Monitor DTR
Monitor DTR
Docker Trusted Registry is a Dockerized application. To monitor it, you can use the same tools and techniques you’re already using to monitor other containerized applications running on your cluster. One way to monitor DTR is using the monitoring capabilities of Docker Universal Control Plane.
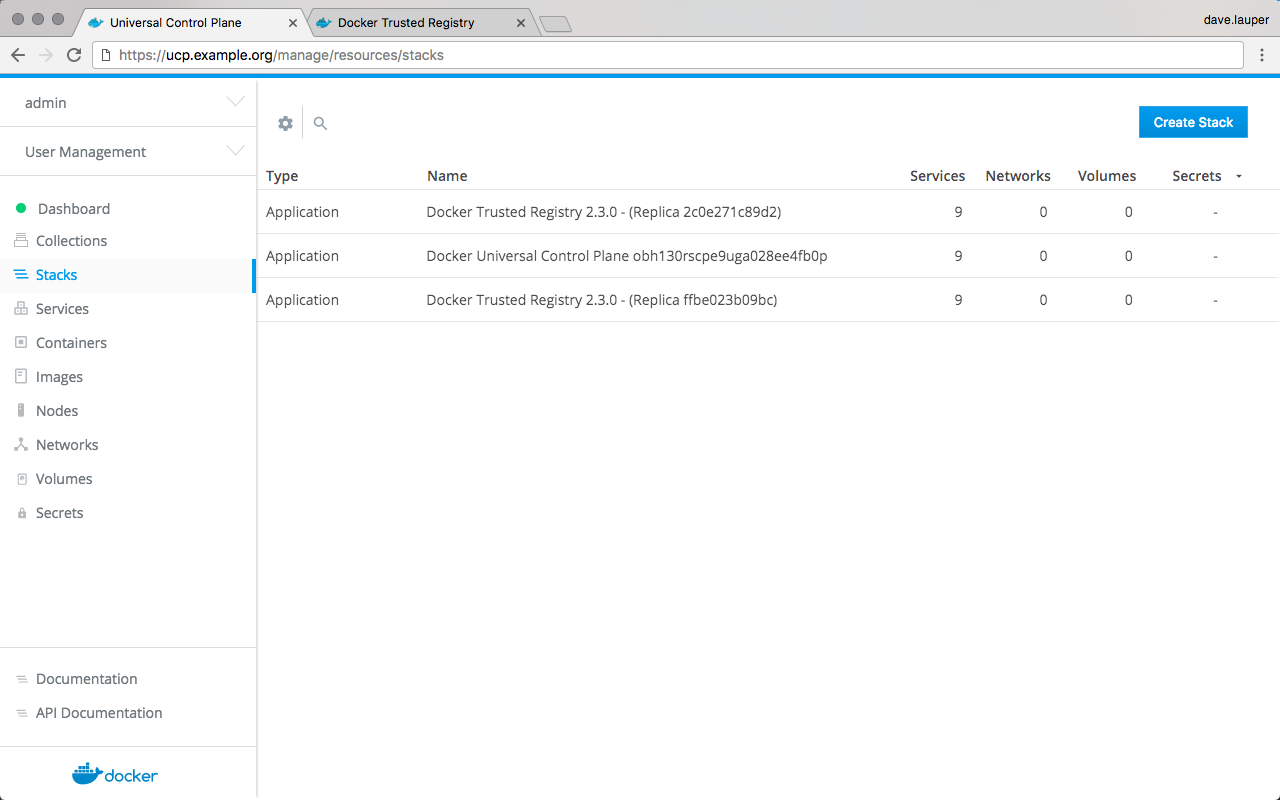
In your browser, log in to Docker Universal Control Plane (UCP), and navigate to the Stacks page. If you have DTR set up for high-availability, then all the DTR replicas are displayed.
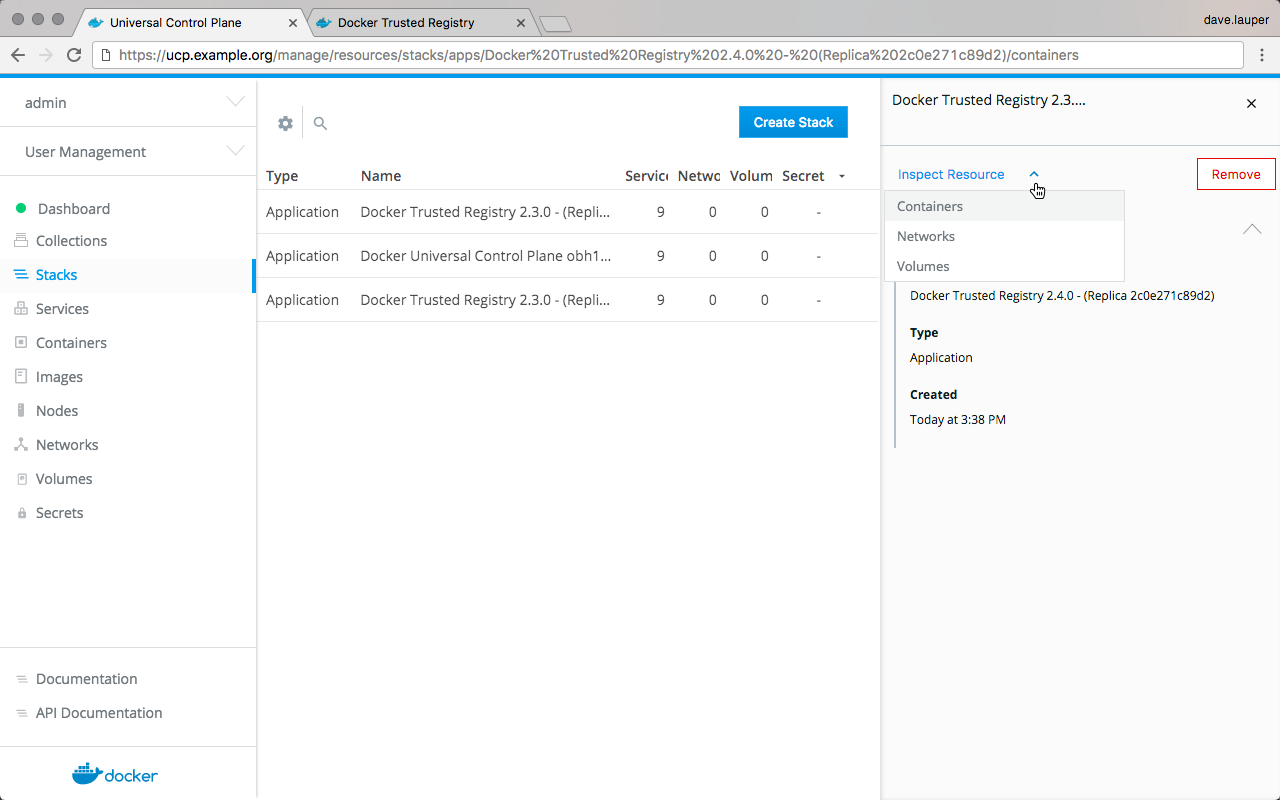
To check the containers for the DTR replica, click the replica you want to inspect, click Inspect Resource, and choose Containers.
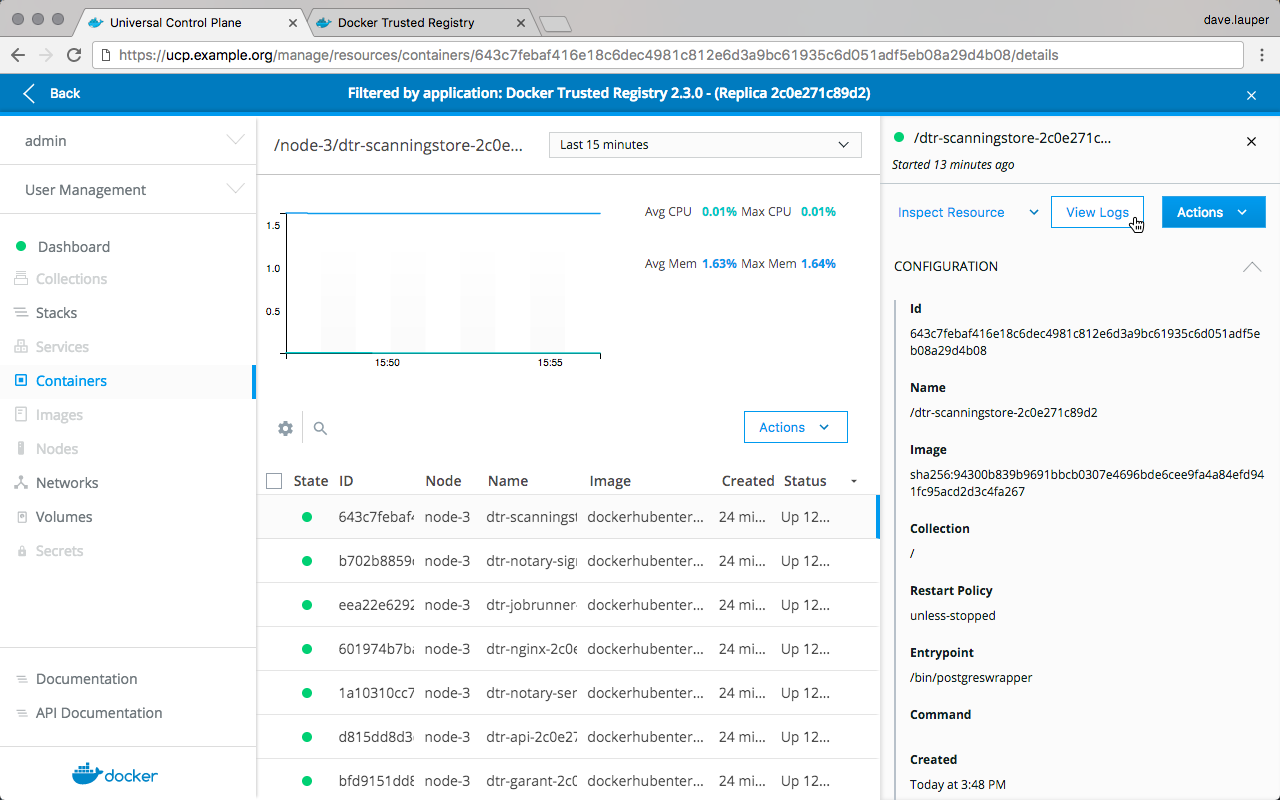
Now you can drill into each DTR container to see its logs and find the root cause of the problem.
Health check endpoints
DTR also exposes several endpoints you can use to assess if a DTR replica is healthy or not:
/_ping: Checks if the DTR replica is healthy, and returns a simple json response. This is useful for load balancing or other automated health check tasks./nginx_status: Returns the number of connections being handled by the NGINX front-end used by DTR./api/v0/meta/cluster_status: Returns extensive information about all DTR replicas.
Cluster status
The /api/v0/meta/cluster_status endpoint requires administrator
credentials, and returns a JSON object for the entire cluster as observed by
the replica being queried. You can authenticate your requests using HTTP basic
auth.
curl -ksL -u <user>:<pass> https://<dtr-domain>/api/v0/meta/cluster_status
{
  "current_issues": [
   {
    "critical": false,
    "description": "... some replicas are not ready. The following servers are
                    not reachable: dtr_rethinkdb_f2277ad178f7",
  }],
  "replica_health": {
    "f2277ad178f7": "OK",
    "f3712d9c419a": "OK",
    "f58cf364e3df": "OK"
  },
}
You can find health status on the current_issues and
replica_health arrays. If this endpoint doesn’t provide meaningful
information when trying to troubleshoot, try troubleshooting using
logs.