Datadog Monitoring Implementation Guide for Docker Enterprise
Datadog Monitoring Implementation Guide for Docker Enterprise
Overview
Docker Solution Briefs enable you to integrate the Docker Enterprise container platform with popular 3rd party ecosystem solutions for networking, load balancing, storage, logging and monitoring, access management, and more. This Solution Brief documents how to deploy Datadog to monitor the performance of Docker containers in a Docker Enterprise MKE Cluster environment.
Docker Enterprise includes Docker Cluster, a tool for for lifecycle management of Docker clusters. With Cluster, you use a YAML file to configure your provider’s resources. Then, with a single command, you provision and install all the resources from your configuration. The Docker Enterprise cluster was created using ‘docker cluster’ tool on Azure Cloud for this solution brief.
Note
Information on Datadog is provided by Docker as a known, working configuration for Docker Enterprise 3.0. Mirantis does not provide the product support for Datadog. Please contact the vendor approved support methods if you have any questions or problems with them.
Datadog Overview
Datadog is a SaaS-based data analytics monitoring service for cloud-scale applications, bringing together data from servers, databases, tools, and services to present a unified view of an entire stack.
Datadog’s main features are:
- Ability for developers and operations to see the full infrastructure
on a single pane of glass:
- Clouds
- Servers
- Applications
- Services
- Metrics
- and more
- Real-time, customizable, interactive dashboards
- Full-text search capabilities for metrics and events
- Over 200 Integrations which includes various clouds, enterprise applications, and developer software tools out of the box
- API to allow integrating and monitoring unique infrastructures
Datadog provides an agent for all of the major Linux distributions and Windows, which needs to be downloaded and installed on each host that you wish to monitor. The agent collects the events and metrics and then forwards them to the Datadog SaaS server for processing, analysis, and viewing. Datadog also provides their Linux agent as a Certified Docker Image in Docker Hub.
Docker Enterprise MKE Cluster
This implementation guide was developed and tested on:
- Docker Enterprise 3.0 with Mirantis Container Runtime 19.03.2, MKE 3.2.1 and MSR 2.7.1, and DataDog Agent 6.14.1
The Docker Enterprise MKE Cluster environment had 6 nodes (1 manager and 5 workers). Refer to Docker Enterprise Best Practices and Design Considerations for details on best practices for deploying Docker Enterprise.
To discover your infrastructure and collect the events and metrics, the Datadog agent needs to be deployed on all Docker Nodes that you wish to monitor.

Datadog SaaS Account
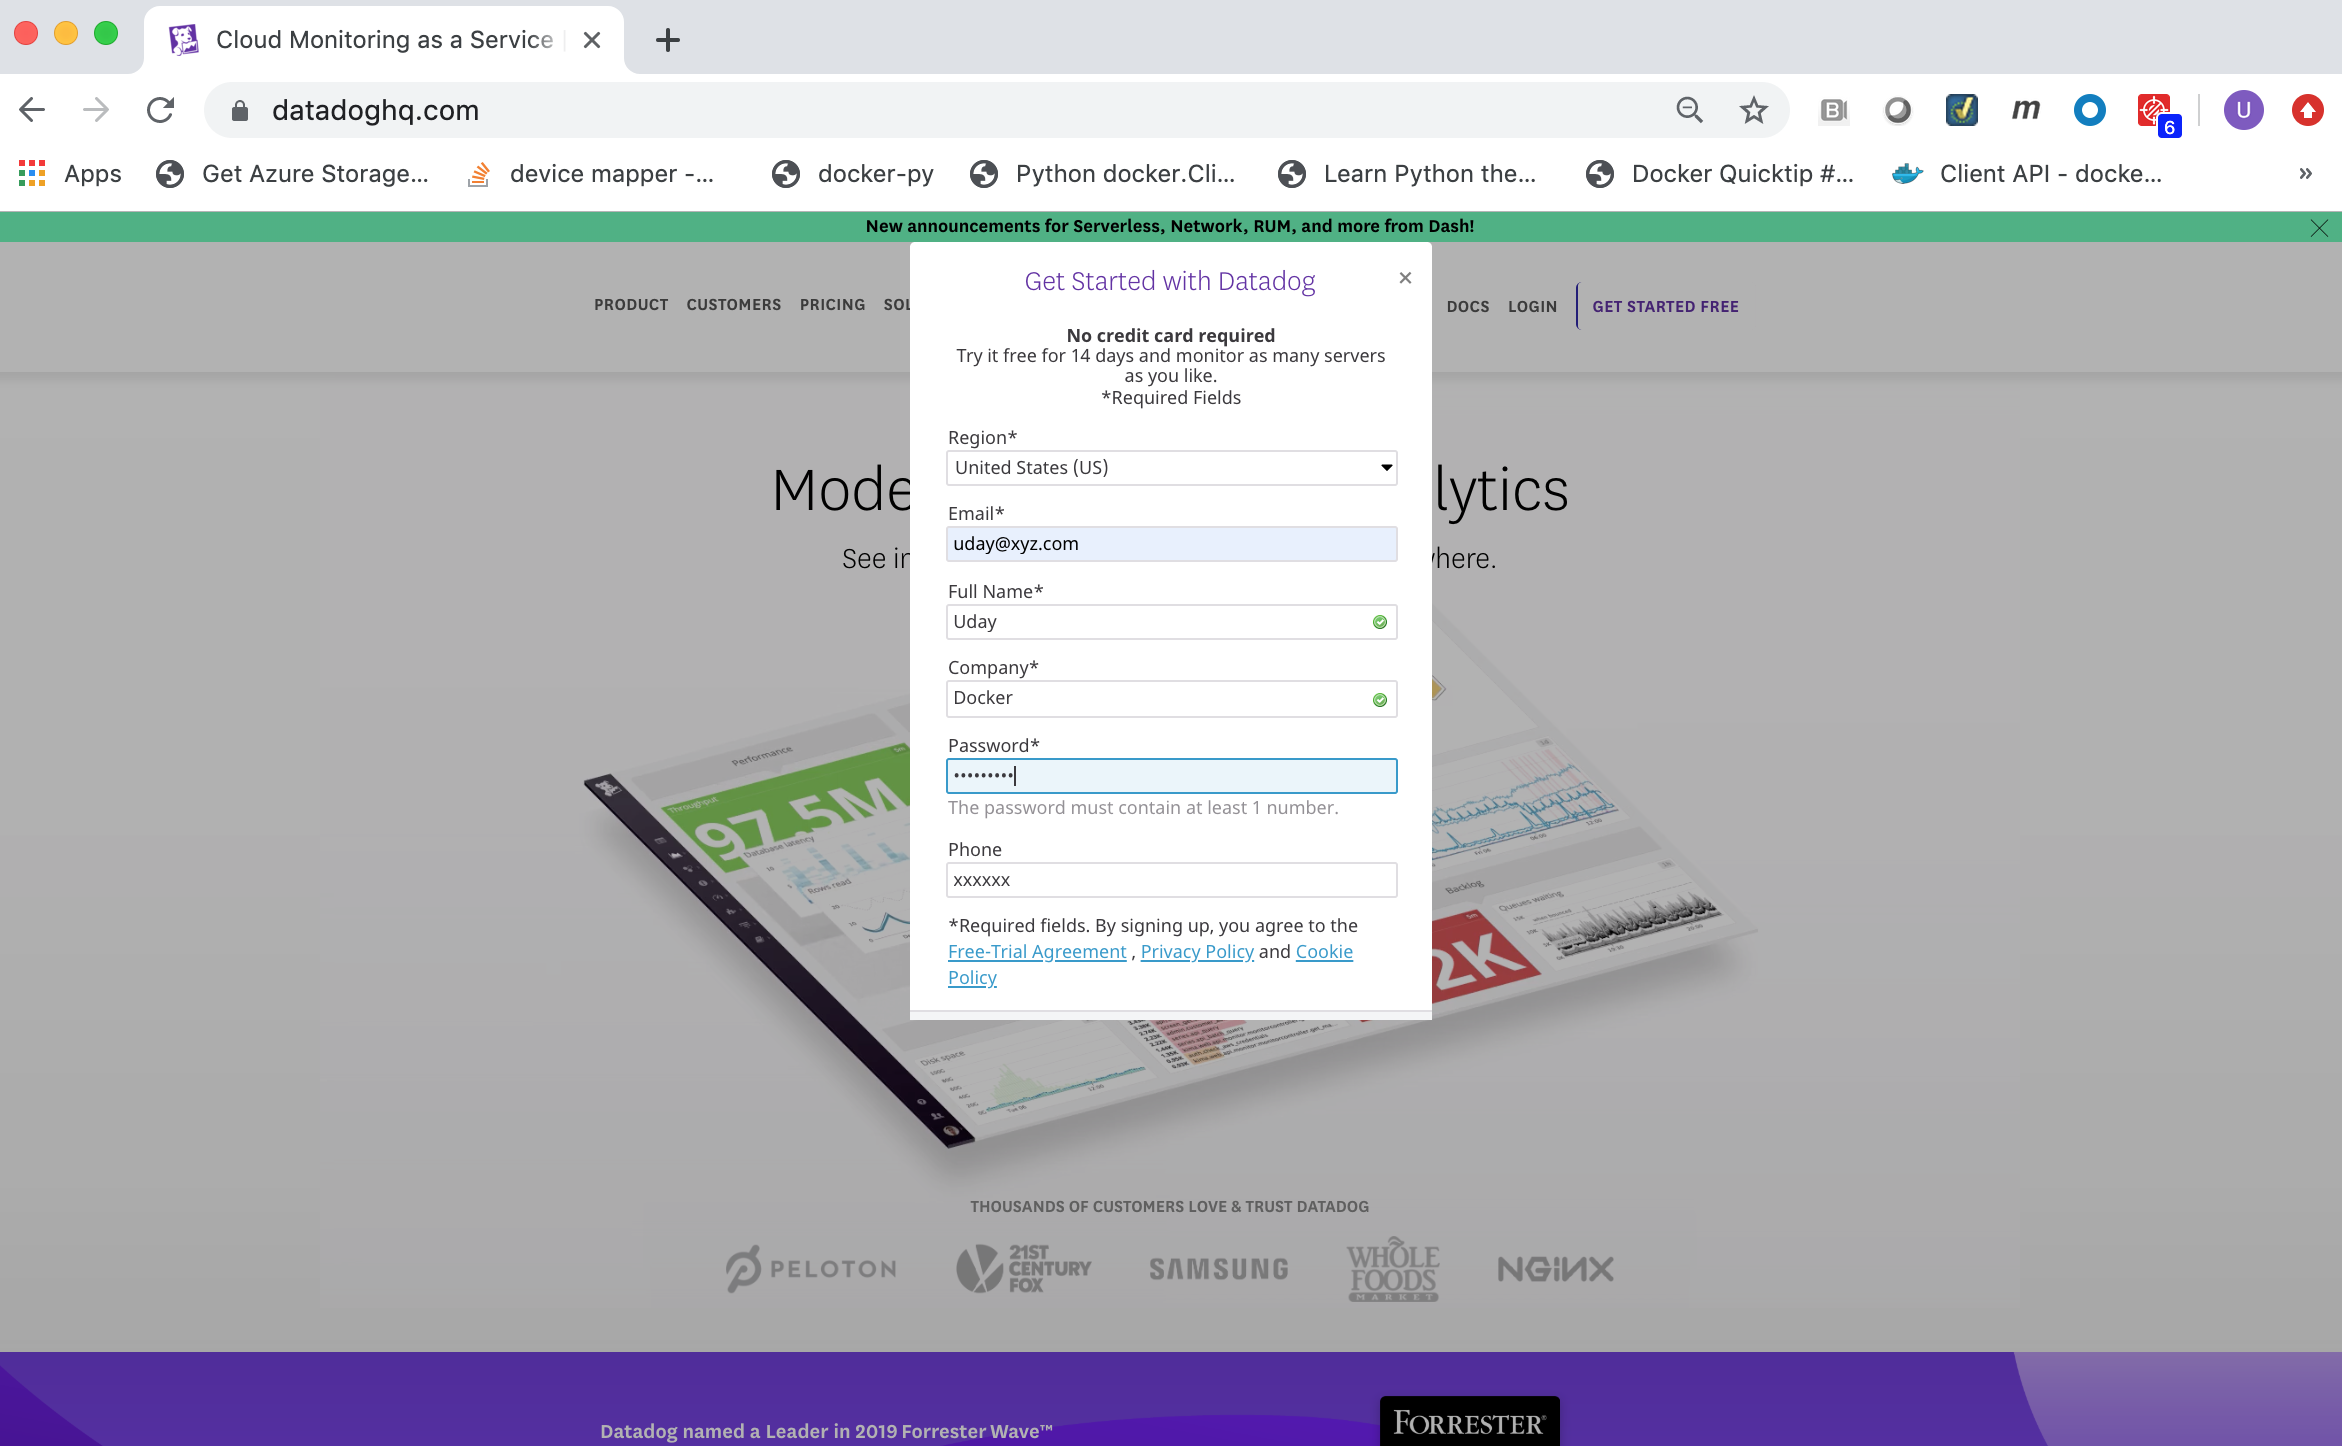
A Datadog SaaS Account is required. You can register for a free 14-day Datadog Account on https://www.datadoghq.com/. Click on the GET STARTED FREE button.
Datadog API Key
The Datadog agent requires a Datadog API Key in order for it to
securely connect to the Datadog SaaS server and forward monitoring data
to it. You can view and copy your Datadog API Key from the Datadog
SaaS Web portal.
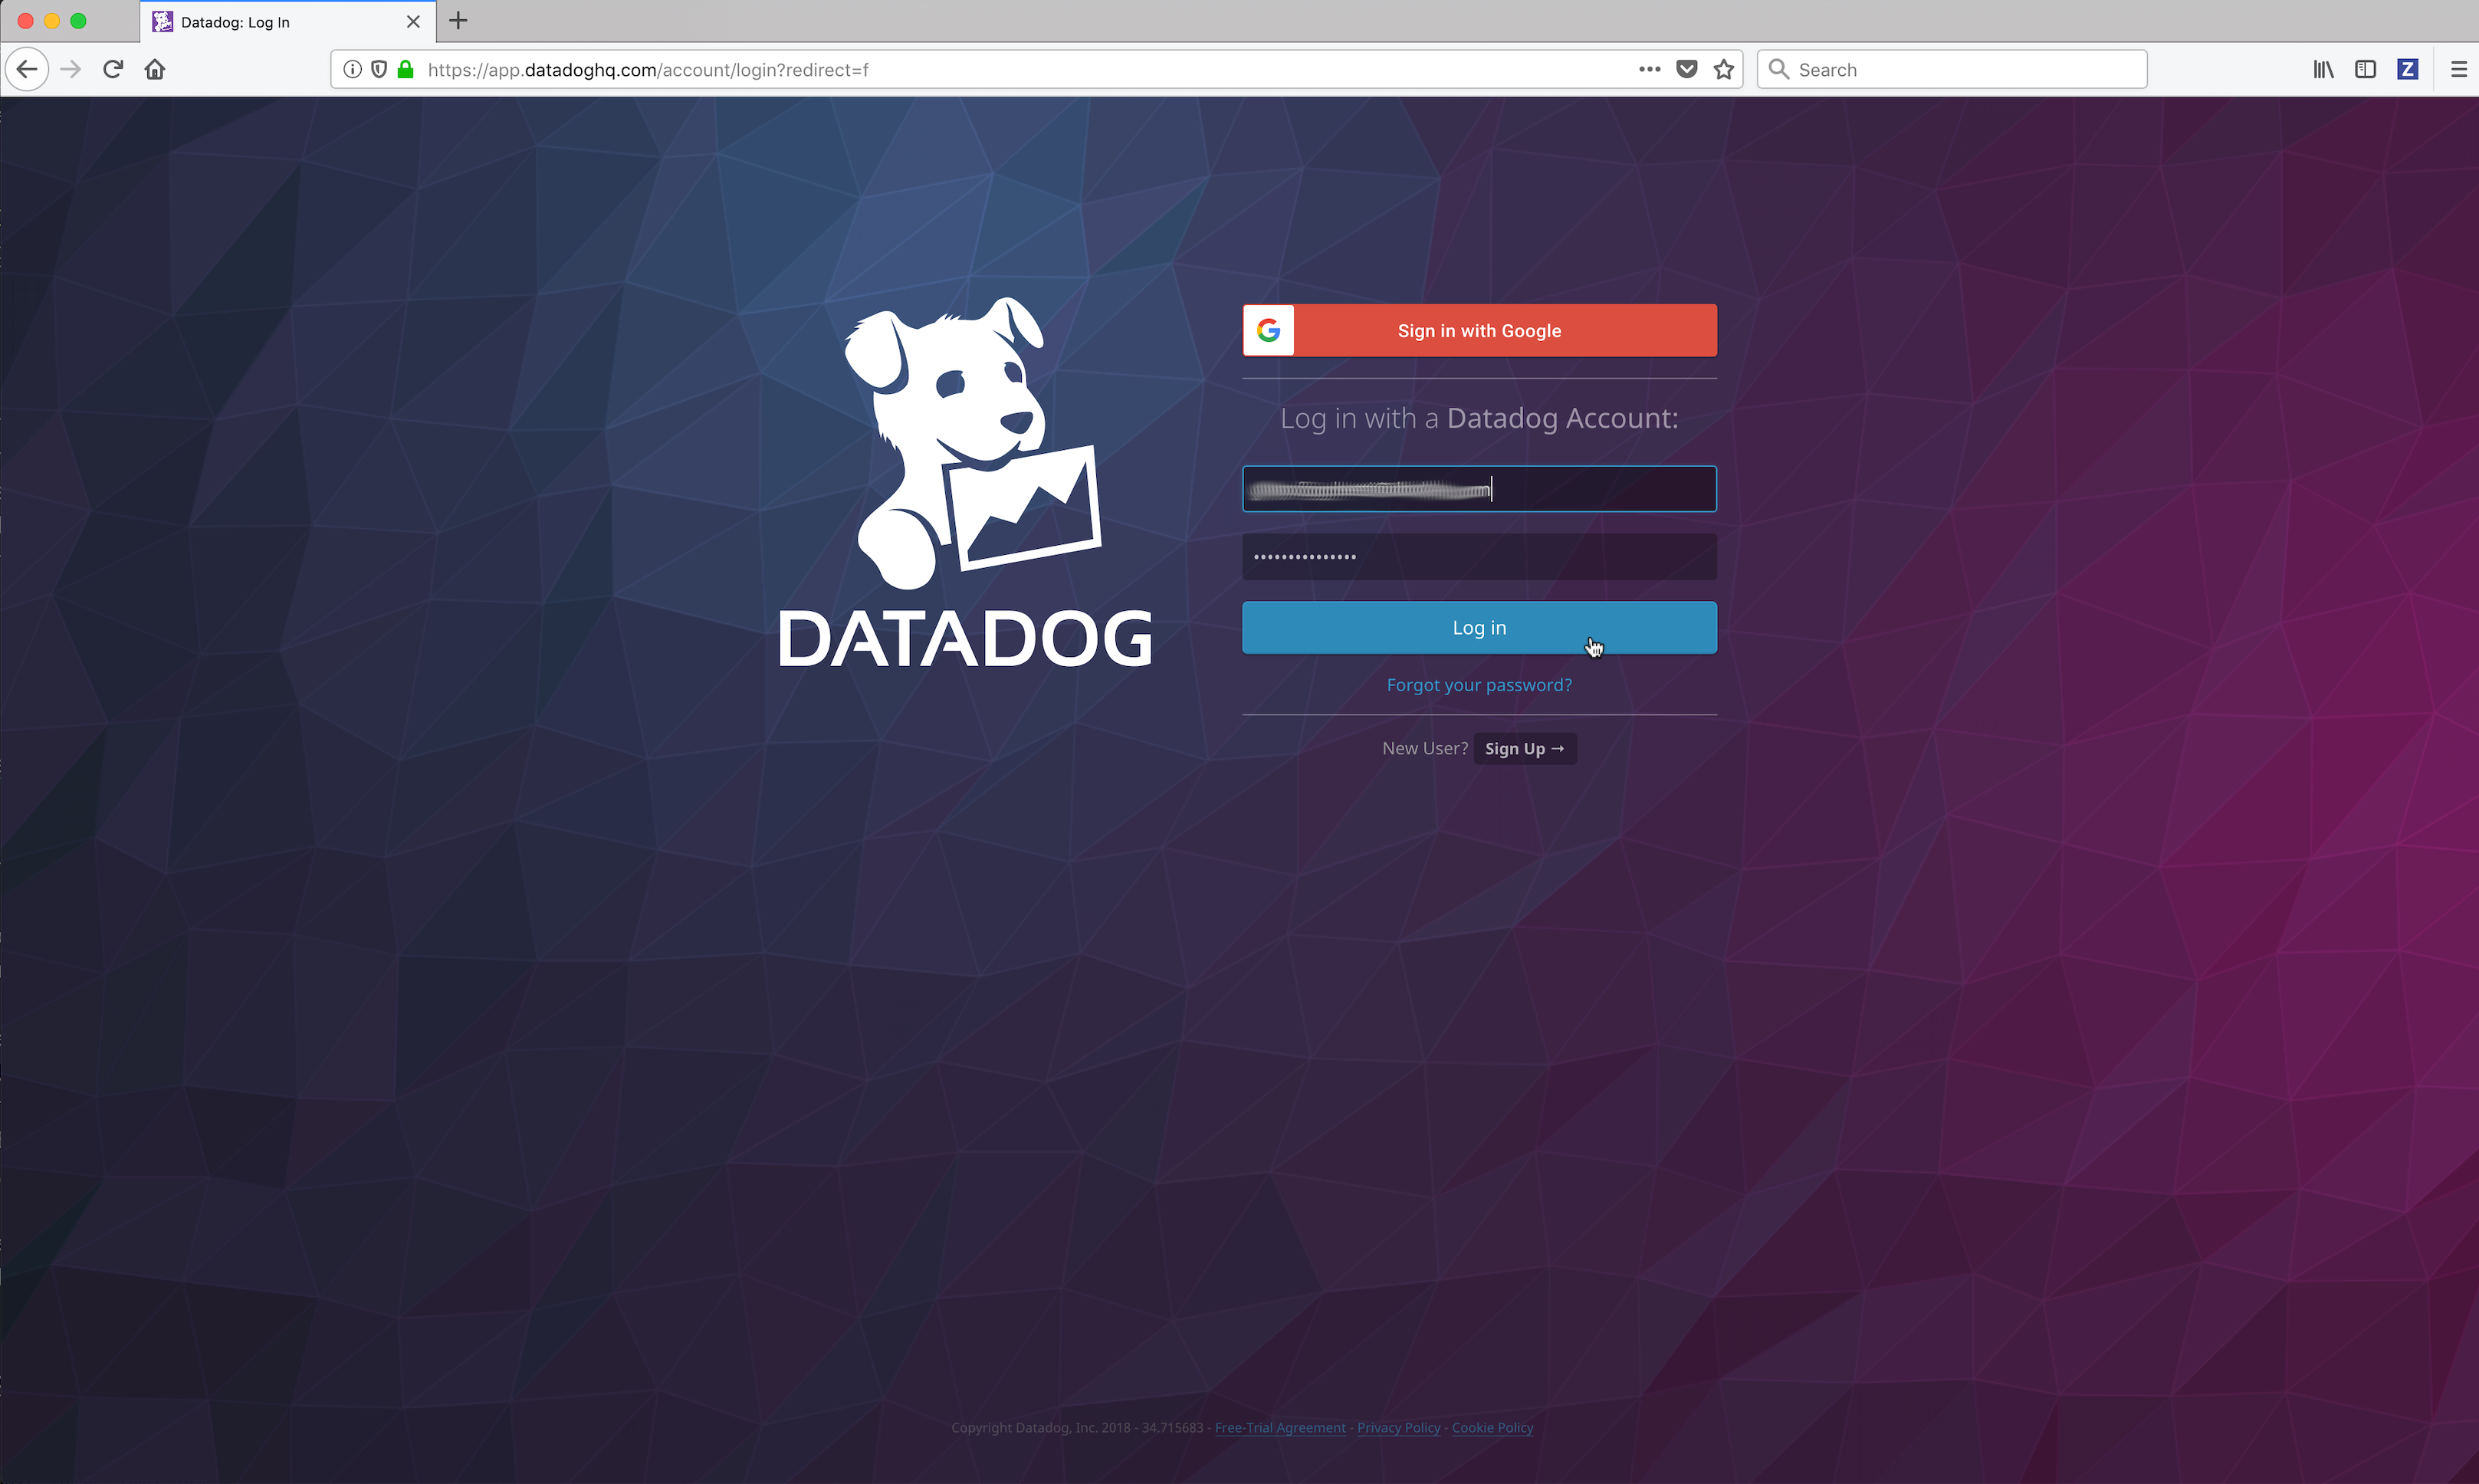
Log into the Datadog SaaS Web portal at https://app.datadoghq.com.
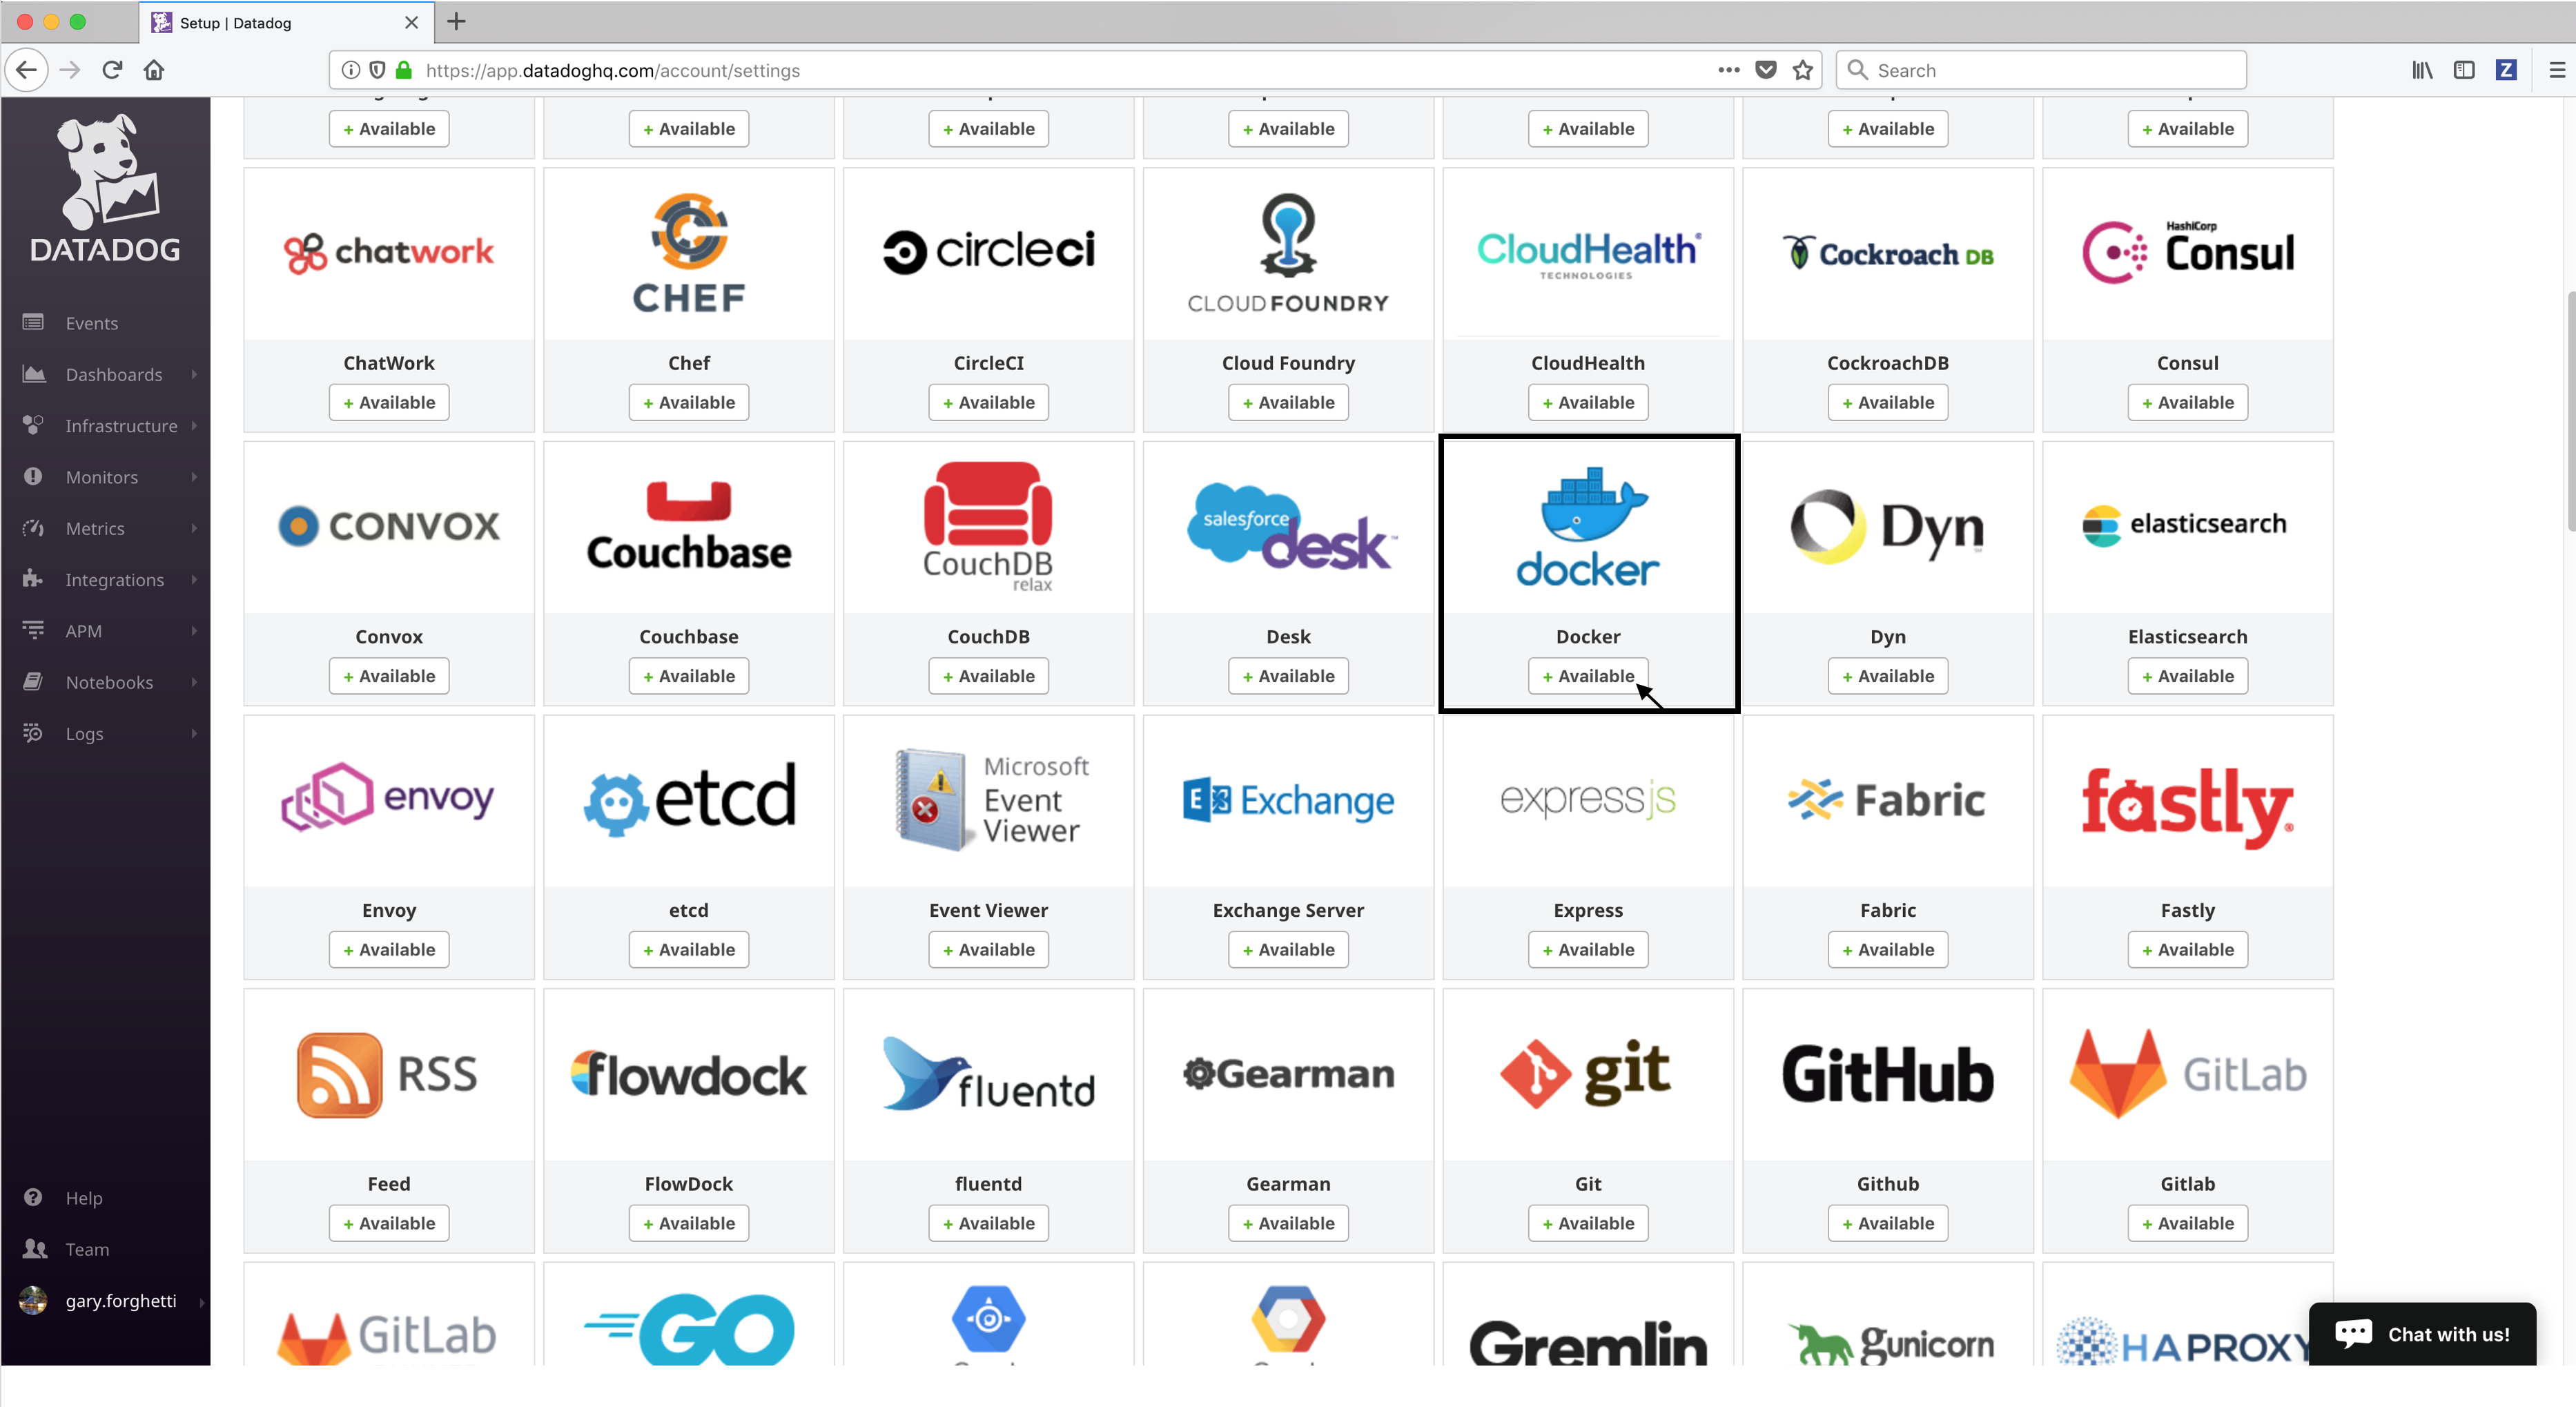
Click on the Integrations link in the left frame, then click on the Agent menu item.
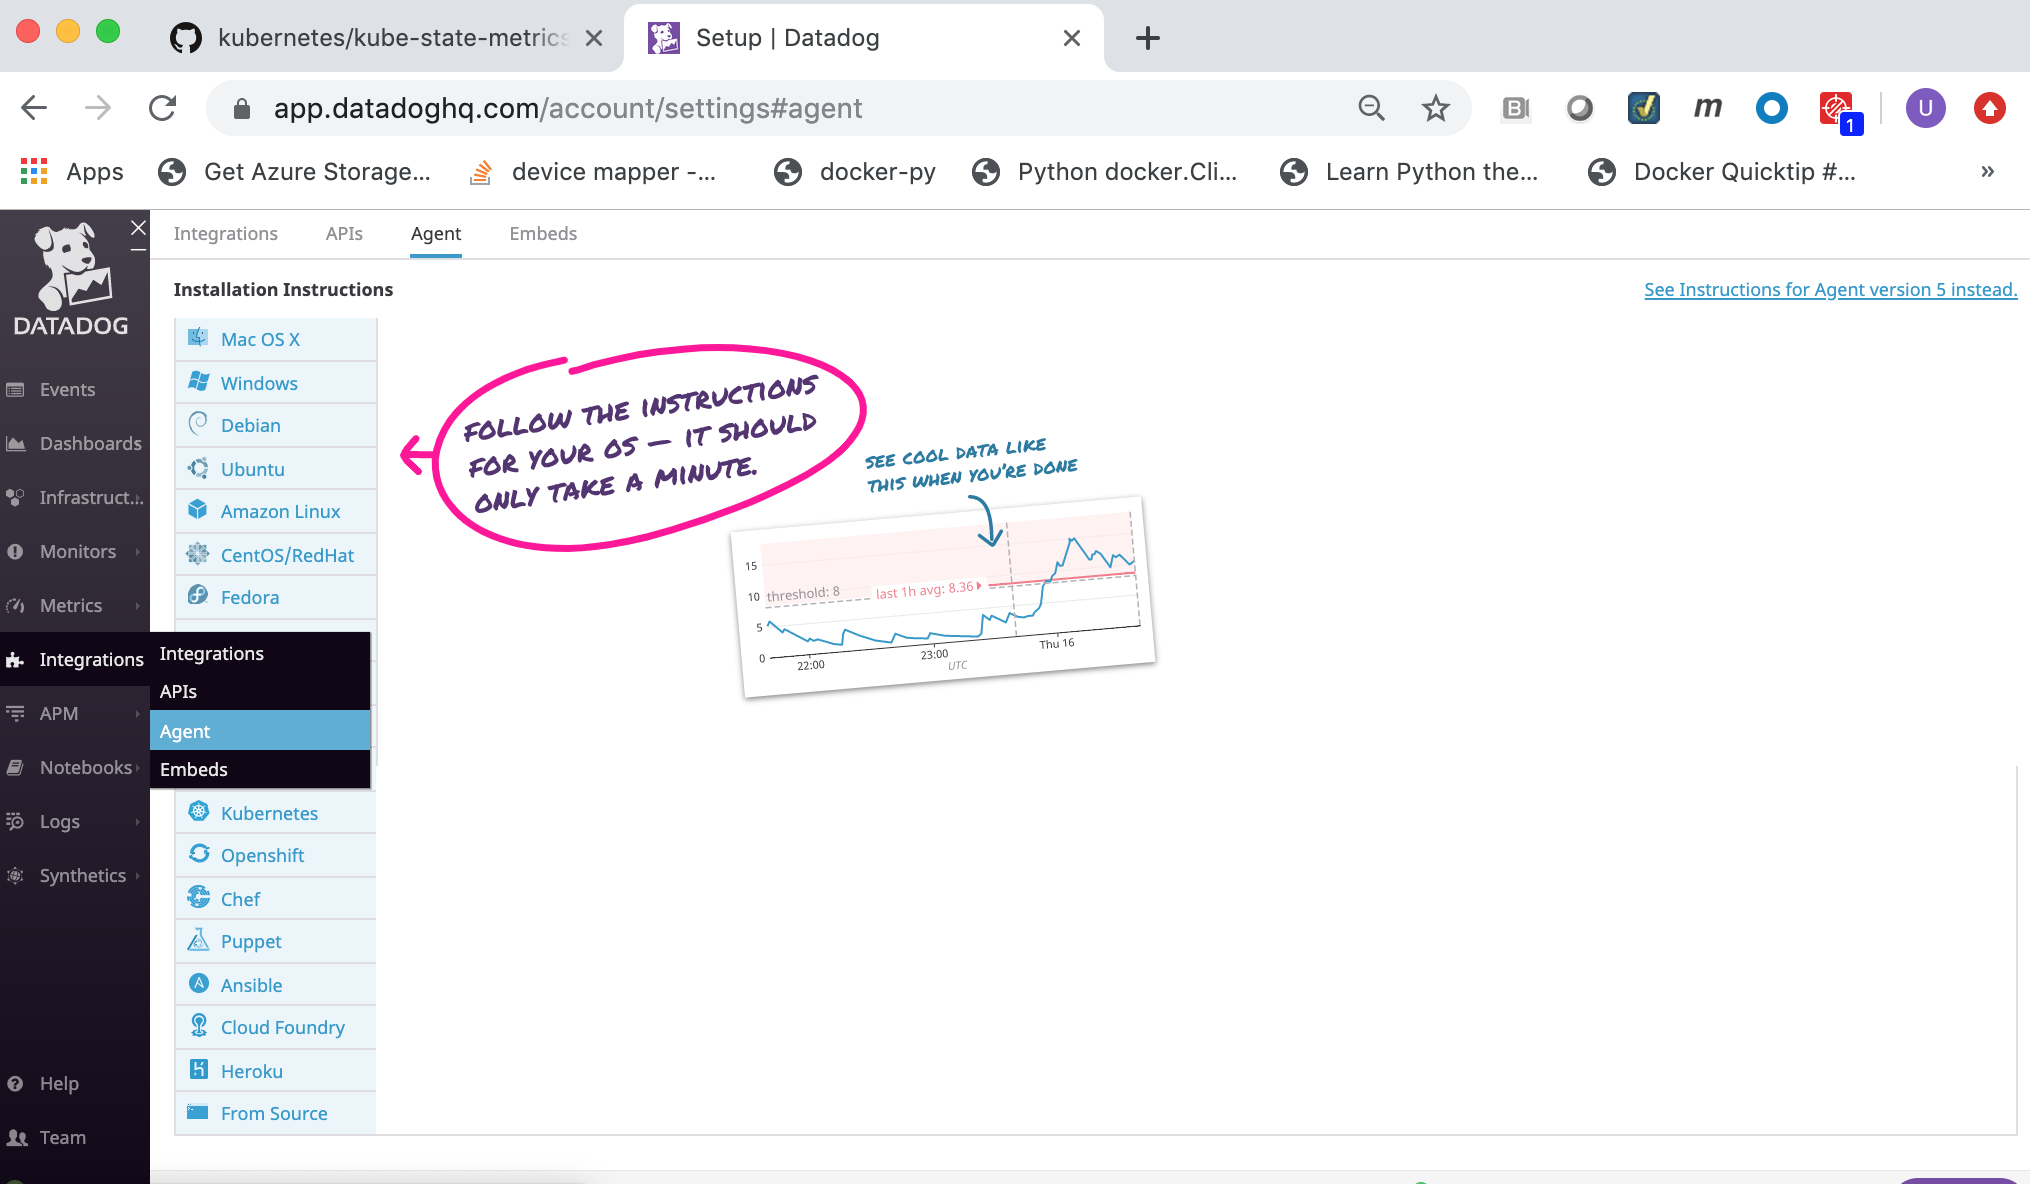
Click on the Docker link.

Select and copy the
Datadog API Key. You will need to specify theDatadog API Keyto the Datadog agent when deploying it.
Volume Usage
The Datadog agent container requires the following volume mounts (read-only) for gathering metrics and logs.
/var/run/docker.sock:/var/run/docker.sock:ro/proc/:/host/proc/:ro/sys/fs/cgroup/:/host/sys/fs/cgroup:ro
Additional commands
Git client command
The Git client command was used in this Solution Brief to clone the Kubernetes State Metrics GitHub Repository. It was run on the Docker Enterprise client machine as part of the setup to deploy Kubernetes State Metrics prior to deploying the Elastic stack with Kubernetes Monitoring Integration on Docker Enterprise 3.0. Refer to the Git Getting Started - Installing Git web page for details on how to install the Git client if you need to install it.
curl Command
Some of the commands in this Solution Brief use the curl command.
If the curl command is not installed you can install it using the
instructions below for the Linux distributions:
Debian/Ubuntu
apt-get update -qq;apt-get install curl -y
CentOS/RHEL
yum makecache fast;yum install curl -y
For other Linux distributions you can download and install it from https://curl.haxx.se/download.html.
jq command
Some of the commands in this Solution Brief use the jq command to
format and display json output.
If the jq command is not installed you can install it using the
instructions below for the Linux distributions:
Debian/Ubuntu
$ apt-get update -qq;apt-get install jq -y
CentOS/RH
$ yum makecache fast;yum install jq -y
For other Linux distributions you can download and install it from https://github.com/stedolan/jq/wiki/Installation.
Configure your Docker Enterprise client command shell for Docker Enterprise MKE
This Solution Brief requires you to download a Docker Enterrise MKE client bundle and configure your command shell in order to run Docker Enterprise commands to your Docker Enterprise MKE Cluster. You can generate and download a Docker Enterprise MKE client bundle using the Docker Enterprise MKE Rest API or from your Docker Enterprise MKE Web UI.
Generate and download a MKE client bundle using the MKE Rest API
You can download a sample bash script named
get-docker-ee-ucp-client-bundle.sh from this GitHub Repository
get-docker-ee-ucp-client-bundle
which uses the Docker Enterprise MKE Rest API to generate and download a
Docker Enterprise MKE client bundle. You can then run the script which
will download a Docker Enterprise MKE client bundle.
Download the sample bash script get-docker-ee-ucp-client-bundle
Export your Docker Enterprise MKE user account and password as environment variables.
Example:
$ export DOCKER_USER="**your-docker-ee-ucp-user-account**"
$ export DOCKER_PASSWORD="**your-docker-ee-ucp-password**"
Generate and download a Docker Enterprise MKE Client Bundle.
Run the following command from the Docker Enterprise command shell. Replace
manager.example.comwith the hostname or IP address of your Docker Enterprise MKE manager.$ ./get-docker-ee-ucp-client-bundle.sh -d manager.example.com
Example:

Configure your Docker Enterprise client command shell.
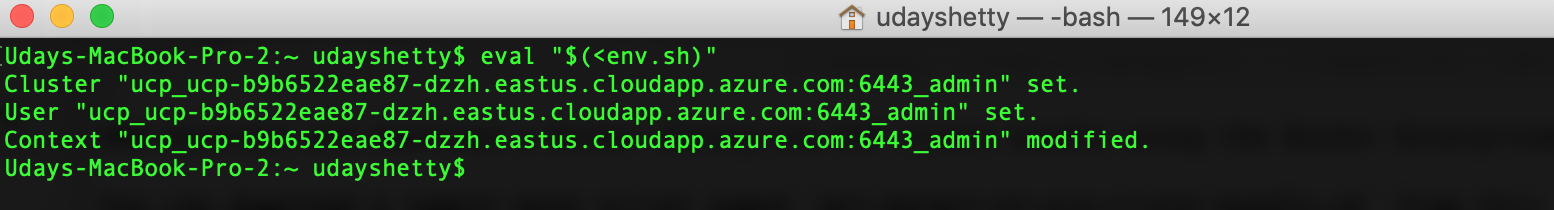
Run the following command from the Docker Enterprise command shell.
$ eval "$(<env.sh)"
Example:
Test the Docker Enterprise MKE client bundle and configuration.
Run the docker version command from the Docker Enterprise client command shell.
$ docker version --format '{{println .Server.Platform.Name}}Client: {{.Client.Version}}{{range .Server.Components}}{{println}}{{.Name}}: {{.Version}}{{end}}'
Example:

Generate and download a MKE client bundle from your MKE Web UI
If you prefer, you can generate and download a Docker Enterprise MKE client bundle from your Docker Enterprise MKE Web UI.
Login to your Docker Enterprise MKE Cluster Web UI using your Docker ID and password.

Click on your account name and then click on My Profile

Click on the New Client Bundle button then Generate Client Bundle button.

Locate the generated client bundle archive file and unzip it.
Note
The generated client bundle archive file will be downloaded to whatever folder your browser’s Download folder is configured for. You may have to move the generated client bundle archive file to the Docker Enterprise client machine if it is a different machine than the machine you downloaded it on.
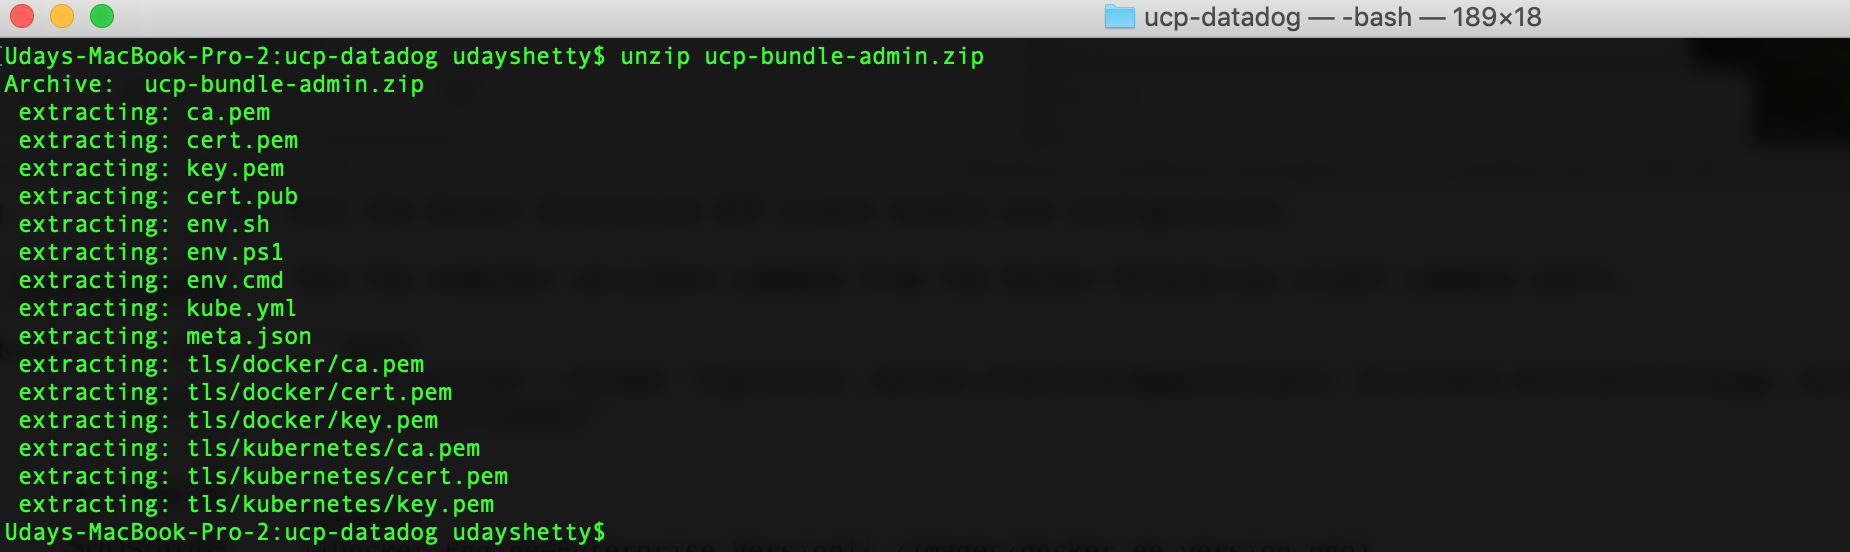
Run the following command from the Docker Enterprise client command shell to unzip the client bundle archive file. Substitute your generated client bundle archive file name.
$ unzip ucp-bundle-admin.zip
Example:
Configure your Docker Enterprise client command shell.
Run the following command from the Docker Enterprise command shell.
$ eval "$(<env.sh)"
Example:
Test the Docker Enterprise MKE client bundle and configuration.
Run the docker version command from the Docker Enterprise client command shell.
$ docker version --format '{{println .Server.Platform.Name}}Client: {{.Client.Version}}{{range .Server.Components}}{{println}}{{.Name}}: {{.Version}}{{end}}'
Example:
Kubernetes kubectl command
The Kubernetes kubectl command must be installed on the Docker
Enterprise client machine. Refer to Install and Set Up
kubectl
to download and install the version of the kubectl command that
matches the version of Kubernetes included with the Docker Enterprise
version you are running. You can run the docker version command to
display the version of Kubernetes installed with Docker Enterprise.
Deploying Kubernetes workloads in Docker Enterprise MKE
In this Solution Brief the Datadog Agent will be deployed as a Kubernetes DaemonSet. A Kubernetes DaemonSet can be used to ensure that an application or service container runs on every node in the cluster. Monitoring and logging type applications and services typically require this type of deployment. However, in Docker Enterprise MKE the deployment of a Kubernetes DaemonSet is affected by the Docker Enterprise MKE orchestrator type that is set on the node. A node in a Docker Enterprise MKE Cluster environment contains both the Mirantis Container Runtime (aka the Docker daemon) and the Kubernetes Agent (aka the Kubernetes kubelet). A node can be configured to run containers deployed by Docker and/or Kubernetes by setting the Docker Enterprise MKE orchestrator type on the node to one of the 3 types below.
- Swarm - Only containers deployed using the Docker CLI and Mirantis Container Runtime API can run on this node.
- Kubernetes - Only containers deployed using the Kubernetes CLI and Kubernetes API can run on this node.
- Mixed - Containers deployed with Swarm or Kubernetes can run on this node. This is not recommended for production.
By default, Docker Enterprise MKE will not deploy a Kubernetes orchestrated container to a node whose orchestrator type is configured as Swarm. That presents a problem to an application or service that needs a container running on all nodes. To ensure that these types of applications and services run all on nodes, you need to deploy the application or service as a Kubernetes DaemonSet in the Kubernetes kube-system namespace. Containers deployed in the Kubernetes kube-system namespace will run on all nodes regardless of the Docker Enterprise MKE orchestrator type. The Datadog Agent needs to run on all nodes in the Docker Enterprise MKE Cluster so it needs to be deployed as a Kubernetes DaemonSet in the Kubernetes kube-system namespace.
Refer to Docker Enterprise Platform for more information on Docker Enterprise and Orchestration.
Deploying Datadog in Docker Enterprise
Deploying Datadog on Docker Enterprise 3.0 with Kubernetes Monitoring Integration.
In addition, there is an example of installing Datadog Windows Integration and the Datadog Agent on Windows.
This example demonstrates how to deploy Datadog with Kubernetes Monitoring Integration to monitor your infrastructure on Docker Enterprise 3.0
Note
The Datadog agent needs to be deployed in the kube-system namespace in the Docker Enterprise MKE environment. This will ensure that the Datadog agent container is deployed on all nodes in the Docker Enterprise MKE Cluster and that it can discover and collect Kubernetes State Metrics.
Kubernetes State Metrics
Note
If you wish to deploy Datadog with Kubernetes Monitoring Integration you need to deploy Kubernetes State Metrics prior to deploying Datadog with Kubernetes Monitoring Integration.
Kubernetes State Metrics is a simple service that listens to the Kubernetes API server and generates metrics about the state of the objects. It is not focused on the health of the individual Kubernetes components, but rather on the health of the various objects inside, such as deployments, nodes and pods.
Datadog has integration with Kubernetes State Metrics and will collect the metrics and has a dashboard which displays the Kubernetes State Metrics. In this Solution Brief Kubernetes State Metrics will be deployed and integrated with Datadog.
See also
Refer to the Kubernetes State Metrics GitHub repository for more documentation and the latest Kubernetes manifest files at this link: https://github.com/kubernetes/kube-state-metrics.
Deploy Kubernetes State Metrics
The Kubernetes Manifest files to deploy Kubernetes State Metrics are hosted and maintained on GitHub in the kube-state-metrics Repository. Run the following
gitcommand below from the Docker Enterprise client command shell to clone the kube-state-metrics GitHub repository.$ git clone https://github.com/kubernetes/kube-state-metrics.git
Deploy Kubernetes State Metrics.
Run the following commands from the MKE client command shell to deploy Kubernetes State Metrics.
$ cd kube-state-metrics
$ kubectl apply -f examples/standard
Display the Kubernetes State Metrics Deployment.
Run the following command from the MKE client command shell.
  $ kubectl get deployment kube-state-metrics --namespace kube-system -o wide

Example:

.. image:: ../_images/datadog/display_kube_state_metrics_deployment.png
   :width:
   :alt: Display Kubernetes State Metrics
Display the pod deployed by the Kubernetes State Metrics Deployment.
Run the following command from the MKE client command shell.
  $ kubectl get pods --namespace kube-system -o wide

Example:

.. image:: ../_images/datadog/display_kube_state_metrics_deployment_pod.png
   :width: 100%
   :alt: Display Kubernetes State Metrics Pod
You can display detailed information on the Kubernetes State Metrics pod.
Run the following
kubectl describe podcommand below from the MKE client command shell. Change the pod name to match the Kubernetes State Metrics pod which was deployed.$ kubectl describe pod --namespace kube-state-metrics-78f8b6786b-qg8wc
Check the Kubernetes State Metrics pod logs for any errors.
Note
A Kubernetes State Metrics pod contains 2 containers: kube-state-metrics and addon-resizer.
Run the following
kubectl logscommands below from the Docker MKE client command shell. Change the pod name to match the Kubernetes State Metrics pod which was deployed.$ kubectl logs --namespace kube-system kube-state-metrics-78f8b6786b-qg8wc --container kube-state-metrics | grep -i 'Error' $ kubectl logs --namespace kube-system kube-state-metrics-78f8b6786b-qg8wc --container addon-resizer | grep -i 'Error'
Create a Kubernetes secret named dd-api-key to contain the value of your
Datadog API Key.Run the following command from the Docker Enterprise client command shell. Change the text **datadog-api-key** to your
Datadog API Key.$ kubectl create secret generic dd-api-key --namespace kube-system --from-literal=api-key='**datadog-api-key**'
Example:

Download the sample
deploy-datadog-agent-with-kubernetes-monitoring-integration.yamlincluded with this solution brief which contains the Kubernetes DaemonSet manifest to deploy the Datadog agent at this link:deploy-datadog-agent-with-kubernetes-monitoring-integration.yamlNote
The sample
deploy-datadog-agent-with-kubernetes-monitoring-integration.yamlincluded with this solution brief has been customized for Docker Enterprise. Datadog provides sample Kubernetes daemonset yaml files at this link: https://github.com/DataDog/datadog-agent. For additional information on deploying the Datadog agent on Kubernetes refer to: Kubernetes DaemonSet Setup.Deploy the Datadog agents with Kubernetes Monitoring Integration on all Docker Enterprise MKE Cluster nodes.
Run the following command from the Docker Enterprise client command shell.
$ kubectl apply -f deploy-datadog-agent-with-kubernetes-monitoring-integration.yaml
Example:

Wait a few minutes for the Datadog environment to start up and become fully initialized.
Display the Datadog Agent DaemonSet.
Run the following command from the Docker Enterprise client command shell.
$ kubectl get daemonset --namespace kube-system datadog-agent -o wide
Example:

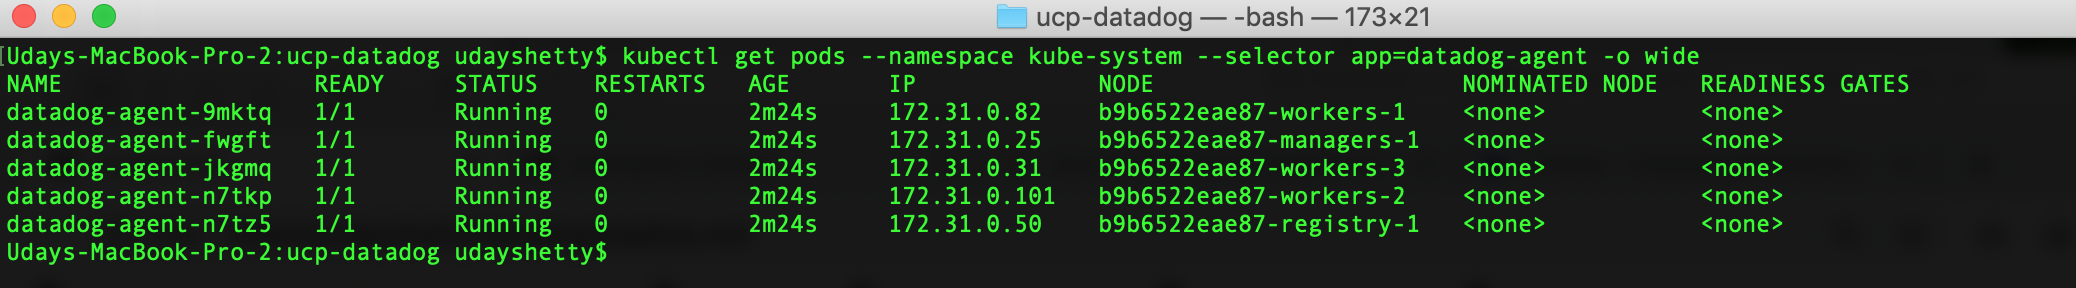
Display the Datadog Agent DaemonSet Pods.
Run the following command from the Docker Enterprise client command shell.
$ kubectl get pods --namespace kube-system --selector app=datadog-agent -o wide
Example:
You can display detailed information on a Datadog agent DaemonSet Pod.
Run the following
kubectl describe podcommand below from the Docker Enterprise client command shell. Change the pod name to match a Datadog agent pod which was deployed.$ kubectl describe pod --namespace kube-system datadog-agent-fwgft
You can check a Datadog agent DaemonSet Pod logs for any errors.
Run the following
kubectl logscommand below from the Docker Enterprise client command shell. Change the pod name to match a Datadog agent pod which was deployed.$ kubectl logs --namespace kube-system datadog-agent-fwgft | grep -i 'Error'
Install Datadog Windows Integration and the Windows Datadog Agent
Install Datadog Windows Integration
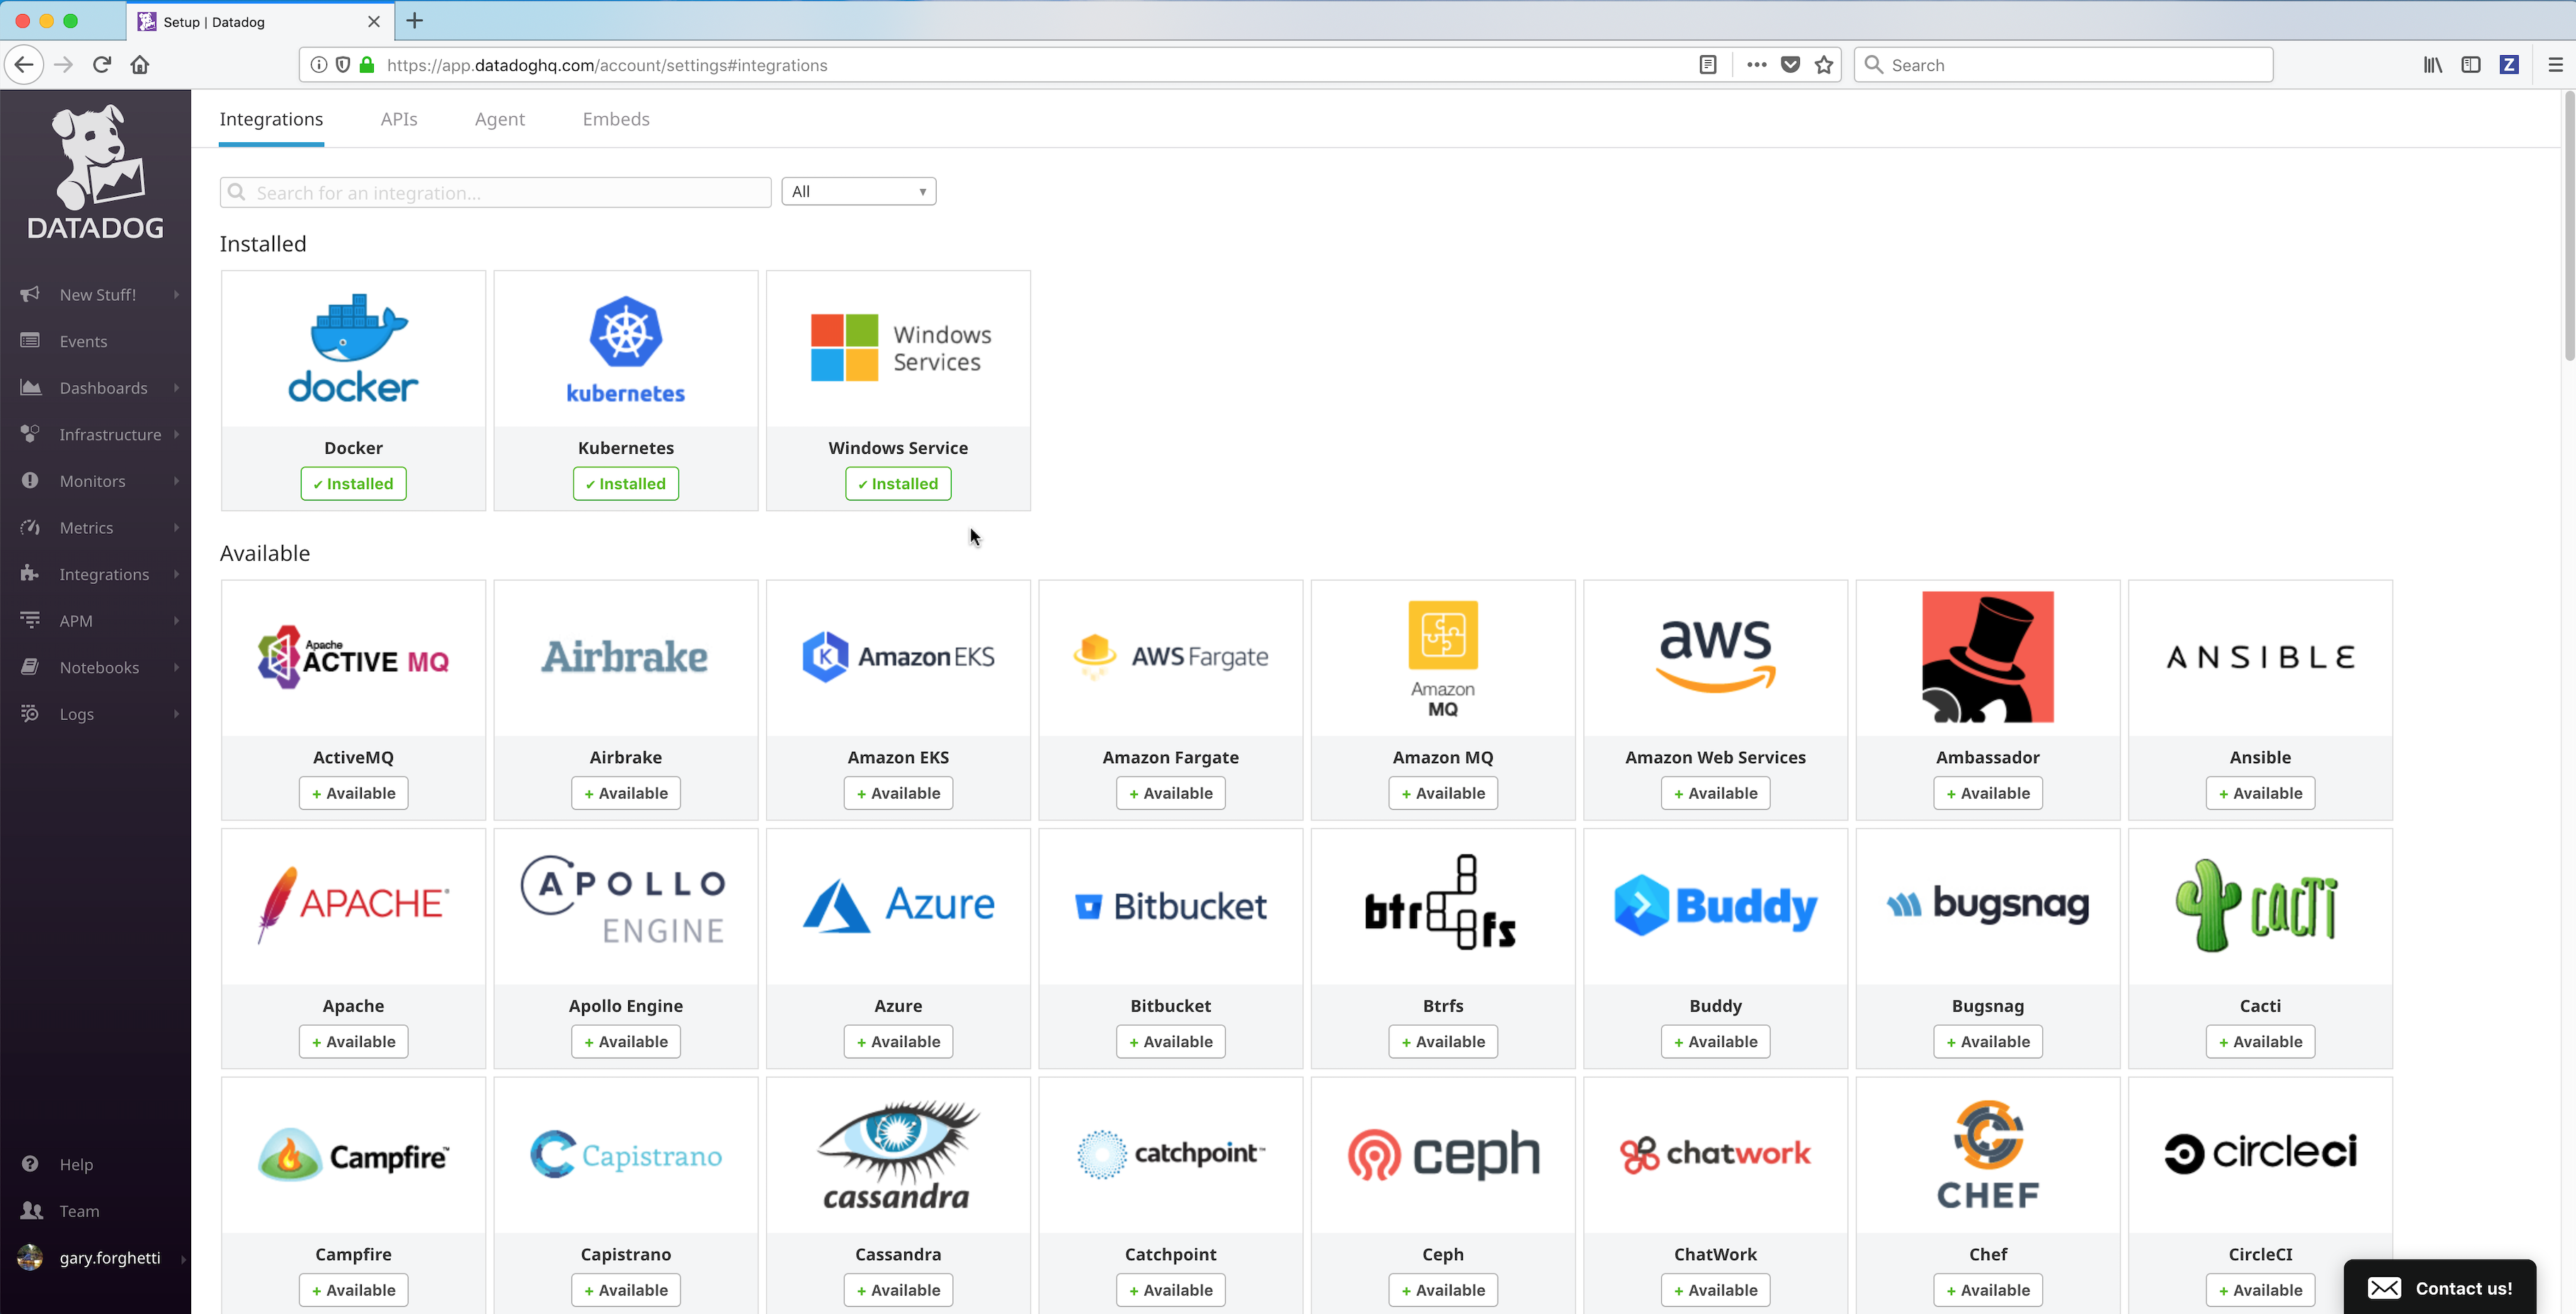
Click on the Integrations link in the left frame, then click on the Integrations menu item.

Locate and click on the Windows Service integration icon/button to install it.
Click on the Configuration tab and then click on the Install Integration button. The install takes a few seconds.
After the installation completes, refresh the page and scroll to the top. The Windows Service Integration will appear as Installed.
Install the Windows Datadog agent on a Windows Docker Enterprise MKE node
Click on the Integrations link in the left frame, then click on the Agent menu item.
Right click the Download the Datadog Agent installer link and copy the link.
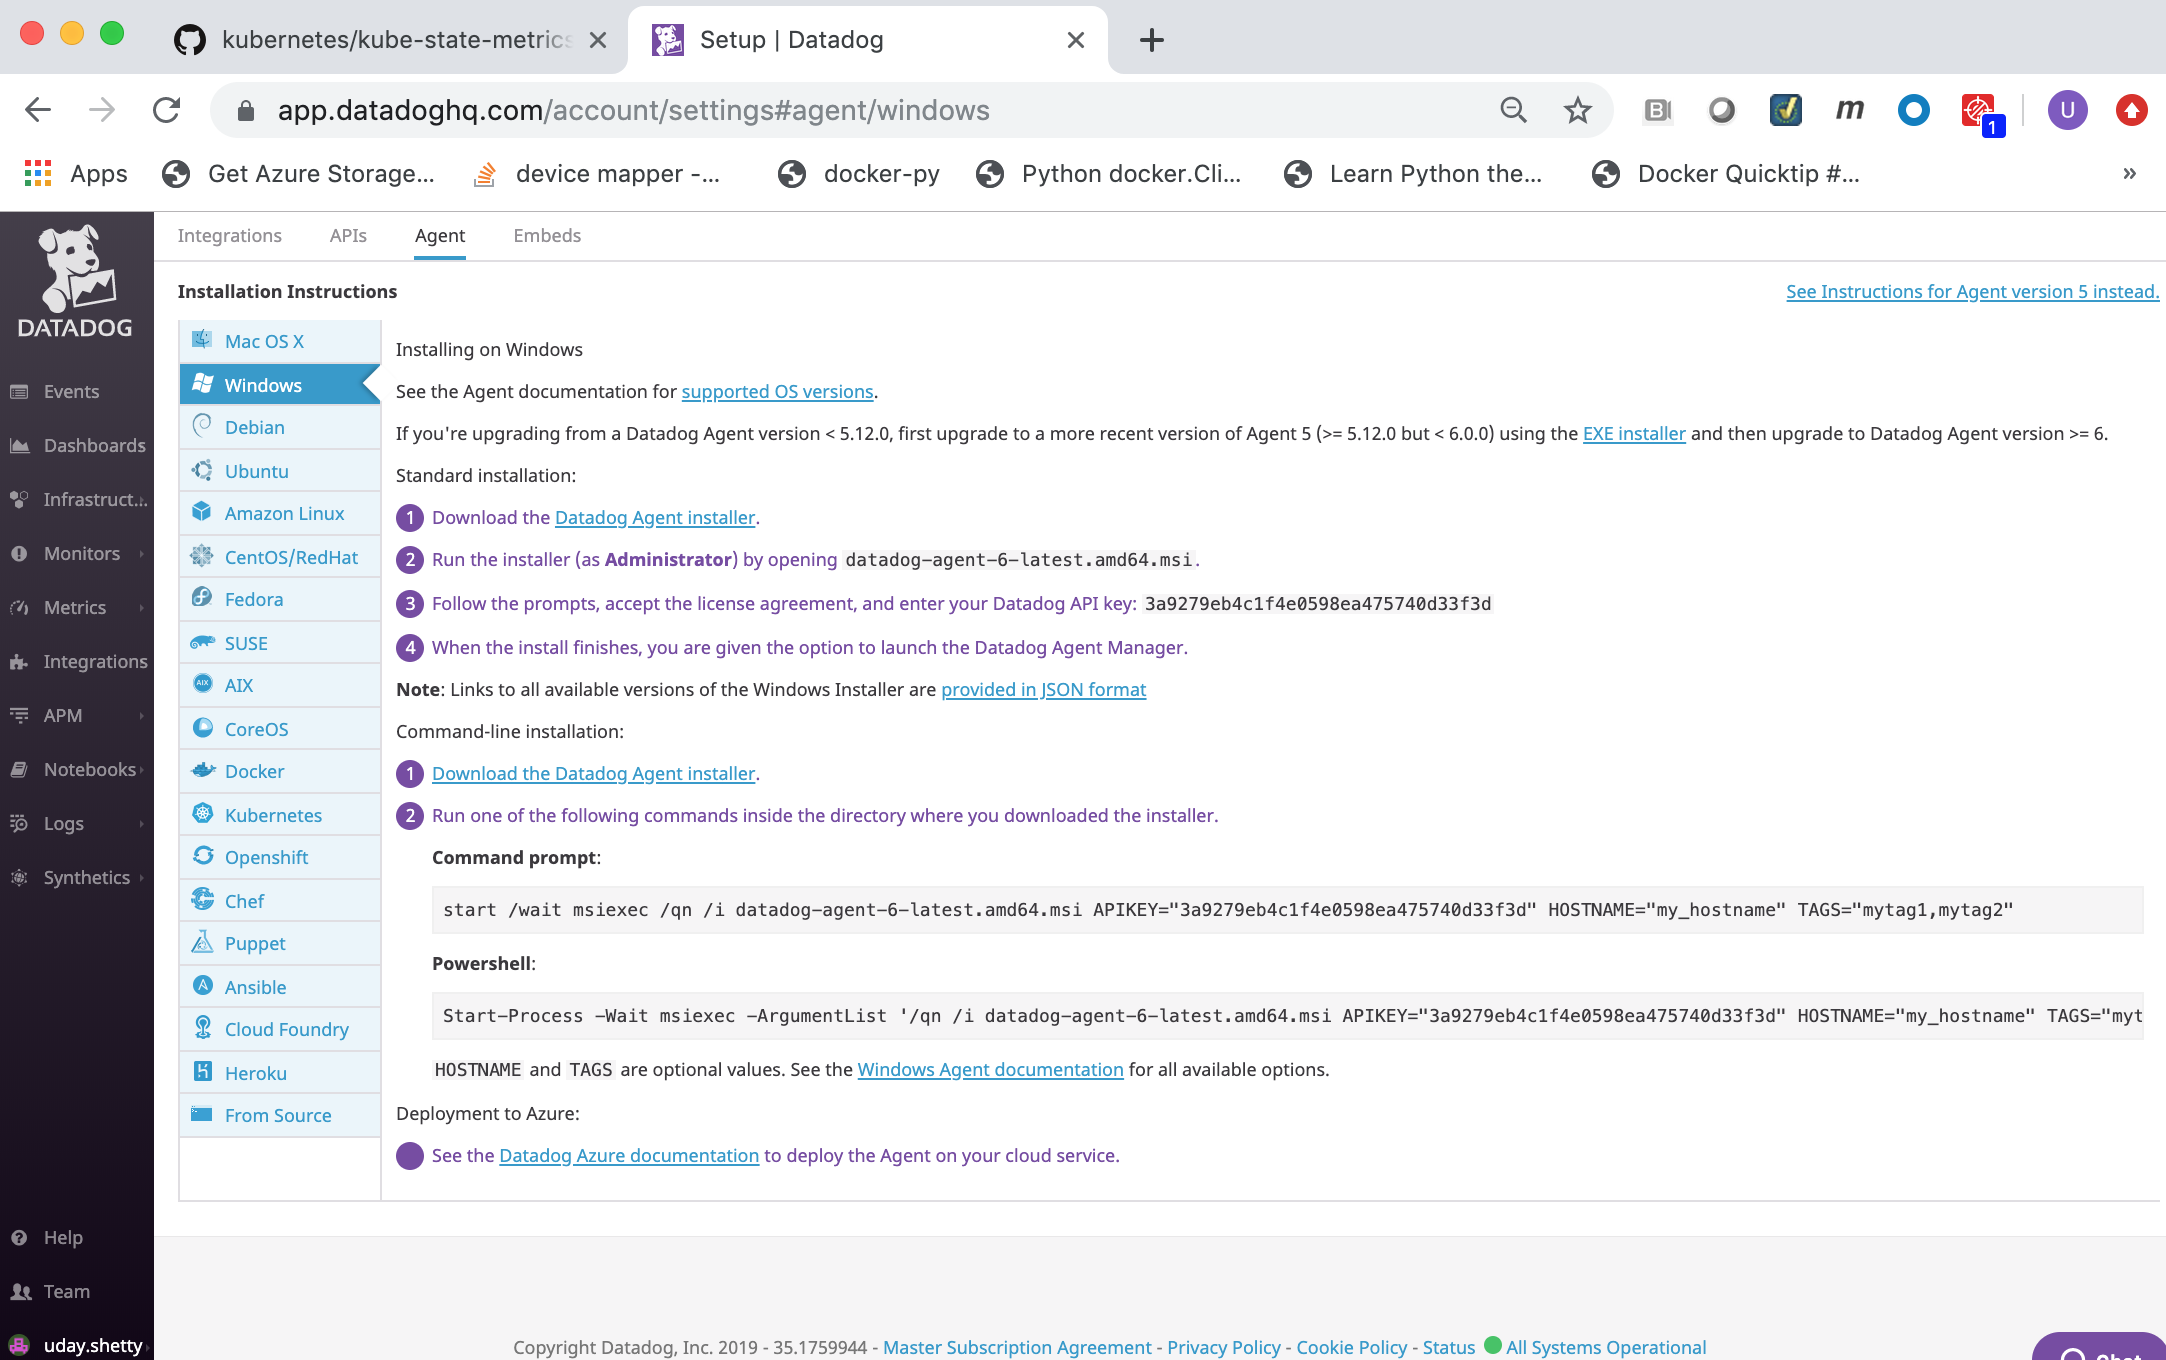
- Run the following
iwrcommand from a from a Windows Powershell command prompt on the Docker Enterprise Windows Node to download the Datadog Agent installer. Replace **datadog-windows-installer-download-link** with the link you copied in the previous step.
   > iwr **datadog-windows-installer-download-link** -outfile datadog-agent-installer-windows.msi

Example:

.. image:: ../_images/datadog/install_datadog_agent_on_windows4.png
   :width: 100%
   :alt: Install Datadog Agent on Windows
Run the following command from a Windows Powershell command prompt on the Docker Enterprise Windows Node. Change **datadog-api-key** to your
Datadog API Key.Note: Refer to Datadog Basic Agent Usage for Windows documentation for more details on installing the Datadog Agent on Windows including the installation parameters.
    Start-Process -Wait msiexec -ArgumentList '/qn /i datadog-agent-installer-windows.msi APM_ENABLED="true" LOGS_ENABLED="true" PROCESS_ENABLED="true" APIKEY="**datadog-api-key**"'

Example:

.. image:: ../_images/datadog/install_datadog_agent_on_windows5.png
   :width: 100%
   :alt: Install Datadog Agent on Windows

.. Note::

   The Datadog Agent is being installed silently in the
   background. It may take a few minutes for the installation to
   complete.
- Run the following command from a Windows Powershell command prompt on the Docker Enterprise Windows Node to display the Datadog Agent Windows services.
   > get-service -name "Datadog*"

Example:

.. image:: ../_images/datadog/display_datadog_agent_on_windows.png
   :width: 100%
   :alt: Display Datadog Agent on Windows
Note
At the time of testing Windows 2019, there’s no Docker for Windows and Kubernetes for Windows support.
Display the Datadog Agents from the Datadog Monitor Web portal
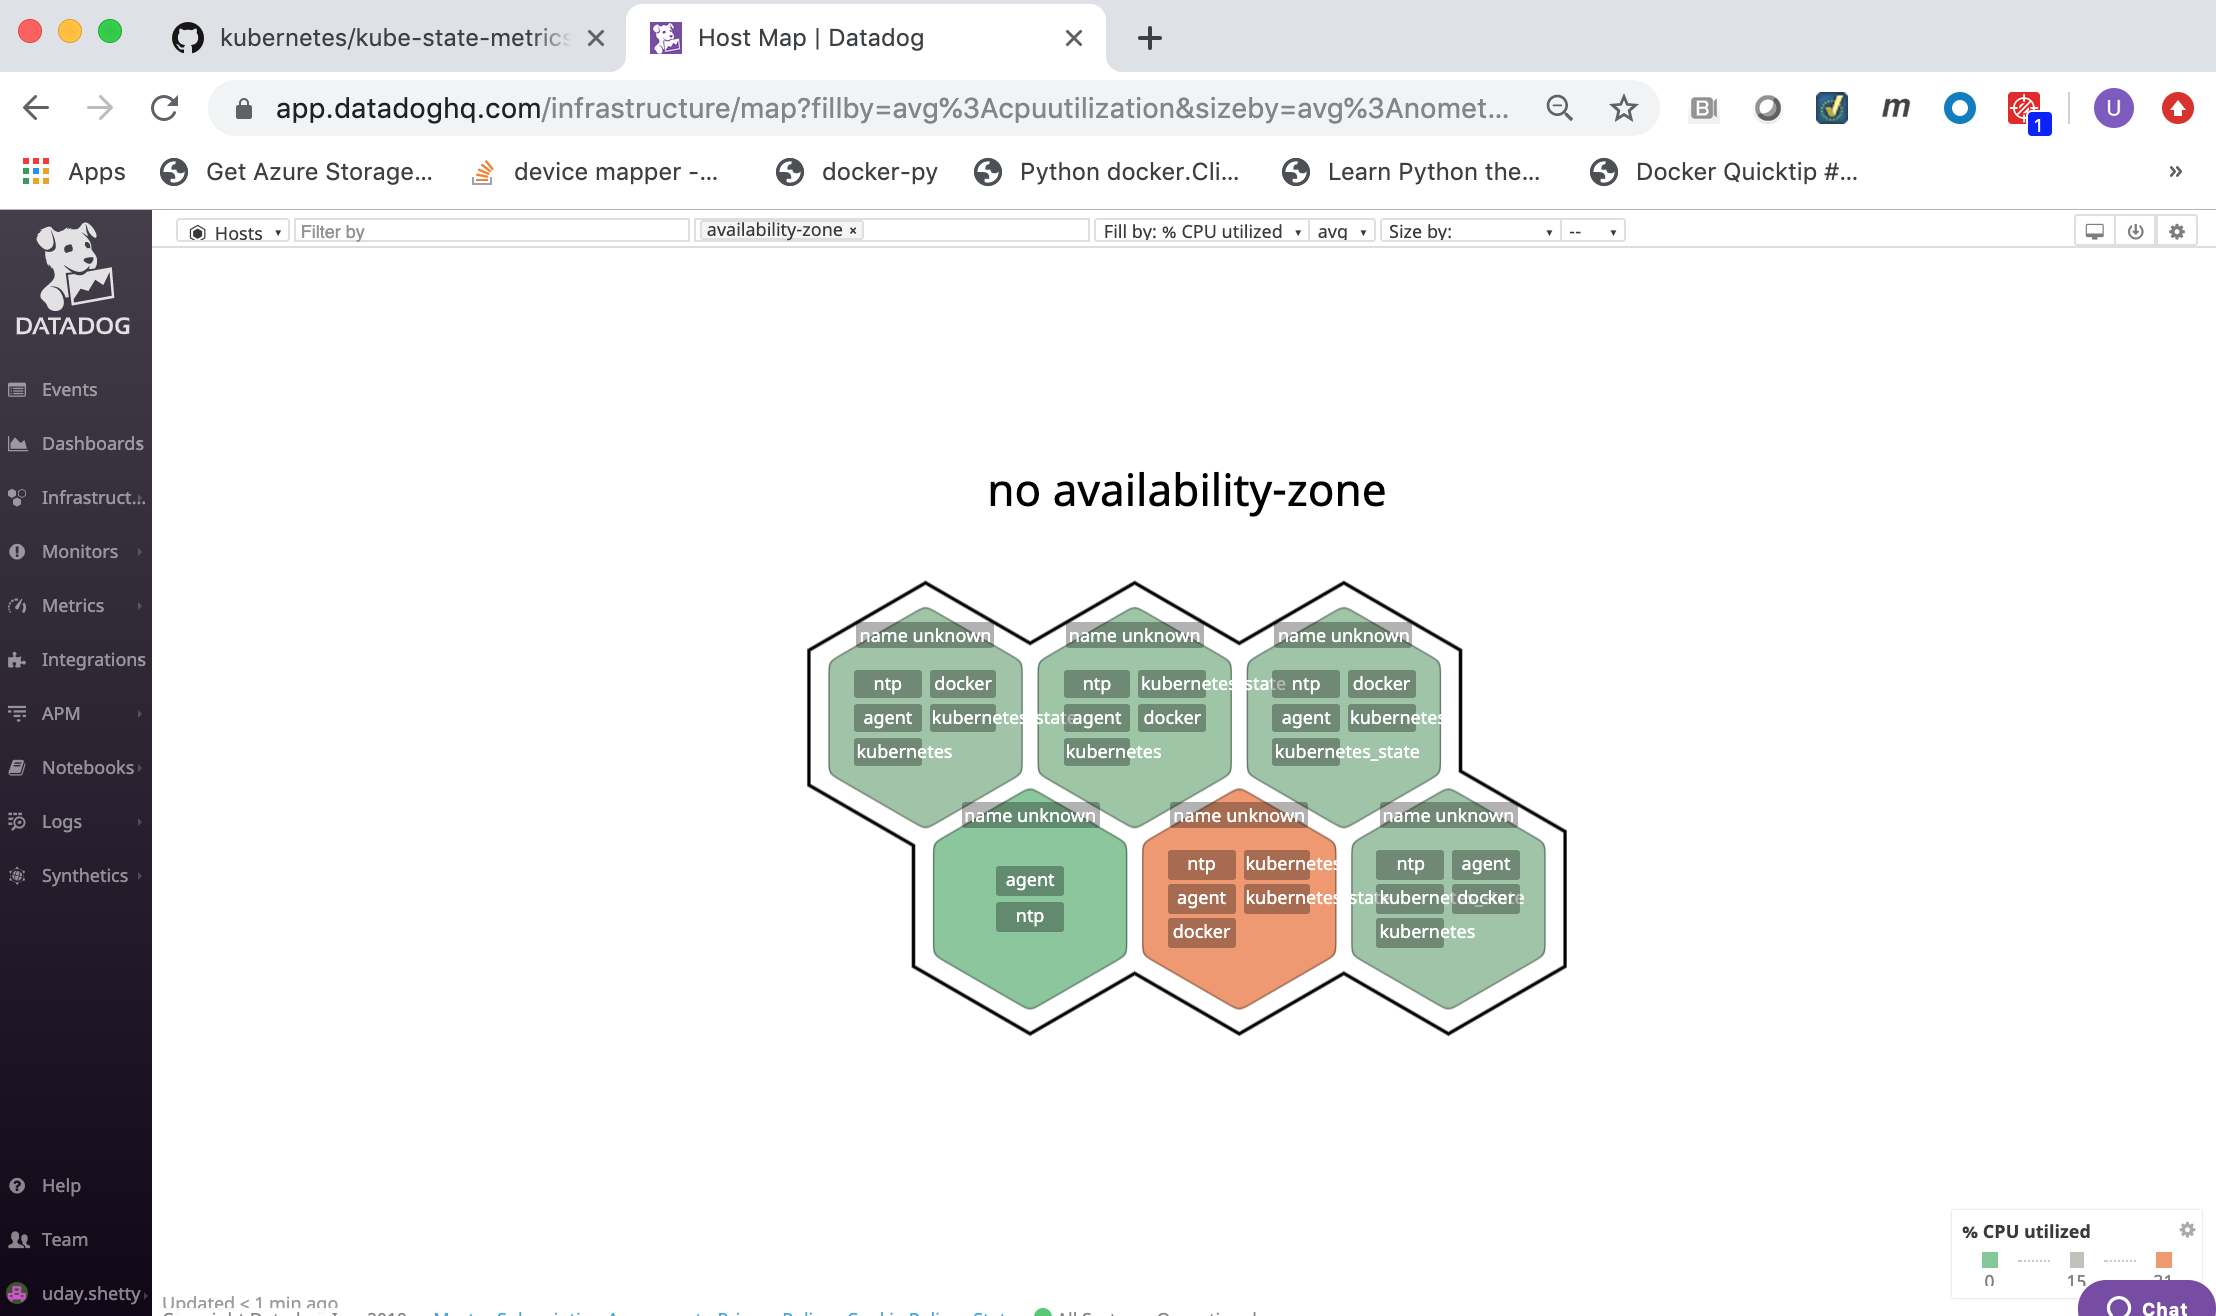
You can view the deployed Datadog agent from the Datadog Web portal Host Map page.
From the Datadog Monitor Web portal click on the Infrastructure link in the left frame and then click on the Host Map link.
Datadog Web Interface
The Datadog Web Interface has the following modules:
| Module | Description |
|---|---|
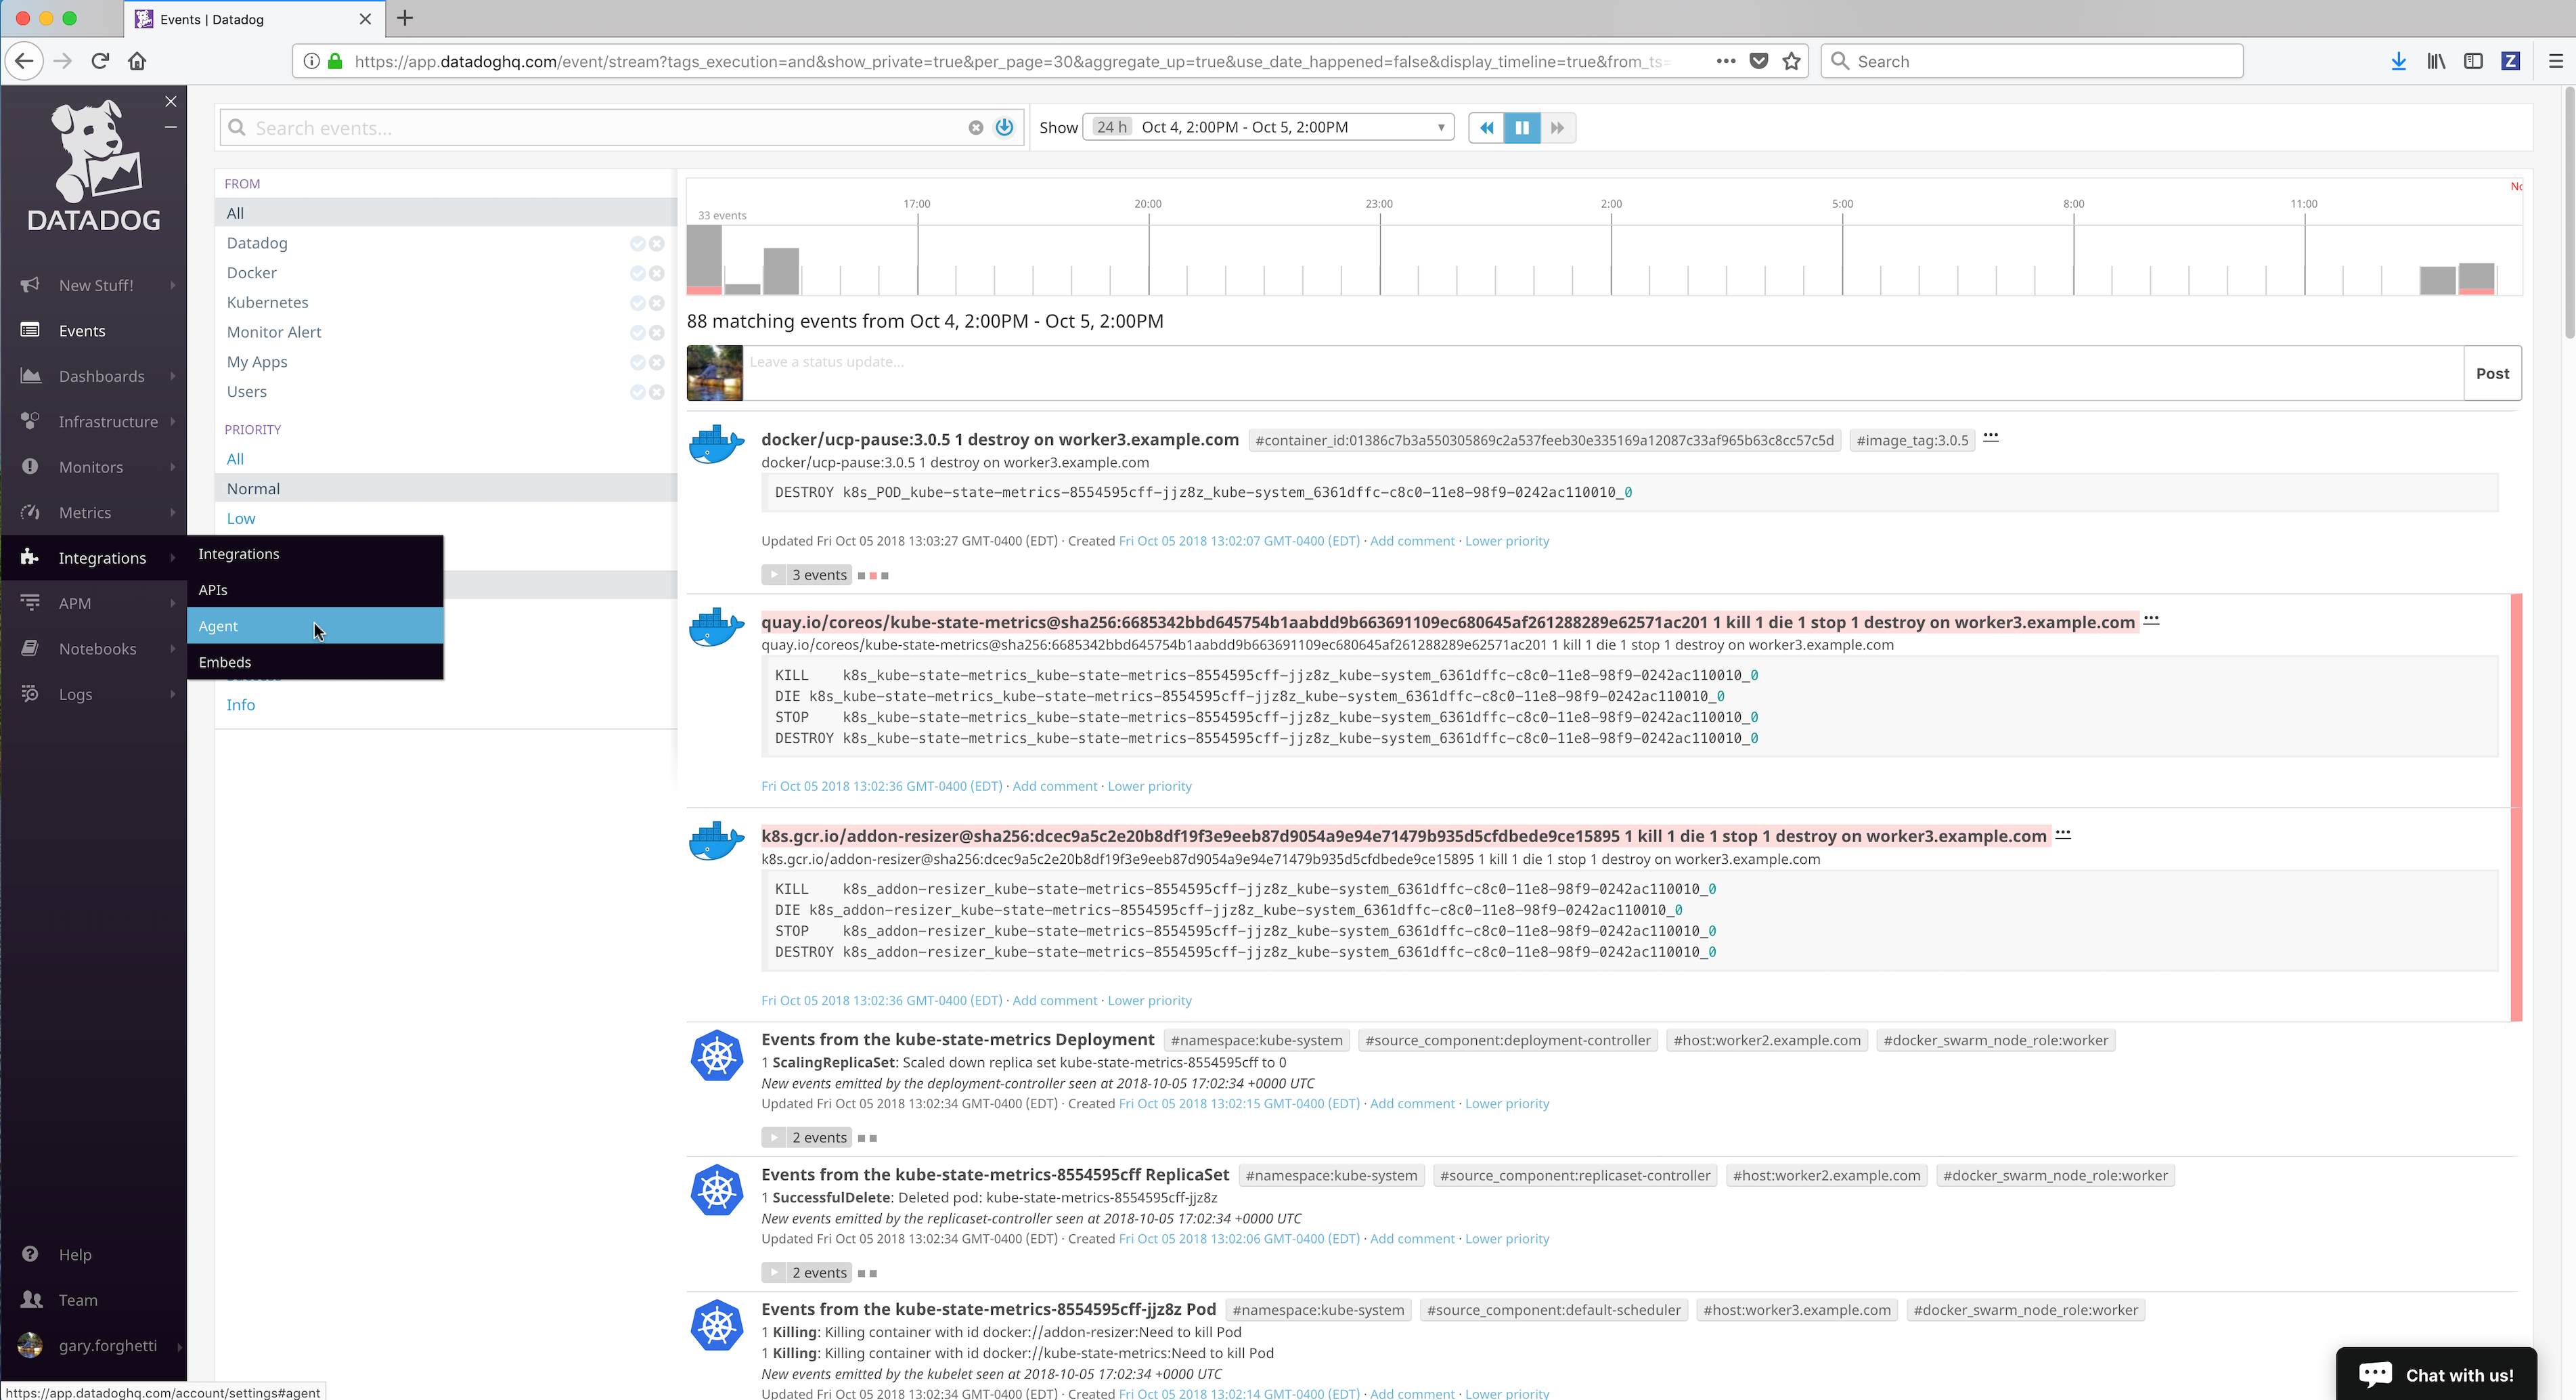
| Events | Shows a stream of the events collected by Datadog agents. |
| Dashboards | Allows you to view and create Dashboards that contain graphs with real-time performance metrics. |
| Infrastructure | Shows all of the hosts being monitoring by Datadog agents. |
| Monitors | Create monitors to notify you if the aggregate of a specific metric is above or below a certain threshold. |
| Metrics | Search, view and graph the collected metrics. |
| Integrations | Configure Datadog to integrate with over 200 applications, services and systems. |
| APM | Provides you with deep insight into your application’s performance-from automatically generated dashboards that monitor key metrics. |
| Notebooks | Create notebooks that combine graphs and text in a linear, cell-based format. |
| Logs | Search, view and graph all the logs generated by your applications, and your infrastructure. |
Datadog Events

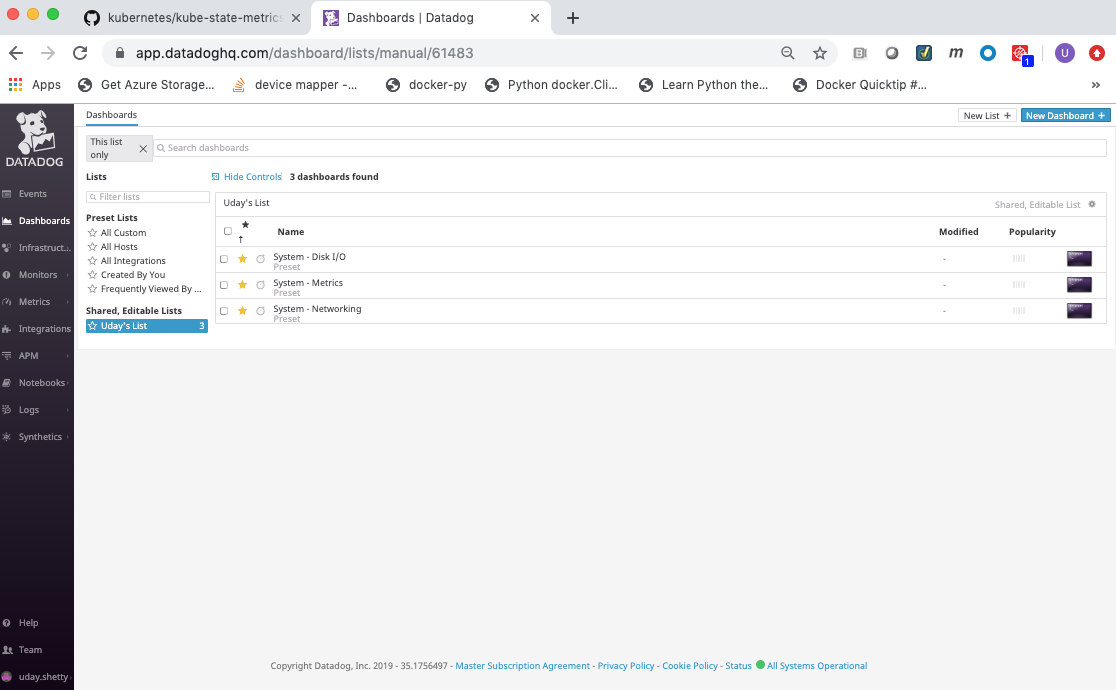
Datadog Dashboards
Out of the box Datadog provides 3 system dashboards:
- System - Disk I/O
- System - Metrics
- System - Networking
System - Disk I/O

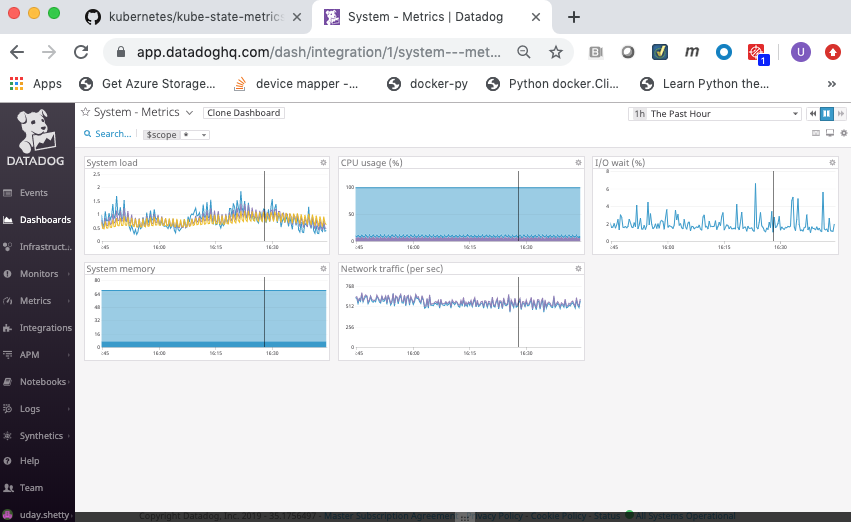
System - Metrics
System - Networking

Integration with Docker
Install the Datadog Docker Integration (Dashboard)
Datadog provides extensive Docker Integration which needs to be installed. To install the Docker Integration:
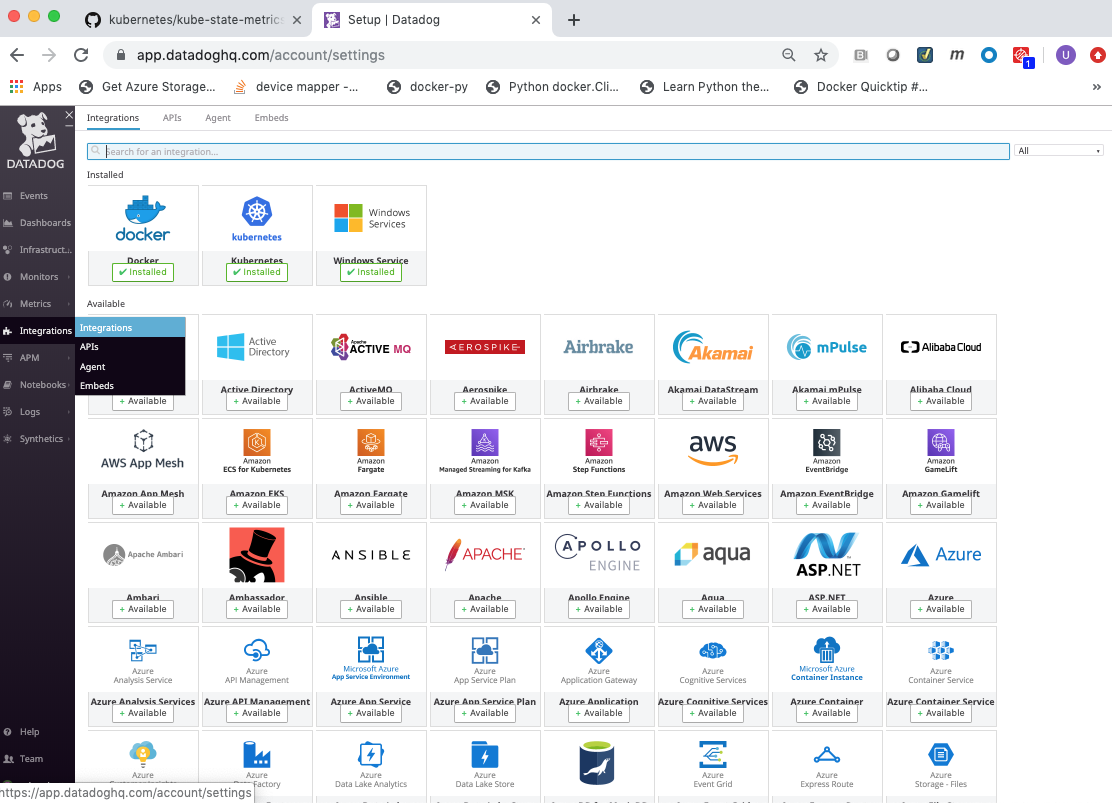
Click on the Integrations link in the left frame, then click on the Integrations menu item.
Locate and click on the Docker integration icon/button to install it.
Click on the Configuration tab and then click on the Install Integration button. The install takes a few seconds.

- After the installation completes, refresh the page and scroll to the top. The Docker Integration will appear as Installed.
Integration with Kubernetes
Install the Kubernetes Integration (Dashboard)
Datadog provides extensive Kubernetes Integration which needs to be installed. To install the Kubernetes Integration:
- Follow the same process as above to install Kubernetes Integration
- After the installation completes, refresh the page and scroll to the top. The Kubernetes Integration will appear as Installed.
View the Datadog Docker Dashboard
Click on the Dashboards link in the left frame, followed by the Dashboard List menu item.
Click on the Docker Dashboard from the dashboard list.
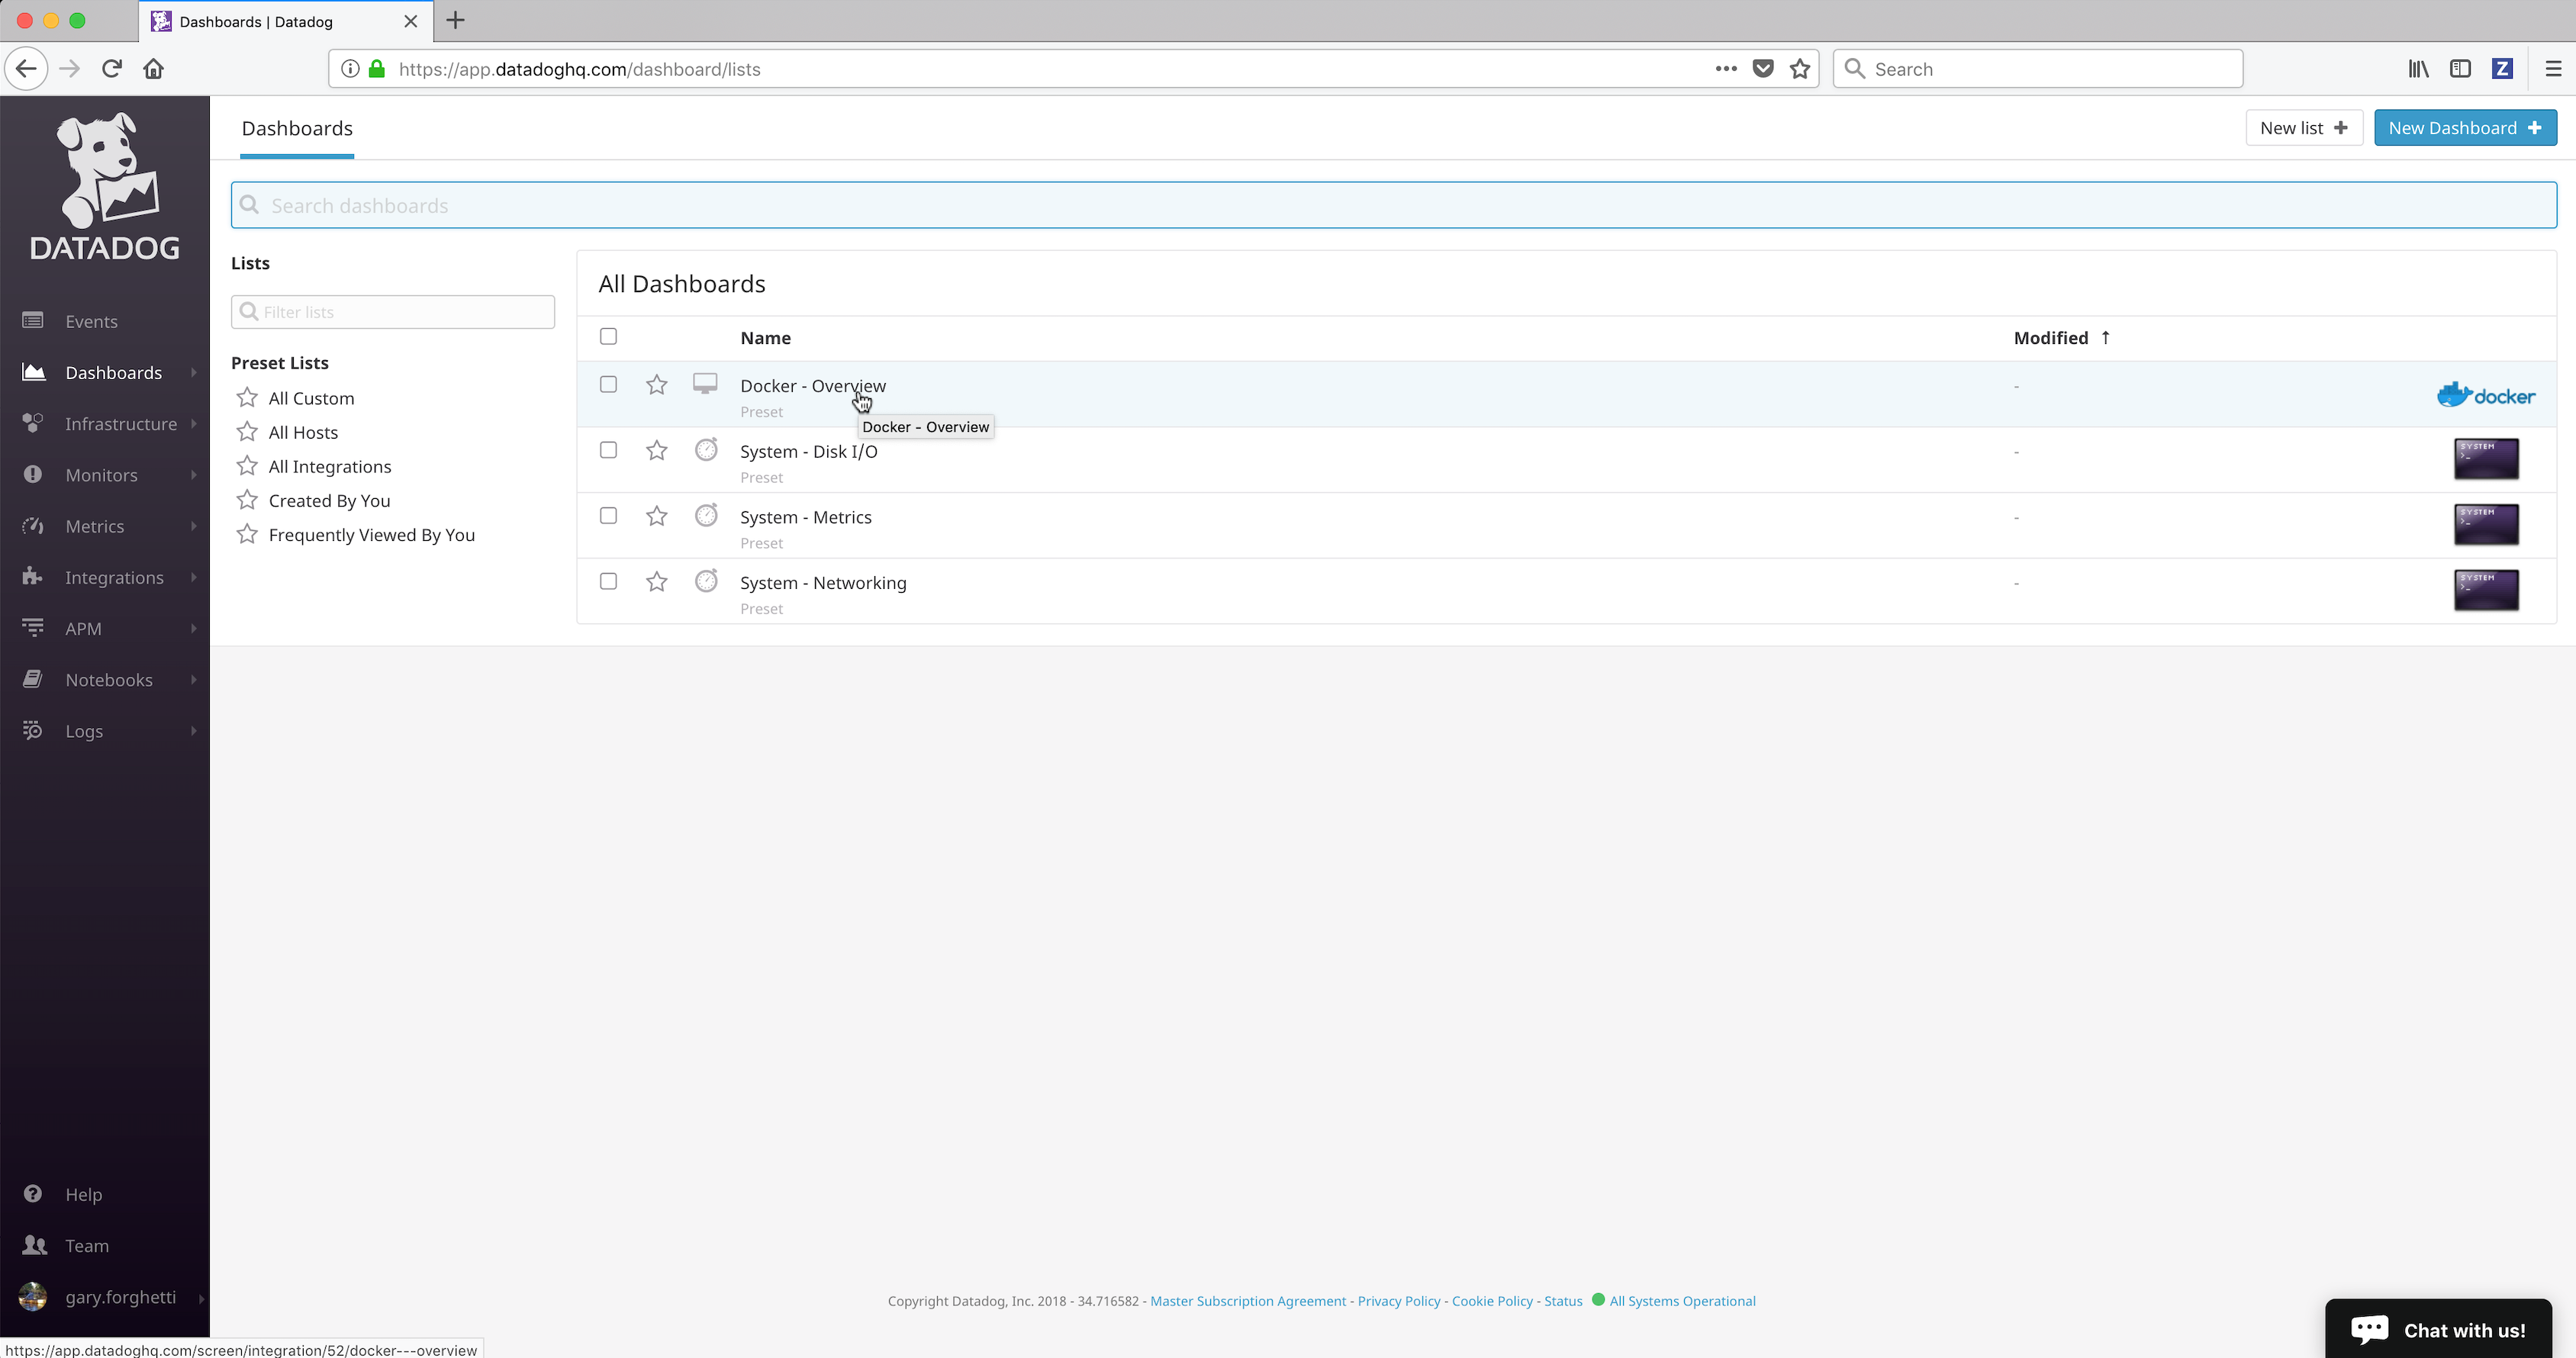
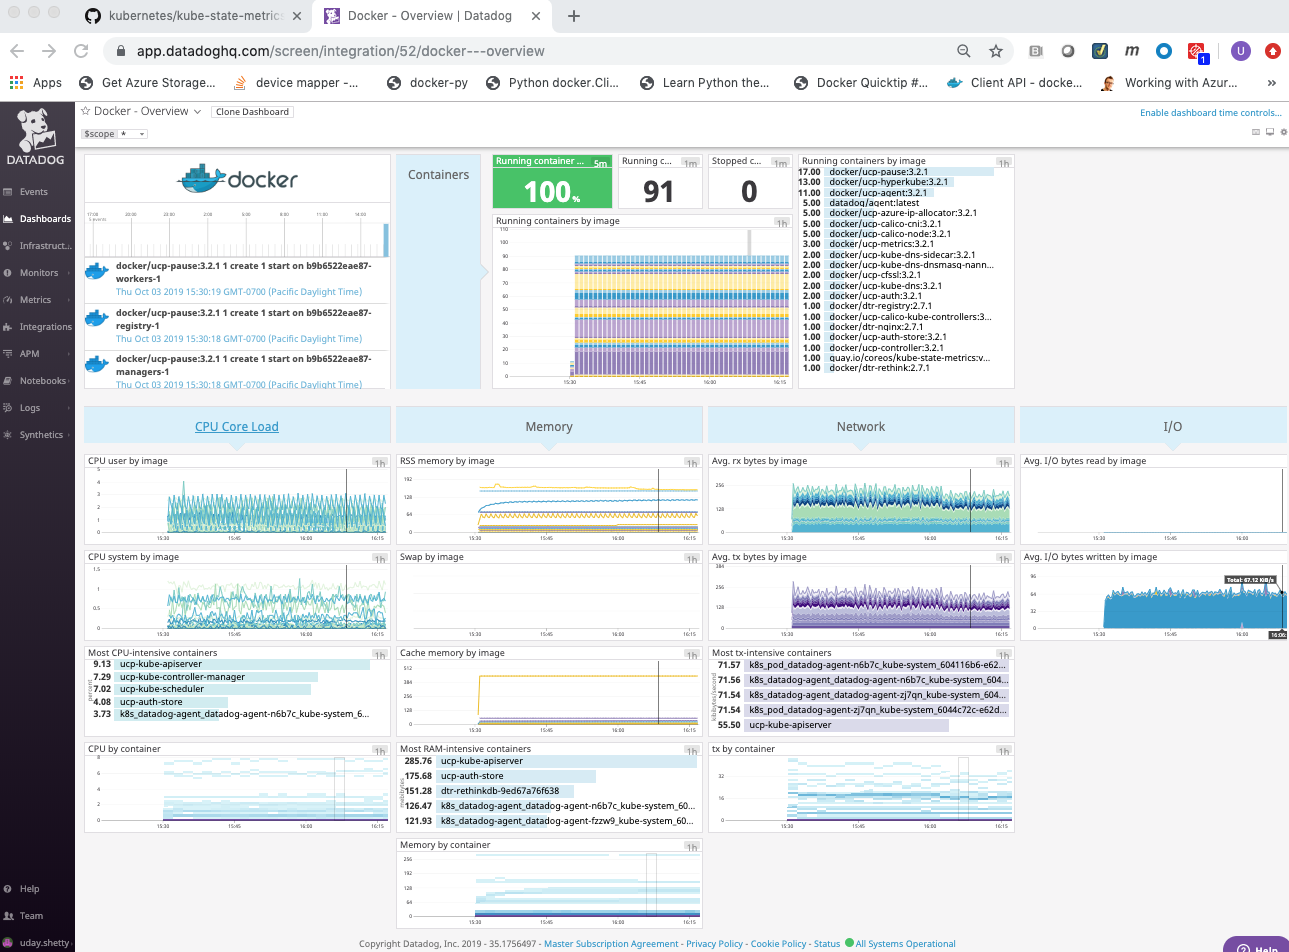
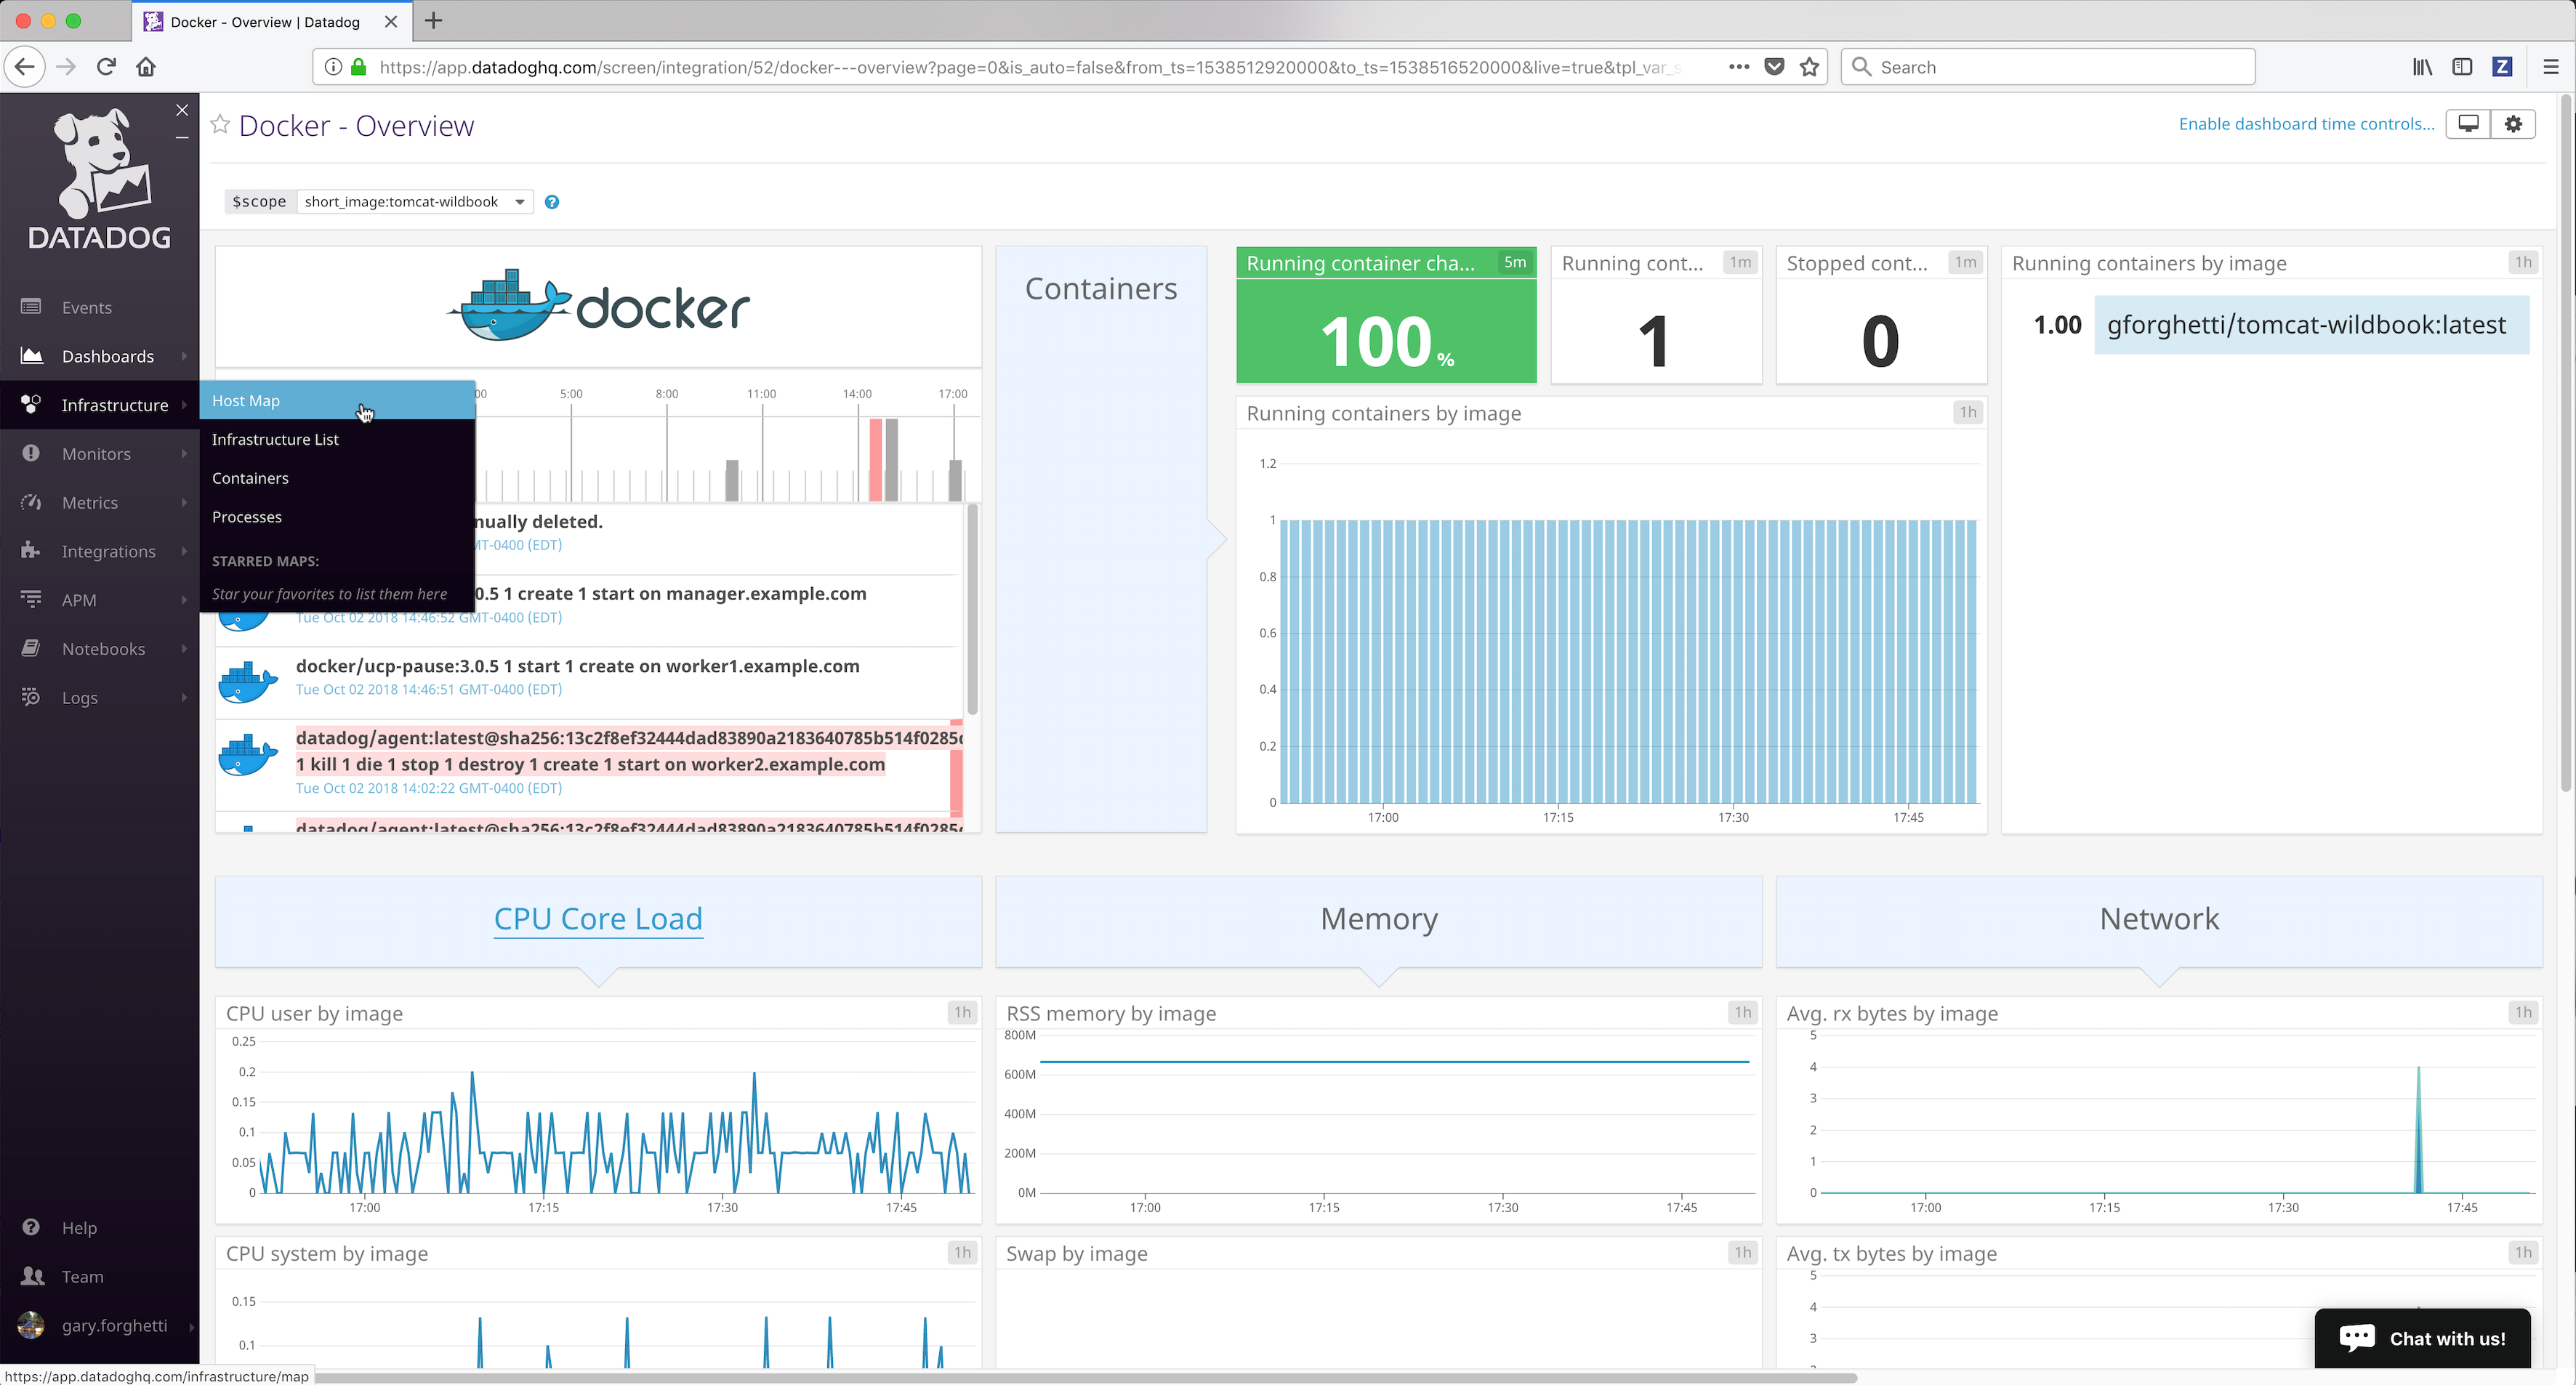
The Datadog Docker Dashboard will be displayed.
The Datadog Docker Dashboard displays:
- Events
- Event timeline over the past day
- Event stream
- Metrics on running and stopped containers
- Running container change over the past 5 minutes
- Running containers
- Stopped containers
- Running containers by image (graph)
- Running containers by image (list)
- CPU Core Load
- CPU user usage by image
- CPU system usage by image
- Most CPU intensive containers over the past hour
- CPU usage by container over the past hour
- Memory
- RSS memory usage by image
- SWAP usage by image, on average
- Cache memory usage by image
- Most RAM-intensive containers over the past hour
- Memory by container over the past hour
- Network
- Average received bytes by image over the past hour
- Average transmitted bytes by image over the past hour
- Most network traffic intensive containers over the past hour
- Network traffic by container over the past hour
See also
More details on the Datadog Docker Dashboard can be found on datadoghq.com.
- Events
Infrastructure
View Docker Infrastructure
You can view the Docker Infrastructure dashboards from the Infrastructure link in the left frame:
Docker Infrastructure dashboards
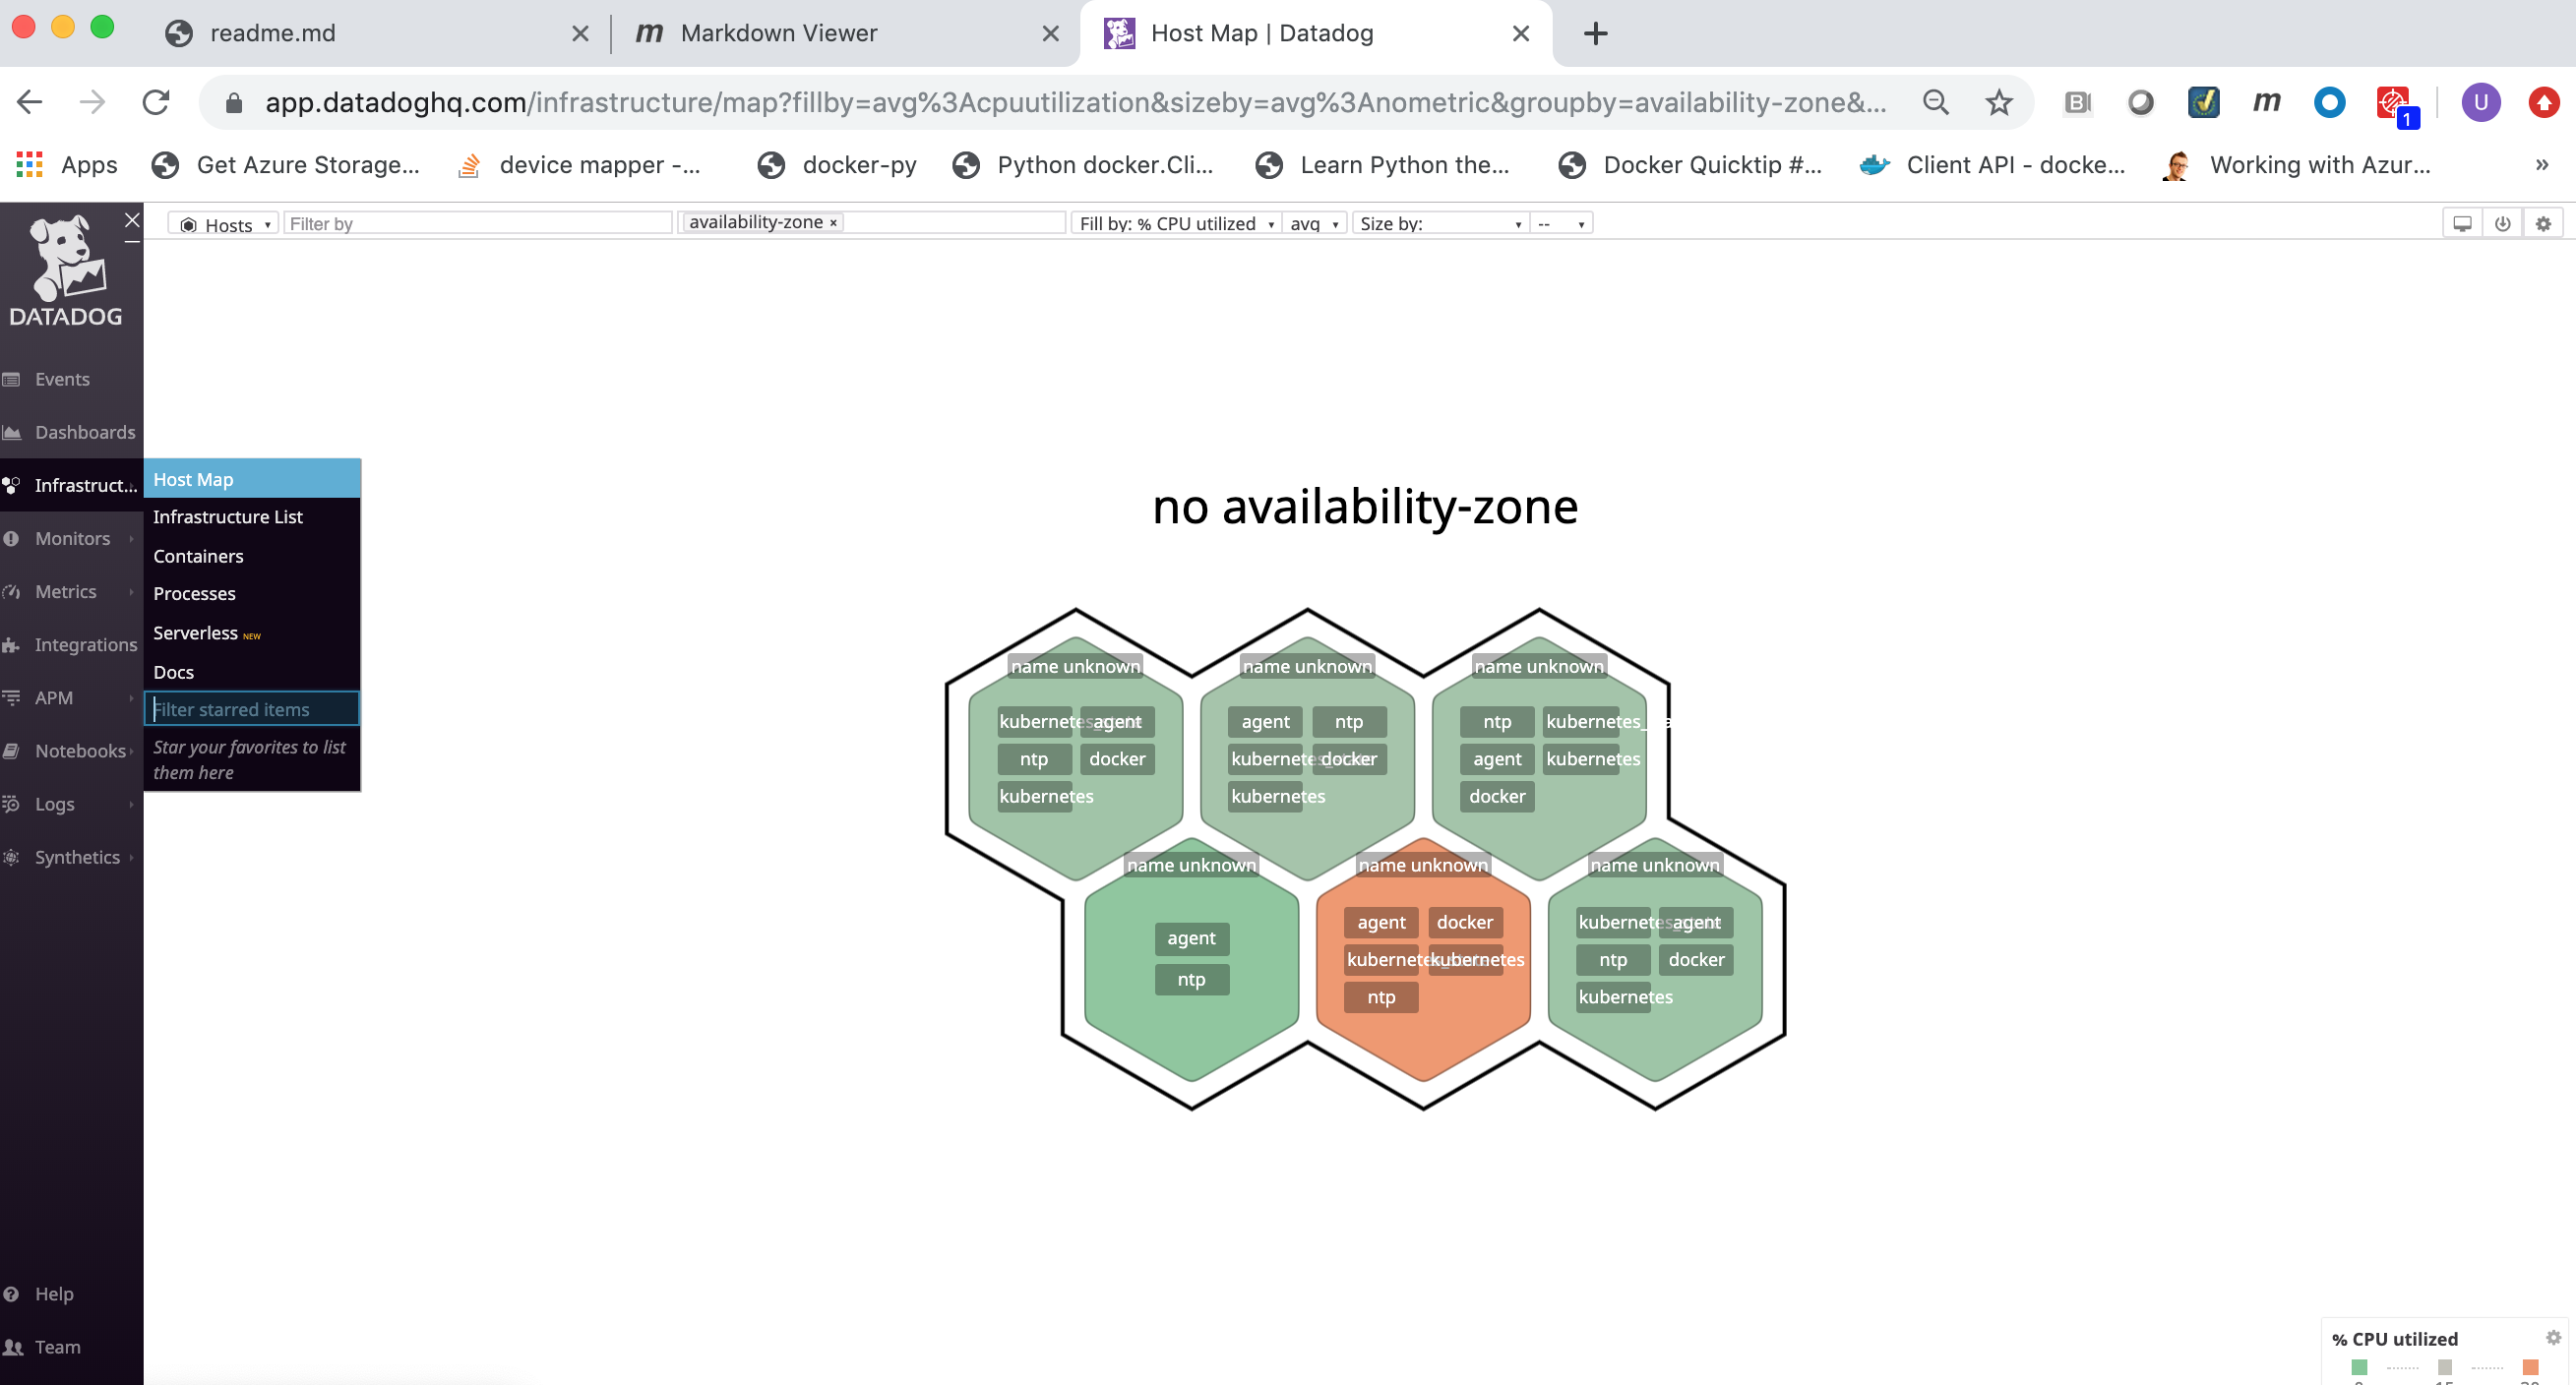
The Host Map page provides a quick visualization of the monitored environment:
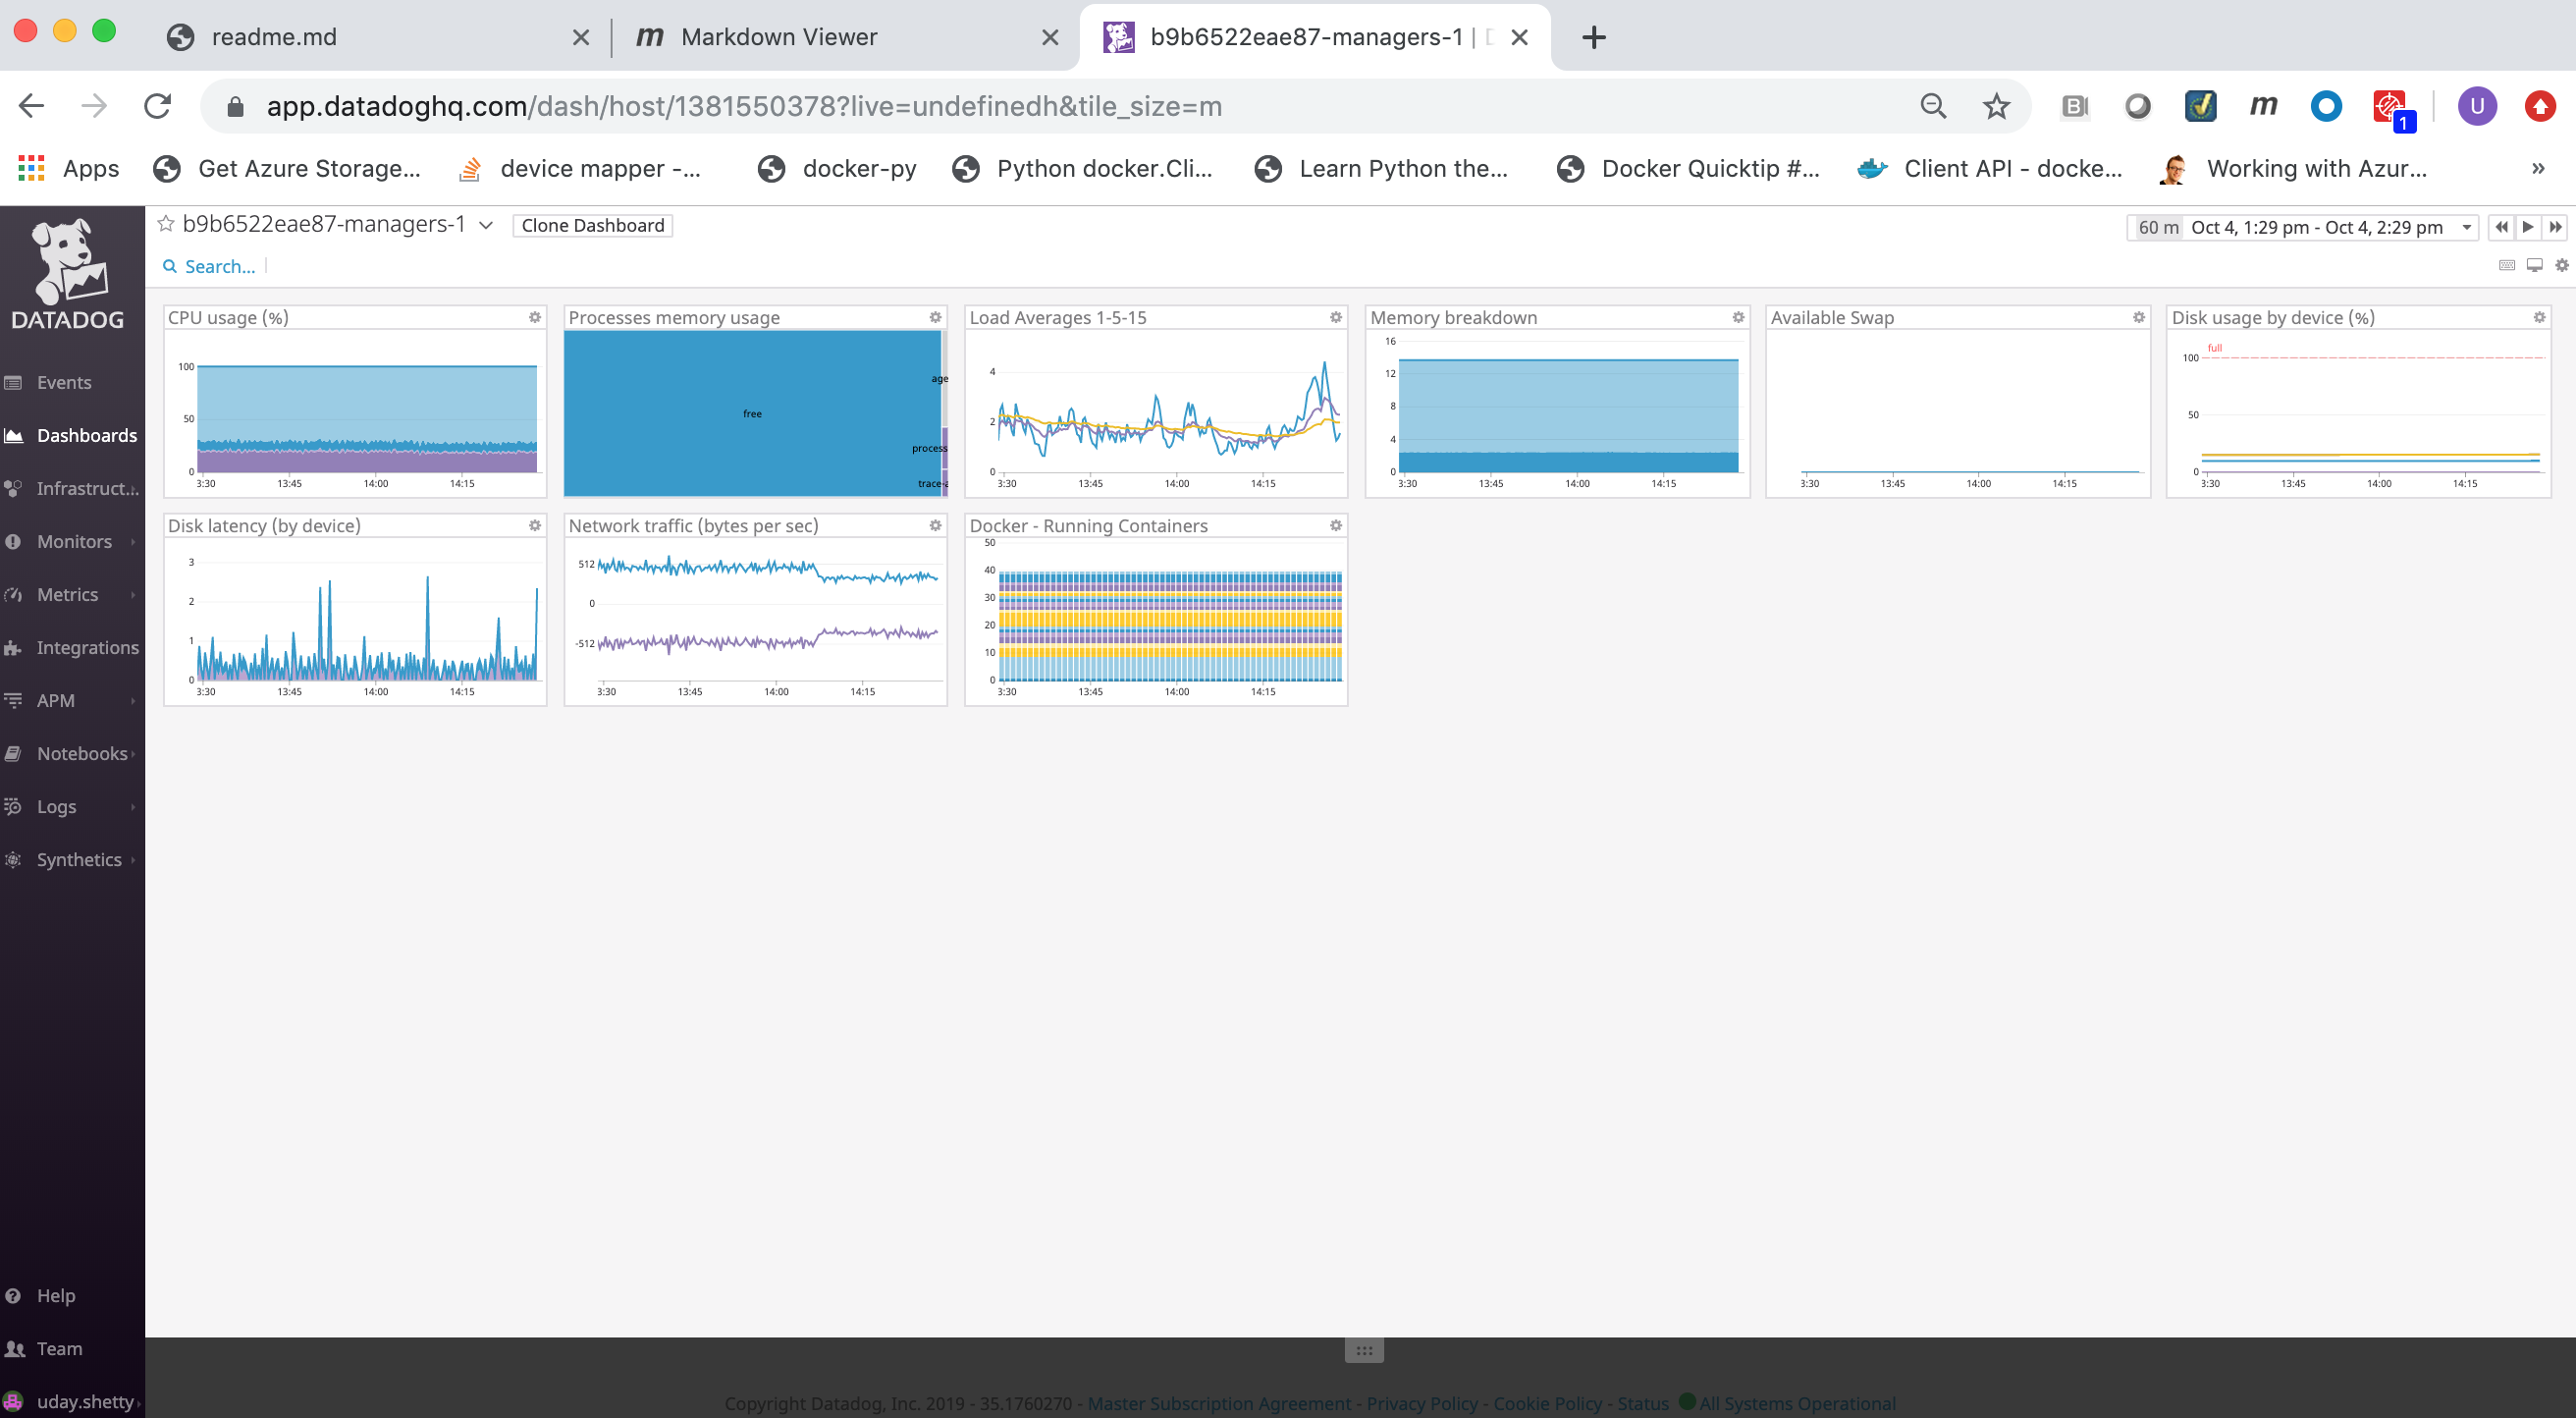
the Infrastructure List page shows all Docker nodes being monitored (running the Datadog agent):

You can click on a Docker node to inspect it and get details.
The Containers page lists all running containers from all Docker nodes being monitored:

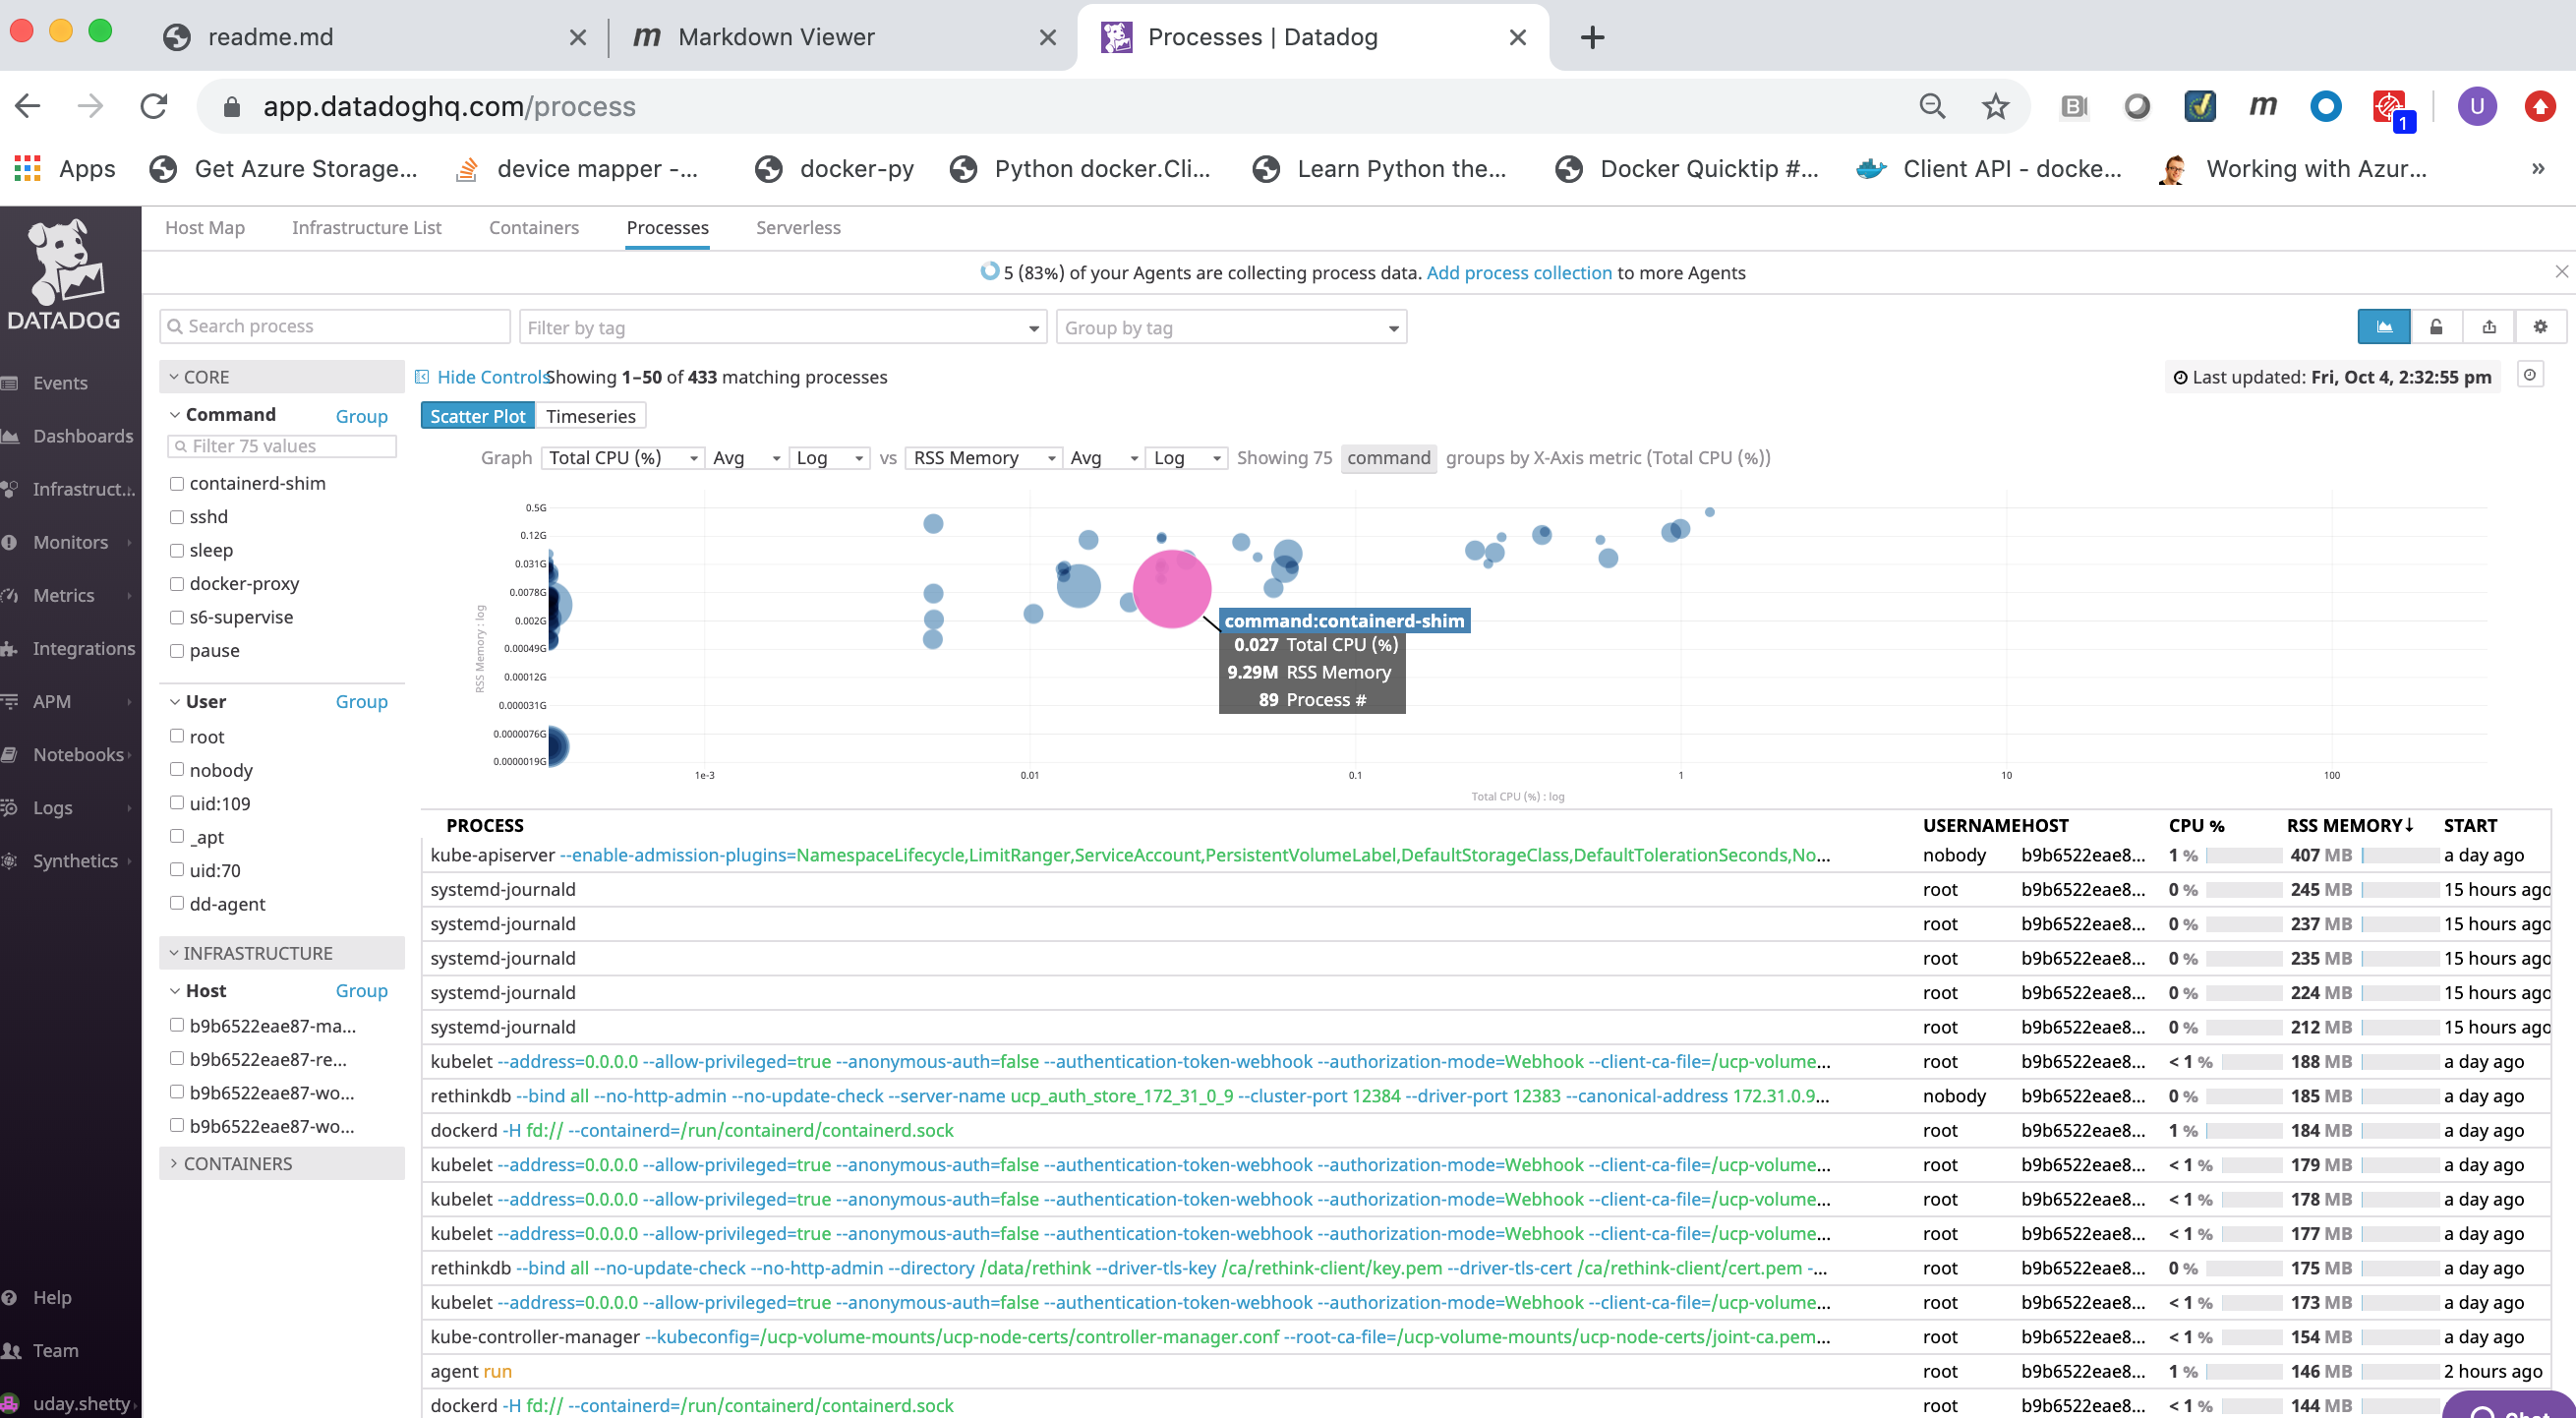
The Processes page displays a list of all running processes from all Docker nodes being monitored:


Logs
Search, view and graph all the logs generated by your applications, and your infrastructure.

See also
- Docker Enterprise
- Datadog Getting Started
- Datadog Quick Start Guide
- Datadog Docker Integration
- Getting Started with the Datadog agent
- Datadog Docker Agent
- Datadog Agent on Windows
- Docker Monitoring
- Kubernetes Integration
- Datadog Kubernetes Agent
- Datadog Documentation
- Datadog Knowledge Base and FAQ
- Datadog Blog
- Datadog Certified Docker Hub Image
Refer to the following links for more information on Datadog best practices:
Refer to the following links for more information on Monitoring and Troubleshooting: