Dynatrace Monitoring Implementation Guide for Docker Enterprise
Dynatrace Monitoring Implementation Guide for Docker Enterprise
Overview
Docker Solution Briefs enable you to integrate the Docker Enterprise with popular 3rd party ecosystem solutions for networking, load balancing, storage, logging and monitoring, access management, and more. This Solution Brief documents how to deploy Dynatrace to monitor the performance of Docker containers in a Docker Enterprise MKE Cluster environment.
Docker Enterprise includes Docker Cluster, a tool for for lifecycle management of Docker clusters. With Cluster, you use a YAML file to configure your provider’s resources. Then, with a single command, you provision and install all the resources from your configuration. The Docker Enterprise cluster was created using ‘docker cluster’ tool on Azure Cloud for this solution brief.
Note
Information on Dynatrace is provided by Docker as a known, working configuration for Docker Enterprise 3.0. Docker does not provide the product support for Dynatrace. Please contact the vendor approved support methods if you have any questions or problems with Dynatrace.
Dynatrace Overview
Dynatrace is an artificial intelligence (AI) powered, full stack, automated Application Performance Management and Infrastructure Monitoring solution for programs running on-premises and in the cloud. Dynatrace manages the availability and performance of software applications and the impact on user experience in the form of deep transaction tracing, synthetic monitoring, real user monitoring, and network monitoring.
Product Benefits
- Auto-discovery - Dynatrace Smartscape® technology automatically detects and displays all the components and dependencies that comprise your environment, providing you with a real-time blueprint of your application architecture.
- Auto-baselining - Dynatrace uses AI to understand the difference between desirable and unwanted behaviors emerging from each component. It can also dive deep into the code to uncover methods being invoked and how they contribute to the overall performance of the system.
- Auto-problem analysis - Dynatrace rapidly identifies failures, component involvement, and root causes. Machine learning helps evaluate issues, determine if it warrants an alert, and provide valuable insights for better business decisions.
Dynatrace’s main features
- Hybrid multi-cloud, container, and infrastructure monitoring
- Support for native apps, microservices and containers
- Full stack discovery
- Single transaction analysis
- User behavior analytics
- Automated root-cause analysis
- Docker Swarm and Kubernetes integration
- SaaS or on-premise deployment
- Deploy, configure, and manage with zero touch
- Intuitive dashboards pre-configured with self-learning
- Open ecosystem with seamless integration along with APIs and platform extensions
Dynatrace Supported Technologies
Dynatrace supports are large array of technologies. Some of the most popular ones are:
AMP, ASPNET Core, AWS CodePipeline, AWS Elastic Load Balancing (ELB), AWS Lambda, ActiveMQ, Akka, Amazon DynamoDB, Amazon EC2, Amazon Elastic Block Store (EBS), Amazon RDS, Amazon S3, Amazon Web Services, Android, Android app monitoring, AngularJS, Ansible, Apache Cordova, Apache HTTP Server, Azure App Service, Azure Container Services (AKS), Azure Virtual Machines, Azure Web Apps, Bitbucket, C, C++, CakePHP, Cassandra, Citrix, Cloud Foundry, CouchDB, Couchbase, DC/OS, Demandware, Docker, Drupal, Elasticsearch, Erlang, Eureka, GlassFish, Golang, Google Cloud Platform, GraalVM, Grails, Hadoop, Heroku, HipChat, Hyper-V, Hystrix, IBM Bluemix, IBM Cloud, IBM Commerce, IBM HTTP Server, IBM WebSphere, IBM z/OS, JBoss, Java, Jetty, Jira, Joomla, Jython, Kubernetes, Laravel, Magento, Memcached, Mesos, Microsoft Azure, Microsoft IIS, Microsoft SharePoint, MongoDB, MySQL, .NET, .NET Core, Netflix OSS, Netty, Nginx, NodeJS, OpenStack, OpenTracing, Openshift, OpsGenie, Oracle Cloud, Oracle DB, Oracle HTTP Server, Oracle WebLogic, Oracle eBusiness, PHP, PagerDuty, Perl, Pivotal, Pivotal Cloud Foundry, Play Framework, PostgreSQL, Python, RabbitMQ, Reactjs, Red Hat, Redis, Ruby, SAP, SAP Cloud Platform, SAP Hybris, SQL Server, Salesforce Commerce Cloud, Scala, ServiceNow, Sitecore, Slack, Spark, Splunk, Spring, Symfony, TomEE, Tomcat, Trello, VMware, VMware Cloud on AWS, Varnish, VictorOps, Webhooks, Wildfly, Windows Messaging, WordPress, iOS, iOS, jQuery, xMatters
See also
Refer to Dynatrace Supported technologies for a complete updated list of the technologies it detects and supports.
Dynatrace Monitoring environment
The Dynatrace Monitoring environment consists of a Dynatrace server, Dynatrace agents and Dynatrace Activate (proxy).
Dynatrace server
- Collects, stores and analyzes the monitoring data sent to it from the Dynatrace agents.
- Provides a web UI for viewing and searching, and a REST API.
- Dynatrace has both a SaaS server and an on-premise server (Dynatrace Managed Server).
Dynatrace agent
- Dynatrace provides an agent named OneAgent for all of the major Linux distributions and Windows that needs to be deployed on all Docker node that you wish to monitor.
- The Dynatrace agent automatically discovers the infrastructure, collects the events and metrics, and forwards them to the Dynatrace SaaS server for processing, analysis and viewing.
- Dynatrace provides their Linux agent and Windows agent as installable binaries.
- Dynatrace also provides their linux agent as a certified docker image in Docker Hub dynatrace/oneagent.
Note
For more details on the Dynatrace supported Operating Systems and environments refer to Dynatrace OneAgent Supported Environments.
Dynatrace ActiveGate
Dynatrace Activegate is an optional proxy you can install between the Dynatrace agents and the Dynatrace Server (SaaS or on-premise).
Note
Refer to Dynatrace Activegate for more details on when and why you should install it.
In this Solution Brief the Dynatrace SaaS server will be used. The Dynatrace agents will be deployed and configured to send their monitoring data to the Dynatrace SaaS Server.
Docker Enterprise MKE Cluster
This Solution Brief was tested with the following Docker Enterprise components:
- Docker Enterprise 3.0 with Mirantis Container Runtime 19.03.2, MKE 3.2.1 and MSR 2.7.1, Dynatrace OneAgent version 1.32.1000
This Docker Enterprise environment in this implementation guide had 6 nodes (1 manager and 5 workers).
Refer to Docker Enterprise Best Practices and Design Considerations reference architecture for details.
Dynatrace SaaS account
A Dynatrace SaaS account is required. You can register for a free 15-day trial Dynatrace account on https://www.dynatrace.com/.
To register for a free 15-day trial Dynatrace account:
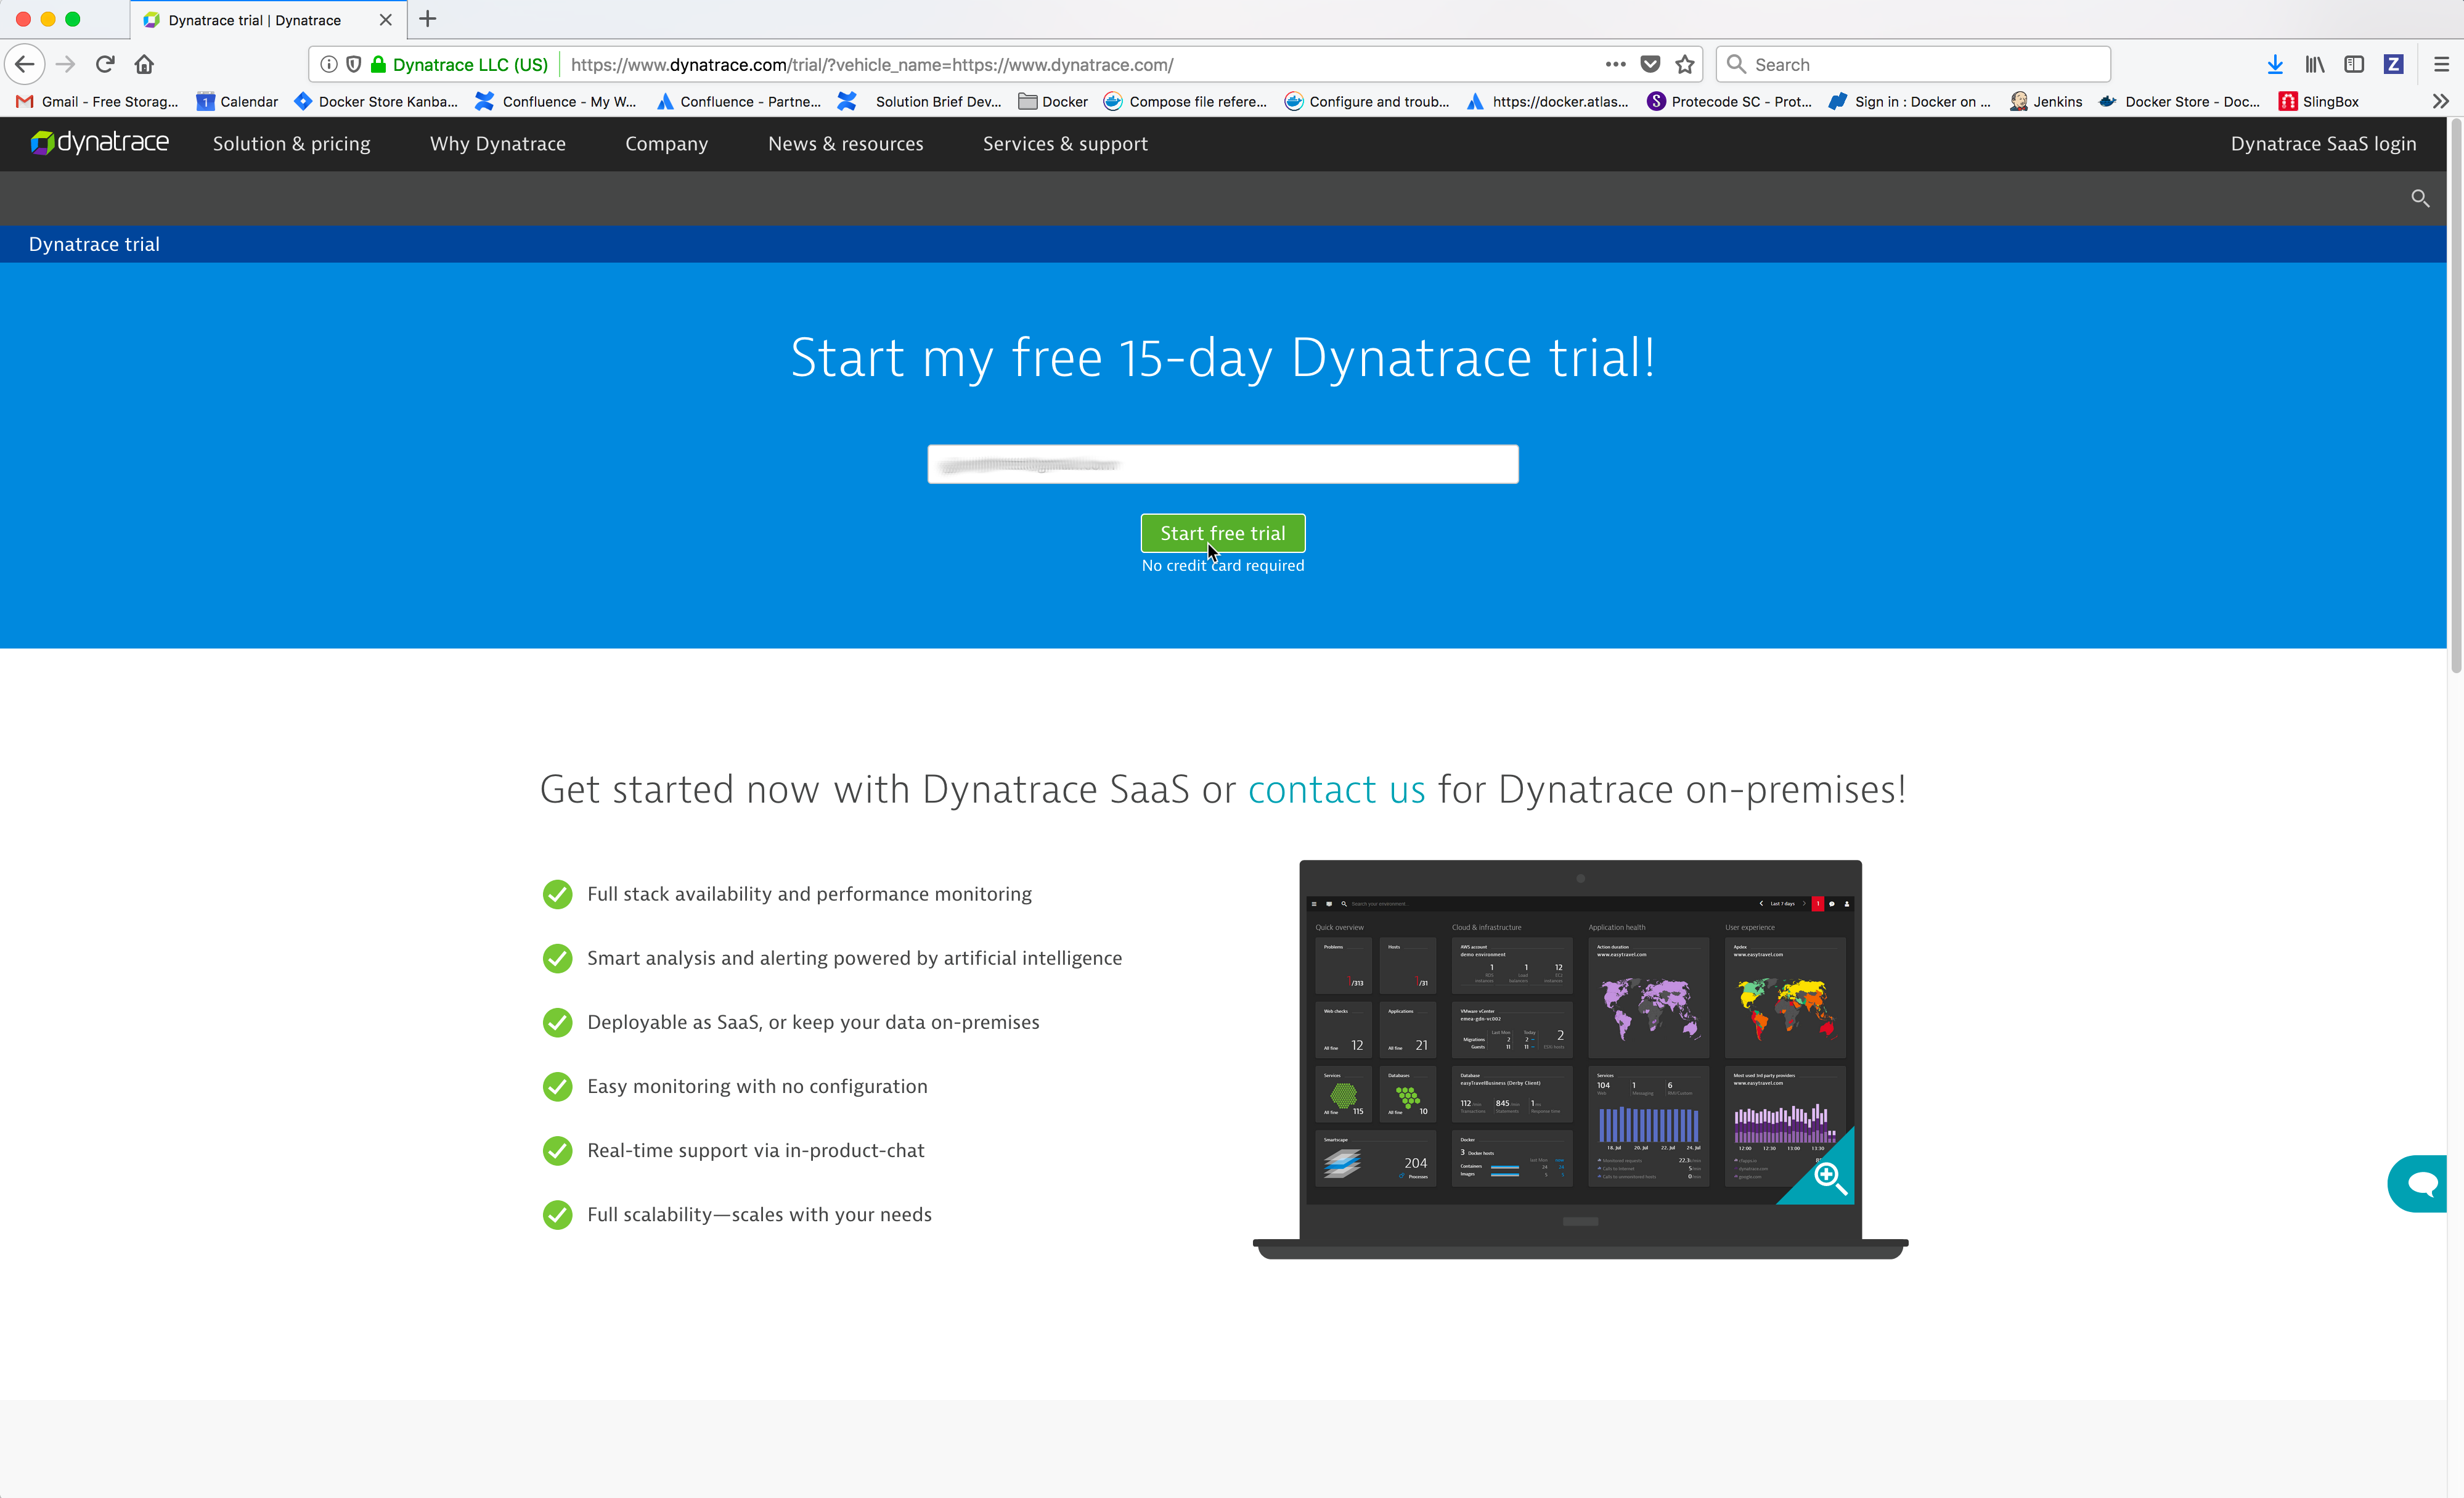
From a web browser, navigate to the URL https://www.dynatrace.com/.
Click on the Free trial button.

Enter your email address and then click on the Start free trial button.
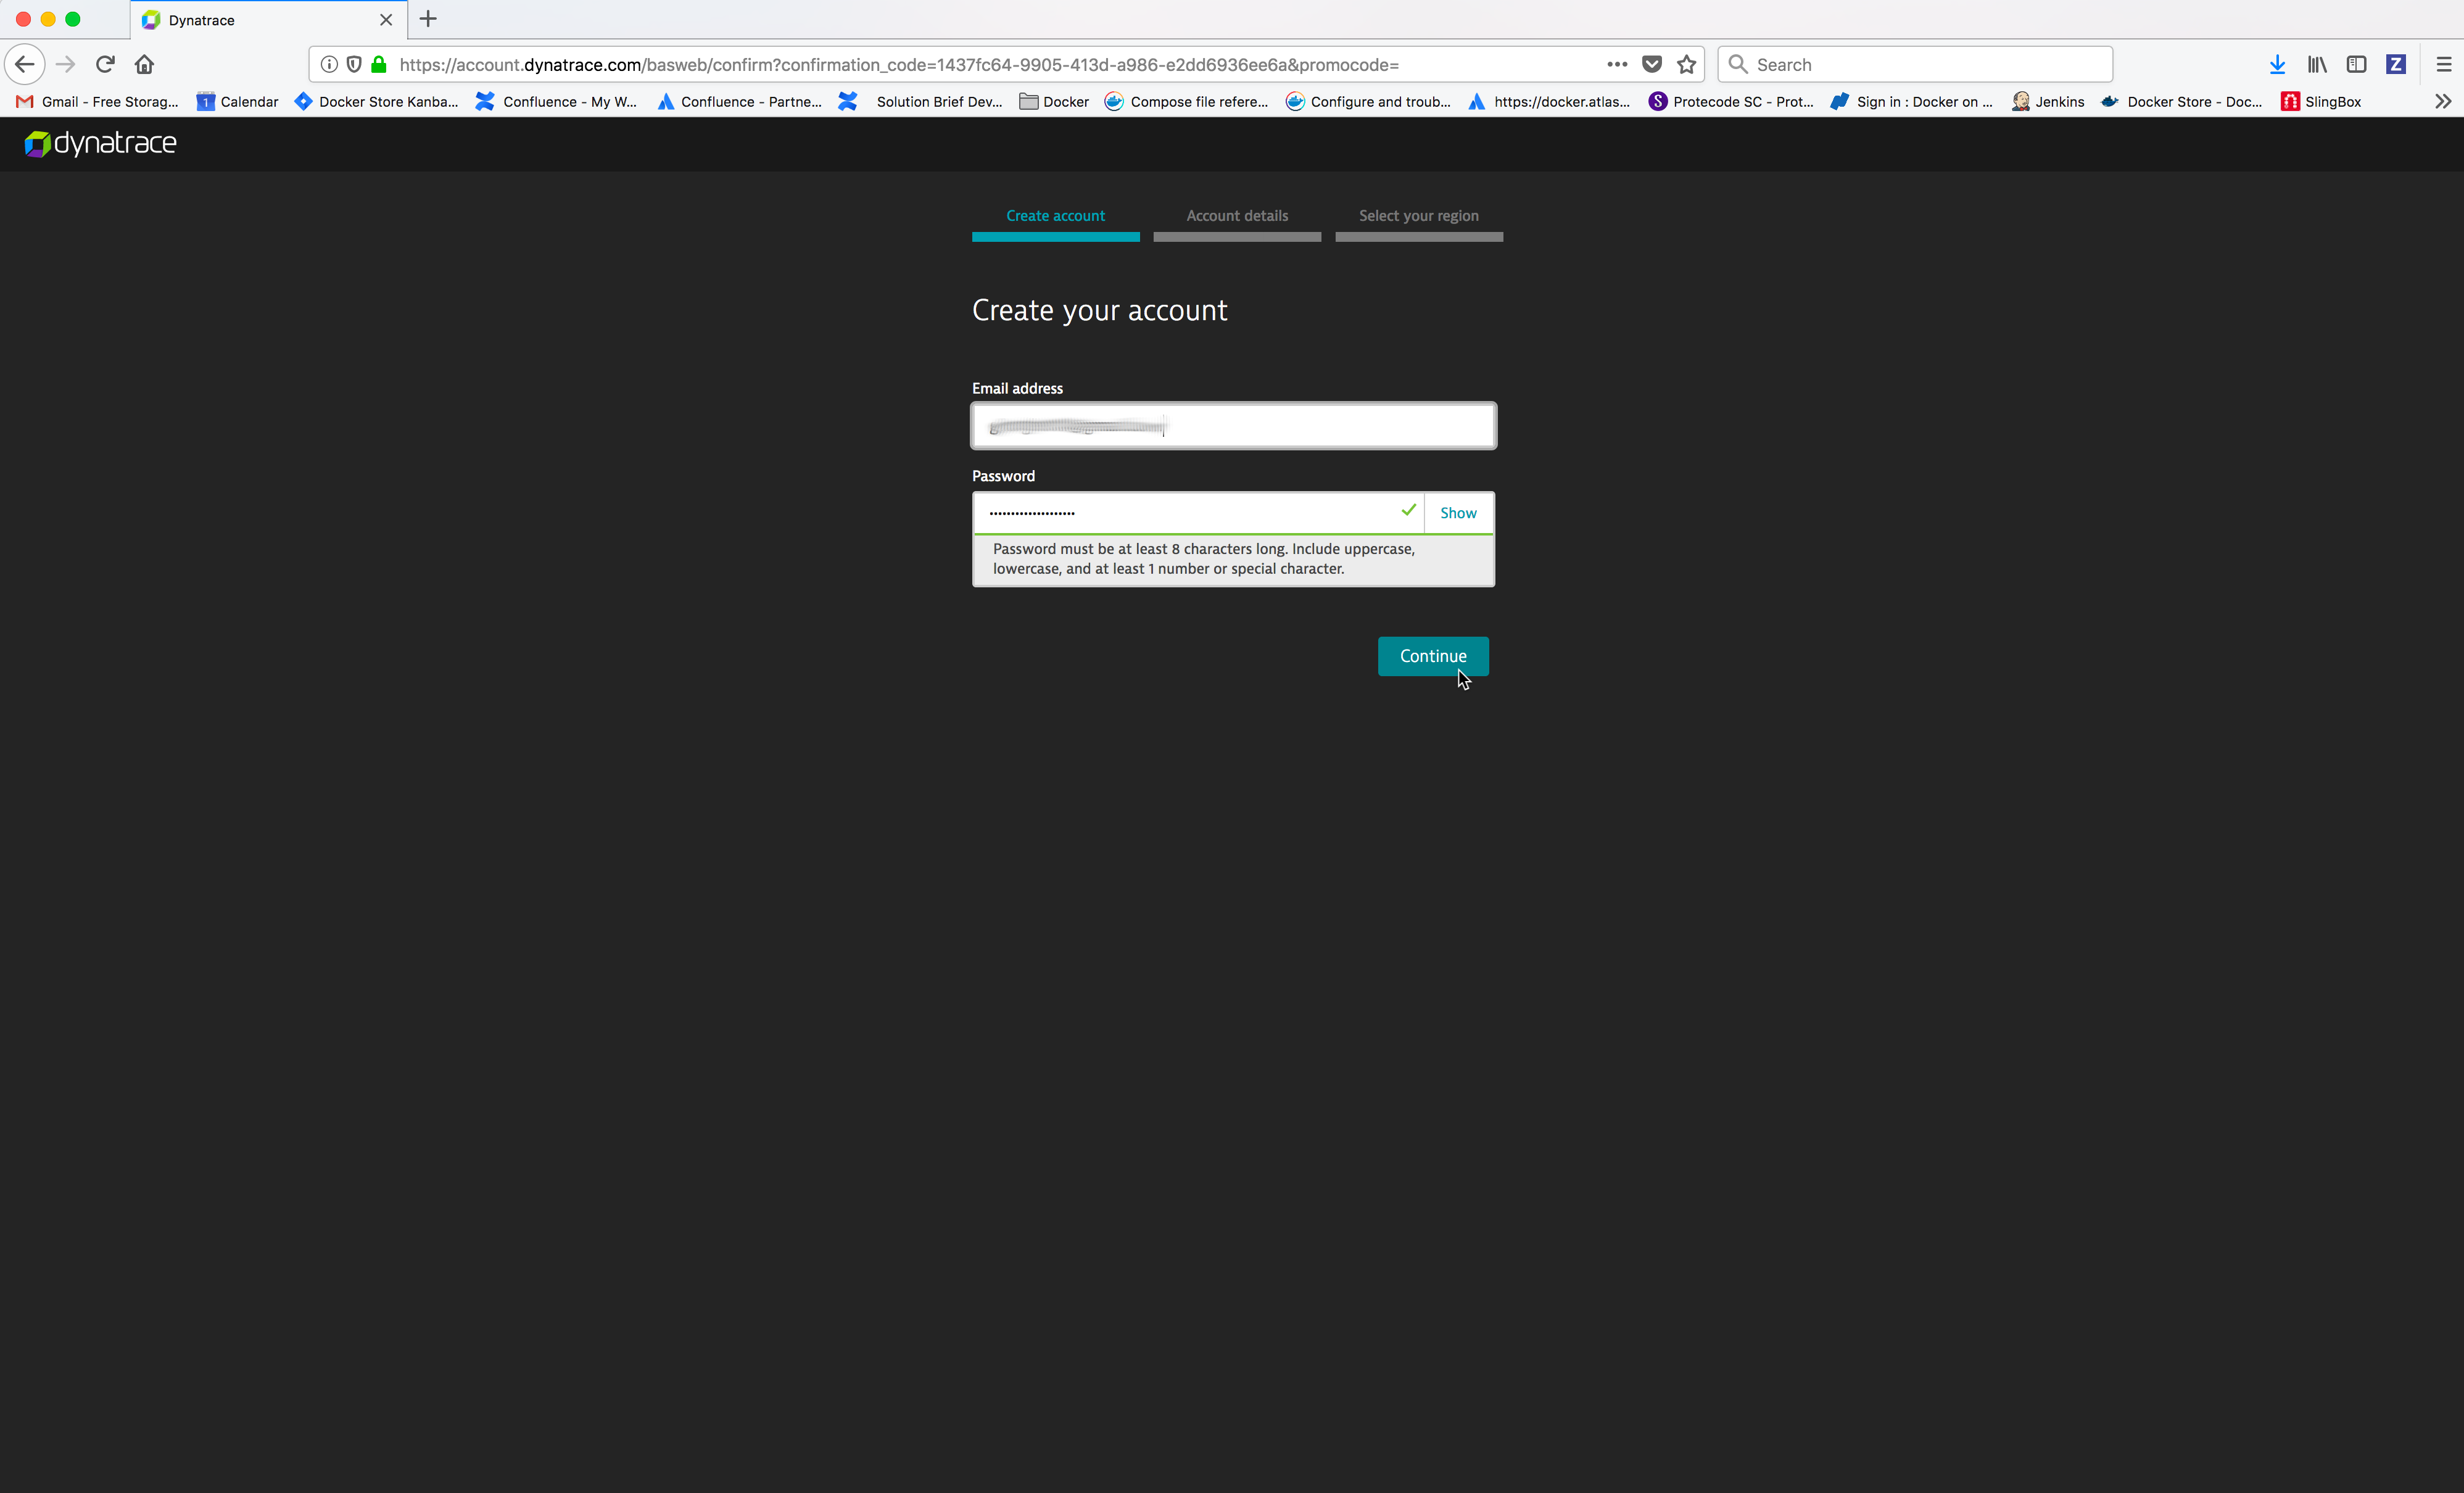
Enter your desired password and then click on the Continue button.
Enter the necessary account details and then click on the Continue button.

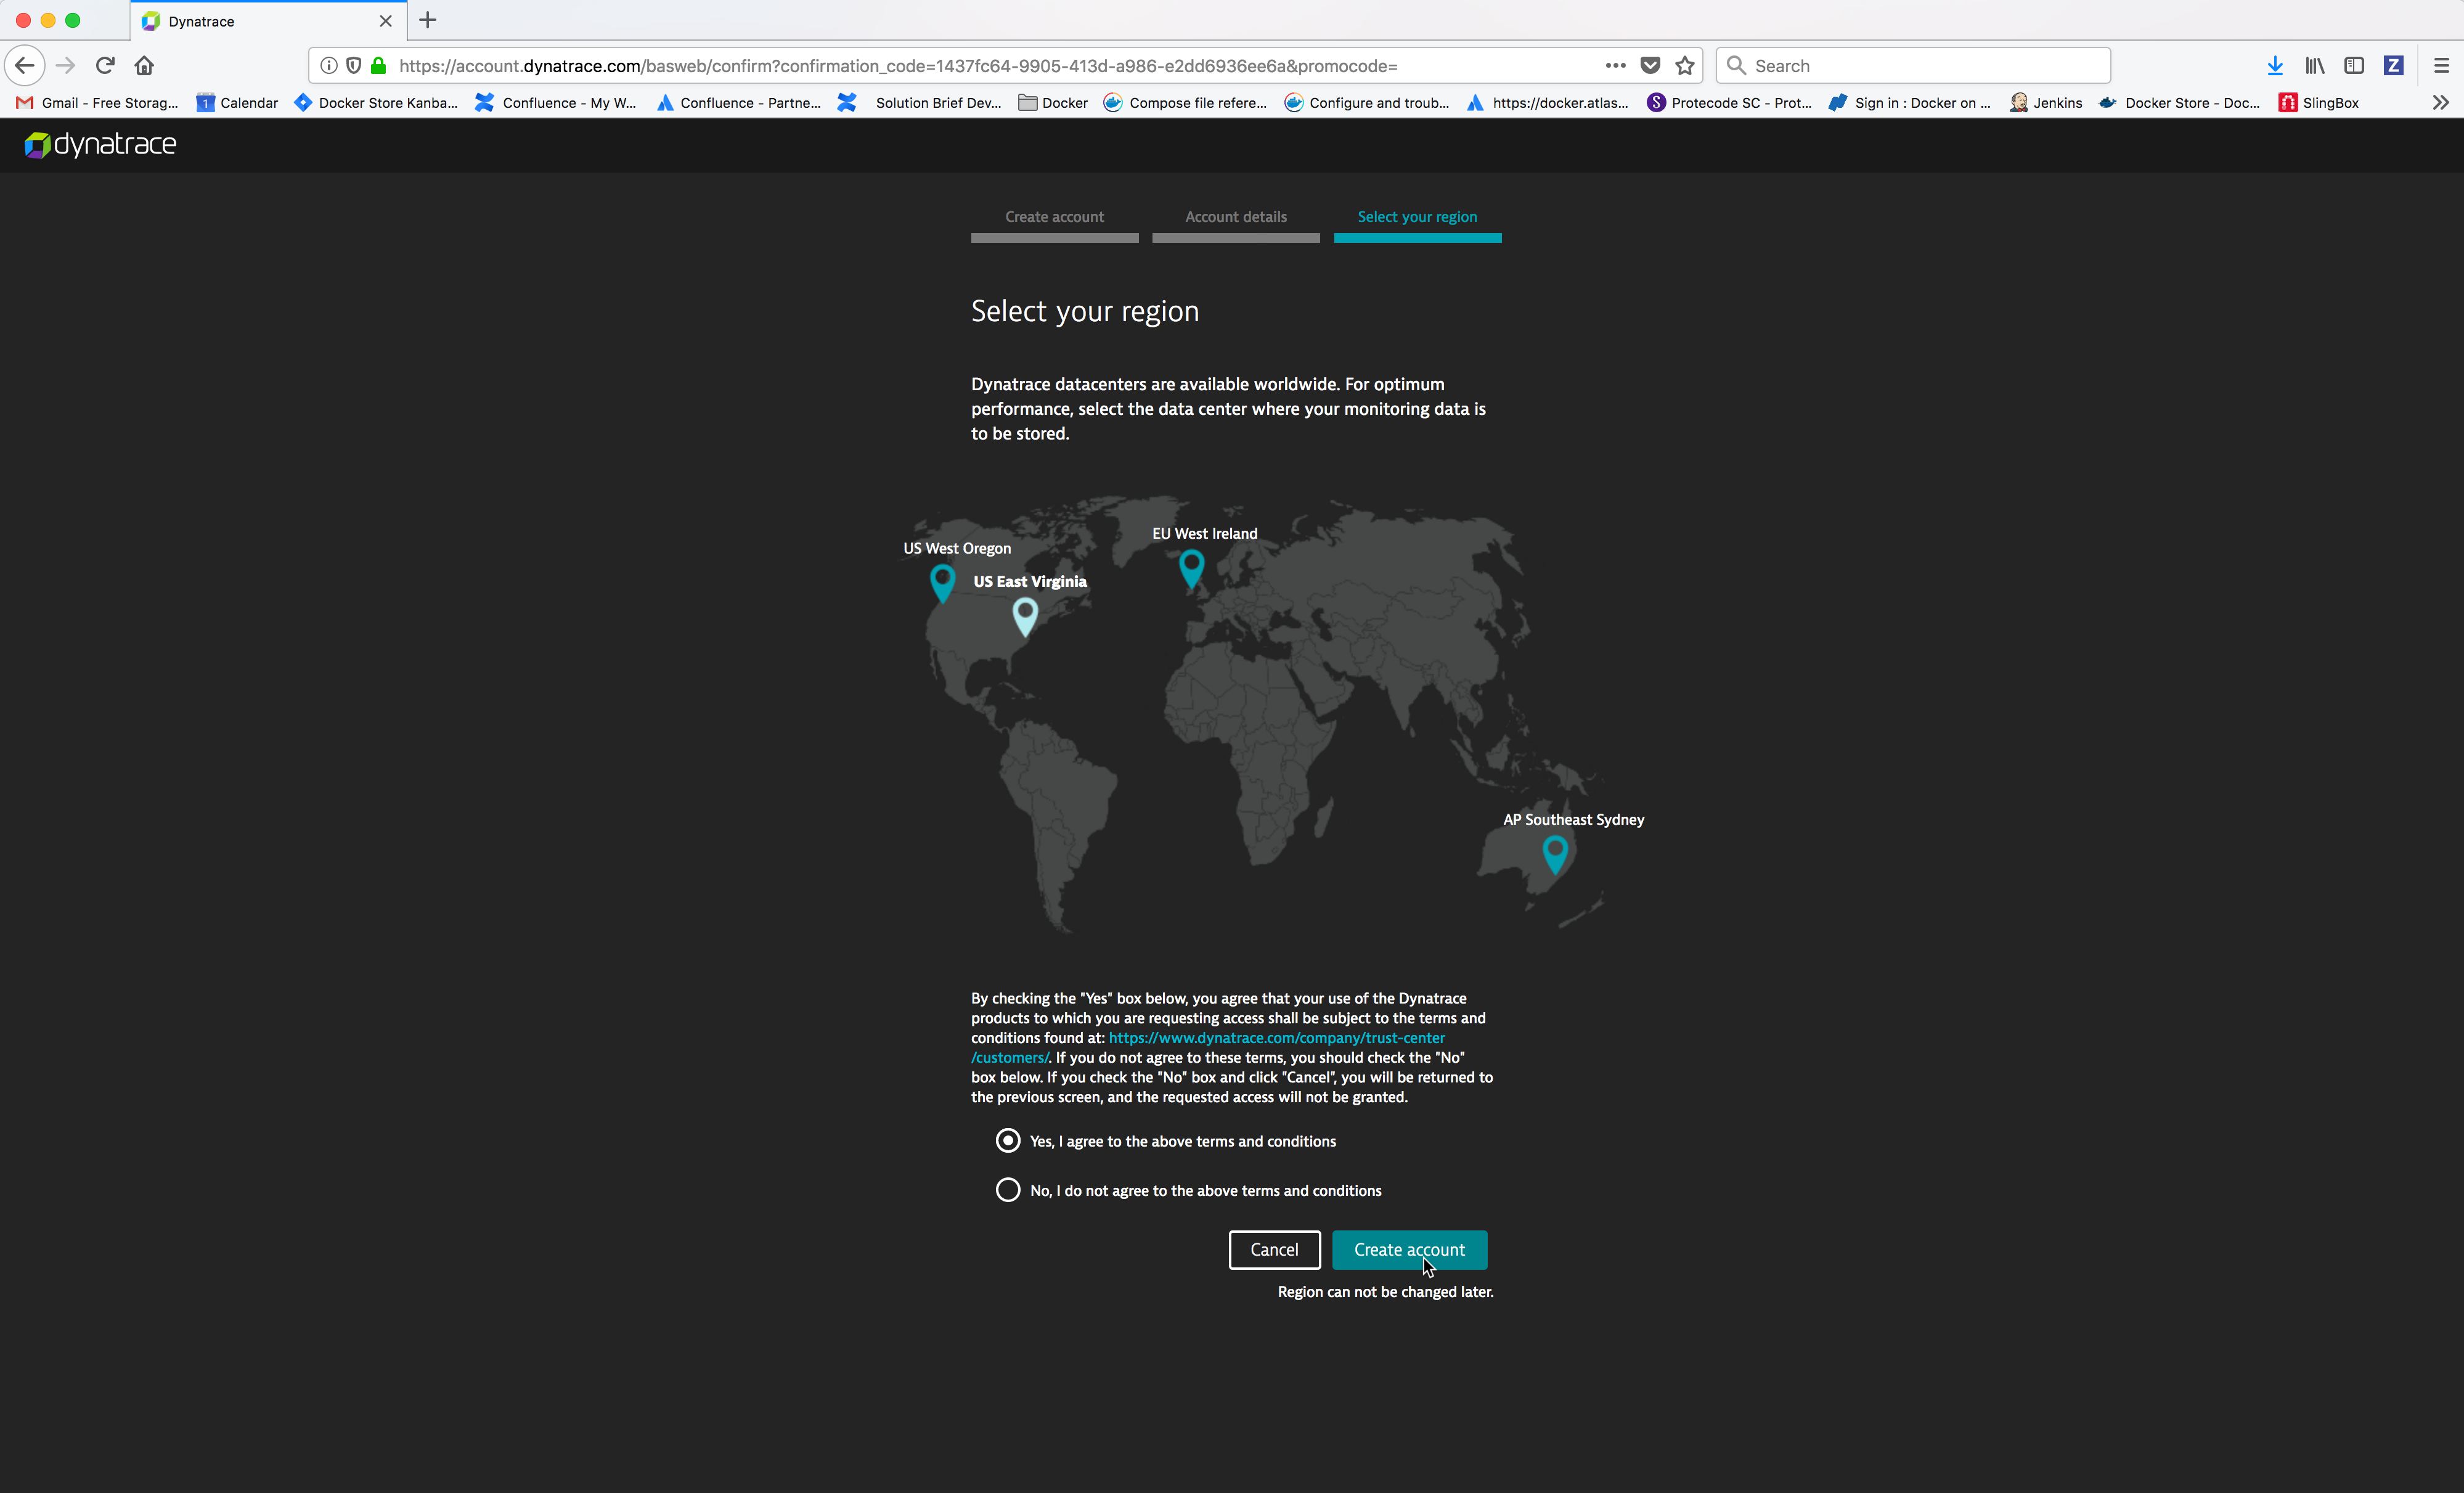
Select your region, click on the radio button Yes, I agree to the above terms and conditions and then click on the Create account button.
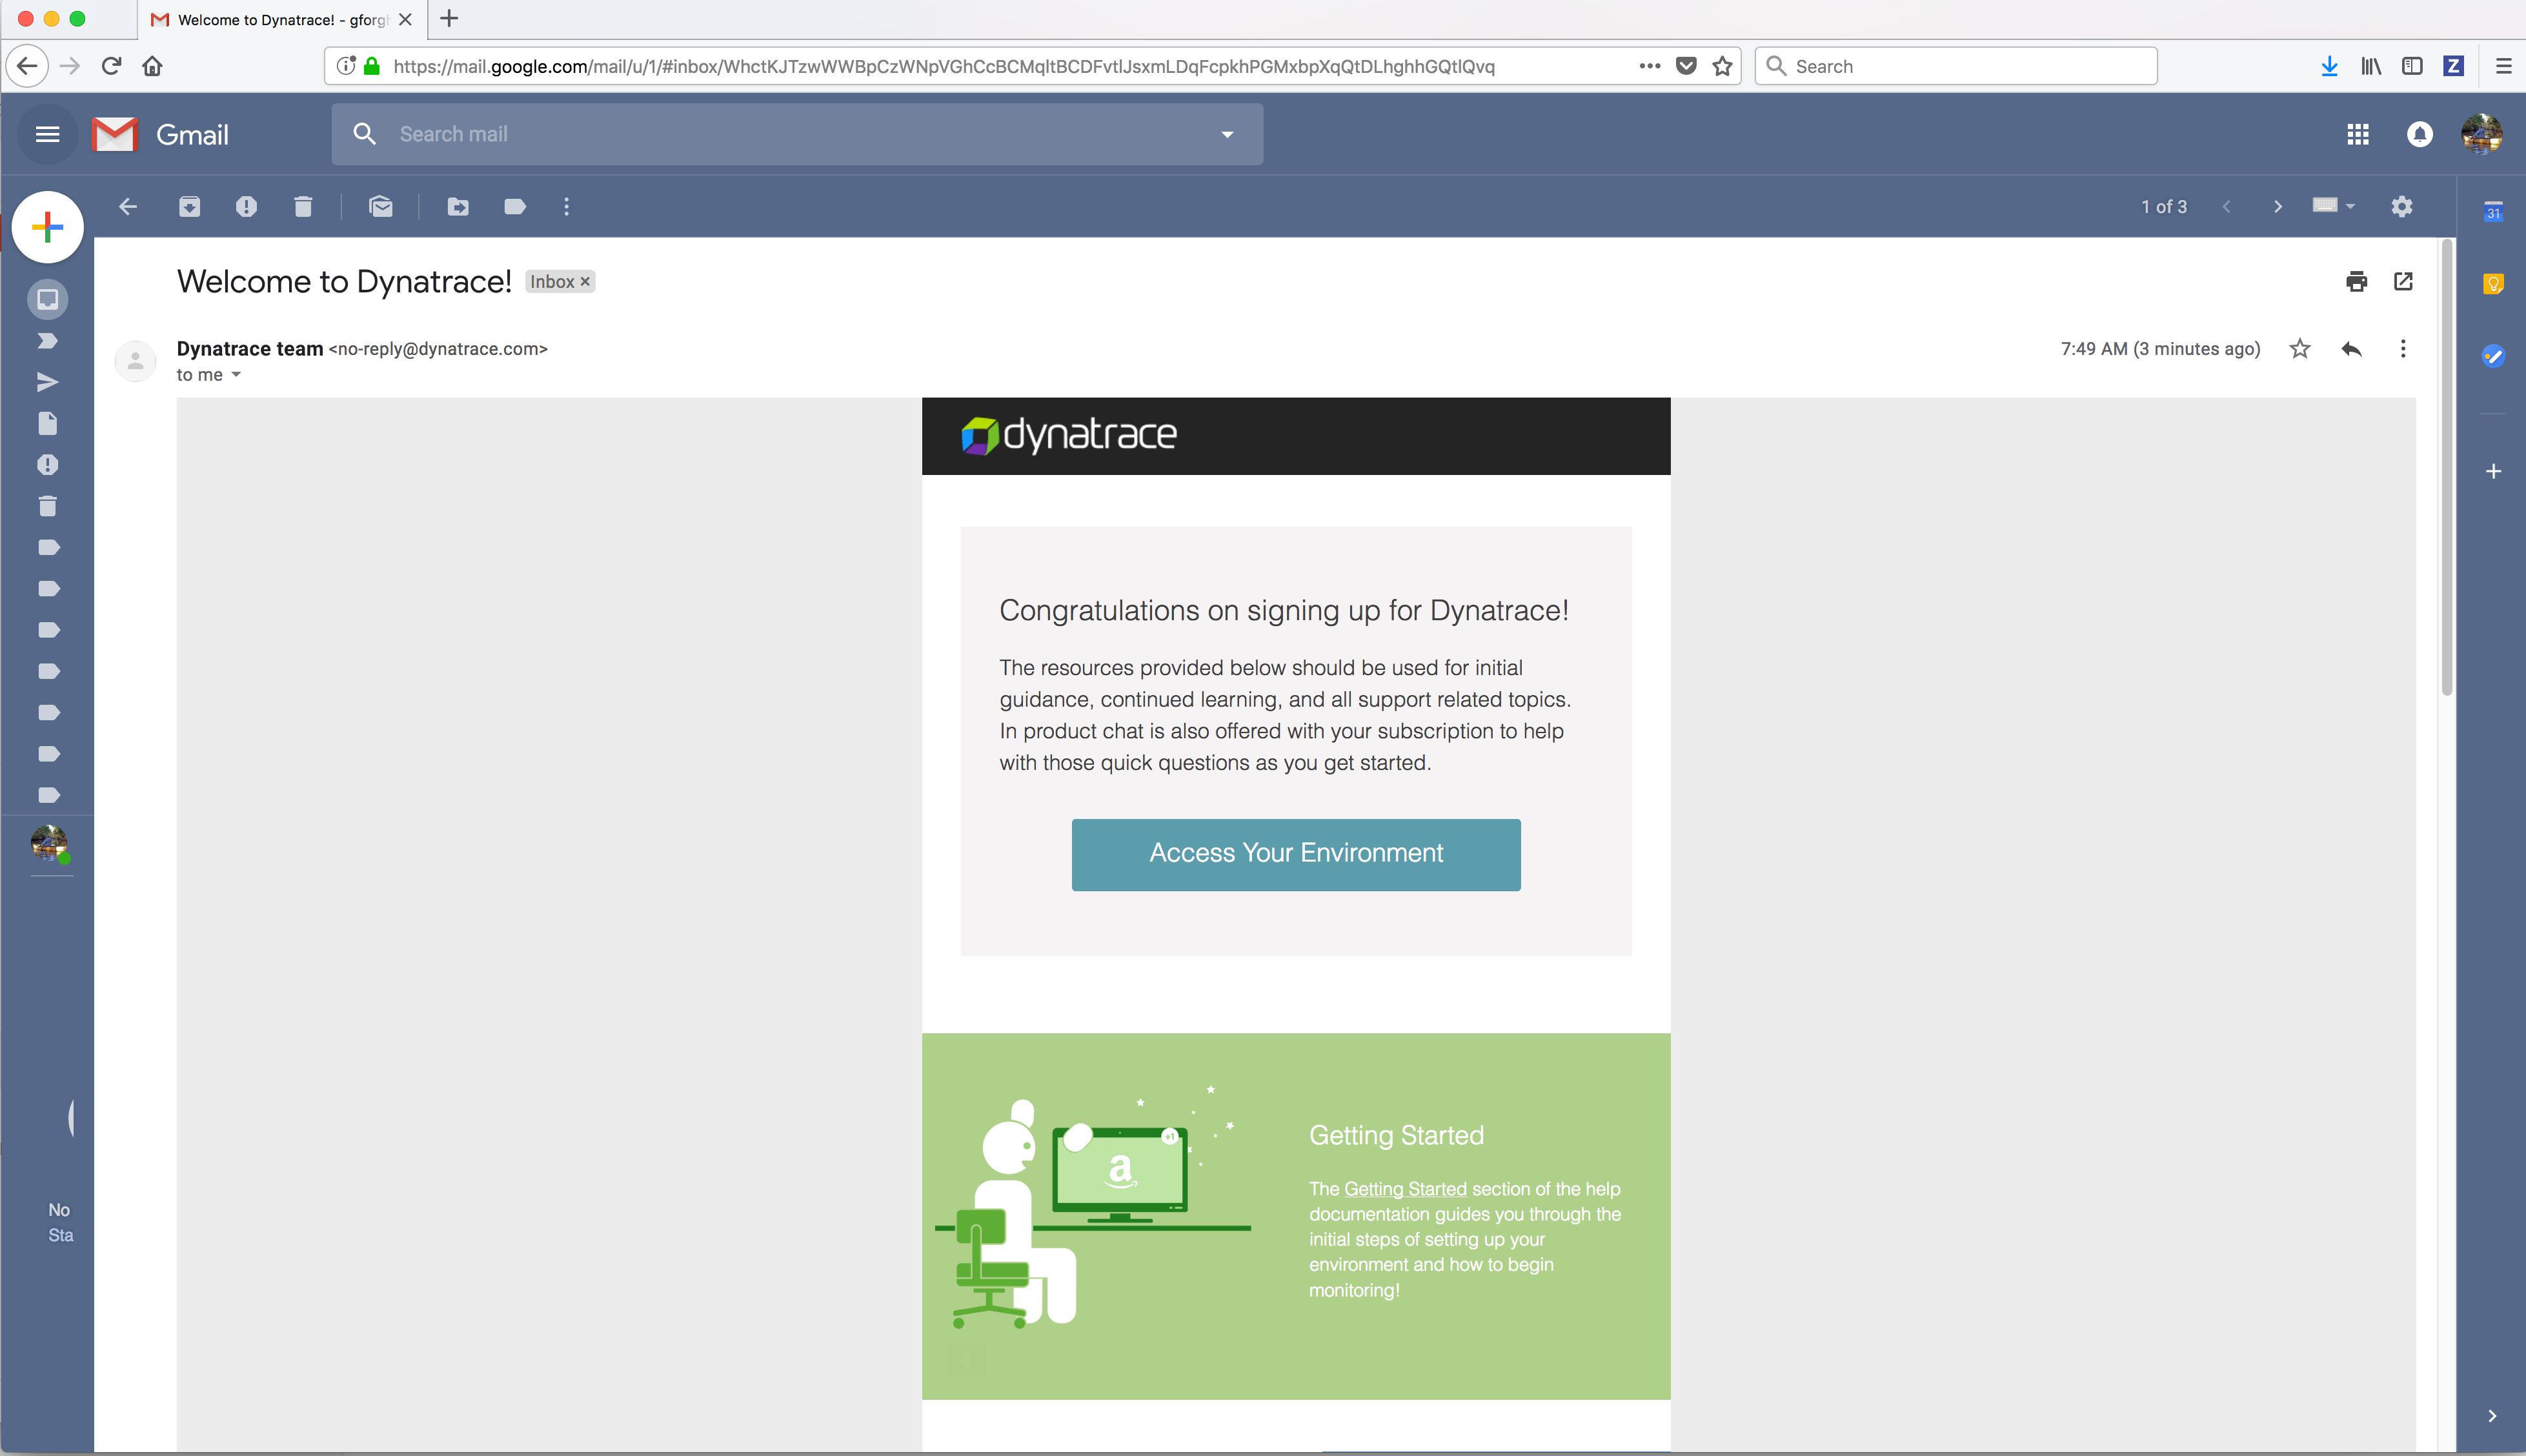
Click on the Deploy Dynatrace button.

You should see a screen similar to the screen below.
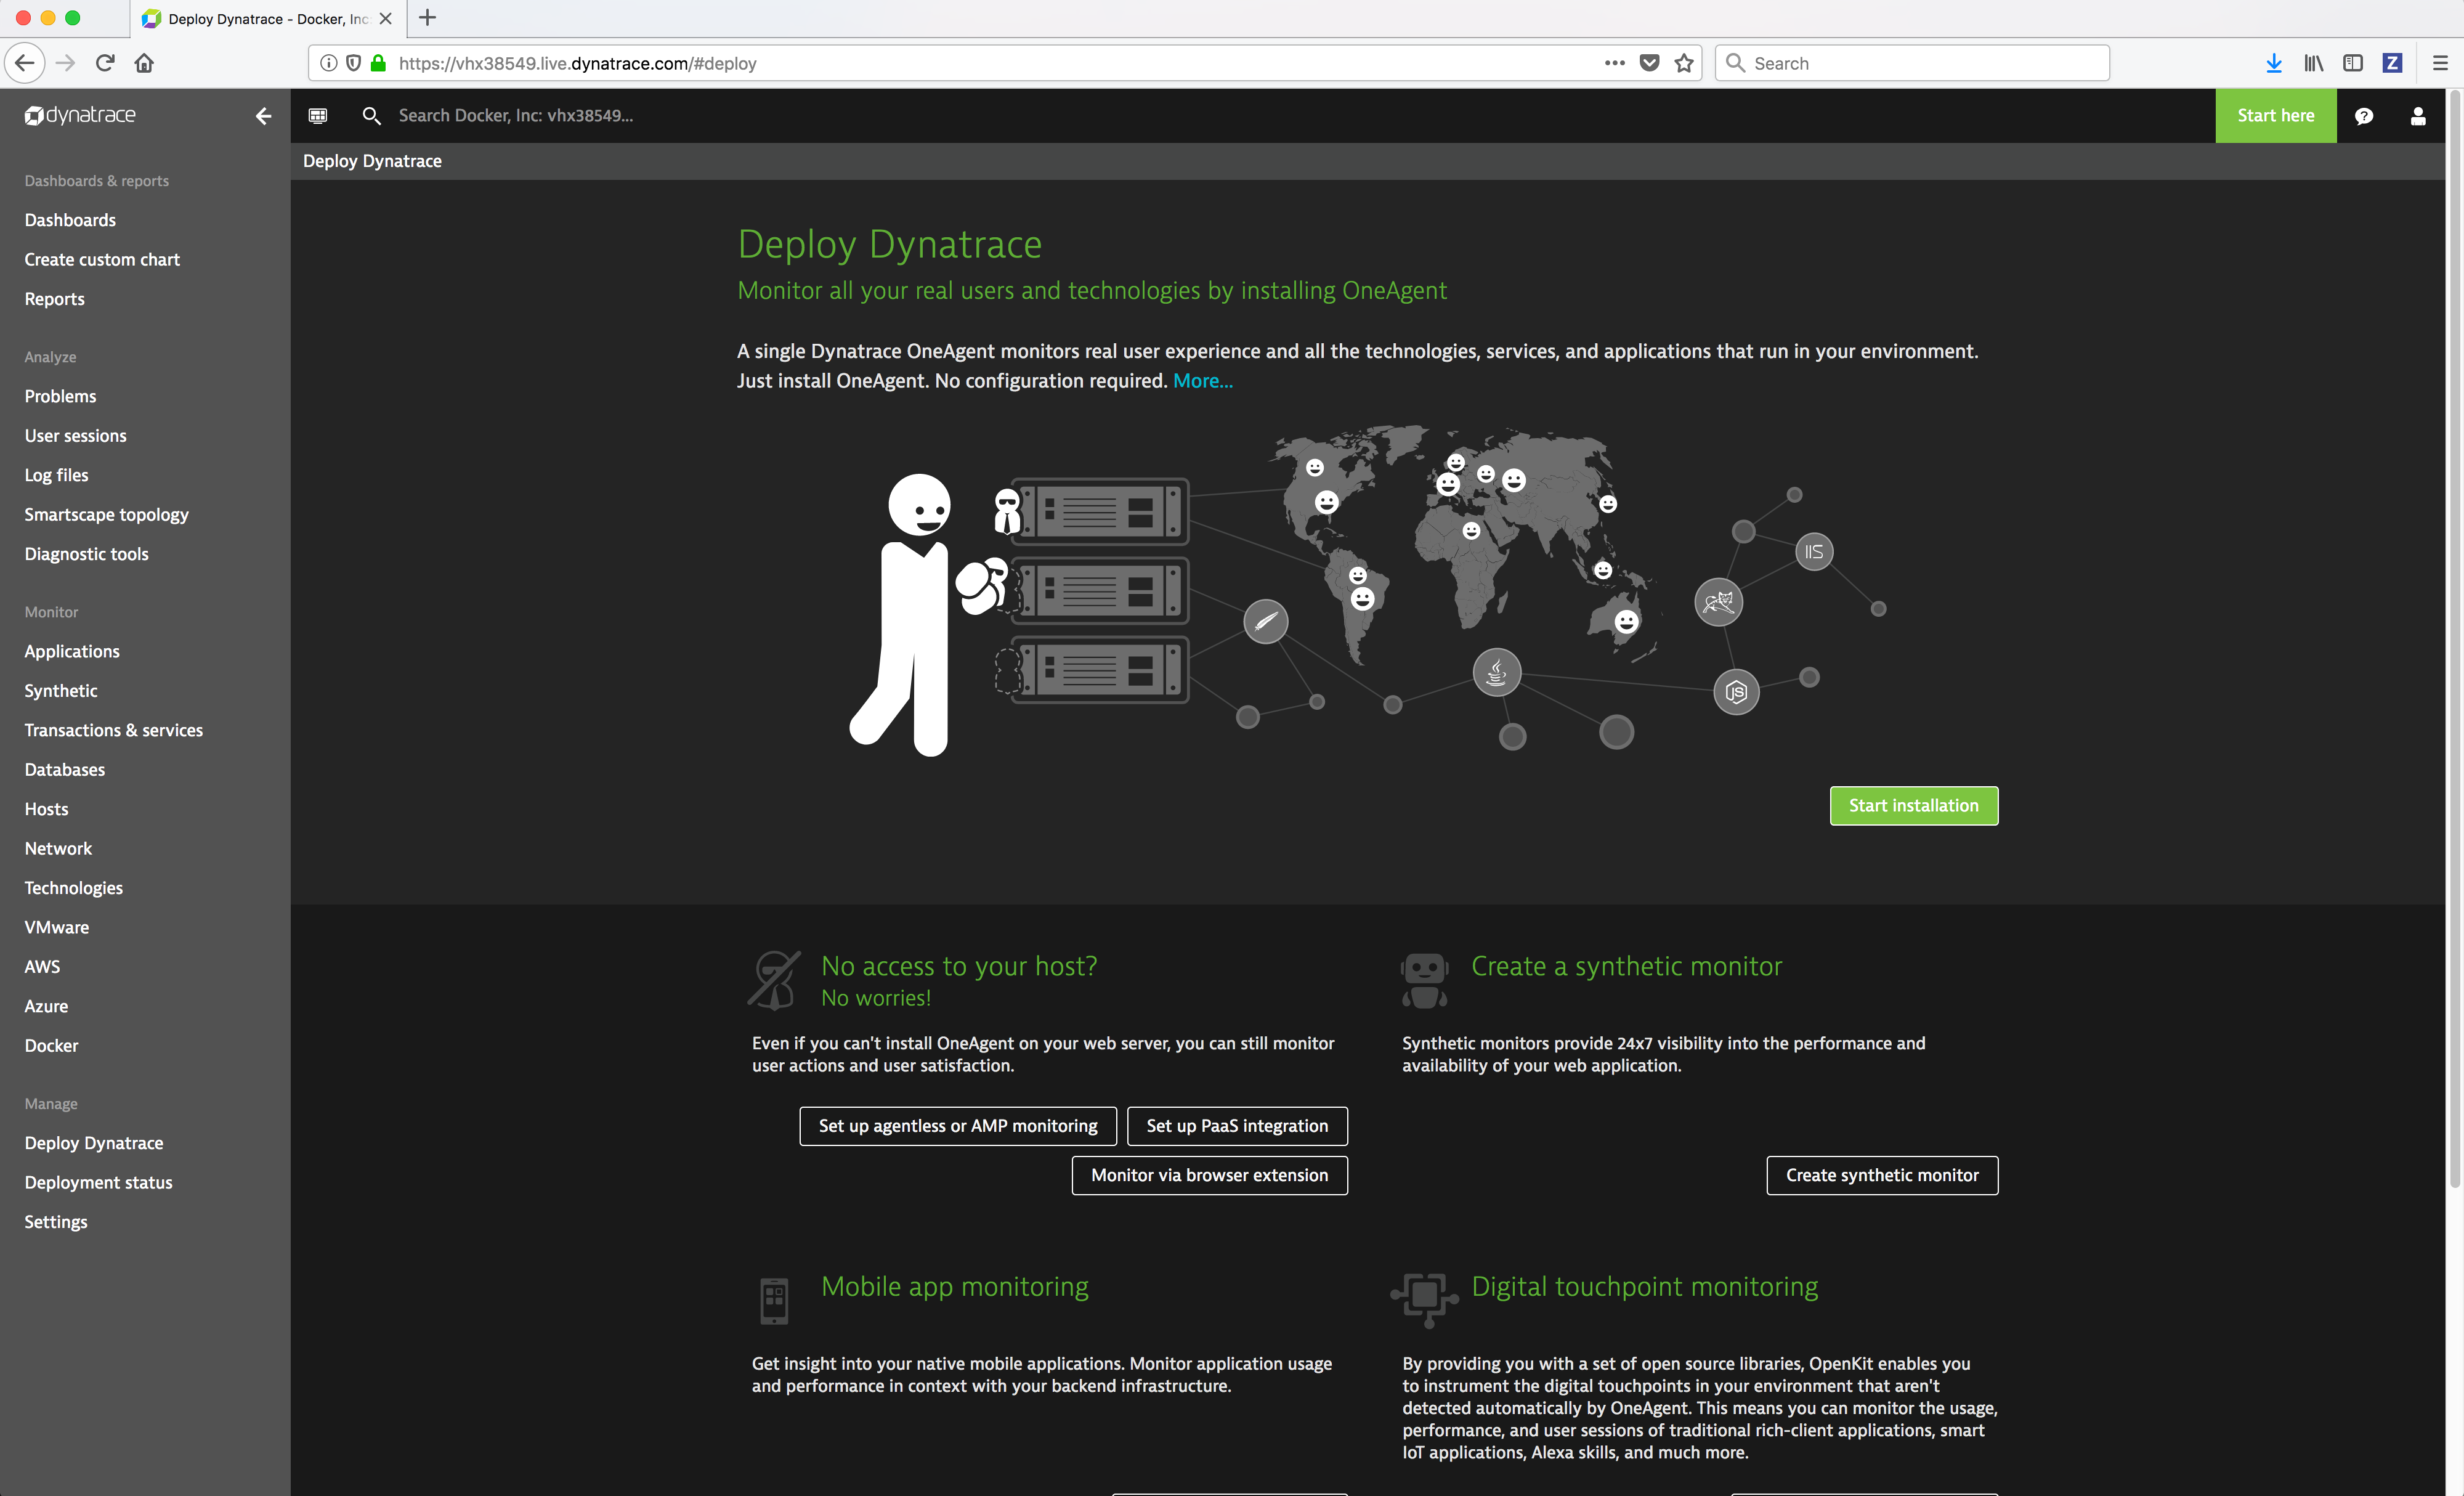
You should also receive an acknowledgement signup email from Dynatrace.
Monitoring the Docker Enterprise MKE Cluster and Application containers
To discover your infrastructure and collect the events and metrics, the Dynatrace agent needs to be deployed on all the Docker Enterprise MKE nodes.


Deploying the Dynatrace agent
The Dynatrace agent has a startup dependency. It must be started and fully initialized on the Docker node before any of the processes you want to monitor in order for it to capture all of the required metrics for it to perform the deep process monitoring. If the Dynatrace agent is started after processes that you want monitor, you will only be able to see a limited set of metrics such as CPU or memory consumption. You would have to restart those processes in order for the Dynatrace agent to capture all of the required metrics.
There are 3 ways to deploy the Dynatrace agent on a Docker node in a Docker Enterprise MKE cluster:
- Deploy the Linux Dynatrace agent docker container on the Docker Enterprise MKE nodes configured for Swarm only orchestration.
- Deploy the Linux Dynatrace agent docker container as a Kubernetes DaemonSet (pods) on the Docker Enterprise MKE nodes for Kubernetes or Mixed orchestration.
- Install the Linux or Windows Dynatrace agent directly on the Docker Enterprise MKE nodes.
Because of the Dynatrace startup dependency, running the Linux Dynatrace agent as a docker container or a Kubernetes DaemonSet will not allow the Linux Dynatrace agent to be started and fully initialized before the Docker Enterprise MKE cluster containers, which will result in limited metrics on the Docker Enterprise MKE cluster containers. Therefore, to perform the deep monitoring of the Docker Enterprise Cluster, installing the Dynatrace agent directly on the Docker Enterprise MKE nodes is recommended before Docker Enterprise is installed using a configuration management tool such as Chef, Puppet, Terraform, Ansible, Cloud Init script, etc.
In this Solution Brief the Dynatrace agent will be deployed directly on the Docker Enterprise MKE nodes. If you wish to deploy the Linux Dynatrace agent as a Docker container, refer to the Dynatrace documentation Dynatrace OneAgent as a Docker container or Deploy OneAgent on Kubernetes.
Installing the Dynatrace OneAgent on Kubernetes on Docker Enterprise
Deploying Dynatrace OneAgent via DaemonSet on a MKE is straightforward. There are few steps need to follow:
- Deploy the Dynatrace OneAgent. The OneAgent monitors kubernetes workload (services running in your application pods), the containers, middleware and underlying Linux OS. The agent deployment is done via an operator. The operator will create a daemonset that will deploy the agent in its own pod on each node of the cluster The procedure is described here:
The following information is required for this deployment:
- tenant or Environment ID : your Dynatrace environment ID (otherwise known as a tenant ID), is included at the beginning of your Dynatrace environment´s URL
- An API token.
- A PaaS token, this is different than the API token.
The operator and oneagent pods will run in the dynatrace namespace
- Setup integration with kubernetes API. This integration use a plugin in the ActiveGate that will query the Kubernetes API for cluster node resource utilization and limits as described below. To set up this integration, you need:
service account with cluster role permission to access the Kubernetes API endpoint URL
the Kubernetes API endpoint URL
- the bearer token for the service account
Installing the Dynatrace OneAgent on Docker Enterprise MKE nodes
Install the Linux Dynatrace agent on a Linux Docker Enterprise MKE node
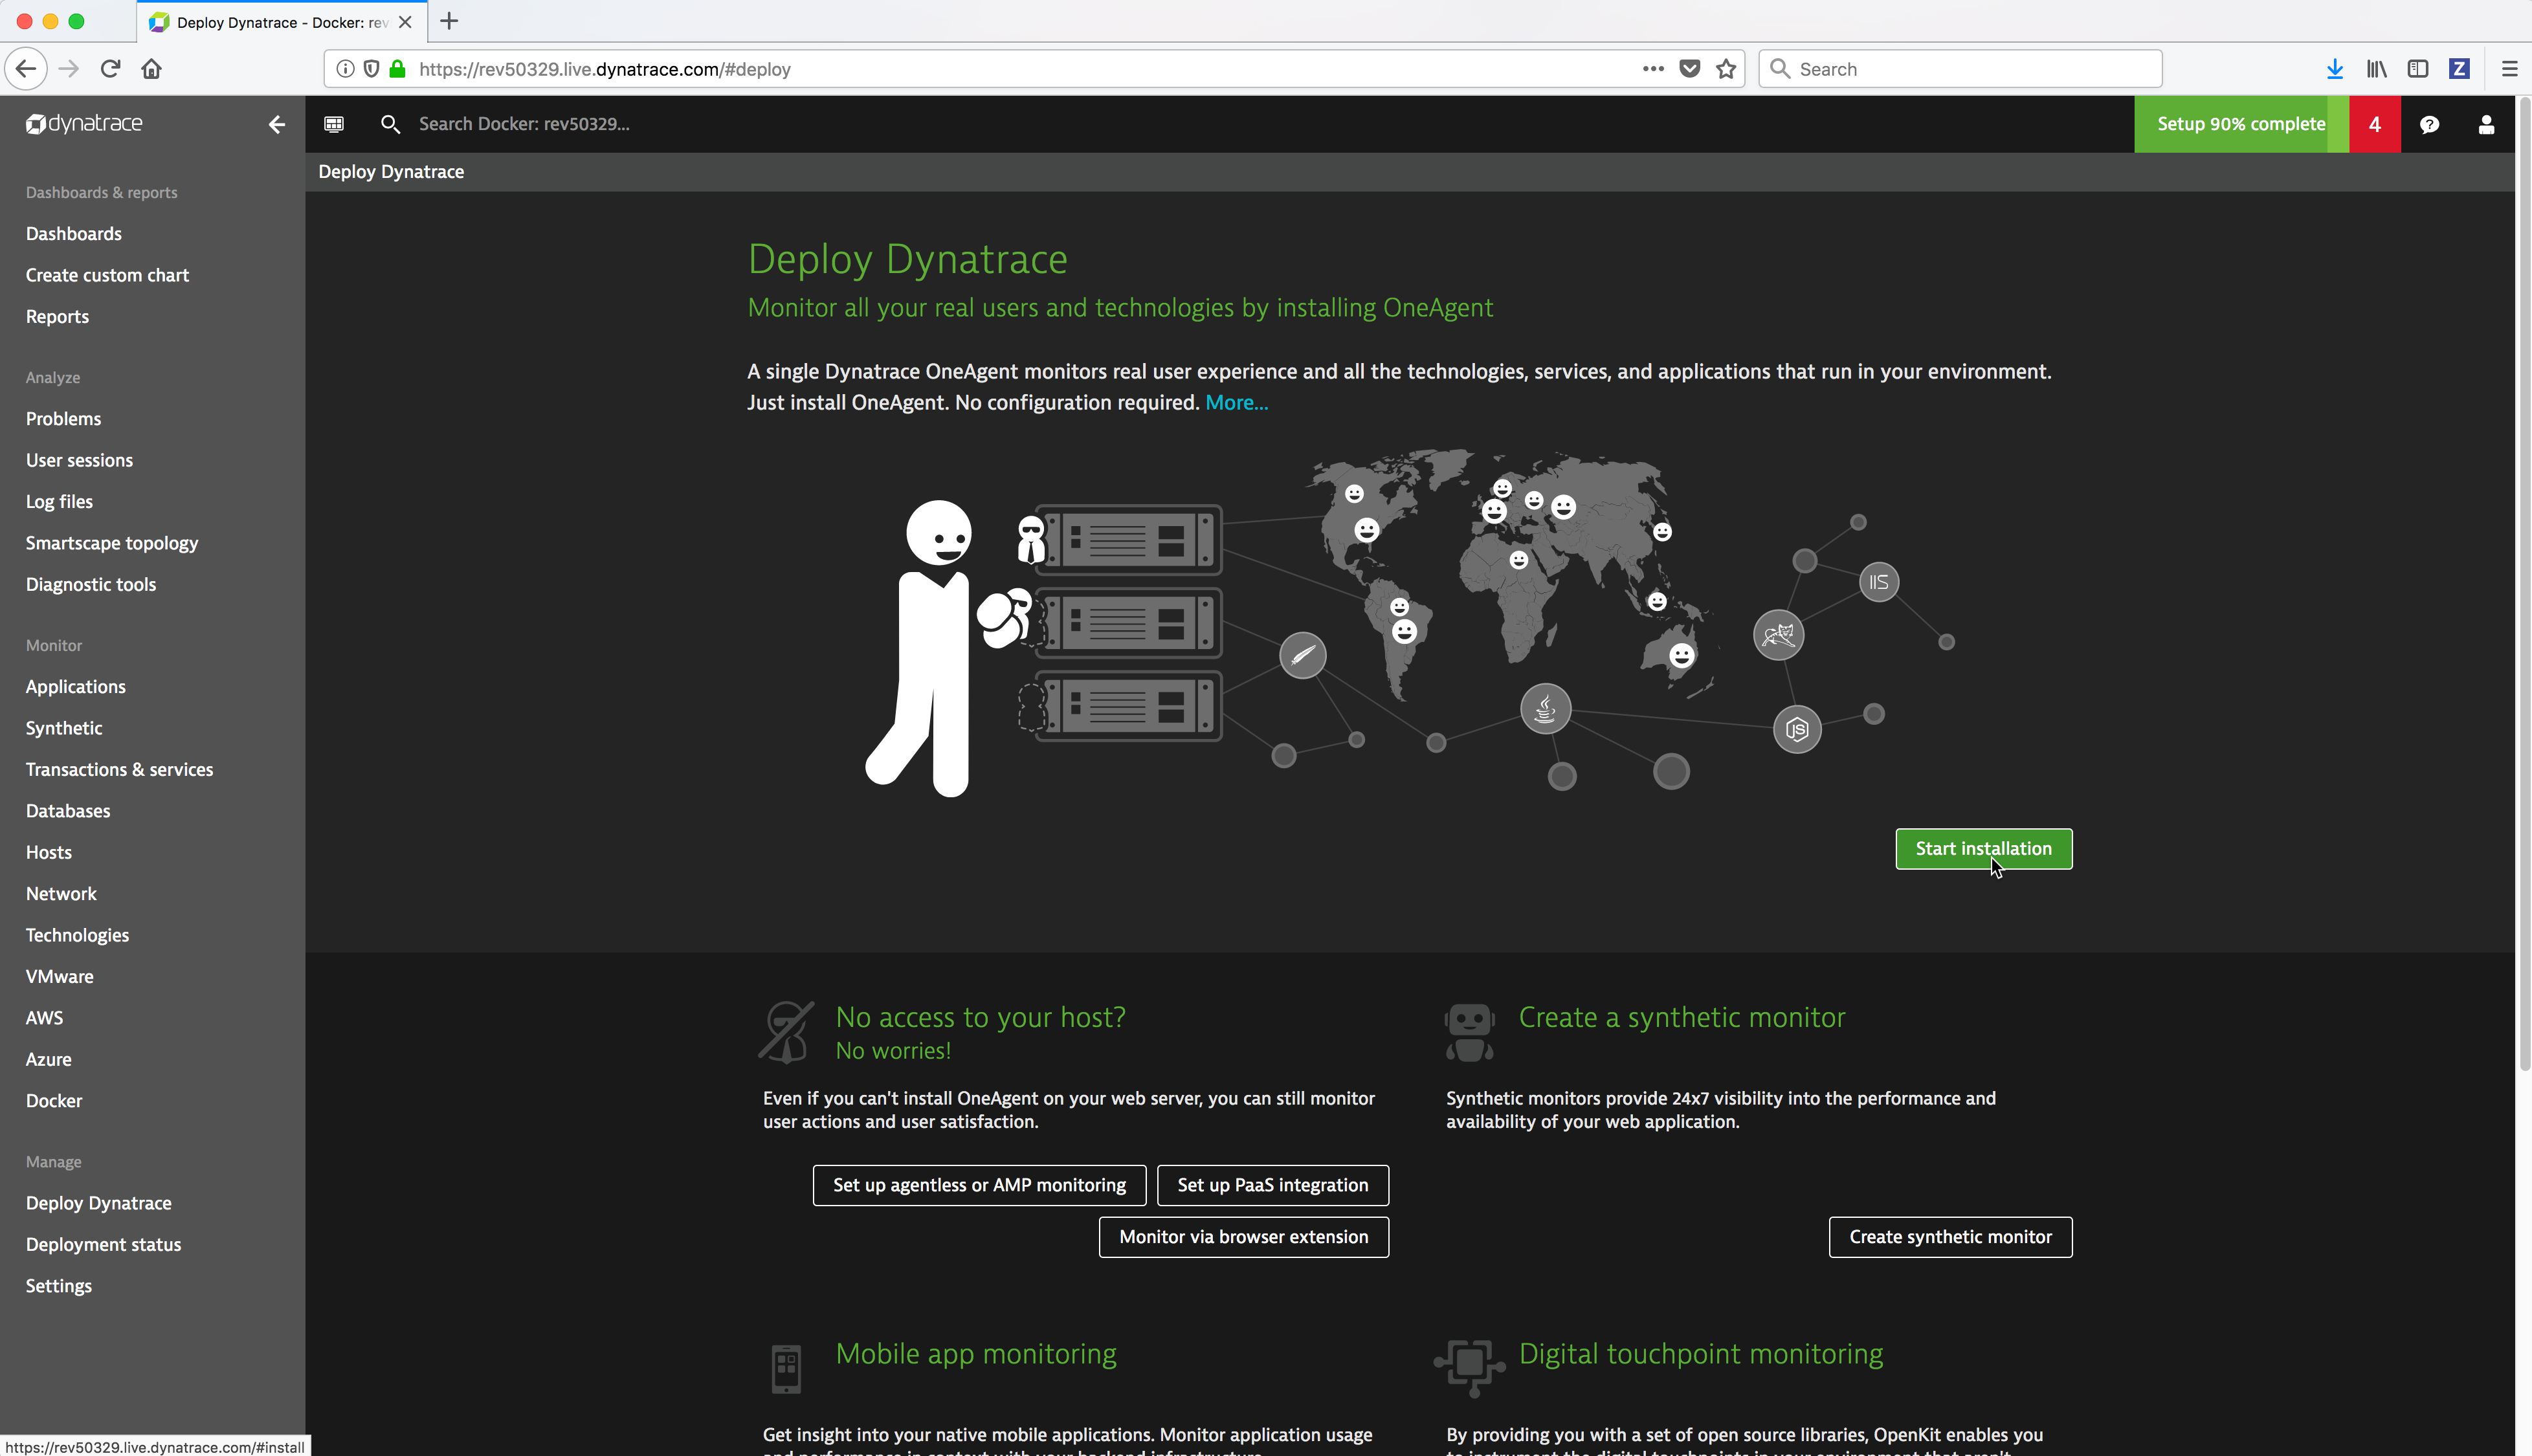
From the Dynatrace Web UI, navigate to the Deploy Dynatrace page by clicking on the Deploy Dynatrace link (bottom left). Then click on the Start installation button.
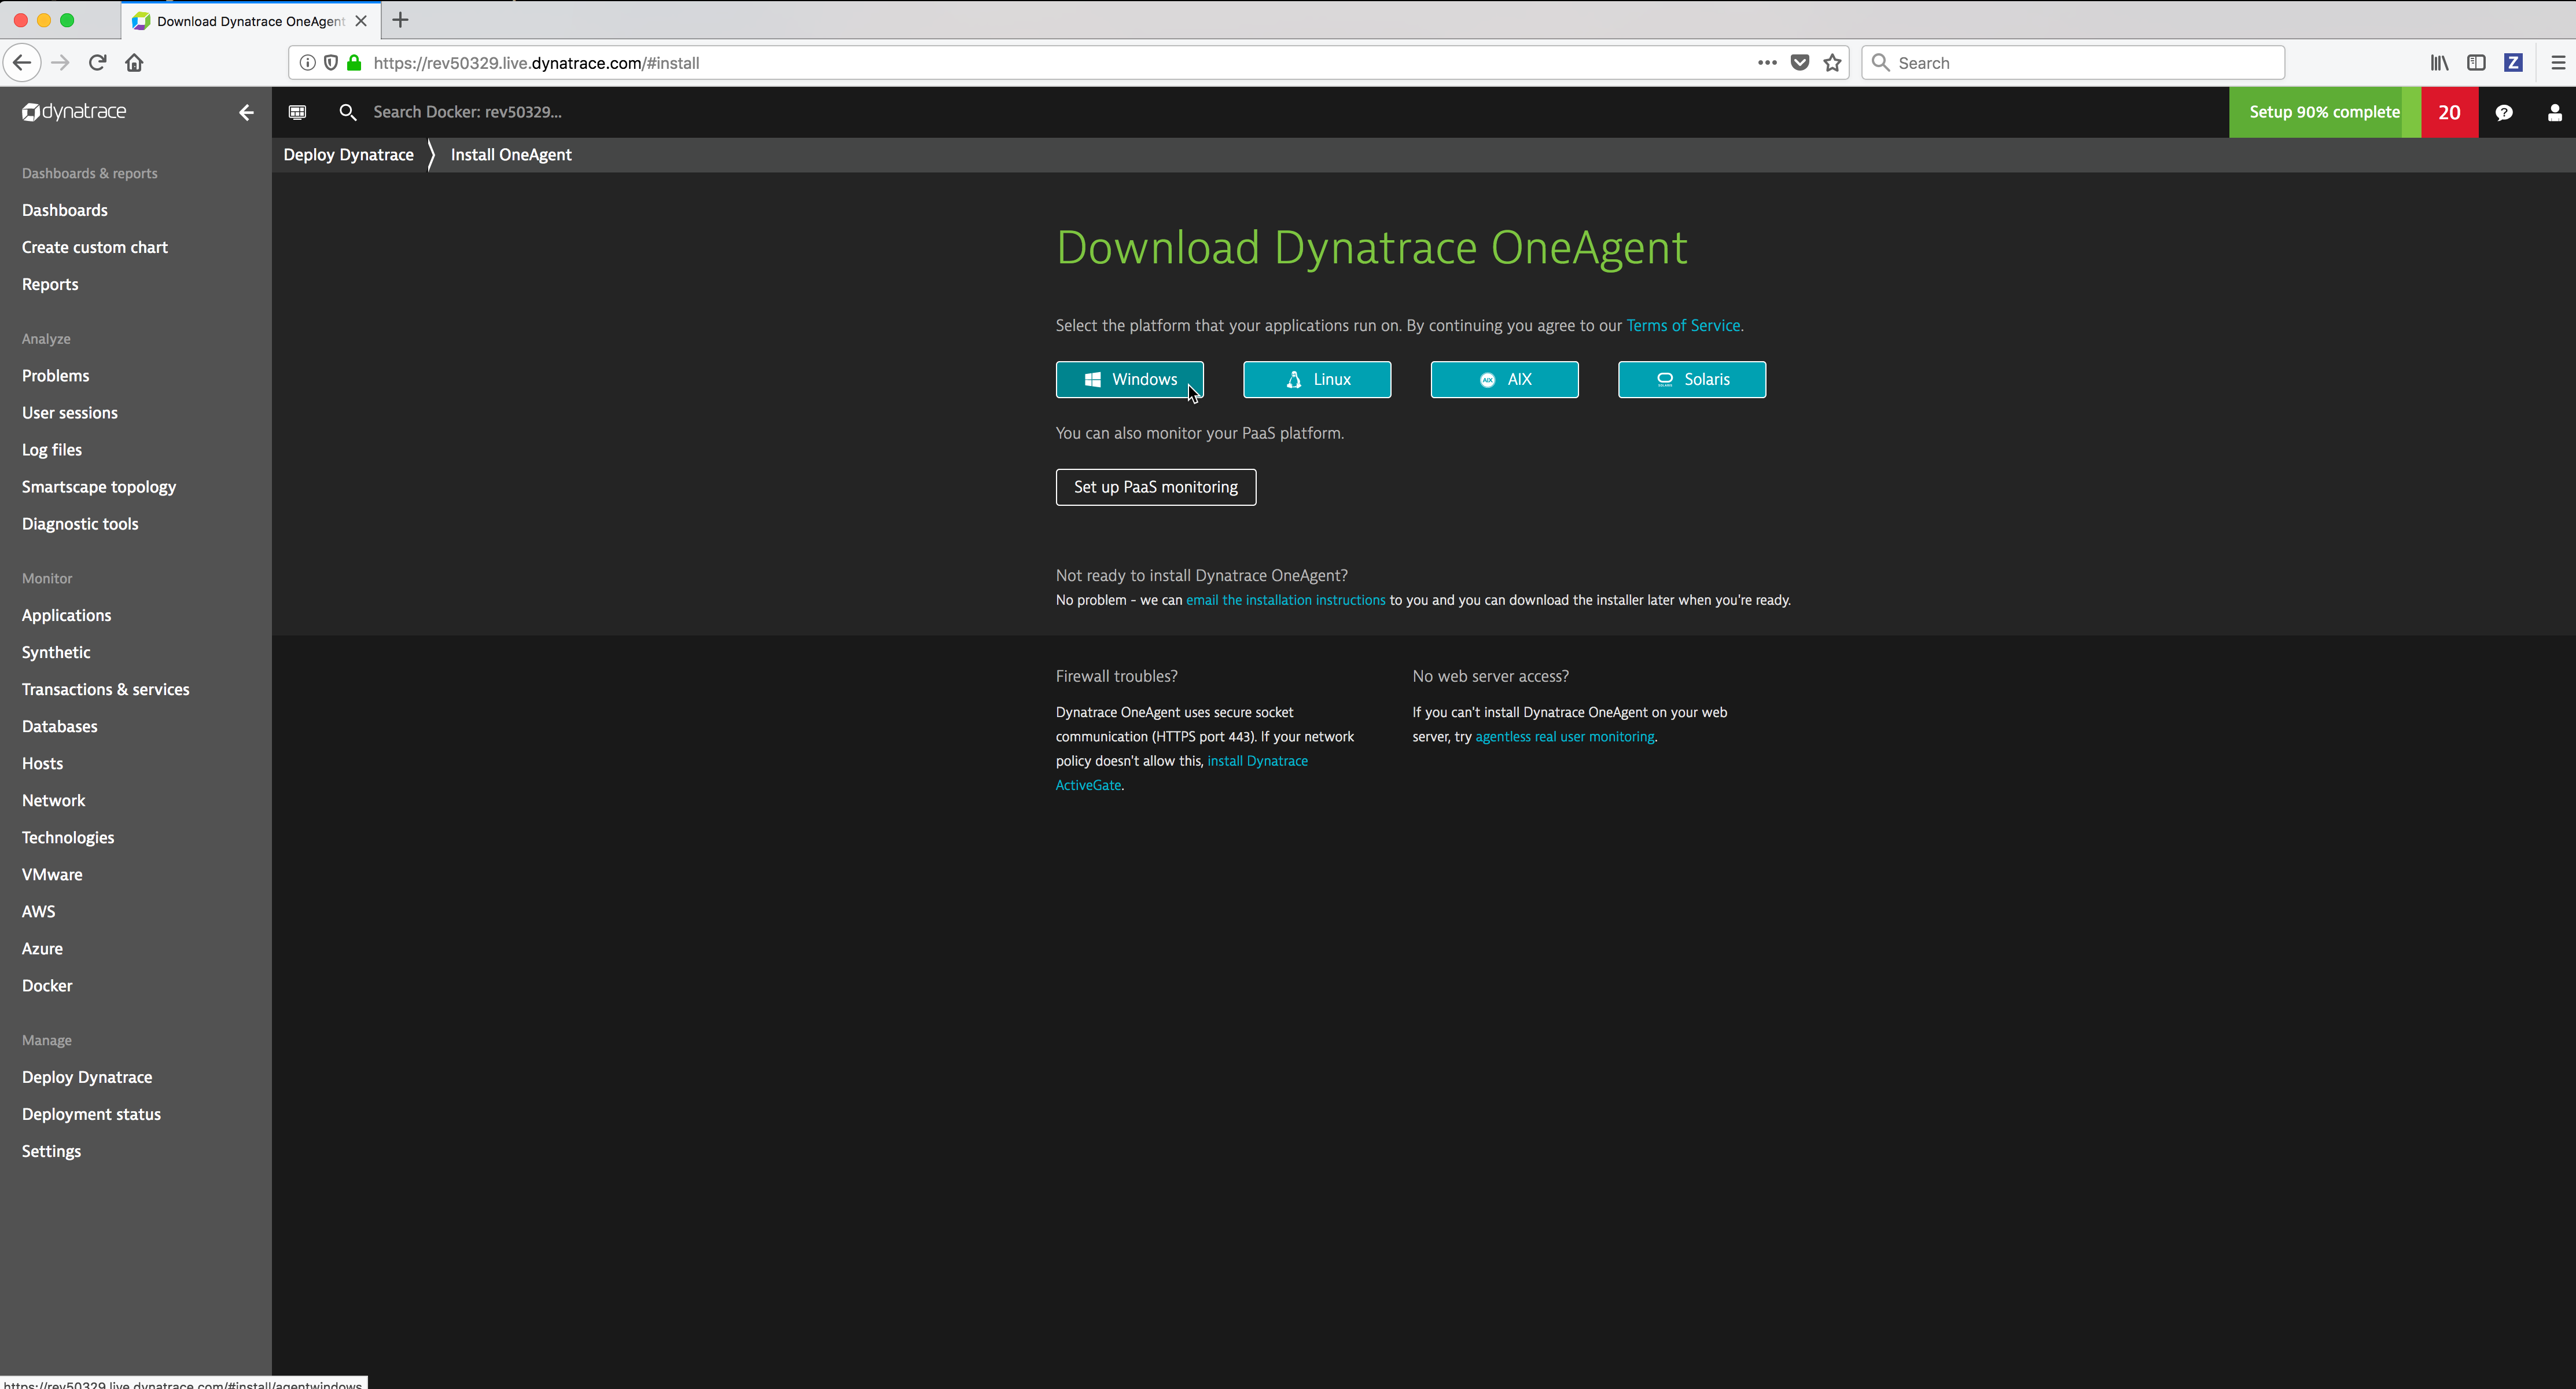
From the Download Dynatrace OneAgent page click on the Linux button.

Copy the
wgetcommand which downloads the Dynatrace agent installation bits by clicking on the Copy button to the right of the command.
Paste the
wgetcommand into a Linux command prompt and run it with root authority (sudo).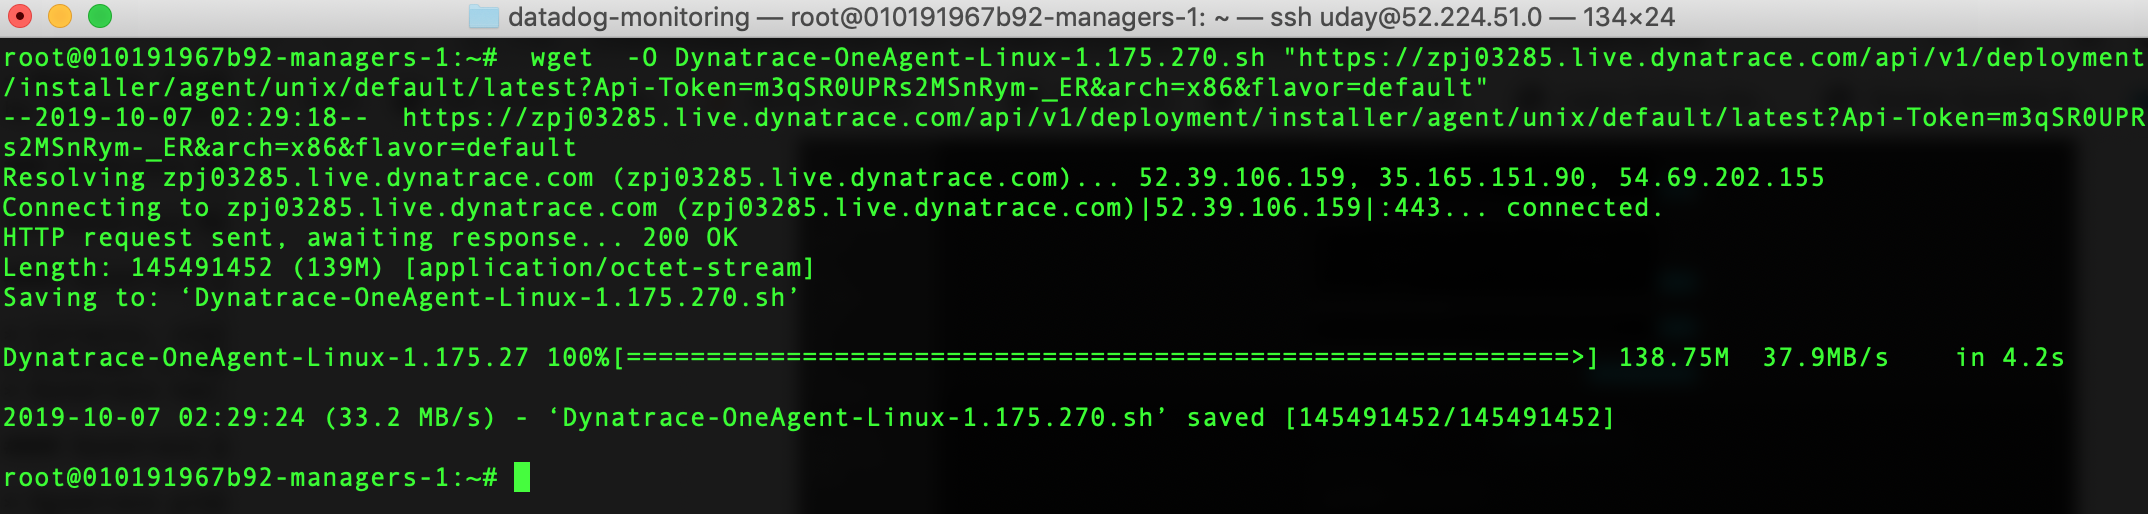
Copy the command to install the Dynatrace agent by clicking on the Copy button to the right of the command.
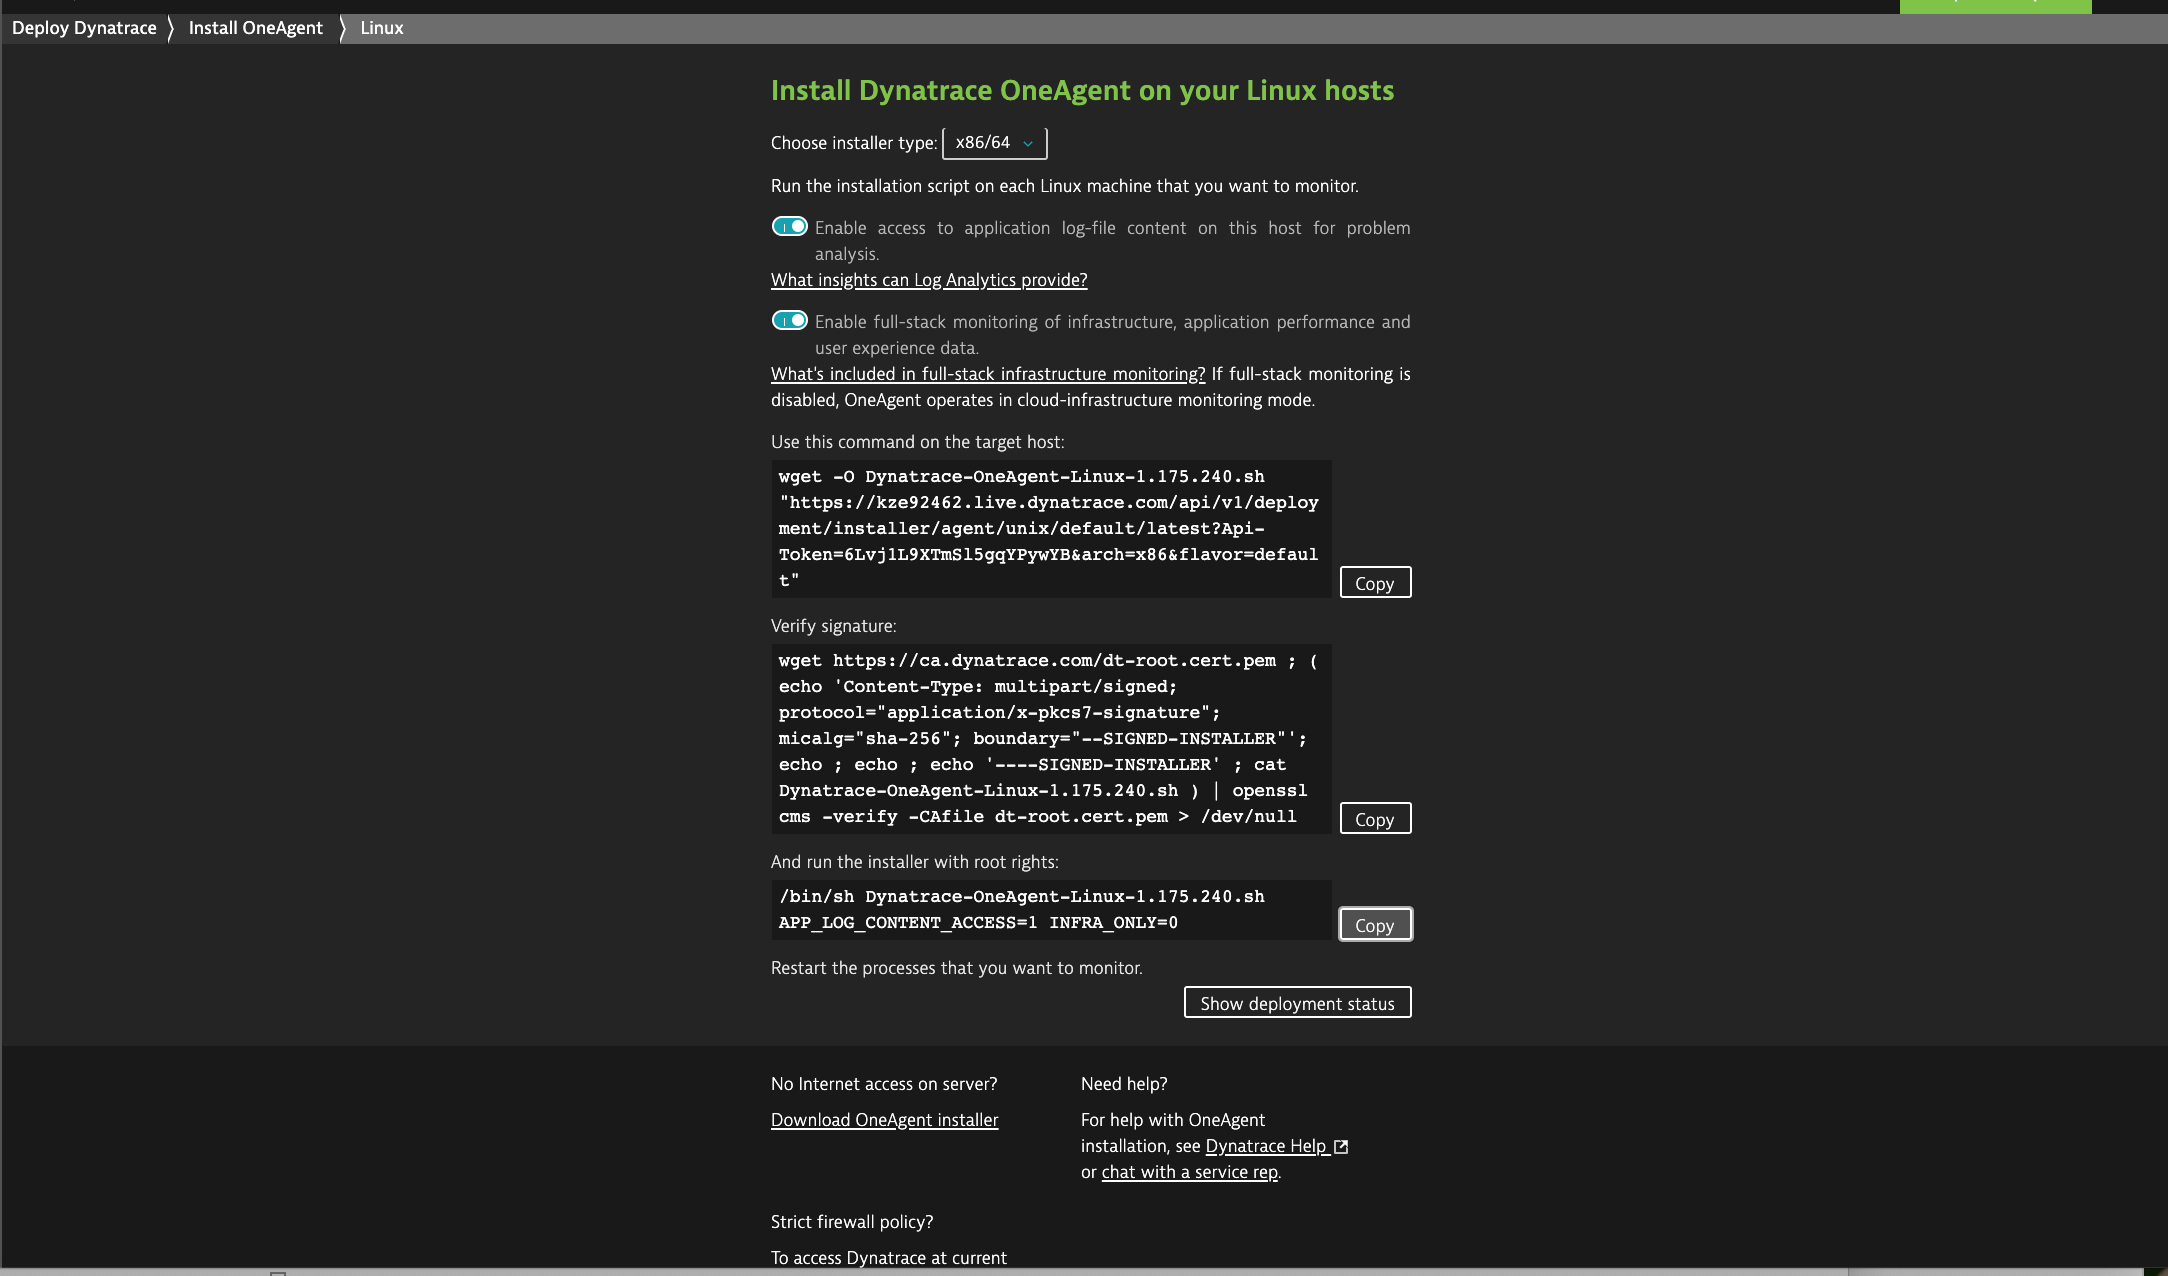
Paste the command into a Linux command prompt and run it with root authority (
sudo).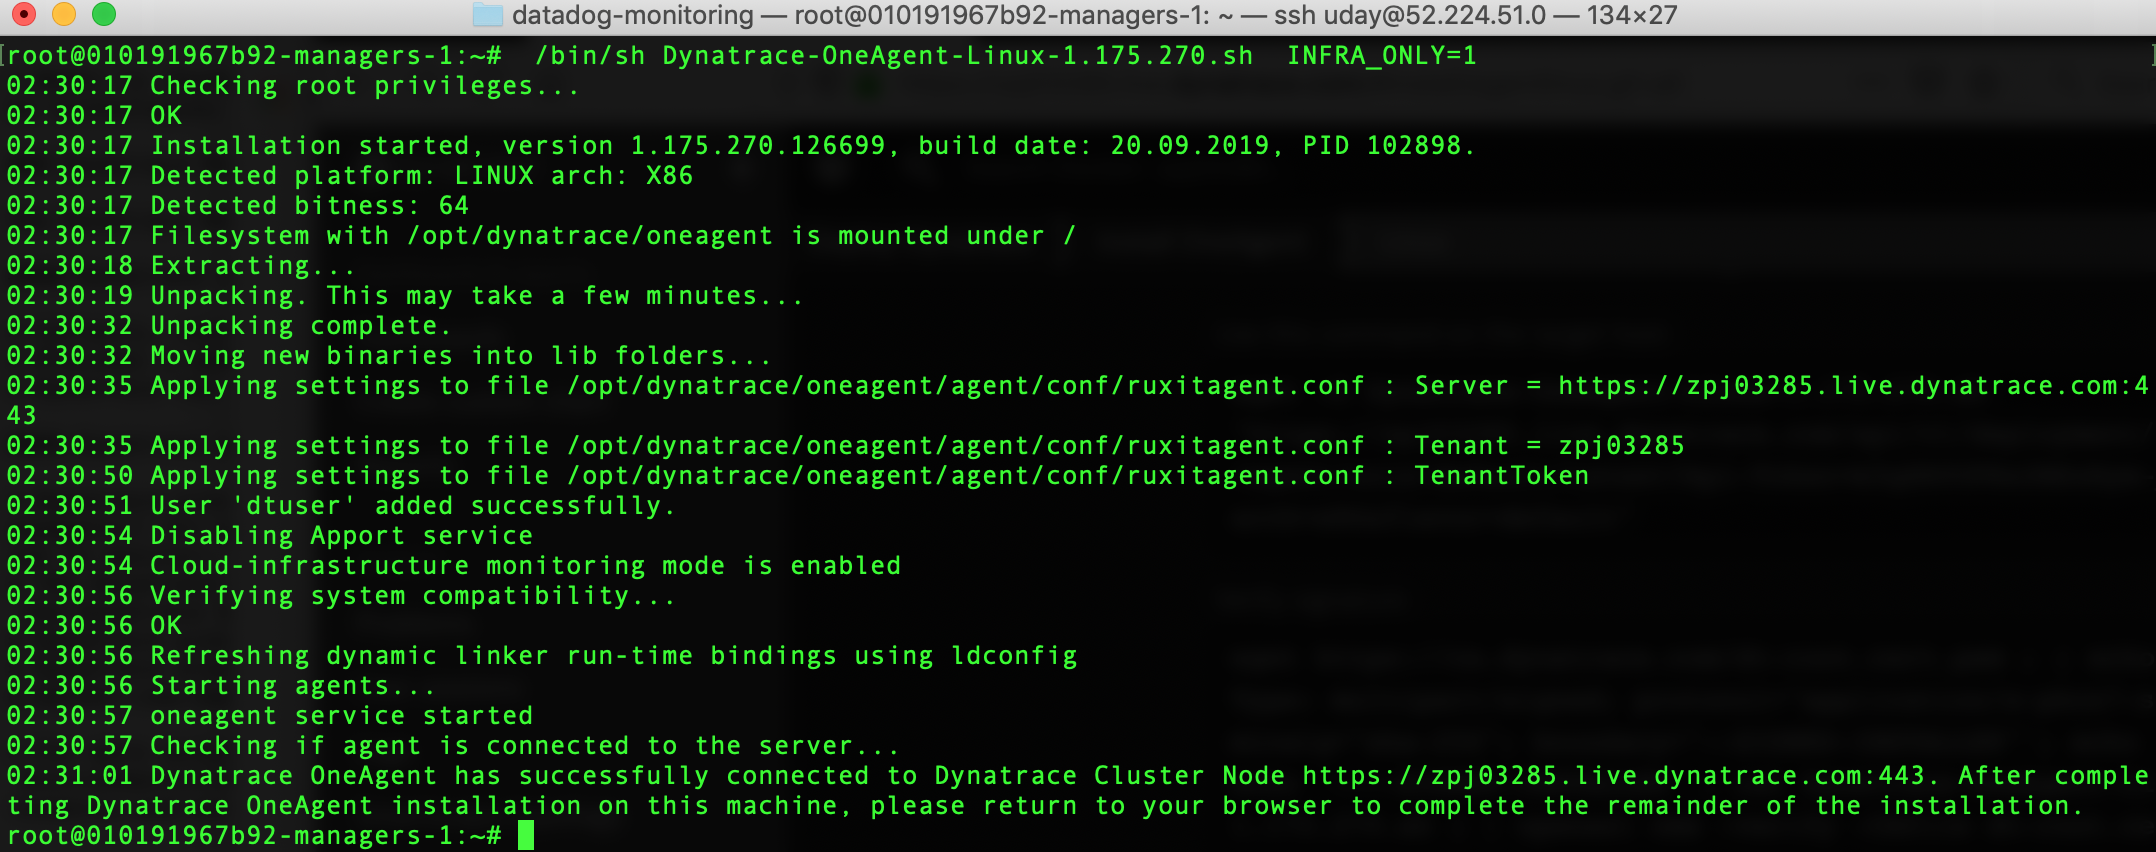
If Docker Enterprise was installed prior to installing the Dynatrace agent you will need to reboot the machine.
Repeat the above Dynatrace agent installation on all of the Linux Docker nodes.
Note
You should automate the installation of the Linux Dynatrace agent before Docker Enterprise is installed on the node using a configuration management tool such as Chef, Puppet, Terraform, Ansible, Cloud Init script, etc.
Install the Windows Dynatrace agent on a Windows Docker Enterprise MKE node
From the Dynatrace Web UI, navigate to the Deploy Dynatrace page by clicking on the Deploy Dynatrace link (bottom left). Then click on the Start installation button.
From the Download Dynatrace OneAgent page click on the Windows button.
Right click on the Download agent.exe button and copy the
Linkto download the installation bits.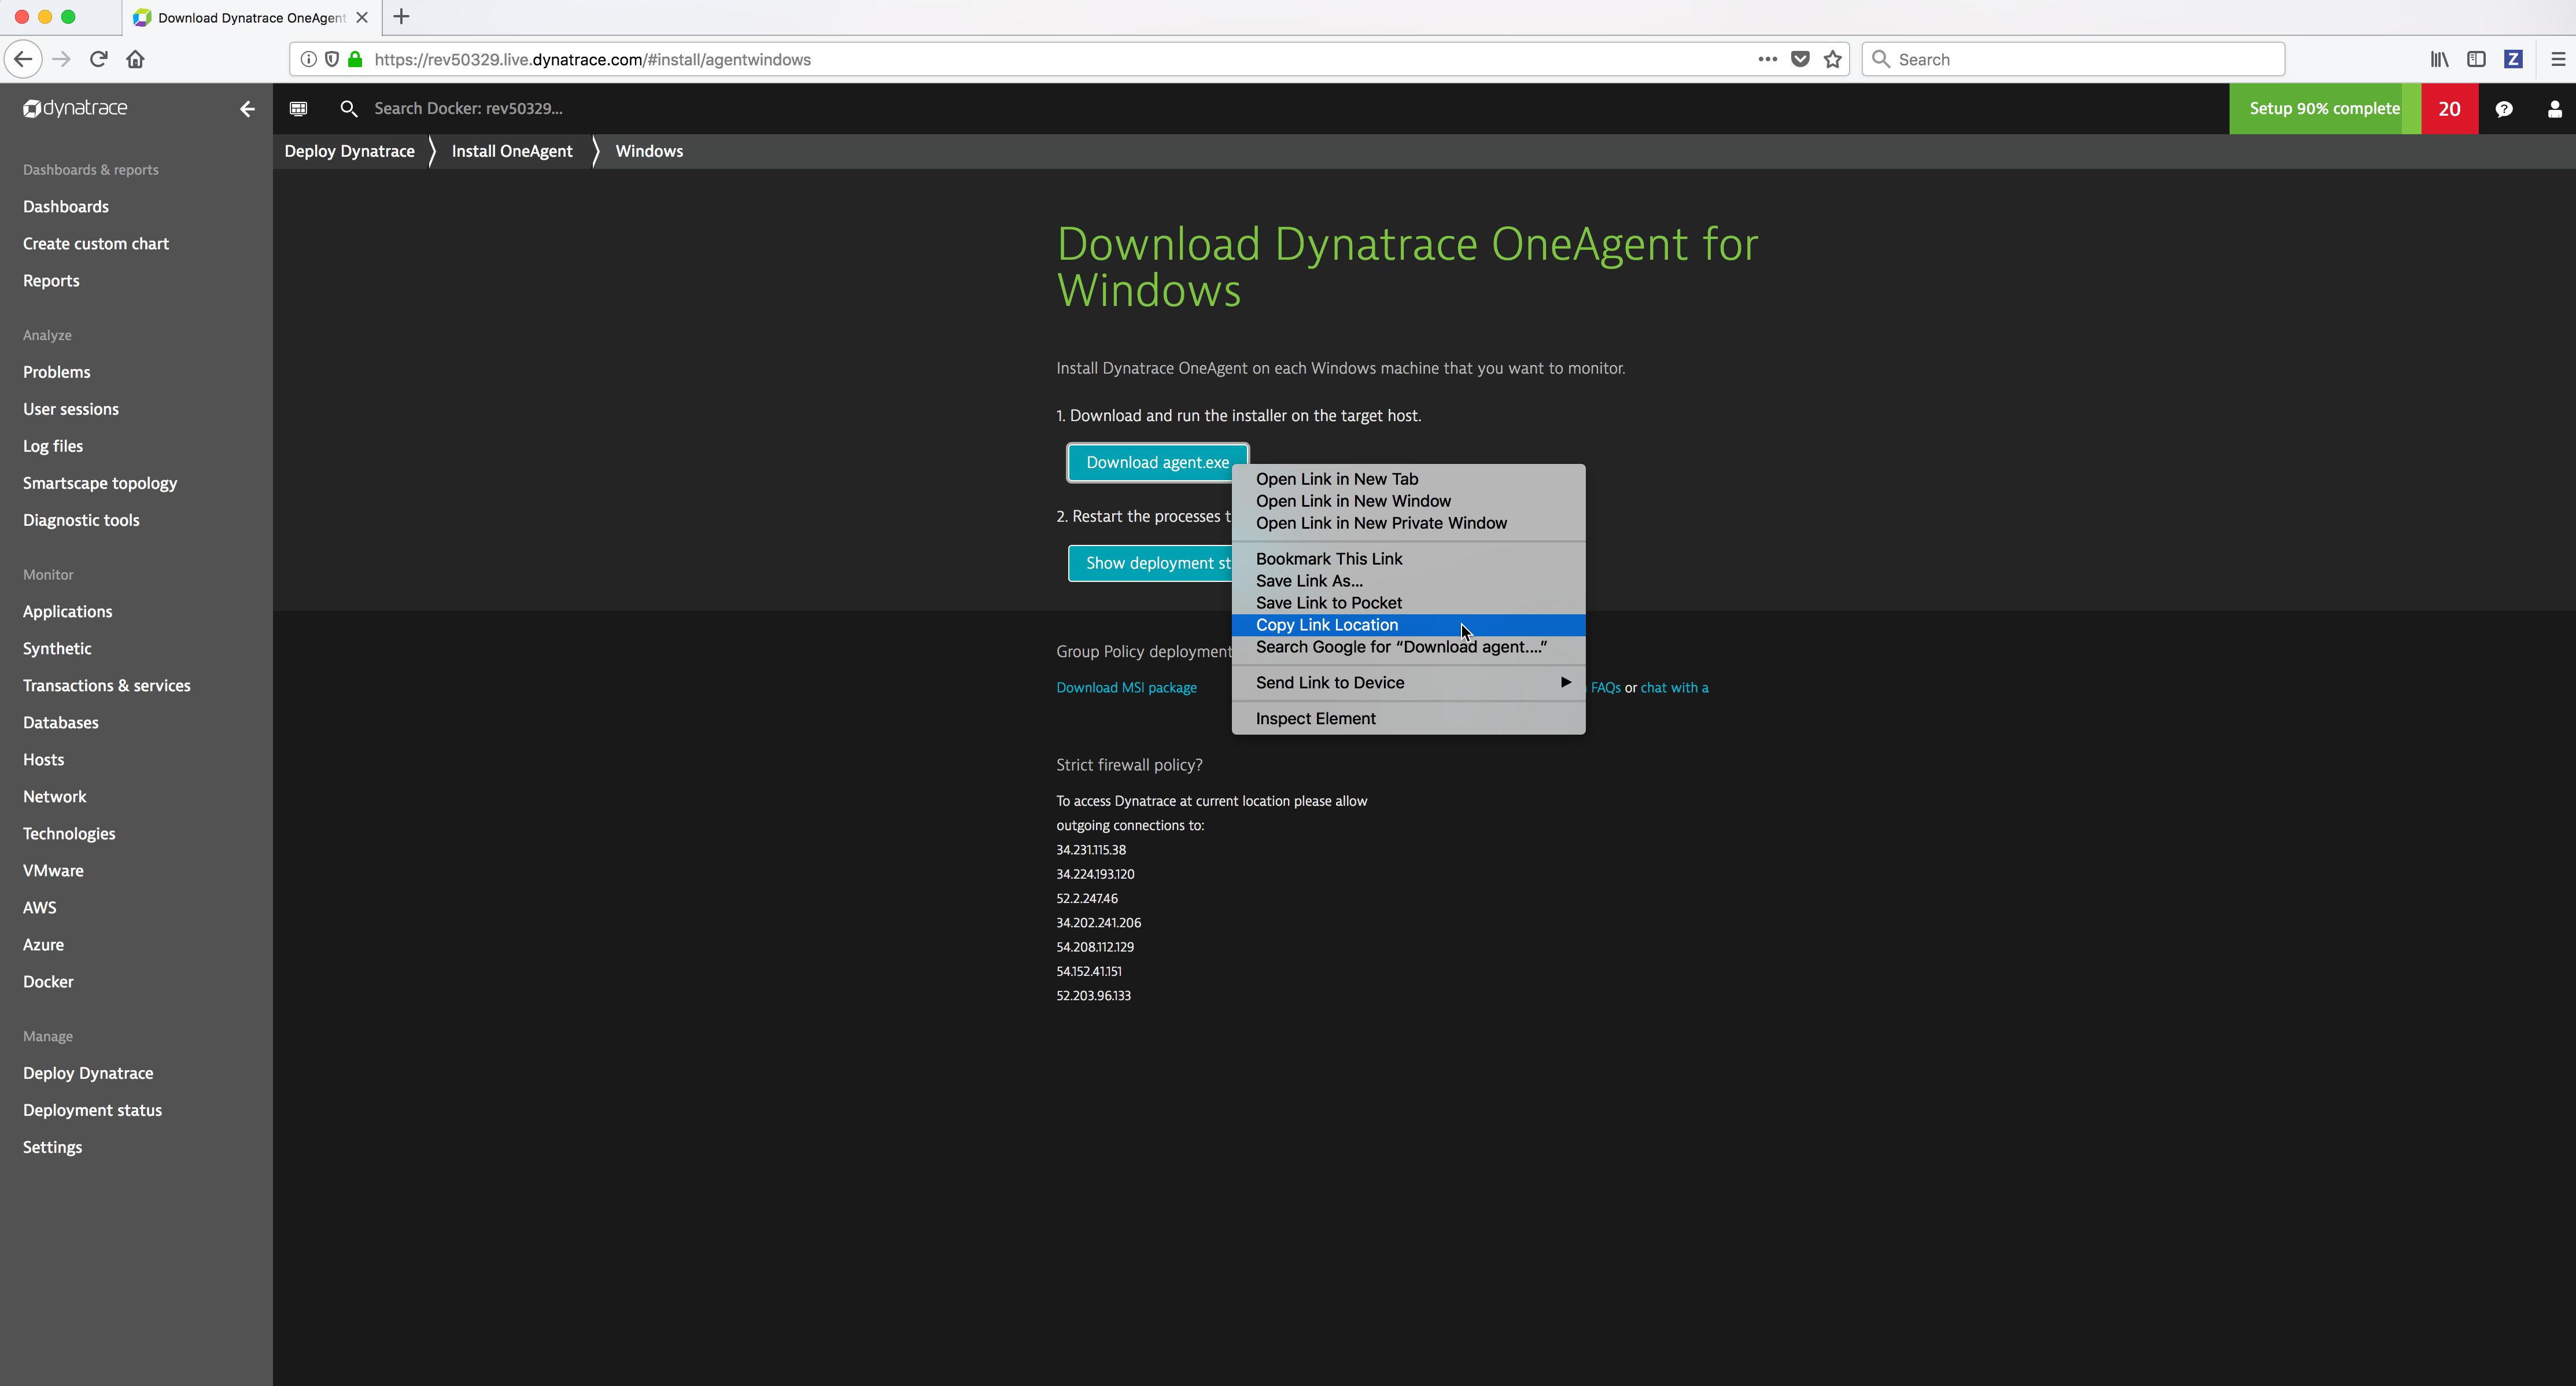
- Run the following
iwrcommand from a Powershell command prompt to download the Windows Dynatrace agent installation bits. Substitute the text dynatrace-oneagent-windows-download-link with the Windows Dynatrace agent downloadLinkyou copied in the previous step.
   > iwr -outfile install_oneagent.exe -uri '**dynatrace-oneagent-windows-download-link**'

Example:

.. image:: ../_images/dynatrace/run_dynatrace_oneagent_installer_iwr_command.png
   :width: 100%
   :alt: Run the iwr command
- Run the following
install_oneagent.execommand from a Powershell command prompt to install the Windows Dynatrace agent.
    .\install_oneagent.exe /quiet /norestart

Example:

.. image:: ../_images/dynatrace/run_dynatrace_oneagent_installer_windows_command.png
   :width: 100%
   :alt: Run the iwr command

.. Note::

   The **install\_oneagent.exe** command runs detached in the background.
- Wait about a minute and then run the following command from a Powershell command prompt to display the Dynatrace agent windows service.
   > net start | findstr /c:"Dynatrace OneAgent"

Example:

.. image:: ../_images/dynatrace/display_dynatrace_oneagent_windows_service.png
   :width: 100%
   :alt: Run the iwr command
If Docker Enterprise was installed prior to installing the Dynatrace agent you will need to reboot the machine.
Repeat the above Dynatrace agent installation on all of the Windows Docker nodes.
Note
You should automate the installation of the Windows Dynatrace agent before Docker Enterprise is installed on the node using a configuration management tool such as Chef, Puppet, Terraform, Ansible, Cloud Init script, etc.
Display the Dynatrace agents from the Dynatrace Web UI
You can display the Dynatrace agents from the Dynatrace Web UI Deployment Status page.
From the Dynatrace Web UI, click on the Deployment Status link.

You can click on a Dynatrace agent to get more details.

More details are displayed which includes the processes and containers being monitored by the selected Dynatrace agent.

Dynatrace Web Interface
Dashboards & reports
- Dashboards - allow you to create your own custom dashboards to monitor your infrastructure and applications. Dynatrace provides a default home dashboard that provides a quick overview of your system’s health.
- Create custom chart - Custom charts enable you to analyze any combination of monitoring metrics directly on your dashboards.
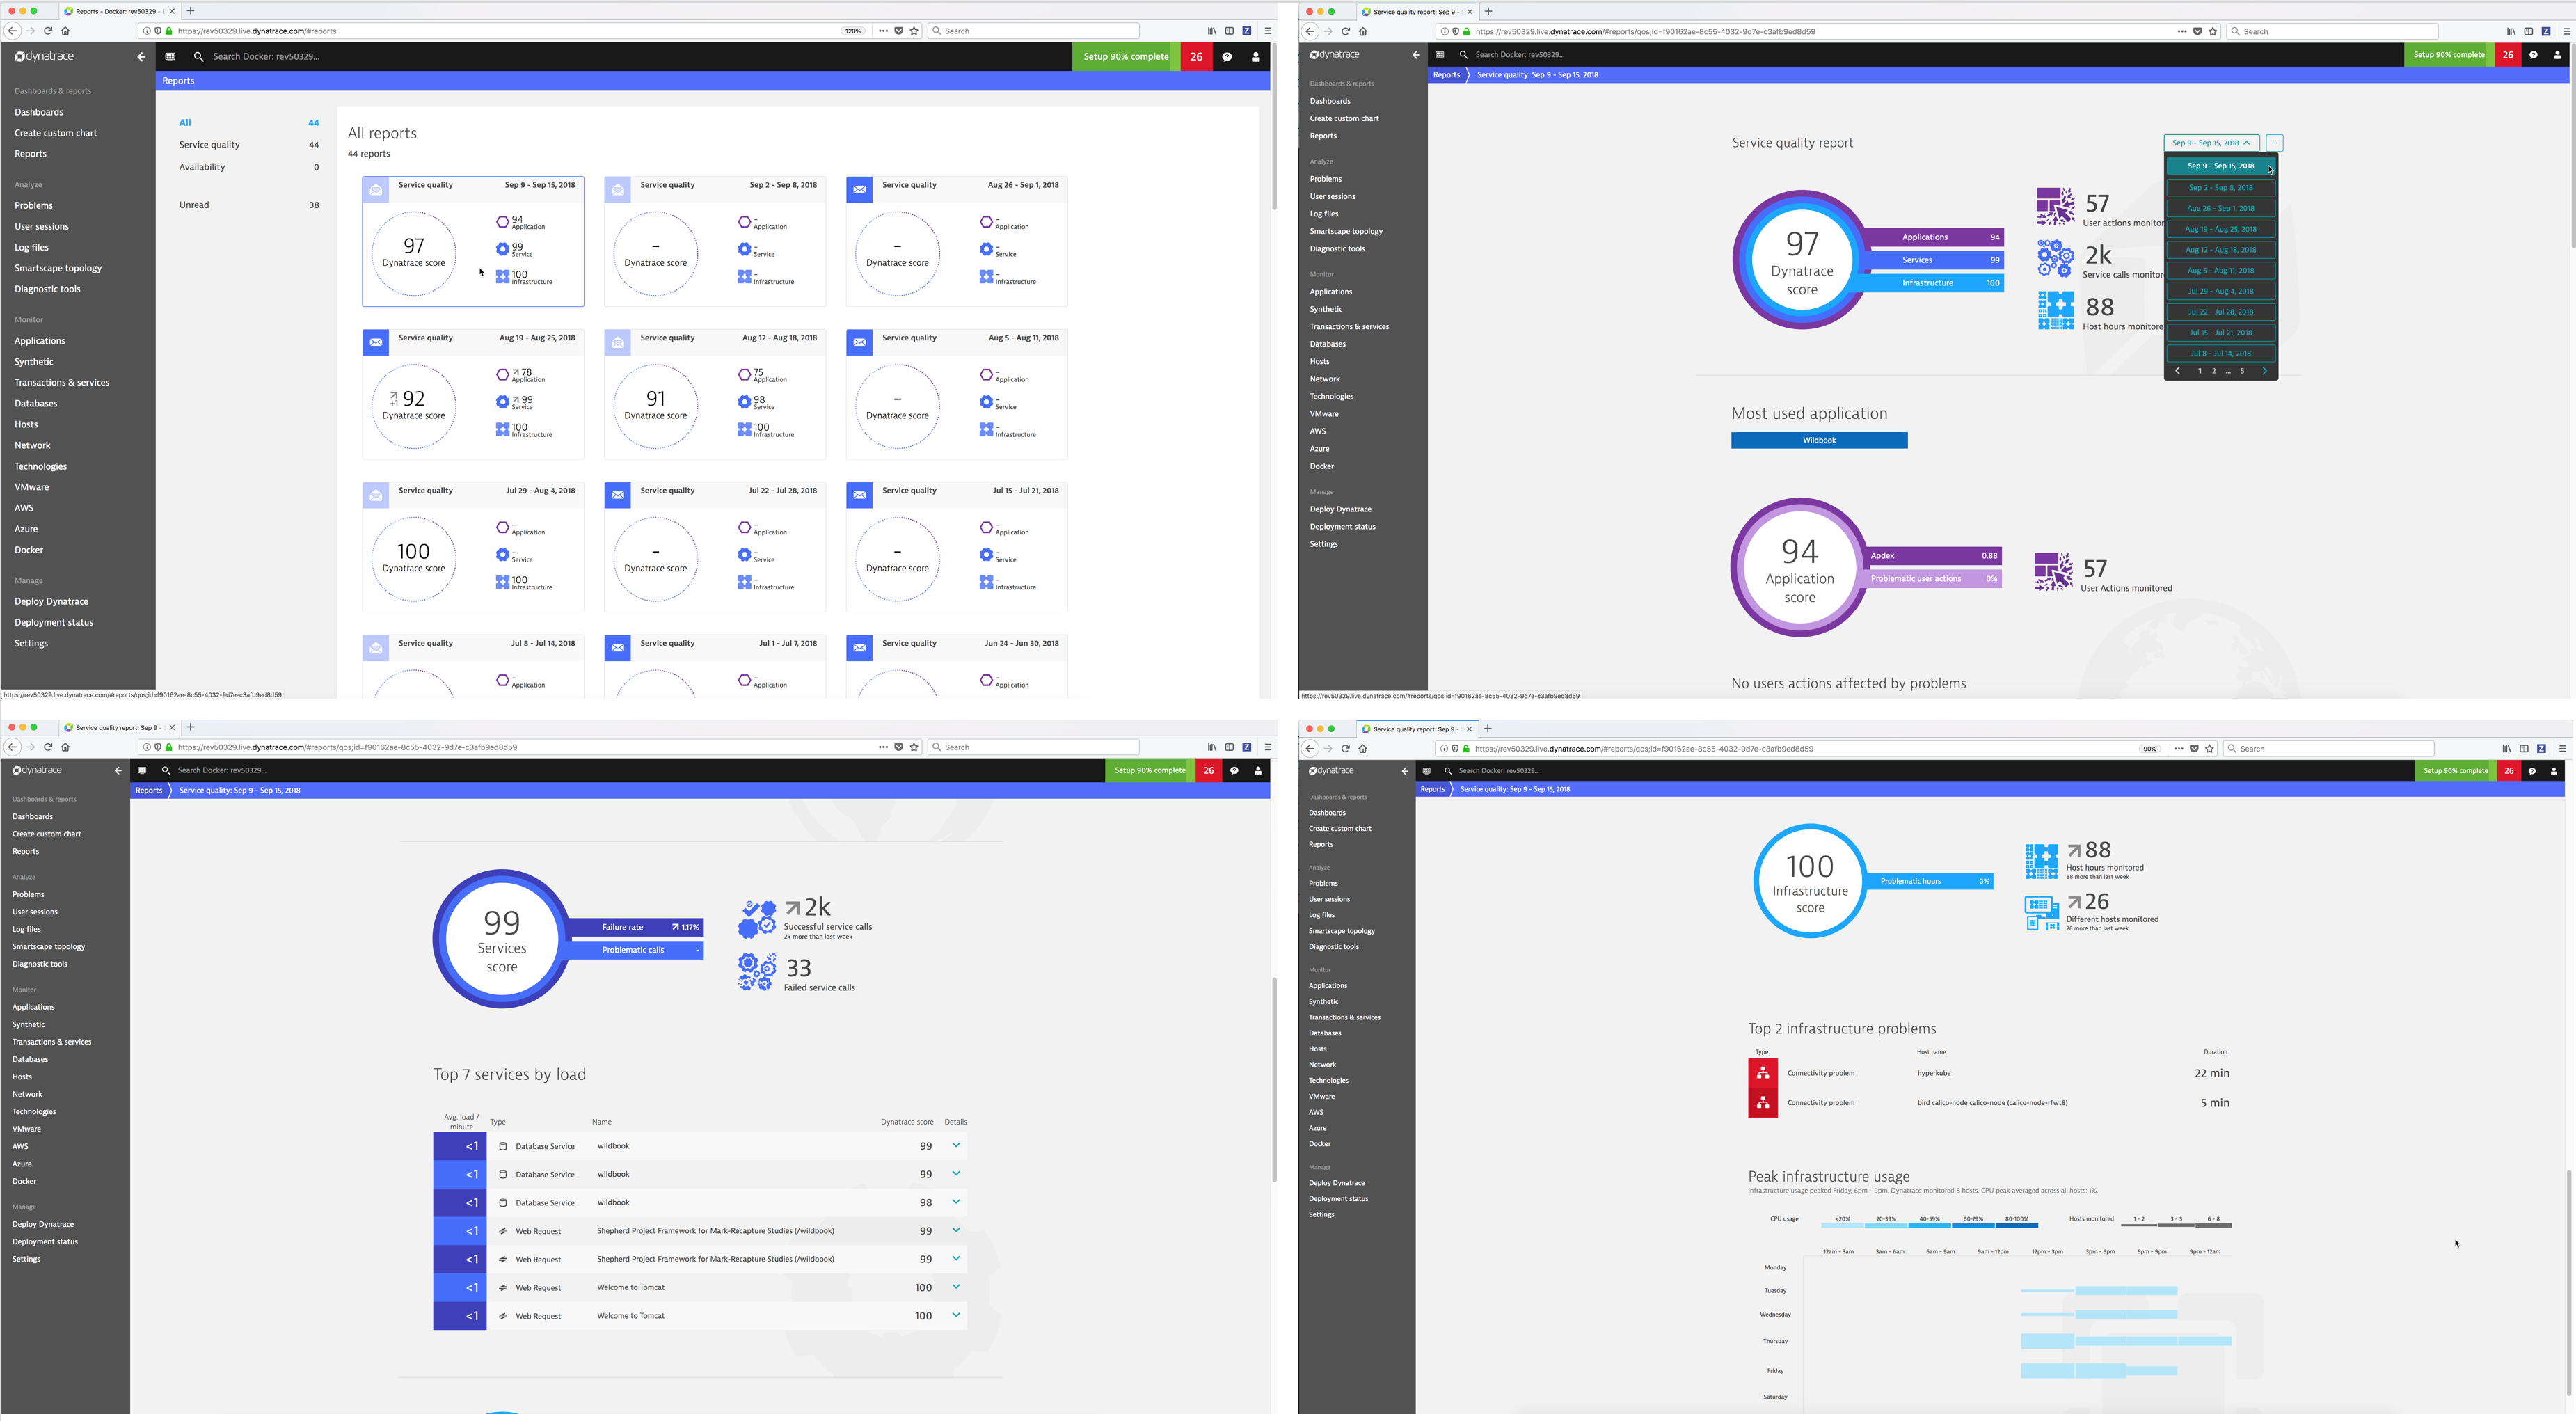
- Reports - Dynatrace provides Service quality and Availability reports. Service quality reports are generated each week on Sundays at midnight so that when you start your work week each Monday morning you’ll find a new report ready for your review. Availability reports are based on web checks that you have running in Dynatrace.
Analyze
- Problems - Dynatrace automatically detects performance anomalies in your applications, services, and infrastructure. Dynatrace “problems” are used to report and alert on abnormal situations, such as performance degradations, improper functionality, or lack of availability (i.e., problems represent anomalies in baseline system performance).
- User sessions - A user session, sometimes known as a “visit,” is a group of user actions that are performed in your web application during a limited period of time.
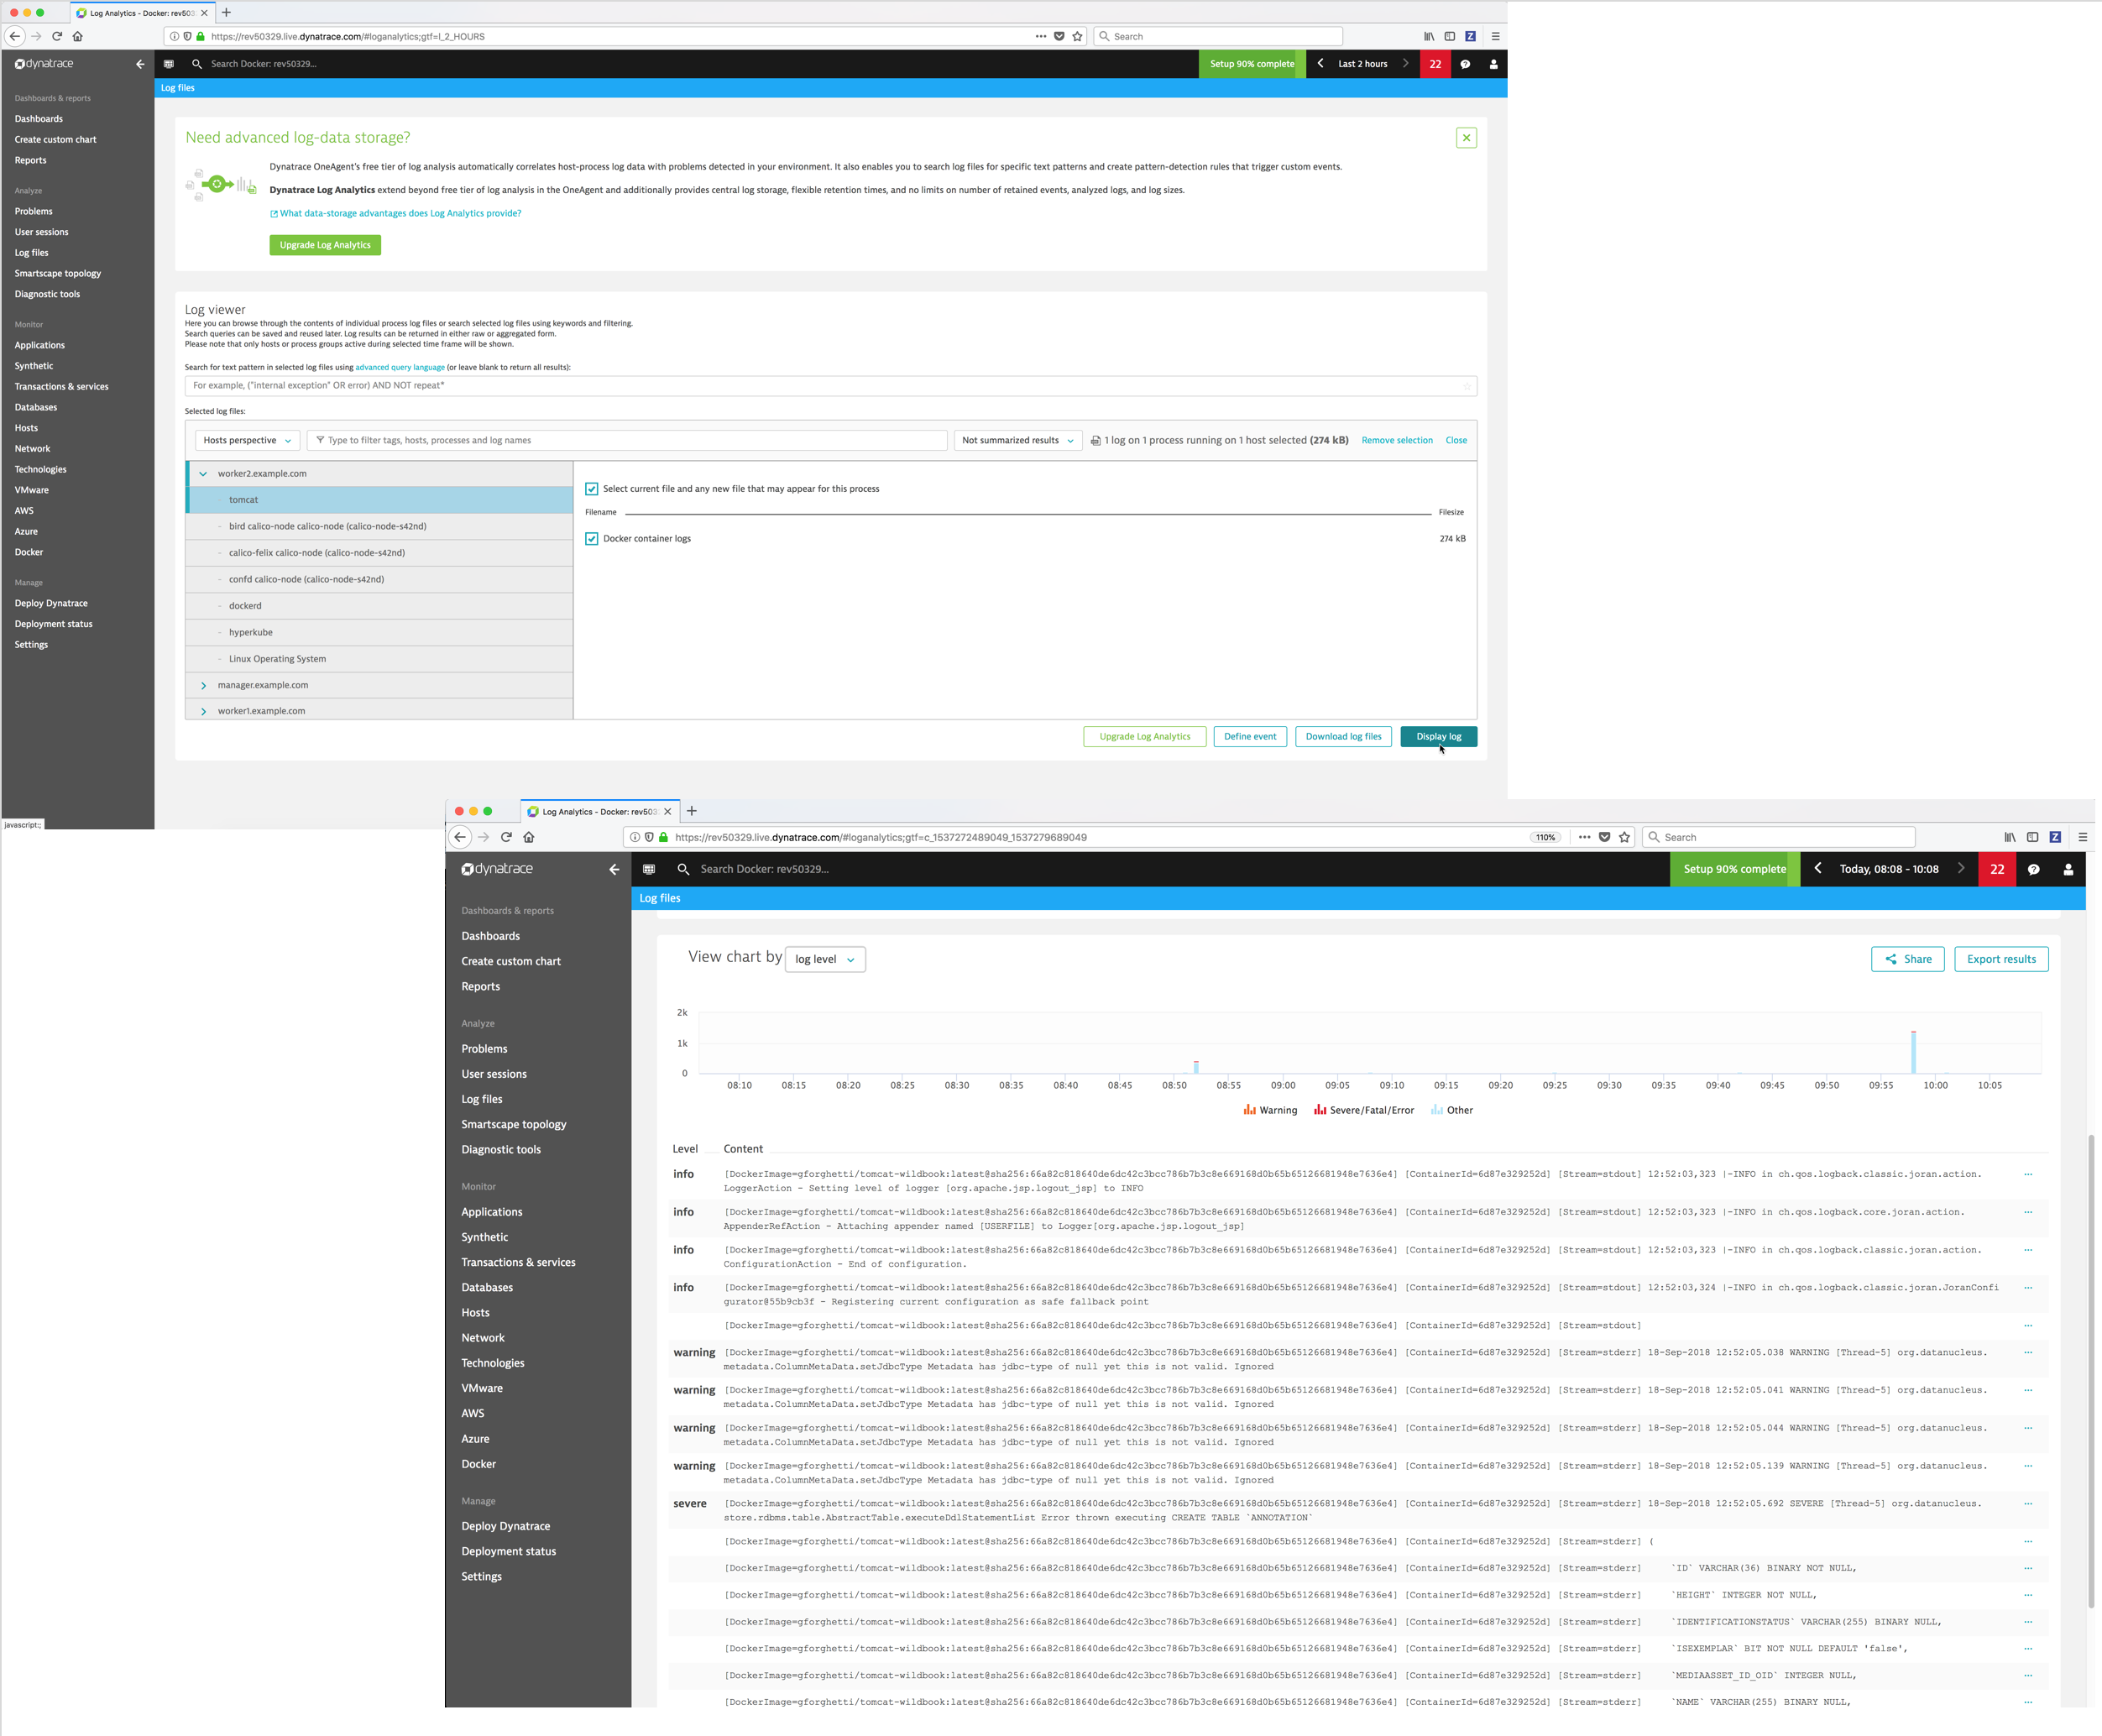
- Log files - Dynatrace automatically discovers all log files on your monitored hosts and processes. You can then browse, search and filter for information in the log files.
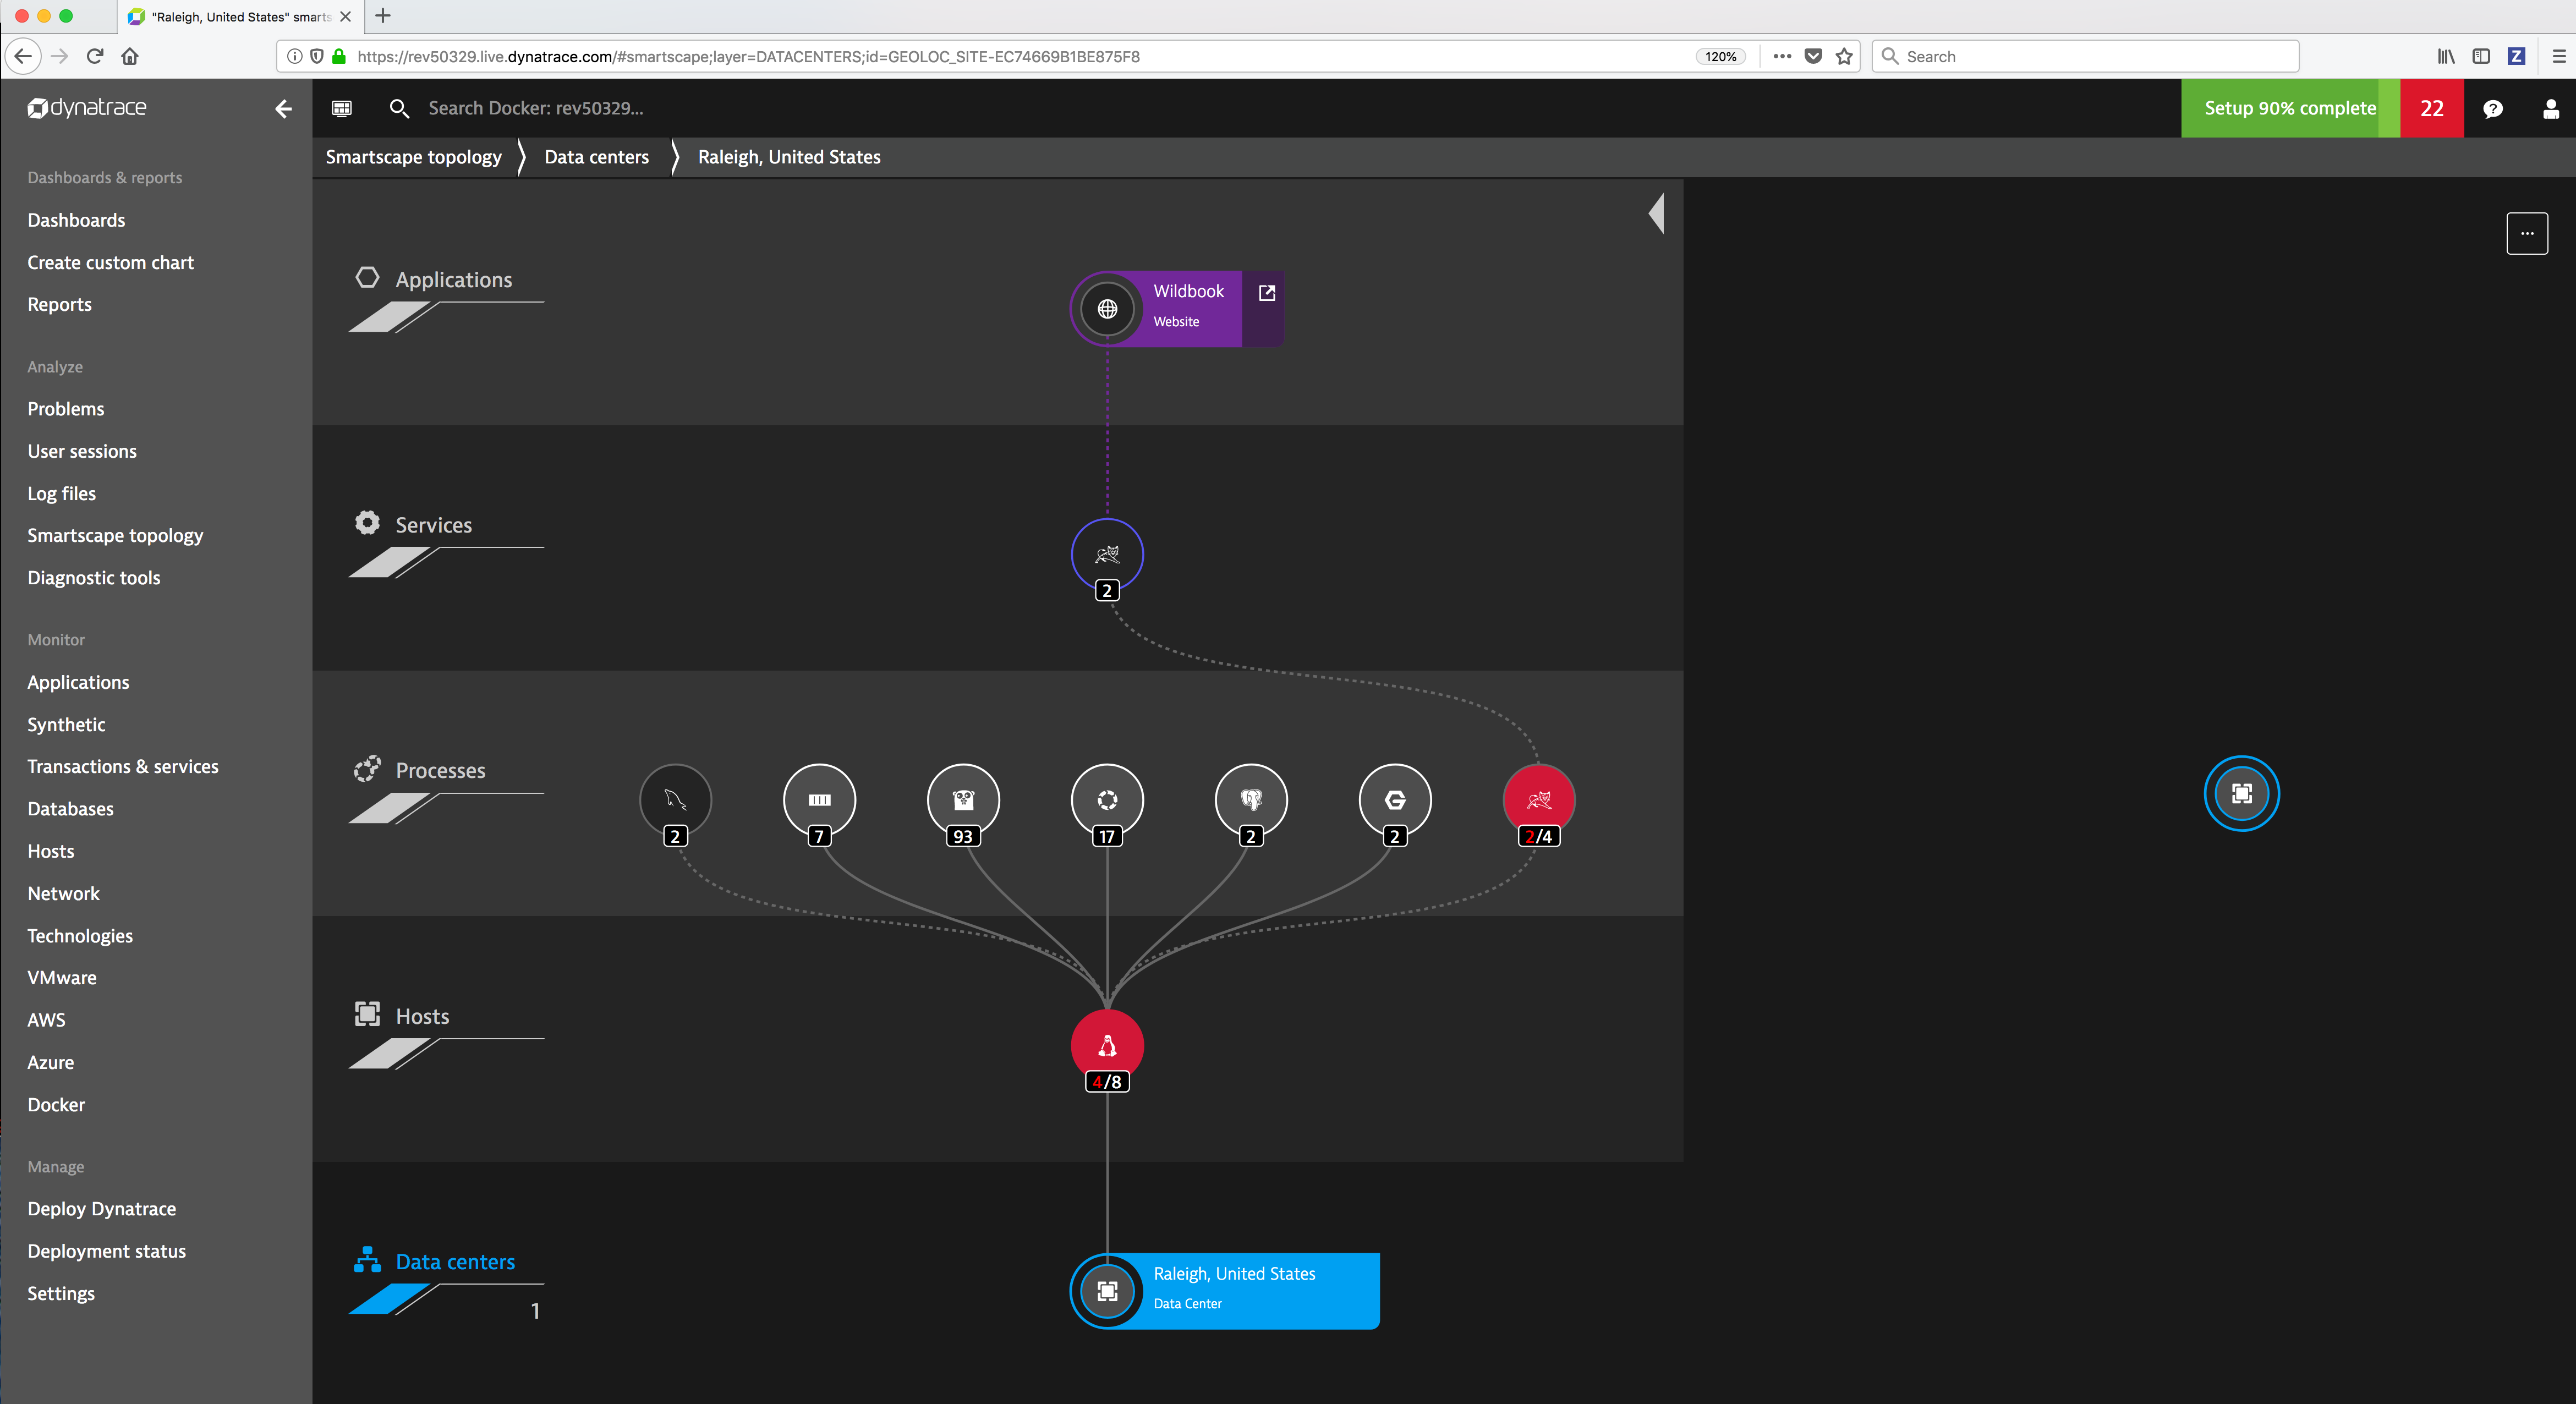
- Smartscape topology - Visualize your application topology in an interactive infographic.
- Diagnostic tools - Dynatrace provide diagnostic tools for detecting and analyzing performance problems in your application environment.
Monitor
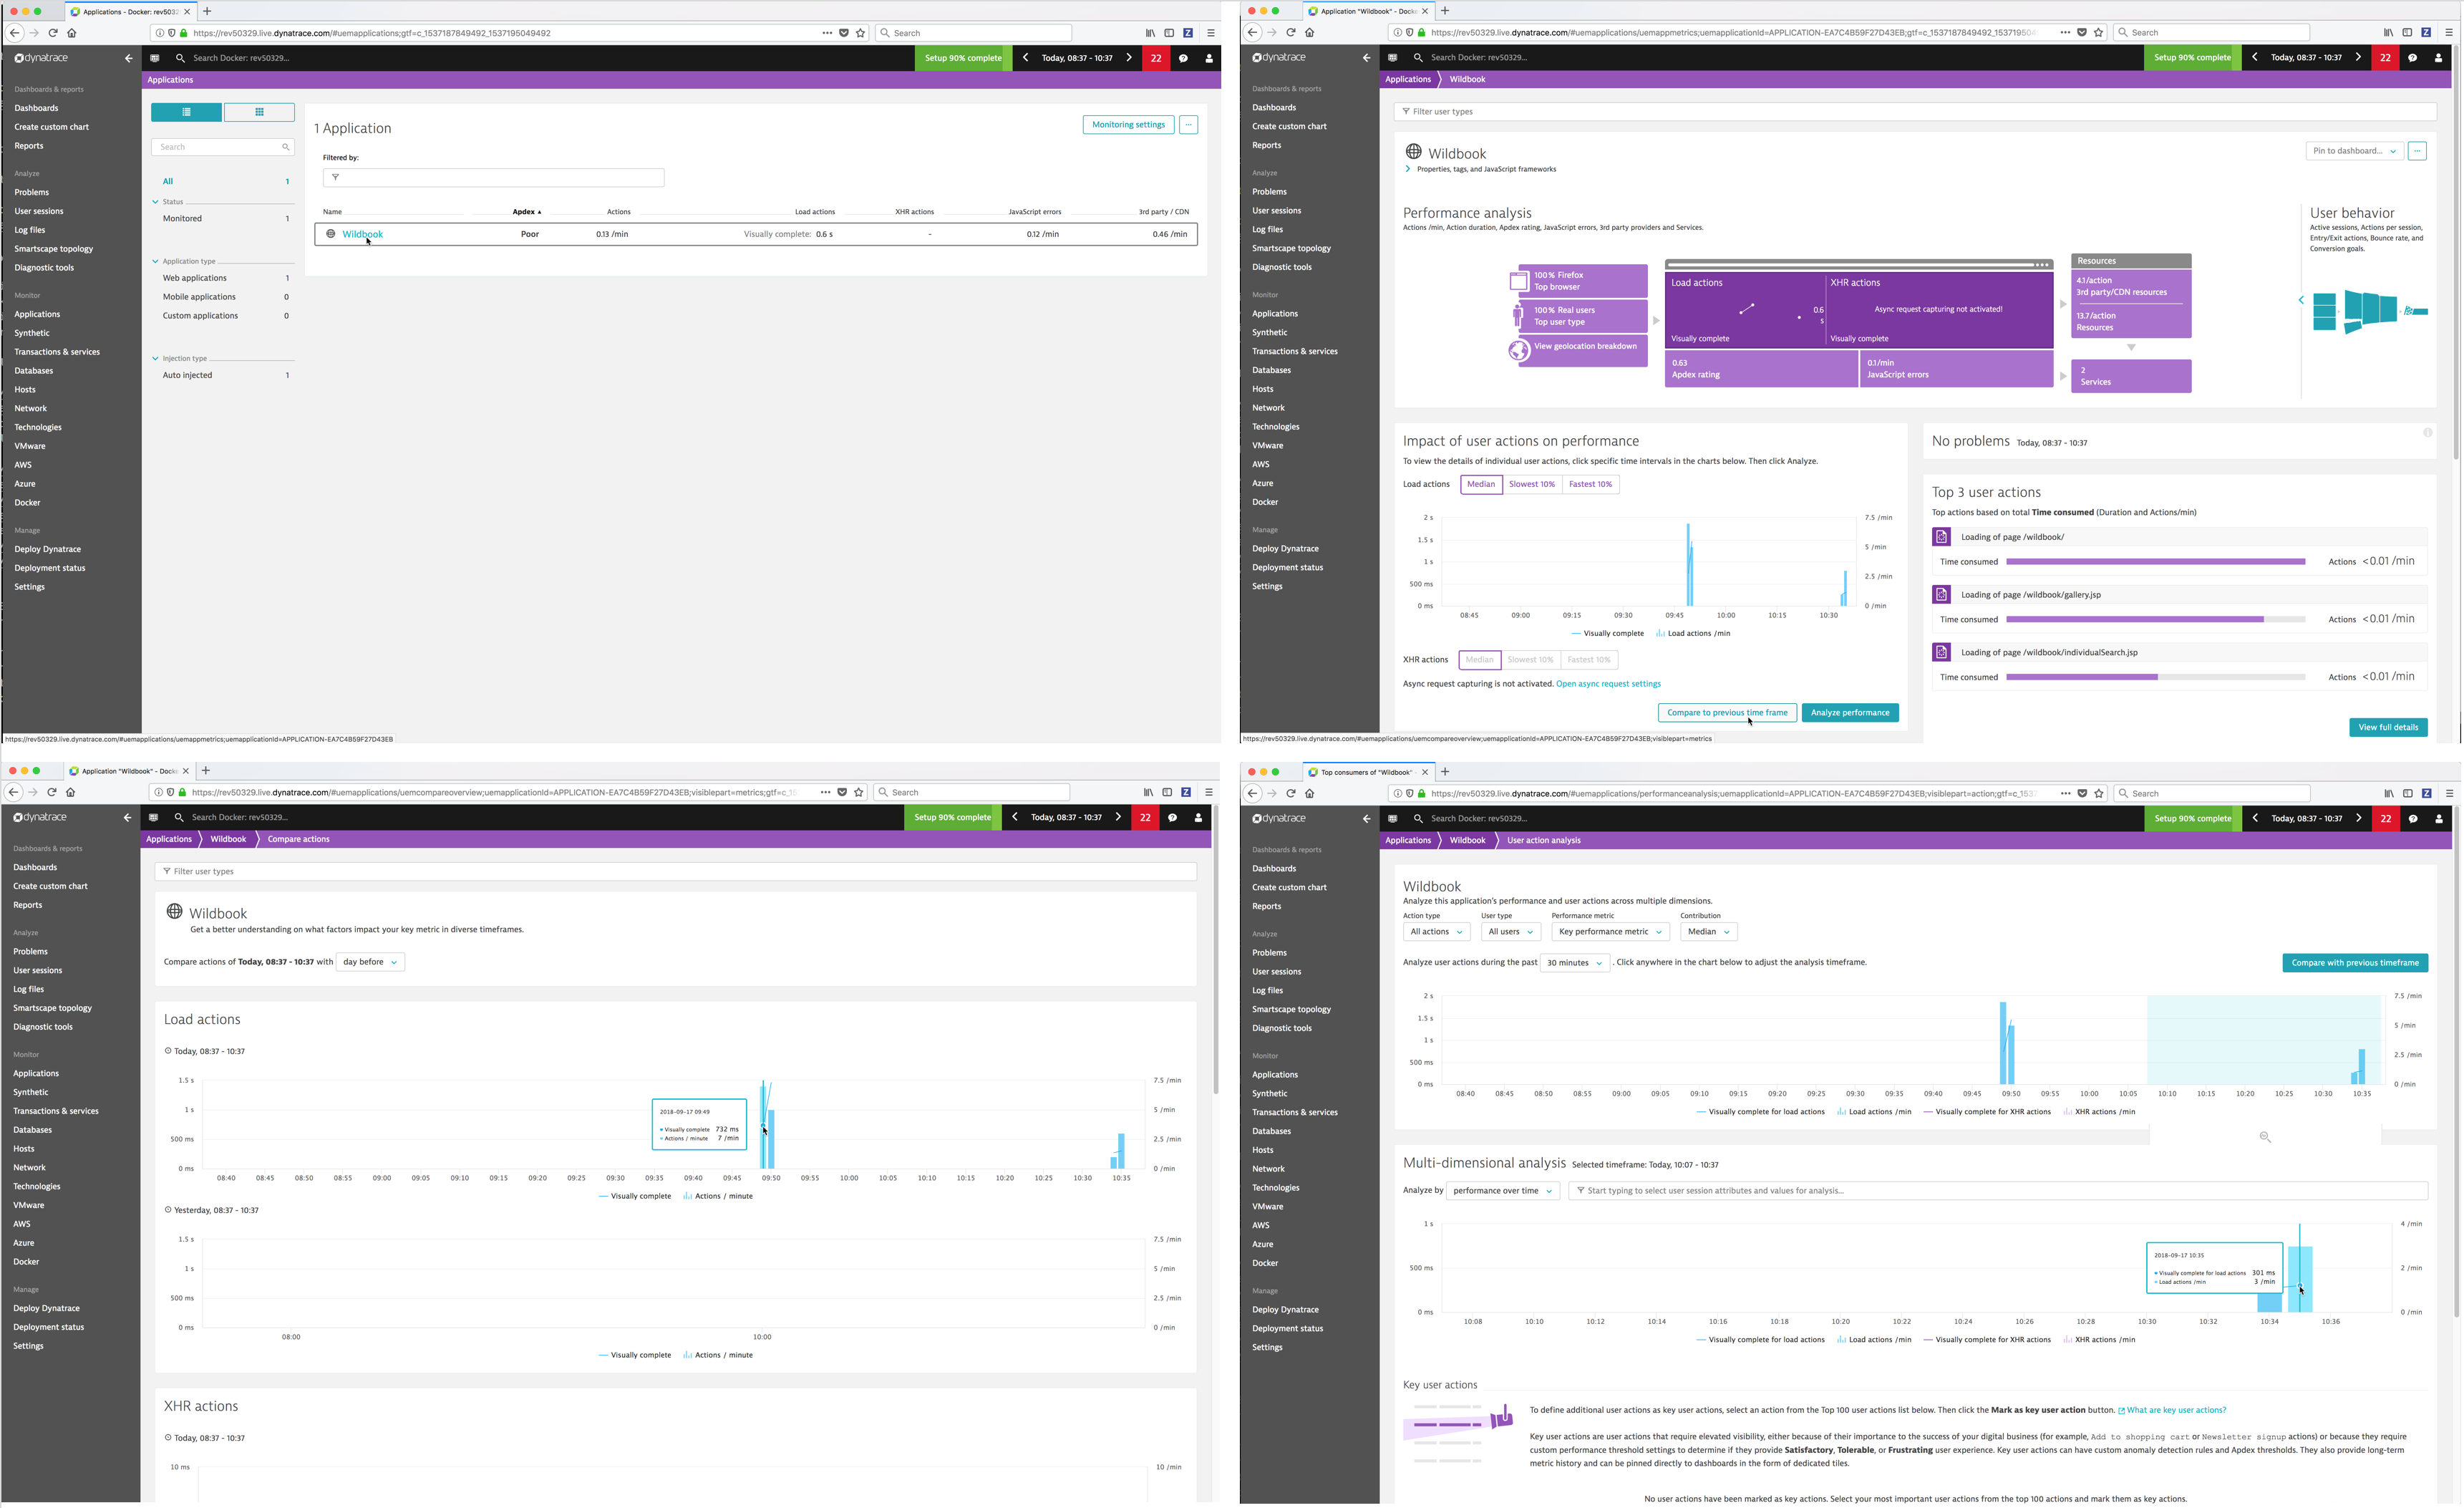
- Applications - Dynatrace monitors and visualizes application performance, provides all performance metrics in real time and detects and diagnoses problems automatically.
- Synthetic - Dynatrace allows you to define Synthetic monitors (simulated user sessions) that alert you when an application is inaccessible or when performance degrades below baseline performance.
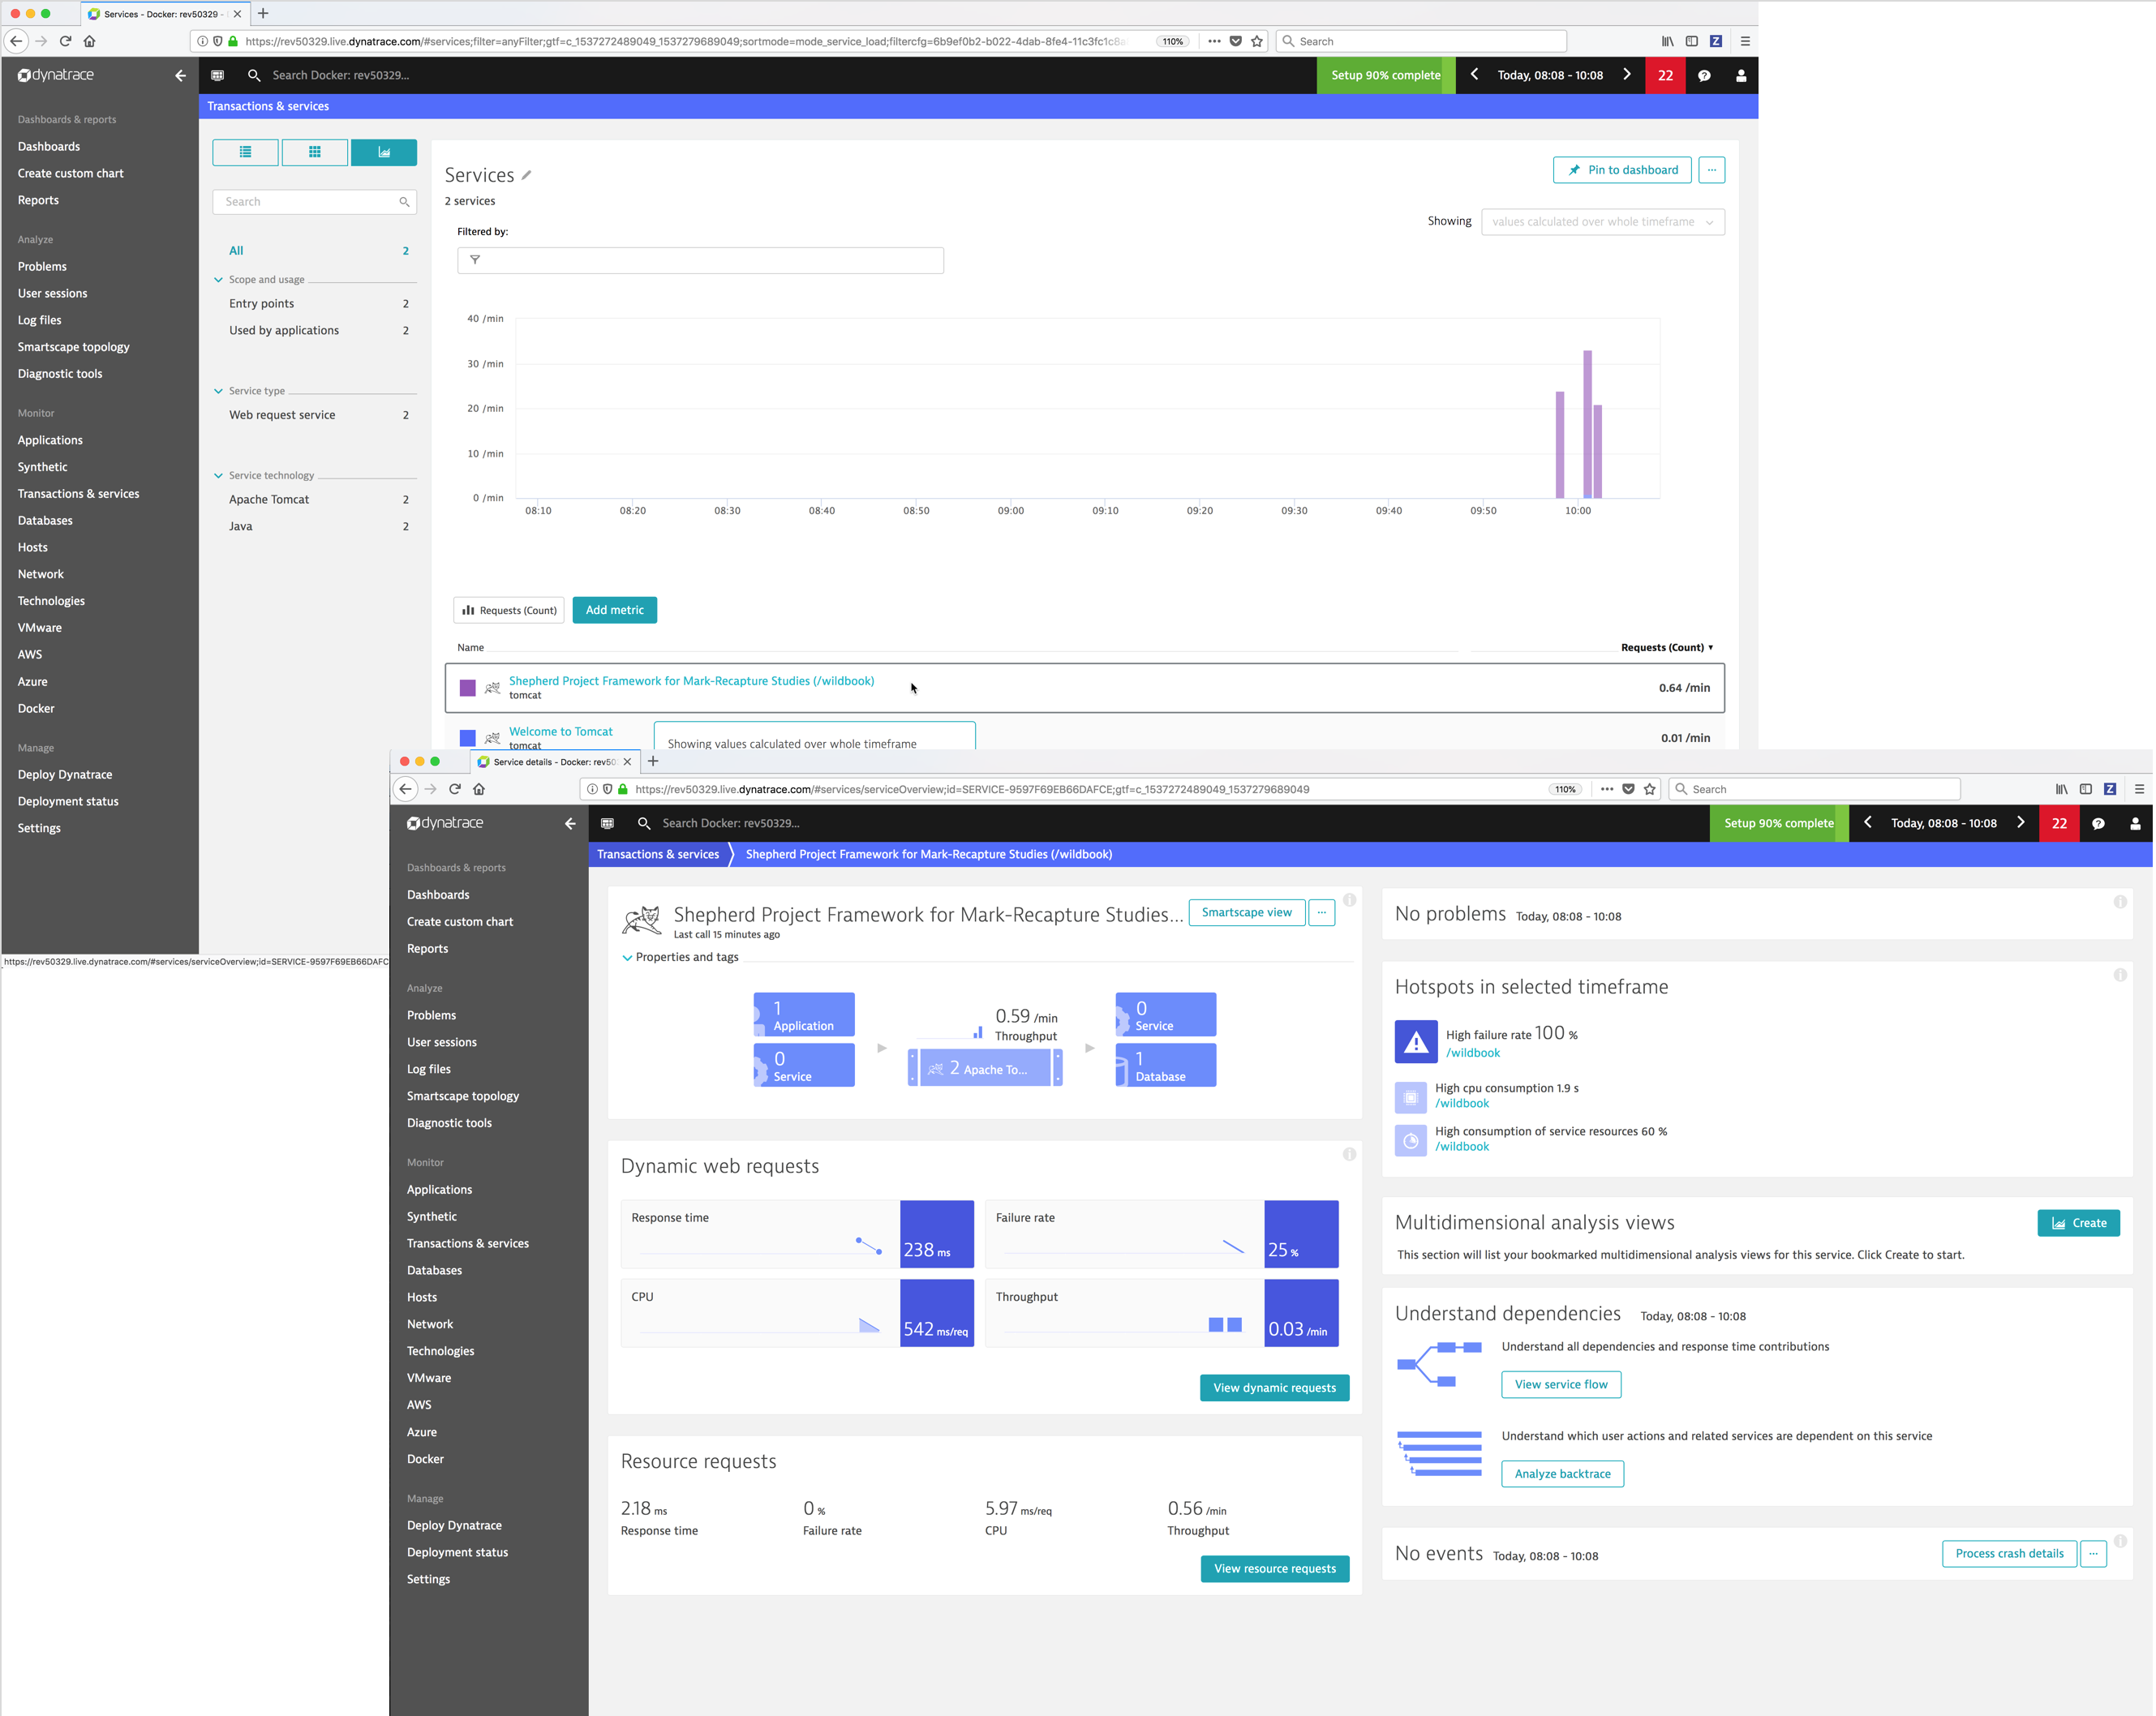
- Transactions & services - Dynatrace captures every transaction from all applications and services.
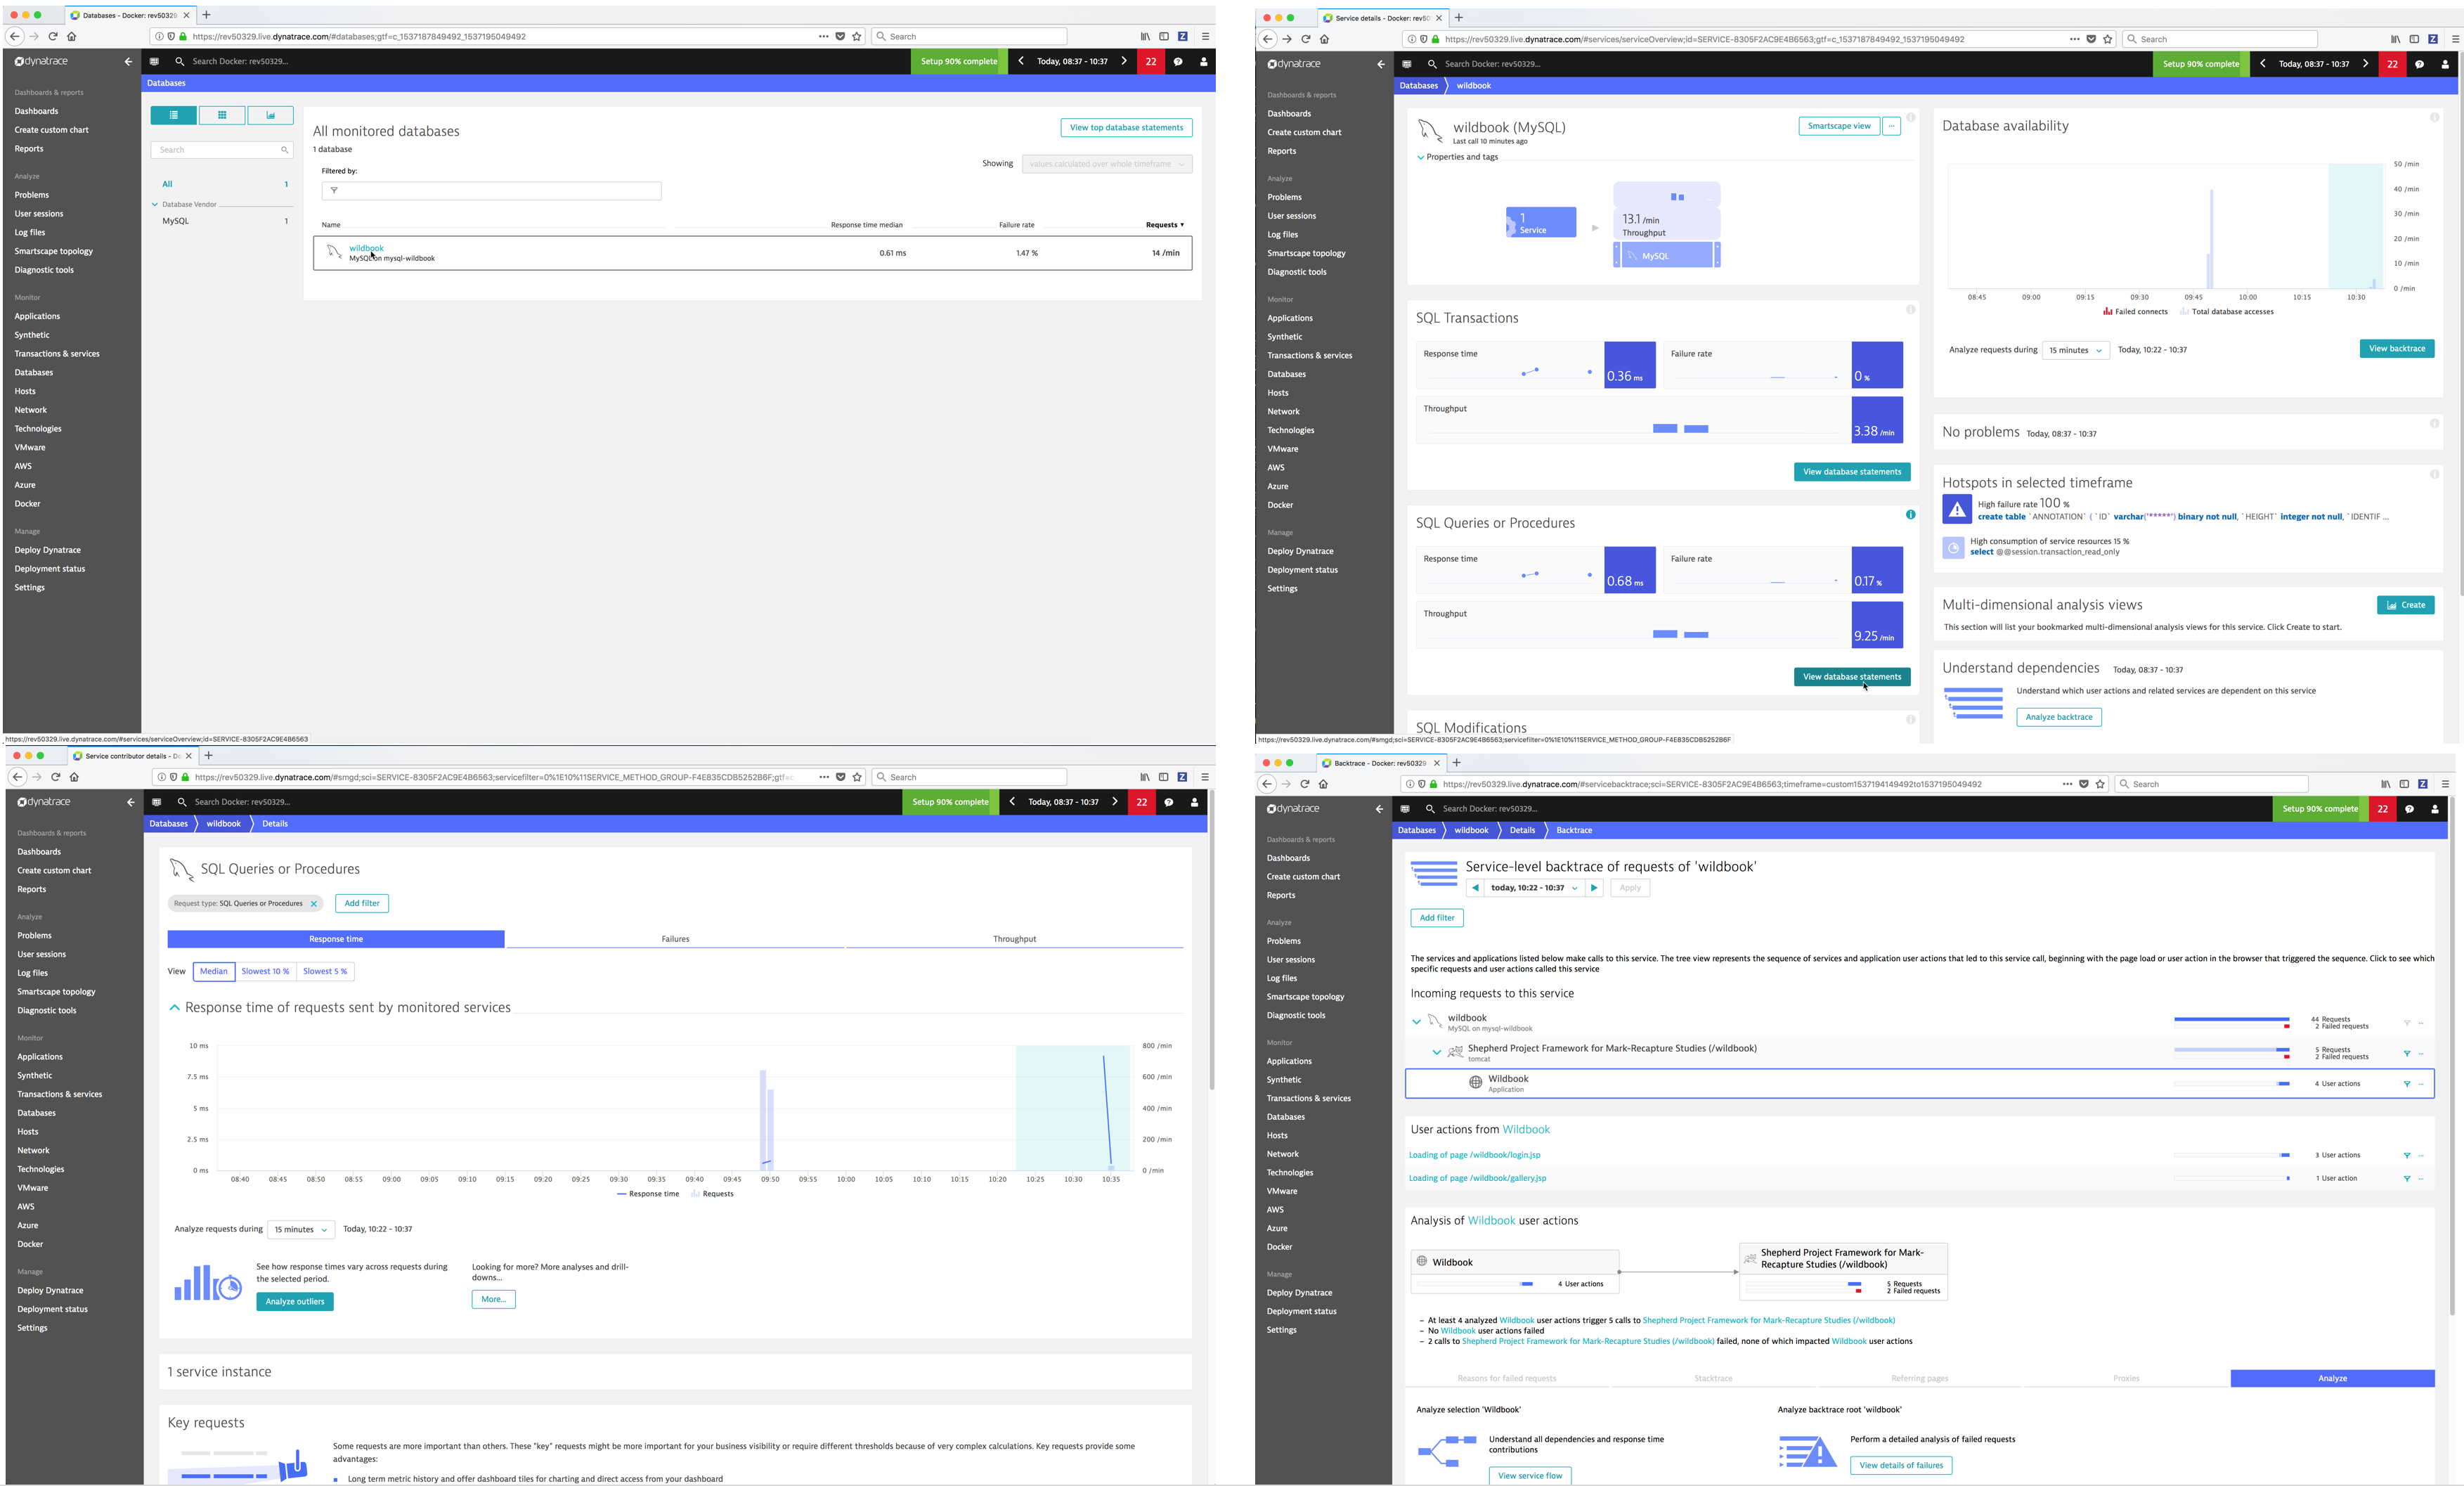
- Databases - Dynatrace detects and monitors all databases, captures every database statement and displays detailed health metrics for each statement.
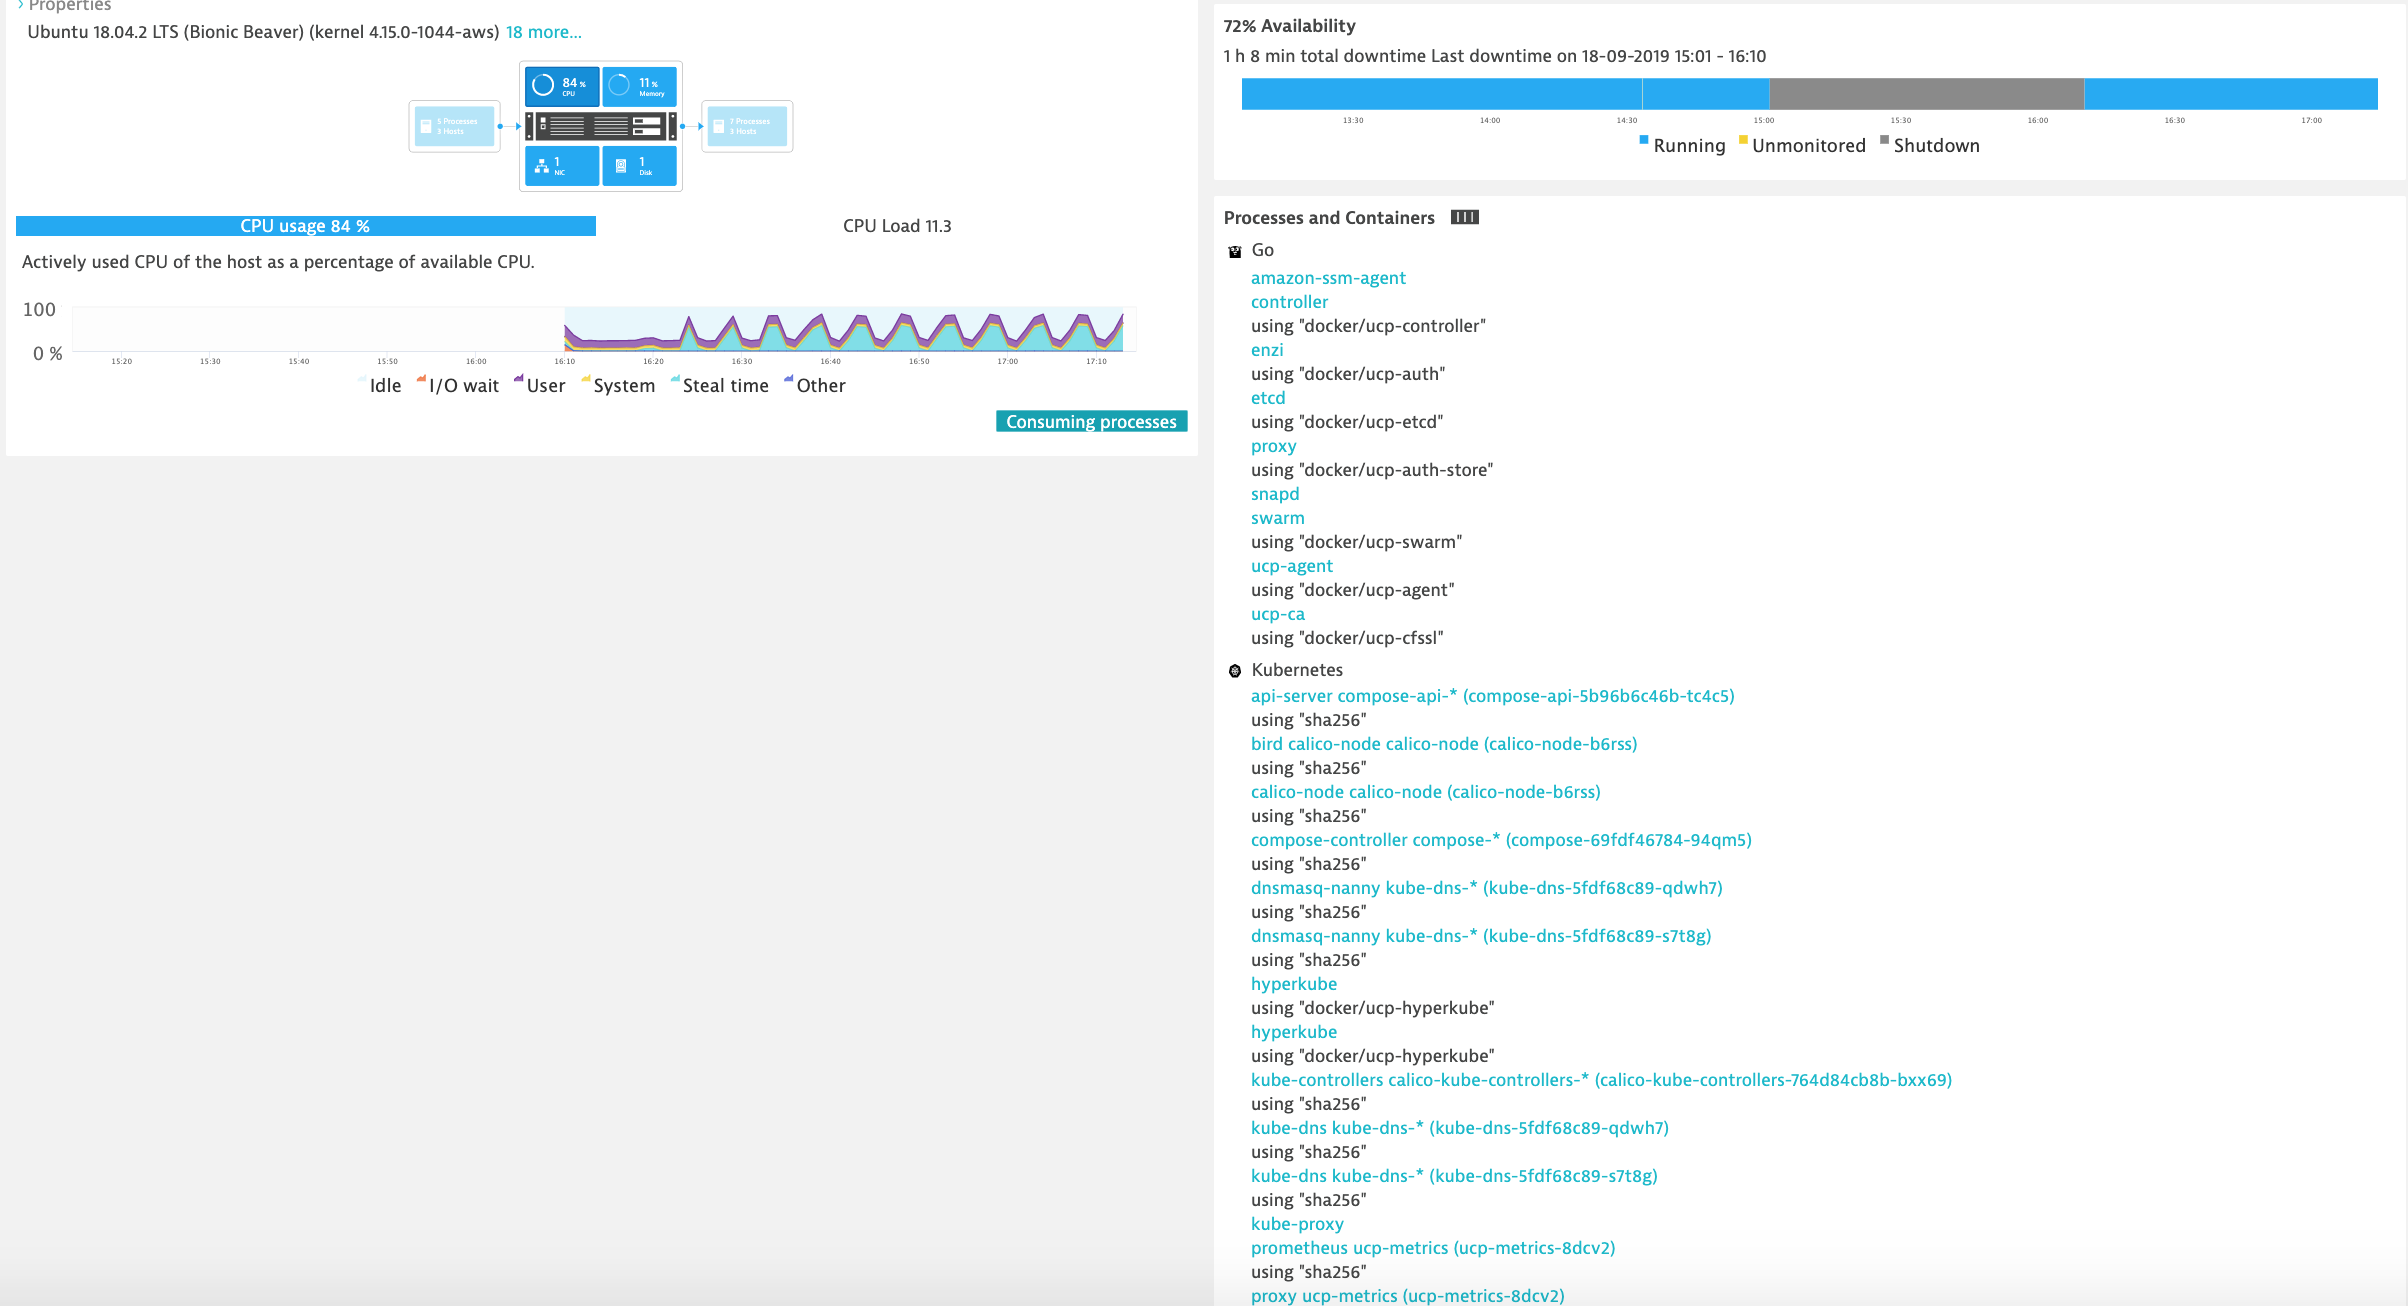
- Hosts - Dynatrace automatically monitors the state of a host machine along with the running processes and containers.
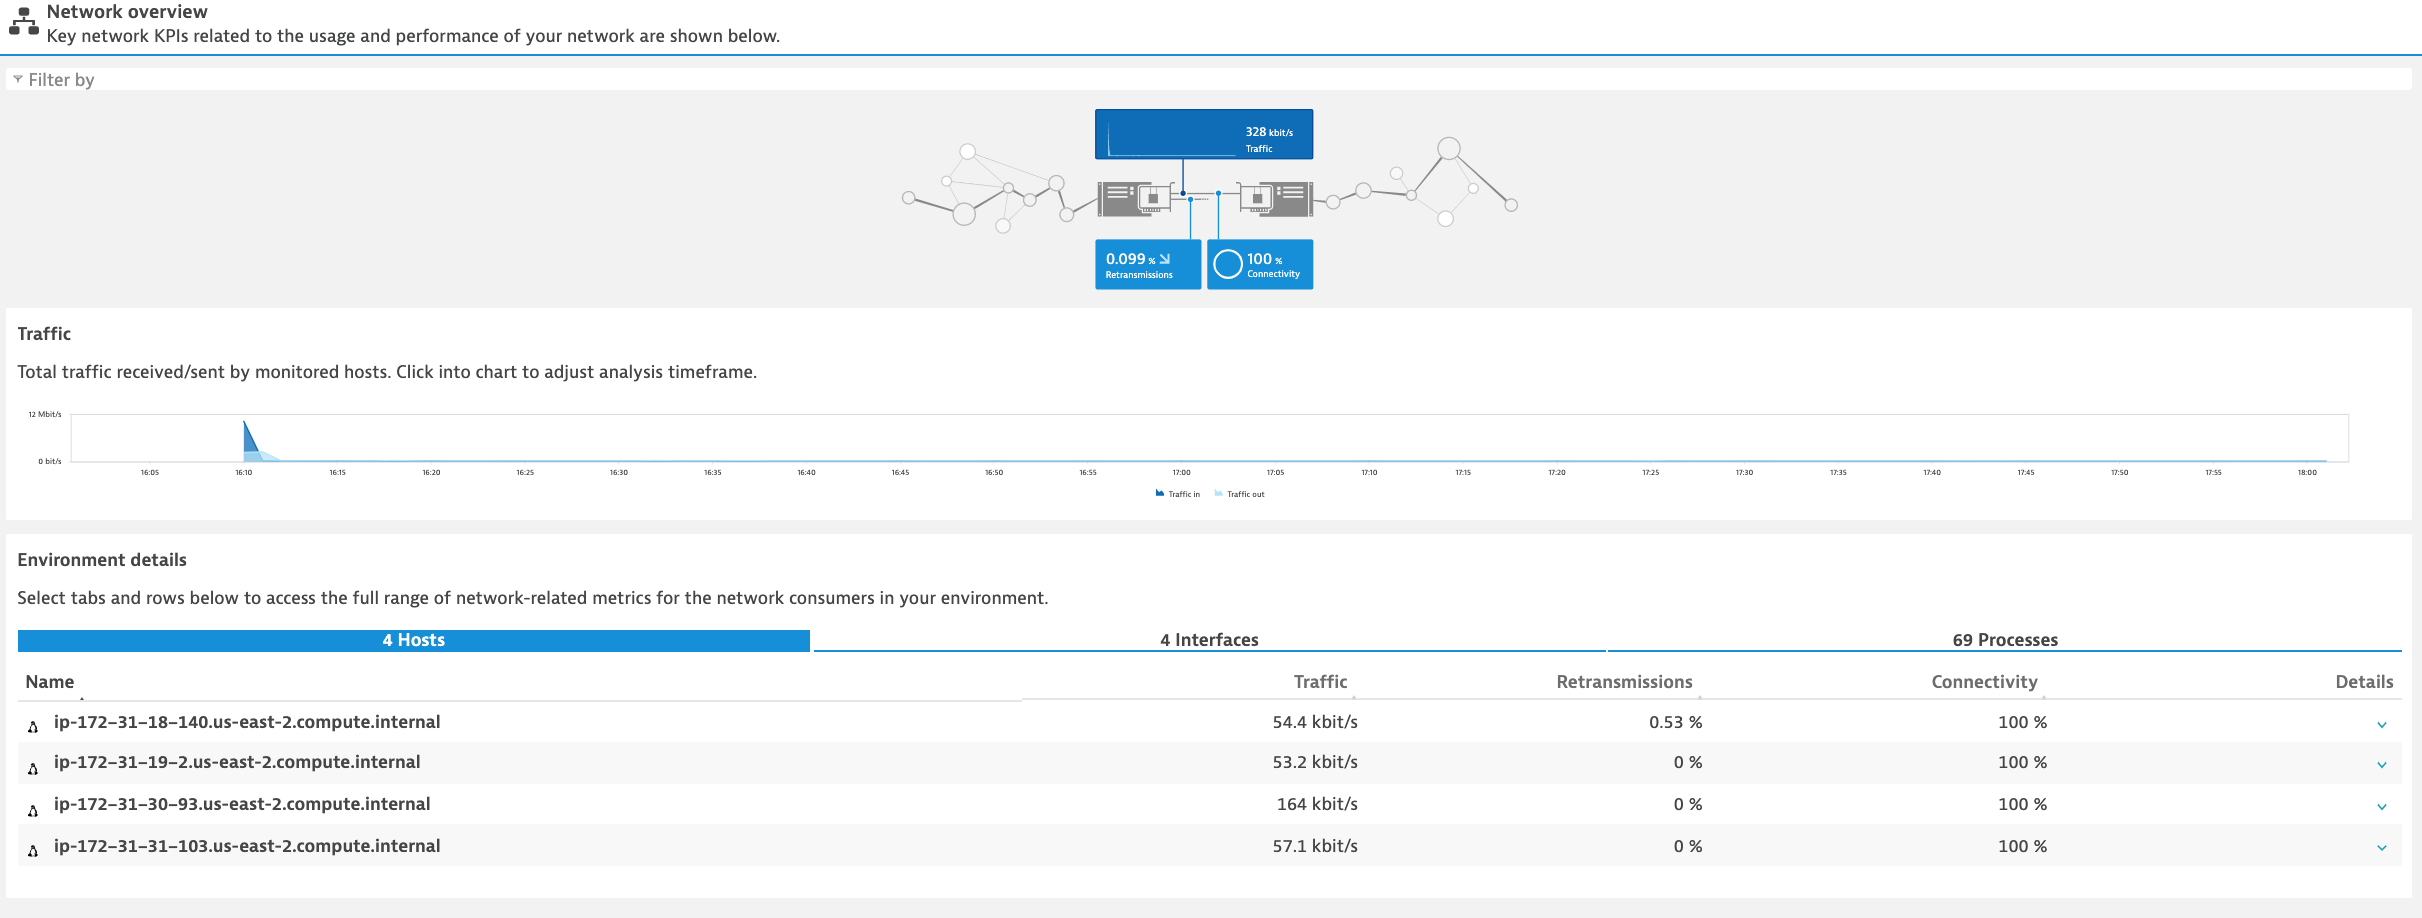
- Network - Dynatrace monitors and visualizes process-specific network performance metrics like requests and retransmissions to proactively identify connection issues.
- Technologies - Dynatrace detects and monitors over 120 technologies (clouds, applications, databases, web, integrations, etc.)
- VMware - Dynatrace monitors and visualizes your VMware environments to understand the relationships between components such as ESXi hosts and your vCenter platform as a whole.
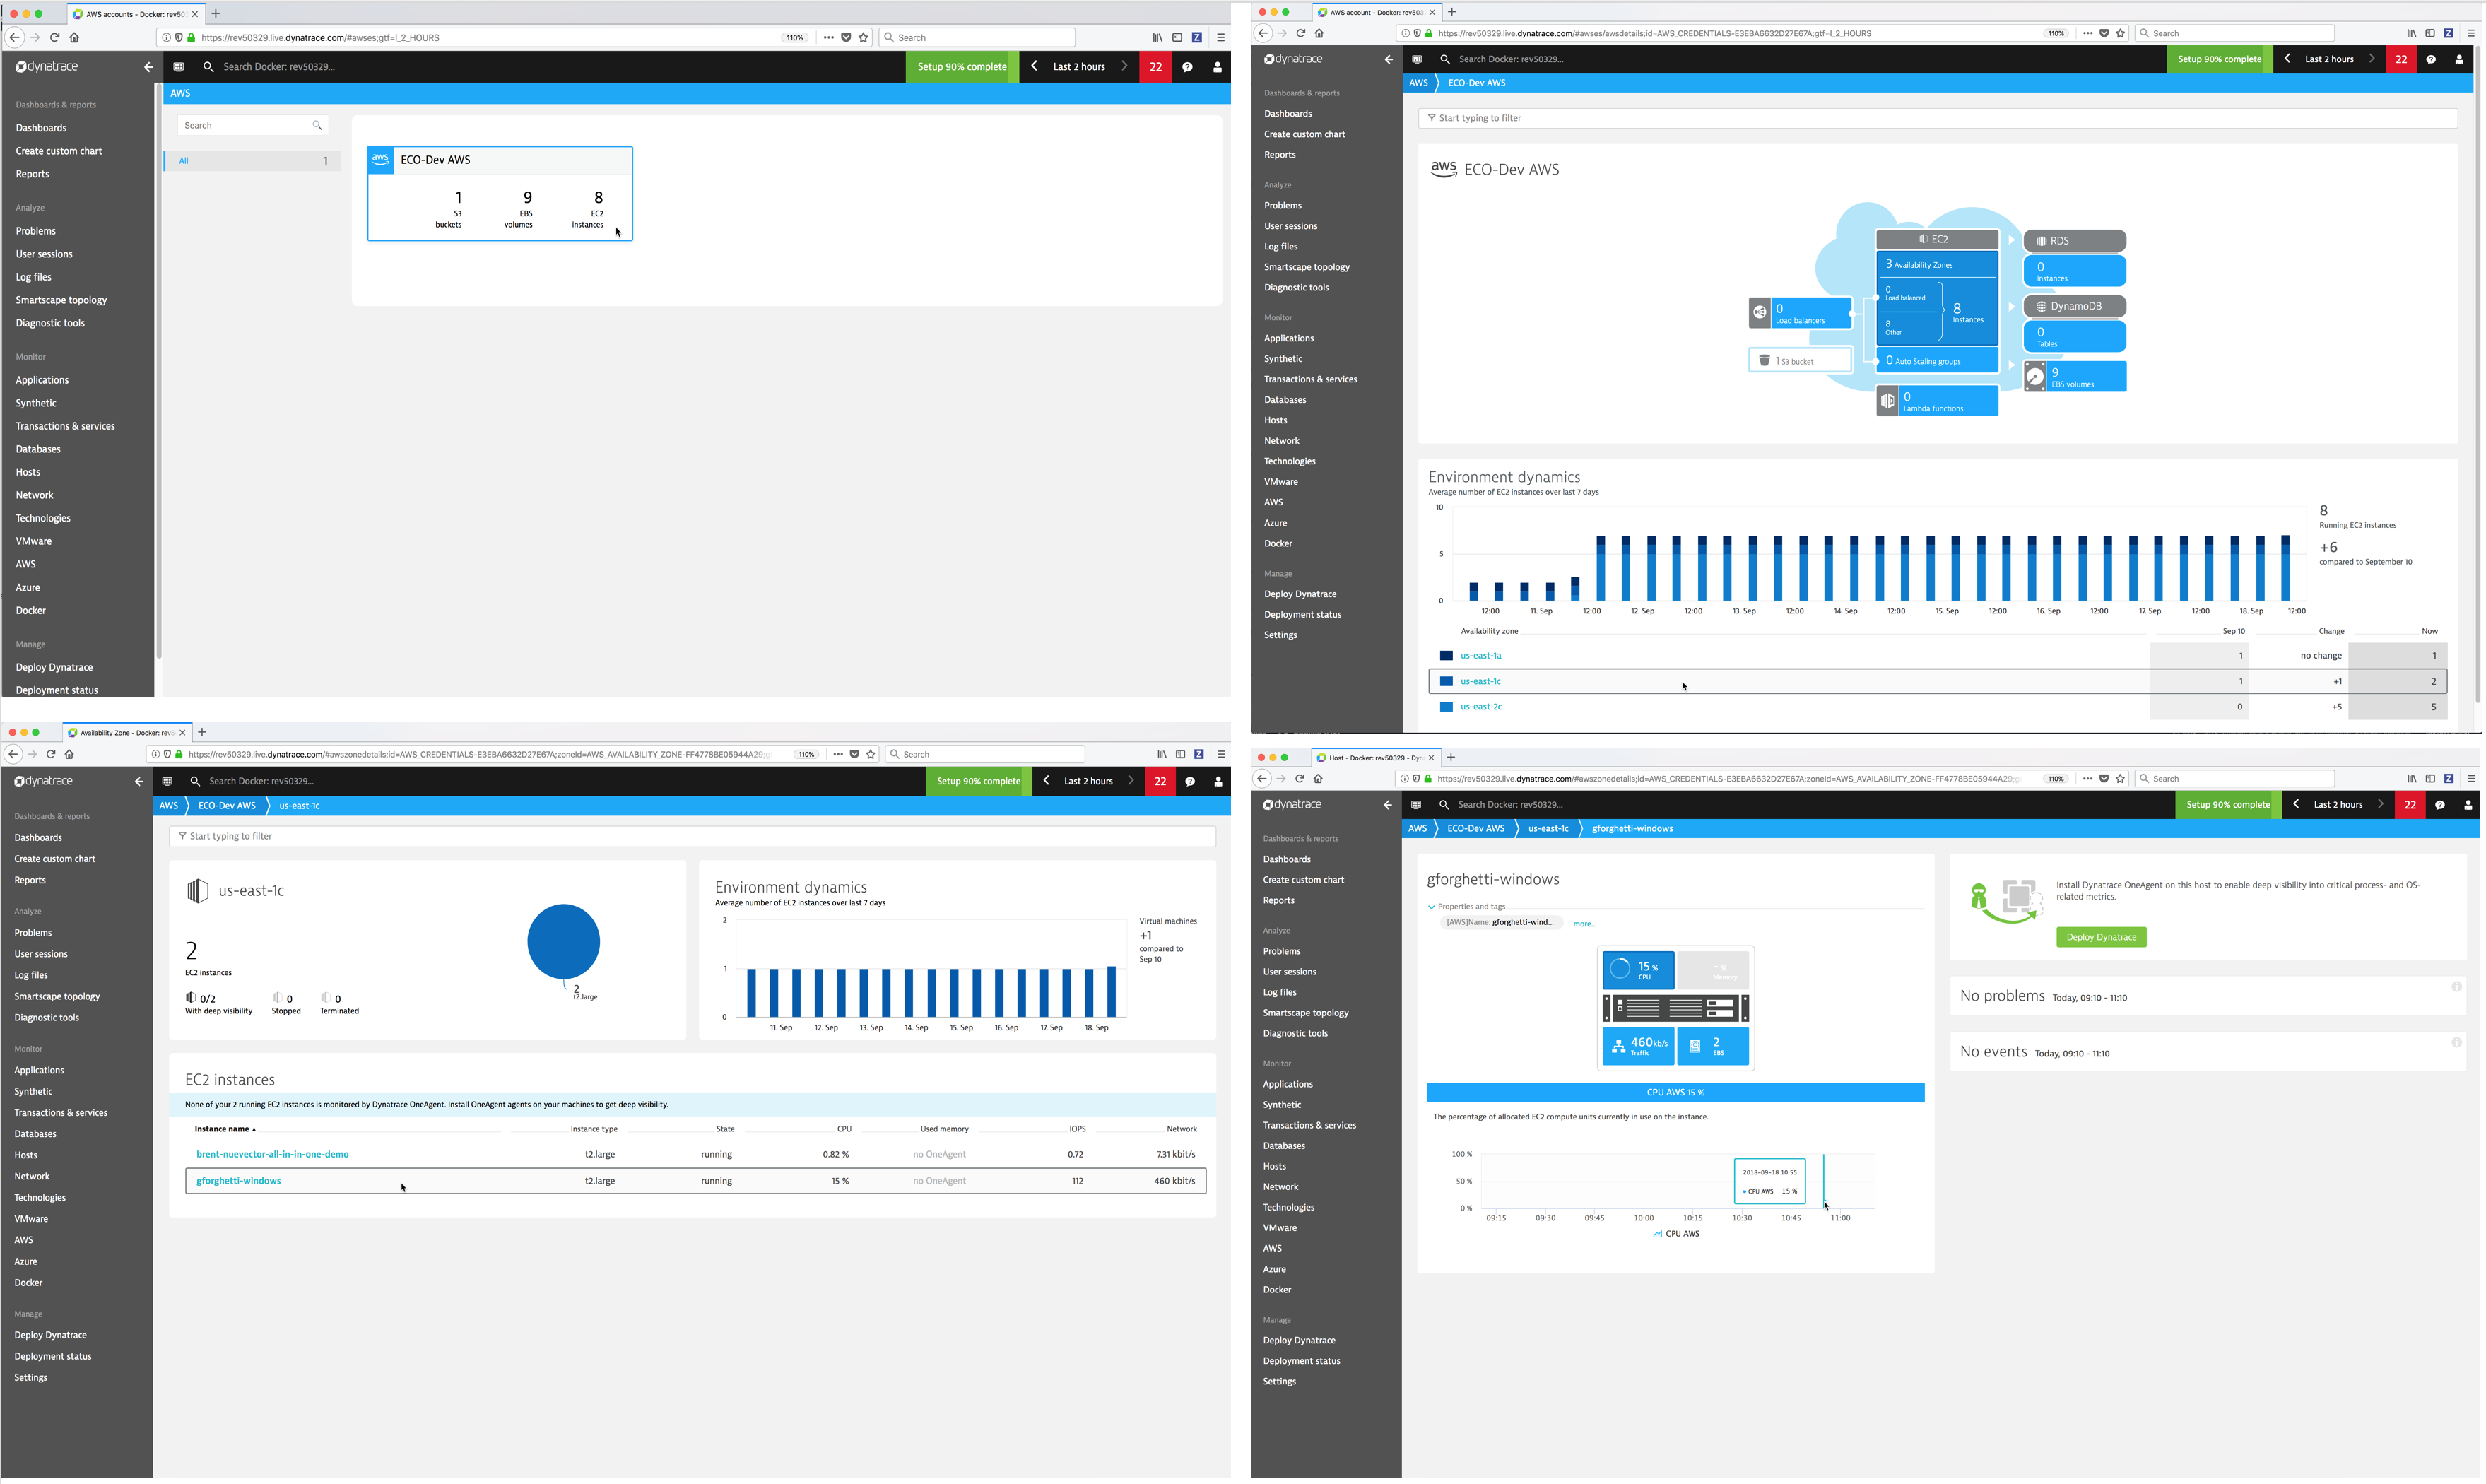
- AWS - Dynatrace monitors and visualizes services running in the Amazon Web Services Cloud.
- Azure - Dynatrace monitors and visualizes services running in the Microsoft Azure Cloud.
- Docker - Dynatrace offers full-featured Docker monitoring and provides you with a complete picture of your Dockerized environments.
Manage
- Deploy Dynatrace - Simple wizard to walk you through deploying the Dynatrace agent.
- Deployment status - Display status of the deployed Dynatrace agents.
- Settings - Configure Dynatrace monitoring settings from the Dynatrace Web UI.
Settings
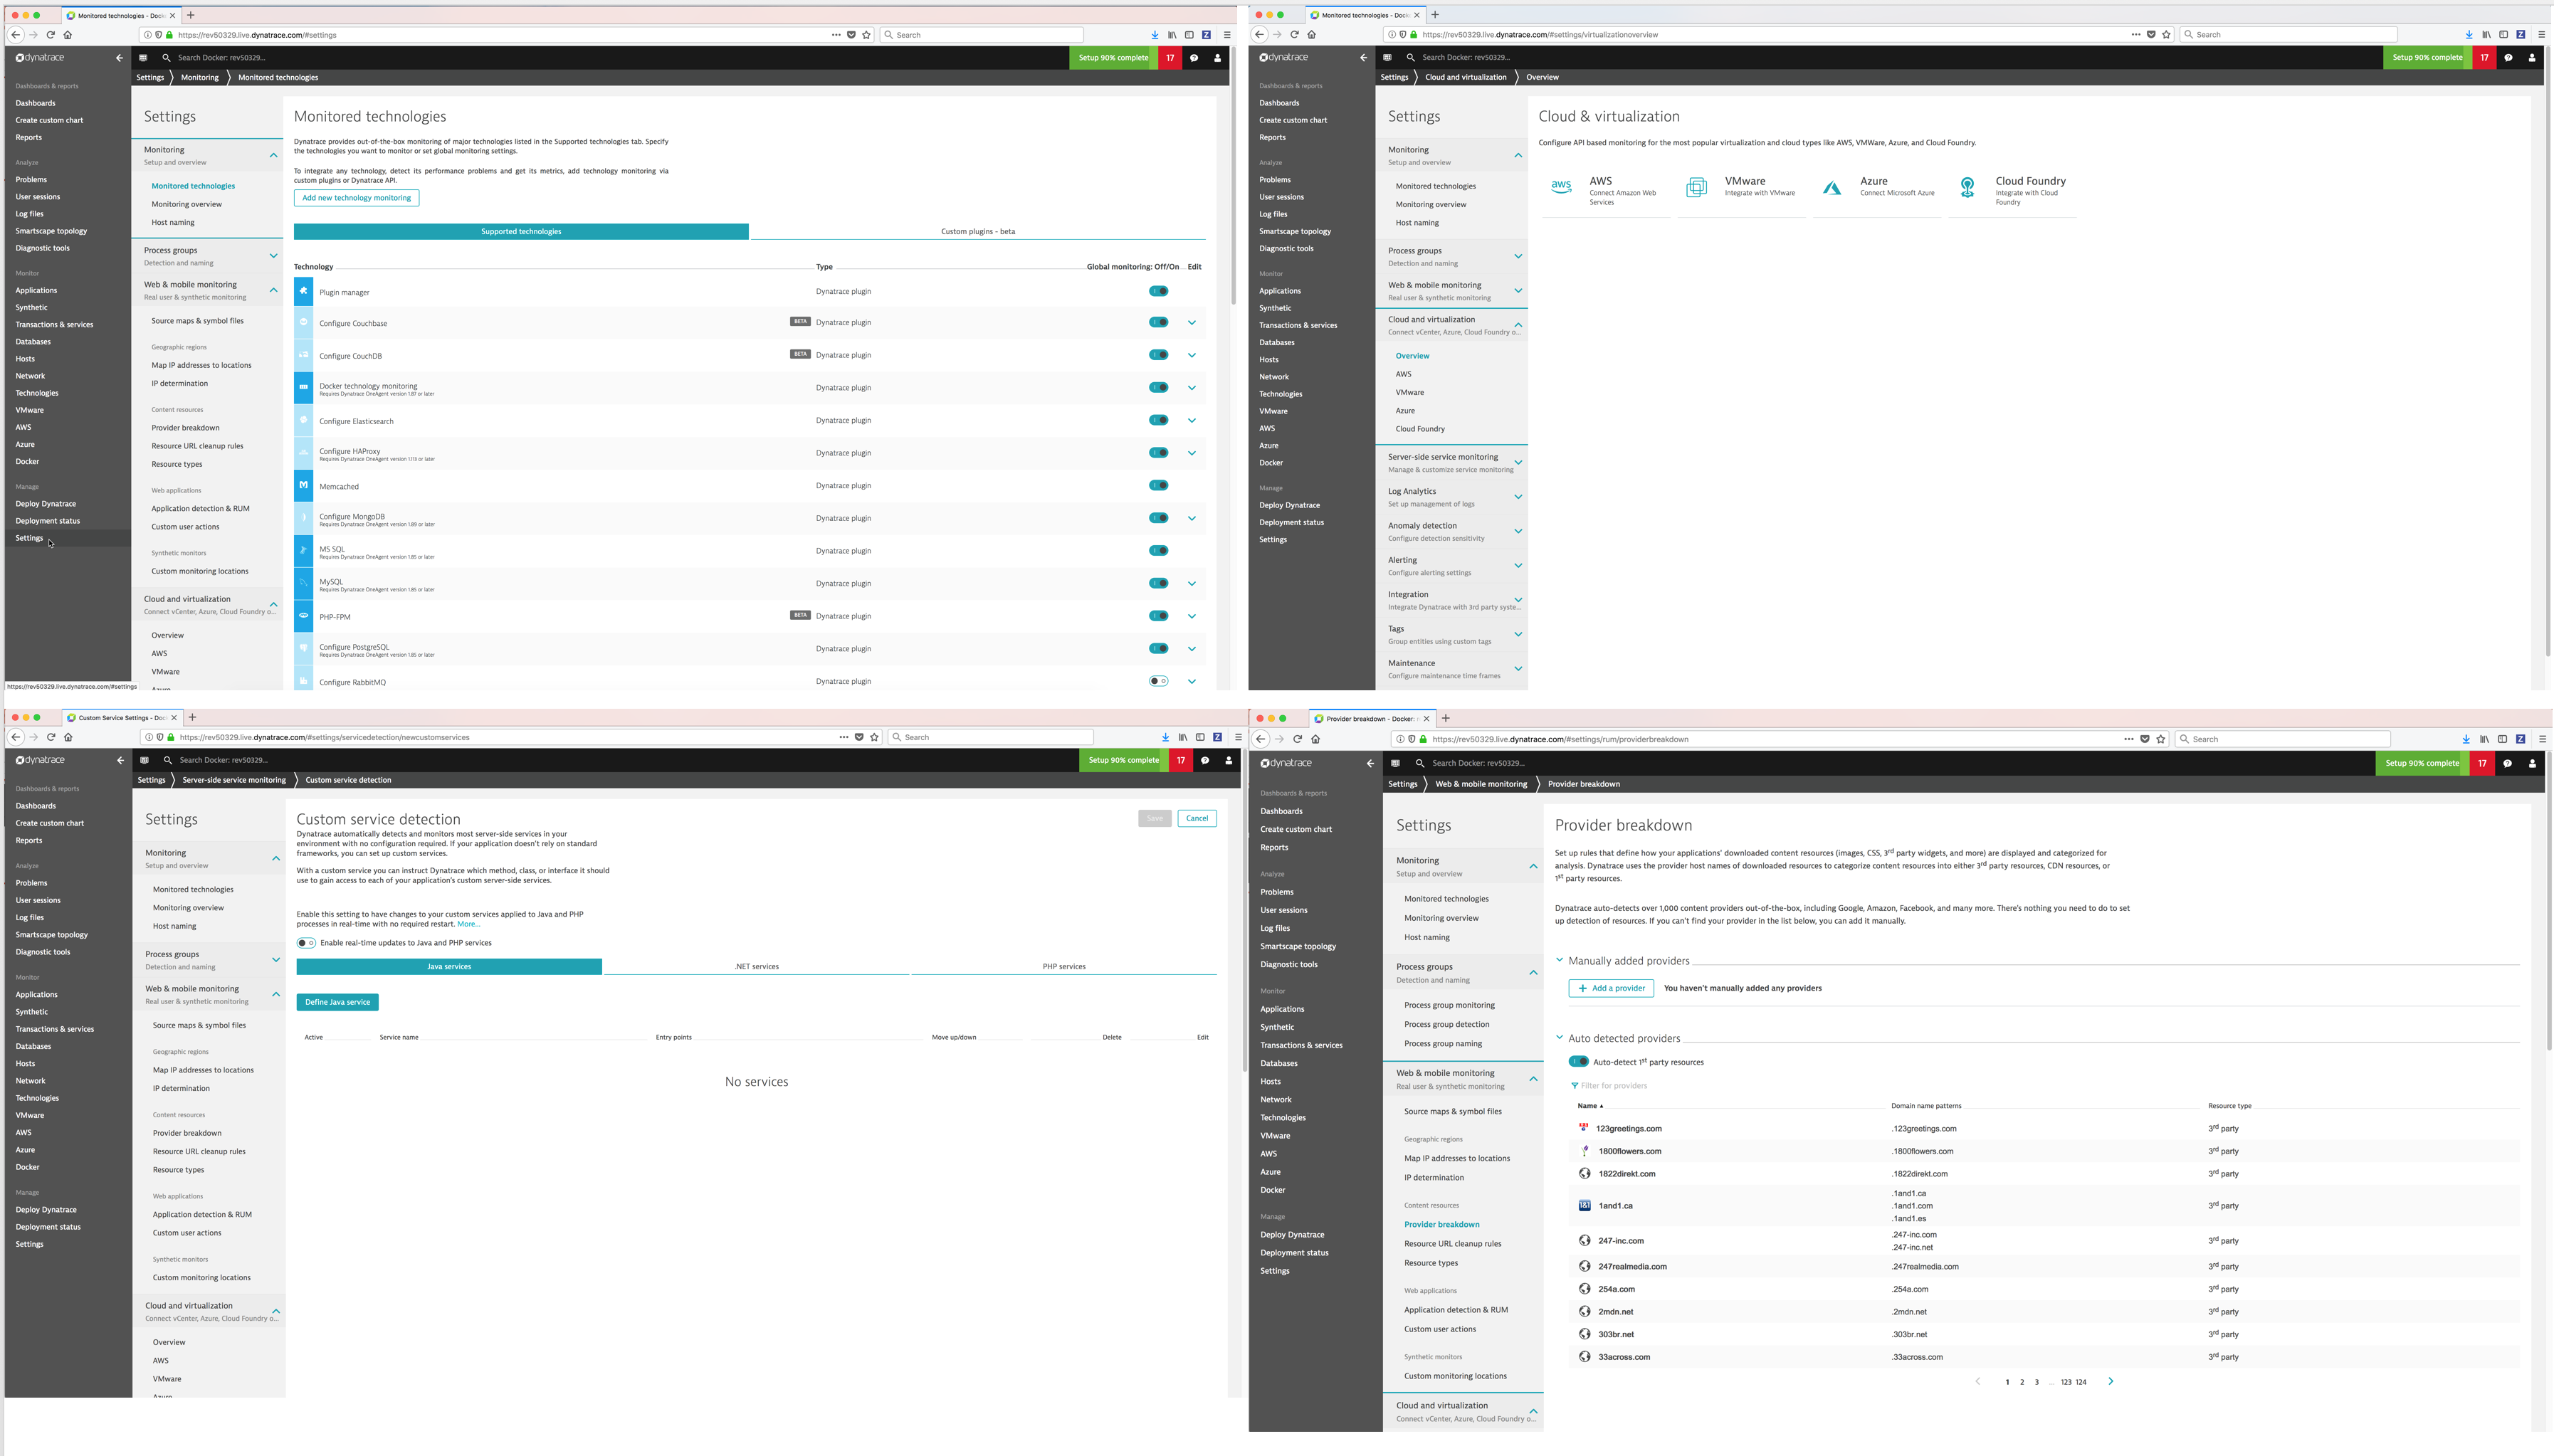
You can configure and customize Dynatrace to monitor technologies and clouds and customize other settings.
Dashboards
You can monitor your infrastructure and applications using out of box dashboards and create your own.


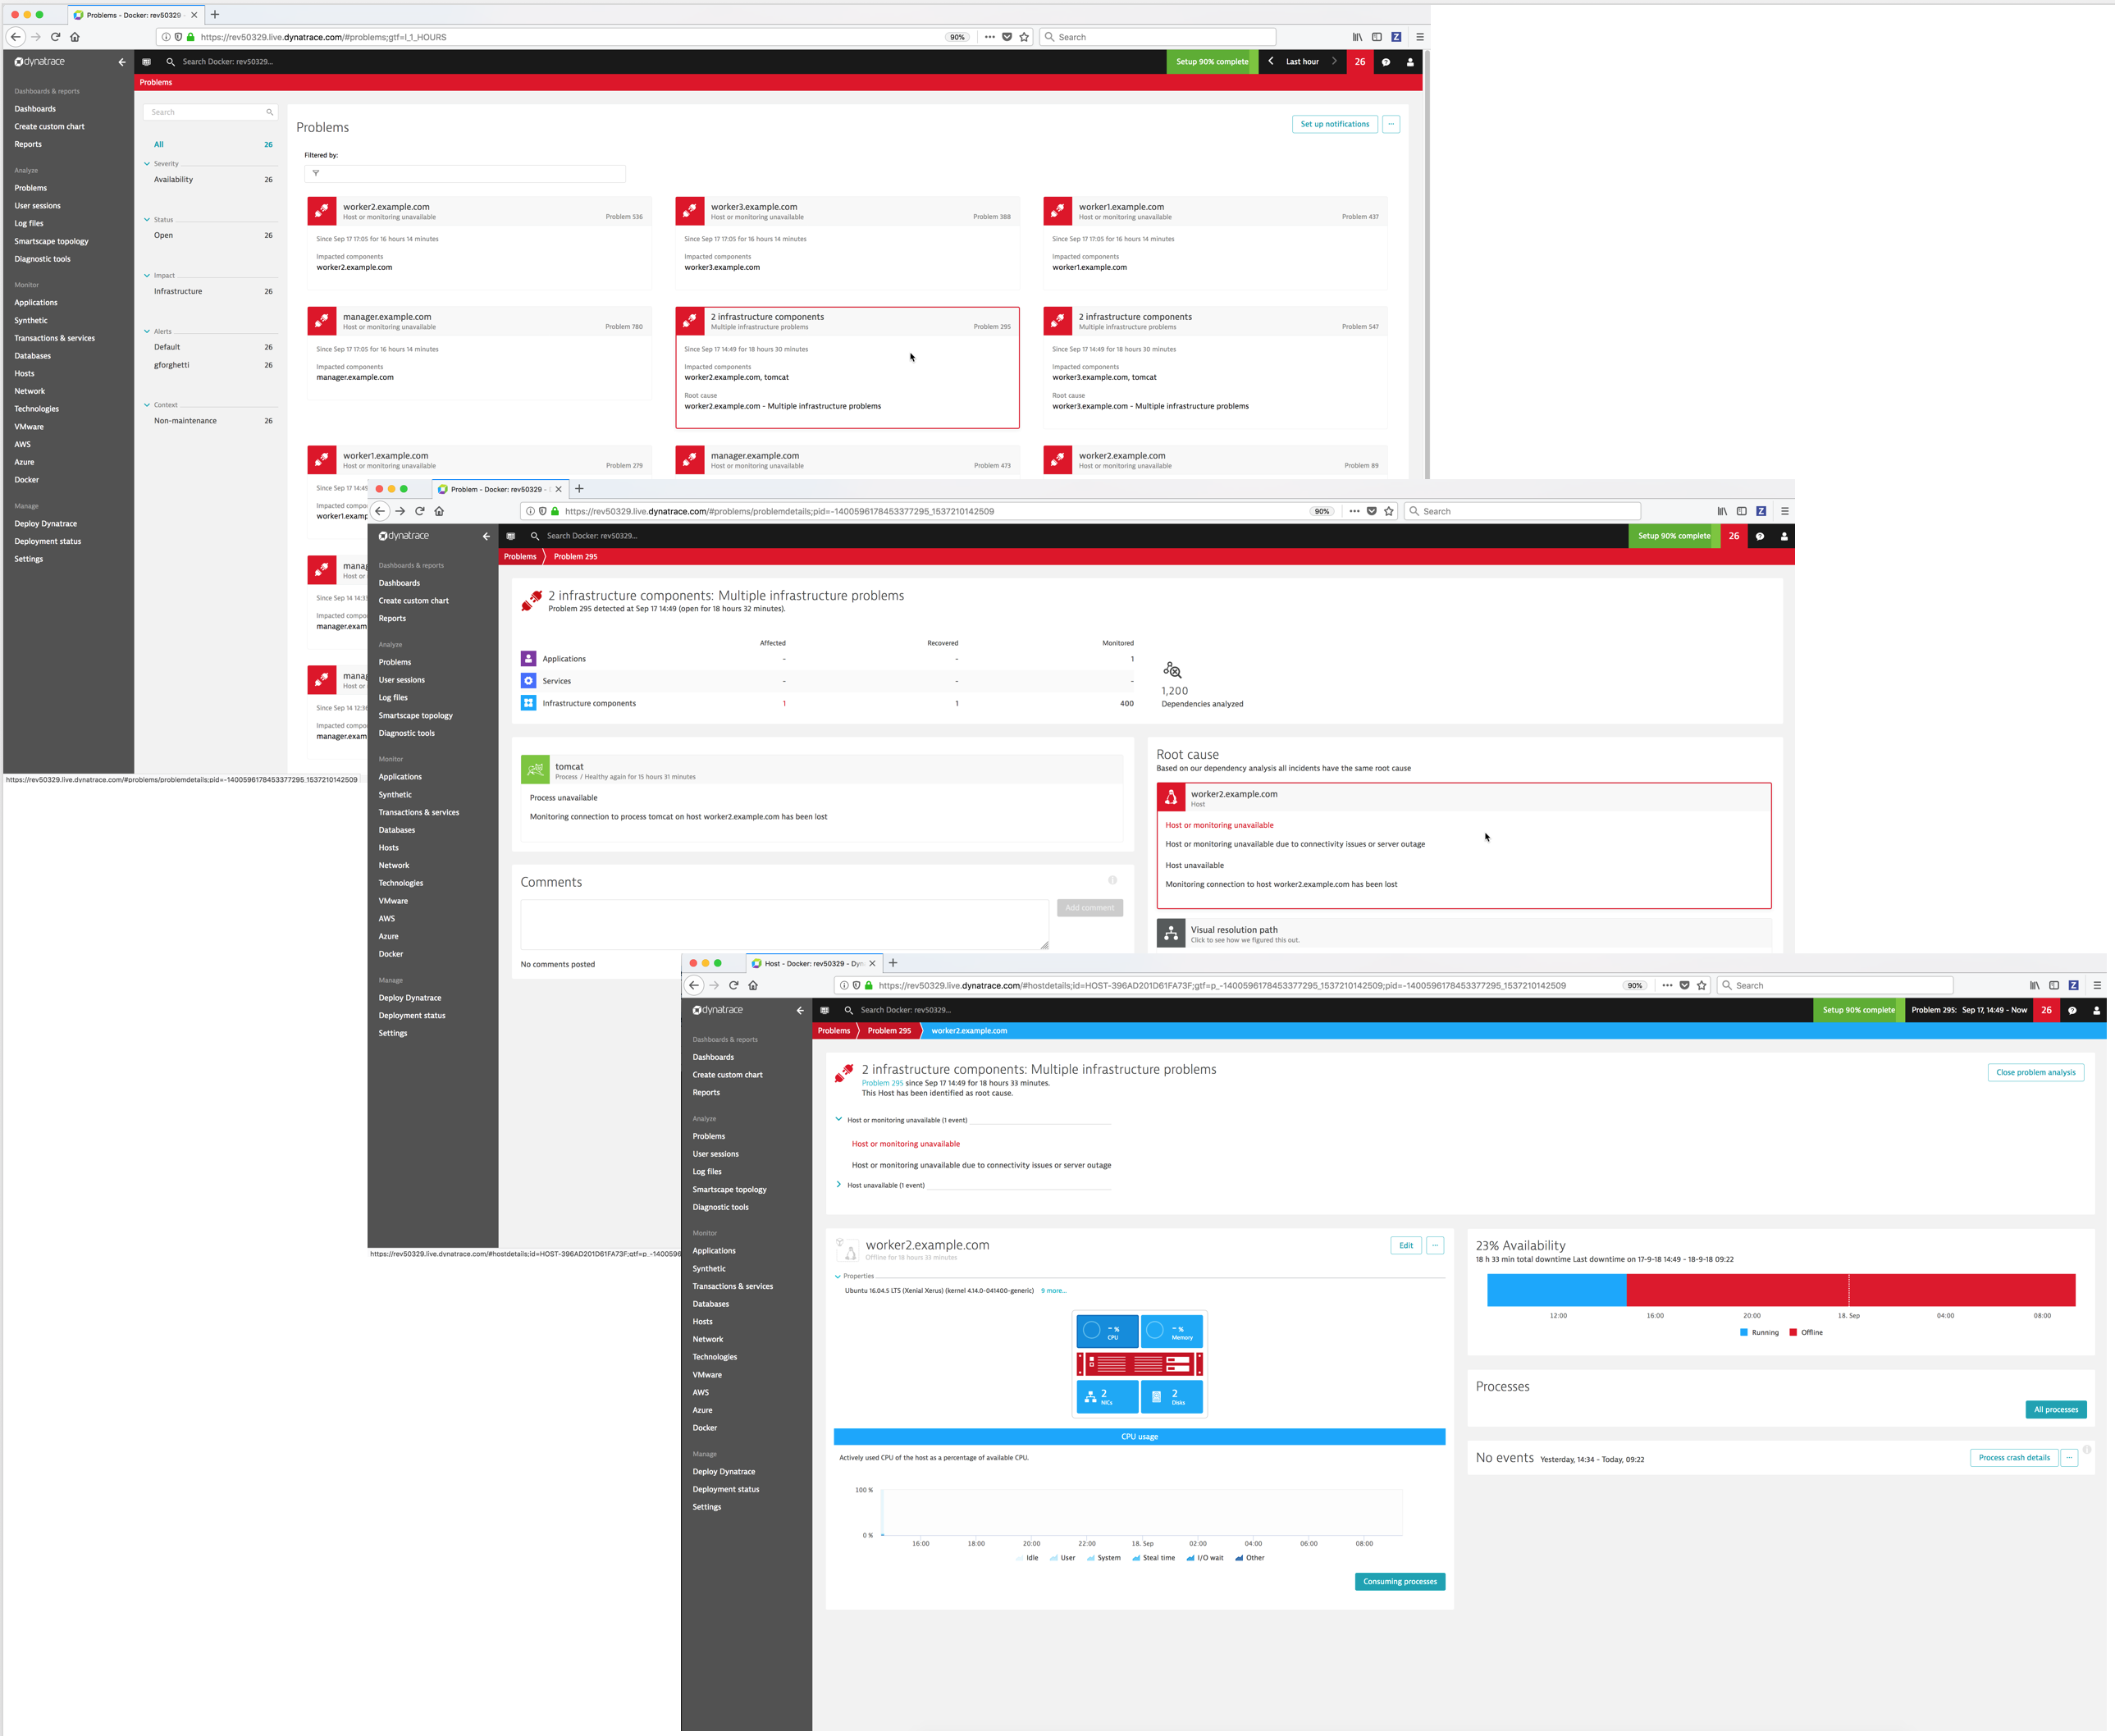
Problems
Dynatrace automatically detects performance anomalies and generates “problems” which you can view. You can display detailed information on a problem including the services impacted and the root cause.

Dynatrace Smartscape® Topology
Dynatrace automatically discovers your full technology stack and detects the dependencies between websites, applications, services, processes, hosts, networks, and cloud infrastructure within minutes. Your application topology is then visualized in an interactive infographic.
See also
Refer to Dynatrace Supported technologies for a complete updated list of the technologies it detects and supports.
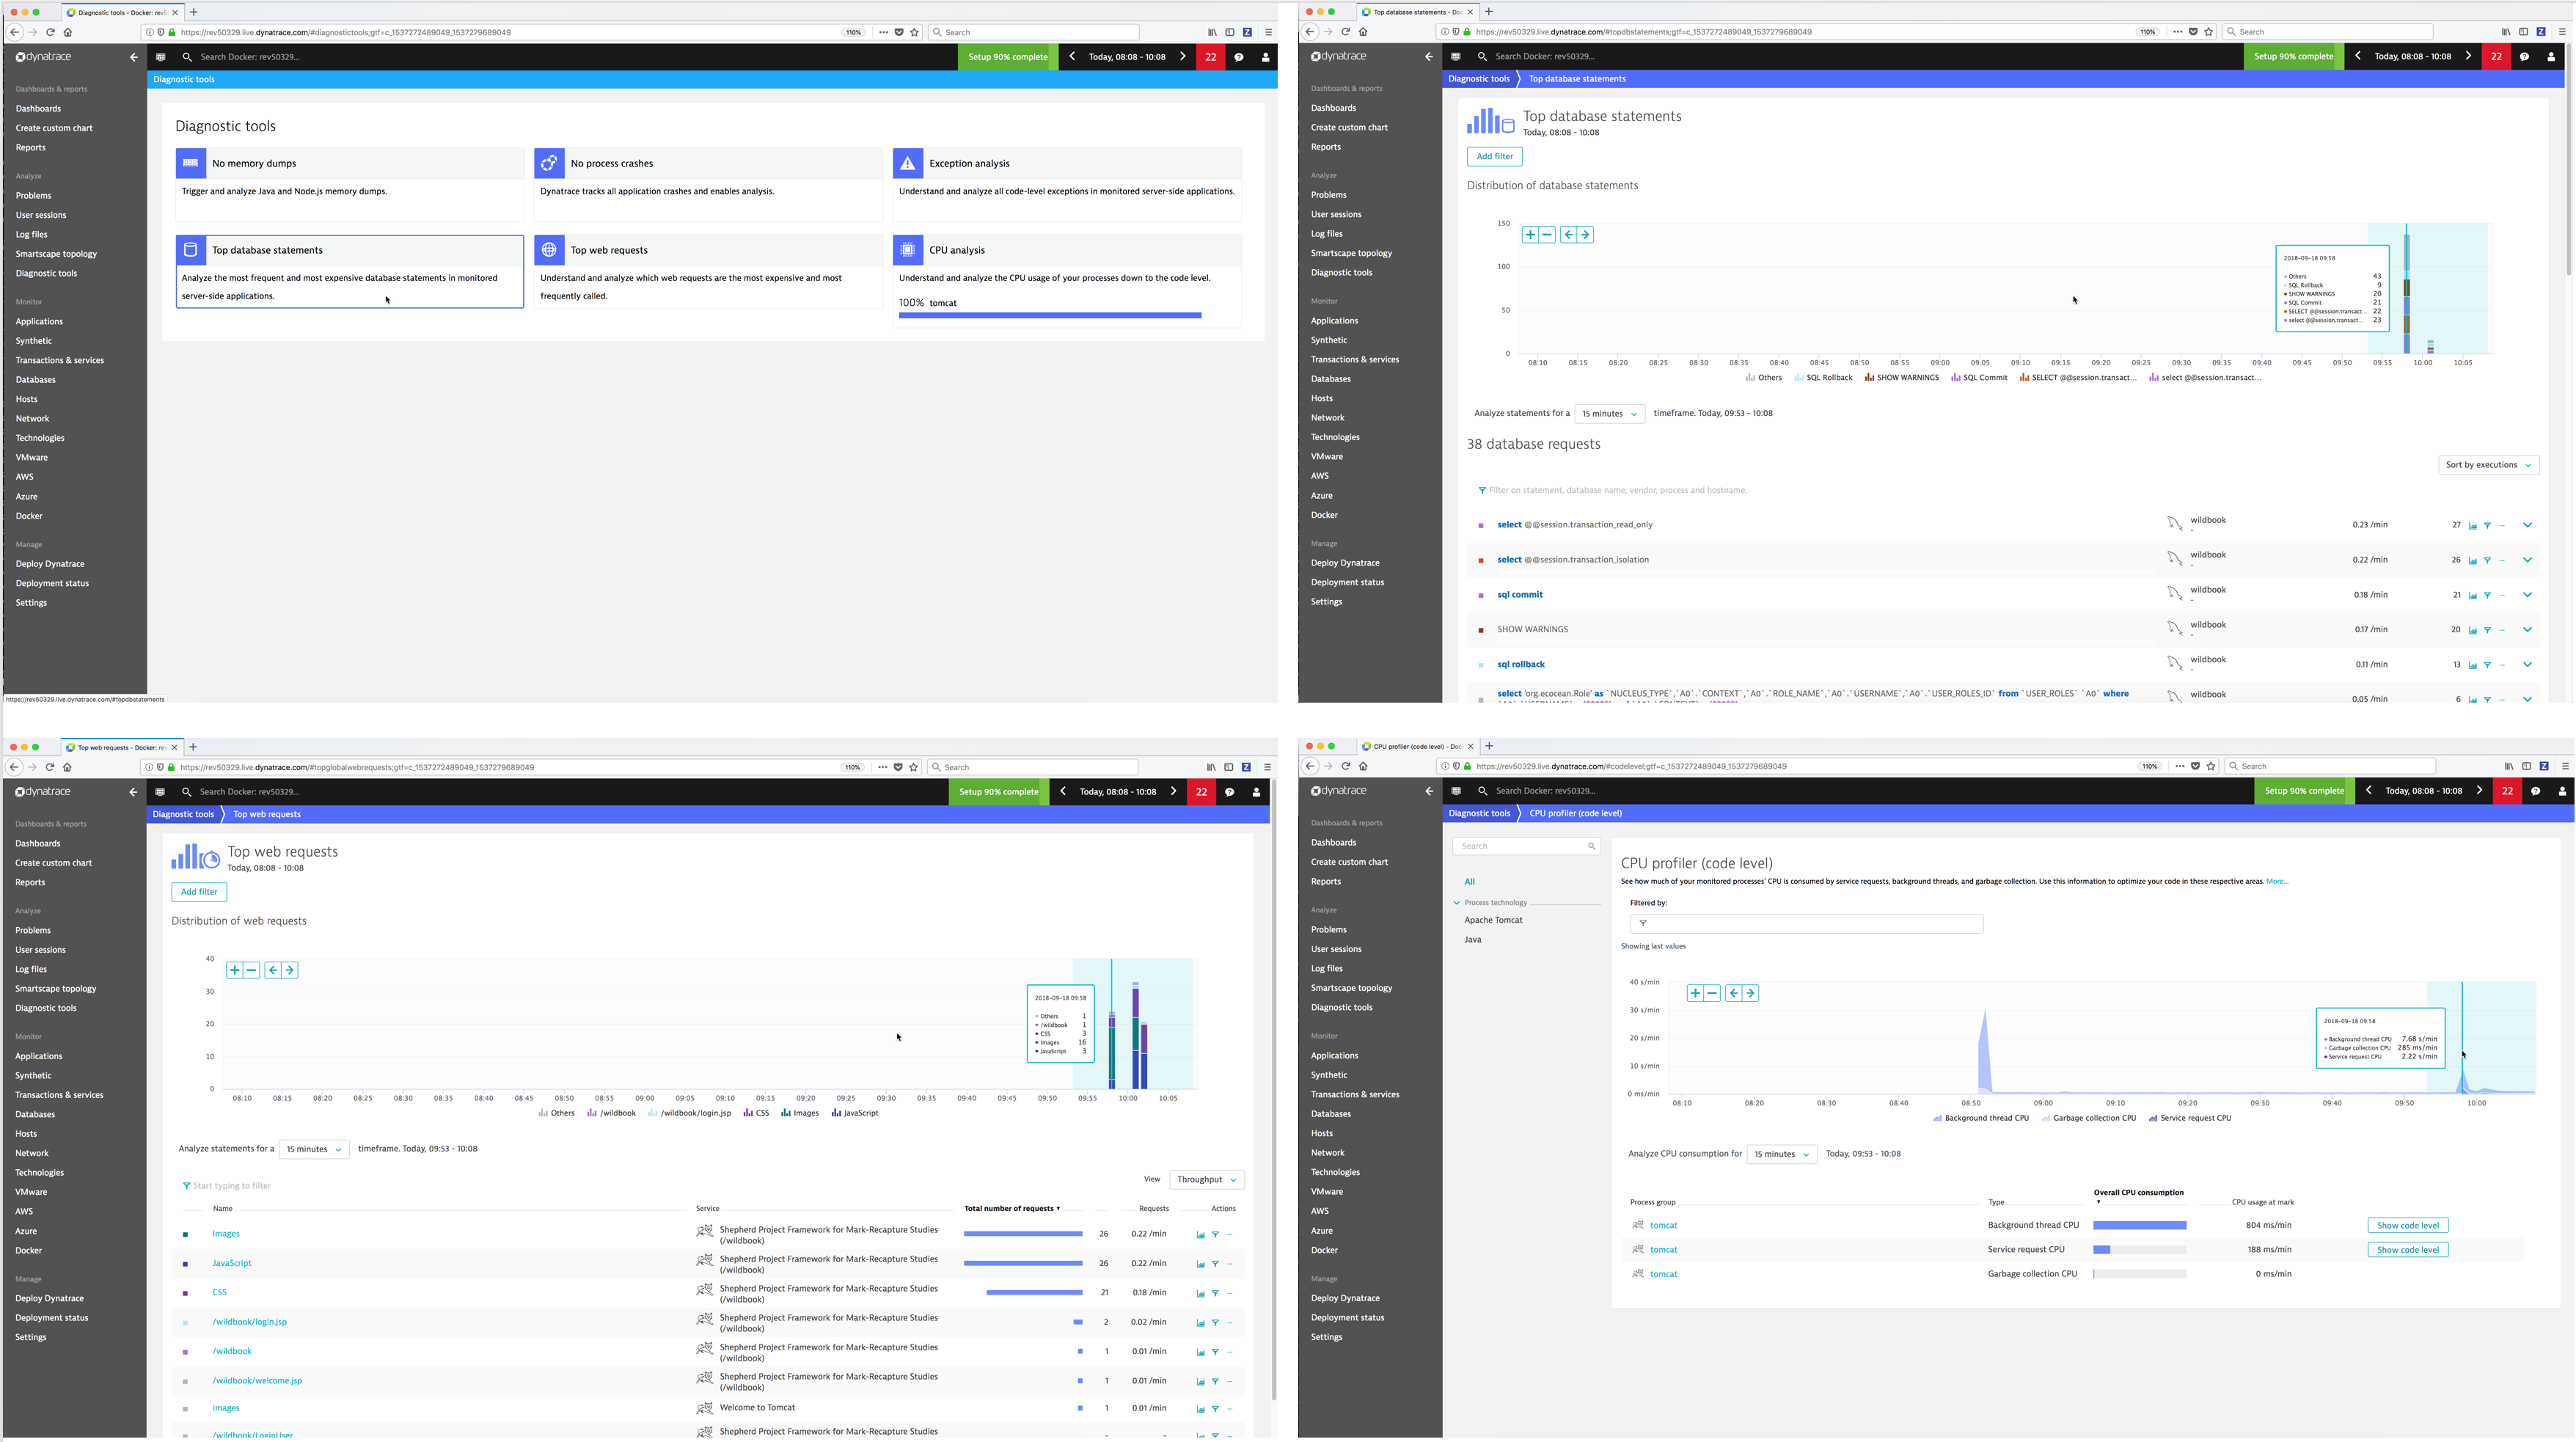
Diagnostic Tools
Dynatrace provides built-in diagnostic tools for detecting and analyzing performance problems in your application environment.
Monitor Transactions & Services
Monitor Hosts
You can display an overview of all the hosts and drill down to see the details of a specific host.
Monitor Clouds and Virtualization types
- AWS
- VMware
- Azure
Monitor Docker
Dynatrace provides you with a complete picture of your Dockerized environments. Dynatrace provides container-centric monitoring perspectives on Docker images, services, and nodes.
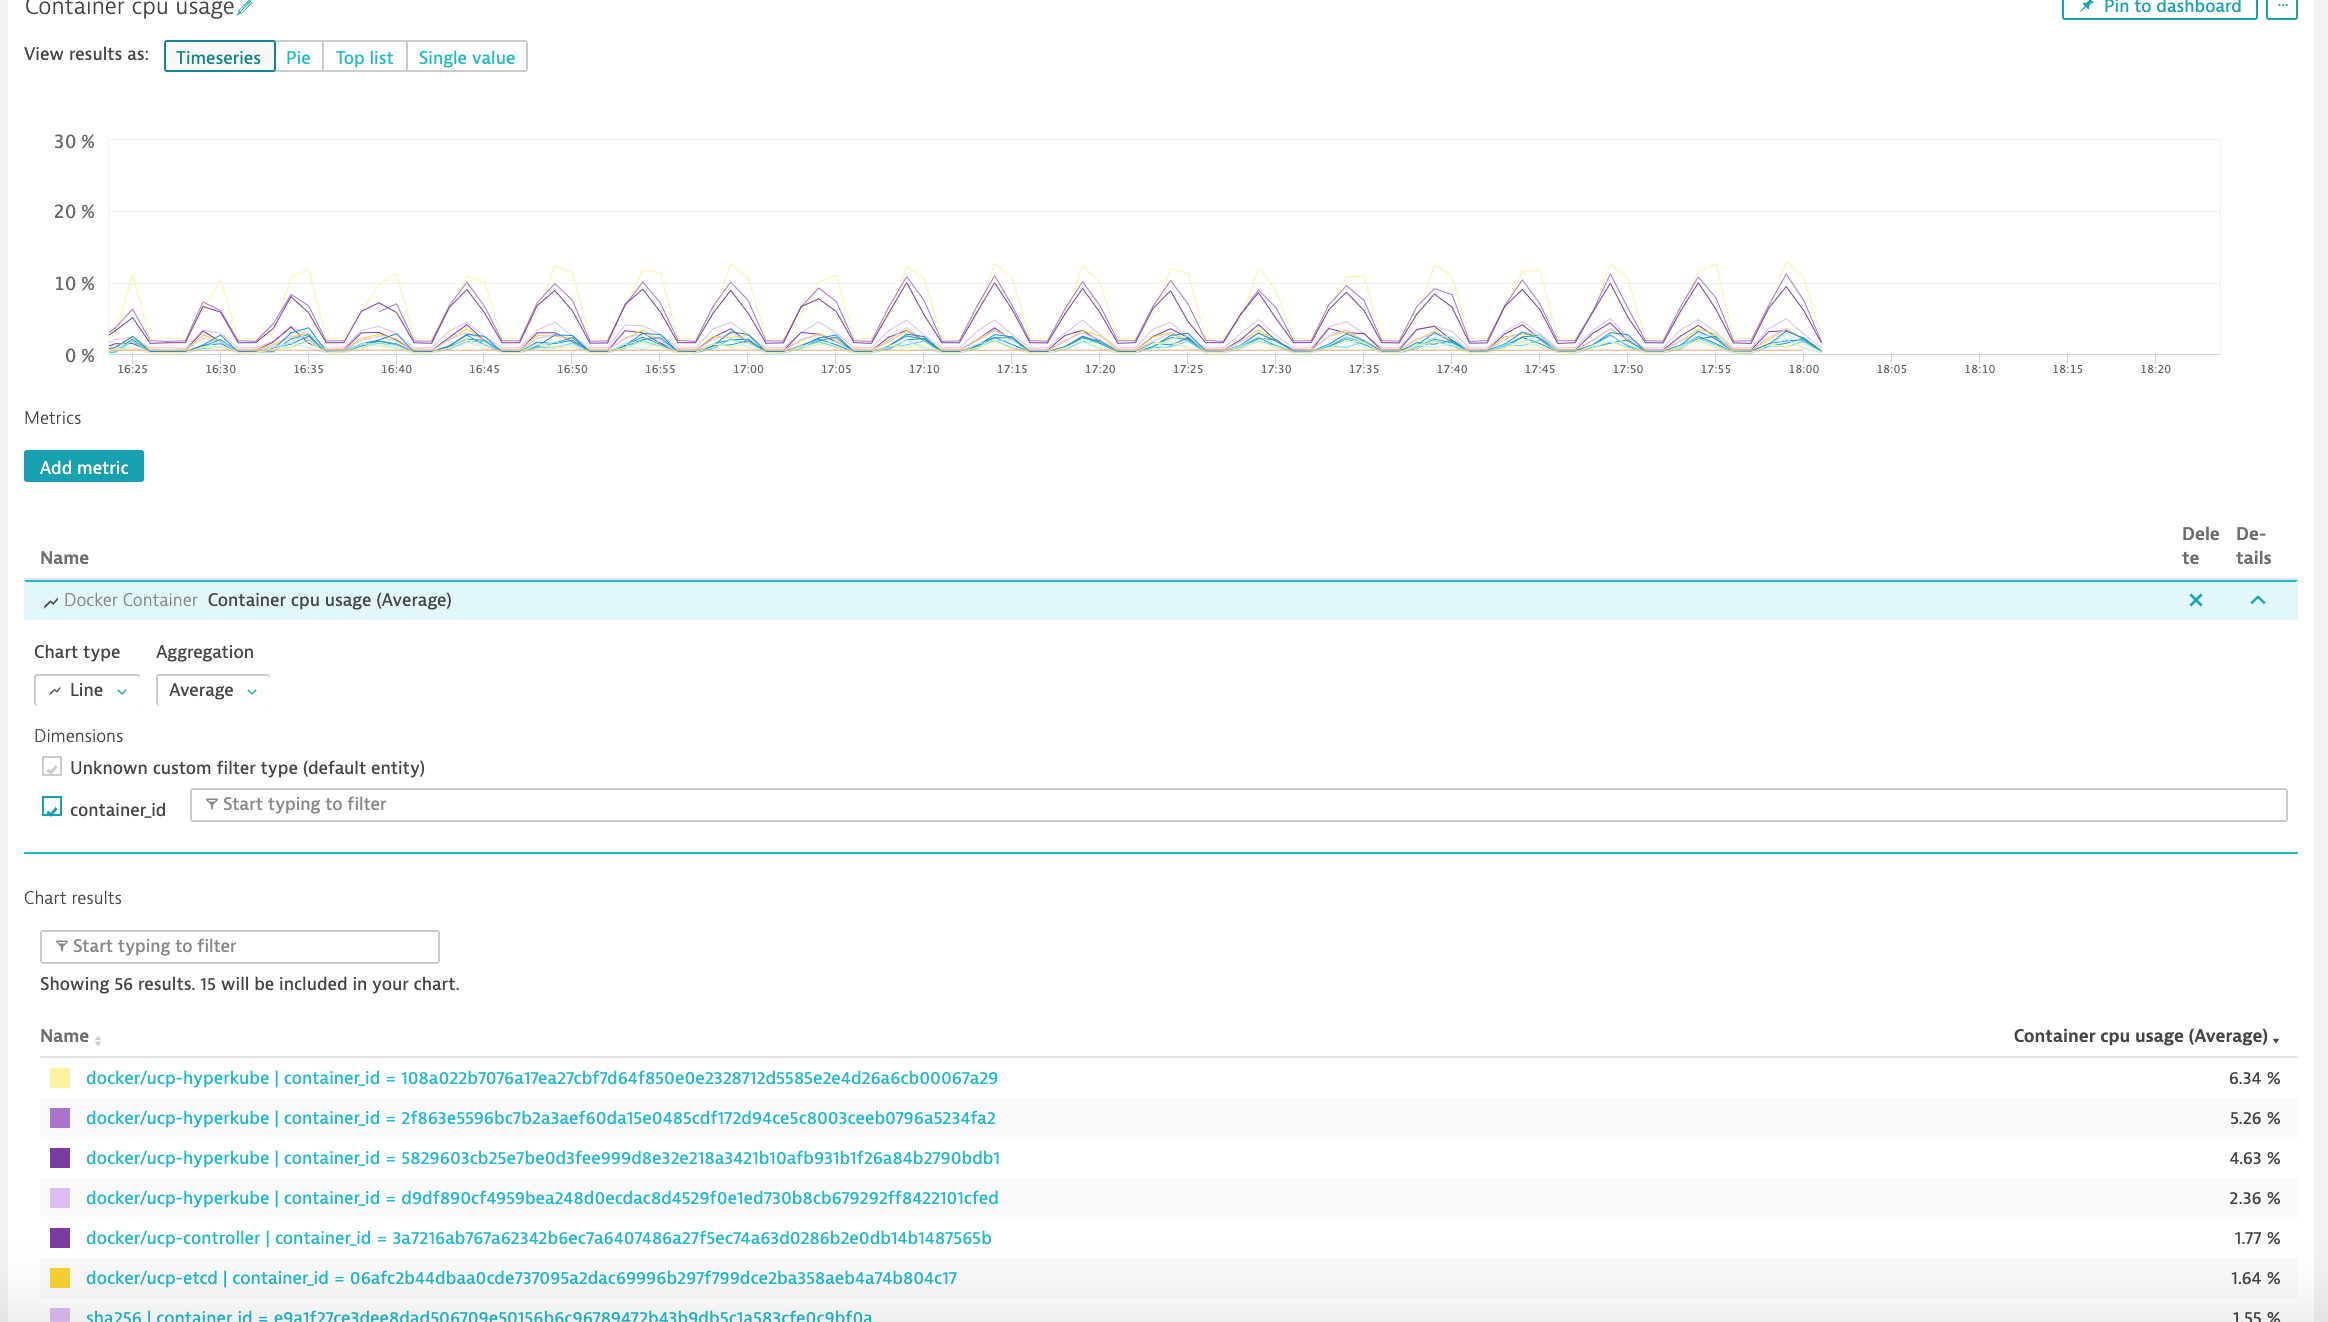
Monitor Docker nodes
You can display an overview of all Docker nodes and you can drill down to a specific Docker node to monitor CPU, Memory, Network and Disk utilization.
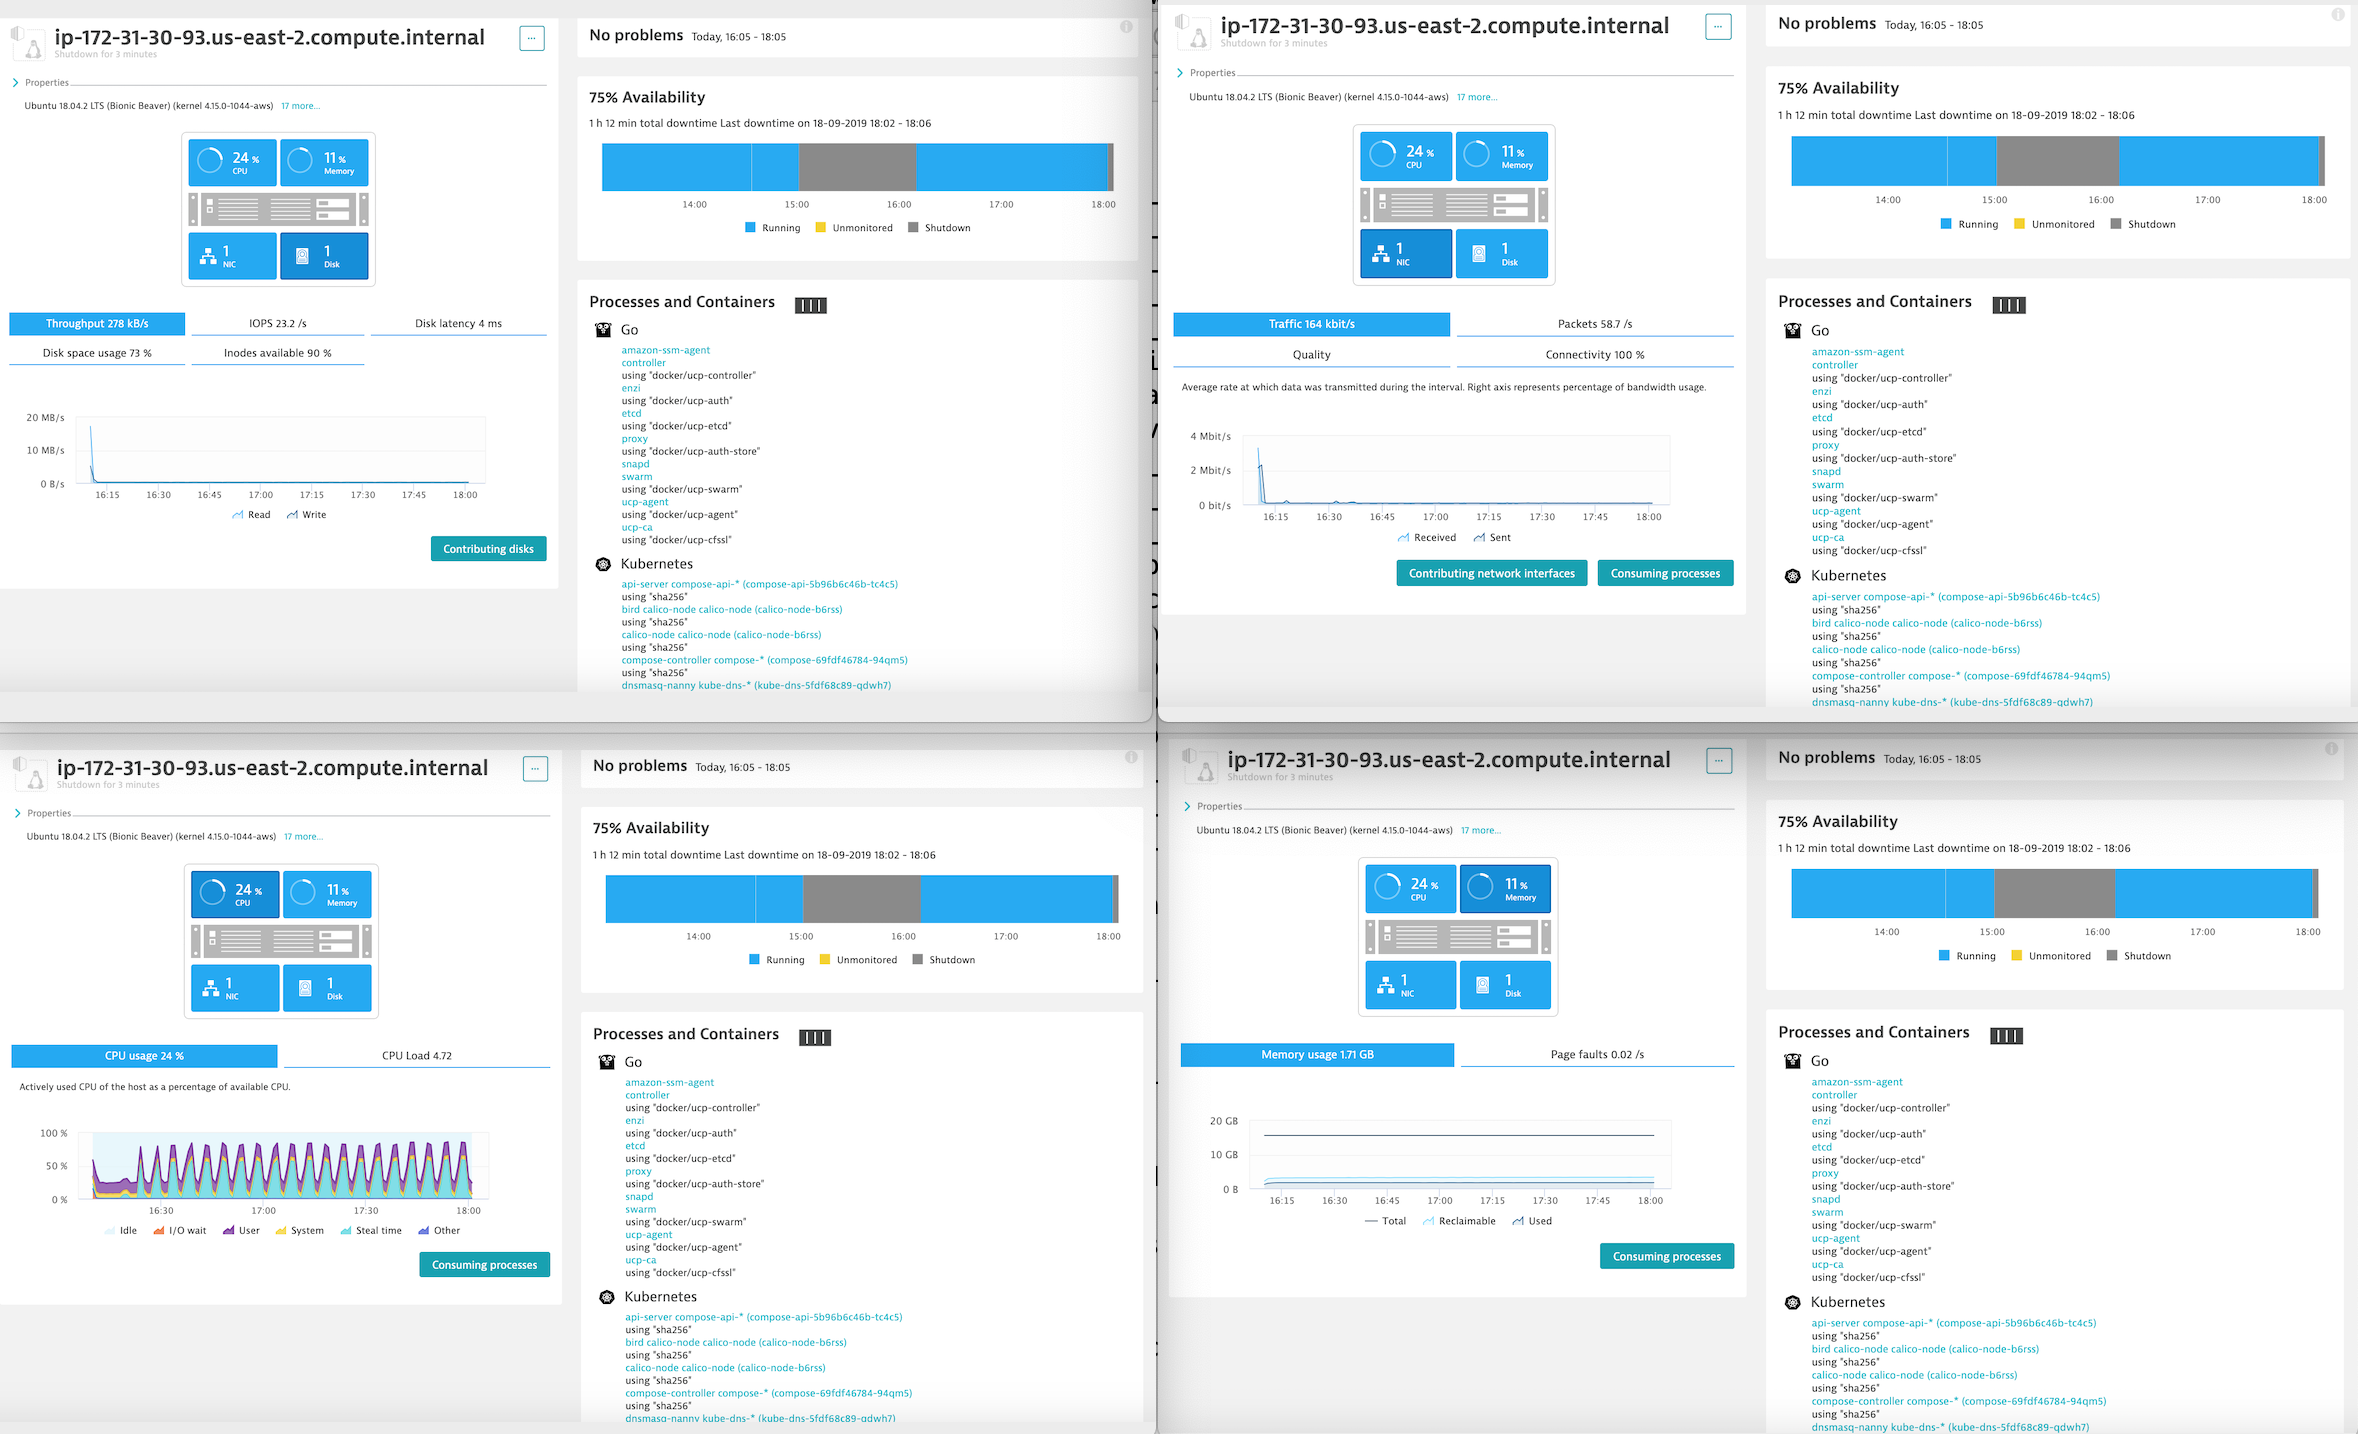
You can drill down to a specific Docker container.
Troubleshooting
See also
Refer to the following links for additional information: