StackLight LMA components
StackLight LMA components
StackLight LMA consists of the following components:
- Prometheus server
Collects and stores monitoring data. A Prometheus server scrapes metrics from Telegraf, exporters, and native endpoints, such as Calico, etcd, or Kubernetes, either directly or through Pushgateway. Prometheus stores all scraped samples in a local database and runs rules over this data to either record new time series from existing data or generate alerts. Prometheus stores the data as time series: streams of time-stamped values that belong to the same metric and the same set of labeled dimensions. Timestamps have a millisecond resolution, while values are always 64-bit floats. Prometheus has a dimensional data model. Any given combination of labels for the same metric name results in a separate time series. The Prometheus Query Language (PromQL) enables filtering and aggregation based on these dimensions. Grafana uses the data stored in Prometheus to provide graphs and charts.
The built-in alarms defined in Salt formulas detect the most critical conditions that may occur. However, using the Reclass model you can modify and override the built-in alarms as well as create custom alarms for a specific deployment. Both built-in and custom alarms use the same declarative YAML structure.
If more than one instance of Prometheus is deployed, they perform as independent Prometheus servers not connected to each other. However, these instances gather the same endpoints. Therefore, in case of any failure in one Prometheus server, another Prometheus server will contain the same data in the database.
- Alertmanager
- Handles alerts sent by client applications such as the Prometheus server. Alertmanager deduplicates, groups, and routes alerts to receiver integrations. By default, StackLight LMA is configured to send email notifications. However, you can also configure it to create Salesforce cases from the Alertmanager notifications on alerts using the Salesforce notifier service and close the cases once the alerts are resolved. Notifications can be configured separately for any alert. Alertmanager also performs silencing and inhibition of alerts.
- Alerta
- Receives, consolidates and deduplicates the alerts sent by Alertmanager and visually represents them through a simple yet effective web UI. Using Alerta, you can easily view the most recent alerts, watched alerts, as well as group and filter alerts according to your needs. Alerta uses MongoDB as a backend.
- Telegraf and exporter agents
Collect metrics from the system they are running on. Telegraf runs on every host operating system and on every VM where certain services of MCP are deployed. Telegraf collects and processes the operational data that is relevant to the scope of a node including hardware, host operating system metrics, local service checks, and measurements. Telegraf is plugin-driven and has the concept of two distinct set of plugins:
- Input plugins collect metrics from the system, services, or third-party APIs
- Output plugins write and expose metrics to various destinations
- Pushgateway
- Enables ephemeral and batch jobs to expose their metrics to Prometheus. Since these jobs may not exist long enough to be scraped, they can instead push their metrics to the Pushgateway, which then exposes these metrics to Prometheus. Pushgateway is not an aggregator or a distributed counter but rather a metrics cache. The metrics pushed are exactly the same as scraped from a permanently running program.
- Grafana
- Builds and visually represents metric graphs based on time series databases. Grafana supports querying of Prometheus using the PromQL language.
- Long-term storage system
Uses one of the following set of components to store the data for further analysis:
- Prometheus long-term storage that scrapes all data from the Prometheus server. This historical data can then be used for analytics purposes. Prometheus Relay adds a proxy layer to Prometheus to merge the results from underlay Prometheus servers to prevent gaps in case some data is missing on some servers. Grafana uses the data from Prometheus long-term storage. This approach is used by default.
- InfluxDB Deprecated in Q4`18 long-term storage that scrapes the data using the remote storage adapter. This historical data can then be used for analytics purposes. InfluxDB Relay adds a basic high availability layer to InfluxDB by replicating the InfluxDB data to a cluster of InfluxDB servers.
- Logging system
Responsible for collecting, processing, and persisting the logs. The logging system components include:
- Fluentd (log collector), which parses logs, sends them to Elasticsearch, generates metrics based on analysis of incoming log entries, and exposes these metrics to Prometheus. Fluentd runs on every node in a cluster.
- Elasticsearch, which stores logs and notifications, and Elasticsearch Curator, which maintains the data (indexes) in Elasticsearch by performing such operations as creating, closing, or opening an index as well as deleting a snapshot. Additionally, Elasticsearch Curator can also manage the data retention policy in Elasticsearch clusters. Elasticsearch Curator runs on each Elasticsearch node within the log storage nodes.
The metrics derived from logs are used to alert the operator upon abnormal conditions such as a spike of HTTP 5xx errors. Elasticsearch receives and indexes the logs for viewing and searching in Kibana.
- Gainsight integration service Deprecated since 2019.2.9
You can integrate StackLight LMA with Gainsight. Gainsight integration service queries Prometheus for the following metrics data, combines the data into a single CSV file, and sends the file to the Salesforce Gainsight extension through API:
- The amount of vCPU, vRAM, and vStorage used and available
- The number of VMs running, compute nodes, and tenants/projects
- The availability of Cinder, Nova, Keystone, Glance, and Neutron
By default, Gainsight integration service sends the data to API once per day. Mirantis uses the collected data for further analysis and reports to improve the quality of customer support. The CSV files are stored under
/srv/volumes/local/gainsight/csvon themonnodes for 180 days by default.- Prometheus Elasticsearch exporter [0]
- Allows presenting the Elasticsearch data as Prometheus metrics by periodically sending configured queries to the Elasticsearch cluster and exposing the results to a scrapable HTTP endpoint like other Prometheus targets.
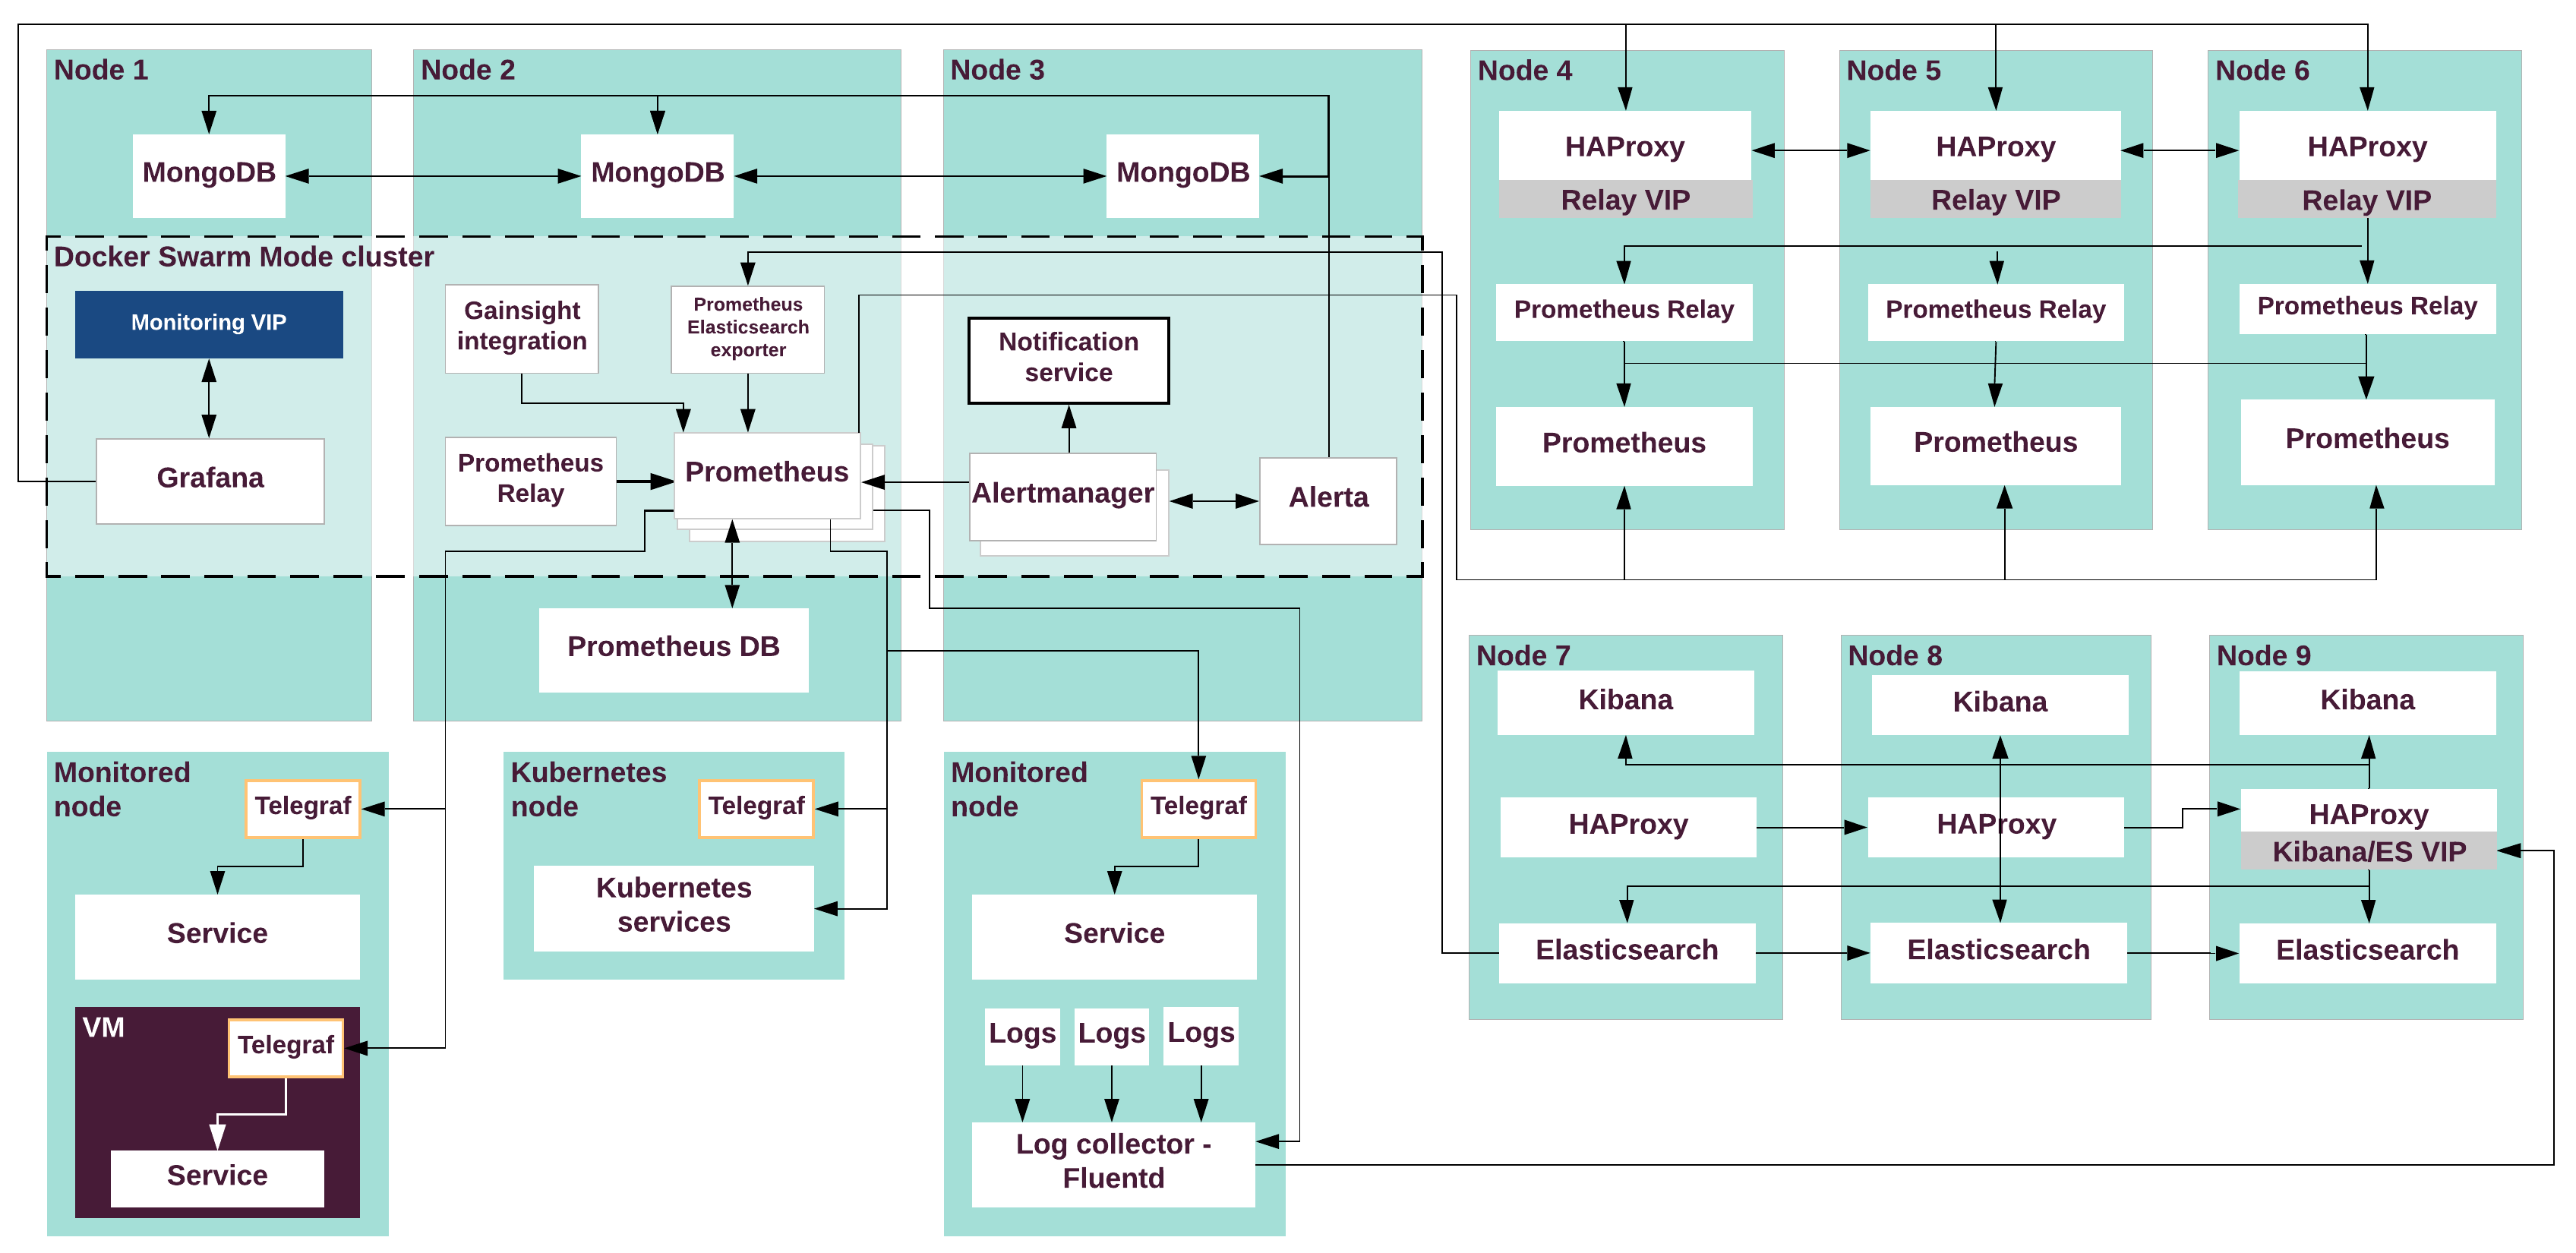
The following diagram illustrates data flow and connections between the StackLight LMA services. Prometheus long-term storage is illustrated as the default option.
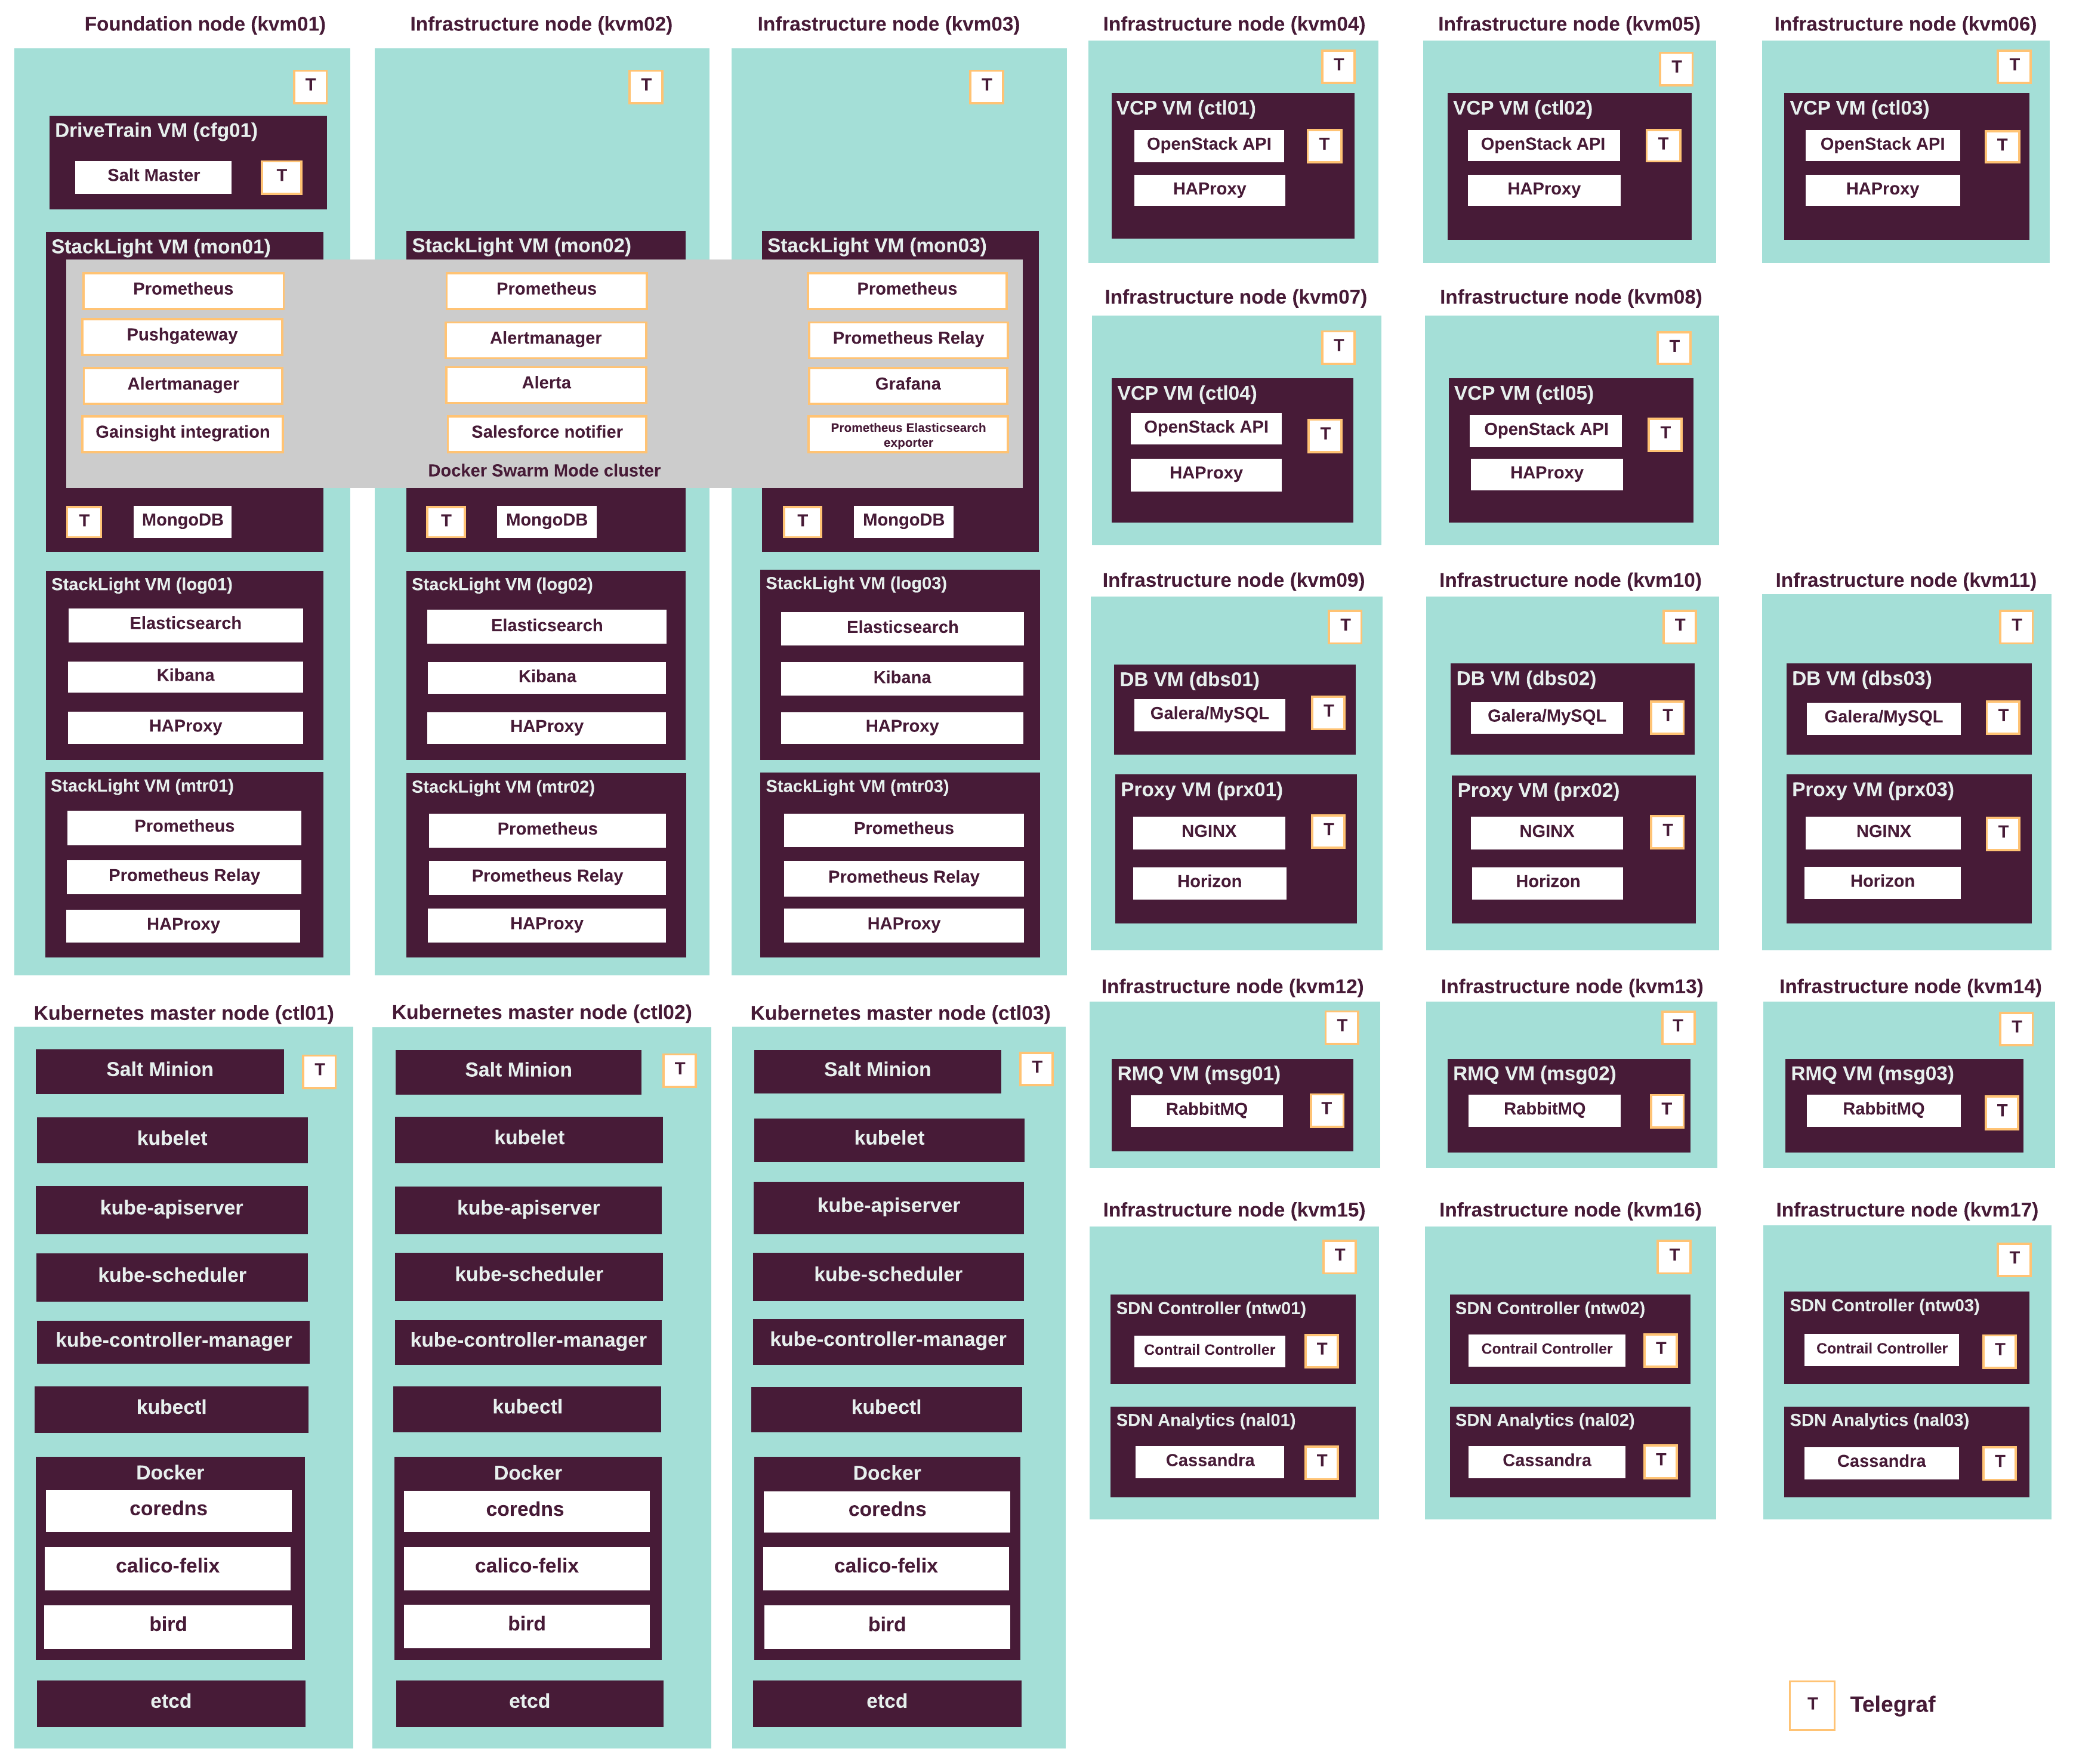
The Prometheus, Pushgateway, Alertmanager, Alerta, Grafana, Gainsight, and Prometheus Elasticsearch exporter services run on a separate Docker Swarm Mode cluster deployed on the monitoring VMs. The following diagram illustrates the composition of StackLight LMA components across all MCP services. Prometheus long-term storage is illustrated as the default option.
The following table lists the roles of StackLight LMA VCP nodes and their names in the Salt Reclass metadata model:
| Server role name | Server role group name in Reclass model | Description |
|---|---|---|
| StackLight LMA metering node | mtr |
Servers that run Prometheus long-term storage. |
| StackLight LMA log storage and visualization node | log |
Servers that run Elasticsearch and Kibana. |
| StackLight LMA monitoring node | mon |
Servers that run the Prometheus, Grafana, Pushgateway, Alertmanager, Alerta, and Gainsight integration (optional) services in containers in Docker Swarm mode. |
| [0] | The functionality is available starting from the MCP 2019.2.4 maintenance update. |