Docker Enterprise Solution Guides v3.1 documentation
Warning
Mirantis stopped maintaining this documentation set as of 2021-07-21, in correlation with the End of Life date for MKE 3.2.x and MSR 2.7.x. The company continues to support MCR 19.03.x and its documentation.
For the latest MKE, MSR, and MCR product documentation, refer to:
Docker Enterprise Solution Guides
Warning
Mirantis stopped maintaining this documentation set as of 2021-07-21, in correlation with the End of Life date for MKE 3.2.x and MSR 2.7.x. The company continues to support MCR 19.03.x and its documentation.
For the latest MKE, MSR, and MCR product documentation, refer to:
Introduction
From extending the Docker Enterprise ecosystem to troubleshooting solutions, practitioners are regularly looking for ready to go applications and tools to solve their challenges. With the ever evolving container landscape, solutions, best practices, and troubleshooting methodologies are challenging to keep up on but we have you covered with our partner ecosystem and troubleshooting best practices from some of the best in the business to help you ensure you have the right tools to get the right level of visibility into your container based platform.
Warning
Mirantis stopped maintaining this documentation set as of 2021-07-21, in correlation with the End of Life date for MKE 3.2.x and MSR 2.7.x. The company continues to support MCR 19.03.x and its documentation.
For the latest MKE, MSR, and MCR product documentation, refer to:
Partner Implementation Guides
The container ecosystem is quite broad and growing every day. Mirantis has partnered with leaders in the container ecosystem to bring technical implementation guides for relevant products that compliment the Docker Enterprise platform to help provide out of the box production ready solutions.
Continuous Integration and Continuous Deployment
Continuous Integration and Continuous Deployment practices are commonly used in association with container platforms. The level of automation required to achieve the speed and agility that organizations are looking for with containers is something that traditional processes lack, holding up the innovation cycle. Even the most experienced organizations with CI and/or CD practices can struggle when it comes to their integration with how to build and operate those CI/CD processes with a container platform. We have developed processes with partner solutions to help learn to accelerate the integration from leading container industry experts.
Automating Docker Enterprise with Azure DevOps
Introduction
Microsoft Azure DevOps (ADO) is a fully managed suite of tooling that empowers developers and operators to implement DevOps techniques. The Docker Enterprise Platform integrates with ADO through the use of Azure Pipelines for automated building and deploying of container-based workloads.
This guide does not attempt to recreate the excellent Azure DevOps documentation available online, but will focus on integration points between the two systems.
Setting up Azure DevOps
An Azure DevOps tenant is necessary to use the service. These accounts are available from a myriad of different sources from Microsoft Developer Network (MSDN) subscriptions, to simply signing up for a free account.
Creating a Project
Once a tenant is secured, create an Organization and a Project to hold code and pipeline definitions.
Configuring Source Control Management
Azure DevOps is capable of working with git repositories hosted in ADO itself, or in a variety of other locations such as GitHub, or on-premises servers. Create a new git repository in the ADO Project, or link to an existing repository to begin the enablement of build automation.
Automated triggers can be used between the git repository and ADO,
meaning that when a git commit push occurs then an ADO Pipeline can
be automatically initiate. This effectively established a continuous
integration (CI) capability for source code.
Once the git repository is linked with ADO, ensure that all application code has been committed.
Building a Pipeline
Pipelines in Azure DevOps define a series of steps the sequentially build, test, and package applications in various forms.
Pipelines can be generated via two techniques. The Classic experience is a GUI-driven wizard where boxes and dropdowns are completed with pipeline steps. This system has been largely replaced with a YAML-based system more in line with other offerings in the DevOps market.
The YAML-based pipelines offer “pipelines as code” benefits, as they are committed to source control and able to versioned and shared like any other file. This guide will focus on YAML-based pipelines.
Triggers
Pipelines are initiated via Triggers, which contain the logic that determines how and when a pipeline beings execution. Triggers can be configured in a variety of ways:
- Manual will require that an operator initiate a new build
- Automatic will initiate a build any time that a commit is added to the designated source control system. To avoid builds when non-application changes are made to the repository, specify a path and/or branch to specifically target application code changes.
trigger:
  branches:
    include:
    - master
  paths:
    include:
    - app/src/*
Pools
When a build is triggered it is added to a queue for a given agent pool. The next available agent will then have the build assigned, and it will execute the pipeline steps.
By default ADO uses a hosted agent pool where all servers are maintained by Microsoft. Alternatively, a pool of custom agents may also be used. Please see the Agents section for more detailed information on build agent setup.
Using the Ubuntu-based hosted agent (which includes a Moby-based container runtime):
pool:
  vmImage: 'ubuntu-latest'
Using a pool of custom build agents:
pool:
  name: 'UCP Agents - Linux'
Steps
The steps within a pipeline define which actions are done to the source code. These actions may be defined as custom scripts or configured via pre-built tasks.
Script blocks are used to run shell code as a pipeline step. For small
scripts it is fine to place these inline within the YAML. For larger
scripts consider creating a scripts directory within the code
repository and creating dedicated .sh, .ps1, etc. files. These
files may then be called from the pipeline step without cluttering the
pipeline file.
Build a Docker Image with a shell script:
scripts:
- script: |
    docker build \
      --tag $(DOCKER_REGISTRY_IMAGE):"$(git rev-parse --short HEAD)" \
      ./moby/pipeline
  displayName: 'Build Docker Image'
Build a Docker Image with a PowerShell script:
scripts:
- powershell: |
    docker build `
      --tag $(DOCKER_REGISTRY_IMAGE):"$(git rev-parse --short HEAD)" `
      .\moby\pipeline
  displayName: 'Build Docker Image'
Tasks are pre-built actions that can easily be integrated into a pipeline. A series of tasks are available out of the box from Microsoft; however, the system is also extensible through the Visual Studio Marketplace community.
Note
Pre-built tasks for Docker and Kubernetes are available, however the
typical brevity of the docker and kubectl command lines make
the additional abstraction optional compared to use of simple
script tasks
Variables
Dockerfiles are often static assets, requiring a developer to commit code changes to adjust its behavior. Hard-coded values also impede the ability to reuse a Dockerfile across multiple contexts or image variations. The Azure DevOps platform offers variables to be defined for a given Pipeline, radically increasing the flexibility of Dockerfiles by not requiring code changes to reuse a given file.
While variables may be named any value, it is recommended to decide upon
a naming convention that promotes consistency and predictability.
DOCKER_ is one such convention prefix that clearly denotes that a
variable is related to Docker. For example, DOCKER_REGISTRY_USERNAME
would denote first that a value is related to Docker, that it is used to
interact with a Registry, and that it contains an account username.
When Azure DevOps needs to use a variable that contains sensitive or
secret information, a Build Secret may be employed rather than a Build
Variable. When creating a variable, simply select the lock icon to
convert the value to a secret. Secrets are not echoed out in logs or
allowed to be seen once set. Setting the password or token used to
authenticate with a Docker Registry via a DOCKER_REGISTRY_TOKEN
secret would be advisable instead of a variable.
Note
Azure DevOps, Docker, and Kubernetes all have the notion of “Secrets” to handle sensitive information and can be used in tandem to protect values in a pipeline
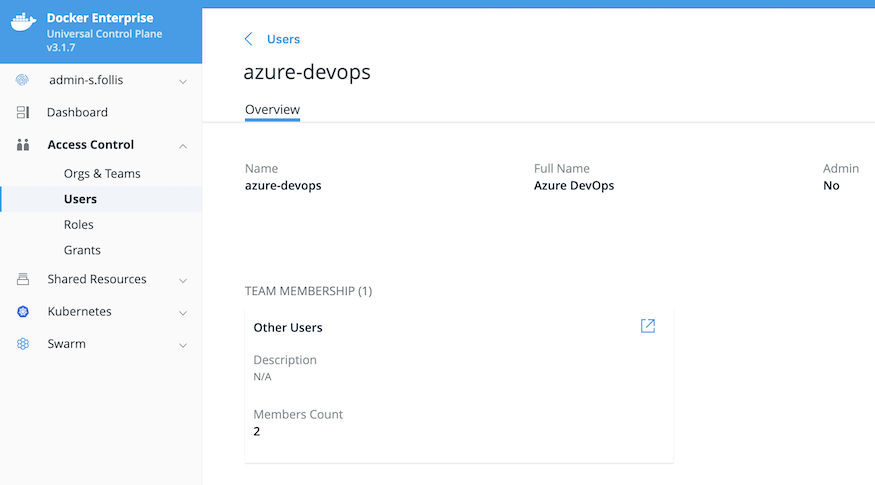
Docker Enterprise Service Account
Steps within an Azure DevOps Pipeline that require interaction with
Docker Enterprise may use a service account model for clean separation
between systems. In Mirantis Kubernetes Engine, a new user account may be
created with a name such as azure-devops or similar that will serve
as a service account. If using
LDAP
or
SAML
integration with a directory such as Active Directory then create an
account in the external system to be synchronized into MKE.
This service account is then used whenever a pipeline needs to interact
with Docker Enterprise. For example, to execute a docker push into
Mirantis Secure Registry, the pipeline must first authenticate against
the registry with a docker login:
- script: |
    docker login $(DOCKER_REGISTRY_FQDN) \
      --username $(DOCKER_REGISTRY_USERNAME) \
      --password $(DOCKER_REGISTRY_TOKEN)
  displayName: 'Login to Mirantis Secure Registry'
In this example the DOCKER_REGISTRY_USERNAME refers to the service
account’s username, and the DOCKER_REGISTRY_TOKEN is an Access Token
generated from
MSR loaded into
Azure DevOps as a Secret.
User accounts in Docker Enterprise utilize granular, role-based access controls (RBAC) to ensure that only the proper account has access to a given MSR repository, set of MKE nodes, etc. The service account can be directly granted permissions for pertinent MSR repositories or added to a MKE Group that inherits permissions. This system ensures that the service account has the least privileges necessary to conduct its tasks with Docker Enterprise.
A Docker Client
Bundle
can also be generated for this account, which can be used for continuous
delivery tasks such as docker stack deploy, kubectl apply, or
helm upgrade.
Preparing a Dockerfile
A developer working with a Dockerfile in their local environment has different requirements than a build automation system using the same file. A series of adjustments can optimize a Dockerfile for build performance and enhance the flexibility of a file to be utilized in multiple build variations.
Build Arguments
The mechanism to dynamically pass a value into a Dockerfile at
docker build time is the --build-arg flag. A variable or secret
can be used with the flag to change a build outcome without committing a
code change into the source control system. To utilize the flag, we add
an ARG line to our Dockerfile for each variable to be passed.
For example, to dynamically expose a port with in the Dockerfile we would adjust:
FROM mcr.microsoft.com/dotnet/core/sdk:2.1
EXPOSE 80
WORKDIR /app
to include an ARG
FROM mcr.microsoft.com/dotnet/core/sdk:2.1
ARG DOCKER_IMAGE_PORT=80
EXPOSE ${DOCKER_IMAGE_PORT}
WORKDIR /app

Note that we set a default value by including ``=80``; this value
will be used if a dynamic value is not passed in at build time.
A base image may also be made into a dynamic value, however the ARG
must be placed outside of the FROM statement. For example, to adjust
the following Dockerfile:
FROM mcr.microsoft.com/dotnet/core/sdk:2.1
EXPOSE 80
WORKDIR /app
Place the ARG at the beginning of the file and use the variable name
in the FROM statement:
ARG BASE_IMAGE='mcr.microsoft.com/dotnet/core/sdk:2.1'

FROM ${BASE_IMAGE}
EXPOSE 80
WORKDIR /app
Positioning the ARG outside of the FROM statement(s) places it
in a higher scope than within any specific stage.
Using the ARG and --build-arg pattern is useful to easily patch
a given image when improvements are made to its base image. Adjusting a
build variable and initiating a build brings the newer base image tag in
without requiring a formal code commit.
Labels
Metadata may be added to a Dockerfile via the LABEL keyword. Labels
can help designate particular application owners, points of contact, or
extraneous characteristics that would benefit from embedding within an
image.
Some common settings in Dockerfiles include:
FROM mcr.microsoft.com/dotnet/core/sdk:2.1
LABEL IMAGE_OWNER='Moby Whale <mobyw@docker.com>'
LABEL IMAGE_DEPARTMENT='Digital Marketing'
LABEL IMAGE_BUILT_BY='Azure DevOps'
EXPOSE 80
WORKDIR /app
Combine LABEL with ARG to dynamically pass metadata values into
an image at build time.
FROM mcr.microsoft.com/dotnet/core/sdk:2.1
ARG COMMIT_ID=''
LABEL GIT_COMMIT_ID=${COMMIT_ID}
docker build `
  --build-arg COMMIT_ID="$(git rev-parse --short HEAD)" `
  --tag $(DOCKER_REGISTRY_IMAGE):"$(git rev-parse --short HEAD)" `
  .
Values for LABEL can be viewed in a container registry such as
Mirantis Secure Registry (MSR), or from the Docker CLI:
$ docker inspect moby:1
[
    {
        ...
        "Config": {
            ...
            "Labels": {
                "GIT_COMMIT_ID": "421b895"
            }
        }
        ...
    }
]
Multi-Stage Builds
Dockerfiles originally functioned as a single “stage”, where all steps took place in the same context. All libraries and frameworks necessary for the Dockerfile to build had to be loaded in, bloating the size of the resulting images. Much of this image size was used during the build phase, but was not necessary for the application to properly run; for example, after an application compiles it does not necessarily have to have the compiler or SDK within the image to run.
The introduction of “multi-stage builds” introduced splitting out of individual “stages” within one physical Dockerfile. In a build system such as Azure DevOps, we can define a “builder” stage with a base layer containing all necessary compilation components, and then a second, lightweight “runtime” stage devoid of hefty SDKs and compilation tooling. This last stage becomes the built image, with the builder stage serving only as a temporary intermediary.
#=======================================================
# Stage 1: Use the larger SDK image to compile .NET code
#=======================================================
FROM mcr.microsoft.com/dotnet/core/sdk:2.1 AS build
WORKDIR /app

# copy csproj and restore as distinct layers
COPY *.sln .
COPY aspnetapp/*.csproj ./aspnetapp/
RUN dotnet restore

# copy everything else and build app
COPY aspnetapp/. ./aspnetapp/
WORKDIR /app/aspnetapp
RUN dotnet publish -c Release -o out

#=========================================================
# Stage 2: Copy built artifact into the slim runtime image
#=========================================================
FROM mcr.microsoft.com/dotnet/core/aspnet:2.1 AS runtime
EXPOSE 80
WORKDIR /app
COPY --from=build /app/aspnetapp/out ./
ENTRYPOINT ["dotnet", "aspnetapp.dll"]
Using multi-stage builds in your pipelines has considerable impact to
the speed and efficiency of builds, and the resulting file size of the
built container image. For a .NET Core application, the aspnet base
layer without the sdk components is substantially smaller:
$ docker image ls \
  --format 'table {{.Repository}}\t{{.Tag}}\t{{.Size}}' \
  --filter=reference='mcr.microsoft.com/dotnet/core/*:*'

REPOSITORY                              TAG                 SIZE
mcr.microsoft.com/dotnet/core/sdk       2.1                 1.74GB
mcr.microsoft.com/dotnet/core/sdk       2.2                 1.74GB
mcr.microsoft.com/dotnet/core/aspnet    2.1                 253MB
mcr.microsoft.com/dotnet/core/runtime   2.1                 180MB

For more information please see the Docker Documentation for
`Multi-Stage Builds <TODO>`__.
Agents
When a pipeline is triggered, Azure DevOps initiates a build by adding the build job to an agent queue. These queues are sets of build agents, which are the actual environments that will execute the steps defined in the pipeline.
One or more agents may be added into a pool. Using a pool allows multiple agents to be used in parallel, decreasing the time that a job sits in the queue awaiting an available agent. Microsoft maintains “hosted” agents, or you can define and run your own “self-hosted” agents within a physical server, virtual machine, or even a Docker container.
Hosted Agents
The easiest way to execute builds on Azure DevOps is by using the hosted
build agents. These VM-based agent pools come in a variety of operating
systems and have Docker available. Pipeline steps such as
docker build are available without additional configuration.
Being a hosted environment, there is minimal ability to customize the
SDKs, tooling, and other components within the virtual machine. A
pipeline step could be used to install needed software via approaches
such as apt-get or chocolatey, however doing so may add
substantial time to each build considering the VMs are wiped after the
pipeline completes.
The use of multi-stage builds decreases this dependency on the hosted build environment, as all necessary components for a container image should be embedded into the “builder” Dockerfile stage. To adjust the container runtime itself, for example to use a supported Docker Enterprise engine, a self-hosted agent is necessary.
Self-Hosted Agents
Running a self-hosted agent provides the ability to customize every facet of the build environment. Container runtimes can be customized, specific SDKs and compilers added, and for scenarios where project requirements restrict cloud-based agents a self-hosted agent can enable on-premises builds.
The downside is that infrastructure must be deployed and maintained to host the agents. These severs or virtual machines install a software agent, which connects to a specific Azure DevOps tenant.
The software agent can also run within a Docker container. Deploying containerized agents provides an array of benefits compared to traditional VM-based build agents including:
- Utilize existing container clusters, such as Docker Enterprise, rather than dedicated infrastructure
- Easily scale up and down the number of build agent instances with the Kubernetes or Swarm orchestrators
- Minimal assets to maintain when multi-stage builds are used as the containerized agent only needs access to the host’s Docker daemon
If building traditional software that does not run in a container, then
simply install the Azure DevOps agent and connect to a tenant. For
containerized applications that require a docker build pipeline
step, the Docker CLI is installed within the container so that it may
connect to the host’s Docker Daemon. This connection executes the build
on the host but controlled from a containerized build agent.
To make this connection on Linux, a Docker Volume is used to mount the host’s daemon:
docker run --volume /var/run/docker.sock:/var/run/docker.sock ...
And on Windows a Named Pipe is used via a similar approach:
docker run --volume \\.\pipe\docker_engine:\\.\pipe\docker_engine ...

Note that the ability to use Named Pipes `was
introduced <https://blog.docker.com/2017/09/docker-windows-server-1709/>`__
in Windows Server 1709 (SAC), and Windows Server 2019 (LTSC)
These volume mounts allow the Docker CLI to execute commands such as
docker build within the container, and have the action executed on
the host.
Microsoft provides
documentation
on running a build agent within a container. The base instructions may
be extended as-needed, for example to add binaries such as kubectl
and helm:
#=========================================================
# Stage 1: Download Docker CLI binary
#=========================================================
FROM alpine:latest AS dockercli

ARG DOCKER_BRANCH=test
ARG DOCKER_VERSION=19.03.0-beta4

RUN wget --output docker.tgz https://download.docker.com/linux/static/${DOCKER_BRANCH}/x86_64/docker-${DOCKER_VERSION}.tgz && \
    tar -zxvf docker.tgz && \
    chmod +x docker/docker

#=========================================================
# Stage 2: Download kubectl binary
#=========================================================
FROM alpine:latest AS kubectl

ARG KUBECTL_VERSION=v1.14.1

RUN wget --output ./kubectl https://storage.googleapis.com/kubernetes-release/release/${KUBECTL_VERSION}/bin/linux/amd64/kubectl && \
    chmod +x ./kubectl

#=========================================================
# Stage 3: Download Helm binary
#=========================================================
FROM alpine:latest AS helm

ARG HELM_VERSION=v2.13.1

RUN wget --output helm.tar.gz https://storage.googleapis.com/kubernetes-helm/helm-${HELM_VERSION}-linux-amd64.tar.gz && \
    tar -zxvf helm.tar.gz && \
    chmod +x linux-amd64/helm

#=========================================================
# Stage 4: Setup Azure Pipelines remote agent
# Documented at https://docs.microsoft.com/en-us/azure/devops/pipelines/agents/docker?view=azure-devops#linux
#=========================================================
FROM ubuntu:16.04

RUN apt-get update \
  && apt-get install -y --no-install-recommends \
  ca-certificates \
  curl \
  jq \
  git \
  iputils-ping \
  libcurl3 \
  libicu55 \
  zip \
  unzip \
  && rm -rf /var/lib/apt/lists/*

WORKDIR /azp

COPY ./start.sh .

# User is required for the Docker Socket
USER root

# Copy binaries from earlier build stages
COPY --from=dockercli docker/docker /usr/local/bin/docker
COPY --from=kubectl ./kubectl /usr/local/bin/kubectl
COPY --from=helm /linux-amd64/helm /usr/local/bin/helm

CMD ["./start.sh"]
Microsoft does not maintain specific instructions for running the cross-platform build agent software within a Windows Container, but a similar approach to the Linux Container build agent may be taken:
# escape=`

#=========================================================
# Stage 1: Download Docker CLI binary
#=========================================================
FROM mcr.microsoft.com/windows/servercore:ltsc2019 AS dockercli

SHELL ["powershell", "-Command", "$ErrorActionPreference = 'Stop'; $ProgressPreference = 'SilentlyContinue';"]

RUN Invoke-WebRequest `
      -OutFile docker.zip `
      -Uri https://download.docker.com/components/engine/windows-server/18.09/docker-18.09.6.zip `
      -UseBasicParsing; `
    Expand-Archive `
      -DestinationPath 'C:\' `
      -Force `
      -Path docker.zip;
#=========================================================
# Stage 2: Download Azure DevOps Pipelines Agent
#=========================================================
FROM mcr.microsoft.com/windows/servercore:ltsc2019 AS adoagent
SHELL ["powershell", "-Command", "$ErrorActionPreference = 'Stop'; $ProgressPreference = 'SilentlyContinue';"]
ENV ADO_AGENT_URL='https://vstsagentpackage.azureedge.net/agent/2.148.2/vsts-agent-win-x64-2.148.2.zip'
RUN Invoke-WebRequest `
      -OutFile C:\agent.zip `
      -Uri $env:ADO_AGENT_URL `
      -UseBasicParsing; `
    Expand-Archive `
      -Destination C:\agent `
      -Force `
      -Path agent.zip;
#=========================================================
# Stage 3: Download ServiceMonitor
# https://github.com/microsoft/IIS.ServiceMonitor
#=========================================================
FROM mcr.microsoft.com/windows/servercore:ltsc2019 AS servicemonitor
SHELL ["powershell", "-Command", "$ErrorActionPreference = 'Stop'; $ProgressPreference = 'SilentlyContinue';"]
ENV SERVICE_MONITOR_VERSION='2.0.1.3'
RUN Invoke-WebRequest `
      -OutFile C:\ServiceMonitor.exe `
      -Uri "https://dotnetbinaries.blob.core.windows.net/servicemonitor/$Env:SERVICE_MONITOR_VERSION/ServiceMonitor.exe" `
      -UseBasicParsing;
#=========================================================
# Stage 4: Setup Azure Pipelines remote agent
#=========================================================
FROM mcr.microsoft.com/windows/servercore:ltsc2019 AS runtime
SHELL ["powershell", "-Command", "$ErrorActionPreference = 'Stop'; $ProgressPreference = 'SilentlyContinue';"]
WORKDIR C:\agent
# Setup general tools via the Scoop package manager
RUN Invoke-Expression (New-Object Net.WebClient).DownloadString('https://get.scoop.sh'); `
    scoop install git;
# Setup Azure Pipelines Agent
COPY --from=adoagent C:\agent C:\agent
# Setup Docker CLI
COPY --from=dockercli C:\docker C:\docker
# Setup ServiceMonitor
COPY --from=servicemonitor C:\ServiceMonitor.exe C:\ServiceMonitor.exe
# Update path variable
RUN $env:PATH = 'C:\docker;' + $env:PATH; `
    Set-ItemProperty `
      -Path 'HKLM:\SYSTEM\CurrentControlSet\Control\Session Manager\Environment\' `
      -Name Path `
      -Value $env:PATH;

# Copy startup script into container
COPY start.ps1 .

# Run startup script on initialization
CMD .\start.ps1
PowerShell used as the CMD .\start.ps1 command:
# https://docs.microsoft.com/en-us/azure/devops/pipelines/agents/v2-windows

# ===============================
# Check if required variables are present
# ===============================
if (!$env:AZP_URL) { Write-Host "The AZP_URL environment variable is null. Please adjust before continuing"; exit 1; }
if (!$env:AZP_TOKEN) { Write-Host "The AZP_TOKEN environment variable is null. Please adjust before continuing"; exit 1; }
if (!$env:AZP_POOL) { $env:AZP_POOL='Default' }

# ===============================
# Configure Azure Pipelines Agent
# ===============================
if(!(Test-Path -Path C:\agent\_work )) {
  Write-Output "No previous agent configuration detected. Configuring agent."
  .\config.cmd `
    --acceptTeeEula `
    --auth PAT `
    --pool "${env:AZP_POOL}" `
    --replace `
    --runAsService `
    --token "${env:AZP_TOKEN}" `
    --unattended `
    --url "${env:AZP_URL}" `
    --windowsLogonAccount "NT AUTHORITY\SYSTEM"

}

# ==============================
# Run Azure Pipelines Agent with ServiceMonitor
# ==============================
C:\ServiceMonitor.exe (Get-Service vstsagent*).Name
This Windows Container Dockerfile executes a variety of activities through the use of multiple stages:
- Downloads the Docker CLI binary so that the container can communicate with the host’s Docker Daemon
- Downloads the Azure DevOps Pipeline Agent that will facilitate communications between the container and the tenant
- Downloads the ServiceMonitor executable, which will monitor and manage the background service used by the agent
- Combines all downloaded binaries into the final stage and sets path variables to be used by the startup process
- Sets a PowerShell file to run as the container’s startup
CMDprocess
Note
Using Docker Secrets rather than an environment varibale for the Azure DevOps Personal Access Token (PAT) would increase security
Deploying
Azure DevOps Pipelines may be used for both continuous integration, and for continuous delivery processes. In the integration stage a Docker image was built and pushed into Mirantis Secure Registry (MSR). Delivery takes the next step to schedule the image from MSR onto a cluster of servers managed by Mirantis Kubernetes Engine.
Deploying with Helm
In the Kubernetes world, Helm is a popular tool
for deploying and managing the life cycle of container workloads. A Helm
“Chart” is created via the helm create command, and then values are
adjusted to match a given application’s needs. Docker Enterprise is a
CNCF Certified distribution of Kubernetes and works seamlessly with
Helm.
Azure DevOps Pipelines can interface with Docker Enterprise via Helm by
having the kubectl binary installed in the build agent. This command
line tool is then further configured to work with MKE through a Docker
Client Bundle, which establishes a secure connection context between
kubectl and MKE. Once established, standard Helm commands may be
issued to update a running Helm workload.
In the following example, a formal deploy
stage
is created in the Azure DevOps Pipeline that depends on the successful
completion of a build stage. A Client Bundle is then downloaded from
the Azure DevOps Secure File
Library,
unzipped, and sourced. The helm upgrade command then updates the
declared image tag to the recently build tag from MSR with
--set "image.tag=$(git rev-parse --short HEAD)". Helm then
gracefully handles the upgrade process for the running image.
- stage: deploy
  displayName: Deploy to Cluster
  dependsOn:
  - build
  jobs:
  - job: helm
    displayName: 'Deploy Container with Helm'
    pool:
      name: 'Shared SE - Linux'
      demands:
      - agent.os -equals Linux
      - docker
    steps:
    - task: DownloadSecureFile@1
      inputs:
        secureFile: 'ucp-bundle-azure-devops.zip'

    - script: |
        # Unzip Docker Client Bundle from UCP
        unzip \
          -d $(Agent.TempDirectory)/bundle \
          $(Agent.TempDirectory)/ucp-bundle-azure-devops.zip
      displayName: 'Setup Docker Client Bundle'

    - script: |
        # Connect Helm to cluster via Docker Client Bundle
        cd $(Agent.TempDirectory)/bundle
        eval "$(<env.sh)"

        # Update deployment with Helm
        cd $(Build.SourcesDirectory)
        helm upgrade \
          web \
          ./pipelines/helm/techorama \
          --set "image.tag=$(git rev-parse --short HEAD)" \
          --tiller-namespace se-stevenfollis
      displayName: 'Update application with Helm'
Conclusion
Azure DevOps is an end-to-end suite of tools that enable an organization to successfully implement modern best-practices for building and releasing software. Organizations that have invested in the Docker Enterprise platform can easily utilize such tooling to build, share, and run containerized workloads wherever their Docker Enterprise clusters are operating. Simple connection points between the two systems such as Docker Client Bundles and Helm facilitate the movement of workloads and allow users to experience the benefits of both enterprise-grade systems.
Monitoring
Monitoring any application platform is a critical day 2 operations function and the same is true when operating a container platform. Mirantis partners have built solutions that integrate and extend the capabilities in Docker Enterprise to provide the necessary tools and visibility int your applications and infrastructure.
Datadog Monitoring Implementation Guide for Docker Enterprise
Overview
Docker Solution Briefs enable you to integrate the Docker Enterprise container platform with popular 3rd party ecosystem solutions for networking, load balancing, storage, logging and monitoring, access management, and more. This Solution Brief documents how to deploy Datadog to monitor the performance of Docker containers in a Docker Enterprise MKE Cluster environment.
Docker Enterprise includes Docker Cluster, a tool for for lifecycle management of Docker clusters. With Cluster, you use a YAML file to configure your provider’s resources. Then, with a single command, you provision and install all the resources from your configuration. The Docker Enterprise cluster was created using ‘docker cluster’ tool on Azure Cloud for this solution brief.
Note
Information on Datadog is provided by Docker as a known, working configuration for Docker Enterprise 3.0. Mirantis does not provide the product support for Datadog. Please contact the vendor approved support methods if you have any questions or problems with them.
Datadog Overview
Datadog is a SaaS-based data analytics monitoring service for cloud-scale applications, bringing together data from servers, databases, tools, and services to present a unified view of an entire stack.
Datadog’s main features are:
- Ability for developers and operations to see the full infrastructure
on a single pane of glass:
- Clouds
- Servers
- Applications
- Services
- Metrics
- and more
- Real-time, customizable, interactive dashboards
- Full-text search capabilities for metrics and events
- Over 200 Integrations which includes various clouds, enterprise applications, and developer software tools out of the box
- API to allow integrating and monitoring unique infrastructures
Datadog provides an agent for all of the major Linux distributions and Windows, which needs to be downloaded and installed on each host that you wish to monitor. The agent collects the events and metrics and then forwards them to the Datadog SaaS server for processing, analysis, and viewing. Datadog also provides their Linux agent as a Certified Docker Image in Docker Hub.
Docker Enterprise MKE Cluster
This implementation guide was developed and tested on:
- Docker Enterprise 3.0 with Mirantis Container Runtime 19.03.2, MKE 3.2.1 and MSR 2.7.1, and DataDog Agent 6.14.1
The Docker Enterprise MKE Cluster environment had 6 nodes (1 manager and 5 workers). Refer to Docker Enterprise Best Practices and Design Considerations for details on best practices for deploying Docker Enterprise.
To discover your infrastructure and collect the events and metrics, the Datadog agent needs to be deployed on all Docker Nodes that you wish to monitor.

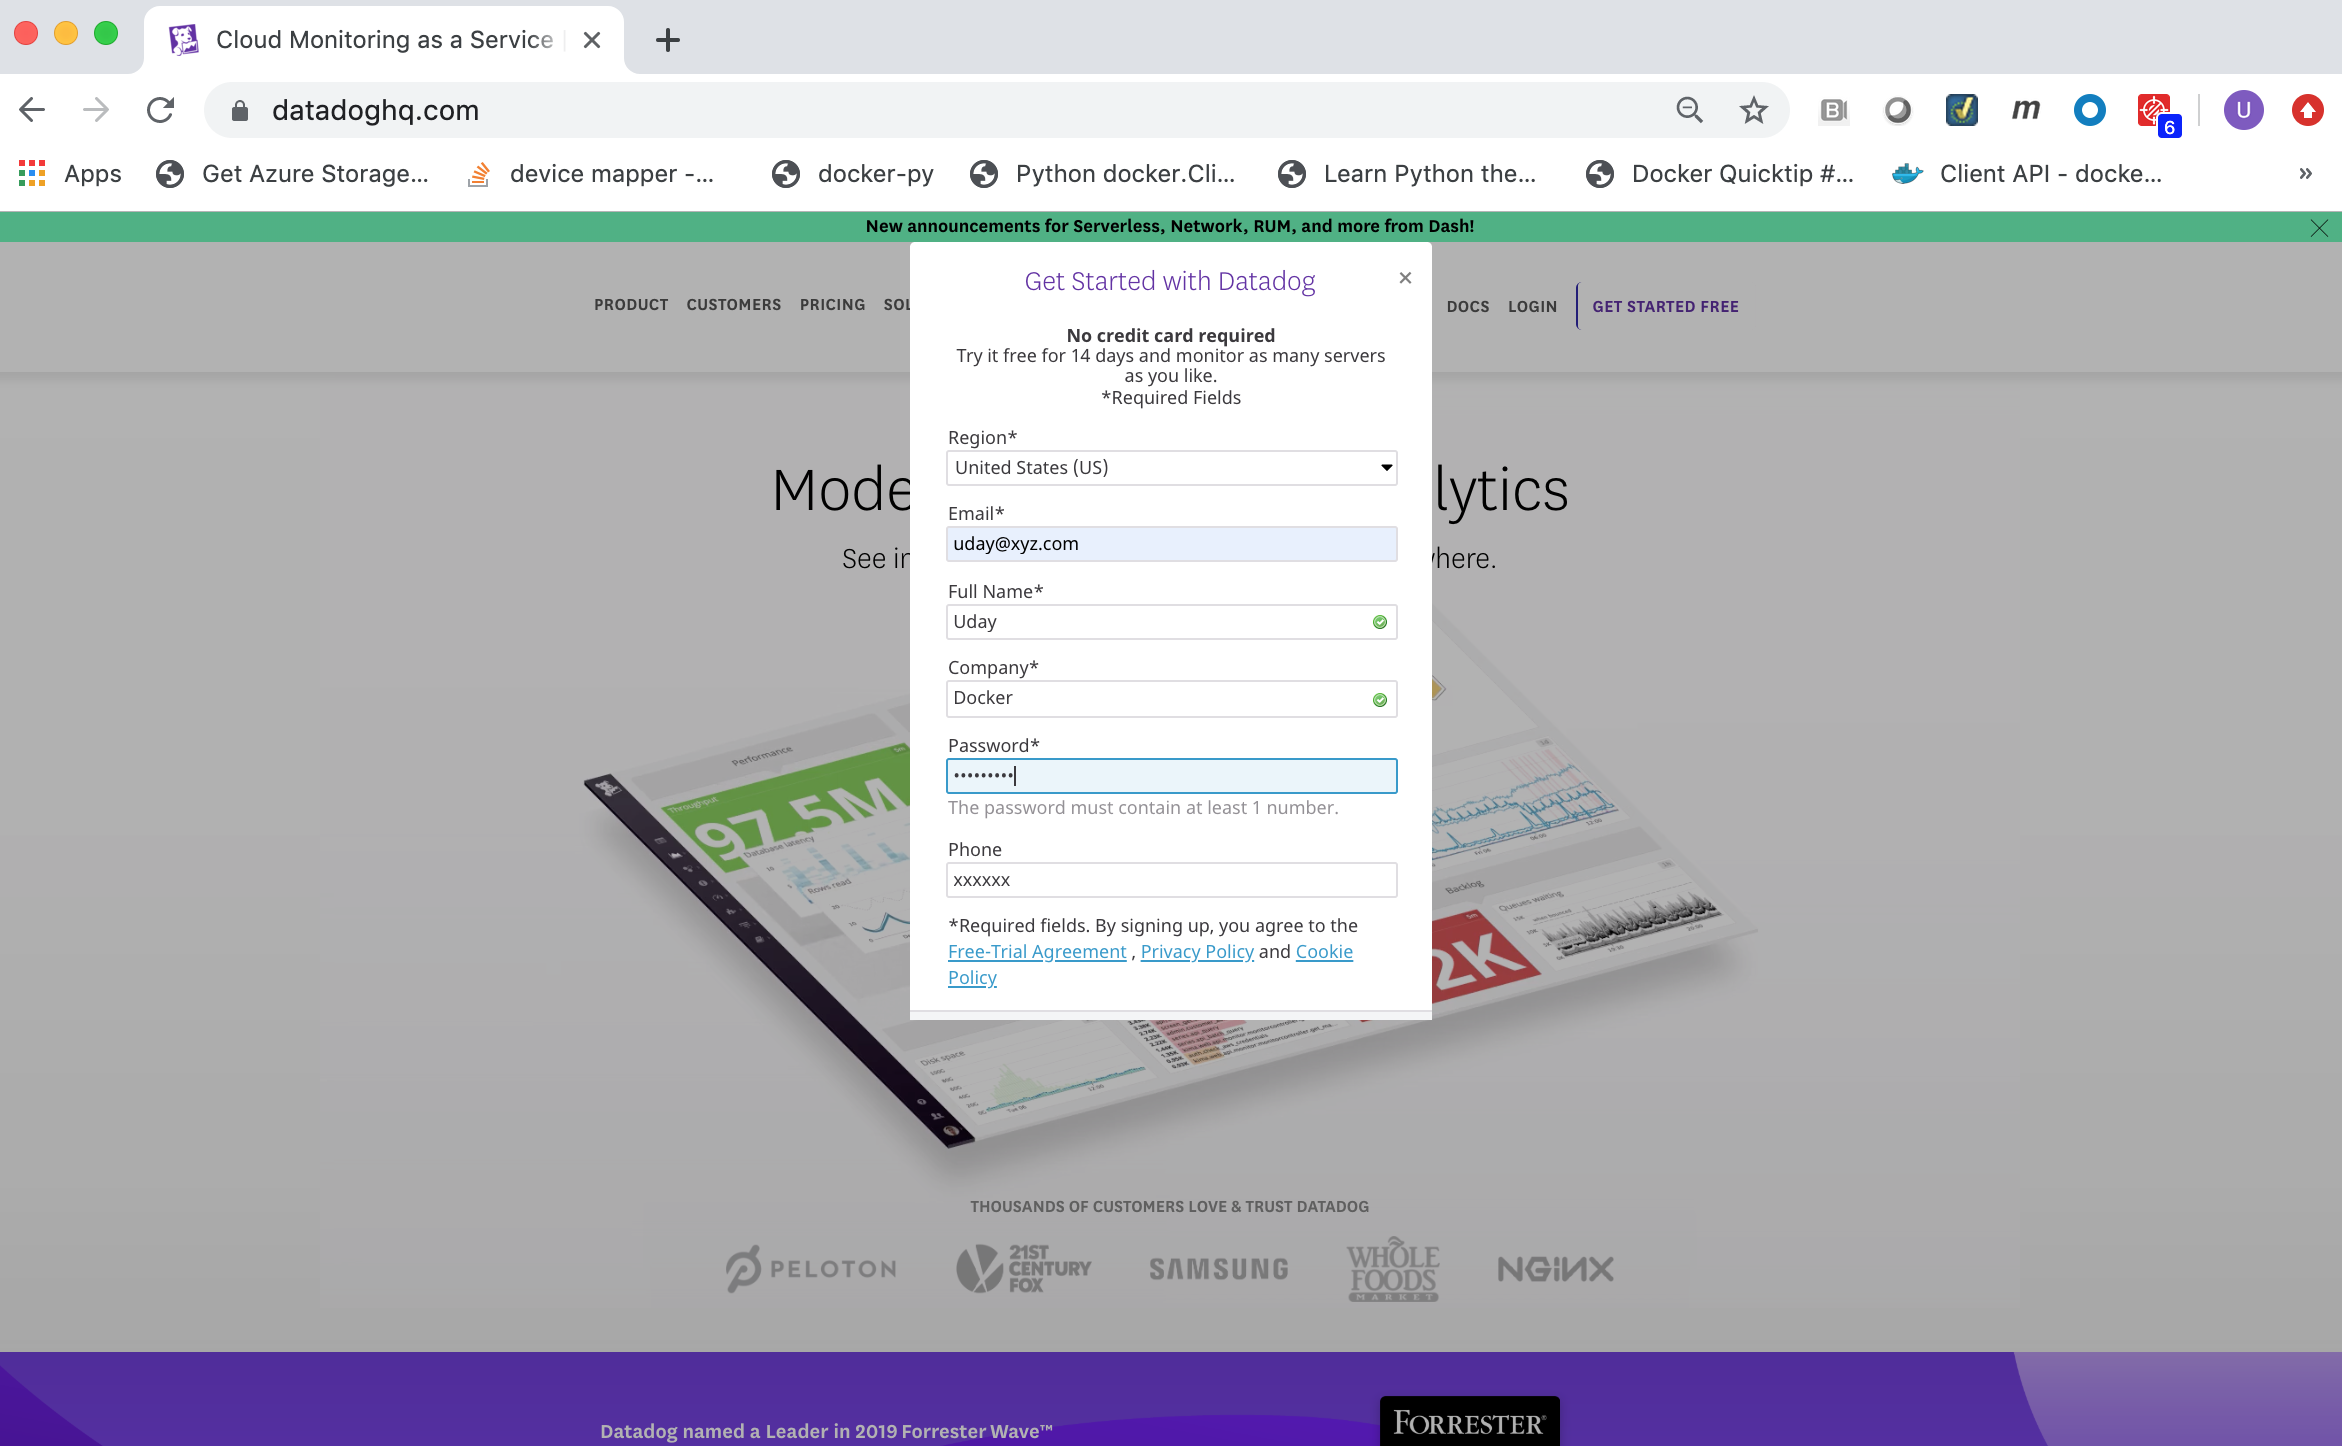
Datadog SaaS Account
A Datadog SaaS Account is required. You can register for a free 14-day Datadog Account on https://www.datadoghq.com/. Click on the GET STARTED FREE button.
Datadog API Key
The Datadog agent requires a Datadog API Key in order for it to
securely connect to the Datadog SaaS server and forward monitoring data
to it. You can view and copy your Datadog API Key from the Datadog
SaaS Web portal.
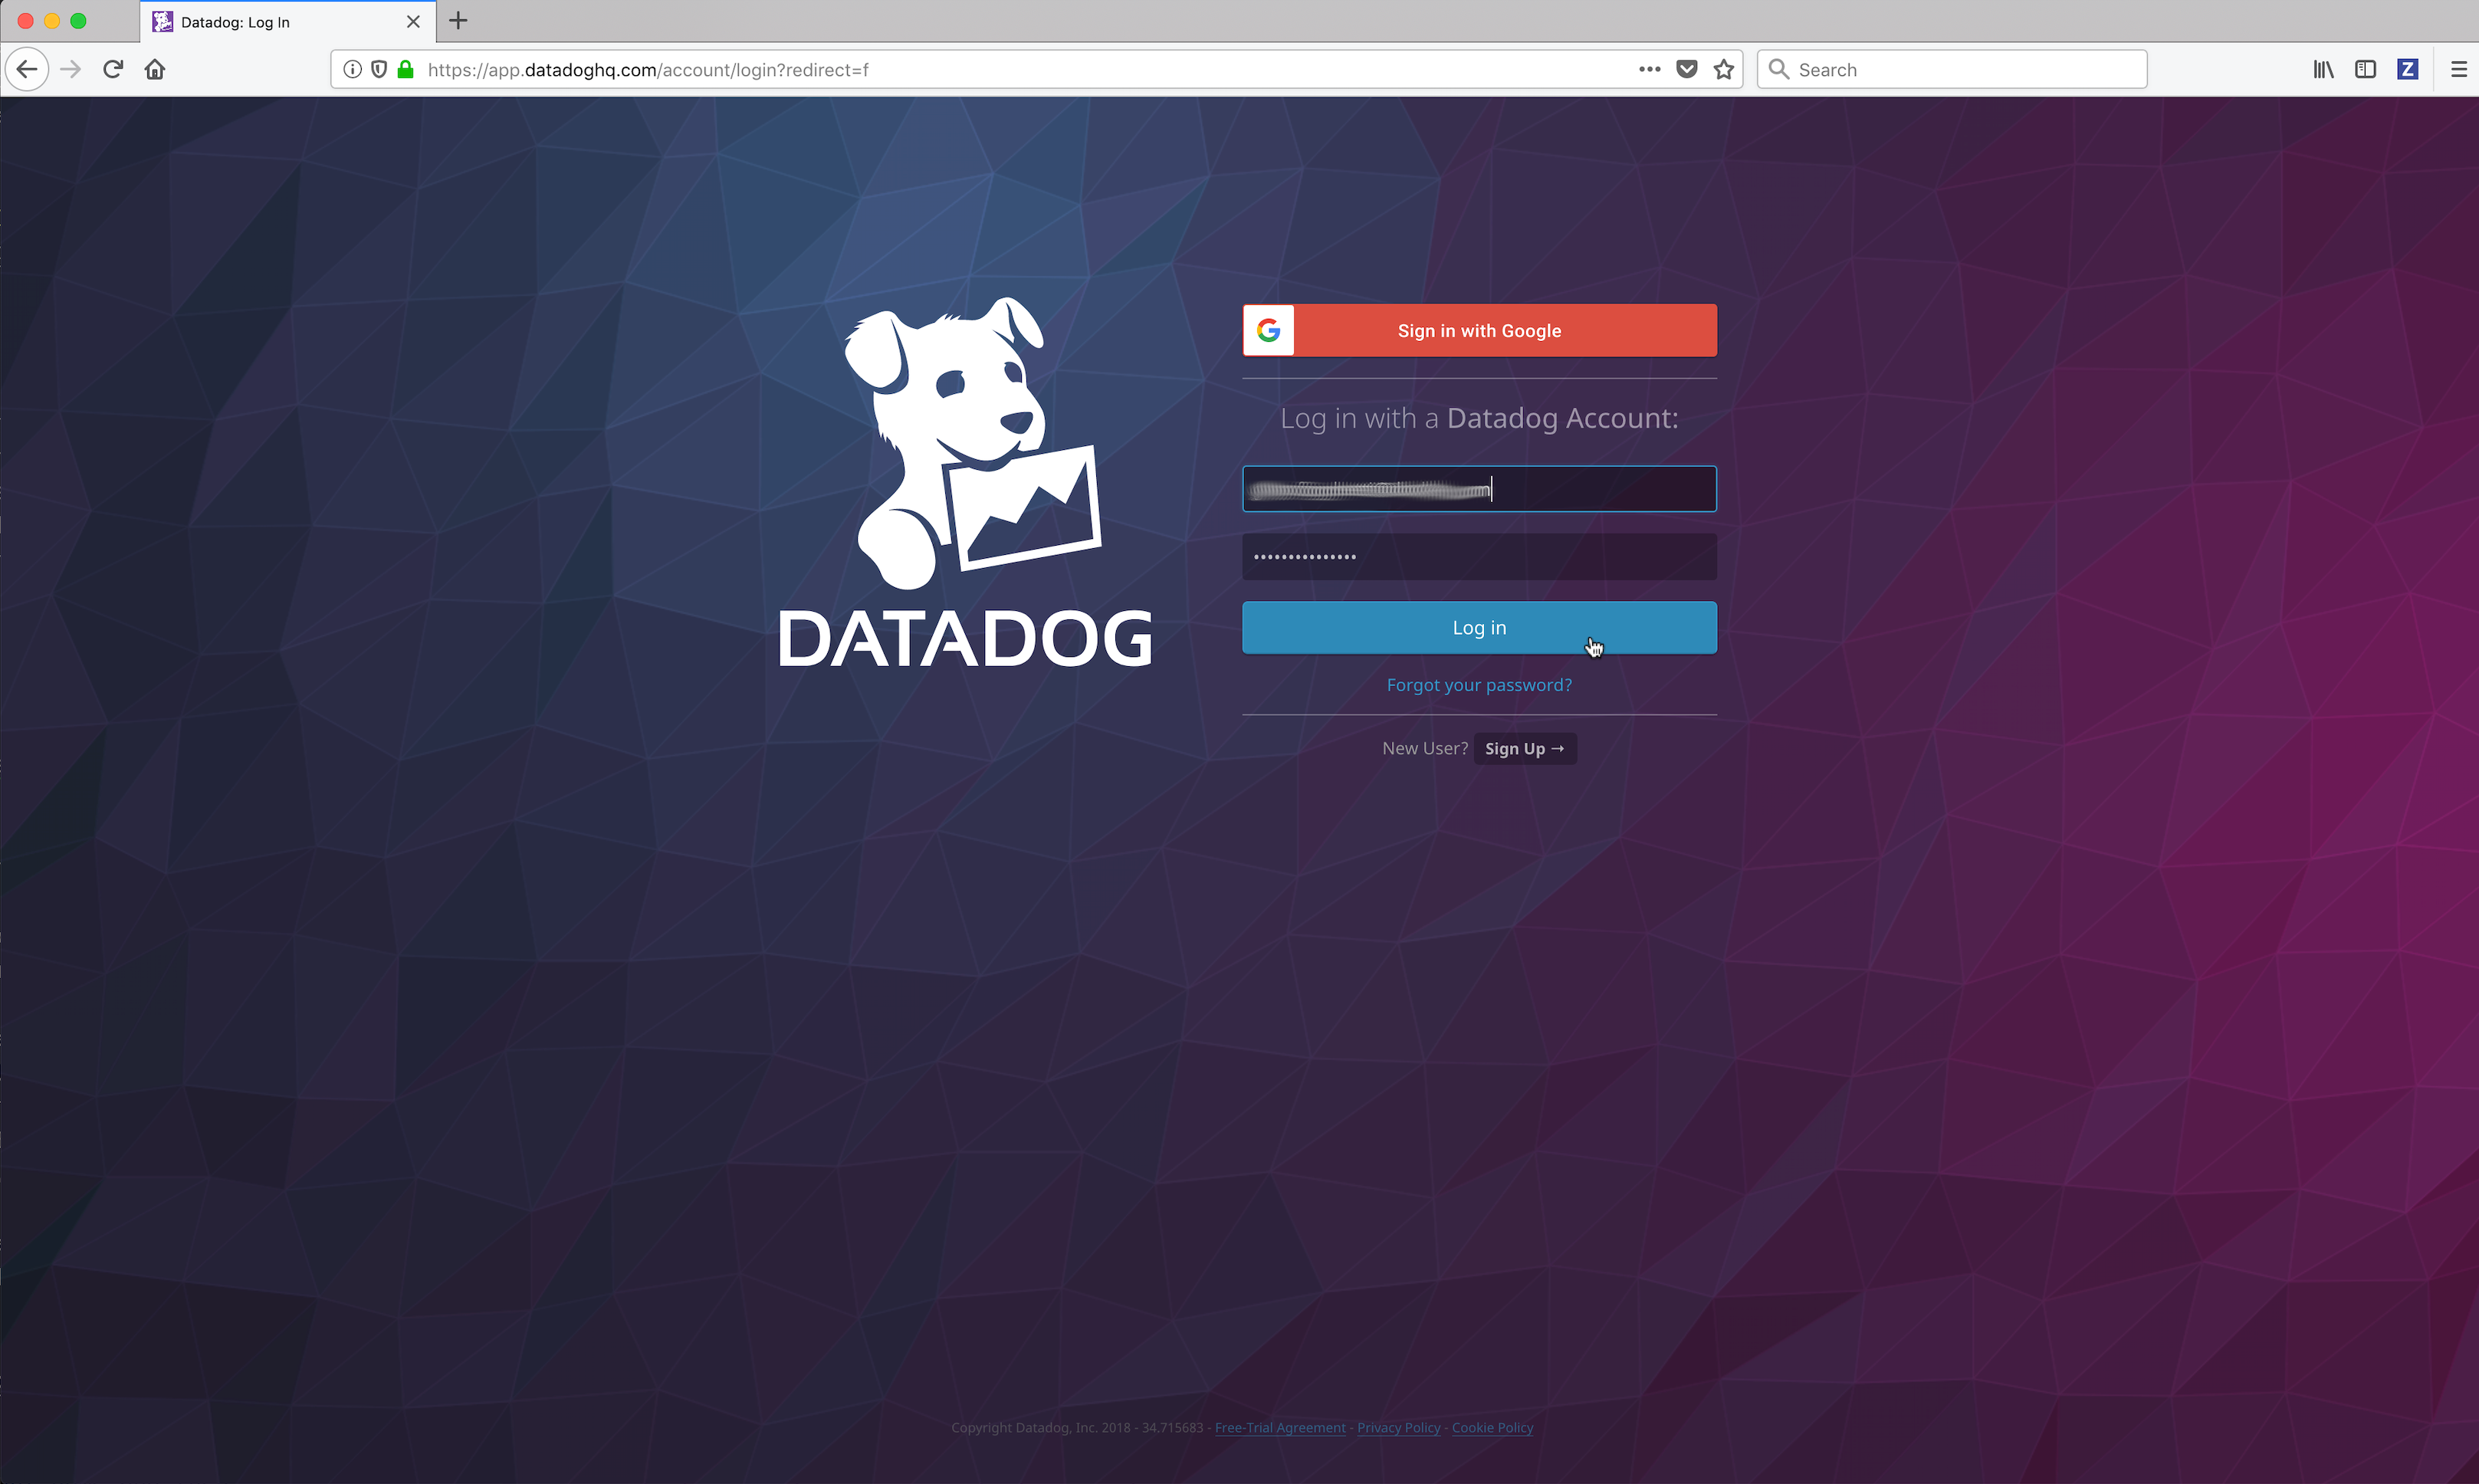
Log into the Datadog SaaS Web portal at https://app.datadoghq.com.
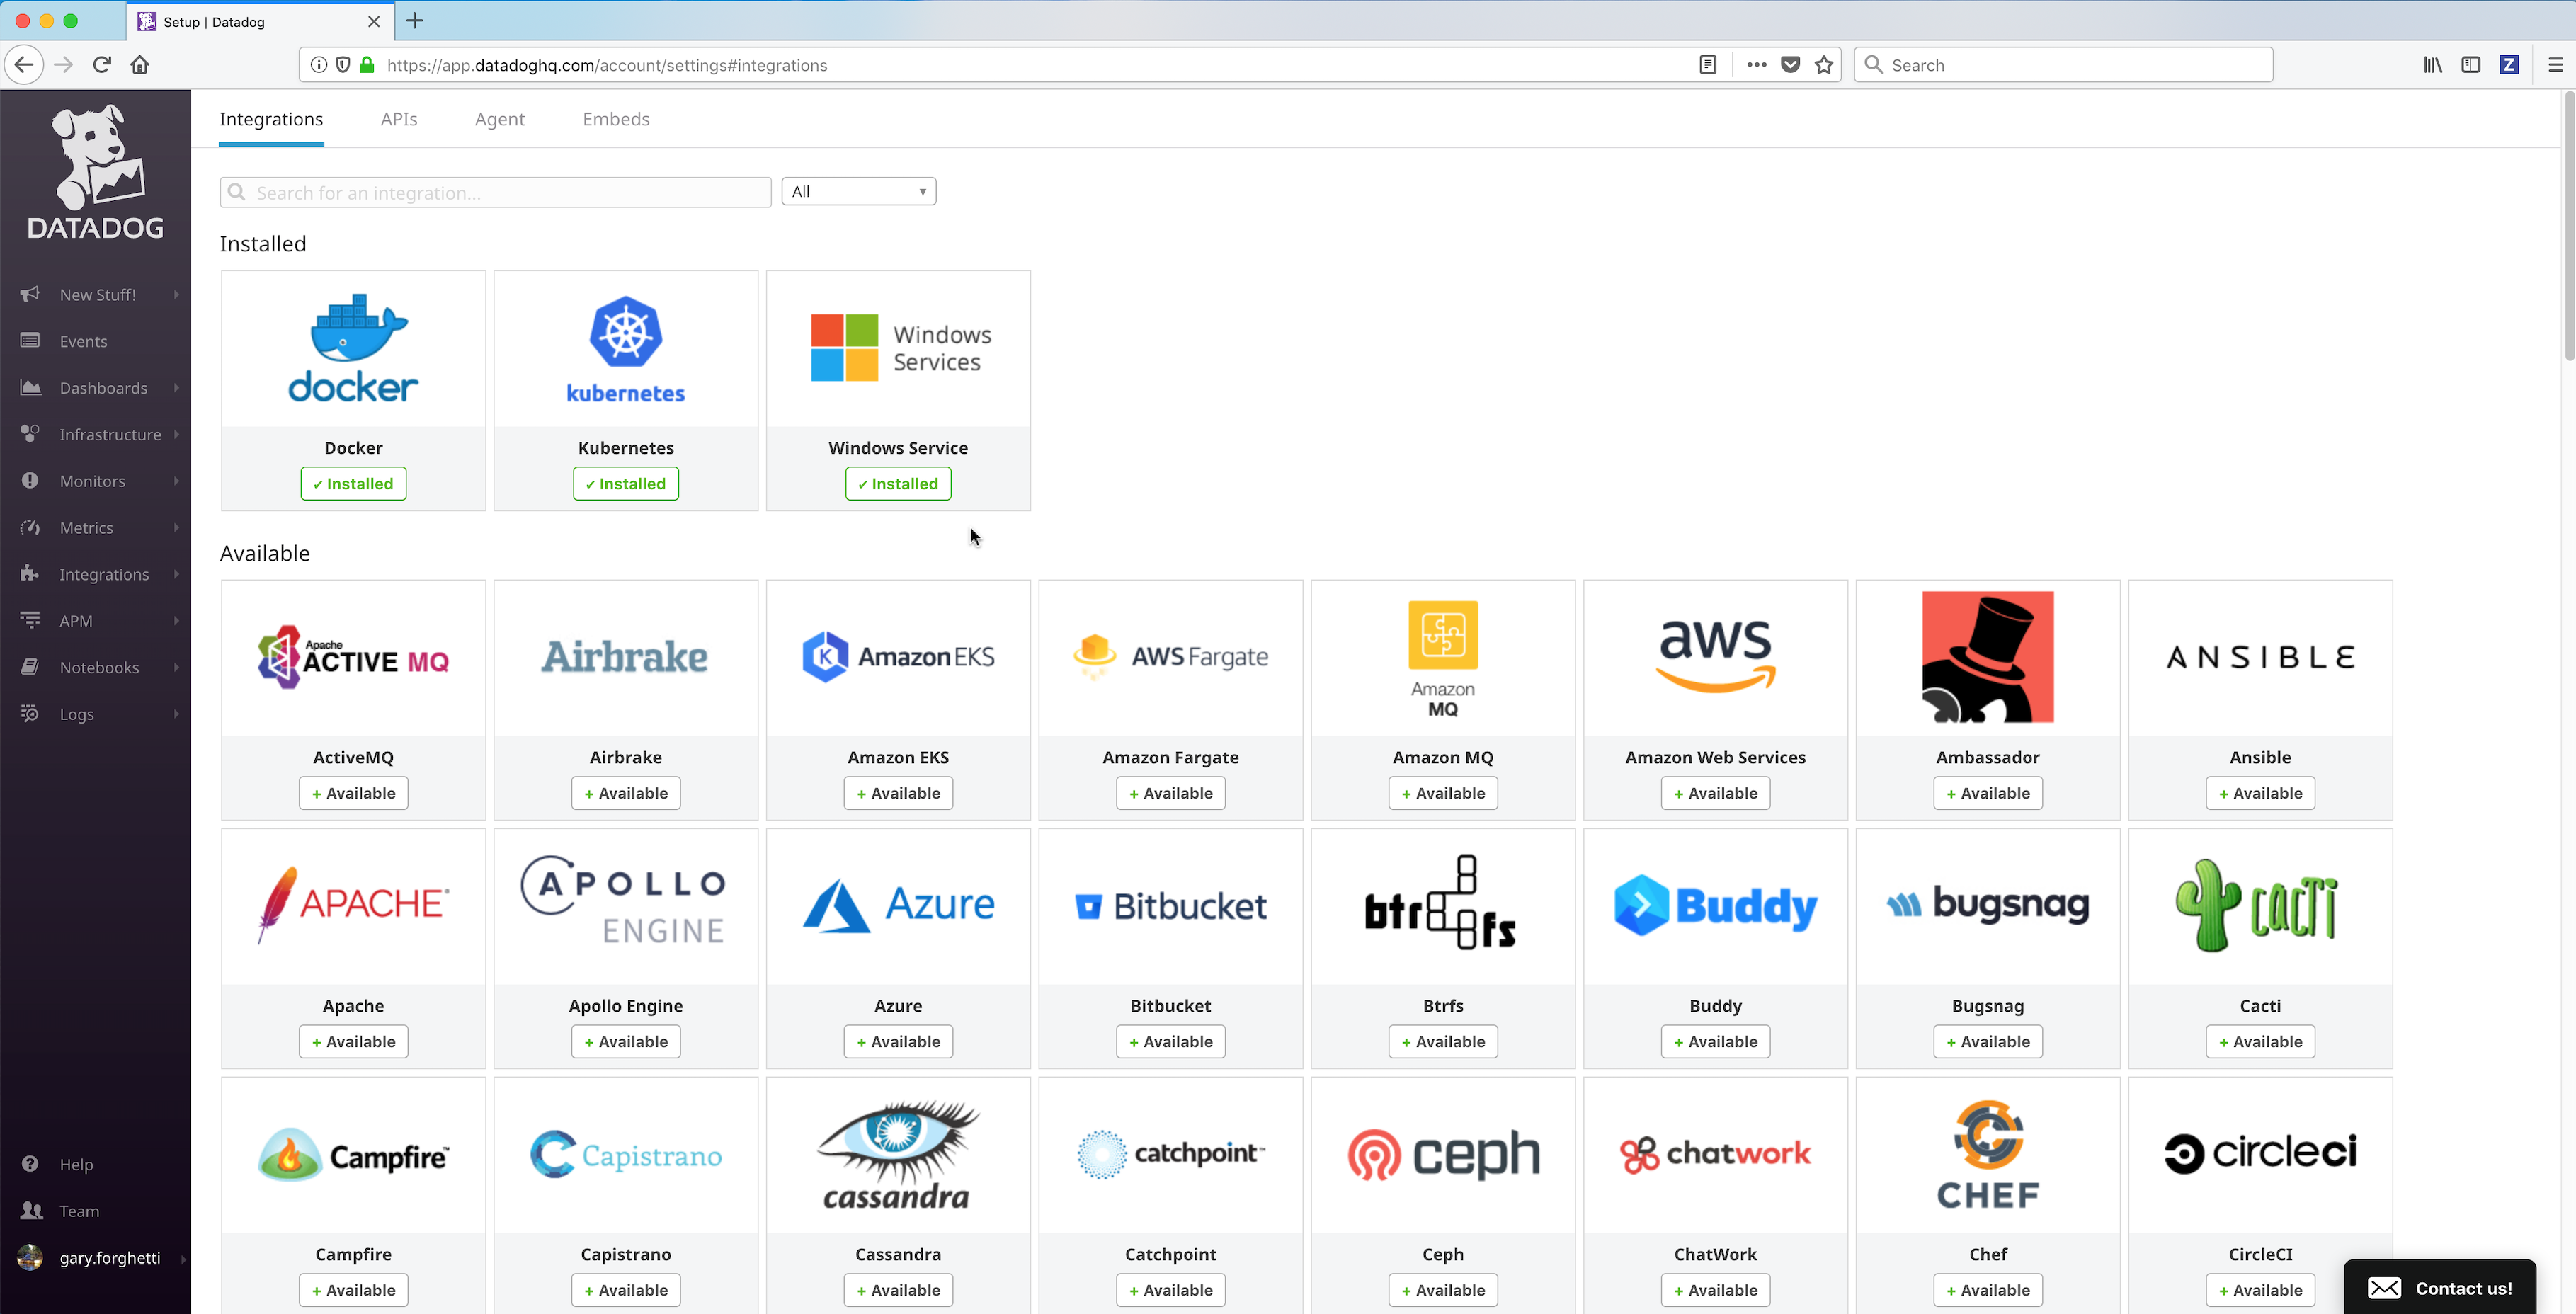
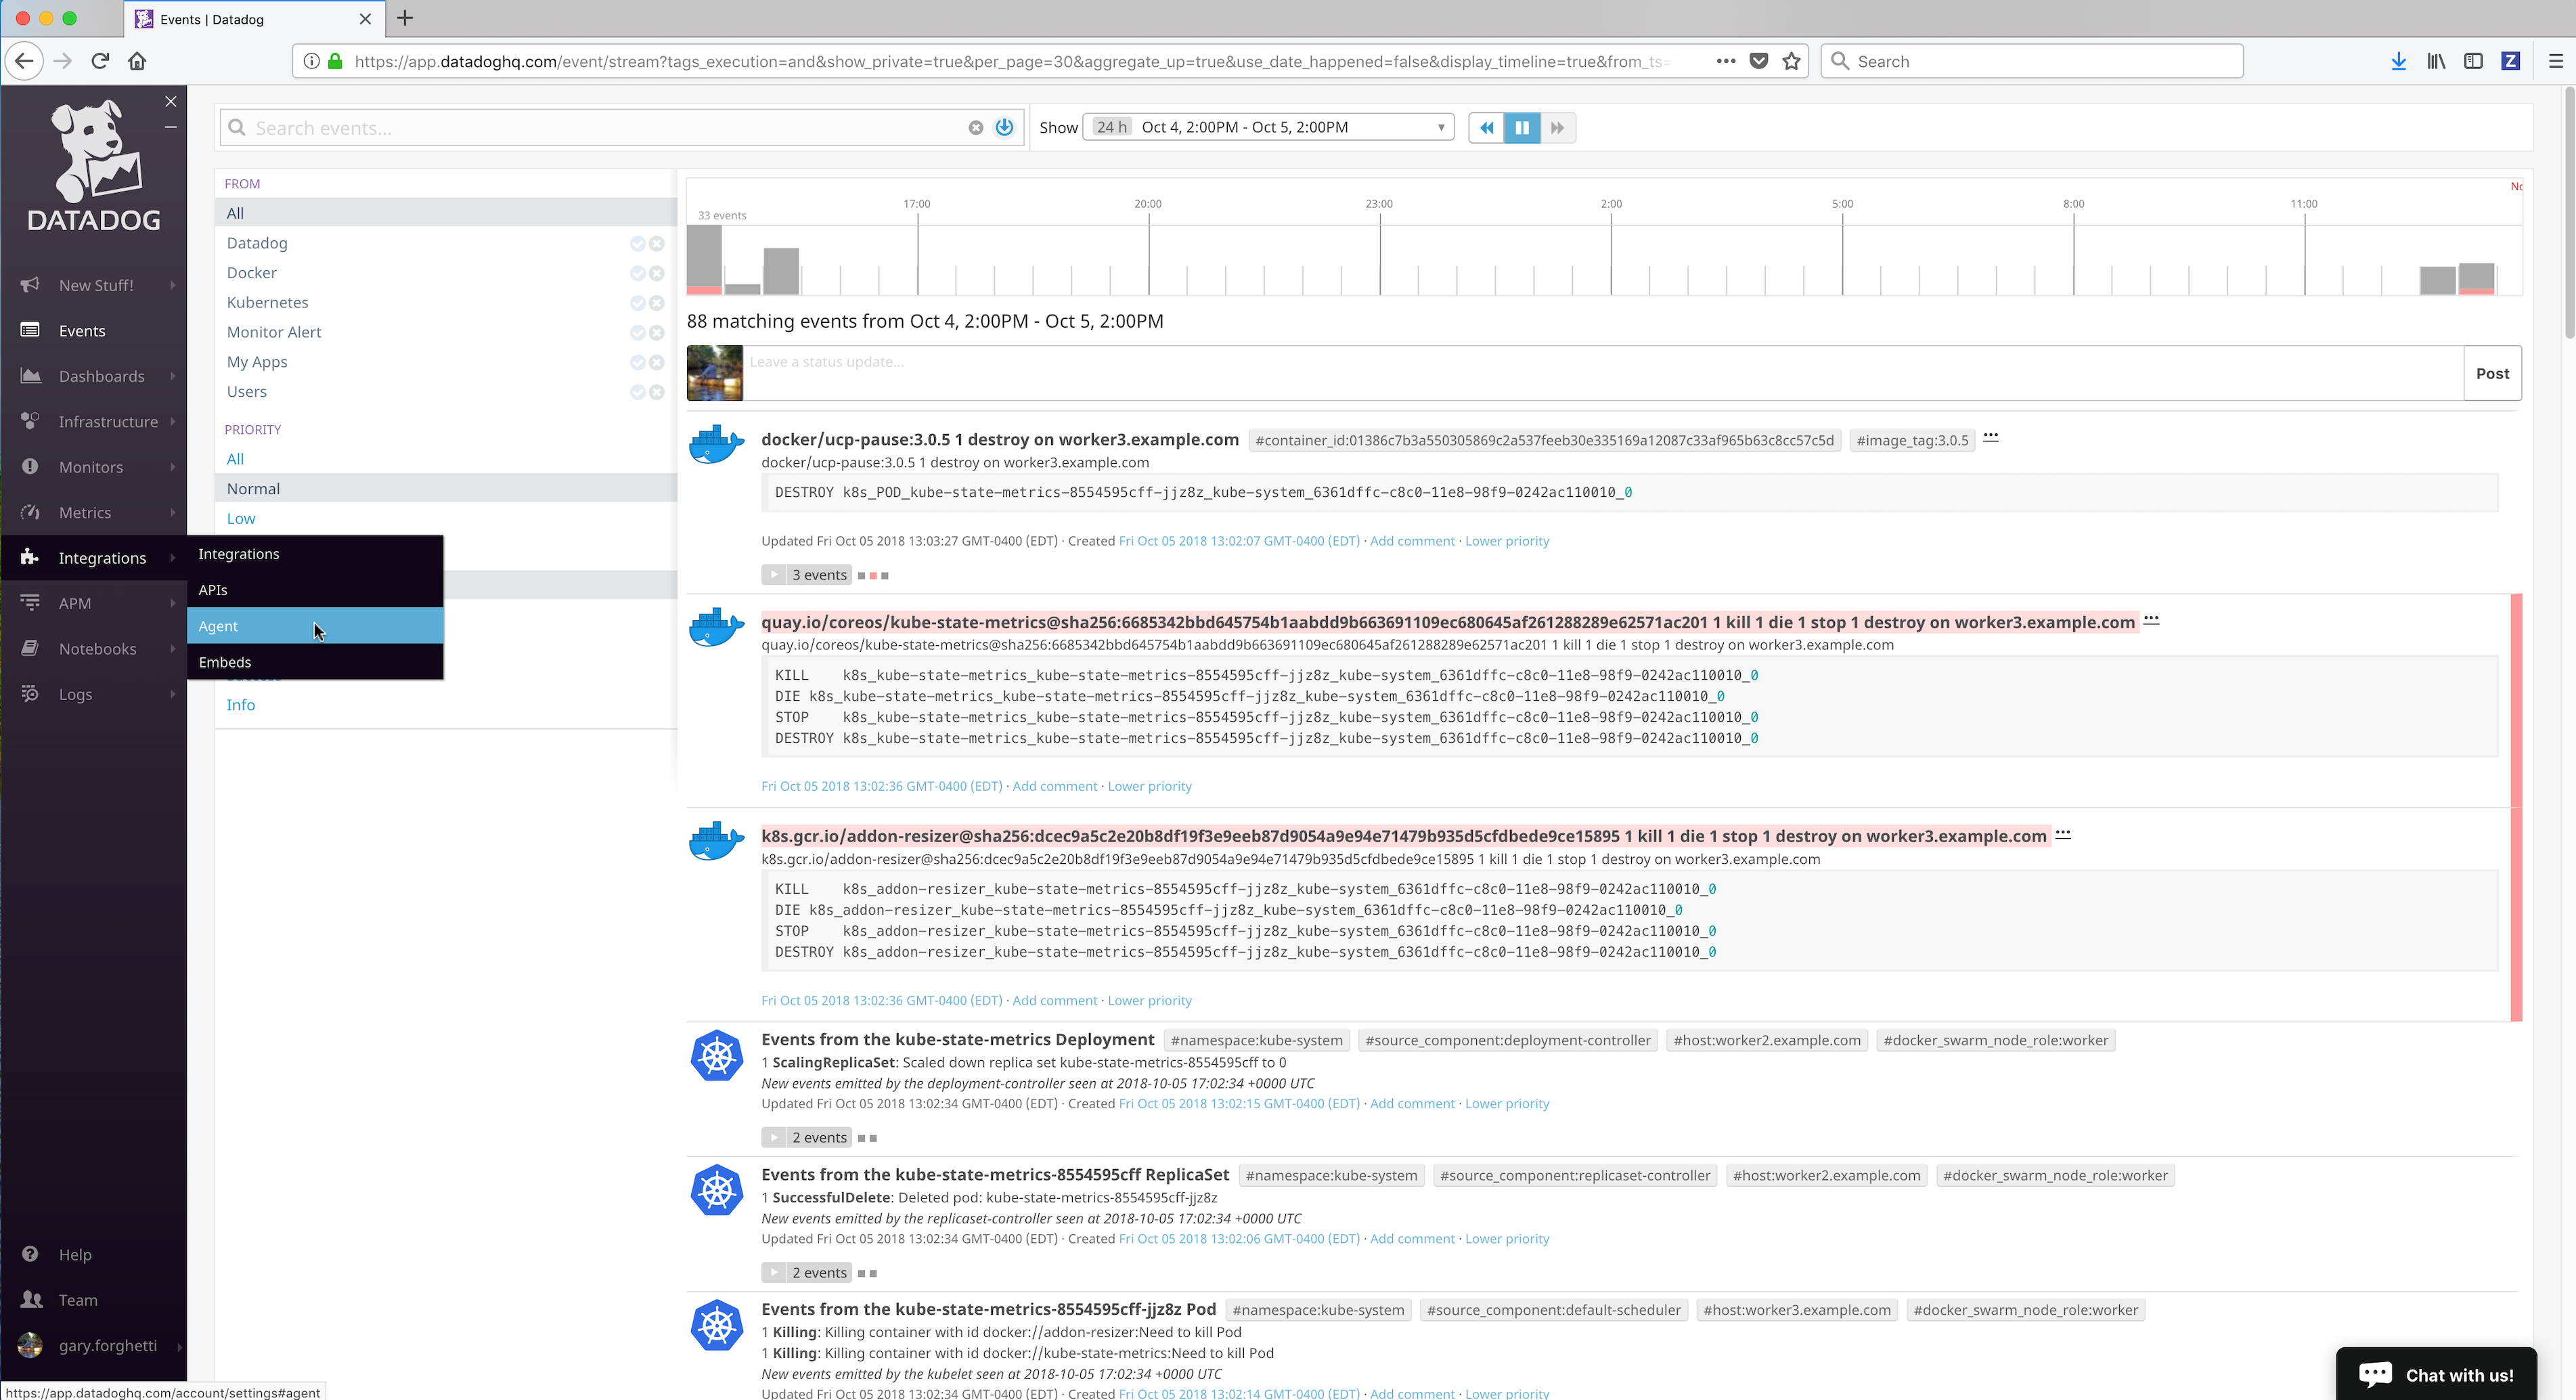
Click on the Integrations link in the left frame, then click on the Agent menu item.
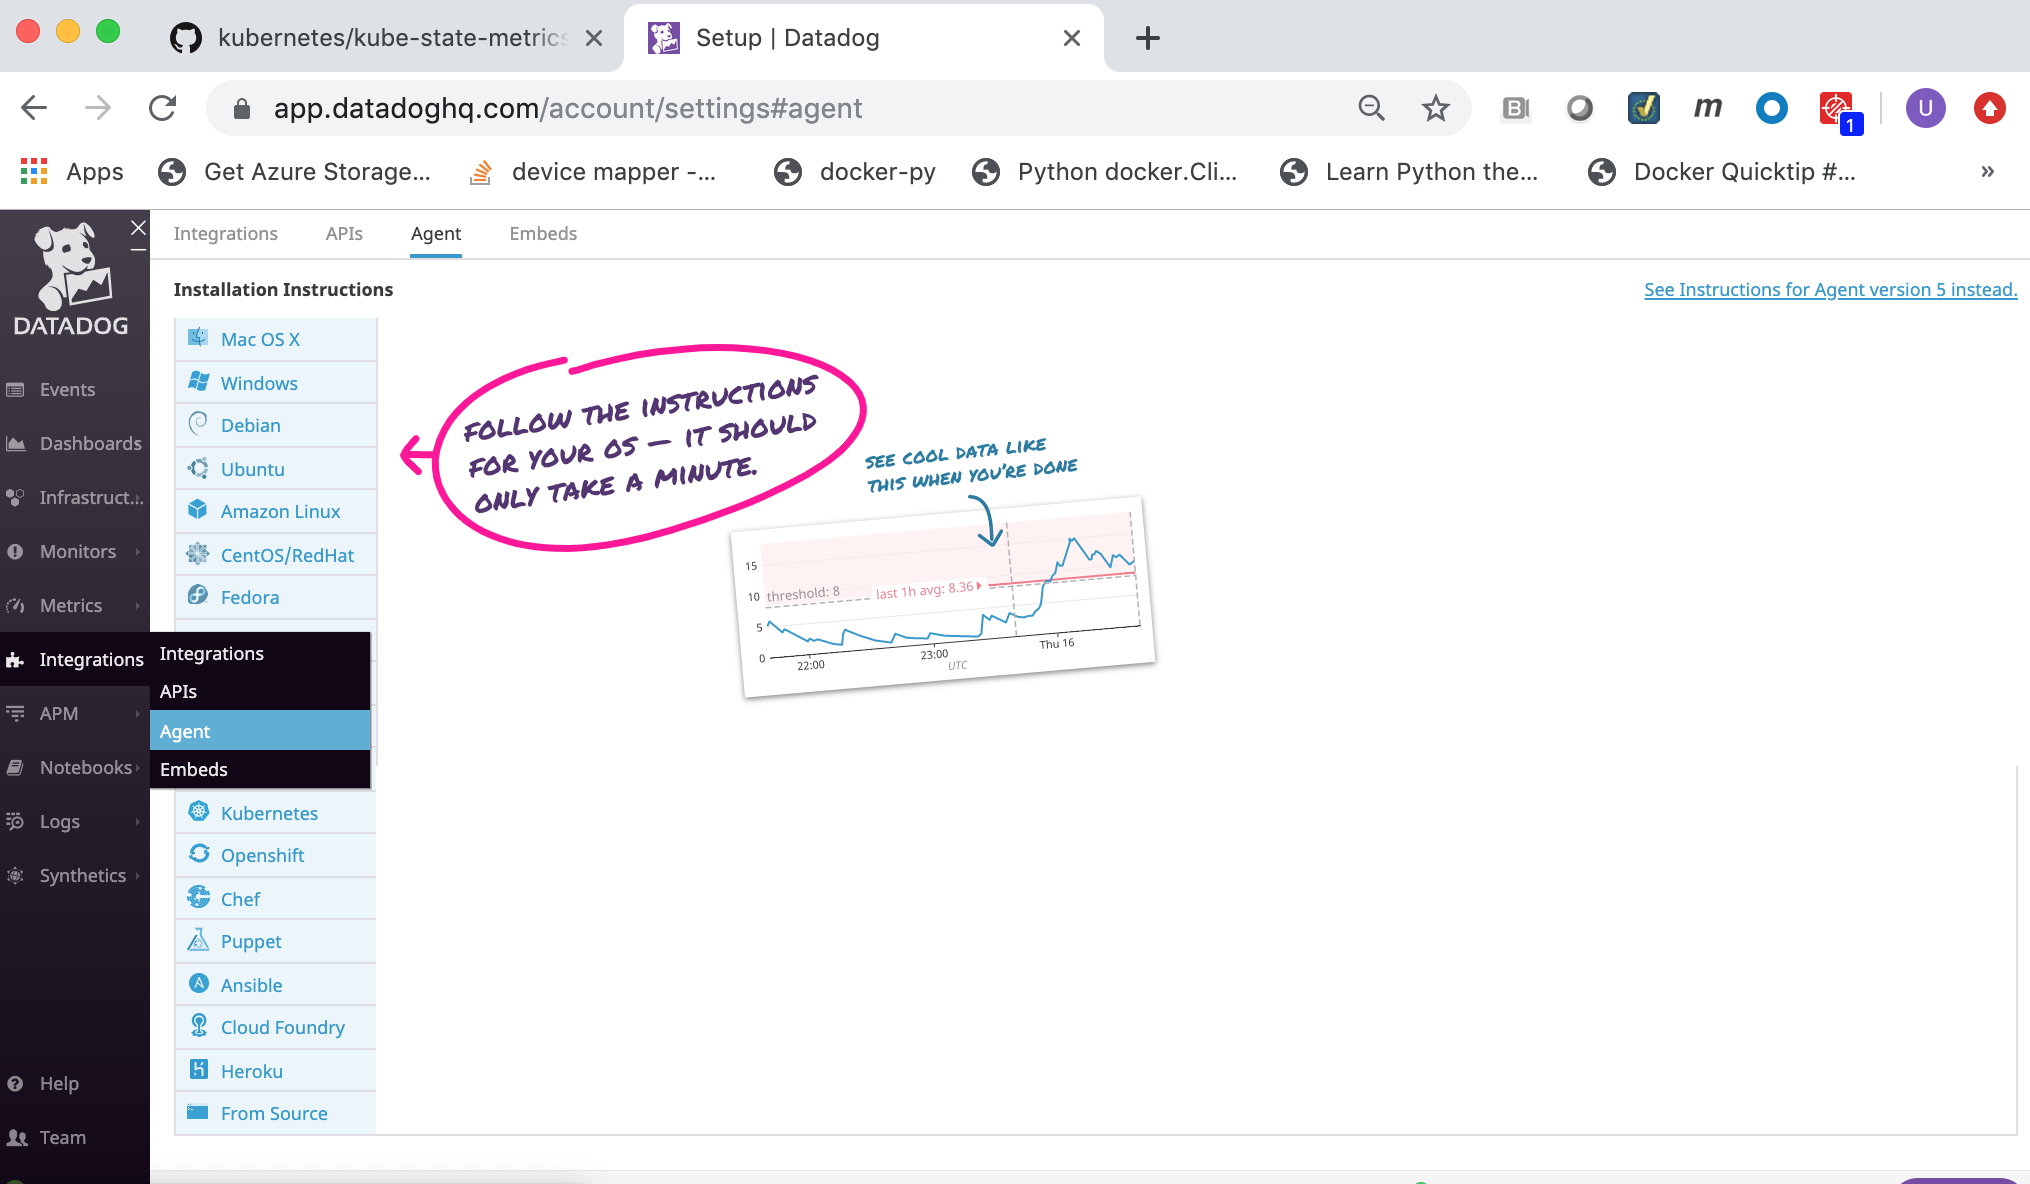
Click on the Docker link.
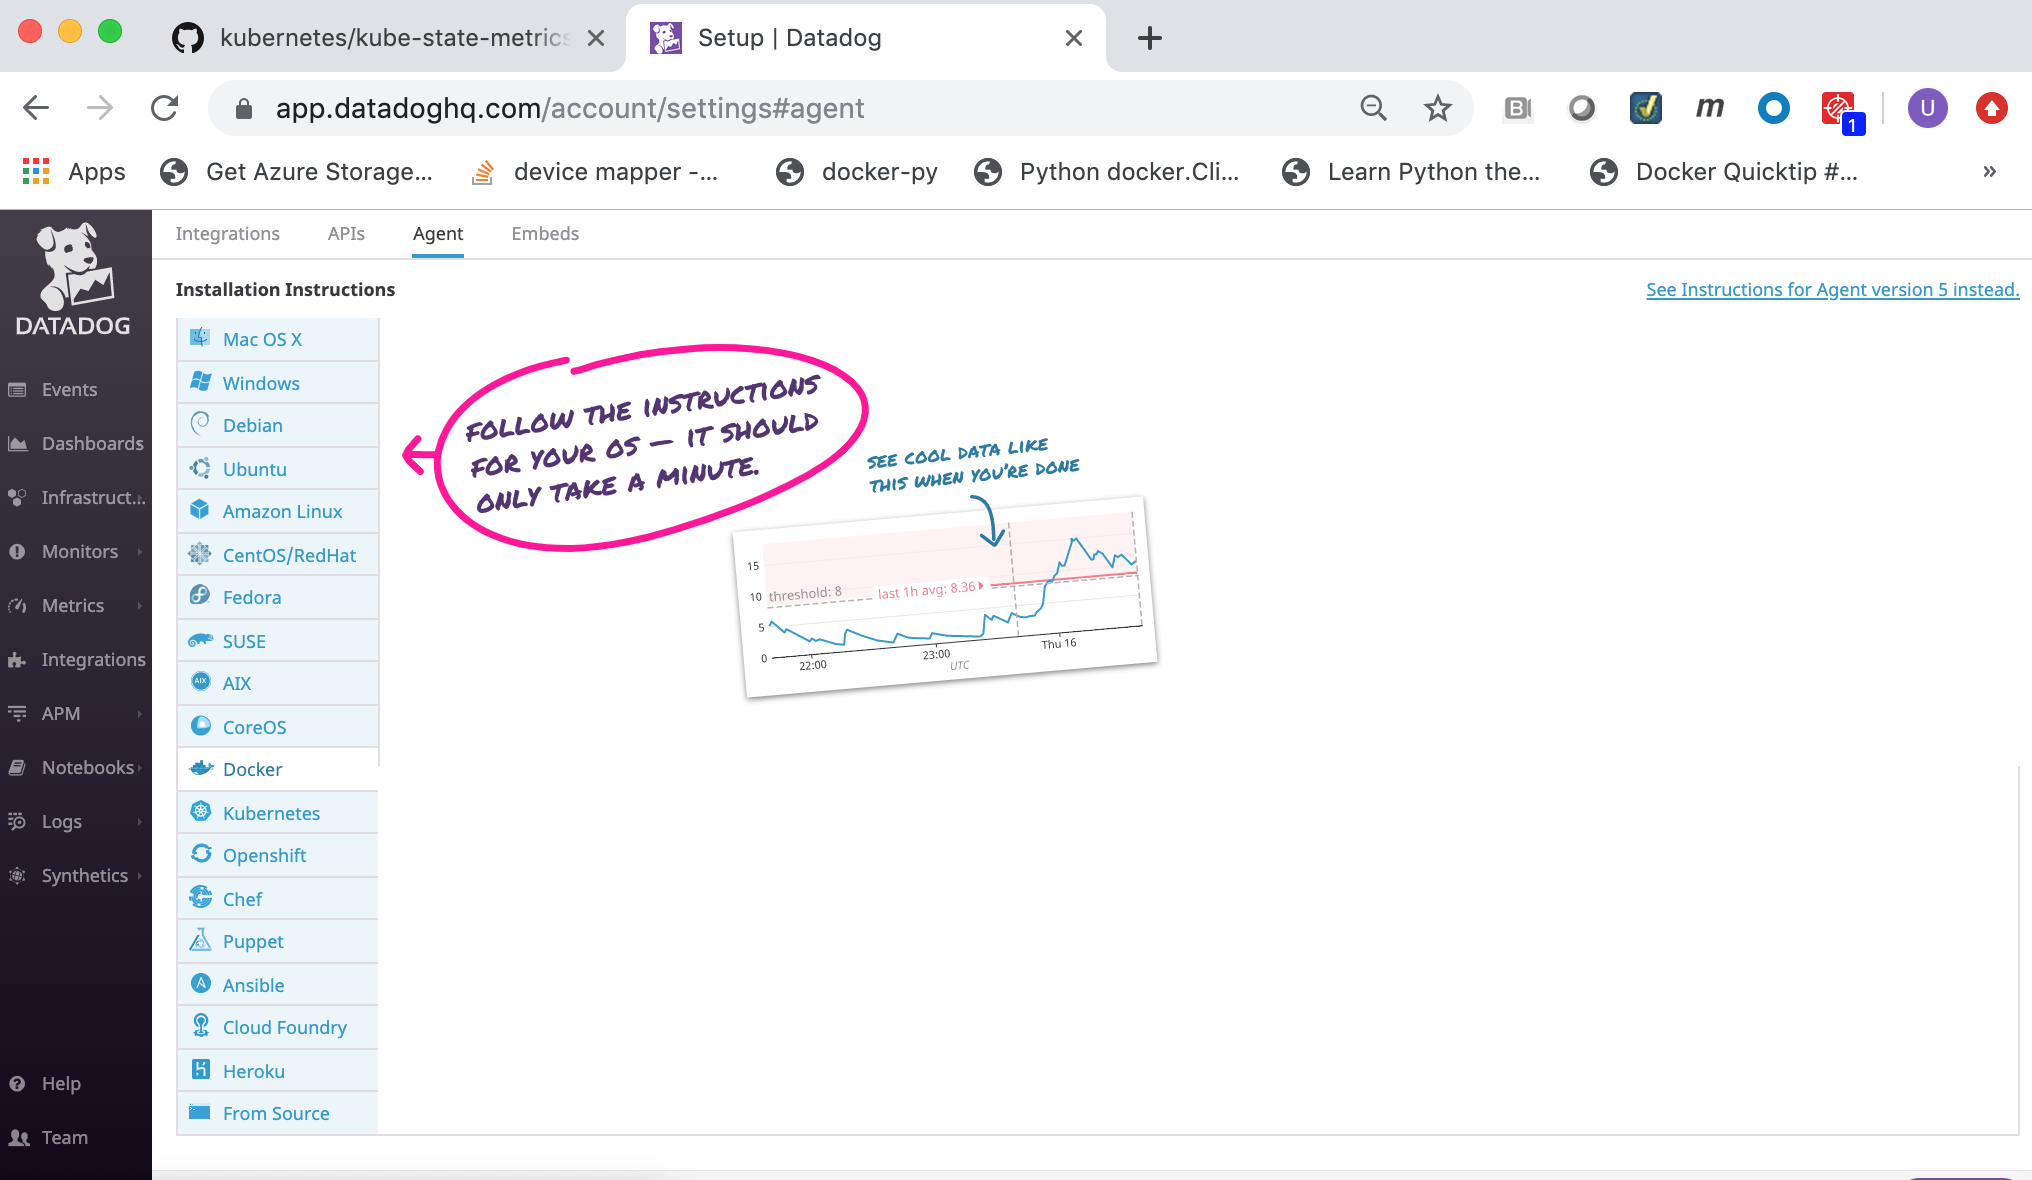
Select and copy the
Datadog API Key. You will need to specify theDatadog API Keyto the Datadog agent when deploying it.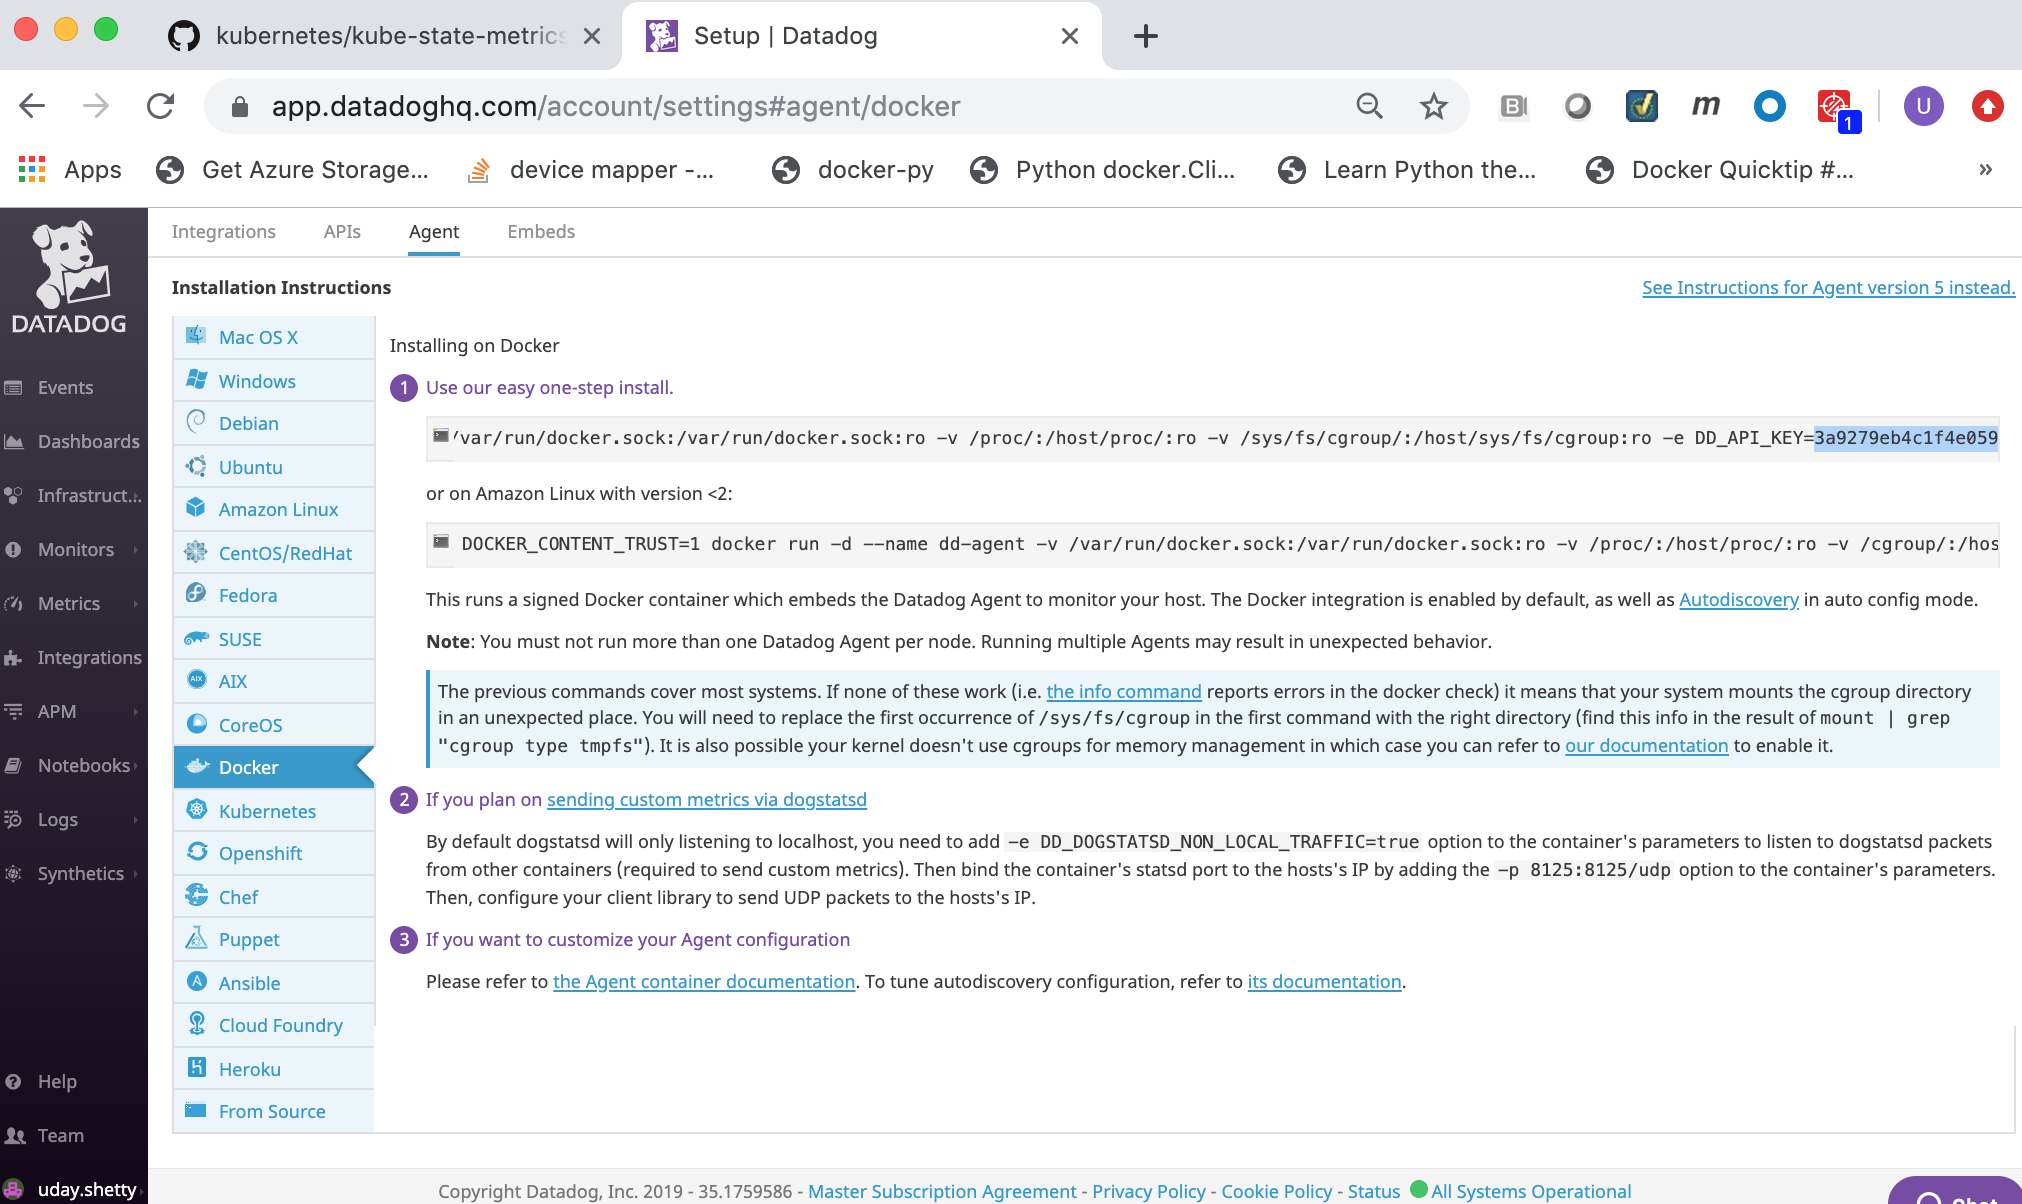
Volume Usage
The Datadog agent container requires the following volume mounts (read-only) for gathering metrics and logs.
/var/run/docker.sock:/var/run/docker.sock:ro/proc/:/host/proc/:ro/sys/fs/cgroup/:/host/sys/fs/cgroup:ro
Additional commands
Git client command
The Git client command was used in this Solution Brief to clone the Kubernetes State Metrics GitHub Repository. It was run on the Docker Enterprise client machine as part of the setup to deploy Kubernetes State Metrics prior to deploying the Elastic stack with Kubernetes Monitoring Integration on Docker Enterprise 3.0. Refer to the Git Getting Started - Installing Git web page for details on how to install the Git client if you need to install it.
curl Command
Some of the commands in this Solution Brief use the curl command.
If the curl command is not installed you can install it using the
instructions below for the Linux distributions:
Debian/Ubuntu
apt-get update -qq;apt-get install curl -y
CentOS/RHEL
yum makecache fast;yum install curl -y
For other Linux distributions you can download and install it from https://curl.haxx.se/download.html.
jq command
Some of the commands in this Solution Brief use the jq command to
format and display json output.
If the jq command is not installed you can install it using the
instructions below for the Linux distributions:
Debian/Ubuntu
$ apt-get update -qq;apt-get install jq -y
CentOS/RH
$ yum makecache fast;yum install jq -y
For other Linux distributions you can download and install it from https://github.com/stedolan/jq/wiki/Installation.
Configure your Docker Enterprise client command shell for Docker Enterprise MKE
This Solution Brief requires you to download a Docker Enterrise MKE client bundle and configure your command shell in order to run Docker Enterprise commands to your Docker Enterprise MKE Cluster. You can generate and download a Docker Enterprise MKE client bundle using the Docker Enterprise MKE Rest API or from your Docker Enterprise MKE Web UI.
Generate and download a MKE client bundle using the MKE Rest API
You can download a sample bash script named
get-docker-ee-ucp-client-bundle.sh from this GitHub Repository
get-docker-ee-ucp-client-bundle
which uses the Docker Enterprise MKE Rest API to generate and download a
Docker Enterprise MKE client bundle. You can then run the script which
will download a Docker Enterprise MKE client bundle.
Download the sample bash script get-docker-ee-ucp-client-bundle
Export your Docker Enterprise MKE user account and password as environment variables.
Example:
$ export DOCKER_USER="**your-docker-ee-ucp-user-account**"
$ export DOCKER_PASSWORD="**your-docker-ee-ucp-password**"
Generate and download a Docker Enterprise MKE Client Bundle.
Run the following command from the Docker Enterprise command shell. Replace
manager.example.comwith the hostname or IP address of your Docker Enterprise MKE manager.$ ./get-docker-ee-ucp-client-bundle.sh -d manager.example.com
Example:

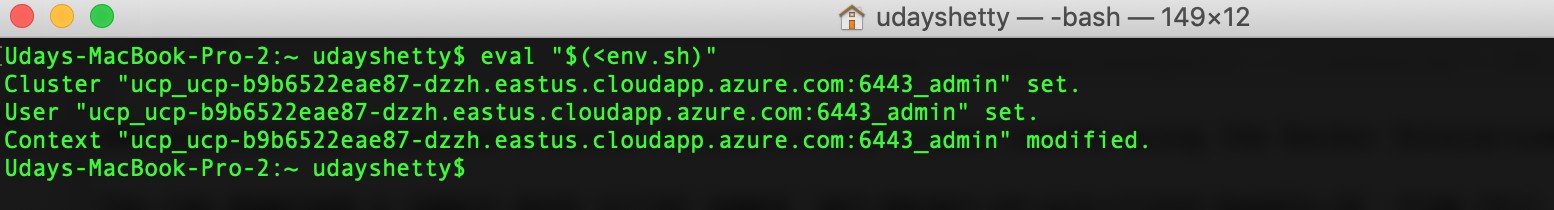
Configure your Docker Enterprise client command shell.
Run the following command from the Docker Enterprise command shell.
$ eval "$(<env.sh)"
Example:
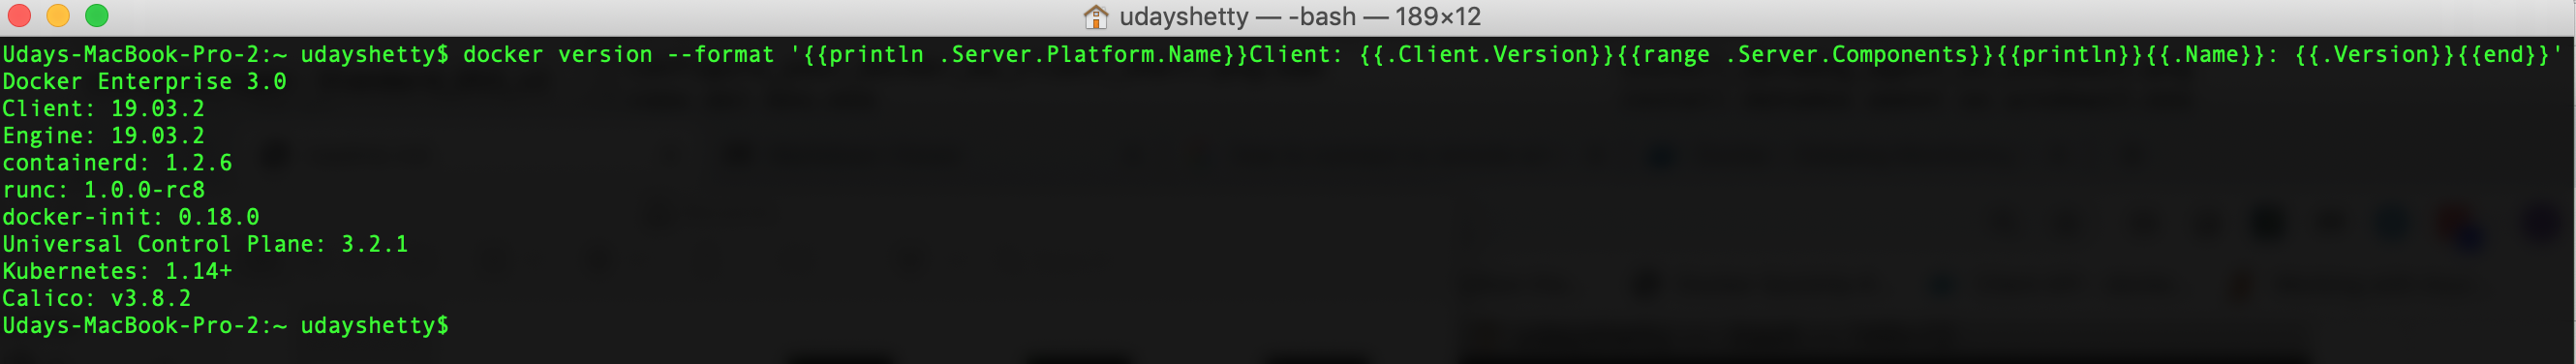
Test the Docker Enterprise MKE client bundle and configuration.
Run the docker version command from the Docker Enterprise client command shell.
$ docker version --format '{{println .Server.Platform.Name}}Client: {{.Client.Version}}{{range .Server.Components}}{{println}}{{.Name}}: {{.Version}}{{end}}'
Example:
Generate and download a MKE client bundle from your MKE Web UI
If you prefer, you can generate and download a Docker Enterprise MKE client bundle from your Docker Enterprise MKE Web UI.
Login to your Docker Enterprise MKE Cluster Web UI using your Docker ID and password.

Click on your account name and then click on My Profile

Click on the New Client Bundle button then Generate Client Bundle button.

Locate the generated client bundle archive file and unzip it.
Note
The generated client bundle archive file will be downloaded to whatever folder your browser’s Download folder is configured for. You may have to move the generated client bundle archive file to the Docker Enterprise client machine if it is a different machine than the machine you downloaded it on.
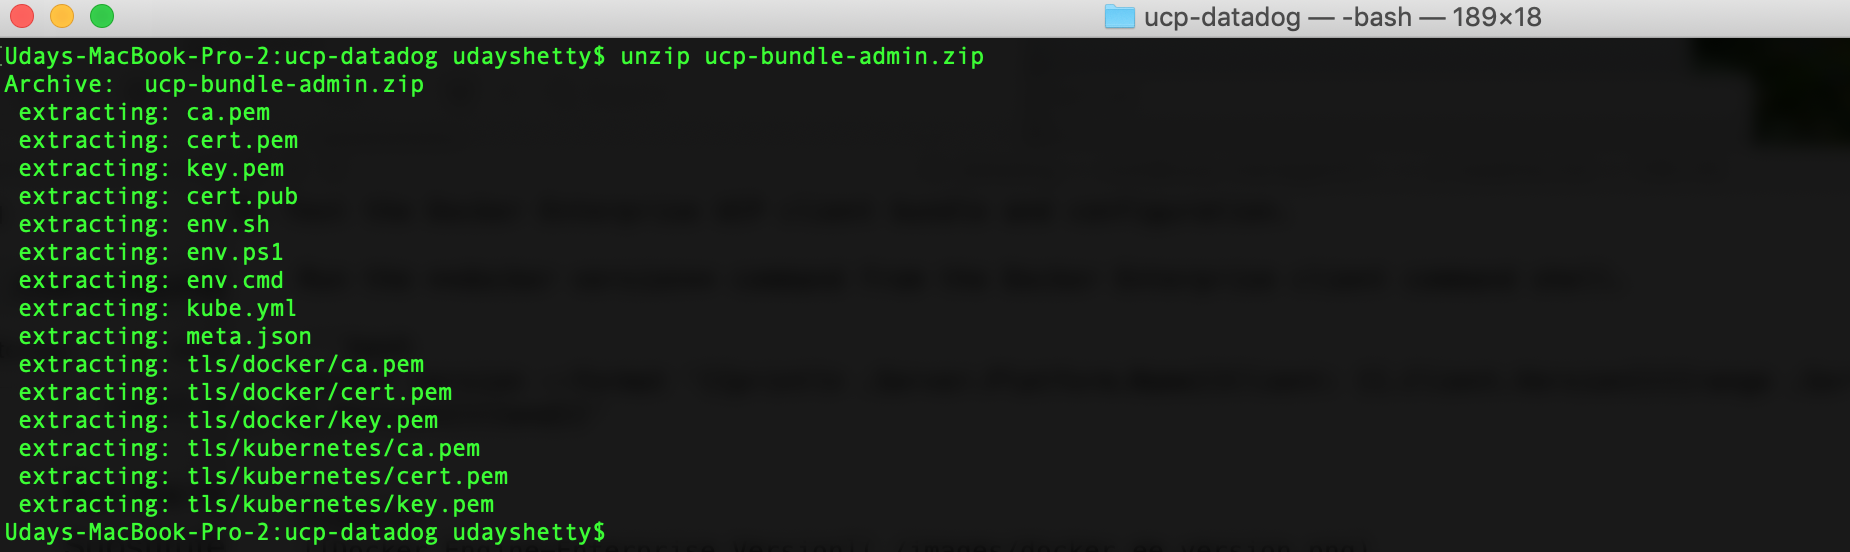
Run the following command from the Docker Enterprise client command shell to unzip the client bundle archive file. Substitute your generated client bundle archive file name.
$ unzip ucp-bundle-admin.zip
Example:
Configure your Docker Enterprise client command shell.
Run the following command from the Docker Enterprise command shell.
$ eval "$(<env.sh)"
Example:
Test the Docker Enterprise MKE client bundle and configuration.
Run the docker version command from the Docker Enterprise client command shell.
$ docker version --format '{{println .Server.Platform.Name}}Client: {{.Client.Version}}{{range .Server.Components}}{{println}}{{.Name}}: {{.Version}}{{end}}'
Example:
Kubernetes kubectl command
The Kubernetes kubectl command must be installed on the Docker
Enterprise client machine. Refer to Install and Set Up
kubectl
to download and install the version of the kubectl command that
matches the version of Kubernetes included with the Docker Enterprise
version you are running. You can run the docker version command to
display the version of Kubernetes installed with Docker Enterprise.
Deploying Kubernetes workloads in Docker Enterprise MKE
In this Solution Brief the Datadog Agent will be deployed as a Kubernetes DaemonSet. A Kubernetes DaemonSet can be used to ensure that an application or service container runs on every node in the cluster. Monitoring and logging type applications and services typically require this type of deployment. However, in Docker Enterprise MKE the deployment of a Kubernetes DaemonSet is affected by the Docker Enterprise MKE orchestrator type that is set on the node. A node in a Docker Enterprise MKE Cluster environment contains both the Mirantis Container Runtime (aka the Docker daemon) and the Kubernetes Agent (aka the Kubernetes kubelet). A node can be configured to run containers deployed by Docker and/or Kubernetes by setting the Docker Enterprise MKE orchestrator type on the node to one of the 3 types below.
- Swarm - Only containers deployed using the Docker CLI and Mirantis Container Runtime API can run on this node.
- Kubernetes - Only containers deployed using the Kubernetes CLI and Kubernetes API can run on this node.
- Mixed - Containers deployed with Swarm or Kubernetes can run on this node. This is not recommended for production.
By default, Docker Enterprise MKE will not deploy a Kubernetes orchestrated container to a node whose orchestrator type is configured as Swarm. That presents a problem to an application or service that needs a container running on all nodes. To ensure that these types of applications and services run all on nodes, you need to deploy the application or service as a Kubernetes DaemonSet in the Kubernetes kube-system namespace. Containers deployed in the Kubernetes kube-system namespace will run on all nodes regardless of the Docker Enterprise MKE orchestrator type. The Datadog Agent needs to run on all nodes in the Docker Enterprise MKE Cluster so it needs to be deployed as a Kubernetes DaemonSet in the Kubernetes kube-system namespace.
Refer to Docker Enterprise Platform for more information on Docker Enterprise and Orchestration.
Deploying Datadog in Docker Enterprise
Deploying Datadog on Docker Enterprise 3.0 with Kubernetes Monitoring Integration.
In addition, there is an example of installing Datadog Windows Integration and the Datadog Agent on Windows.
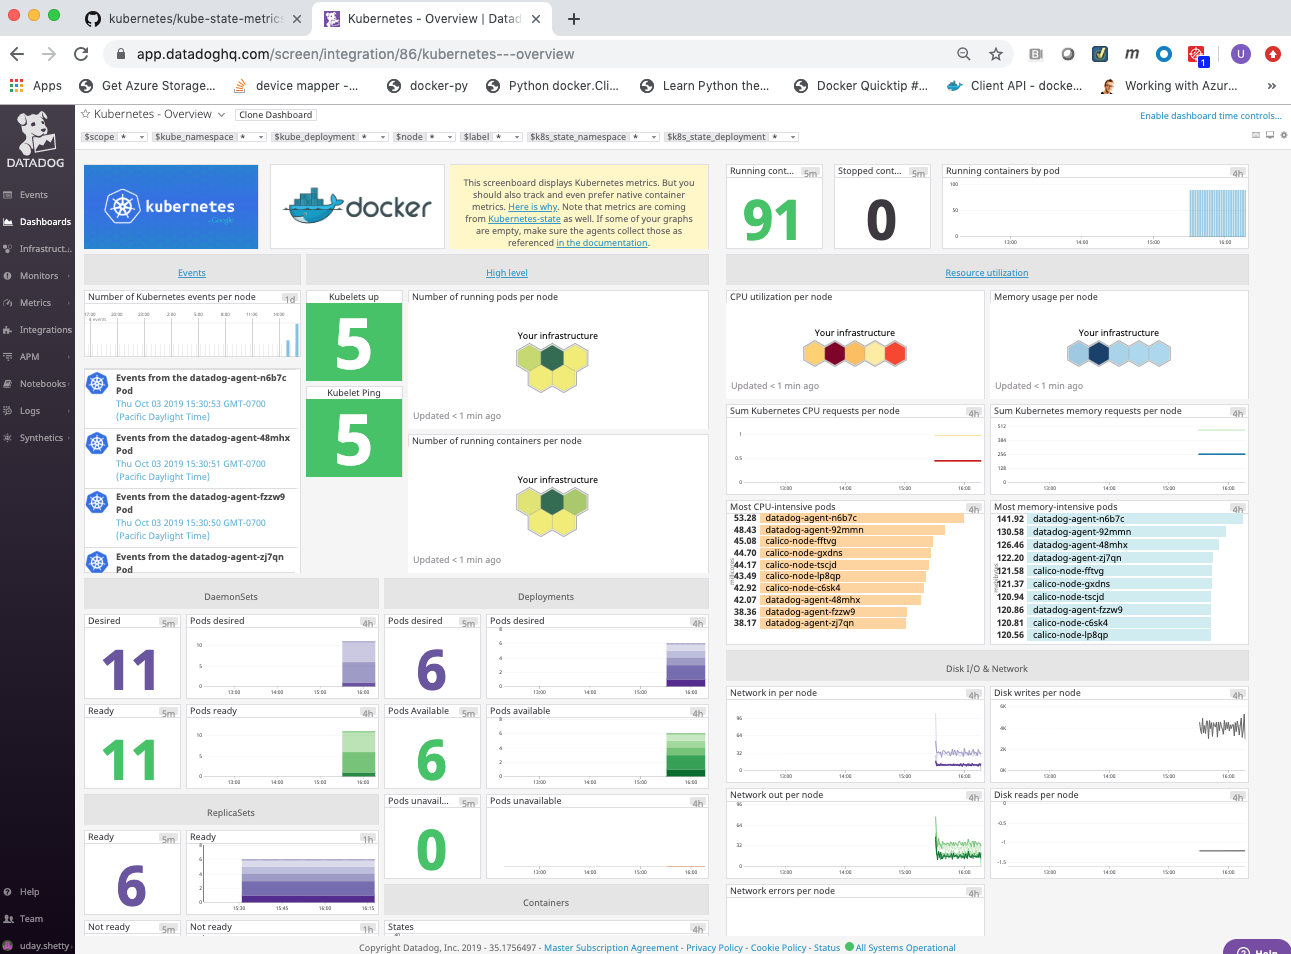
This example demonstrates how to deploy Datadog with Kubernetes Monitoring Integration to monitor your infrastructure on Docker Enterprise 3.0
Note
The Datadog agent needs to be deployed in the kube-system namespace in the Docker Enterprise MKE environment. This will ensure that the Datadog agent container is deployed on all nodes in the Docker Enterprise MKE Cluster and that it can discover and collect Kubernetes State Metrics.
Kubernetes State Metrics
Note
If you wish to deploy Datadog with Kubernetes Monitoring Integration you need to deploy Kubernetes State Metrics prior to deploying Datadog with Kubernetes Monitoring Integration.
Kubernetes State Metrics is a simple service that listens to the Kubernetes API server and generates metrics about the state of the objects. It is not focused on the health of the individual Kubernetes components, but rather on the health of the various objects inside, such as deployments, nodes and pods.
Datadog has integration with Kubernetes State Metrics and will collect the metrics and has a dashboard which displays the Kubernetes State Metrics. In this Solution Brief Kubernetes State Metrics will be deployed and integrated with Datadog.
See also
Refer to the Kubernetes State Metrics GitHub repository for more documentation and the latest Kubernetes manifest files at this link: https://github.com/kubernetes/kube-state-metrics.
Deploy Kubernetes State Metrics
The Kubernetes Manifest files to deploy Kubernetes State Metrics are hosted and maintained on GitHub in the kube-state-metrics Repository. Run the following
gitcommand below from the Docker Enterprise client command shell to clone the kube-state-metrics GitHub repository.$ git clone https://github.com/kubernetes/kube-state-metrics.git
Deploy Kubernetes State Metrics.
Run the following commands from the MKE client command shell to deploy Kubernetes State Metrics.
$ cd kube-state-metrics
$ kubectl apply -f examples/standard
Display the Kubernetes State Metrics Deployment.
Run the following command from the MKE client command shell.
  $ kubectl get deployment kube-state-metrics --namespace kube-system -o wide

Example:

.. image:: ../_images/datadog/display_kube_state_metrics_deployment.png
   :width:
   :alt: Display Kubernetes State Metrics
Display the pod deployed by the Kubernetes State Metrics Deployment.
Run the following command from the MKE client command shell.
  $ kubectl get pods --namespace kube-system -o wide

Example:

.. image:: ../_images/datadog/display_kube_state_metrics_deployment_pod.png
   :width: 100%
   :alt: Display Kubernetes State Metrics Pod
You can display detailed information on the Kubernetes State Metrics pod.
Run the following
kubectl describe podcommand below from the MKE client command shell. Change the pod name to match the Kubernetes State Metrics pod which was deployed.$ kubectl describe pod --namespace kube-state-metrics-78f8b6786b-qg8wc
Check the Kubernetes State Metrics pod logs for any errors.
Note
A Kubernetes State Metrics pod contains 2 containers: kube-state-metrics and addon-resizer.
Run the following
kubectl logscommands below from the Docker MKE client command shell. Change the pod name to match the Kubernetes State Metrics pod which was deployed.$ kubectl logs --namespace kube-system kube-state-metrics-78f8b6786b-qg8wc --container kube-state-metrics | grep -i 'Error' $ kubectl logs --namespace kube-system kube-state-metrics-78f8b6786b-qg8wc --container addon-resizer | grep -i 'Error'
Create a Kubernetes secret named dd-api-key to contain the value of your
Datadog API Key.Run the following command from the Docker Enterprise client command shell. Change the text **datadog-api-key** to your
Datadog API Key.$ kubectl create secret generic dd-api-key --namespace kube-system --from-literal=api-key='**datadog-api-key**'
Example:

Download the sample
deploy-datadog-agent-with-kubernetes-monitoring-integration.yamlincluded with this solution brief which contains the Kubernetes DaemonSet manifest to deploy the Datadog agent at this link:deploy-datadog-agent-with-kubernetes-monitoring-integration.yamlNote
The sample
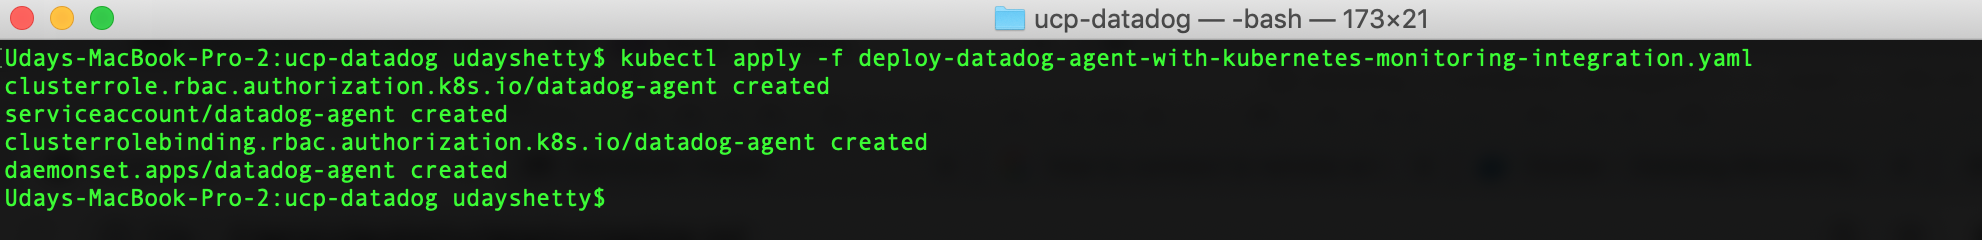
deploy-datadog-agent-with-kubernetes-monitoring-integration.yamlincluded with this solution brief has been customized for Docker Enterprise. Datadog provides sample Kubernetes daemonset yaml files at this link: https://github.com/DataDog/datadog-agent. For additional information on deploying the Datadog agent on Kubernetes refer to: Kubernetes DaemonSet Setup.Deploy the Datadog agents with Kubernetes Monitoring Integration on all Docker Enterprise MKE Cluster nodes.
Run the following command from the Docker Enterprise client command shell.
$ kubectl apply -f deploy-datadog-agent-with-kubernetes-monitoring-integration.yaml
Example:
Wait a few minutes for the Datadog environment to start up and become fully initialized.
Display the Datadog Agent DaemonSet.
Run the following command from the Docker Enterprise client command shell.
$ kubectl get daemonset --namespace kube-system datadog-agent -o wide
Example:

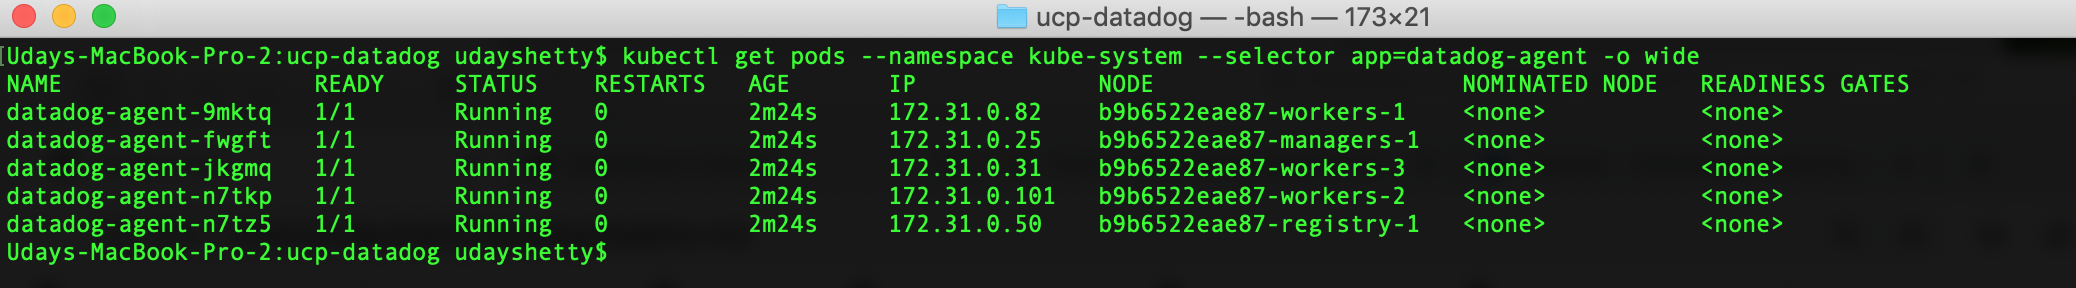
Display the Datadog Agent DaemonSet Pods.
Run the following command from the Docker Enterprise client command shell.
$ kubectl get pods --namespace kube-system --selector app=datadog-agent -o wide
Example:
You can display detailed information on a Datadog agent DaemonSet Pod.
Run the following
kubectl describe podcommand below from the Docker Enterprise client command shell. Change the pod name to match a Datadog agent pod which was deployed.$ kubectl describe pod --namespace kube-system datadog-agent-fwgft
You can check a Datadog agent DaemonSet Pod logs for any errors.
Run the following
kubectl logscommand below from the Docker Enterprise client command shell. Change the pod name to match a Datadog agent pod which was deployed.$ kubectl logs --namespace kube-system datadog-agent-fwgft | grep -i 'Error'
Install Datadog Windows Integration and the Windows Datadog Agent
Install Datadog Windows Integration
Click on the Integrations link in the left frame, then click on the Integrations menu item.
Locate and click on the Windows Service integration icon/button to install it.
Click on the Configuration tab and then click on the Install Integration button. The install takes a few seconds.
After the installation completes, refresh the page and scroll to the top. The Windows Service Integration will appear as Installed.
Install the Windows Datadog agent on a Windows Docker Enterprise MKE node
Click on the Integrations link in the left frame, then click on the Agent menu item.
Right click the Download the Datadog Agent installer link and copy the link.
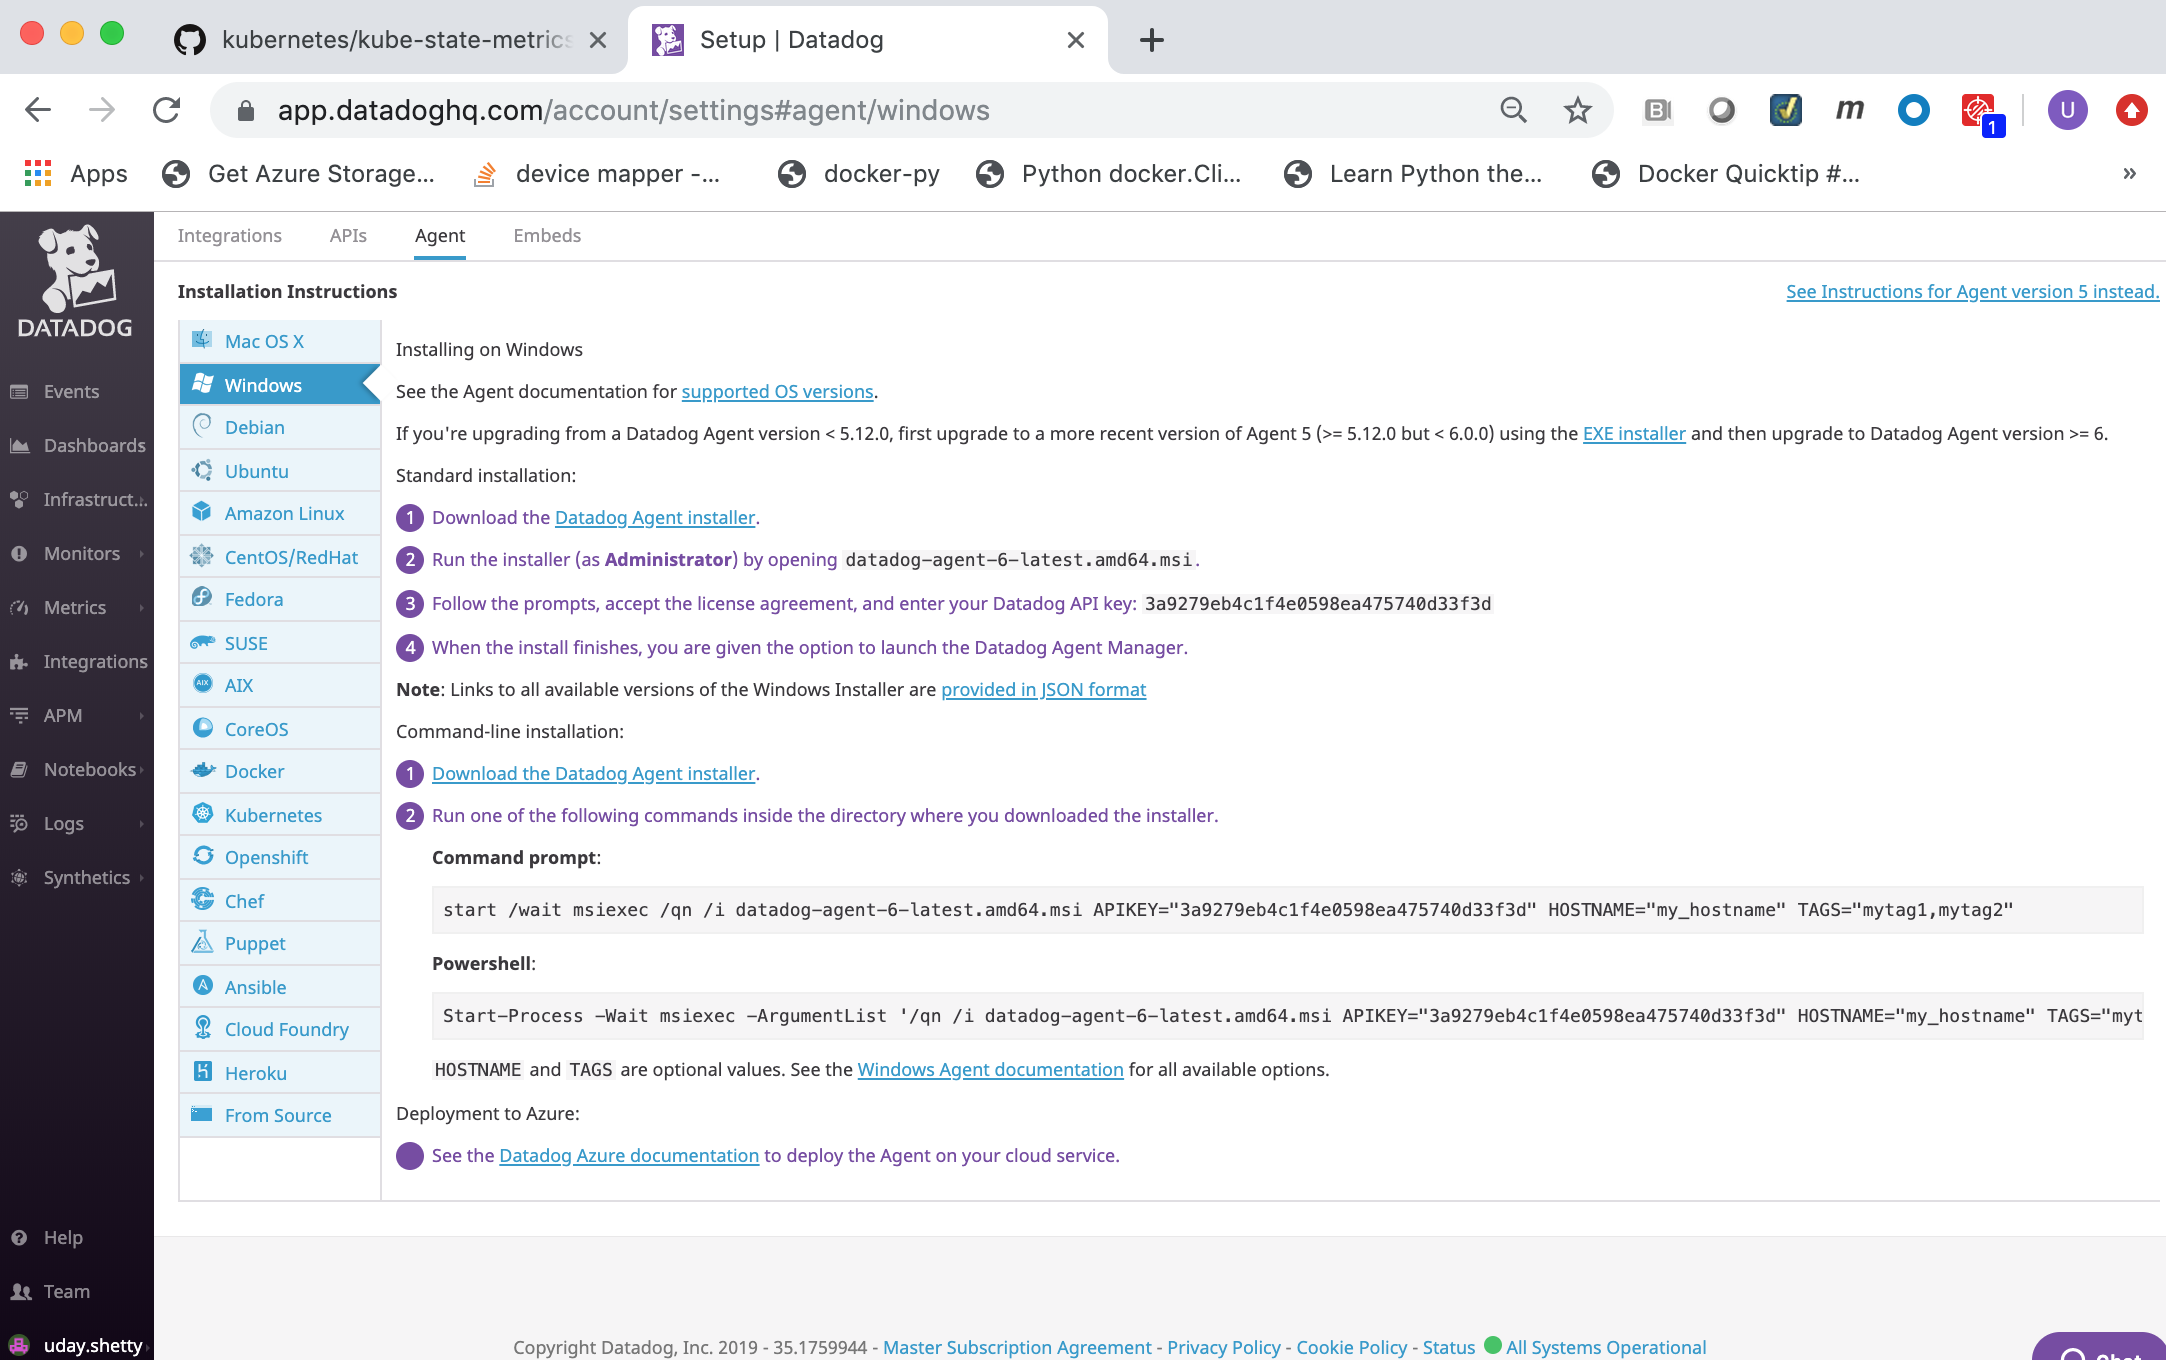
- Run the following
iwrcommand from a from a Windows Powershell command prompt on the Docker Enterprise Windows Node to download the Datadog Agent installer. Replace **datadog-windows-installer-download-link** with the link you copied in the previous step.
   > iwr **datadog-windows-installer-download-link** -outfile datadog-agent-installer-windows.msi

Example:

.. image:: ../_images/datadog/install_datadog_agent_on_windows4.png
   :width: 100%
   :alt: Install Datadog Agent on Windows
Run the following command from a Windows Powershell command prompt on the Docker Enterprise Windows Node. Change **datadog-api-key** to your
Datadog API Key.Note: Refer to Datadog Basic Agent Usage for Windows documentation for more details on installing the Datadog Agent on Windows including the installation parameters.
    Start-Process -Wait msiexec -ArgumentList '/qn /i datadog-agent-installer-windows.msi APM_ENABLED="true" LOGS_ENABLED="true" PROCESS_ENABLED="true" APIKEY="**datadog-api-key**"'

Example:

.. image:: ../_images/datadog/install_datadog_agent_on_windows5.png
   :width: 100%
   :alt: Install Datadog Agent on Windows

.. Note::

   The Datadog Agent is being installed silently in the
   background. It may take a few minutes for the installation to
   complete.
- Run the following command from a Windows Powershell command prompt on the Docker Enterprise Windows Node to display the Datadog Agent Windows services.
   > get-service -name "Datadog*"

Example:

.. image:: ../_images/datadog/display_datadog_agent_on_windows.png
   :width: 100%
   :alt: Display Datadog Agent on Windows
Note
At the time of testing Windows 2019, there’s no Docker for Windows and Kubernetes for Windows support.
Display the Datadog Agents from the Datadog Monitor Web portal
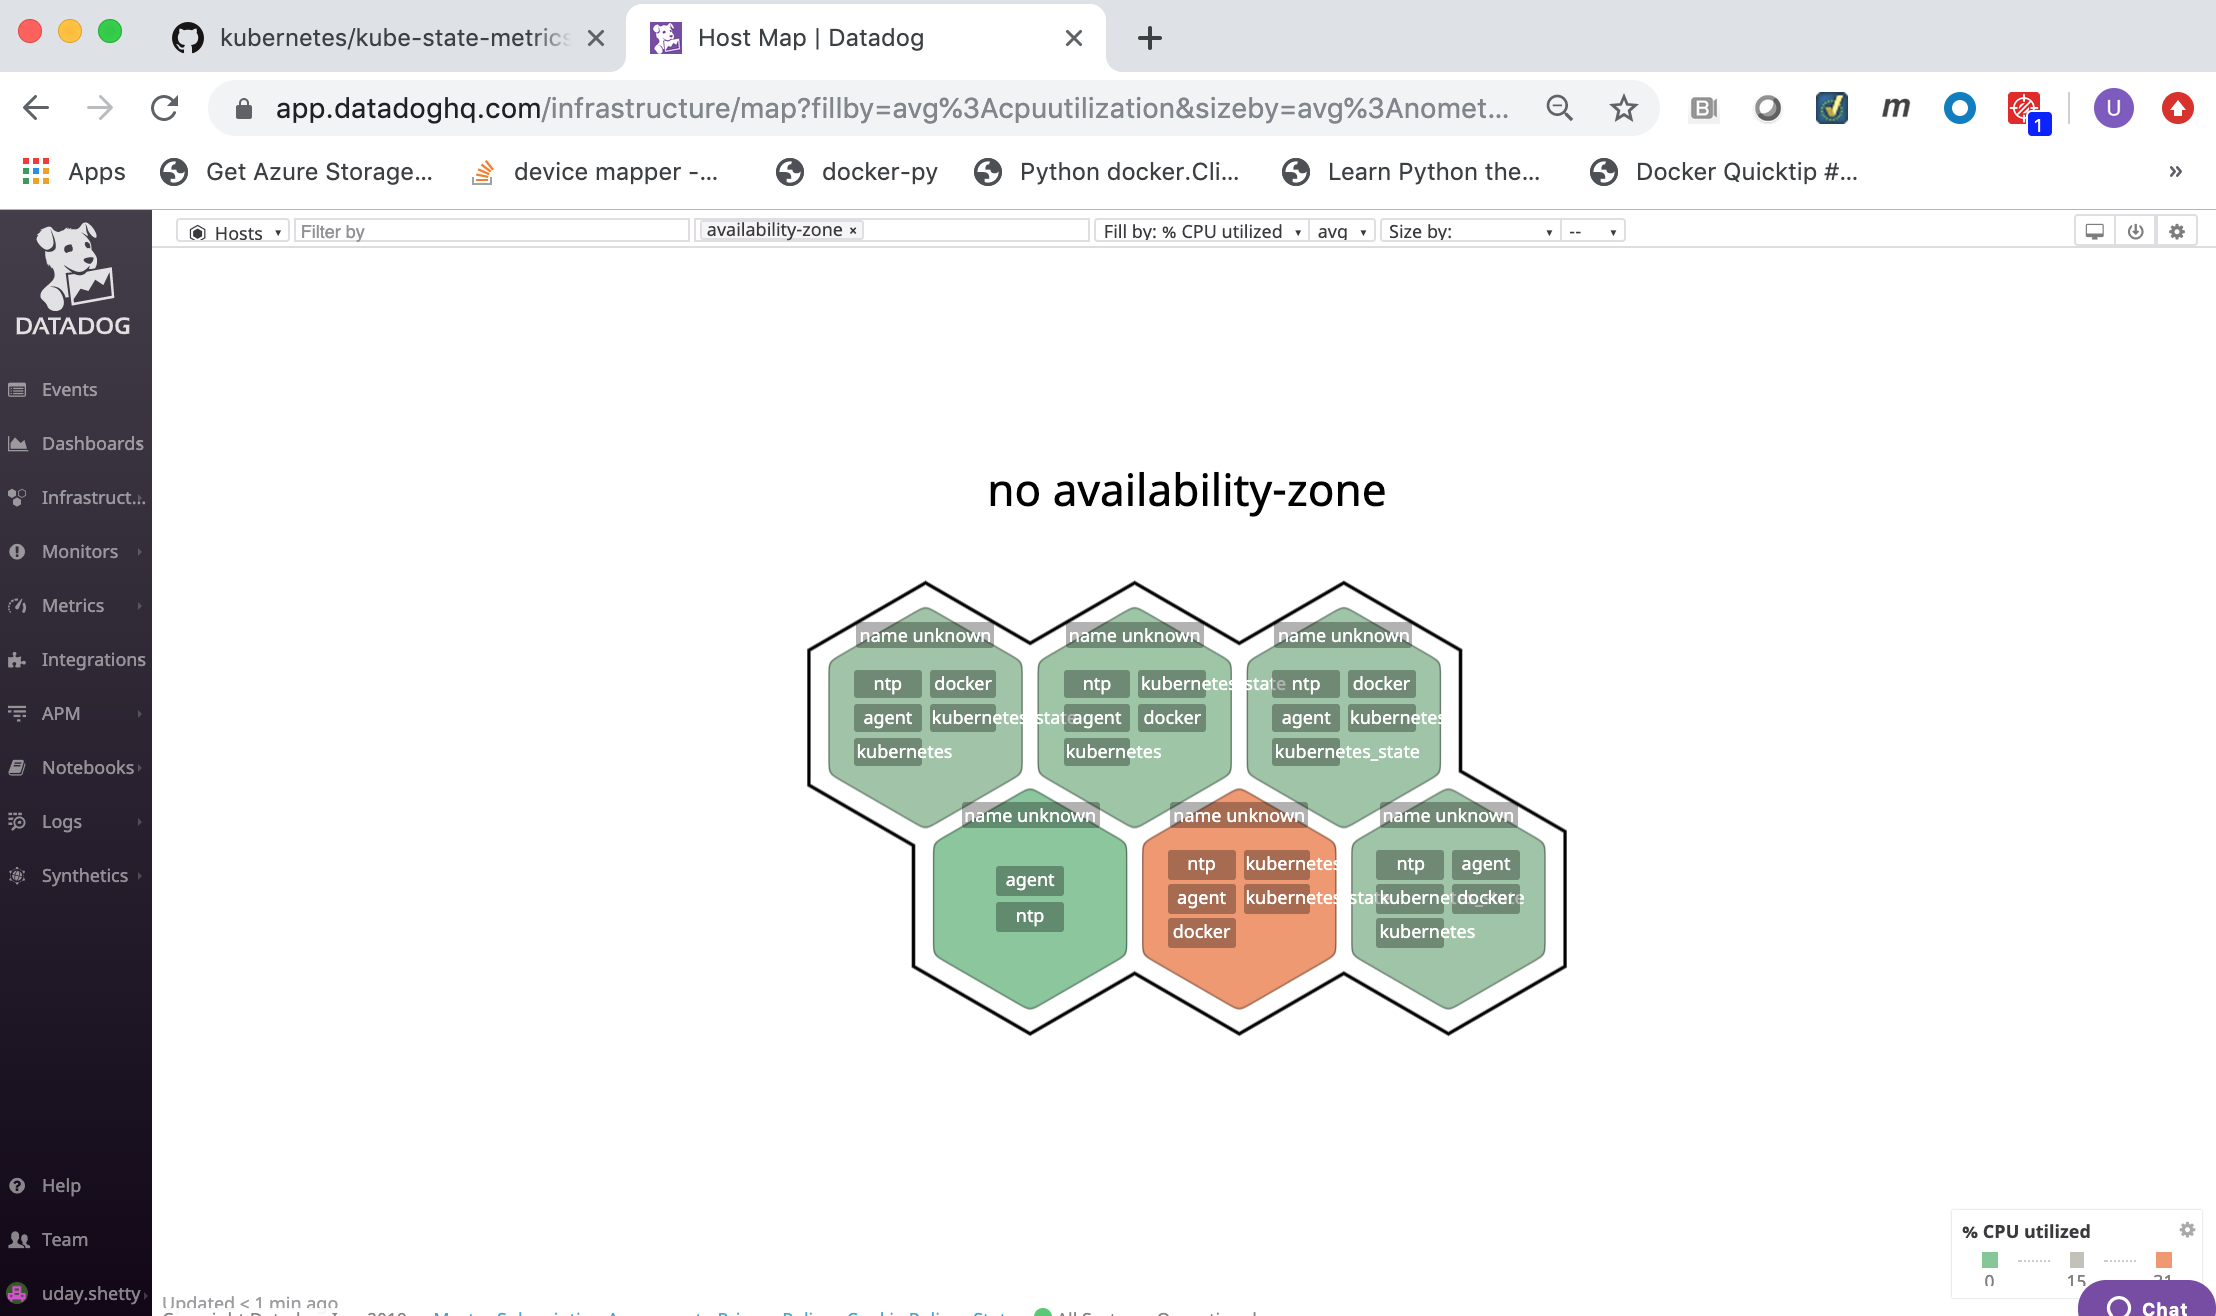
You can view the deployed Datadog agent from the Datadog Web portal Host Map page.
From the Datadog Monitor Web portal click on the Infrastructure link in the left frame and then click on the Host Map link.
Datadog Web Interface
The Datadog Web Interface has the following modules:
| Module | Description |
|---|---|
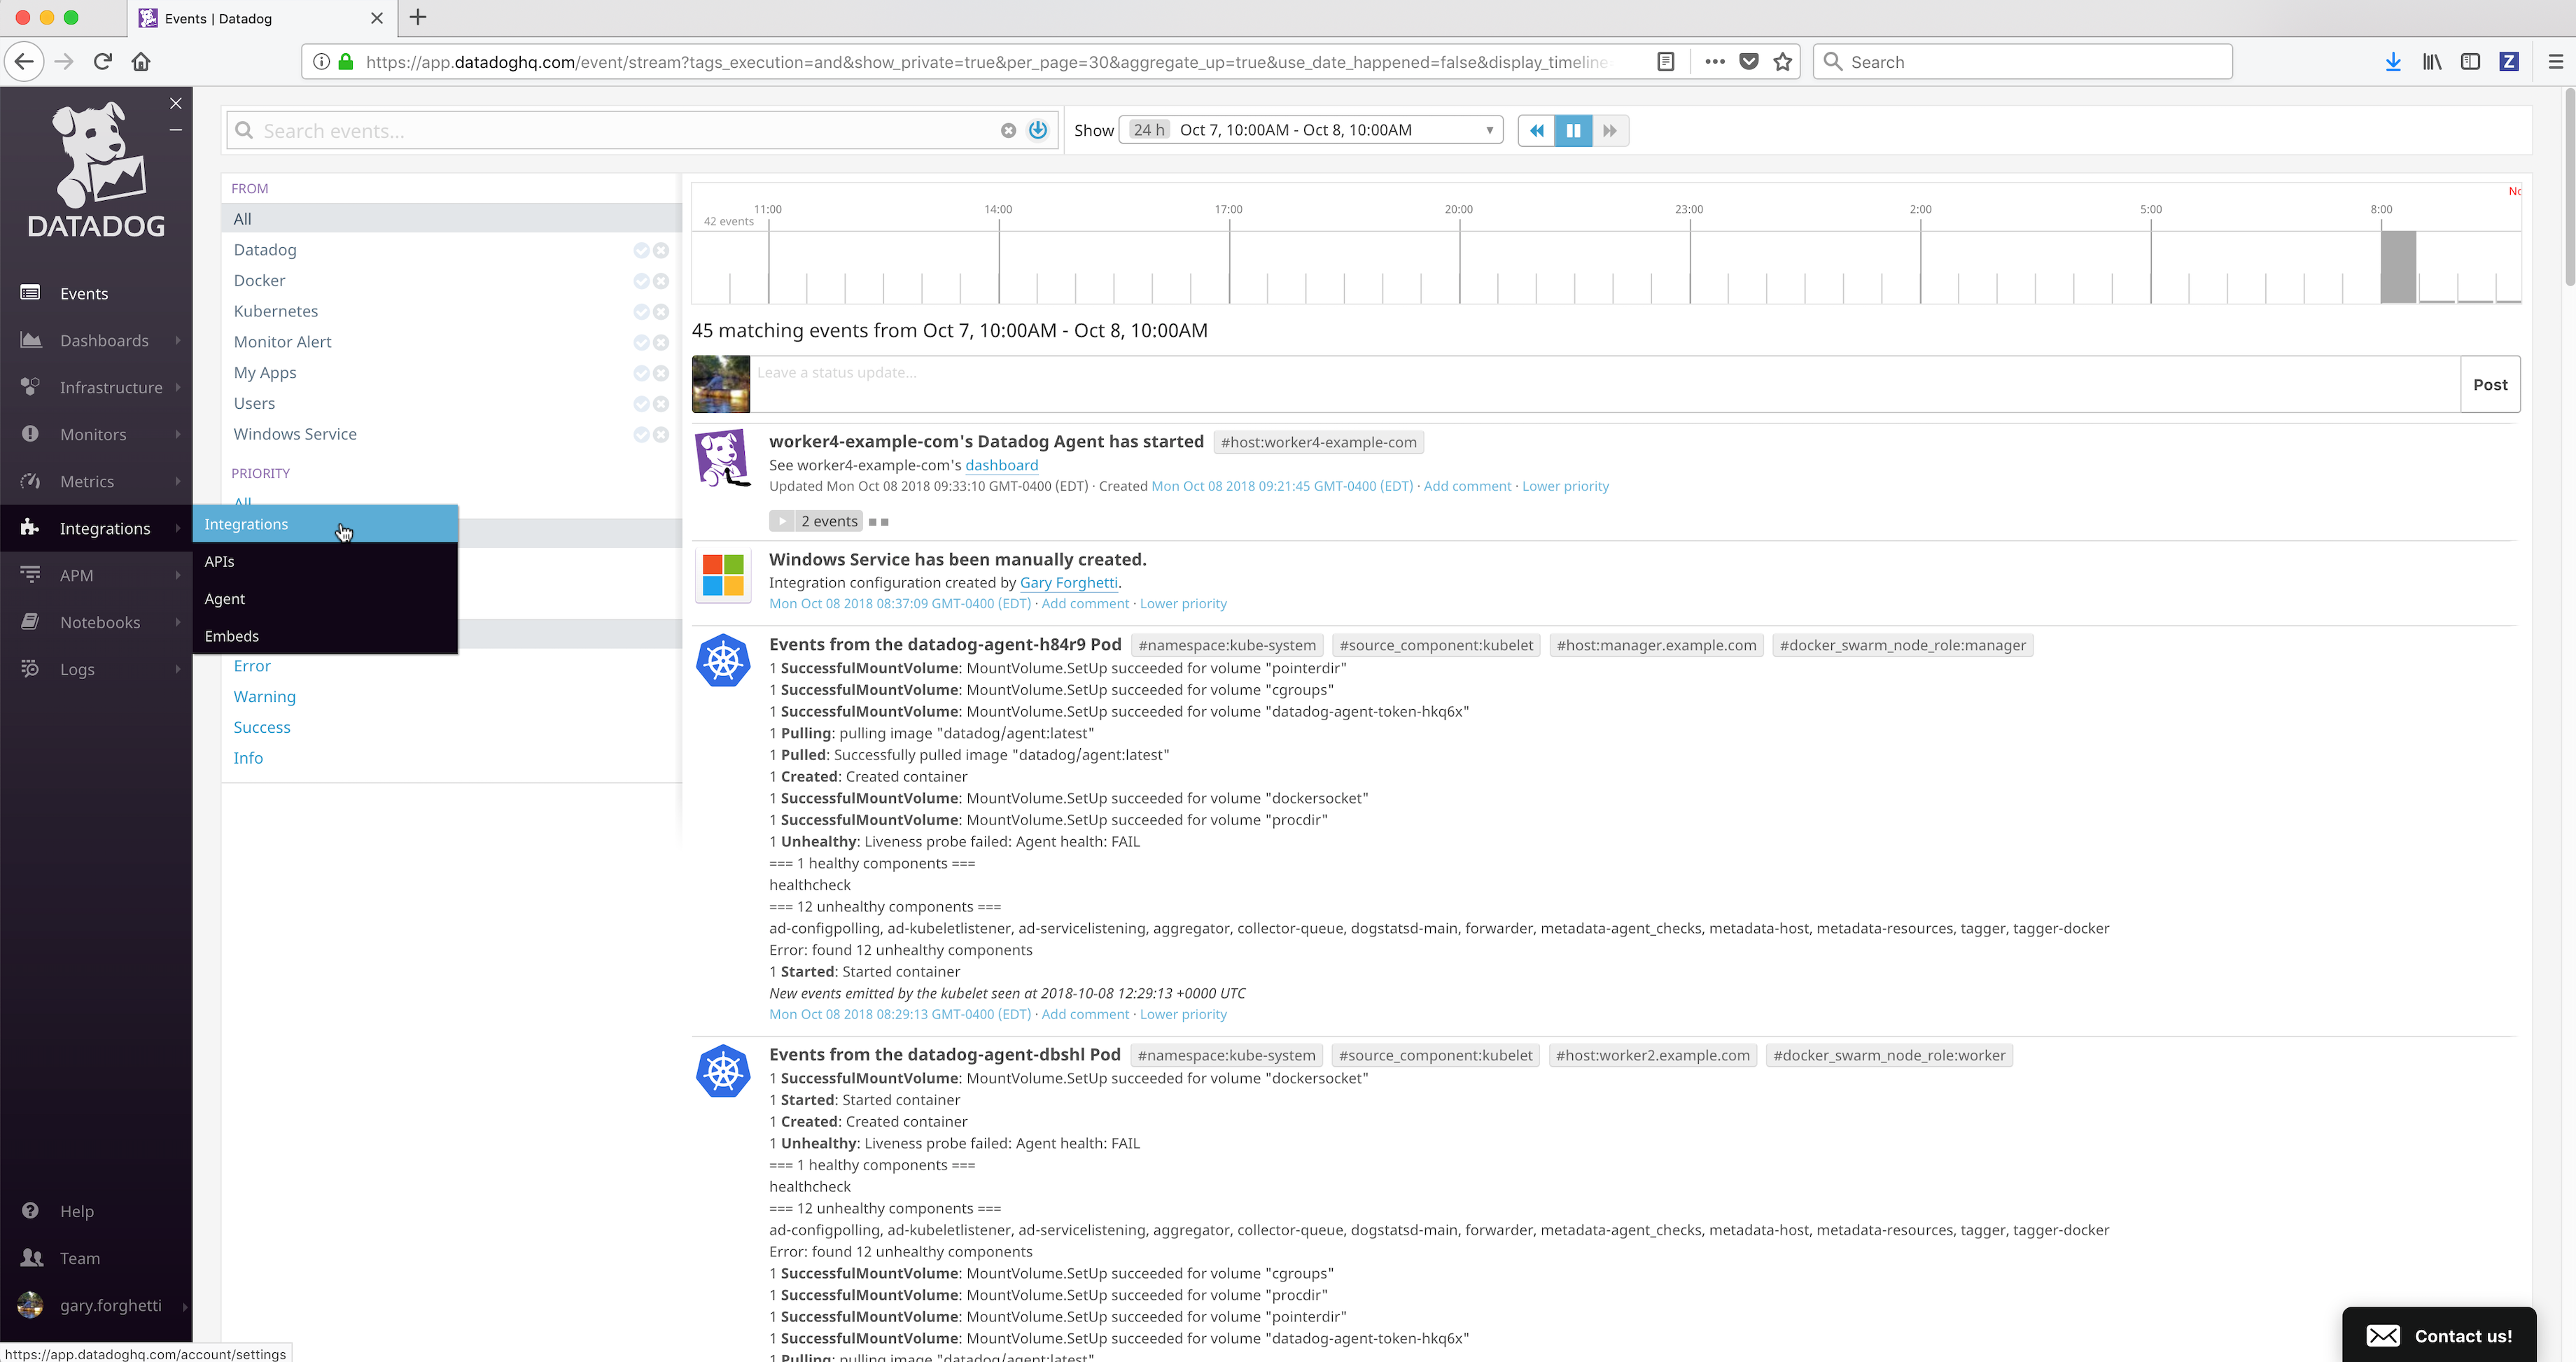
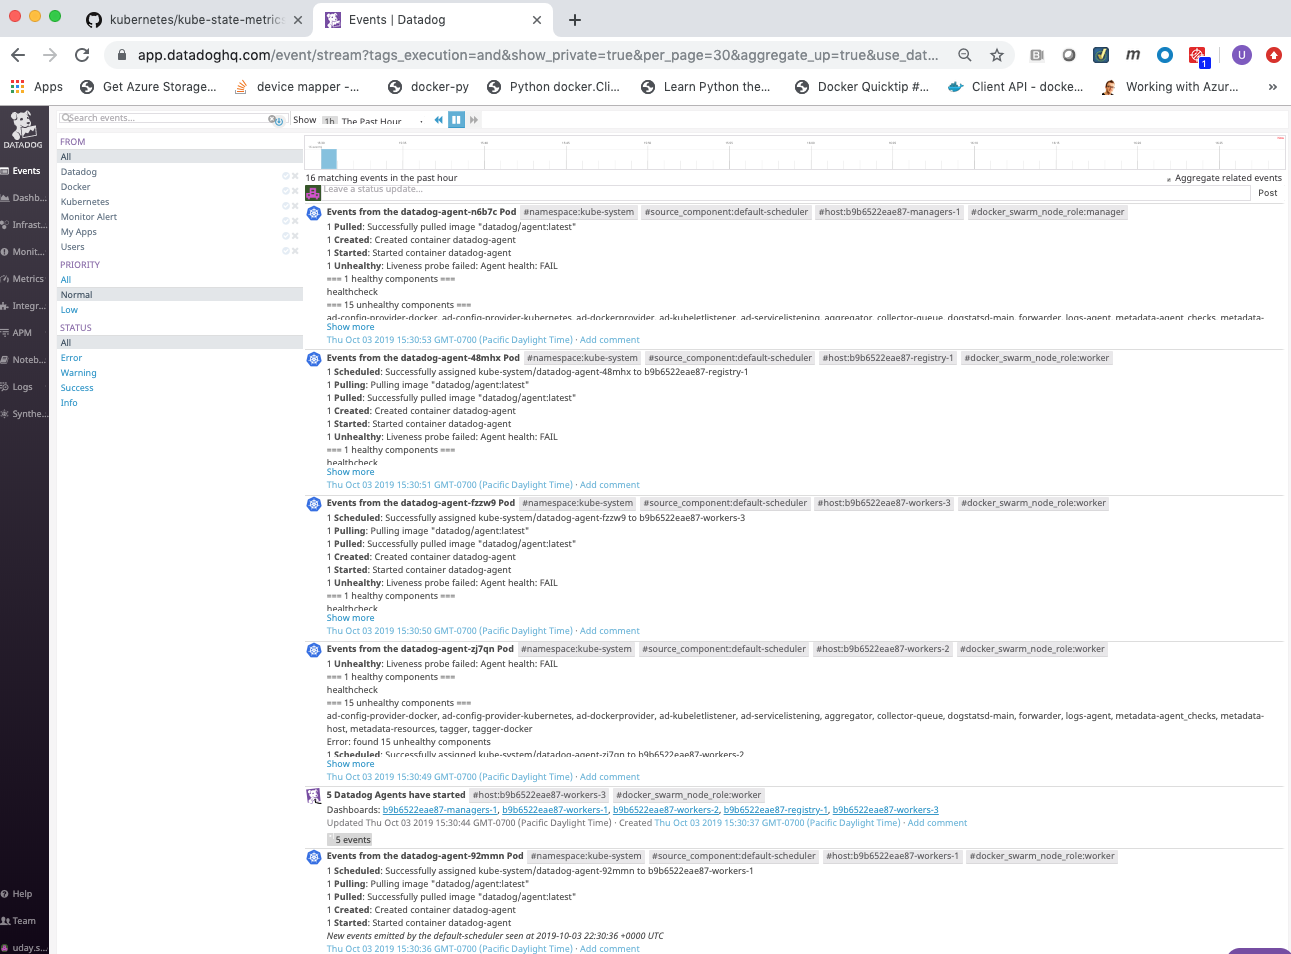
| Events | Shows a stream of the events collected by Datadog agents. |
| Dashboards | Allows you to view and create Dashboards that contain graphs with real-time performance metrics. |
| Infrastructure | Shows all of the hosts being monitoring by Datadog agents. |
| Monitors | Create monitors to notify you if the aggregate of a specific metric is above or below a certain threshold. |
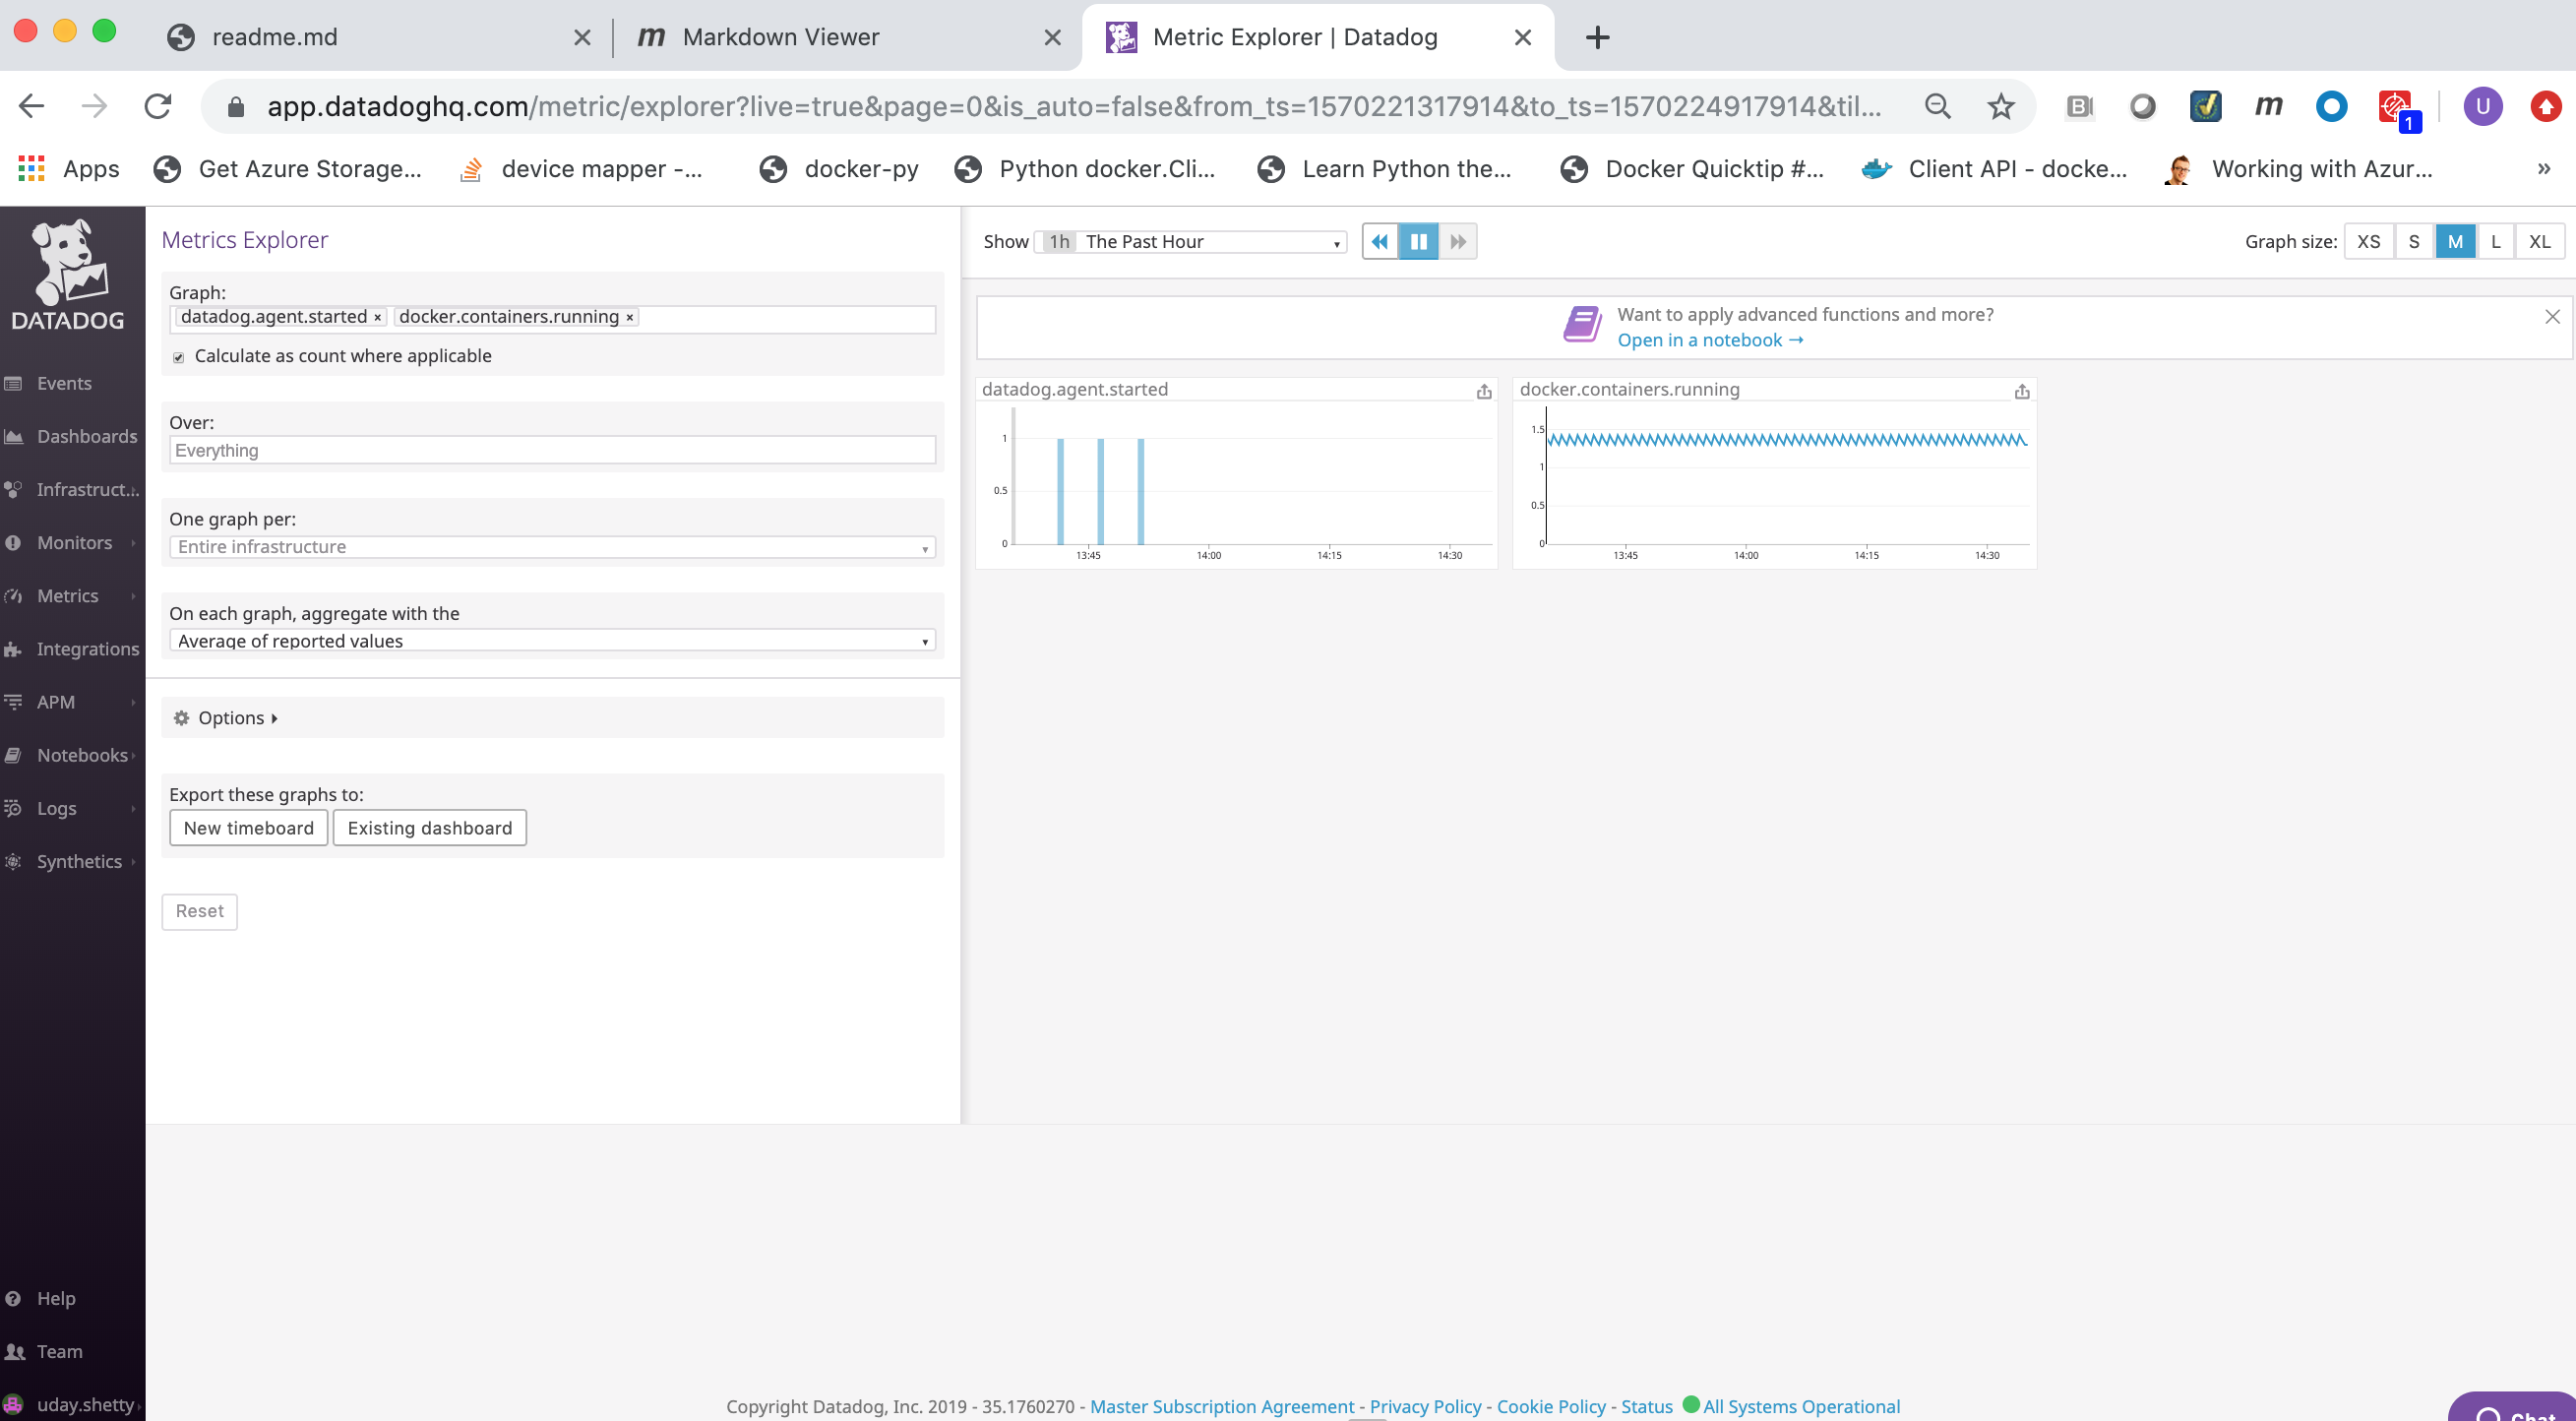
| Metrics | Search, view and graph the collected metrics. |
| Integrations | Configure Datadog to integrate with over 200 applications, services and systems. |
| APM | Provides you with deep insight into your application’s performance-from automatically generated dashboards that monitor key metrics. |
| Notebooks | Create notebooks that combine graphs and text in a linear, cell-based format. |
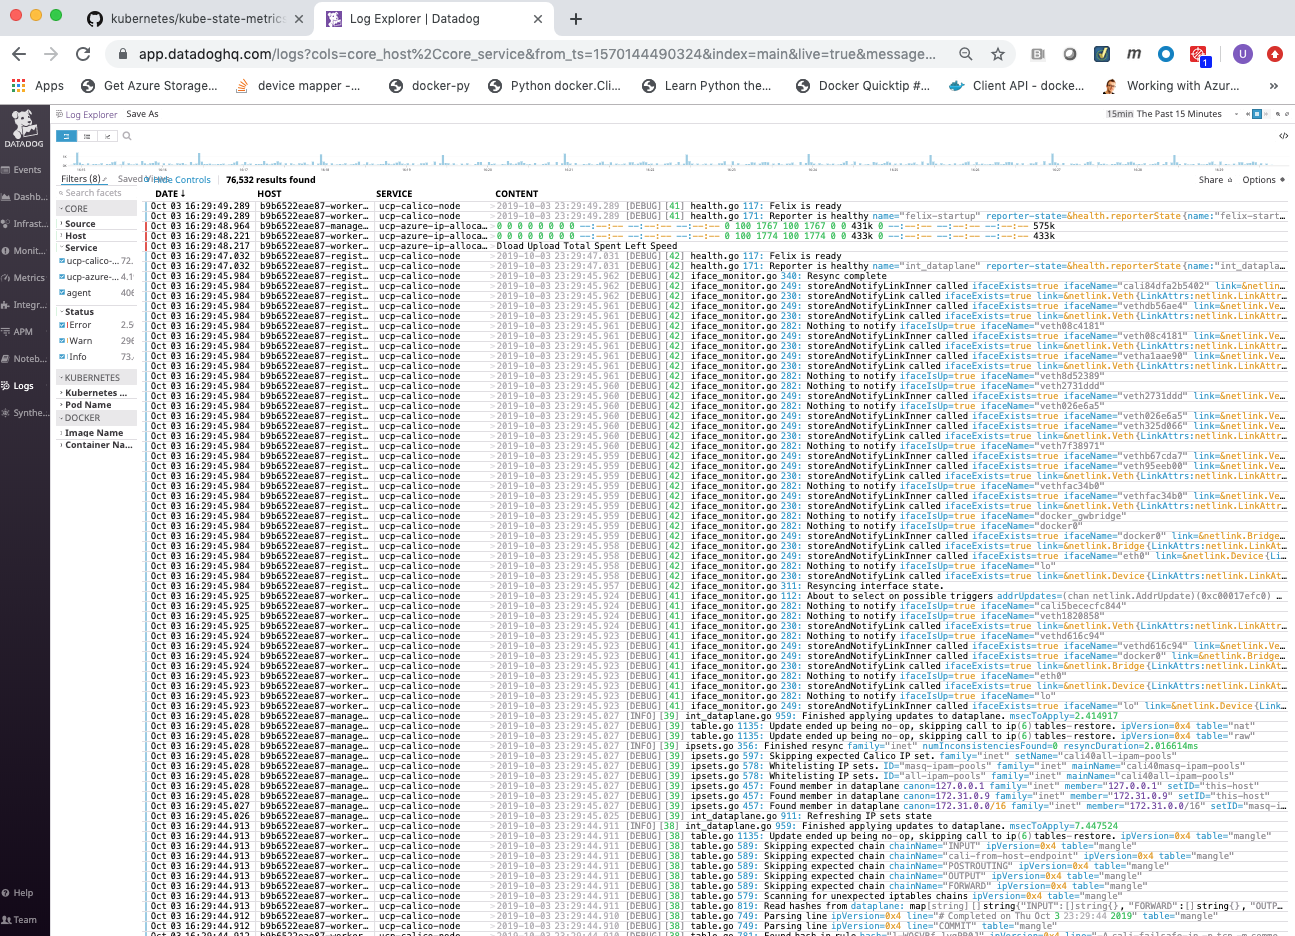
| Logs | Search, view and graph all the logs generated by your applications, and your infrastructure. |
Datadog Events
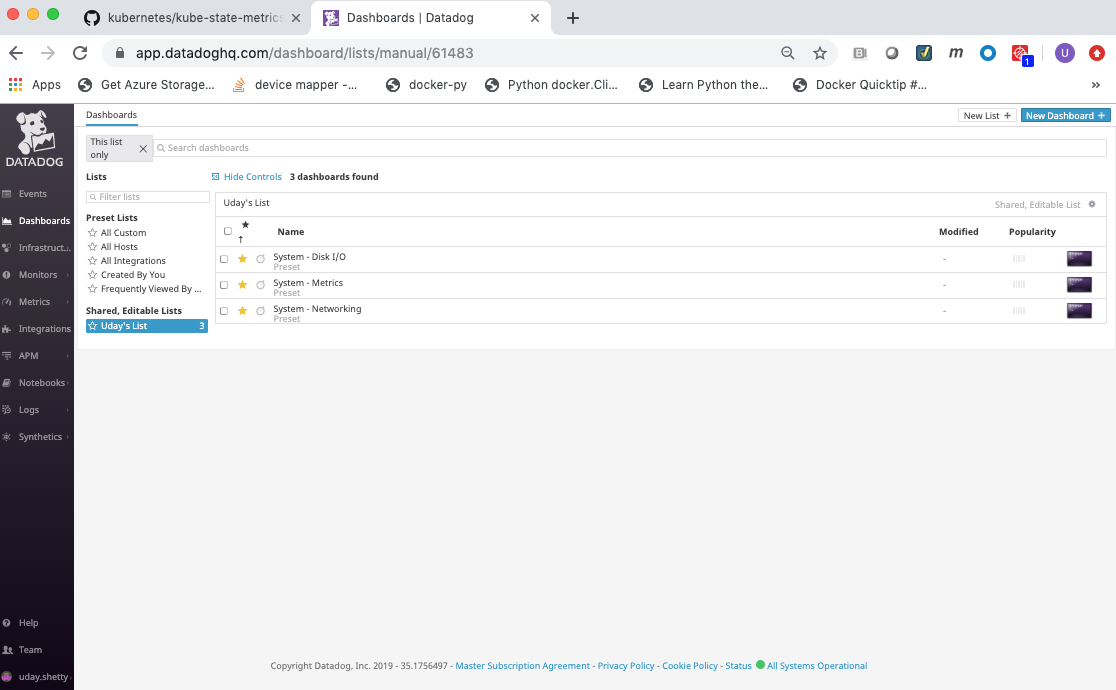
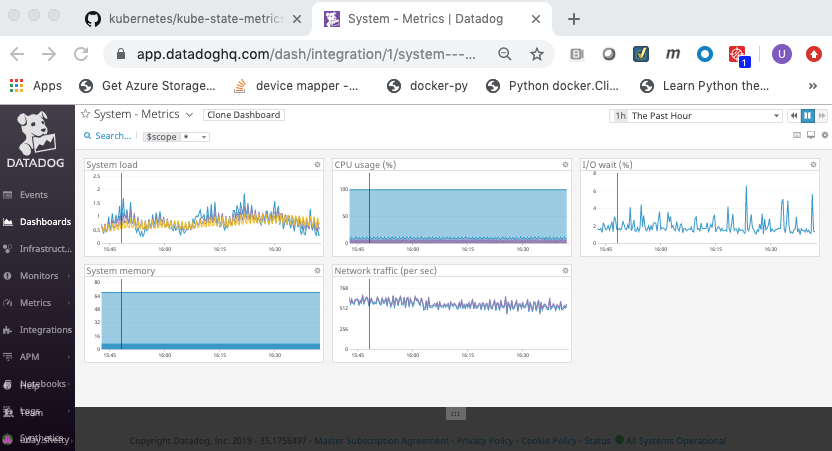
Datadog Dashboards
Out of the box Datadog provides 3 system dashboards:
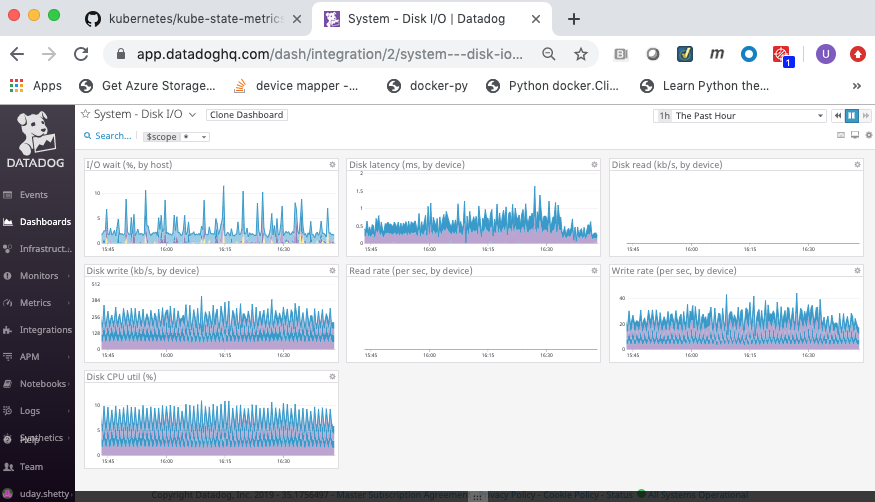
- System - Disk I/O
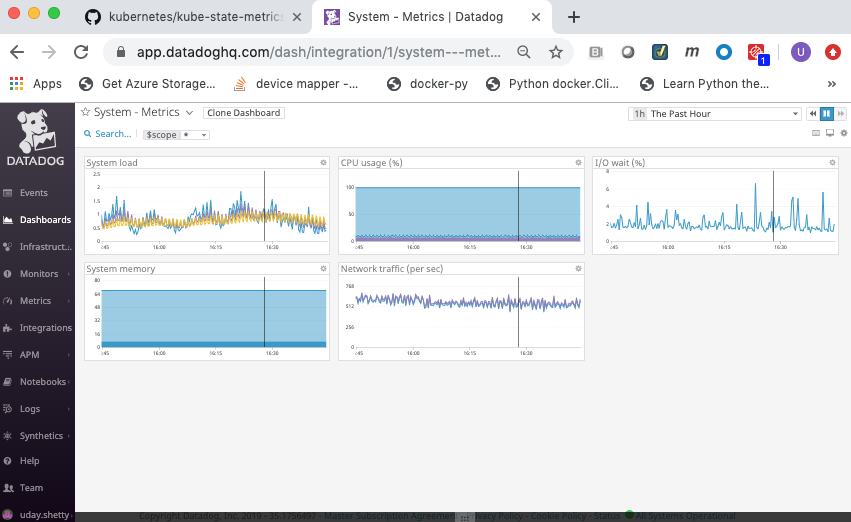
- System - Metrics
- System - Networking
Integration with Docker
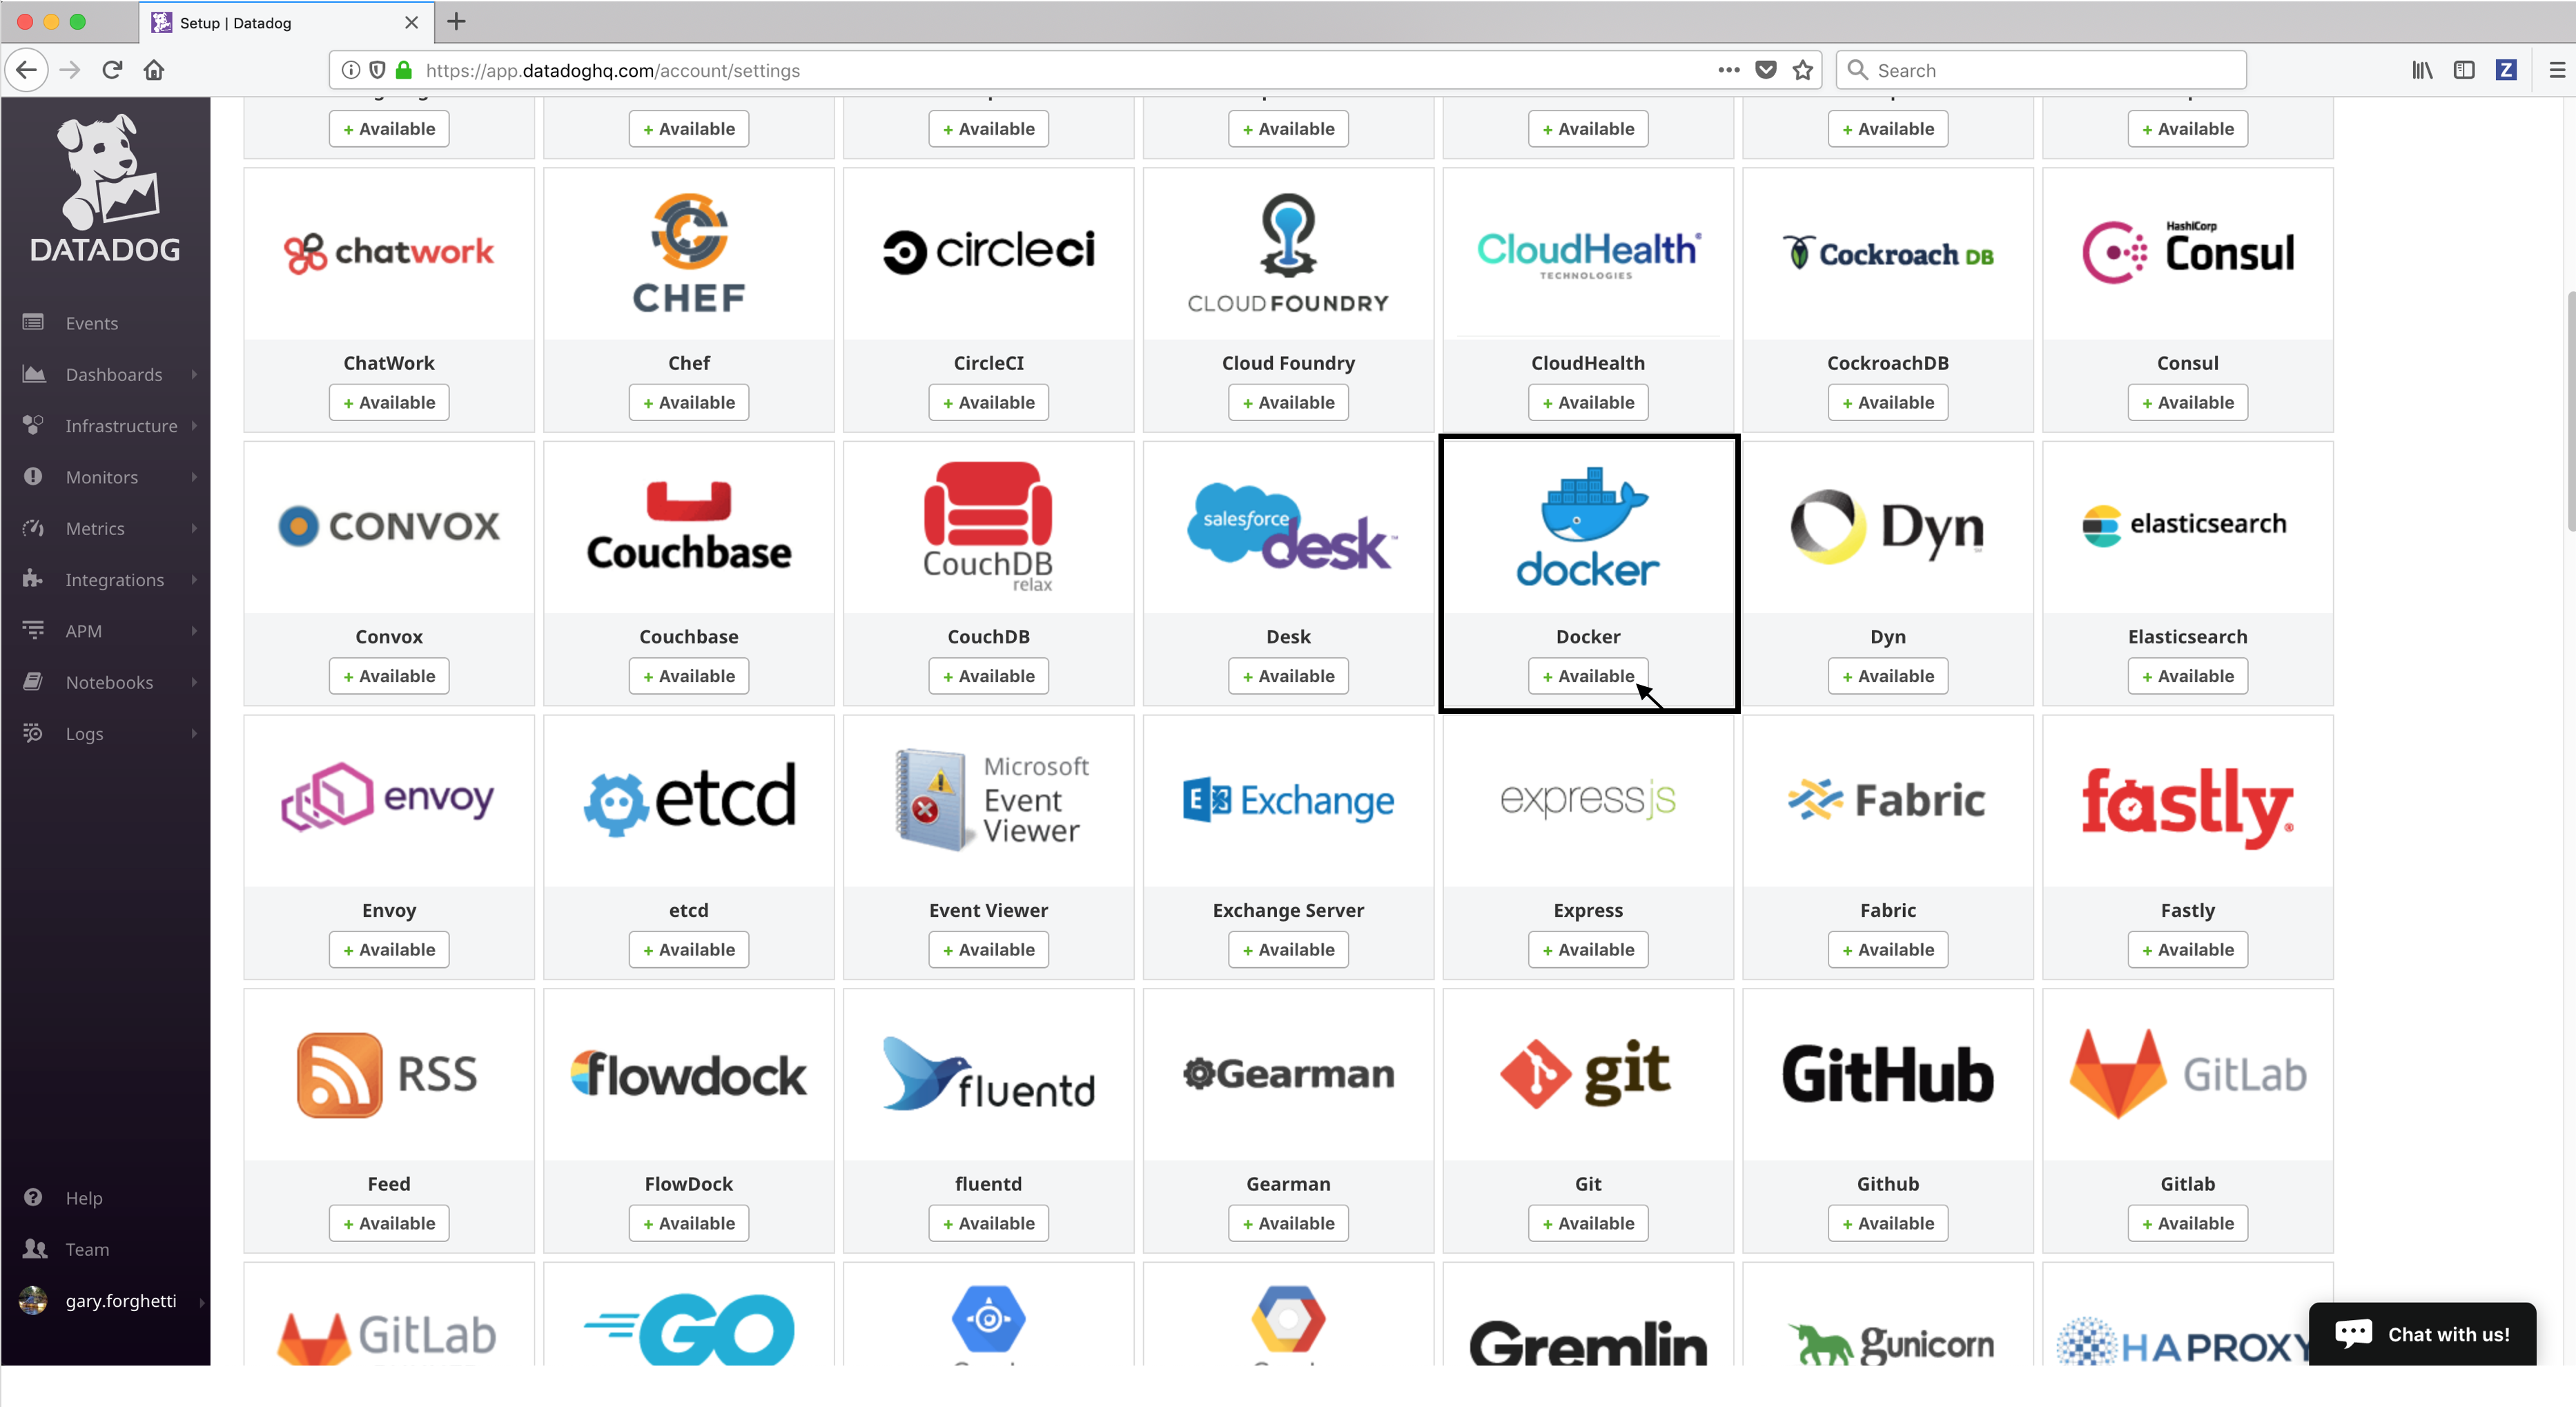
Datadog provides extensive Docker Integration which needs to be installed. To install the Docker Integration:
Click on the Integrations link in the left frame, then click on the Integrations menu item.
Locate and click on the Docker integration icon/button to install it.
Click on the Configuration tab and then click on the Install Integration button. The install takes a few seconds.
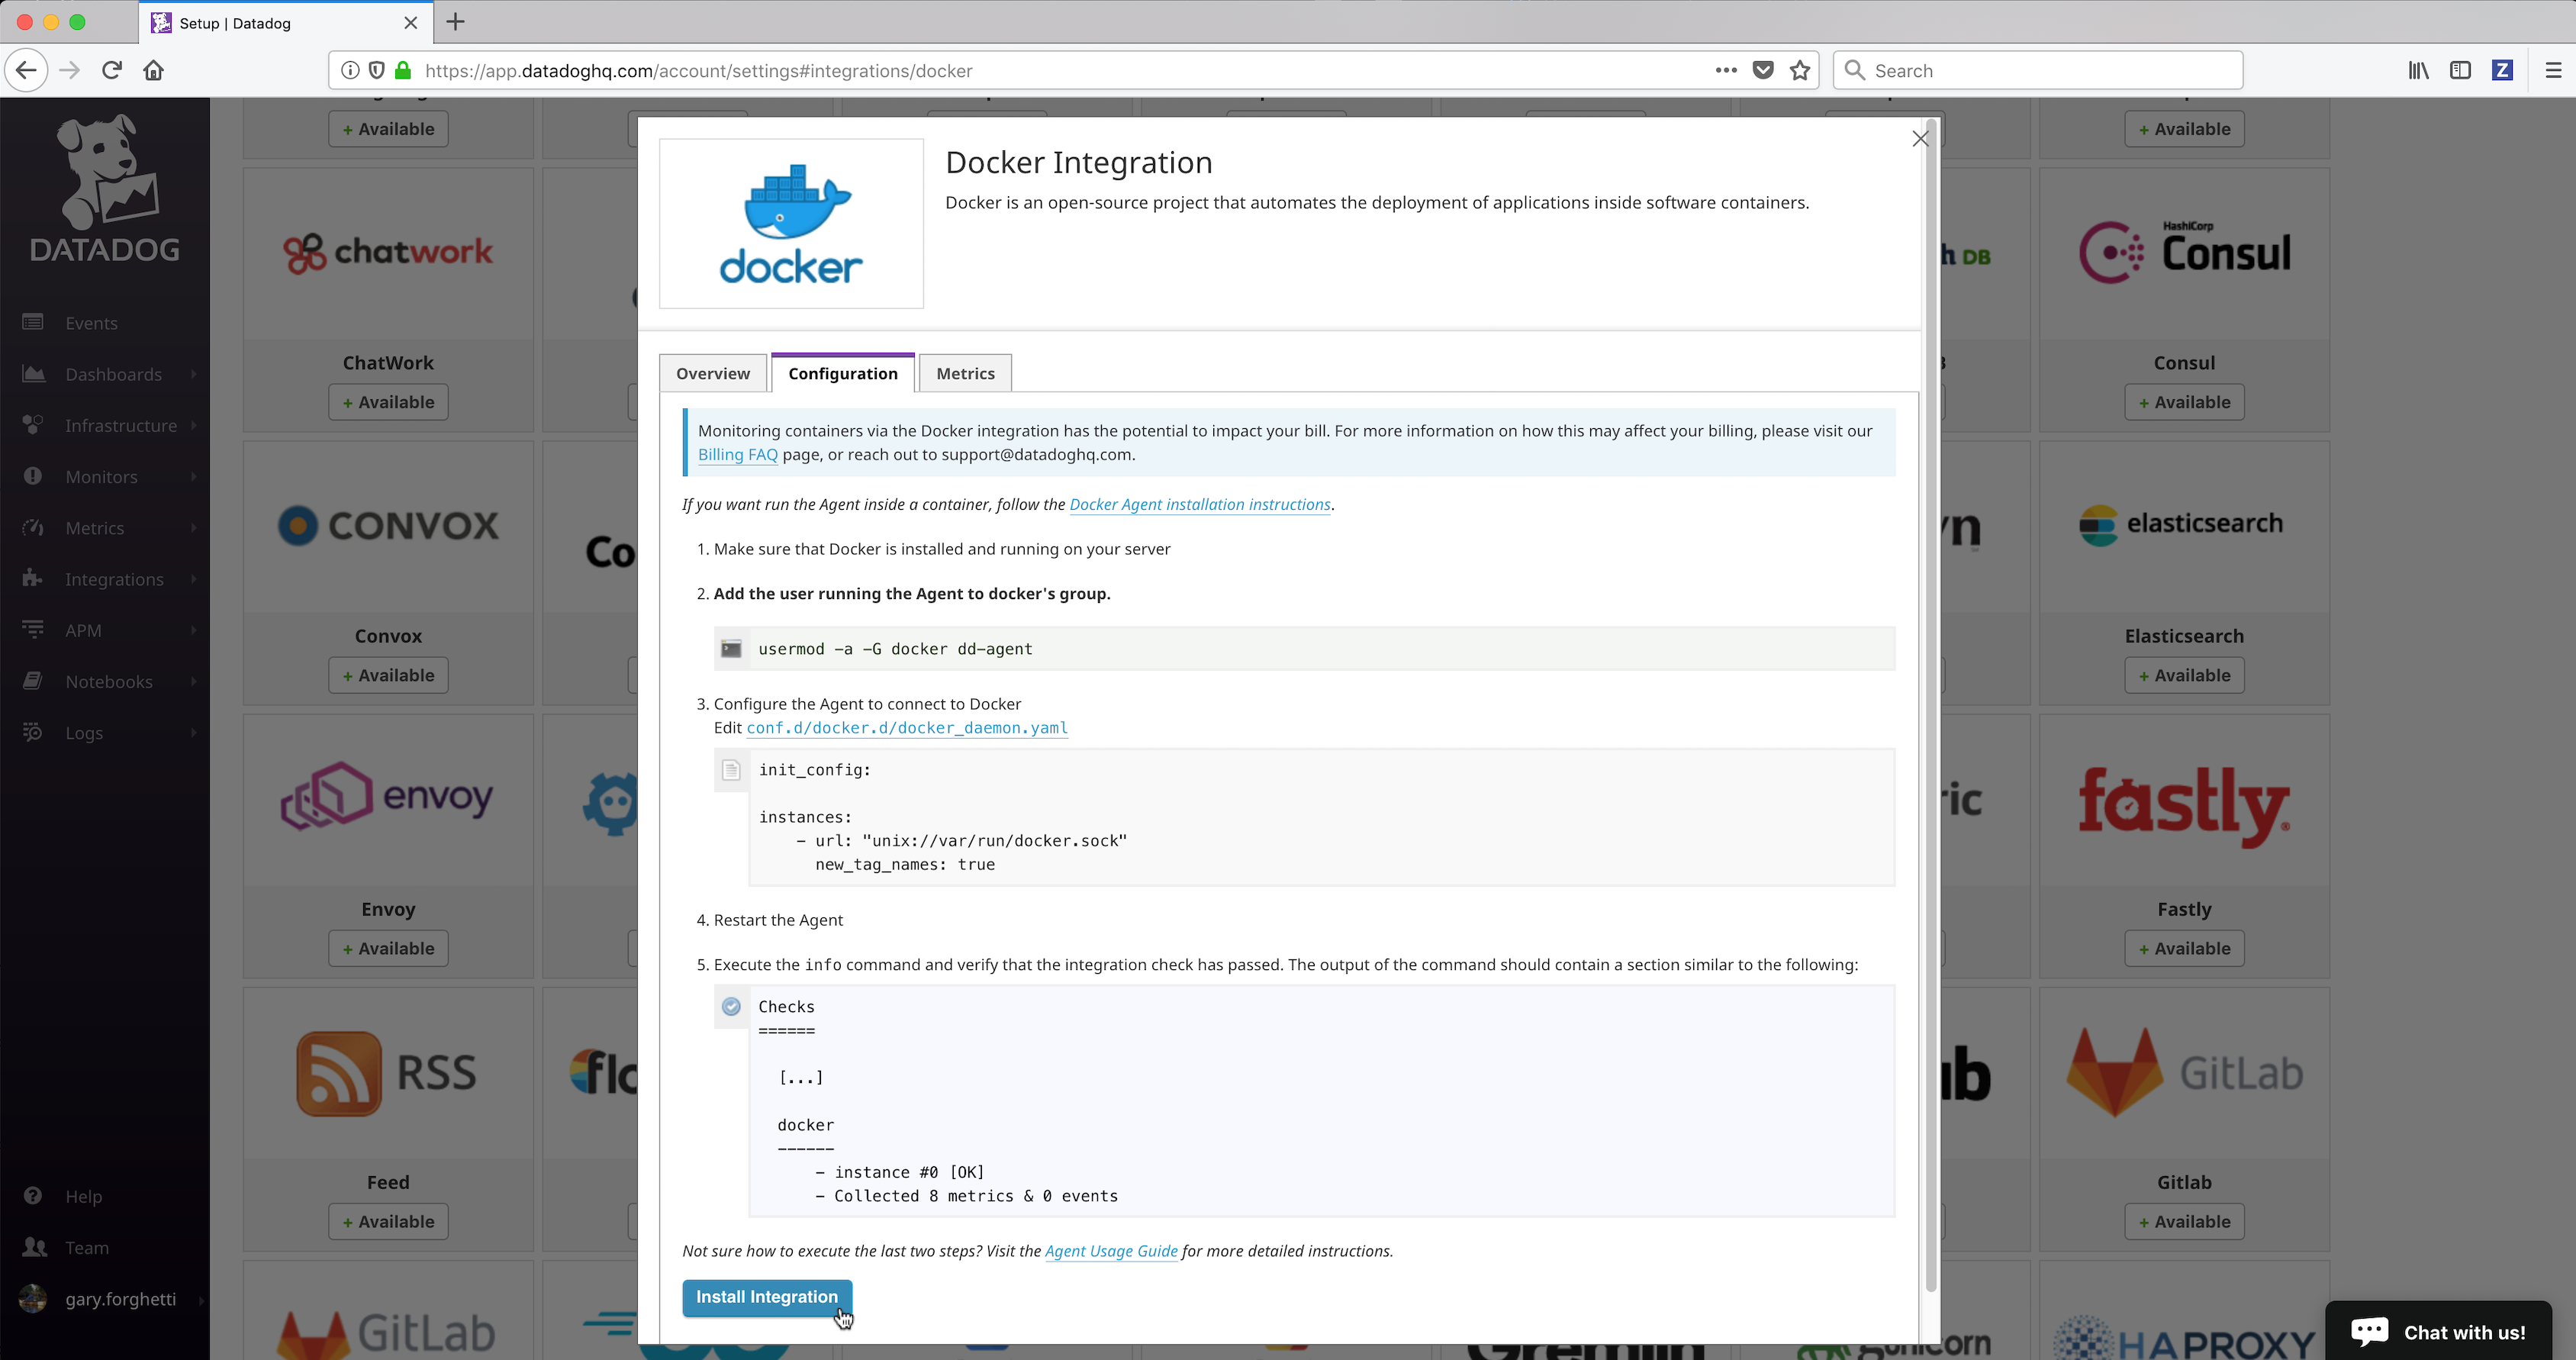
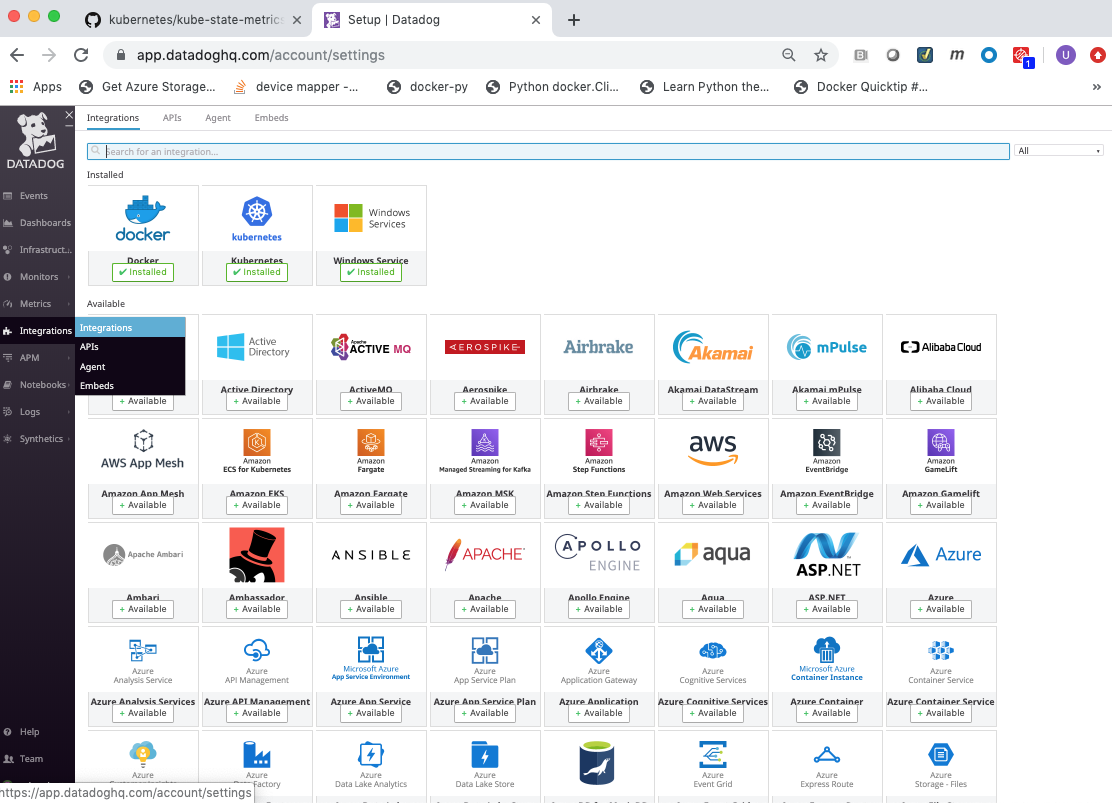
- After the installation completes, refresh the page and scroll to the top. The Docker Integration will appear as Installed.
Integration with Kubernetes
Datadog provides extensive Kubernetes Integration which needs to be installed. To install the Kubernetes Integration:
- Follow the same process as above to install Kubernetes Integration
- After the installation completes, refresh the page and scroll to the top. The Kubernetes Integration will appear as Installed.
Click on the Dashboards link in the left frame, followed by the Dashboard List menu item.
Click on the Docker Dashboard from the dashboard list.
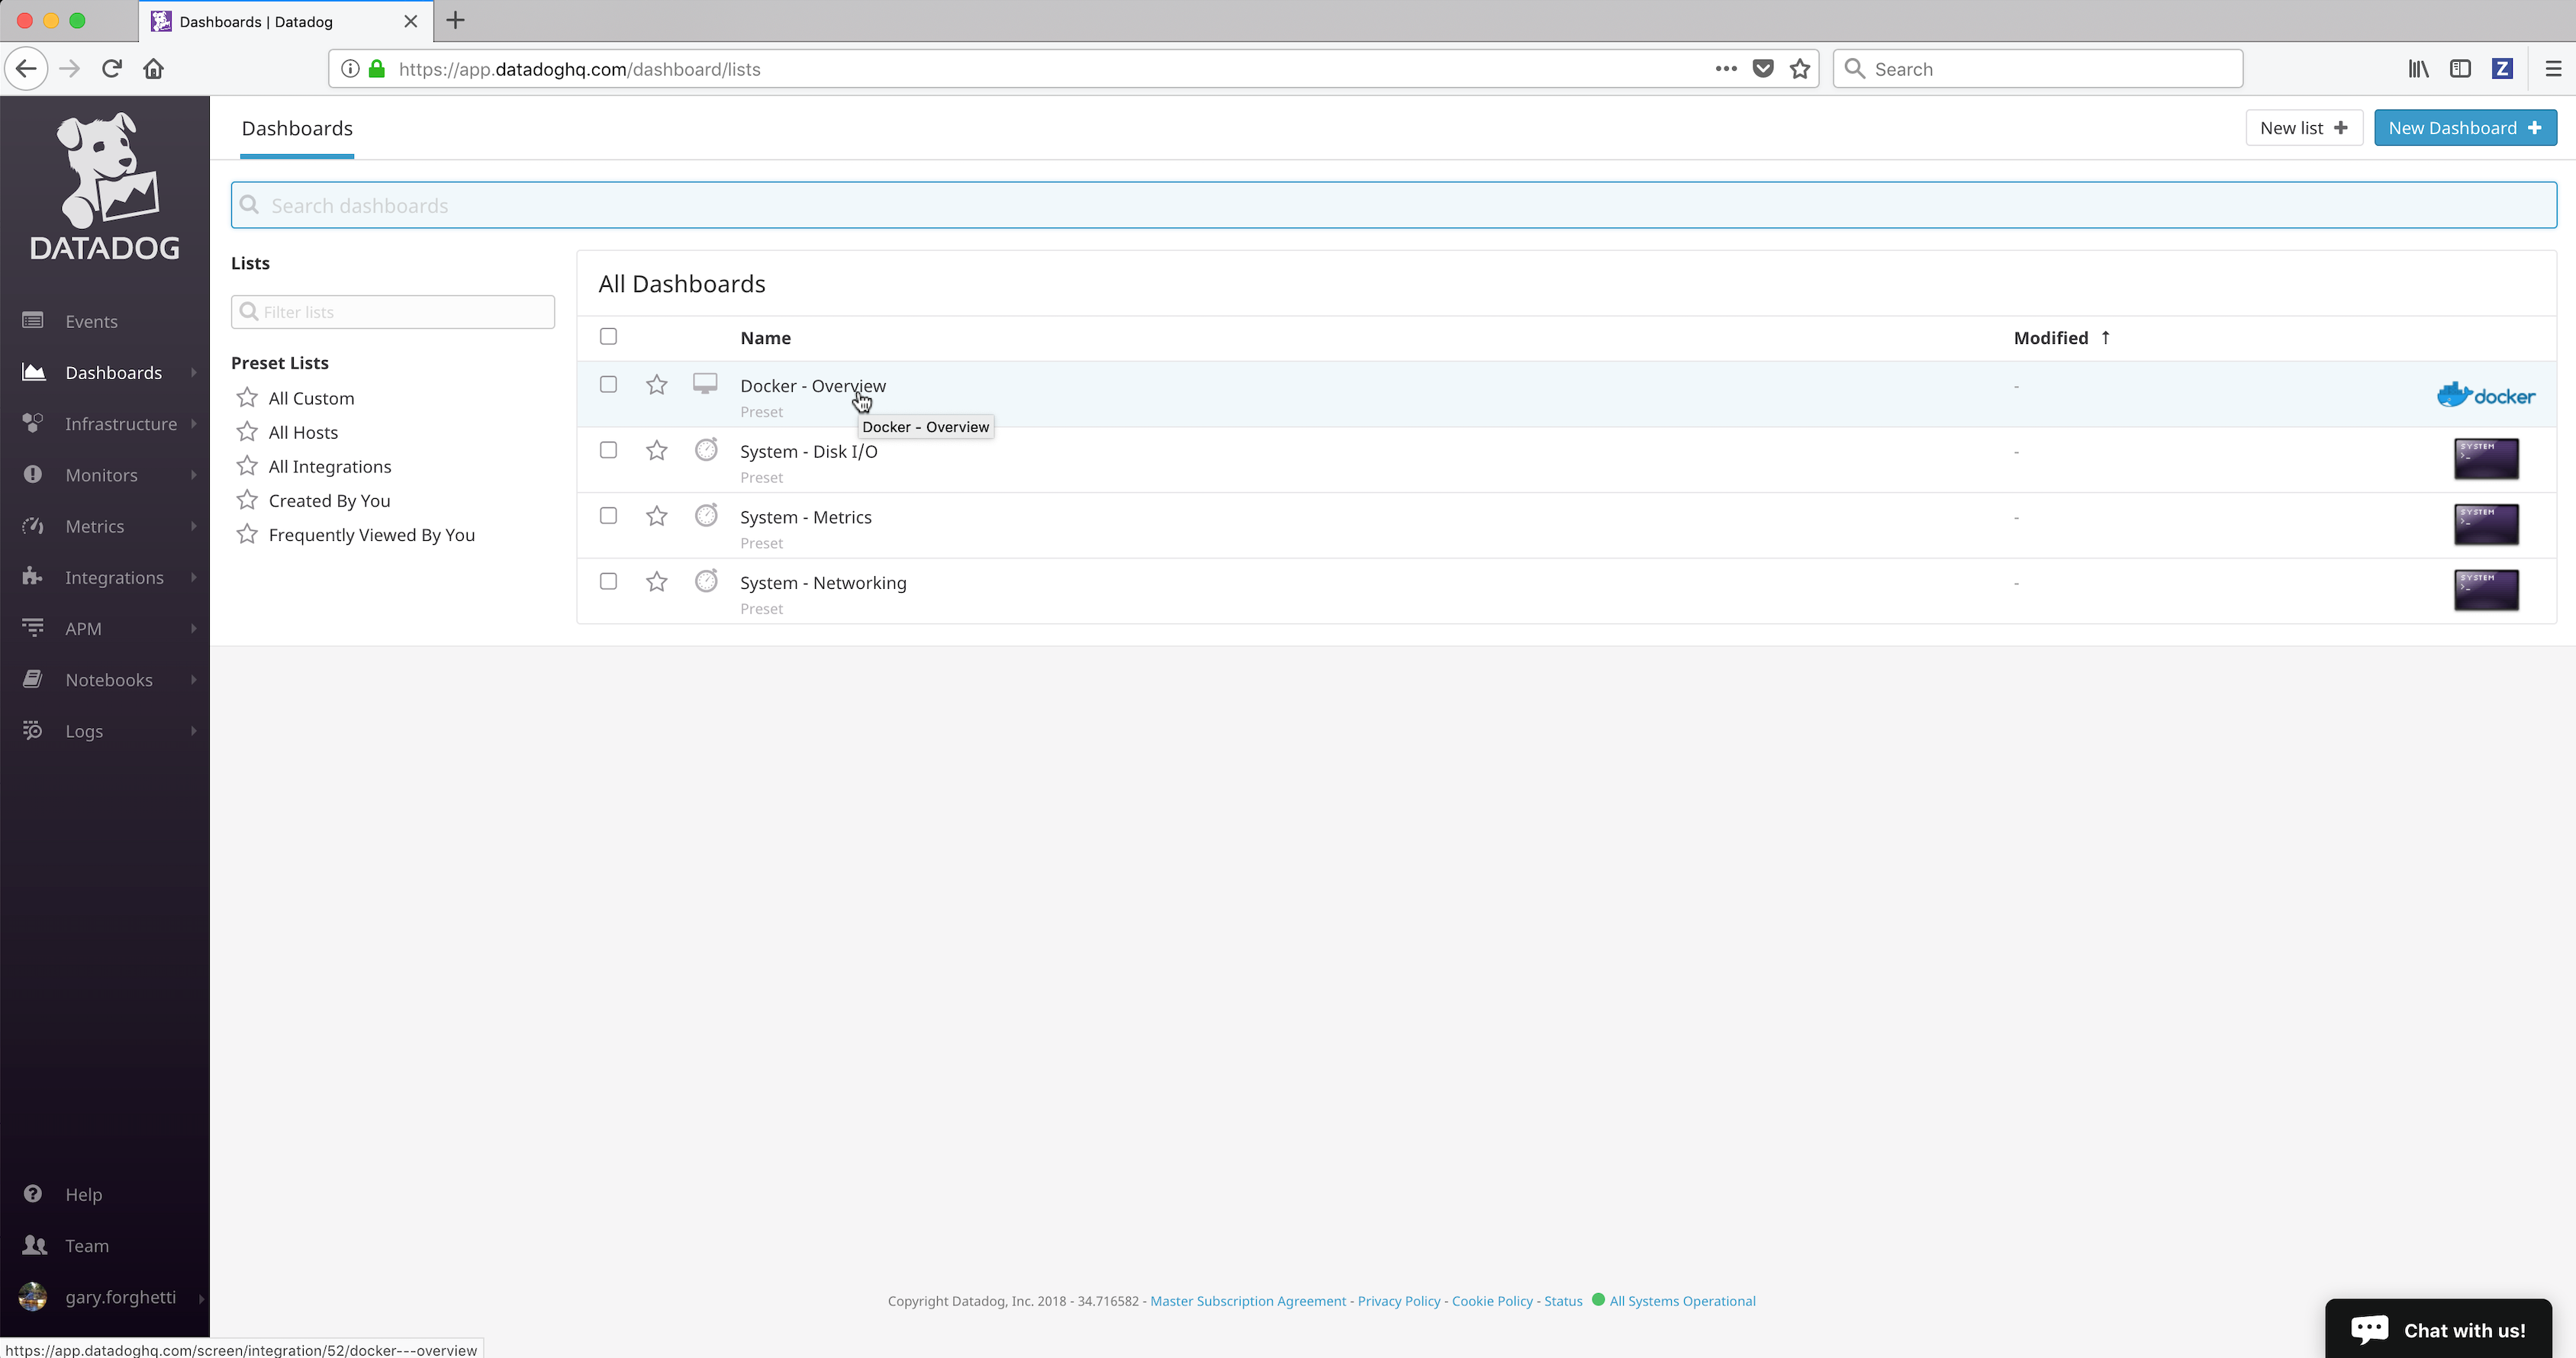
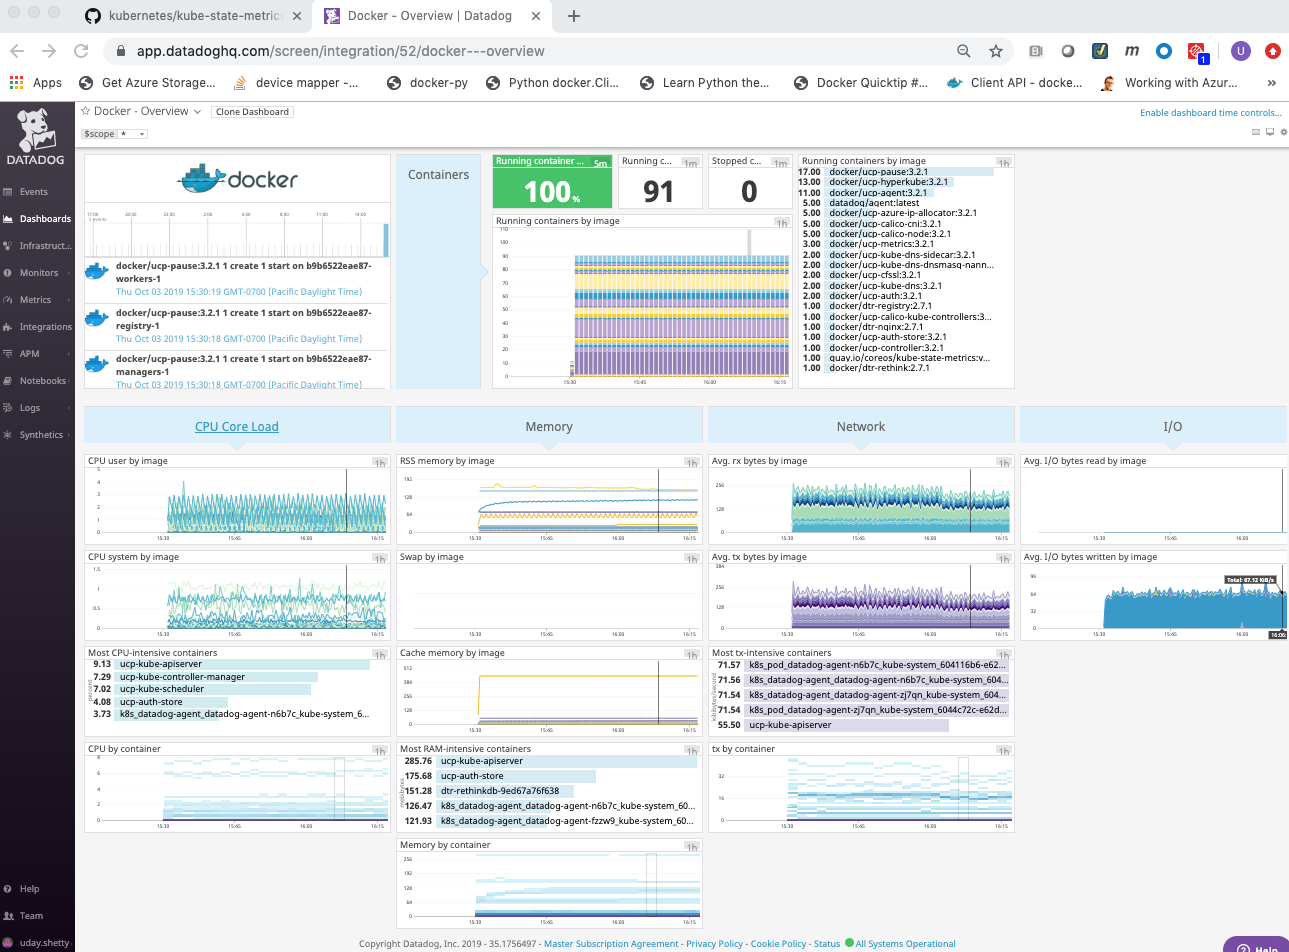
The Datadog Docker Dashboard will be displayed.
The Datadog Docker Dashboard displays:
- Events
- Event timeline over the past day
- Event stream
- Metrics on running and stopped containers
- Running container change over the past 5 minutes
- Running containers
- Stopped containers
- Running containers by image (graph)
- Running containers by image (list)
- CPU Core Load
- CPU user usage by image
- CPU system usage by image
- Most CPU intensive containers over the past hour
- CPU usage by container over the past hour
- Memory
- RSS memory usage by image
- SWAP usage by image, on average
- Cache memory usage by image
- Most RAM-intensive containers over the past hour
- Memory by container over the past hour
- Network
- Average received bytes by image over the past hour
- Average transmitted bytes by image over the past hour
- Most network traffic intensive containers over the past hour
- Network traffic by container over the past hour
See also
More details on the Datadog Docker Dashboard can be found on datadoghq.com.
- Events
Infrastructure
You can view the Docker Infrastructure dashboards from the Infrastructure link in the left frame:
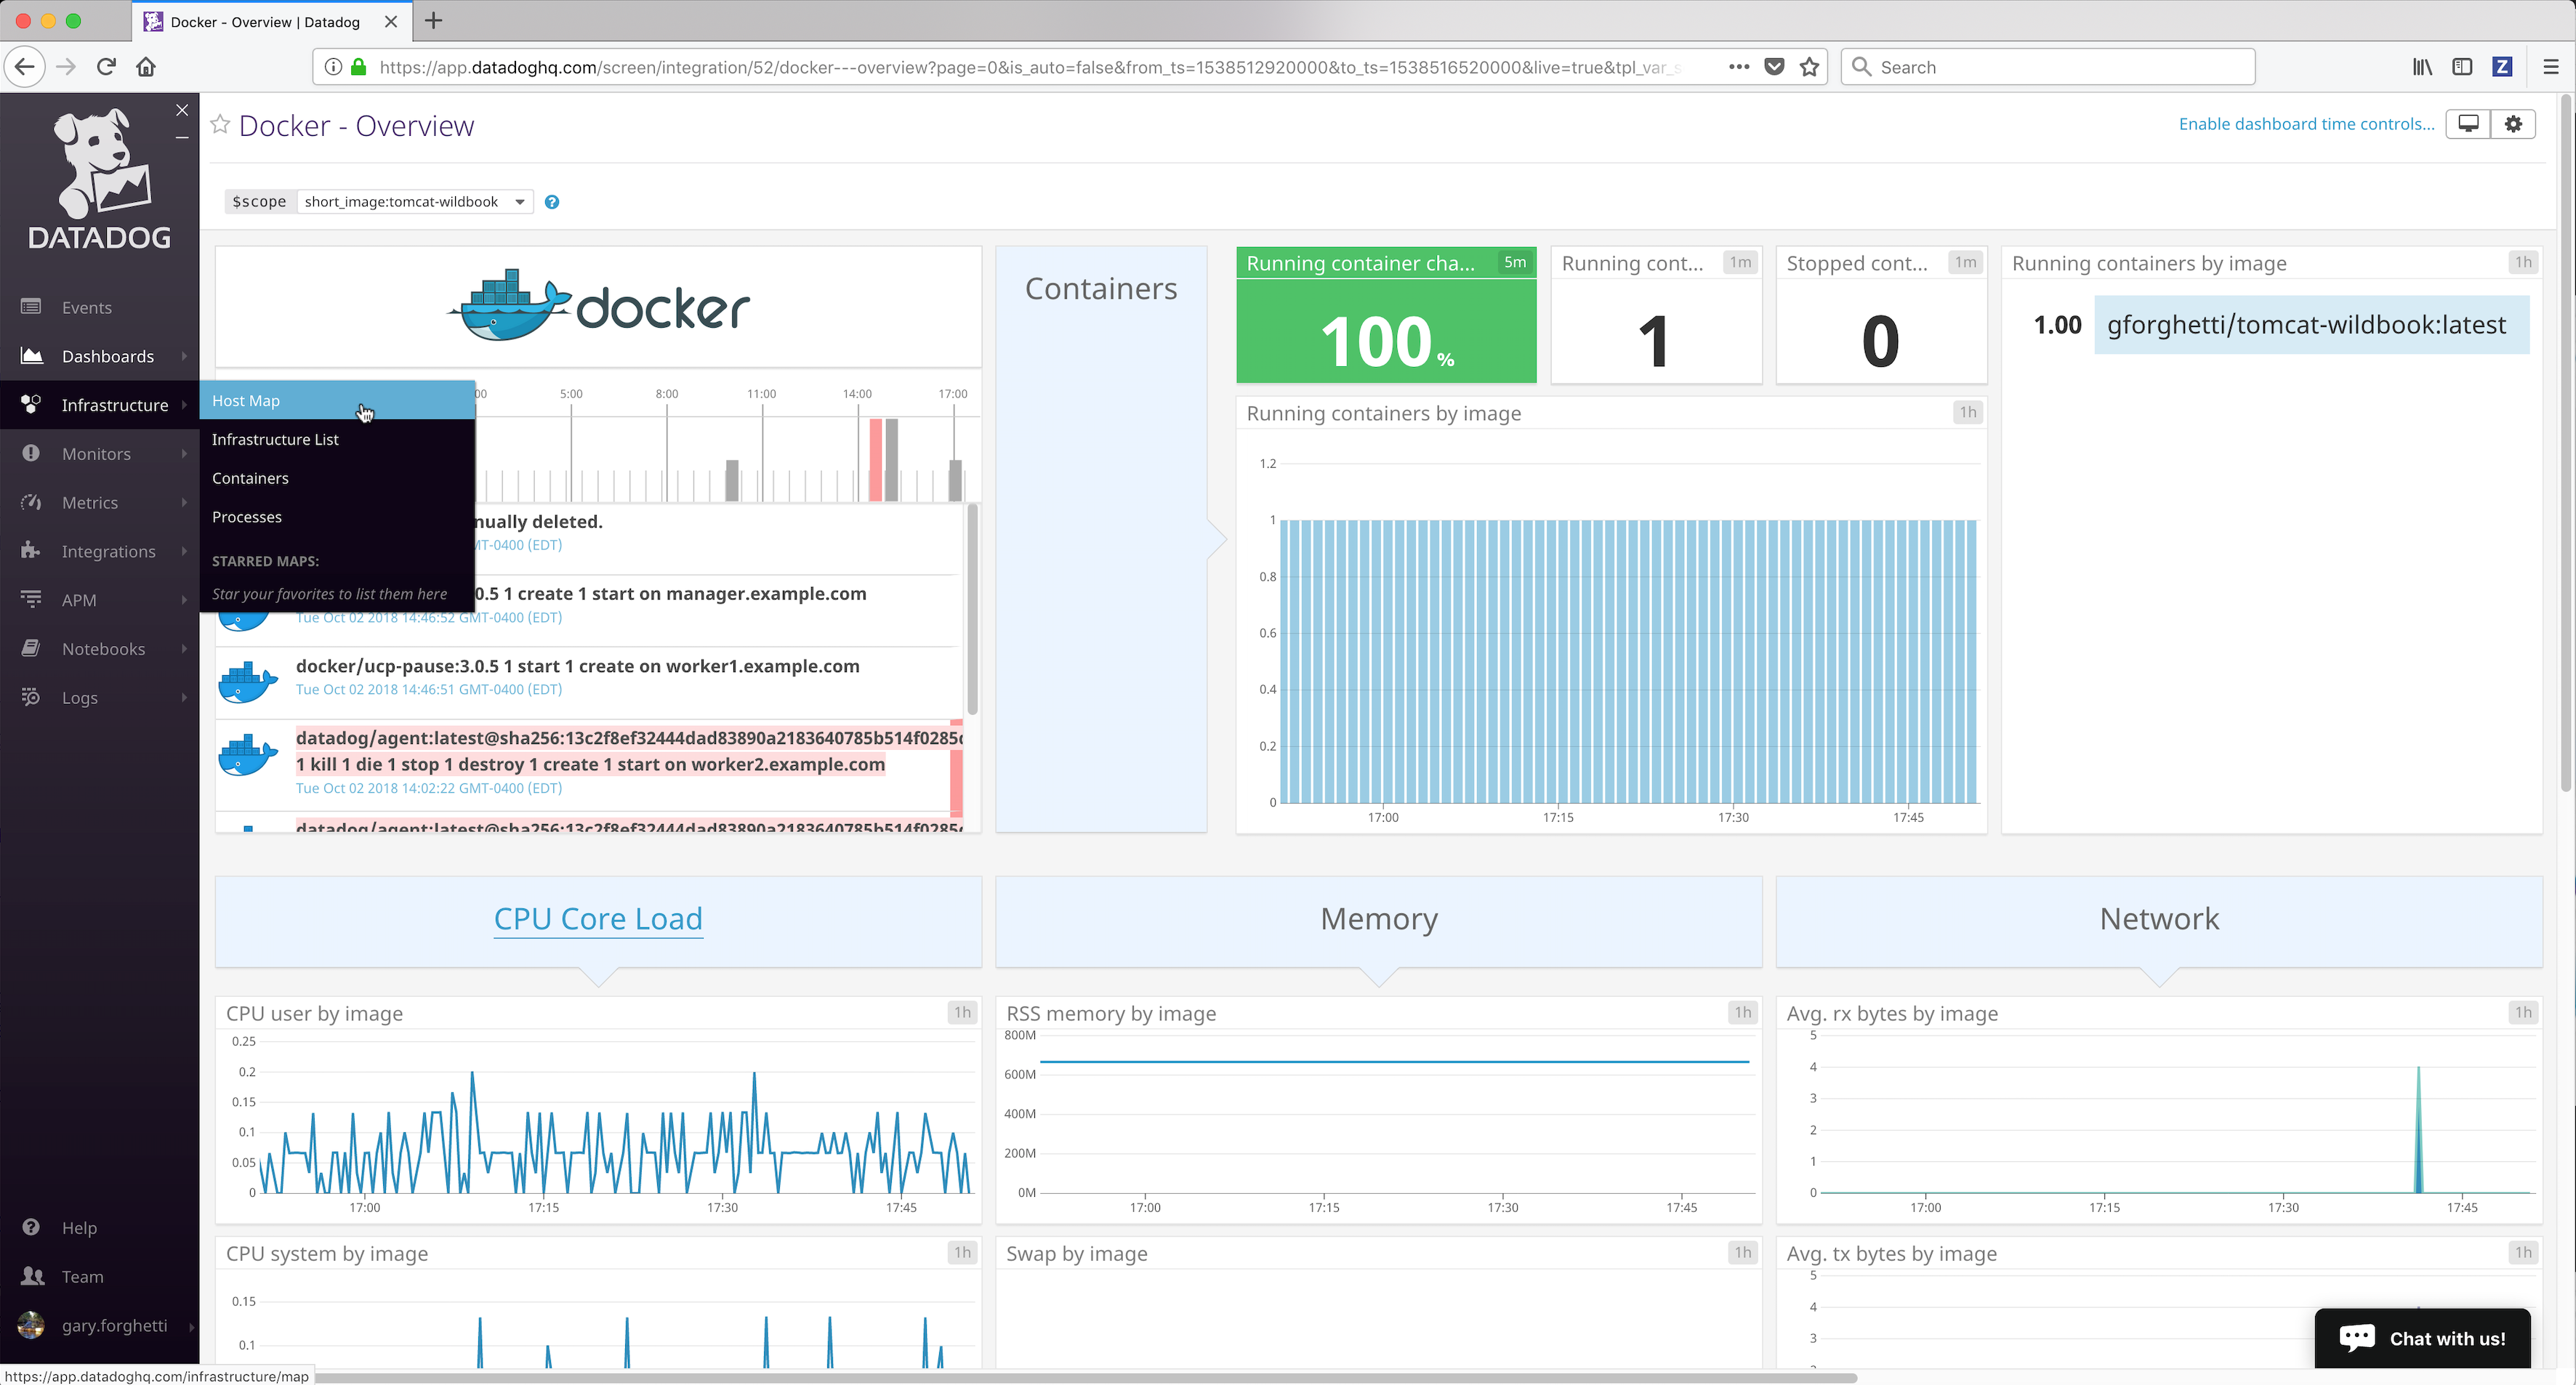
The Host Map page provides a quick visualization of the monitored environment:
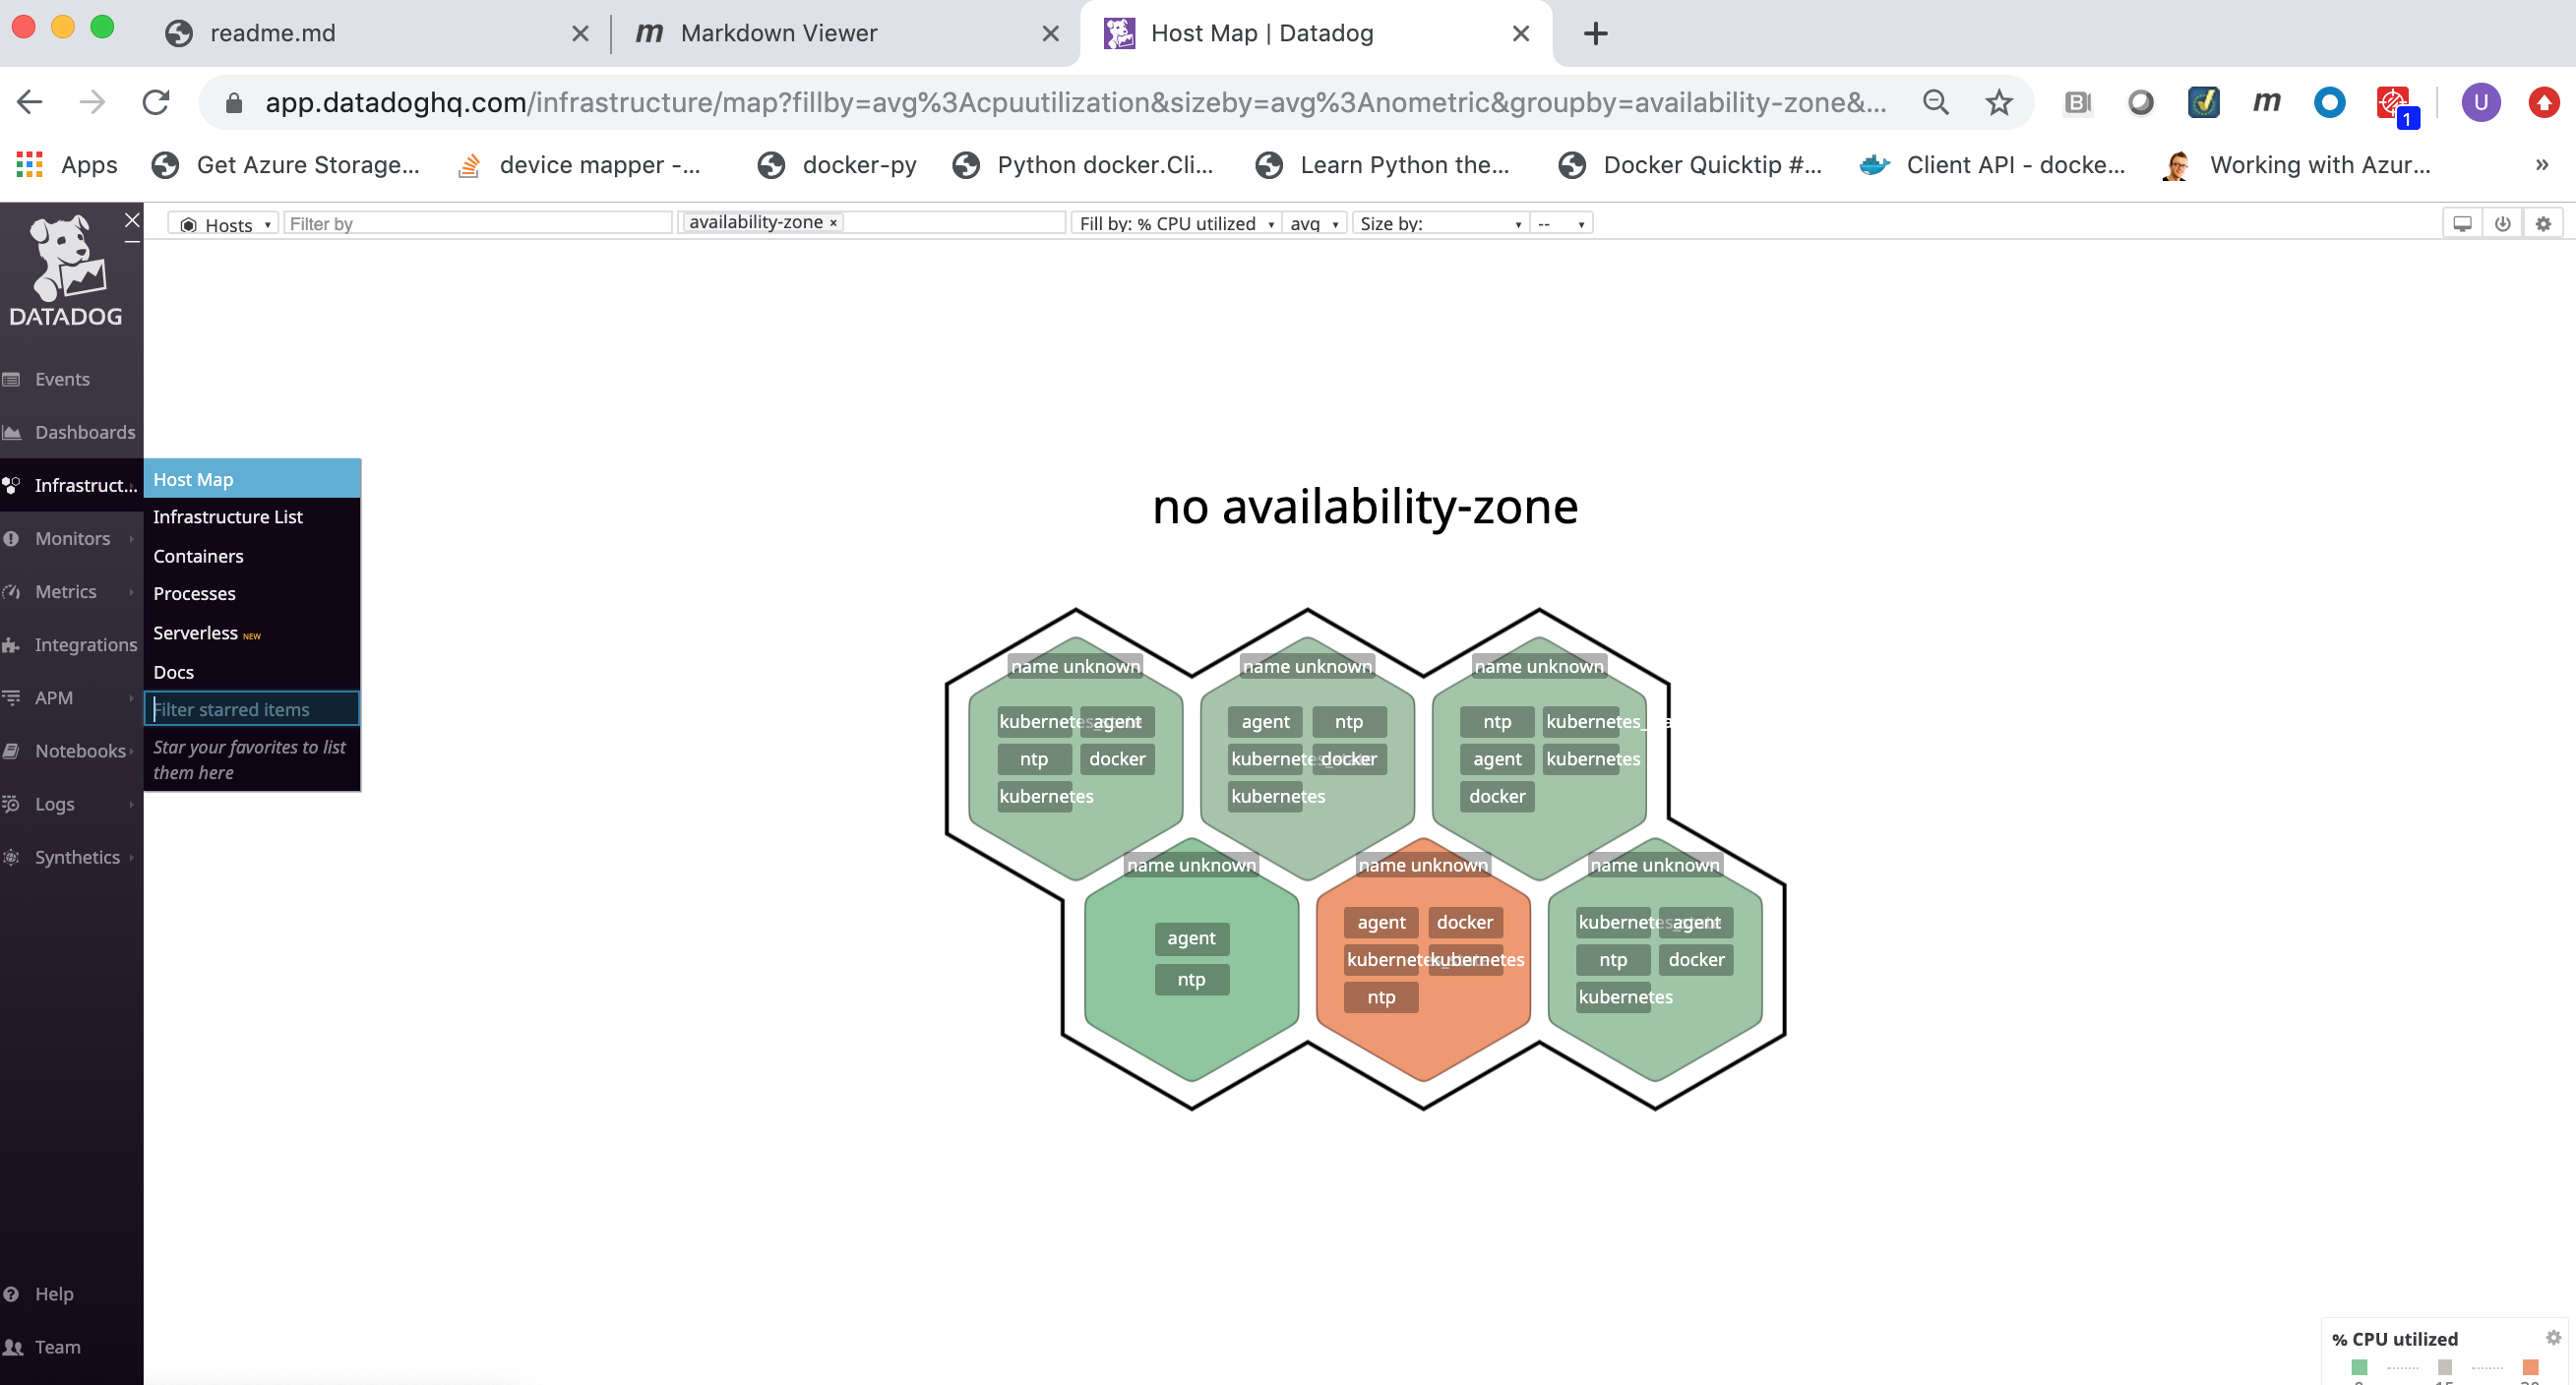
the Infrastructure List page shows all Docker nodes being monitored (running the Datadog agent):
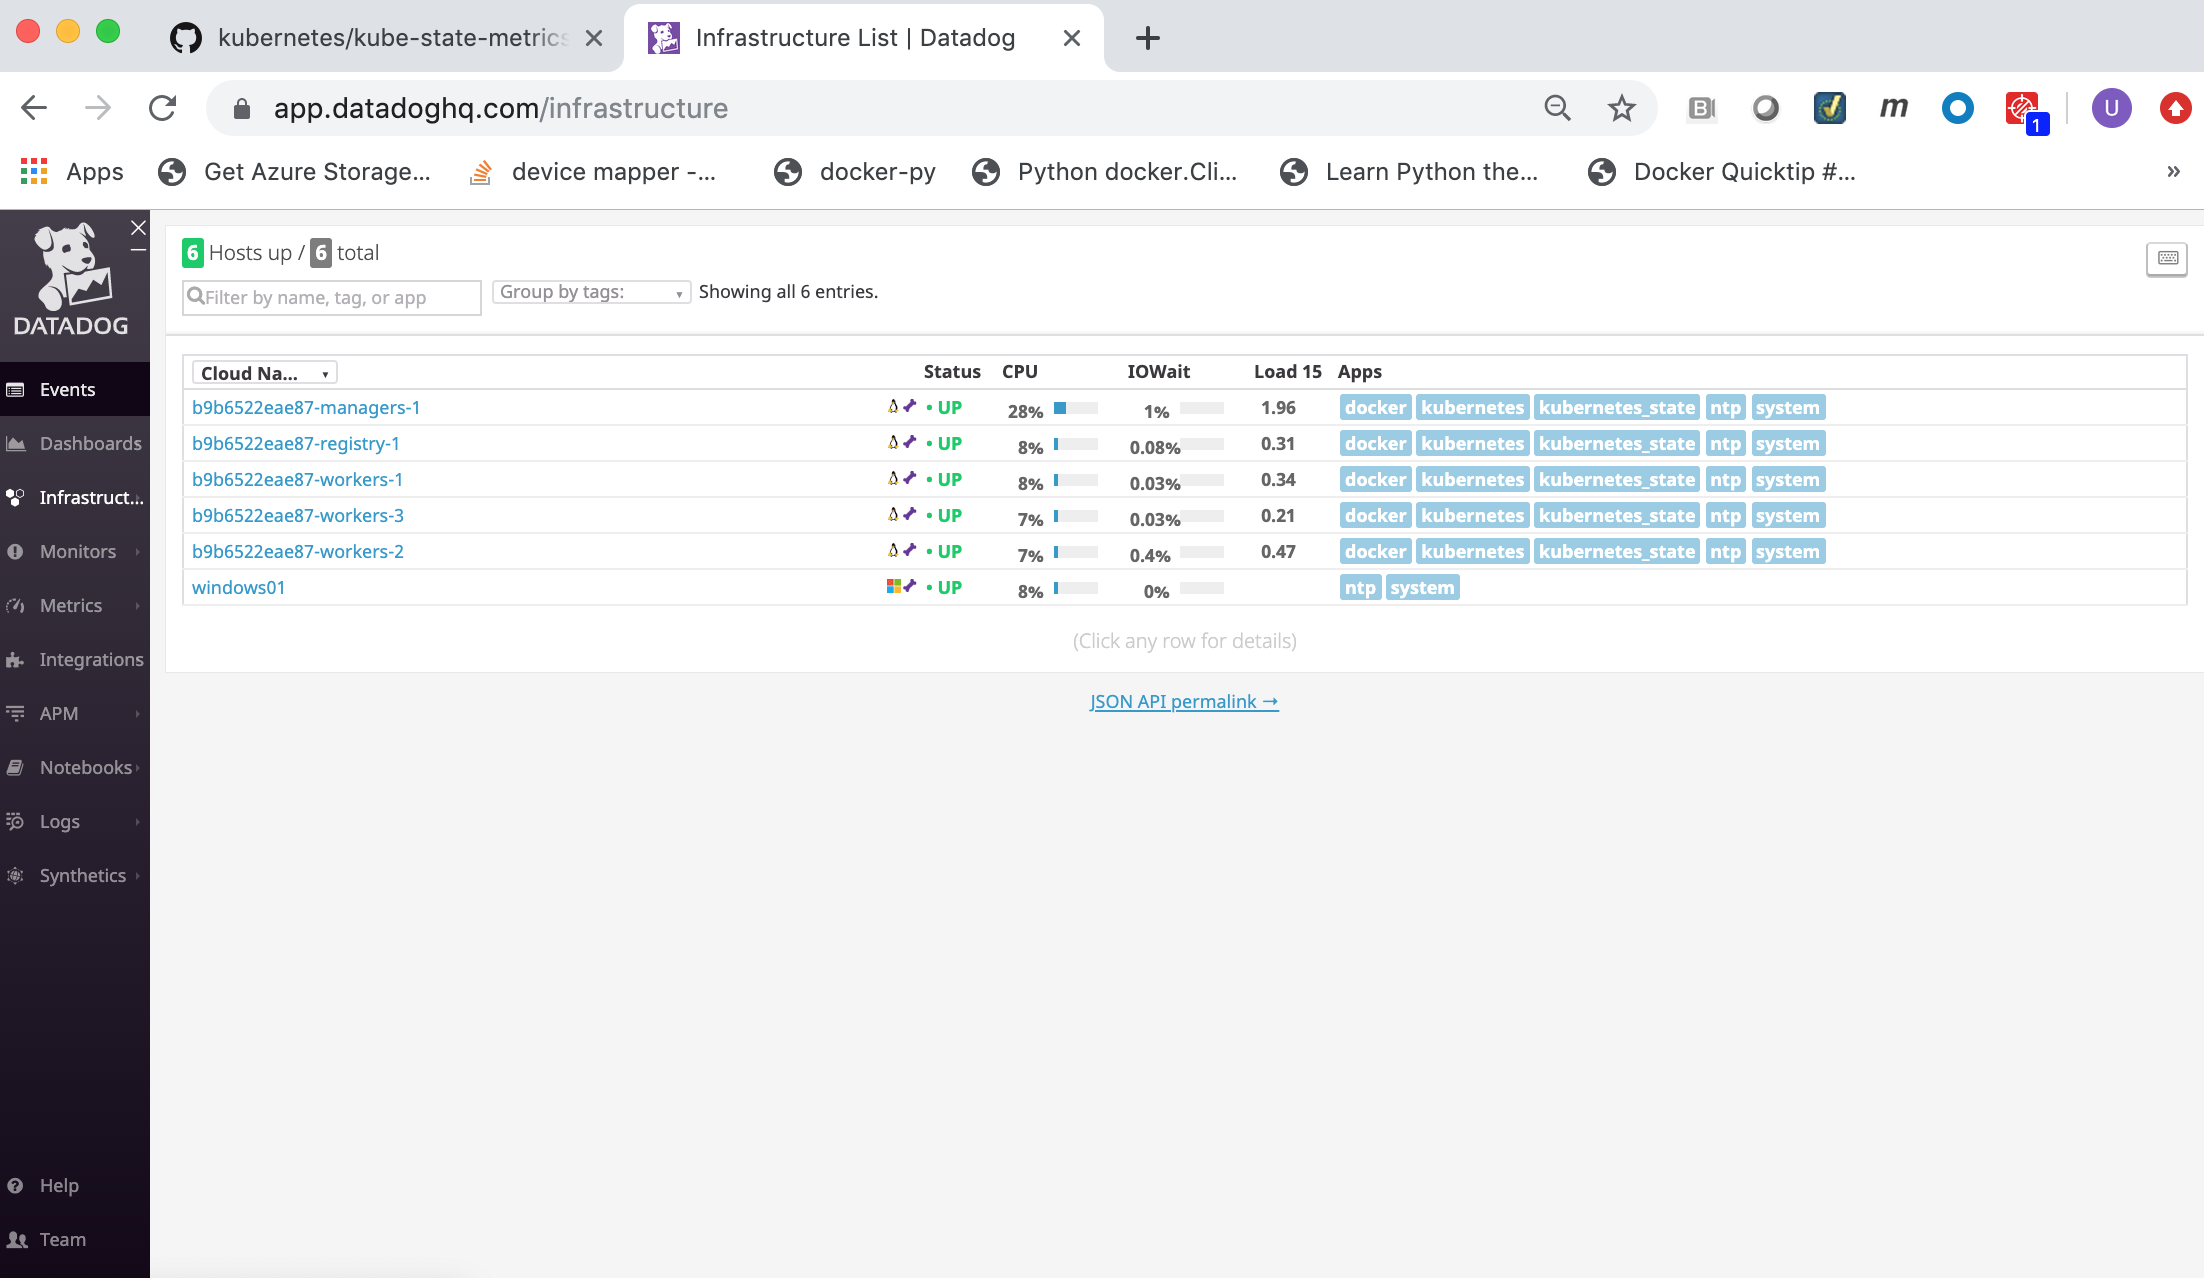
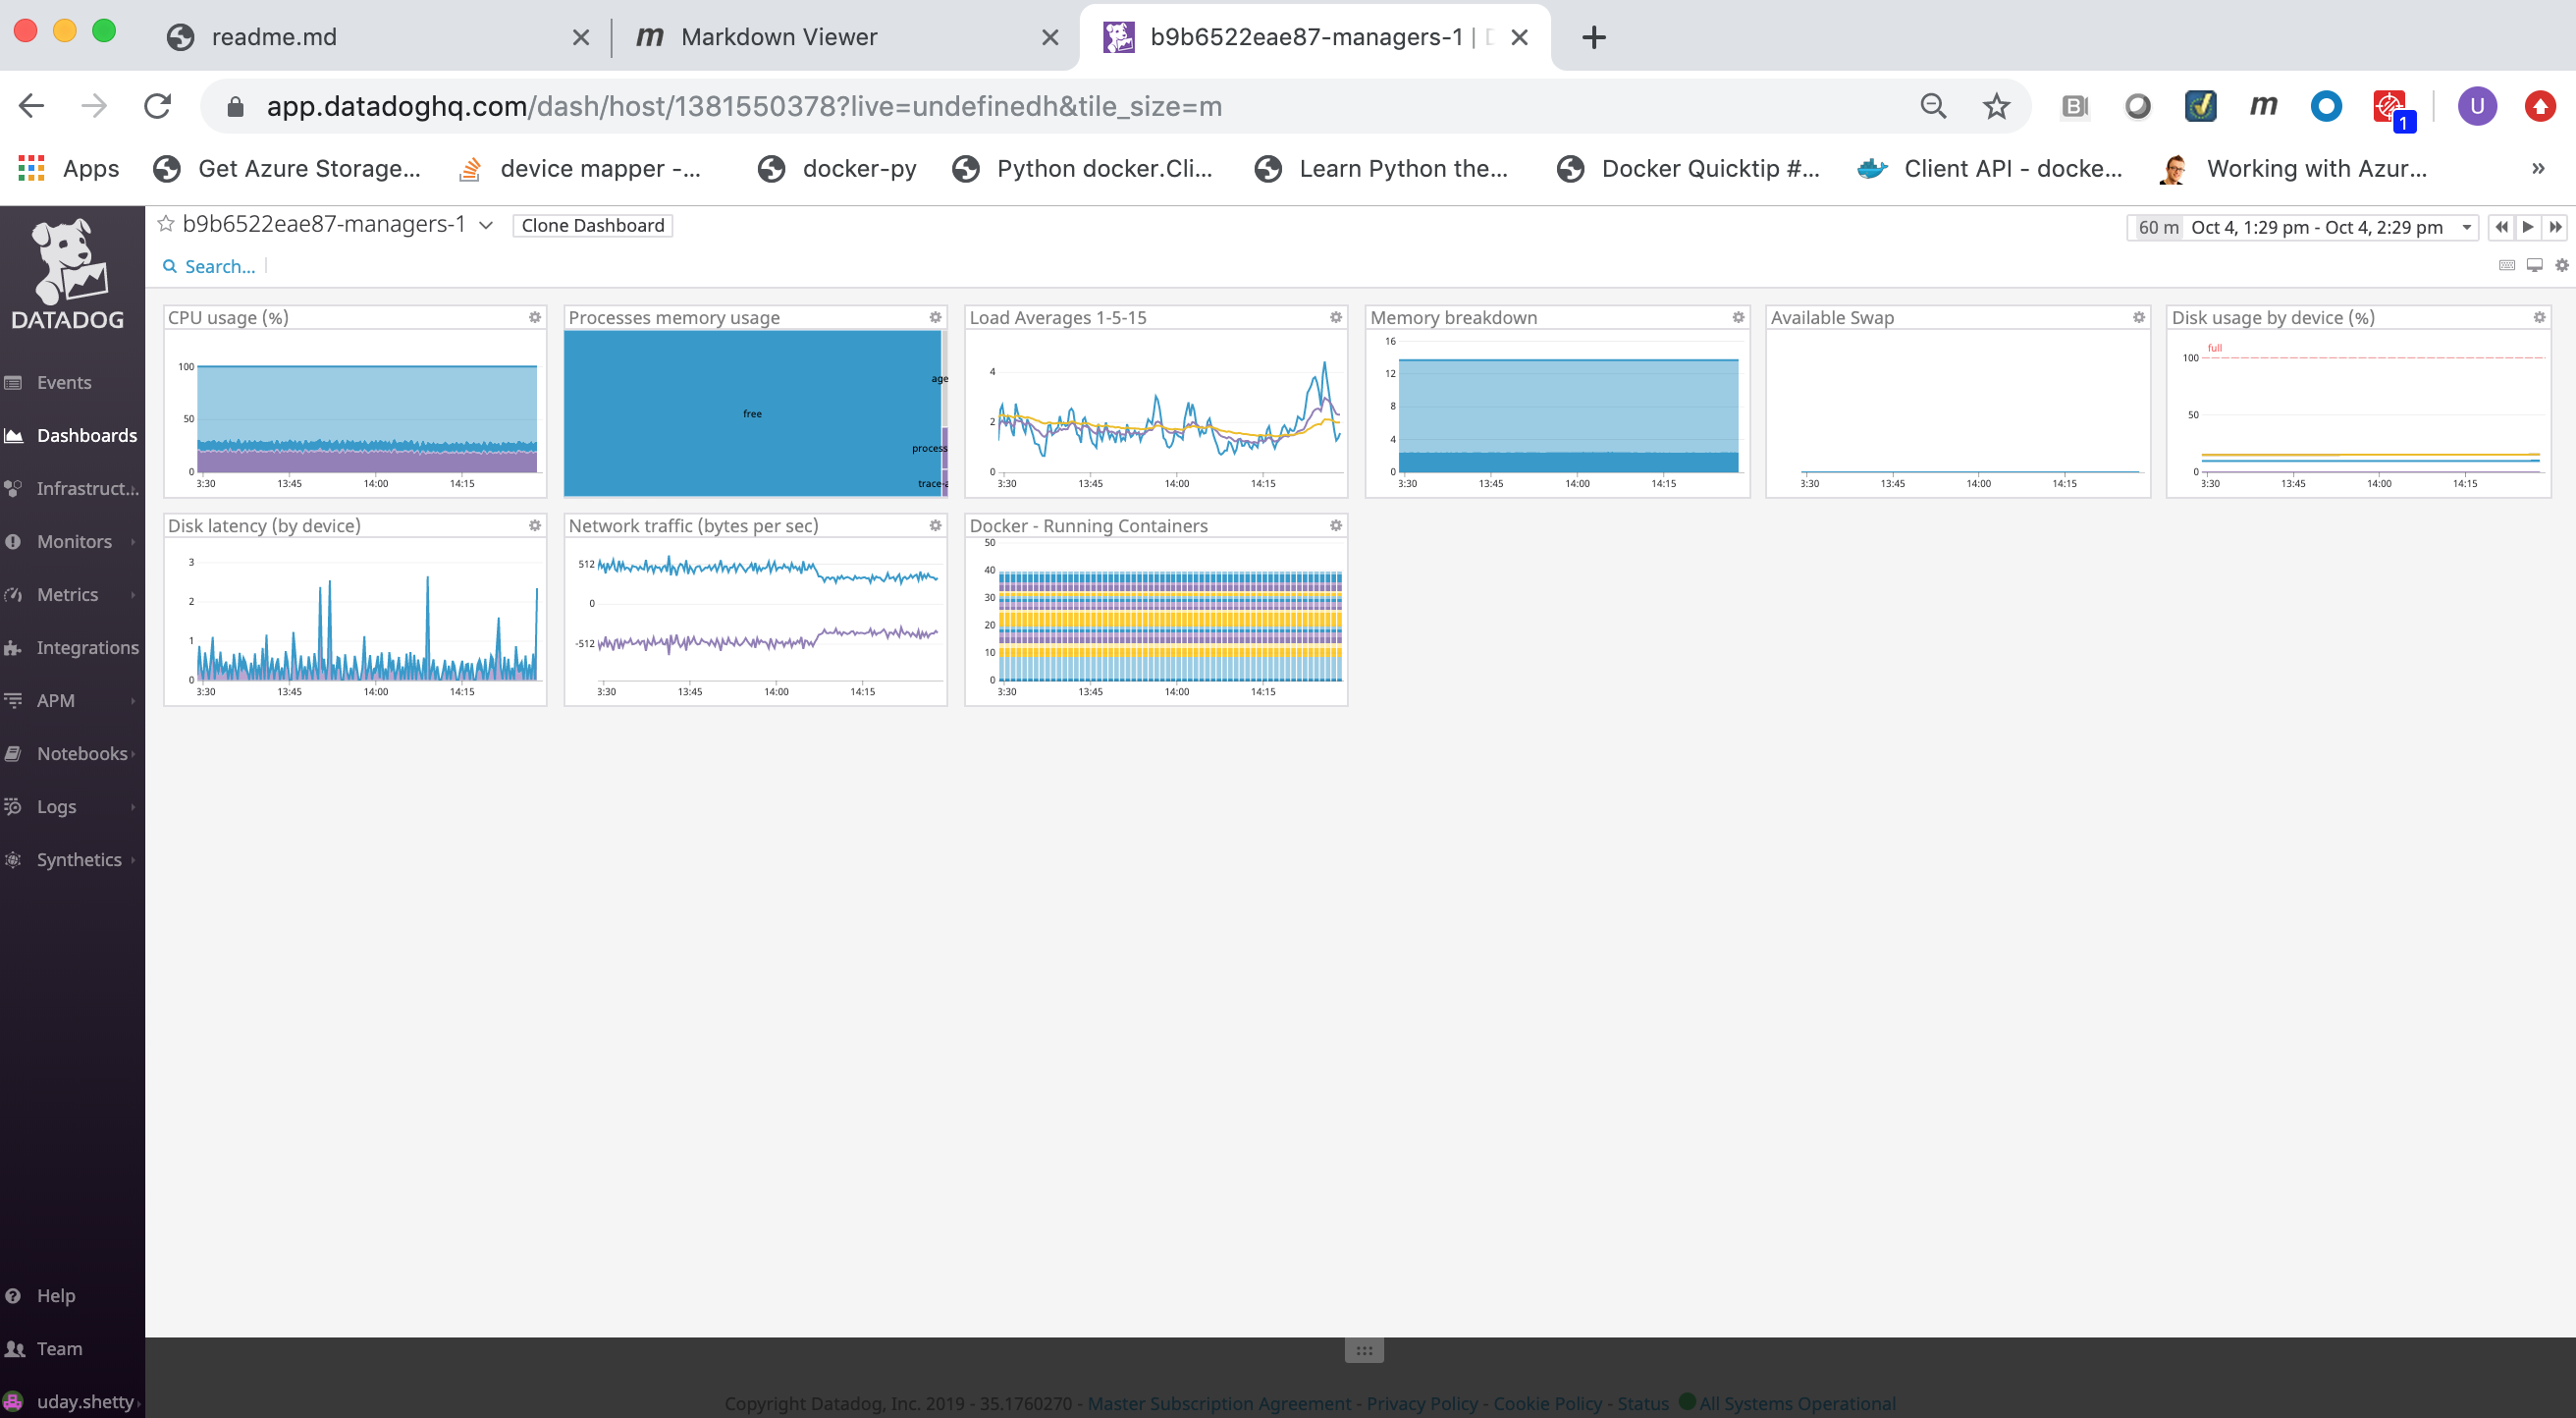
You can click on a Docker node to inspect it and get details.
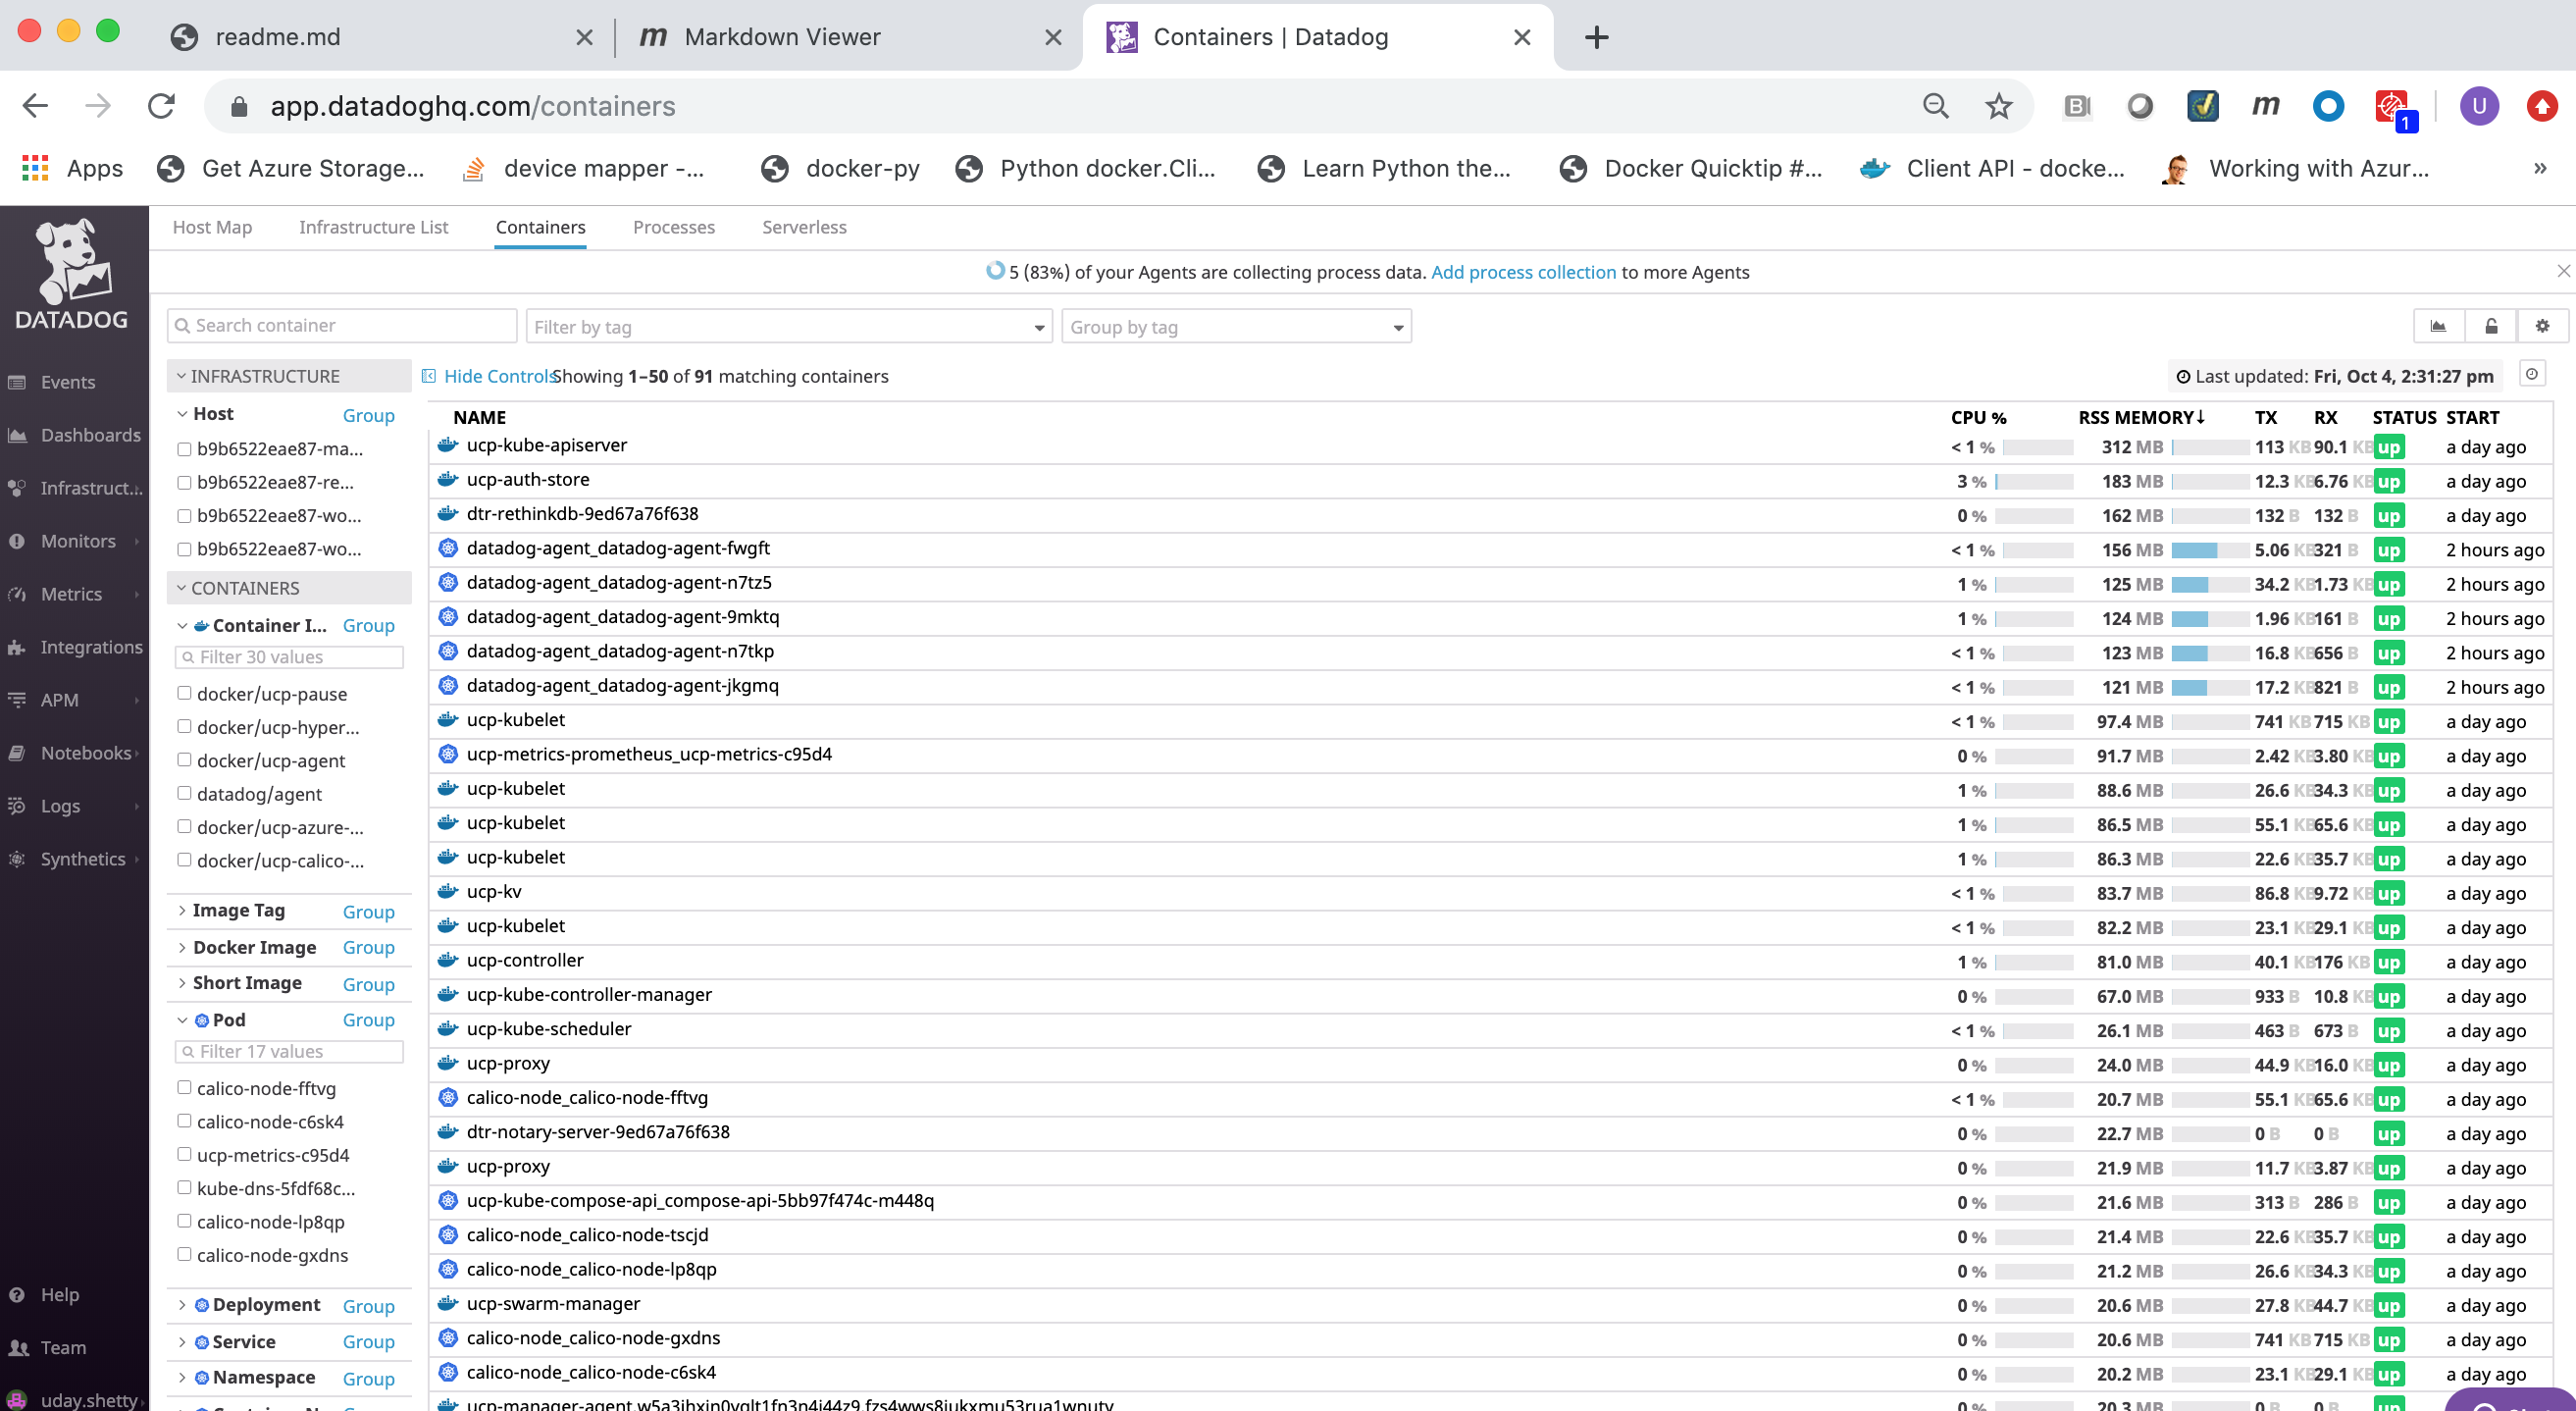
The Containers page lists all running containers from all Docker nodes being monitored:
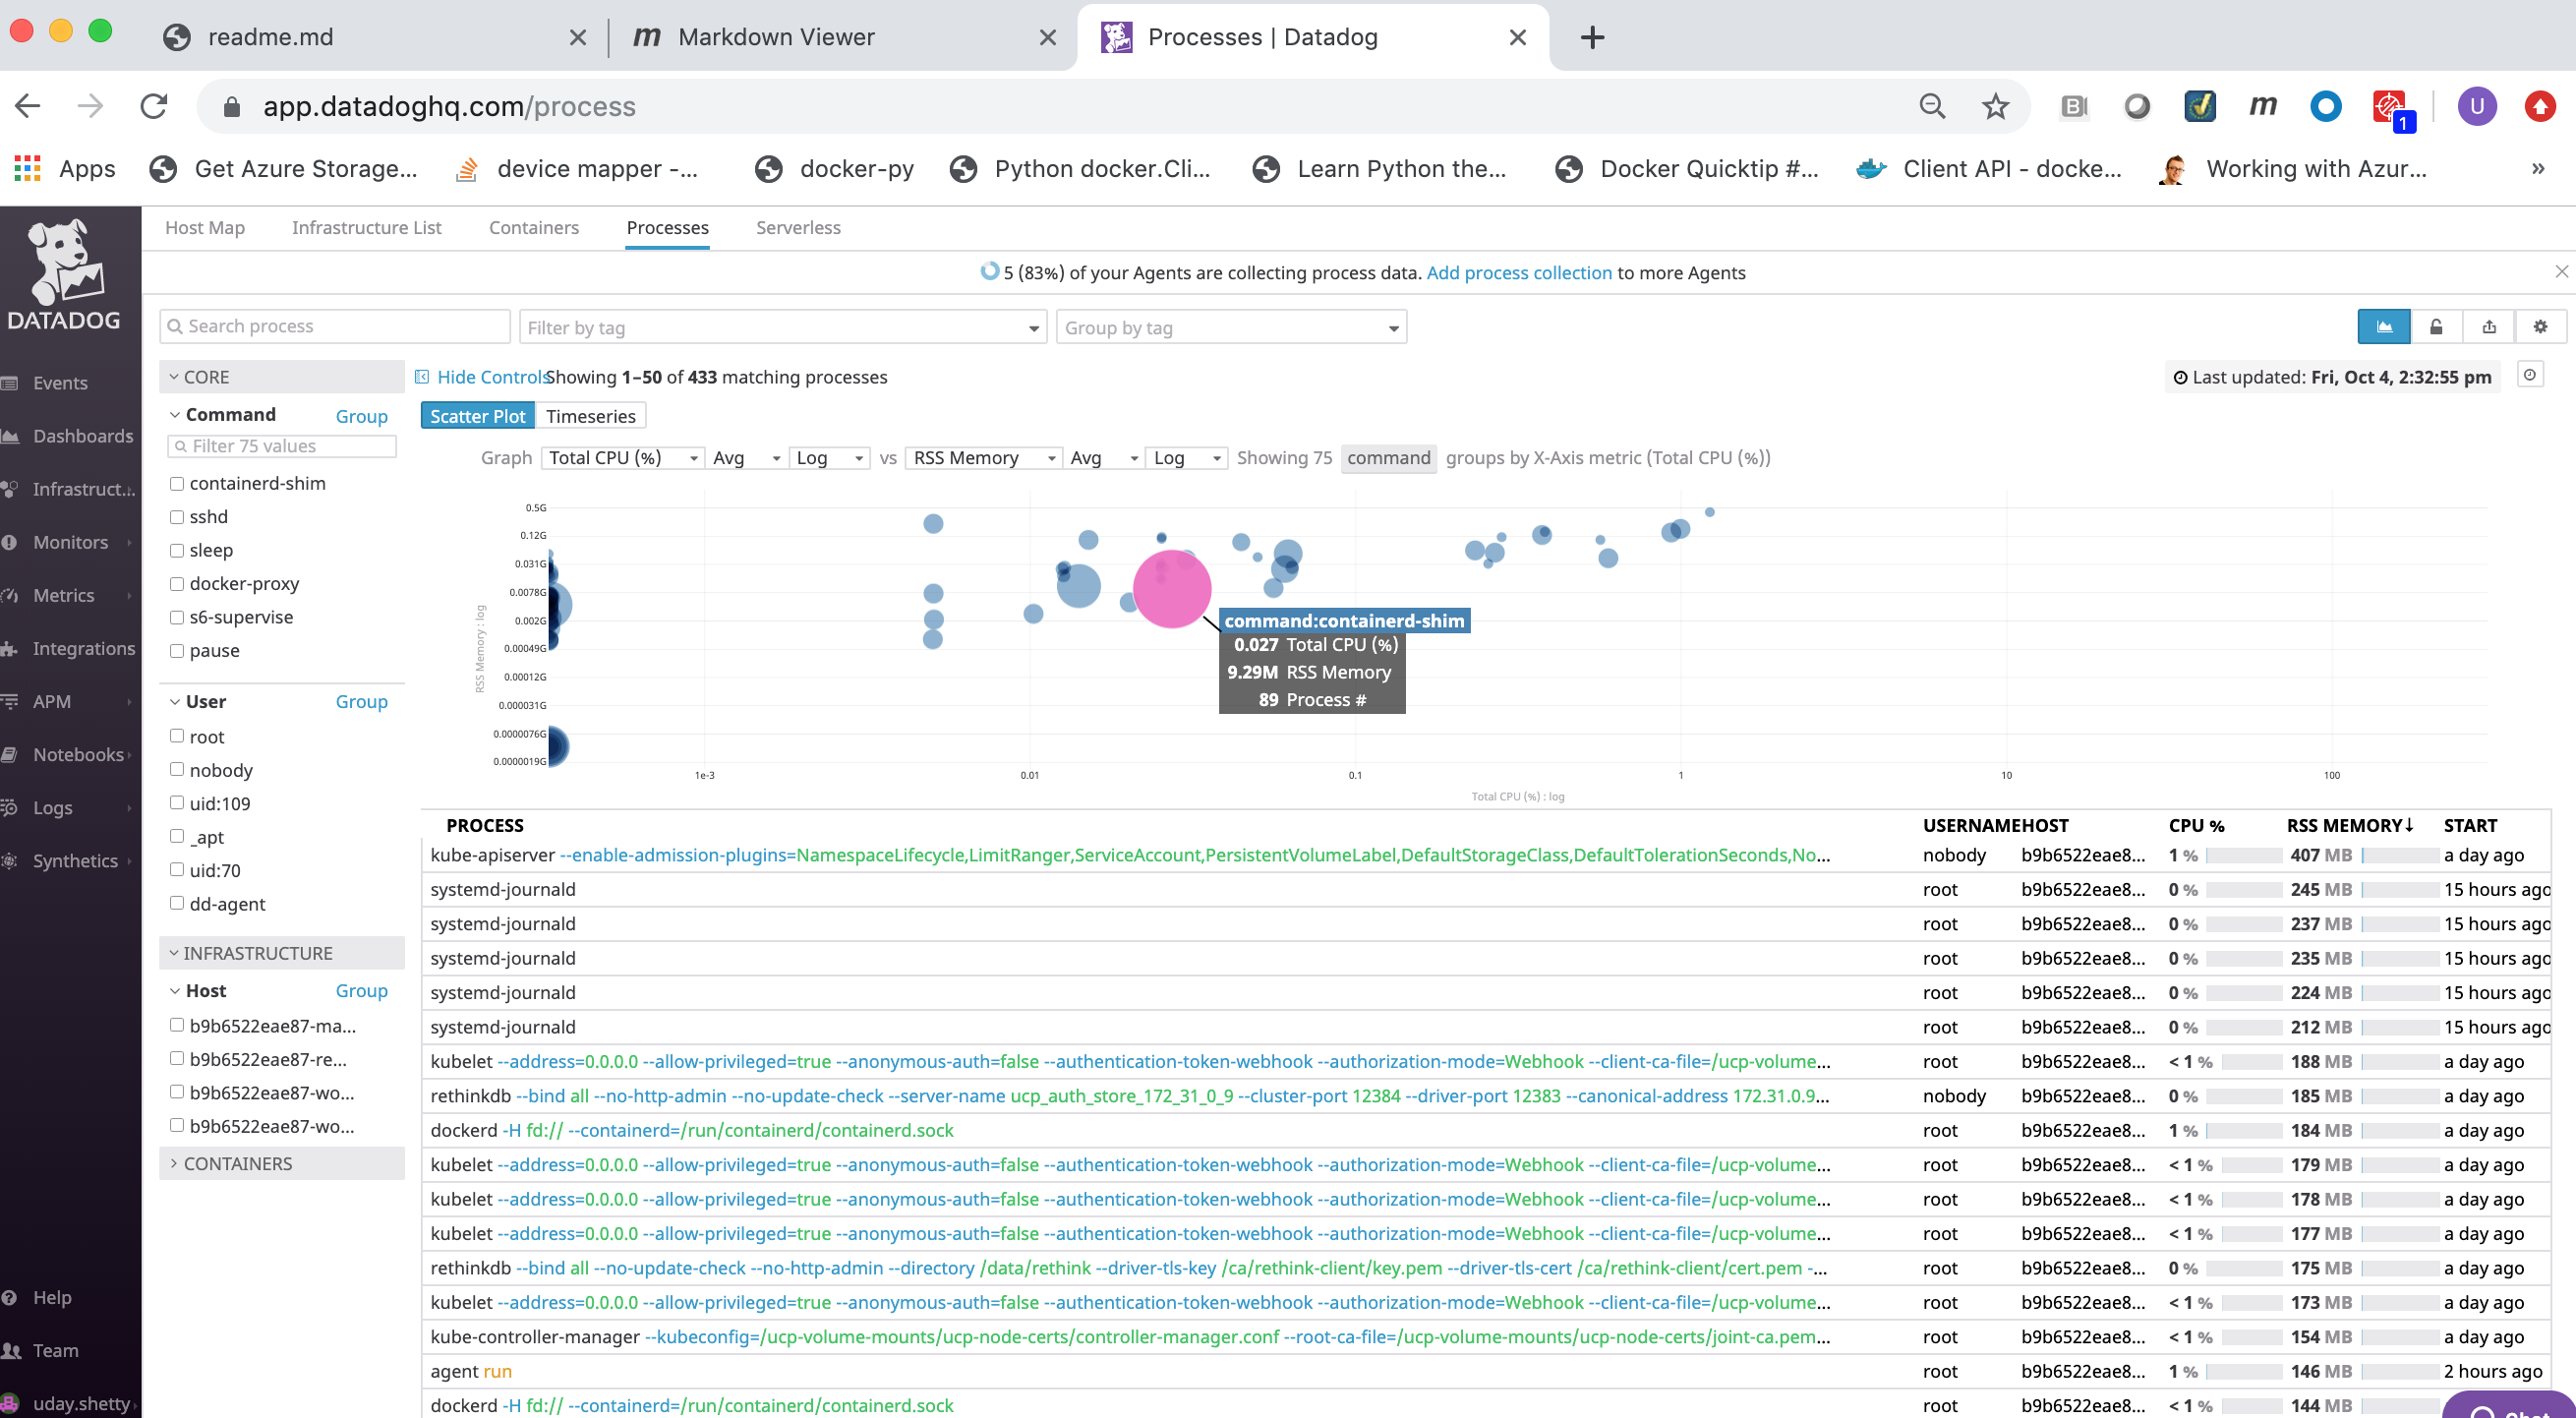
The Processes page displays a list of all running processes from all Docker nodes being monitored:

Logs
Search, view and graph all the logs generated by your applications, and your infrastructure.
See also
- Docker Enterprise
- Datadog Getting Started
- Datadog Quick Start Guide
- Datadog Docker Integration
- Getting Started with the Datadog agent
- Datadog Docker Agent
- Datadog Agent on Windows
- Docker Monitoring
- Kubernetes Integration
- Datadog Kubernetes Agent
- Datadog Documentation
- Datadog Knowledge Base and FAQ
- Datadog Blog
- Datadog Certified Docker Hub Image
Refer to the following links for more information on Datadog best practices:
Refer to the following links for more information on Monitoring and Troubleshooting:
Dynatrace Monitoring Implementation Guide for Docker Enterprise
Overview
Docker Solution Briefs enable you to integrate the Docker Enterprise with popular 3rd party ecosystem solutions for networking, load balancing, storage, logging and monitoring, access management, and more. This Solution Brief documents how to deploy Dynatrace to monitor the performance of Docker containers in a Docker Enterprise MKE Cluster environment.
Docker Enterprise includes Docker Cluster, a tool for for lifecycle management of Docker clusters. With Cluster, you use a YAML file to configure your provider’s resources. Then, with a single command, you provision and install all the resources from your configuration. The Docker Enterprise cluster was created using ‘docker cluster’ tool on Azure Cloud for this solution brief.
Note
Information on Dynatrace is provided by Docker as a known, working configuration for Docker Enterprise 3.0. Docker does not provide the product support for Dynatrace. Please contact the vendor approved support methods if you have any questions or problems with Dynatrace.
Dynatrace Overview
Dynatrace is an artificial intelligence (AI) powered, full stack, automated Application Performance Management and Infrastructure Monitoring solution for programs running on-premises and in the cloud. Dynatrace manages the availability and performance of software applications and the impact on user experience in the form of deep transaction tracing, synthetic monitoring, real user monitoring, and network monitoring.
Product Benefits
- Auto-discovery - Dynatrace Smartscape® technology automatically detects and displays all the components and dependencies that comprise your environment, providing you with a real-time blueprint of your application architecture.
- Auto-baselining - Dynatrace uses AI to understand the difference between desirable and unwanted behaviors emerging from each component. It can also dive deep into the code to uncover methods being invoked and how they contribute to the overall performance of the system.
- Auto-problem analysis - Dynatrace rapidly identifies failures, component involvement, and root causes. Machine learning helps evaluate issues, determine if it warrants an alert, and provide valuable insights for better business decisions.
Dynatrace’s main features
- Hybrid multi-cloud, container, and infrastructure monitoring
- Support for native apps, microservices and containers
- Full stack discovery
- Single transaction analysis
- User behavior analytics
- Automated root-cause analysis
- Docker Swarm and Kubernetes integration
- SaaS or on-premise deployment
- Deploy, configure, and manage with zero touch
- Intuitive dashboards pre-configured with self-learning
- Open ecosystem with seamless integration along with APIs and platform extensions
Dynatrace Supported Technologies
Dynatrace supports are large array of technologies. Some of the most popular ones are:
AMP, ASPNET Core, AWS CodePipeline, AWS Elastic Load Balancing (ELB), AWS Lambda, ActiveMQ, Akka, Amazon DynamoDB, Amazon EC2, Amazon Elastic Block Store (EBS), Amazon RDS, Amazon S3, Amazon Web Services, Android, Android app monitoring, AngularJS, Ansible, Apache Cordova, Apache HTTP Server, Azure App Service, Azure Container Services (AKS), Azure Virtual Machines, Azure Web Apps, Bitbucket, C, C++, CakePHP, Cassandra, Citrix, Cloud Foundry, CouchDB, Couchbase, DC/OS, Demandware, Docker, Drupal, Elasticsearch, Erlang, Eureka, GlassFish, Golang, Google Cloud Platform, GraalVM, Grails, Hadoop, Heroku, HipChat, Hyper-V, Hystrix, IBM Bluemix, IBM Cloud, IBM Commerce, IBM HTTP Server, IBM WebSphere, IBM z/OS, JBoss, Java, Jetty, Jira, Joomla, Jython, Kubernetes, Laravel, Magento, Memcached, Mesos, Microsoft Azure, Microsoft IIS, Microsoft SharePoint, MongoDB, MySQL, .NET, .NET Core, Netflix OSS, Netty, Nginx, NodeJS, OpenStack, OpenTracing, Openshift, OpsGenie, Oracle Cloud, Oracle DB, Oracle HTTP Server, Oracle WebLogic, Oracle eBusiness, PHP, PagerDuty, Perl, Pivotal, Pivotal Cloud Foundry, Play Framework, PostgreSQL, Python, RabbitMQ, Reactjs, Red Hat, Redis, Ruby, SAP, SAP Cloud Platform, SAP Hybris, SQL Server, Salesforce Commerce Cloud, Scala, ServiceNow, Sitecore, Slack, Spark, Splunk, Spring, Symfony, TomEE, Tomcat, Trello, VMware, VMware Cloud on AWS, Varnish, VictorOps, Webhooks, Wildfly, Windows Messaging, WordPress, iOS, iOS, jQuery, xMatters
See also
Refer to Dynatrace Supported technologies for a complete updated list of the technologies it detects and supports.
Dynatrace Monitoring environment
The Dynatrace Monitoring environment consists of a Dynatrace server, Dynatrace agents and Dynatrace Activate (proxy).
- Collects, stores and analyzes the monitoring data sent to it from the Dynatrace agents.
- Provides a web UI for viewing and searching, and a REST API.
- Dynatrace has both a SaaS server and an on-premise server (Dynatrace Managed Server).
- Dynatrace provides an agent named OneAgent for all of the major Linux distributions and Windows that needs to be deployed on all Docker node that you wish to monitor.
- The Dynatrace agent automatically discovers the infrastructure, collects the events and metrics, and forwards them to the Dynatrace SaaS server for processing, analysis and viewing.
- Dynatrace provides their Linux agent and Windows agent as installable binaries.
- Dynatrace also provides their linux agent as a certified docker image in Docker Hub dynatrace/oneagent.
Note
For more details on the Dynatrace supported Operating Systems and environments refer to Dynatrace OneAgent Supported Environments.
Dynatrace Activegate is an optional proxy you can install between the Dynatrace agents and the Dynatrace Server (SaaS or on-premise).
Note
Refer to Dynatrace Activegate for more details on when and why you should install it.
In this Solution Brief the Dynatrace SaaS server will be used. The Dynatrace agents will be deployed and configured to send their monitoring data to the Dynatrace SaaS Server.
Docker Enterprise MKE Cluster
This Solution Brief was tested with the following Docker Enterprise components:
- Docker Enterprise 3.0 with Mirantis Container Runtime 19.03.2, MKE 3.2.1 and MSR 2.7.1, Dynatrace OneAgent version 1.32.1000
This Docker Enterprise environment in this implementation guide had 6 nodes (1 manager and 5 workers).
Refer to Docker Enterprise Best Practices and Design Considerations reference architecture for details.
Dynatrace SaaS account
A Dynatrace SaaS account is required. You can register for a free 15-day trial Dynatrace account on https://www.dynatrace.com/.
To register for a free 15-day trial Dynatrace account:
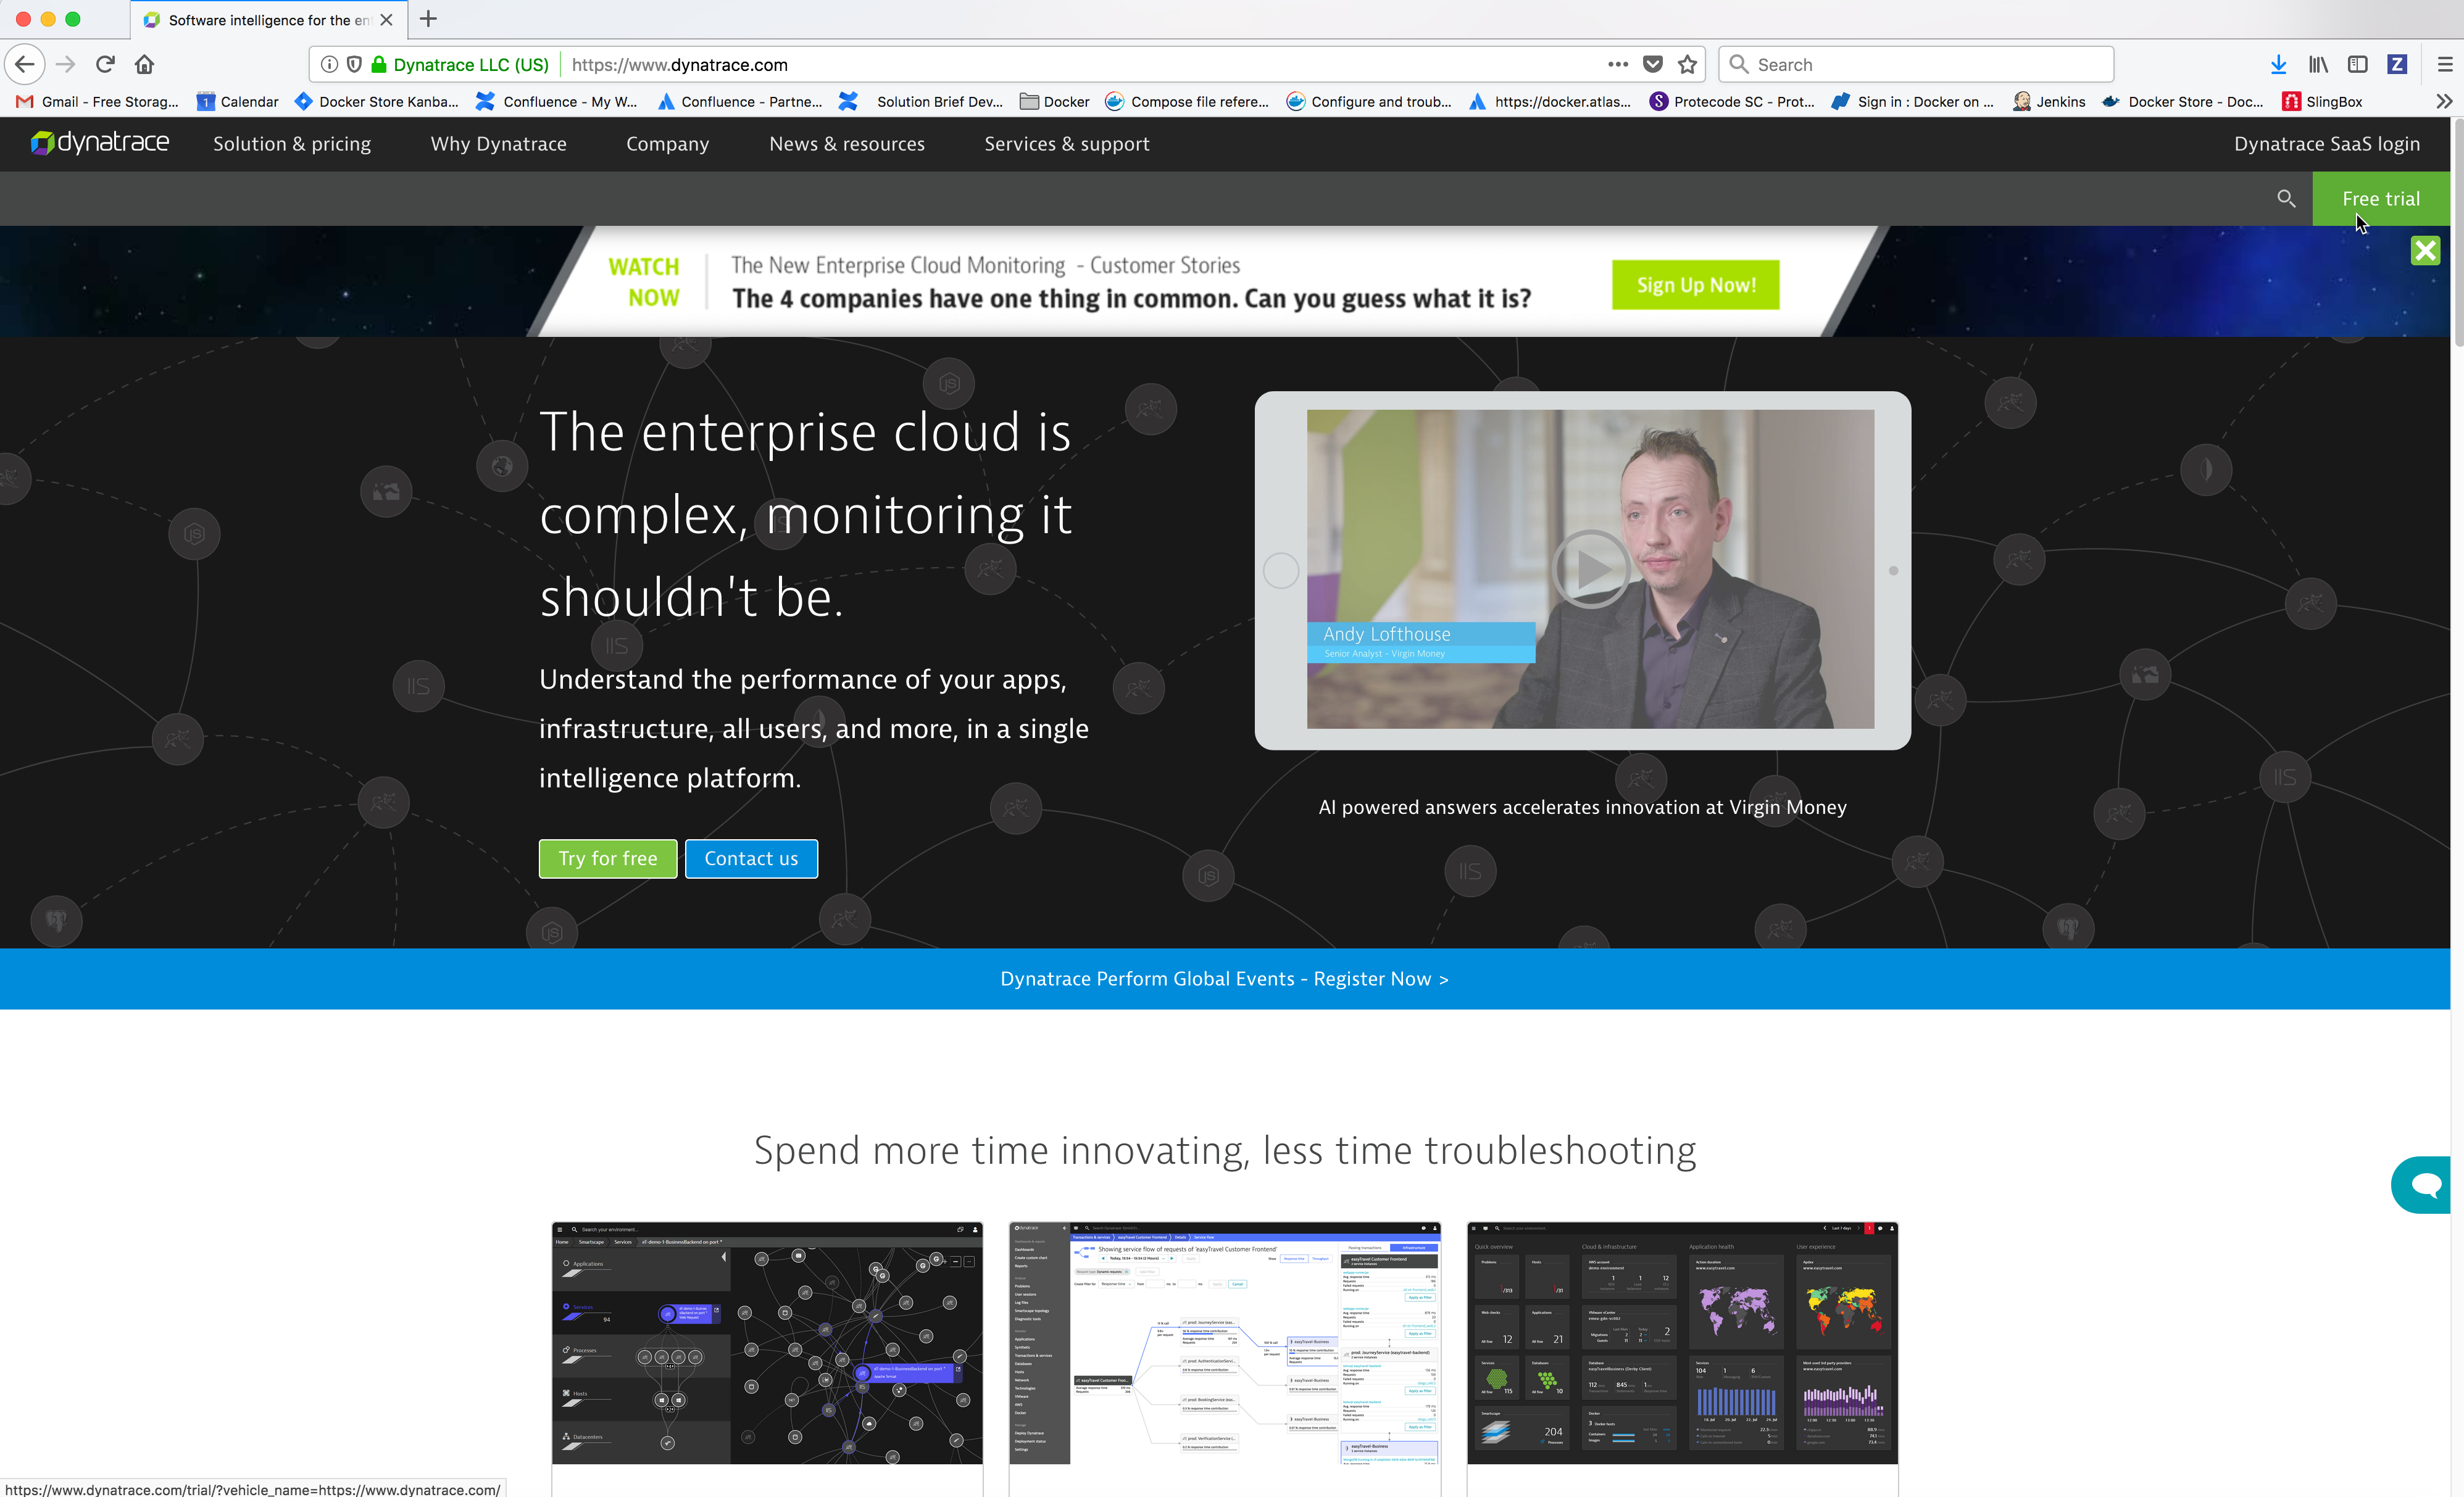
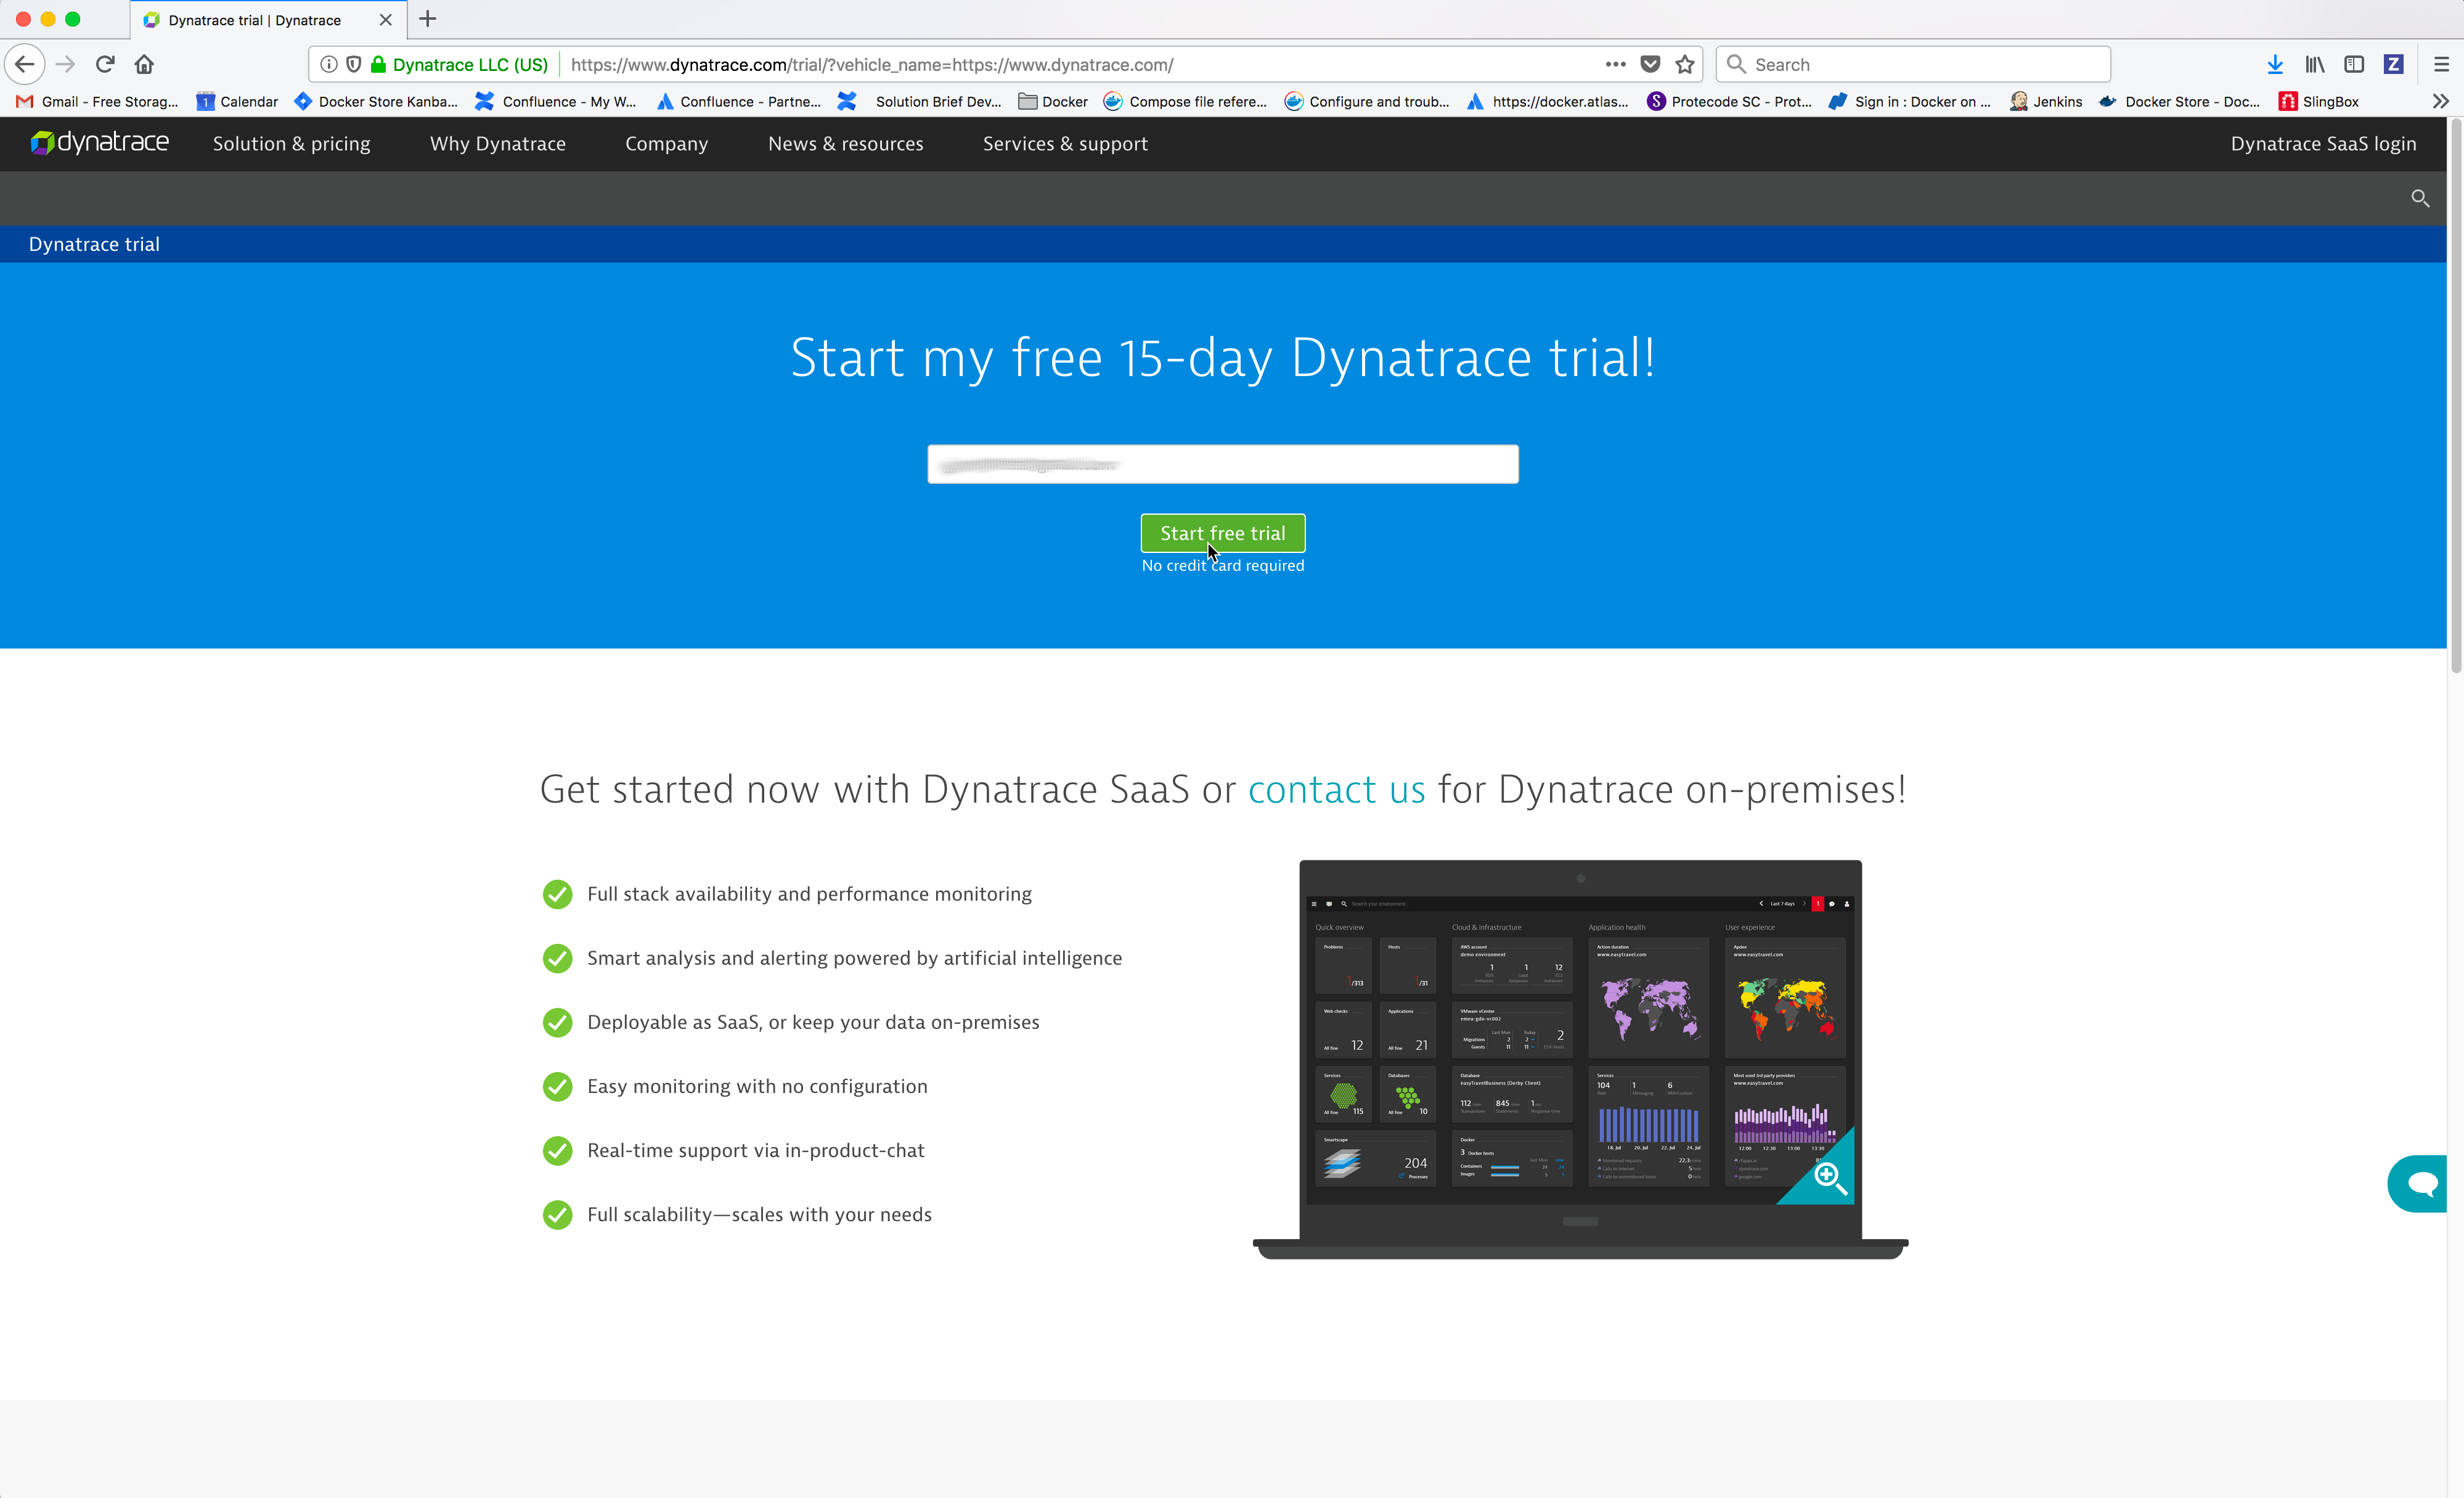
From a web browser, navigate to the URL https://www.dynatrace.com/.
Click on the Free trial button.
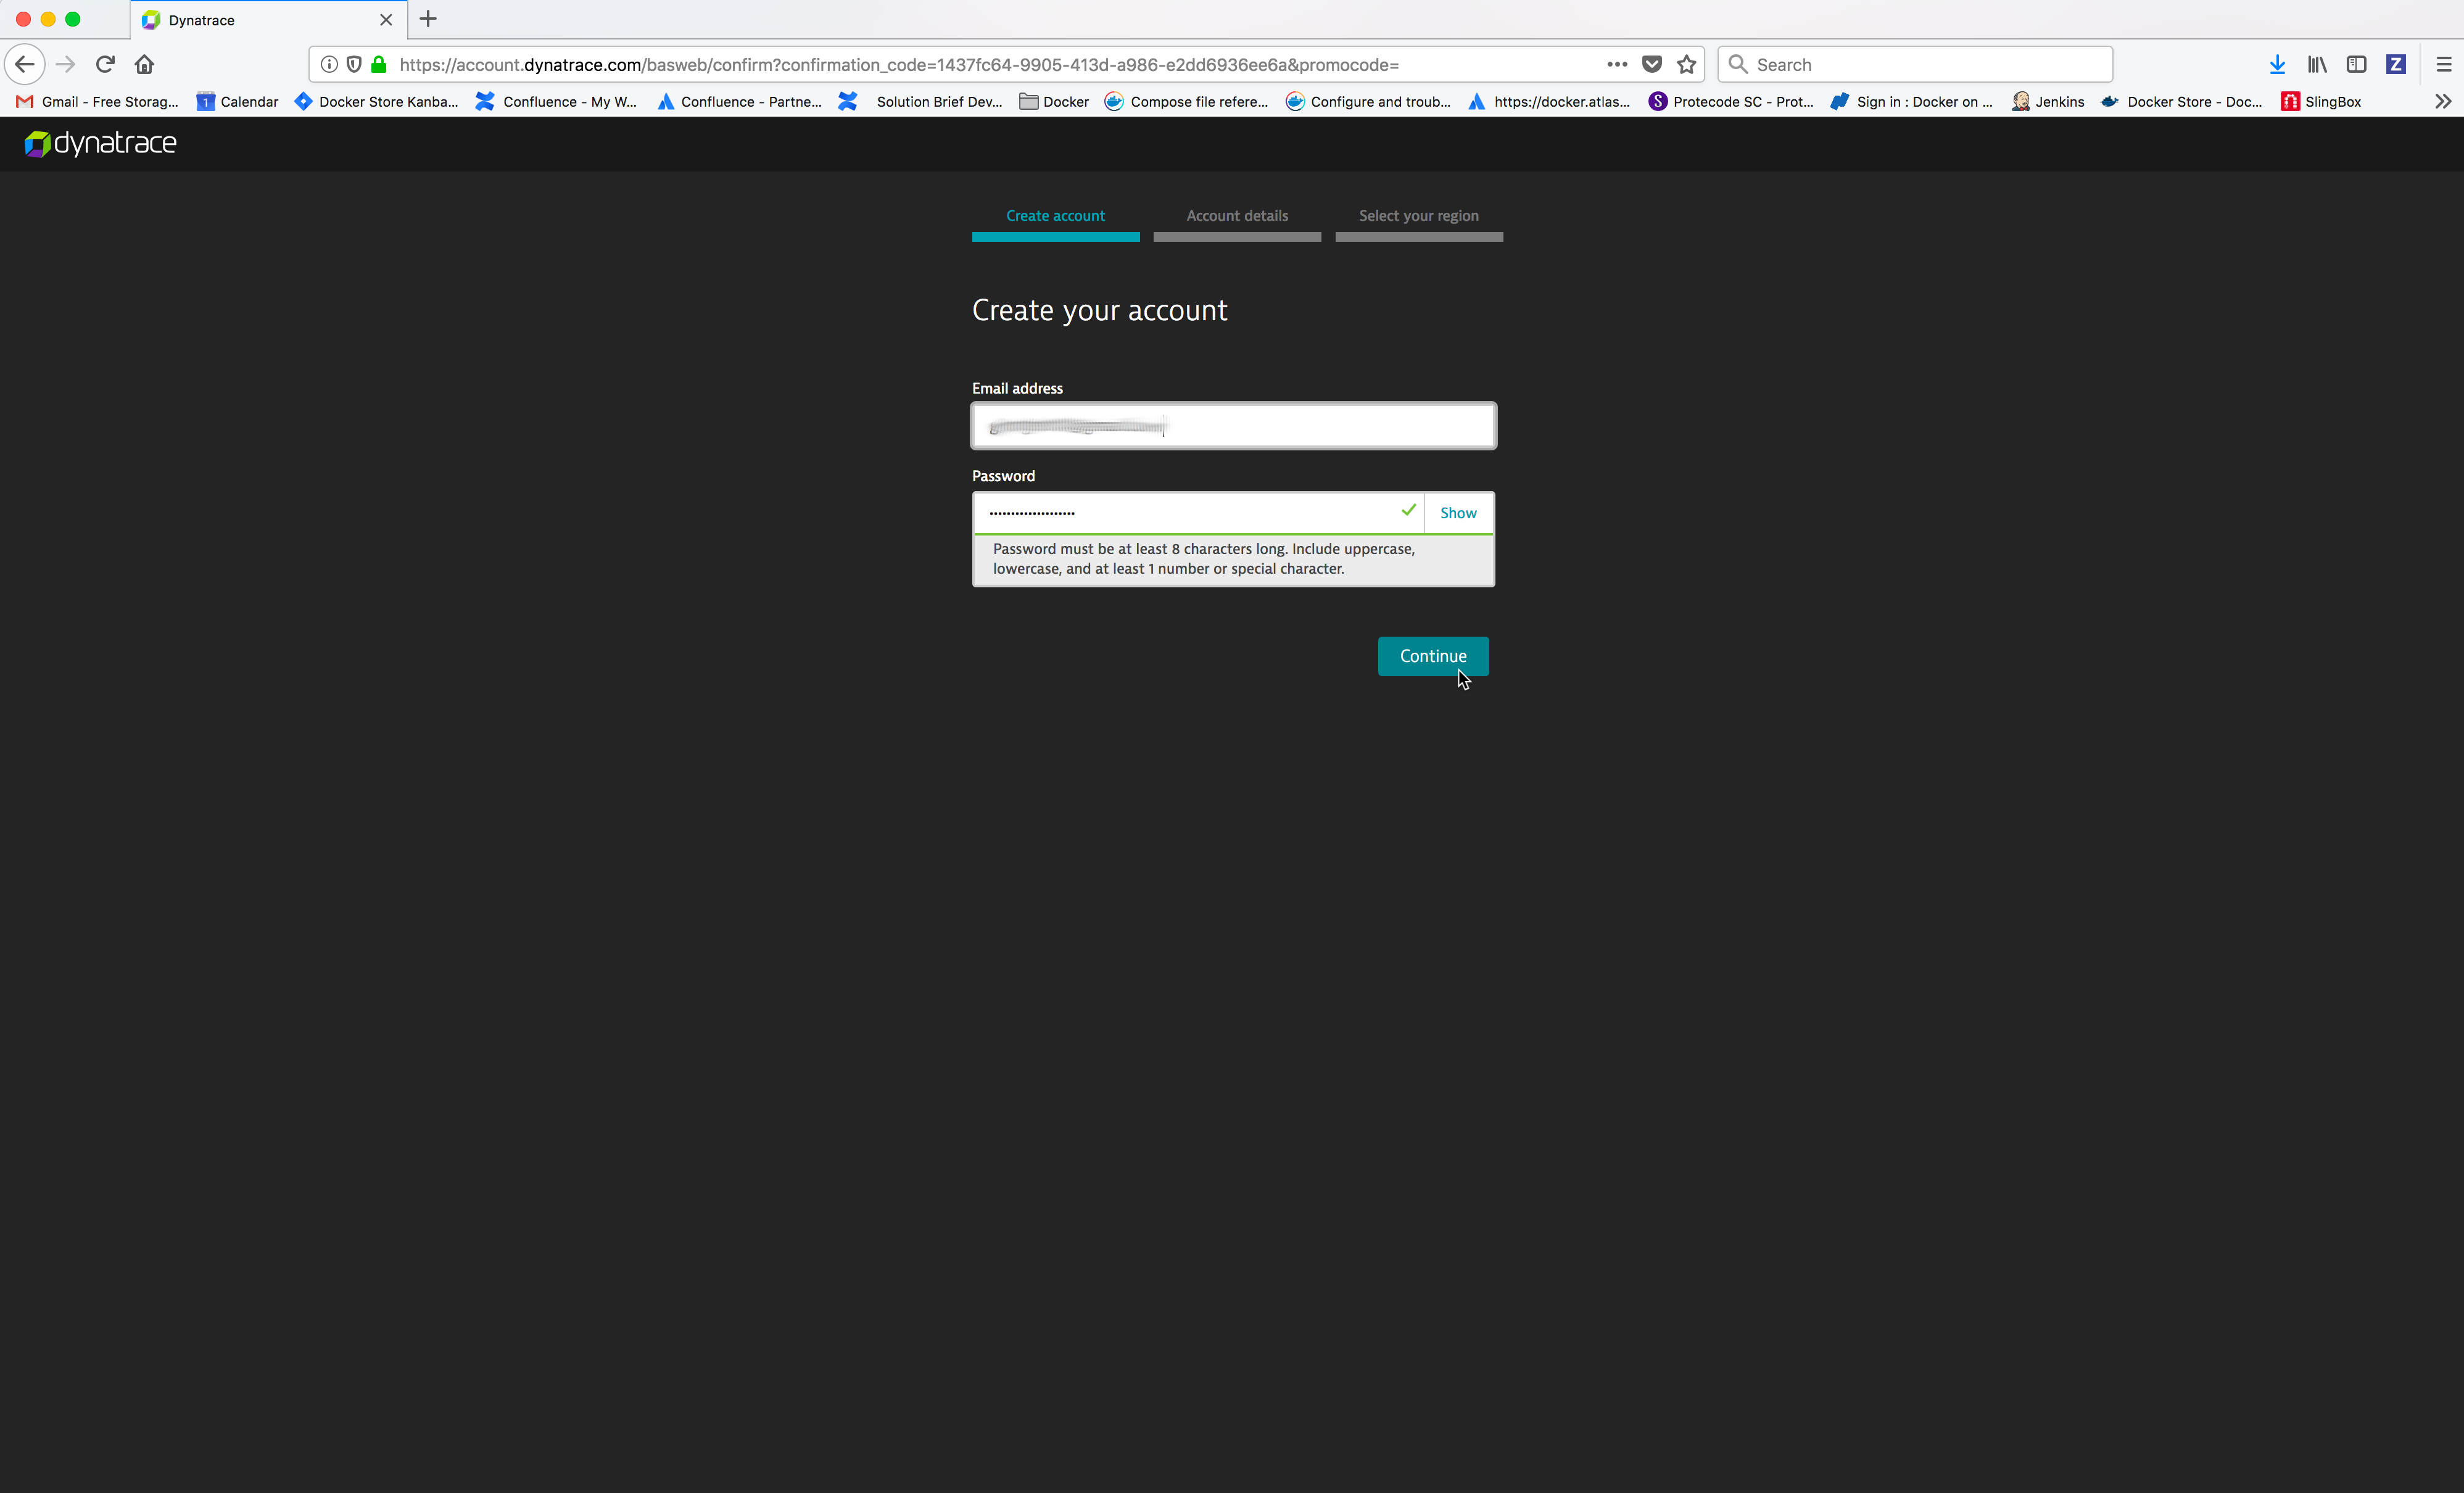
Enter your email address and then click on the Start free trial button.
Enter your desired password and then click on the Continue button.
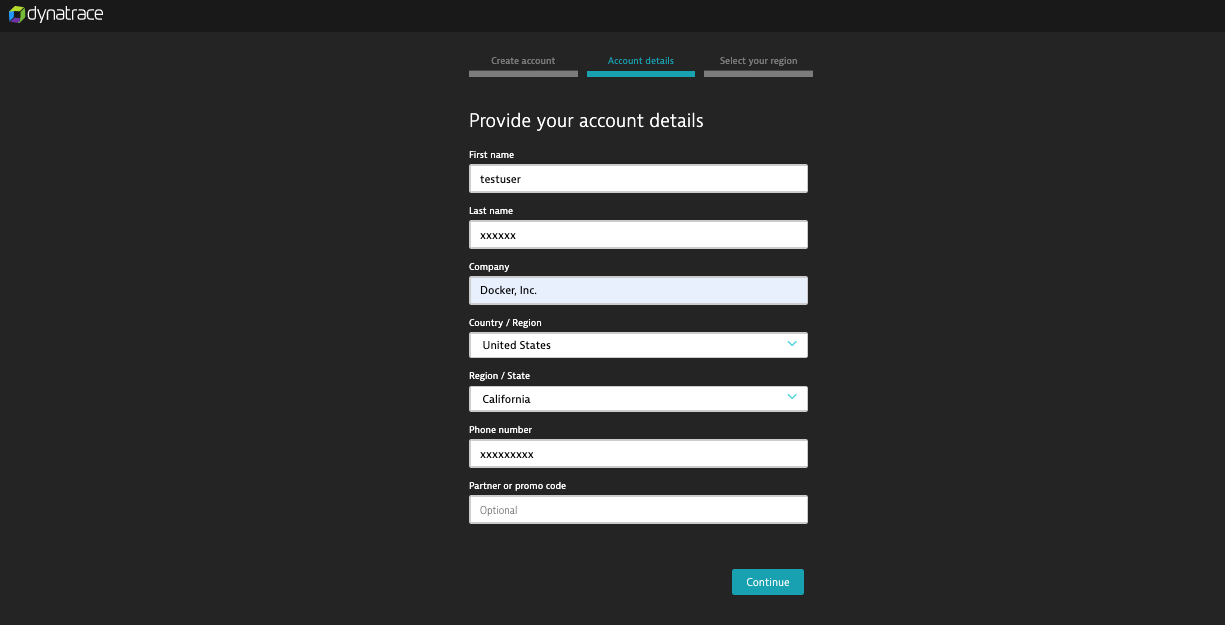
Enter the necessary account details and then click on the Continue button.
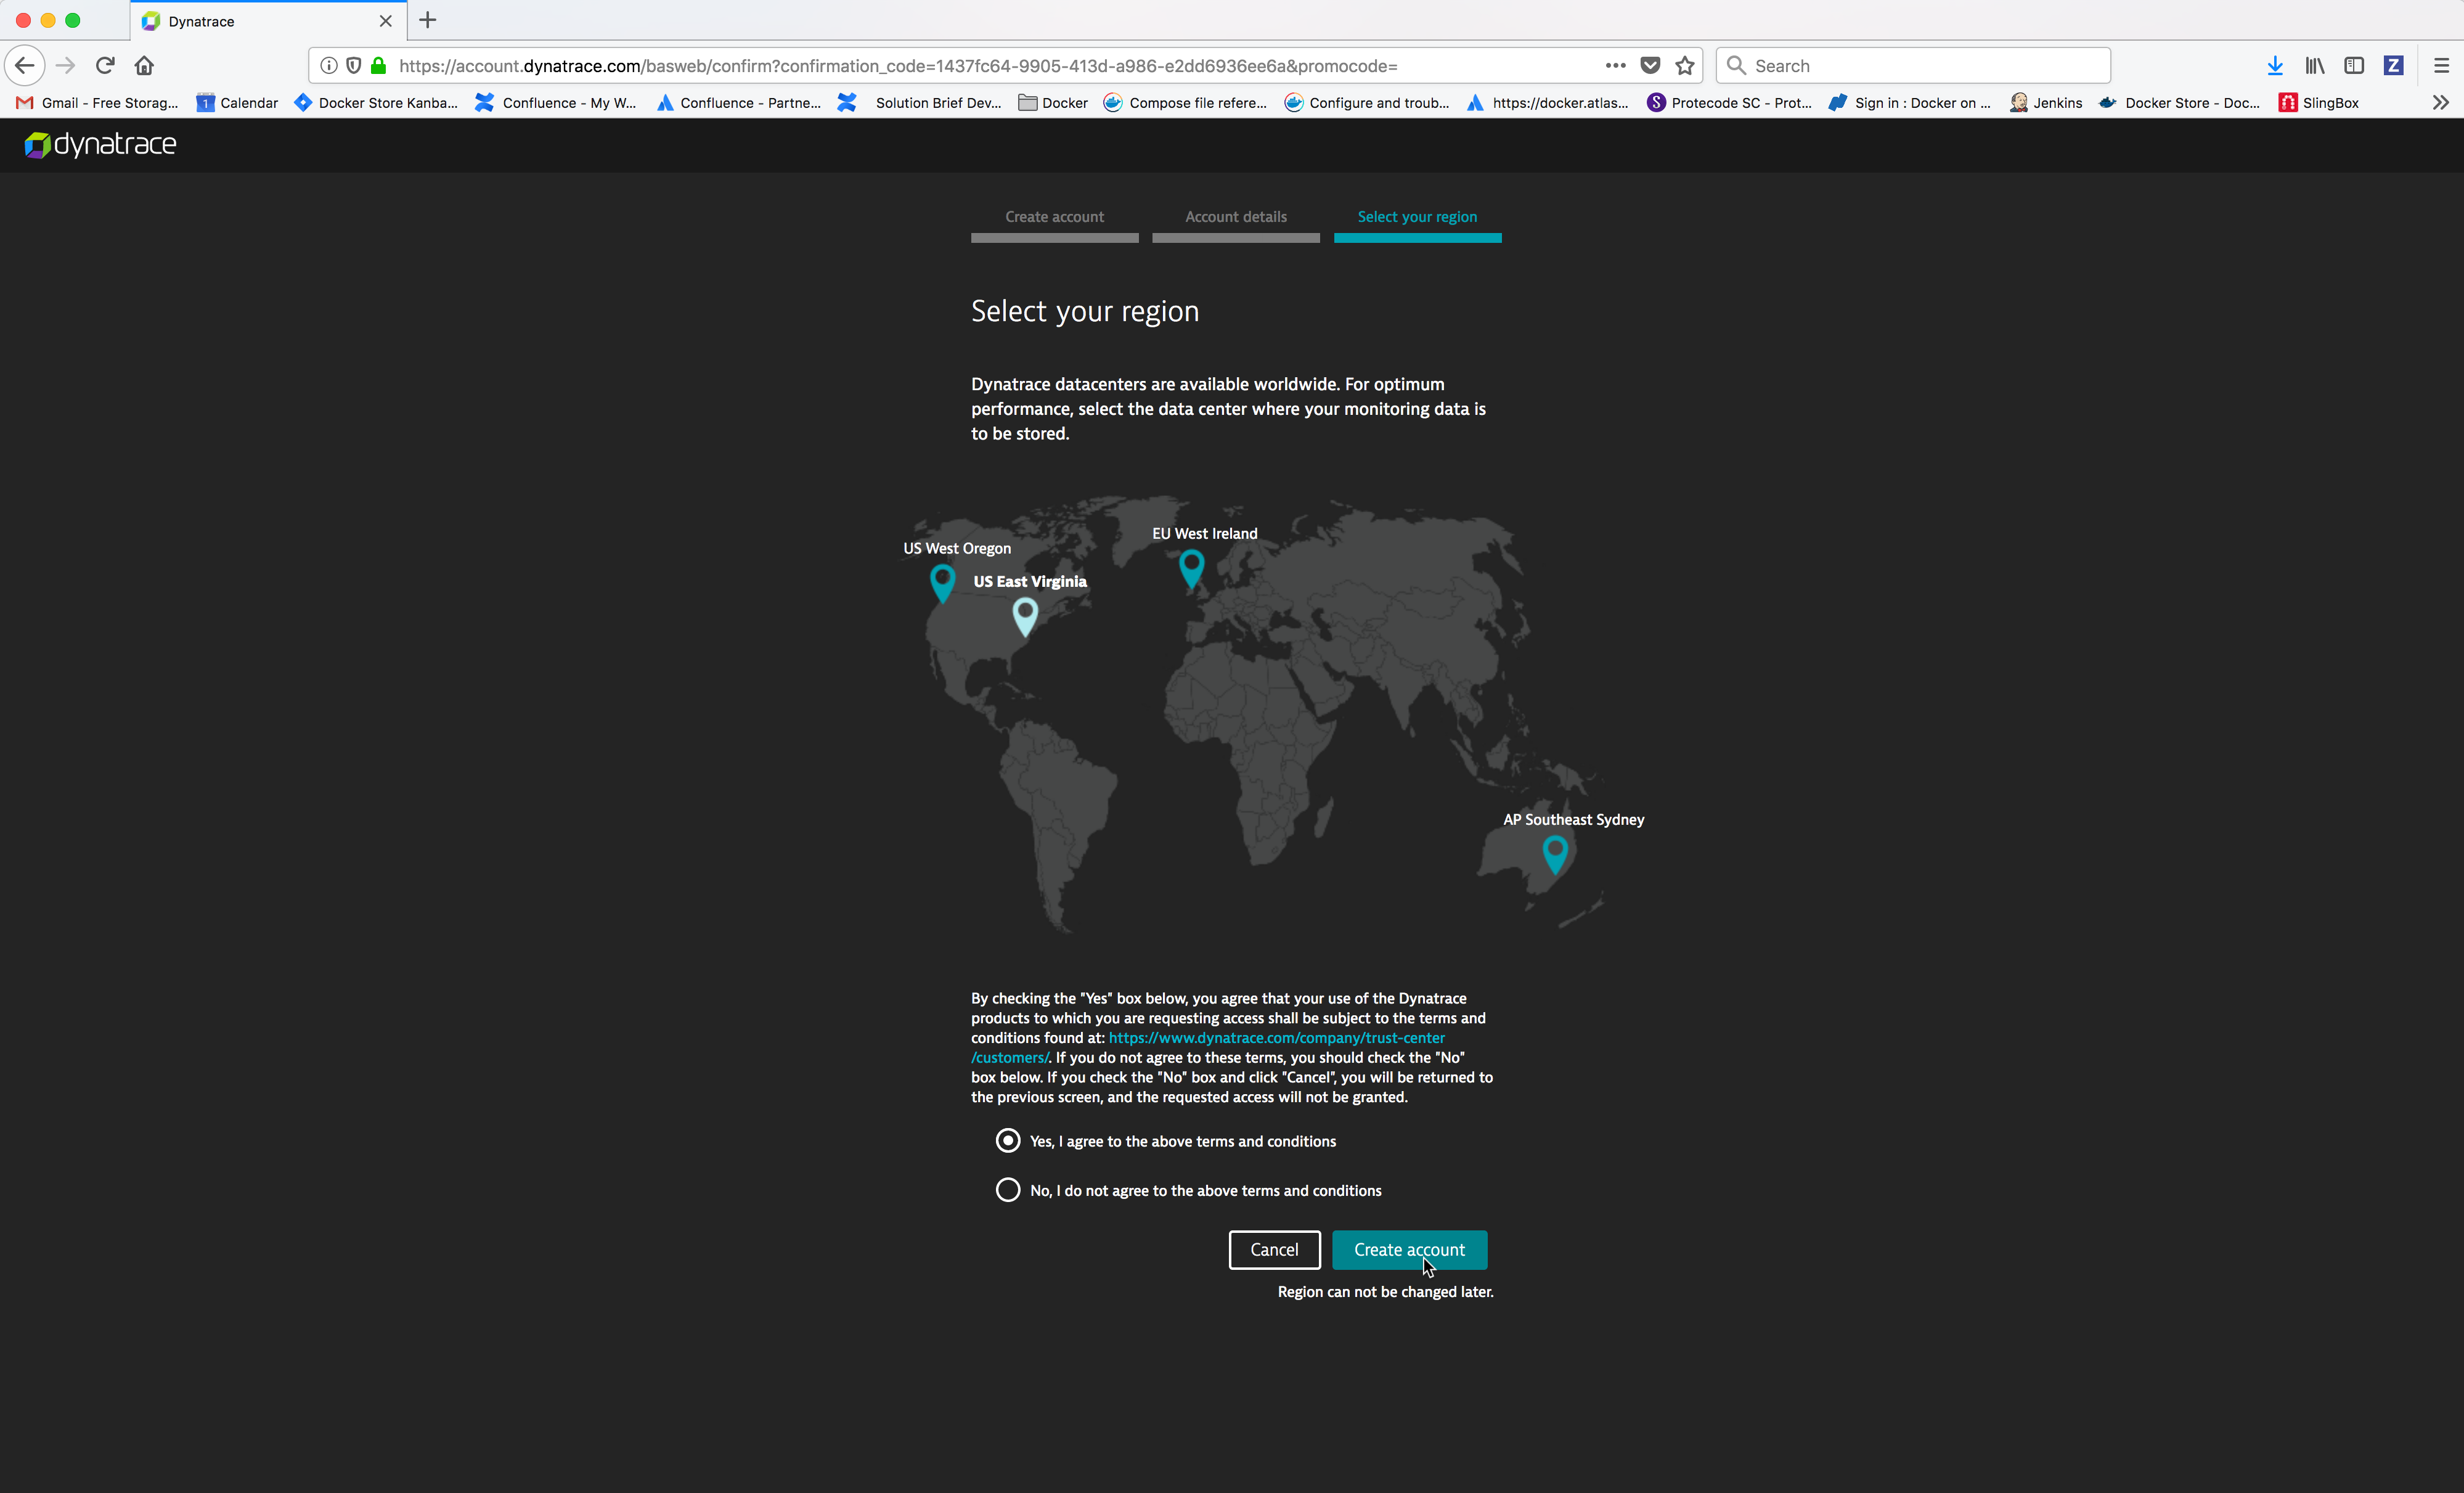
Select your region, click on the radio button Yes, I agree to the above terms and conditions and then click on the Create account button.
Click on the Deploy Dynatrace button.
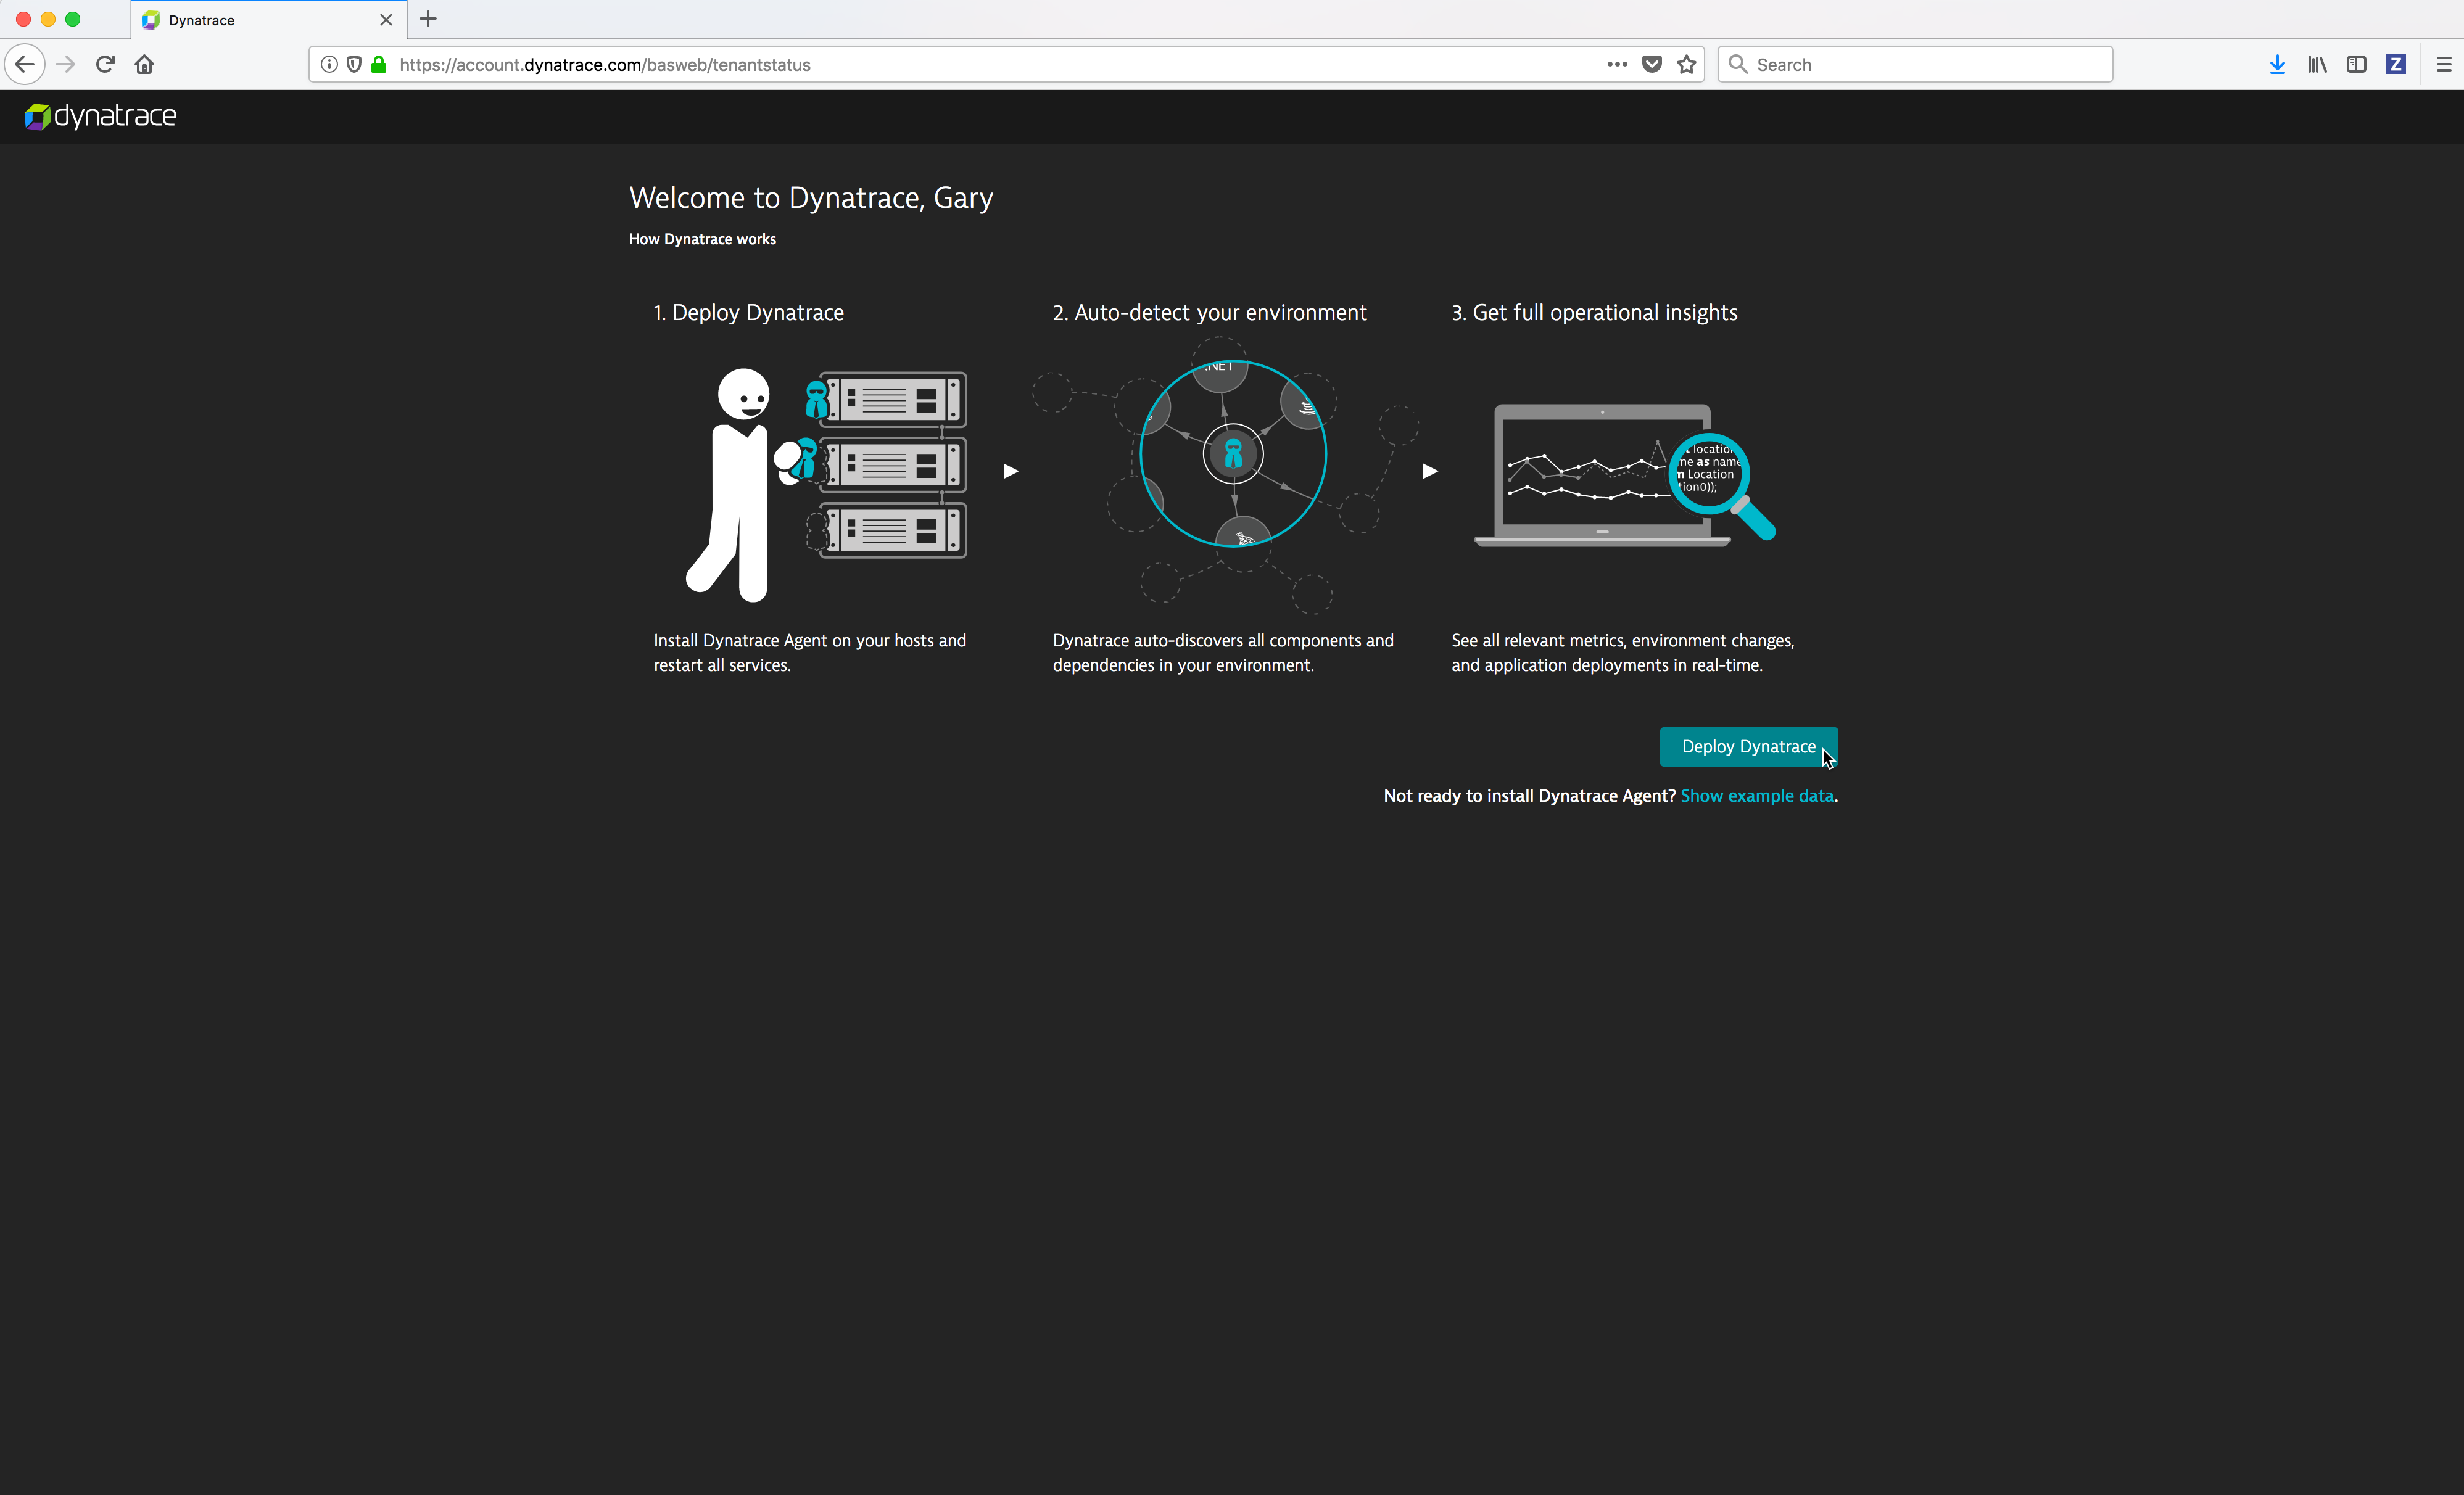
You should see a screen similar to the screen below.
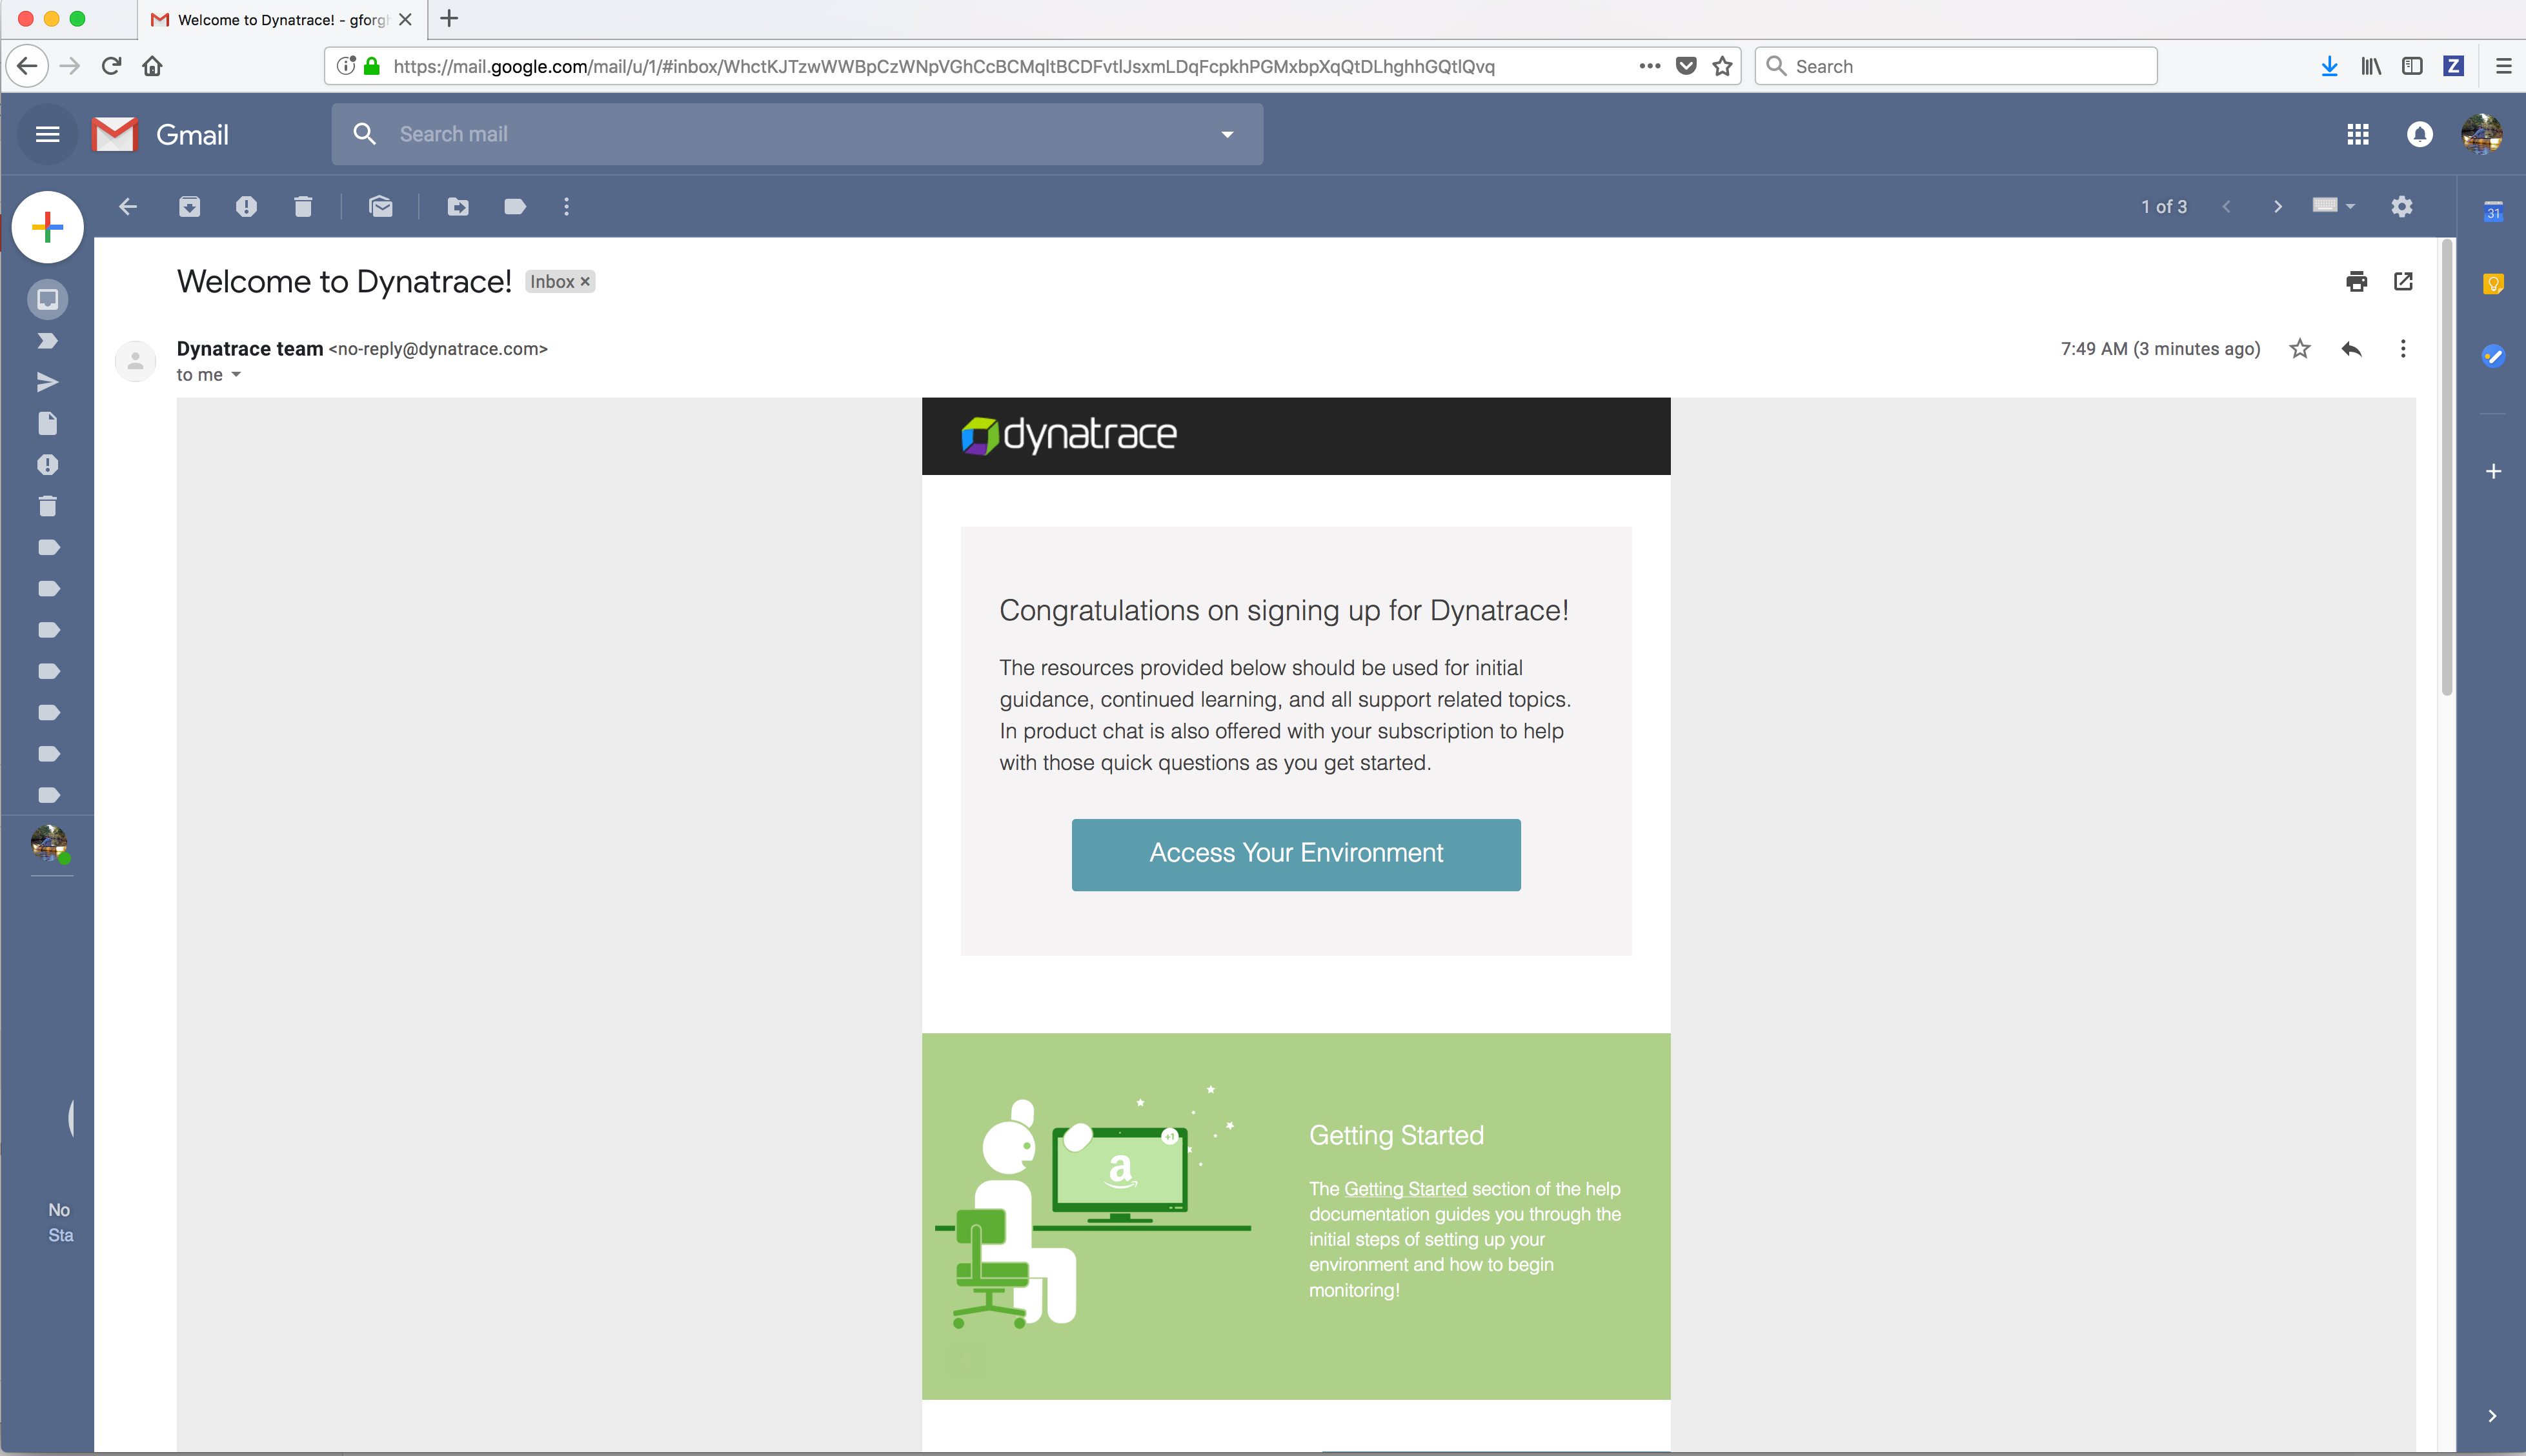
You should also receive an acknowledgement signup email from Dynatrace.
Monitoring the Docker Enterprise MKE Cluster and Application containers
To discover your infrastructure and collect the events and metrics, the Dynatrace agent needs to be deployed on all the Docker Enterprise MKE nodes.


Deploying the Dynatrace agent
The Dynatrace agent has a startup dependency. It must be started and fully initialized on the Docker node before any of the processes you want to monitor in order for it to capture all of the required metrics for it to perform the deep process monitoring. If the Dynatrace agent is started after processes that you want monitor, you will only be able to see a limited set of metrics such as CPU or memory consumption. You would have to restart those processes in order for the Dynatrace agent to capture all of the required metrics.
There are 3 ways to deploy the Dynatrace agent on a Docker node in a Docker Enterprise MKE cluster:
- Deploy the Linux Dynatrace agent docker container on the Docker Enterprise MKE nodes configured for Swarm only orchestration.
- Deploy the Linux Dynatrace agent docker container as a Kubernetes DaemonSet (pods) on the Docker Enterprise MKE nodes for Kubernetes or Mixed orchestration.
- Install the Linux or Windows Dynatrace agent directly on the Docker Enterprise MKE nodes.
Because of the Dynatrace startup dependency, running the Linux Dynatrace agent as a docker container or a Kubernetes DaemonSet will not allow the Linux Dynatrace agent to be started and fully initialized before the Docker Enterprise MKE cluster containers, which will result in limited metrics on the Docker Enterprise MKE cluster containers. Therefore, to perform the deep monitoring of the Docker Enterprise Cluster, installing the Dynatrace agent directly on the Docker Enterprise MKE nodes is recommended before Docker Enterprise is installed using a configuration management tool such as Chef, Puppet, Terraform, Ansible, Cloud Init script, etc.
In this Solution Brief the Dynatrace agent will be deployed directly on the Docker Enterprise MKE nodes. If you wish to deploy the Linux Dynatrace agent as a Docker container, refer to the Dynatrace documentation Dynatrace OneAgent as a Docker container or Deploy OneAgent on Kubernetes.
Installing the Dynatrace OneAgent on Kubernetes on Docker Enterprise
Deploying Dynatrace OneAgent via DaemonSet on a MKE is straightforward. There are few steps need to follow:
- Deploy the Dynatrace OneAgent. The OneAgent monitors kubernetes workload (services running in your application pods), the containers, middleware and underlying Linux OS. The agent deployment is done via an operator. The operator will create a daemonset that will deploy the agent in its own pod on each node of the cluster The procedure is described here:
The following information is required for this deployment:
- tenant or Environment ID : your Dynatrace environment ID (otherwise known as a tenant ID), is included at the beginning of your Dynatrace environment´s URL
- An API token.
- A PaaS token, this is different than the API token.
The operator and oneagent pods will run in the dynatrace namespace
- Setup integration with kubernetes API. This integration use a plugin in the ActiveGate that will query the Kubernetes API for cluster node resource utilization and limits as described below. To set up this integration, you need:
service account with cluster role permission to access the Kubernetes API endpoint URL
the Kubernetes API endpoint URL
- the bearer token for the service account
Installing the Dynatrace OneAgent on Docker Enterprise MKE nodes
Install the Linux Dynatrace agent on a Linux Docker Enterprise MKE node
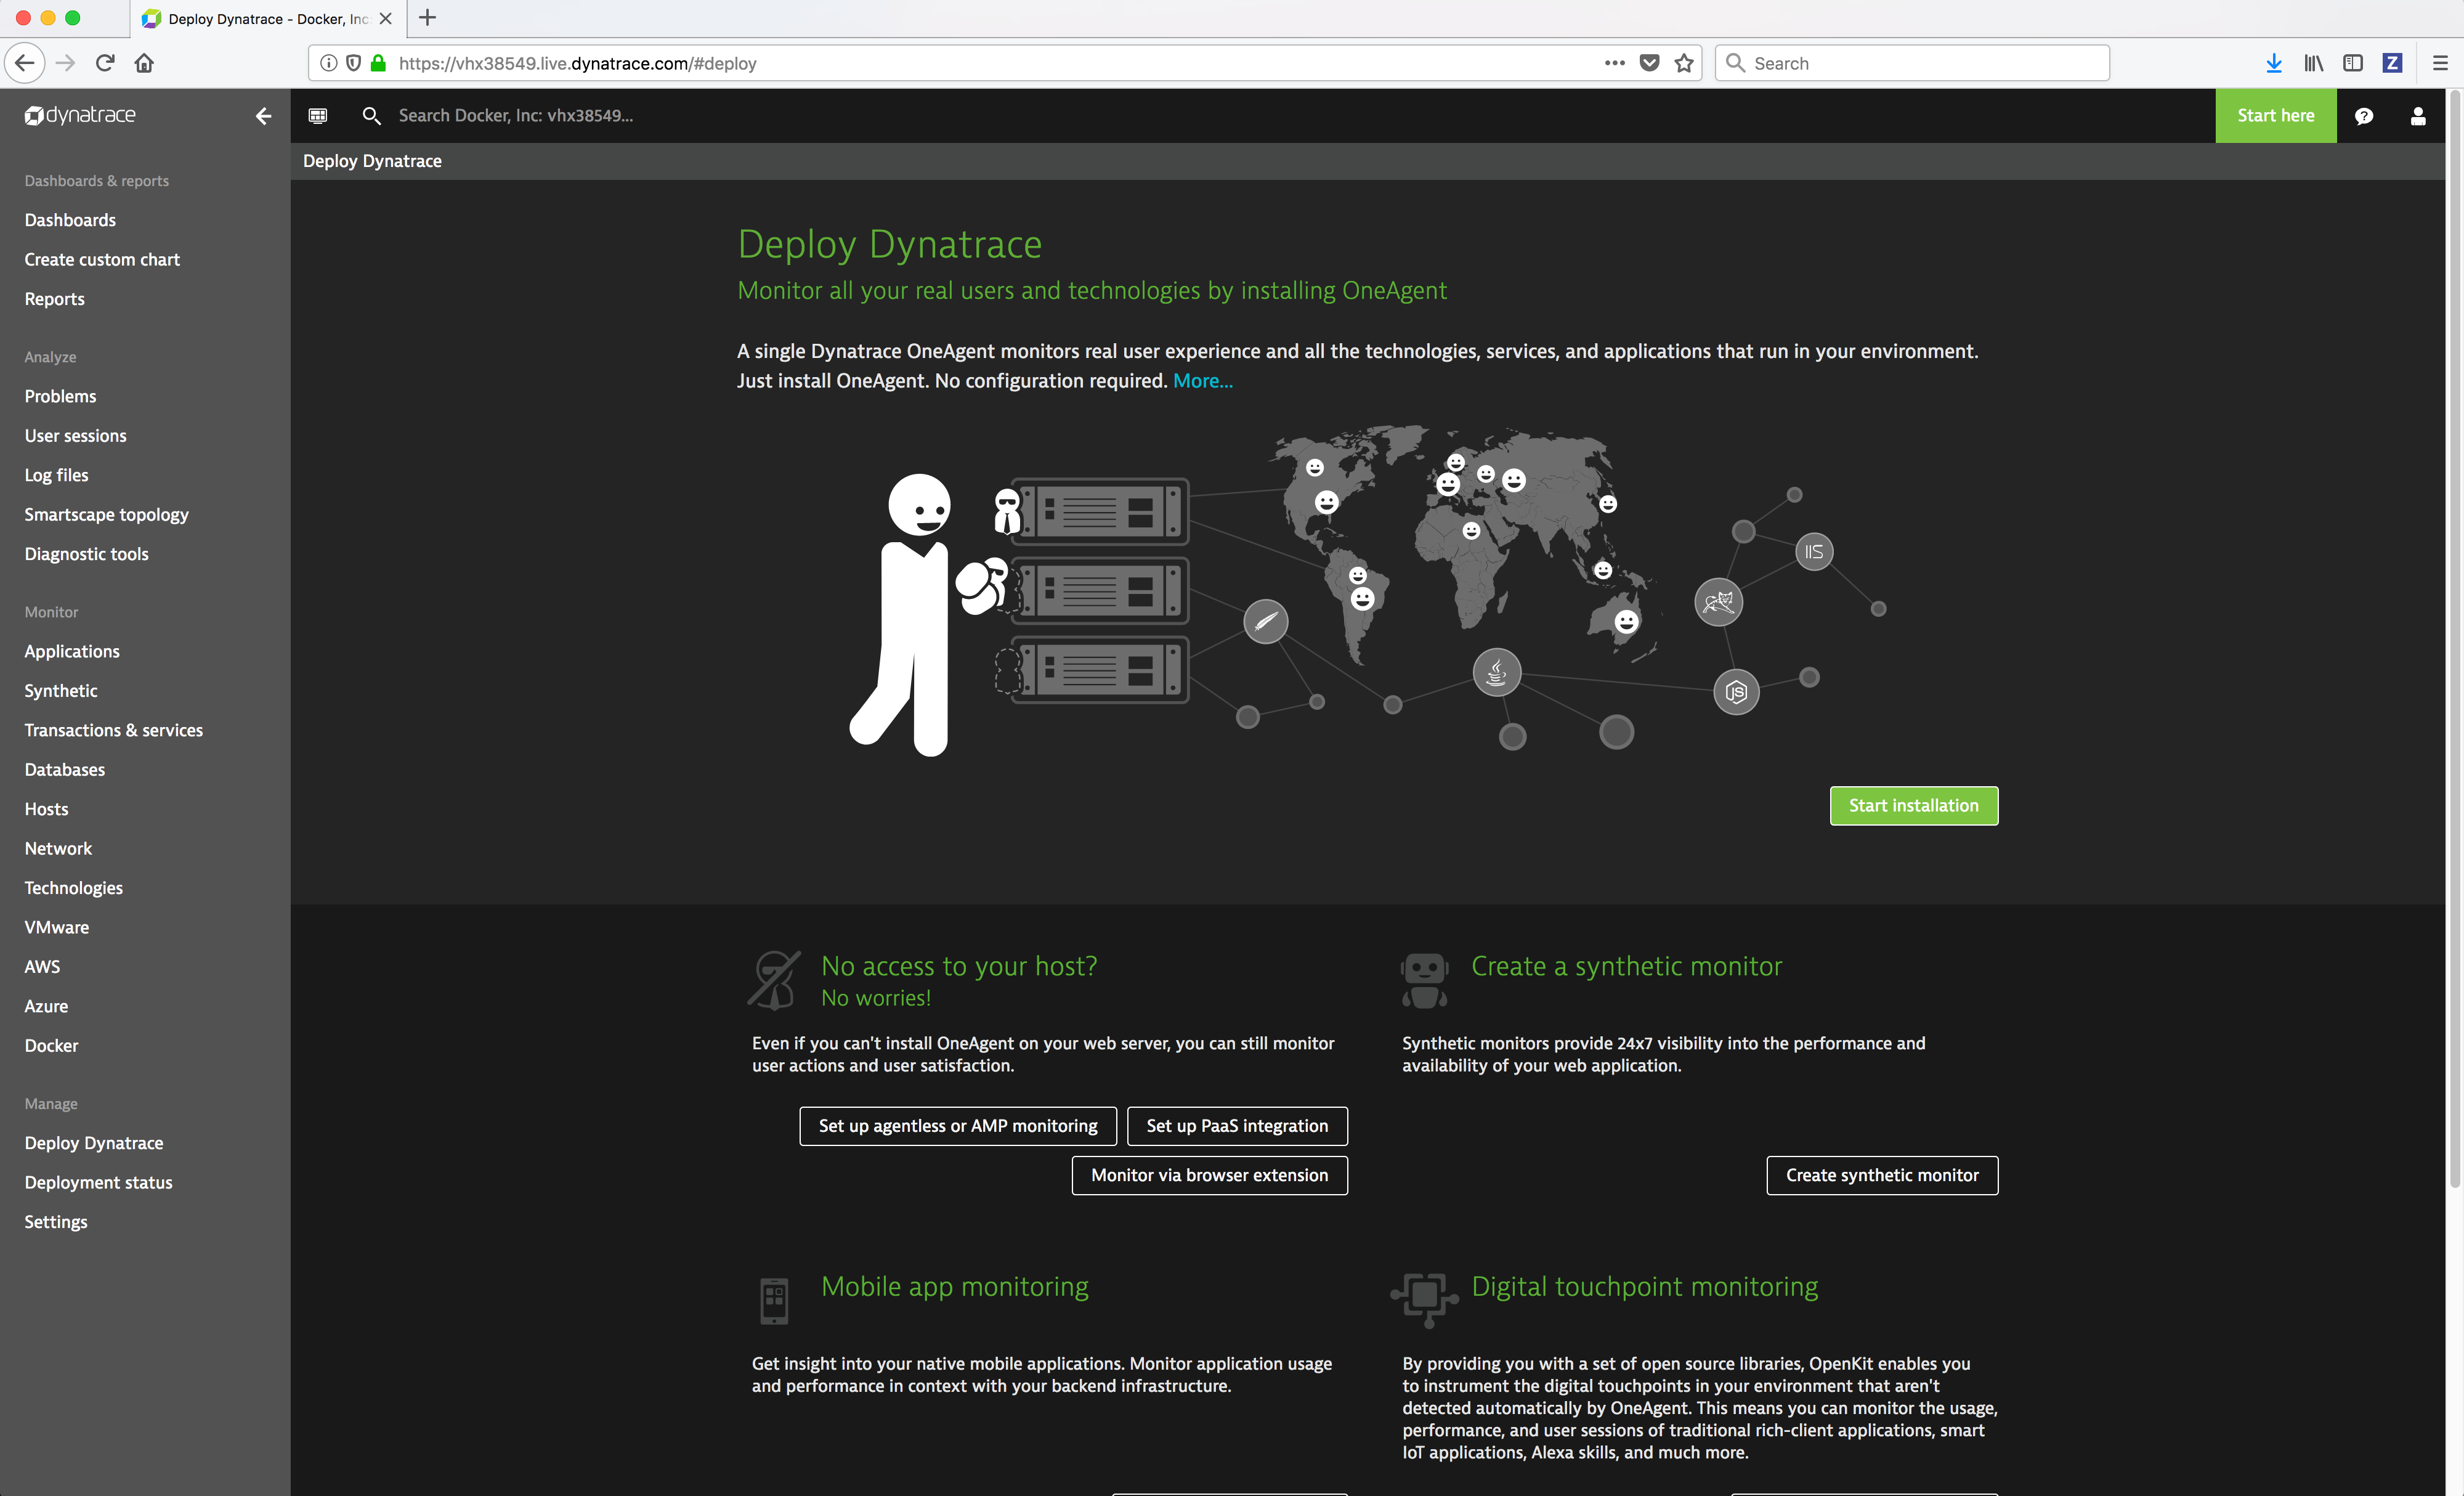
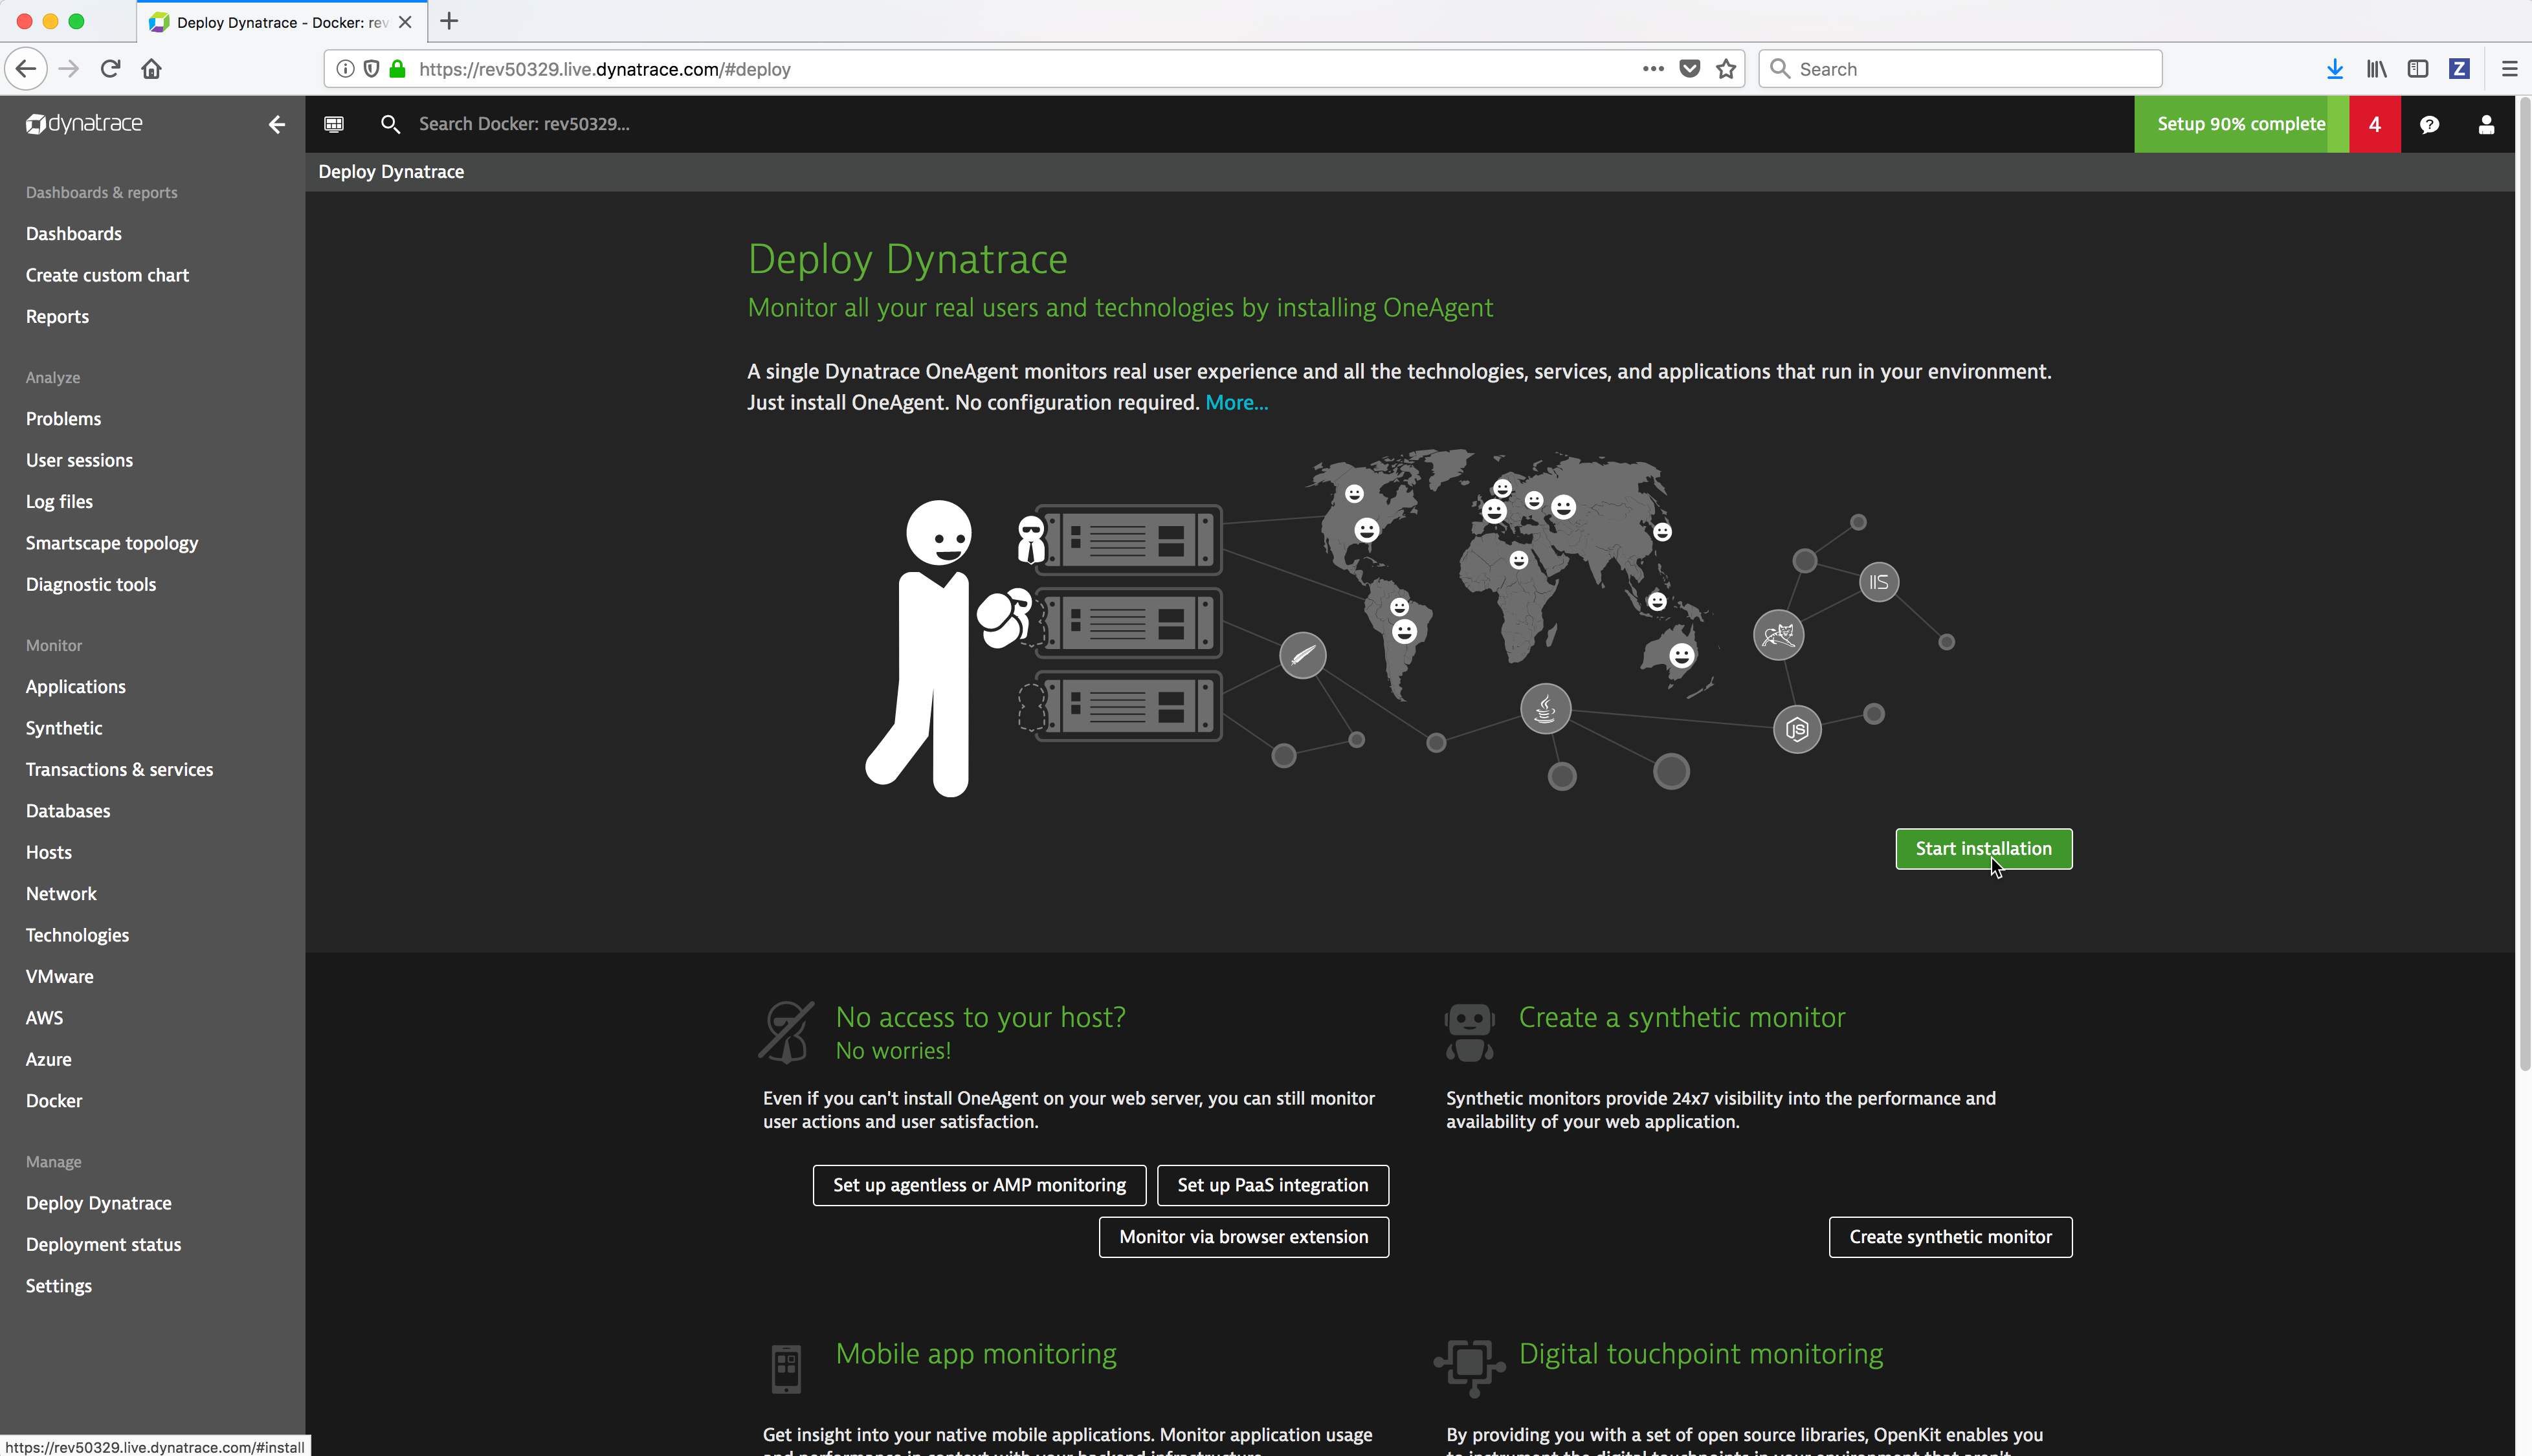
From the Dynatrace Web UI, navigate to the Deploy Dynatrace page by clicking on the Deploy Dynatrace link (bottom left). Then click on the Start installation button.
From the Download Dynatrace OneAgent page click on the Linux button.
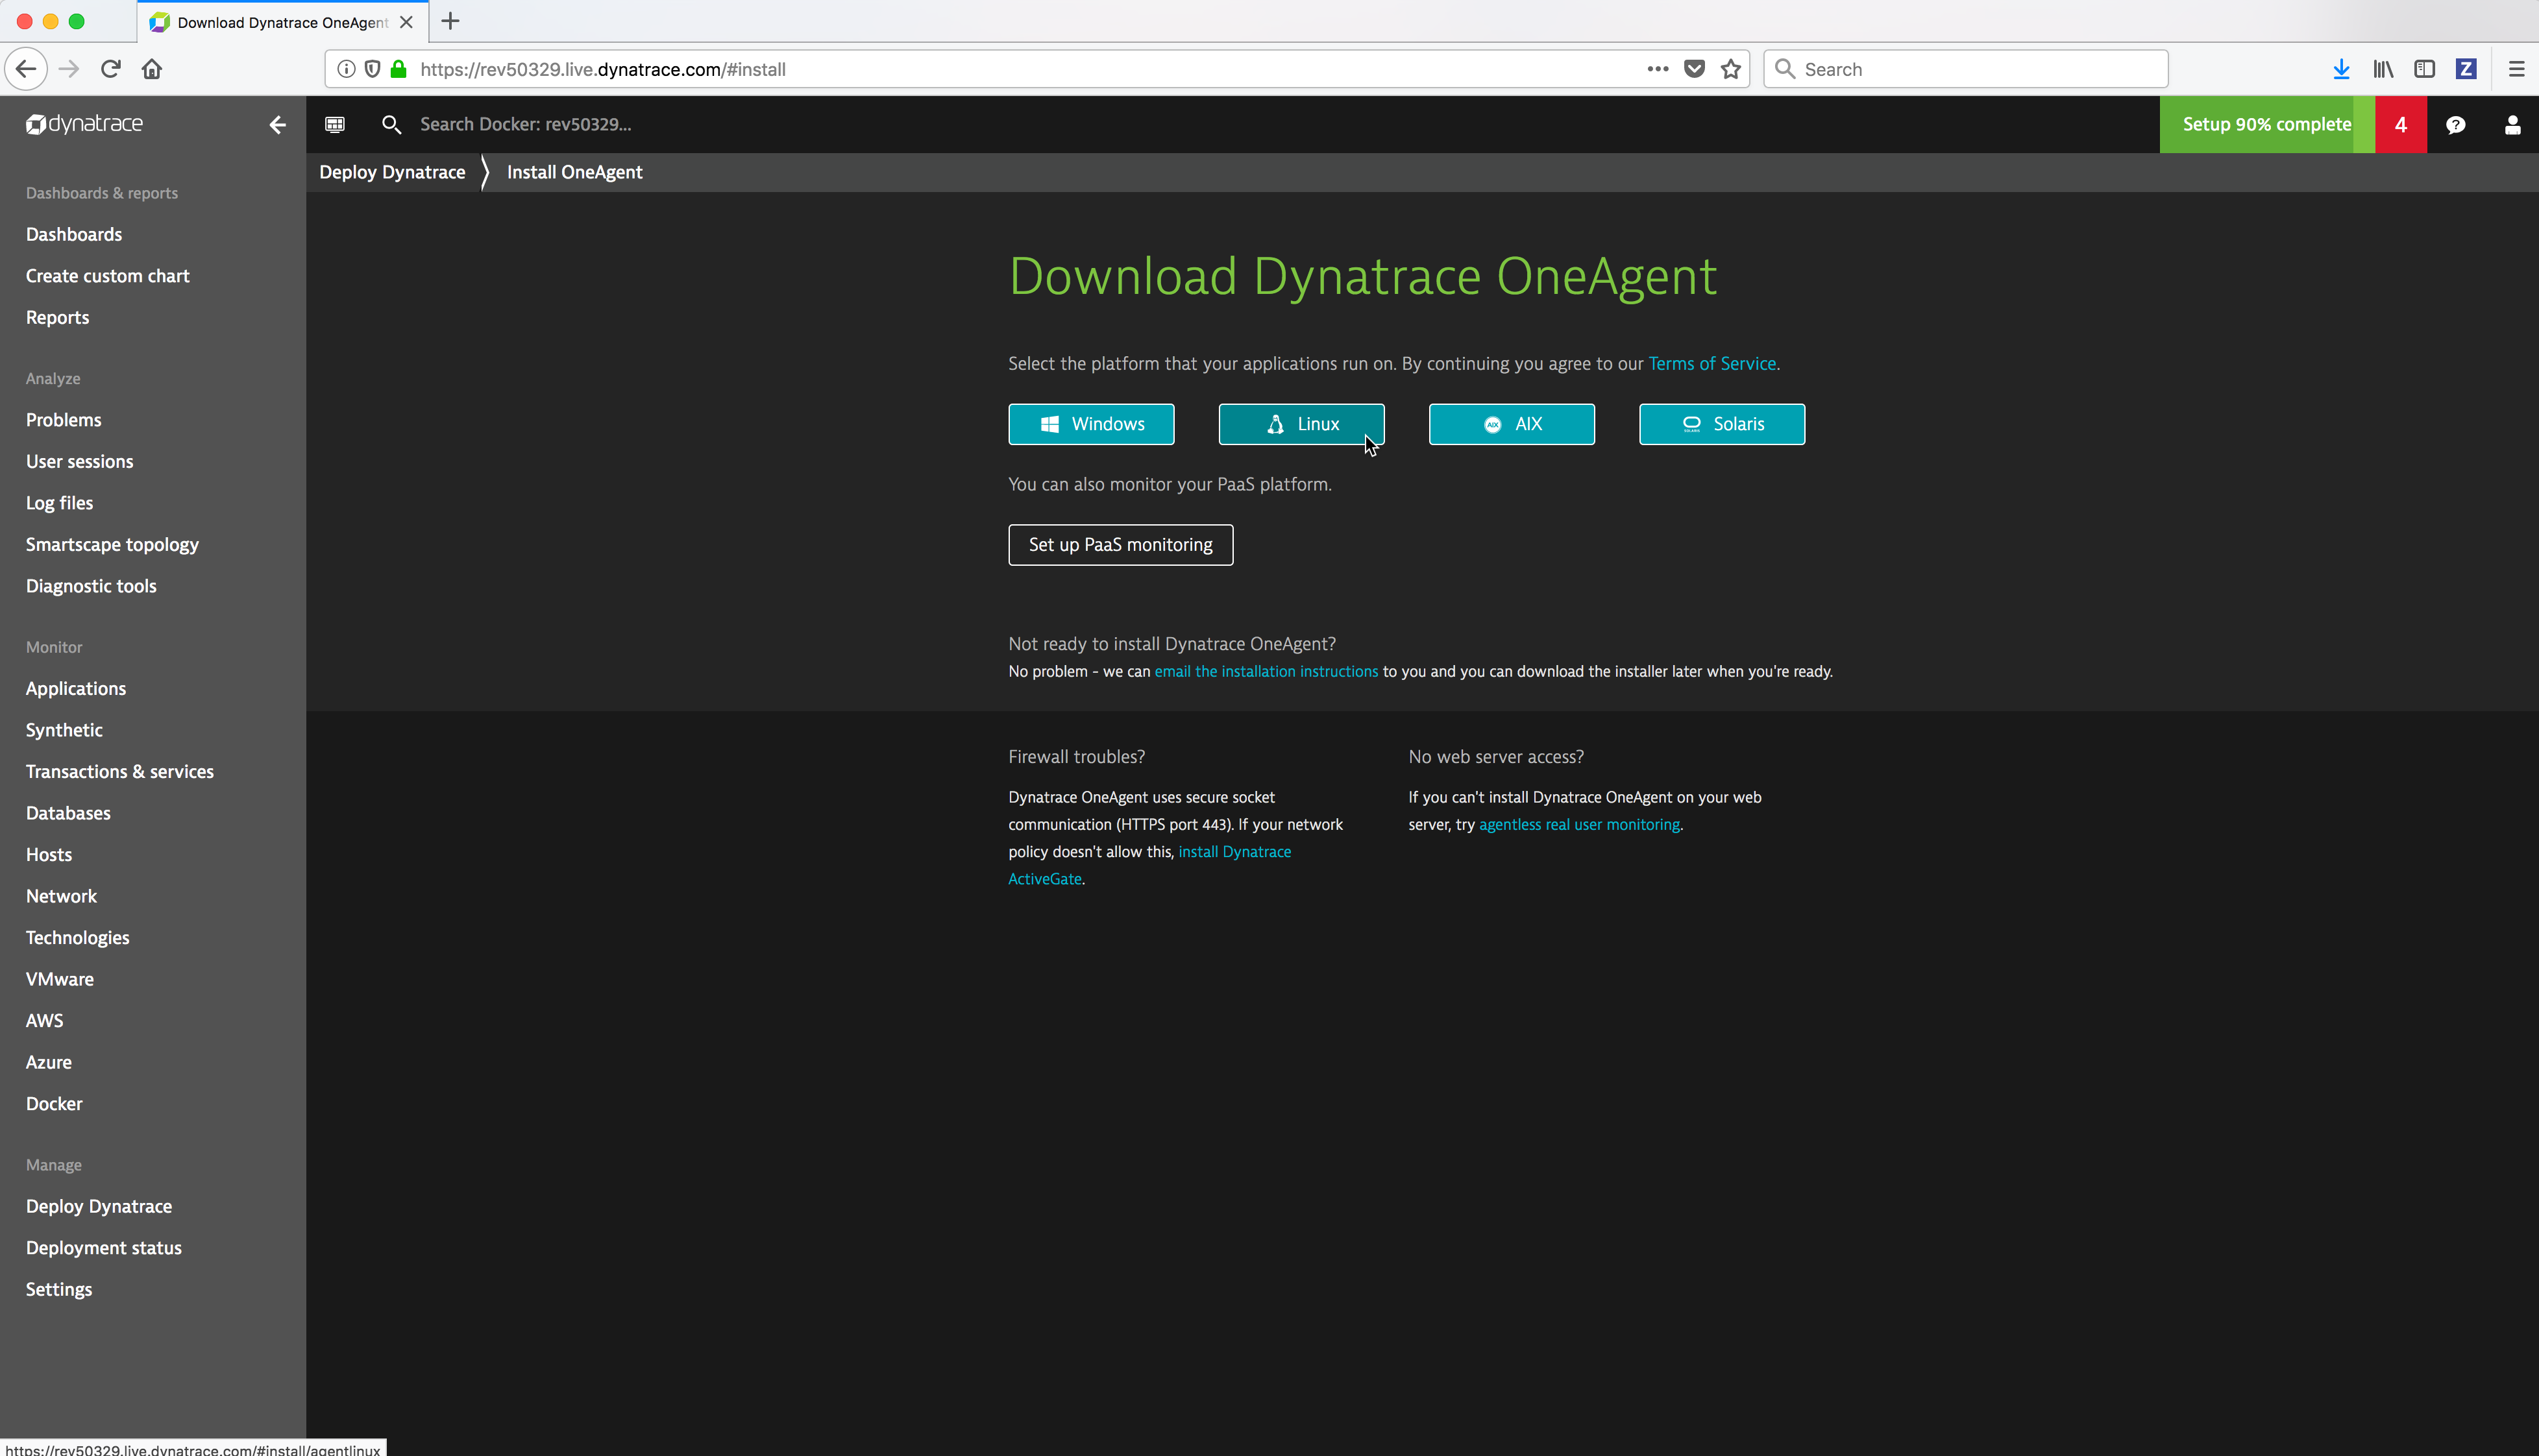
Copy the
wgetcommand which downloads the Dynatrace agent installation bits by clicking on the Copy button to the right of the command.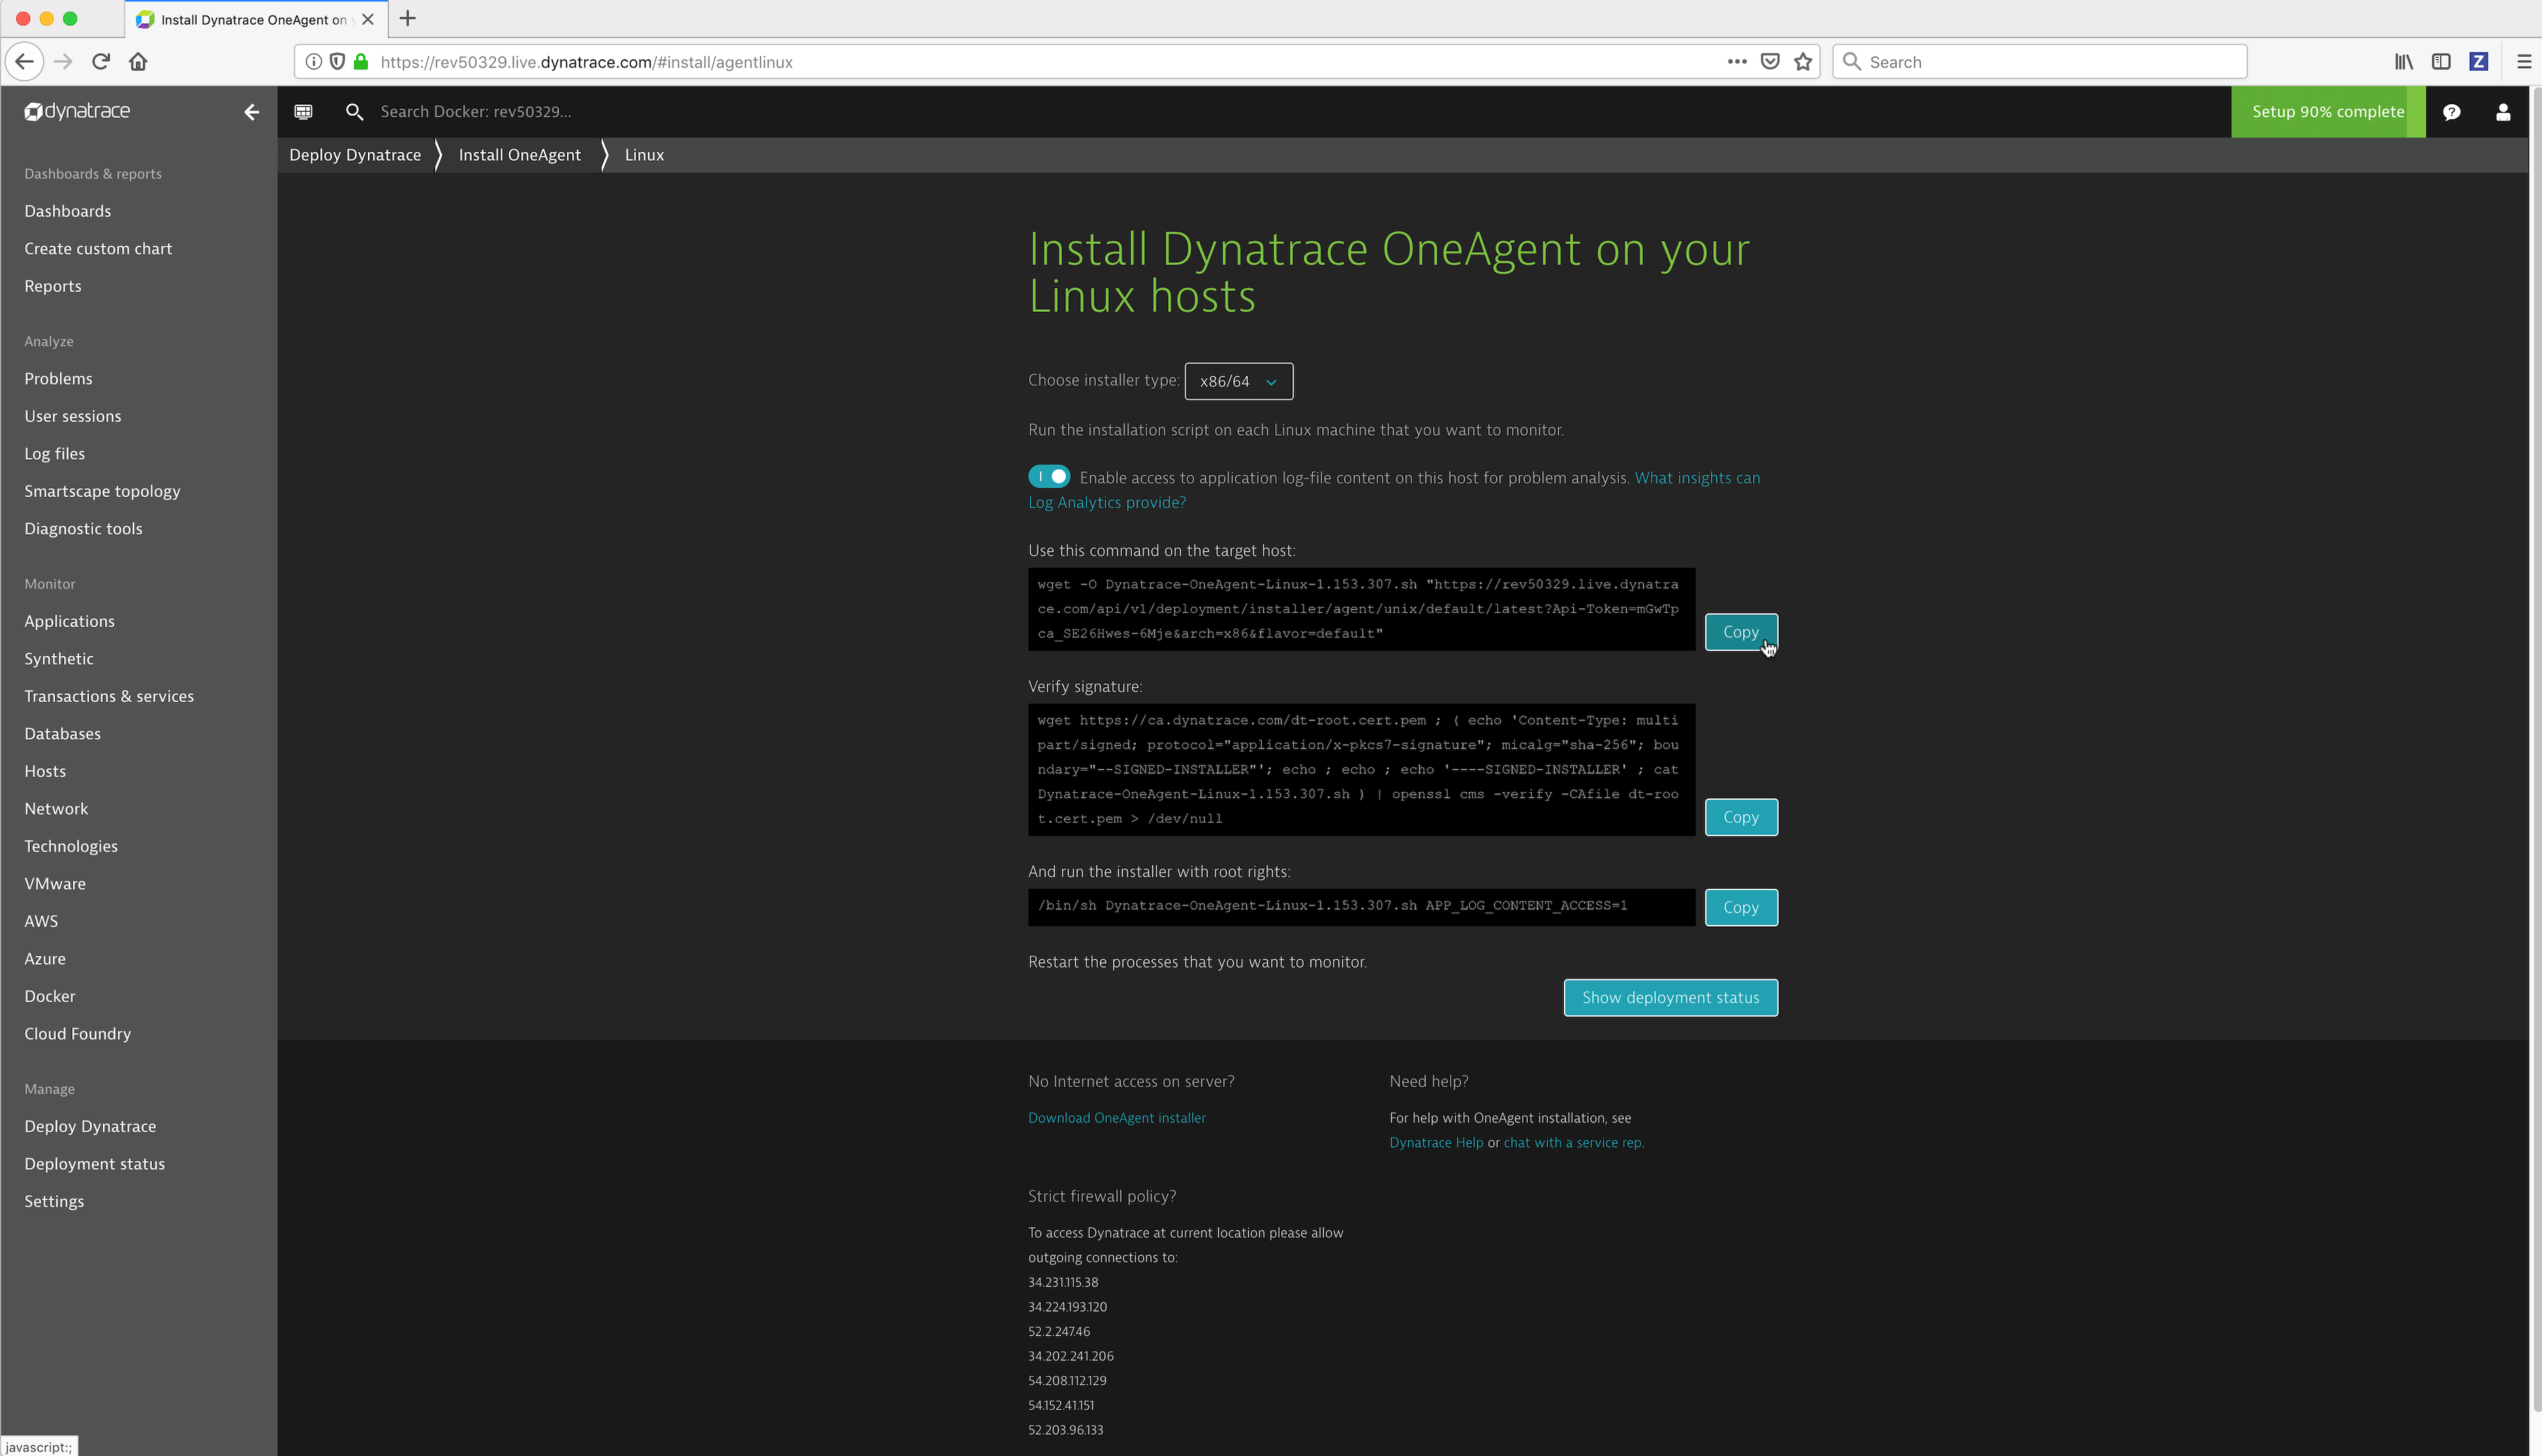
Paste the
wgetcommand into a Linux command prompt and run it with root authority (sudo).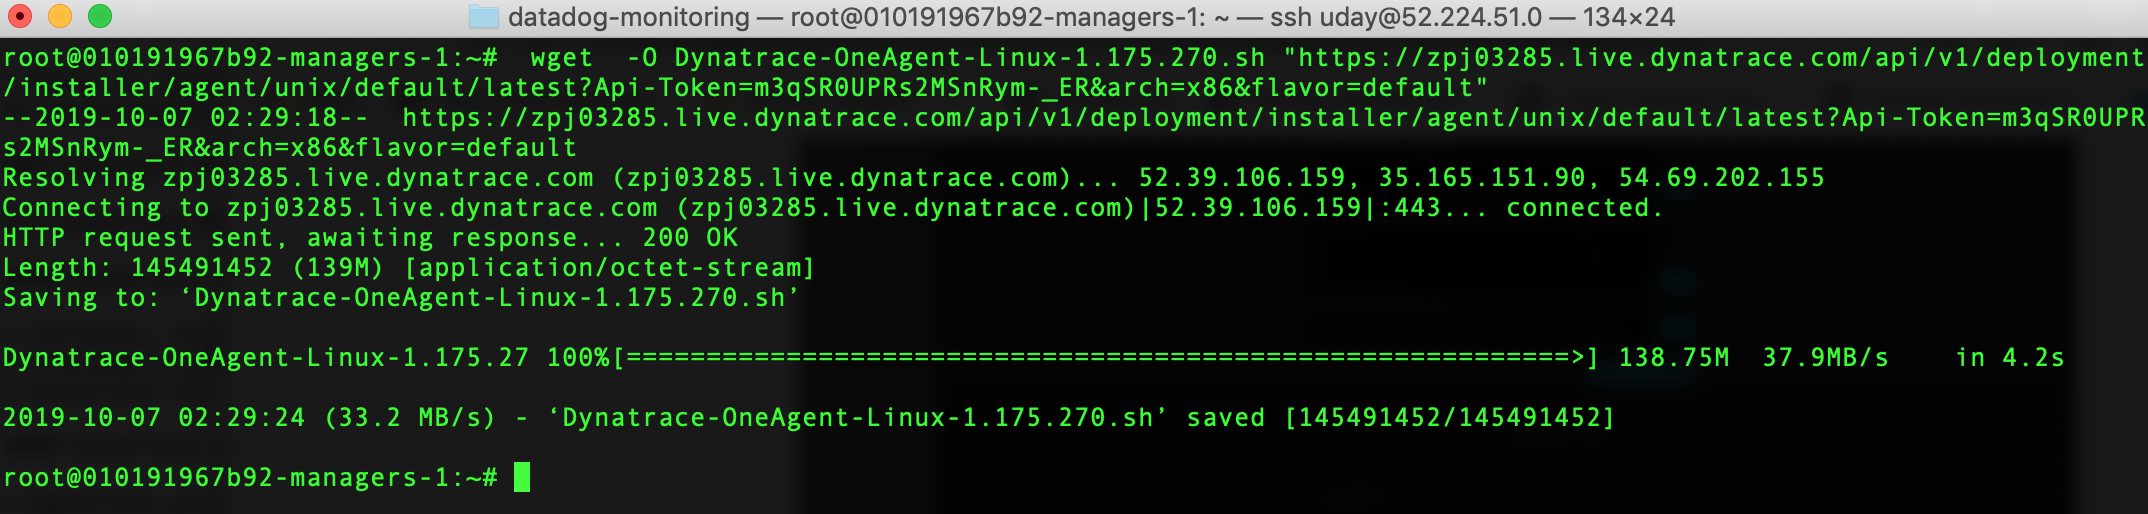
Copy the command to install the Dynatrace agent by clicking on the Copy button to the right of the command.
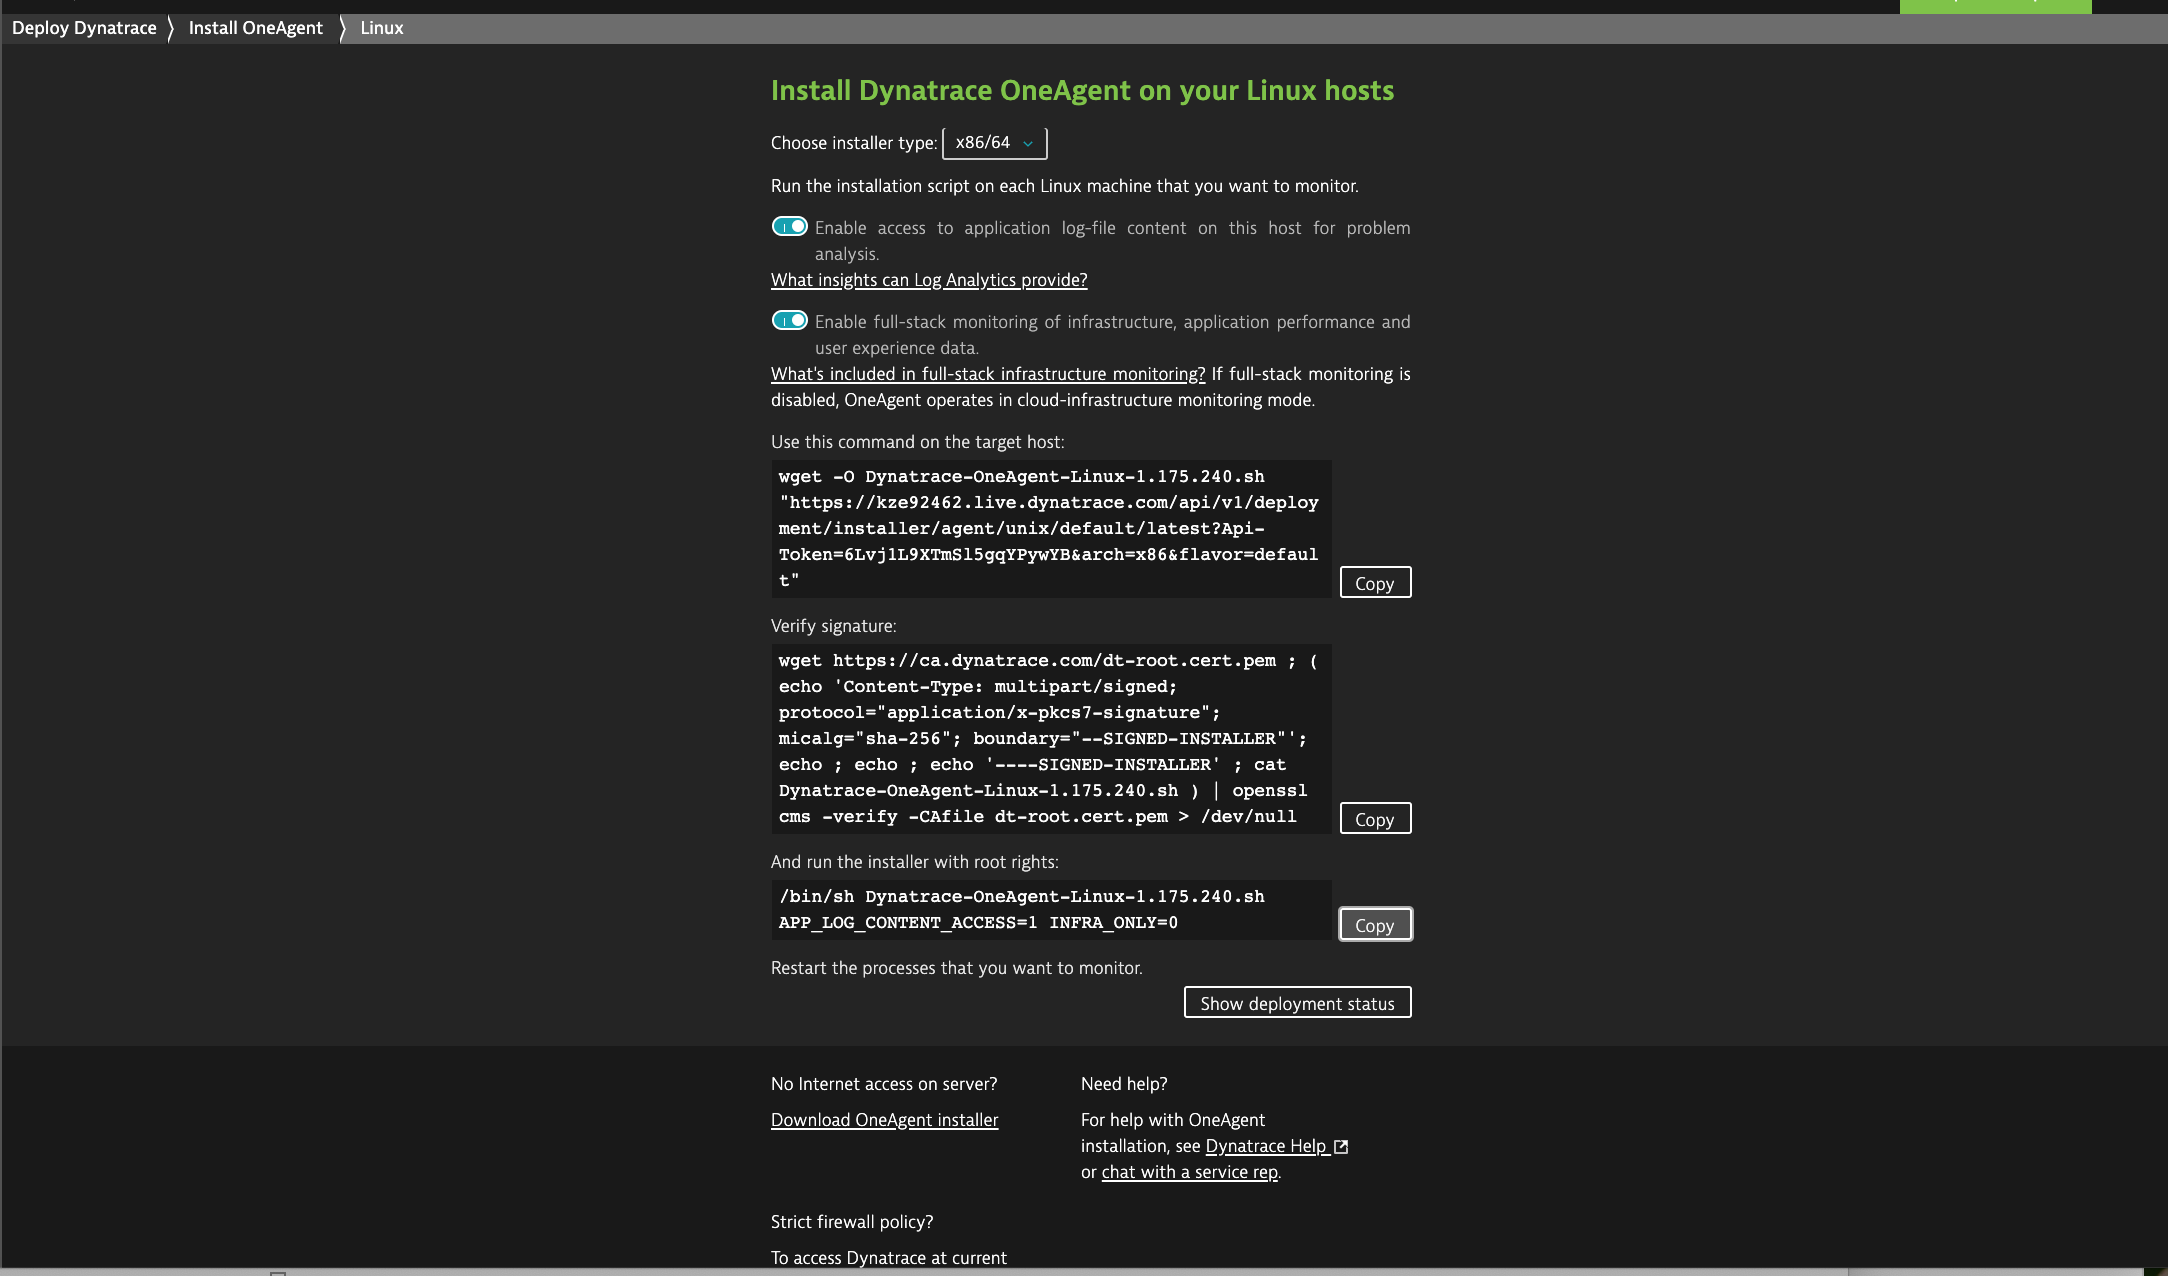
Paste the command into a Linux command prompt and run it with root authority (
sudo).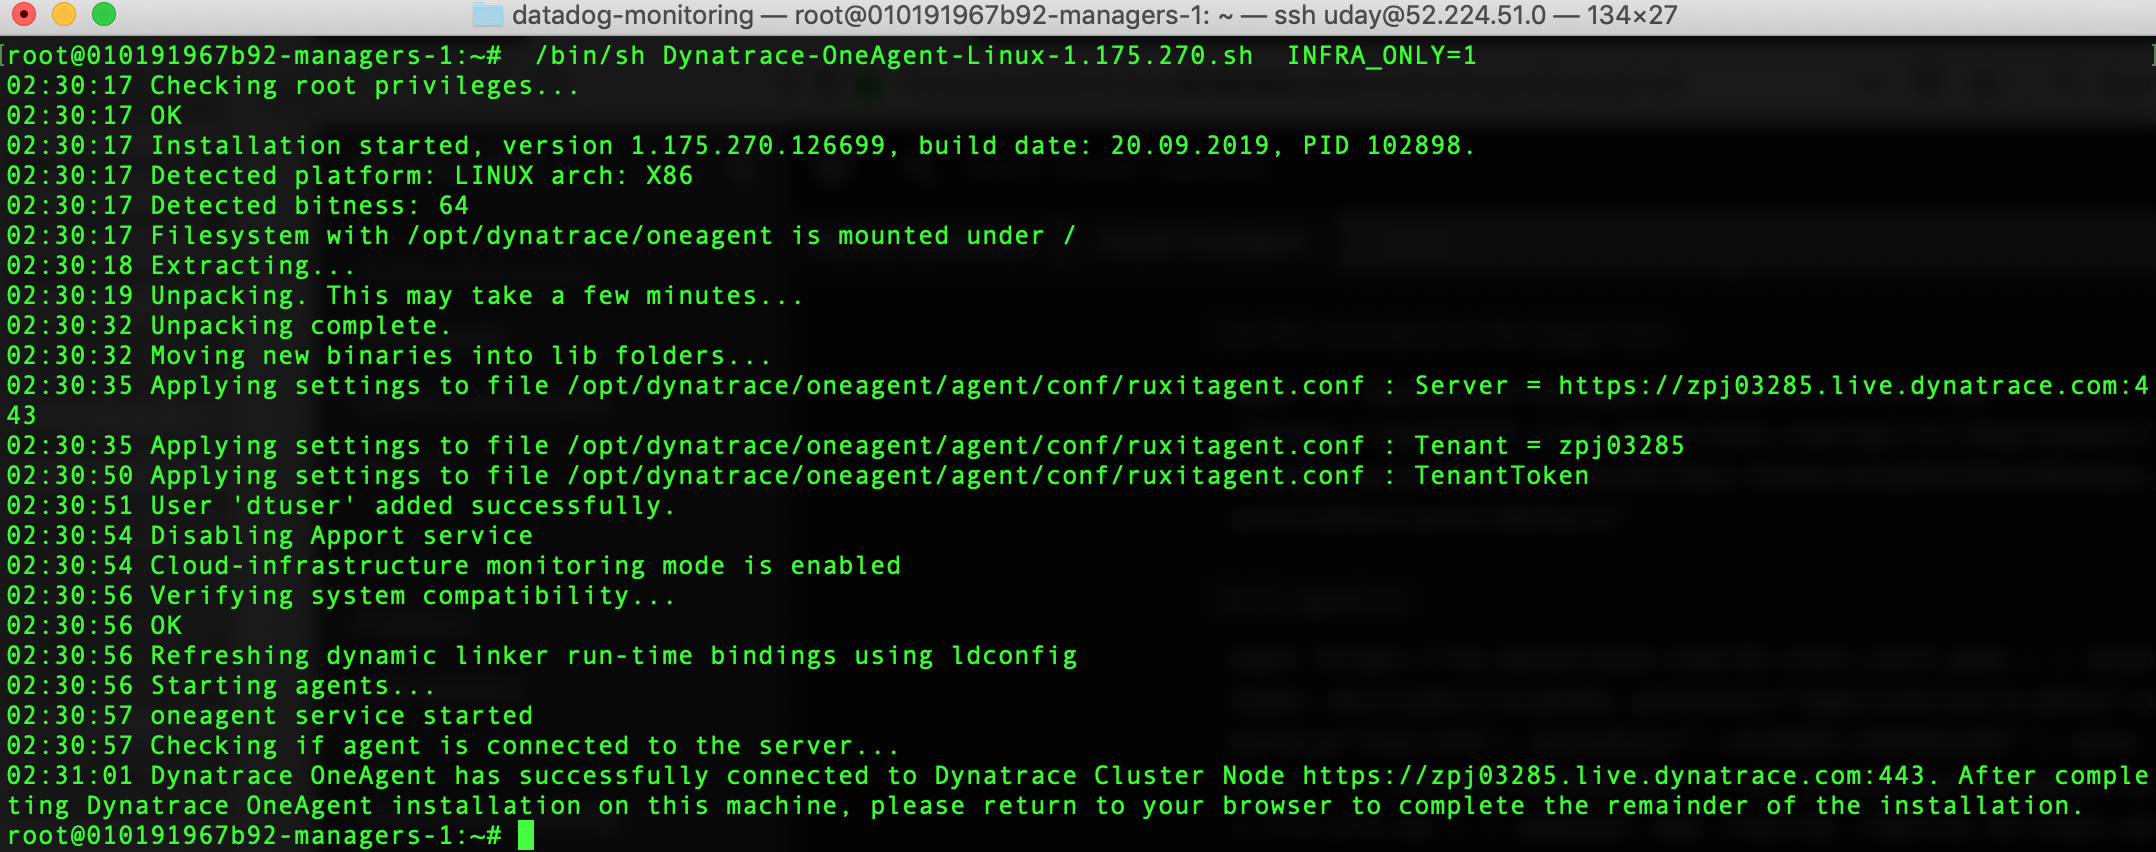
If Docker Enterprise was installed prior to installing the Dynatrace agent you will need to reboot the machine.
Repeat the above Dynatrace agent installation on all of the Linux Docker nodes.
Note
You should automate the installation of the Linux Dynatrace agent before Docker Enterprise is installed on the node using a configuration management tool such as Chef, Puppet, Terraform, Ansible, Cloud Init script, etc.
Install the Windows Dynatrace agent on a Windows Docker Enterprise MKE node
From the Dynatrace Web UI, navigate to the Deploy Dynatrace page by clicking on the Deploy Dynatrace link (bottom left). Then click on the Start installation button.
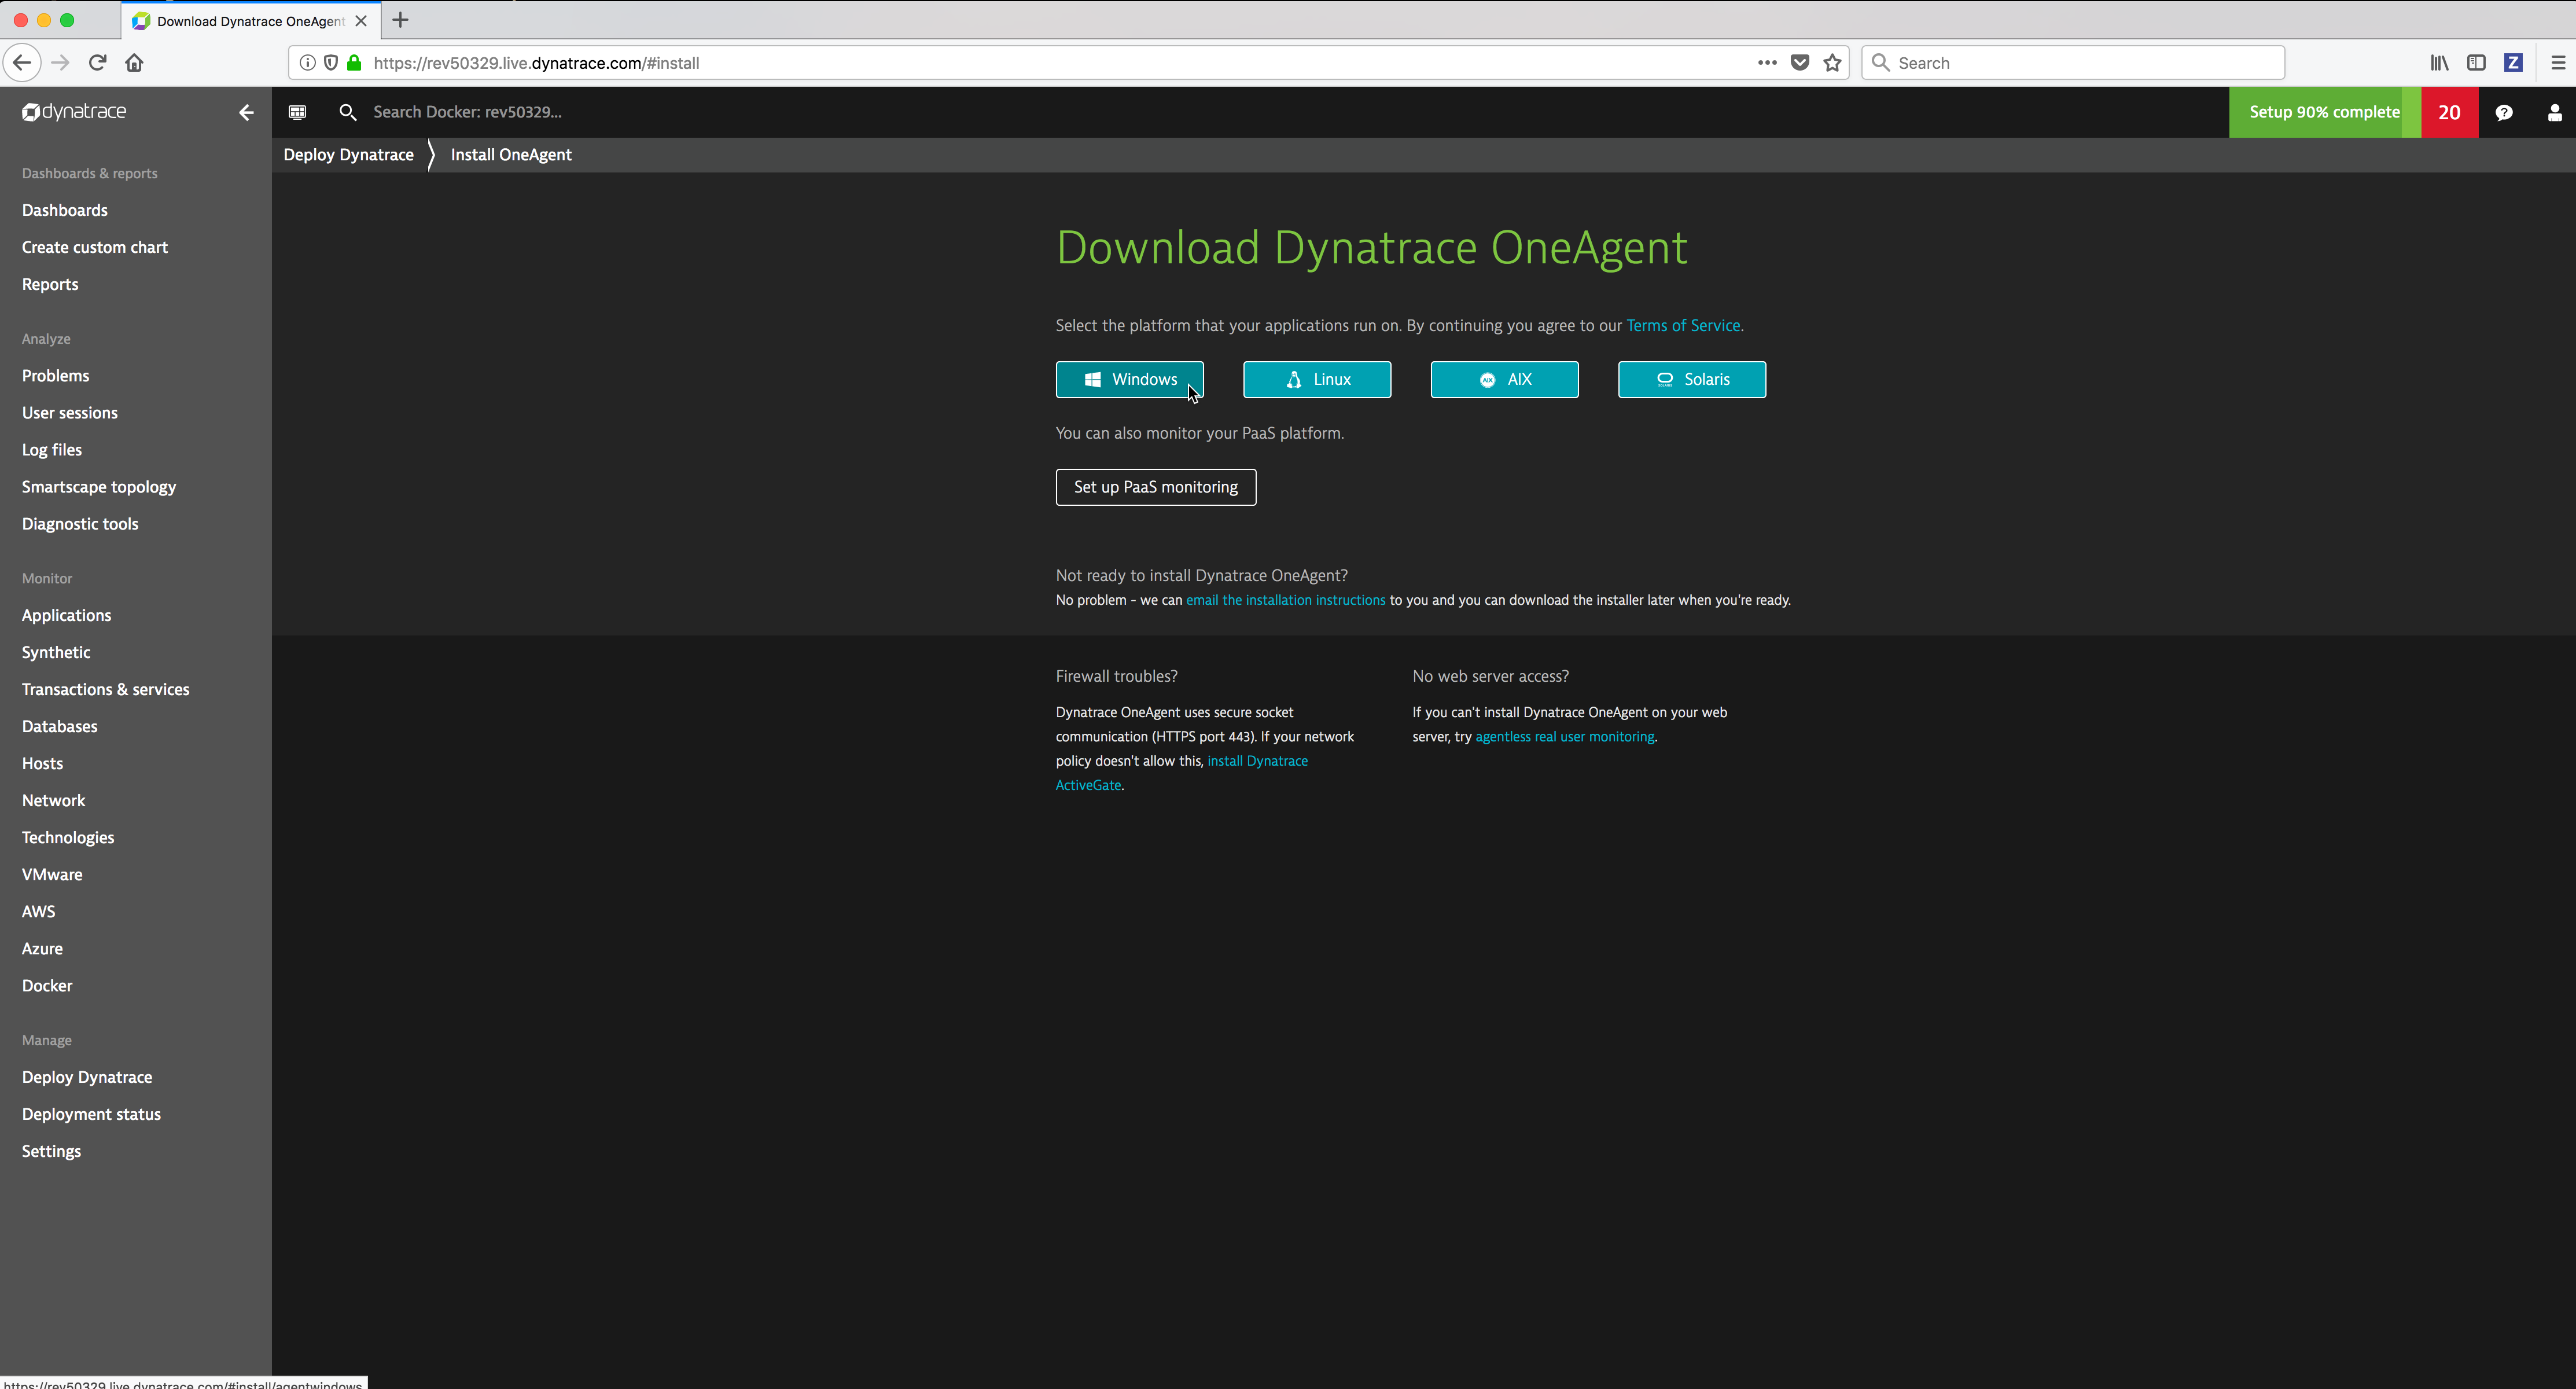
From the Download Dynatrace OneAgent page click on the Windows button.
Right click on the Download agent.exe button and copy the
Linkto download the installation bits.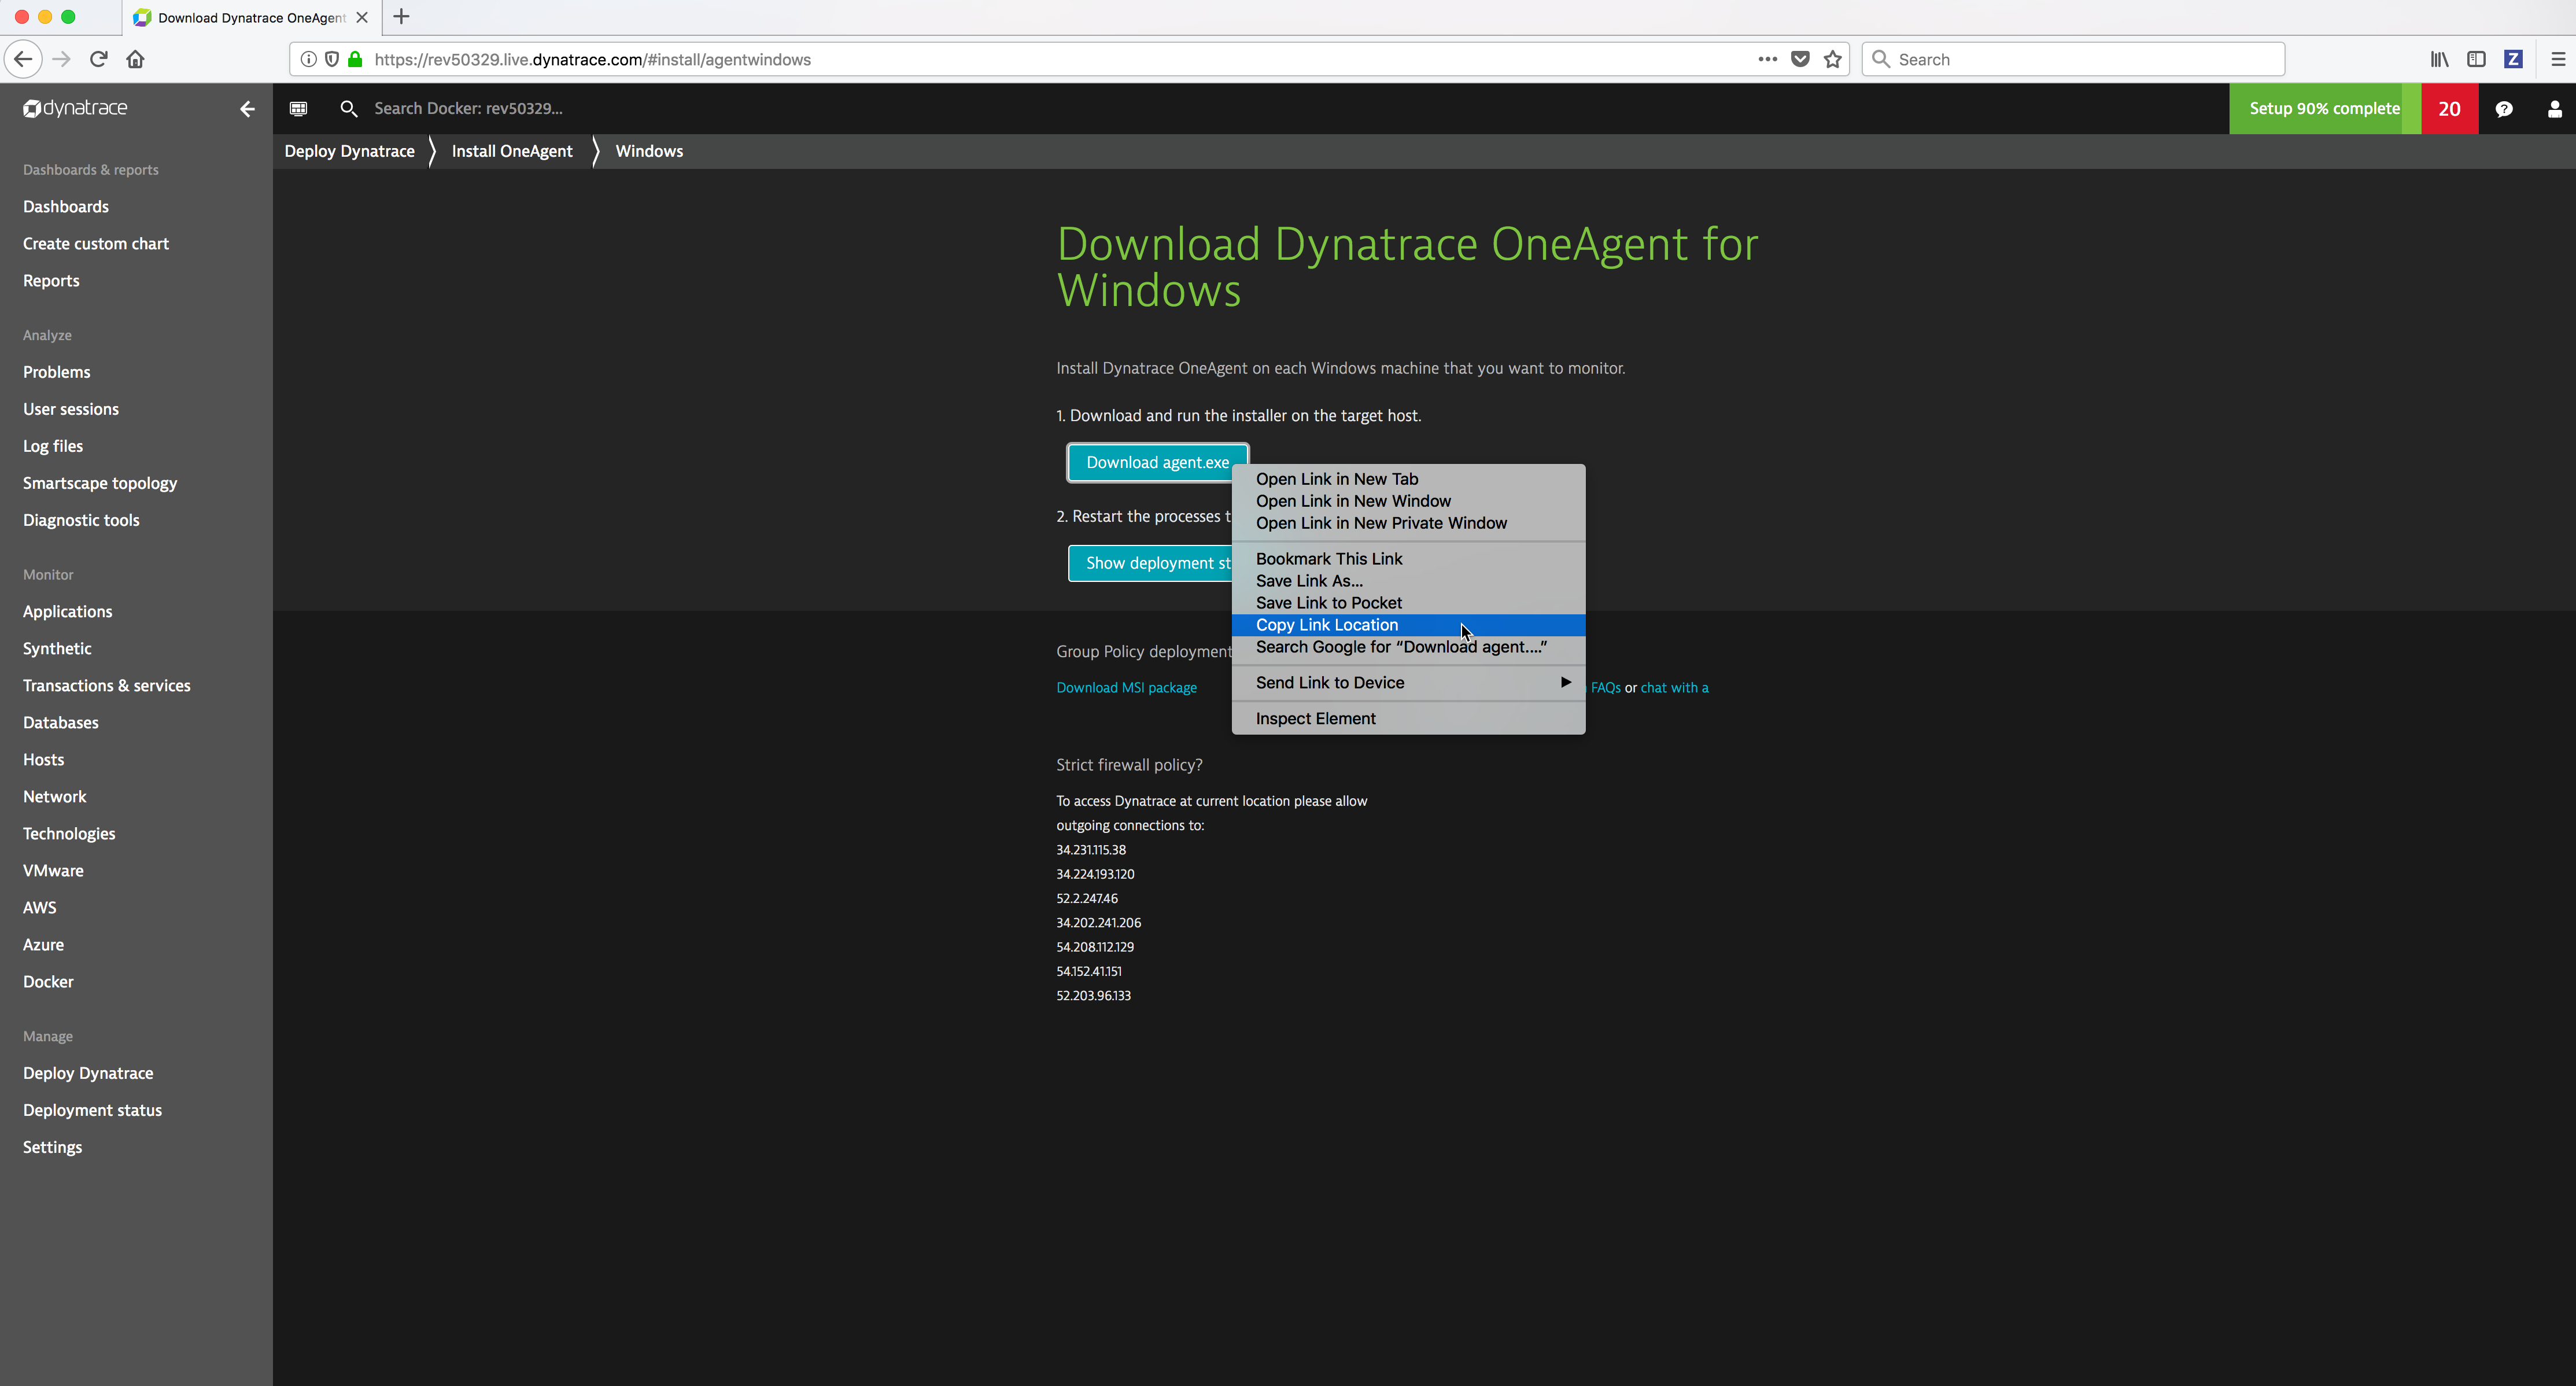
- Run the following
iwrcommand from a Powershell command prompt to download the Windows Dynatrace agent installation bits. Substitute the text dynatrace-oneagent-windows-download-link with the Windows Dynatrace agent downloadLinkyou copied in the previous step.
   > iwr -outfile install_oneagent.exe -uri '**dynatrace-oneagent-windows-download-link**'

Example:

.. image:: ../_images/dynatrace/run_dynatrace_oneagent_installer_iwr_command.png
   :width: 100%
   :alt: Run the iwr command
- Run the following
install_oneagent.execommand from a Powershell command prompt to install the Windows Dynatrace agent.
    .\install_oneagent.exe /quiet /norestart

Example:

.. image:: ../_images/dynatrace/run_dynatrace_oneagent_installer_windows_command.png
   :width: 100%
   :alt: Run the iwr command

.. Note::

   The **install\_oneagent.exe** command runs detached in the background.
- Wait about a minute and then run the following command from a Powershell command prompt to display the Dynatrace agent windows service.
   > net start | findstr /c:"Dynatrace OneAgent"

Example:

.. image:: ../_images/dynatrace/display_dynatrace_oneagent_windows_service.png
   :width: 100%
   :alt: Run the iwr command
If Docker Enterprise was installed prior to installing the Dynatrace agent you will need to reboot the machine.
Repeat the above Dynatrace agent installation on all of the Windows Docker nodes.
Note
You should automate the installation of the Windows Dynatrace agent before Docker Enterprise is installed on the node using a configuration management tool such as Chef, Puppet, Terraform, Ansible, Cloud Init script, etc.
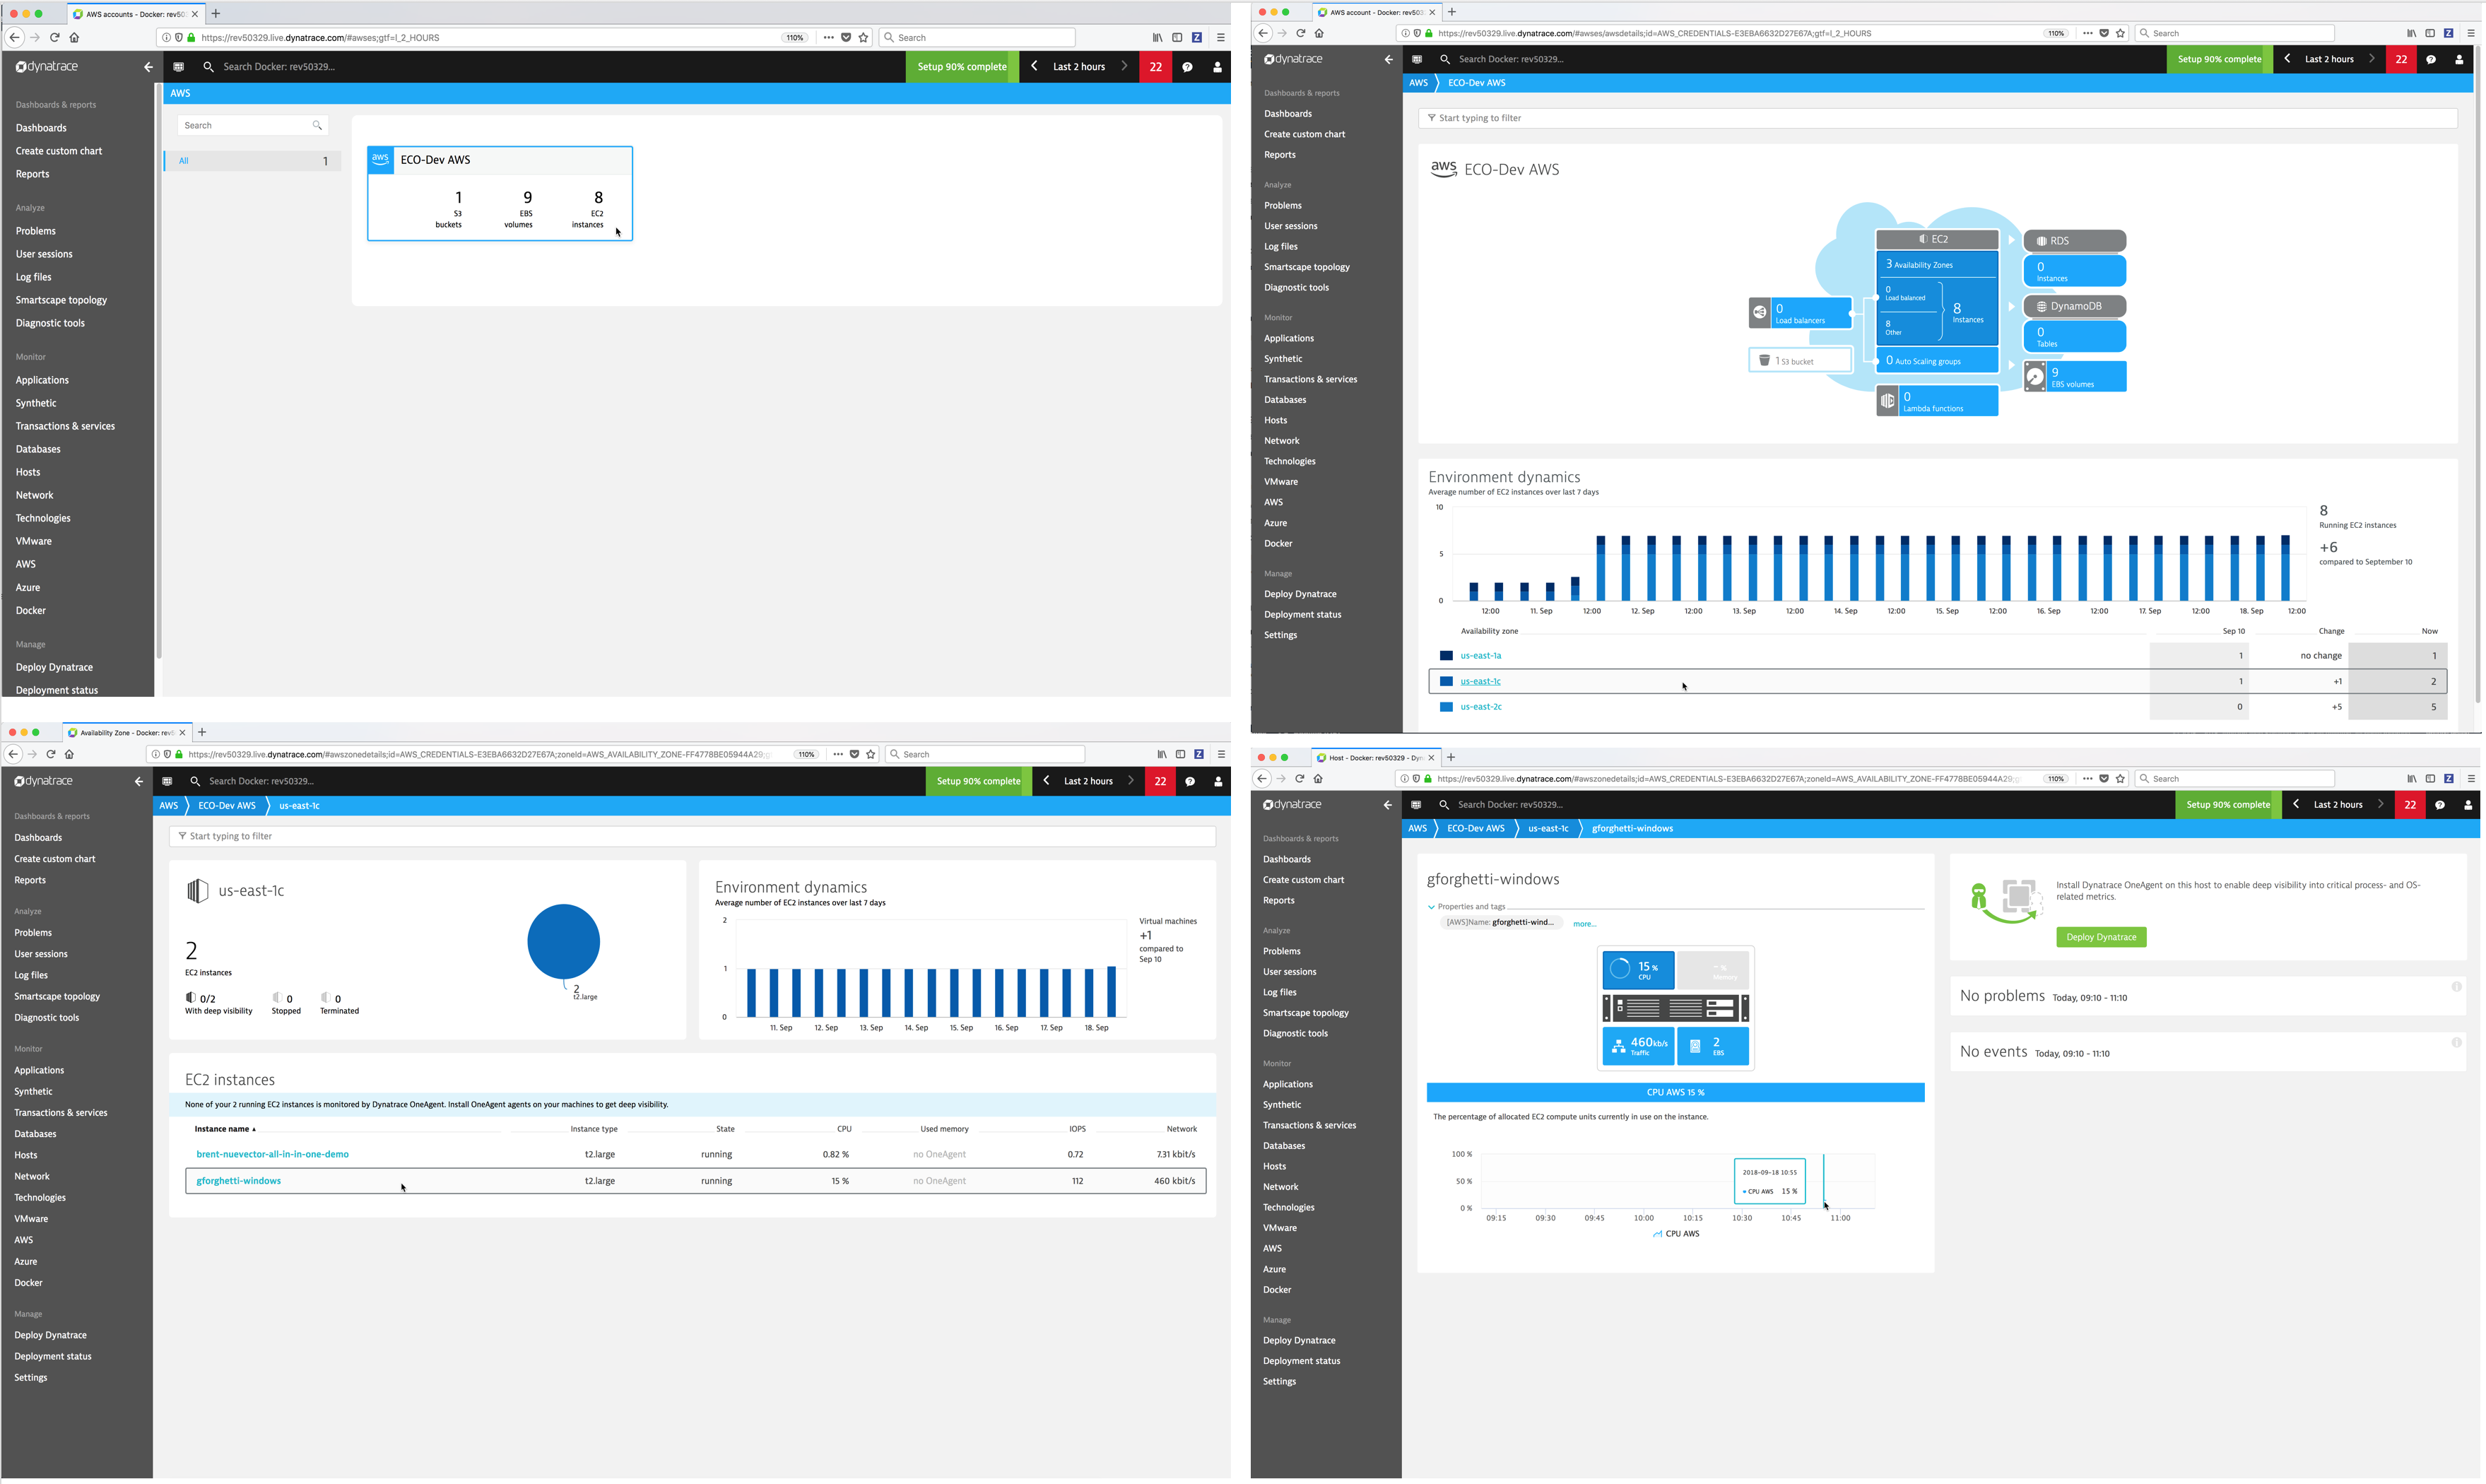
Display the Dynatrace agents from the Dynatrace Web UI
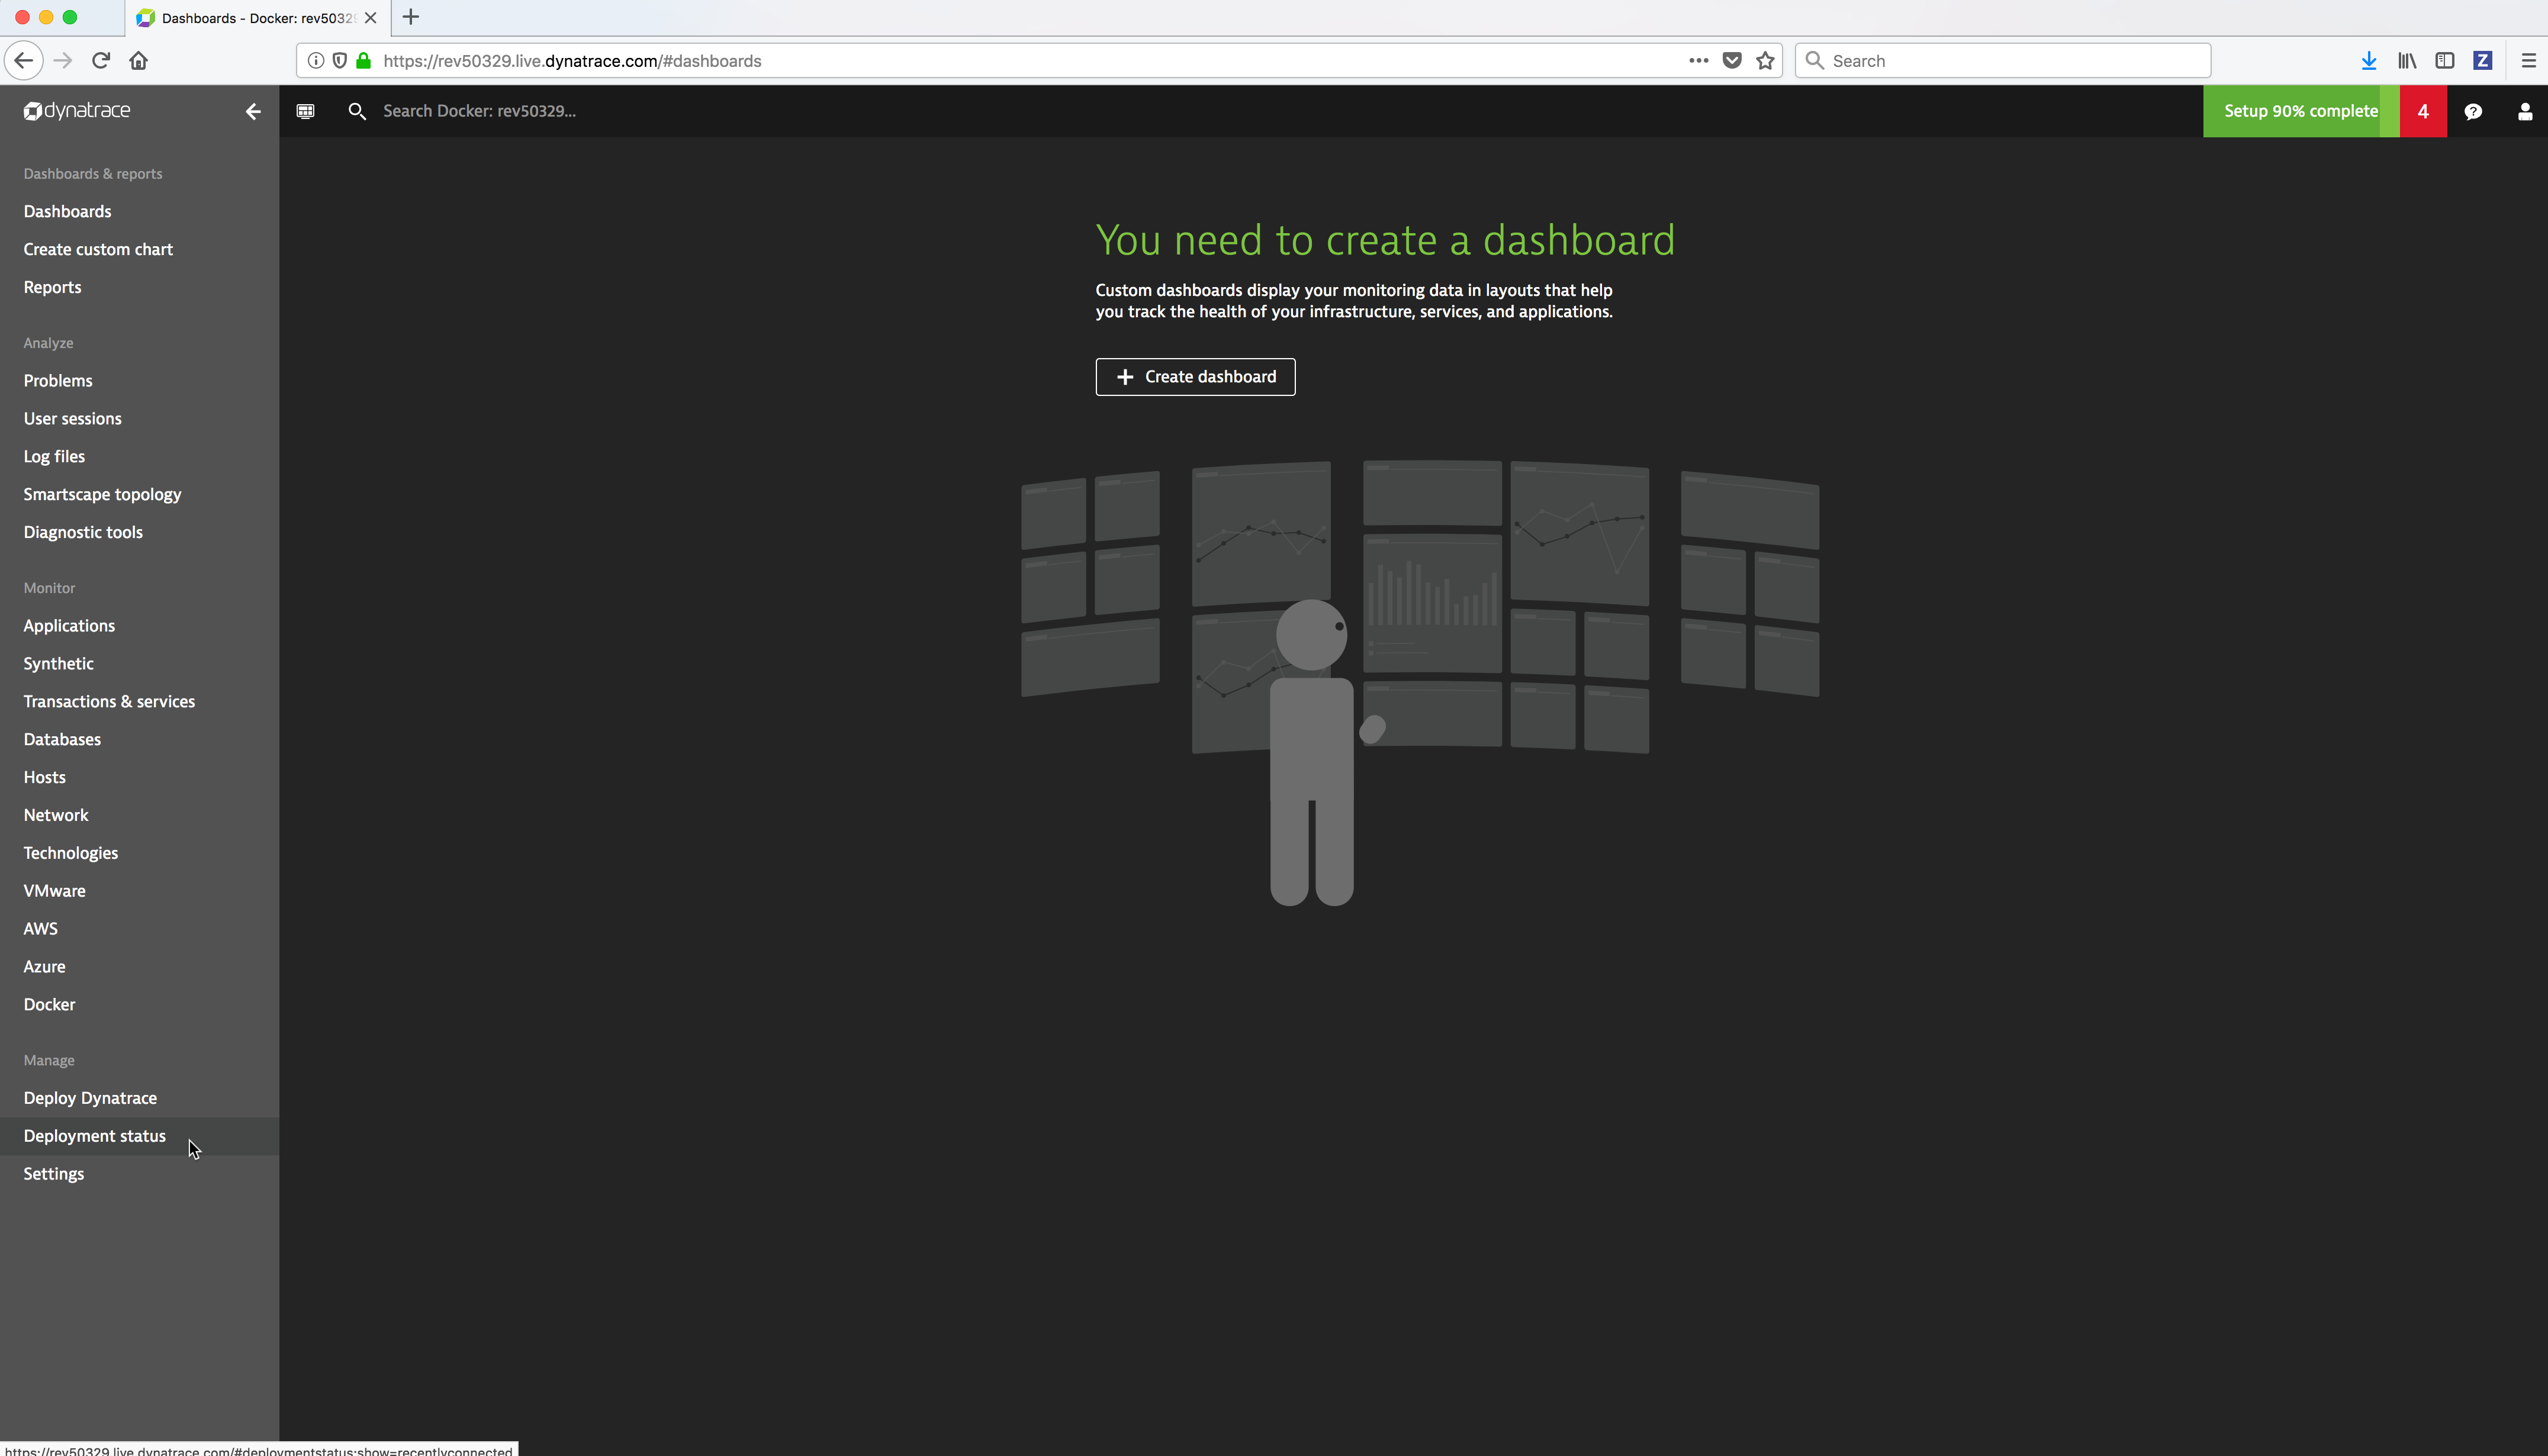
You can display the Dynatrace agents from the Dynatrace Web UI Deployment Status page.
From the Dynatrace Web UI, click on the Deployment Status link.
You can click on a Dynatrace agent to get more details.
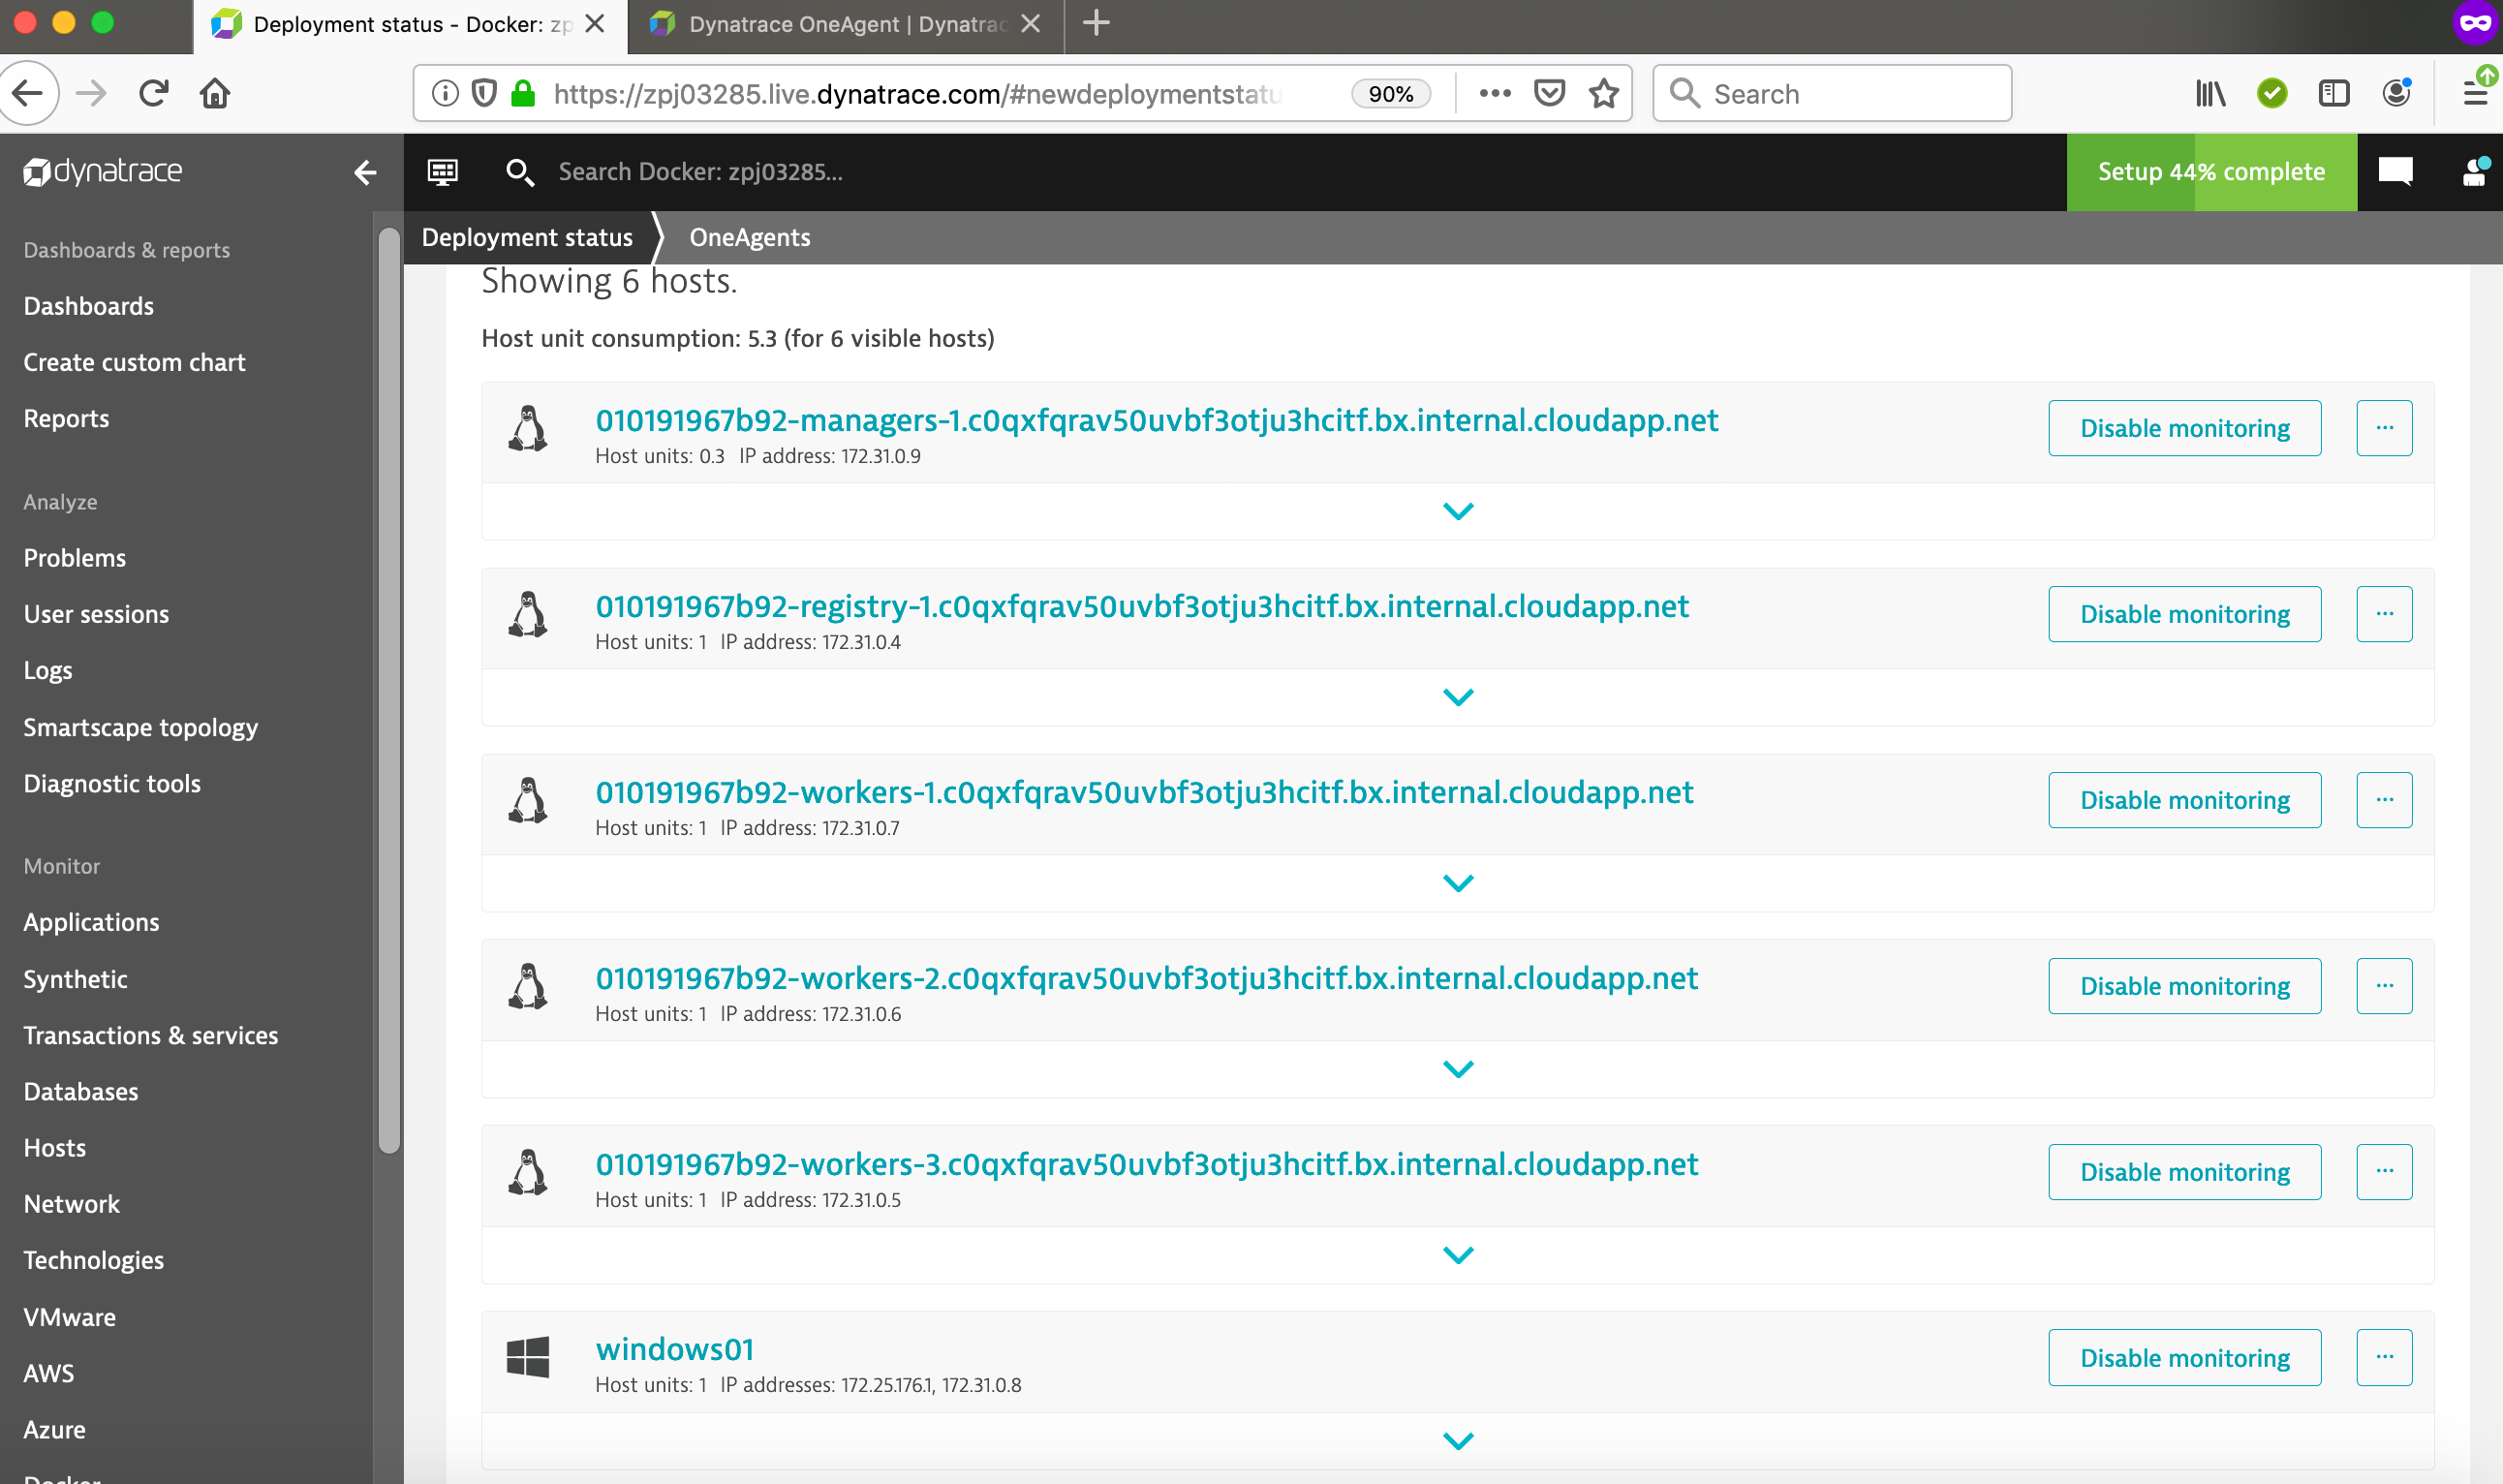
More details are displayed which includes the processes and containers being monitored by the selected Dynatrace agent.
Dynatrace Web Interface
Dashboards & reports
- Dashboards - allow you to create your own custom dashboards to monitor your infrastructure and applications. Dynatrace provides a default home dashboard that provides a quick overview of your system’s health.
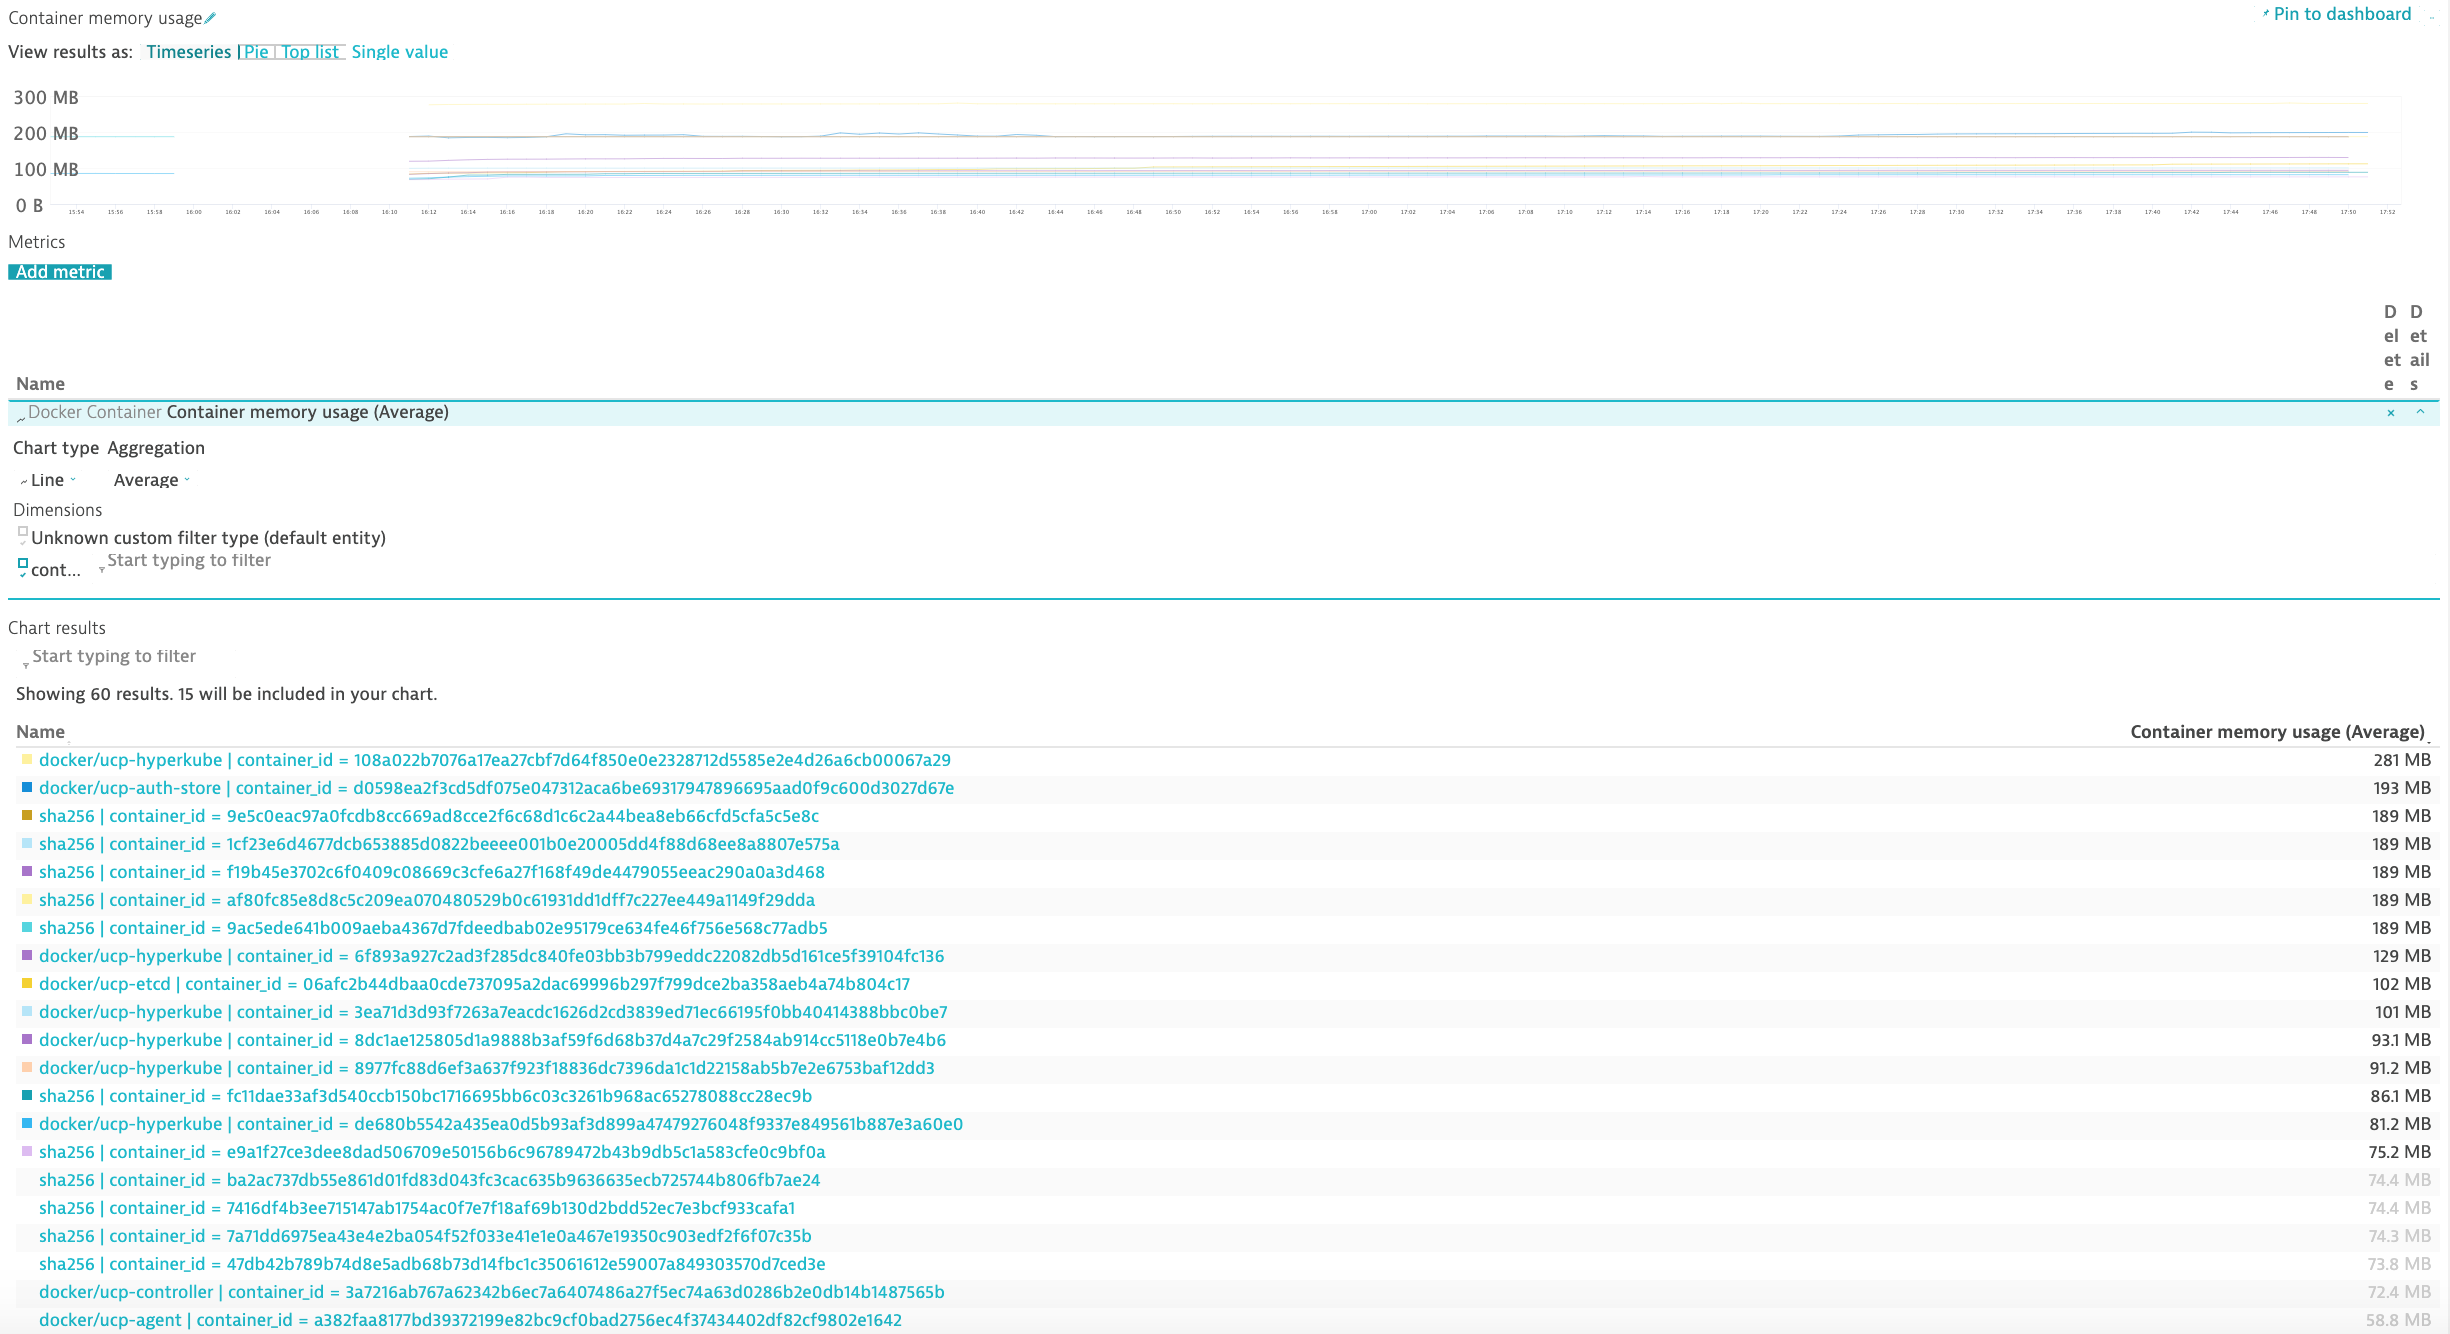
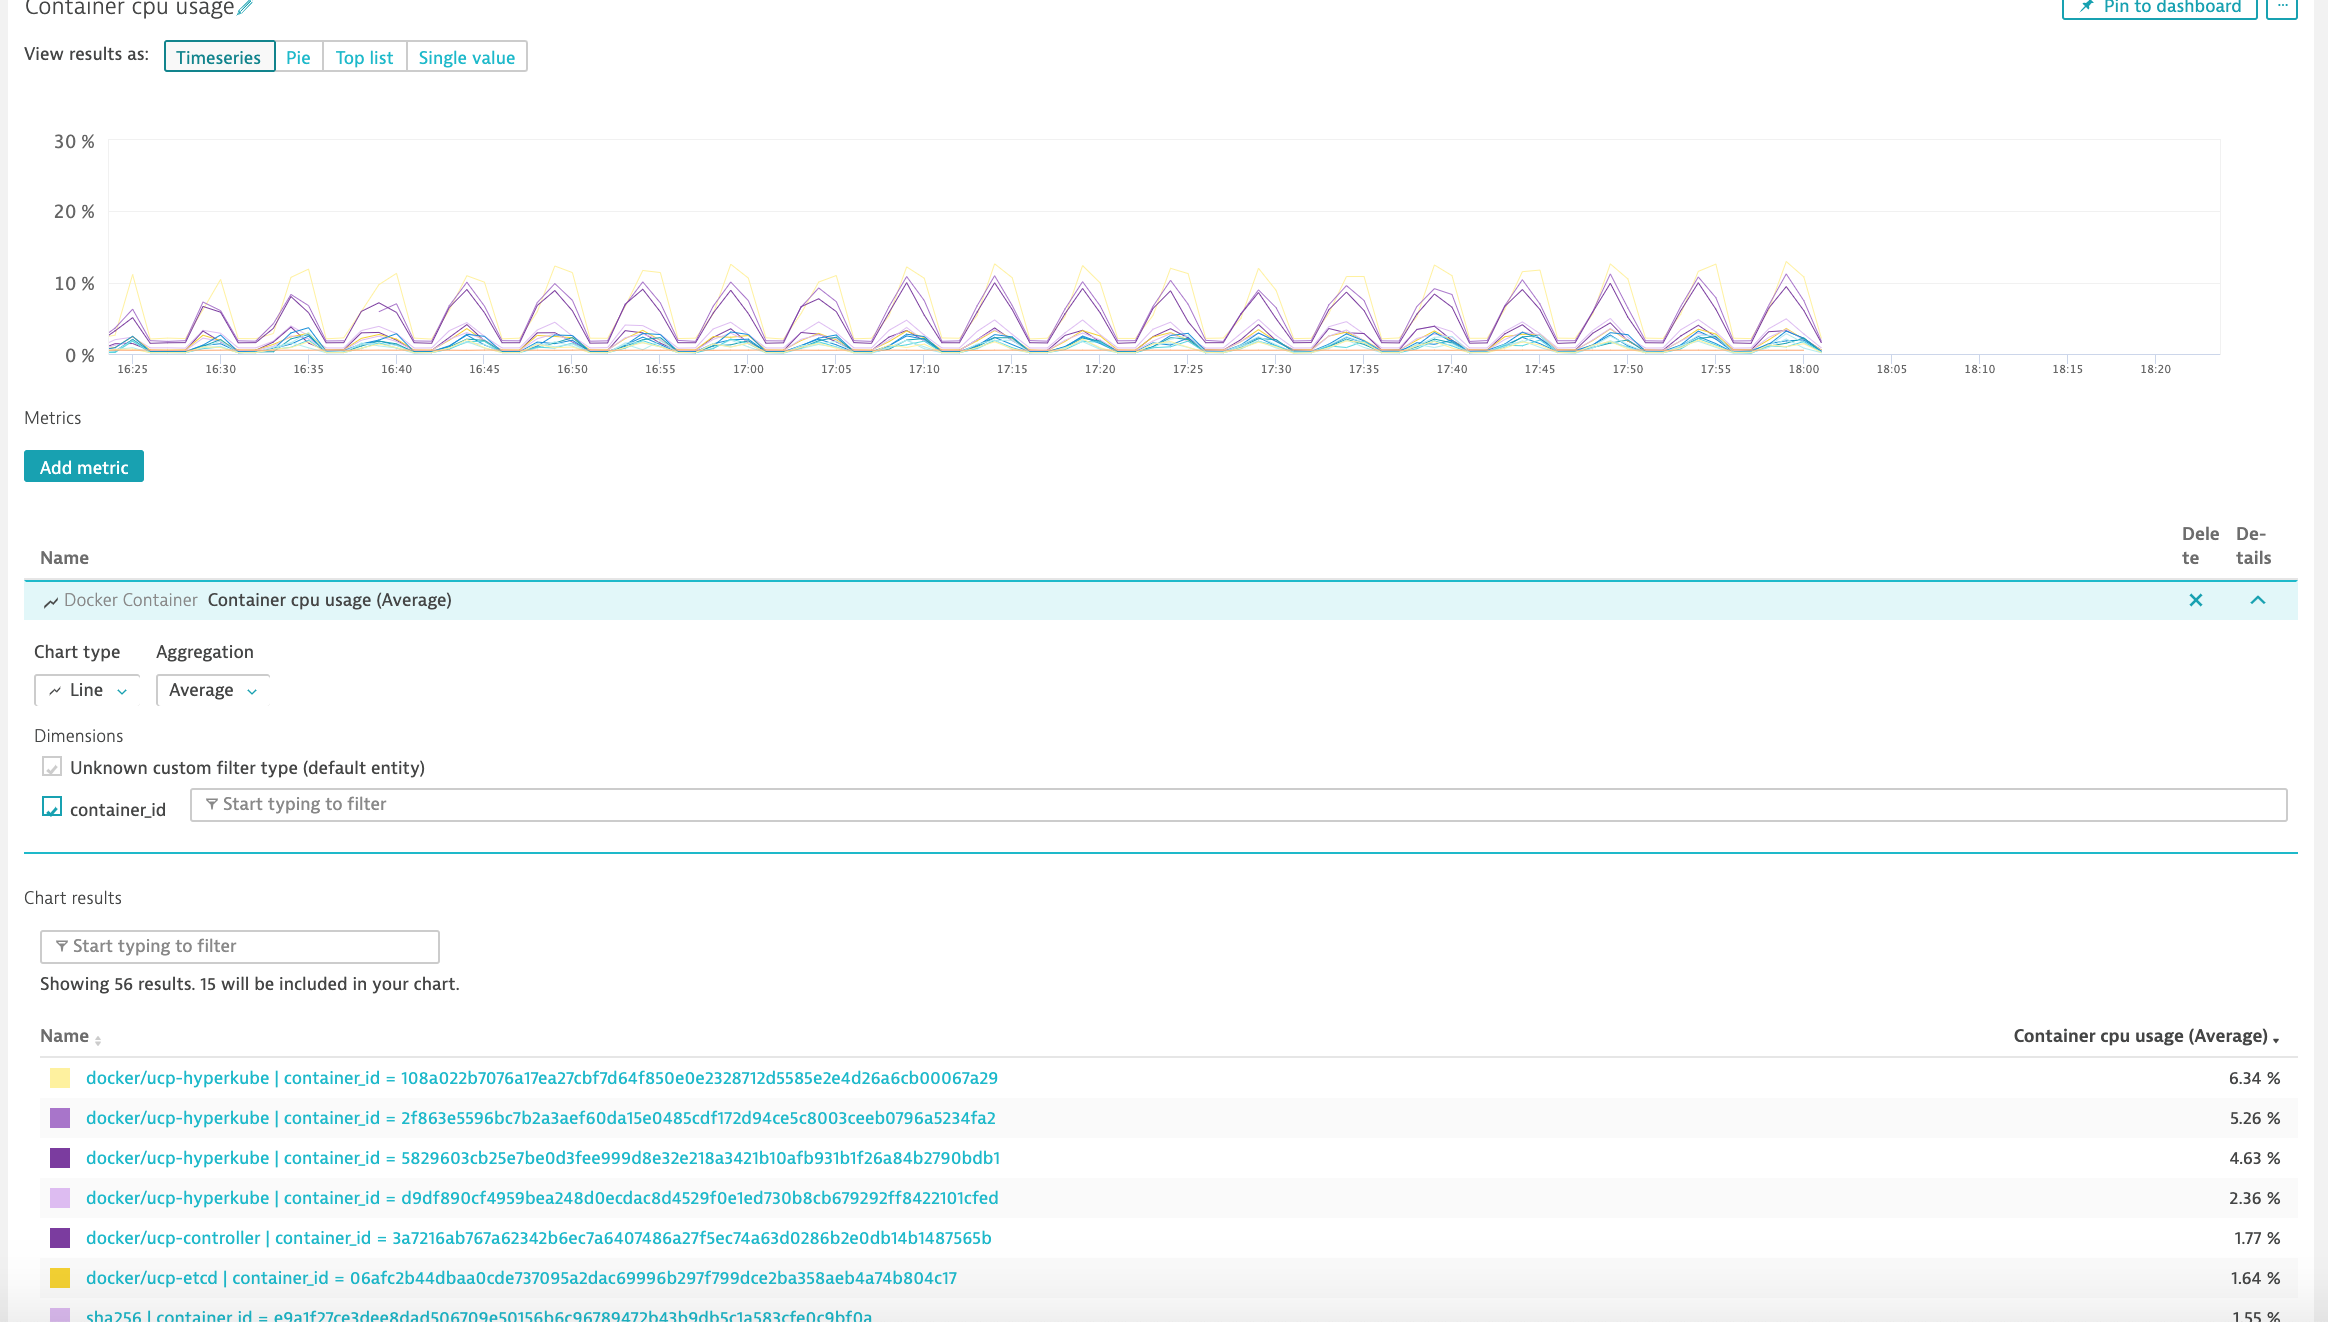
- Create custom chart - Custom charts enable you to analyze any combination of monitoring metrics directly on your dashboards.
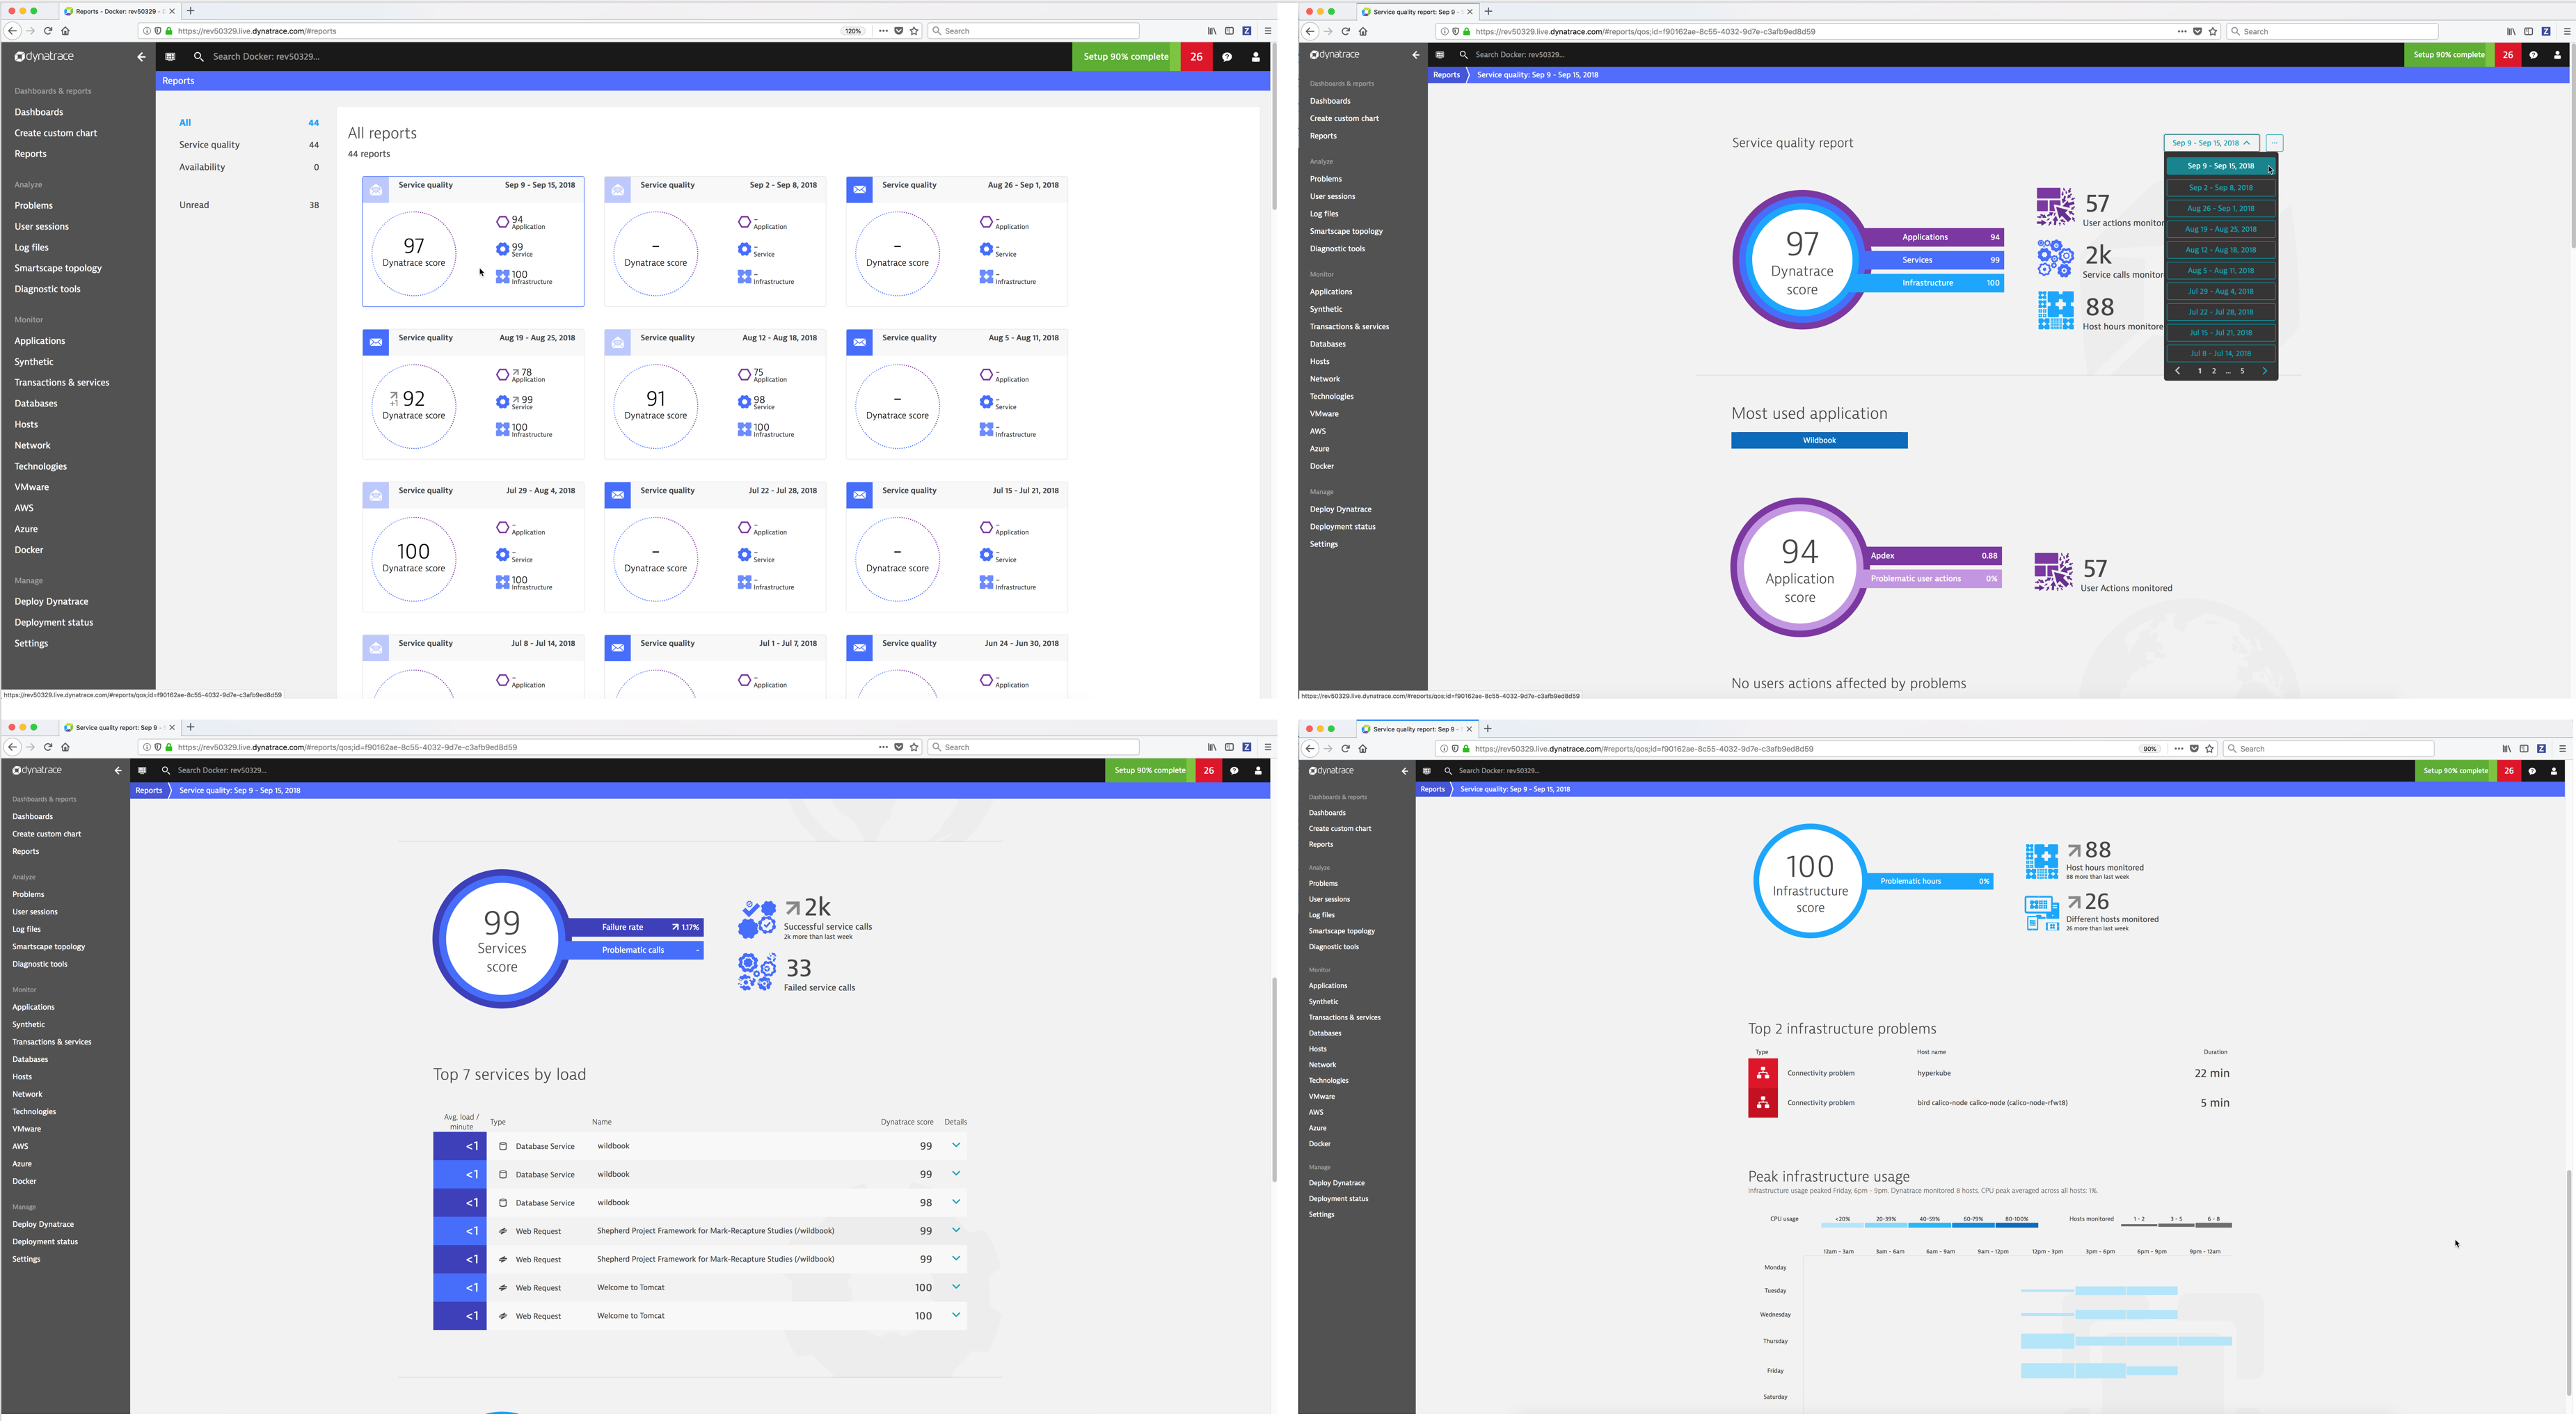
- Reports - Dynatrace provides Service quality and Availability reports. Service quality reports are generated each week on Sundays at midnight so that when you start your work week each Monday morning you’ll find a new report ready for your review. Availability reports are based on web checks that you have running in Dynatrace.
Analyze
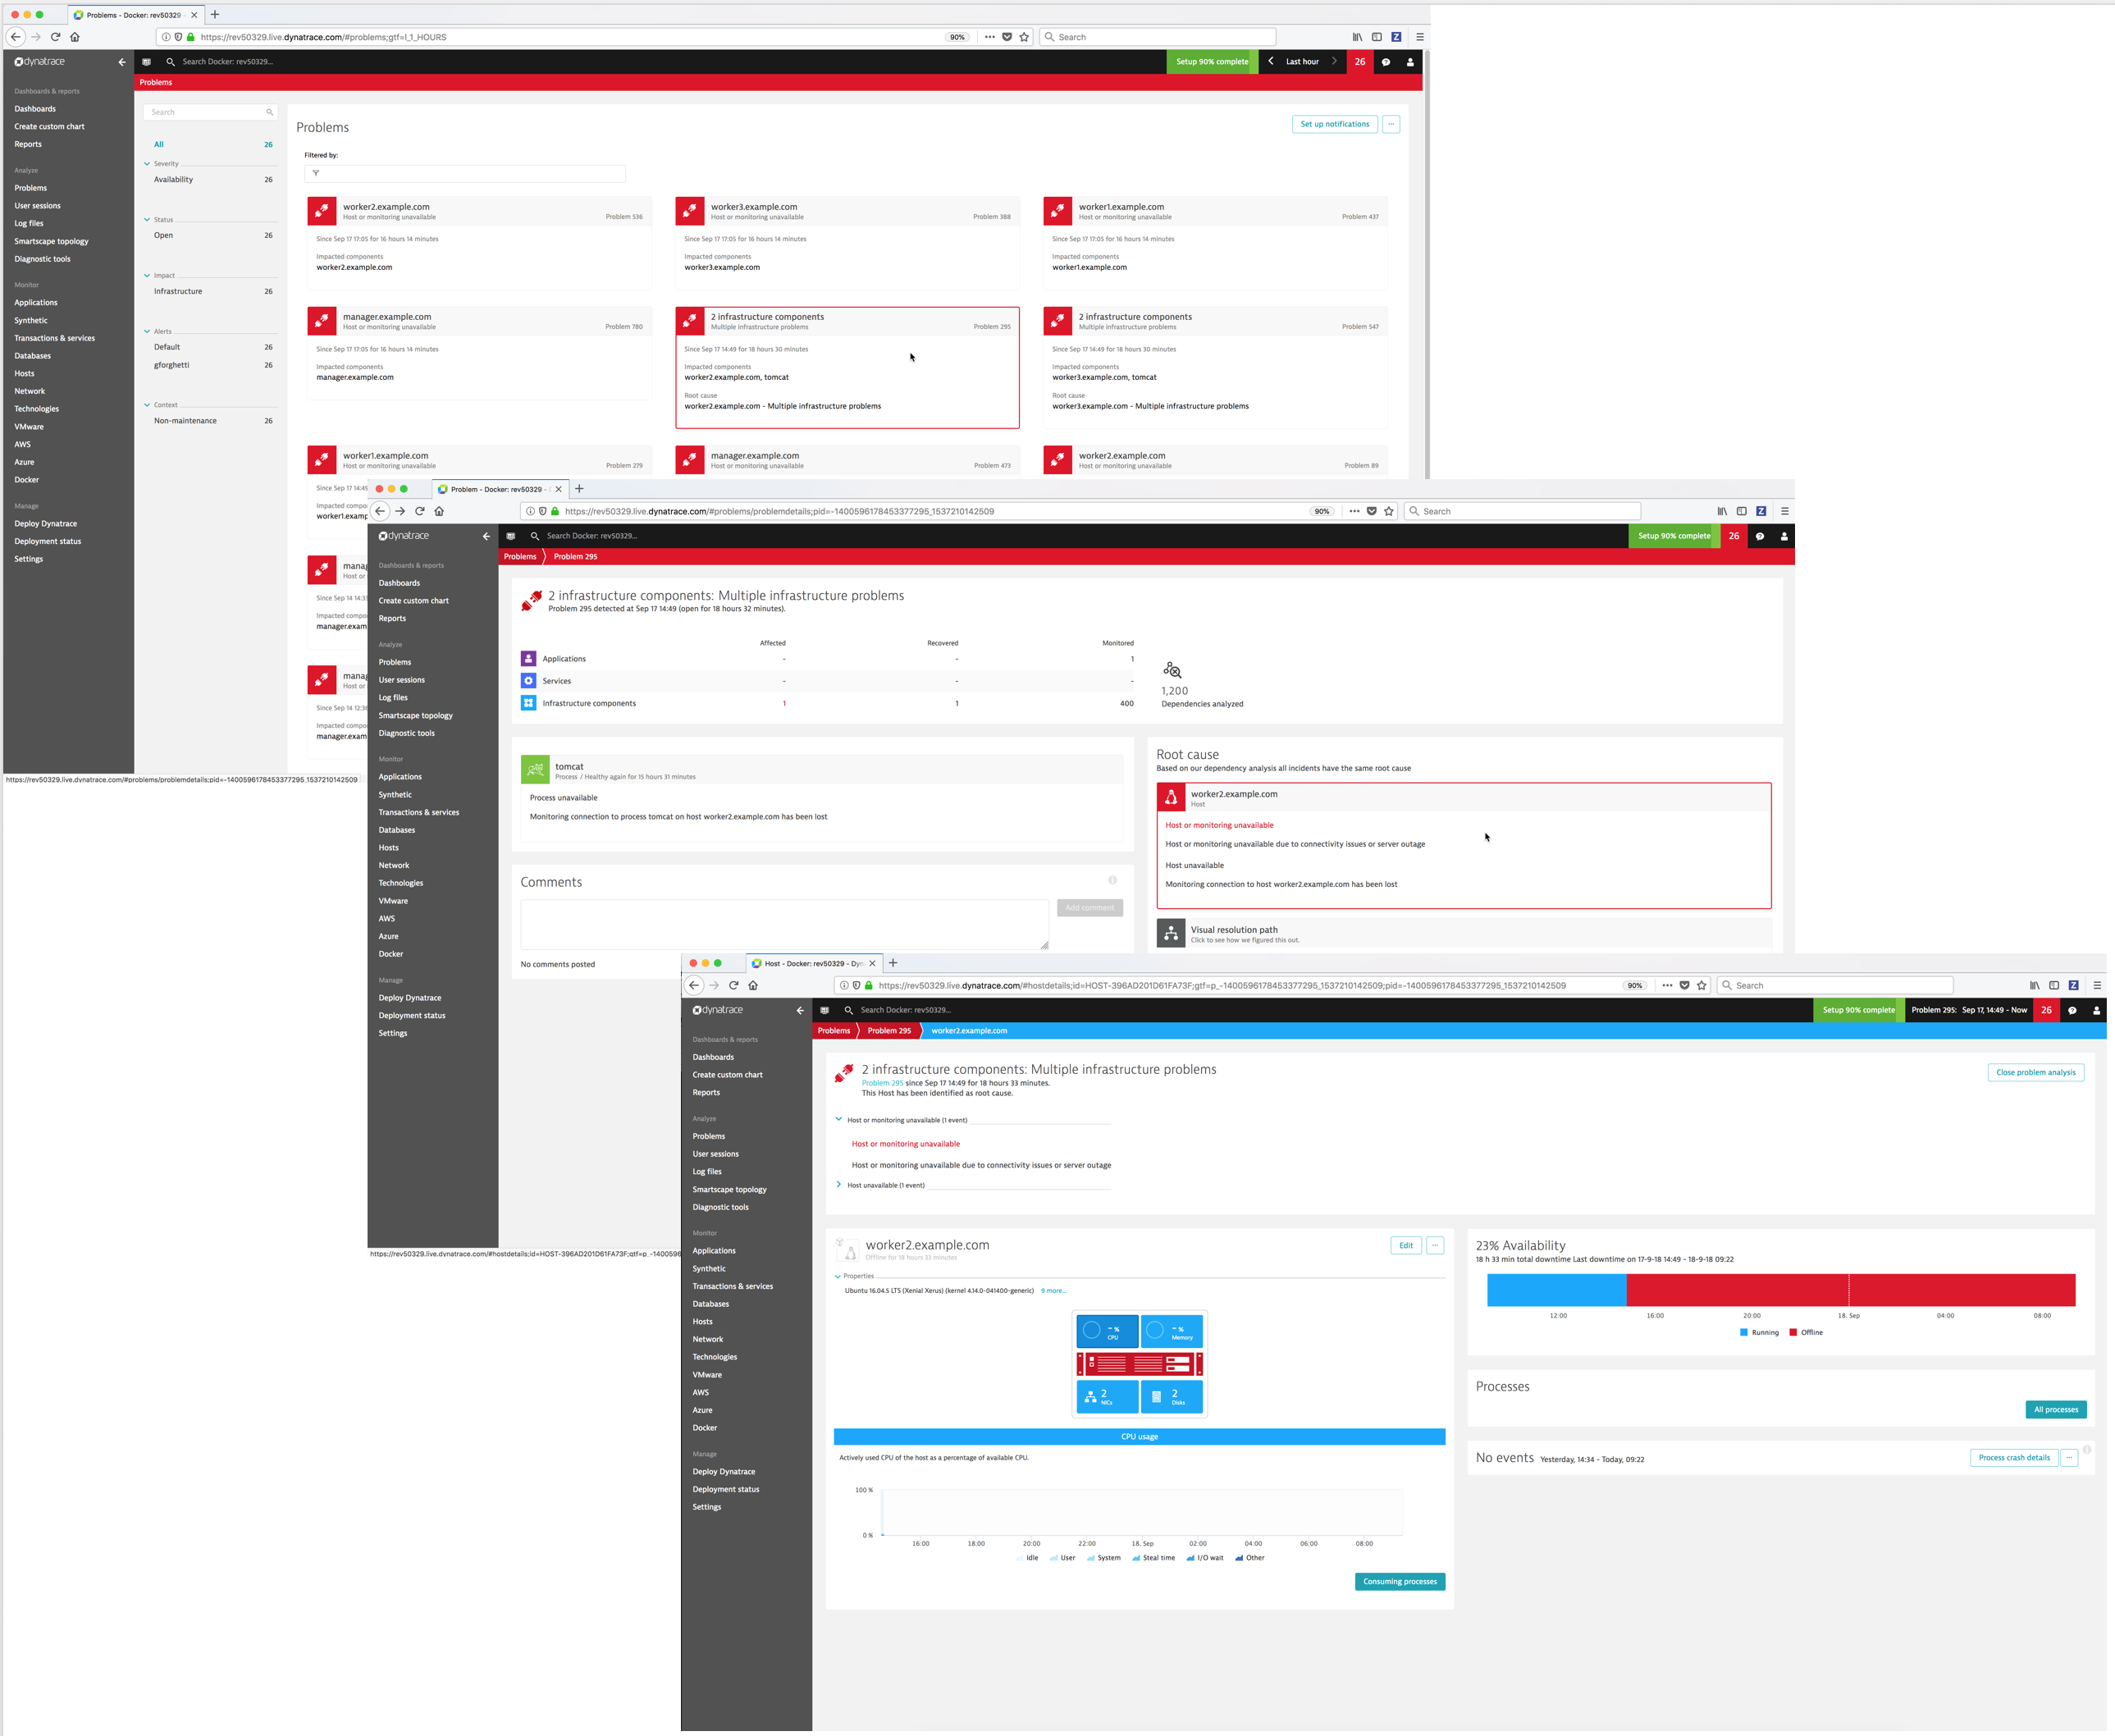
- Problems - Dynatrace automatically detects performance anomalies in your applications, services, and infrastructure. Dynatrace “problems” are used to report and alert on abnormal situations, such as performance degradations, improper functionality, or lack of availability (i.e., problems represent anomalies in baseline system performance).
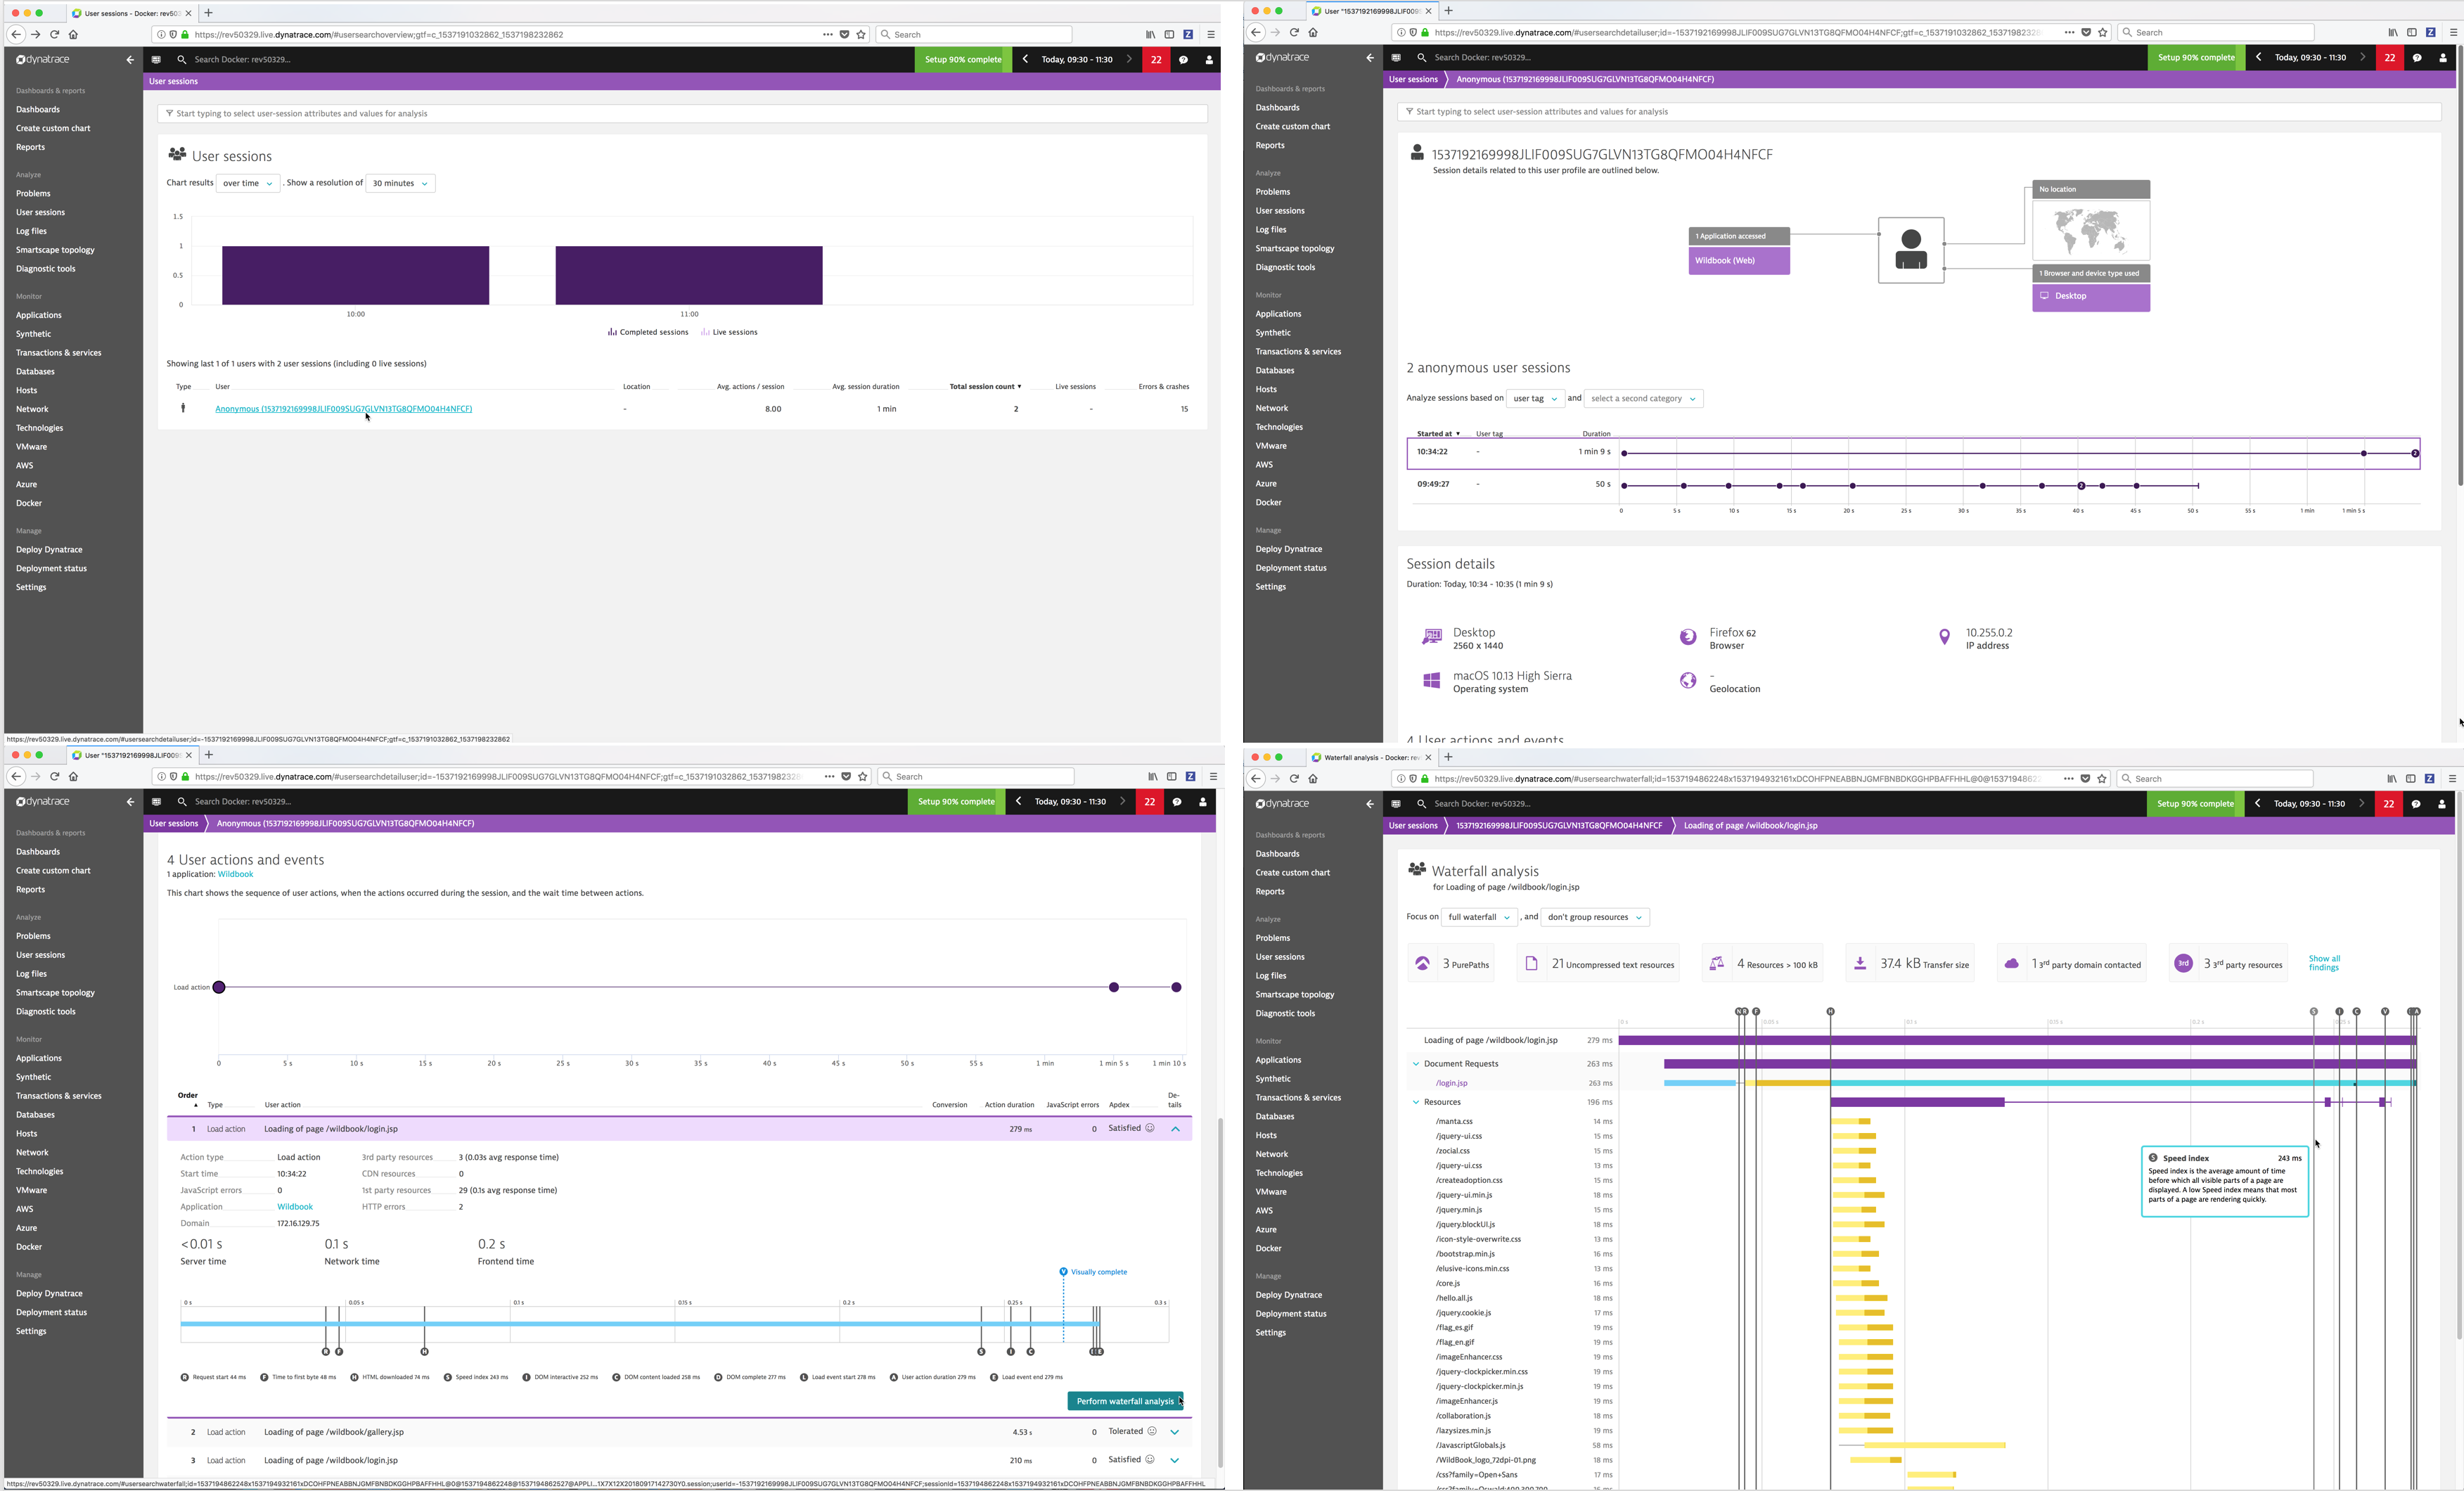
- User sessions - A user session, sometimes known as a “visit,” is a group of user actions that are performed in your web application during a limited period of time.
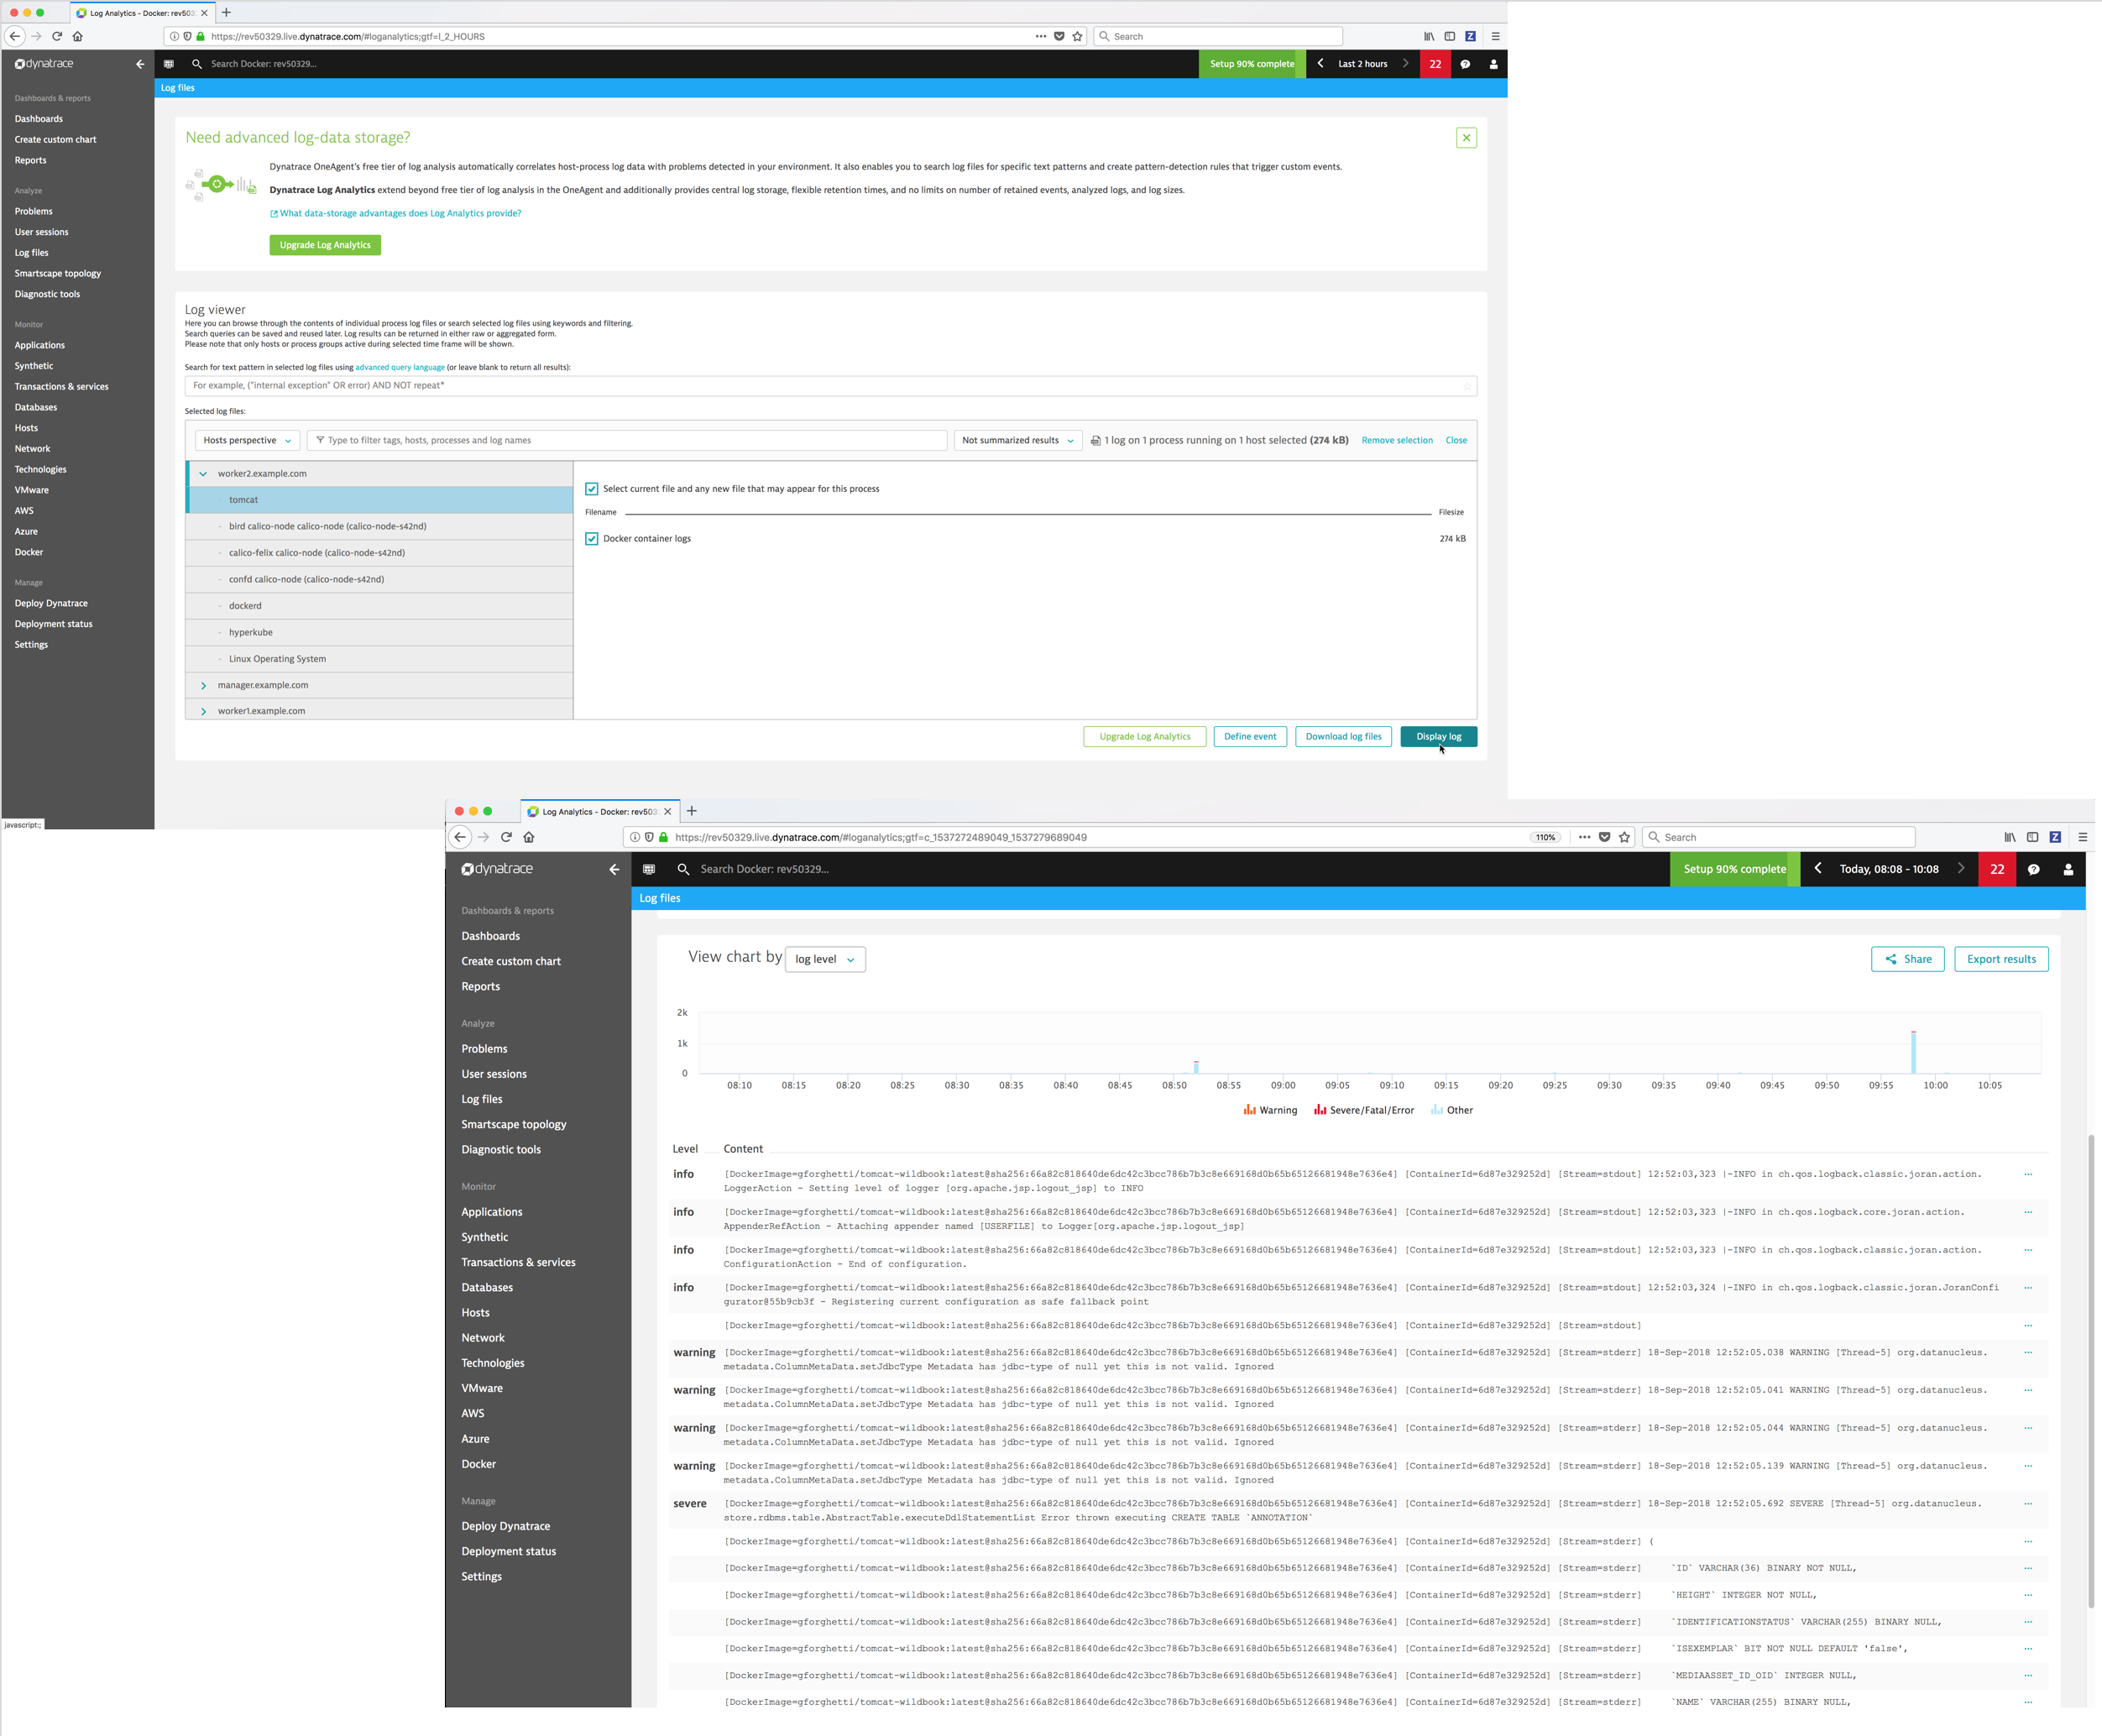
- Log files - Dynatrace automatically discovers all log files on your monitored hosts and processes. You can then browse, search and filter for information in the log files.
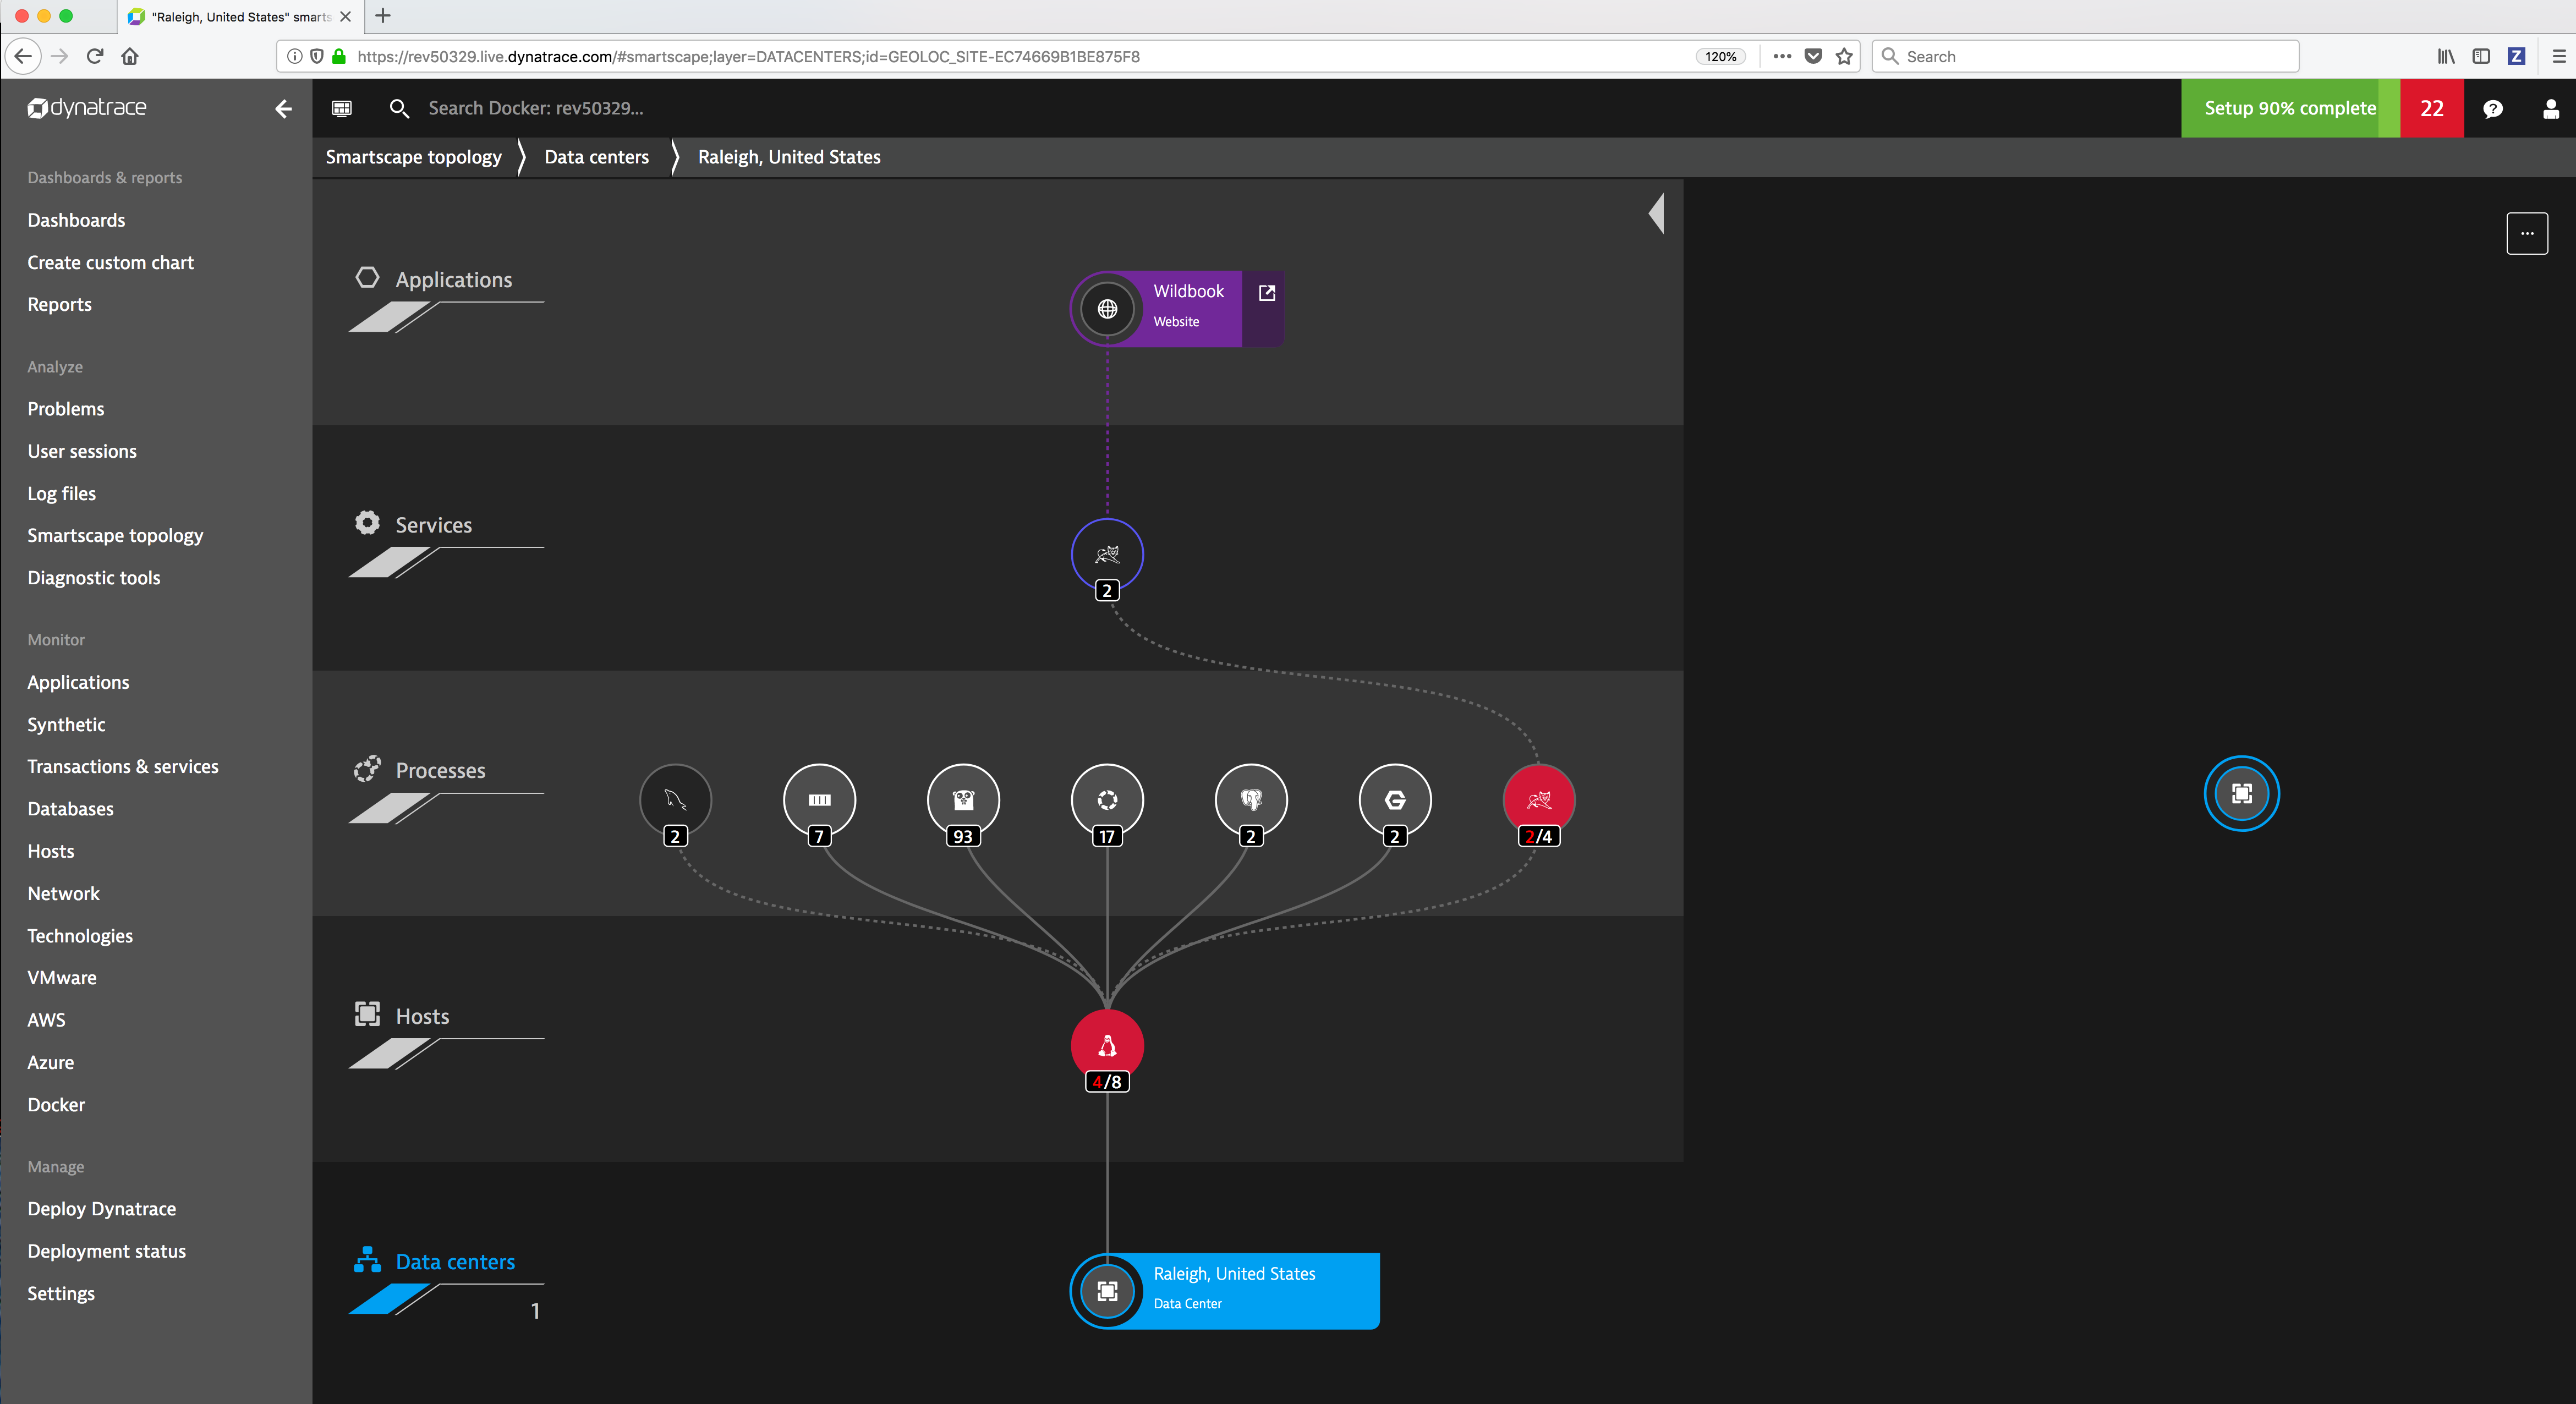
- Smartscape topology - Visualize your application topology in an interactive infographic.
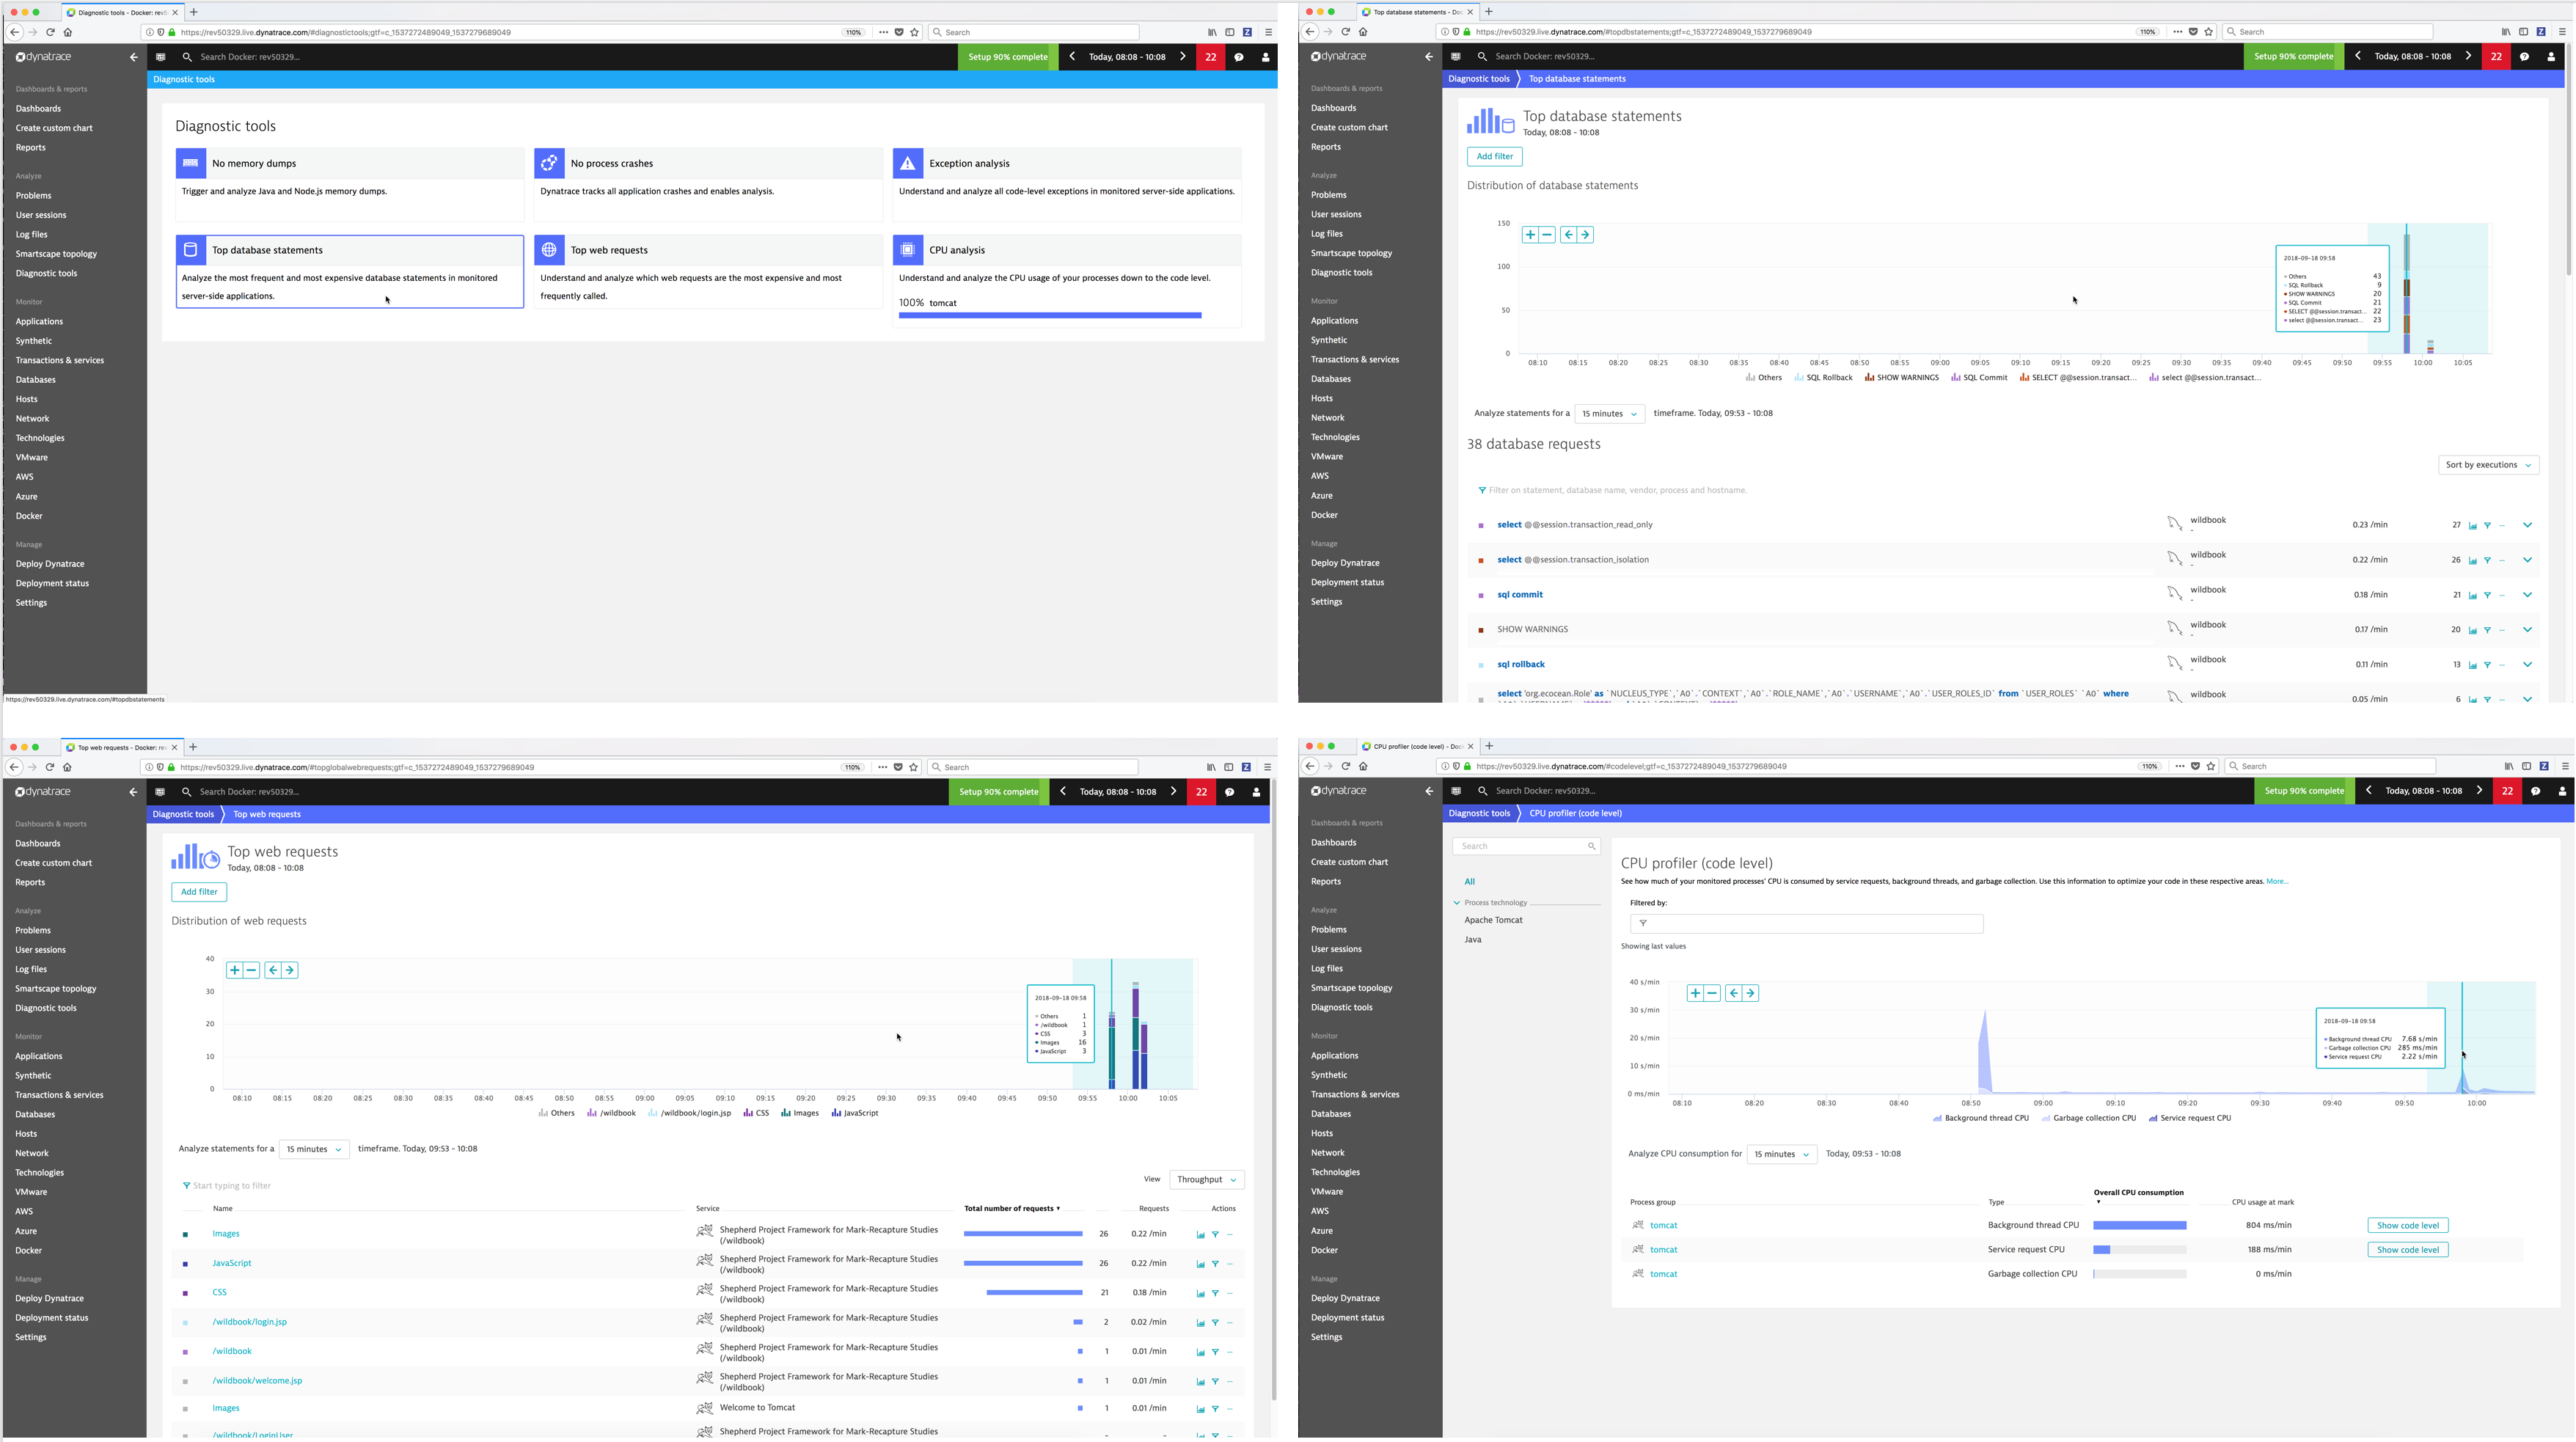
- Diagnostic tools - Dynatrace provide diagnostic tools for detecting and analyzing performance problems in your application environment.
Monitor
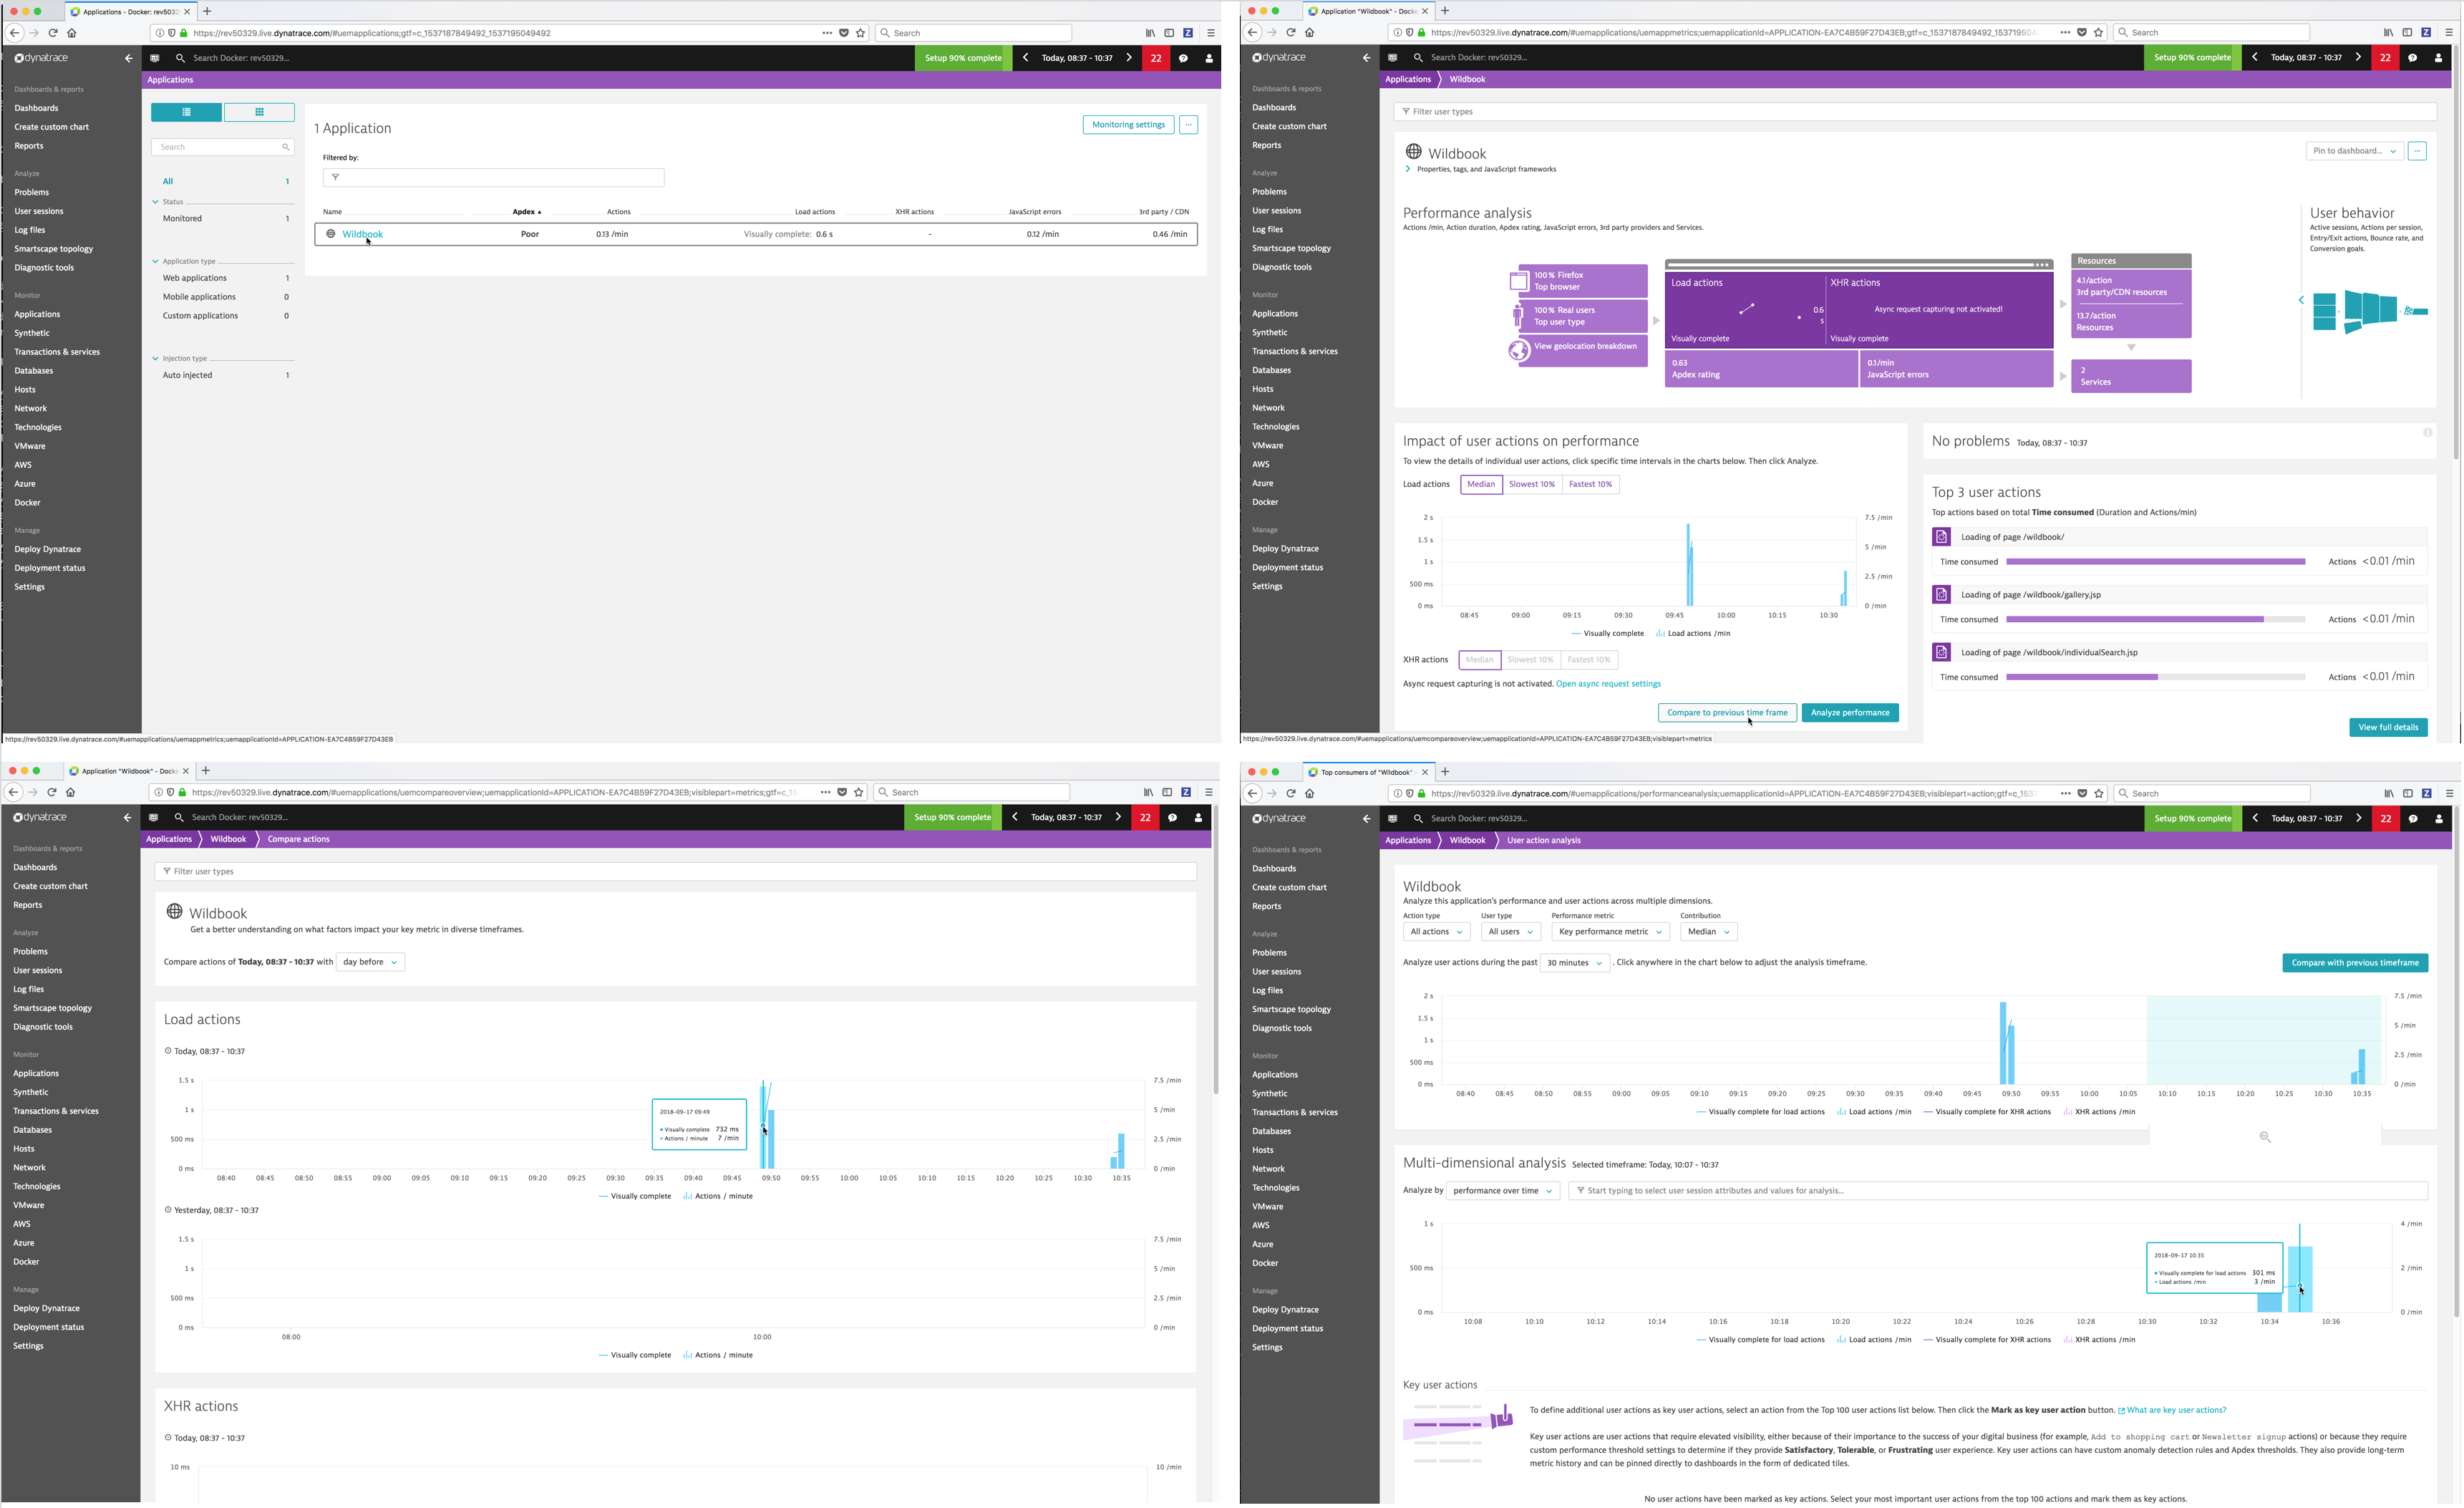
- Applications - Dynatrace monitors and visualizes application performance, provides all performance metrics in real time and detects and diagnoses problems automatically.
- Synthetic - Dynatrace allows you to define Synthetic monitors (simulated user sessions) that alert you when an application is inaccessible or when performance degrades below baseline performance.
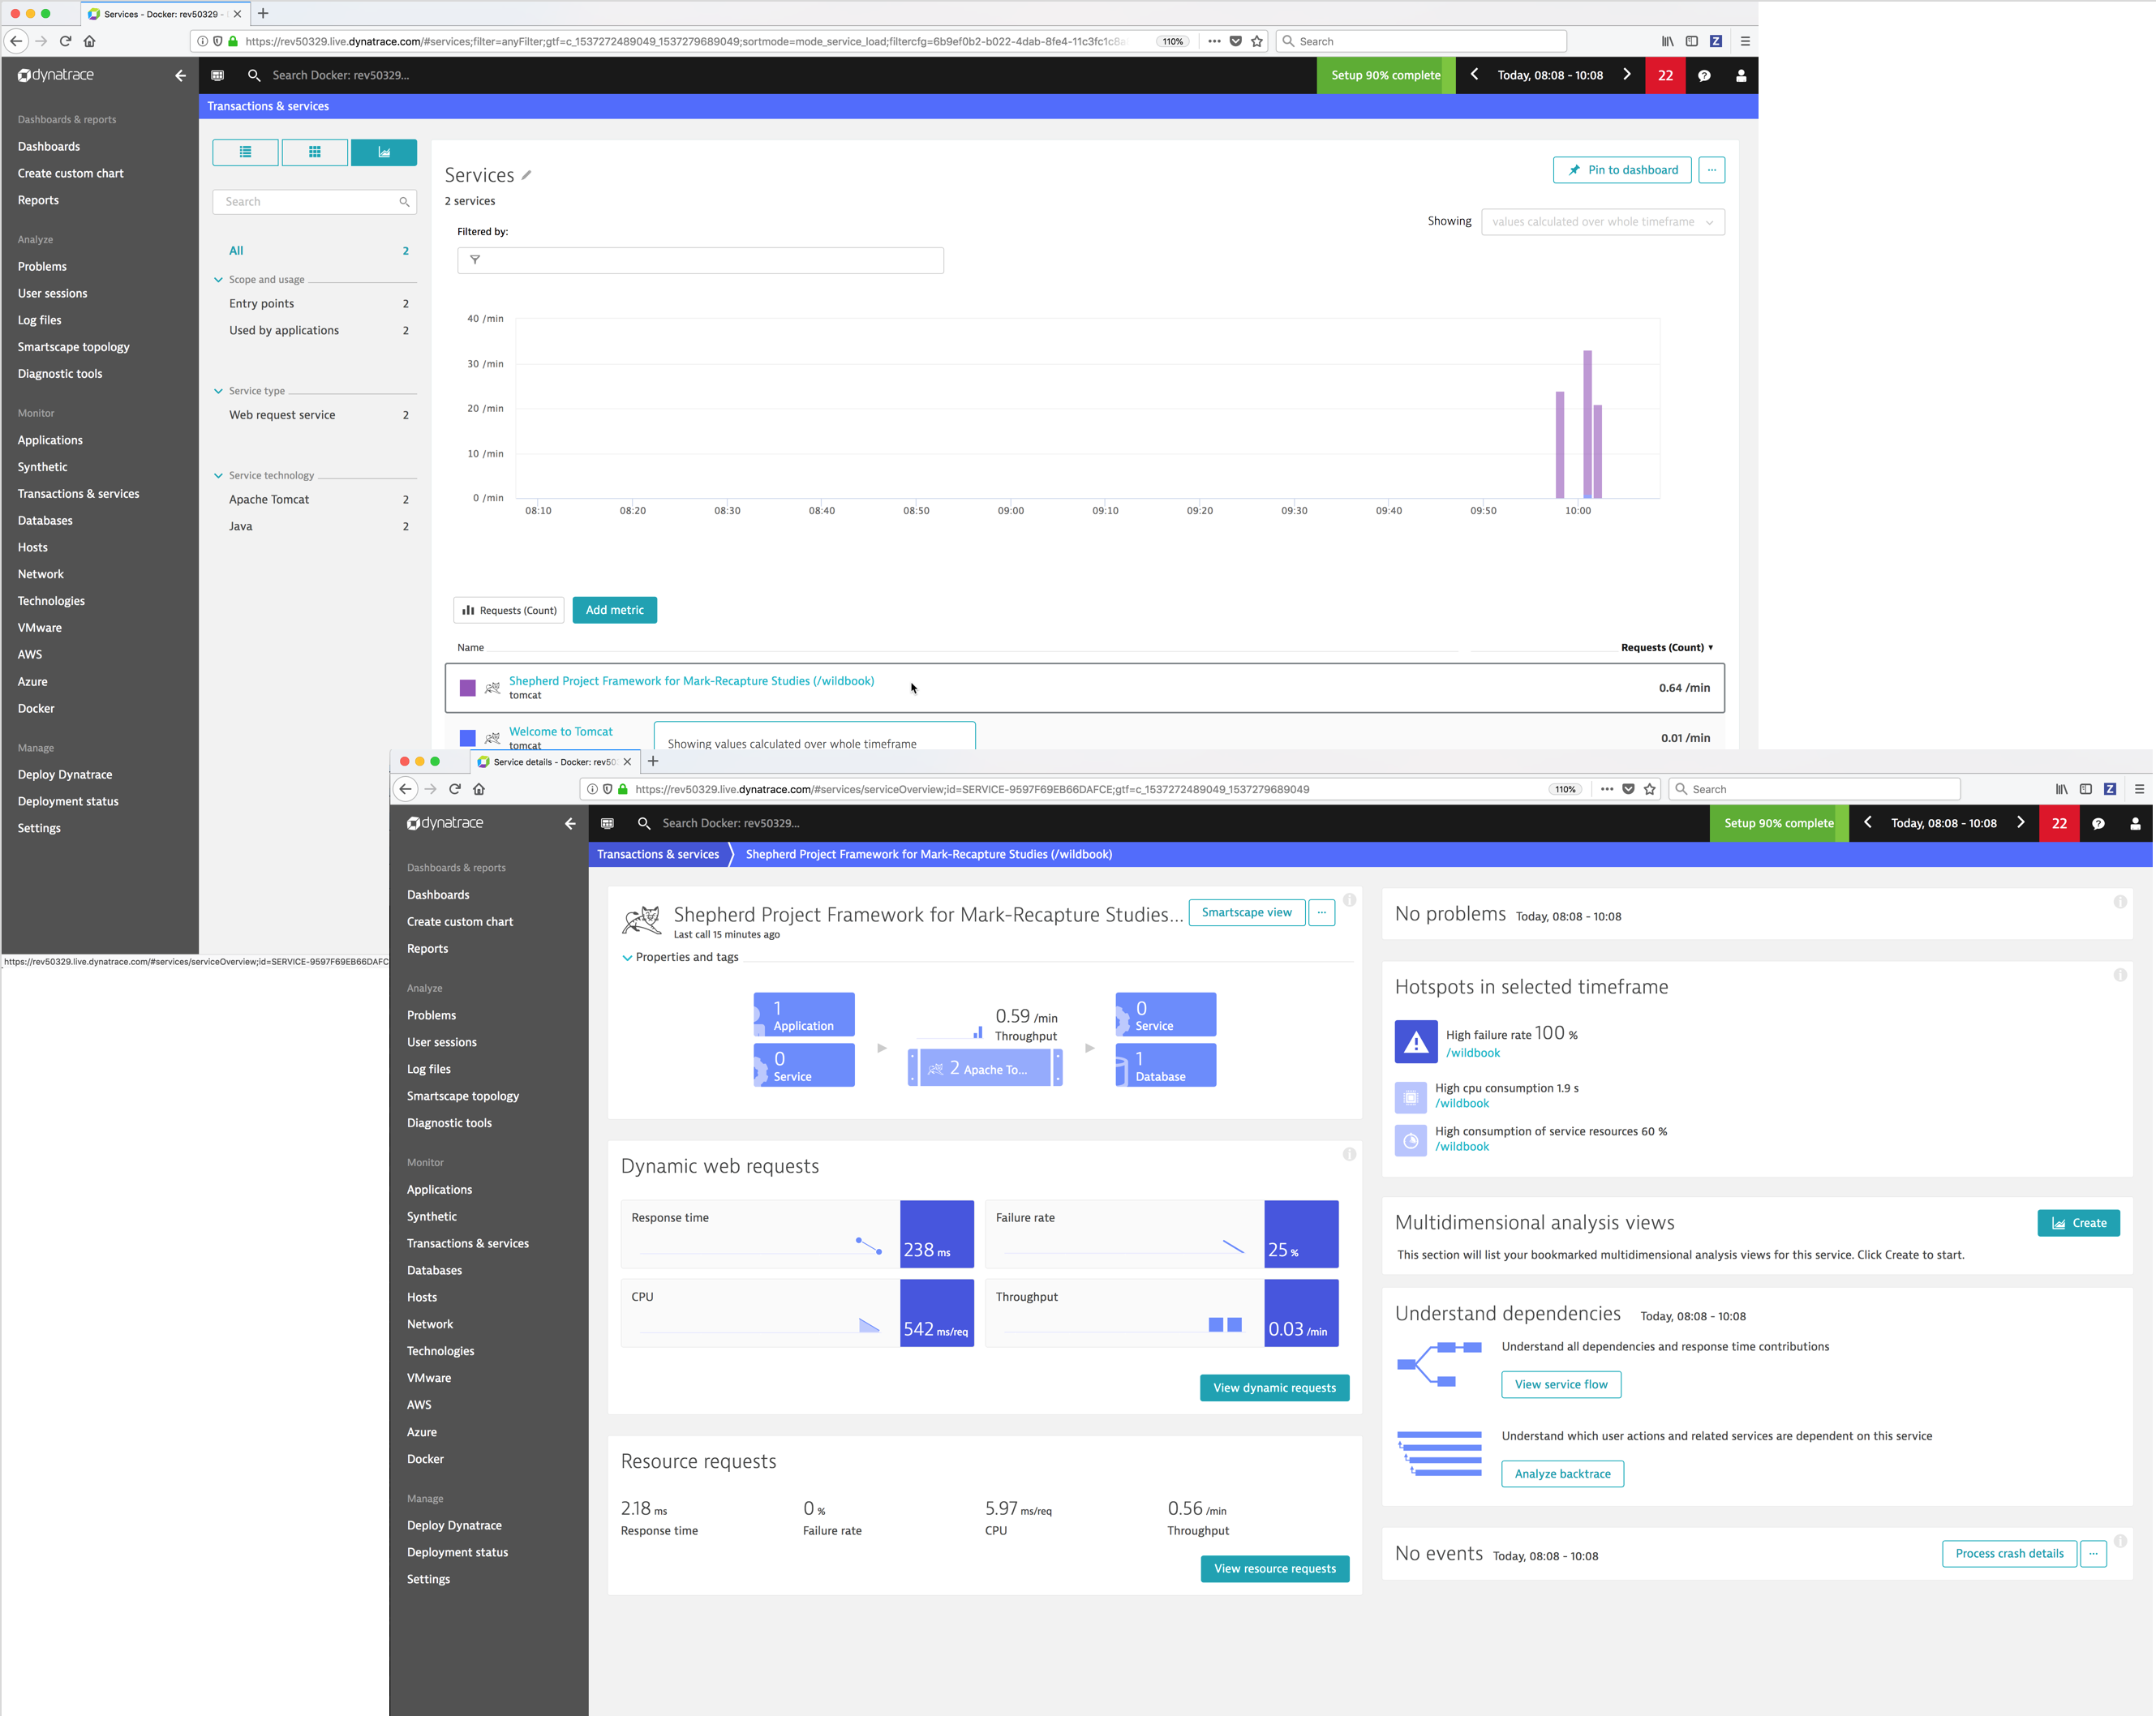
- Transactions & services - Dynatrace captures every transaction from all applications and services.
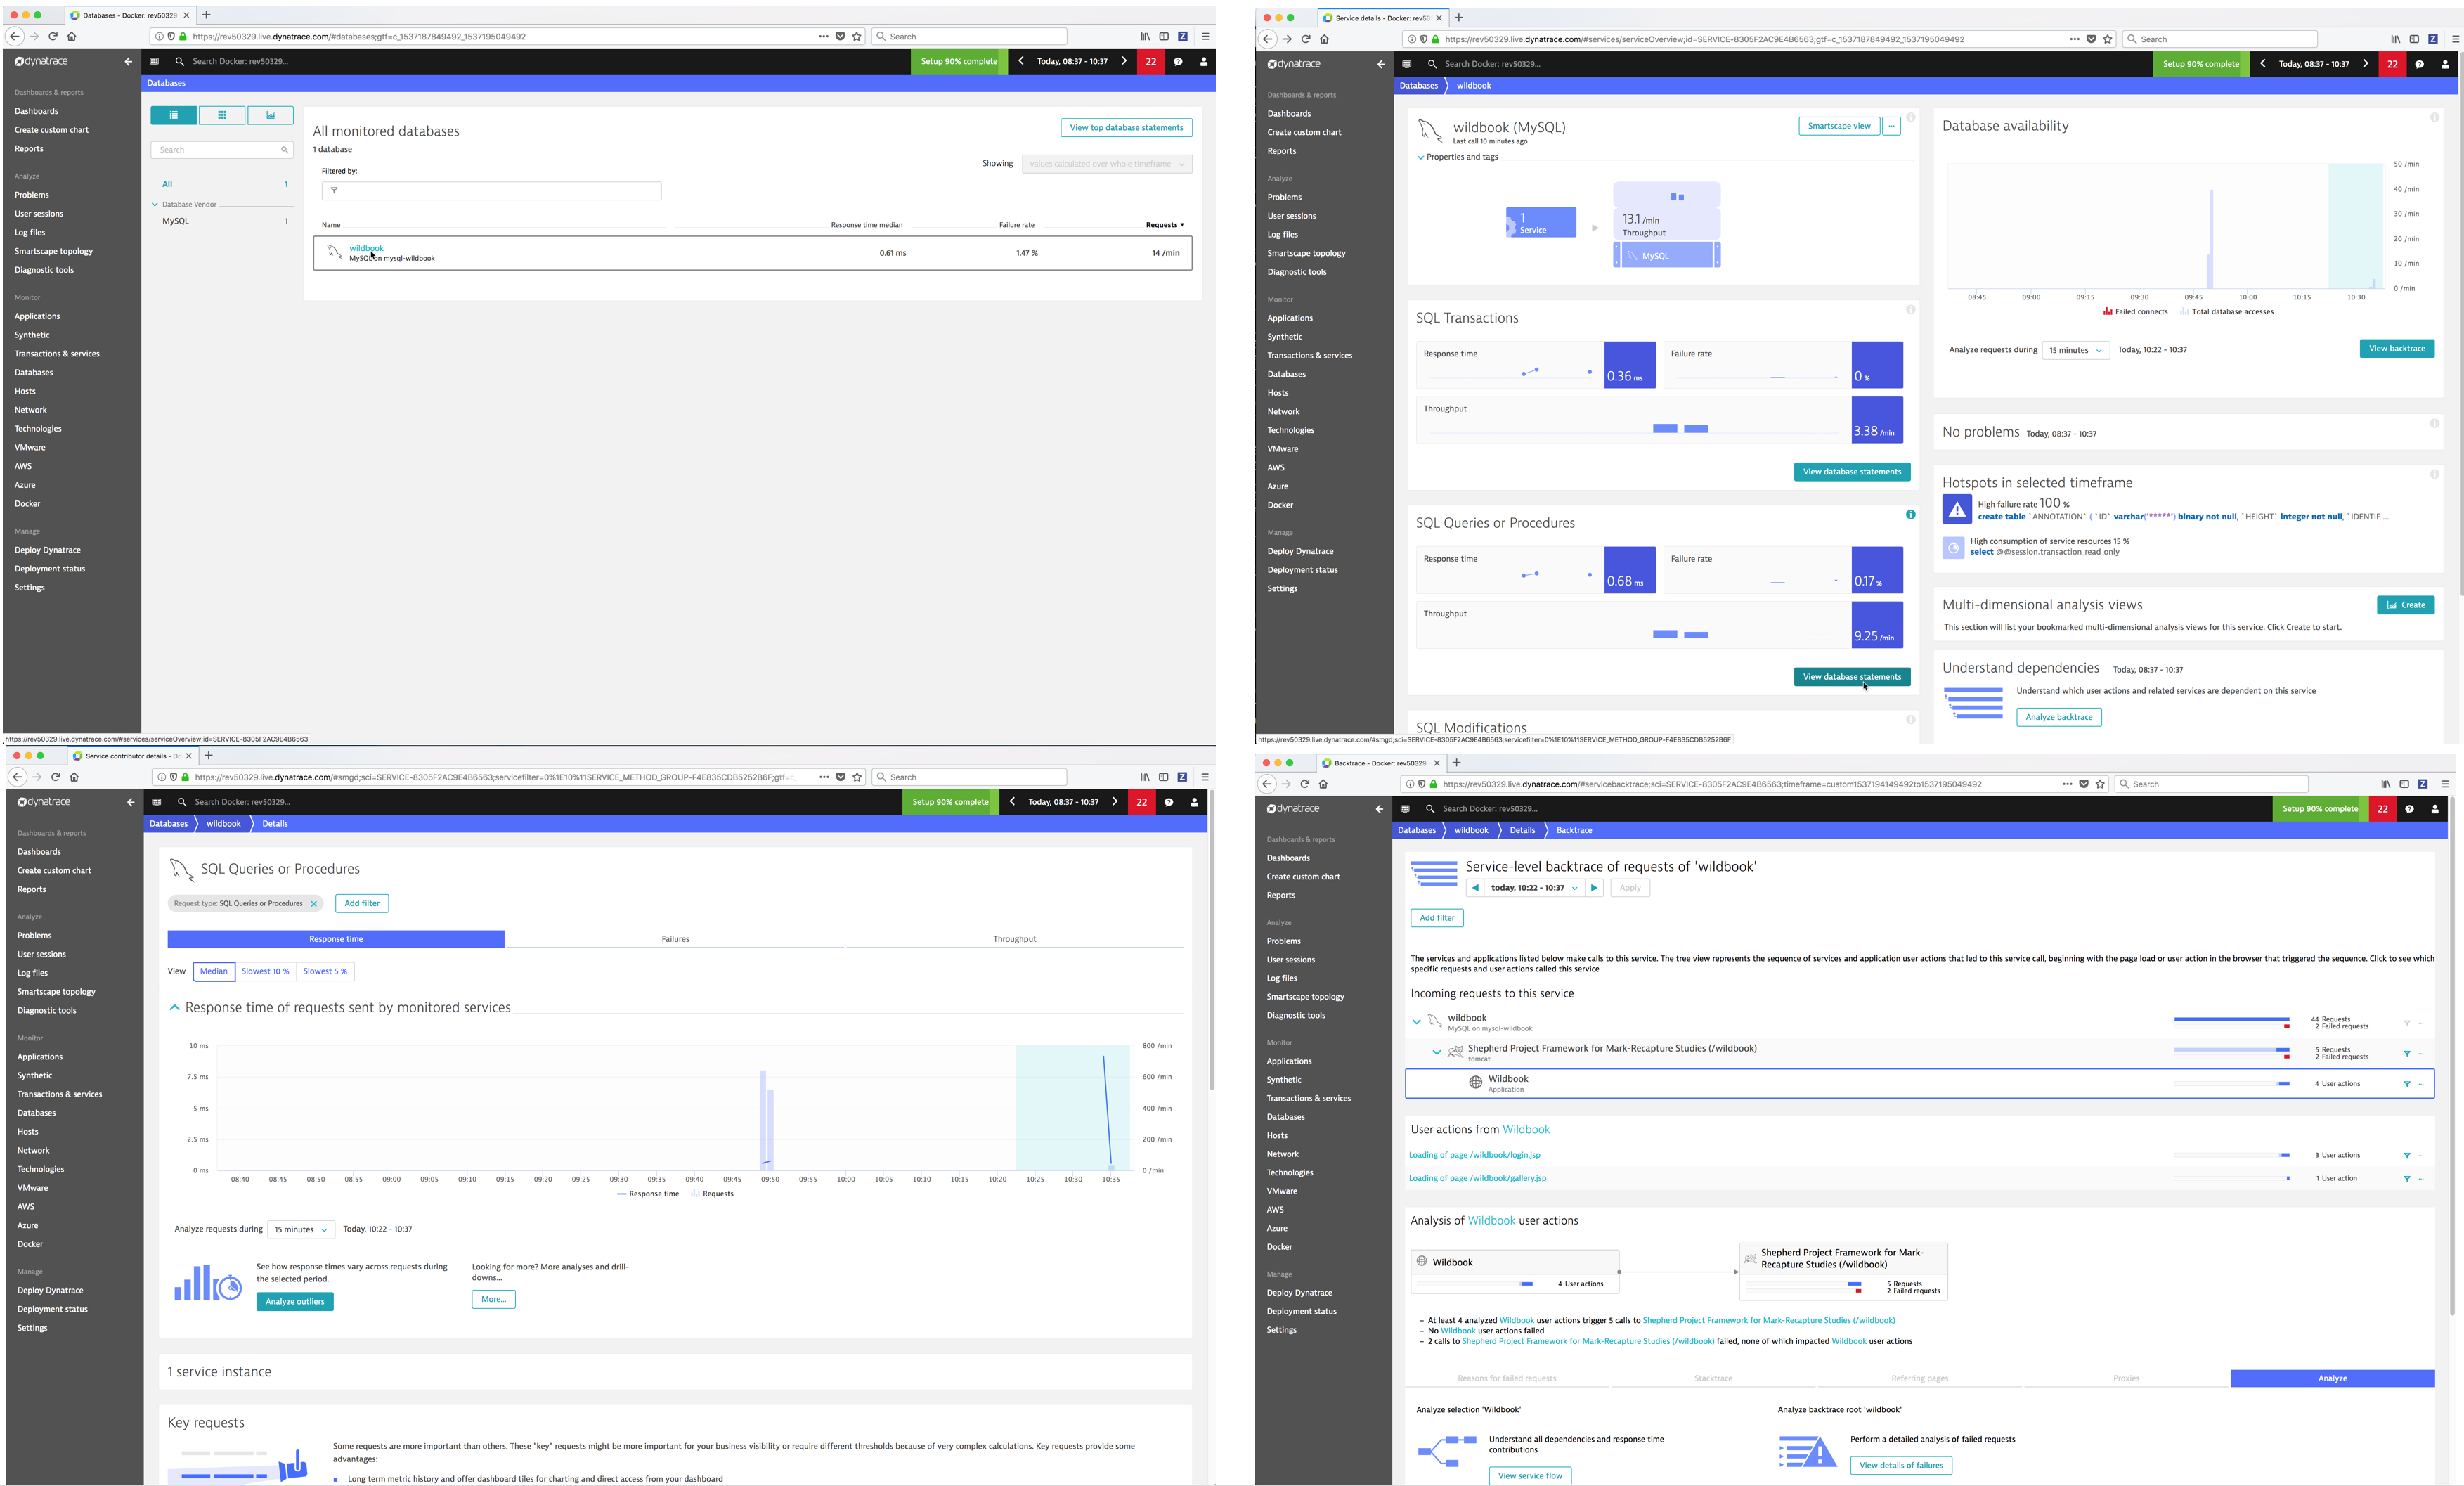
- Databases - Dynatrace detects and monitors all databases, captures every database statement and displays detailed health metrics for each statement.
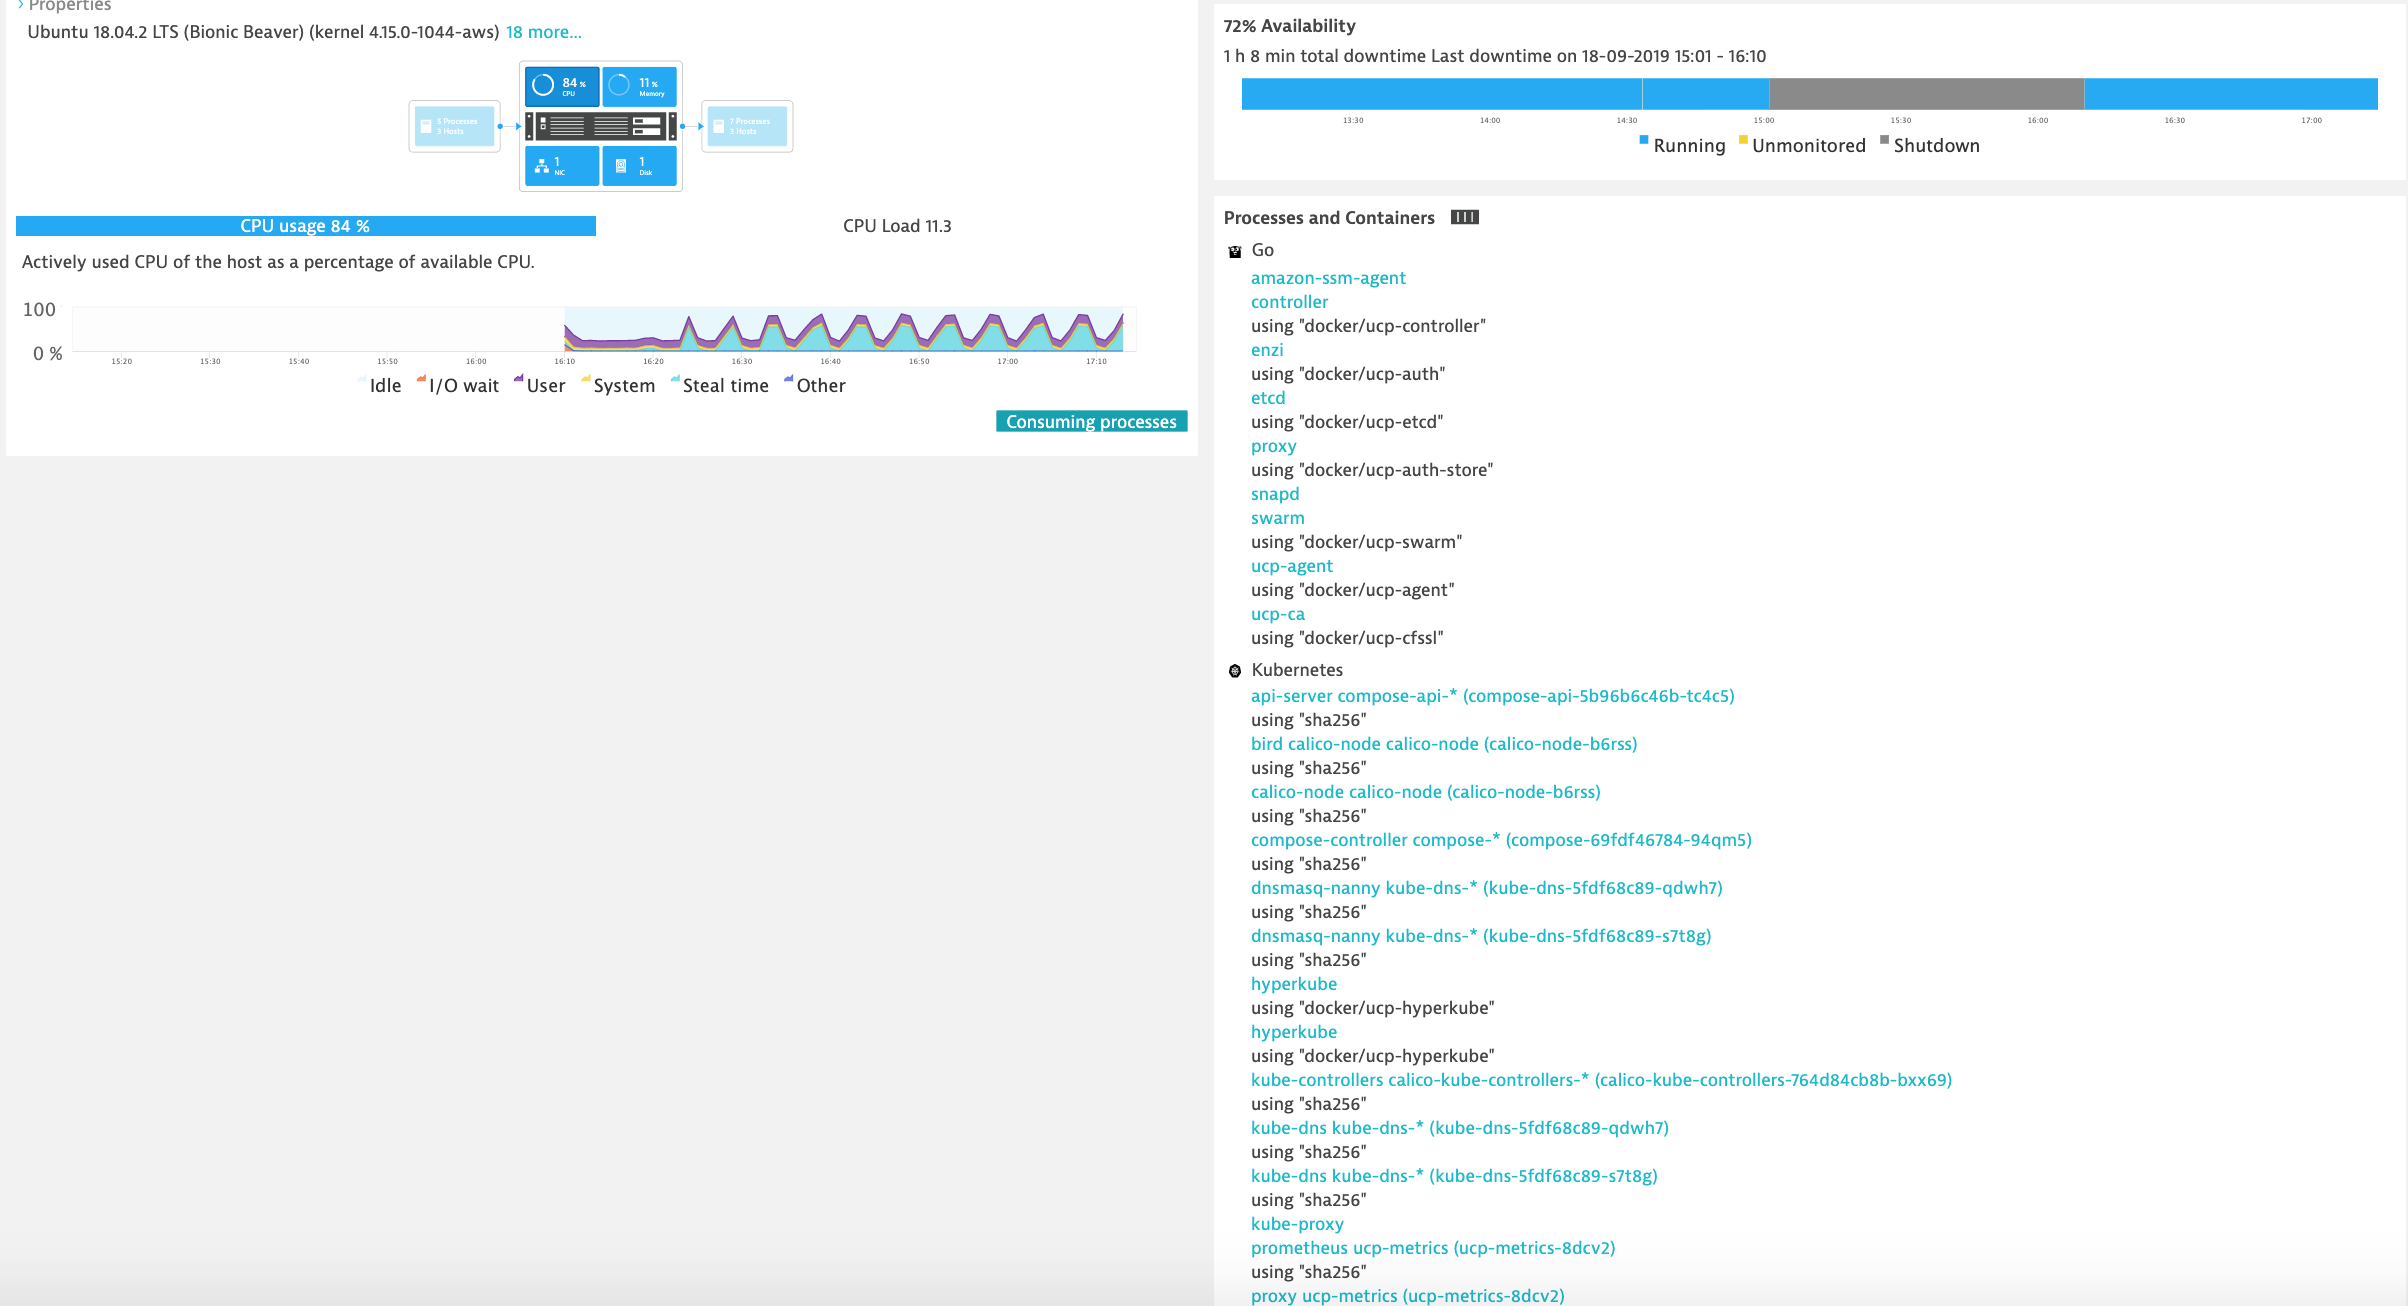
- Hosts - Dynatrace automatically monitors the state of a host machine along with the running processes and containers.
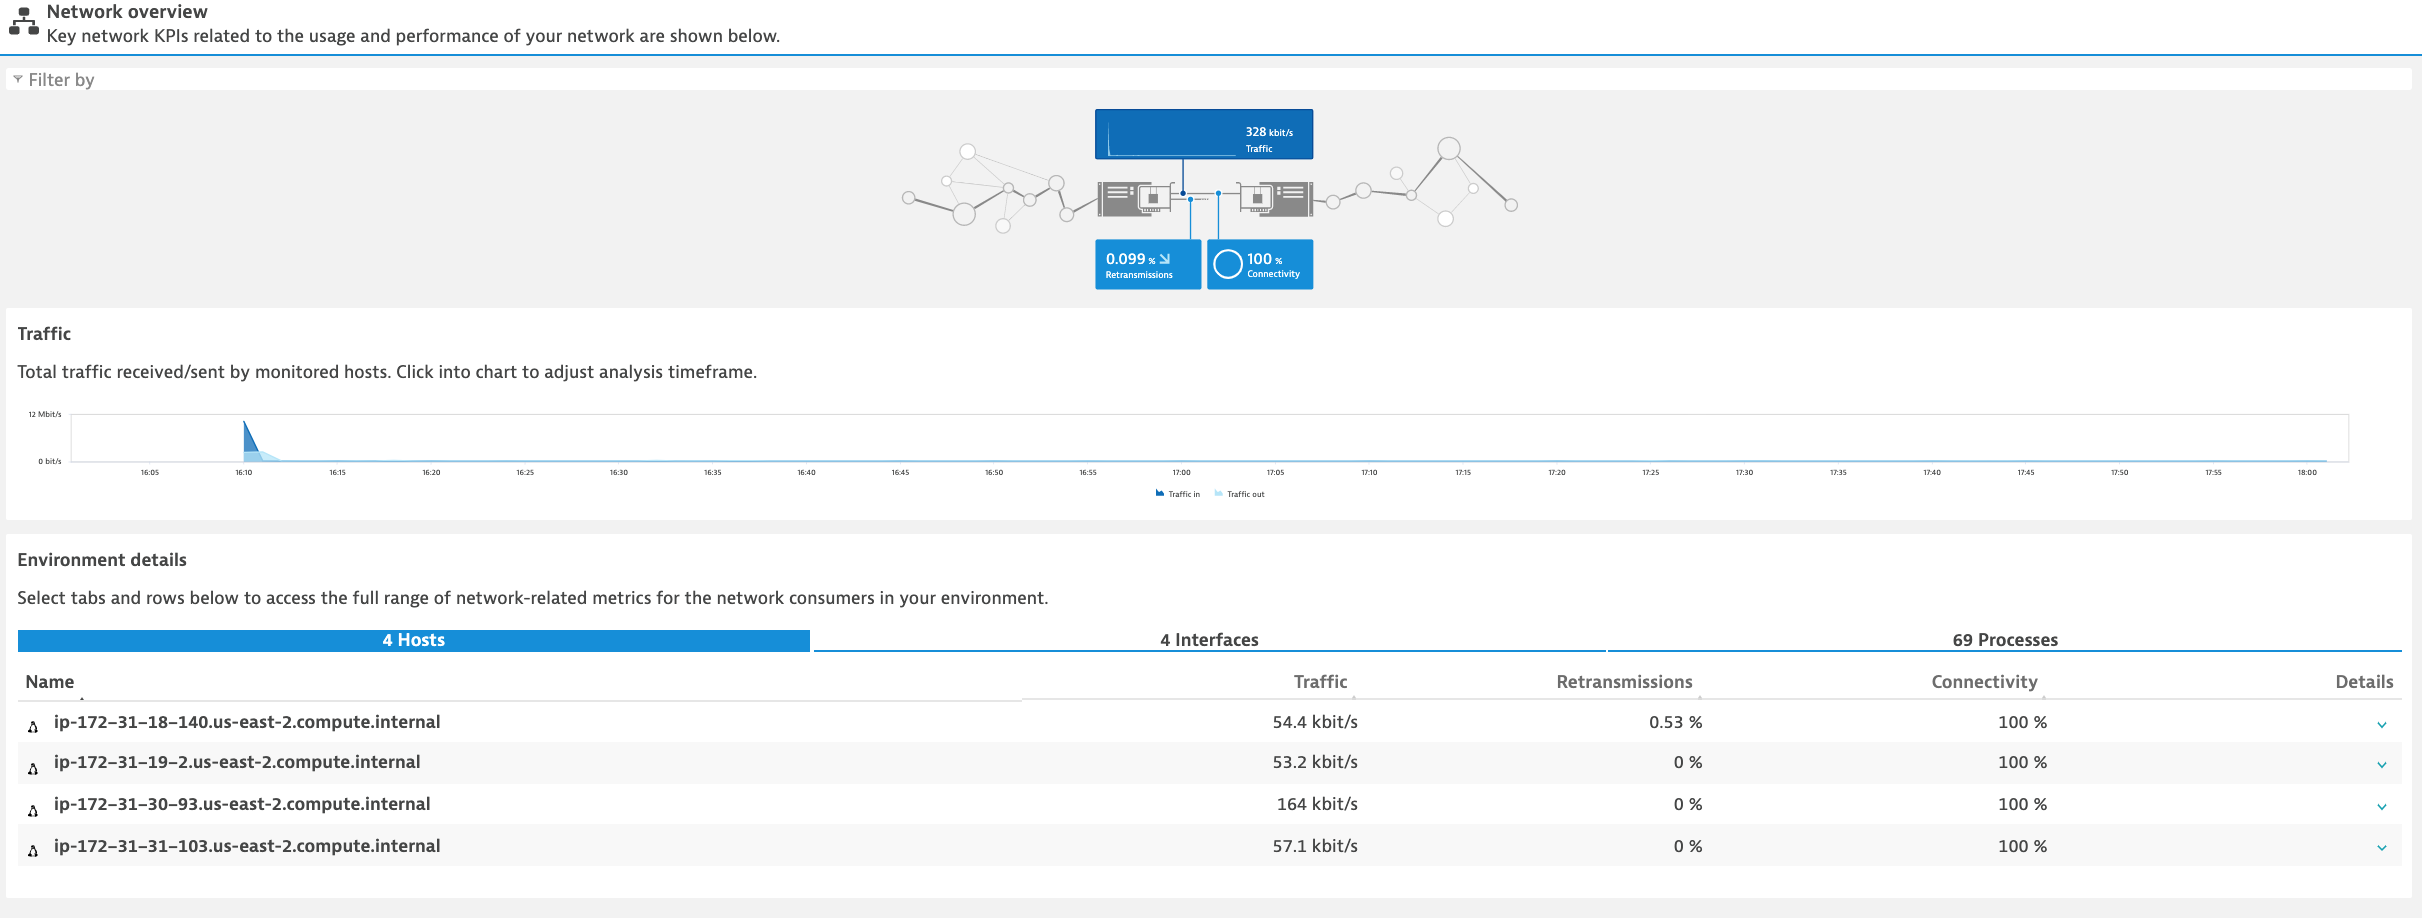
- Network - Dynatrace monitors and visualizes process-specific network performance metrics like requests and retransmissions to proactively identify connection issues.
- Technologies - Dynatrace detects and monitors over 120 technologies (clouds, applications, databases, web, integrations, etc.)
- VMware - Dynatrace monitors and visualizes your VMware environments to understand the relationships between components such as ESXi hosts and your vCenter platform as a whole.
- AWS - Dynatrace monitors and visualizes services running in the Amazon Web Services Cloud.
- Azure - Dynatrace monitors and visualizes services running in the Microsoft Azure Cloud.
- Docker - Dynatrace offers full-featured Docker monitoring and provides you with a complete picture of your Dockerized environments.
Manage
- Deploy Dynatrace - Simple wizard to walk you through deploying the Dynatrace agent.
- Deployment status - Display status of the deployed Dynatrace agents.
- Settings - Configure Dynatrace monitoring settings from the Dynatrace Web UI.
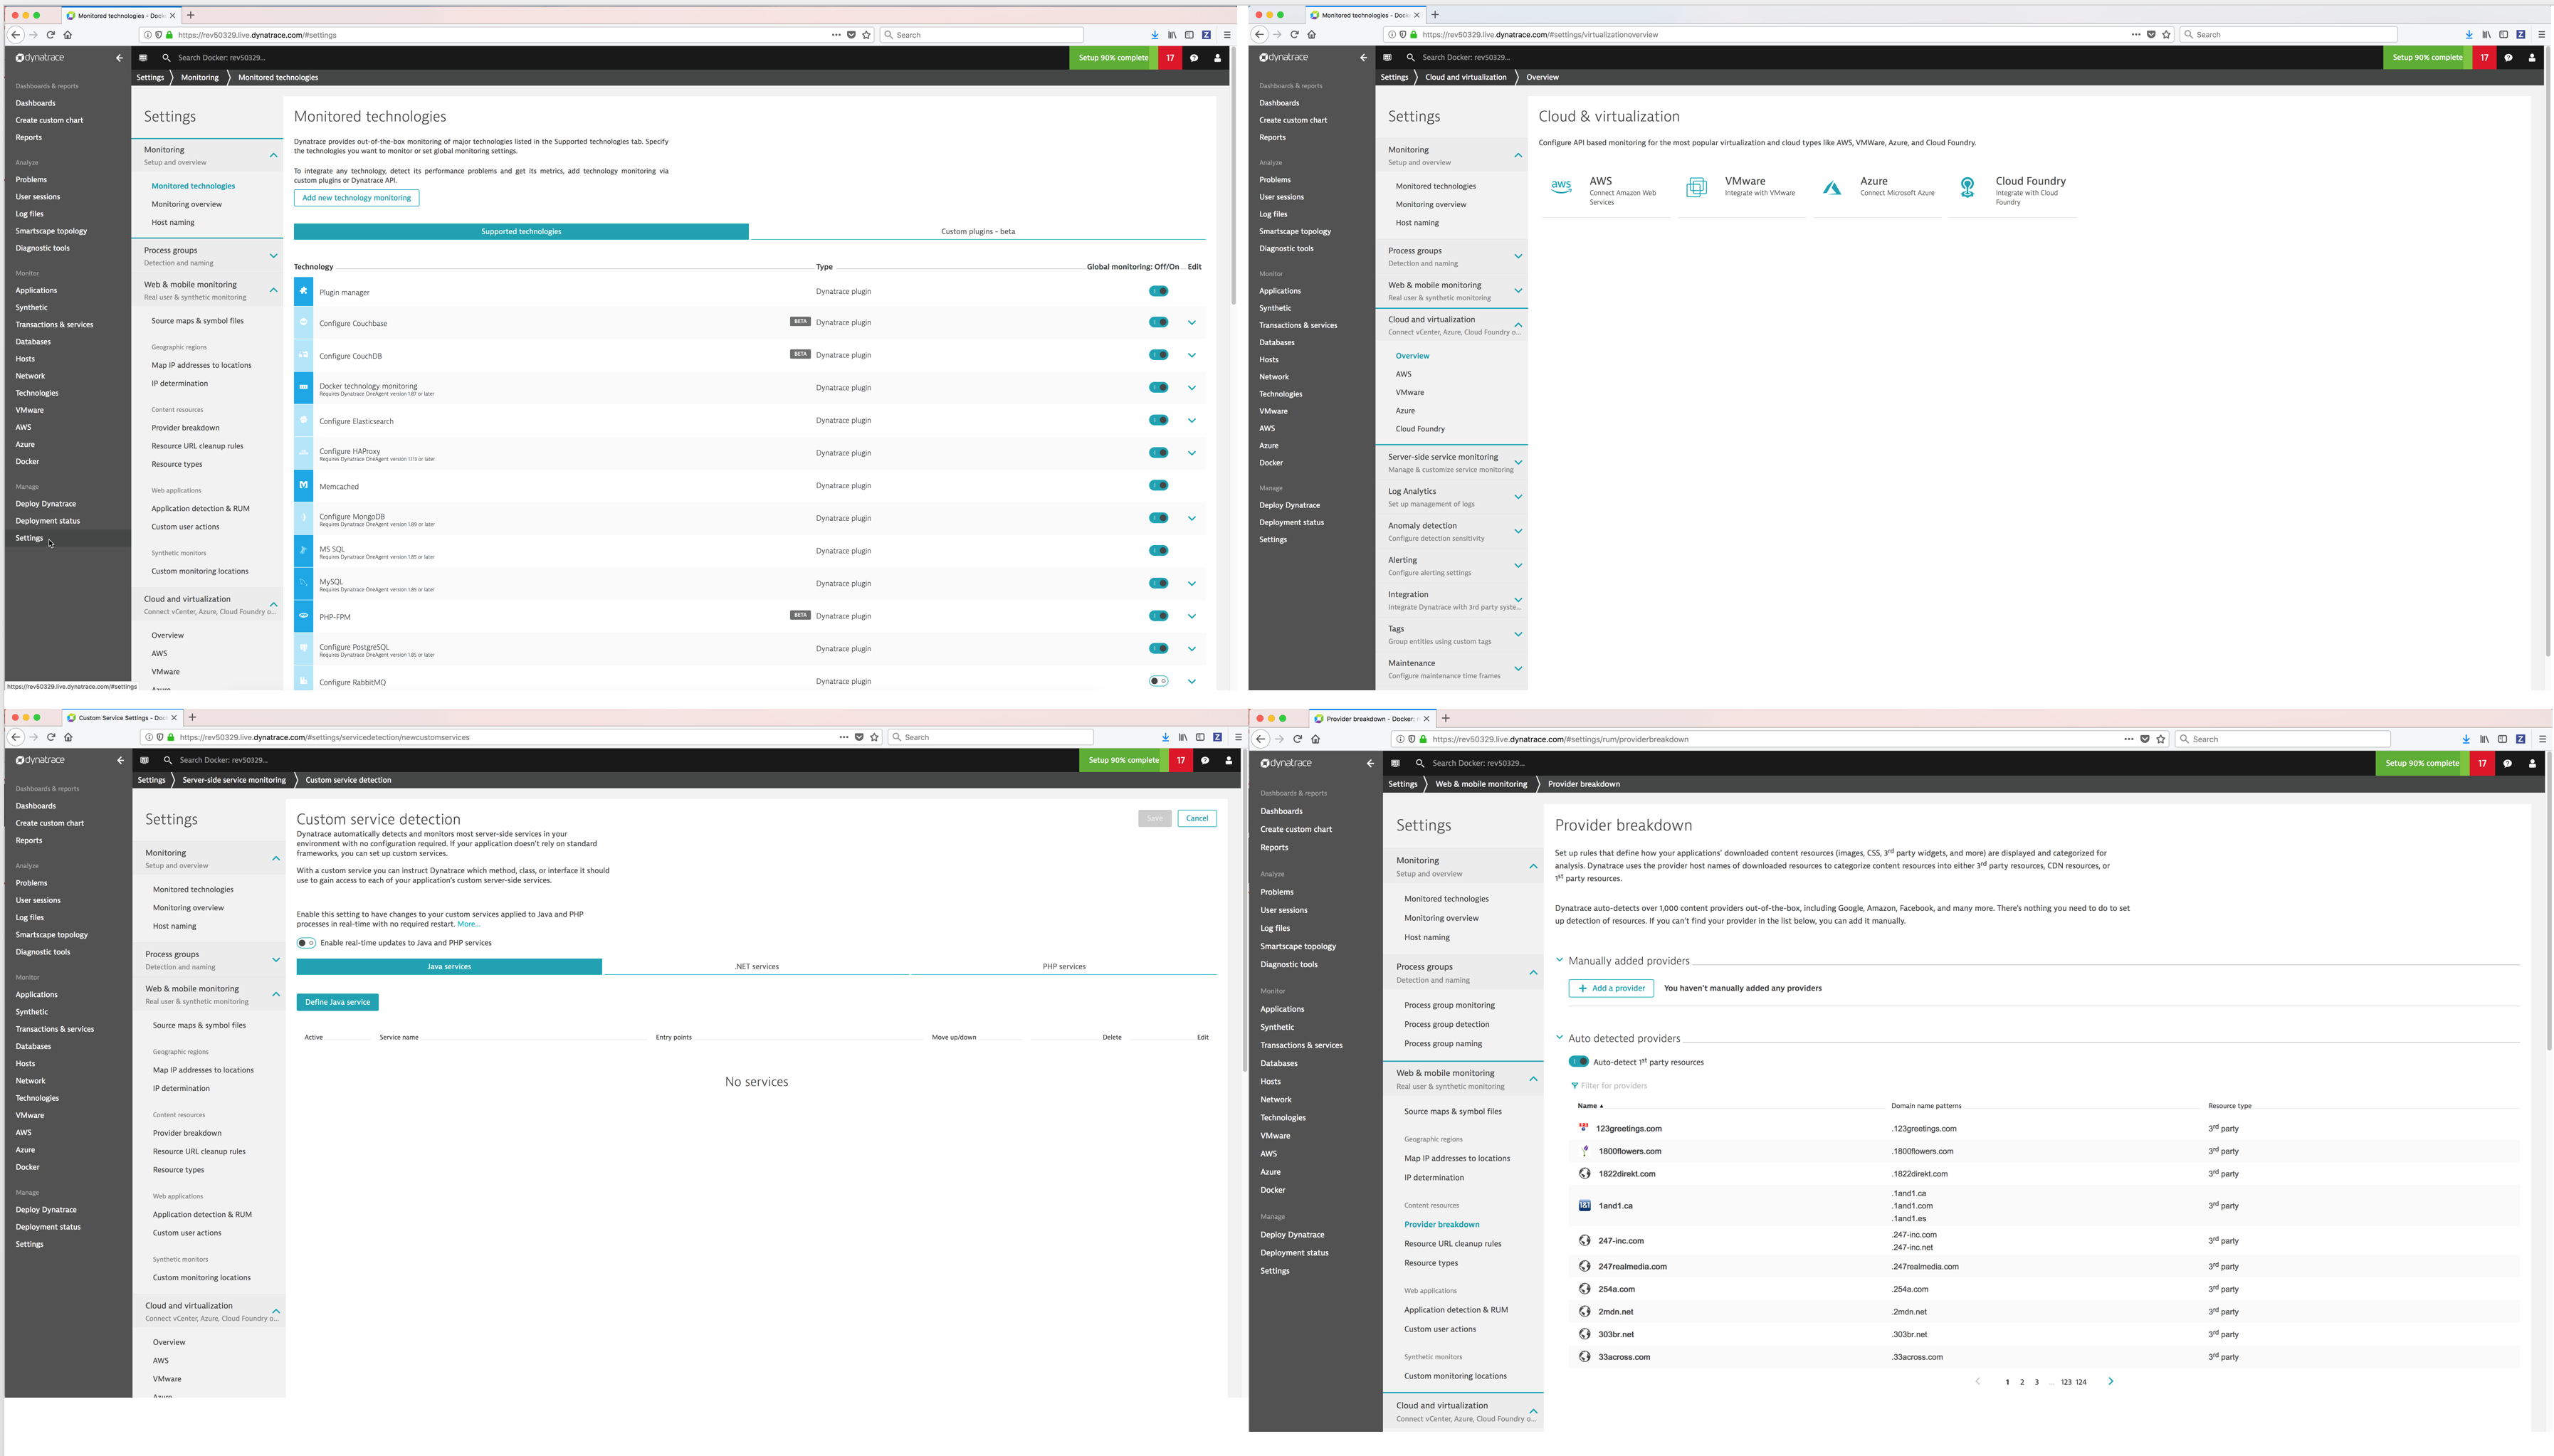
Settings
You can configure and customize Dynatrace to monitor technologies and clouds and customize other settings.
Dashboards
You can monitor your infrastructure and applications using out of box dashboards and create your own.
Problems
Dynatrace automatically detects performance anomalies and generates “problems” which you can view. You can display detailed information on a problem including the services impacted and the root cause.
Dynatrace Smartscape® Topology
Dynatrace automatically discovers your full technology stack and detects the dependencies between websites, applications, services, processes, hosts, networks, and cloud infrastructure within minutes. Your application topology is then visualized in an interactive infographic.
See also
Refer to Dynatrace Supported technologies for a complete updated list of the technologies it detects and supports.
Diagnostic Tools
Dynatrace provides built-in diagnostic tools for detecting and analyzing performance problems in your application environment.
Monitor Transactions & Services
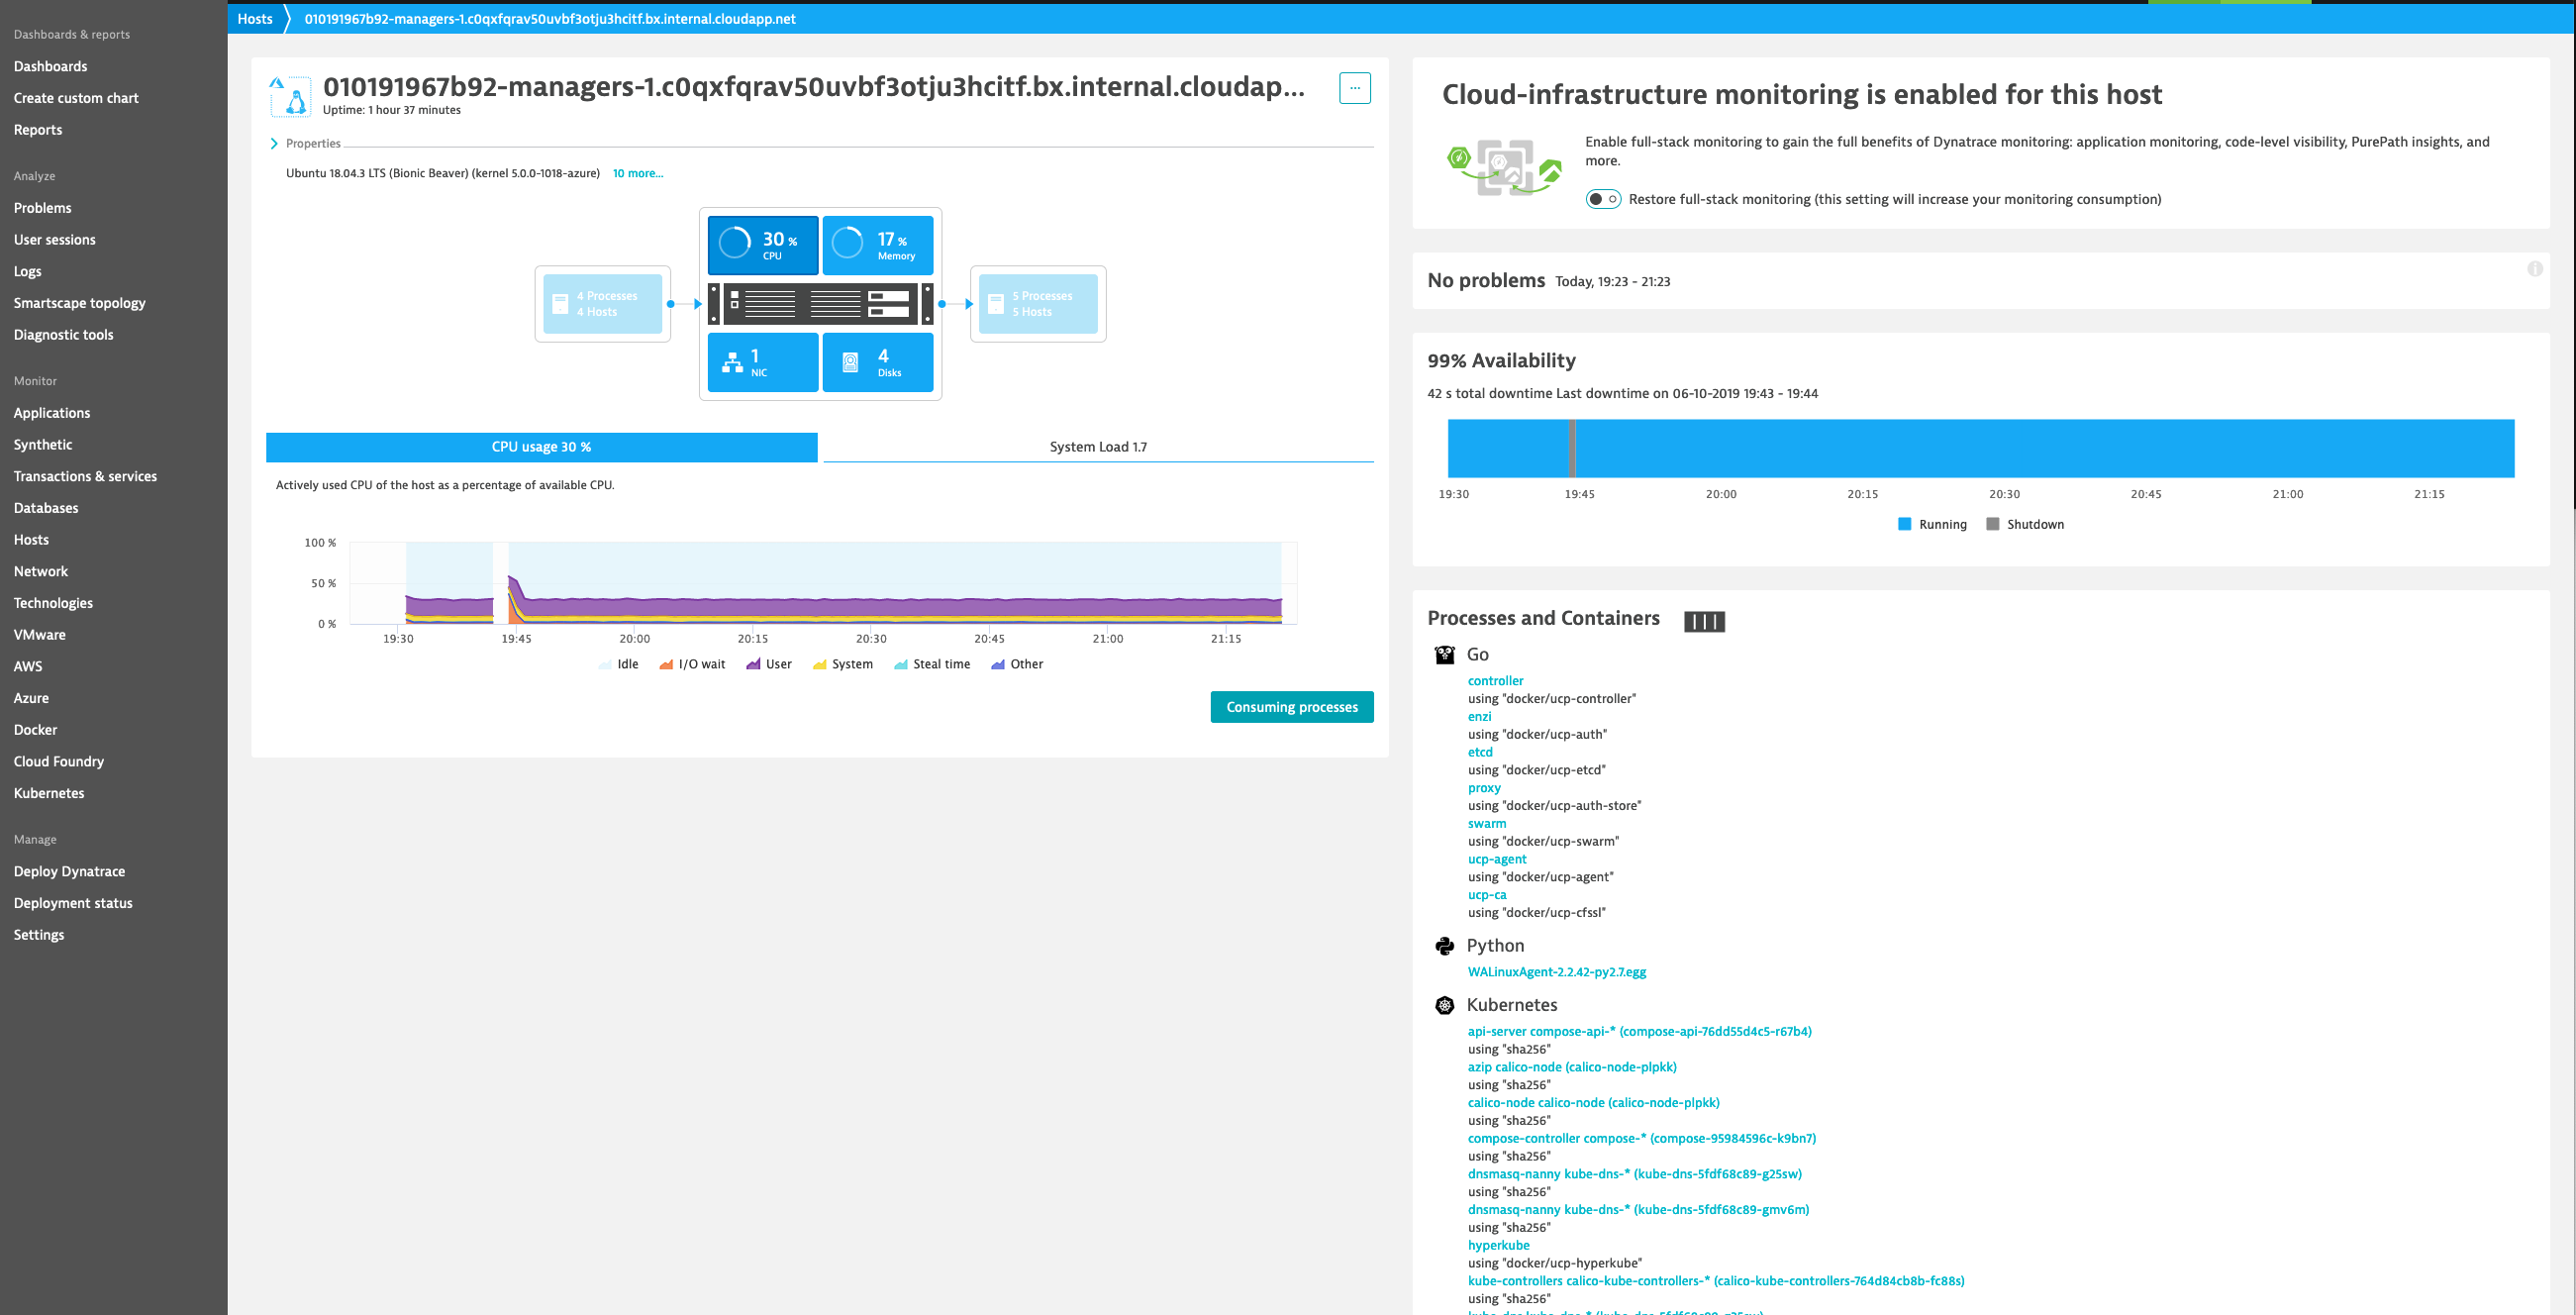
Monitor Hosts
You can display an overview of all the hosts and drill down to see the details of a specific host.
Monitor Clouds and Virtualization types
- AWS
- VMware
- Azure
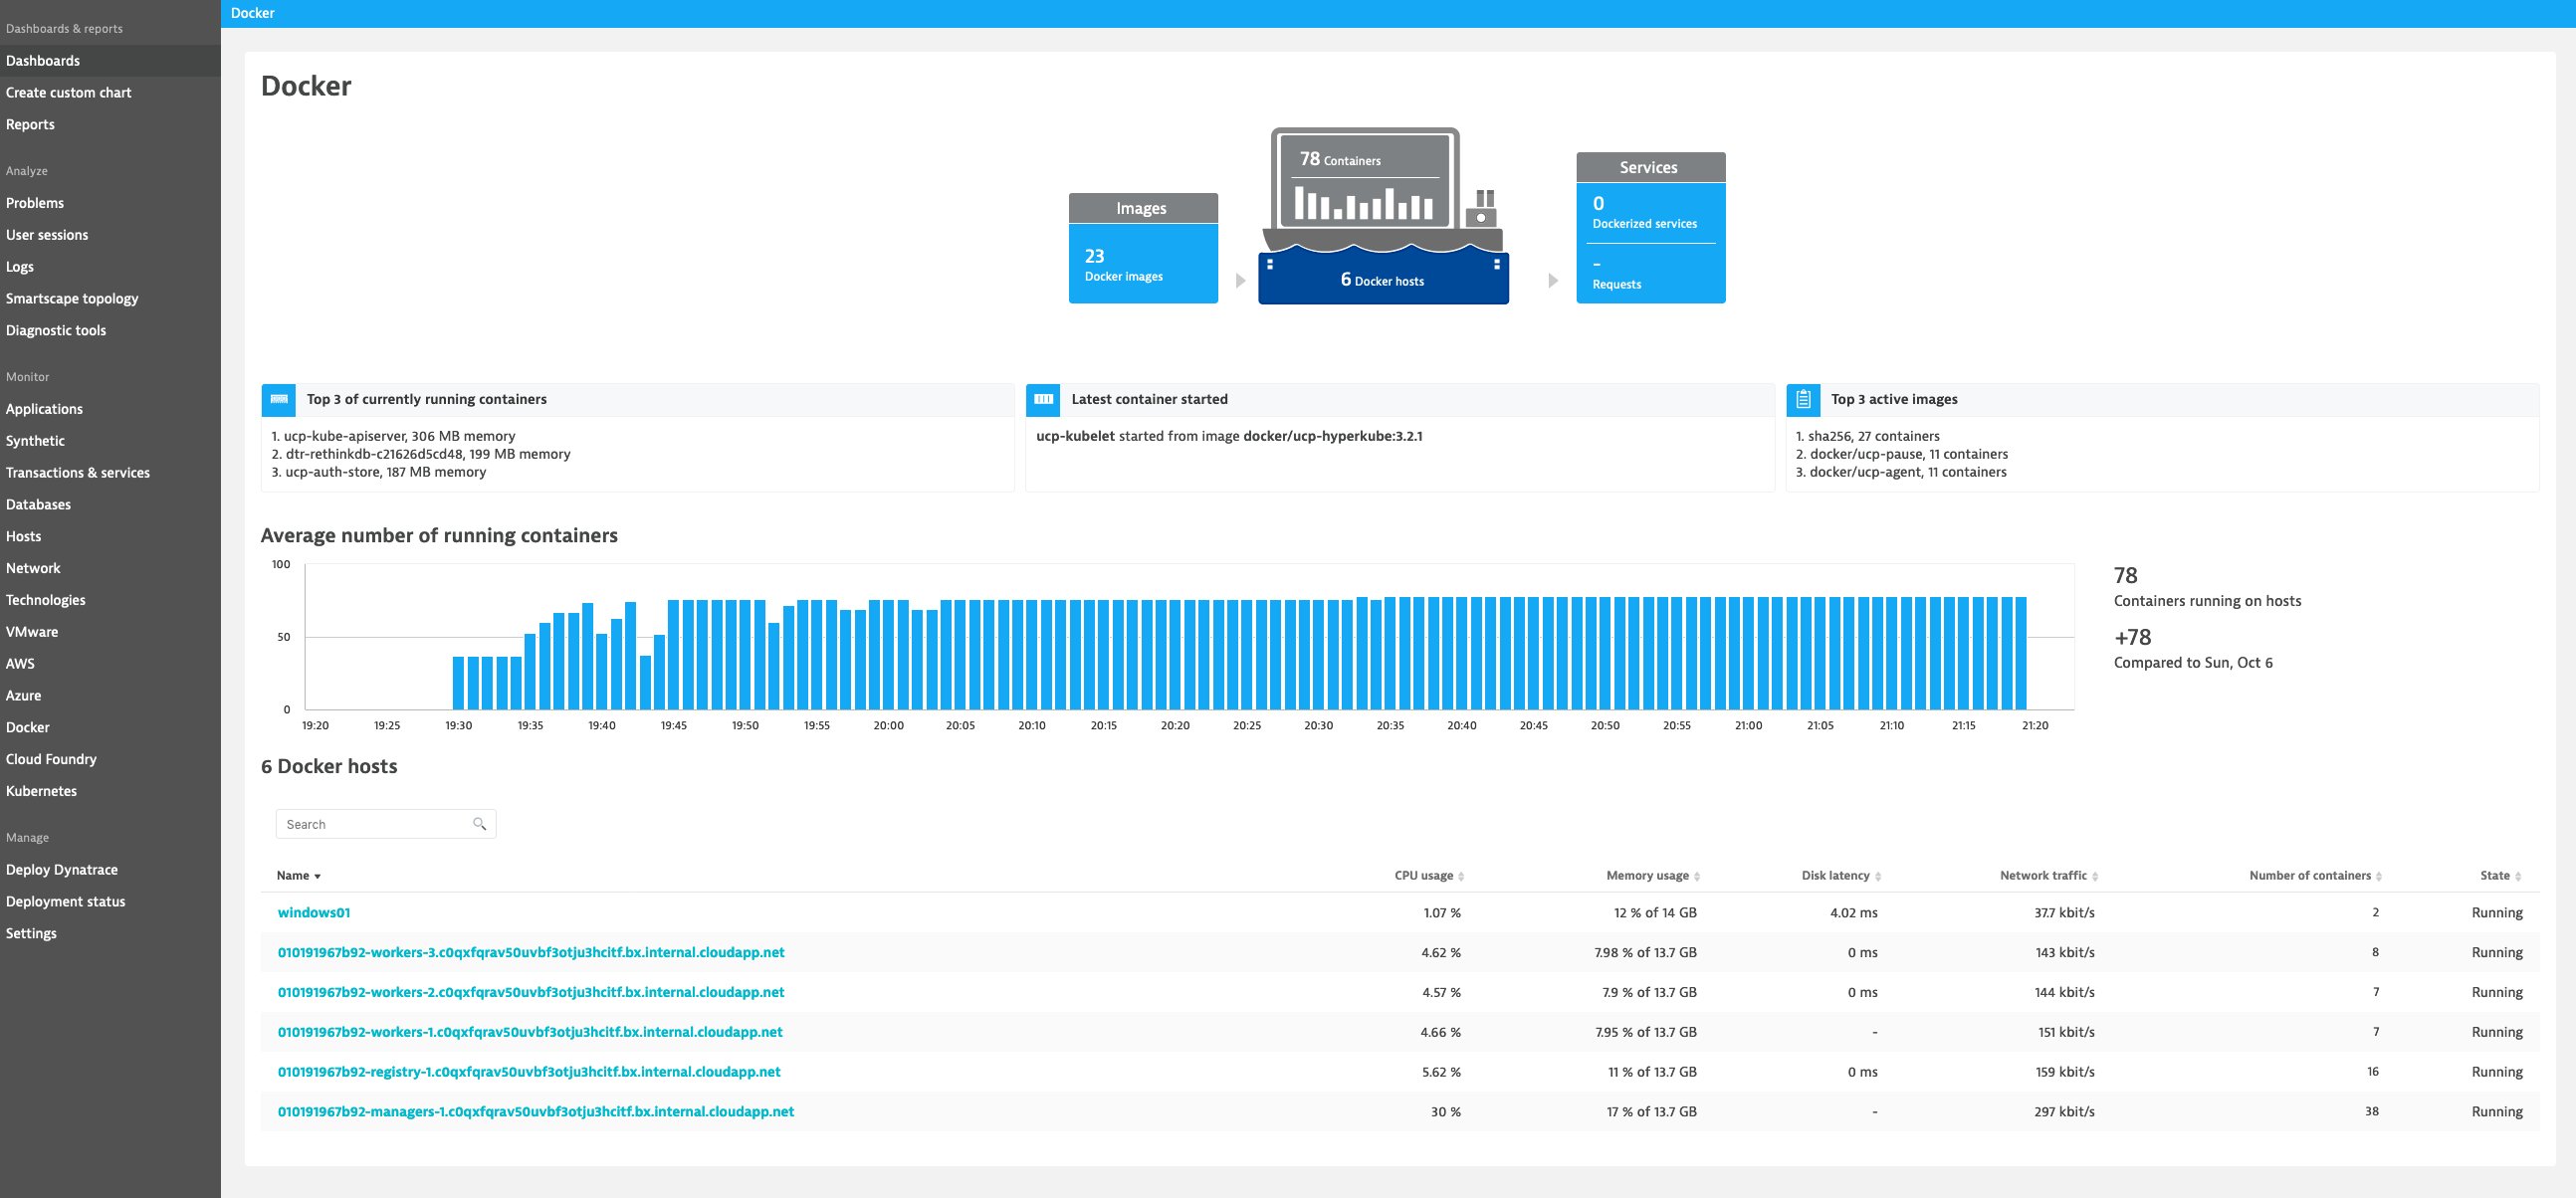
Monitor Docker
Dynatrace provides you with a complete picture of your Dockerized environments. Dynatrace provides container-centric monitoring perspectives on Docker images, services, and nodes.
Monitor Docker nodes
You can display an overview of all Docker nodes and you can drill down to a specific Docker node to monitor CPU, Memory, Network and Disk utilization.
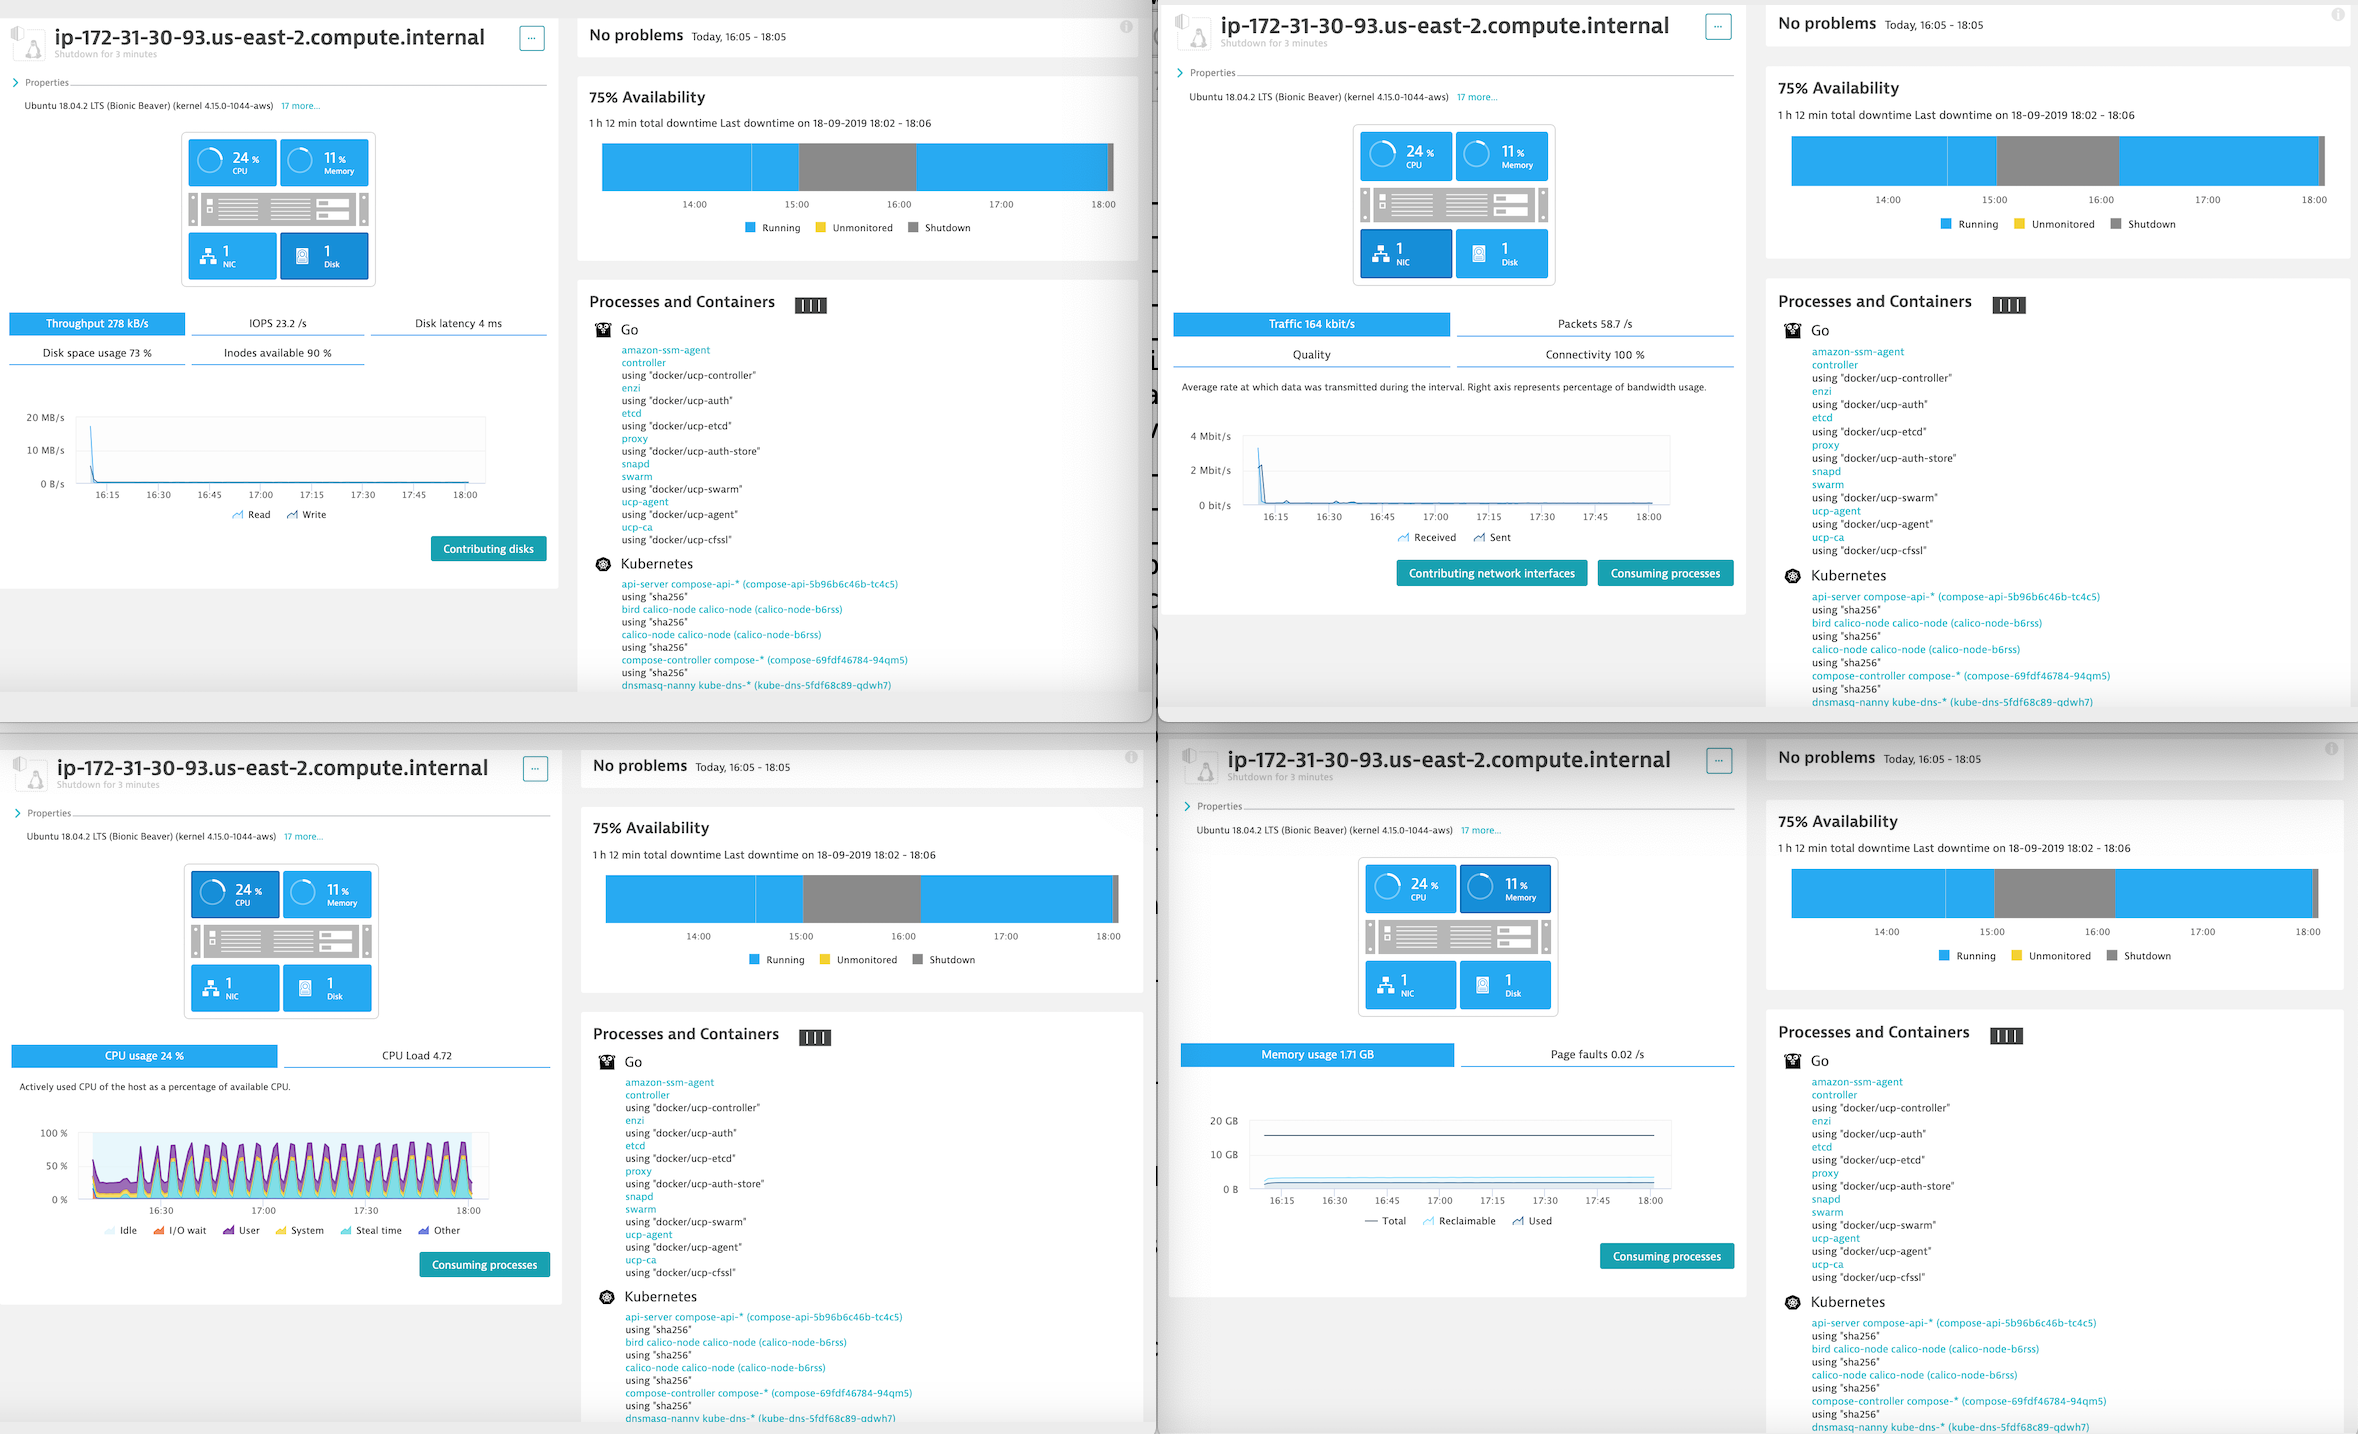
You can drill down to a specific Docker container.
Troubleshooting
See also
Refer to the following links for additional information:
Storage
Almost nothing is as important as your data. This continues to be the case when it comes to container platforms. The ability for a container orchestrator to schedule containers anywhere inside your infrastructure brings a whole new set of challenges but our Mirantis partners have designed container storage solutions that will help your business take advantage of modern container platforms while providing the necessary data persistence capabilities.
Portworx Storage Implementation Guide for Docker Enterprise
Overview
Portworx is one of the leading Software-Defined Storage solutions for container deployments. This document is a walkthrough of installing Portworx on a Docker Enterprise 3.0 install for Kubernetes workloads.
Prerequisites
The following prerequisites are required to successfully complete this guide:
- Docker Enterprise 3.0 installed with at least two Kubernetes worker nodes
- A license for, or trial of Portworx Enterprise
- A workstation with the kubectl command bound to your Docker Enterprise install. (This can be the installation’s master node)
Installation and Configuration
Add an unmounted disk of 50Gb min to each worker node. You should be able to see the unmounted disk with the following command once you log in to each worker node
NAME    MAJ:MIN RM  SIZE RO TYPE MOUNTPOINT
loop0     7:0    0 88.5M  1 loop /snap/core/7270
loop1     7:1    0   18M  1 loop /snap/amazon-ssm-agent/1455
loop2     7:2    0 10.1M  1 loop /snap/kubectl/1139
loop3     7:3    0 88.7M  1 loop /snap/core/7396
xvda    202:0    0   20G  0 disk
└─xvda1 202:1    0   20G  0 part /
xvdb    202:16   0  100G  0 disk /var/lib/docker
xvdf    202:80   0  150G  0 disk
Confirm the Docker Enterprise version with the following command on your prepared workstation.
$ kubectl version --short | awk -Fv '/Server Version: / {print $3}'
1.14.3-docker-2
In this step, we will use Portworx’s online install wizard to create a Kubernetes YAML deployment definition.
In a web browser, navigate to http://install.portworx.com and enter the Docker version and select “Portworx hosted etcd” under the ETCD section, and click “Next.”
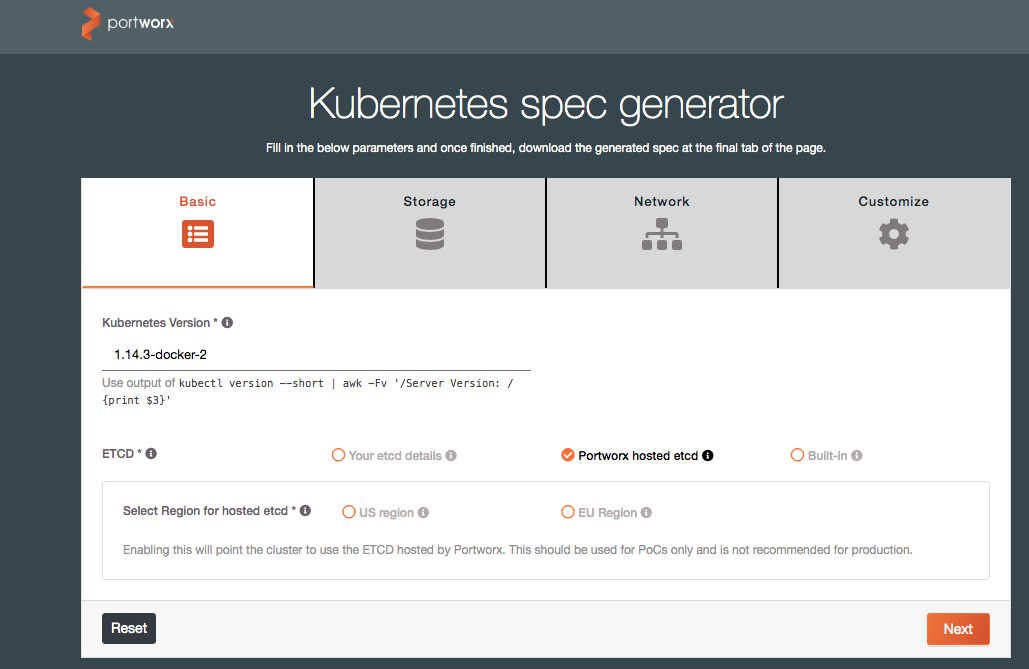
On the next page, select “OnPrem” and leave everything else default. Click “Next.”
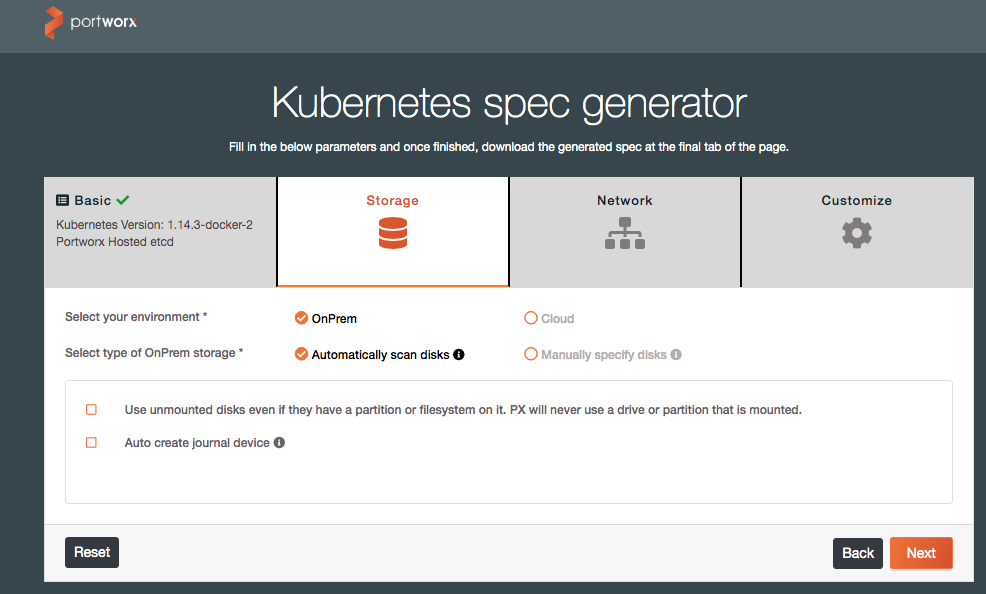
On the third page, leave everything default. Click “Next.”
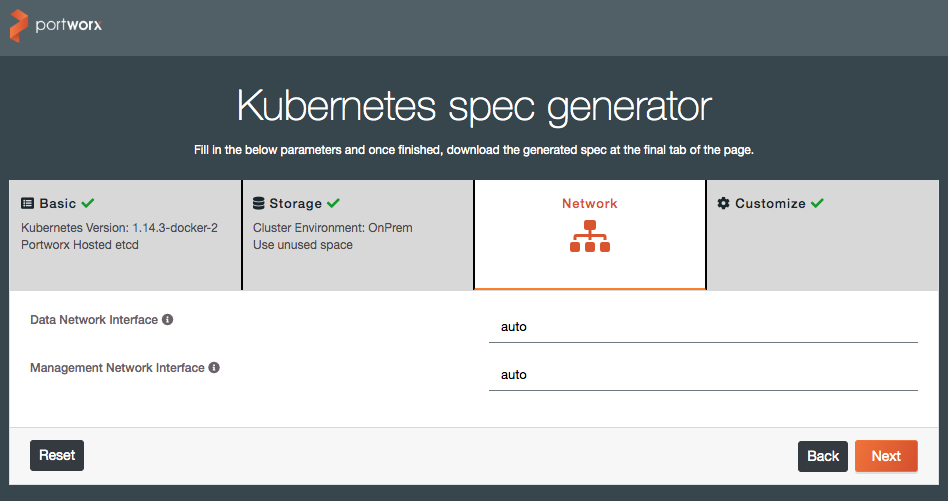
On the Customize page, select “None” in the Customize section. Click “Finish.”
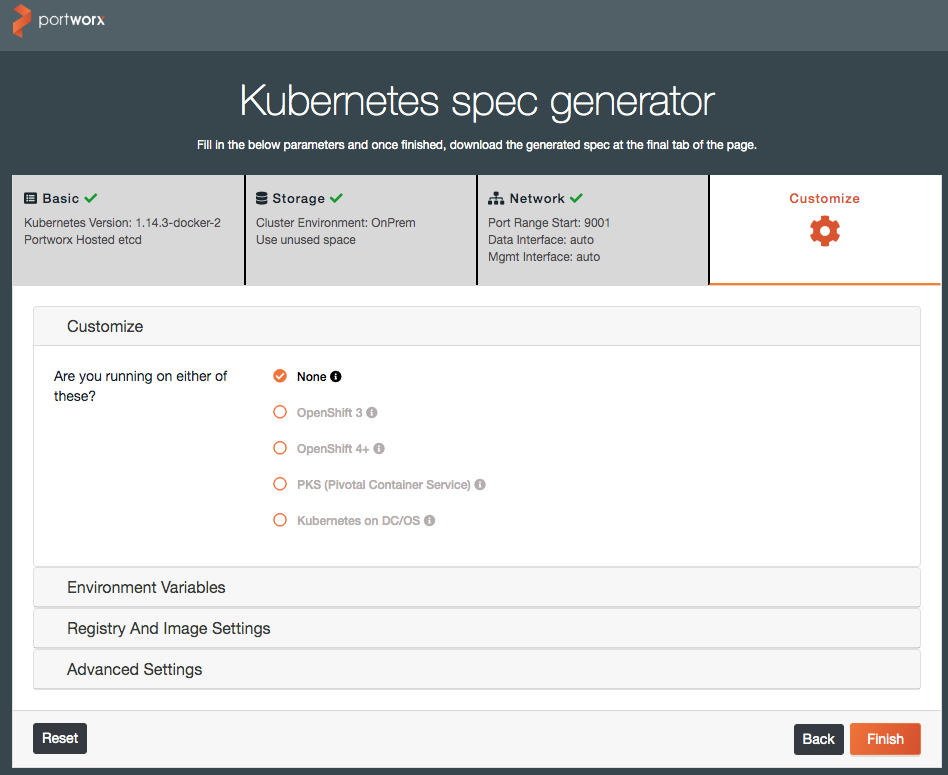
On the last screen, you can either copy the example command to run from your workstation, or download the YAML spec file for inspection and alterations.
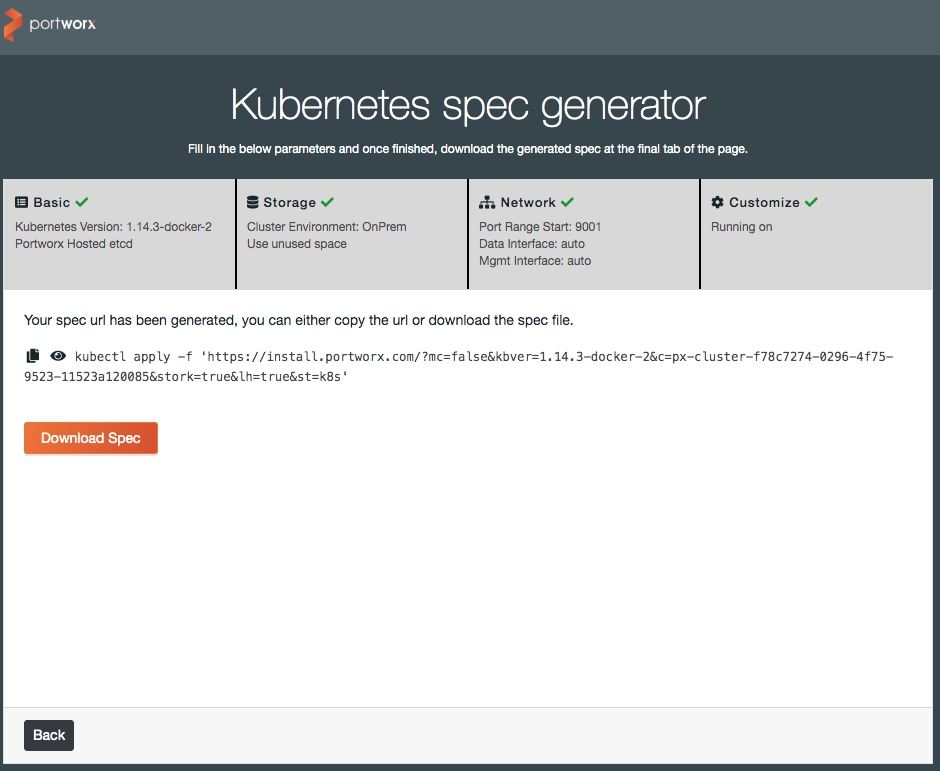
Note
If you use the spec file, open it up in a text editor and replace the
{UUID}value with a new UUID. You can generate one at a linux command prompt via:$ uuid 056d3c88-c3b0-11e9-9d56-ef363149603dThen apply the spec file in the usual way with the kubectl command:
$ kubectl apply -f spec.yaml
Monitoring and Troubleshooting
Portworx maintains documentation at https://docs.portworx.com.
They have sections with advice for monitoring and production use, as well as troubleshooting your installation.
Included here are a few commands that are useful in diagnosing installation issues:
Describe PX pods:
$ kubectl describe pods -l name=portworx -n kube-system
Get PX cluster status:
$ PX_POD=$(kubectl get pods -l name=portworx -n kube-system -o jsonpath='{.items[0].metadata.name}')
$ kubectl exec $PX_POD -n kube-system -- /opt/pwx/bin/pxctl status
Recent Portworx logs can be gathered by using this kubectl command:
$ kubectl logs -n kube-system -l name=portworx --tail=99999
If you have access to a particular node, you can use this journalctl command to get all Portworx logs:
$ journalctl -lu portworx*
See also
Refer to the following links for additional information:
VMware vSphere 6.7 CSI Implementation Guide for Docker Enterprise
Overview
Docker Solution Briefs enable you to integrate the Docker Enterprise with popular 3rd party ecosystem solutions for networking, load balancing, storage, logging and monitoring, access management, and more.
This document is a walkthrough for installing VMware vSphere CSI driver on a Docker Enterprise 3.0 for Docker Kubernetes Service.
vSphere CSI Driver Overview
vSphere CSI driver enables customers to address persistent storage requirements for Docker Enterprise (Kubernetes orchestration) in vSphere environments. Docker users can now consume vSphere Storage (vSAN, VMFS, NFS) to support persistent storage for Docker Kubernetes Service
vSphere CSI driver is Docker Certified to use with Docker Enterprise and is available in Docker Hub.
Prerequisites
- Docker Enterprise 3.0 VMware
vSphere
- Tested on Docker Enterprise 3.0 - MCR 19.03, MKE 3.2.4, and MSR 2.7.2
- VMware vSphere 6.7 Update 3
Installation and Configuration
On ESX
Install Docker Enterprise 3.0 (MKE and MSR) and configure worker node orchestration to Kubernetes.
Highlevel Cluster diagram

Login to Docker Enterprise MKE Cluster Web UI using Docker username and password.

Docker Enterprise MKE Dashboard

Configure Node Orchestration from Swarm to Kubernetes. Double click on highlighted node.
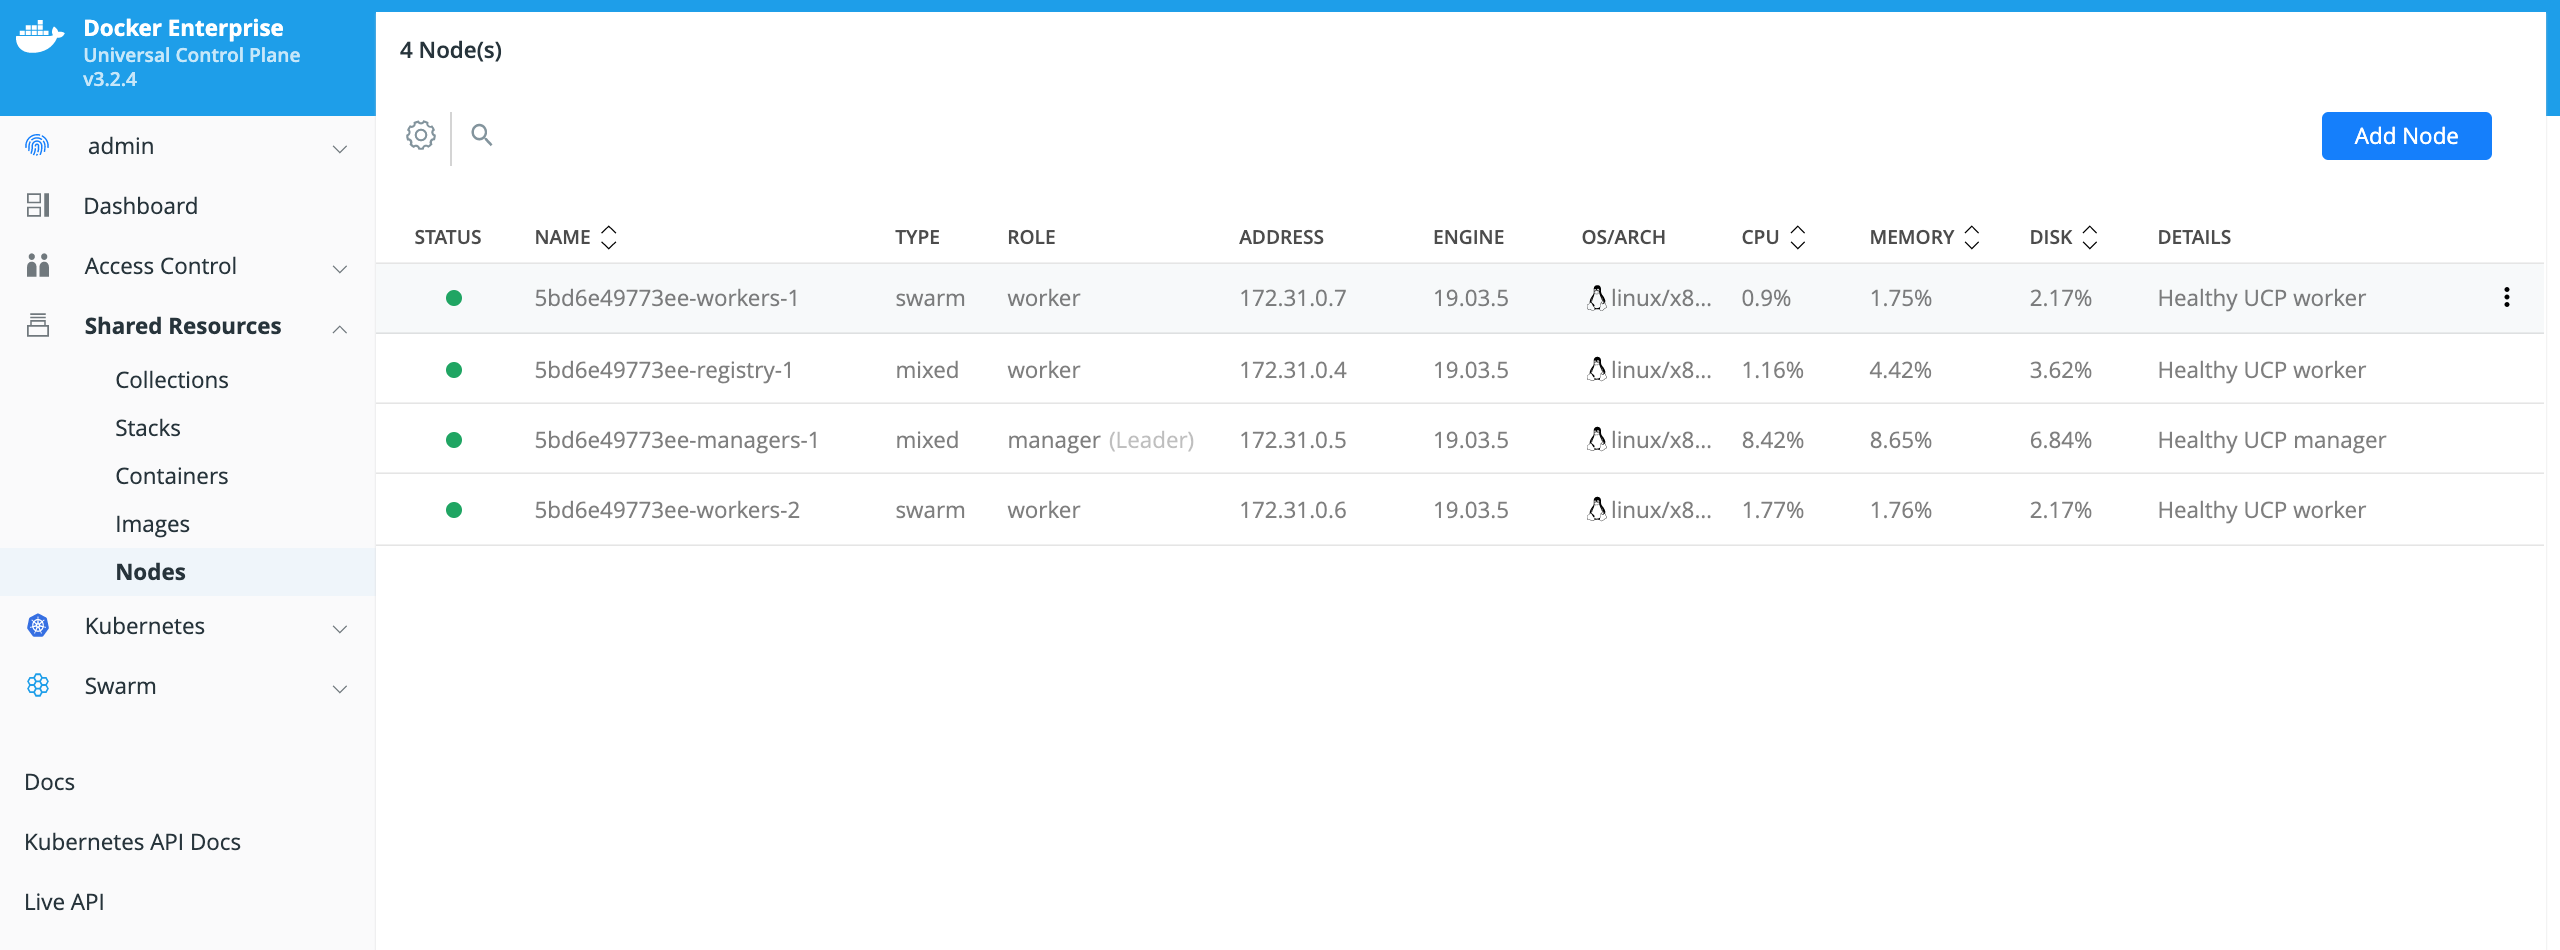
Click on the Edit Node on upper right hand, and change Orchestrator Type to kubernetes
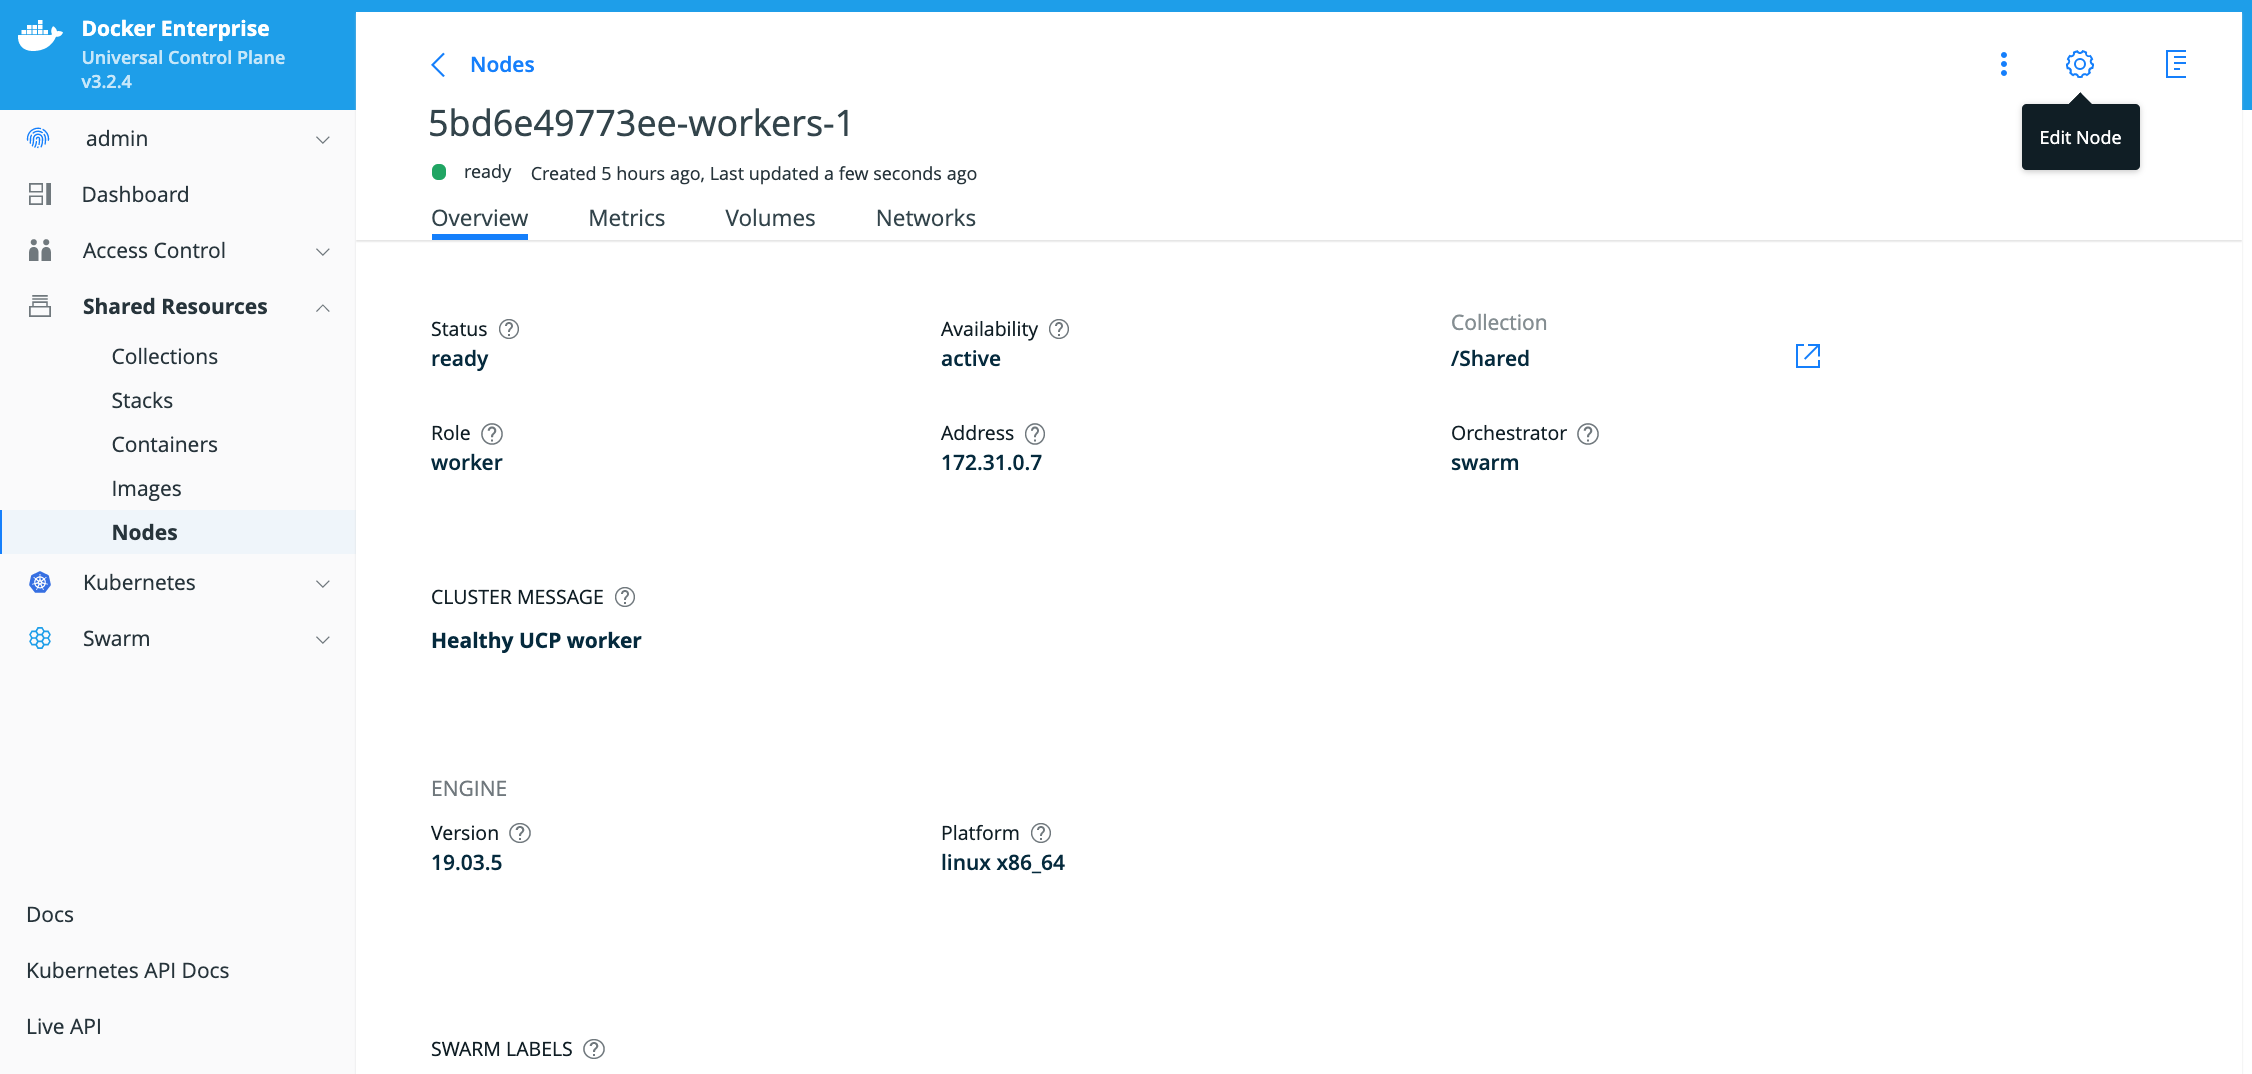
Note
Repeat similar steps for all worker nodes.
New display of nodes will show Orchestrator Type as kubernetes for workers nodes
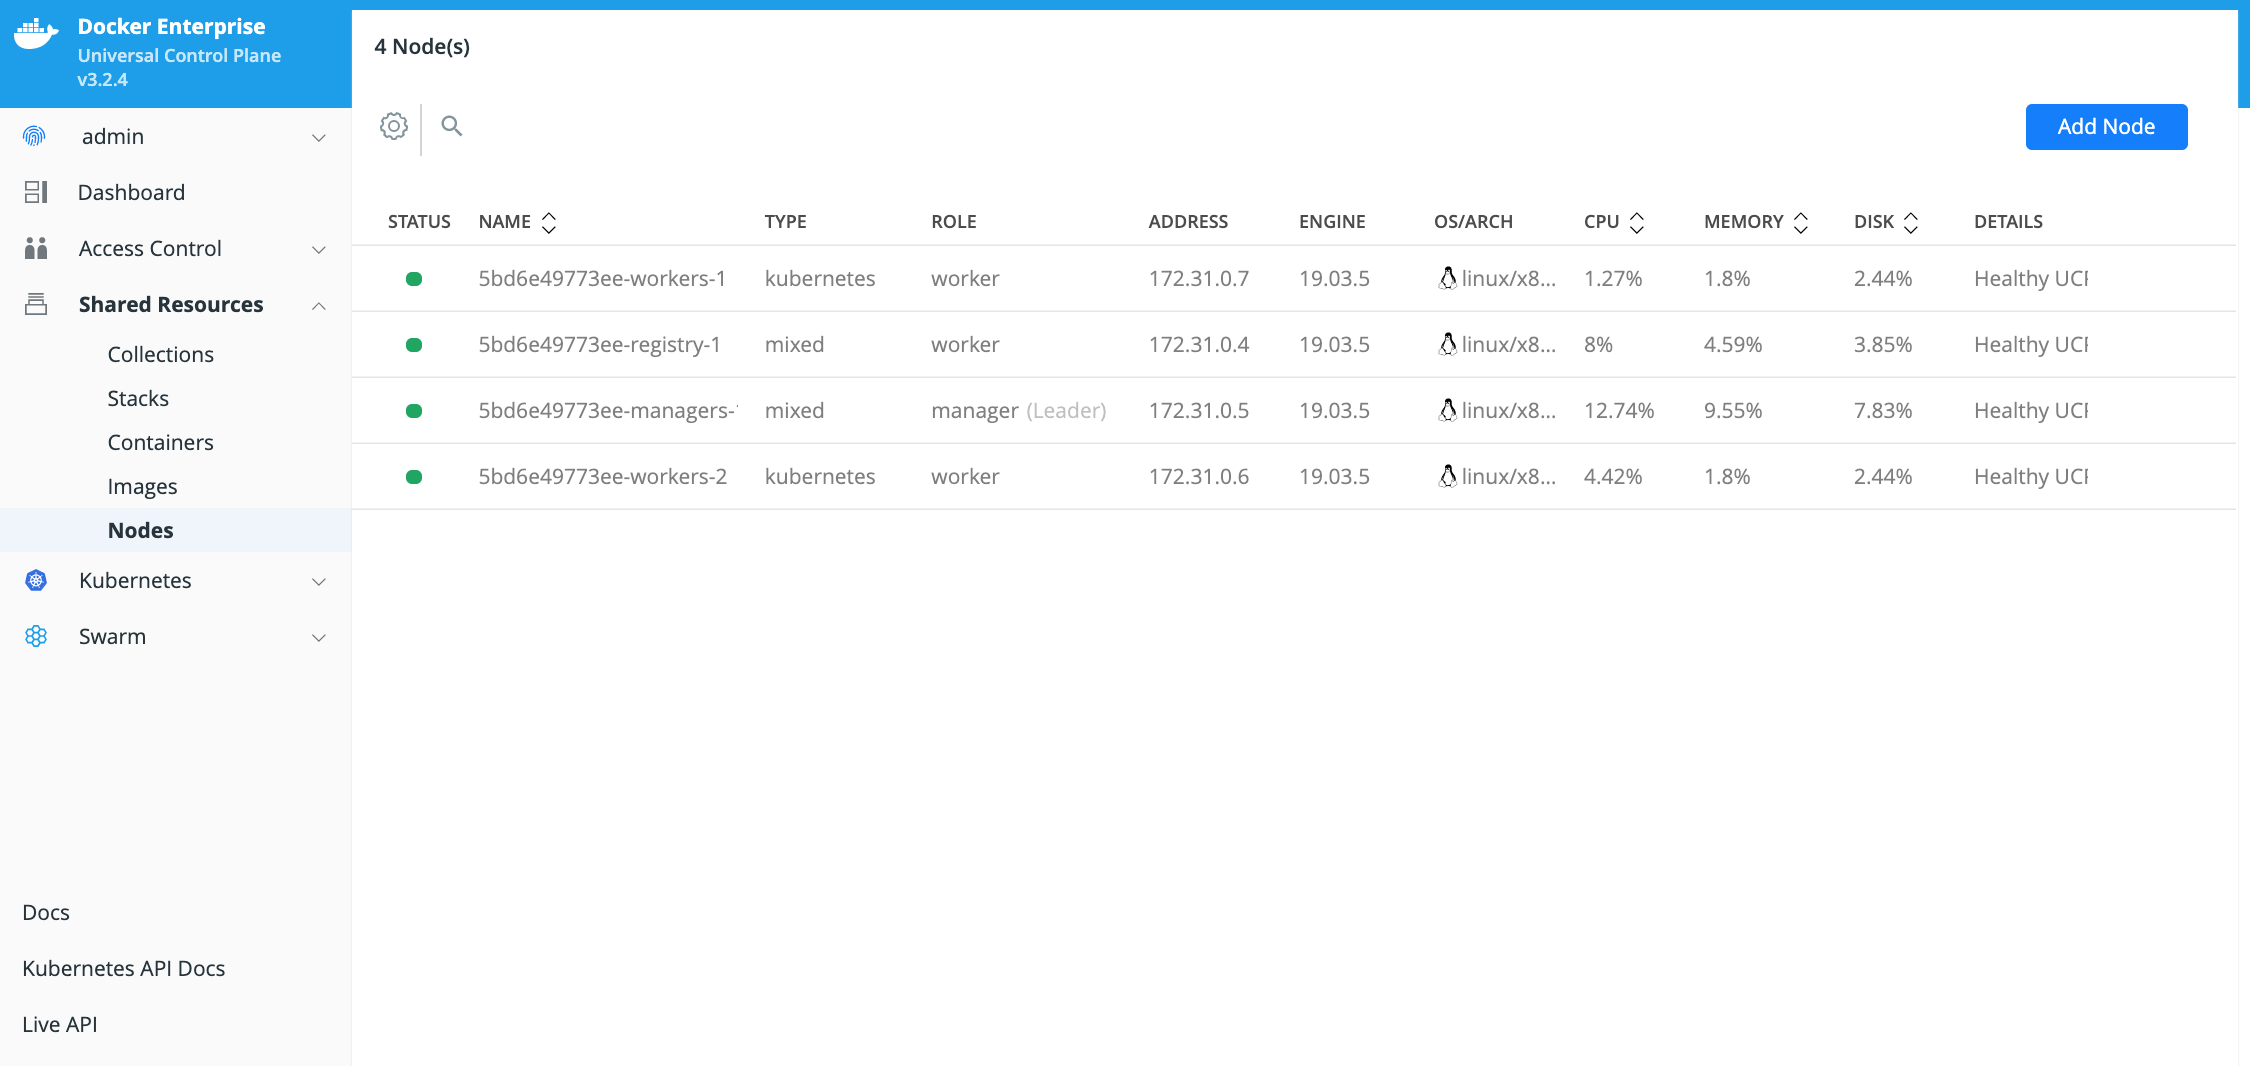
Generate and download a Docker Enterprise MKE client bundle from MKE Web UI
Click on your account name and then click on My Profile

Click on the New Client Bundle button then Generate Client Bundle button.

Locate the generated client bundle archive file and unzip it.
Note
The generated client bundle archive file will be downloaded to whatever folder your browser’s Download folder is configured for. You may have to move the generated client bundle archive file to the Docker client machine if it is a different machine than the machine it was downloaded to.
Run the following command from the Docker Enterprise client command shell to unzip the client bundle archive file.
$ unzip ucp-bundle-admin.zip
Example:
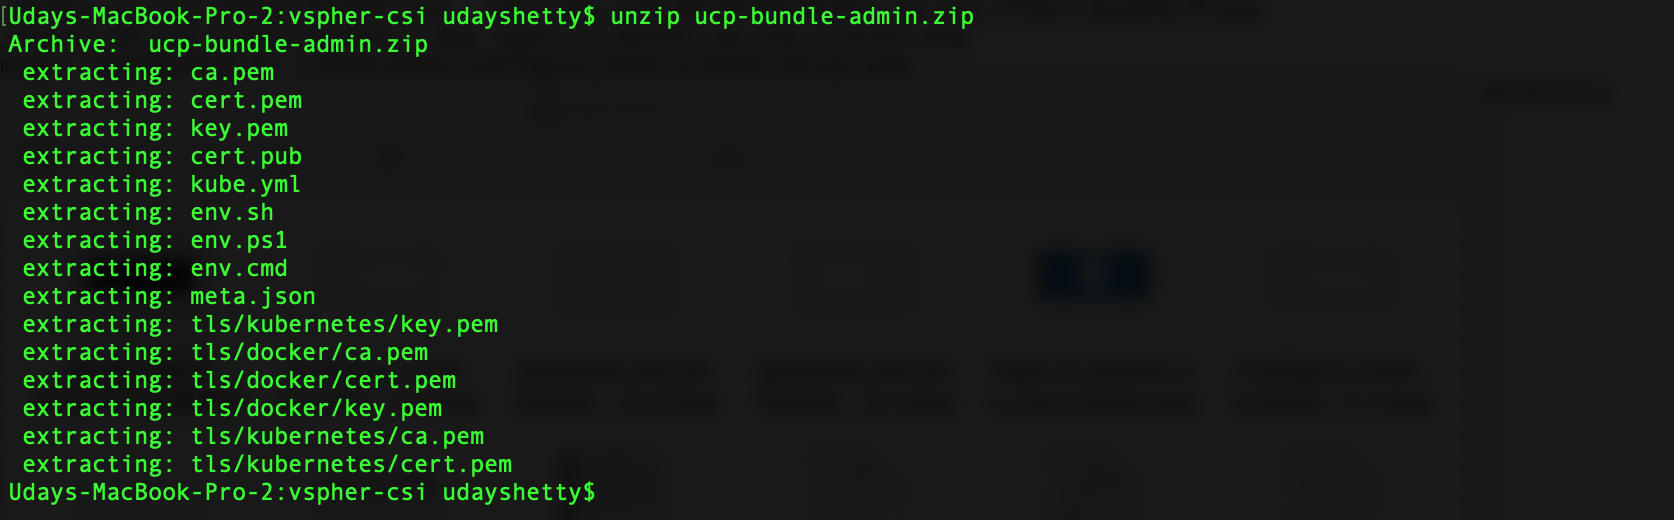
Configure Docker Enterprise client command shell.
Run the following command from the Docker Enterprise command shell.
$ eval "$(<env.sh)"
Example:
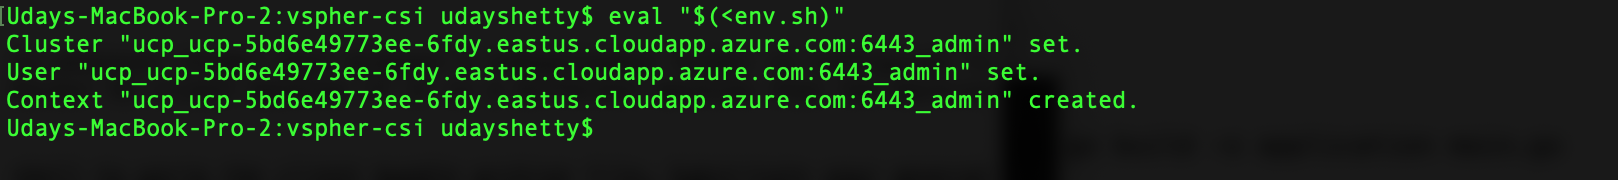
Test the Docker Enterprise MKE client bundle and configuration.
Run the docker version command from the Docker client command shell. (download Docker for Mac or Docker for Windows on your laptop or install Docker on your linux client)
$ docker version --format '{{println .Server.Platform.Name}}Client: {{.Client.Version}}{{range .Server.Components}}{{println}}{{.Name}}: {{.Version}}{{end}}'
Example:
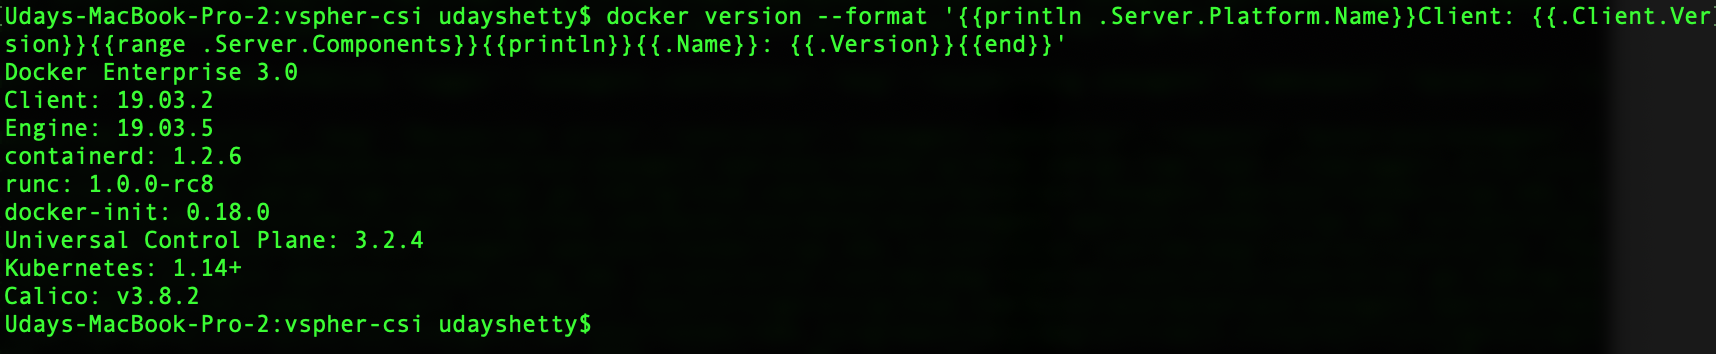
Kubernetes kubectl command
The Kubernetes kubectl command must be installed on the Docker
client machine. Refer to Install and Set Up
kubectl
to download and install the version of the kubectl command that
matches the version of Kubernetes included with the Docker Enterprise
version you are running. You can run the docker version command to
display the version of Kubernetes installed with Docker Enterprise.
Prerequisite for installing vSphere CSI driver
- Get cluster node information
$ kubectl get nodes -o wide
Example:
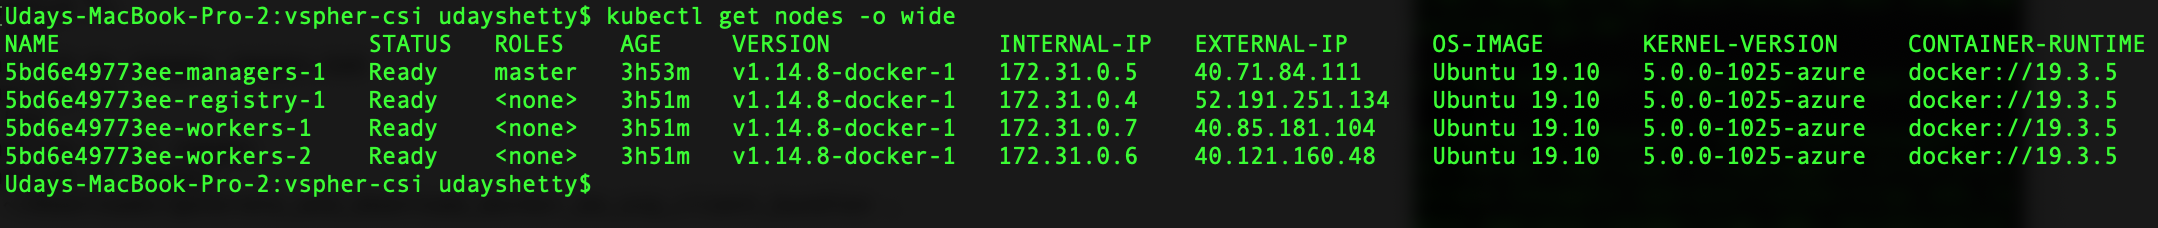
- Make sure master node(s) are tainted, requires 2 taints as shown below (master= and uninitialized=true)
$ kubectl taint node 5bd6e49773ee-managers-1 node-role.kubernetes.io/master=:NoSchedule
$ kubectl taint node 5bd6e49773ee-managers-1 node.cloudprovider.kubernetes.io/uninitialized=true:NoSchedule
- Make sure all the worker nodes are tainted with node.cloudprovider.kubernetes.io/uninitialized=true:NoSchedule
$ kubectl taint node 5bd6e49773ee-workers-1 node.cloudprovider.kubernetes.io/uninitialized=true:NoSchedule
$ kubectl taint node 5bd6e49773ee-workers-2 node.cloudprovider.kubernetes.io/uninitialized=true:NoSchedule
Verify the nodes are tainted
$ kubectl describe nodes | egrep "Taints:|Name:"
Example:
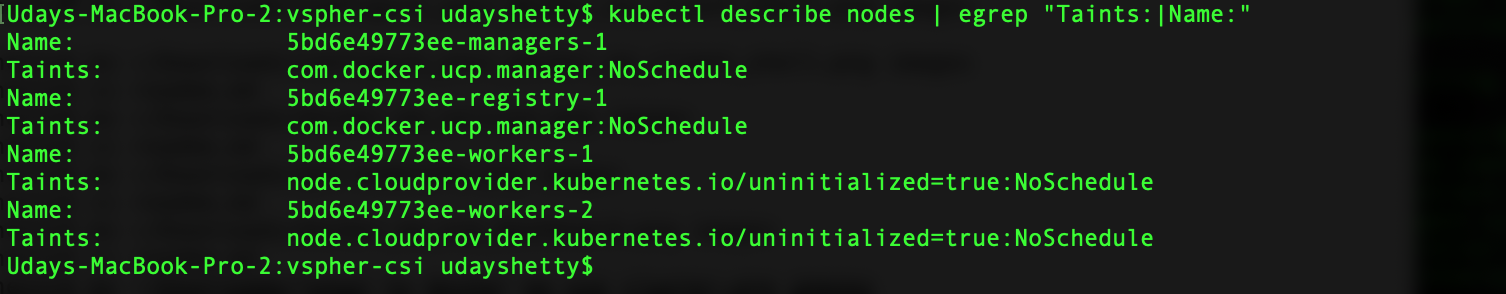
Install vSphere CSI driver
Follow instructions from this doc: https://cloud-provider-vsphere.sigs.k8s.io/tutorials/kubernetes-on-vsphere-with-kubeadm.html#install-vsphere-container-storage-interface-driver
Note
Since MKE doesn’t support cloud-provider option at the moment, will have to rely on the vSphere Cloud Provider (VCP) instead of Cloud Controller Manager (CCM) to discover the UUID of each VM.
Uninitialized taint needs to be manually removed from all nodes after CSI driver is installed.
Certification Test
The fastest way to verify the installation is to run the cert tests at https://github.com/docker/vol-test on Linux hosts.
To install the vol-test tools:
Clone https://github.com/docker/vol-test/
$ git clone https://github.com/docker/vol-test.git
$ cd vol-test
$ cd kubernetes
Run the tests as per the readme:e
Refer to the readme for the voltest package to tailor the configuration variables for your environment. This is the test result for the run.
Note
Please update the storageClassName in testapp.yaml that maps to an existing storage class that references to an existing storage policy in vSphere.
$ ./voltestkube -podurl http://10.156.129.220:33208
Pod voltest-0 is Running
http://10.156.129.220:33208/status
Reset test data for clean run
Shutting down container
Waiting for container restart - we wait up to 10 minutes
Should be pulling status from http://10.156.129.220:33208/status
.Get http://10.156.129.220:33208/status: dial tcp 10.156.129.220:33208: connect: connection refused
.Get http://10.156.129.220:33208/status: dial tcp 10.156.129.220:33208: connect: connection refused

Container restarted successfully, moving on
Pod node voltest-0 is docker-2
Pod was running on docker-2
Shutting down container for forced reschedule
http error okay here
Waiting for container rechedule - we wait up to 10 minutes
......Container rescheduled successfully, moving on
Pod is now running on docker-3
Going into cleanup...
Cleaning up taint on docker-2
Test results:
+-------------------------------------------------------+
Kubernetes Version: v1.14.7-docker-1        OK
Test Pod Existence: Found pod voltest-0 in namespace default        OK
Confirm Running Pod: Pod running        OK
Initial Textfile Content Confirmation: Textcheck passes as expected     OK
Initial Binary Content Confirmation: Bincheck passes as expected        OK
Post-restart Textfile Content Confirmation: Textcheck passes as expected        OK
Post-restart Binaryfile Content Confirmation: Bincheck passes as expected       OK
Rescheduled Textfile Content Confirmation: Textcheck passes as expected     OK
Rescheduled Binaryfile Content Confirmation: Bincheck passes as expected        OK
All tests passed.
Monitoring and Troubleshooting
Monitor the VMware driver container on each node - make sure it’s active and running.
$ kubectl -n kube-system get pod -l app=vsphere-csi-node
Example Output:
$ kubectl -n kube-system get pod -l app=vsphere-csi-node
NAME                     READY   STATUS    RESTARTS   AGE
vsphere-csi-node-8wm48   3/3     Running   0          14d
vsphere-csi-node-tstqr   3/3     Running   0          14d
vsphere-csi-node-wnn7r   3/3     Running   0          14d
See also
Warning
Mirantis stopped maintaining this documentation set as of 2021-07-21, in correlation with the End of Life date for MKE 3.2.x and MSR 2.7.x. The company continues to support MCR 19.03.x and its documentation.
For the latest MKE, MSR, and MCR product documentation, refer to:
Troubleshooting Guides
Troubleshooting in a container based environment can seem a bit foreign due to some of the difference between applications running directly on an operating system and their container based counterparts. We have some tips, tricks, and tools that can help a practitioner navigate some of the technical hurdles they may face.
Troubleshooting Container Networking
Issue
Typically, container-container networking issues manifest themselves as intermittent connection timeouts. They could also manifest as a complete failure of container-container networking.
This walkthrough will guide you to collect the necessary information to determine the root cause of a network connectivity problem.
Prerequisites
First, determine the names of the affected Docker swarm services, networks, and hosts.
Identify a Docker host from which network requests are not answered
correctly. If the requests are submitted through the ingress network,
then to a frontend service, then via another network to a backend
service, then start troubleshooting by splitting the problem in half and
using netshoot to connect from the frontend directly to the backend
service.
Resolution
To troubleshoot container-container networking issues, start by examining the user-defined network. If the problem isn’t found, move to troubleshooting the ingress network. Both are discussed below.
Troubleshooting a User-Defined Network
On the host where the frontend container is running, start a netshoot container reusing the network namespace affected container:
docker run -it --rm --network container:<container_name> nicolaka/netshoot
Steps 2 through 6 are executed inside this shell.
Look up all backend IP addresses by DNS name: DNS names are created for containers and services and are scoped to each overlay network the container or service attaches to. Standalone containers user the container name for the hostnames. Looking up the name of a service returns the IP of the service’s load balancing VIP. To lookup the IP of each task created by a service, use “task.service_name” as the domain name.
For example, to lookup the IP addresses for a the backend service use:
nslookup tasks.<backend_service_name>Where: <backend_service_name> is changed to the backend service name
Issue a netcat TCP test to each backend task IP address on the port where it should be listening:
nc -zvw2 $backend_ip <listening_port>
Where: <listening_port> is changed to the port the backend tasks are listening on
To iterate over multiple task IPs for a service, you can use the following for loop:
for backend_ip in $(nslookup tasks.<backend_service_name> 2>/dev/null \
  | awk '/answer:$/ {inanswer=1} inanswer && $1=="Address:" {print $NF}'); \
  do \
    nc -zw2  $backend_ip <listening_port>; \
  done
Note
Output is only expected for IPs where connections fail.
If no connections fail but requests submitted via the ingress network continue to have problems, move to the next section on troubleshooting the ingress network. If no connections fail, and the issue has only been seen container-container, then check another set of services or hosts until one task fails to reach another.
For any backend IP addresses reported as failed, do a reverse name lookup of the affected IP to determine its service name and task id:
nslookup <IP_address>Results will be formatted
service_name.slot.taskid.network_nameExit the netshoot container and collect
docker network inspect -vagainst the network between the two containers. Note the HostIP of tasks in the Services section that failed the netcat test.On a manager, for the set of all failed service names and tasks, collect the following:
docker service ps <service_name>
docker inspect --type task <task_id>
For tasks that are still present (
inspect --type taskreturns output), note their Created and Updated times. Collect Docker daemon logs covering this time frame from the netshoot host, all managers, and hosts of unresponsive tasks as identified by their HostIP.If your Docker daemon logs to journald, for example:
journalctl -u docker --no-pager --since "YYYY-MM-DD 00:00" --until "YYYY-MM-DD 00:00"
Collect the output of https://github.com/docker/libnetwork/tree/master/support from all hosts in the network path. This will expose and allow for the verification of the kernel programming if needed.
Troubleshooting the Ingress Network
Service discovery is disabled on the ingress network for security
reasons, so you can’t use nslookup tasks.service to establish which
backend IPs to test. Instead use the ipvs loadbalancer programming of
the kernel.
On a manager, use
docker service inspectto identify the VIP for the service on the ingress network (where <service_name> is changed to the name of the service):ingress_id=$(docker network ls -qf name=ingress --no-trunc); docker service inspect <service_name> --format '{{range .Endpoint.VirtualIPs}}{{if eq "'${ingress_id}'" .NetworkID}}{{.Addr}}{{end}}{{end}}'
Using
curlidentify a Docker host from which network requests to the ingress published port of the service are not answered correctly:curl -4 -H 'Host: myapp.example.com' http://host:<listening_port>
Use a netshoot container to enter into the ingress_sbox namespace on that host:
docker run -it --rm -v /var/run/docker/netns:/netns --privileged=true nicolaka/netshoot nsenter --net=/netns/ingress_sbox sh
Look up the decimal ingress firewall mark for the service in question:
iptables -nvL -t mangle |awk '/<vip>/ {printf("%d", $NF)}'; echo
Where <vip> is replaced with the IP address of the service determined by service inspect.
List all the backend task IP addresses using ipvsadm
ipvsadm -l -f <fwmark>
Where <fwmark> is the decimal firewall mark extracted from the iptables mangle table.
Issue a netcat TCP test to each task IP address on the port where it should be listening:
for backend_ip in $(ipvsadm -l -f <fwmark> | awk 'NR>3{print $2}' |cut -d: -f1); \
  do nc -zw1  $backend_ip <listening_port> &>/dev/null || echo $backend_ip failed; \
  done
Where: <listening_port> is changed to the port the backend tasks are listening on <fwmark> is the changed to the decimal firewall mark extracted from the
iptablesmangle tableNote
Output is only expected for IPs where connections fail.
Exit the netshoot container and collect
docker network inspect -v ingress. Note the HostIP, service name, and task ID of any tasks with failed backend IP addresses.On a manager, for the set of all failed service names and tasks, collect the following:
docker service ps <service_name>
docker inspect --type task <task_id>
For tasks that are still present (
inspect --type taskreturns output), note their Created and Updated times. Collect Docker daemon logs covering this time frame from the netshoot host, all managers, and hosts of unresponsive tasks as identified by their HostIP.If your Docker daemon logs to journald, for example:
journalctl -u docker --no-pager --since "YYYY-MM-DD 00:00" --until "YYYY-MM-DD 00:00"
Collect the output of https://github.com/adamancini/libnetwork/blob/improved_support_script/support.sh from all hosts in the network path. This will expose and allow us to verify kernel programming if needed.