MCP Reference Architecture Q4`18 documentation
MCP Reference Architecture
Note
The MCP Reference Architecture guide now includes the updated content from the MCP Standard Configuration document that has been removed from the MCP documentation set.
Preface
This documentation provides information on how to use Mirantis products to deploy cloud environments. The information is for reference purposes and is subject to change.
Intended audience
This documentation is intended for deployment engineers, system administrators, and developers; it assumes that the reader is already familiar with network and cloud concepts.
Documentation history
The following table lists the released revisions of this documentation:
| Revision date | Description |
|---|---|
| February 8, 2019 | Q4`18 GA |
Introduction
Mirantis product is Mirantis Cloud Platform (MCP). This is a software product that is installed on bare metal servers in a datacenter and provides virtualization cloud capabilities to the end users of the platform. MCP also includes deployment and lifecycle management (LCM) tools that enable cloud operators to deploy and update the Mirantis Cloud Platform using automated integration and delivery pipeline.
MCP capabilities
Mirantis Cloud Platform (MCP) provides two broad categories of capabilities to two distinct groups of users:
- Cloud operators
Users from this category are engineers responsible for operations of the cloud platform. They are interested in stability of the platform, reliable life cycle operations, and timely update of the platform software.
- Tenant users
Users from this category run workloads on the cloud platform using interfaces provided by the platform. They need to understand what types of virtual resources are available on the cloud platform, how to utilize them, and what are the limitations of the platform interfaces.
Cloud operators and administrators can use MCP to manage the following elements of the cloud platform infrastructure:
- Physical infrastructure
Hardware servers, host operating system.
- Cloud platform software
Hypervisors, control plane services, identity information.
- Network configuration
Host networking, IP routing, filtering, and VPN.
Tenant users can use MCP to manage the following resources provided by the cloud platform:
- Virtual infrastructure
Virtual server instances and/or containers, virtual networks and resources, virtual storage, and tenants identity information.
- Applications running on the infrastructure
Any workloads that run in the virtual infrastructure using resources of physical infrastructure agnostically through virtualization mechanisms.
MCP design
Mirantis Cloud Platform provides capabilites described above as functions of its software components.
DriveTrain
DriveTrain is code name for the MCP LCM framework that includes Gerrit, Jenkins, MCP Registry, SaltStack, Reclass, and metadata model. The DriveTrain components perform the following functions:
- SaltStack
Flexible and scalable deployment and configuration management and orchestration engine that is used for automated lifecycle management of MCP clusters.
- Reclass
Reclass is an External Node Classifier (ECN) that, coupled with SaltStack, provides an inventory of nodes for easy configuration management.
- Reclass metadata model
The metadata model is a hierarchical file based store that allows to define all parameter values used by Salt to configure services of MCP. The model hierarchy is merged and exposed to Salt through the Reclass ENC.
- Gerrit
Git repository and code review management system in which all MCP codebase and the metadata model are stored and through which all changes to MCP clusters are delivered.
- Jenkins
Build automation tool that, coupled with Gerrit, enables continuous integration and continuous delivery of updates and upgrades to the MCP clusters.
- MCP Registry
A set of repositories with binary artifacts required for MCP cluster deployment and functioning. This is a local mirror of Registry published by Mirantis from its product delivery infrastructure.
- MAAS
Metal-as-a-Service (MAAS) is a provisioning software that allows you to manage physical machines.
- OpenLDAP
OpenLDAP server stores and provides identity information for other components of DriveTrain and, optionally, for MCP clusters.
MCP clusters
Using DriveTrain, you can deploy and manage multiple MCP clusters of different types. MCP clusters provide certain Operator and Tenant functions, as described below.
- StackLight Logging, Monitoring, and Alerting (LMA)
Responsible for collection, analysis, and visualization of critical monitoring data from physical and virtual infrastructure, as well as alerting and error notifications through a configured communication system, such as email.
- OpenStack
Platform that manages virtual infrastructure resources, including virtual servers, storage devices, networks and networking services such as load balancers, and provides management functions to Tenant users.
- Kubernetes support terminated since 2019.2.5
Platform that manages virtual infrastructure resources, including container images, pods, storage and networking resources for containerized applications.
- Ceph
Distributed storage platform that provides storage resources, such as objects and virtual block devices, to virtual and physical infrastructure.
- OpenContrail (optional)
MCP enables you to deploy OpenContrail as a software-defined networking solution. MCP OpenContrail is based on official OpenContrail releases with additional customizations by Mirantis.
Note
If you run MCP OpenContrail SDN, you need to have Juniper MX or SRX hardware or virtual router to route traffic to and from OpenStack tenant VMs.
- High Availability
In MCP, the high availability of control plane services is ensured by Keepalived and HAProxy. Keepalived is a Linux daemon that provides redundancy for virtual IP addresses. HAProxy provides load balancing for network connections.
Cloud infrastructure
A cloud infrastructure consists of the physical infrastructure, network configuration, and cloud platform software.
In large data centers, the cloud platform software required for managing user workloads runs on separate servers from where the actual workloads run. The services that manage the workloads coupled with the hardware on which they run are typically called the control plane, while the servers that host user workloads are called the data plane.
In MCP, the control plane is hosted on the infrastructure nodes. Infrastructure nodes run all the components required for deployment, lifecycle management, and monitoring of your MCP cluster. A special type of infrastructure node called the foundation node, in addition to other services, hosts a node that runs the bare-metal provisioning service called MAAS and the Salt Master service that provides infrastructure automation.
MCP employs modular architecture approach by using the Reclass model to describe configuration and distribution of services across the infrastructure nodes. This allows the product to arrange the same services into different configurations depending on the use case.
Infrastructure management capabilities
MCP provides the following infrastructure management capabilities to cloud operators and administrators:
- Install MCP and its components on bare metal infrastructure.
- Update components of MCP to improve existing capabilities and get security or other fixes.
- Upgrade cloud platform components and other components of MCP installation to gain new capabilities.
- Add, remove, and replace elements of the control plane and data plane physical and virtual infrastructure, including hypervisor servers and servers that host control plane services.
- Configure bare metal servers, including disk and network settings, operating system, and IP routing.
- Collect and expose metrics and logs from the infrastructure.
- Generate alerts and notifications about events in the infrastructure.
- Deploy distributed massively-scaled shared storage (Ceph) and attach it to a cloud in order to provide reliable storage to virtual machines.
Deployment and lifecycle management automation
MCP utilizes the Infrastructure-as-Code concept for deployment and lifecycle management of a cloud datacenter. In this concept, all infrastructure elements are described in definition files. Changes in the files are reflected in the configuration of datacenter hosts and cloud services.
DriveTrain is the lifecycle management (LCM) engine of MCP. It allows cloud operators to deploy and manage MCP clusters.
DriveTrain implements an opinionated approach to Infrastructure-as-Code. Cloud operators can use DriveTrain to describe their infrastructures as declarative class-based metadata model. Changes in the model parameters are applied through DriveTrain LCM orchestration.
The LCM orchestration is handled by Groovy pipelines executed by the Jenkins server. The configuration management is provided by Salt formulas executed by the SaltStack agents (minions).
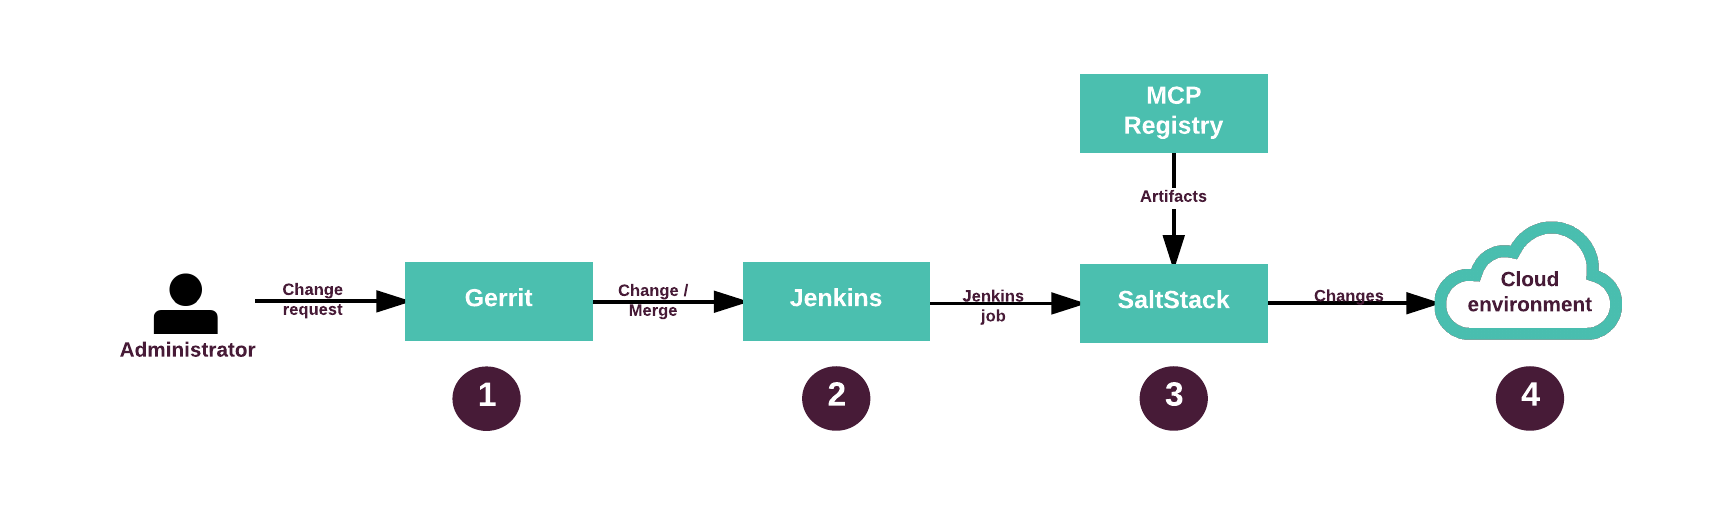
LCM pipeline overview
DriveTrain implements lifecycle management (LCM) operations as Jenkins pipelines. For the list of the components of DriveTrain, see MCP design.
The following diagram describes the workflow of the DriveTrain LCM pipeline:
| # | Description |
|---|---|
| 1 | An operator submits changes to the cluster metadata model in Gerrit for review and approval. |
| 2 | Depending on your configuration and whether you have a staging environment or deploy changes directly to a production MCP cluster, the workflow might slightly differ. Typically, with a staging MCP cluster, you trigger a deployment job in Jenkins before merging the change. This allows you to verify it before promoting to production. However, if you deploy an MCP cluster onto production, you might want to approve and merge the change first. |
| 3 | Jenkins job invokes the required SaltStack formulas and Reclass models from Gerrit and artifacts from the MCP Registry. |
| 4 | SaltStack applies changes to the cloud environment. |
See also
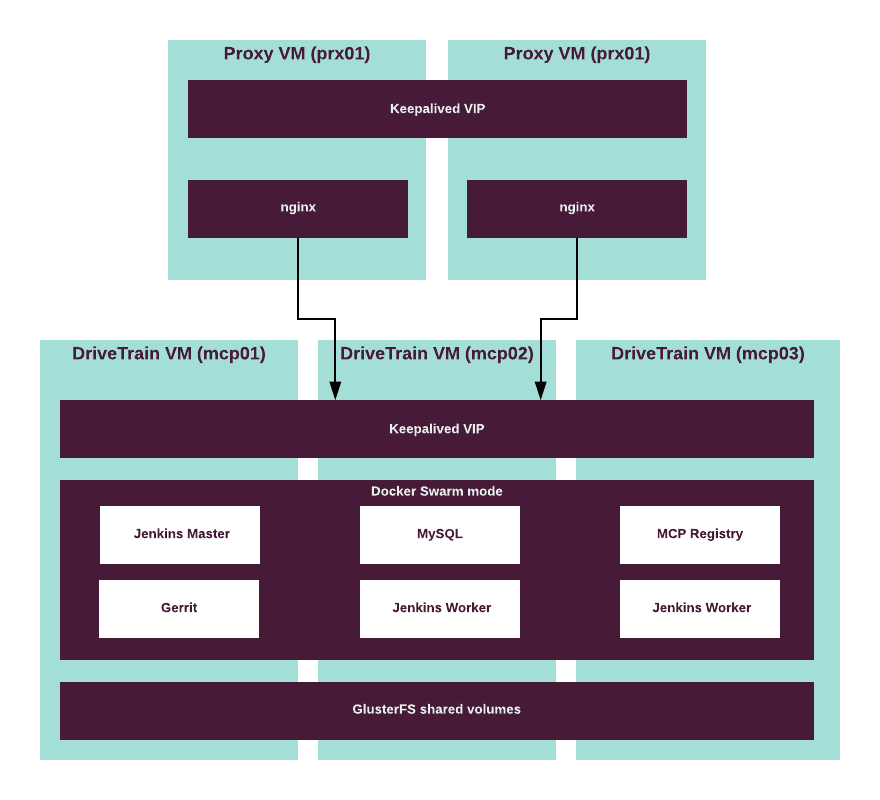
High availability in DriveTrain
DriveTrain is the integration framework for the MCP product. Therefore, its continuous availability is essential for the MCP solution to function properly. Although you can deploy DriveTrain in the single node Docker Swarm mode for testing purposes, most production environments require a highly-available DriveTrain installation.
All DriveTrain components run as containers in Docker Swarm mode cluster which ensures services are provided continuously without interruptions and are susceptible to failures.
The following components ensure high availability of DriveTrain:
- Docker Swarm mode is a special Docker mode that provides
Docker cluster management. Docker Swarm cluster ensures:
- High availability of the DriveTrain services. In case of failure on any infrastructure node, Docker Swarm reschedules all services to other available nodes. GlusterFS ensures the integrity of persistent data.
- Internal network connectivity between the Docker Swarm services through the Docker native networking.
- Keepalived is a routing utility for Linux that provides a single point of entry for all DriveTrain services through a virtual IP address (VIP). If the node on which the VIP is active fails, Keepalived fails over the VIP to other available nodes.
- nginx is web-server software that exposes the DriveTrain service’s APIs that run in a private network to a public network space.
- GlusterFS is a distributed file system that ensures the integrity of the MCP Registry and Gerrit data by storing the data in a shared storage on separate volumes. This ensures that persistent data is preserved during the failover.
The following diagram describes high availability in DriveTrain:
SaltStack and Reclass metadata model
SaltStack is an automation tool that executes formulas. Each SaltStack formula defines one component of the MCP cluster, such as MySQL, RabbitMQ, OpenStack services, and so on. This approach enables MCP product developers to combine the components as needed so that services do not interfere with each other and can be reused in multiple scenarios.
Reclass is an external node classifier (ENC) which enables cloud operators to manage an inventory of nodes by combining different classes into MCP cluster configurations. Reclass operates classes which you can view as tags or categories of metadata parameters.
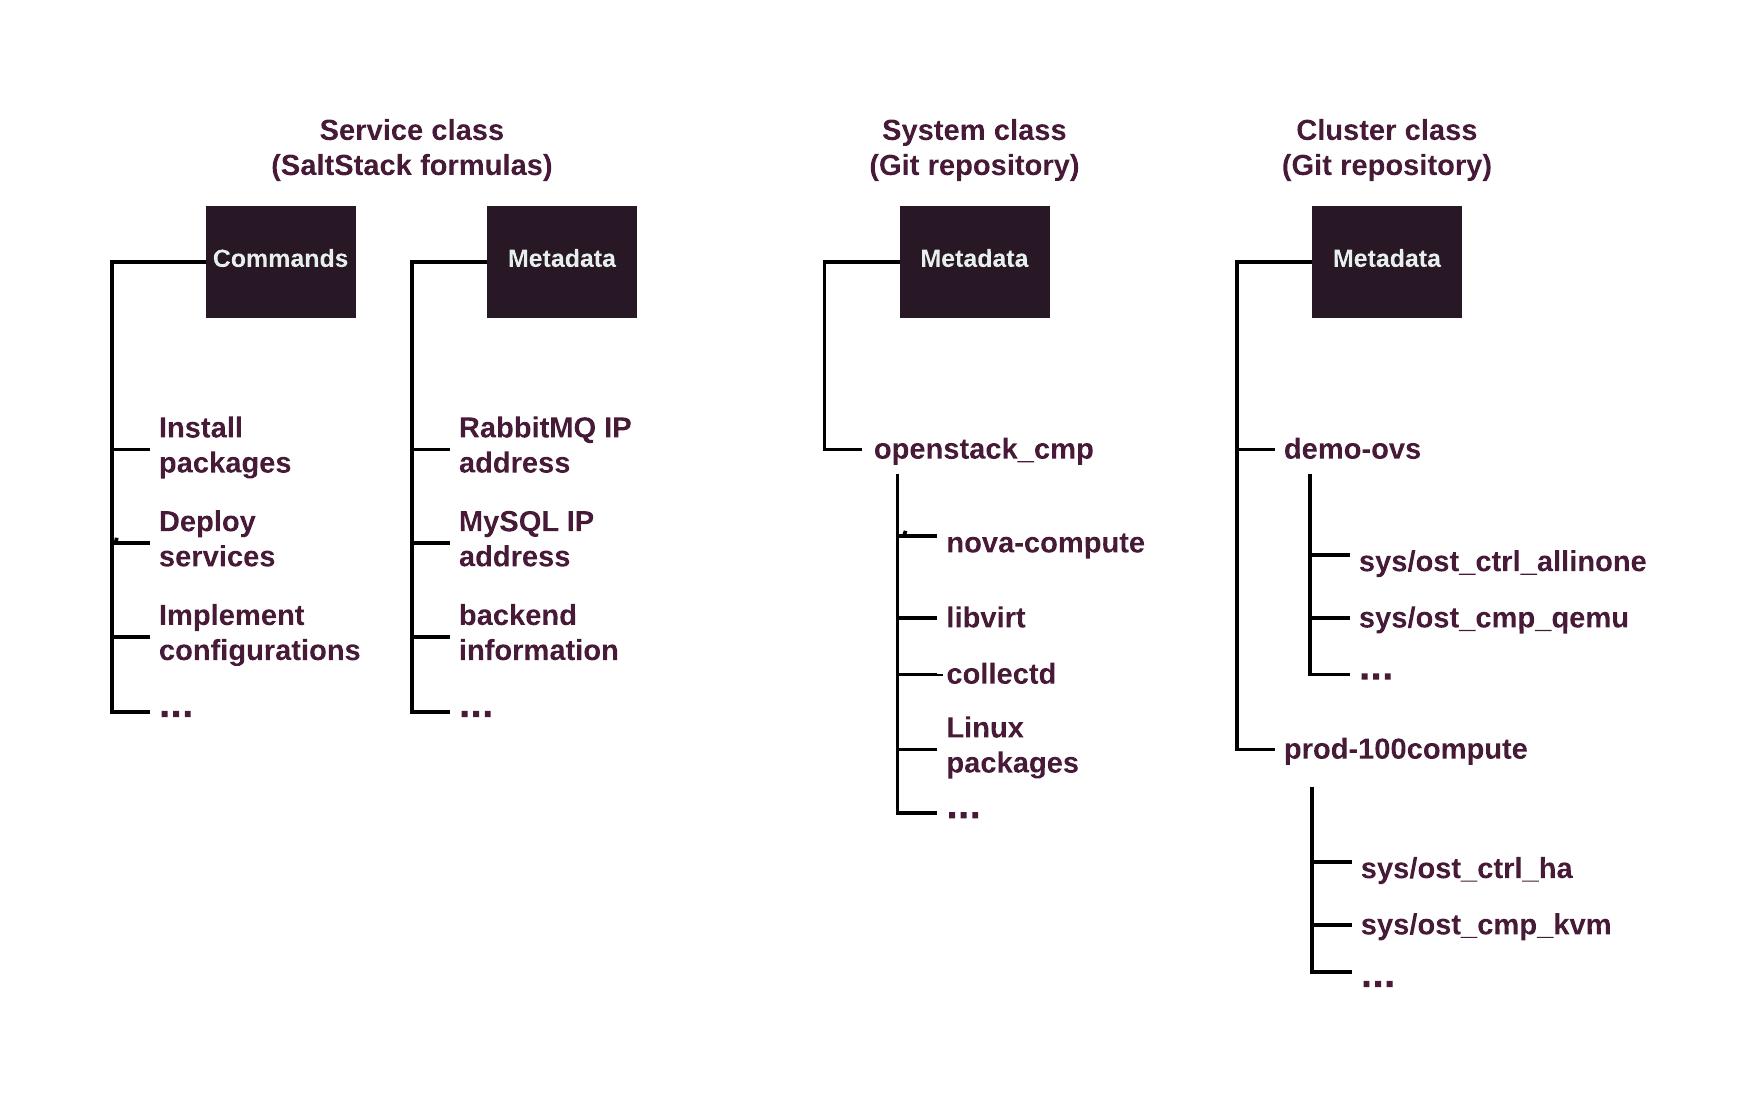
The metadata model itself consists of hierarchically structured classes and corresponding parameters.
The following diagram displays the Mirantis Reclass metadata model’s hierarchy of classes:
| Service class | System class | Cluster class |
|---|---|---|
A service class defines one service, or a group of related services, and the most specific configuration parameters for them. The parameters in this layer of the metadata model are translated directly into values in the configuration files for the corresponding service, and so on. The service classes are provided by and match the Salt formulas installed onto the Salt Master node. A metadata parameter value defined in one of the service classes might be overridden by values from higher levels in the hierarchy, which include the system and cluster levels. |
A system class defines a role (with different granularity) that is applied to a node, logical or physical. System classes typically include and combine service classes and other system classes in a way to describe completely configured, integrated, and ready-to-use system. The system classes are distributed as a Git repository. The repository is copied to the Salt Master node during the bootstrap of DriveTrain. A metadata parameter value set in a system class could be overridden by the values from a higher level in the hierarchy, which is the cluster level. |
A cluster class defines configuration of a specific MCP cluster. This kind of classes can combine system classes according to the architecture of the cluster. A cluster metadata model is typically generated using the automation pipeline that is executed by DriveTrain Jenkins. This pipeline uses Cookiecutter as a templating tool to generate the cluster model. The cluster metadata model is distributed as a Git repository. |
Infrastructure nodes overview
Infrastructure nodes are the physical machines that run all required services for the MCP cluster deployment, lifecycle management, and monitoring, also known as control plane services.
The exact number of the infrastructure nodes in each MCP environment and distribution of the MCP components across the infrastructure nodes depend on the use case and are defined in the deployment model.
The MCP Cloud Provider Reference Configuration requires 9 infrastructure nodes to run control plane services. See OpenStack compact cloud for details.
Note
You can use either Neutron or OpenContrail SDN, but not both at the same time.
Infrastructure nodes disk layout
Infrastructure nodes are typically installed on hardware servers. These servers run all components of management and control plane for both MCP and the cloud itself. It is very important to configure hardware servers properly upfront because changing their configuration after initial deployment is costly.
For instructions on how to configure the disk layout for MAAS to provision the hardware machines, see MCP Deployment Guide: Add a custom disk layout per node in the MCP model.
Consider the following recommendations:
- Layout
- Mirantis recommends using the
LVMlayout for disks on infrastructure nodes. This option allows for more operational flexibility, such as resizing the Volume Groups and Logical Volumes for scale-out. - LVM Volume Groups
According to Hardware requirements for Cloud Provider Infrastructure, an infrastructure node typically has two or more SSD disks. These disks must be configured as LVM Physical Volumes and joined into a Volume Group.
The name of the Volume Group is the same across all infrastructure nodes to ensure consistency of LCM operations. Mirantis recommends following the
vg_<role>naming convention for the Volume Group. For example,vg_root.- LVM Logical Volumes
The following table summarizes the recommended Logical Volume schema for infrastructure nodes in the CPI reference architecture. The
/var/lib/libvirt/images/size may be adjusted to the size of all VMs hosted on the node depending on the VCP VMs size. The disk size for a large deployment may require more that 3 TB for StackLight LMA and OpenContrail.Follow the instructions in the MCP Deployment Guide to configure infrastructure nodes in your cluster model.
| Server role | Server names | Logical Volume path | Mount point | Size |
|---|---|---|---|---|
| All roles | kvm01 - kvm09 |
/dev/vg_root/lv_root |
'/' |
50 GB |
| VCP infrastructure | kvm01, kvm02, kvm03 |
/dev/vg_root/lv_gluster |
/srv/glusterfs |
200 GB |
| VCP infrastructure | kvm01, kvm02, kvm03 |
/dev/vg_root/lv_mcp_images |
/var/lib/libvirt/images |
1200 GB |
| StackLight LMA | kvm04, kvm05, kvm06 |
/dev/vg_root/lv_mcp_images |
/var/lib/libvirt/images |
5500 GB |
| Tenant gateway | kvm07, kvm08, kvm09 |
/dev/vg_root/lv_mcp_images |
/var/lib/libvirt/images |
700 GB |
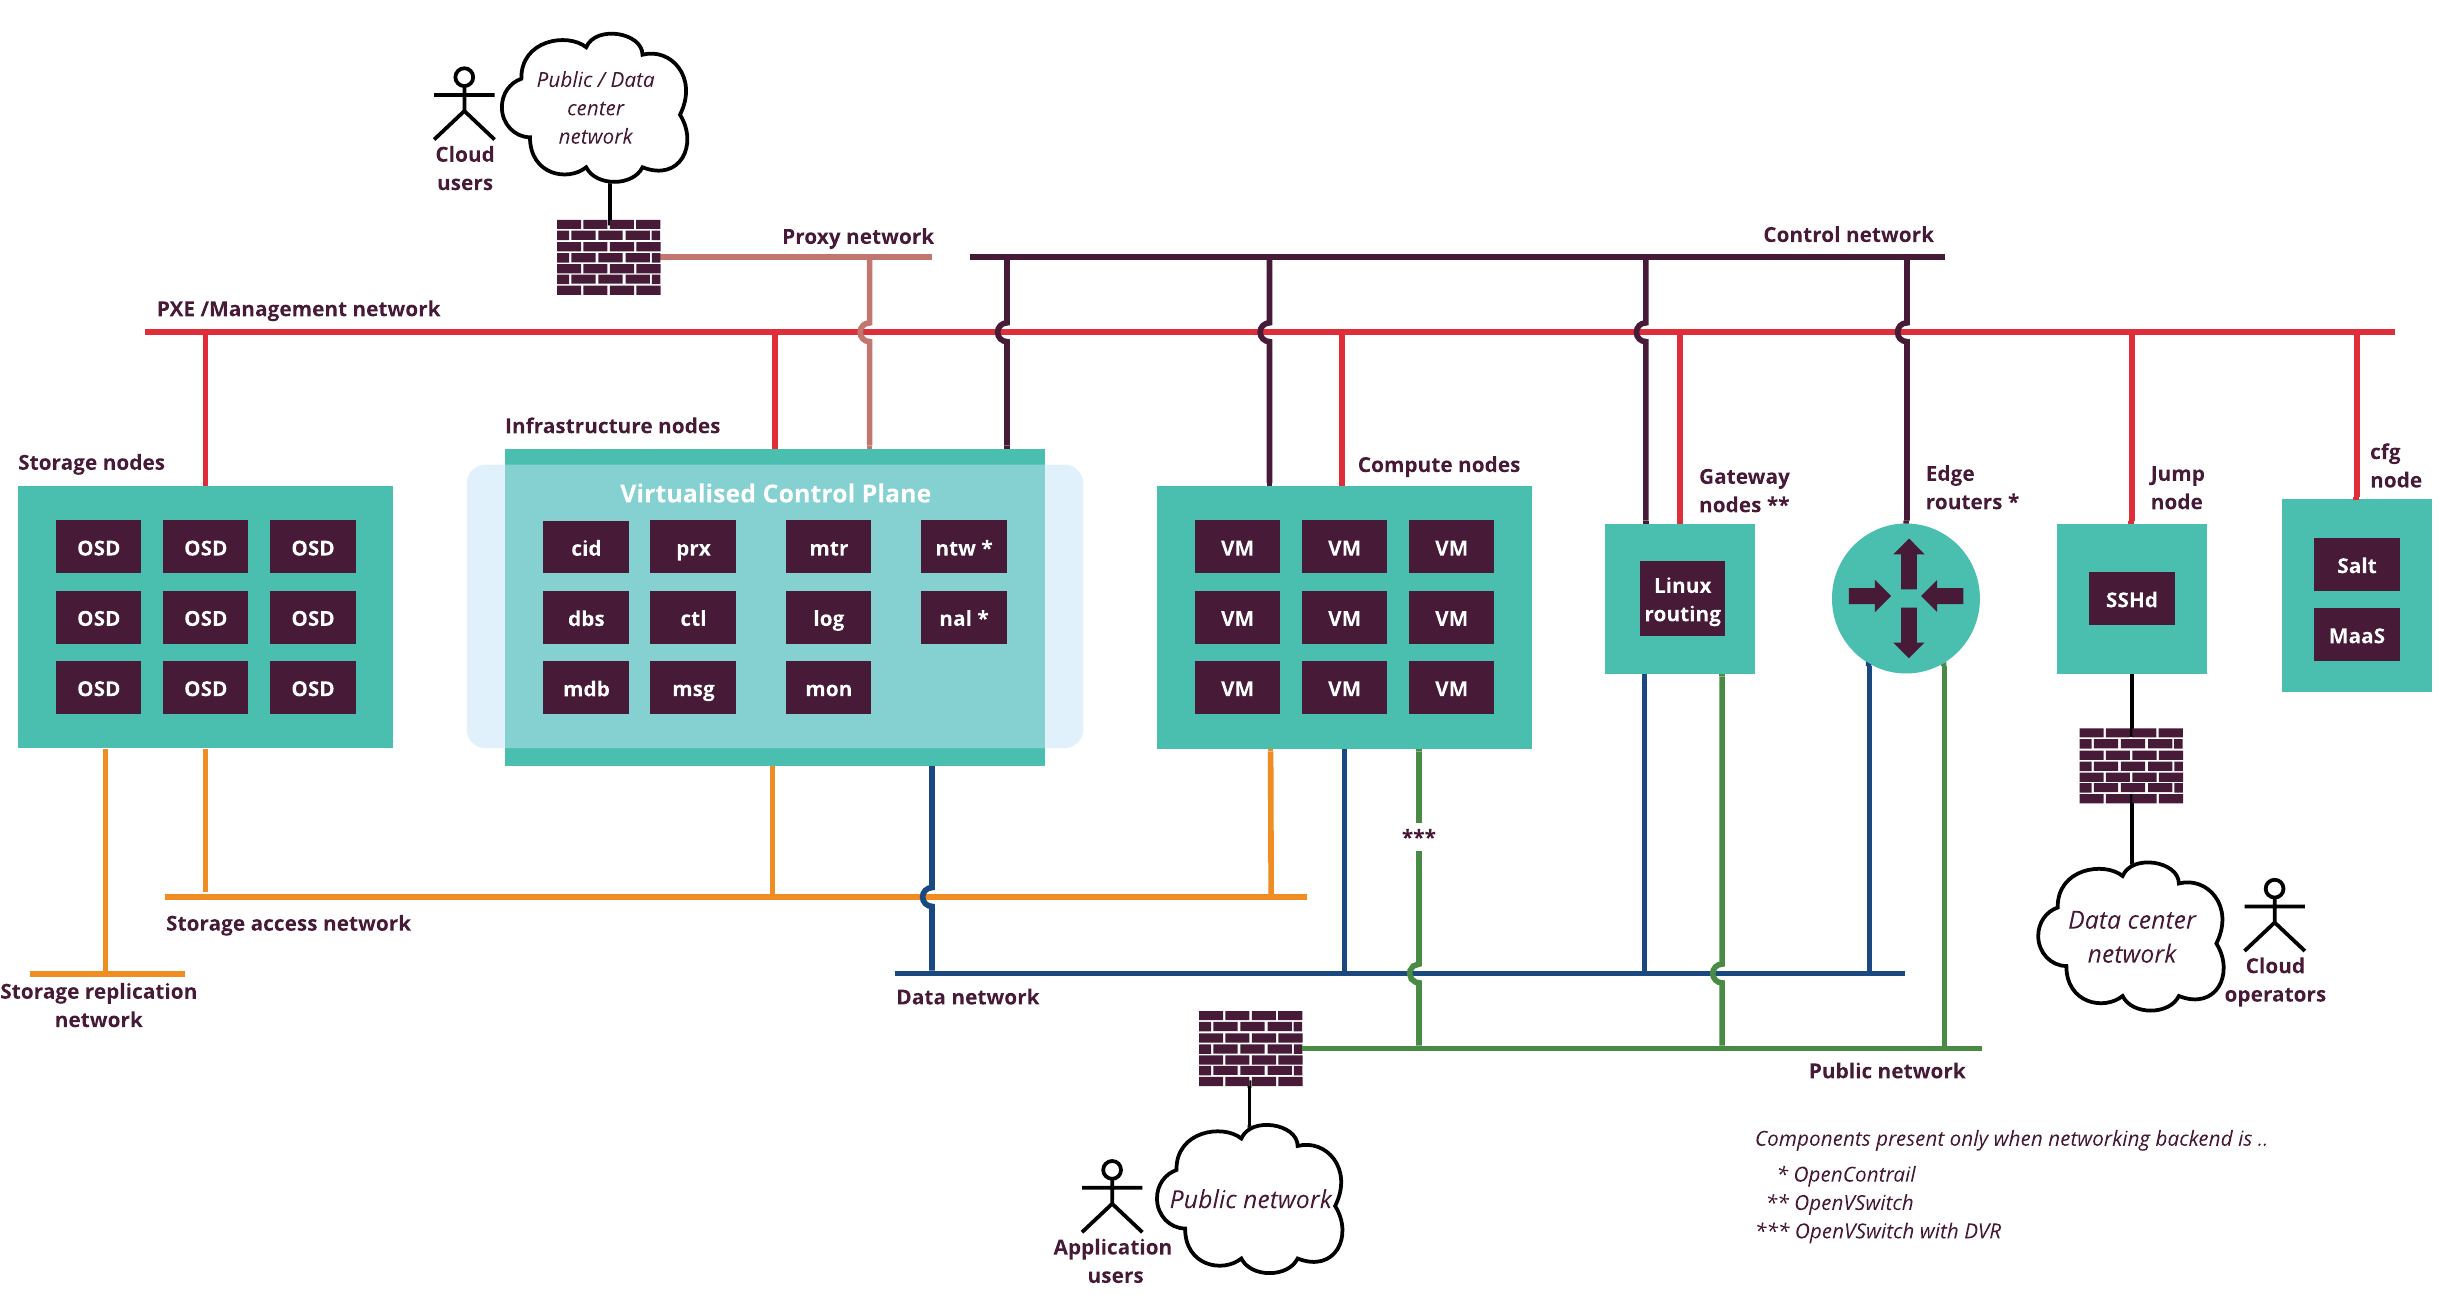
Hardware requirements for Cloud Provider Infrastructure
The reference architecture for MCP Cloud Provider Infrastructure (CPI) use case requires 9 infrastructure nodes to run the control plane services.
The following diagram displays the components mapping of the infrastructure nodes in the CPI reference architecture.
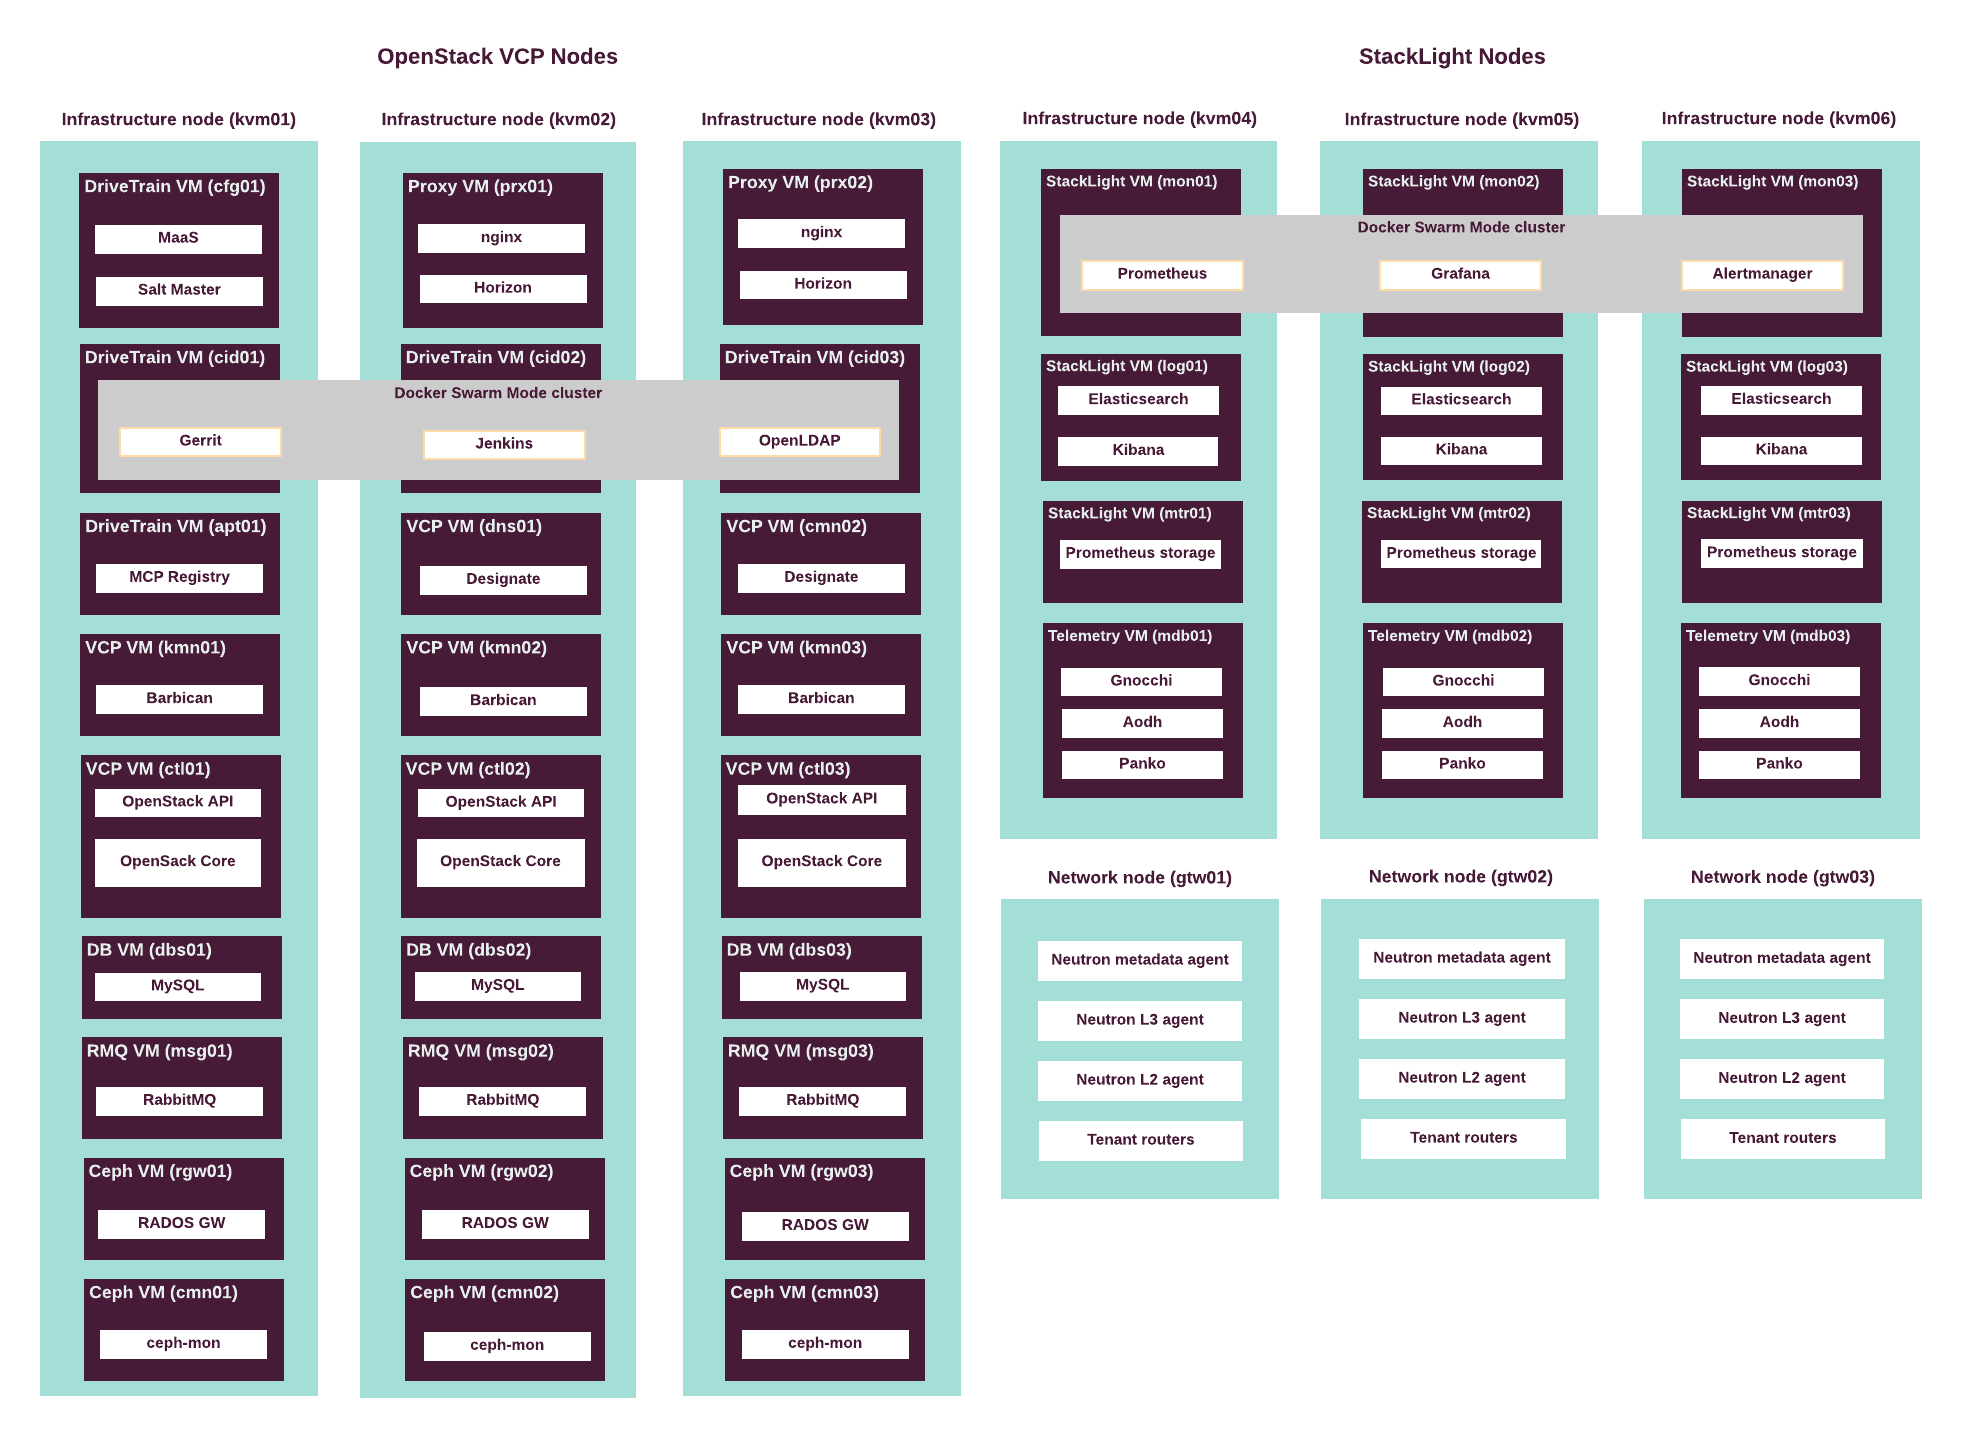
Hardware requirements for the CPI reference architecture are based on the capacity requirements of the control plane virtual machines and services. See details in Virtualized control plane layout.
The following table summarizes the actual configuration of the hardware infrastucture nodes used by Mirantis to validate and verify the CPI reference architecture. Use it as a reference to plan the hardware bill of materials for your installation of MCP.
| Server role | Servers number | Server model | CPU model | CPUs number | vCores number | RAM, GB | Storage, GB | NIC model | NICs number |
|---|---|---|---|---|---|---|---|---|---|
| Infrastructure node (VCP) | 3 | Supermicro SYS-6018R-TDW | Intel E5-2650v4 | 2 | 48 | 256 | 1900 [1] | Intel X520-DA2 | 2 |
| Infrastructure node (StackLight LMA) | 3 | Supermicro SYS-6018R-TDW | Intel E5-2650v4 | 2 | 48 | 256 | 5700 [2] | Intel X520-DA2 | 2 |
| Tenant gateway | 3 | Supermicro SYS-6018R-TDW | Intel E5-2620v4 | 1 | 16 | 96 | 960 [3] | Intel X520-DA2 | 2 |
| Compute node | 50 to 150 | Supermicro SYS-6018R-TDW | [4] | [4] | [4] | [4] | 960 [3] [5] | Intel X520-DA2 | 2 |
| Ceph OSD | 9+ [6] | Supermicro SYS-6018R-TDW | Intel E5-2620v4 | 1 | 16 | 96 | 960 [3] [7] | Intel X520-DA2 | 2 |
| [1] | One SSD, Micron 5200 MAX or similar. |
| [2] | Three SSDs, 1900 GB each, Micron 5200 MAX or similar. |
| [3] | (1, 2, 3) Two SSDs, 480 GB each, WD Blue 3D (WDS500G2B0A) or similar. |
| [4] | (1, 2, 3, 4) Depends on capacity requirements and compute planning. See details in Compute nodes planning. |
| [5] | Minimal system storage. Additional storage for virtual server instances might be required. |
| [6] | Minimal recommended number of Ceph OSD nodes for production deployment is 9. See details in Additional Ceph considerations. |
| [7] | Minimal system storage. Additional devices are required for Ceph storage, cache, and journals. For more details on Ceph storage configuration, see Ceph OSD hardware considerations. |
Note
RAM capacity of this hardware configuration includes overhead
for GlusterFS servers running on the infrastructure nodes
(kvm01, kvm02, and kvm03).
The rule of thumb for capacity planning of the infrastructure nodes is to have at least 10% more RAM than planned for all virtual machines on the host combined. This rule is also applied by StackLight LMA, and it will start sending alerts if less than 10% or 8 GB of RAM is free on an infrastructure node.
See also
Control plane virtual machines
MCP cluster infrastructure consists of a set of virtual machines that host the services required to manage workloads and respond to API calls.
MCP clusters includes a number of logical roles that define functions of its nodes. Each role can be assigned to a specific set of the control plane virtual machines. This allows to adjust the number of instances of a particular role independently of other roles, providing greater flexibility to the environment architecture.
To ensure high availability and fault tolerance, the control plane of an MCP cluster typically spreads across at least three physical nodes. However, depending on your hardware you may decide to break down the services on a larger number of nodes. The number of virtual instances that must run each service may vary as well.
The reference architecture for Cloud Provider Infrastructure use case uses 9 infrastructure nodes to host the MCP control plane services.
The following table lists the roles of infrastructure logical nodes and their standard code names used throughout the MCP metadata model:
| Server role | Server role codename in metadata model | Description |
|---|---|---|
| Infrastructure node | kvm |
Infrastructure KVM hosts that provide virtualization platform all VCP component |
| Network node | gtw |
Nodes that provide tenant network data plane services. |
| DriveTrain Salt Master node | cfg |
The Salt Master node that is responsible for sending commands to Salt Minion nodes. |
| DriveTrain LCM engine node | cid |
Nodes that run DriveTrain services in containers in Docker Swarm mode cluster. |
| RabbitMQ server node | msg |
Nodes that run the message queue server (RabbitMQ). |
| Database server node | dbs |
Nodes that run the clustered MySQL database (Galera). |
| OpenStack controller node | ctl |
Nodes that run the Virtualized Control Plane service, including the OpenStack API servers and scheduler components. |
| OpenStack compute node | cmp |
Nodes that run the hypervisor service and VM workloads. |
| OpenStack DNS node | dns |
Nodes that run OpenStack DNSaaS service (Designate). |
| OpenStack secrets storage nodes | kmn |
Nodes that run OpenStack Secrets service (Barbican). |
| OpenStack telemetry database nodes | mdb |
Nodes that run the Telemetry monitoring database services. |
| Proxy node | prx |
Nodes that run reverse proxy that exposes OpenStack API, dashboards, and other components externally. |
| Contrail controller nodes | ntw |
Nodes that run the OpenContrail controller services. |
| Contrail analytics nodes | nal |
Nodes that run the OpenContrail analytics services. |
| StackLight LMA log nodes | log |
Nodes that run the StackLight LMA logging and visualization services. |
| StackLight LMA database nodes | mtr |
Nodes that run the StackLight database services. |
| StackLight LMA nodes | mon |
Nodes that run the StackLight LMA monitoring services. |
| Ceph RADOS gateway nodes | rgw |
Nodes that run Ceph RADOS gateway daemon and expose Object Storage API. |
| Ceph Monitor nodes | cmn |
Nodes that run Ceph Monitor service. |
| Ceph OSD nodes | osd |
Nodes that provide storage devices for Ceph cluster. |
Note
In the Cloud Provider reference configuration, Ceph OSDs run on dedicated hardware servers. This reduces operations complexity, isolates the failure domain, and helps avoid resources contention.
See also
Networking
This section describes the key hardware recommendations on server and infrastructure networking, as well as switching fabric capabilities for CPI reference architecture.
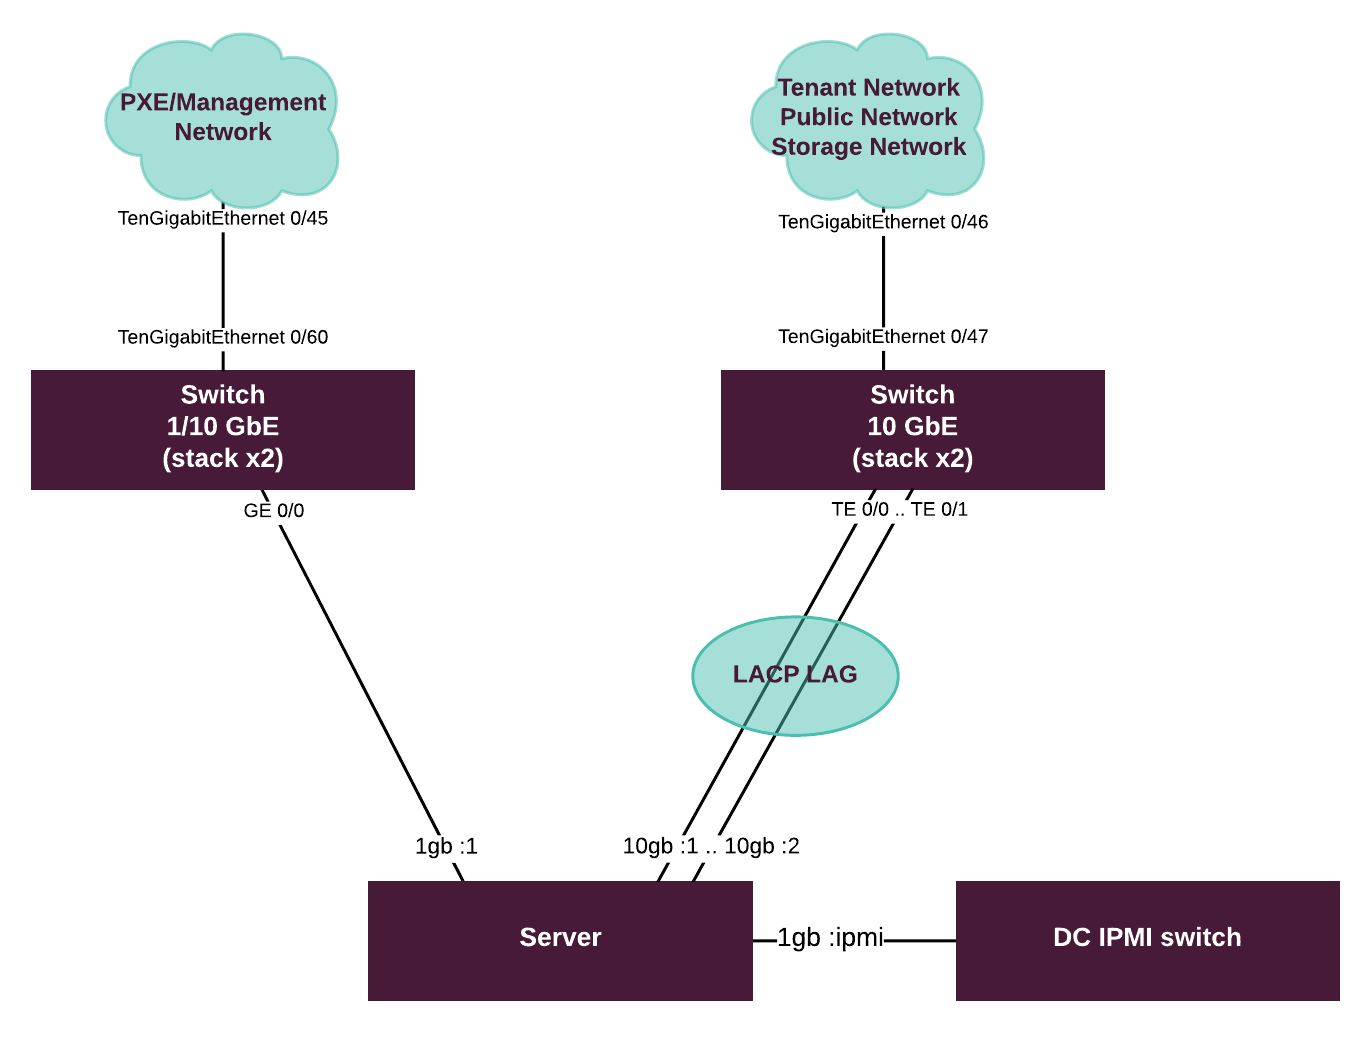
Server networking
Server machines used in CPI reference architecture have 1 built-in dual port 1 GbE network interface card (NIC), and two additional 1/10 GbE NICs.
The built-in NIC is used for network boot of the servers. Only one interface is typically for PXE boot, the other one is kept unused for redundancy.
The first pair of 1/10 Gbit Ethernet interfaces is used for the management and control plane traffic. These interfaces should be connected to an access switch in 1 or 10 GbE mode.
In CPI referernce architecture, the interfaces of the first NIC are
joined in a bond logical interface in 802.3ad mode.
The second NIC with two interfaces is used for the data plane traffic and
storage traffic. On the operating system level, ports on this 1/10 GbE card
are joined into an LACP bond (Linux bond mode 802.3ad).
Recommended LACP load balancing method for both bond interfaces is
transmission hash policy based on TCP/UDP port numbers (xmit_hash_policy
layer3+4).
This NIC must be connected to an access switch in 10 GbE mode.
Note
The LACP configuration in 802.3ad mode on the server side must
be supported by the corresponding configuration of switching fabric.
See Switching fabric capabilities for details.
Access networking
The top of the rack (ToR) switches provide connectivity to servers on physical and data-link levels. They must provide support for LACP and other technologies used on the server side, for example, 802.1q VLAN segmentation. Access layer switches are used in stacked pairs.
In MCP CPI reference architecture validation lab, the following 10 GbE switches were used as the top of the rack (ToR) for PXE, Management Public, Storage, and Tenant networks in MCP:
- Dell Force10 S4810P 48x 10 GbE ports, 4x 40 GbE ports
Use this a reference when planning the hardware bill of materials for your installation of MCP.
The following diagram illustrates how a server is connected to the switching fabric and how the fabric itself is configured.
Switching fabric capabilities
The following table summarizes requirements for the switching fabric capabilities:
| Name of requirement | Description |
|---|---|
| LACP TCP/UDP hash balance mode | Level 4 LACP hash balance mode is recommended to support services that employ TCP sessions. This helps to avoid fragmentation and asymmetry in traffic flows. |
| Multihome server connection support | There are two major options to support multihomed server connections:
|
| LAG/port-channel links | The number of supported LAGs/port-channel links per switch must be twice the number of ports. Take this parameter into account so that you can create the required number of LAGs to accommodate all servers connected to the switch. |
Note
LACP configurations on access and server levels must be compatible with each other. In general, it might require additional design and testing effort in every particular case, depending on the models of switching hardware and the requirements to networking performance.
Multi-cluster architecture
Note
The major limitation of the DriveTrain multi-cluster architecture as of MCP Build ID 2019.2.0 is that all clusters managed by a single instance of DriveTrain must have the same version and must be updated simultaneously to the new release of MCP. Some LCM operations on the clusters of earlier versions might not be possible. The only operation supported in this case is update/upgrade operation.
Mirantis Cloud Platform (MCP) can manage multiple disparate clusters using the same DriveTrain and infrastructure node installation. The following clusters are supported:
- OpenStack environments
- Kubernetes clusters support terminated since 2019.2.5
MCP provides the means to manage these sets of clusters using one DriveTrain installation over the L3 network. The cloud operator can execute such operations as applying the global configuration changes to a set of clusters or to an individual cluster, update cluster components, such as OpenStack services, and so on.
Starting with MCP release 2019.2.0, the updated recommendation is to avoid using single model structure to describe multiple clusters. Your cluster is more efficient and scalable if you describe every cluster in a separate model structure, stored in separate Git repository. This way, every cluster has dedicated Salt Master that uses a metadata model specific to that particular cluster. It also makes it easier to manage models using a multi-cluster orchestrator external to Salt Master.
A Jenkins deployment pipeline enables you to specify the URL and credentials of the Salt Master API endpoint that will be called upon the execution of the pipeline. Use the following pipeline parameters to designate the Salt Master service:
SALT_MASTER_URLSALT_MASTER_CREDENTIALS
The targeted Salt Master node then distributes appropriate changes to targeted nodes.
Note
MAAS and StackLight LMA do not support multi-cluster environments. These components are installed per cluster and used only for that cluster.
One of the most common use cases of a multi-cluster architecture is the installation of a staging cluster next to a production one. The staging environment is managed by the same instance of DriveTrain as the production cluster.
The instance of DriveTrain that manages multiple clusters should be installed separately from managed clusters and have its own cluster model, not be included in staging or production environment models.
The following diagram describes a high-level multi-cluster architecture:

Staging environment
Mirantis recommends creating a staging environment for any production purposes. Thus, a typical MCP installation should consist of at least two clusters of the same kind (OpenStack or Kubernetes): for staging and production.
Mirantis recommends you install the staging environment first and reuse as much as possible of the Reclass cluster model of the staging environment to deploy production environment(s). Having a staging environment with a control plane topology that differs from the production environment is considered impractical.
Consider installing a staging environment for your production environment if:
- You will run mission-critical workloads in your production environment.
- You plan to install more than one production environment in the same or similar topology.
- You plan to develop custom components or integrate an external service with MCP.
In any case, the staging environment provides you with a testing sandbox to test any changes in configuration or versions of artifacts before you apply it to your production environment.
Note
DriveTrain pipeline jobs allow you to select what Salt Master node should be called during the particular build/run of the pipeline job. This allows you to target staging and production environments separately. See more details in the Multi-cluster architecture section.
OpenStack cluster
MCP enables you to deploy one or multiple OpenStack environments to address the needs of your data center.
Coupled together with the deployment automation, native logging, monitoring, and alerting component, as well as with support for OpenContrail and Open vSwitch networking, an MCP OpenStack environment represents a reliable, scalable, and flexible cloud solution that supports numerous types of workloads and applications.
OpenStack cloud capabilities
The following capabilities are available to users of the MCP-based OpenStack clouds:
- Upload and manage virtual machine disk images to object storage using the OpenStack Image (Glance) API.
- Assign storage, network, and other infrastructural resources to the virtual machines upfront and at the runtime using the OpenStack Networking (Neutron) API.
- Boot and run virtual machines on a KVM hypervisor under the OpenStack management from the uploaded images, or from block storage through the OpenStack Compute (Nova) API.
- Migrate virtual machines between hypervisors and their groups, with or without interruption of the workload running on the virtual machine, depending on availability of a shared storage for disk images. This ability is provided by the Compute API.
- Connect remote or local block storage resources to the virtual machines using the OpenStack Block Storage (Cinder) API.
- Configure virtual load balancers through the OpenStack Load Balancing-as-a-Service (Octavia) API.
- Configure DNS names for their virtual server instances through the DNS-as-a-Service (Designate) API.
- Access all API endpoints of the OpenStack cloud over connections secured by SSL/TLS protocols.
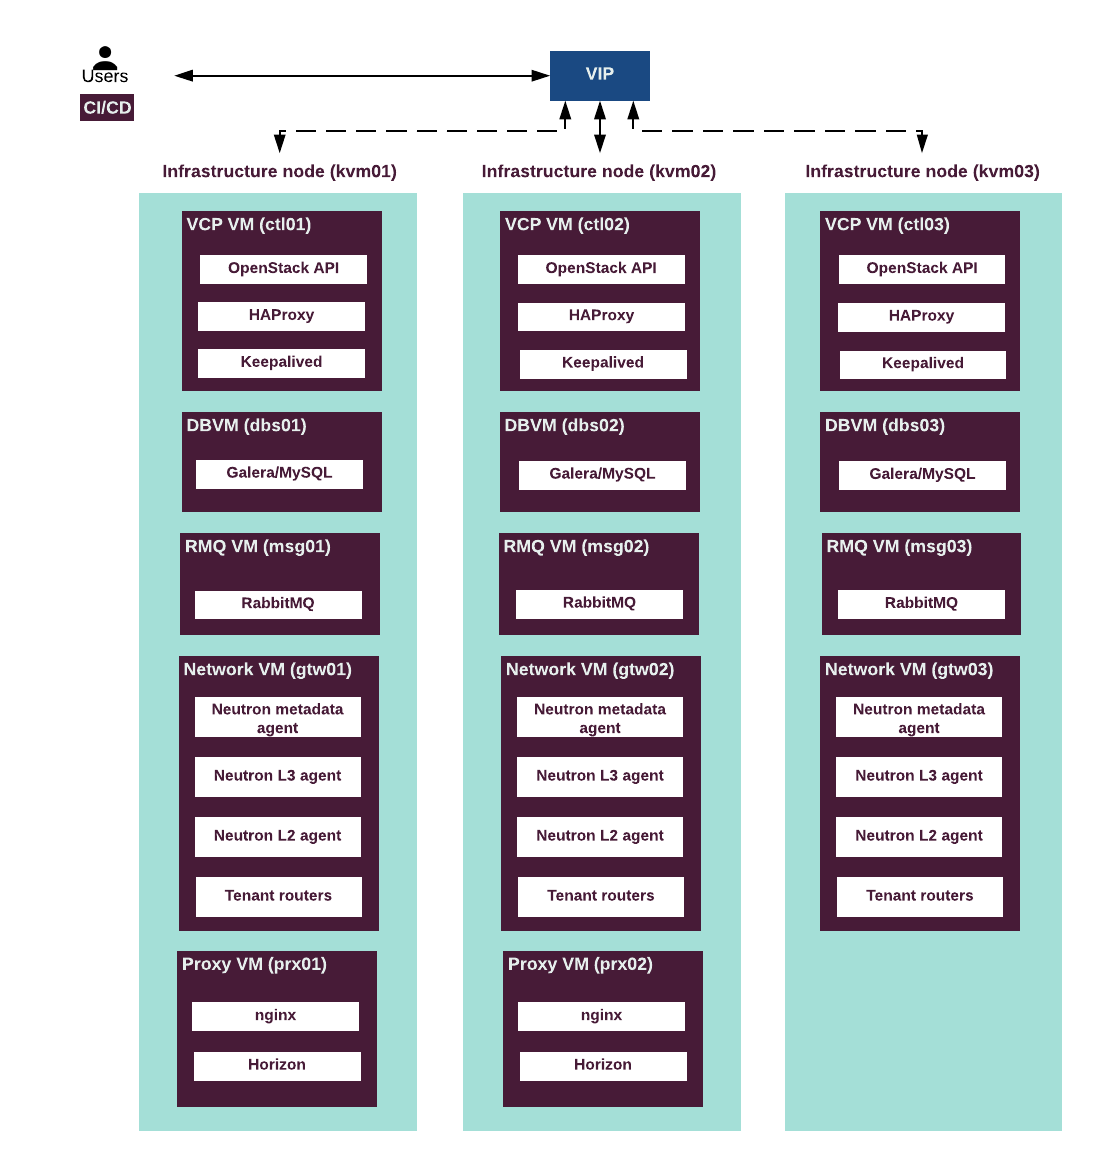
OpenStack compact cloud
The Compact Cloud is an OpenStack-based reference architecture for MCP. It is designed to provide a generic public cloud user experience to the cloud tenants in terms of available virtual infrastructure capabilities and expectations. It features reduced control plane footprint, at the cost of reduced maximum capacity.
The compact reference architecture is designed to support up to 500 virtual servers or 50 hypervisor hosts. In addition to the desirable number of hypervisors, 3 infrastructure physical servers are required for the control plane. These 3 servers host the OpenStack virtualized control plane (VCP), StackLight services, and virtual Neutron gateway nodes.
Note
Out of the box, the compact reference architecture supports only Neutron OVS networking for OpenStack. DVR is enabled by default.
OpenContrail is not supported out of the box in the compact reference architecture.
The following diagram describes the distribution of VCP and other services throughout the infrastructure nodes.
The following table describes the hardware nodes in the CPI reference architecture, roles assigned to them, and the number of nodes of each type.
| Node type | Role name | Number of servers |
|---|---|---|
| Infrastructure nodes (VCP) | kvm |
3 |
| OpenStack compute nodes | cmp |
up to 50 |
| Staging infrastructure nodes | kvm |
3 |
| Staging compute nodes | cmp |
2 - 5 |
The following table summarizes the VCP virtual machines mapped to physical servers.
| Virtual server roles | Physical servers | # of instances | CPU vCores per instance | Memory (GB) per instance | Disk space (GB) per instance |
|---|---|---|---|---|---|
ctl |
kvm01
kvm02
kvm03 |
3 | 8 | 32 | 100 |
msg |
kvm01
kvm02
kvm03 |
3 | 8 | 32 | 100 |
dbs |
kvm01
kvm02
kvm03 |
3 | 8 | 16 | 100 |
prx |
kvm02
kvm03 |
2 | 4 | 8 | 50 |
cfg |
kvm01 |
1 | 2 | 8 | 50 |
mon |
kvm01
kvm02
kvm03 |
3 | 4 | 16 | 500 |
mtr |
kvm01
kvm02
kvm03 |
3 | 4 | 32 | 1000 |
log |
kvm01
kvm02
kvm03 |
3 | 4 | 32 | 2000 |
cid |
kvm01
kvm02
kvm03 |
3 | 8 | 32 | 100 |
gtw |
kvm01
kvm02
kvm03 |
3 | 4 | 16 | 50 |
mdb |
kvm01
kvm02
kvm03 |
3 | 4 | 8 | 150 |
| TOTAL | 30 | 166 | 672 | 12450 |
Note
- The
gtwVM should have four separate NICs for the following interfaces:dhcp,primary,tenant, andexternal. It simplifies the host networking as you do not need to pass VLANs to VMs. - The
prxVM should have an additional NIC for the proxy network. - All other nodes should have two NICs for DHCP and primary networks.
See also
- Control plane virtual machines for the details on the functions of nodes of each type.
- Hardware requirements for Cloud Provider Infrastructure for the reference hardware configuration for each type of node.
OpenStack Cloud Provider infrastructure
The Cloud Provider infrastructure (CPI) is an OpenStack-based reference architecture for MCP. It is designed to provide a generic public cloud user experience to the cloud tenants in terms of available virtual infrastructure capabilities and expectations.
The reference customer persona for the MCP CPI reference architecture is a Cloud Services Provider, provider of a generic cloud service (public or private).
The CPI reference architecture is designed to support up to 2000 virtual servers or 150 hypervisor hosts. In addition to the desirable number of hypervisors, 9 infrastructure physical servers are required for the control plane. These include 3 servers dedicated to StackLight LMA services and 3 servers for the Neutron gateway nodes. The gateway nodes host virtual routers that provide network connectivity to virtual servers in the cloud.
Note
Out of the box, the CPI reference architecture supports only Neutron OVS networking for OpenStack. DVR is enabled by default.
OpenContrail is not supported out of the box in the CPI reference architecture.
The following table describes the hardware nodes in the CPI reference architecture, roles assigned to them and the number of nodes of each type.
| Node type | Role name | Number of servers |
|---|---|---|
| Infrastructure nodes (VCP) | kvm |
3 |
| Infrastructure nodes (StackLight LMA) | kvm |
3 |
| Tenant network gateway nodes | gtw |
3 |
| OpenStack compute nodes | cmp |
50 - 150 |
| Staging infrastructure nodes | kvm |
3 |
| Staging infrastructure nodes (StackLight LMA) | kvm |
3 |
| Staging tenant network gateway nodes | gtw |
3 |
| Staging compute nodes | cmp |
2 - 5 |
See also
- Control plane virtual machines for the details on the functions of nodes of each type.
- Hardware requirements for Cloud Provider Infrastructure for the reference hardware configuration for each type of node.
- Virtualized control plane layout for the details on layout of control plane services across physical infrastructure servers.
OpenStack large cloud
The Large Cloud is an OpenStack-based reference architecture for MCP. It is designed to provide a generic public cloud user experience to the cloud tenants in terms of available virtual infrastructure capabilities and expectations.
The large reference architecture is designed to support up to 5000 virtual servers or 500 hypervisor hosts. In addition to the desirable number of hypervisors, 18 infrastructure physical servers are required for the control plane. This number includes 9 servers that host OpenStack virtualized control plane (VCP), 6 servers dedicated to the StackLight services, and 3 servers for the OpenContrail control plane.
The following diagram describes the distribution of VCP and other services throughout the infrastructure nodes.

The following table describes the hardware nodes in the CPI reference architecture, roles assigned to them, and the number of nodes of each type.
| Node type | Role name | Number of servers |
|---|---|---|
| Infrastructure nodes (VCP) | kvm |
9 |
| Infrastructure nodes (OpenContrail) | kvm |
3 |
| Monitoring nodes (StackLight LMA) | mon |
3 |
| Infrastructure nodes (StackLight LMA) | kvm |
3 |
| OpenStack compute nodes | cmp |
200 - 500 |
| Staging infrastructure nodes | kvm |
18 |
| Staging OpenStack compute nodes | cmp |
2 - 5 |
The following table summarizes the VCP virtual machines mapped to physical servers.
| Virtual server roles | Physical servers | # of instances | CPU vCores per instance | Memory (GB) per instance | Disk space (GB) per instance |
|---|---|---|---|---|---|
ctl |
kvm02 kvm03 kvm04 kvm05 kvm06 |
5 | 24 | 128 | 100 |
dbs |
kvm04 kvm05 kvm06 |
3 | 24 | 64 | 1000 |
msg |
kvm07 kvm08 kvm09 |
3 | 32 | 196 | 100 |
prx |
kvm07 kvm08 |
2 | 8 | 32 | 100 |
mdb |
kvm07 kvm08 kvm09 |
3 | 8 | 32 | 150 |
| TOTAL | 16 | 328 | 1580 | 4450 |
| Virtual server roles | Physical servers | # of instances | CPU vCores per instance | Memory (GB) per instance | Disk space (GB) per instance |
|---|---|---|---|---|---|
cfg |
kvm01 |
1 | 8 | 32 | 50 |
cid |
kvm01 kvm02 kvm03 |
3 | 4 | 32 | 500 |
| TOTAL | 4 | 20 | 128 | 1550 |
| Virtual server roles | Physical servers | # of instances | CPU vCores per instance | Memory (GB) per instance | Disk space (GB) per instance |
|---|---|---|---|---|---|
ntw |
kvm10 kvm11 kvm12 |
3 | 16 | 64 | 100 |
nal |
kvm10 kvm11 kvm12 |
3 | 24 | 128 | 2000 |
| TOTAL | 6 | 120 | 576 | 6300 |
| Virtual server roles | Physical servers | # of instances | CPU vCores per instance | Memory (GB) per instance | Disk space (GB) per instance |
|---|---|---|---|---|---|
cmn |
kvm01 kvm02 kvm03 |
3 | 16 | 32 | 100 |
rgw |
kvm01 kvm02 kvm03 |
3 | 16 | 32 | 50 |
| TOTAL | 6 | 96 | 192 | 450 |
| Virtual server roles | Physical servers | # of instances | CPU vCores per instance | Memory (GB) per instance | Disk space (GB) per instance |
|---|---|---|---|---|---|
mon |
kvm16 kvm17 kvm18 |
3 | 24 | 256 | 1000 [0] |
mtr |
kvm13 kvm14 kvm15 |
3 | 16 | 196 | 3000 [0] |
log |
kvm13 kvm14 kvm15 |
3 | 16 | 64 [1] | 5000 [2] |
| TOTAL | 9 | 192 | 1548 | 27000 |
| [0] | (1, 2) The required disk space per instance depends on the Prometheus retention
policy, which by default is 5 days for mon nodes and 180 days for
mtr nodes. |
| [1] | The Elasticsearch heap size must not exceed 32 GB. For details, see Limiting memory usage. To limit the heap size, see MCP Operations Guide: Configure Elasticsearch. |
| [2] | The required disk space per instance depends on the Elasticsearch retention policy, which is 31 days by default. |
Note
- The
prxVM should have an additional NIC for the Proxy network. - All other nodes should have two NICs for DHCP and Primary networks.
See also
- Control plane virtual machines for the details on the functions of nodes of each type
- Hardware requirements for Cloud Provider Infrastructure for the reference hardware configuration for each type of node.
Virtualized control plane
The MCP virtualized control plane (VCP) provides all services and components required to manage the virual infrastructure of the cloud platform.
Virtualized control plane overview
Virtualized control plane (VCP) consists of the services required to manage workloads and respond to API calls. VCP is the heart and brain of your OpenStack deployment that controls all logic responsible for managing OpenStack-based virtual infrastructure and provide the OpenStack cloud capabilities.
For the sake of clarity, we split the OpenStack VCP services into the core and extension services.
The OpenStack VCP core services are dealing with the virtual infrastructure
resources, sush as virtual machines, images, networks, and
so on. From the layout standpoint, one instance of each
core service runs in the combined control plane virtual node called
ctl in terms of the metadata model.
The OpenStack VCP extension services enable management of the resources consumed by the workloads indrectly, such as DNS names, virtual load balancers, and so on. Unlike the core services, the extensions typically run on the dedicated virtual nodes. See the Control plane virtual machines for details.
Note
Core and extension services are considered mandatory in the Mirantis OpenStack reference architecture.
OpenStack VCP Core services
The following table summarizes the core capabilities provided by MCP Cloud Provider Infrastructure as APIs, services that provide specific parts of that API, the default and optional backends used by these services, where applicable.
| API type | Capabilities provided | Service | Default back-end | Optional back-ends |
|---|---|---|---|---|
| Compute | Boot and run virtual machines | Nova | Linux KVM | N/A |
| Identity | Control ownership, access and quota for the virtual resources | Keystone | N/A | N/A |
| Image | Create and manage VM disk images and snapshots | Glance | Ceph | GlusterFS |
| Networking | Create, manage and connect virtual overlay networks for the VMs | Neutron | OpenVSwitch | OpenContrail |
| Orchestration | Create and manage templates and instances of virtual infrastructures | Heat | N/A | N/A |
| Dashboard | Access dashboard UI for managing the virtual resources | Horizon | N/A | N/A |
| Block storage | Create, manage and connect block storage resources to the VMs | Cinder | Ceph | LVM |
| Object storage | Create, download and manage storage objects | Ceph RADOS Gateway | Ceph | N/A |
OpenStack VCP extension services
The following table summarizes the extension capabilities provided by MCP Cloud Provider Infrastructure as APIs, services that provide these APIs, the default and optional backends used by these services, where applicable.
| API Type | Capabilities provided | Service | Default back-end | Optional back-ends |
|---|---|---|---|---|
| Load Balancer | Create, configure and manage virtual load balancers for tenant workloads | Octavia | HAProxy | N/A |
| Domain Name Service | Create and manage DNS names for tenant workloads | Designate | PowerDNS | N/A |
| Secrets management | Store and manage certificates and other types of secrets for tenant workloads | Barbican | DogTag | N/A |
| Telemetry | Collect, store, and expose usage and utilization data for the virtual resources |
|
N/A | N/A |
OpenStack VCP extra services
Caution
Manila deprecation notice
In the MCP 2019.2.7 update, the OpenStack Manila component is being considered for deprecation. The corresponding capabilities are still available, although not further enhanced.
Starting with the 2019.2.11 maintenance update, the OpenStack Manila component will no longer be supported by Mirantis. For those existing customers who have the Manila functionality explicitly included in the scope of their contracts, Mirantis will continue to fulfill the corresponding support obligations.
The extra services provide additional capabilities supported by MCP, but not included in the reference architecture. See the supported versions of these components in Release Notes: Components Versions.
The following table summarizes the extra capabilities provided by MCP OpenStack platform as APIs, services that provide these APIs, the default and optional backends used by these services, where applicable.
| API type | Capabilities provided | Service | Default backend | Optional backends |
|---|---|---|---|---|
| Shared Storage | Create, configure, and manage shared storage folders for tenant workloads | Manila | NFS | N/A |
| Bare metal | Provision bare-metal servers as virtual instances through OpenStack API | Ironic [0] | N/A | N/A |
| [0] | Starting from the 2019.2.6 maintenance update, Ironic is officially supported and integrated into MCP. Before the 2019.2.6 maintenance update, Ironic is available as technical preview and can be used for testing and evaluation purposes only. |
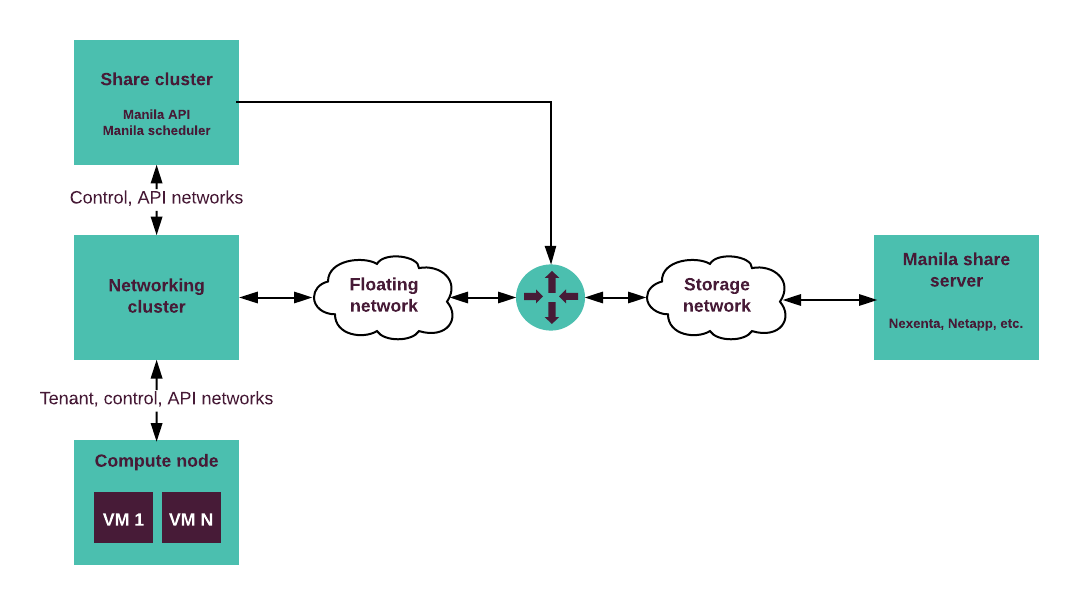
Manila storage networking planning
Caution
Manila deprecation notice
In the MCP 2019.2.7 update, the OpenStack Manila component is being considered for deprecation. The corresponding capabilities are still available, although not further enhanced.
Starting with the 2019.2.11 maintenance update, the OpenStack Manila component will no longer be supported by Mirantis. For those existing customers who have the Manila functionality explicitly included in the scope of their contracts, Mirantis will continue to fulfill the corresponding support obligations.
Since OpenStack Manila is a share-as-a-service component, it requires network to be configured properly to reach shares from inside virtual machines. The networking approach heavily varies depending on an environment architecture and Manila backend. Some scenarios use the L2 connectivity with network interfaces for share servers created on a tenant-owned subnet. Therefore, virtual machines have direct connectivity to the storage. Such configuration requires a driver that can create share servers for each tenant.
Note
For the list of share drivers and their capabilities supported in OpenStack, see Manila share features support mapping in the official OpenStack documentation.
In some cases, the Manila share server runs on a standalone node that requires a separate network. Such approach requires the L3 connectivity through a router between the floating network and the Manila share server as illustrated on the diagram.
Note
The diagram depicts a common share server configuration.
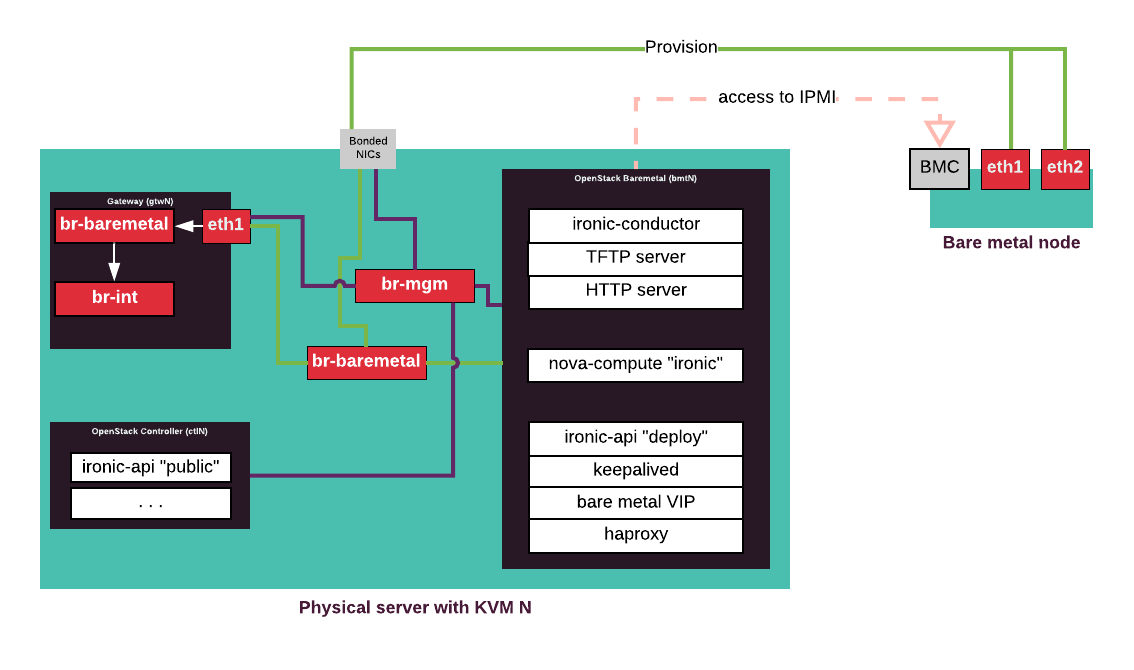
Ironic planning
MCP enables you to provision the OpenStack environment workloads (instances) to bare metal servers using Ironic. Ironic provisions workloads to bare metal servers through the Compute service (Nova) in almost the same way the virtual machines are provisioned.
Note
Starting from the 2019.2.6 maintenance update, Ironic is officially supported and integrated into MCP. Before the 2019.2.6 maintenance update, Ironic is available as technical preview and can be used for testing and evaluation purposes only.
Ironic applies to a number of use cases that include:
- An OpenStack environment contains the workloads that can not be run on virtual machines due to, for example, legacy software installed.
- An OpenStack environment contains the workloads that require high performance as well as no virtualization overhead.
Ironic components
Ironic consists of two main components: ironic-api and
ironic-conductor. Additionally, it requires several auxiliary services for
ironic-conductor including TFTP and HTTP servers. To enable the Compute
service users to provision their workloads on bare metal servers, the
nova-compute service is configured to use the ironic virt-driver.
| Component | Description |
|---|---|
ironic-conductor |
Performs actual node provisioning. Due to security and performance considerations, it is deployed
on separate
bmt* VMs on MCP KVM nodes along with its auxiliary
services. |
ironic-api |
Due to security considerations, two pools of
|
nova-compute |
Separate pool of nova-compute services with ironic virt-driver
deploys on bmt* nodes. |
MCP Ironic supported features and known limitations
This section lists the Ironic drivers and features with known limitations that MCP DriveTrain supports. The driver or feature support in this section stands for the ability of MCP DriveTrain to deploy and configure the features by means of the Ironic Salt formula through the cluster model.
Supported Ironic drivers in MCP include:
- The
ipmihardware type with theiscsideploy interface (thepxe_ipmitoolclassic driver) - The
ilohardware type with theiscsideploy interface (thepxe_iloclassic driver)
Note
Ironic provides an ability to configure both classic drivers and new drivers. The latter drivers are also known as hardware types.
MCP DriveTrain does not support any other than listed above classic drivers and hardware types with other interfaces.
The following table includes the Ironic features and specifies the support status for these features in MCP. The status of any of the items included in this table may change in the future MCP release versions.
| Ironic feature | Support status for MCP Ironic |
|---|---|
| The integration of Cinder that includes the functionality to boot from an iSCSI back-end volume. | Supported |
| The PXE and iPXE boot | Supported, iPXE by default |
| The Ironic integration with the Fluentd logging | Supported since Queens |
The configuration of CORS for ironic-api |
Supported since Queens |
| Multitenancy support | Supported |
| The automated cleanup enablement and setting priorities for the default cleaning steps | Supported |
| The ability to fine-tune the Ironic conductor performance | Not supported |
| The configuration of the console support for the bare metal nodes | Supported since the MCP 2019.2.4 update, shellinabox by default |
The ironic-inspector and Ironic integration with
ironic-inspector |
Not supported |
| The configuration of a custom path to the iPXE boot script | Not supported |
| Compatibility with OpenContrail | Not supported |
MCP does not provide pre-built images for RAMDisk deployment to be used by Ironic during the node provisioning, as well as end-user images to be deployed on bare metal nodes due to high dependency from the hardware specifics.
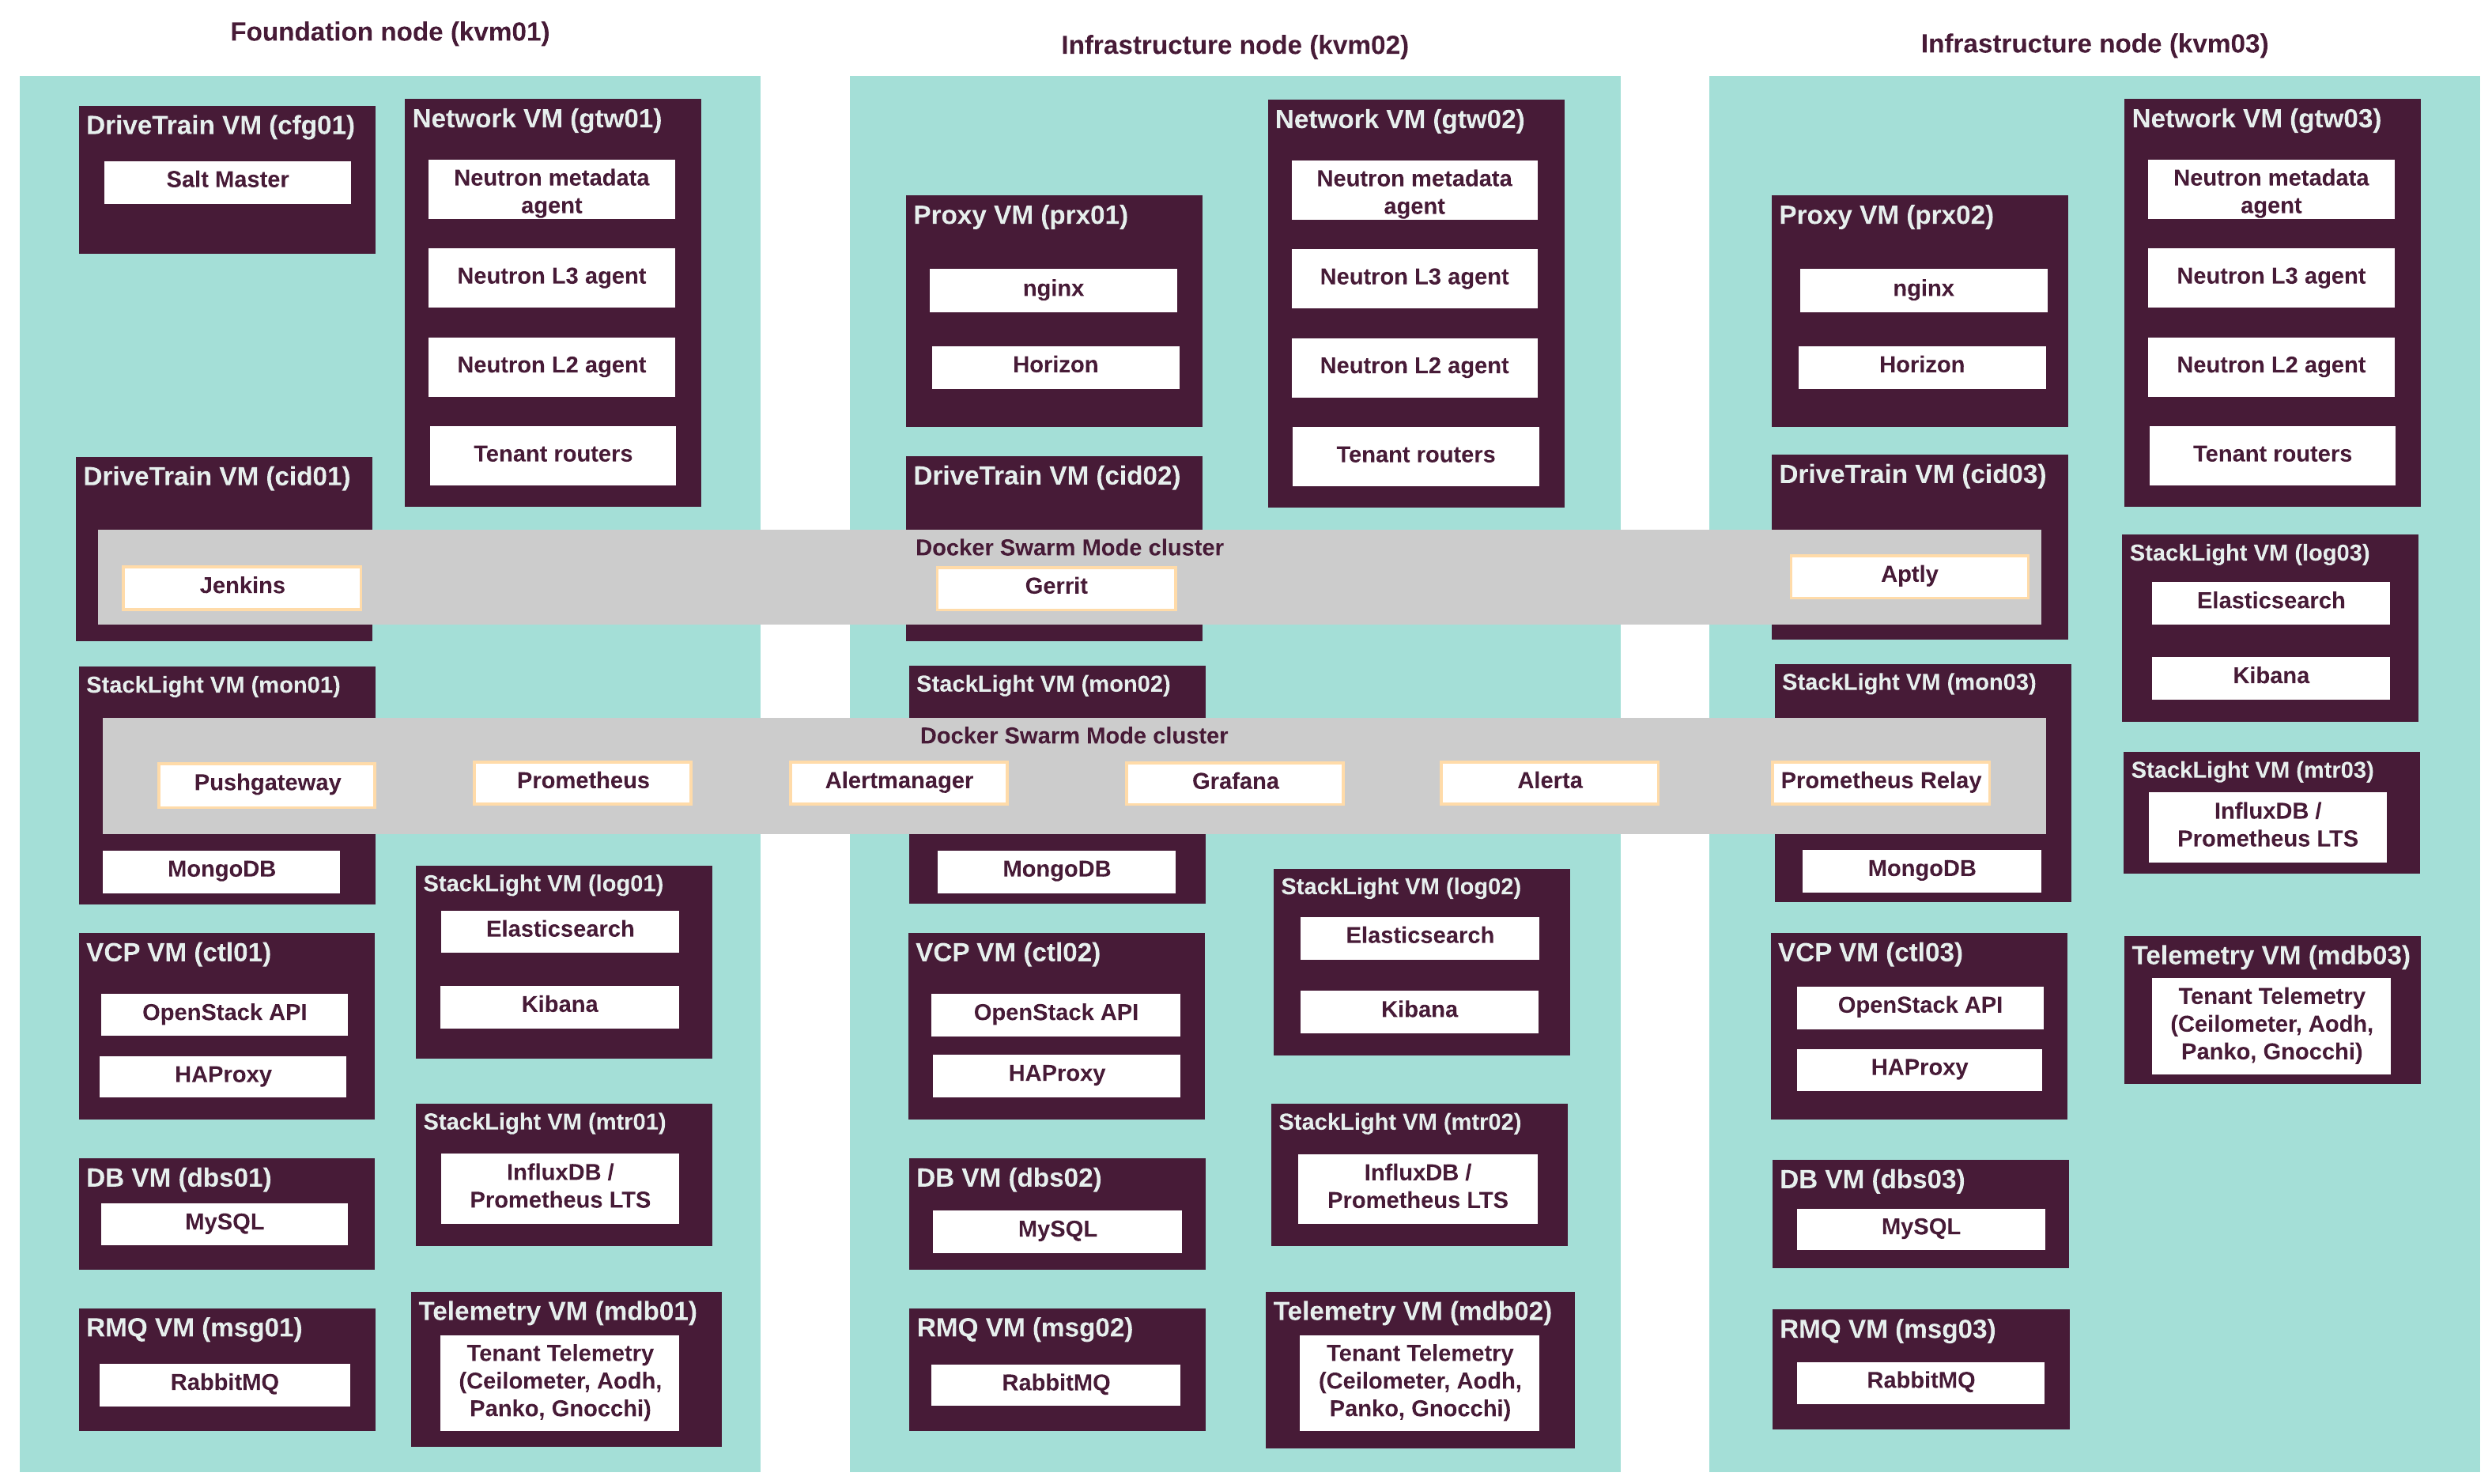
Virtualized control plane layout
The following diagram describes the distribution of OpenStack and other services throughout the infrastructure nodes. For detailed description of the services, see Virtualized control plane.
The following table summarizes the VCP virtual machines mapped to physical servers. See Control plane virtual machines for details.
| Virtual server roles | Physical servers | # of instances | CPU vCores per instance | Memory (GB) per instance | Disk space (GB) per instance |
|---|---|---|---|---|---|
ctl |
kvm01 kvm02 kvm03 |
3 | 16 | 64 | 100 |
kmn |
kvm01 kvm02 kvm03 |
3 | 4 | 8 | 50 |
dns |
kvm02 kvm03 |
2 | 2 | 4 | 50 |
dbs |
kvm01 kvm02 kvm03 |
3 | 8 | 32 | 100 |
msg |
kvm01 kvm02 kvm03 |
3 | 16 | 64 | 100 |
prx |
kvm02 kvm03 |
2 | 4 | 16 | 300 |
cfg |
kvm01 |
1 | 8 | 16 | 50 |
cid |
kvm01 kvm02 kvm03 |
3 | 8 | 32 | 200 |
cmn |
kvm01 kvm02 kvm03 |
3 | 4 | 8 | 50 |
rgw |
kvm01 kvm02 kvm03 |
3 | 4 | 16 | 50 |
apt |
kvm01 |
1 | 4 | 16 | 500 |
mtr |
kvm04 kvm05 kvm06 |
3 | 12 | 96 | 1500 |
log |
kvm04 kvm05 kvm06 |
3 | 16 | 48 | 3000 |
mon |
kvm04 kvm05 kvm06 |
3 | 12 | 64 | 1000 |
mdb |
kvm04 kvm05 kvm06 |
3 | 8 | 32 | 500 |
High availability in OpenStack
The Virtual Control Plane (VCP) services in the MCP OpenStack are highly available and work in active/active or active/standby modes to enable service continuity after a single node failure. An OpenStack environment contains both stateless and stateful services. Therefore, the MCP OpenStack handles them in a different way to achieve high availability (HA).
- OpenStack microservices
To make the OpenStack stateless services, such as
nova-api,nova-conductor,glance-api,keystone-api,neutron-api, andnova-schedulersustainable against a single node failure, HAProxy load balancer (two or more instances) is used for failover. MCP runs multiple instances of each service distributed between physical machines to separate the failure domains.
- API availability
MCP OpenStack ensures HA for the stateless API microservices in an active/active configuration using the HAProxy with Keepalived. HAProxy provides access to the OpenStack API endpoint by redirecting the requests to active instances of an OpenStack service in a round-robin fashion. It sends API traffic to the available backends and prevents the traffic from going to the unavailable nodes. Keepalived daemon provides VIP failover for the HAProxy server.
Note
Optionally, you can manually configure SSL termination on the HAProxy, so that the traffic to OpenStack services is mirrored to go for inspection in a security domain.
- Database availability
In MCP OpenStack, MySQL database server runs in cluster with synchronous data replication between the instances of MySQL server. The cluster is managed by Galera. Galera creates and runs MySQL cluster of three instances of the database server. All servers in the cluster are active. HAProxy redirects all writing requests to just one server at any time and handles failovers.
- Message bus availability
RabbitMQ server provides messaging bus for OpenStack services. In MCP reference configuration, RabbitMQ is configured with
ha-modepolicy to run a cluster in active/active mode. Notification queues are mirrored across the cluster. Messaging queues are not mirrored by default, but are accessible from any node in the cluster.
- OpenStack dashboard
Two instances of proxy node are deployed. They run OpenStack dashboard (Horizon), and Nginx based reverse proxy that exposes OpenStack API endpoints.
The following diagram describes the control flow in an HA OpenStack environment:
Secure OpenStack API
The Transport Layer Security (TLS) cryptographic protocol enables you to provide a secured encrypted communication for the client-server OpenStack applications as well as for the RabbitMQ and MySQL backends of an MCP OpenStack environment. TLS protects the communications in your MCP cluster from trespassing and eavesdropping.
Note
In the Mirantis Reference Architecture, all traffic between OpenStack API endpoints and clients is encrypted by default, including both external and internal endpoints.
See also
- MCP Deployment Guide: Enable TLS support
- Introduction to TLS and SSL in the OpenStack Security Guide
Compute nodes planning
Determining the appropriate hardware for the compute nodes greatly depends on the workloads, number of virtual machines, and types of applications that you plan to run on the nodes. Typically, the engagement of a Mirantis cloud architect is required to properly plan the capacity for your cloud.
That said, it is essential to understand your cloud capacity utilization tendencies and patterns to plan for expansion accordingly. On one hand, planning expansion too aggressively may result in underutilization. Underestimating expansion trends, on the other hand, threatens oversubscription and eventual performance degradation.
Mirantis provides a spreadsheet with the compute node calculation. You need to fill the following parameters in the spreadsheet:
| Parameter | Description |
|---|---|
| Overhead components | Describe components that put additional overhead on system resources, such as DVR/vRouter and Hypervisor. The parameters specified in the spreadsheet represent standard workloads. The DVR / vRouter parameters represent a Compute node with 2 x 10 Gbps NICs. If you use a larger capacity network interfaces, such as 40 Gbps, this number may increase. For most deployments, the hypervisor overhead parameters equal represented numbers. |
| HW Components | Compute profile represents the hardware specification that you require for the specified number of virtual machines and the selected flavor. The adjusted version of the compute profile represents the hardware specification after correction to overhead components. |
| Oversubscription ratio | Defines the amount of virtual resources to allocate for a single physical resource entity. Oversubscription ratio highly depends on the workloads that you plan to run in your cloud. For example, Mirantis recommends to allocate 8 vCPU per 1 hyper-thread CPU, as well as 1:1 ratio for both memory and disk for standard workloads, such as web application development environments. If you plan to run higher CPU utilization workloads, you may need to decrease CPU ratio down to 1:1. |
| Flavor definitions | Defines a virtual machine flavor that you plan to use in your deployment. The flavor depends on the workloads that you plan to run. In the spreadsheet, the OpenStack medium virtual machine is provided as an example. |
| Flavor totals | Defines the final hardware requirements based on specified parameters. Depending on the number and the virtual machine flavor, you get the number of compute nodes (numHosts) with the hardware characteristics. |
| Resource utilization per compute node | The resource utilization parameter defines the percentage of memory, processing, and storage resource utilization on each compute node. Mirantis recommends that vCPU, vMEM, and vDISK are utilized at least at 50 %, so that your compute nodes are properly balanced. If your calculation results in less than 50 % utilization, adjust the numbers to use the resources more efficiently. |
See also
Download Compute nodes calculation
OpenStack network architecture
OpenStack Networking manages virtual networks that connect virtual server instances to each other and to external network. Also, OpenStack networking handles network configuration of instances, virtual firewalls, and floating IP addresses.
Tenant virtual networks are overlay networks on top of physical and logical infrastructure of a data center network. Both the overlay network creation and host network configuration depend on the backend that you use.
MCP supports the following network technologies as back ends for OpenStack Networking:
- Neutron Open vSwitch (OVS)
- OpenContrail
Selecting a network technology
Neutron Open vSwitch networking is the default for OpenStack networking in the MCP CPI reference architecture. The second supported option is OpenContrail SDN networking.
The following table compares the two technologies and defines use cases for both.
| Neutron OVS | OpenContrail |
|---|---|
Neutron with Open vSwitch is the default networking for OpenStack. It is supported by diverse community of the OpenStack developers. Neutron provides basic networking including the IP addresses, IP routing, security groups, and floating IP addresses management. It also provides virtual load balancer capabilities through LBaaS API (Octavia) to the cloud users. Neutron uses VXLAN encapsulation for tenant overlay networks. Neutron supports distributed virtual router (DVR) for east-west and network node for north-bound traffic originating from tenant virtual servers. North-bound traffic reaches its destinations using address translation (SNAT) on the network (gateway) nodes. |
OpenContrail is an open source SDN product backed by Juniper and supported by community of developers. OpenContrail provides both basic networking, such as IP addresses management, security groups, floating IP addresses, and advanced networking functions, including DPDK network virtualization and SR-IOV. OpenContrail replaces standard Linux networking stack with its
own The main use case for OpenContrail is advanced overlay network configurations that heavily rely on Service Function Chaining and SR-IOV. It is generally recommended to cloud operators that run Telco workloads in their clouds. |
See also
Types of networks
The following diagram provides an overview of the underlay networks in an OpenStack environment:
An OpenStack environment typically uses the following types of networks:
Underlay networks for OpenStack that are required to build network infrastructure and related components. See details on the physical network infrastructure for CPI reference architecture in Networking.
PXE / Management
This network is used by SaltStack and MAAS to serve deployment and provisioning traffic, as well as to communicate with nodes after deployment. After deploying an OpenStack environment, this network runs low traffic. Therefore, a dedicated 1 Gbit network interface is sufficient. The size of the network also depends on the number of hosts managed by MAAS and SaltStack.
Public
Virtual machines access the Internet through Public network. Public network provides connectivity to the globally routed address space for VMs. In addition, Public network provides a neighboring address range for floating IPs that are assigned to individual VM instances by the project administrator.
Proxy
This network is used for network traffic created by Horizon and for OpenStack API access. The proxy network requires routing. Typically, two proxy nodes with Keepalived VIPs are present in this network, therefore, the /29 network is sufficient. In some use cases, you can use Proxy network as Public network.
Control
This network is used for internal communication between the components of the OpenStack environment. All nodes are connected to this network including the VCP virtual machines and KVM nodes. OpenStack control services communicate through the control network. This network requires routing.
Data
This network is used to build a network overlay. All tenant networks, including floating IP, fixed with RT, and private networks, are carried over this underlay network. VxLAN encapsulation is used by default in CPI reference architecture.
Data network does not require external routing by default. Routing for tenant networks is handled by Neutron gateway nodes. Routing for Data underlay network may be required if you want to access your workloads from corporate network directly (not via Floating IP addresses). In this case, external routers are required that are not managed by MCP.
Storage access (optional)
This network is used to access Ceph storage servers (OSD nodes). The network does not need to be accessible from outside the cloud environment. However, Mirantis recommends that you reserve a dedicated and redundant 10 Gbit network connection to ensure low latency and fast access to the block storage volumes. You can configure this network with routing for L3 connectivity or without routing. If you set this network without routing, you must ensure additional L2 connectivity to nodes that use Ceph.
Storage replication (optional)
This network is used for copying data between OSD nodes in a Ceph cluster. Does not require access from outside the OpenStack environment. However, Mirantis recommends reserving a dedicated and redundant 10 Gbit network connection to accommodation high replication traffic. Use routing only if rack-level L2 boundary is required or if you want to configure smaller broadcast domains (subnets).
Virtual networks inside OpenStack
Virtual networks inside OpenStack include virtual public and internal networks. Virtual public network connects to the underlay public network. Virtual internal networks exist within the underlay data network. Typically, you need multiple virtual networks of both types to address the requirements of your workloads.
In the reference architecture for Cloud Provider Infrastructure, isolated virtual/physical networks must be configured for PXE and Proxy traffic. For PXE network, 1 GbE interface is required. For Proxy, Data and Control network, CPI uses 10 GbE interfaces bonded together and split into VLANs, one VLAN per network. For Storage networks CPI requires a dedicated pair of 10 GbE interfaces bonded together for increased performance and resiliency. Storage access and replication networks may be divided into separate VLANs on top of the dedicated bond interface.
See also
MCP external endpoints
MCP exposes a number of services through endpoints terminated on a reverse
proxy server. MCP uses nginx as a reverse proxy server. The server
listens on a virtual IP address from Public network (see
types-networks).
The following table summarizes the endpoints and port numbers used by services in MCP CPI referenece architecture.
| Component | Service | Endpoint | Port |
|---|---|---|---|
| OpenStack | Dashboard | https | 443 |
| Keystone | https | 5000 | |
| Neutron | https | 9696 | |
| Nova | https | 8774 | |
| Nova Placement | https | 8778 | |
| Ceilometer | https | 8777 | |
| Cinder | https | 8776 | |
| Glance | https | 9292 | |
| Heat CFN | https | 8000 | |
| Heat CloudWatch | https | 8003 | |
| Heat | https | 8004 | |
| NoVNC | https | 6080 | |
| Octavia | https | 9876 | |
| Barbican | https | 9311 | |
| Designate | https | 9001 | |
| Aodh | https | 8042 | |
| Gnocci | https | 8041 | |
| Panko | https | 8977 | |
| Dashboard [1] | http | 80 | |
| Ceph | RadosGW | https | 8080 |
| StackLight | Alerta | https | 15017 |
| Grafana | https | 8084 | |
| Kibana | https | 5601 | |
| Alertmanager | https | 15011 | |
| Prometheus | https | 15010 | |
| DriveTrain | Gerrit | https | 8070 |
| jenkins | https | 8081 |
| [1] | Redirected to HTTPS, port 443. |
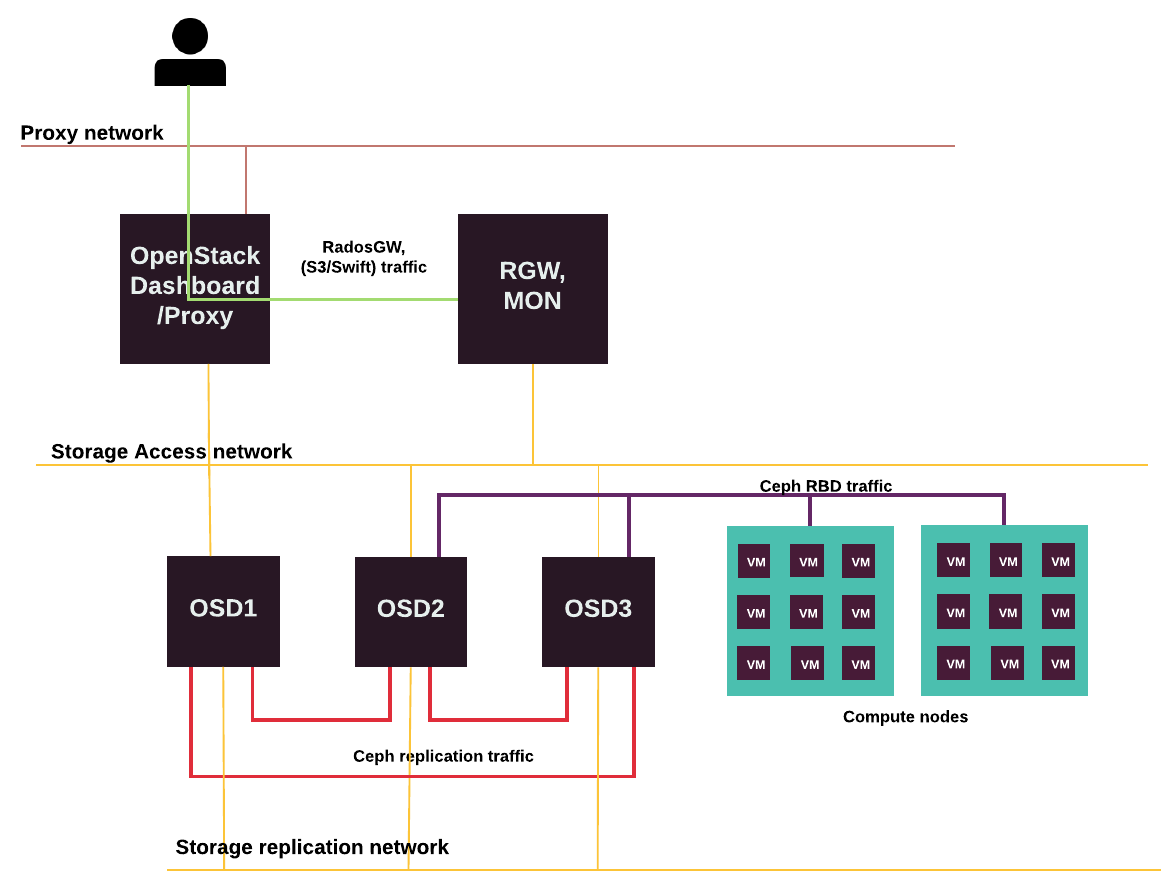
Storage traffic
Storage traffic flows through dedicated storage networks that Mirantis recommends to configure if you use Ceph.
The following diagram displays the storage traffic flow for Ceph RBD, replication, and RadosGW.
Neutron OVS networking
OpenStack Networking with OVS is used by default and is the only supported networking mode in the reference architecture for the CPI use case.
Neutron configuration for the CPI use case enables distributed virtual router (DVR) by default. Overlay networks are created using the VxLAN encapsulation. Access to the external networks is provided by source network address translation (SNAT) working on dedicated network nodes or gateway nodes.
Neutron supports external access to the virtual server instances in the cloud through the floating IP assigned to the virtual servers through the networking API.
Neutron OVS requires setting up of a specific network node, which is sometimes called gateway, that handles the routing across the internal networks, as well as the outbound routing.
Limitations
Due to a limitation in the OpenStack Networking service, the Distributed Virtual Router (DVR) in combination with L3 HA is not stable enough and affects the SNAT traffic. Therefore, Mirantis does not recommend such a configuration for production deployments.
Instead of L3 HA, the allow_automatic_l3agent_failover option is enabled
by default in neutron.conf for the Neutron OVS with DVR deployments in MCP.
This option enables automatic rescheduling of a failed L3 agent routers
to an online L3 agent on a different network node.
Node configuration
For all Neutron OVS use cases, configure four VLANs and four IP addresses in separate networks on all compute and network nodes. You will also need two VLAN ranges for tenant traffic and external VLAN traffic.
The following table describes a node network configuration for a Neutron OVS-based MCP OpenStack cluster:
| Interface/Bridge | Description | Interfaces | IP |
|---|---|---|---|
eth0 |
PXE Boot traffic | - |
Dynamic |
br-mgm |
OpenStack and other management traffic | bond0.<management_VLAN> |
Static |
br-prv |
Tenant VLAN traffic | bond0 |
Static |
br-mesh |
Tenant overlay traffic (VXLAN) | bond0.<tenant_VLAN> |
Static |
br-floating |
External VLAN traffic | bond0.<external_VLAN> (or VLAN range) |
No IP |
br-stor |
Storage traffic | bond0.<storage_VLAN> |
No IP |
bond0 |
Main bond | eth1, eth2 | No IP |
Depending on hardware capabilities, you can separate bonds for the control plane and data plane.
Depending on your use case, configure your network nodes to use the VLAN or VXLAN-based tenant network.
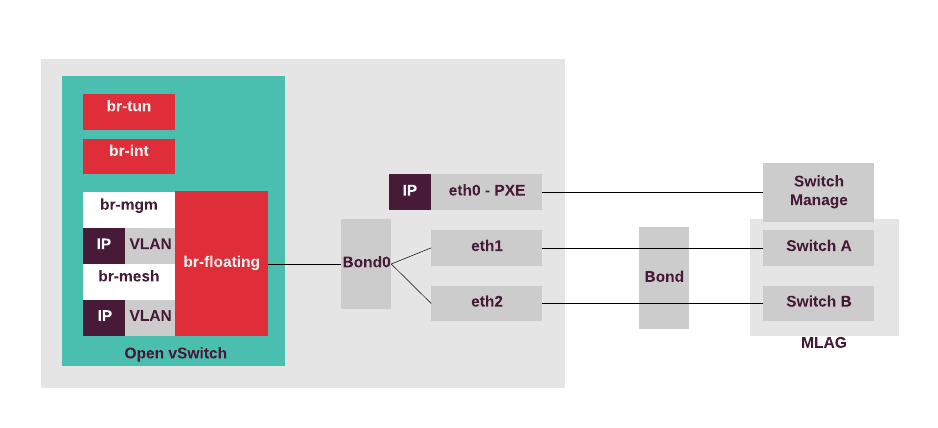
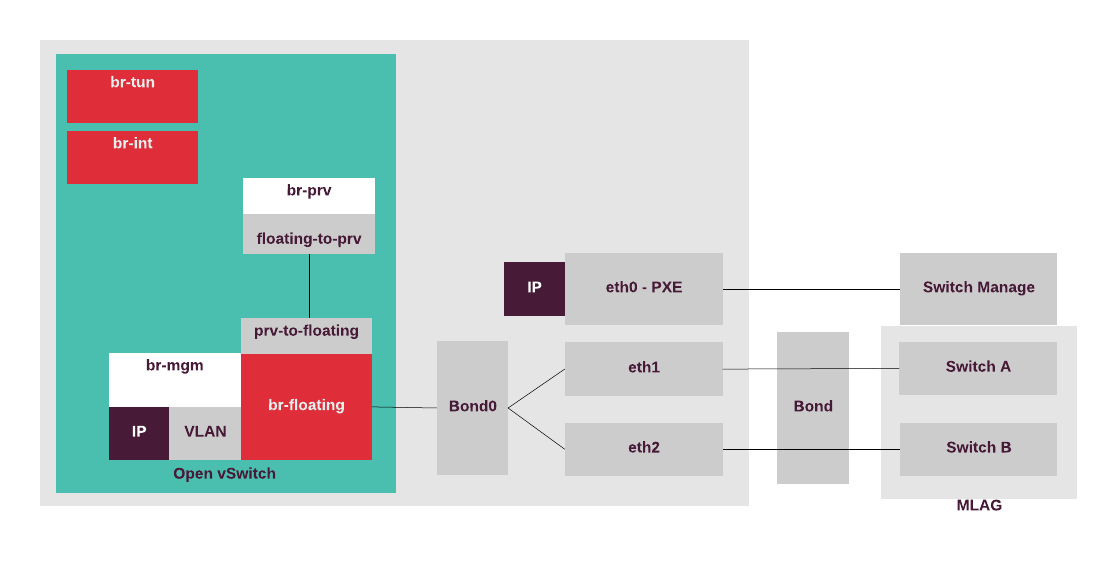
Network node configuration for VXLAN tenant networks
In the VXLAN-based tenant networks, the network node terminates VXLAN mesh
tunnels and sends traffic to external provider VLAN networks.
Therefore, all tagged interfaces must be configured directly
in Neutron OVS as internal ports without Linux bridges.
Bond0 is added into br-floating, which is mapped as physnet1
into the Neutron provider networks. br-mgm and br-mesh
are Neutron OVS internal ports with tags and IP addresses.
As there is no need to handle storage traffic on the network nodes,
all the sub-interfaces can be created in Neutron OVS. This also
allows for the creation of VLAN providers through the Neutron API.
The following diagram displays the network node configuration for the use case with Neutron VXLAN tenant networks and external access configured on the network node only.
Network node configuration for VLAN tenant networks
In the VLAN-based tenant networks, the network node terminates private VLANs
and sends traffic to the external provider of VLAN networks.
Therefore, all tagged interfaces must be configured directly
in Neutron OVS as internal ports without Linux bridges.
Bond0 is added into br-floating, which is mapped as physnet1
into the Neutron provider networks. br-floating is patched with
br-prv which is mapped as physnet2 for VLAN tenant
network traffic. br-mgm is an OVS internal port with a tag and
an IP address. br-prv is the Neutron OVS bridge which is
connected to br-floating through the patch interface. As storage
traffic handling on the network nodes is not required, all the
sub-interfaces can be created in Neutron OVS which enables creation
of VLAN providers through the Neutron API.
The following diagram displays the network node configuration for the use case with Neutron VLAN tenant networks and external access configured on the network node only.
VCP hosts networking
Each physical server that hosts a KVM on which the Virtualized Control Plane (VCP) services run must have the following network configuration:
| Bridge | Description | Interfaces | IP |
|---|---|---|---|
br-pxe |
PXE Boot traffic | eth0 | Dynamic |
br-bond0 |
Tenant internal and external traffic | bond0 (eth1/eth2) |
No IP |
br-mgm |
OpenStack and other management traffic | bond0.<management_VLAN> |
Static |
br-prx |
Proxy traffic | bond0.<proxy_VLAN> |
No IP |
Neutron VXLAN tenant networks with network nodes for SNAT (DVR for all)
If you configure your network with Neutron OVS VXLAN tenant networks with network nodes for SNAT and Distributed Virtual Routers (DVR) on the compute nodes, network nodes perform SNAT and routing between tenant and public networks. The compute nodes running DVRs perform routing between tenant networks, as well as routing to public networks in cases when public networks (provider, externally routed) are exposed or Floating IP addresses are used.
The following diagram displays internal and external traffic flow.
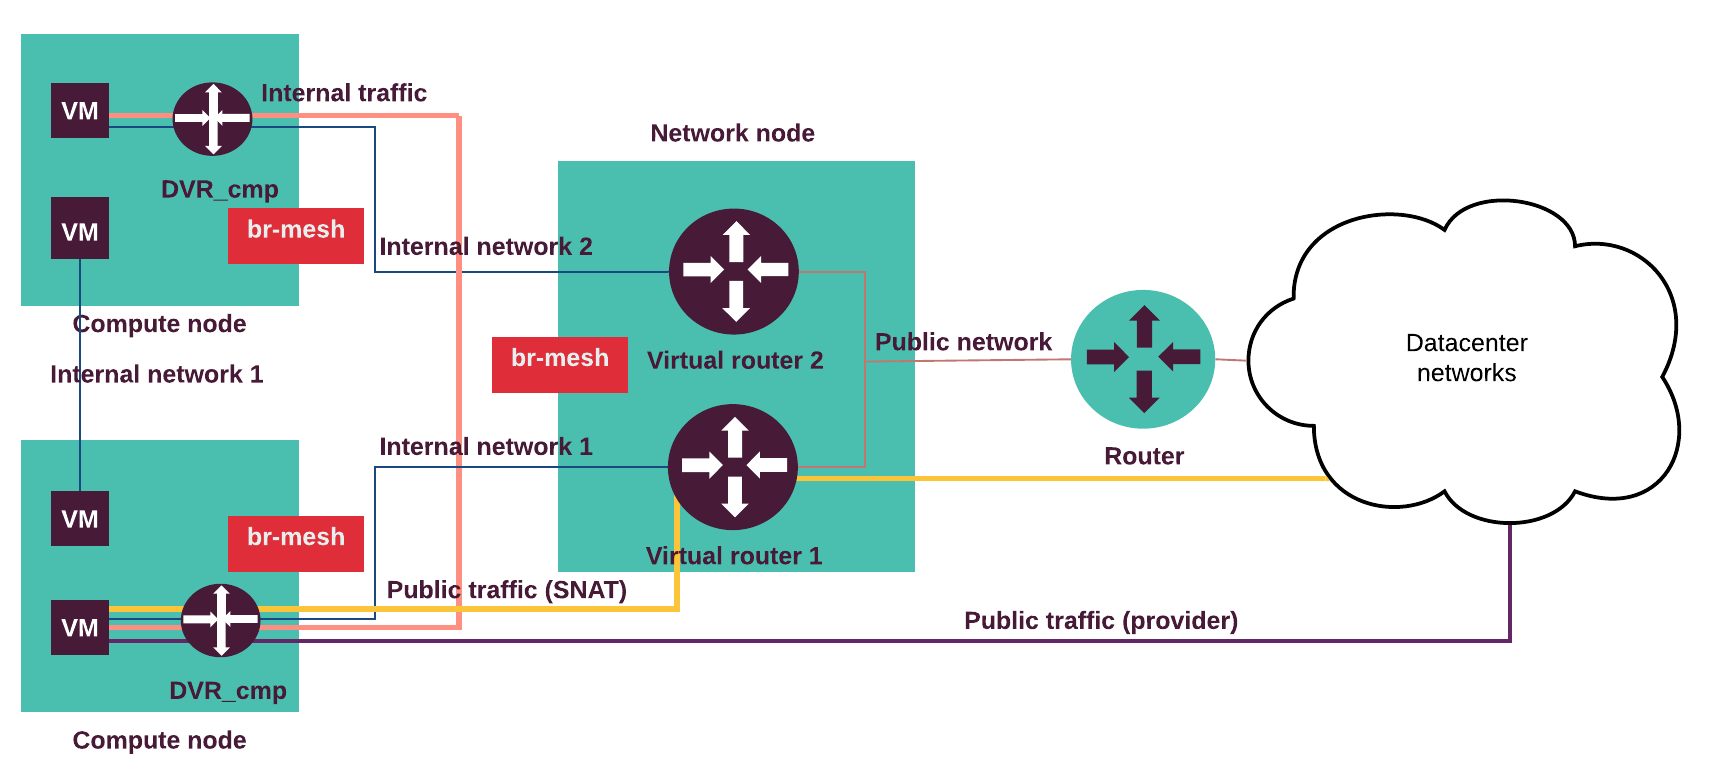
The internal traffic from one tenant virtual machine located on the virtual Internal network 1 goes to another virtual machine located in the Internal network 2 through the DVRs on the compute nodes. The external traffic (SNAT) from a virtual machine goes through the Internal network 1 and the DVR on the compute node to the virtual router on the network node and through the Public network to the outside network. The external routable traffic from a virtual machine on the compute nodes goes through the Internal network 1 and the DVR on the compute node through the Control or Public network to the outside network.
Traffic flow examples:
- A virtual machine without a floating IP address sends traffic to a
destination outside the Public network (N-S). The Internal network 1
is connected to a public network through the Neutron router.
The virtual machine (VM) is connected to the Internal network 1.
- The VM sends traffic through the virtual router to the network node.
- The network node performs SNAT, de-encapsulates and forwards traffic to the public network’s external gateway router.
- Return path same.
- A virtual machine with a floating IP address sends traffic to a destination
outside the Public network (N-S). The compute node with a DVR hosting the
VM is connected to a public network. An Internal network 1 is connected to
the external network through the Neutron router. The VM is connected to the
Internal network 1.
- The VM sends traffic through the compute node DVR to a public network (egress).
- The compute node DVR performs SNAT, de-encapsulates and forwards traffic to the public network’s external gateway router.
- Return path (ingress) same (DNAT).
- A virtual machine on an internal (private, tenant) network sends traffic to
a destination IP address on a public (provider, externally routed) network
(E-W). The compute node with DVR hosting the VM is connected to the provider
network. The Internal network 1 is connected to the provider network
through the Neutron router. The VM is connected to the Internal network 1.
- The VM sends traffic through the compute node DVR to a destination IP on a public network.
- The compute node DVR de-encapsulates and forwards traffic to a public network (no NAT).
- Return path same.
- A virtual machine (VM1) sends traffic to another VM (VM2) located on
separate host(E-W).
The Internal network 1 is connected to the Internal network 2
through the Neutron router. The (VM1) is connected to the Internal network 1
and the VM2 is connected to the Internal network 2.
- The VM1 sends traffic to the VM2 through the compute node DVR.
- The DVR on the compute node hosting VM1 forwards encapsulated traffic to the DVR on the compute node hosting VM2.
- Return path same.
The compute nodes can access the external network,
therefore, there is the OVS bridge called br-floating.
All Open vSwitch bridges are automatically created by the Neutron
OVS agent. For a highly-available production environment, network
interface bonding is required.
The separation of the traffic types is done by the bonded tagged
sub-interfaces,
such as bond.x for the virtualized control plane traffic (management IP),
bond.y for the data plane bridge (br-mesh) that provides VTEP for
OVS, bond.z for storage, and others. The IP address of br-mesh is used
as a local IP in the openvswitch.ini configuration file for tunneling.
The following diagram displays the compute nodes configuration for the use case with Neutron VXLAN tenant networks with SNAT on the network nodes and external access on the compute and network nodes.
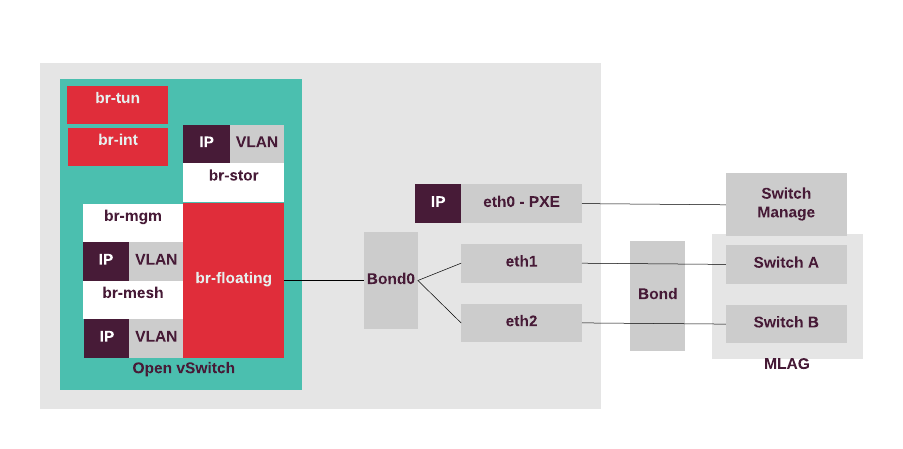
Plan the Domain Name System
MCP leverages the OpenStack Domain Name System as a Service component called Designate to provide DNS with integrated Keystone authentication for OpenStack environments. Designate uses the Galera MySQL cluster as the distributed database to provide a mapping of IP addresses to domain names and hosts to access the Internet.
Designate uses RESTful API for creating, updating, and deleting DNS zones and records of OpenStack environments. Designate integrates Nova and Neutron notifications for auto-generated records as well as uses different underlying DNS servers including BIND9 and PowerDNS that are supported by MCP.
Designate includes the following components:
| Component | Description |
|---|---|
designate-api |
Processes API requests by sending them to designate-central using
the Remote Procedure Call (RPC) mechanism. |
designate-central |
Handles RPC requests using message queueing, coordinates persistent
storage, and applies business logic to data from
designate-api. Storage is provided using the SQLAlchemy plugin
supporting MySQL. |
designate-worker |
Runs the zone create, zone update, and zone delete tasks as
well as tasks from designate-producer. |
designate-producer |
Manages periodic Designate tasks. |
designate-pool-manager |
(Optional) Manages the states of the DNS servers that are handled by Designate. |
designate-zone-manager |
(Optional) Handles all periodic tasks of the zone shard that
designate-zone-manager is responsible for. |
designate-mdns |
Pushes the DNS zone information to the customer-facing DNS servers. Can also pull information about the DNS zones hosted outside of the Designate infrastructure. |
designate-sink |
Consumes the Nova and Neutron events and notifications to produce auto-generated records that are determined by custom notification handlers. |
| Backend (BIND9 or PowerDNS) | Represents your existing DNS servers or DNS servers deployed on separate VMs of the MCP infrastructure nodes. |
All components except the backend can run on the MCP Virtualized Control Plane (VCP) as a part of the OpenStack API.
Plan load balancing with OpenStack Octavia
MCP enables you to use the OpenStack Octavia service coupled with the Neutron LBaaS driver version 2 to provide advanced load balancing in your OpenStack environment. Octavia acts as a back-end driver for Neutron LBaaS, therefore, all networking requests are handled by the Octavia API. The main advantage of Octavia comparing to just using the Neutron LBaaS driver is that Octavia provides easy on-demand scaling of load balancing services, what makes it an enterprise-class solution.
One of the fundamental components of Octavia is called amphora, a specific entity that can be a virtual machine, a container, or a bare-metal server, that Octavia uses to deliver workload load balancing services. Currently, only virtual machines are supported.
Octavia makes use of the following OpenStack projects that should be set up on your production OpenStack environment:
- Nova
- Neutron
- Glance
- Keystone
- RabbitMQ
- MySQL
- Barbican (if TLS support is required)
Octavia API services run on the OpenStack controller nodes. These services can be installed as a cluster or single service. The Octavia Manager services that are Octavia Worker, Octavia Health Monitor, and Octavia Housekeeping run on the gateway node. The clusterization of the Octavia Manager services is currently available as technical preview only.
The certificates that are used for connection to amphora are created
on the Salt Master node and then loaded on the gtw nodes.
If required, you can move the certificates that were originally created
on the gtw01 node to the Salt Master node. For details, see:
MCP Deployment Guide.
Caution
Octavia works with Neutron OVS as a network solution only. OpenContrail is not supported.
Storage planning
Depending on your workload requirements, consider different types of storage. This section provides information on how to plan different types of storage for your OpenStack environment.
You typically need to plan your MCP cluster with the following types of storage:
- Image storage
- Storage required for storing disk images that are used in the OpenStack environment.
- Ephemeral block storage
- Storage for the operating systems of virtual servers in an OpenStack environment, bound to the life cycle of the instance. As its name suggests, the storage will be deleted once the instance is terminated. Ephemeral storage does persist through a reboot of a virtual server instance.
- Persistent block storage
- Block storage that exists and persists outside a virtual server instance. It is independent of virtual machine images or ephemeral disks and can be attached to virtual servers.
- Object storage
- Storage for unstructured data with capabilities not provided by other types of storage, such as separation of metadata from other data and an API.
Image storage planning
The OpenStack Image service (Glance) provides a REST API for storing and managing virtual machine images and snapshots. Glance requires you to configure a backend for storing images.
MCP supports the following options as Glance backend:
- Ceph cluster
- A highly scalable distributed object storage that is recommended as an Image storage for environments with a large number of images and/or snapshots. If used as a backend for both image storage and ephemeral storage, Ceph can eliminate caching of images on compute nodes and enable copy-on-write of disk images, which in large clouds can save a lot of storage capacity.
- GlusterFS
- A distributed network file system that allows you
to create a reliable and redundant data storage for image files.
This is the default option for an Image store with the
Filebackend in MCP.
The default backend used in Mirantis Reference Architecture is Ceph cluster.
See also
Block storage planning
The OpenStack component that provides an API to create block storage for your cloud is called OpenStack Block Storage service, or Cinder. Cinder requires you to configure one or multiple supported backends.
MCP Reference Architecture uses Ceph cluster as a default backend for OpenStack Block Storage service. Ceph supports object, block, and file storage. Therefore, you can use it as OpenStack Block Storage service back end to deliver a reliable, highly available block storage solution without single points of failure.
In addition to Ceph cluster, MCP supports Cinder drivers. If you already use a network storage solution, such as NAS or SAN, you can use it as a storage backend for Cinder using a corresponding Cinder driver, if available.
See also
Object storage planning
MCP supports Ceph as an only option for Object Storage. Mirantis reference architecture uses Ceph RADOS Gateway to provide an API compatible with OpenStack Swift API and AWS S3 API.
See Release Notes: Known Issues for the list of identified limitations in the API compatibility if any.
See also
Ceph planning
Proper planning is crucial for building a reliable, resilient, and performant Ceph cluster. The following pages will advise on planning a Ceph cluster suitable for your performance and resilience requirements.
MCP Ceph cluster overview
MCP uses Ceph as a primary solution for all storage types, including image storage, ephemeral storage, persistent block storage, and object storage. When planning your Ceph cluster, consider the following:
- Ceph version
- Supported versions of Ceph are listed in the MCP Release Notes: Release artifacts section.
- Daemon colocation
Ceph uses the Ceph Monitor (
ceph.mon), object storage (ceph.osd), Ceph Manager (ceph-mgr) and RADOS Gateway (ceph.radosgw) daemons to handle the data and cluster state. Each daemon requires different computing capacity and hardware optimization.Mirantis recommends running Ceph Monitors and RADOS Gateway daemons on dedicated virtual machines or physical nodes. Colocating the daemons with other services may negatively impact cluster operations. Three Ceph Monitors are required for a cluster of any size. If you have to install more than three, the number of Monitors must be odd.
Ceph Manager is installed on every node (virtual or physical) running Ceph Monitor, to achieve the same level of availability.
Note
MCP Reference Architecture uses 3 instances of RADOS Gateway and 3 Ceph Monitors. The daemons run in dedicated virutal machines, one VM of each type per infrastructure node, on 3 infrastructure nodes.
- Store type
Ceph can use either the BlueStore or FileStore backend. The BlueStore back end typically provides better performance than FileStore because in BlueStore the journaling is internal and more light-weight compared to FileStore. Mirantis supports BlueStore only for Ceph versions starting from Luminous.
For more information about Ceph backends, see Storage devices.
- BlueStore configuration
BlueStore uses Write-Ahead Log (WAL) and Database to store the internal journal and other metadata. WAL and Database may reside on a dedicated device or on the same device as the actual data (primary device).
- Dedicated
Mirantis recommends using a dedicated WAL/DB device whenever possible. Typically, it results in better storage performance. One write-optimized SSD is recommended for WAL/DB metadata per five primary HDD devices.
- Colocated
WAL and Database metadata are stored on the primary device. Ceph will allocate space for data and metadata storage automatically. This configuration may result in slower storage performance in some environments.
- FileStore configuration
Mirantis recommends using dedicated write-optimized SSD devices for Ceph journal partitions. Use one journal device per five data storage devices.
It is possible to store the journal on the data storage devices. However, Mirantis does not recommend it unless special circumstances preclude the use of dedicated SSD journal devices.
Note
MCP Reference Configuration uses BlueStore store type as a default.
- Ceph cluster networking
A Ceph cluster requires having at least the front-side network, which is used for client connections (public network in terms of Ceph documentation). Ceph Monitors and OSDs are always connected to the front-side network.
To improve the performance of the replication operations, you may additionally set up the back-side network (or cluster network in terms of Ceph documentation), which is used for communication between OSDs. Mirantis recommends assigning dedicated interface to the cluster network. For more details on Ceph cluster networking, see Ceph Network Configuration Reference.
- Pool parameters
Set up each pool according to expected usage. Consider at least the following pool parameters:
min_sizesets the minimum number of replicas required to perform I/O on the pool.sizesets the number of replicas for objects in the pool.typesets the pool type, which can be eitherreplicatedorerasure.
The following diagram describes the Reference Architecture of Ceph cluster in MCP:
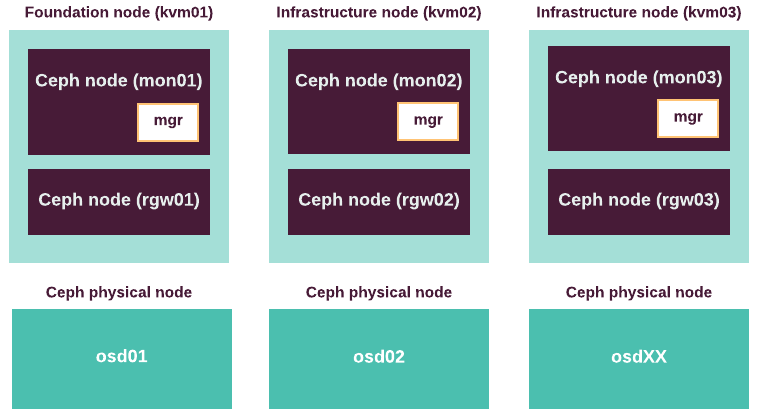
Ceph services
When planning a Ceph cluster, consider the following guidelines for the Ceph Monitor and RADOS Gateway services.
- Ceph Monitor service
The Ceph Monitor service is quorum-based. Three instances of Ceph Monitor are required to ensure fault tolerance and typically suffice for any number of OSD nodes. If additional Ceph Monitors are required for any reason, the total number of instances must be odd.
Run one Ceph Monitor per physical infrastructure node to minimize the risk of losing the Monitor quorum upon server hardware failure.
The recommended minimal size of a Ceph Monitor VM is:
- 4 vCPU
- 8 GB RAM
- 32 GB disk
- 10 GbE network
- RADOS Gateway service
The RADOS Gateway service is required to provide Swift and S3-compatible Object Storage API on top of Ceph. RADOS Gateway is stateless and puts no constraints on the number of nodes in a cluster. Start with two instances behind a load balancer for redundancy in case of failure.
Mirantis recommends running the RADOS Gateway service on a dedicated VM with at least:
- 4 vCPU
- 16 GB RAM
- Minimum 16 GB disk space for the operating system
- 10 GbE network connection internally and externally
RADOS Gateway scales out horizontally, so you can increase the number of VMs to get more concurrent connections processed.
Additional Ceph considerations
When planning storage for your cloud, you must consider performance, capacity, and operational requirements that affect the efficiency of your MCP environment.
Based on those considerations and operational experience, Mirantis recommends no less than nine-node Ceph clusters for OpenStack production environments. Recommendation for test, development, or PoC environments is a minimum of five nodes.
Note
This section provides simplified calculations for your reference. Each Ceph cluster must be evaluated by a Mirantis Solution Architect.
Capacity
When planning capacity for your Ceph cluster, consider the following:
- Total usable capacity
The existing amount of data plus the expected increase of data volume over the projected life of the cluster.
- Data protection (replication)
Typically, for persistent storage a factor of 3 is recommended, while for ephemeral storage a factor of 2 is sufficient. However, with a replication factor of 2, an object can not be recovered if one of the replicas is damaged.
- Cluster overhead
To ensure cluster integrity, Ceph stops writing if the cluster is 90% full. Therefore, you need to plan accordingly.
- Administrative overhead
To catch spikes in cluster usage or unexpected increases in data volume, an additional 10-15% of the raw capacity should be set aside.
- BlueStore backend
According to the official Ceph documentation, it is recommended that the BlueStore
block.dbdevice size must not be smaller than 4% of the block size. For example, if the block size is 1 TB, then theblock.dbdevice size must not be smaller than 40 GB. Salt formulas do not perform complex calculations on the parameters. Therefore, plan the cloud storage accordingly.
The following table describes an example of capacity calculation:
| Parameter | Value |
|---|---|
| Current capacity persistent | 500 TB |
| Expected growth over 3 years | 300 TB |
| Required usable capacity | 800 TB |
| Replication factor for all pools | 3 |
| Raw capacity | 2.4 PB |
| With 10% cluster internal reserve | 2.64 PB |
| With operational reserve of 15% | 3.03 PB |
| Total cluster capacity | 3 PB |
Overall sizing
When you have both performance and capacity requirements, scale the cluster size to the higher requirement. For example, if a Ceph cluster requires 10 nodes for capacity and 20 nodes for performance to meet requirements, size the cluster to 20 nodes.
Operational recommendations
- A minimum of 9 Ceph OSD nodes is recommended to ensure that a node failure does not impact cluster performance.
- Mirantis does not recommend using servers with excessive number of disks, such as more than 24 disks.
- All Ceph OSD nodes must have identical CPU, memory, disk and network hardware configurations.
- If you use multiple availability zones (AZ), the number of nodes must be evenly divisible by the number of AZ.
Perfromance considerations
When planning performance for your Ceph cluster, consider the following:
Raw performance capability of the storage devices. For example, a SATA hard drive provides 150 IOPS for 4k blocks.
Ceph read IOPS performance. Calculate it using the following formula:
number of raw read IOPS per device X number of storage devices X 80%
Ceph write IOPS performance. Calculate it using the following formula:
number of raw write IOPS per device X number of storage
devices / replication factor X 65%
Ratio between reads and writes. Perform a rough calculation using the following formula:
read IOPS X % reads + write IOPS X % writes
Note
Do not use these formulas for a Ceph cluster that is based on SSDs only. Technical specifications of SSDs may vary thus the performance of SSD-only Ceph clusters must be evaluated individually for each model.
Storage device considerations
The expected number of IOPS that a storage device can carry out, as well as its throughput, depends on the type of device. For example, a hard disk may be rated for 150 IOPS and 75 MB/s. These numbers are complementary because IOPS are measured with very small files while the throughput is typically measured with big files.
Read IOPS and write IOPS differ depending on the device. Сonsidering typical usage patterns helps determining how many read and write IOPS the cluster must provide. A ratio of 70/30 is fairly common for many types of clusters. The cluster size must also be considered, since the maximum number of write IOPS that a cluster can push is divided by the cluster size. Furthermore, Ceph can not guarantee the full IOPS numbers that a device could theoretically provide, because the numbers are typically measured under testing environments, which the Ceph cluster cannot offer and also because of the OSD and network overhead.
You can calculate estimated read IOPS by multiplying the read IOPS number for the device type by the number of devices, and then multiplying by ~0.8. Write IOPS are calculated as follows:
(the device IOPS * number of devices * 0.65) / cluster size
If the cluster size for the pools is different, an average can be used. If the number of devices is required, the respective formulas can be solved for the device number instead.
Consider disk weights. For Ceph Nautilus, by default, a balancer module actively balances the usage of each disk. For Ceph Luminous, by default, the weight is set depending on disk space. To set a disk-specific weight, specify it as an integer using the default Ceph OSD definition field. However, Mirantis does not recommend setting Ceph OSDs weights manually.
disks:
  - dev: /dev/vdc
    ...
    weight: 5
Ceph OSD hardware considerations
When sizing a Ceph cluster, you must consider the number of drives needed for capacity and the number of drives required to accommodate performance requirements. You must also consider the largest number of drives that ensure all requirements are met.
The following list describes generic hardware considerations for a Ceph cluster:
- Use HDD storage devices for Ceph Object Storage Devices (OSDs). Ceph is designed to work on commercial off-the-shelf (COTS) hardware. Most disk devices from major vendors are supported.
- Create one OSD per HDD in Ceph OSD nodes.
- Allocate 1 CPU thread per OSD.
- Allocate 1 GB of RAM per 1 TB of disk storage on the OSD node.
- Disks for OSDs must be presented to the system as individual
devices.
- This can be achieved by using Host Bus Adapter (HBA) mode for disk controller.
- RAID controllers are only acceptable if disks can be presented to the operating system as individual devices (JBOD or HBA mode).
- Place Ceph write journals on write-optimized SSDs instead of OSD HDD disks. Use one SSD journal device for 4 - 5 OSD hard disks.
The following table provides an example of input parameters for a Ceph cluster calculation:
| Parameter | Value |
|---|---|
| Virtual instance size | 40 GB |
| Read IOPS | 14 |
| Read to write IOPS ratio | 70/30 |
| Number of availability zones | 3 |
For 50 compute nodes, 1,000 instances
Number of OSD nodes: 9, 20-disk 2U chassis
This configuration provides 360 TB of raw storage and with cluster size of 3 and 60% used initially, the initial amount of data should not exceed 72 TB (out of 120 TB of replicated storage). Expected read IOPS for this cluster is approximately 20,000 and write IOPS 5,000, or 15,000 IOPS in a 70/30 pattern.
Note
In this case performance is the driving factor, and so the capacity is greater than required.
For 300 compute nodes, 6,000 instances
Number of OSD nodes: 54, 36-disks chassis
The cost per node is low compared to the cost of the storage devices and with a larger number of nodes failure of one node is proportionally less critical. A separate replication network is recommended.
For 500 compute nodes, 10,000 instances
Number of OSD nodes: 60, 36-disks chassis
You may consider using a larger chassis. A separate replication network is required.
Tenant Telemetry planning
MCP provides Tenant Telemetry for OpenStack environments based on the OpenStack Telemetry Data Collection service, or Ceilometer. Tenant Telemetry assists in resource utilization planning and expansion, addresses scalability issues by collecting various OpenStack resource metrics, as well as provides the metrics to such auto-scaling systems as OpenStack Orchestration service, or Heat, that is used to launch stacks of resources, such as virtual machines.
Caution
Tenant Telemetry based on Ceilometer, Aodh, Panko, and Gnocchi is supported starting from the Pike OpenStack release and does not support integration with StackLight LMA. However, you can add the Gnocchi data source to Grafana to view the Tenant Telemetry data.
Tenant Telemetry stores scalability metrics in the time-series database called Gnocchi and events in Panko. By default, Panko uses MySQL as a backend with the same Galera cluster as for the OpenStack API. Gnocchi uses the following backends:
- MySQL Galera cluster as indexing storage (using the same MySQL cluster as the OpenStack API)
- Redis as incoming metrics storage set up on the same nodes as Tenant Telemetry
- Aggregation metrics storage:
- Ceph. This option is recommended for production.
- File backend based on GlusterFS. Use this option only for testing purposes.
Note
To define the amount of resources for Gnocchi, calculate the approximate amount of stored data using the How to plan for Gnocchi’s storage instruction. Roughly, 1000 instances produce approximately 60 GB of telemetry data per year.
Example:
The cloud includes 15 compute nodes with 256 GB RAM each:
15 * 256 = 3840 GB RAM raw
Therefore, the cloud includes approximately 3.84 thousands of instances 1 GB each. Assuming that 1000 instances produce about 60 GB of metering data:
3.840 * 60 GB = 230 GB of telemetry data for cloud
A huge amount of short-living instances may increase this value because the data is stored with different aggregation rules. The older the data, the higher is the aggregation step.
Tenant Telemetry supports the community Aodh service that uses the Gnocchi API and provides an alarm evaluator mechanism based on metrics. Aodh allows triggering actions that are based on defined rules against sample or event data of OpenStack services that is collected by Ceilometer. After the event-driven alarm evaluation, Aodh provides instant alarm notifications to the user. The default Aodh backend is the same Galera cluster as used for the Openstack API.
To gather metrics from the compute nodes, Tenant Telemetry uses the Ceilometer Compute Agent installed on each compute node.
The following diagram displays the composition of Tenant Telemetry components across MCP nodes:
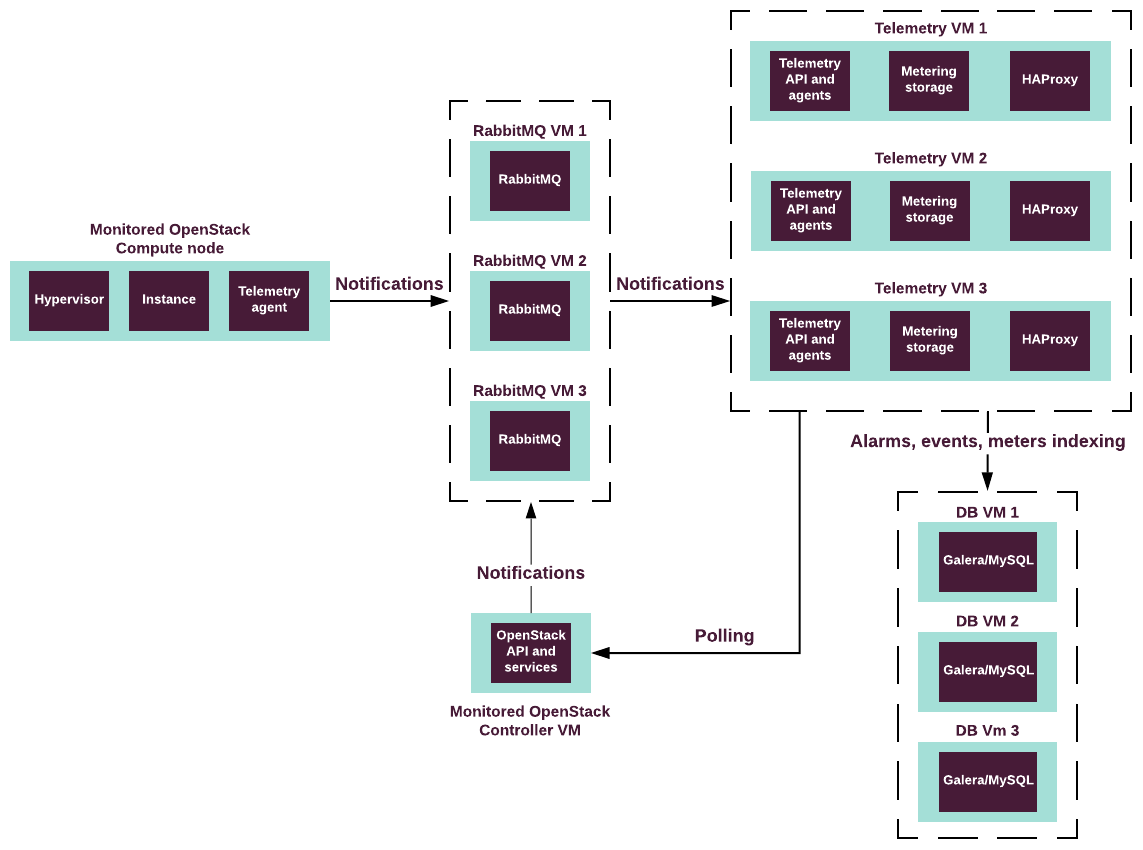
The following diagram displays the data flow across the Tenant Telemetry services:
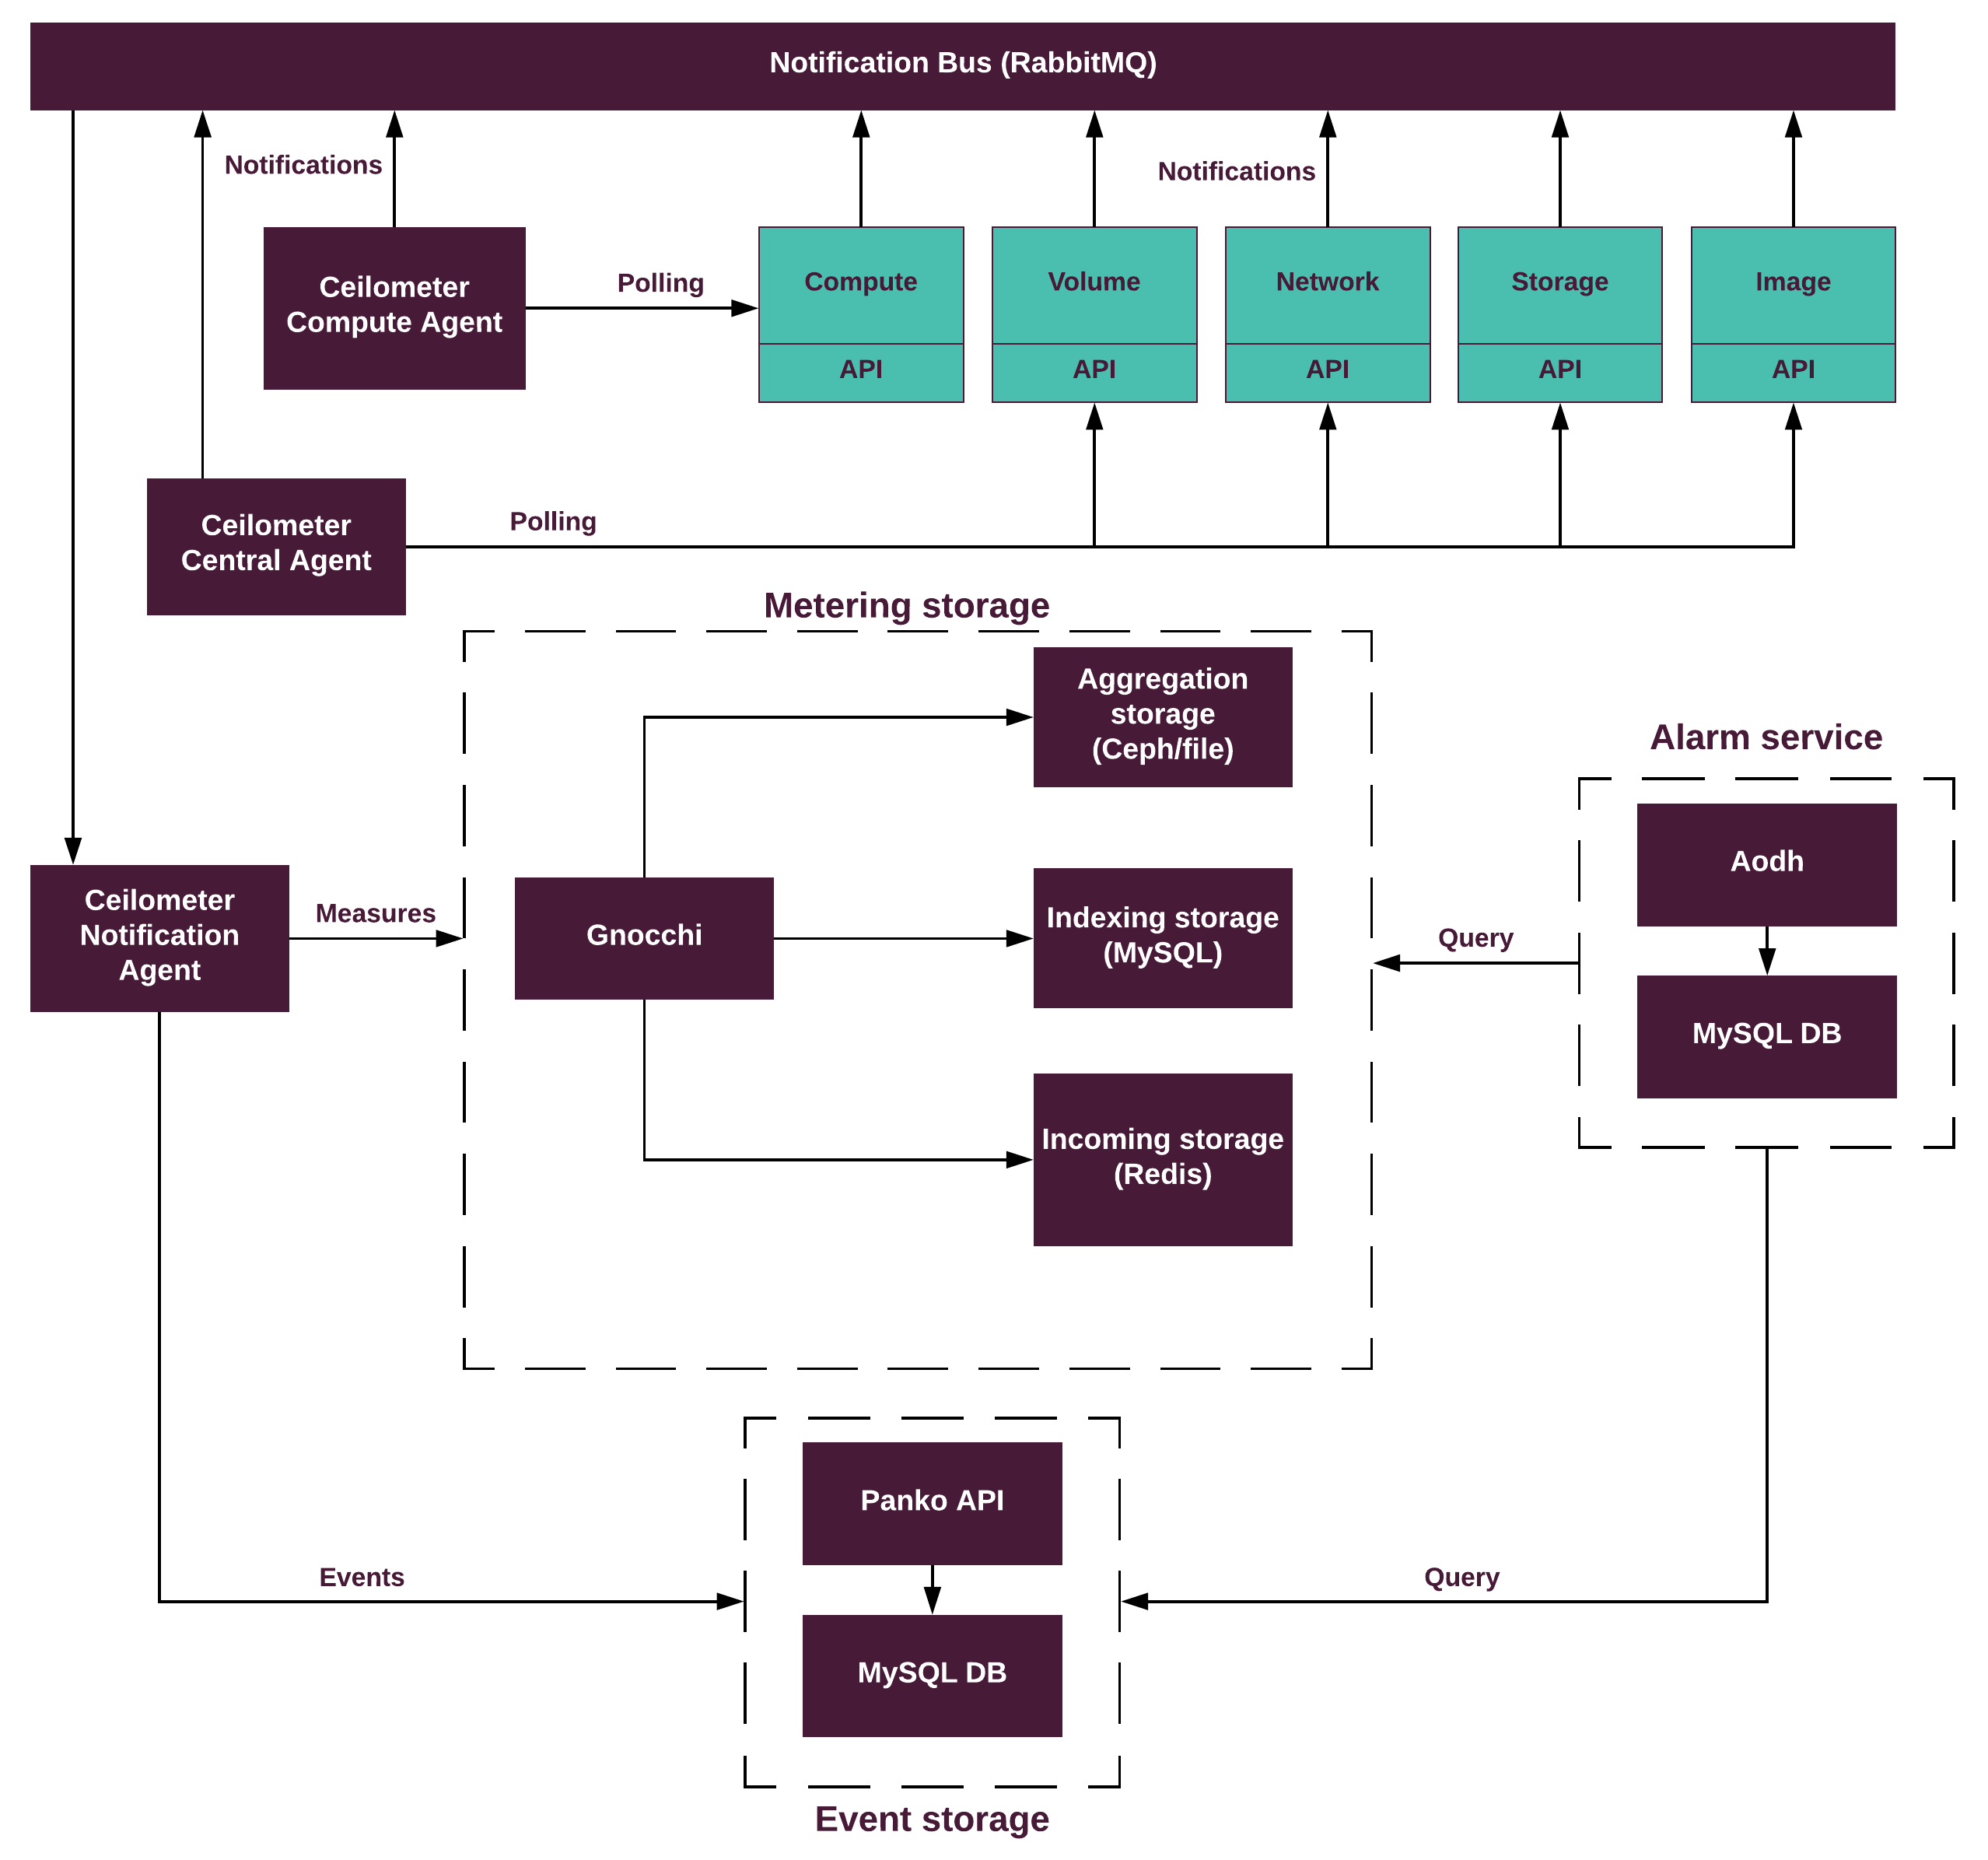
The following table describes the components of Tenant Telemetry:
| Component | Description |
|---|---|
| Ceilometer agents |
|
| Gnocchi agent |
|
| Aodh agents |
|
Heat planning
When creating stacks, the OpenStack Orchestration service (Heat) reuses the incoming token of a user to create resources under the user’s project ownership and to honor RBAC restrictions applicable to this user.
This logic has certain consequences when the stacks creation takes longer than the token expiration time set in the OpenStack Identity service (Keystone) configuration. Therefore, you should plan the expected type of the Heat stacks users to be created in your MCP cluster. Consider the following common issues and ways to overcome them:
Heat fails to create a stack resource
When creating resources from a template, Heat internally builds a graph for resources to be created, updated, or deleted in a well-defined order. If at some point an operation on intermediate resources takes longer than the Keystone token expiration time, the user token that Heat keeps expires and Heat can no longer use it to access other OpenStack APIs. This manifests as
401 Unauthorizederror when trying to modify (create, update, or delete) a resource in another OpenStack service.If you anticipate that your users will create such stacks, consider enabling the following option in the Heat configuration file:
[DEFAULT]
reauthentication_auth_method = trusts
With this setting, Heat creates a Keystone trust between the user set in the
[trustee]section of the Heat configuration file and the user who made the request to Heat. With this trust available, Heat can impersonate the user in all communications with other OpenStack APIs and get a new Keystone token when the initial one expires.Warning
This setting effectively circumvents the token expiry.
Note
Alternatively, a cloud operator can increase the token lifetime to be longer than the maximum anticipated Heat stack creation time.
Since the MCP 2019.2.4 maintenance update, you can set the Keystone trust in your Reclass cluster model:
heat:
  server:
    reauthentication_auth_method: trusts
Signaling to the Heat
WaitConditionwith curl is failingA common use case when provisioning the Nova instances using the Heat templates is to utilize the
OS::Heat::WaitConditionandOS::Heat::WaitConditionHandleresources to signal Heat that the initial configuration of the instance with the user data script is done. This is commonly done using the value of thecurl_cliattribute of theOS::WaitConditionHandleresource inside the user data to be passed to Nova when creating the instance. The value of this attribute contains a predefined command that uses thecurltool to make a request to the Heat API including the appropriate address and the Keystone token. However, the token to use with this request is generated when the correspondingOS::Heat::WaitConditionHandleresource goes toCREATE_COMPLETEstate. If calling of this command while executing the user data script is long enough after the token was created, the token may become expired and signaling Heat will fail.To fix this issue, write the Heat templates in such a way that the
OS::Heat::WaitConditionHandleresource is created immediately before the server it will be used with. Use thedepends_ondirective in the resource definition to precisely plan the instantiation of this resource after all other prerequisite resources for the given server are created.However, if you anticipate that the execution of the user data script inside the instance will take more than the configured expiration time of the Keystone tokens, a cloud operator should either increase the lifetime of the token or use other methods to signal Heat. For more details, see Heat documentation.
Kubernetes cluster
Caution
Kubernetes support termination notice
Starting with the MCP 2019.2.5 update, the Kubernetes component is no longer supported as a part of the MCP product. This implies that Kubernetes is not tested and not shipped as an MCP component. Although the Kubernetes Salt formula is available in the community driven SaltStack formulas ecosystem, Mirantis takes no responsibility for its maintenance.
Customers looking for a Kubernetes distribution and Kubernetes lifecycle management tools are encouraged to evaluate the Mirantis Kubernetes-as-a-Service (KaaS) and Docker Enterprise products.
Kubernetes is an orchestrator for containerized applications. MCP enables you to deploy a Kubernetes cluster on bare metal and provides lifecycle management of the Kubernetes cluster through the continuous integration and continuous delivery pipeline, as well as monitoring through the MCP Logging, Monitoring, and Alerting solution.
Kubernetes cluster overview
Caution
Kubernetes support termination notice
Starting with the MCP 2019.2.5 update, the Kubernetes component is no longer supported as a part of the MCP product. This implies that Kubernetes is not tested and not shipped as an MCP component. Although the Kubernetes Salt formula is available in the community driven SaltStack formulas ecosystem, Mirantis takes no responsibility for its maintenance.
Customers looking for a Kubernetes distribution and Kubernetes lifecycle management tools are encouraged to evaluate the Mirantis Kubernetes-as-a-Service (KaaS) and Docker Enterprise products.
Kubernetes provides orchestration, scheduling, configuration management, horizontal pods scaling, and updates to the containerized customer workloads. Kubernetes components are typically installed on bare metal nodes.
At a high level, a Kubernetes cluster includes the following types of nodes:
- Kubernetes Master
- Runs the services related to the Kubernetes control plane services.
The default hostname is
ctl0X. - Kubernetes Node
- Runs user workloads (previously known as Minion). In MCP, a Kubernetes Node
is identical to a compute node. The default hostname is
cmp00X.
The MCP Kubernetes design is flexible and allows you to install the Kubernetes control plane services on an arbitrary number of nodes. For example, some installations may require you to dedicate a node for the etcd cluster members. The minimum recommended number of nodes in the Kubernetes control plane for production environments is three.
The following diagram describes the minimum production Kubernetes installation with Calico:
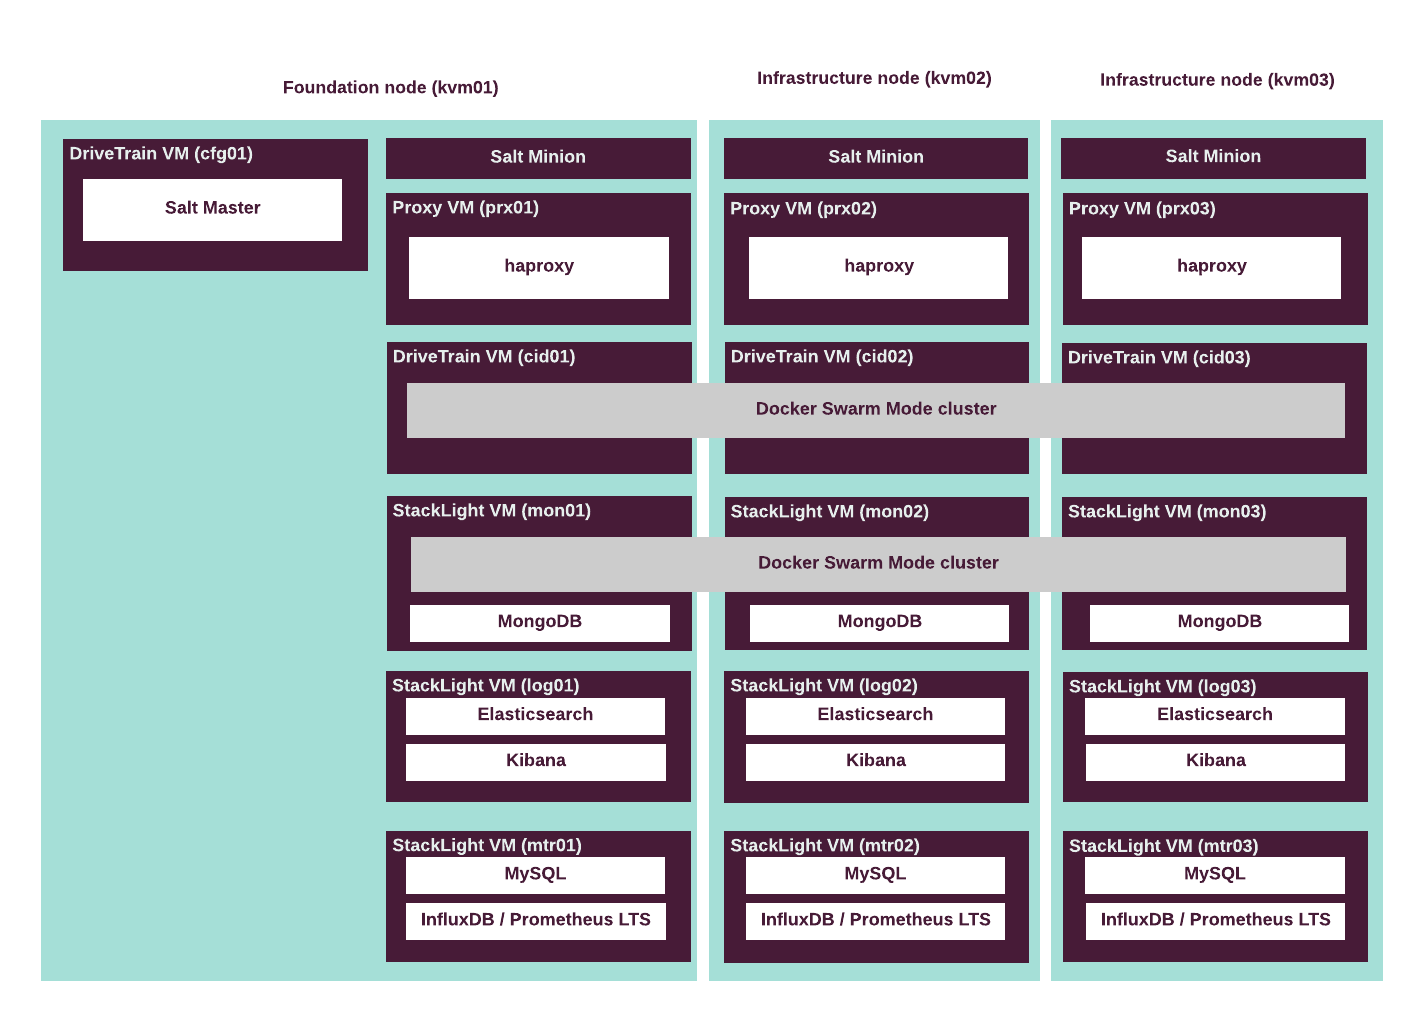
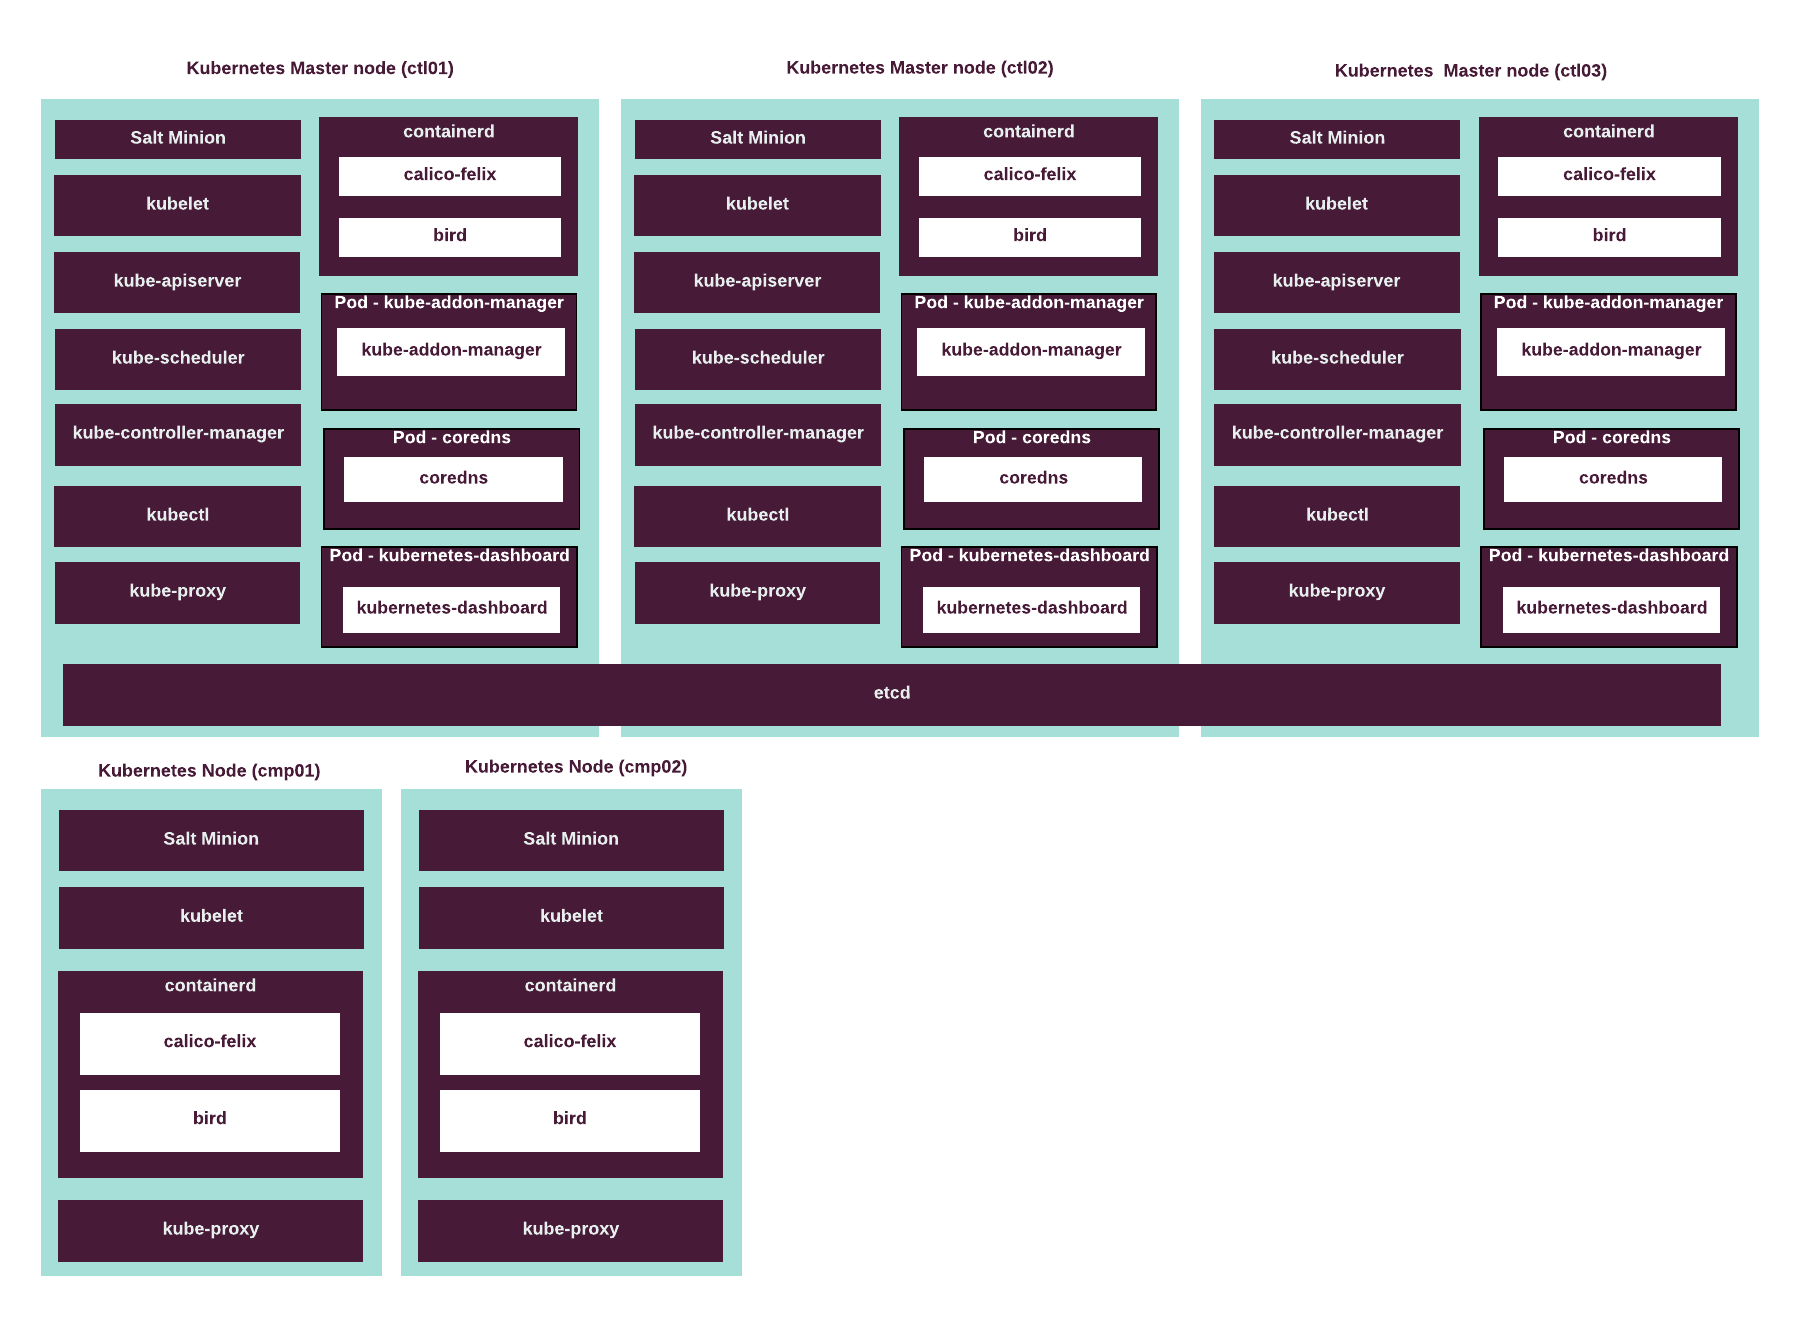
Kubernetes cluster components
Caution
Kubernetes support termination notice
Starting with the MCP 2019.2.5 update, the Kubernetes component is no longer supported as a part of the MCP product. This implies that Kubernetes is not tested and not shipped as an MCP component. Although the Kubernetes Salt formula is available in the community driven SaltStack formulas ecosystem, Mirantis takes no responsibility for its maintenance.
Customers looking for a Kubernetes distribution and Kubernetes lifecycle management tools are encouraged to evaluate the Mirantis Kubernetes-as-a-Service (KaaS) and Docker Enterprise products.
A Kubernetes cluster includes the Kubernetes components as well as supplementary services that run on all or some of the nodes.
Unless noted otherwise, all listed components run as daemon processes
on a host operating system, controlled by systemd.
The components can be divided into the following types:
- Common components
These components run on all nodes in a Kubernetes cluster.
- The
kubeletagent service is responsible for creating and managing containerd containers on the Kubernetes cluster nodes. - The
kube-proxyservice is responsible for the TCP/UDP stream forwarding or round-robin TCP/UDP forwarding across various backends to reach cluster services (acts as a service proxy). This service is used for the Calico SDN only.
- The
- Master components
These components run on the Kubernetes Master nodes and provide the control plane functionality.
- The
etcdservice is a distributed key-value store that stores data across a Kubernetes cluster. - The
kube-addon-managerservice manages two classes of addons with given template files located at/etc/kubernetes/addons/by default. It runs as a pod controlled by Kubernetes. - The
kube-apiserverREST API server verifies and configures data for such API objects as pods, services, replication controllers, and so on. - The
kubectlcommand-line client for the Kubernetes API enables cloud operators to execute commands against Kubernetes clusters. - The
kube-control-managerprocess embeds the core control loops shipped with Kubernetes, such as the replication controller and so on. - The
kube-schedulerutility implements the scheduling functions of workloads provisioning in pods to specific Kubernetes Nodes according to the capacity requirements of workloads, Nodes allowances, and user-defined policies, such as affinity, data localization, and other custom restraints. Thekube-schedulerutility may significantly affect performance, availability, and capacity.
- The
- Networking components
These components run on the Kubernetes nodes.
- The Calico SDN solution provides pure L3 networking
to a Kubernetes cluster. Calico runs as a containerd container
calico-node. - The Container Network Interface (CNI) plugin for the Calico SDN establishes a standard for the network interface configuration in Linux containers.
- The Calico SDN solution provides pure L3 networking
to a Kubernetes cluster. Calico runs as a containerd container
- Mandatory addons
These components are mandatory for an MCP Kubernetes cluster.
- The
corednsprocess manages the DNS requests for the Kubernetes Nodes as well as monitors the Kubernetes Master nodes for changes in Services and Endpoints. It runs runs on the Kubernetes Master nodes as a pod controlled by Kubernetes.
- The
- Optional components
You may need to install these components if your environment has specific requirements:
- The
cni-genieaddon allows container orchestrators to use multiple CNI plugins in runtime. - The Kubernetes
dashboardallows using a web UI to manage applications that run on a Kubernetes cluster as well as troubleshoot them through the web UI. - The
external-dnsmanages DNS records dynamically through the Kubernetes resources in a DNS provider-agnostic way, as well as makes these resources discoverable through public DNS servers. - The
helmaddon is a tool for managing Kubernetes charts. - The
ingress-nginxcontroller provides load balancing, SSL termination, and name-based virtual hosting. The NGINX Ingress controller requires MetalLB to be enabled on a cluster. - The
metallbservice for Calico provides external IP addresses to the workloads services, for example, NGINX, from the pool of addresses defined in the MetalLB configuration. - The
sriov-cniCNI plugin allows the Kubernetes pods to attach to an SR-IOV virtual function.
- The
Network planning
Caution
Kubernetes support termination notice
Starting with the MCP 2019.2.5 update, the Kubernetes component is no longer supported as a part of the MCP product. This implies that Kubernetes is not tested and not shipped as an MCP component. Although the Kubernetes Salt formula is available in the community driven SaltStack formulas ecosystem, Mirantis takes no responsibility for its maintenance.
Customers looking for a Kubernetes distribution and Kubernetes lifecycle management tools are encouraged to evaluate the Mirantis Kubernetes-as-a-Service (KaaS) and Docker Enterprise products.
Mirantis Cloud Platform supports Calico as a networking solution for Kubernetes clusters.
Calico is a distributed networking controller integrated through the
Container Network Interface (CNI) plugin that provides pure L3 networking
to a Kubernetes cluster. Calico runs as a containerd container calico-node
on the Kubernetes nodes. This container includes all Calico services.
When using Calico, the workload network, which is analogous to the tenant
network in OpenStack, is combined with the public and storage networks
into one flat L3 space. You can also specify the pool.address parameter
for particular hosts to define an interface for the workload network traffic.
This parameter defines a host IP address that is used as a source IP address
to reach other nodes in a Kubernetes cluster.
Kubernetes has one logical network for all Kubernetes workloads. Each Kubernetes Master node and Kubernetes Node has one network interface for the traffic flow between nodes.
Caution
OpenContrail 4.x for Kubernetes 1.12 or later is not supported.
Types of networks
When planning your MCP Kubernetes cluster, consider the types of traffic that your workloads generate and design your network accordingly.
An MCP Kubernetes cluster with Calico contains the following types of the underlay networks:
- PXE/Management
The non-routable network that is used for MAAS and Salt for DHCP traffic, provisioning and managing nodes. It usually requires a 1 Gbps network interface.
- Control network
The routable network for managing traffic between
kube-api,kubelet, and OpenContrail (or Calico). It is also used to access the KVM nodes.
- Public network
The routable network for external IP addresses of the LoadBalancer services managed by MetalLB. The public and workload networks are combined into one flat IP address space. Network traffic can then be separated using network policies and IP pools.
- Workload network
The routable network for communication between containers in a cluster that is managed by Calico. It is analogous to the tenant network in OpenStack.
- Storage network (optional)
The routable network used for storage traffic.
Calico networking considerations
As Kubernetes does not provide native support for inter-pod networking, MCP uses Calico as an L3 networking provider for all Kubernetes deployments through the Container Network Interface (CNI) plugin. The CNI plugin establishes a standard for the network interface configuration in Linux containers.
Calico ensures propagation of a container IP address to all Kubernetes Nodes over the BGP protocol, as well as provides network connectivity between the containers. It also provides dynamic enforcement of the Kubernetes network policies. Calico uses the etcd key-value store or the Kubernetes API datastore as a configuration data storage.
Calico runs in a container called calico-node on every node in a
Kubernetes cluster. The calico-node container is controlled by the
operating system directly as a systemd service.
The calico-node container incorporates the following main Calico services:
- Felix
- The primary Calico agent which is responsible for programming routes and ACLs, as well as for all components and services required to provide network connectivity on the host.
- BIRD
- A lightweight BGP daemon that distributes routing information between the nodes of the Calico network.
- confd
- Dynamic configuration manager for BIRD, triggered automatically by updates in the configuration data.
The Kubernetes controllers for Calico are deployed as a single pod
in a Calico kube-controllers deployment that runs as a Kubernetes addon.
The Kubernetes controllers for Calico are only required when using
the etcd datastore, which is the default configuration in MCP.
The Kubernetes controllers for Calico are enabled by default and are
as follows:
- Policy controller
- Monitors network policies and programs the Calico policies.
- Profile controller
- Monitors namespaces and programs the Calico profiles.
- Workload endpoint controller
- Monitors changes in pod labels and updates the Calico workload endpoints.
- Node controller
- Monitors removal of the Kubernetes Nodes and removes corresponding data from Calico.
Network checker overview
Network checker, or Netchecker, is a Kubernetes application that verifies connectivity between the Kubernetes nodes.
Netchecker comprises the following components:
- Netchecker agent is deployed on every Kubernetes node using the Daemonset mechanism which ensures automatic pod management. Agents periodically gather networking information from the Kubernetes nodes and send it to the Netchecker server.
- Netchecker server is deployed in a dedicated Kubernetes pod and exposed inside of the cluster through the Kubernetes service resource. All Netchecker agents connect to the Netchecker server through the service DNS name.
The communication mechanism between the user and Netchecker is the HTTP RESTful interface. You can run the following requests:
GET-/api/v1/connectivity_check- request to test the connectivity between the Netchecker server and agents. The response contains information about possible issues.Example of the request:
curl http://nc-server-ip:port/api/v1/connectivity_checkThis request returns the following:
MessageA text that describes the status of the connection between the agent and server pods. Example: All 4 pods successfully reported back to the server.AbsentIndicates that the Netchecker server failed to receive reports from one or more Netchecker agents since the deployment of the Netchecker application. This field can be empty. OutdatedIndicates that the Netchecker server failed to receive reports from one or more agents within the configured report interval due to a connectivity error. This field can be empty.
The following diagram illustrates how the Netchecker works:
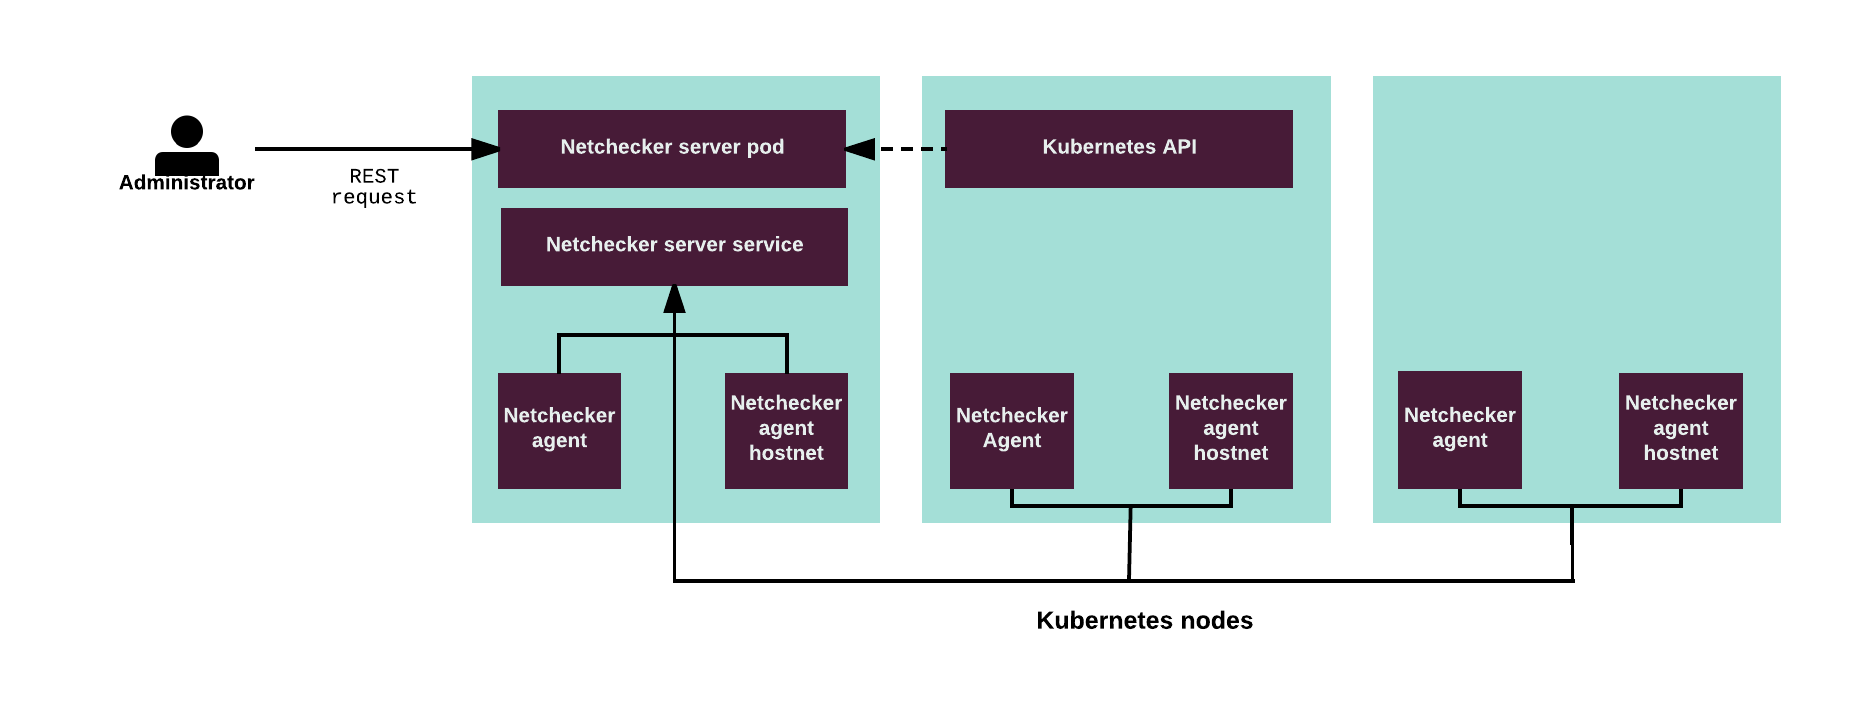
MetalLB support
In MCP, MetalLB is a Kubernetes add-on that provides a network load balancer for bare metal Calico-based Kubernetes clusters using standard routing protocols.
MetalLB support is available starting Kubernetes 1.9.0 on clusters that do not have the network load balancing implemented yet.
Since MetalLB provides a standard network load balancer functionality, it is compatible with several Kubernetes networking add-ons.
In MCP, MetalLB supports only the layer-2 mode. For details, see: MetalLB in layer-2 mode. MetalLB in the Border Gateway Protocol (BGP) mode is not supported yet.
In an MCP Kubernetes cluster, MetalLB runs in pods on the Kubernetes Nodes.
When using MetalLB, you can also enable the NGINX Ingress controller to provide an external access to Kubernetes services.
Etcd cluster
Caution
Kubernetes support termination notice
Starting with the MCP 2019.2.5 update, the Kubernetes component is no longer supported as a part of the MCP product. This implies that Kubernetes is not tested and not shipped as an MCP component. Although the Kubernetes Salt formula is available in the community driven SaltStack formulas ecosystem, Mirantis takes no responsibility for its maintenance.
Customers looking for a Kubernetes distribution and Kubernetes lifecycle management tools are encouraged to evaluate the Mirantis Kubernetes-as-a-Service (KaaS) and Docker Enterprise products.
In the MCP Kubernetes cluster deployment, etcd is used for both Kubernetes components and Calico networking. Etcd is a distributed key-value store that allows you to store data from cluster environments. Etcd is based on the Raft consensus algorithm that ensures fault-tolerance and high performance of the store.
Every instance of etcd operates in the full daemon mode
participating in Raft consensus and having persistent storage.
Three instances of etcd run in full mode on the Kubernetes Master nodes.
This ensures quorum in the cluster and resiliency of service.
The etcd service runs as a systemd service.
High availability in Kubernetes
Caution
Kubernetes support termination notice
Starting with the MCP 2019.2.5 update, the Kubernetes component is no longer supported as a part of the MCP product. This implies that Kubernetes is not tested and not shipped as an MCP component. Although the Kubernetes Salt formula is available in the community driven SaltStack formulas ecosystem, Mirantis takes no responsibility for its maintenance.
Customers looking for a Kubernetes distribution and Kubernetes lifecycle management tools are encouraged to evaluate the Mirantis Kubernetes-as-a-Service (KaaS) and Docker Enterprise products.
In a Calico-based MCP Kubernetes cluster, the control plane services are highly available and work in active-standby mode. All Kubernetes control components run on every Kubernetes Master node of a cluster with one node at a time being selected as a master replica and others running in the standby mode.
Every Kubernetes Master node runs an instance of kube-scheduler and
kube-controller-manager. Only one service of each kind is active
at a time, while others remain in the warm standby mode.
The kube-controller-manager and kube-scheduler services
elect their own leaders natively.
API servers work independently while external or internal
Kubernetes load balancer dispatches requests between all of them.
Each of the three Kubernetes Master nodes runs its own instance of
kube-apiserver. All Kubernetes Master nodes services work with
the Kubernetes API locally, while the services that run on the Kubernetes Nodes
access the Kubernetes API by directly connecting to an instance of
kube-apiserver.
The following diagram describes the API flow in a highly available
Kubernetes cluster where each API instance on every Kubernetes Master node
interacts with each HAProxy instance, etcd cluster, and each kubelet
instance on the Kubernetes Nodes.
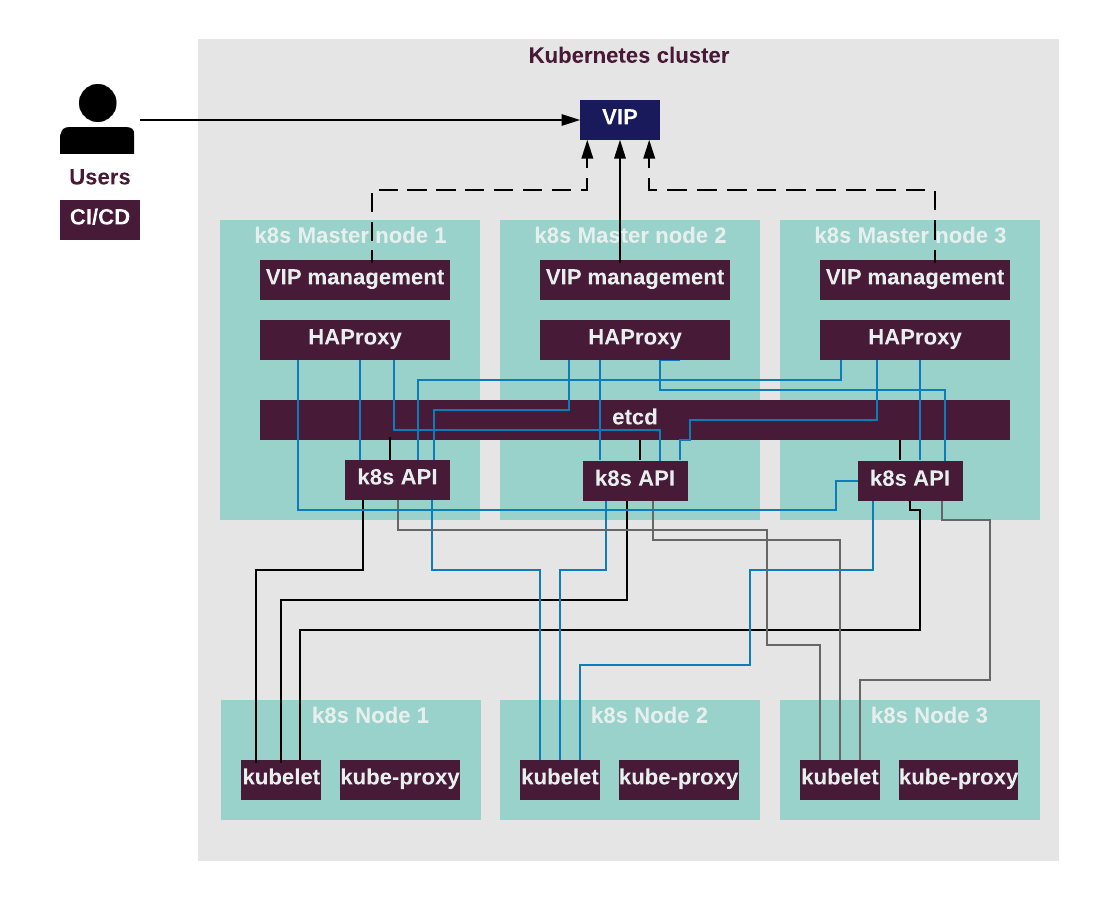
High availability of the proxy server is ensured by HAProxy.
HAProxy provides access to the Kubernetes API endpoint
by redirecting requests to instances of kube-apiserver
in a round-robin fashion. The proxy server sends API traffic to
available backends and HAProxy prevents the traffic from going to the
unavailable nodes. The Keepalived daemon provides VIP management
for the proxy server. Optionally, SSL termination can be configured
on HAProxy, so that the traffic to kube-apiserver instances
goes over the internal Kubernetes network.
Virtual machines as Kubernetes pods
Caution
Kubernetes support termination notice
Starting with the MCP 2019.2.5 update, the Kubernetes component is no longer supported as a part of the MCP product. This implies that Kubernetes is not tested and not shipped as an MCP component. Although the Kubernetes Salt formula is available in the community driven SaltStack formulas ecosystem, Mirantis takes no responsibility for its maintenance.
Customers looking for a Kubernetes distribution and Kubernetes lifecycle management tools are encouraged to evaluate the Mirantis Kubernetes-as-a-Service (KaaS) and Docker Enterprise products.
MCP allows running QEMU/KVM virtual machines as Kubernetes pods using Virtlet.
Virtlet is a Kubernetes Container Runtime Interface (CRI) implementation that is packaged as a Docker image and contains such components as a libvirt daemon, QEMU/KVM wrapper, and so on.
Virtlet enables you to run unmodified QEMU/KVM virtual machines that do not include an additional containerd layer as in similar solutions in Kubernetes. Virtlet supports all standard Kubernetes objects, such as ReplicaSets, Deployments, DaemonSets, and so on, as well as their operations.
Virtlet uses libvirt API to manage virtual machine and translates Kubernetes API primitives into operations over libvirt.
The following diagram describes the Virtlet components and interactions between them.

Virtlet includes the following components:
- Virtlet manager that implements CRI interfaces for virtualization and image handling
- A libvirt instance
- Virtlet tapmanager that is responsible for managing a VM networking
- Virtlet vmwrapper that is responsible for preparing environment for an emulator
- An emulator (QEMU with KVM support and with a possibility to disable KVM)
- Container Runtime Interface (CRI) Proxy that provides the ability to mix containerd and VM-based workloads on the same Kubernetes node
The image service provides VM images accessible through HTTP in a local cluster environment. It is only used as an optional helper because Virtlet manager can pull images from any HTTP server accessible from the node.
Limitations
Before you include Virtlet to your MCP Kubernetes cluster architecture, consider the following limitations:
- Virtlet with OpenContrail is available as technical preview. Use such configuration for testing and evaluation purposes only.
Virtlet manager
Virtlet manager has the main binary file that is responsible for providing
API that fulfills the Container Runtime Interface (CRI) specification.
Virtlet manager handles the requests from kubelet and has
the following functionality:
- Control the preparation of libvirt VM environment (virtual drives, network interfaces, trimming resources like RAM, CPU).
- Call CNI plugins to setup network environment for virtual machines.
- Request libvirt to call vmwrapper instead of using emulator directly.
- Query libvirt for VM statuses.
- Instruct libvirt to stop VMs.
- Call libvirt to remove a VM environment.
See also
Virtlet tapmanager
Virtlet tapmanger controls the setup of VM networking using CNI
that is started by the virtlet command, since tapmanger uses
the same virtlet binary.
The Virtlet tapmanger process has the following functionality:
- Take the setup requests from the Virtlet manager and set up networking for a VM by producing an open file descriptor that corresponds to the TAP device.
- Run DHCP server for each active VM.
- Handle requests from
vmwrapperby sending the file descriptor over a Unix domain socket tovmwrapper. As a result, this file descriptor can be used in another mount namespace of a container. And you do not need a shared access to the directory containing network namespaces. - Remove a VM network upon the Virtlet manager requests.
Virtlet vmwrapper
Virtlet vmwrapper is controlled by libvirt and runs the emulator
(QVM/QEMU).
The Virtlet vmwrapper process has the following functionality:
- Request TAP file descriptor from
tapmanager. - Add the command-line arguments required by the emulator to use the TAP device.
- Spawn the emulator.
See also
Container Runtime Interface Proxy
Container Runtime Interface (CRI) Proxy provides a way to run multiple CRI
implementations on the same node, for example, Virtlet and containerd.
It enables running infrastructure pods such as kube-proxy.
CRI Proxy allows using containerd as one of CRI implementations
on the multi-runtime nodes.
See also
OpenStack cloud provider for Kubernetes
Caution
Kubernetes support termination notice
Starting with the MCP 2019.2.5 update, the Kubernetes component is no longer supported as a part of the MCP product. This implies that Kubernetes is not tested and not shipped as an MCP component. Although the Kubernetes Salt formula is available in the community driven SaltStack formulas ecosystem, Mirantis takes no responsibility for its maintenance.
Customers looking for a Kubernetes distribution and Kubernetes lifecycle management tools are encouraged to evaluate the Mirantis Kubernetes-as-a-Service (KaaS) and Docker Enterprise products.
Note
This feature is available as technical preview in the MCP Build ID 2019.2.0. Starting from the MCP 2019.2.2 update, the feature is fully supported.
The OpenStack cloud provider extends the basic functionality of Kubernetes by fulfilling the provider requirement for several resources. This is achieved through communication with several OpenStack APIs. As a rule, the Kubernetes cluster must consist of instances that are deployed on an OpenStack environment in order to activate the cloud provider.
Additionally, the OpenStack environment must have the following components installed: Nova, Keystone, Neutron (with Octavia), and Cinder.
In the future, DNS support may become available through the Designate project.
Several of the Kubernetes components communicate with the OpenStack environment services in order to obtain information as well as create and maintain objects.
The kubelet service accesses nova to obtain the nova
instance name. The kubelet node name will be set to the instance name.
It also accesses cinder to mount PersistentVolumes that are requested
by a pod.
The kube-apiserver service accesses nova to limit admission
to the Kubernetes cluster. The service only allows the
cloudprovider-enabled Kubernetes nodes to register themselves into the
cluster.
The openstack-cloud-controller-manager service accesses cinder
and neutron to create PersistentVolumes (using cinder) and
LoadBalancers (using neutron-lbaas).
Below is a diagram of the components involved and how they interact.
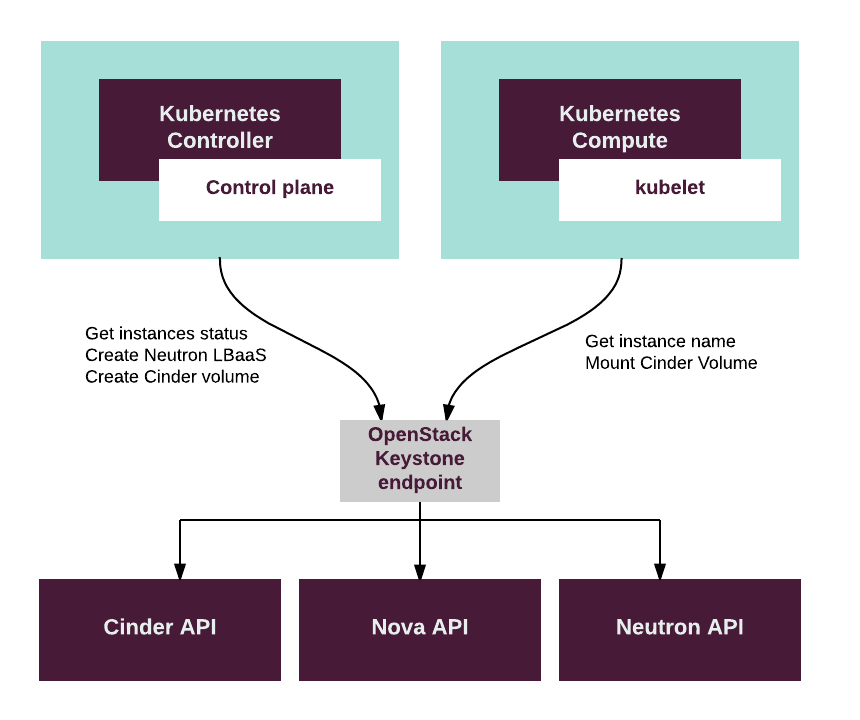
Fixed in 2019.2.2 OpenStack cloud provider has the following limitation: it works as designed only when a Kubernetes node has only one physical network interface. For more details, see the community bug.
OpenContrail
Caution
The OpenContrail versions support status:
- OpenContrail 4.1 is fully supported.
- OpenContrail 4.0 is deprecated and not supported for new deployments since MCP maintenance update 2019.2.4.
- OpenContrail 3.2 is not supported for new deployments.
OpenContrail is a highly scalable distributed Software Defined Networking (SDN) solution for MCP. It provides NFV capabilities as well as powerful network analytics and visualization of results through a web UI. OpenContrail cluster is integrated with to provision, orchestrate, and deploy high-performance clusters with various networking features.
Caution
OpenContrail 4.x for Kubernetes 1.12 or later is not supported.
The following table describes the main features of OpenContrail in comparison with OVS for OpenStack:
| Feature name | OpenContrail | OVS |
|---|---|---|
| Encapsulation | MPLSoGRE, MPLSoUDP, VXLAN | VLAN, VXLAN, GRE, Geneve |
| Security and multitenancy | Native overlay, label, namespaces | Native overlay, label, namespaces |
| Multi-cloud | Bare metal, VMs, containers | Bare metal, VMs, containers |
| Network analytics | Yes | No |
| NFV | Yes | Yes |
| Dataplane acceleration | DPDK, SR-IOV | DPDK, SR-IOV |
| Extra features | Bare metal extensions, L2VPN, L3VPN | LBaaS |
Limitations
The OpenContrail deployment in MCP includes the following limitations:
OpenContrail does not support tenant renaming due to architecture limitations.
OpenContrail does not support parallel addition and removal of rules to and from security groups.
By default, one worker of the
contrail-apiservice is used. If needed, you can enable multiple workers in your Reclass cluster model, but this setting requires thekeystone_sync_on_demand=falseoption that allows fixing the issue with the synchronization of the information about the OpenStack projects. Be aware that with such a configuration, you can start setting network entities in a newly created OpenStack project only one minute after this project is created.To set multiple workers with the
keystone_sync_on_demand=falseoption, refer to MCP Operations Guide: Set multiple contrail-api workers.Fixed in 2019.2.3 In the MCP Build ID 2019.2.0, by default, one worker of the
contrail-apiservice is used. If needed, you can enable multiple workers in your Reclass cluster model, but this setting requires thekeystone_sync_on_demand=falseoption that allows fixing the issue with the synchronization of the information about the OpenStack projects. Be aware that with such a configuration, you can start setting network entities in a newly created OpenStack project only one minute after this project is created.To set multiple workers with the
keystone_sync_on_demand=falseoption, refer to MCP Operations Guide: Set multiple contrail-api workers.Starting from the MCP 2019.2.3 update, by default, six workers of the
contrail-apiservice are used and you do not need thekeystone_sync_on_demand=falseoption to be enabled for multiple workers. Therefore, the limitation described above is removed.
OpenContrail cluster overview
OpenContrail provides the following types of networking to an OpenStack environment running on MCP cluster:
- Basic networking that includes IP address management, security groups, floating IP addresses, and so on
- Advanced networking that includes DPDK network virtualization and SR-IOV
OpenContrail is based on the overlay networking, where all containers are connected to a virtual network with encapsulation (MPLSoGRE, MPLSoUDP, VXLAN).
In the current network model, the OpenContrail vRouter uses different gateways for the control and data planes.
Caution
The OpenContrail versions support status:
- OpenContrail 4.1 is fully supported.
- OpenContrail 4.0 is deprecated and not supported for new deployments since MCP maintenance update 2019.2.4.
- OpenContrail 3.2 is not supported for new deployments.
OpenContrail 3.2 cluster overview
Caution
The OpenContrail versions support status:
- OpenContrail 4.1 is fully supported.
- OpenContrail 4.0 is deprecated and not supported for new deployments since MCP maintenance update 2019.2.4.
- OpenContrail 3.2 is not supported for new deployments.
An OpenContrail 3.2 cluster contains the following types of nodes:
- Controller node
Includes package-based services of OpenContrail, such as the API server and configuration database.
- Analytics node
Includes package-based services for OpenContrail metering and analytics, such as the Cassandra database for analytics and data collectors.
- vRouter node
A forwarding plane that runs in the hypervisor of a compute node. It extends the network from the physical routers and switches into a virtual overlay network hosted on compute nodes.
- Gateway node
A physical or virtual gateway router that provides access to an external network.
The following diagram describes the minimum production installation of OpenContrail 3.2 with OpenStack for MCP:
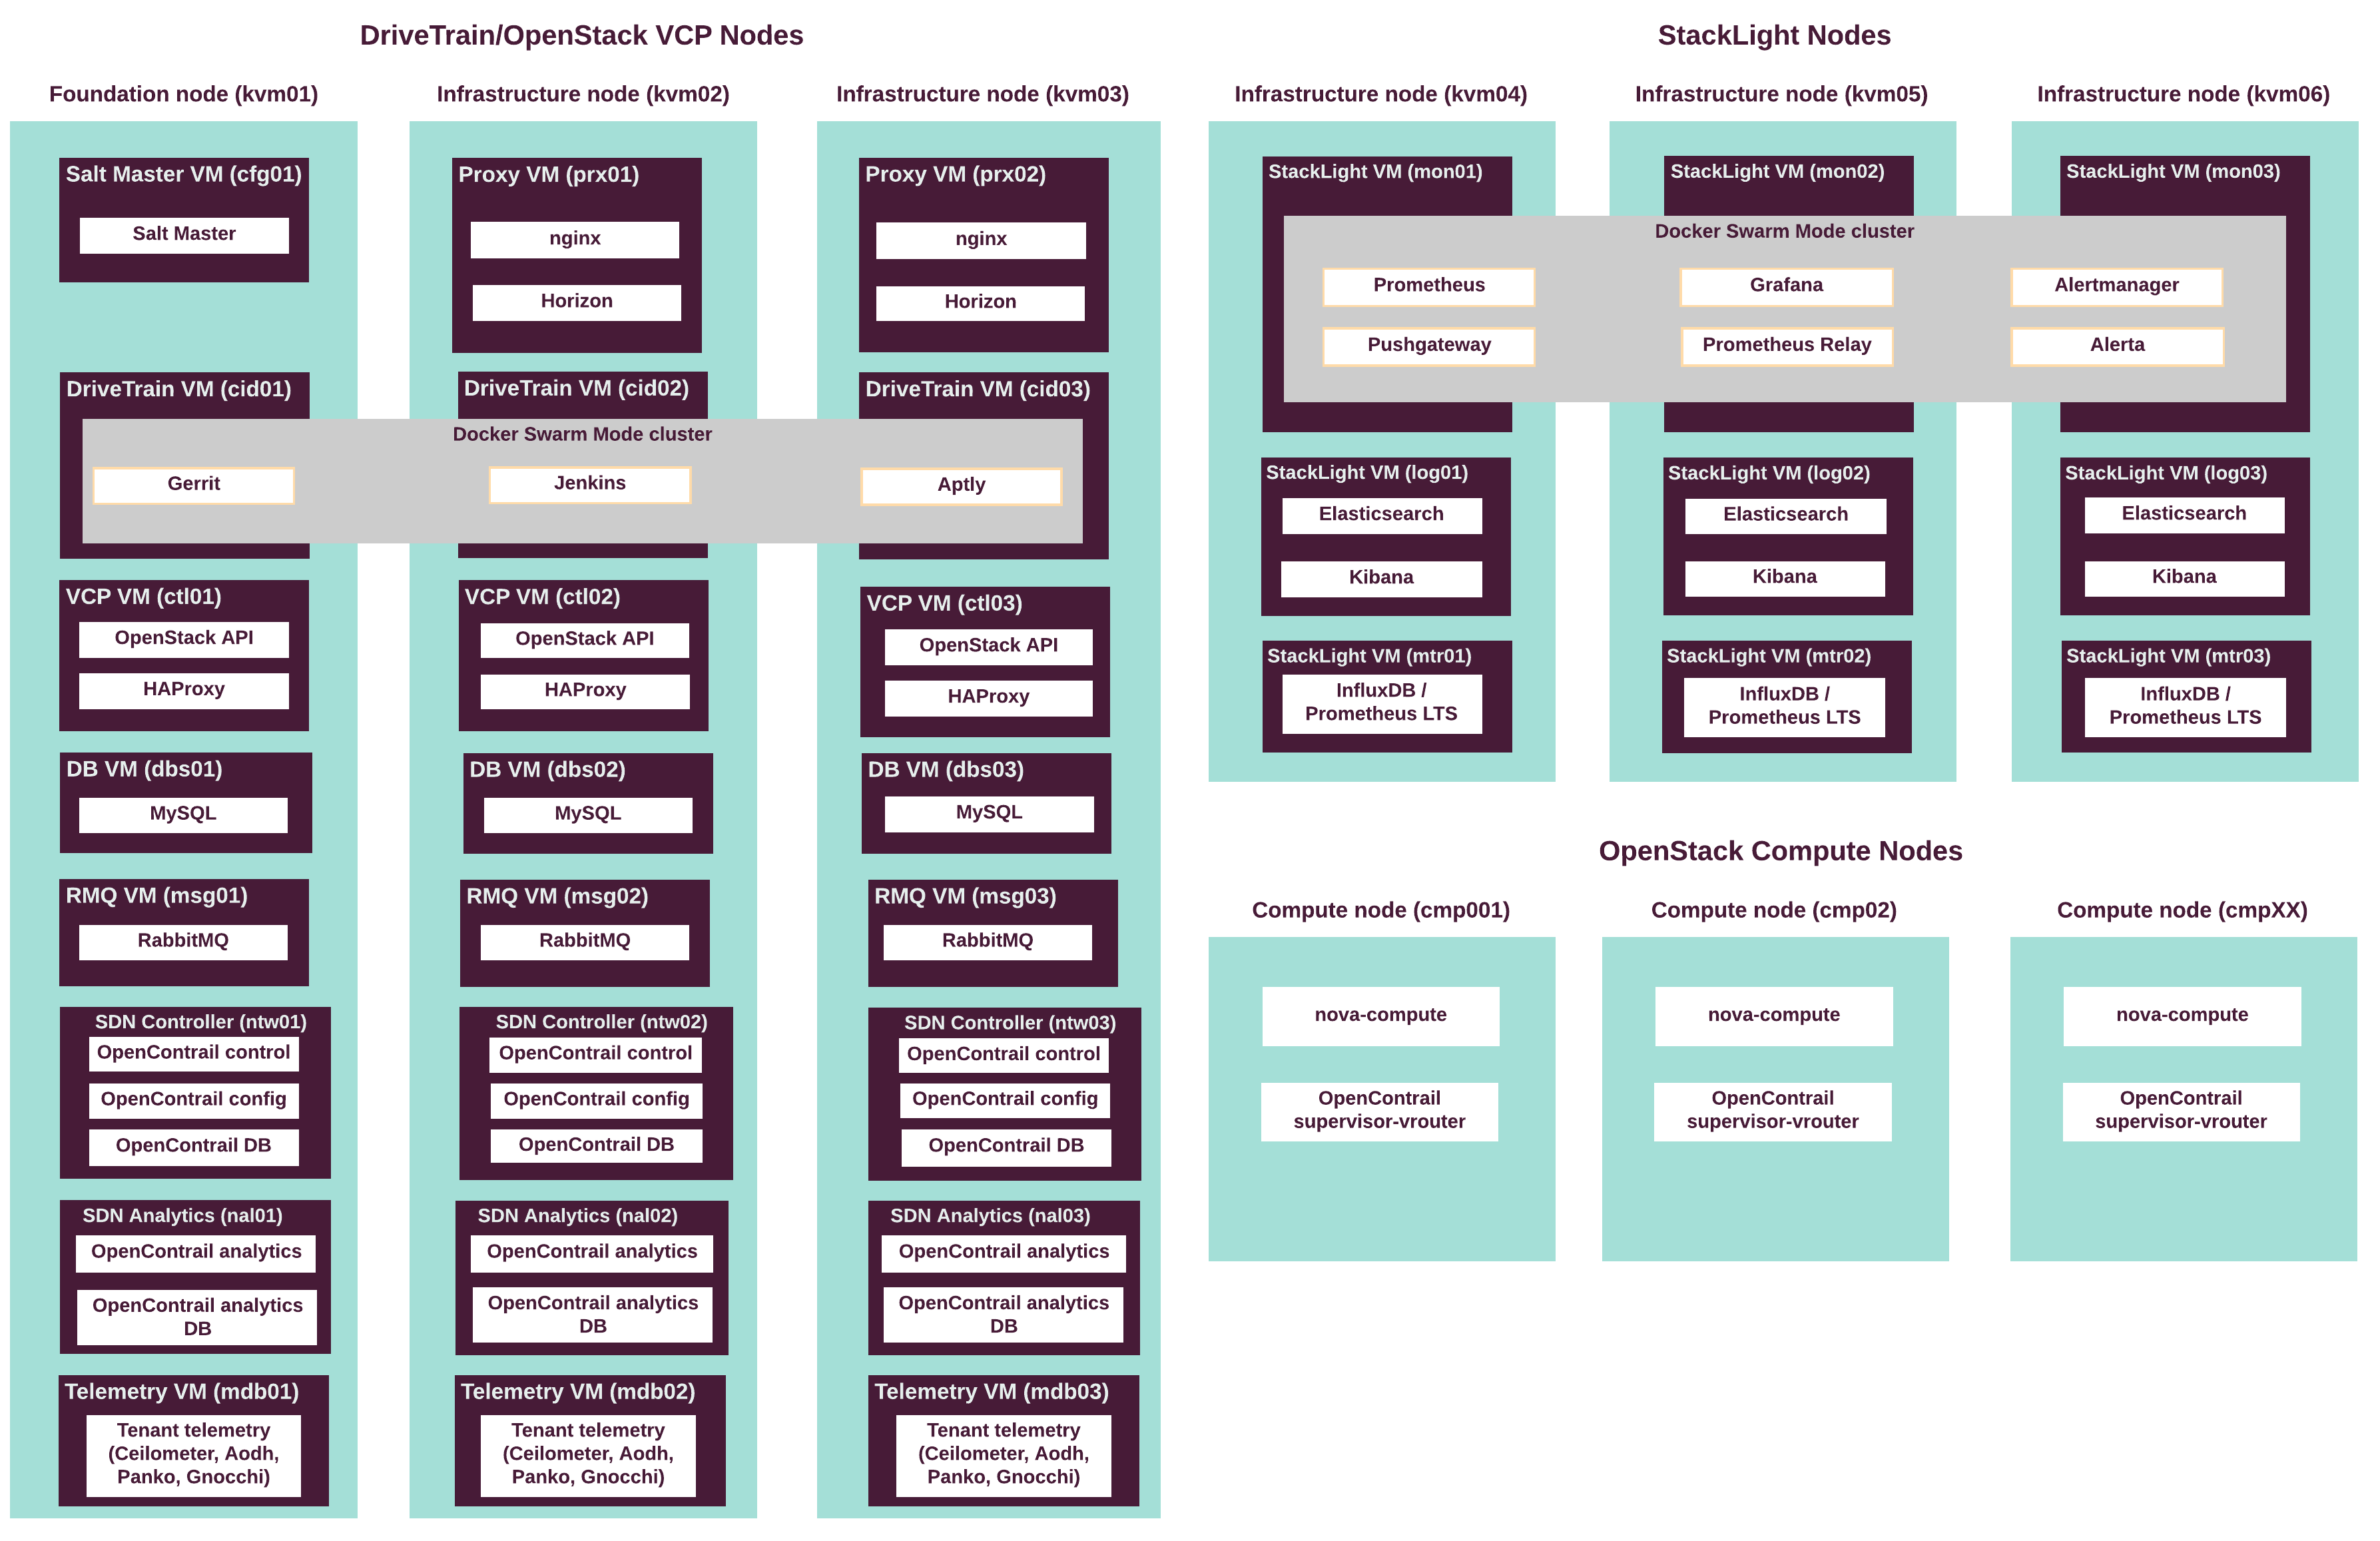
OpenContrail 4.x cluster overview
Caution
The OpenContrail versions support status:
- OpenContrail 4.1 is fully supported.
- OpenContrail 4.0 is deprecated and not supported for new deployments since MCP maintenance update 2019.2.4.
- OpenContrail 3.2 is not supported for new deployments.
In OpenContrail 4.x, the OpenContrail controller and analytics modules are delivered as containers to reduce the complexity of the OpenContrail deployment and to group the related OpenContrail components.
Each container has an INI-based configuration file that is available on the host system and mounted within a specific container.
The OpenContrail containers run with the host network,
without using a Docker bridge. All services within a container
listen on the host network interface.
Note
For the sake of visual clarity, the diagrams in this section illustrate only the OpenContrail architecture with OpenStack. The diagrams presuppose the DriveTrain and StackLight LMA nodes.
The following diagram describes the minimum production installation of OpenContrail 4.x with OpenStack for MCP.
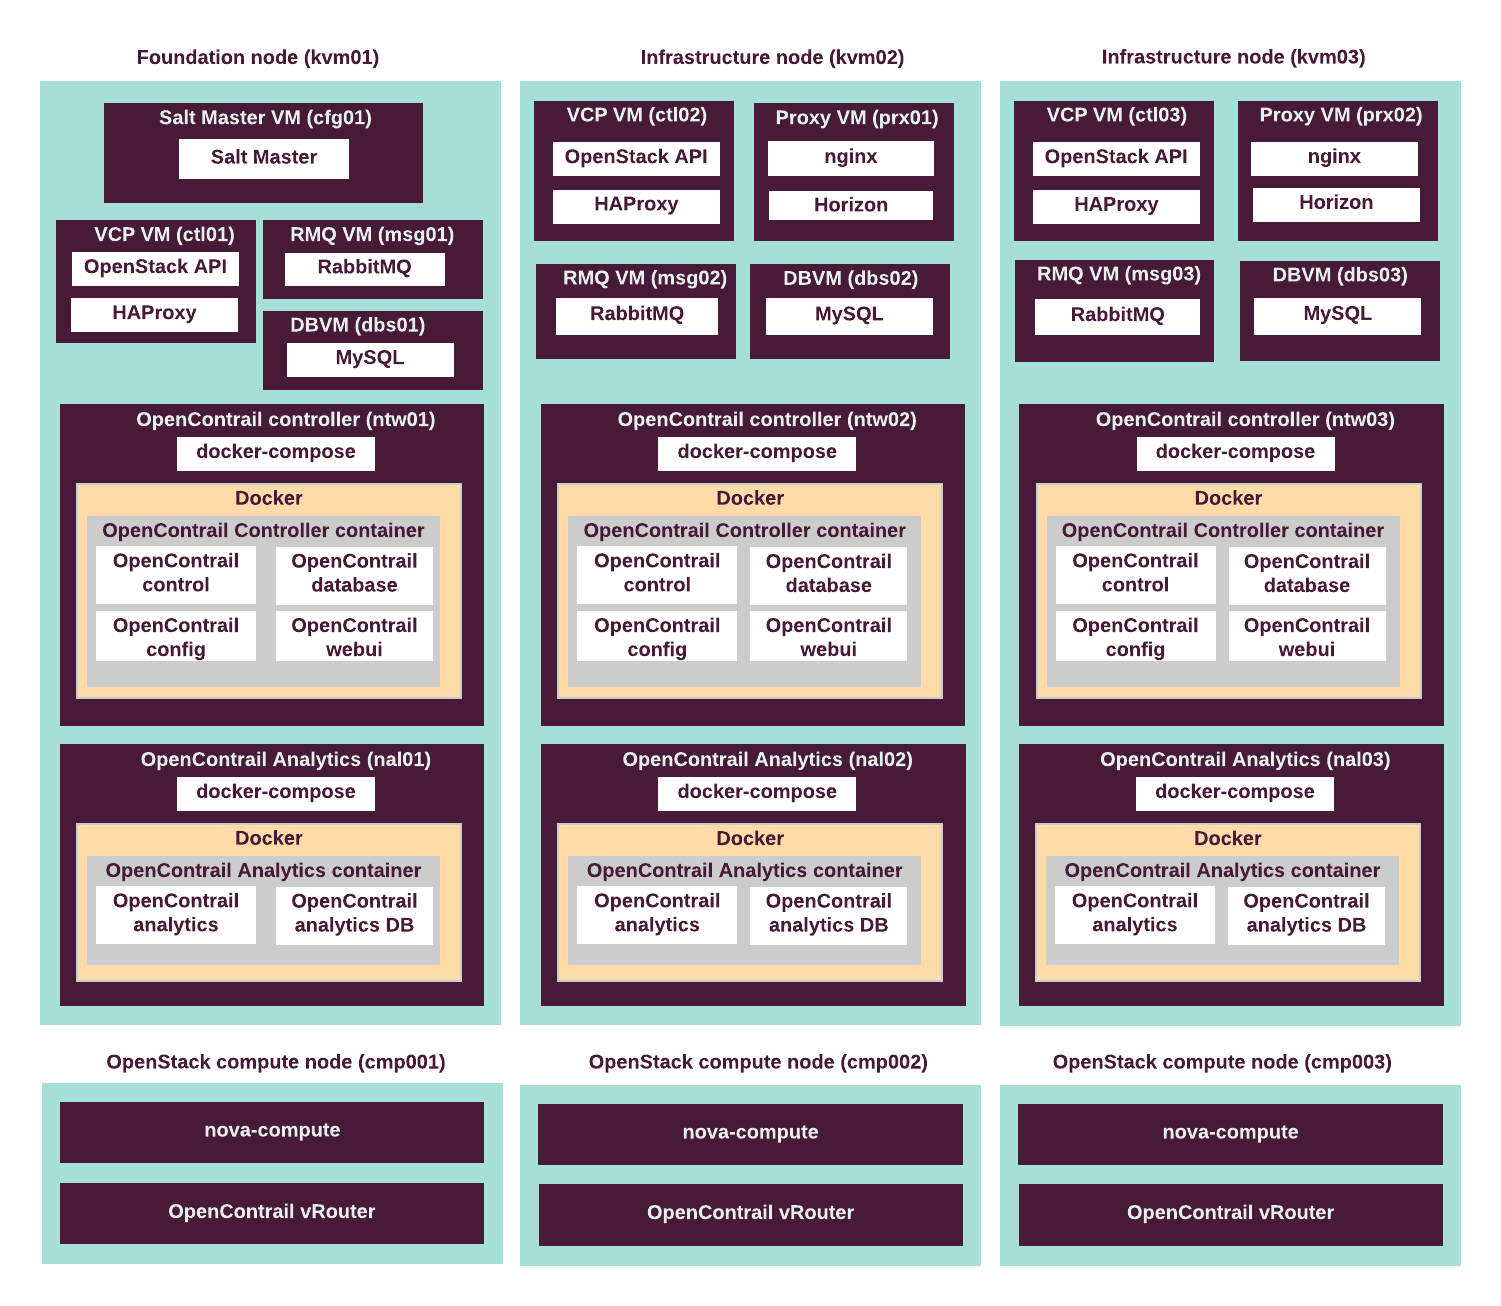
An OpenContrail 4.x cluster for OpenStack contains the following types of entities:
- Controller Docker container
Includes the package-based OpenContrail services, such as the API server and configuration database. Runs on top of the
ntwvirtual machine as a Docker container initialized bydocker-compose.
- Analytics Docker container
Includes the OpenContrail metering and analytics package-based services, such as analytics API, alarm generator and data collector. Runs on top of the
nalvirtual machine as a Docker container initialized bydocker-compose.
- Analyticsdb Docker container
Includes the OpenContrail metering and analytics package-based services. This container includes a database for Analytics container, Kafka, and ZooKeeper. Runs on top of the
nalvirtual machine as a Docker container initialized bydocker-compose.
- vRouter node
A forwarding plane that runs in the hypervisor of a compute node. It extends the network from the physical routers and switches into a virtual overlay network hosted on compute nodes.
- Gateway node
A physical or virtual gateway router that provides access to an external network.
See also
OpenContrail components
Caution
The OpenContrail versions support status:
- OpenContrail 4.1 is fully supported.
- OpenContrail 4.0 is deprecated and not supported for new deployments since MCP maintenance update 2019.2.4.
- OpenContrail 3.2 is not supported for new deployments.
The difference between components in the specified OpenContrail versions is as follows:
- In OpenContrail 3.2, services run as
supervisorornon-supervisorservices. In OpenContrail 4.x, all services run assystemdservices in a Docker container. - In OpenContrail 4.x, the
ifmap-serverandcontrail-discoveryservices are absent as compared to OpenContrail 3.2.
The OpenContrail services are distributed across several MCP cluster nodes:
- For both versions of OpenContrail,
the
control,config,analytics, anddatabaseservices run on the OpenContrail controller (ntw) and analytics (nal) nodes.
- The
vrouterOpenContrail services run on the OpenStack compute nodes (cmp).
- The OpenContrail plugin is included to the
neutron-serverservice that runs on the OpenStack controller nodes (ctl).
This section describes the OpenContrail 3.2 and 4.x services as well as their distribution across the MCP cluster nodes.
OpenContrail 3.2 components
Caution
The OpenContrail versions support status:
- OpenContrail 4.1 is fully supported.
- OpenContrail 4.0 is deprecated and not supported for new deployments since MCP maintenance update 2019.2.4.
- OpenContrail 3.2 is not supported for new deployments.
The tables in this section describe the OpenContrail 3.2 services and their distribution across the MCP cluster nodes.
| Service name | Service description |
|---|---|
contrail-control |
Communicates with the cluster gateways using BGP and with the vRouter agents using XMPP as well as redistributes appropriate networking information. |
contrail-control-nodemgr |
Collects the OpenContrail controller process data and sends
this information to the OpenContrail collector. |
contrail-dns |
Using the contrail-named service, provides the DNS service
to the VMs spawned on different compute nodes. Each vRouter node
connects to two OpenContrail controller nodes that run
the contrail-dns process. |
contrail-named |
This is the customized Berkeley Internet Name Domain (BIND) daemon of
OpenContrail that manages DNS zones for the contrail-dns service. |
| Service name | Service description |
|---|---|
contrail-webui |
Consists of the webserver and jobserver services. Provides
the OpenContrail web UI. |
ifmap-server |
Removed in OpenContrail 4.x. The contrail-control,
contrail-schema, contrail-svc-monitor
services connect to the Interface for Metadata Access Points (IF-MAP)
server using this service during configuration changes. |
| Service name | Service description |
|---|---|
contrail-api |
Exposes a REST-based interface for the OpenContrail API. |
contrail-config-nodemgr |
Collects data of the OpenContrail configuration processes and sends it
to the OpenContrail collector. |
contrail-device-manager |
Manages physical networking devices using netconf or ovsdb.
In multi-node deployments, it works in the active/backup mode. |
contrail-discovery |
Removed in OpenContrail 4.x. Acts as a registry for all OpenContrail services. |
contrail-schema |
Listens to configuration changes done by a user and generates corresponding system configuration objects. In multi-node deployments, it works in the active/backup mode. |
contrail-svc-monitor |
Listens to configuration changes of service-template and
service-instance as well as spawns and monitors virtual machines
for the firewall, analyzer services and so on. In multi-node
deployments, it works in the active/backup mode. |
| Service name | Service description |
|---|---|
contrail-alarm-gen |
Evaluates and manages the alarms rules. |
contrail-analytics-api |
Provides a REST API to interact with the Cassandra analytics database. |
contrail-analytics-nodemgr |
Collects all OpenContrail analytics process data and sends
this information to the OpenContrail collector. |
contrail-collector |
Collects and analyzes data from all OpenContrail services. |
contrail-query-engine |
Handles the queries to access data from the Cassandra database. |
contrail-snmp-collector |
Receives the authorization and configuration of the physical routers
from the contrail-config-nodemgr service,
polls the physical routers using the Simple Network Management Protocol
(SNMP) protocol, and uploads the data to the OpenContrail collector. |
contrail-topology |
Reads the SNMP information from the physical router user-visible entities (UVEs), creates a neighbor list, and writes the neighbor information to the physical router UVEs. The OpenContrail web UI uses the neighbor list to display the physical topology. |
| Service name | Service description |
|---|---|
contrail-database |
Manages the Cassandra database information. |
contrail-database-nodemgr |
Collects data of the contrail-database process and sends it
to the OpenContrail collector. |
kafka |
Handles the messaging bus and generates alarms across the OpenContrail analytics nodes. |
| Service name | Service description |
|---|---|
cassandra |
On the OpenContrail network nodes, maintains the configuration data
of the OpenContrail cluster.
On the OpenContrail analytics nodes, stores the contrail-collector
service data. |
redis |
Stores the physical router UVE storage and serves as a messaging bus for event notifications. |
zookeeper |
Holds the active/backup status for the contrail-device-manager,
contrail-svc-monitor, and the contrail-schema-transformer
services. This service is also used for mapping of the OpenContrail
resources names to UUIDs. |
| Service name | Service description |
|---|---|
contrail-vrouter-agent |
Connects to the OpenContrail controller node and the OpenContrail DNS system using the Extensible Messaging and Presence Protocol (XMPP). |
contrail-vrouter-nodemgr |
Collects the supervisor vrouter data and sends it
to the OpenContrail collector. |
| Service name | Service description |
|---|---|
neutron-server |
The Neutron server that includes the OpenContrail plugin. |
OpenContrail 4.x components
The tables in this section describe the OpenContrail 4.x services and their distribution across the OpenStack-based MCP cluster nodes.
The OpenContrail services run as
the analytics, analyticsdb, and controller fat Docker containers
managed by docker-compose with the exception of contrail-vrouter-agent
running on the compute nodes as a non-containerized service.
| Service name | Service description |
|---|---|
contrail-api |
Exposes a REST-based interface for the OpenContrail API. |
contrail-config-nodemgr |
Collects data of the OpenContrail configuration processes and sends it
to the OpenContrail collector. |
contrail-control |
Communicates with the cluster gateways using BGP and with the vRouter agents using XMPP as well as redistributes appropriate networking information. |
contrail-control-nodemgr |
Collects the OpenContrail controller process data and sends
this information to the OpenContrail collector. |
contrail-device-manager |
Manages physical networking devices using netconf or ovsdb.
In multi-node deployments, it works in the active/backup mode. |
contrail-discovery |
Deprecated. Acts as a registry for all OpenContrail services. |
contrail-dns |
Using the contrail-named service, provides the DNS service
to the VMs spawned on different compute nodes. Each vRouter node
connects to two OpenContrail controller containers that run
the contrail-dns process. |
contrail-named |
This is the customized Berkeley Internet Name Domain (BIND) daemon of
OpenContrail that manages DNS zones for the contrail-dns service. |
contrail-schema |
Listens to configuration changes done by a user and generates corresponding system configuration objects. In multi-node deployments, it works in the active/backup mode. |
contrail-svc-monitor |
Listens to configuration changes of service-template and
service-instance as well as spawns and monitors virtual machines
for the firewall, analyzer services and so on. In multi-node
deployments, it works in the active/backup mode. |
contrail-webui |
Consists of the webserver and jobserver services. Provides
the OpenContrail web UI. |
ifmap-server |
Deprecated. The contrail-control, contrail-schema,
contrail-svc-monitor services connect to the Interface
for Metadata Access Points (IF-MAP) server using this service
during configuration changes. |
| Service name | Service description |
|---|---|
contrail-alarm-gen |
Evaluates and manages the alarms rules. |
contrail-analytics-api |
Provides a REST API to interact with the Cassandra analytics database. |
contrail-analytics-nodemgr |
Collects all OpenContrail analytics process data and sends
this information to the OpenContrail collector. |
contrail-collector |
Collects and analyzes data from all OpenContrail services. |
contrail-query-engine |
Handles the queries to access data from the Cassandra database. |
contrail-snmp-collector |
Receives the authorization and configuration of the physical routers
from the contrail-config-nodemgr service,
polls the physical routers using the Simple Network Management Protocol
(SNMP) protocol, and uploads the data to the OpenContrail collector. |
contrail-topology |
Reads the SNMP information from the physical router user-visible entities (UVEs), creates a neighbor list, and writes the neighbor information to the physical router UVEs. The OpenContrail web UI uses the neighbor list to display the physical topology. |
| Service name | Service description |
|---|---|
cassandra |
On the OpenContrail network nodes and OpenContrail pods, maintains
the configuration data of the OpenContrail cluster.
On the OpenContrail analytics containers, stores the contrail-collector
service data. |
contrail-database |
Manages the Cassandra database information. |
contrail-database-nodemgr |
Collects data of the contrail-database process and sends it
to the OpenContrail collector. |
kafka |
Handles the messaging bus and generates alarms across the OpenContrail analytics containers. |
redis |
Stores the physical router UVE storage and serves as a messaging bus for event notifications. |
zookeeper |
Holds the active/backup status for the contrail-device-manager,
contrail-svc-monitor, and the contrail-schema-transformer
services. This service is also used for mapping of the OpenContrail
resources names to UUIDs. |
| Service name | Service description |
|---|---|
contrail-vrouter-agent |
Connects to the OpenContrail controller container and the OpenContrail DNS system using the Extensible Messaging and Presence Protocol (XMPP). |
contrail-vrouter-nodemgr |
Collects the supervisor vrouter data and sends it
to the OpenContrail collector. |
| Service name | Service description |
|---|---|
neutron-server |
The Neutron server that includes the OpenContrail plugin. |
OpenContrail traffic flow
This section provides diagrams that describe types of traffic and the directions of traffic flow in an MCP cluster.
User Interface and API traffic
The following diagram displays all types of UI and API traffic in an MCP cluster, including monitoring, OpenStack API, and OpenContrail UI/API traffic. The OpenStack Dashboard node hosts Horizon and acts as proxy for all other types of traffic. SSL termination occurs on this node as well.
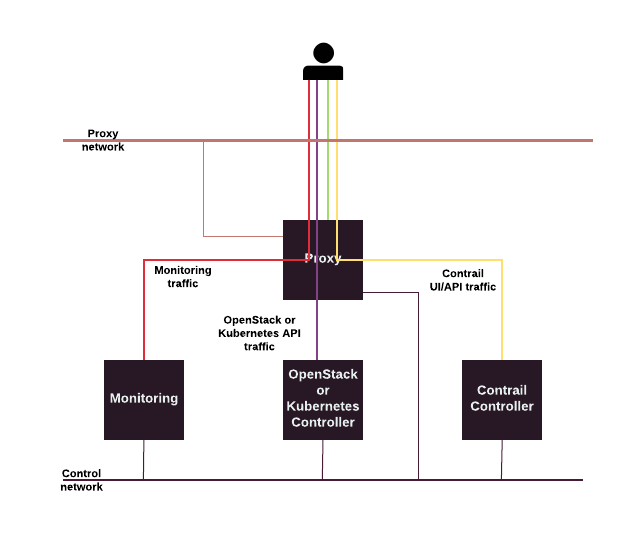
SDN traffic
SDN or OpenContrail traffic goes through the overlay Data network and processes east-west and north-south traffic for applications that run in an MCP cluster. This network segment typically contains tenant networks as separate MPLS over GRE and MPLS over UDP tunnels. The traffic load depends on workload.
The control traffic between OpenContrail controllers, edge routers, and vRouters use iBGP and XMPP protocols. Both protocols produce low traffic which does not affect the MPLS over GRE and MPLS over UDP traffic. However, this traffic is critical and must be reliably delivered. Mirantis recommends configuring higher QoS for this type of traffic.
The following diagram displays both MPLS over GRE/MPLS over UDP and iBGP and XMPP traffic examples in an MCP cluster:
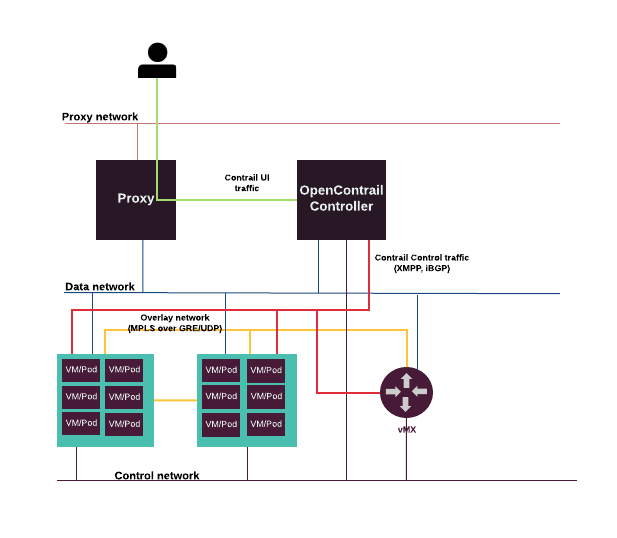
OpenContrail vRouter
The OpenContrail vRouter provides data forwarding to an OpenStack tenant instance and reports statistics to the OpenContrail analytics nodes. The OpenContrail vRouter is installed on all OpenStack compute nodes.
In MCP, the OpenContrail vRouter can be either kernel-based or DPDK-based. You can configure a node(s) before deployment to use the DPDK vRouter mode instead of the regular kernel mode. This option allows different nodes to use different modules of the OpenContrail vRouter. Using DPDK with OpenContrail allows processing more packets per second in comparison to the regular kernel module.
The vRouter agent acts as a local control plane. Each OpenContrail vRouter agent is connected to at least two OpenContrail control nodes in an active-active redundancy mode. The OpenContrail vRouter agent is responsible for all networking-related functions including routing instances, routes, and so on.
The OpenContrail vRouter uses different gateways for the control and data planes. For example, the Linux system gateway is located on the management network, and the OpenContrail gateway is located on the data plane network.
The following diagram shows the OpenContrail kernel vRouter setup by Cookiecutter:

On the diagram above, the following types of networks interfaces are used:
eth0- for the management (PXE) network (eth1andeth2are the slave interfaces ofBond0)Bond0.x- for the MCP control plane networkBond0.y- for the MCP data plane network
OpenContrail HAProxy driver with LBaaSv2
The OpenContrail HAProxy driver with Load Balancing as a Service (LBaaS) is implemented as a special type of service instance.
The load balancer service is implemented as a network namespace with HAProxy. The service runs on two randomly chosen vRouter compute nodes to achieve high availability.
The load balancer service has two sides:
- Right that is the public side
- Left that is the private side (for the back-end and pool subnet)
In LBaaS v1, the left side subnet is determined automatically from
the subnet_id of a pool. But in LBaaS v2, the pool does not associate
with subnet anymore. Therefore, to overcome this architecture limitation,
the pool members of the left side and listener of the right side
should be associated with the same subnet.
The OpenContrail HAProxy driver provides the benefits of LBaaS v2 API along with listening of multiple ports for the same IP address by decoupling the virtual IP address from the physical port.
OpenContrail HAProxy driver supports the following configuration options:
| Component | Option |
|---|---|
| Listener protocols |
|
| Load balancer algorithms |
|
| Health monitor types |
|
| Session persistence |
|
OpenContrail IPv6 support
OpenContrail allows running IPv6-enabled OpenStack tenant networks on top of IPv4 underlay. You can create an IPv6 virtual network through the OpenContrail web UI or OpenStack CLI in the same way as the IPv4 virtual network. The IPv6 functionality is enabled out of the box and does not require major changes in the cloud configuration. For an example of user workflow, see OpenStack Neutron IPv6 support in OpenContrail SDN.
The following IPv6 features are supported and regularly verified as part of MCP:
|
|
The following IPv6 features are available in OpenContrail according to the official documentation:
|
|
The following IPv6 features are not available in OpenContrail:
|
|
StackLight LMA
StackLight LMA is the Logging, Monitoring, and Alerting solution that provides a single pane of glass for cloud maintenance and day-to-day operations as well as offers critical insights into cloud health including rich operational insights about the services deployed on MCP. StackLight LMA is based on Prometheus, an open-source monitoring solution and a time series database.
StackLight LMA overview
StackLight LMA monitors nodes, services, cluster health, and provides reach operational insights out-of-the-box for OpenStack, Kubernetes, and OpenContrail services deployed on the platform. Stacklight LMA helps to prevent critical conditions in the MCP cluster by sending notifications to cloud operators so that they can take timely actions to eliminate the risk of service downtime. Stacklight LMA uses the following tools to gather monitoring metrics:
Telegraf, a plugin-driven server agent that monitors the nodes on which the MCP cluster components are deployed. Telegraf gathers basic operating system metrics, including:
- CPU
- Memory
- Disk
- Disk I/O
- System
- Processes
- Docker
Prometheus, a toolkit that gathers metrics. Each Prometheus instance automatically discovers and monitors a number of endpoints such as Kubernetes, etcd, Calico, Telegraf, and others. For Kubernetes deployments, Prometheus discovers the following endpoints:
- Node, discovers one target per cluster node.
- Service, discovers a target for each service port.
- Pod, discovers all pods and exposes their containers as targets.
- Endpoint, discovers targets from listed endpoints of a service.
By default, the Prometheus database stores metrics of the past 15 days. To store the data in a long-term perspective, consider one of the following options:
(Default) Prometheus long-term storage, which uses the federated Prometheus to store the metrics (six months)
InfluxDB, which uses the remote storage adapter to store the metrics (30 days)
Warning
InfluxDB, including InfluxDB Relay and remote storage adapter, is deprecated in the Q4`18 MCP release and will be removed in the next release.
Using the Prometheus web UI, you can view simple visualizations, debug, add new features such as alerts, aggregates, and others. Grafana dashboards provide a visual representation of all graphs gathered by Telegraf and Prometheus.
See also
Telegraf official documentation
The link points to the documentation of the latest Telegraf version. View the Telegraf documentation of the version that is supported by a relevant MCP release.
StackLight LMA components
StackLight LMA consists of the following components:
- Prometheus server
Collects and stores monitoring data. A Prometheus server scrapes metrics from Telegraf, exporters, and native endpoints, such as Calico, etcd, or Kubernetes, either directly or through Pushgateway. Prometheus stores all scraped samples in a local database and runs rules over this data to either record new time series from existing data or generate alerts. Prometheus stores the data as time series: streams of time-stamped values that belong to the same metric and the same set of labeled dimensions. Timestamps have a millisecond resolution, while values are always 64-bit floats. Prometheus has a dimensional data model. Any given combination of labels for the same metric name results in a separate time series. The Prometheus Query Language (PromQL) enables filtering and aggregation based on these dimensions. Grafana uses the data stored in Prometheus to provide graphs and charts.
The built-in alarms defined in Salt formulas detect the most critical conditions that may occur. However, using the Reclass model you can modify and override the built-in alarms as well as create custom alarms for a specific deployment. Both built-in and custom alarms use the same declarative YAML structure.
If more than one instance of Prometheus is deployed, they perform as independent Prometheus servers not connected to each other. However, these instances gather the same endpoints. Therefore, in case of any failure in one Prometheus server, another Prometheus server will contain the same data in the database.
- Alertmanager
- Handles alerts sent by client applications such as the Prometheus server. Alertmanager deduplicates, groups, and routes alerts to receiver integrations. By default, StackLight LMA is configured to send email notifications. However, you can also configure it to create Salesforce cases from the Alertmanager notifications on alerts using the Salesforce notifier service and close the cases once the alerts are resolved. Notifications can be configured separately for any alert. Alertmanager also performs silencing and inhibition of alerts.
- Alerta
- Receives, consolidates and deduplicates the alerts sent by Alertmanager and visually represents them through a simple yet effective web UI. Using Alerta, you can easily view the most recent alerts, watched alerts, as well as group and filter alerts according to your needs. Alerta uses MongoDB as a backend.
- Telegraf and exporter agents
Collect metrics from the system they are running on. Telegraf runs on every host operating system and on every VM where certain services of MCP are deployed. Telegraf collects and processes the operational data that is relevant to the scope of a node including hardware, host operating system metrics, local service checks, and measurements. Telegraf is plugin-driven and has the concept of two distinct set of plugins:
- Input plugins collect metrics from the system, services, or third-party APIs
- Output plugins write and expose metrics to various destinations
- Pushgateway
- Enables ephemeral and batch jobs to expose their metrics to Prometheus. Since these jobs may not exist long enough to be scraped, they can instead push their metrics to the Pushgateway, which then exposes these metrics to Prometheus. Pushgateway is not an aggregator or a distributed counter but rather a metrics cache. The metrics pushed are exactly the same as scraped from a permanently running program.
- Grafana
- Builds and visually represents metric graphs based on time series databases. Grafana supports querying of Prometheus using the PromQL language.
- Long-term storage system
Uses one of the following set of components to store the data for further analysis:
- Prometheus long-term storage that scrapes all data from the Prometheus server. This historical data can then be used for analytics purposes. Prometheus Relay adds a proxy layer to Prometheus to merge the results from underlay Prometheus servers to prevent gaps in case some data is missing on some servers. Grafana uses the data from Prometheus long-term storage. This approach is used by default.
- InfluxDB Deprecated in Q4`18 long-term storage that scrapes the data using the remote storage adapter. This historical data can then be used for analytics purposes. InfluxDB Relay adds a basic high availability layer to InfluxDB by replicating the InfluxDB data to a cluster of InfluxDB servers.
- Logging system
Responsible for collecting, processing, and persisting the logs. The logging system components include:
- Fluentd (log collector), which parses logs, sends them to Elasticsearch, generates metrics based on analysis of incoming log entries, and exposes these metrics to Prometheus. Fluentd runs on every node in a cluster.
- Elasticsearch, which stores logs and notifications, and Elasticsearch Curator, which maintains the data (indexes) in Elasticsearch by performing such operations as creating, closing, or opening an index as well as deleting a snapshot. Additionally, Elasticsearch Curator can also manage the data retention policy in Elasticsearch clusters. Elasticsearch Curator runs on each Elasticsearch node within the log storage nodes.
The metrics derived from logs are used to alert the operator upon abnormal conditions such as a spike of HTTP 5xx errors. Elasticsearch receives and indexes the logs for viewing and searching in Kibana.
- Gainsight integration service Deprecated since 2019.2.9
You can integrate StackLight LMA with Gainsight. Gainsight integration service queries Prometheus for the following metrics data, combines the data into a single CSV file, and sends the file to the Salesforce Gainsight extension through API:
- The amount of vCPU, vRAM, and vStorage used and available
- The number of VMs running, compute nodes, and tenants/projects
- The availability of Cinder, Nova, Keystone, Glance, and Neutron
By default, Gainsight integration service sends the data to API once per day. Mirantis uses the collected data for further analysis and reports to improve the quality of customer support. The CSV files are stored under
/srv/volumes/local/gainsight/csvon themonnodes for 180 days by default.- Prometheus Elasticsearch exporter [0]
- Allows presenting the Elasticsearch data as Prometheus metrics by periodically sending configured queries to the Elasticsearch cluster and exposing the results to a scrapable HTTP endpoint like other Prometheus targets.
The following diagram illustrates data flow and connections between the StackLight LMA services. Prometheus long-term storage is illustrated as the default option.
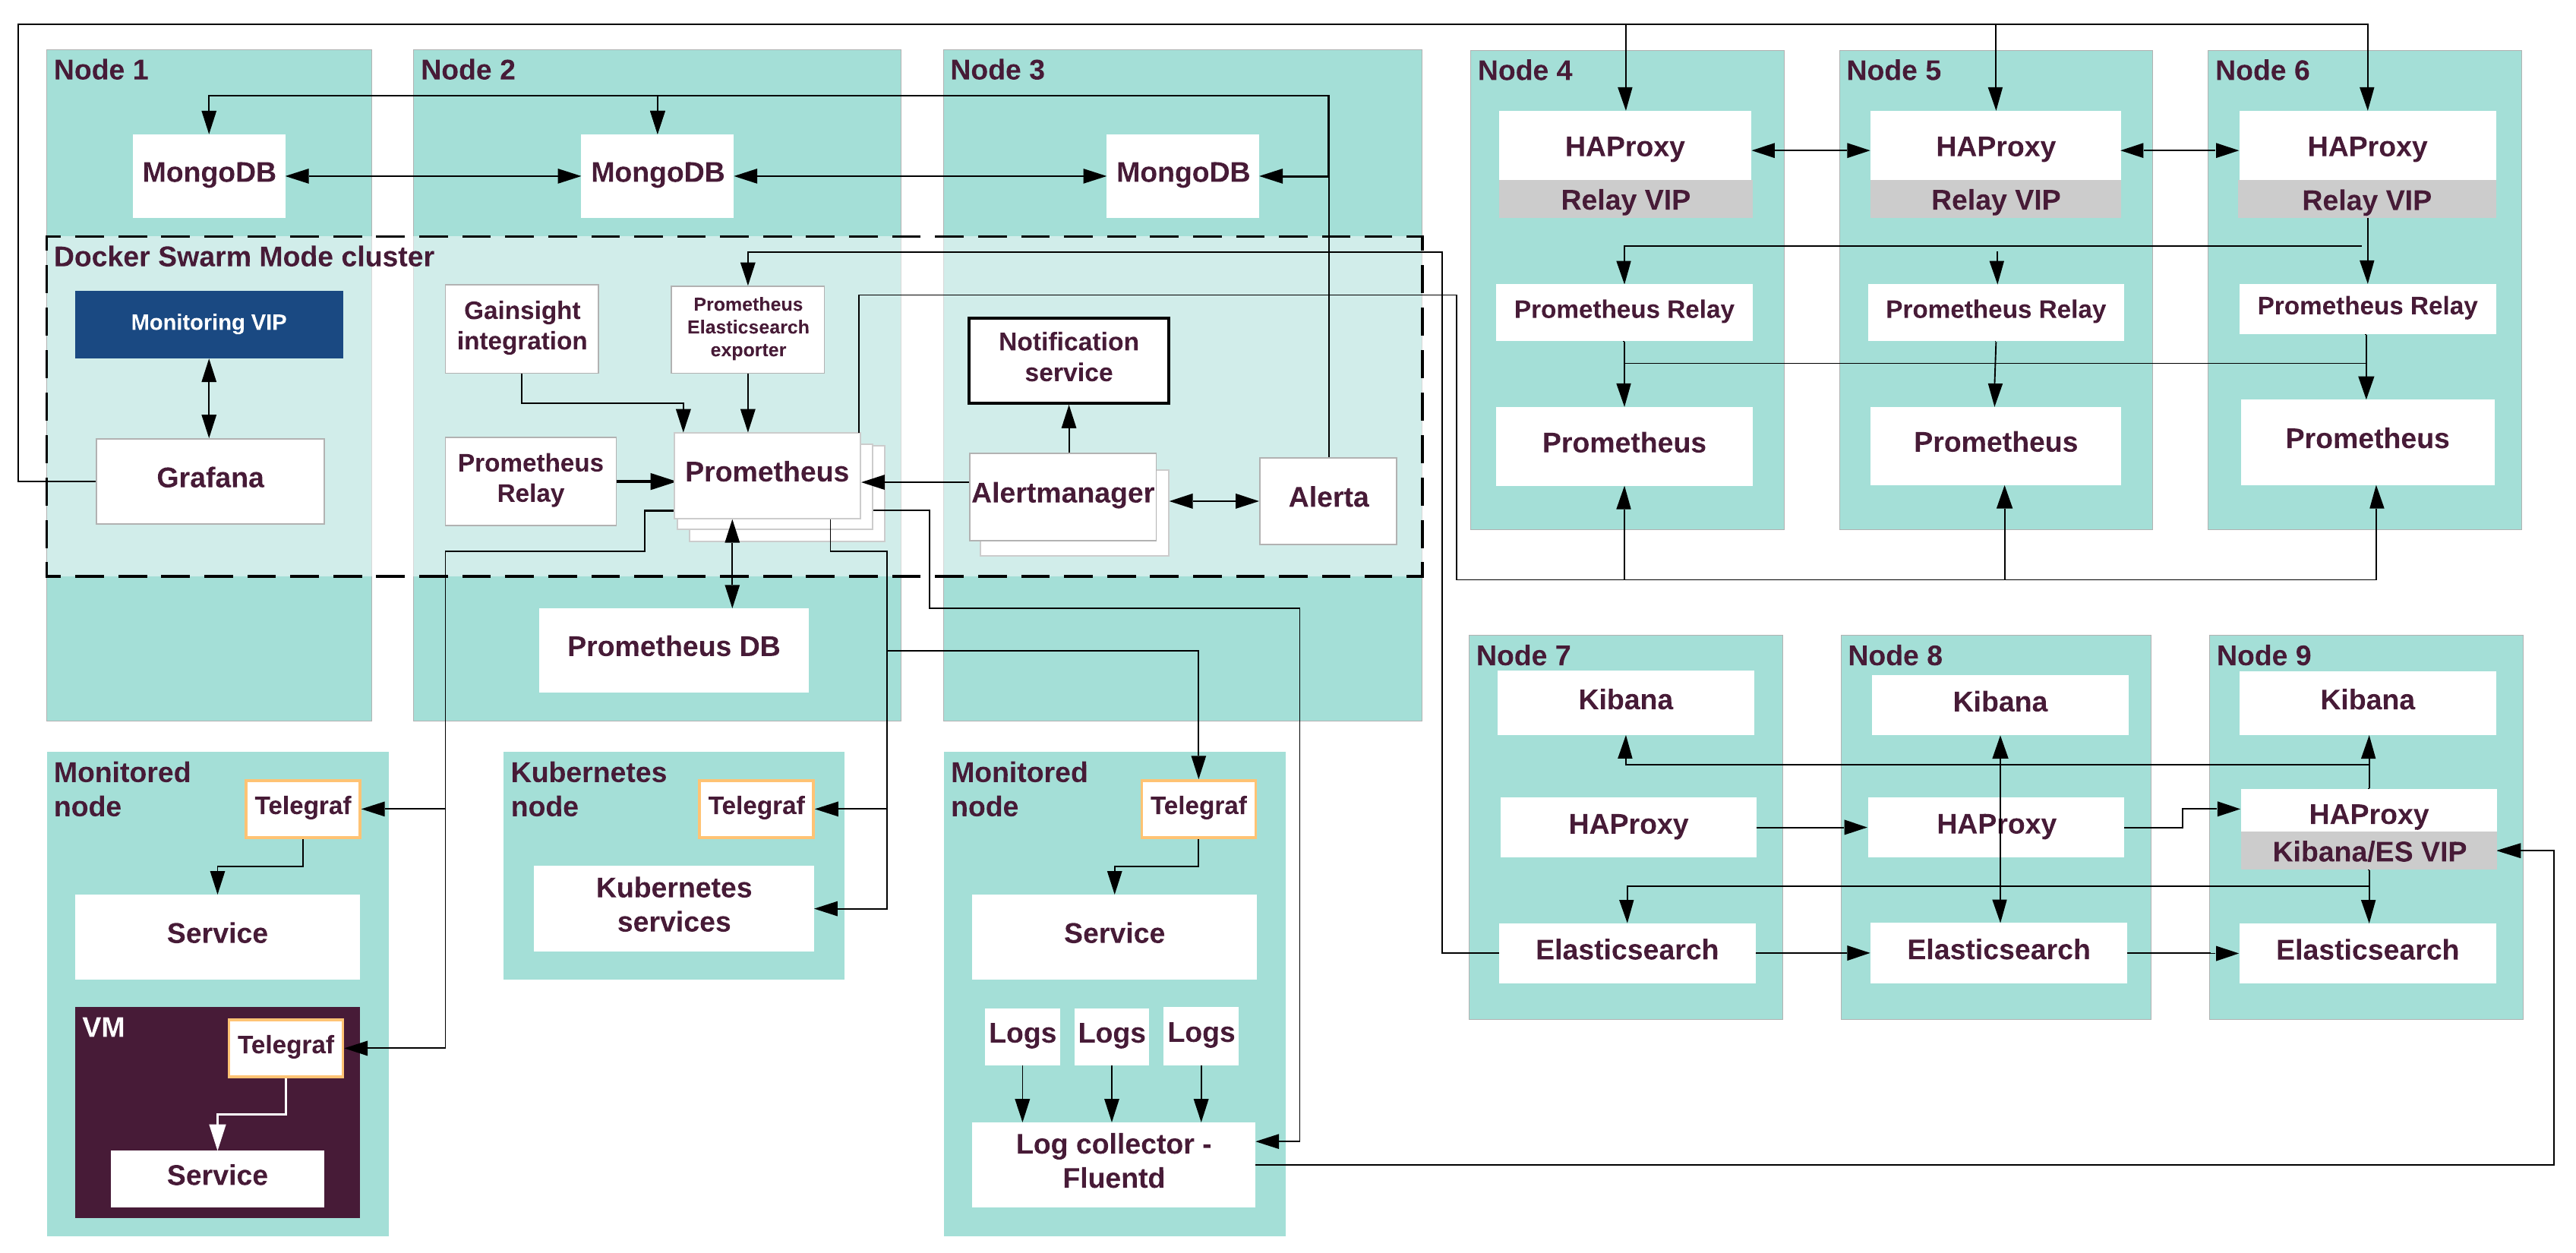
The Prometheus, Pushgateway, Alertmanager, Alerta, Grafana, Gainsight, and Prometheus Elasticsearch exporter services run on a separate Docker Swarm Mode cluster deployed on the monitoring VMs. The following diagram illustrates the composition of StackLight LMA components across all MCP services. Prometheus long-term storage is illustrated as the default option.
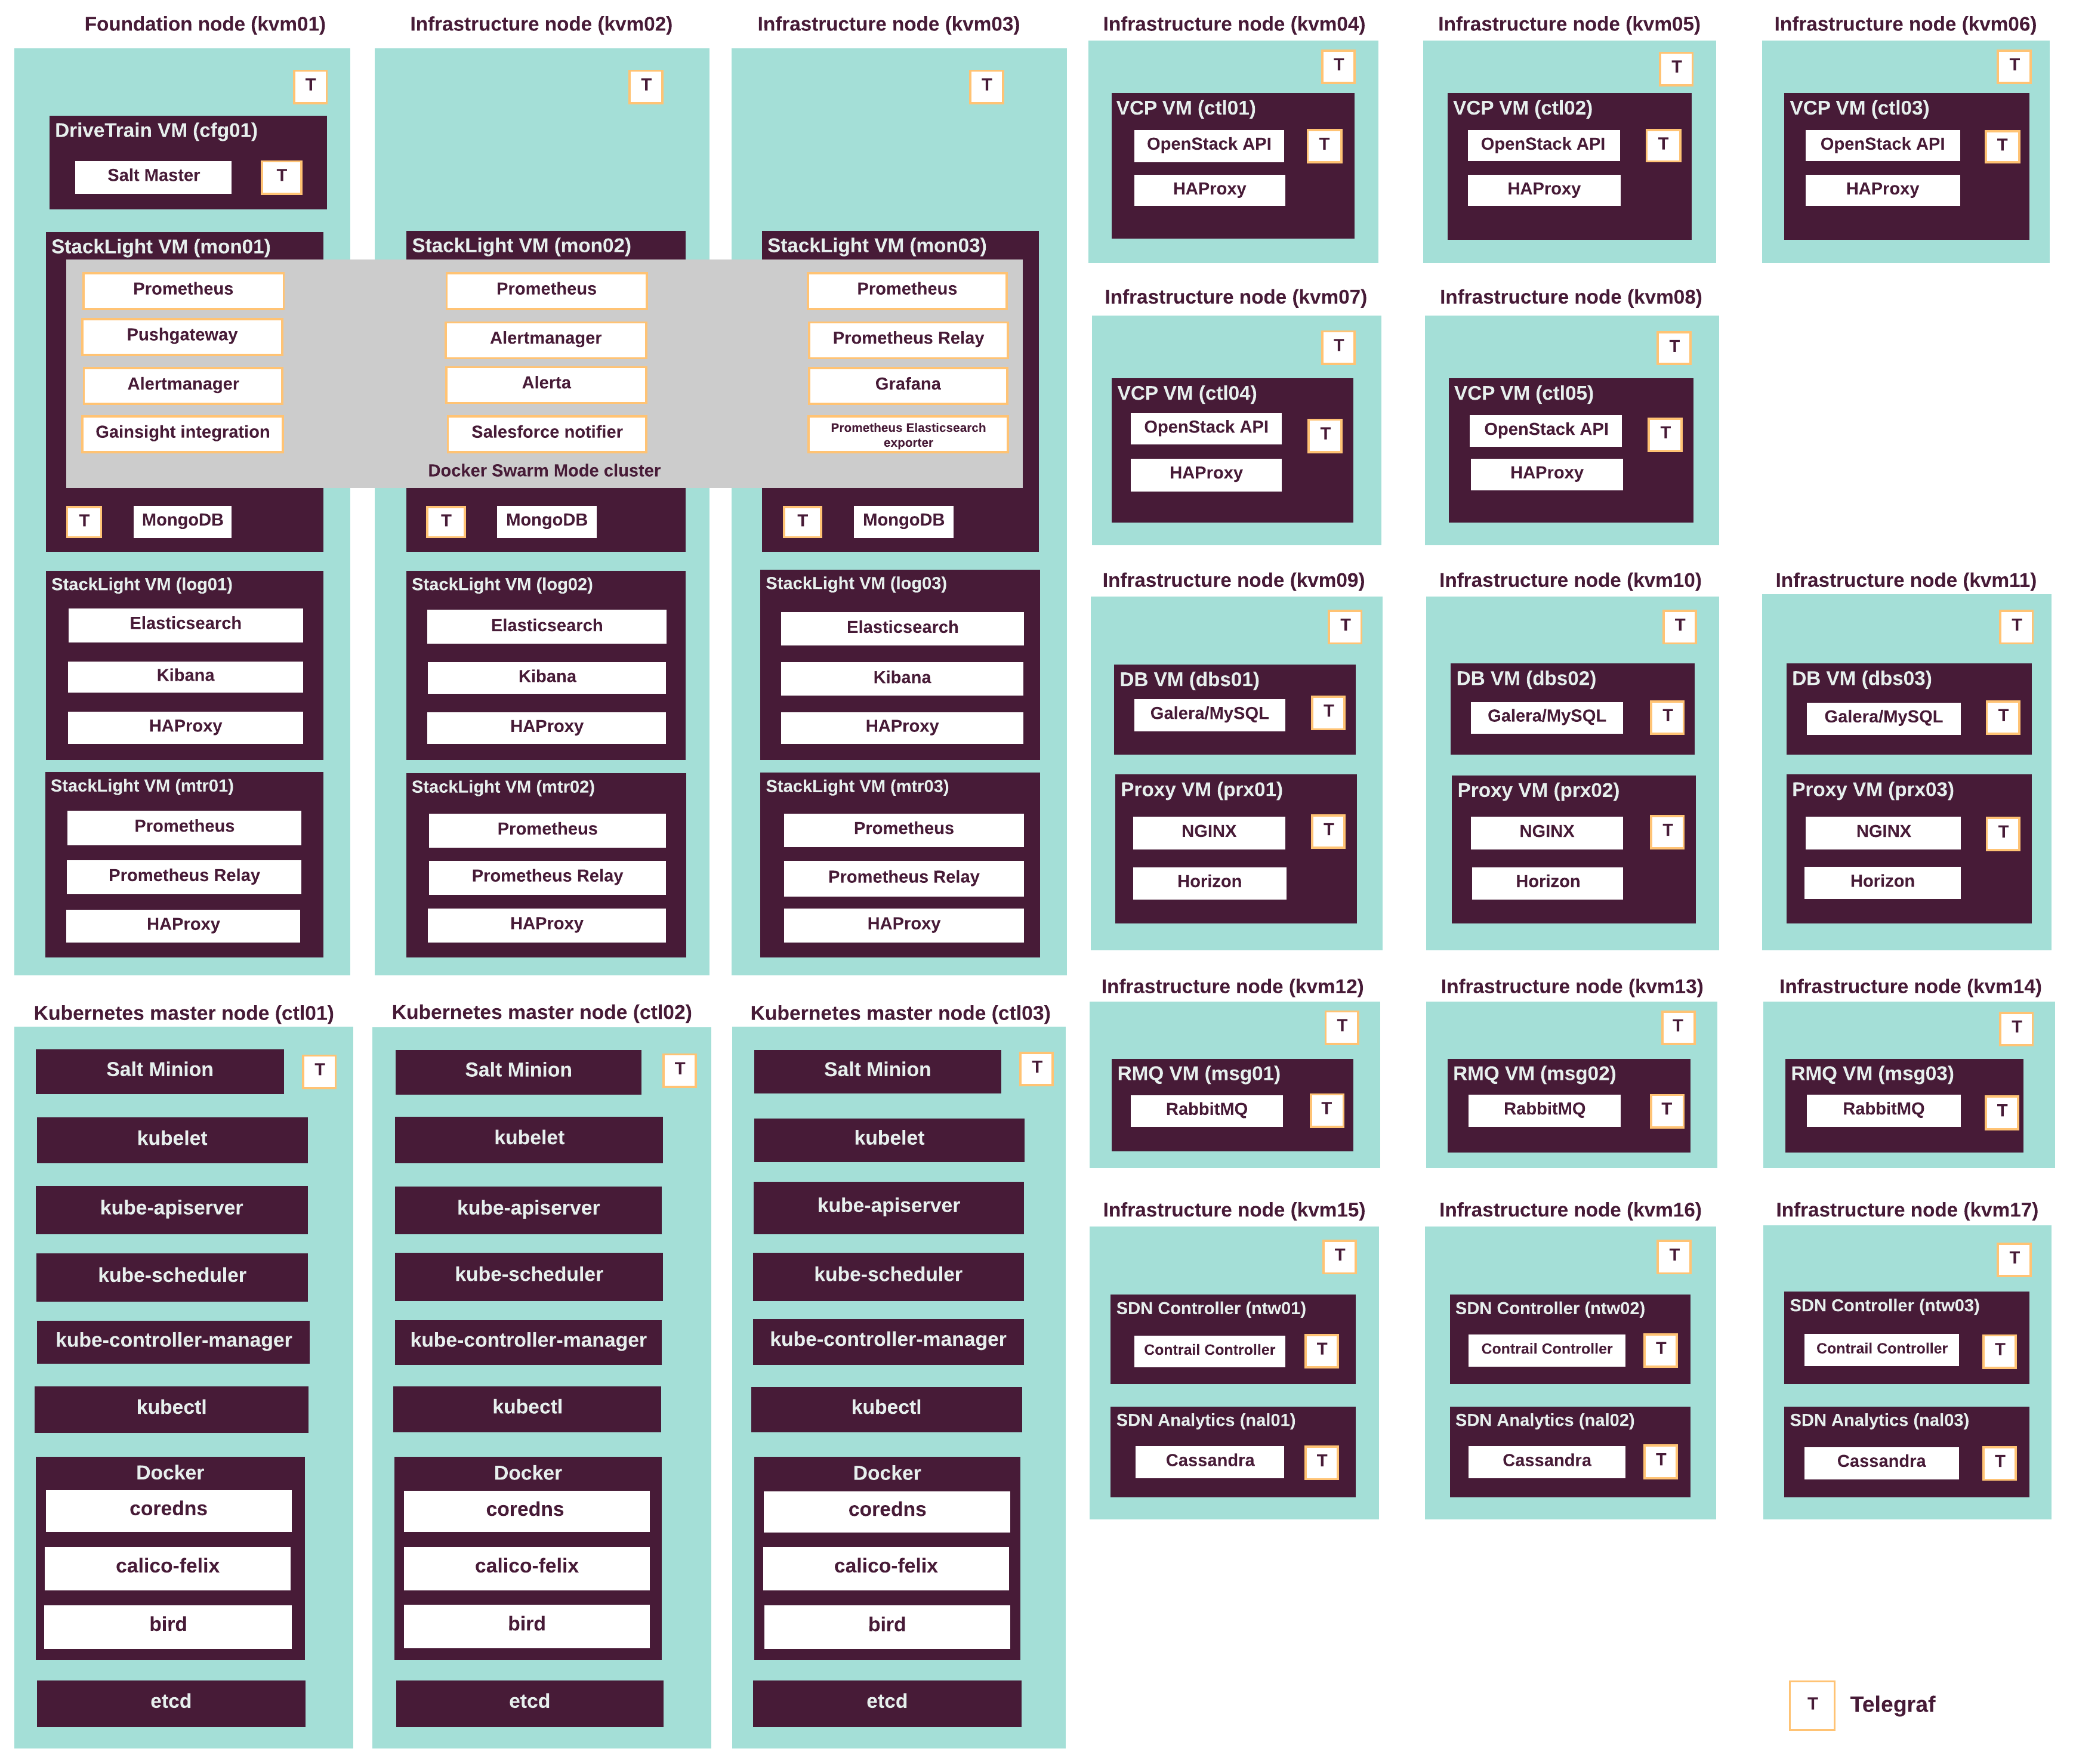
The following table lists the roles of StackLight LMA VCP nodes and their names in the Salt Reclass metadata model:
| Server role name | Server role group name in Reclass model | Description |
|---|---|---|
| StackLight LMA metering node | mtr |
Servers that run Prometheus long-term storage. |
| StackLight LMA log storage and visualization node | log |
Servers that run Elasticsearch and Kibana. |
| StackLight LMA monitoring node | mon |
Servers that run the Prometheus, Grafana, Pushgateway, Alertmanager, Alerta, and Gainsight integration (optional) services in containers in Docker Swarm mode. |
| [0] | The functionality is available starting from the MCP 2019.2.4 maintenance update. |
StackLight LMA high availability
High availability in StackLight LMA is achieved through the deployment of three Prometheus servers, Prometheus Relay service, and InfluxDB Relay service.
Warning
InfluxDB, including InfluxDB Relay and remote storage adapter, is deprecated in the Q4`18 MCP release and will be removed in the next release.
To ensure high availability for Prometheus, StackLight LMA deploys three Prometheus servers at the same time. Each Prometheus server uses the same configuration file, monitors the same endpoints, and has the same alerts defined. The Alertmanager service deduplicates the fired alerts, so you will receive one alert instead of three.
For external components such as Grafana, the Prometheus Relay service handles Prometheus API calls, sends them to all discovered Prometheus servers, merges the results, and returns them to Grafana to visualize the data from all Prometheus servers. Therefore, if one Prometheus servers is down, Grafana will contain the data from the remaining Prometheus servers.
The following diagram illustrates the Prometheus HA.
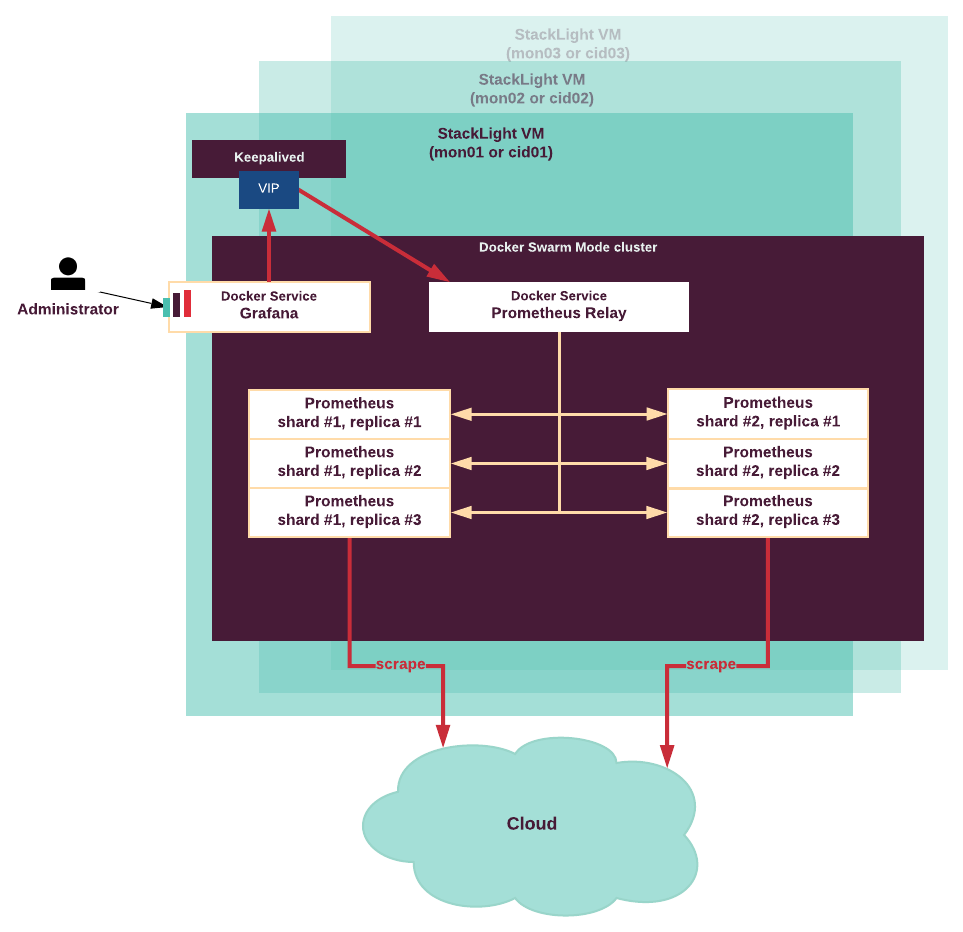
High availability for Prometheus long-term storage is achieved by scraping the same data in an independent way. In case one Prometheus server fails, the other two will contain the data. To keep the time series gapless, Prometheus Relay acts as a proxy and merges the results from three underlay Prometheus servers.
High availability for the InfluxDB service is achieved using the InfluxDB Relay service that listens to HTTP writes and sends the data to each InfluxDB server through the HTTP write endpoint. InfluxDB Relay returns a success response once one of the InfluxDB servers returns it. If any InfluxDB server returns a 4xx response or if all servers return a 5xx response, it will be returned to the client. If some but not all servers return a 5xx response, it will not be returned to the client.
This approach allows sustaining failures of one InfluxDB or one InfluxDB Relay service while these services will still perform writes and serve queries. InfluxDB Relay buffers failed requests in memory to reduce the number of failures during short outages or periodic network issues.
Monitored components
StackLight LMA measures, analyzes, and reports in a timely manner everything that may fail in any of the devices, resources, and services running in the standalone or cluster mode on top of the infrastructure clusters of Mirantis Cloud Platform.
StackLight LMA monitors the following components and their sub-components, if any:
Linux operating system
Linux operating system and audit logs
Salt Master node
Salt Minion node
Jenkins
RabbitMQ
Apache
Keepalived
libvirt
Memcached
MySQL
HAProxy
NGINX
NTP
GlusterFS
Physical disks, SSD, or HDDs, which provide SMART data [0]
SSL certificates [0]
Open vSwitch [0]
OpenStack (Nova, Cinder, Glance, Neutron, Keystone, Horizon, Heat, Octavia, Ironic [1])
OpenContrail (Cassandra, Contrail server, ZooKeeper)
Kubernetes (Kube-apiserver, Kube-controller-manager, Kube-proxy, Kube-scheduler, Kubelet, Docker, etcd)
Calico (Felix, BIRD, confd)
Ceph (OSD, ceph-mon)
StackLight LMA (Alertmanager, InfluxDB, InfluxDB Relay, Elasticsearch, Heka, Grafana, Kibana, Prometheus, Pushgateway, Telegraf, remote storage adapter, MongoDB)
Warning
InfluxDB, including InfluxDB Relay and remote storage adapter, is deprecated in the Q4`18 MCP release and will be removed in the next release.
| [0] | (1, 2, 3) Monitoring of the functionality is available starting from the MCP 2019.2.3 update. |
| [1] | Monitoring of Ironic is available starting from the MCP 2019.2.6 maintenance update. |
StackLight LMA resource requirements per cloud size
Compact cloud
The following table summarizes resource requirements of all StackLight LMA node roles for compact clouds (up to 50 compute nodes and Ceph OSD nodes, if any).
| Virtual server roles | # of instances | CPU vCores per instance | Memory (GB) per instance | Disk space (GB) per instance | Disk type |
|---|---|---|---|---|---|
mon |
3 | 4 | 16 | 500 [0] | SSD |
mtr |
3 | 4 | 32 | 1000 [0] | SSD |
log |
3 | 4 | 32 | 2000 [1] | SSD |
Cloud Provider Infrastructure (CPI)
The following table summarizes resource requirements of all StackLight LMA node roles for CPI clouds (50 - 150 compute nodes and Ceph OSD nodes, if any).
| Virtual server roles | # of instances | CPU vCores per instance | Memory (GB) per instance | Disk space (GB) per instance | Disk type |
|---|---|---|---|---|---|
mon |
3 | 8 | 32 | 500 [0] | SSD |
mtr |
3 | 8 | 32 | 2000 [0] | SSD |
log |
3 | 8 | 48 | 3000 [1] | SSD |
Large cloud
The following table summarizes resource requirements of all StackLight LMA node roles for large clouds (200 - 500 compute nodes and Ceph OSD nodes, if any).
| Virtual server roles | # of instances | CPU vCores per instance | Memory (GB) per instance | Disk space (GB) per instance | Disk type |
|---|---|---|---|---|---|
mon |
3 | 24 | 256 | 1000 [0] | SSD |
mtr |
3 | 16 | 196 | 3000 [0] | SSD |
log |
3 | 16 | 64 [2] | 5000 [1] | SSD |
| [0] | (1, 2, 3, 4, 5, 6) The required disk space per instance depends on the Prometheus retention
policy, which by default is 5 days for mon nodes and 180 days for
mtr nodes. |
| [1] | (1, 2, 3) The required disk space per instance depends on the Elasticsearch retention policy, which is 31 days by default. |
| [2] | The Elasticsearch heap size must not exceed 32 GB. For details, see Limiting memory usage. To limit the heap size, see MCP Operations Guide: Configure Elasticsearch. |
Repository planning
The MCP software is provided as a combination of the following types of artifacts:
- Mirantis APT/DEB Packages
The binary packages for Ubuntu Linux operating system. These packages are built and maintained by Mirantis. They are published to package repositories in APT package manager format.
- Third party mirrors
Binary Debian packages provided by a vendors of specific software product integrated into MCP. Typically, those are free open source software projects. These mirror repositories retain the original content and metadata structure provided by vendor of the repository.
- Plaintext/Git repository
Plain text artifacts are usually kept in Git repositories. Examples of such artifact include the Reclass metadata model and Jenkins Pipelines delivered as a source code.
- Docker images
Binary images of containers run by Docker daemon. These images are rebuilt by Mirantis or mirrored as is from their original vendors.
The MCP Release Notes: Release artifacts section describes the repositories and Docker registry sources in detail. The Salt Master node requires access to APT, Docker, and Git repositories, while all other nodes in the environment require access to the APT and Docker repositories only.
Even though it is possible to use the Mirantis and mirrors of the third-party repositories directly with the Internet access, Mirantis recommends using local mirrors for the following reasons:
- Repeatability
You can redeploy clouds exactly the same way including all dependencies.
- Control
You have control over when and which packages to upgrade. By default,
apt-get dist-upgradeupdates the packages to the latest available version. And with a local mirror, you control when a new update is available.
- Security
This is a good security practice not to download artifacts from the Internet but to control what software gets delivered into the datacenter.
To create the local mirrors and registries, the Internet access is required. Otherwise, you need to ship all artifacts manually through a medium, such as an external hard drive. For more information about the local mirror design, see Local mirror design.
Local mirror design
The main scenarios for using local mirrors and registries include:
- Online deployment
There is the Internet access from the DriveTrain node during deployment. DriveTrain is then used to set up the local mirrors and registries.
- Offline deployment
There is no Internet access from any of the MCP nodes. The local mirrors and registry are not part of an MCP cluster. The existing local mirrors can be used and populated with the repositories needed by the MCP deployment. This scenario is more common at telephone and financial companies.
By default, MCP deploys local mirrors with packages in a Docker container on the DriveTrain nodes with GlusterFS volumes using the online scenario.
You can manage the local mirrors using the aptly mirror command.
Note
A mirror can only be updated as a whole. Individual package updates are not supported.
The complete mirror of the repositories used in MCP may consume several hundreds of gigabytes of disk space.
This section explains the details of the scenarios above.
Online deployment
The online deployment scenario assumes that there is the Internet access from the DriveTrain nodes during deployment. By default, the local Gerrit (Git), aptly, and Docker registry are run as part of DriveTrain.
The following diagram shows an example of the virtual machines layout:
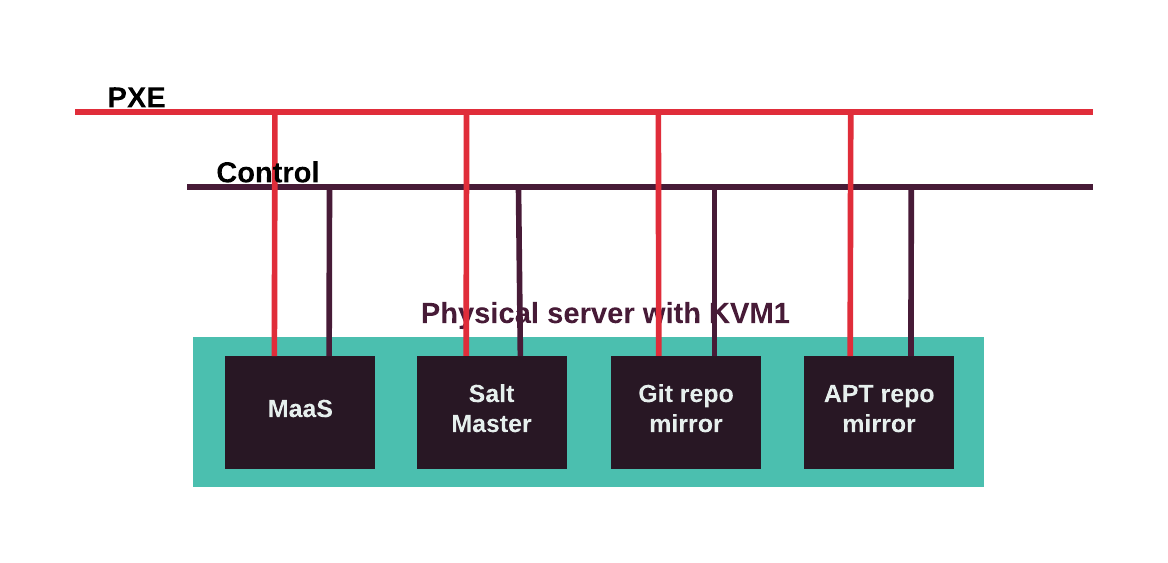
The high-level workflow for the online deployment using local mirrors is as follows:
- Create a deployment model that has the default repositories included (requires the Internet access).
- Deploy MCP DriveTrain using the MCP Deployment Guide.
- Configure the aptly mirror to mirror the repositories described in the MCP Release Notes: Release artifacts section in the related MCP release documentation.
- Modify the deployment model to utilize the local mirrors that are provided by DriveTrain.
- Deploy the MCP cluster using DriveTrain.
Offline deployment
The offline deployment scenario assumes that there is no Internet access from any of the nodes inside the MCP cluster including DriveTrain. The requirement is that the MCP cluster instead has access to the already prepared Debian repository, Docker registry, Git server, HTTP server with QCOW images, and PyPi server.
Mirantis provides a pre-configured QCOW image with already mirrored Debian packages using Aptly, Docker images using Docker Registry, Git repositories needed for MCP deployment, QCOW images, and Python packages. The actual content of this image is described in Mirror image content.
Warning
An offline MCP deployment does not support all possible MCP cluster configurations. For example, the OpenContrail, Kubernetes, OpenStack Mitaka and Ocata packages are not available within the scope of an offline MCP deployment. For a list of artifacts available for an offline deployment, see MCP Release Notes: Release artifacts.
The high-level workflow of the offline deployment is as follows:
Create the deployment model using the Model Designer UI as described in the MCP Deployment Guide checking the offline option (requires the Internet access).
Run a VM using the mirror image.
Deploy the MCP DriveTrain and MCP OpenStack environment using the MCP Deployment Guide.
Note
The offline QCOW image enables you to deploy an MCP OpenStack environment with the services and features as per an OpenStack release version announced in the corresponding MCP release.
Mirror image content
The mirror image delivered for the offline MCP deployment includes:
- Preinstalled services
- Mirrored Debian package repositories
- Mirrored Docker images
- Mirrored Git repositories
- Mirrored QCOW images
For a list of mirrored Debian package repositories and Docker images, see the Release artifacts section of the corresponding MCP release in MCP Release Notes.
The following table describes services and ports for an offline MCP deployment:
| Service name | Service description | Protocol/Port |
|---|---|---|
| Aptly | Serves Debian Packages | HTTP/80 |
| Registry | Serves Docker images | HTTP/5000 |
| Git | Serves Git Repositories | HTTP/8088 |
| HTTP | Serves QCOW images and other files | HTTP/8078 |
The following table describes mirrored Git repositories for an offline MCP deployment:
| Repository name [1] |
|---|
| rundeck-cis-jobs git@github.com:Mirantis/rundeck-cis-jobs.git |
| reclass-system-salt-model git@github.com:Mirantis/reclass-system-salt-model [2] |
| pipeline-library git@github.com:Mirantis/pipeline-library |
| mk-pipelines git@github.com:Mirantis/mk-pipelines |
| [1] | The repositories are tagged with MCP_RELEASE |
| [2] | To reduce the image size, almost all offline repositories contain lists of excluded packages compared to online mirrors. To inspect lists of excludes, refer to the Mirantis Reclass system repository. |
The following table describes mirrored QCOW images of an offline MCP deployment:
| Image name |
|---|
| ubuntu-14-04-x64-MCP_RELEASE.qcow2 |
| ubuntu-16-04-x64-MCP_RELEASE.qcow2 |