Tenant Telemetry planning
Tenant Telemetry planning
MCP provides Tenant Telemetry for OpenStack environments based on the OpenStack Telemetry Data Collection service, or Ceilometer. Tenant Telemetry assists in resource utilization planning and expansion, addresses scalability issues by collecting various OpenStack resource metrics, as well as provides the metrics to such auto-scaling systems as OpenStack Orchestration service, or Heat, that is used to launch stacks of resources, such as virtual machines.
Caution
Tenant Telemetry based on Ceilometer, Aodh, Panko, and Gnocchi is supported starting from the Pike OpenStack release and does not support integration with StackLight LMA. However, you can add the Gnocchi data source to Grafana to view the Tenant Telemetry data.
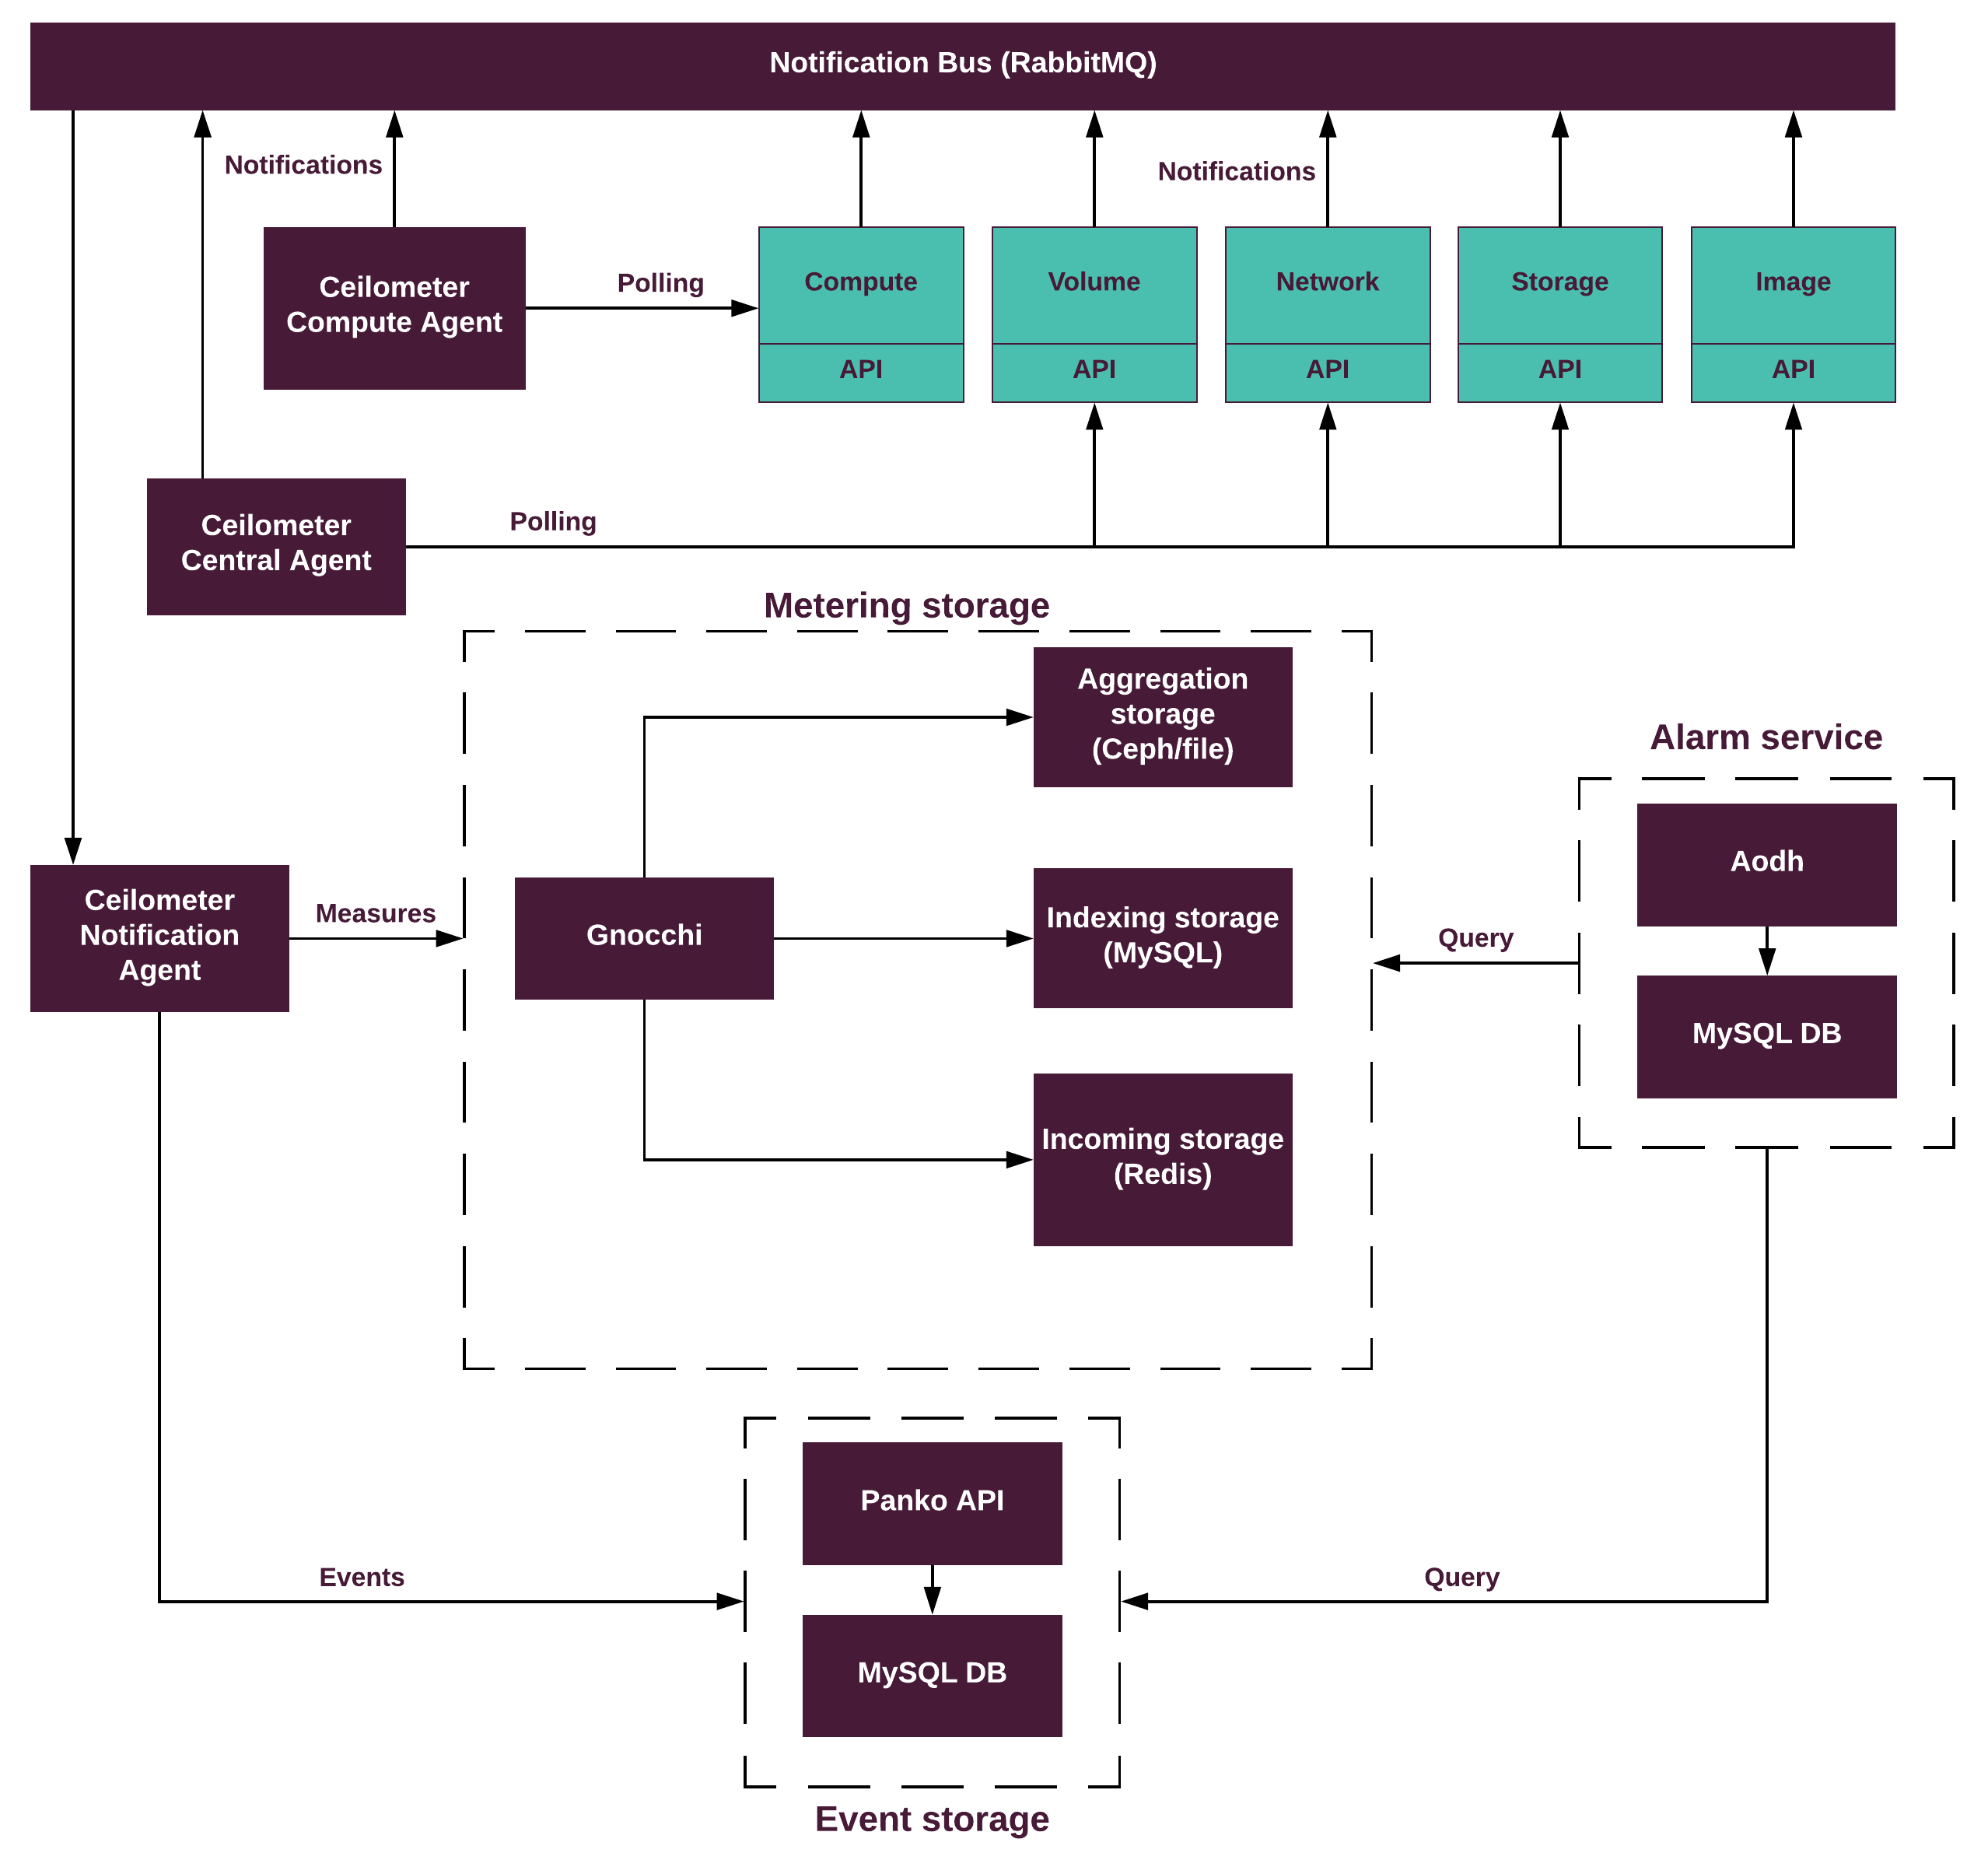
Tenant Telemetry stores scalability metrics in the time-series database called Gnocchi and events in Panko. By default, Panko uses MySQL as a backend with the same Galera cluster as for the OpenStack API. Gnocchi uses the following backends:
- MySQL Galera cluster as indexing storage (using the same MySQL cluster as the OpenStack API)
- Redis as incoming metrics storage set up on the same nodes as Tenant Telemetry
- Aggregation metrics storage:
- Ceph. This option is recommended for production.
- File backend based on GlusterFS. Use this option only for testing purposes.
Note
To define the amount of resources for Gnocchi, calculate the approximate amount of stored data using the How to plan for Gnocchi’s storage instruction. Roughly, 1000 instances produce approximately 60 GB of telemetry data per year.
Example:
The cloud includes 15 compute nodes with 256 GB RAM each:
15 * 256 = 3840 GB RAM raw
Therefore, the cloud includes approximately 3.84 thousands of instances 1 GB each. Assuming that 1000 instances produce about 60 GB of metering data:
3.840 * 60 GB = 230 GB of telemetry data for cloud
A huge amount of short-living instances may increase this value because the data is stored with different aggregation rules. The older the data, the higher is the aggregation step.
Tenant Telemetry supports the community Aodh service that uses the Gnocchi API and provides an alarm evaluator mechanism based on metrics. Aodh allows triggering actions that are based on defined rules against sample or event data of OpenStack services that is collected by Ceilometer. After the event-driven alarm evaluation, Aodh provides instant alarm notifications to the user. The default Aodh backend is the same Galera cluster as used for the Openstack API.
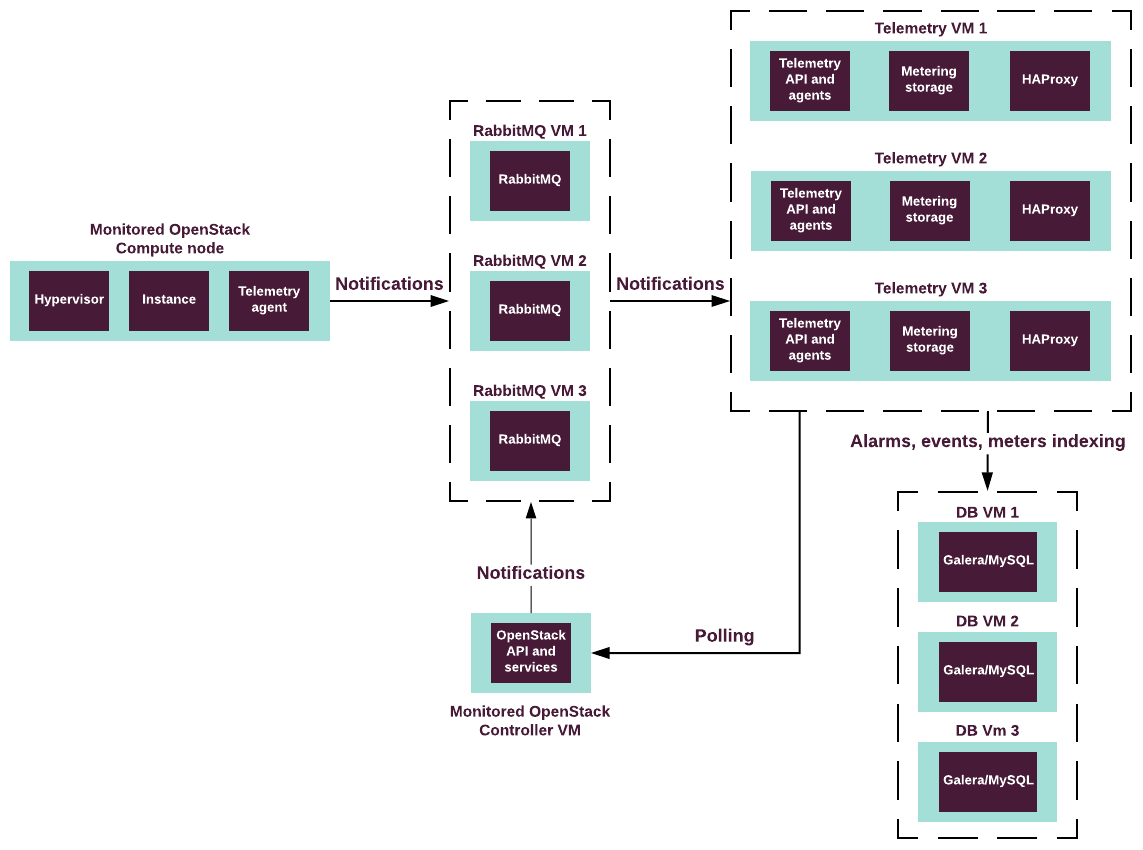
To gather metrics from the compute nodes, Tenant Telemetry uses the Ceilometer Compute Agent installed on each compute node.
The following diagram displays the composition of Tenant Telemetry components across MCP nodes:
The following diagram displays the data flow across the Tenant Telemetry services:
The following table describes the components of Tenant Telemetry:
| Component | Description |
|---|---|
| Ceilometer agents |
|
| Gnocchi agent |
|
| Aodh agents |
|