Metrics Collection and Visualization
This article describes how to enable metrics collection for MSR and visualize the collected data using the Grafana web UI.
Prerequisites
A Grafana instance (either Grafana OSS or Grafana Cloud).
Prometheus deployed in the same Kubernetes cluster as MSR. You can use the community-provided Helm chart: kube-prometheus-stack.
Prometheus configured as a data source in Grafana. For details, refer to the Prometheus data source official documentation from Grafana Labs.
Metrics collection
Enabling metrics collection consists of two parts:
Configure MSR to expose metrics by adding dedicated endpoints to its services.
Configure Prometheus to scrape those endpoints and collect MSR metrics.
Configure MSR
During the initial deployment, or updating an existing MSR cluster, you need to pass an additional value to the MSR Helm chart. For more information, see Install highly available MSR.
Set the metrics.enabled value to true.
Example Helm installation or upgrade command:
helm upgrade --install my-release oci://registry.mirantis.com/harbor/helm/msr --version <MSR-VERSION> -f <PATH-TO/msr-values.yaml> --set metrics.enabled=true
This command enables metrics collection by creating additional endpoints in selected MSR Kubernetes services.
Configure Prometheus
Next, configure Prometheus to scrape the newly exposed MSR metrics endpoints.
To do so, deploy a Prometheus custom resource called ServiceMonitor.
Verify that the Prometheus Operator is deployed in the
monitoringnamespace.Verify that the MSR cluster is deployed in the
msr4namespace.Apply the following manifest to create the
ServiceMonitorresource:cat <<EOF | kubectl apply -f - apiVersion: monitoring.coreos.com/v1 kind: ServiceMonitor metadata: labels: app: msr4 release: prometheus name: msr4 namespace: monitoring spec: endpoints: - port: http-metrics namespaceSelector: matchNames: - msr4 selector: matchLabels: app: harbor EOF
After the ServiceMonitor is deployed, Prometheus starts scraping
metrics from MSR. You can then query these metrics directly in
the Prometheus web UI.
Metrics visualization
You can now visualize the collected MSR metrics. Because Prometheus is already configured as a data source in Grafana, the only remaining step is to create a dashboard.
Mirantis provides an MSR4-specific dashboard, available at the following URL:
https://get.mirantis.com/monitoring/msr4-dashboard.json
To use the dashboard, paste the URL directly into the Grafana web UI when importing a new dashboard.
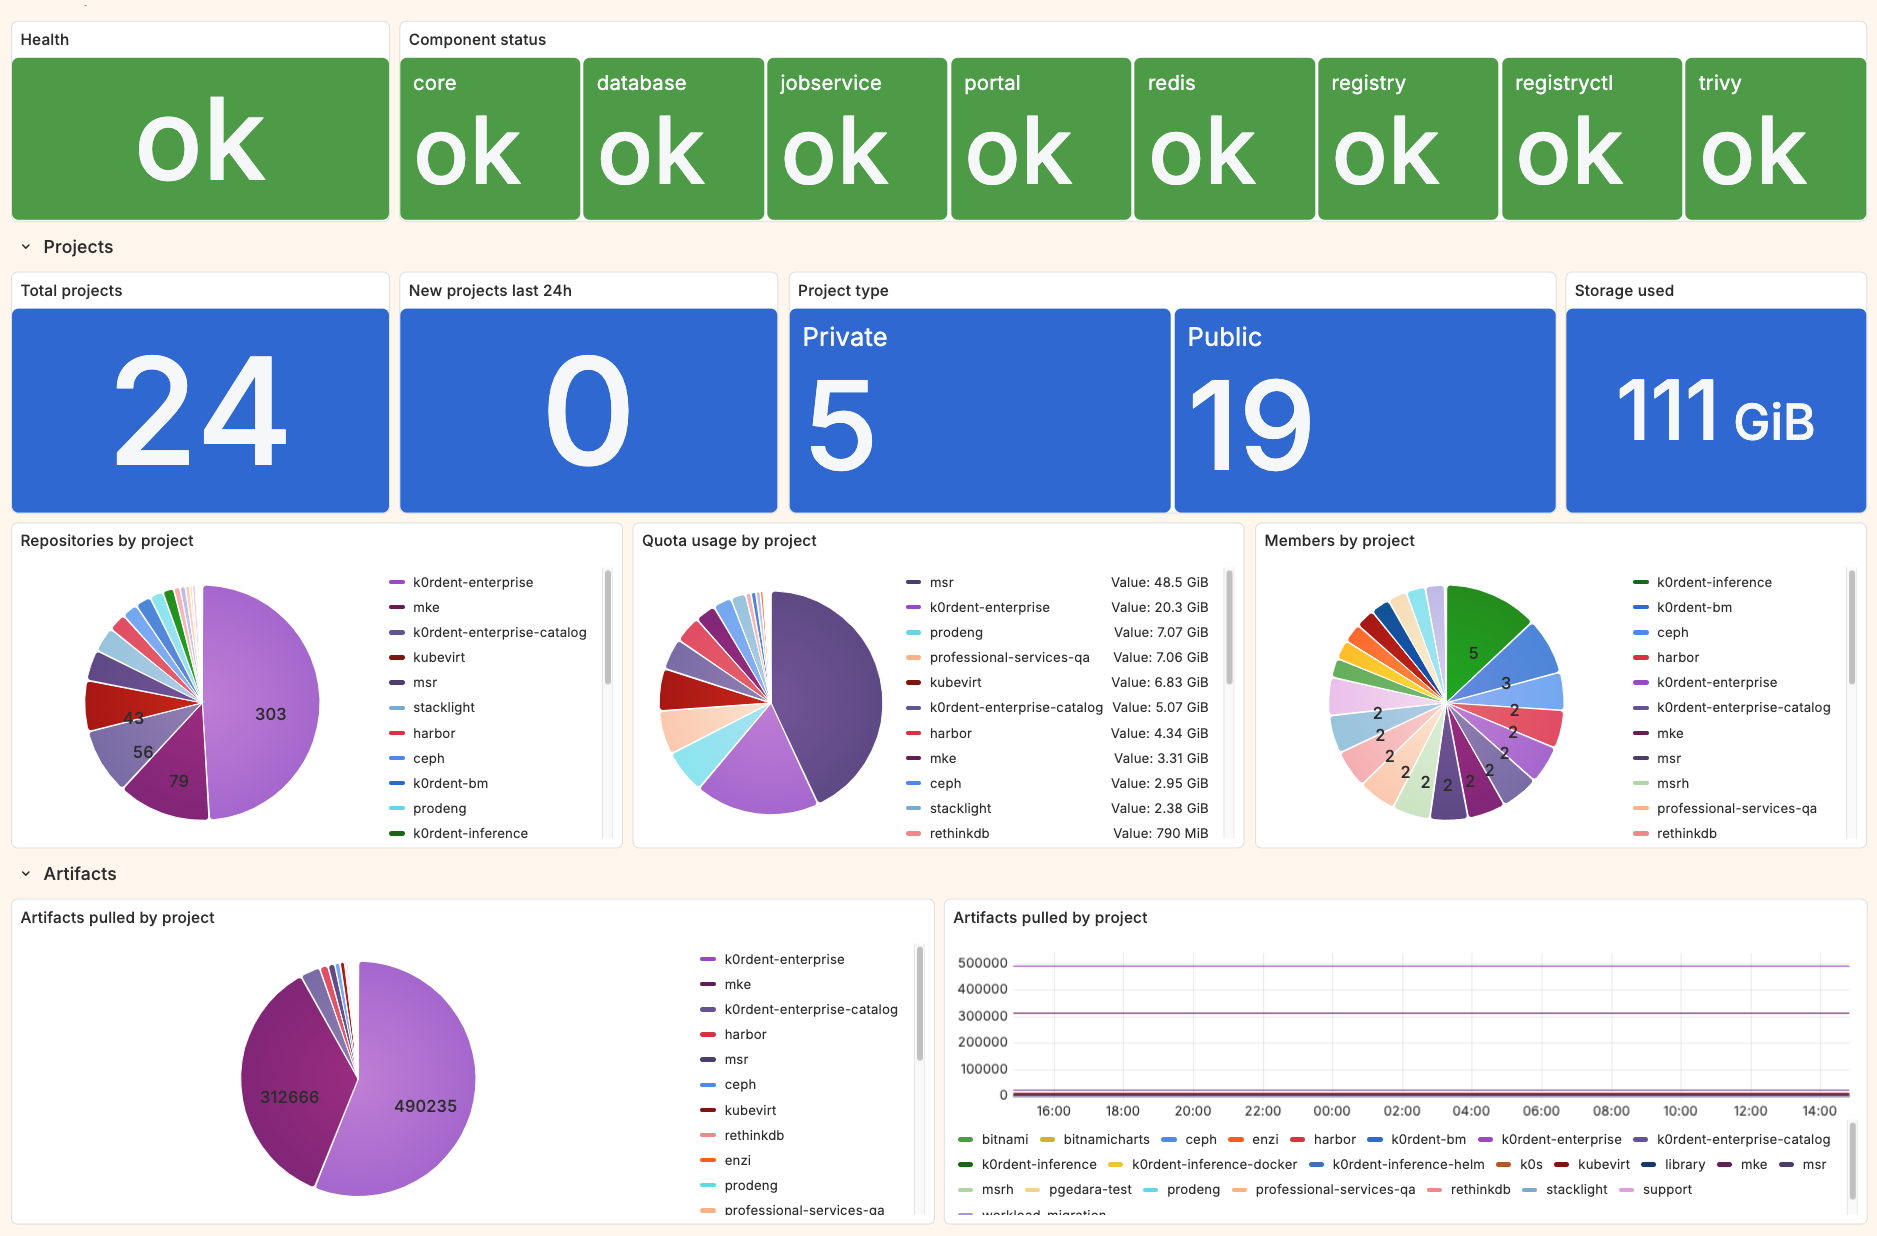
Dashboard example: