Connect to Grafana
Connect to Grafana
To access Grafana, use the public IP exposed by the proxy node, the default 8084 port, and the HTTPS protocol.
To connect to Grafana:
Log in to the Salt Master node.
Obtain the Grafana hostname (IP address), port, and protocol to use as a URL:
salt -C 'I@horizon:server' pillar.item nginx:server:site:nginx_proxy_grafana:host
Example of system response:
prx01.stacklight-dev-2019-2-9.local:
    ----------
    nginx:server:site:nginx_proxy_grafana:host:
        ----------
        name:
            10.13.0.80
        port:
            8084
        protocol:
            https
Obtain the Grafana administrator password:
Starting from the MCP 2019.2.11 maintenance update:
salt -C 'I@grafana:client and I@docker:swarm:role:master' pillar.item _param:grafana_password
Example of system response:
mon01.queens-ovs-stacklight-2k19-2-om.local:
    ----------
    _param:grafana_password:
        jrRk4Fa6pxrjq7hbVeqm2drz6Ezgpr4m
Prior to the MCP 2019.2.11 maintenance update:
salt -C 'I@grafana:client and I@docker:swarm:role:master' pillar.item docker:client:stack:dashboard:service:grafana:environment:GF_SECURITY_ADMIN_PASSWORD
Example of system response:
mon01.stacklight-dev-2019-2-9.local:
    ----------
    docker:client:stack:dashboard:service:grafana:environment:GF_SECURITY_ADMIN_PASSWORD:
        Z06IsBRBY4h67PCczp24vERqh7fGY3dm
Enter the URL obtained in the step 2 to a web browser.
Log in to the Grafana web UI using the default
adminuser name and the password obtained in the step 3.
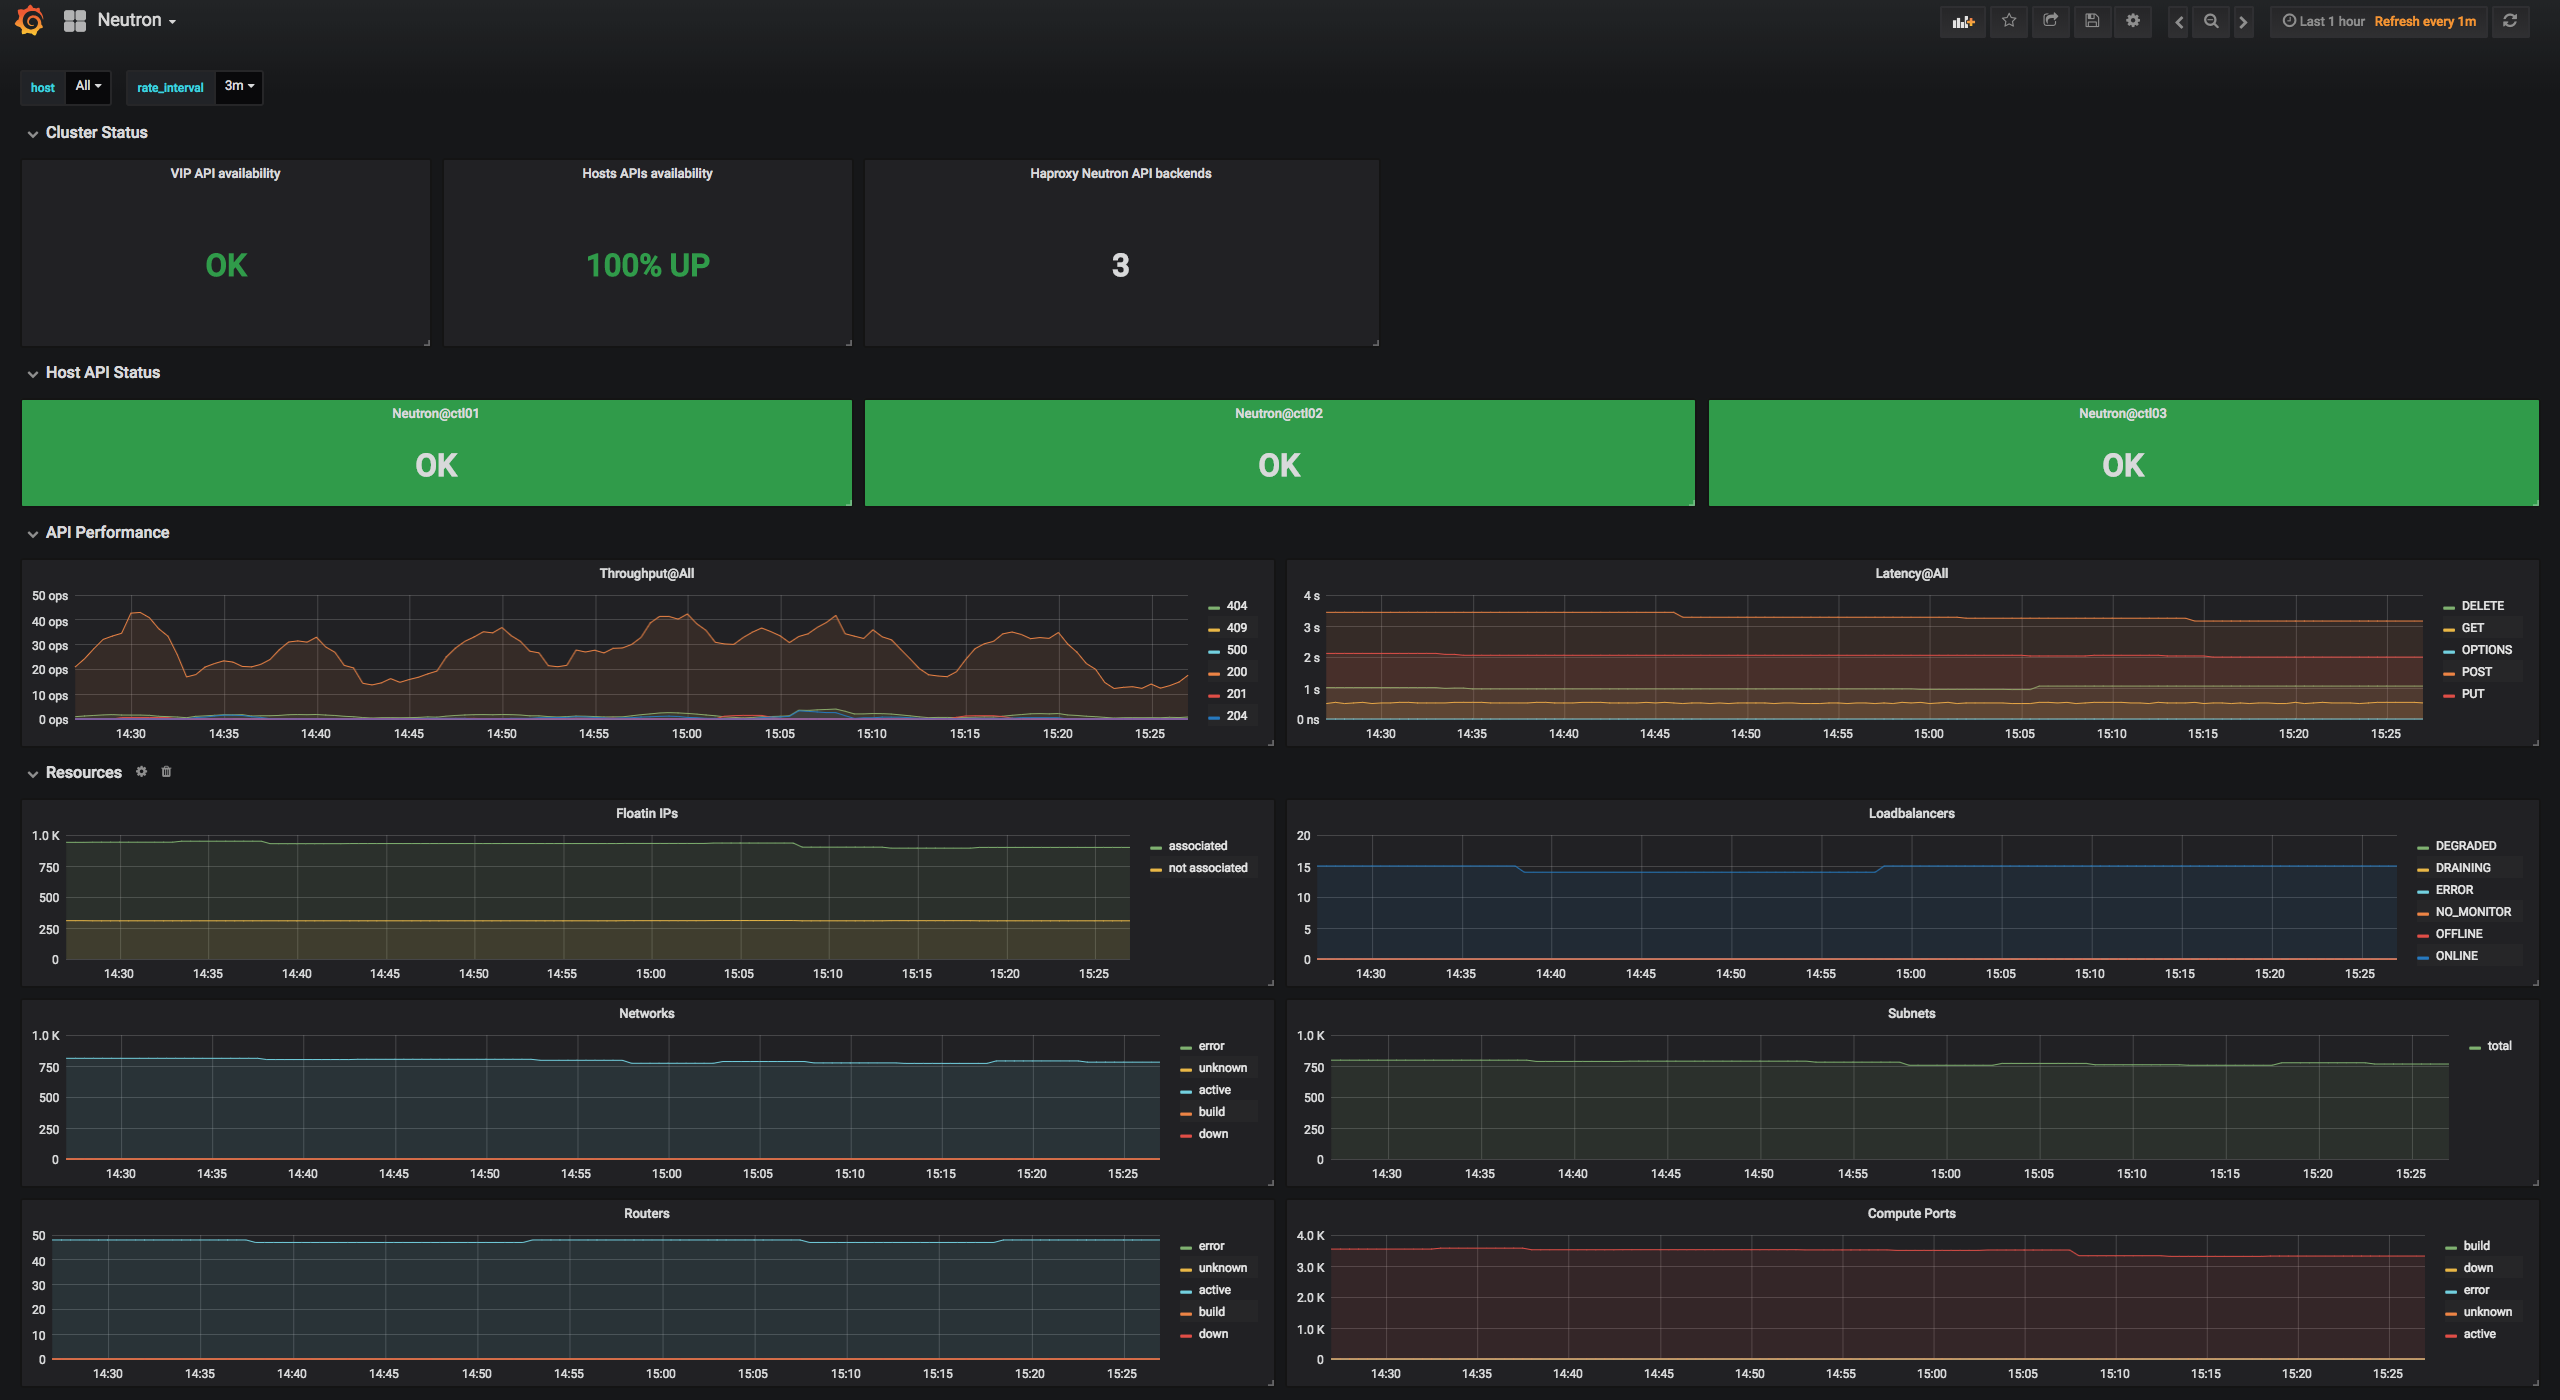
Once done, select the required dashboard from the Home drop-down list. For details about the available Grafana dashboards, see View Grafana dashboards. The following is an example of a Grafana dashboard: