Manage Kibana dashboards
Manage Kibana dashboards
Kibana contains the following built-in dashboards:
- The Logs analytics dashboard that is used to visualize and search the logs.
- The Notifications analytics dashboard that is used to visualize and search the notifications. This dashboard is available if you enable the feature in the Collector settings.
- The Audit analytics dashboard that is used to visualize and search for the OpenStack CADF notifications.
To switch from one dashboard to another, click Dashboard and select the required one as shown in the screen capture below:
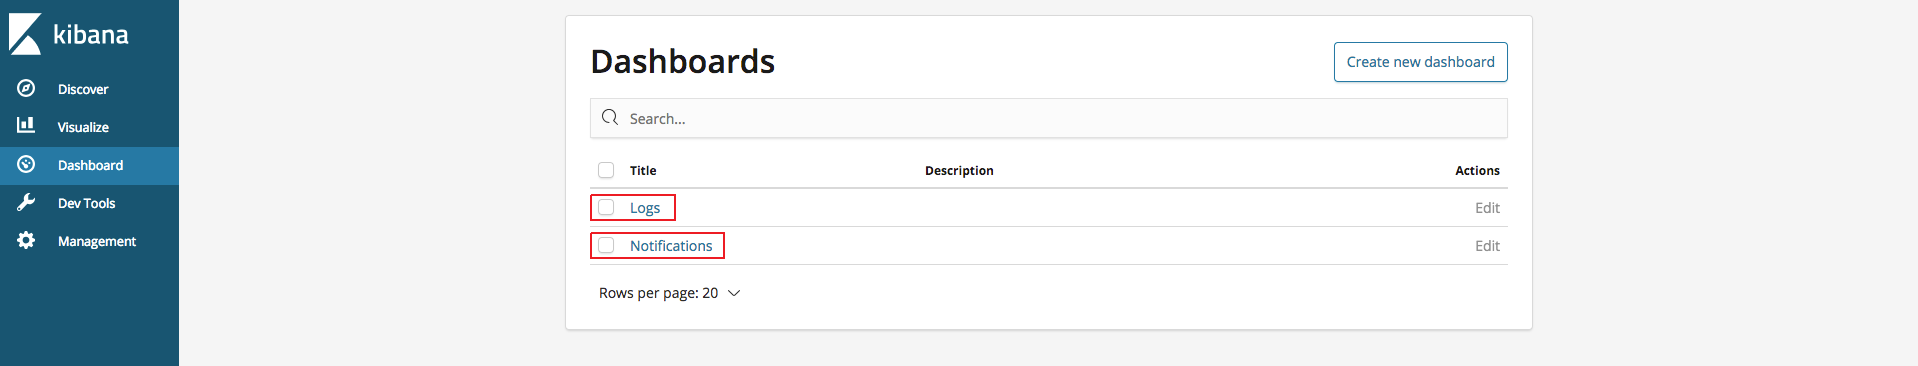
Each dashboard provides a single pane of glass for visualizing and searching for the logs and notifications of your deployment.
The Kibana dashboard for logs is divided into several sections:
A time-picker control to select the required time period and refresh frequency.
A text box to enter search queries.
The logs analytics with six different panels showing the following stack graphs:
- All logs per source
- All logs per severity
- All logs for top 10 sources
- All logs for top 10 programs
- All logs for top 10 hosts
- The number of logs per severity
The table of log messages is sorted in the reverse chronological order.
Connect to Kibana
View Previous Section
Use Kibana filters and queries