Cloud Vector
Cloud Vector
Warning
The DevOps Portal has been deprecated in the Q4`18 MCP release tagged with the 2019.2.0 Build ID.
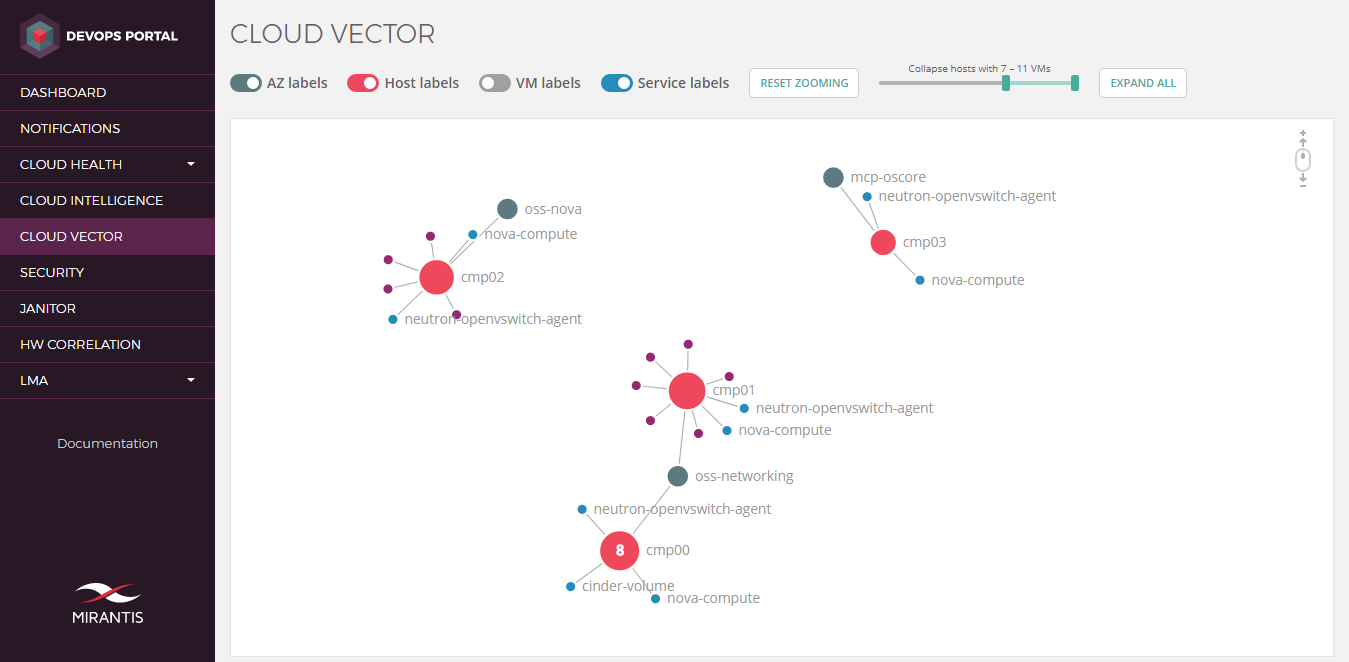
The Cloud Vector dashboard uses a node graph to represent a cloud environment in a form of a cloud map. The entities that build the map include availability zones (AZs), hosts, VMs, and services. Each host represents a compute node in a particular AZ with all VMs and services running on it. Thereby, a cloud map enables you to easily identify the number of nodes running in your cloud environment.
The screen capture below is an example of a cloud map created by Cloud Vector.
Note
The Cloud Vector dashboard depends on the following services:
- DevOps Portal web UI
- Cloud Intelligence service
To use the Cloud Vector dashboard:
Log in to the DevOps Portal.
Navigate to the Cloud Vector dashboard.
Proceed with the following available actions as required:
Collapse child elements:
Note
Hosts with more than 50 child VMs are collapsed by default.
Note
The size of a host circle depends on the number of its child elements. The more VMs a host owns, the bigger it is.
- Double-click on an AZ or a host to collapse its child elements. If a host is collapsed, the number of its VMs is displayed. Services are not collapsed when you collapse a host.
- Use the slider to collapse the nodes which VMs count matches the specified conditions.
Expand child elements:
- Double-click on a collapsed element to expand its child elements.
- Click Expand all to expand all collapsed elements.
Drag elements on the canvas:
- Drag a particular element to move it and all connected elements.
- Drag the canvas background to change the position of all elements.
- Click Reset zomming to reset canvas shifts.
Scale elements on the canvas:
Note
Red borders appear if elements are extended beyond the canvas boundaries.
- Click on the canvas and scroll up or down to zoom in or out.
- Click Reset zomming to reset scaling.
Show and hide node labels:
- Use toggles to show or hide labels of particular entities.
- Hover over a particular element to view its label.