Mirantis Container Cloud (MCC) becomes part of Mirantis OpenStack for Kubernetes (MOSK)!
Starting with MOSK 25.2, the MOSK documentation set covers all product layers, including MOSK management (formerly MCC). This means everything you need is in one place. The separate MCC documentation site will be retired, so please update your bookmarks for continued easy access to the latest content.
Mirantis OpenStack for Kubernetes Documentation
This documentation provides information on how to deploy and operate a Mirantis OpenStack for Kubernetes (MOSK) environment. The documentation is intended to help operators to understand the core concepts of the product. The documentation provides sufficient information to deploy and operate the solution.
The information provided in this documentation set is being constantly improved and amended based on the feedback and kind requests from the consumers of MOS.
The following table lists the guides included in the documentation set you are reading:
Guide |
Purpose |
|---|---|
Learn the fundamentals of MOSK reference architecture to appropriately plan your deployment |
|
Deploy a MOSK environment of a preferred configuration using supported deployment profiles tailored to the demands of specific business cases |
|
Operate your MOSK environment |
|
Learn about new features and bug fixes in the current MOSK version |
Intended audience
This documentation is intended for engineers who have the basic knowledge of Linux, virtualization and containerization technologies, Kubernetes API and CLI, Helm and Helm charts, Mirantis Kubernetes Engine (MKE), and OpenStack.
Documentation history
The following table contains the released revision of the documentation set you are reading.
Release date |
Release name |
|---|---|
August, 2023 |
MOSK 23.2 series |
Conventions
This documentation set uses the following conventions in the HTML format:
Convention |
Description |
|---|---|
boldface font |
Inline CLI tools and commands, titles of the procedures and system response examples, table titles |
|
Files names and paths, Helm charts parameters and their values, names of packages, nodes names and labels, and so on |
italic font |
Information that distinguishes some concept or term |
External links and cross-references, footnotes |
|
Main menu > menu item |
GUI elements that include any part of interactive user interface and menu navigation |
Superscript |
Some extra, brief information |
Note The Note block |
Messages of a generic meaning that may be useful for the user |
Caution The Caution block |
Information that prevents a user from mistakes and undesirable consequences when following the procedures |
Warning The Warning block |
Messages that include details that can be easily missed, but should not be ignored by the user and are valuable before proceeding |
See also The See also block |
List of references that may be helpful for understanding of some related tools, concepts, and so on |
Learn more The Learn more block |
Used in the Release Notes to wrap a list of internal references to the reference architecture, deployment and operation procedures specific to a newly implemented product feature |
Product Overview
Mirantis OpenStack for Kubernetes (MOSK) combines the power of Mirantis Container Cloud for delivering and managing Kubernetes clusters, with the industry standard OpenStack APIs, enabling you to build your own cloud infrastructure.
The advantages of running all of the OpenStack components as a Kubernetes application are multi-fold and include the following:
Zero downtime, non-disruptive updates
Fully automated Day-2 operations
Full-stack management from bare metal through the operating system and all the necessary components
The list of the most common use cases includes:
- Software-defined data center
The traditional data center requires multiple requests and interactions to deploy new services, by abstracting the data center functionality behind a standardized set of APIs service can be deployed faster and more efficiently. MOSK enables you to define all your data center resources behind the industry standard OpenStack APIs allowing you to automate the deployment of applications or simply request resources through the UI to quickly and efficiently provision virtual machines, storage, networking, and other resources.
- Virtual Network Functions (VNFs)
VNFs require high performance systems that can be accessed on demand in a standardized way, with assurances that they will have access to the necessary resources and performance guarantees when needed. MOSK provides extensive support for VNF workload enabling easy access to functionality such as Intel EPA (NUMA, CPU pinning, Huge Pages) as well as the consumption of specialized networking interfaces cards to support SR-IOV and DPDK. The centralized management model of MOSK and Mirantis Container Cloud also enables the easy management of multiple MOSK deployments with full lifecycle management.
- Legacy workload migration
With the industry moving toward cloud-native technologies many older or legacy applications are not able to be moved easily and often it does not make financial sense to transform the applications to cloud-native applications. MOSK provides a stable cloud platform that can cost-effectively host legacy applications whilst still providing the expected levels of control, customization, and uptime.
Reference Architecture
Mirantis OpenStack for Kubernetes (MOSK) is a virtualization platform that provides an infrastructure for cloud-ready applications, in combination with reliability and full control over the data.
MOSK combines OpenStack, an open-source cloud infrastructure software, with application management techniques used in the Kubernetes ecosystem that include container isolation, state enforcement, declarative definition of deployments, and others.
MOSK integrates with Mirantis Container Cloud to rely on its capabilities for bare-metal infrastructure provisioning, Kubernetes cluster management, and continuous delivery of the stack components.
MOSK simplifies the work of a cloud operator by automating all major cloud life cycle management routines including cluster updates and upgrades.
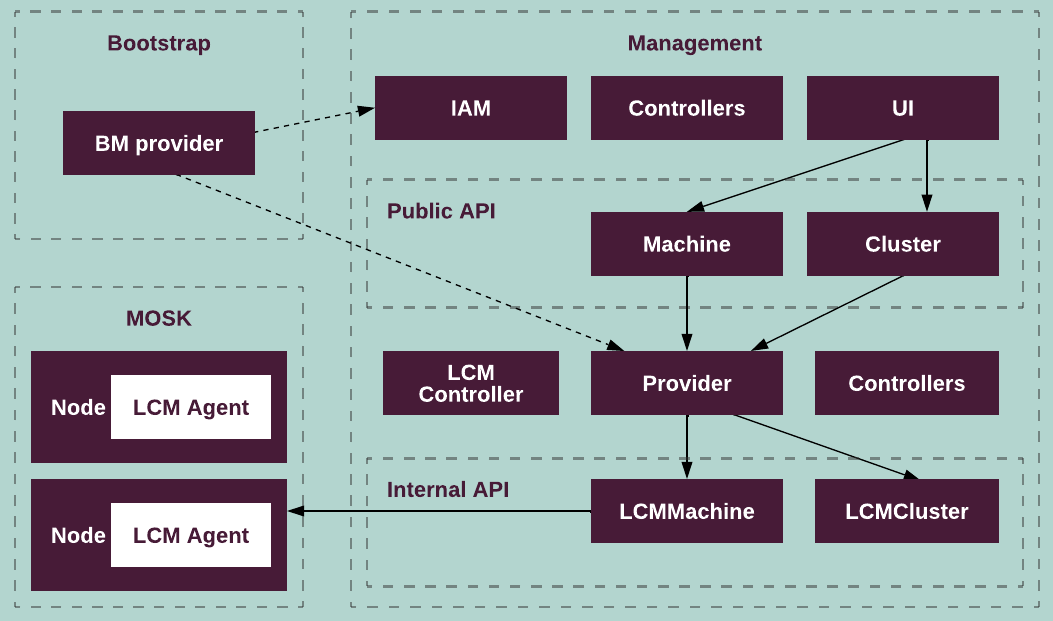
Cluster types
The types of Mirantis OpenStack for Kubernetes (MOSK) clusters include:
- Bootstrap cluster
Runs the bootstrap process on a seed data center bare metal node.
Requires access to the bare metal provider backend.
Initially, the bootstrap cluster is created with the following minimal set of components: Bootstrap Controller, public API charts, and the Bootstrap API.
The user can interact with the bootstrap cluster through the Bootstrap API to create the configuration for a management cluster and start its deployment. More specifically, the user performs the following operations:
Create required deployment objects.
Optionally add proxy and SSH keys.
Configure the cluster and machines.
Deploy the management cluster.
The user can monitor the deployment progress of the cluster and machines.
After a successful deployment, the user can download the
kubeconfigartifact of the provisioned cluster.
- Management cluster
Provides the following functionality:
Runs all public APIs and services including the management console of the MOSK management cluster.
Runs the baremetal-specific services and internal API including
LCMMachineandLCMCluster. Also, it runs an LCM controller for orchestrating MOSK clusters and other controllers for handling different resources.Requires two-way access to the bare metal provider backend. The provider connects to a backend to spawn MOSK cluster nodes, and the agent running on the nodes accesses the management cluster to obtain the deployment information.
For deployment details of a management cluster, see Deploy a management cluster.
- MOSK cluster
A Mirantis Kubernetes Engine (MKE) cluster that an end user creates using the management console.
Requires access to its management cluster. Each node of a MOSK cluster runs an LCM Agent that connects to the LCM machine of the management cluster to obtain the deployment details.
Combines OpenStack, an open-source cloud infrastructure software, with application management techniques used in the Kubernetes ecosystem
All types of MOSK clusters except the bootstrap cluster are based on the MKE and Mirantis Container Runtime (MCR) architecture. For details, see MKE and MCR documentation.
The following diagram illustrates the distribution of services between each type of MOSK clusters:
All artifacts used by Kubernetes and workloads are stored on the Mirantis content delivery network (CDN):
mirror.mirantis.com(Debian packages including the Ubuntu mirrors)binary.mirantis.com(Helm charts and binary artifacts)mirantis.azurecr.io(Docker image registry)
All MOSK components are deployed in the Kubernetes clusters. All MOSK management APIs are implemented using the Kubernetes Custom Resource Definition (CRD) that represents custom objects stored in Kubernetes and allows you to expand Kubernetes API.
The MOSK logic is implemented using controllers. A
controller handles changes in custom resources defined in the controller CRD.
A custom resource consists of a spec that describes the desired state of a
resource provided by the user. During every change, a controller reconciles
the external state of a custom resource with the user parameters and stores
this external state in the status subresource of its custom resource.
Deployment profiles
A Mirantis OpenStack for Kubernetes (MOSK) deployment profile is a thoroughly tested and officially supported reference architecture that is guaranteed to work at a specific scale and is tailored to the demands of a specific business case, such as generic IaaS cloud, Network Function Virtualisation infrastructure, Edge Computing, and others.
A deployment profile is defined as a combination of:
Services and features the cloud offers to its users.
Non-functional characteristics that users and operators should expect when running the profile on top of a reference hardware configuration. Including, but not limited to:
Performance characteristics, such as an average network throughput between VMs in the same virtual network.
Reliability characteristics, such as the cloud API error response rate when recovering a failed controller node.
Scalability characteristics, such as the total amount of virtual routers tenants can run simultaneously.
Hardware requirements - the specification of physical servers, and networking equipment required to run the profile in production.
Deployment parameters that an operator for the cloud can tweak within a certain range without being afraid of breaking the cloud or losing support.
In addition, the following items may be included in a definition:
Compliance-driven technical requirements, such as TLS encryption of all external API endpoints.
Foundation-level software components, such as Tungsten Fabric or Open vSwitch as a backend for the networking service.
Note
Mirantis reserves the right to revise the technical implementation of any profile at will while preserving its definition - the functional and non-functional characteristics that operators and users are known to rely on.
MOSK supports a huge list of different deployment profiles to address a wide variety of business tasks. The table below includes the profiles for the most common use cases.
Note
Some components of a MOSK cluster are mandatory and are being installed during cluster deployment regardless of the deployment profile in use. StackLight is one of the cluster components that are enabled by default. See Create a managed cluster for details.
Profile |
OpenStackDeployment CR Preset |
Description |
|---|---|---|
Cloud Provider Infrastructure (CPI) |
|
Provides the core set of the services an IaaS vendor would need including some extra functionality. The profile is designed to support up 50-70 compute nodes and a reasonable number of storage nodes. 0 The core set of services provided by the profile includes: |
CPI with Tungsten Fabric |
|
A variation of the CPI profile 1 with Tugsten Fabric as a backend for networking. |
- 0
The supported node count is approximate and may vary depending on the hardware, cloud configuration, and planned workload.
- 1(1,2)
Ironic is an optional component for the CPI profile. See Bare Metal service for details.
- 2
Ironic is not supported for the CPI with Tungsten Fabric profile. See Tungsten Fabric known limitations for details.
Components overview
Mirantis OpenStack for Kubernetes (MOSK) includes the following key design elements.
HelmBundle Operator
The HelmBundle Operator is the realization of the Kubernetes Operator
pattern that provides a Kubernetes custom resource of the HelmBundle
kind and code running inside a pod in Kubernetes. This code handles changes,
such as creation, update, and deletion, in the Kubernetes resources of this
kind by deploying, updating, and deleting groups of Helm releases from
specified Helm charts with specified values.
OpenStack
The OpenStack platform manages virtual infrastructure resources, including virtual servers, storage devices, networks, and networking services, such as load balancers, as well as provides management functions to the tenant users.
Various OpenStack services are running as pods in Kubernetes and are
represented as appropriate native Kubernetes resources, such as
Deployments, StatefulSets, and DaemonSets.
For a simple, resilient, and flexible deployment of OpenStack and related services on top of a Kubernetes cluster, MOSK uses OpenStack-Helm that provides a required collection of the Helm charts.
Also, MOSK uses OpenStack Controller (Rockoon) as the
realization of the Kubernetes Operator pattern. Rockoon provides a custom
Kubernetes resource of the OpenStackDeployment kind and code running
inside a pod in Kubernetes. This code handles changes such as creation,
update, and deletion in the Kubernetes resources of this kind by
deploying, updating, and deleting groups of the Helm releases.
Ceph
Ceph is a distributed storage platform that provides storage resources, such as objects and virtual block devices, to virtual and physical infrastructure.
MOSK uses Rook as the implementation of the
Kubernetes Operator pattern that manages resources of the CephCluster
kind to deploy and
manage Ceph services as pods on top of Kubernetes to provide Ceph-based
storage to the consumers, which include OpenStack services, such as Volume
and Image services, and underlying Kubernetes through Ceph CSI (Container
Storage Interface).
The Ceph Controller is the implementation of the Kubernetes Operator
pattern, that manages resources of the MiraCeph kind to simplify
management of the Rook-based Ceph clusters.
StackLight Logging, Monitoring, and Alerting
The StackLight component is responsible for collection, analysis, and visualization of critical monitoring data from physical and virtual infrastructure, as well as alerting and error notifications through a configured communication system, such as email. StackLight includes the following key sub-components:
Prometheus
OpenSearch
OpenSearch Dashboards
Fluentd
Requirements
MOSK cluster hardware requirements
This section provides hardware requirements for the Mirantis Container Cloud management cluster with a managed Mirantis OpenStack for Kubernetes (MOSK) cluster.
For installing MOSK, the Mirantis Container Cloud management cluster and managed cluster must be deployed with baremetal provider.
Important
A MOSK cluster is to be used for a deployment of an OpenStack cluster and its components. Deployment of third-party workloads on a MOSK cluster is neither allowed nor supported.
Note
One of the industry best practices is to verify every new update or configuration change in a non-customer-facing environment before applying it to production. Therefore, Mirantis recommends having a staging cloud, deployed and maintained along with the production clouds. The recommendation is especially applicable to the environments that:
Receive updates often and use continuous delivery. For example, any non-isolated deployment of Mirantis Container Cloud.
Have significant deviations from the reference architecture or third party extensions installed.
Are managed under the Mirantis OpsCare program.
Run business-critical workloads where even the slightest application downtime is unacceptable.
A typical staging cloud is a complete copy of the production environment including the hardware and software configurations, but with a bare minimum of compute and storage capacity.
The table below describes the node types the MOSK reference architecture includes.
Node type |
Description |
|---|---|
Mirantis Container Cloud management cluster nodes |
The Container Cloud management cluster architecture on bare metal requires three physical servers for manager nodes. On these hosts, we deploy a Kubernetes cluster with services that provide Container Cloud control plane functions. |
OpenStack control plane node and StackLight node |
Host OpenStack control plane services such as database, messaging, API, schedulers conductors, and L3 and L2 agents, as well as the StackLight components. Note MOSK enables the cloud operator to collocate the OpenStack control plane with the managed cluster master nodes on the OpenStack deployments of a small size. This capability is available as technical preview. Use such configuration for testing and evaluation purposes only. |
Tenant gateway node |
Optional. Hosts OpenStack gateway services including L2, L3, and DHCP agents. The tenant gateway nodes are combined with OpenStack control plane nodes. The strict requirement is a dedicated physical network (bond) for tenant network traffic. |
Tungsten Fabric control plane node |
Required only if Tungsten Fabric is enabled as a backend for the OpenStack networking. These nodes host the TF control plane services such as Cassandra database, messaging, API, control, and configuration services. |
Tungsten Fabric analytics node |
Unsupported since MOSK 24.2 Required only if Tungsten Fabric is enabled as a backend for the OpenStack networking. These nodes host the TF analytics services such as Cassandra, ZooKeeper, and collector. |
Compute node |
Hosts the OpenStack Compute services such as QEMU, L2 agents, and others. |
Infrastructure nodes |
Runs underlying Kubernetes cluster management services. The MOSK reference configuration requires minimum three infrastructure nodes. |
The table below specifies the hardware resources the MOSK reference architecture recommends for each node type.
Node type |
# of servers |
CPU cores # per server |
RAM per server, GB |
Disk space per server, GB |
NICs # per server |
|---|---|---|---|---|---|
Management cluster node |
3 0 |
32 min 16 |
128 min 64 |
1 NVME or SSD x 240
1 NVME or SSD x 960 1
|
2 or 1 x 2-port 2 |
OpenStack control plane, gateway 3, and StackLight node |
3 or more |
32 |
128 |
1 SSD x 500
2 SSD x 1000 5
|
5 |
Tenant gateway node (optional) |
0-3 |
32 |
128 |
1 SSD x 500 |
5 |
Tungsten Fabric control plane node |
3 |
16 |
64 |
1 SSD x 500 |
1 |
Tungsten Fabric analytics node Unsupported since MOSK 24.2 |
3 |
32 |
64 |
1 SSD x 1000 |
1 |
Compute node |
3 (varies) |
16 |
64 |
1 SSD x 500 6 |
5 |
Infrastructure node (Kubernetes cluster management) |
3 |
16 |
64 |
1 SSD x 500 |
5 |
Infrastructure node (Ceph) 4 |
3 |
16 |
64 |
1 SSD x 500
2 HDDs x 2000
|
5 |
Note
The exact hardware specifications and number of the control plane and gateway nodes depend on a cloud configuration and scaling needs. For example, for the clouds with more than 12,000 Neutron ports, Mirantis recommends increasing the number of gateway nodes.
- 0
Adding more than 3 nodes to a management cluster is not supported.
- 1
In total, at least 2 disks are required:
disk0- system storage, recommended - 240 GB, minimum - 120 GB.disk1- management cluster services storage, recommended - 960 GB, minimum - 480 GB that must include 2 volumes for management services (total 50 GB). For details about required StackLight volumes, see the corresponding footnote below. The exact capacity requirements depend on configured volume sizes for StackLight, MariaDB, andmcc-cache.
For other storage details, see Management cluster storage.
- 2
Only one PXE port per node is allowed. The out-of-band management (IPMI) port is not included.
- 3
OpenStack gateway services can optionally be moved to separate nodes.
- 4
A Ceph cluster with 3 Ceph nodes does not provide hardware fault tolerance and is not eligible for recovery operations, such as a disk or an entire node replacement. Therefore, a minimum of 5 Ceph nodes is recommended for production use.
A Ceph cluster uses the replication factor that equals 3. If the number of Ceph OSDs is less than 3, a Ceph cluster moves to the degraded state with the write operations restriction until the number of alive Ceph OSDs equals the replication factor again.
- 5
1 SSD x 500 for operating system
1 SSD x 1000 for OpenStack LVP
1 SSD x 1000 for StackLight LVP that must include 4 volumes per node:
Alertmanager - 2 GB (hardcoded)
PostgreSQL - 10 GB (hardcoded)
Prometheus - 16 GB by default
OpenSearch - 30 GB by default
For production deployments, Mirantis recommends increasing the default values for Prometheus and OpenSearch to store more metrics and logs, according to your needs.
- 6
When Nova is used with local folders, additional capacity is required depending on the VM images size.
Note
If you would like to evaluate the MOSK capabilities and do not have much hardware at your disposal, you can deploy it in a virtual environment. For example, on top of another OpenStack cloud using the sample Heat templates.
Please mind, the tooling is provided for reference only and is not a part of the product itself. Mirantis does not guarantee its interoperability with any MOSK version.
Management cluster storage
The management cluster requires minimum two storage devices per node. Each device is used for different type of storage:
The first device is always used for boot partitions and the root file system. SSD is recommended. A RAID device is not supported.
One storage device per server is reserved for local persistent volumes. These volumes are served by the Local Storage Static Provisioner, that is
local-volume-provisioner, and used by many services of MOSK.
You can configure host storage devices using BareMetalHostProfile
resources. For details, see Create a custom bare metal host profile.
System requirements for the seed node
The seed node is only necessary to deploy the management cluster. When the bootstrap is complete, the bootstrap node can be discarded and added back to the MOSK cluster as a node of any type.
The minimum reference system requirements for a baremetal-based bootstrap seed node are as follow:
Basic Ubuntu 18.04 server with the following configuration:
Kernel of version 4.15.0-76.86 or later
8 GB of RAM
4 CPU
10 GB of free disk space for the bootstrap cluster cache
No DHCP or TFTP servers on any NIC networks
Routable access IPMI network for the hardware servers.
Internet access for downloading of all required artifacts
If you use a firewall or proxy, make sure that the bootstrap and management clusters have access to the following IP ranges and domain names:
IP ranges:
Microsoft Azure (only IP addresses for
MicrosoftContainerRegistry)Amazon AWS (only IP addresses for
"service": "CLOUDFRONT")
Domain names:
mirror.mirantis.com and repos.mirantis.com for packages
binary.mirantis.com for binaries and Helm charts
mirantis.azurecr.io and *.blob.core.windows.net for Docker images
mcc-metrics-prod-ns.servicebus.windows.net:9093 for Telemetry (port 443 if proxy is enabled)
mirantis.my.salesforce.com and login.salesforce.com for Salesforce alerts
Note
Access to Salesforce is required from any cluster type.
If any additional Alertmanager notification receiver is enabled, for example, Slack, its endpoint must also be accessible from the cluster.
Components collocation
MOSK uses Kubernetes labels to place components onto hosts. For the default locations of components, see MOSK cluster hardware requirements. Additionally, MOSK supports component collocation. This is mostly useful for OpenStack compute and Ceph nodes. For component collocation, consider the following recommendations:
When calculating hardware requirements for nodes, consider the requirements for all collocated components.
When performing maintenance on a node with collocated components, execute the maintenance plan for all of them.
When combining other services with the OpenStack compute host, verify that
reserved_host_*has increased accordingly to the needs of collocated components by using node-specific overrides for thecomputeservice.
Infrastructure requirements
This section lists the infrastructure requirements for the Mirantis OpenStack for Kubernetes (MOSK) reference architecture.
Service |
Description |
|---|---|
MetalLB |
MetalLB exposes external IP addresses of cluster services to access applications in a Kubernetes cluster. |
DNS |
The Kubernetes Ingress NGINX controller is used to expose OpenStack services outside of a Kubernetes deployment. Access to the Ingress services is allowed only by its FQDN. Therefore, DNS is a mandatory infrastructure service for an OpenStack on Kubernetes deployment. |
See also
DHCP range requirements for PXE
When setting up the network range for DHCP Preboot Execution Environment (PXE), keep in mind several considerations to ensure smooth server provisioning:
Determine the network size. For instance, if you target a concurrent provision of 50+ servers, a /24 network is recommended. This specific size is crucial as it provides sufficient scope for the DHCP server to provide unique IP addresses to each new Media Access Control (MAC) address, thereby minimizing the risk of collision.
The concept of collision refers to the likelihood of two or more devices being assigned the same IP address. With a /24 network, the collision probability using the SDBM hash function, which is used by the DHCP server, is low. If a collision occurs, the DHCP server provides a free address using a linear lookup strategy.
In the context of PXE provisioning, technically, the IP address does not need to be consistent for every new DHCP request associated with the same MAC address. However, maintaining the same IP address can enhance user experience, making the /24 network size more of a recommendation than an absolute requirement.
For a minimal network size, it is sufficient to cover the number of concurrently provisioned servers plus one additional address (50 + 1). This calculation applies after covering any exclusions that exist in the range. You can define excludes in the corresponding field of the
Subnetobject. For details, see API Reference: Subnet resource.When the available address space is less than the minimum described above, you will not be able to automatically provision all servers. However, you can manually provision them by combining manual IP assignment for each bare metal host with manual pauses. For these operations, use the
host.dnsmasqs.metal3.io/addressandbaremetalhost.metal3.io/detachedannotations in theBareMetalHostInventoryobject. For details, see Manually allocate IP addresses for bare metal hosts.All addresses within the specified range must remain unused before provisioning. If an IP address in-use is issued by the DHCP server to a BOOTP client, that specific client cannot complete provisioning.
See also
Management cluster
This section outlines key components of a Mirantis OpenStack for Kubernetes (MOSK) management cluster.
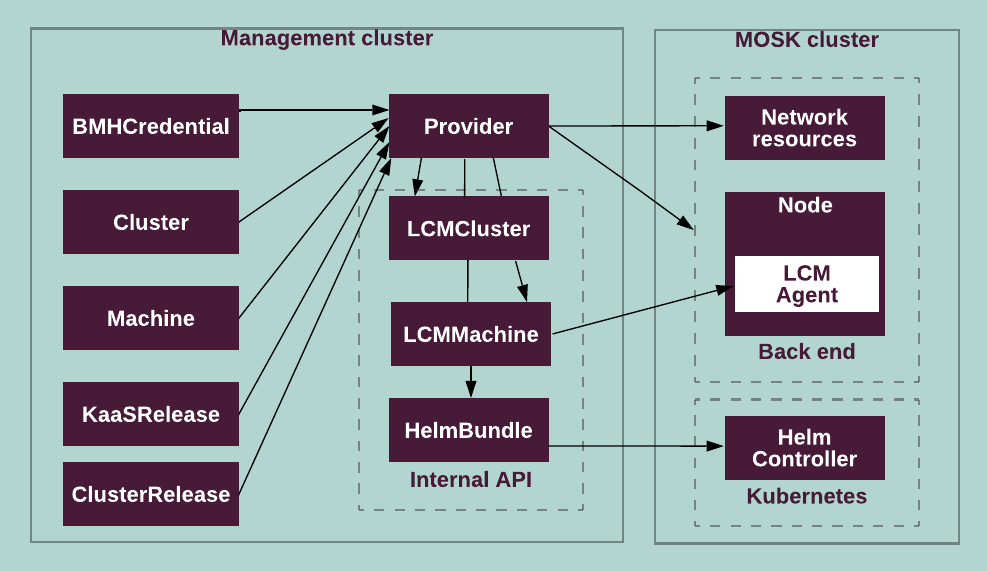
Bare metal provider
MOSK bare metal provider provisions nodes of management and MOSK clusters and runs the LCM Agent on these nodes. It runs in a management cluster and requires connection to the bare metal provider backend.
The bare metal provider interacts with the following types of public API objects:
Public API object name |
Description |
|---|---|
|
Contains the following information about clusters:
|
|
|
|
|
|
|
|
Contains all information about the Baseboard Management Controller ( |
|
Is provided to every machine to obtain SSH access. |
The bare metal provider performs the following operations:
Consumes the below types of data from a management cluster:
Credentials to connect to the provider backend
Deployment instructions from the
KaaSReleaseandClusterReleaseobjectsThe cluster-level parameters from the
ClusterobjectsThe machine-level parameters from the
Machineobjects
Prepares data for all MOSK components:
Creates the
LCMClusterandLCMMachinecustom resources for LCM Controller and LCM Agent. TheLCMMachinecustom resources are created empty to be later handled by the LCM Controller.Creates the
HelmBundlecustom resources for the Helm Controller using data from theKaaSReleaseandClusterReleaseobjects.Creates service accounts for these custom resources.
Creates a scope in Identity and access management (IAM) for a user access to a MOSK cluster.
Provisions nodes for a MOSK cluster.
Installs and enables LCM Agent using the
cloud-initscript.Installs Helm Controller as a Helm v3 chart.
The following diagram illustrates the bare metal provider data flow:
Release Controller
The MOSK Release Controller is responsible for the following functionality:
Monitor and control the
KaaSReleaseandClusterReleaseobjects present in a management cluster. If any release object is used in a cluster, the Release Controller prevents the deletion of such an object.Sync the
KaaSReleaseandClusterReleaseobjects published at https://binary.mirantis.com/releases/ with an existing management cluster.Trigger the managementc cluster auto-update procedure if a new
KaaSReleaseobject is found:Search for MOSK clusters with old Cluster releases that are not supported by a new
KaaSRelease. If any are detected, abort the auto-update and display the corresponding note about an old Cluster release in the MOSK management console. In this case, a user must update all MOSK clusters to the Cluster releases supported by a newKaaSReleasefor the auto-update to be retriggered by the Release Controller.Trigger the
KaaSReleaseupdate of all components in the management cluster. The update itself is processed by the bare metal provider.Trigger the
ClusterReleaseupdate of the management cluster to the Cluster release version that is indicated in the updatedKaaSReleaseversion. TheLCMClustercomponents, such as MKE, are updated before theHelmBundlecomponents, such as StackLight or Ceph.Once the management cluster is updated, an option to update managed clusters becomes available in the MOSK management console. During a managed cluster update, all cluster components including Kubernetes are automatically updated to newer versions if available. The
LCMClustercomponents, such as MKE, are updated before theHelmBundlecomponents, such as StackLight or Ceph.
The Operator can delay the automatic update procedure for a limited amount of time or schedule update to run at desired hours or weekdays. For details, see Schedule Mirantis Container Cloud updates.
MOSK remains operational during the management cluster update. MOSK clusters are not affected during this update. For the list of components that are updated, see the Release artifacts section for the management cluster of the corresponding major release in Release Notes.
When Mirantis announces support of the newest versions of Mirantis Container Runtime (MCR) and Mirantis Kubernetes Engine (MKE), MOSK automatically upgrades these components as well. For the maintenance window best practices before upgrade of these components, see MKE Documentation.
Management console
MOSK management console is mainly designed to create and update MOSK clusters as well as add or remove machines to or from an existing cluster.
You can use the management console to obtain the management cluster details including endpoints, release version, and so on. The management cluster update occurs automatically with a new release change log available through the management console.
The management console is a JavaScript application that is based on the React
framework. The management console is designed to work on a client side only.
Therefore, it does not require a special backend. It interacts with the
Kubernetes and Keycloak APIs directly. The management console uses a Keycloak
token to interact with the management API and download kubeconfig for
management and MOSK clusters.
The management console uses NGINX that runs on a management cluster and handles the management console static files. NGINX proxies the Kubernetes and Keycloak APIs for the management console.
Identity and access management
Identity and access management (IAM) provides a central point of users and permissions management of a MOSK cluster resources in a granular and unified manner. Also, IAM provides infrastructure for single sign-on user experience across all MOSK web portals.
IAM for MOSK consists of the following components:
- Keycloak
Provides the OpenID Connect endpoint
Integrates with an external identity provider (IdP), for example, existing LDAP or Google Open Authorization (OAuth)
Stores roles mapping for users
- IAM Controller
Provides IAM API with data about MOSK projects
Handles all role-based access control (RBAC) components in Kubernetes API
- IAM API
Provides an abstraction API for creating user scopes and roles
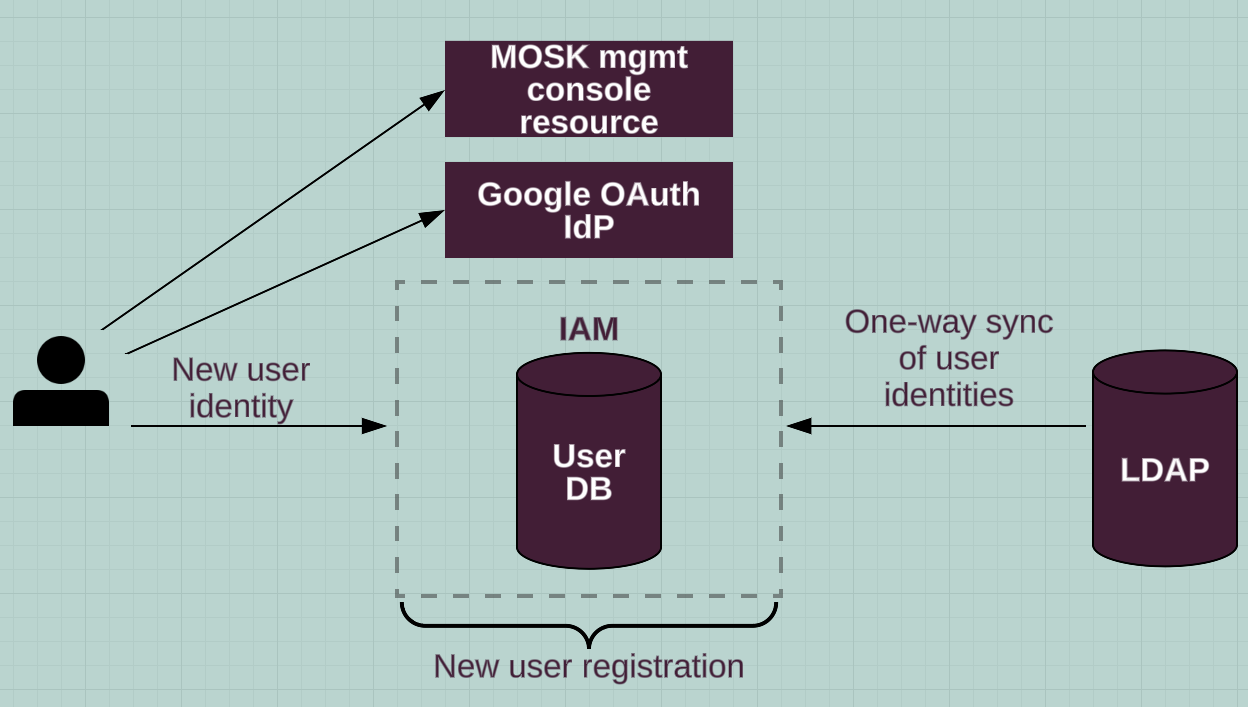
External identity provider integration
To be consistent and keep the integrity of a user database and user permissions, in MOSK, IAM stores the user identity information internally. However in real deployments, the identity provider usually already exists.
Out of the box, in MOSK, IAM supports integration with LDAP and Google Open Authorization (OAuth). If LDAP is configured as an external identity provider, IAM performs one-way synchronization by mapping attributes according to configuration.
In case of the Google Open Authorization (OAuth) integration, the user is automatically registered and their credentials are stored in the internal database according to the user template configuration. The Google OAuth registration workflow is as follows:
The user requests a MOSK management console resource.
The user is redirected to the IAM login page and logs in using the Log in with Google account option.
IAM creates a new user with the default access rights that are defined in the user template configuration.
The user can access the MOSK management console resource.
The following diagram illustrates the external IdP integration to IAM:
You can configure simultaneous integration with both external IdPs with the user identity matching feature enabled.
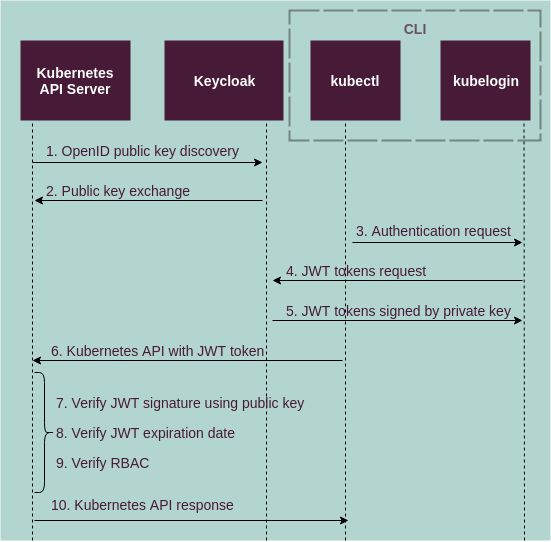
Authentication and authorization
Mirantis IAM uses the OpenID Connect (OIDC) protocol for handling authentication.
Mirantis IAM performs as an OpenID Connect (OIDC) provider, it issues a token and exposes discovery endpoints.
The credentials can be handled by IAM itself or delegated to an external identity provider (IdP).
The issued JSON Web Token (JWT) is sufficient to perform operations across MOSK according to the scope and role defined in it. Mirantis recommends using asymmetric cryptography for token signing (RS256) to minimize the dependency between IAM and managed components.
When MOSK calls Mirantis Kubernetes Engine (MKE), the user in Keycloak is created automatically with a JWT issued by Keycloak on behalf of the end user. MKE, in its turn, verifies whether the JWT is issued by Keycloak. If the user retrieved from the token does not exist in the MKE database, the user is automatically created in the MKE database based on the information from the token.
The authorization implementation is out of scope of IAM in MOSK. This functionality is delegated to the component level. IAM interacts with a MOSK component using the OIDC token content that is processed by a component itself and required authorization is enforced. Such an approach enables you to have any underlying authorization that is not dependent on IAM and still to provide a unified user experience across all MOSK components.
The following diagram illustrates the Kubernetes CLI authentication flow. The authentication flow for Helm and other Kubernetes-oriented CLI utilities is identical to the Kubernetes CLI flow, but JSON Web Tokens (JWT) must be pre-provisioned.
See also
Cloud services
Each section below is dedicated to a particular service provided by MOSK. They contain configuration details and usage samples of supported capabilities provided through the custom resources.
Core cloud services:
Compute service
Mirantis OpenStack for Kubernetes (MOSK) provides instances management capability through the Compute service (OpenStack Nova). The Compute service interacts with other OpenStack components of an OpenStack environment to provide life-cycle management of the virtual machine instances.
Resource oversubscription
The Compute service (OpenStack Nova) enables you to spawn instances that can collectively consume more resources than what is physically available on a compute node through resource oversubscription, also known as overcommit or allocation ratio.
Resources available for oversubscription on a compute node include the number of CPUs, amount of RAM, and amount of available disk space. When making a scheduling decision, the scheduler of the Compute service takes into account the actual amount of resources multiplied by the allocation ratio. Thereby, the service allocates resources based on the assumption that not all instances will be using their full allocation of resources at the same time.
Oversubscription enables you to increase the density of workloads and compute resource utilization and, thus, achieve better Return on Investment (ROI) on compute hardware. In addition, oversubscription can also help avoid the need to create too many fine-grained flavors, which is commonly known as flavor explosion.
Available since MOSK 23.1
There are two ways to control the oversubscription values for compute nodes:
The legacy approach entails utilizing the
{cpu,disk,ram}_allocation_ratioconfiguration options offered by the Compute service. A drawback of this method is that restarting the Compute service is mandatory to apply the new configuration. This introduces the risk of possible interruptions of cloud user operations, for example, instance build failures.The modern and recommended approach, adopted in MOSK 23.1, involves using the
initial_{cpu,disk,ram}_allocation_ratioconfiguration options, which are employed exclusively during the initial provisioning of a compute node. This may occur during the initial deployment of the cluster or when new compute nodes are added subsequently. Any further alterations can be performed dynamically using the OpenStack Placement service API without necessitating the restart of the service.
There is no definitive method for selecting optimal oversubscription values. As a cloud operator, you should continuously monitor your workloads, ideally have a comprehensive understanding of their nature, and experimentally determine the maximum values that do not impact performance. This approach ensures maximum workload density and cloud resource utilization.
To configure the initial compute resource oversubscription in
MOSK, specify the spec:features:nova:allocation_ratios
parameter in the OpenStackDeployment custom resource as explained in the
table below.
Parameter |
|
|---|---|
Configuration |
Configure initial oversubscription of CPU, disk space, and RAM resources on compute nodes. By default, the following values are applied:
Note In MOSK 22.5 and earlier, the effective
default value of RAM allocation ratio is Warning Mirantis strongly advises against oversubscribing RAM, by any amount. See Preventing resource overconsumption for details. Changing the resource oversubscription configuration through the
|
Usage |
Configuration example: kind: OpenStackDeployment
spec:
features:
nova:
allocation_ratios:
cpu: 8
disk: 1.6
ram: 1.0
Configuration example of setting different oversubscription values for specific nodes: spec:
nodes:
compute-type::hi-perf:
features:
nova:
allocation_ratios:
cpu: 2.0
disk: 1.0
In the example configuration above, the compute nodes labeled with
|
When using oversubscription, it is important to conduct thorough cloud management and monitoring to avoid system overloading and performance degradation. If many or all instances on a compute node start using all allocated resources at once and, thereby, overconsume physical resources, failure scenarios depend on the resource being exhausted.
Affected resource |
Symptoms |
|---|---|
CPU |
Workloads are getting slower as they actively compete for physical CPU usage. A useful indicator is the steal time as reported inside the workload, which is a percentage of time the operating system in the workload is waiting for actual physical CPU core availability to run instructions. To verify the steal time in the Linux-based workload, use the top command: top -bn1 | head | grep st$ | awk -F ',' '{print $NF}'
Generally, steal times of >10 for 20-30 minutes are considered alarming. |
RAM |
Operating system on the compute node starts to aggressively use physical swap space, which significantly slows the workloads down. Sometimes, when the swap is also exhausted, the operating system of a compute node can outright OOM kill most offending processes, which can cause major disruptions to workloads or a compute node itself. Warning While it may seem like a good idea to make the most of available resources, oversubscribing RAM can lead to various issues and is generally not recommended due to potential performance degradation, reduced stability, and security risks for the workloads. Mirantis strongly advises against oversubscribing RAM, by any amount. |
Disk space |
Depends on the physical layout of storage. Virtual root and ephemeral storage devices that are hosted on a compute node itself are put in the read-only mode negatively affecting workloads. Additionally, the file system used by the operating system on a compute node may become read-only too blocking the compute node operability. See also |
There are workload types that are not suitable for running in an oversubscribed environment, especially those with high performance, latency-sensitive, or real-time requirements. Such workloads are better suited for compute nodes with dedicated CPUs, ensuring that only processes of a single instance run on each CPU core.
Virtual CPU
MOSK provides the capability to configure virtual CPU types
for OpenStack instances through the OpenStackDeployment custom resource.
This feature enables cloud user to tailor performance and resource allocation
within their OpenStack environment to meet specific workload demands
effectively.
Parameter |
|
|---|---|
Usage |
Configures the type of virtual CPU that Nova will use when creating instances. The list of supported CPU models include |
The host-model CPU model (default) mimics the host CPU and provides for
decent performance, good security, and moderate compatibility with live
migrations.
With this mode, libvirt finds an available predefined CPU model that best matches the host CPU, and then explicitly adds the missing CPU feature flags to closely match the host CPU features. To mitigate known security flaws, libvirt automatically adds critical CPU flags, supported by installed libvirt, QEMU, kernel, and CPU microcode versions.
This is a safe choice if your OpenStack compute node CPUs are of the same generation. If your OpenStack compute node CPUs are sufficiently different, for example, span multiple CPU generations, Mirantis strongly recommends setting explicit CPU models supported by all of your OpenStack compute node CPUs or organizing your OpenStack compute nodes into host aggregates and availability zones that have largely identical CPUs.
Note
The host-model model does not guarantee two-way live migrations
between nodes.
When migrating instances, the libvirt domain XML is first copied as is to the destination OpenStack compute node. Once the instance is hard rebooted or shut down and started again, the domain XML will be re-generated. If versions of libvirt, kernel, CPU microcode, or BIOS firmware differ from what they were on the source compute node the instance was started before, libvirt may pick up additional CPU feature flags, making it impossible to live-migrate back to the original compute node.
The host-passthrough CPU model provides maximum performance, especially
when nested virtualization is required or if live migration support is not
a concern for workloads. Live migration requires exactly the same CPU
on all OpenStack compute nodes, including the CPU microcode and kernel
versions. Therefore, for live migrations support, organize your compute
nodes into host aggregates and availability zones. For workload migration
between non-identical OpenStack compute nodes, contact Mirantis support.
For example, to set the host-passthrough CPU model for all OpenStack
compute nodes:
spec:
features:
nova:
vcpu_type: host-passthrough
MOSK enables you to specify a comma-separated list of exact QEMU CPU models to create and emulate. Specify the common and less advanced CPU models first. All explicit CPU models provided must be compatible with the OpenStack compute node CPUs.
To specify an exact CPU model, review the available CPU models and their
features. List and inspect the /usr/share/libvirt/cpu_map/*.xml files in
the libvirt containers of pods of the libvirt DeamonSet or multiple
DaemonSets if you are using node-specific settings.
To review the available CPU models
Identify the available libvirt DaemonSets:
kubectl -n openstack get ds -l application=libvirt --show-labels
Example of system response:
NAME DESIRED CURRENT READY UP-TO-DATE AVAILABLE NODE SELECTOR AGE LABELS libvirt-libvirt-default 2 2 2 2 2 openstack-compute-node=enabled 34d app.kubernetes.io/managed-by=Helm,application=libvirt,component=libvirt,release_group=openstack-libvirt
Identify the pods of libvirt DaemonSets:
kubectl -n openstack get po -l application=libvirt,release_group=openstack-libvirt
Example of system response:
NAME READY STATUS RESTARTS AGE libvirt-libvirt-default-5zs8m 2/2 Running 0 8d libvirt-libvirt-default-vt8wd 2/2 Running 0 3d14h
List and review the available CPU model definition files. For example:
kubectl -n openstack exec -ti libvirt-libvirt-default-5zs8m -c libvirt -- ls /usr/share/libvirt/cpu_map/*.xml
List and review the content of all CPU model definition files. For example:
kubectl -n openstack exec -ti libvirt-libvirt-default-5zs8m -c libvirt -- bash -c 'for f in `ls /usr/share/libvirt/cpu_map/*.xml`; do echo $f; cat $f; done'
For example, for nodes that are labeled with processor=amd-epyc, set
a custom EPYC CPU model:
spec:
nodes:
processor::amd-epyc:
features:
nova:
vcpu_type: EPYC
Instance migration
OpenStack supports the following types of instance migrations:
- Cold migration (also referred to simply as migration)
The process involves shutting down the instance, copying its definition and disk, if necessary, to another host, and then starting the instance again on the new host.
This method disrupts the workload running inside the instance but allows for more reliability and works for most types of instances and consumed resources.
- Live migration
The process involves copying the instance definition, memory, and disk, if necessary, to another host while the instance continues running, without shutting it down. The instance then momentarily switches to run on the new host.
While generally less disruptive to workloads, this method is less reliable and imposes more restrictions on the instance and target host properties to succeed.
As a cloud operator, you can configure live migration through the
OpenStackDeployment custom resource. The following table provides
the details on available configuration.
Parameter |
Usage |
|---|---|
|
Specifies the name of the NIC device on the actual host that will be used by Nova for the live migration of instances. Mirantis recommends setting up your Kubernetes hosts in such a way that networking is configured identically on all of them, and names of the interfaces serving the same purpose or plugged into the same network are consistent across all physical nodes. Also, set the option to
|
|
Available since MOSK 23.2.
If set to spec:
features:
nova:
libvirt:
tls:
enabled: true
See also Encryption of live migration data. |
Available since MOSK 24.3
MOSK provides the following distinct sets of policies that govern access to cold and live migrations:
os_compute_api:os-migrate-server:migrateandos_compute_api:os-migrate-server:migrate_livedefine the ability to initiate migrations without specifying the target host. In this case, the OpenStack Compute scheduler selects the best suited target host automatically.os_compute_api:os-migrate-server:migrate:hostandos_compute_api:os-migrate-server:migrate_live:hostdefine the ability to initiate migration together with specifying the target host. Depending on the API microversion used to start the migration, the host is either validated by the scheduler (recommended) or forced regardless of other considerations. The latter option is not recommended as it may lead to inconsistencies in the internal state of the Compute service.
Since MOSK 24.3, the default policies for migrations without
the target host specification is set to rule: project_member_or_admin.
This means that migration is available to both cloud administrators and
project users with the member role.
The migration to a specific host requires administrative privileges.
If the default policy does not suit your deployment, you can require
administrative access for all instance migrations by setting these policy
values to rule:context_is_admin, or any other value appropriate for your
use case.
If you use the default policies and want to revert to the old defaults, ensure
that the following snippet is present in your OpenStackDeployment custom
resource:
kind: OpenStackDeployment
spec:
features:
policies:
nova:
os_compute_api:os-migrate-server:migrate: rule:context_is_admin
os_compute_api:os-migrate-server:migrate_live: rule:context_is_admin
Image storage backend
Parameter |
|
|---|---|
Usage |
Defines the type of storage for Nova to use on the compute hosts for the images that back up the instances. The list of supported options include:
|
Remote console access to virtual machines
MOSK provides a number of different methods to interact
with OpenStack virtual machines including VNC (default) and SPICE remote
consoles. This section outlines how you can configure these different
console services through the OpenStackDeployment custom resource.
The noVNC client provides remote control or remote desktop access to guest virtual machines through the Virtual Network Computing (VNC) system. The MOSK Compute service users can access their instances using the noVNC clients through the noVNC proxy server.
The VNC remote console is enabled by default in MOSK.
To disable VNC remote console through the OpenStackDeployment custom
resource, set spec:features:nova:console:novnc to false:
spec:
features:
nova:
console:
novnc:
enabled: false
Available since MOSK 23.1
MOSK uses TLS to secure public-facing VNC access on networks between a noVNC client and noVNC proxy server.
The features:nova:console:novnc:tls:enabled ensures that the data
transferred between the instance and the noVNC proxy server is encrypted.
Both servers use the VeNCrypt authentication scheme for the data
encryption.
To enable the encrypted data transfer for noVNC, use the following
structure in the OpenStackDeployment custom resource:
kind: OpenStackDeployment
spec:
features:
nova:
console:
novnc:
tls:
enabled: true
Available since MOSK 24.1 TechPreview
The VNC protocol has its limitations, such as the lack of support for multiple monitors, bi-directional audio, reliable cut-and-paste, video streaming, and others. The SPICE protocol aims to overcome these limitations and deliver a robust remote desktop support.
The SPICE remote console is disabled by default in MOSK.
To enable SPICE remote console through the OpenStackDeployment custom
resource, set spec:features:nova:console:spice:enabled to true:
spec:
features:
nova:
console:
spice:
enabled: true
GPU virtualization
Available since MOSK 24.1 TechPreview
MOSK provides GPU virtualization capabilities to its users through the NVIDIA vGPU and Multi-Instance GPU (MIG) technologies.
GPU virtualization is a capability offered by modern datacenter-grade GPUs, enabling the partitioning of a single physical GPU into smaller virtual devices, that can then be attached to individual virtual machines.
In contrast to the Peripheral Component Interconnect (PCI) passthrough feature, leveraging the GPU virtualization enables concurrent utilization of the same physical GPU device by multiple virtual machines. This enhances hardware utilization and fosters a more elastic consumption of expensive hardware resources.
When using GPU virtualization, the physical device and its drivers manage computing resource partitioning and isolation.
The use case for GPU virtualization aligns with any application necessitating or benefiting from accelerated parallel floating-point calculations, such as graphic-intensive desktop workloads, for example, 3D modeling and rendering, as well as computationally intensive tasks, for example, artifial intelligence, specifically, machine learning training and classification.
At its core, GPU virtualization operates on base of the single-root input/output virtualization framework (SR-IOV), which is already widely used by datacenter-grade network adapters and mediated devices Linux kernel framework.
Typically, using GPU virtualization requires the installation of specific physical GPU drivers on the host system. For detailed instructions on obtaining and installing the required drivers, refer to official documentation from the vendor of your GPU.
For the latest family of NVIDIA GPUs under NVIDIA AI Enterprise, start with NVIDIA AI Enterprise documentation.
You can automate the configuration of drivers by adding a custom post-install
script to the BareMetalHostProfile object of your
MOSK cluster. See Configure GPU virtualization for details.
Certain NVIDIA GPUs, for example, Ampere GPU architecture and later, support GPU virtualization in two modes: time sliced (vGPU) or Multi-Instance GPU (MIG). Older architectures support only the time-sliced mode.
The distinction between these modes lies in resource isolation, dedicated performance levels, and partitioning flexibility.
Typically, there is no fixed rule dictating which mode should be used, as it depends on the intended workloads for the virtual GPUs and the level of experience and assurances the cloud operator aims to offer users. Below, there is a brief overview of the differences between these two modes.
In time-sliced vGPU mode, each virtual GPU is allocated dedicated slices of the physical GPU memory while sharing the physical GPU engines. Only one vGPU operates at a time, with full access to all physical GPU engines. The resource scheduler within the physical GPU regulates the timing of each vGPU execution, ensuring fair allocation of resources.
Therefore, this setup may encounter issues with noisy neighbors, where the performance of one vGPU is affected by resource contention from others. However, when not all available vGPU slots are occupied, the active ones can fully utilize the power of its physical GPU.
Advantages:
Potential ability to fully utilize the compute power of physical GPU, even if not all possible vGPUs have yet been created on that physical GPU.
Easier configuration.
Disadvantages:
Only a single vGPU type (size of the vGPU) can be created on any given physical GPU. The cloud operator must decide beforehand what type of vGPU each physical GPU will be providing.
Less strict resource isolation. Noisy neighbors and unpredictable level of performance for every single guest vGPU.
In Multi-Instance GPUs (MIG) mode, each virtual GPU is allocated dedicated physical GPU engines, exclusively utilized by that specific virtual GPU. Virtual GPUs run in parallel, each on its own engines according to their type.
Advantages:
Ability to partition a single physical GPU into various types of virtual GPUs. This approach provides cloud operators with enhanced flexibility in determining the available vGPU types for cloud users. However, the cloud operator has to decide beforehand what types of virtual GPU each physical GPU will be providing and partition each GPU accordingly.
Better resource isolation and guaranteed resource access with predictable performance levels for every virtual GPU.
Disadvantages:
Under-utilization of physical GPU when not all possible virtual GPU slots are occupied.
Comparatively complicated configuration, especially in heterogeneous hardware environments.
Note
Some of these restrictions may be lifted in future releases of MOSK.
Cloud users will face the following limitations when working with GPU virtualization in MOSK:
Inability to create several instances with virtual GPUs in one request if there is no physical GPU available that can fit all of them at once. For NVIDIA MIG, this effectively means that you cannot create several instances with virtual GPUs in one request.
Inability to create an instance with several virtual GPUs.
Inability to attach virtual GPU to or detach virtual GPU from a running instance.
Inability to live-migrate instances with virtual GPU attached.
Cloud operator will face the following limitations when configuring GPU virtualization in MOSK:
Partition of physical GPUs to virtual GPUs is static and not on-demand. You need to decide beforehand what types of virtual GPUs each physical GPU will get partinioned into. Changing of the partitioning requires removing all instances using virtual GPUs from the compute node before initiating the repartitioning process.
Repartitioning may require additional manual steps to eliminate orphan resource providers in the placement service, and thus, avoid resource over-reporting and instance scheduling problems.
Configuration of multiple virtual GPU types per node may be very verbose since configuration depends on particular PCI addresses of physical GPUs on each node.
See also
Learn more
Graceful instance shutdown
Available since MOSK 24.3
Management of compute node reboots is an important Day 2 operation. Before shutting down a host, guest instances must either be migrated to other compute nodes or gracefully powered off. This ensures the integrity of disk filesystems and prevents damage to running applications.
MOSK provides the capability to automatically power off the instances during the compute node shutdown or reboot through the ACPI power event.
Graceful instance shutdown is managed using the systemd inhibit
tool. When the nova-compute service starts, it creates locks. For example:
systemd-inhibit --list
Example system response:
WHO UID USER PID COMM WHAT WHY MODE
Nova Shutdown Handler 0 root 28927 python3 shutdown Handle events on shutdown notification delay
The process runs in the nova-compute-inhibit-lock container within
the nova-compute pod. It intercepts systemd power event and starts
graceful guest shutdown. When all guest instances are powered off,
the inhibit lock is released.
To initiate a proper shutdown, use the following commands: systemctl shutdown and systemctl reboot.
Networking service
Mirantis OpenStack for Kubernetes (MOSK) Networking service (OpenStack Neutron) provides cloud applications with Connectivity-as-a-Service enabling instances to communicate with each other and the outside world.
The API provided by the service abstracts all the nuances of implementing a virtual network infrastructure on top of your own physical network infrastructure. The service allows cloud users to create advanced virtual network topologies that may include load balancing, virtual private networking, traffic filtering, and other services.
MOSK Networking service supports Open vSwitch and Tungsten Fabric SDN technologies as backends.
Backends
MOSK offers various networking backends. Selecting the appropriate backend option for the Networking service is essential for building a robust and efficient cloud networking infrastructure. Whether you choose Open vSwitch (OVS), Open Virtual Network (OVN), or Tungsten Fabric, understanding their features, capabilities, and suitability for your specific use case is crucial for achieving optimal performance and scalability in your OpenStack environment.
Refer to Networking backend configuration for the configuration details.
Capability |
Tungsten Fabric |
Open vSwitch (OVS) |
Open Virtual Network (OVN) |
|---|---|---|---|
Logical routers |
|||
Static routes |
|||
SNAT |
|||
Floating IPs |
|||
External IPs on VMs |
|||
Per-tenant floating networks and SNAT pools |
|||
IPv6 |
|||
Bare Metal as a Service (Ironic) |
|||
DNS as a Service |
Designate and Tungsten Fabric vDNS |
Designate |
Designate |
Firewalling |
Security groups and application policies |
OVS firewall |
OVS firewall |
Load balancing |
Tungsten Fabric built in HAProxy, OpenStack Octavia/Amphora |
OpenStack Octavia/Amphora |
OpenStack Octavia/Amphora, Octavia/OVN native load balancer |
BGP VPNs |
Unsupported |
||
VPN as a Service (IPsec) |
TechPreview |
TechPreview |
|
Data plane acceleration |
SR-IOV |
SR-IOV |
SR-IOV |
QoS |
|||
Network equipment management |
Netconf/OVSDB |
Neutron ML2 plugins/networking-generic-switch |
Neutron ML2 plugins/networking-generic-switch |
East-West traffic encryption |
Open vSwitch is a production-quality, multilayer virtual switch licensed under the open source Apache 2.0 license. It is designed to enable massive network automation through programmatic extension, while supporting standard management interfaces and protocols.
Open vSwitch is suitable for general-purpose networking requirements in OpenStack deployments. It provides flexibility and scalability for various network topologies.
Key characteristics of Open vSwitch:
Depends on RabbitMQ and RPC communication
Uses keepalived to set up HA routers
Uses namespace and Veth routing to provide its capabilities
Locates metadata in router or DHCP namespaces
Centralizes the DHCP service, which is running in a separate namespace
Available since MOSK 25.1 as GA (Caracal) Available since MOSK 24.2 as TechPreview (Antelope)
Open Virtual Network is a solution for Open vSwitch that provides native virtual networking support for Open vSwitch environments. It provides enhanced scalability and performance compared to traditional Open vSwitch deployments.
Key characteristics of Open Virtual Network:
Uses the OVSDB protocol for commmunication
Is distributed by design
Handles all traffic with OpenFlow
Runs metadata on all nodes
Provides DHCP through local Open vSwitch instances
Caution
There are numerous limitations related to VLAN/Flat tenant networks in Open Virtual Network with distributed floating IPs for bare metal SR-IOV and Octavia VIP ports. For more information about Open Virtual Network limitations, see relevant upstream documentation.
OpenStack official documentation
Tungsten Fabric is an open-source SDN based on Juniper Contrail. Its design allows for simplified creation and management of virtual networks in cloud environments. Tungsten Fabric supports advanced networking scenarious, such as BGP integration and scalability.
Key characteristics of Tungsten Fabric:
Uses well scalable protocols to set up tunnels, such as BGP/MPLS
Provides out-of-the-box BGPaaS/Service chaining capabilities
General configuration
MOSK offers the Networking service as a part of its
core setup. You can configure the service through the
spec:features:neutron section of the OpenStackDeployment custom
resource.
Parameter |
|
|---|---|
Usage |
Defines the networking backend. The list of supported options includes:
Refer to Backends to learn more about the networking backends supported by MOSK. |
Parameter |
|
|---|---|
Usage |
Defines the name of the NIC device on the actual host that will be used for Neutron. Mirantis recommends setting up your Kubernetes hosts in such a way that networking is configured identically on all of them, and names of the interfaces serving the same purpose or plugged into the same network are consistent across all physical nodes. |
Parameter |
|
|---|---|
Usage |
Defines the list of IPs of DNS servers that are accessible from virtual networks. Used as default DNS servers for VMs. |
Parameter |
|
|---|---|
Usage |
Contains the data structure that defines external (provider) networks on top of which the Neutron networking will be created. |
Parameter |
|
|---|---|
Usage |
If enabled, must contain the data structure defining the floating IP network that will be created for Neutron to provide external access to your Nova instances. |
BGP dynamic routing
Available since MOSK 23.2 TechPreview
The BGP dynamic routing extension to the Networking service (OpenStack Neutron) is particularly useful for the MOSK clouds where private networks managed by cloud users need to be transparently integrated into the networking of the data center.
For example, the BGP dynamic routing is a common requirement for IPv6-enabled environments, where clients need to seamlessly access cloud workloads using dedicated IP addresses with no address translation involved in between the cloud and the external network.
BGP dynamic routing changes the way self-service (private) network prefixes are communicated to BGP-compatible physical network devices, such as routers, present in the data center. It eliminates the traditional reliance on static routes or ICMP-based advertising by enabling the direct passing of private network prefix information to router devices.
Note
To effectively use the BGP dynamic routing feature, Mirantis recommends acquiring good understanding of OpenStack address scopes and how they work.
The components of the OpenStack BGP dynamic routing are:
- Service plugin
An extension to the Networking service (OpenStack Neutron) that implements the logic for BGP-related entities orhestration and provides the cloud user-facing API. A cloud administrator creates and configures a BGP speaker using the CLI or API and manually schedules it to one or more hosts running the agent.
- Agent
Manages BGP peering sessions. In MOSK, the BGP agent runs on nodes labeled with
openstack-gateway=enabled.
Prefix advertisement depends on the binding of external networks to a BGP speaker and the address scope of external and internal IP address ranges or subnets.
BGP dynamic routing advertises prefixes for self-service networks and host routes for floating IP addresses.
To successfully advertise a self-service network, you need to fulfill the following conditions:
External and self-service networks reside in the same address scope.
The router contains an interface on the self-service subnet and a gateway on the external network.
The BGP speaker associates with the external network that provides a gateway on the router.
The BGP speaker has the
advertise_tenant_networksattribute set toTrue.
To successfully advertise a floating IP address, you need to fulfill the following conditions:
The router with the floating IP address binding contains a gateway on an external network with the BGP speaker association.
The BGP speaker has the
advertise_floating_ip_host_routesattribute set totrue.
The diagram below is an example of the BGP dynamic routing in the non-DVR mode with self-service networks and the following advertisements:
B>* 192.168.0.0/25 [200/0]through10.11.12.1B>* 192.168.0.128/25 [200/0]through10.11.12.2B>* 10.11.12.234/32 [200/0]through10.11.12.1
For both floating IP and IPv4 fixed IP addresses, the BGP speaker advertises the gateway of the floating IP agent on the corresponding compute node as the next-hop IP address. When using IPv6 fixed IP addresses, the BGP speaker advertises the DVR SNAT node as the next-hop IP address.
The diagram below is an example of the BGP dynamic routing in the DVR mode with self-service networks and the following advertisements:
B>* 192.168.0.0/25 [200/0]through10.11.12.1B>* 192.168.0.128/25 [200/0]through10.11.12.2B>* 10.11.12.234/32 [200/0]through10.11.12.12
DVR incompatibility with ARP announcements and VRRP
Due to the known issue #1774459 in the upstream implementation, Mirantis does not recommend using Distributed Virtual Routing (DVR) routers in the same networks as load balancers or other applications that utilize the Virtual Router Redundancy Protocol (VRRP) such as Keepalived. The issue prevents the DVR functionality from working correctly with network protocols that rely on the Address Resolution Protocol (ARP) announcements such as VRRP.
The issue occurs when updating permanent ARP entries for
allowed_address_pair IP addresses in DVR routers because DVR performs
the ARP table update through the control plane and does not allow any
ARP entry to leave the node to prevent the router IP/MAC from
contaminating the network.
This results in various network failover mechanisms not functioning in virtual networks that have a distributed virtual router plugged in. For instance, the default backend for MOSK Load Balancing service, represented by OpenStack Octavia with the OpenStack Amphora backend when deployed in the HA mode in a DVR-connected network, is not able to redirect the traffic from a failed active service instance to a standby one without interruption.
Block Storage service
Mirantis OpenStack for Kubernetes (MOSK) provides volume management capability through the Block Storage service (OpenStack Cinder).
Backup configuration
MOSK provides support for the following backends for the Block Storage service (OpenStack Cinder):
Backend |
Support status |
|---|---|
Ceph |
Full support, default |
NFS |
|
S3 |
|
In MOSK, Cinder backup is enabled and uses the Ceph back
end for Cinder by default. The backup configuration is stored
in the spec:features:cinder:backup structure in the
OpenStackDeployment custom resource. If necessary, you can disable
the backup feature in Cinder as follows:
kind: OpenStackDeployment
spec:
features:
cinder:
backup:
enabled: false
Using this structure, you can also configure another backup driver supported by MOSK for Cinder as described below. At any given time, only one backend can be enabled.
Available since MOSK 23.2 TechPreview
MOSK supports NFS Unix authentication exclusively.
To use an NFS driver with MOSK, ensure you have
a preconfigured NFS server with an NFS share accessible to a Unix
Cinder user. This user must be the owner of the exported NFS folder,
and the folder must have the permission value set to 775.
All Cinder services run with the same user by default. To obtain the Unix user ID:
kubectl -n openstack get pod -l application=cinder,component=api -o jsonpath='{.items[0].spec.securityContext.runAsUser}'
Note
The NFS server must be accessible through the network from all OpenStack control plane nodes of the cluster.
To enable the NFS storage for Cinder backup, configure the following
structure in the OpenStackDeployment object:
spec:
features:
cinder:
backup:
drivers:
<BACKEND_NAME>:
type: nfs
enabled: true
backup_share: <URL_TO_NFS_SHARE>
You can specify the backup_share parameter in following formats:
hostname:path, ipv4addr:path, or [ipv6addr]:path.
For example: 1.2.3.4:/cinder_backup.
Available since MOSK 23.2 TechPreview
To use an S3 driver with MOSK, ensure you have a preconfigured S3 storage with a user account created for access.
Note
The S3 storage must be accessible through the network from all OpenStack control plane nodes of the cluster.
To enable the S3 storage for Cinder backup:
Create a dedicated secret in Kuberbetes to securely store the credentials required for accessing the S3 storage:
--- apiVersion: v1 kind: Secret metadata: labels: openstack.lcm.mirantis.com/osdpl_secret: "true" name: cinder-backup-s3-hidden namespace: openstack type: Opaque data: access_key: <ACCESS_KEY_FOR_S3_ACCOUNT> secret_key: <ACCESS_KEY_FOR_S3_ACCOUNT>
Configure the following structure in the
OpenStackDeploymentobject:spec: features: cinder: backup: drivers: <BACKEND_NAME>: type: s3 enabled: true endpoint_url: <URL_TO_S3_STORAGE> store_bucket: <S3_BUCKET_NAME> store_access_key: value_from: secret_key_ref: key: access_key name: cinder-backup-s3-hidden store_secret_key: value_from: secret_key_ref: key: secret_key name: cinder-backup-s3-hidden
Volume encryption
TechPreview
The Block Storage service (OpenStack Cinder) supports volume encryption using a key stored in the Key Manager service (OpenStack Barbican). Such configuration uses Linux Unified Key Setup (LUKS) to create an encrypted volume type and attach it to the Compute service (OpenStack Nova) instances. Nova retrieves the asymmetric key from Barbican and stores it on the OpenStack compute node as a libvirt key to encrypt the volume locally or on the backend and only after that transfers it to Cinder.
Note
To create an encrypted volume under a non-admin user, the
creatorrole must be assigned to the user.When planning your cloud, consider that encryption may impact CPU.
Volume configuration
The MOSK Block Storage service (OpenStack Cinder) uses Ceph
as the default backend for Cinder Volume. Also, MOSK enables
its clients to define their own volume backends using the
OpenStackDeployment custom resource. This section provides all the details
required to properly configure a custom Cinder Volume backend as a StatefulSet
or a DaemonSet.
MOSK stores the configuration for the default Ceph backend
in the spec:features:cinder:volume structure in the OpenStackDeployment
custom resource.
To disable the Ceph backend for Cinder Volume, modify the
spec:features:cinder:volume structure as follows:
spec:
features:
cinder:
volume:
enabled: false
services:
block-storage:
cinder:
values:
conf:
DEFAULT:
default_volume_type: <NEW-DEFAULT-VOLUME-TYPE-NAME>
When disabling the Ceph backend for Cinder Volume, you must explicitly specify
the new default_volume_type parameter. Refer to the sections below to learn
how you can configure it.
Before you start deploying your custom Cinder Volume backend, decide on key backend parameters and understand how they affect other services:
Note
Make sure to navigate to the documentation for the specific OpenStack version used to deploy your environment when referring to the official OpenStack documentation.
In addition, you may need to build your own Cinder image as described in Customize OpenStack container images.
Next, review the following key considerations:
Configuration option |
Details |
|---|---|
StatefulSet or DaemonSet |
If the Cinder volume backend you prefer must run on all nodes with a specific label and scale automatically as nodes are added or removed, use a DaemonSet. This type of backend typically requires that its data remains on the same node where its pod is running. A common example of such a backend is the LVM backend. Otherwise, Mirantis recommends using a StatefulSet, which offers more flexibility than a DaemonSet. |
Support for Active/Active High Availability |
If the driver does not support Active/Active High Availability, ensure
that only a single copy of the backend runs and that the When deploying the backend using a StatefulSet, set
|
Support for Multi-Attach |
If the driver supports Multi-Attach, it allows multiple connections to the same volume. This capability is important for certain services, such as Glance. If the driver does not support Multi-Attach, the backend cannot be used for services that require this functionality. |
Support for iSCSI and access to the |
Unsupported since MOSK 25.2
Some drivers require access to the |
Privileged access for the container |
For security reasons, Mirantis recommends running the Cinder Volume
backend container with the minimum required privileges. However,
if the drivers require privileged access, you can enable it for the
StatefulSet by setting the parameter
|
Access to the host network namespace |
If the driver requires access to the host network namespace, or if you
need to ensure that the Cinder Volume backend’s IP address remains
unchanged after pod recreation or restart, set hostNetwork
to
|
Access to the host IPC namespace |
If the driver requires access to the host’s IPC namespace, set hostIPC
to
|
Access to host PID namespace |
If the driver requires access to the host’s PID namespace, set hostPID
to
|
Available since MOSK 24.3 TechPreview
MOSK enables its clients to define volume backends as a StatefulSet.
To configure a custom StatefulSet backend for the MOSK
Block Storage service (OpenStack Cinder), use the
spec:features:cinder:volume:backends structure in the
OpenStackDeployment custom resource:
spec:
features:
cinder:
volume:
backends:
<UNIQUE_BACKEND_NAME>:
enabled: true
type: statefulset
create_volume_type: true
values:
conf:
images:
labels:
pod:
The enabled and create_volume_type parameters are optional. With
create_volume_type set to true (default), the new backend
will be added to the Cinder bootstrap job. Once this job is completed,
the volume type for the custom backend will be created in OpenStack.
The supported value for type is statefulset.
The list of keys you can override in the values.yaml file of the Cinder
chart includes conf, images, labels, and pod.
When you define the custom backend for the Block Storage service, MOSK deploys individual pods for it. These pods have separate Secrets for configuration files and ConfigMaps for scripts.
Example of configuration of a custom StatefulSet backend for Cinder:
The configuration example deploys a StatefulSet for the Cinder
volume backend that uses the NFS driver, running a single replica on node
labeled kubernetes.io/hostname:service-node. Privilege escalation for
the Cinder volume pod is driver-specific.
spec:
features:
cinder:
volume:
enabled: false
backends:
nfs-volume:
type: statefulset
values:
conf:
cinder:
DEFAULT:
cluster: ""
enabled_backends: volumes-nfs
volumes-extra-nfs:
nas_host: 1.2.3.4
nas_share_path: /cinder_volume
nas_secure_file_operations: false
nfs_mount_point_base: /tmp/mountpoints
nfs_snapshot_support: true
volume_backend_name: volumes-nfs
volume_driver: cinder.volume.drivers.nfs.NfsDriver
pod:
replicas:
volume: 1
security_context:
cinder_volume:
container:
cinder_volume:
privileged: true
labels:
volume:
node_selector_key: kubernetes.io/hostname
node_selector_value: service-node
services:
block-storage:
cinder:
values:
conf:
DEFAULT:
default_volume_type: volumes-nfs
TechPreview
MOSK enables its clients to define volume backends as a DaemonSet, LVM in particular.
To configure a custom DaemonSet backend for the MOSK
Block Storage service (OpenStack Cinder), use the spec:nodes structure
in the OpenStackDeployment custom resource:
spec:
nodes:
<node label>:
features:
cinder:
volume:
backends:
<backend name>:
lvm:
<CINDER-LVM-DRIVER-PARAMETERS>
Example of configuration of a custom DaemonSet backend for Cinder:
The configuration example deploys a DaemonSet for the Cinder volume backend
that uses the LVM driver and runs on nodes with the
openstack-compute-node=enabled label:
Caution
For data storage, this backend uses the LVM cinder-vol
group that must be present on nodes before the new backend is applied.
For the procedure on how to deploy an LVM backend, refer to
Enable LVM block storage.
spec:
features:
cinder:
volume:
enabled: false
nodes:
openstack-compute-node::enabled:
features:
cinder:
volume:
backends:
volumes-lvm:
lvm:
volume_group: "cinder-vol"
services:
block-storage:
cinder:
values:
conf:
DEFAULT:
default_volume_type: volumes-lvm
MOSK provides the cinder-service-cleaner CronJob
by default. This CronJob periodically checks whether all Cinder services in
OpenStack are up to date and removes any stale ones.
This CronJob is tested only with backends supported by MOSK.
If cinder-service-cleaner does not work properly with your custom Cinder
volume backend, you can disable it at the OpenStackDeployment service
level in the OpenStackDeployment custom resource:
spec:
services:
block-storage:
cinder:
values:
manifests:
cron_service_cleaner: false
Note
Make sure to navigate to the documentation for the specific OpenStack version used to deploy your environment when referring to the official OpenStack documentation.
Identity service
Mirantis OpenStack for Kubernetes (MOSK) provides authentication, service discovery, and distributed multi-tenant authorization through the OpenStack Identity service, aka Keystone.
Federation
MOSK integrates with Mirantis Container Cloud Identity and Access Management (IAM) subsystem to allow centralized management of users and their permissions across multiple clouds.
The core component of Container Cloud IAM is Keycloak, the open-source identity and access management software. Its primary function is to perform secure authentication of cloud users against its built-in or various external identity databases, such as LDAP directories, OpenID Connect or SAML compatible identity providers.
By default, every MOSK cluster is integrated with the
Keycloak running in the Container Cloud management cluster. The integration
automatically provisions the necessary configuration on the
MOSK and Container Cloud IAM sides, such as the os
client object in Keycloak. However, for the federated users to get proper
permissions after logging in, the cloud operator needs to define the role
mapping rules specific to each MOSK environment.
MOSK enables you to connect to the Keycloak identity
provider through the following structure in the OpenStackDeployment
custom resource:
spec:
features:
keystone:
keycloak:
enabled: true
url: https://keycloak.it.just.works
oidc:
OIDCSSLValidateServer: false
OIDCOAuthSSLValidateServer: false
OIDCScope: "openid email profile groups"
Available since MOSK 24.3 TechPreview
MOSK enables you to connect external identity
provider to Keystone directly through the following structure in the
OpenStackDeployment custom resource:
spec:
features:
keystone:
federations:
openid:
enabled: true
oidc_auth_type: oauth2
providers:
keycloak:
issuer: https://keycloak.it.just.works/auth/realms/iam
mapping:
- local:
- user:
email: '{1}'
name: '{0}'
- domain:
name: Default
groups: '{2}'
remote:
- type: OIDC-iam_username
- type: OIDC-email
- type: OIDC-iam_roles
metadata:
client:
client_id: os
conf:
response_type: id_token
scope: openid email profile
ssl_validate_server: false
provider:
value_from:
from_url:
url: https://keycloak.it.just.works/auth/realms/iam/.well-known/openid-configuration
okta:
description: OKTA provider
enabled: true
issuer: https://dev-68495932.okta.com/oauth2/default
mapping:
- local:
- user:
email: '{1}'
name: '{0}'
- domain:
name: Default
groups: m:os@admin
remote:
- type: OIDC-name
- type: OIDC-email
metadata:
client:
client_id: 0oaixfwyqcAkCbC335d7
client_secret: aKOtnqHwu37ricQJfOD9ShECqj7DY7SVHgh8nm1NwlAhGbQjGqREHencsGagyfmQ
conf: {}
provider:
value_from:
from_url:
url: https://dev-68495932.okta.com/oauth2/default/.well-known/openid-configuration
oauth2:
OAuth2TokenVerify: jwks_uri https://dev-68495932.okta.com/oauth2/default/v1/keys
token_endpoint: https://dev-68495932.okta.com/oauth2/default/v1/token
The oidc_auth_type parameter specifies the Apache module to use:
oauth20 or oauth2. The oauth20 functionality is deprecated
and superseded by a new oauth2 module. You can configure two and more
identity providers only with the oauth2 module.
Regions
A region in MOSK represents a complete OpenStack cluster that has a dedicated control plane and set of API endpoints. It is not uncommon for operators of large clouds to offer their users several OpenStack regions, which differ by their geographical location or purpose. In order to easily navigate in a multi-region environment, cloud users need a way to distinguish clusters by their names.
The region_name parameter of an OpenStackDeployment custom resource
specifies the name of the region that will be configured in all the OpenStack
services comprising the MOSK cluster upon the initial
deployment.
Important
Once the cluster is up and running, the cloud operator cannot set or change the name of the region. Therefore, Mirantis recommends selecting a meaningful name for the new region before the deployment starts. For example, the region name can be based on the name of the data center the cluster is located in.
Usage sample:
apiVersion: lcm.mirantis.com/v1alpha1
kind: OpenStackDeployment
metadata:
name: openstack-cluster
namespace: openstack
spec:
region_name: <your-region-name>
Application credentials
Application credentials is a mechanism in the MOSK Identity service that enables application automation tools, such as shell scripts, Terraform modules, Python programs, and others, to securely perform various actions in the cloud API in order to deploy and manage application components.
Application credentials is a modern alternative to the legacy approach where every application owner had to request several technical user accounts to ensure their tools could authenticate in the cloud.
For the details on how to create and authenticate with application credentials, refer to Manage application credentials.
By default, cloud users logging in to the cloud through the Mirantis Container Cloud IAM or any external identity provider cannot use the application credentials mechanism.
An application credential is heavily tied to the account of the cloud user owning it. An application automation tool that is a consumer of the credential acts on behalf of the human user who created the credential. Each action that the application automation tool performs gets authorized against the permissions, including roles and groups, the user currently has.
The source of truth about a federated user permissions is the identity provider. This information gets temporary transferred to the cloud’s Identity service inside a token once the user authenticates. By default, if such a user creates an application credential and passes it to the automation tool, there is no data to validate the tool’s action on the user’s behalf.
However, a cloud operator can configure the authorization_ttl parameter
for an identity provider object to enable caching of its users authorization
data. The parameter defines for how long in minutes the information about
user permissions is preserved in the database after the user successfully
logs in to the cloud.
Warning
Authorization data caching has security implications. In case a federated user account is revoked or his permissions change in the identity provider, the cloud Identity service will still allow performing actions on the user behalf until the cached data expires or the user re-authenticates in the cloud.
To set authorization_ttl to, for example, 60 minutes for the keycloak
identity provider in Keystone:
Log in to the
keystone-clientPod:kubectl -n openstack exec $(kubectl -n openstack get po -l application=keystone,component=client -oname) -ti -c keystone-client -- bash
Inside the Pod, run the following command:
openstack identity provider set keycloak --authorization-ttl 60
Domain-specific configuration
Parameter |
|
|---|---|
Usage |
Defines the domain-specific configuration and is useful for integration
with LDAP. An example of OsDpl with LDAP integration, which will create
a separate spec:
features:
keystone:
domain_specific_configuration:
enabled: true
domains:
domain.with.ldap:
enabled: true
config:
assignment:
driver: keystone.assignment.backends.sql.Assignment
identity:
driver: ldap
ldap:
chase_referrals: false
group_desc_attribute: description
group_id_attribute: cn
group_member_attribute: member
group_name_attribute: ou
group_objectclass: groupOfNames
page_size: 0
password: XXXXXXXXX
query_scope: sub
suffix: dc=mydomain,dc=com
url: ldap://ldap01.mydomain.com,ldap://ldap02.mydomain.com
user: uid=openstack,ou=people,o=mydomain,dc=com
user_enabled_attribute: enabled
user_enabled_default: false
user_enabled_invert: true
user_enabled_mask: 0
user_id_attribute: uid
user_mail_attribute: mail
user_name_attribute: uid
user_objectclass: inetOrgPerson
|
Image service
Mirantis OpenStack for Kubernetes (MOSK) provides the image management capability through the OpenStack Image service, aka Glance.
The Image service enables you to discover, register, and retrieve virtual machine images. Using the Glance API, you can query virtual machine image metadata and retrieve actual images.
MOSK deployment profiles include the Image service in the
core set of services. You can configure the Image service through the
spec:features definition in the OpenStackDeployment custom resource.
Image signature verification
Deprecated since MOSK 25.2
MOSK can automatically verify the cryptographic signatures
associated with images to ensure the integrity of their data. A signed image
has a few additional properties set in its metadata that include
img_signature, img_signature_hash_method, img_signature_key_type,
and img_signature_certificate_uuid. You can find more information about
these properties and their values in the upstream OpenStack documentation.
MOSK performs image signature verification during the following operations:
A cloud user or a service creates an image in the store and starts to upload its data. If the signature metadata properties are set on the image, its content gets verified against the signature. The Image service accepts non-signed image uploads.
A cloud user spawns a new instance from an image. The Compute service ensures that the data it downloads from the image storage matches the image signature. If the signature is missing or does not match the data, the operation fails. Limitations apply, see Known limitations.
A cloud user boots an instance from a volume, or creates a new volume from an image. If the image is signed, the Block Storage service compares the downloaded image data against the signature. If there is a mismatch, the operation fails. The service will accept a non-signed image as a source for a volume. Limitations apply, see Known limitations.
spec:
features:
glance:
signature:
enabled: true
Every MOSK cloud is pre-provisioned with a baseline set of images containing most popular operating systems, such as Ubuntu, Fedora, CirrOS.
In addition, a few services in MOSK rely on the creation of service instances to provide their functions, namely the Load Balancer service and the Bare Metal service, and require corresponding images to exist in the image store.
When image signature verification is enabled during the cloud deployment, all these images get automatically signed with a pre-generated self-signed certificate. Enabling the feature in an already existing cloud requires manual signing of all of the images stored in it. Consult the OpenStack documentation for an example of the image signing procedure.
The image signature verification is supported for LVM and local backends for ephemeral storage.
The functionality is not compatible with Ceph-backed ephemeral storage combined with RAW formatted images. The Ceph copy-on-write mechanism enables the user to create instance virtual disks without downloading the image to a compute node, the data is handled completely on the side of a Ceph cluster. This enables you to spin up instances almost momentarily but makes it impossible to verify the image data before creating an instance from it.
The Image service does not enforce the presence of a signature in the metadata when the user creates a new image. The service will accept the non-signed image uploads.
The Image service does not verify the correctness of an image signature upon update of the image metadata.
MOSK does not validate if the certificate used to sign an image is trusted, it only ensures the correctness of the signature itself. Cloud users are allowed to use self-signed certificates.
The Compute service does not verify image signature for Ceph backend when the RAW image format is used as described in Supported storage backends.
The Compute service does not verify image signature if the image is already cached on the target compute node.
The Instance HA service may experience issues when auto-evacuating instances created from signed images if it does have access to the corresponding secrets in the Key manager service.
The Block Storage service does not perform image signature verification when a Ceph backend is used and the images are in the RAW format.
The Block Storage service does not enforce the presence of a signature on the images.
Object Storage service
Ceph Object Gateway provides Object Storage (Swift) API for end users in MOSK deployments. For the API compatibility, refer to Ceph Documentation: Ceph Object Gateway Swift API.
Object storage enablement
Parameter |
|
|---|---|
Usage |
Enables the object storage and provides a RADOS Gateway Swift API that is compatible with the OpenStack Swift API. To enable the service, add spec:
features:
services:
- object-storage
To create the RADOS Gateway pool in Ceph, see :ref: Operations Guide: Enable Ceph RGW Object Storage <enable-rgw>. |
Object storage server-side encryption
TechPreview
Ceph Object Gateway also provides Amazon S3 compatible API. For details, see Ceph Documentation: Ceph Object Gateway S3 API. Using integration with the OpenStack Key Manager service (Barbican), the objects uploaded through S3 API can be encrypted by Ceph Object Gateway according to the AWS Documentation: Protecting data using server-side encryption with customer-provided encryption keys (SSE-C) specification.
Instead of Swift, such configuration uses an S3 client to upload server-side encrypted objects. Using server-side encryption, the data is sent over a secure HTTPS connection in an unencrypted form and the Ceph Object Gateway stores that data in the Ceph cluster in an encrypted form.
Dashboard
MOSK Dashboard (OpenStack Horizon) provides a web-based interface for users to access the functions of the cloud services.
Custom theme
Parameter |
|
|---|---|
Usage |
Defines the list of custom OpenStack Dashboard themes. Content of the archive file with a theme depends on the level of customization and can include static files, Django templates, and other artifacts. For the details, refer to OpenStack official documentation: Customizing Horizon Themes. spec:
features:
horizon:
themes:
- name: theme_name
description: The brand new theme
url: https://<path to .tgz file with the contents of custom theme>
sha256summ: <SHA256 checksum of the archive above>
|
Message of the Day (MOTD)
Available since MOSK 25.1
MOSK enables a cloud operator to configure Message of the Day (MOTD) for the MOSK Dashboard (OpenStack Horizon). These short messages inform users about current infrastructure issues, upcoming maintenance, and other events, helping them plan their work with minimal service disruption.
Cloud operators can configure messages to appear before or after users log in to Horizon, or both. Messages can also be visually distinguished based on severity and support minimal HTML formatting, including links.
To define the MOTD, populate the following structure in the
OpenStackDeployment custom resource:
spec:
features:
horizon:
motd:
<NAME>:
level: <LEVEL>
message: <MESSAGE>
afterLogin: <true|false>
beforeLogin: <true|false>
Parameters:
<NAME>: A unique symbolic name to distinguish messageslevel: The severity level of the message. Supported values:success,info,warning, anderrorbeforeLogin: Boolean. Iftrue, the message appears on the login page for unauthorized users. Default:false.afterLogin: Boolean. Iftrue, the message appears after users log in. Default:true.
Configuration example:
spec:
features:
horizon:
motd:
errorBefore:
level: error
message: "We are experiencing <b>issues</b> with the authentication provider<br>Check the status at the <a href='https://foo.bar'>status page</a>"
afterLogin: false
beforeLogin: true
warnAfter:
level: warning
message: "Planned maintenance tomorrow"
The above configuration results in the following two messages displayed for all cloud users:
Login page:
After logging in:
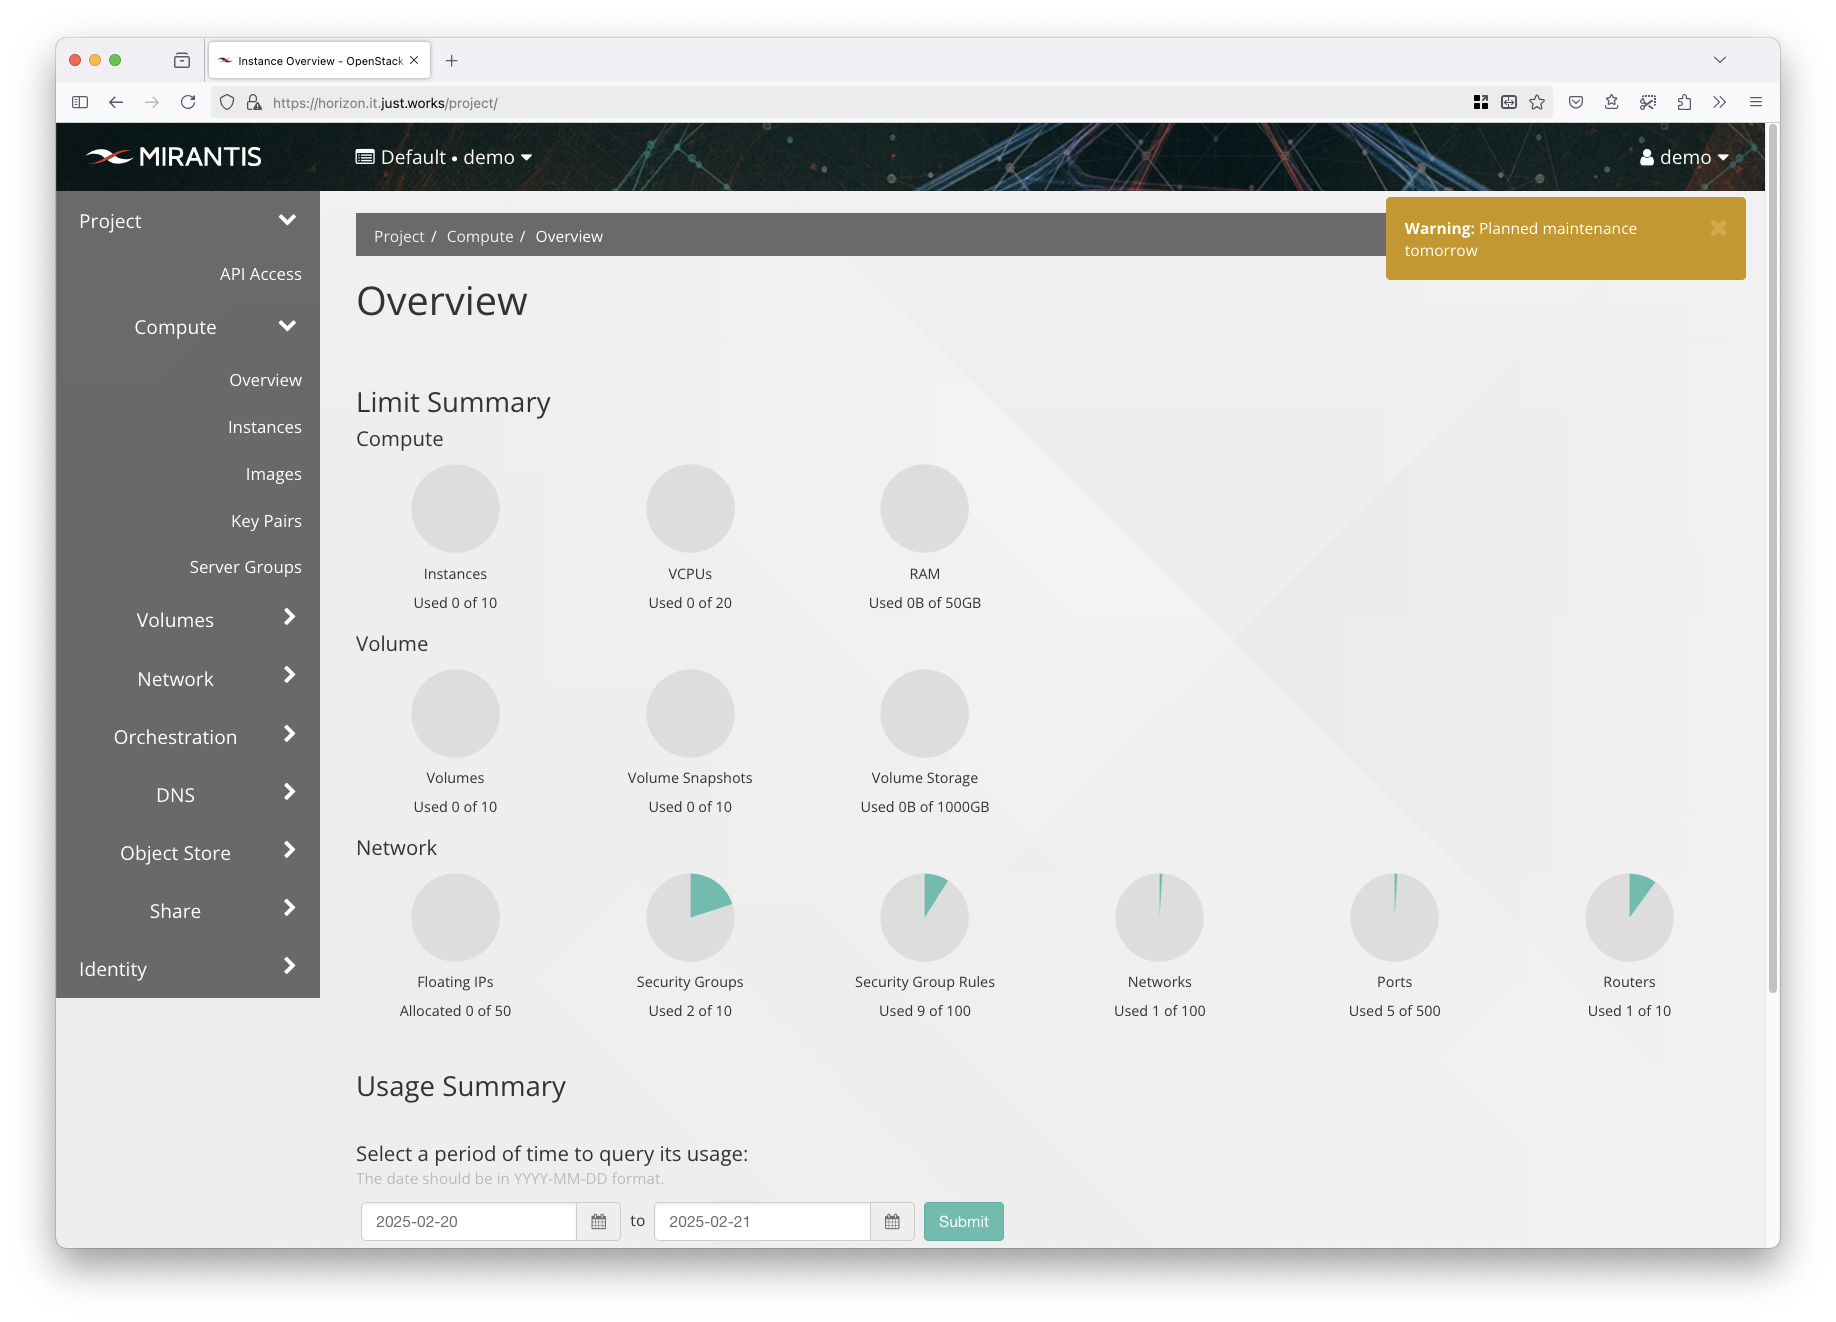
Auxiliary cloud services:
Bare Metal service
The Bare Metal service (Ironic) is an extra OpenStack service that can be
deployed by the OpenStack Controller (Rockoon). This section provides the
baremetal-specific configuration options of the OpenStackDeployment
resource.
Enabling the Bare Metal service
The Bare Metal service is not included into the core set of services and needs
to be explicitly enabled in the OpenStackDeployment custom resource.
To install bare metal services, add the baremetal keyword to the
spec:features:services list:
spec:
features:
services:
- baremetal
Note
All bare metal services are scheduled to the nodes with the
openstack-control-plane: enabled label.
Ironic agent deployment images
To provision a user image onto a bare metal server, Ironic boots a node with
a ramdisk image. Depending on the node’s deploy interface and hardware, the
ramdisk may require different drivers (agents). MOSK
provides tinyIPA-based ramdisk images and uses the direct deploy interface
with the ipmitool power interface.
Example of agent_images configuration:
spec:
features:
ironic:
agent_images:
base_url: https://binary.mirantis.com/openstack/bin/ironic/tinyipa
initramfs: tinyipa-stable-ussuri-20200617101427.gz
kernel: tinyipa-stable-ussuri-20200617101427.vmlinuz
Since the bare metal nodes hardware may require additional drivers, you may need to build a deploy ramdisk for particular hardware. For more information, see Ironic Python Agent Builder. Be sure to create a ramdisk image with the version of Ironic Python Agent appropriate for your OpenStack release.
Bare metal networking
Ironic supports the flat networking mode for both Open vSwitch (OVS)
and Open Virtual Network (OVN) backends, and the multitenancy networking
mode for the OVN backend only.
Caution
The multitenant OVS networking has become unsupported in MOSK 25.2. For details, refer to Multitenant OVS networking for the Bare Metal service.
The flat networking mode assumes that all bare metal nodes are
pre-connected to a single network that cannot be changed during the
virtual machine provisioning. This network with bridged interfaces
for Ironic should be spread across all nodes including compute nodes
to allow plug-in regular virtual machines to connect to Ironic network.
In its turn, the interface defined as provisioning_interface should
be spread across gateway nodes. The cloud operator can perform
all these underlying configuration through the L2 templates.
Example of the OsDpl resource illustrating the configuration for the flat
network mode:
spec:
features:
services:
- baremetal
neutron:
external_networks:
- bridge: ironic-pxe
interface: <baremetal-interface>
network_types:
- flat
physnet: ironic
vlan_ranges: null
ironic:
# The name of neutron network used for provisioning/cleaning.
baremetal_network_name: ironic-provisioning
networks:
# Neutron baremetal network definition.
baremetal:
physnet: ironic
name: ironic-provisioning
network_type: flat
external: true
shared: true
subnets:
- name: baremetal-subnet
range: 10.13.0.0/24
pool_start: 10.13.0.100
pool_end: 10.13.0.254
gateway: 10.13.0.11
# The name of interface where provision services like tftp and ironic-conductor
# are bound.
provisioning_interface: br-baremetal
Unsupported for OVS since MOSK 25.2
The multitenancy network mode uses the neutron Ironic network
interface to share physical connection information with Neutron. This
information is handled by Neutron ML2 drivers when plugging a Neutron port
to a specific network. MOSK supports the
networking-generic-switch Neutron ML2 driver out of the box.
Example of the OsDpl resource illustrating the configuration for the
multitenancy network mode:
spec:
features:
services:
- baremetal
neutron:
tunnel_interface: ens3
external_networks:
- physnet: physnet1
interface: <physnet1-interface>
bridge: br-ex
network_types:
- flat
vlan_ranges: null
mtu: null
- physnet: ironic
interface: <physnet-ironic-interface>
bridge: ironic-pxe
network_types:
- vlan
vlan_ranges: 1000:1099
ironic:
# The name of interface where provision services like tftp and ironic-conductor
# are bound.
provisioning_interface: <baremetal-interface>
baremetal_network_name: ironic-provisioning
networks:
baremetal:
physnet: ironic
name: ironic-provisioning
network_type: vlan
segmentation_id: 1000
external: true
shared: false
subnets:
- name: baremetal-subnet
range: 10.13.0.0/24
pool_start: 10.13.0.100
pool_end: 10.13.0.254
gateway: 10.13.0.11
Available since MOSK 25.2 for OVN TechPreview
MOSK provides the port trunking capability for Ironic
instances through the networking-generic-switch Neutron driver allowing for
a single NIC/port on a bare metal server to carry traffic for multiple VLANs
simultaneously.
To learn how to configure the port trunking, refer to the Configure network trunking in projects tutorial.
To check the functionality compatibility with your hardware, contact Mirantis support.
DNS service
Mirantis OpenStack for Kubernetes (MOSK) provides DNS records managing capability through the DNS service (OpenStack Designate).
LoadBalancer type for PowerDNS
The supported backend for Designate is PowerDNS. If required, you can specify whether to use an external IP address or UDP, TCP, or TCP + UDP kind of Kubernetes for the PowerDNS service.
To configure LoadBalancer for PowerDNS, use the spec:features:designate
definition in the OpenStackDeployment custom resource.
The list of supported options includes:
external_ip- Optional. An IP address for the LoadBalancer service. If not defined, LoadBalancer allocates the IP address.protocol- A protocol for the Designate backend in Kubernetes. Can only beudp,tcp, ortcp+udp.type- The type of the backend for Designate. Can only bepowerdns.
For example:
spec:
features:
designate:
backend:
external_ip: 10.172.1.101
protocol: udp
type: powerdns
DNS service known limitations
Due to an issue in the dnspython library, Asynchronous Transfer Full Range
(AXFR) requests do not work and cause inability to set up a secondary DNS zone.
The issue affects OpenStack Victoria and is fixed in the Yoga release.
Key Manager service
MOSK Key Manager service (OpenStack Barbican) provides secure storage, provisioning, and management of cloud application secret data, such as Symmetric Keys, Asymmetric Keys, Certificates, and raw binary data.
Configuring the Vault backend
Parameter |
|
|---|---|
Usage |
Specifies the object containing the Vault parameters to connect to Barbican. The list of supported options includes:
If the Vault backend is used, configure it properly using the following parameters: spec:
features:
barbican:
backends:
vault:
enabled: true
approle_role_id: <APPROLE_ROLE_ID>
approle_secret_id: <APPROLE_SECRET_ID>
vault_url: <VAULT_SERVER_URL>
use_ssl: false
Mirantis recommeds hiding the Note Since MOSK does not currently support the
Vault SSL encryption, set the |
Instance High Availability service
TechPreview
Instance High Availability service (OpenStack Masakari) enables cloud users to ensure that their instances get automatically evacuated from a failed hypervisor.
The service consists of the following components:
API recieves requests from users and events from monitors, and sends them to engine
Engine executes recovery workflow
Monitors detect failures and notifies API. MOSK uses monitors of the following types:
Instance monitor performs liveness of instance processes
Introspective instance monitor enhances instance high availability within OpenStack environments by monitoring and identifying system-level failures through the QEMU Guest Agent
Host monitor performs liveness of a compute host, runs as part of the Node controller from the OpenStack Controller (Rockoon)
Note
The Processes monitor is not present in MOSK as far as HA for the compute processes is handled by Kubernetes.
This section describes how to enable various components of the Instance High Availability service for your MOSK deployment:
Enabling the Instance HA service
The Instance HA service is not included into the core set of services and needs
to be explicitly enabled in the OpenStackDeployment custom resource.
Parameter |
|
|---|---|
Usage |
Enables Masakari, the OpenStack service that ensures high availability
of instances running on a host. To enable the service, add
spec:
features:
services:
- instance-ha
|
Enabling introspective instance monitor
Available since MOSK 25.1 TechPreview
The introspective instance monitor in the Instance High Availability service enhances the reliability of the cloud environment by monitoring virtual machines for failure events, including operating system crashes, kernel panics, and unresponsive states. Upon detecting such events in real time, the monitor initiates automated recovery actions, such as rebooting the affected instance. This allows for reduced downtime and maintains high availability of an OpenStack environment.
As a cloud operator, you can enable and configure the instance introspection
through the spec:features:masakari:monitors:introspective definition in the
OpenStackDeployment custom resource. The list of supported options include:
enabled(boolean)Enables or disables the introspection monitor. Default:
false.
guest_monitoring_interval(integer)Defines the time interval (in seconds) for monitoring the status of the guest virtual machine. Default:
10.
guest_monitoring_timeout(integer)Sets the timeout (in seconds) for detecting a non-responsive guest VM before marking it as failed. Default:
2.
guest_monitoring_failure_threshold(integer)Defines the number of consecutive failures required before a notification is sent or recovery action is initiated. Default:
3.
Example configuration:
spec:
features:
masakari:
monitors:
introspective:
enabled: true
guest_monitoring_interval: 10
guest_monitoring_timeout: 2
guest_monitoring_failure_threshold: 3
The introspective instance monitor relies on the QEMU Guest Agent being installed within the guest virtual machine. This agent enables communication between the host and guest operating systems, ensuring precise monitoring of the virtual machine health. Without the QEMU Guest Agent, the introspection monitor cannot accurately assess the state of the virtual machine, which may prevent the initiation of necessary recovery actions. To start monitoring, refer to Configure the introspective instance monitor.
Dynamic Resource Balancer service
Available since MOSK 24.2 TechPreview
In a cloud environment where resources are shared across all workloads, those resources often become a point of contention.
For example, it is not uncommon for an oversubscribed compute node to experience the noisy neighbor problem, when one of the instances may start consuming a lot more resources than usually, negatively affecting performance of other instances running on the same node.
In such cases, an intervention is required from the cloud operators to manually re-distribute workloads in the cluster to achieve more equal utilization of resources.
The Dynamic Resource Balancer (DRB) service continiously measures resource usage on hypervisors and redistributes workloads to achieve some optimum target, thereby eliminating the need for manual interventions from cloud operators.
Architecture overview
The DRB service is implemented as a Kubernetes operator, controlled by
the custom resource of kind: DRBConfig. Unless at least one resource
of such kind is present, the service does not perform any operations. Cloud
operators who want to enable the DRB service for their MOSK
clouds, need to create the resource with proper configuration.
The DRB controller consists of the following сomponents interacting with each other:
collectorCollects the statistics of resource consumption in the cluster
schedulerBased on the data from the collector, makes decisions whether cloud resources need to be relocated to achieve the optimum
actuatorExecutes the resource relocation decisions made by
scheduler
Out of the box, these service components implement a very simple logic, which,
however, can be individually enhanced according to the needs of a specific
cloud environment by utilizing their pluggable architecture. The plugins
need to be written in Python programming language and injected as modules
into the DRB service by building a custom drb-controller container image.
Default plugins as well as custom plugins are configured through the
corresponding sections of DRBConfig custom resources.
Also, it is possible to limit the scope of DRB decisions and actions to only a subset of hosts. This way, you can model the node grouping schema that is configured in OpenStack, for example, compute node aggregates and availability zones, to avoid DRB service attempting resource placement changes that cannot be fulfilled by MOSK Compute service (OpenStack Nova).
Example configuration
apiVersion: lcm.mirantis.com/v1alpha1
kind: DRBConfig
metadata:
name: drb-test
namespace: openstack
spec:
actuator:
max_parallel_migrations: 10
migration_polling_interval: 5
migration_timeout: 180
name: os-live-migration
collector:
name: stacklight
hosts: []
migrateAny: false
reconcileInterval: 300
scheduler:
load_threshold: 80
min_improvement: 0
name: vm-optimize
The spec section of configuration consists of the following main parts:
collectorSpecifies and configures the collector plugin to collect the metrics on which decisions are based. At a minimum, the
nameof the plugin must be provided.
schedulerSpecifies and configures the scheduler plugin that will make decisions based on the collected metrics. At a minimum, the
nameof the plugin must be provided.
actuatorSpecifies and configures the actuator plugin that will move resources around. At a minimum, the
nameof the plugin must be provided.
reconcileIntervalDefines time in seconds between reconciliation cycles. Should be large enough for the metrics to settle after resources are moved around.
For the default
stacklightcollector plugin, this value must equal at least300.
hostsSpecifies the list of cluster hosts to which this given instance of
DRBConfigapplies. This means that only metrics from these hosts will be used for making decisions, only resources belonging to these hosts will be considered for re-distribution, and only these hosts will be considered as possible targets for re-distribution.You can create multiple
DRBConfigresources that watch over non-overlapping sets of hosts.Default of this setting is an empty list that implies all hosts.
migrateAnyA boolean flag that the scheduler plugin can consider when making decisions, allowing cloud operators and users to opt certain workloads in or out of redistribution.
For the default
vm-optimizescheduler plugin:migrateAny: true(default) - any instance can be migrated, except for instances tagged withlcm.mirantis.com:no-drb, explicitly opting out of the DRB functionalitymigrateAny: false- only instances tagged withlcm.mirantis.com:drbare migrated by the DRB service, explicitly opting in to the DRB functionality
Included default plugins
Collects node_load5, machine_cpu_cores, and
libvirt_domain_info_cpu_time_seconds:rate5m metrics
from the StackLight service running in the MOSK cluster.
Does not have options available.
Requires the reconcileInterval set to at least 300 (5 minutes),
as both the collected node and instance CPU usage metrics are effectively
averaged over a 5-minute sliding window.
Attempts to minimize the standard deviation of node load. The node load is normalized per CPU core, so heterogeneous compute hosts can be compared.
Available options:
load_thresholdThe value in percent of the compute host load after which the host will be considered overloaded and attempts will be made to migrate instances from it. Defaults to
80.
min_improvementMinimal improvement of the optimization metric in percent. While making decisions, the scheduler attempts to predict the resulting load distribution to determine if moving resources is beneficial. If the total improvement after all necessary decisions is calculated to be less than
min_improvement, no decisions will be executed.Defaults to
0, any potential improvement is acted upon. Setting this to a higher value should allow avoiding instance migrations that provide negligible improvements.
Warning
The current version of this plugin takes into account only basic resource classes when making scheduling decisions. These include only RAM, disk, and vCPU count from the instance flavor. It does not take into account any other information including specific image or aggregate metadata, custom resource classes, PCI devices, NUMA, hugepages, and so on. Moving around instances that consume such resources will more likely fail as the current implementation of the scheduler plugin cannot reliably predict if such instances fit onto the selected target host.
Live migrates instances to specific hosts. Assumes any migration is possible.
Refer to the hosts and migrateAny options above to learn how to control
which instances are migrated to which locations.
Available options:
max_parallel_migrationsDefines the number of instances to migrate in parallel.
Defaults to
10.This value applies to all decisions being processed, so it may involve instances from different hosts. Meanwhile, the
nova-computeservice may have its own limits on how many live migrations a given host can handle in parallel.
migration_polling_intervalDefines the interval in seconds for checking the instance status while the latter is being migrated
Defaults to
5.
migration_timeoutDefines the interval in seconds after which an unfinished migration is considered failed.
Defaults to
180.
Only logs the decisions that were scheduled for execution. Useful for debugging and dry-runs.
Note
The list of the services and their supported features included in this section is not full and is being constantly amended based on the complexity of the architecture and use of a particular service.
OpenStack
OpenStack cluster
OpenStack and auxiliary services are running as containers in the kind: Pod
Kubernetes resources. All long-running services are governed by one of
the ReplicationController-enabled Kubernetes resources, which include
either kind: Deployment, kind: StatefulSet, or kind: DaemonSet.
The placement of the services is mostly governed by the Kubernetes node labels. The labels affecting the OpenStack services include:
openstack-control-plane=enabled- the node hosting most of the OpenStack control plane services.openstack-compute-node=enabled- the node serving as a hypervisor for Nova. The virtual machines with tenants workloads are created there.openvswitch=enabled- the node hosting Neutron L2 agents and OpenvSwitch pods that manage L2 connection of the OpenStack networks.openstack-gateway=enabled- the node hosting Neutron L3, Metadata and DHCP agents, Octavia Health Manager, Worker and Housekeeping components.
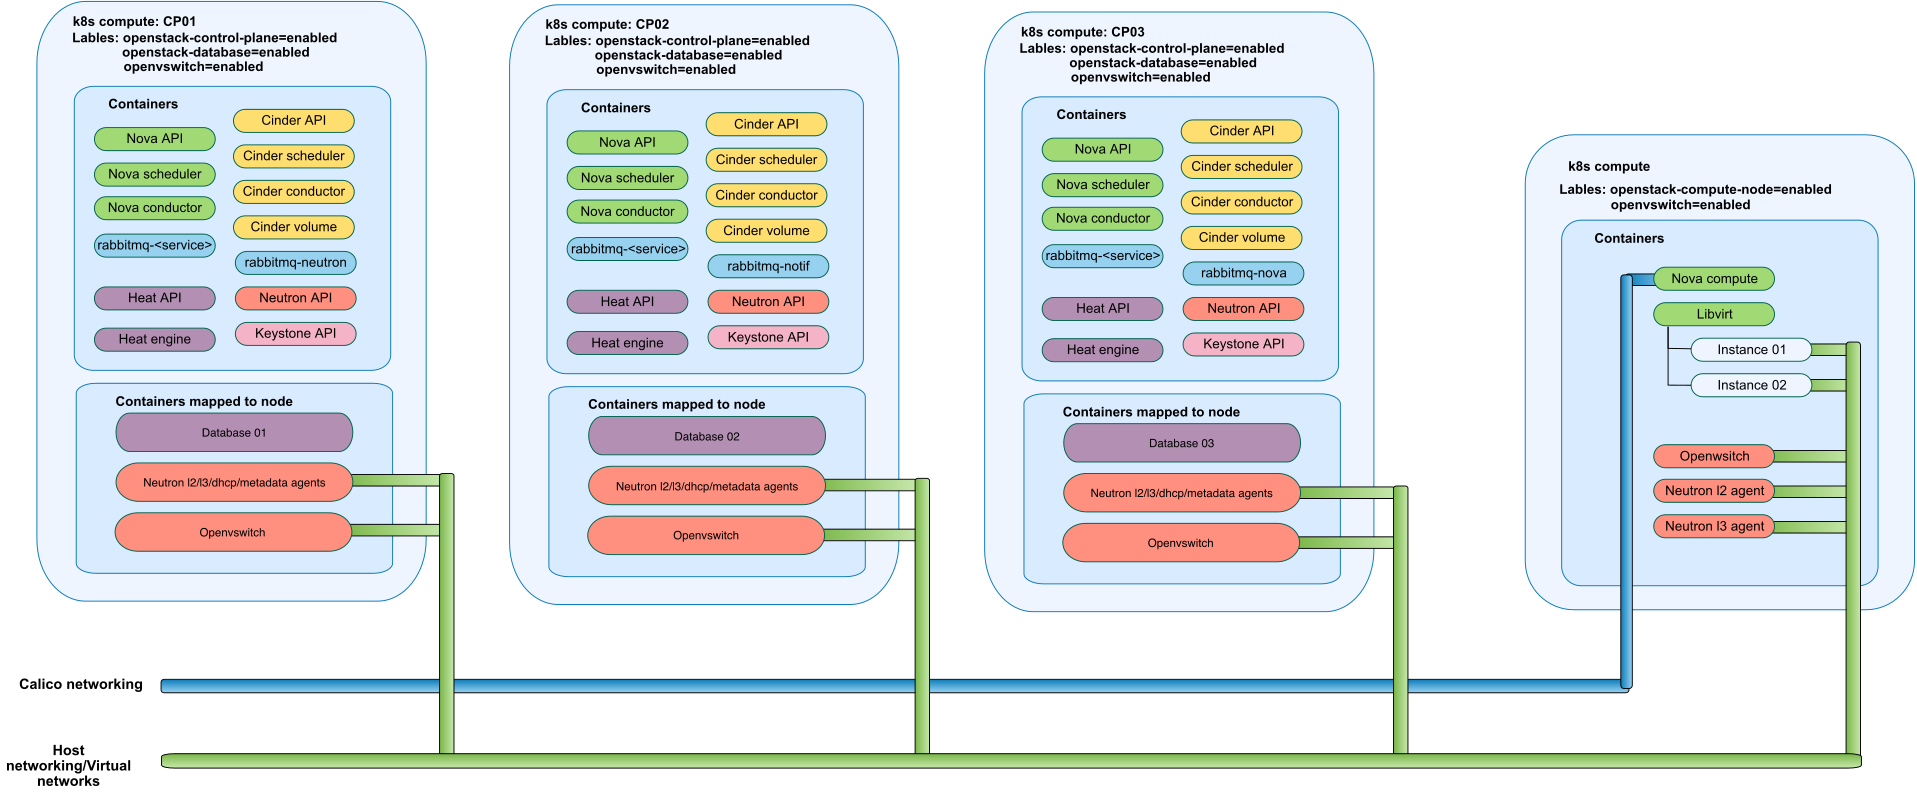
Note
OpenStack is an infrastructure management platform. Mirantis OpenStack for Kubernetes (MOSK) uses Kubernetes mostly for orchestration and dependency isolation. As a result, multiple OpenStack services are running as privileged containers with host PIDs and Host Networking enabled. You must ensure that at least the user with the credentials used by Helm/Tiller (administrator) is capable of creating such Pods.
Infrastructure services
Service |
Description |
|---|---|
Storage |
While the underlying Kubernetes cluster is configured to use Ceph CSI for providing persistent storage for container workloads, for some types of workloads such networked storage is suboptimal due to latency. This is why the separate |
Database |
A single WSREP (Galera) cluster of MariaDB is deployed as the SQL
database to be used by all OpenStack services. It uses the storage class
provided by Local Volume Provisioner to store the actual database files.
The service is deployed as |
Messaging |
RabbitMQ is used as a messaging bus between the components of the OpenStack services. A separate instance of RabbitMQ is deployed for each OpenStack service that needs a messaging bus for intercommunication between its components. An additional, separate RabbitMQ instance is deployed to serve as a notification messages bus for OpenStack services to post their own and listen to notifications from other services. StackLight also uses this message bus to collect notifications for monitoring purposes. Each RabbitMQ instance is a single node and is deployed as
|
Caching |
A single multi-instance of the Memcached service is deployed to be used by all OpenStack services that need caching, which are mostly HTTP API services. |
Coordination |
A separate instance of etcd is deployed to be used by Cinder, which require Distributed Lock Management for coordination between its components. |
Ingress |
Is deployed as |
Image pre-caching |
A special This is especially useful for containers used in |
OpenStack services
Service |
Description |
|---|---|
Identity (Keystone) |
Uses MySQL backend by default.
|
Image (Glance) |
Supported backend is RBD (Ceph is required). |
Volume (Cinder) |
Supported backend is RBD (Ceph is required). |
Network (Neutron) |
Supported backends are Open vSwitch, Open Virtual Network, and Tungsten Fabric. |
Placement |
|
Compute (Nova) |
Supported hypervisor is Qemu/KVM through libvirt library. |
Dashboard (Horizon) |
|
DNS (Designate) |
Supported backend is PowerDNS. |
Load Balancer (Octavia) |
|
Ceph Object Gateway (SWIFT) |
Provides the object storage, the Ceph Object Gateway S3 API, and the Ceph
Object Gateway Swift API that is compatible with the OpenStack Swift API.
You can manually enable the service in the |
Instance HA (Masakari) |
An OpenStack service that ensures high availability of instances running
on a host. You can manually enable Masakari in the
|
Orchestration (Heat) |
|
Key Manager (Barbican) |
The supported backends include:
|
Tempest |
Runs tests against a deployed OpenStack cloud. You can manually enable
Tempest in the |
Shared Filesystems (OpenStack Manila) |
Provides Shared Filesystems as a service that enables you to create and manage shared filesystems in a multi-project cloud environments. For details, refer to Shared Filesystems service. |
OpenStack database architecture
A complete setup of a MariaDB Galera cluster for OpenStack is illustrated in the following image:
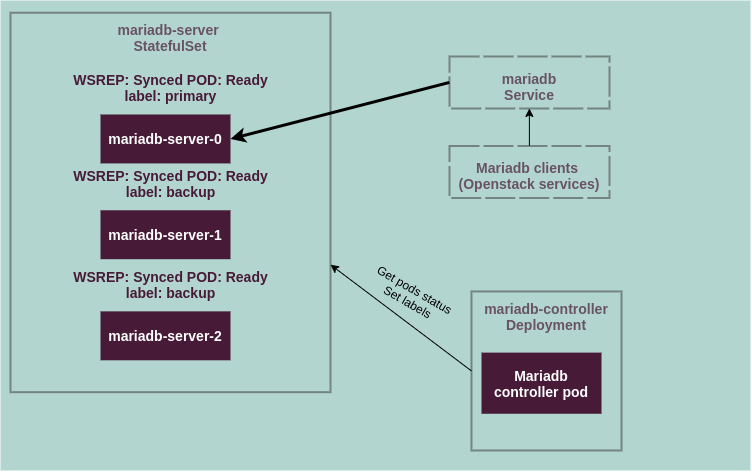
MariaDB server pods are running a Galera multi-master cluster. Clients
requests are forwarded by the Kubernetes mariadb service to the
mariadb-server pod that has the primary label. Other pods from
the mariadb-server StatefulSet have the backup label. Labels are
managed by the mariadb-controller pod.
The MariaDB Controller periodically checks the readiness of the
mariadb-server pods and sets the primary label to it if the following
requirements are met:
The
primarylabel has not already been set on the pod.The pod is in the ready state.
The pod is not being terminated.
The pod name has the lowest integer suffix among other ready pods in the StatefulSet. For example, between
mariadb-server-1andmariadb-server-2, the pod with themariadb-server-1name is preferred.
Otherwise, the MariaDB Controller sets the backup label. This means that
all SQL requests are passed only to one node while other two nodes are in
the backup state and replicate the state from the primary node.
The MariaDB clients are connecting to the mariadb service.
OpenStack lifecycle management
The OpenStack Operator component is a combination of the following entities:
OpenStack Controller (Rockoon)
In MOSK, Rockoon is the singleton Kubernetes operator that acts as the OpenStack Controller, providing a Kubernetes-native control plane for OpenStack. Rockoon is written in Python and leverages the Kopf framework for Kubernetes operator development, along with Pykube, a lightweight Kubernetes API client.
Rockoon is continuously watching the OpenStackDeployment custom
resource and manages the full lifecycle of OpenStack through the
Kubernetes API. When the resource changes, Rockoon translates
its data into Helm values, merging global, feature-level, and per-service
parameters, and applies them to the underlying Kubernetes cluster to install
and update OpenStack components. This approach provides a stable abstraction
over raw OpenStack-Helm charts and enables continuous, declarative
reconciliation.
The basic child resources managed by the controller are Helm releases.
They are rendered from templates using values derived from the
main and features sections in the OpenStackDeployment custom
resource. Then, the common fields are merged to resulting data structures.
Lastly, the services fields are merged providing the final and precise
override for any value in any Helm release to be deployed or upgraded. The
constructed values are then used by Rockoon during a Helm release
installation.
By design, Rockoon runs in a set of containers in a single pod and
is deployed as a Kubernetes Deployment with one replica. Kubernetes
handles failover by restarting the failed containers. Typically, each
dedicated Kubernetes cluster manages a single OpenStack deployment, so
each Rockoon manages only one OpenStackDeployment resource,
simplifying operations and minimizing the need for full high availability
of the controller.
Container |
Description |
|---|---|
|
The core container that handles changes in the |
|
The container that watches the |
|
The container that watches all Kubernetes native
resources, such as |
|
The container that provides data exchange between different components such as Ceph. |
|
The container that handles the node events. |
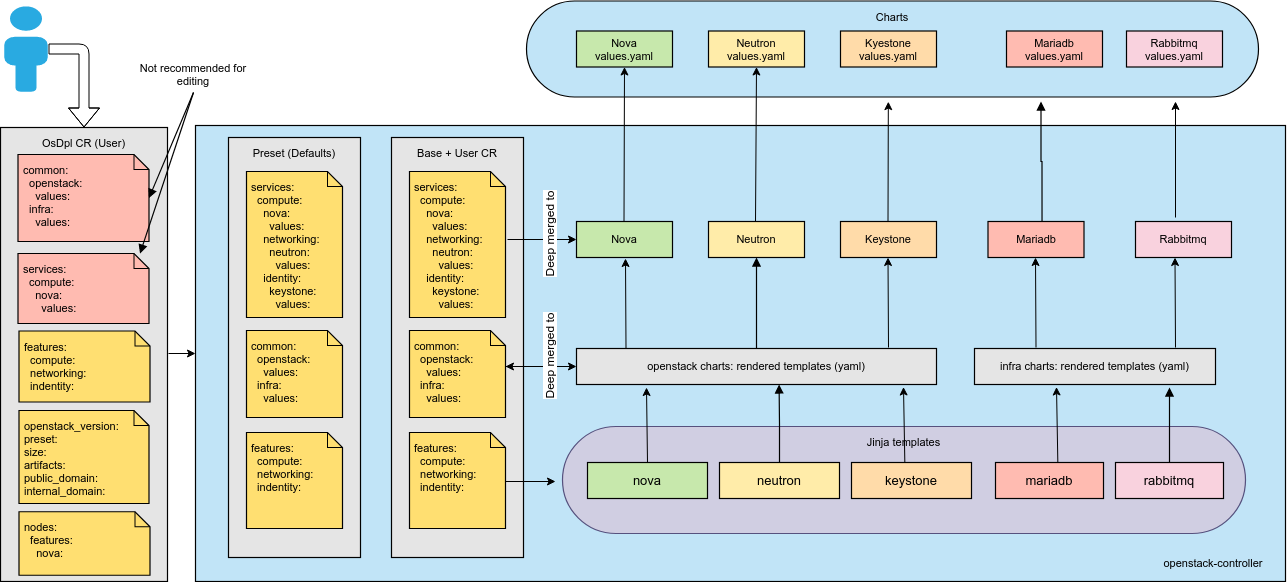
OpenStackDeployment Admission Controller
The CustomResourceDefinition resource in Kubernetes uses the
OpenAPI Specification version 2 to specify the schema of the resource
defined. The Kubernetes API outright rejects the resources that do not
pass this schema validation.
The language of the schema, however, is not expressive enough to define a specific validation logic that may be needed for a given resource. For this purpose, Kubernetes enables the extension of its API with Dynamic Admission Control.
For the OpenStackDeployment (OsDpl) CR the ValidatingAdmissionWebhook
is a natural choice. It is deployed as part of OpenStack Controller (Rockoon)
by default and performs specific extended validations when an OsDpl CR is
created or updated.
The inexhaustive list of additional validations includes:
Deny the OpenStack version downgrade
Deny the OpenStack version skip-level upgrade
Deny the OpenStack master version deployment
Deny upgrade to the OpenStack master version
Deny upgrade if any part of an OsDpl CR specification changes along with the OpenStack version
Under specific circumstances, it may be viable to disable the Admission Controller, for example, when you attempt to deploy or upgrade to the master version of OpenStack.
Warning
Mirantis does not support MOSK deployments performed without the OpenStackDeployment Admission Controller enabled. Disabling of the OpenStackDeployment Admission Controller is only allowed in staging non-production environments.
To disable the Admission Controller, ensure that the following structures and
values are present in the rockoon HelmBundle resource:
apiVersion: lcm.mirantis.com/v1alpha1
kind: HelmBundle
metadata:
name: openstack-operator
namespace: osh-system
spec:
releases:
- name: openstack-operator
values:
admission:
enabled: false
At that point, all safeguards except for those expressed by the CR definition are disabled.
OpenStack Exporter
The OpenStack Exporter collects metrics from the OpenStack services and exposes them to Prometheus for integration with StackLight. The Exporter interacts with the REST APIs of various OpenStack services to gather data about the infrastructure state and performance for visualization, alerting, and analysis within the monitoring system.
To retrieve metrics from the OpenStack Exporter:
Locate the Exporter pod. The OpenStack Exporter runs in the
osh-systemnamespace:kubectl -n osh-system get pods | grep exporter
Query the metrics by executing the curl request inside the exporter container:
kubectl -n osh-system exec -t <EXPORTER-POD> -c exporter curl http://localhost:9102/
OpenStack configuration
MOSK provides the configurational capabilities through a number of custom resources. This section is intended to provide detailed overview of these custom resources and their possible configuration.
OpenStackDeployment custom resource
The OpenStackDeployment custom resource (CR) is a Kubernetes Custom
Resource Definition (CRD) that represents the desired state of an
OpenStack deployment managed by the OpenStack Controller (Rockoon).
It provides a declarative interface for configuring and managing
OpenStack services on Kubernetes.
To learn more about the spec schema of the OpenStackDeployment
custom resource, refer to API Reference.
To view the definition of a specific OpenStack deployment:
kubectl -n openstack get osdpl -o yaml
apiVersion: lcm.mirantis.com/v1alpha1
kind: OpenStackDeployment
metadata:
name: openstack-cluster
namespace: openstack
spec:
openstack_version: victoria
preset: compute
size: tiny
internal_domain_name: cluster.local
public_domain_name: it.just.works
features:
neutron:
tunnel_interface: ens3
external_networks:
- physnet: physnet1
interface: veth-phy
bridge: br-ex
network_types:
- flat
vlan_ranges: null
mtu: null
floating_network:
enabled: False
nova:
live_migration_interface: ens3
images:
backend: local
Available since MOSK 23.1
The OpenStackDeployment custom resource enables you to securely store
sensitive fields in Kubernetes secrets. To do that, verify that the
reference secret is present in the same namespace as the
OpenStackDeployment object and the
openstack.lcm.mirantis.com/osdpl_secret label is set to true.
The list of fields that can be hidden from OpenStackDeployment is limited
and defined by the OpenStackDeployment schema.
For example, to hide spec:features:ssl:public_endpoints:api_cert, use the
following structure:
spec:
features:
ssl:
public_endpoints:
api_cert:
value_from:
secret_key_ref:
key: api_cert
name: osh-dev-hidden
Element |
Sub-element |
Description |
|---|---|---|
|
n/a |
Specifies the version of the Kubernetes API that is used to create this object |
|
n/a |
Specifies the kind of the object |
|
|
Specifies the name of metadata. Should be set in compliance with the Kubernetes resource naming limitations |
|
Specifies the metadata namespace. While technically it is possible to
deploy OpenStack on top of Kubernetes in other than Warning Both OpenStack and Kubernetes platforms provide resources to applications. When OpenStack is running on top of Kubernetes, Kubernetes is completely unaware of OpenStack-native workloads, such as virtual machines, for example. For better results and stability, Mirantis recommends using a dedicated Kubernetes cluster for OpenStack, so that OpenStack and auxiliary services, Ceph, and StackLight are the only Kubernetes applications running in the cluster. |
|
|
|
Specifies the OpenStack release to deploy |
|
String that specifies the name of the
Every supported deployment profile incorporates an OpenStack preset. Refer to Deployment profiles for the list of possible values. |
|
|
String that specifies the size category for the OpenStack cluster. The size category defines the internal configuration of the cluster such as the number of replicas for service workers and timeouts, etc. The list of supported sizes include:
|
|
|
Specifies the public DNS name for OpenStack services. This is a base DNS name that must be accessible and resolvable by API clients of your OpenStack cloud. It will be present in the OpenStack endpoints as presented by the OpenStack Identity service catalog. The TLS certificates used by the OpenStack services (see below) must also be issued to this DNS name. |
|
|
Specifies the Kubernetes storage class name used for services to create
persistent volumes. For example, backups of MariaDB. If not specified,
the storage class marked as |
|
|
Contains the top-level collections of settings for the OpenStack deployment that potentially target several OpenStack services. The section where the customizations should take place. The |
region_name¶TechPreview
The name of the region used for deployment, defaults to RegionOne.
features:policies¶Defines the list of custom policies for OpenStack services.
Configuration structure:
spec:
features:
policies:
nova:
custom_policy: custom_value
The list of services available for configuration includes: Cinder, Nova, Designate, Keystone, Glance, Neutron, Heat, Octavia, Barbican, Placement, Ironic, aodh, Gnocchi, and Masakari.
Learn more about OpenStack API access policies in MOSK in OpenStack API access policies.
Caution
Mirantis is not responsible for cloud operability in case of default policies modifications but provides API to pass the required configuration to the core OpenStack services.
features:policies:strict_admin¶TechPreview
Enables a tested set of policies that limits the global admin role to
only the user with admin role in the admin project or user with the
service role. The latter should be used only for service users utilizied
for communication between OpenStack services.
Configuration structure:
spec:
features:
policies:
strict_admin:
enabled: true
services:
identity:
keystone:
values:
conf:
keystone:
resource:
admin_project_name: admin
admin_project_domain_name: Default
Note
The spec.services part of the above section will become
redundant in one of the following releases.
artifacts¶A low-level section that defines the base URI prefixes for images and binary artifacts.
Warning
Modifying spec:artifacts may result in the OpenStack
deployment becoming unstable or entering an inconsistent state. This
capability is intended solely for operators with expert-level knowledge
of configuration parameters and their implications.
common¶A low-level section that defines values that will be passed to all
OpenStack (spec:common:openstack) or auxiliary
(spec:common:infra) services Helm charts.
Configuration structure:
spec:
artifacts:
common:
openstack:
values:
infra:
values:
Warning
Modifying spec:common may result in the OpenStack
deployment becoming unstable or entering an inconsistent state. This
capability is intended solely for operators with expert-level knowledge
of configuration parameters and their implications.
services¶A section of the lowest level, enables the definition of specific values to pass to specific Helm charts on a one-by-one basis. For details about the structure and configuration examples, refer to OpenStackDeployment spec:services.
Warning
Modifying spec:services may result in the OpenStack
deployment becoming unstable or entering an inconsistent state. This
capability is intended solely for operators with expert-level knowledge
of configuration parameters and their implications, and only in cases
the spec:features section does not offer the required level of
control. Mirantis assumes no responsibility for any issues arising
from the use of the spec:services mechanism.
Parameter |
|
|---|---|
Usage |
Specifies the standard logging levels for OpenStack services that
include the following, at increasing severity: Configuration example: spec:
features:
logging:
nova:
level: DEBUG
|
Depending on the use case, you may need to configure the same application components differently on different hosts. MOSK enables you to easily perform the required configuration through node-specific overrides at the OpenStack Controller side.
The limitation of using the node-specific overrides is that they override only the configuration settings while other components, such as startup scripts and others, should be reconfigured as well.
Caution
The overrides have been implemented in a similar way to the OpenStack node and node label specific DaemonSet configurations. Though, the OpenStack Controller node-specific settings conflict with the upstream OpenStack node and node label specific DaemonSet configurations. Therefore, we do not recommend configuring node and node label overrides.
The list of allowed node labels is located in the Cluster object status
providerStatus.releaseRef.current.allowedNodeLabels field.
If the value field is not defined in allowedNodeLabels, a label can
have any value.
Before or after a machine deployment, add the required label from the allowed
node labels list with the corresponding value to
spec.providerSpec.value.nodeLabels in machine.yaml. For example:
nodeLabels:
- key: <NODE-LABEL>
value: <NODE-LABEL-VALUE>
The addition of a node label that is not available in the list of allowed node labels is restricted.
The node-specific settings are activated through the spec:nodes
section of the OsDpl CR. The spec:nodes section contains the following
subsections:
features- implements overrides for a limited subset of fields and is constructed similarly tospec::featuresservices- similarly tospec::services, enables you to override settings in general for the components running as DaemonSets.
Example configuration:
spec:
nodes:
<NODE-LABEL>::<NODE-LABEL-VALUE>:
features:
# Detailed information about features might be found at
# openstack_controller/admission/validators/nodes/schema.yaml
services:
<service>:
<chart>:
<chart_daemonset_name>:
values:
# Any value from specific helm chart
Parameter |
|
|---|---|
Usage |
Enables tests against a deployed OpenStack cloud: spec:
features:
services:
- tempest
|
See also
OpenStackDeployment spec:services
The spec:services section of the OpenStackDeployment custom
resource defines lowest-level values for Helm charts deployed by
the OpenStack Controller (Rockoon), bypassing its high-level logic
and guardrails.
Rockoon does not validate the spec:services content. The controller
merges parameters from this section directly with the configurations
generated from internal templates, overriding and extending them as
specified.
Warning
Modifying spec:services may result in the OpenStack
deployment becoming unstable or entering an inconsistent state. This
capability is intended solely for operators with expert-level knowledge
of configuration parameters and their implications, and only in cases
the spec:features section does not offer the required level of
control. Mirantis assumes no responsibility for any issues arising
from the use of the spec:services mechanism.
The general structure of the spec:services section is as follows:
spec:
services:
<SERVICE>:
<COMPONENT>:
values:
...
Key |
Description |
|---|---|
|
Corresponds to an entry in the |
|
Represents the name of a specific chart within the group of
For OpenStack services, the |
|
Defines the changes to be applied to the chart. The structure under You can inspect the structure of values in a live environment by checking any specific Helm release deployed by Rockoon: helm3 -n openstack get values --all <HELM-RELEASE>
Alternatively, inspect the source code of Rockoon for the charts used by: The values typically follow a standard schema:
|
- 0
Since MOSK 25.1, Mirantis strongly recommends defining custom images through the ConfigMap as described in Custom OpenStack images. This approach allows patched images to be applied automatically during an OpenStack version upgrade.
The following snippet illustrates how to reset the
default_schedule_zone option to its upstream default value and set
the volume_clear option to a custom value:
spec:
services:
compute:
nova:
values:
conf:
nova:
DEFAULT:
default_schedule_zone: <None>
libvirt:
volume_clear: none
The above example generates the following configuration file snippet:
[DEFAULT]
[libvirt]
volume_clear = none
The configuration of the MOSK Dashboard (OpenStack Horizon)
differs from other service configurations because Horizon is a Django
application. Its configuration file is not in the INI format but is instead
a Python file that must adhere to valid Python syntax. This makes it trickier
to populate from the section.key: value format commonly used in JSON or
YAML.
Some options are managed in conf.horizon.local_settings.config
and are rendered into the local_settings.py file with the template defined
in conf.horizon.local_settings.template. Other options can be passed
through the conf.horizon.local_settings.config.raw structure.
In this structure, key: value YAML entries are translated into Pyhton
by approximately the following procedure:
key = json.loads(json.dumps(yaml.loads((value))))
The resulted entries are appended to the end of the local_settings.py file,
allowing you to override any default value.
For example, to prevent launching instances directly from images, and thus,
effectively require boot-from-volume instances exclusively, use the following
structure in the OpenStackDeployment custom resource:
spec:
services:
dashboard:
horizon:
values:
conf:
horizon:
local_settings:
config:
raw:
"LAUNCH_INSTANCE_DEFAULTS['disable_image']": true
Note
Before MOSK 25.2, the json.loads step in
translating the YAML structure to Python code was omitted, effectively
relying on close similarity between Python and JSON syntax for data
structures. However, due to differences in the boolean syntax, it was
impossible to set values to Python’s True or False.
Another example using complex data structure is adding an additional role,
cloud-admin, alongside the default admin, which allows the user
to access the Admin panels in the Dashboard:
spec:
services:
dashboard:
horizon:
values:
conf:
horizon:
local_settings:
config:
raw:
OPENSTACK_KEYSTONE_ADMIN_ROLES:
- admin
- cloud-admin
The above configuration renders as a Python list in the
local_settings.py configuration file:
OPENSTACK_KEYSTONE_ADMIN_ROLES = ["admin", "cloud-admin"]
OpenStackDeploymentStatus custom resource
The resource of kind OpenStackDeploymentStatus is a custom resource that
describes the status of an OpenStack deployment. To obtain detailed information
about the schema of an OpenStackDeploymentStatus custom resource:
kubectl get crd openstackdeploymentstatus.lcm.mirantis.com -o yaml
To obtain the status definition for a particular OpenStack deployment:
kubectl -n openstack get osdplst
Example of system response:
NAME OPENSTACK VERSION CONTROLLER VERSION STATE LCM PROGRESS HEALTH MOSK RELEASE
osh-dev antelope 0.16.1.dev104 APPLIED 20/20 21/22 MOSK 24.1.3
Where:
OPENSTACK VERSIONdisplays the actual OpenStack version of the deploymentCONTROLLER VERSIONindicates the version of the OpenStack Controller (Rockoon) responsible for the deploymentSTATEreflects the current status of life-cycle management. The list of possible values includes:APPLYINGindicates that some Kubernetes objects for applications are in the process of being appliedAPPLIEDindicates that all Kubernetes objects for applications have been applied to the latest state
LCM PROGRESSreflects the current progress ofSTATEin the format X/Y, where X denotes the number of applications with Kubernetes objects applied and in the actual state, and Y represents the total number of applications managed by the OpenStack Controller (Rockoon)HEALTHprovides an overview of the current health status of the OpenStack deployment in the format X/Y, where X represents the number of applications withnotReadypods, and Y is the total number of applications managed by the OpenStack Controller (Rockoon)MOSK RELEASEdisplays the current product release of the OpenStack deployment
NAME OPENSTACK VERSION CONTROLLER VERSION STATE MOSK RELEASE
osh-dev antelope 0.16.1.dev104 APPLIED MOSK 24.1
Where:
OPENSTACK VERSIONdisplays the actual OpenStack version of the deploymentCONTROLLER VERSIONindicates the version of the OpenStack Controller (Rockoon) responsible for the deploymentSTATEreflects the current status of life-cycle management. The list of possible values includes:APPLYINGindicates that some Kubernetes objects for applications are in the process of being appliedAPPLIEDindicates that all Kubernetes objects for applications have been applied to the latest state
MOSK RELEASEdisplays the current product release of the OpenStack deployment
Example of an OpenStackDeploymentStatus custom resource
configuration
1 kind: OpenStackDeploymentStatus
2 metadata:
3 name: osh-dev
4 namespace: openstack
5 spec: {}
6 status:
7 handle:
8 lastStatus: update
9 health:
10 barbican:
11 api:
12 generation: 2
13 status: Ready
14 cinder:
15 api:
16 generation: 2
17 status: Ready
18 backup:
19 generation: 1
20 status: Ready
21 scheduler:
22 generation: 1
23 status: Ready
24 volume:
25 generation: 1
26 status: Ready
27 osdpl:
28 cause: update
29 changes: '((''add'', (''status'',), None, {''watched'': {''ceph'': {''secret'':
30 {''hash'': ''0fc01c5e2593bc6569562b451b28e300517ec670809f72016ff29b8cbaf3e729''}}}}),)'
31 controller_version: 0.5.3.dev12
32 fingerprint: a112a4a7d00c0b5b79e69a2c78c3b50b0caca76a15fe7d79a6ad1305b19ee5ec
33 openstack_version: ussuri
34 state: APPLIED
35 timestamp: "2021-09-08 17:01:45.633143"
36 services:
37 baremetal:
38 controller_version: 0.5.3.dev12
39 fingerprint: a112a4a7d00c0b5b79e69a2c78c3b50b0caca76a15fe7d79a6ad1305b19ee5ec
40 openstack_version: ussuri
41 state: APPLIED
42 timestamp: "2021-09-08 17:00:54.081353"
43 block-storage:
44 controller_version: 0.5.3.dev12
45 fingerprint: a112a4a7d00c0b5b79e69a2c78c3b50b0caca76a15fe7d79a6ad1305b19ee5ec
46 openstack_version: ussuri
47 state: APPLIED
48 timestamp: "2021-09-08 17:00:57.306669"
49 compute:
50 controller_version: 0.5.3.dev12
51 fingerprint: a112a4a7d00c0b5b79e69a2c78c3b50b0caca76a15fe7d79a6ad1305b19ee5ec
52 openstack_version: ussuri
53 state: APPLIED
54 timestamp: "2021-09-08 17:01:18.853068"
55 coordination:
56 controller_version: 0.5.3.dev12
57 fingerprint: a112a4a7d00c0b5b79e69a2c78c3b50b0caca76a15fe7d79a6ad1305b19ee5ec
58 openstack_version: ussuri
59 state: APPLIED
60 timestamp: "2021-09-08 17:01:00.593719"
61 dashboard:
62 controller_version: 0.5.3.dev12
63 fingerprint: a112a4a7d00c0b5b79e69a2c78c3b50b0caca76a15fe7d79a6ad1305b19ee5ec
64 openstack_version: ussuri
65 state: APPLIED
66 timestamp: "2021-09-08 17:00:57.652145"
67 database:
68 controller_version: 0.5.3.dev12
69 fingerprint: a112a4a7d00c0b5b79e69a2c78c3b50b0caca76a15fe7d79a6ad1305b19ee5ec
70 openstack_version: ussuri
71 state: APPLIED
72 timestamp: "2021-09-08 17:01:00.233777"
73 dns:
74 controller_version: 0.5.3.dev12
75 fingerprint: a112a4a7d00c0b5b79e69a2c78c3b50b0caca76a15fe7d79a6ad1305b19ee5ec
76 openstack_version: ussuri
77 state: APPLIED
78 timestamp: "2021-09-08 17:00:56.540886"
79 identity:
80 controller_version: 0.5.3.dev12
81 fingerprint: a112a4a7d00c0b5b79e69a2c78c3b50b0caca76a15fe7d79a6ad1305b19ee5ec
82 openstack_version: ussuri
83 state: APPLIED
84 timestamp: "2021-09-08 17:01:00.961175"
85 image:
86 controller_version: 0.5.3.dev12
87 fingerprint: a112a4a7d00c0b5b79e69a2c78c3b50b0caca76a15fe7d79a6ad1305b19ee5ec
88 openstack_version: ussuri
89 state: APPLIED
90 timestamp: "2021-09-08 17:00:58.976976"
91 ingress:
92 controller_version: 0.5.3.dev12
93 fingerprint: a112a4a7d00c0b5b79e69a2c78c3b50b0caca76a15fe7d79a6ad1305b19ee5ec
94 openstack_version: ussuri
95 state: APPLIED
96 timestamp: "2021-09-08 17:01:01.440757"
97 key-manager:
98 controller_version: 0.5.3.dev12
99 fingerprint: a112a4a7d00c0b5b79e69a2c78c3b50b0caca76a15fe7d79a6ad1305b19ee5ec
100 openstack_version: ussuri
101 state: APPLIED
102 timestamp: "2021-09-08 17:00:51.822997"
103 load-balancer:
104 controller_version: 0.5.3.dev12
105 fingerprint: a112a4a7d00c0b5b79e69a2c78c3b50b0caca76a15fe7d79a6ad1305b19ee5ec
106 openstack_version: ussuri
107 state: APPLIED
108 timestamp: "2021-09-08 17:01:02.462824"
109 memcached:
110 controller_version: 0.5.3.dev12
111 fingerprint: a112a4a7d00c0b5b79e69a2c78c3b50b0caca76a15fe7d79a6ad1305b19ee5ec
112 openstack_version: ussuri
113 state: APPLIED
114 timestamp: "2021-09-08 17:01:03.165045"
115 messaging:
116 controller_version: 0.5.3.dev12
117 fingerprint: a112a4a7d00c0b5b79e69a2c78c3b50b0caca76a15fe7d79a6ad1305b19ee5ec
118 openstack_version: ussuri
119 state: APPLIED
120 timestamp: "2021-09-08 17:00:58.637506"
121 networking:
122 controller_version: 0.5.3.dev12
123 fingerprint: a112a4a7d00c0b5b79e69a2c78c3b50b0caca76a15fe7d79a6ad1305b19ee5ec
124 openstack_version: ussuri
125 state: APPLIED
126 timestamp: "2021-09-08 17:01:35.553483"
127 object-storage:
128 controller_version: 0.5.3.dev12
129 fingerprint: a112a4a7d00c0b5b79e69a2c78c3b50b0caca76a15fe7d79a6ad1305b19ee5ec
130 openstack_version: ussuri
131 state: APPLIED
132 timestamp: "2021-09-08 17:01:01.828834"
133 orchestration:
134 controller_version: 0.5.3.dev12
135 fingerprint: a112a4a7d00c0b5b79e69a2c78c3b50b0caca76a15fe7d79a6ad1305b19ee5ec
136 openstack_version: ussuri
137 state: APPLIED
138 timestamp: "2021-09-08 17:01:02.846671"
139 placement:
140 controller_version: 0.5.3.dev12
141 fingerprint: a112a4a7d00c0b5b79e69a2c78c3b50b0caca76a15fe7d79a6ad1305b19ee5ec
142 openstack_version: ussuri
143 state: APPLIED
144 timestamp: "2021-09-08 17:00:58.039210"
145 redis:
146 controller_version: 0.5.3.dev12
147 fingerprint: a112a4a7d00c0b5b79e69a2c78c3b50b0caca76a15fe7d79a6ad1305b19ee5ec
148 openstack_version: ussuri
149 state: APPLIED
150 timestamp: "2021-09-08 17:00:36.562673"
The health subsection provides a brief output on services health.
The osdpl subsection describes the overall status of the OpenStack
deployment.
Element |
Description |
|---|---|
|
The cause that triggered the LCM action: |
|
A string representation of changes in the |
|
The version of |
|
The SHA sum of the |
|
The current OpenStack version specified in the |
|
The current state of the LCM action. Possible values include:
|
|
The timestamp of the |
The services subsection provides detailed information of LCM performed with
a specific service. This is a dictionary where keys are service names, for
example, baremetal or compute and values are dictionaries with the
following items.
Element |
Description |
|---|---|
|
The version of the |
|
The SHA sum of the |
|
The OpenStack version specified in the |
|
The current state of the LCM action performed on a service. Possible values include:
|
|
The timestamp of the |
OpenStack Controller configuration
Available since MOSK 23.2
OpenStack Controller (Rockoon)
Since MOSK 25.1, the OpenStack Controller has been open-sourced under the name Rockoon and is maintained as an independent open-source project going forward.
As part of this transition, all openstack-controller pods are named
rockoon pods across the MOSK documentation and deployments. This change
does not affect functionality, but this is the reminder for the users to
utilize the new naming for pods and other related artifacts accordingly.
The OpenStack Controller (Rockoon) enables you to modify its configuration at
runtime without restarting. MOSK stores the controller
configuration in the rockoon-config ConfigMap in the osh-system
namespace of your cluster.
To retrieve the Rockoon configuration ConfigMap, run:
kubectl get configmaps rockoon-config -o yaml
Example of a Rockoon configuration ConfigMap
apiVersion: v1
data:
extra_conf.ini: |
[maintenance]
respect_nova_az = false
kind: ConfigMap
metadata:
annotations:
openstackdeployments.lcm.mirantis.com/skip_update: "true"
name: rockoon-config
namespace: osh-system
Section |
Parameter |
Default value |
Description |
|---|---|---|---|
|
|
|
The number of seconds to wait for all application components to become ready. |
|
|
The number of seconds before going to the sleep mode between attempts to verify if the application is ready. |
|
|
|
The amount of time to wait for the flapping node. |
|
|
|
|
The number of seconds to wait until the values set in the manifest are propagated to the dependent objects. |
|
|
The number of seconds between attempts to verify if the values were applied. |
|
|
|
The number of seconds to wait until the values are removed from the manifest and propagated to the child objects. |
|
|
|
The number of seconds between attempts to verify if the values were removed from the release. |
|
|
|
The number of seconds to wait until the Kubernetes object is removed. |
|
|
|
The number of seconds between attempts to verify if the Kubernetes object is removed. |
|
|
|
The number of seconds to pause for the Helm bundle changes. |
|
|
|
|
The number of instances to migrate concurrently. |
|
|
The maximum number of compute nodes allowed for a parallel update. |
|
|
|
The maximum number of gateway nodes allowed for a parallel update. |
|
|
|
Respect Nova availability zone (AZ). The |
|
|
|
The flag to skip the instance verification on a host before proceeding
with the node removal. The |
|
|
|
The flag to skip the volume verification on a host before proceeding
with the node removal. The |
Custom OpenStack images
Available since MOSK 25.1
The OpenStack Controller enables you to use customized images in your OpenStack
deployments. To start using such images, create a ConfigMap in the
openstack namespace with the following content, replacing
<OPENSTACKDEPLOYMENT-NAME> with the name of your OpenStackDeployment
custom resource:
apiVersion: v1
kind: ConfigMap
metadata:
labels:
openstack.lcm.mirantis.com/watch: "true"
name: <OPENSTACKDEPLOYMENT-NAME>-artifacts
namespace: openstack
data:
caracal: |
dep_check: <KUBERNETES-ENTRYPOINT-IMAGE-URL>
openvswitch_db_server: <OPENVSWITCH-IMAGE-URL>
openvswitch_vswitchd: <OPENVSWITCH-IMAGE-URL>
OpenStack database
MOSK relies on the MariaDB Galera cluster to provide its OpenStack components with a reliable storage of persistent data.
For successful long-term operations of a MOSK cloud, it is crucial to ensure the healthy state of the OpenStack database as well as the safety of the data stored in it. To help you with that, MOSK provides built-in automated procedures for OpenStack database maintenance, backup, and restoration. The hereby chapter describes the internal mechanisms and configuration details for the provided tools.
Overview of the OpenStack database backup and restoration
MOSK relies on the MariaDB Galera cluster to provide its OpenStack components with a reliable storage for persistent data. Mirantis recommends backing up your OpenStack databases daily to ensure the safety of your cloud data. Also, you should always create an instant backup before updating your cloud or performing any kind of potentially disruptive experiment.
MOSK has a built-in automated backup routine that can be triggered manually or by schedule. For detailed information about the process of MariaDB Galera cluster backup, refer to Workflows of the OpenStack database backup and restoration.
Backup and restoration can only be performed against the OpenStack database as a whole. Granular per-service or per-table procedures are not supported by MOSK.
Important
Because database restoration reverts to a specific snapshot, the resulting database state may not accurately reflect the current state of dynamic resources such as running VMs, volumes, and similar components. For example:
A VM is removed after a snapshot for restoration is created. Such VM will be present as an orphan entry in the database and the OpenStack API after restoration.
A VM is created after a snapshot for restoration is created. Such VM will disappear from the OpenStack API after database restoration but will still be present as a process on the compute host.
Manually analyze and resolve such inconsistencies.
Restoring a database may also impact applications that rely on it for heartbeats. For instance, Octavia Amphorae may become unresponsive after restoration, potentially requiring LoadBalancer failover to maintain service availability.
By default, periodic backups are turned off. Though, a cloud operator can
easily enable this capability by adding the following structure to the
OpenStackDeployment custom resource:
spec:
features:
database:
backup:
enabled: true
For the configuration details, refer to Periodic OpenStack database backups.
Along with the automated backup routine, MOSK provides the Mariabackup tool for the OpenStack database restoration. For the database restoration procedure, refer to Restore OpenStack databases from a backup. For more information about the restoration process, consult Workflows of the OpenStack database backup and restoration.
By default, MOSK backup routine stores the OpenStack database data into the Mirantis Ceph cluster, which is a part of the same cloud. This is sufficient for the vast majority of clouds. However, you may want to have the backup data stored off the cloud to comply with specific enterprise practices for infrastructure recovery and data safety.
To achieve that, MOSK enables you to point the backup routine to an external data volume. For details, refer to Remote storage for OpenStack database backups.
The size of a backup storage volume depends directly on the size of the
MOSK cluster, which can be determined through the
size parameter in the OpenStackDeployment CR.
The list of the recommended sizes for a minimal backup volume includes:
20 GB for the
tinycluster size40 GB for the
smallcluster size80 GB for the
mediumcluster size
If required, you can change the default size of a database backup volume. However, make sure that you configure the volume size before OpenStack deployment is complete. This is because there is no automatic way to resize the backup volume once the cloud is deployed. Also, only the local backup storage (Ceph) supports the configuration of the volume size.
To change the default size of the backup volume, use the following structure
in the OpenStackDeployment CR:
spec:
services:
database:
mariadb:
values:
volume:
phy_backup:
size: "200Gi"
To store the backup data to a local Mirantis Ceph, the MOSK underlying Kubernetes cluster needs to have a preconfigured storage class for Kubernetes persistent volumes with the Ceph cluster as a storage backend.
When restoring the OpenStack database from a local Ceph storage, the cron job restores the state on each MariaDB node sequentially. It is not possible to perform parallel restoration because Ceph Kubernetes volumes do not support concurrent mounting from multiple places.
Additionally, MOSK allows for increased backup safety through synchronization of local MariaDB backups with a remote S3 storage. For details, see Synchronization of local MariaDB backups with a remote S3 storage.
MOSK provides you with a capability to store the OpenStack database data outside of the cloud, on an external storage device that supports common data access protocols, such as third-party NAS appliances.
Refer to Remote storage for OpenStack database backups for the configuration details.
Available since MOSK 25.1 TechPreview
Security compliance may require storing backups of databases in an encrypted
format. MOSK enables encryption of database backups, both
local and remote, using the OpenSSL aes-256-cbc encryption.
To encrypt database backups, add the following configuration to the
OpenStackDeployment custom resource:
spec:
features:
database:
backup:
encryption:
enabled: true
Workflows of the OpenStack database backup and restoration
This section provides technical details about the internal implementation of automated backup and restoration routines built into MOSK. The below information would be helpful for troubleshooting of any issues related to the process or understanding the impact these procedures impose on a running cloud.
The OpenStack database backup workflow consists of the following phases.
The mariadb-phy-backup job is responsible for:
Performing basic sanity checks and choosing right node for backup
Verifying the wsrep status and changing the
wsrep_desyncparameter settingsChecking backup integrity (ensuring correct hash sums)
Managing the
mariadb-phy-backup-runnerpodIf enabled, synchronizing the local backup storage with the remote S3 storage
During the first backup phase, the following actions take place:
The
mariadb-phy-backuppod starts on the node where themariadb-serverreplica with the highest number in its name runs. For example, if the MariaDB server pods are namedmariadb-server-0,mariadb-server-1, andmariadb-server-2, themariadb-phy-backuppod starts on the same node asmariadb-server-2.The backup process verifies the hash sums of existing backup files based on ConfigMap information:
If the verification fails and synchronization with the remote S3 storage is enabled, the process checks the hash sums of remote backups as well. If the remote backups are valid, they are downloaded.
If the hash sums are incorrect for both local and remote backups, the backup job fails.
If no ConfigMap exists, these hash sum checks are skipped.
Sanity check: verification of the Kubernetes status and wsrep status of each MariaDB pod. If some pods have wrong statuses, the backup job fails unless the
--allow-unsafe-backupparameter is passed to the main script in the Kubernetes backup job.Note
Since MOSK 22.4, the
--allow-unsafe-backupfunctionality is removed from the product for security and backup procedure simplification purposes.Mirantis does not recommend setting the
--allow-unsafe-backupparameter unless it is absolutely required. To ensure the consistency of a backup, verify that the MariaDB Galera cluster is in a working state before you proceed with the backup.Desynchronize the replica from the Galera cluster. The script connects the target replica and sets the
wsrep_desyncvariable toON. Then, the replica stops receiving write-sets and receives the wsrep statusDonor/Desynced. The Kubernetes health check of thatmariadb-serverpod fails and the Kubernetes status of that pod becomesNot ready. If the pod has theprimarylabel, the MariaDB Controller sets thebackuplabel to it and the pod is removed from the endpoints list of the MariaDB service.Verify that there is enough space in the
/var/backupfolder to perform the backup. The amount of available space in the folder should exceed<DB-SIZE> * <MARIADB-BACKUP-REQUIRED-SPACE-RATIO>in KB.
The
mariadb-phy-backuppod performs the backup using the mariabackup tool.The script puts the backed up replica back to sync with the Galera cluster by setting
wsrep_desynctoOFFand waits for the replica to becomeReadyin Kubernetes.
The script calculates hash sums for backup files and stores them in a special ConfigMap.
If the number of existing backups exceeds the value of the
MARIADB_BACKUPS_TO_KEEPjob parameter, the script removes the oldest backups to maintain the allowed limit.If enabled, the script synchronizes the local backup storage with the remote S3 storage.
The OpenStack database restoration workflow consists of the following phases.
The mariadb-phy-restore job launches the mariadb-phy-restore pod.
This pod starts with the mariadb-server PVC with the highest number
in its name. This PVC is mounted to the /var/lib/mysql folder and the
backup PVC (or local filesystem if the hostapath backend is configured)
is mounted to /var/backup.
The mariadb-phy-restore pod contains the main restore script, which is
responsible for:
Scaling the
mariadb-serverStatefulSetVerifying the statuses of
mariadb-serverpodsManaging the
openstack-mariadb-phy-restore-runnerpodsChecking backup integrity (ensuring correct hash sums)
Caution
During the restoration, the database is not available for OpenStack services that means a complete outage of all OpenStack services.
During the first phase, the following actions take place:
The restoration process verifies the hash sums of existing backup files based on ConfigMap information:
If the verification fails and synchronization with the remote S3 storage is enabled, the process checks the hash sums of remote backups as well. If the remote backups are valid, they are downloaded.
If the hash sums are incorrect for both local and remote backups, the backup job fails.
Save the list of
mariadb-serverpersistent volume claims (PVC).Scale the
mariadbserver StatefulSet to0replicas. At this point, the database becomes unavailable for OpenStack services.
The
mariadb-phy-restorepod performs the following actions:Launches the
openstack-mariadb-phy-restore-runnerpod for eachmariadb-serverPVC. This pod cleans all MySQL data on each PVC.Collects logs from the
openstack-mariadb-phy-restore-runnerpod and then removes it.Unarchives the database backup files to a temporary directory within
/var/backup.Executes
mariabackup --prepareon the unarchived data.Restores the backup to
/var/lib/mysql.
The
mariadb-phy-restorepod scales themariadb-serverStatefulSet back to the configured number of replicas.The
mariadb-phy-restorepod waits until allmariadb-serverreplicas are ready.
OpenStack database auto-cleanup
By design, when deleting a cloud resource, for example, an instance, volume, or router, an OpenStack service does not immediately delete its data but marks it as removed so that it can later be picked up by the garbage collector.
Given that an OpenStack resource is often represented by more than one record in the database, deletion of all of them right away could affect the overall responsiveness of the cloud API. On the other hand, an OpenStack database being severely clogged with stale data is one of the most typical reasons for the cloud slowness.
To keep the OpenStack database small and performance fast, MOSK is pre-configured to automatically clean up the removed database records older than 30 days. By default, the clean up is performed for the following MOSK services every Monday according to the schedule:
Service |
Service identifier |
Clean up time |
|---|---|---|
Block Storage (OpenStack Cinder) |
|
12:01 a.m. |
Compute (OpenStack Nova) |
|
01:01 a.m. |
Image (OpenStack Glance) |
|
02:01 a.m. |
Instance HA (OpenStack Masakari) |
|
03:01 a.m. |
Key Manager (OpenStack Barbican) |
|
04:01 a.m. |
Orchestration (OpenStack Heat) |
|
05:01 a.m. |
If required, you can adjust the cleanup schedule for the OpenStack database by
adding the features:database:cleanup setting to the OpenStackDeployment
CR following the example below. The schedule parameter must contain a
valid cron expression. The age parameter specifies the number of days after
which a stale record gets cleaned up.
spec:
features:
database:
cleanup:
<os-service-identifier>:
enabled: true
schedule: "1 0 * * 1"
age: 30
batch: 1000
Periodic OpenStack database backups
MOSK uses the Mariabackup utility to back up the MariaDB Galera cluster data where the OpenStack data is stored. The Mariabackup gets launched on a periodic basis as a part of the Kubernetes CronJob included in any MOSK deployment and is suspended by default.
Note
If you are using the default backend to store the backup data, which is Ceph, you can increase the default size of a backup volume. However, make sure to configure the volume size before you deploy OpenStack.
For the default sizes and configuration details, refer to Size of a backup storage.
MOSK enables you to configure the periodic backup of the
OpenStack database through the OpenStackDeployment object. To enable the
backup, use the following structure:
spec:
features:
database:
backup:
enabled: true
TechPreview
To enhance cloud security, you can enable encryption of OpenStack
database backups using the OpenSSL aes-256-cbc encryption
through the OpenStackDeployment custom resource. Refer to
Backup encryption for configuration details.
By default, the backup job:
Runs backup on a daily basis at 01:00 AM
Creates incremental backups daily and full backups weekly
Keeps 10 latest full backups
Stores backups in the
mariadb-phy-backup-dataPVCHas the backup timeout of
3600secondsHas the
incrementalbackup type
To verify the configuration of the mariadb-phy-backup CronJob
object, run:
kubectl -n openstack get cronjob mariadb-phy-backup
Example of a mariadb-phy-backup CronJob object
apiVersion: batch/v1beta1
kind: CronJob
metadata:
annotations:
openstackhelm.openstack.org/release_uuid: ""
creationTimestamp: "2020-09-08T14:13:48Z"
managedFields:
<<<skipped>>>>
name: mariadb-phy-backup
namespace: openstack
resourceVersion: "726449"
selfLink: /apis/batch/v1beta1/namespaces/openstack/cronjobs/mariadb-phy-backup
uid: 88c9be21-a160-4de1-afcf-0853697dd1a1
spec:
concurrencyPolicy: Forbid
failedJobsHistoryLimit: 1
jobTemplate:
metadata:
creationTimestamp: null
labels:
application: mariadb-phy-backup
component: backup
release_group: openstack-mariadb
spec:
activeDeadlineSeconds: 4200
backoffLimit: 0
completions: 1
parallelism: 1
template:
metadata:
creationTimestamp: null
labels:
application: mariadb-phy-backup
component: backup
release_group: openstack-mariadb
spec:
containers:
- command:
- /tmp/mariadb_resque.py
- backup
- --backup-timeout
- "3600"
- --backup-type
- incremental
env:
- name: MARIADB_BACKUPS_TO_KEEP
value: "10"
- name: MARIADB_BACKUP_PVC_NAME
value: mariadb-phy-backup-data
- name: MARIADB_FULL_BACKUP_CYCLE
value: "604800"
- name: MARIADB_REPLICAS
value: "3"
- name: MARIADB_BACKUP_REQUIRED_SPACE_RATIO
value: "1.2"
- name: MARIADB_RESQUE_RUNNER_IMAGE
value: docker-dev-kaas-local.docker.mirantis.net/general/mariadb:10.4.14-bionic-20200812025059
- name: MARIADB_RESQUE_RUNNER_SERVICE_ACCOUNT
value: mariadb-phy-backup-runner
- name: MARIADB_RESQUE_RUNNER_POD_NAME_PREFIX
value: openstack-mariadb
- name: MARIADB_POD_NAMESPACE
valueFrom:
fieldRef:
apiVersion: v1
fieldPath: metadata.namespace
image: docker-dev-kaas-local.docker.mirantis.net/general/mariadb:10.4.14-bionic-20200812025059
imagePullPolicy: IfNotPresent
name: phy-backup
resources: {}
securityContext:
allowPrivilegeEscalation: false
readOnlyRootFilesystem: true
terminationMessagePath: /dev/termination-log
terminationMessagePolicy: File
volumeMounts:
- mountPath: /tmp
name: pod-tmp
- mountPath: /tmp/mariadb_resque.py
name: mariadb-bin
readOnly: true
subPath: mariadb_resque.py
- mountPath: /tmp/resque_runner.yaml.j2
name: mariadb-bin
readOnly: true
subPath: resque_runner.yaml.j2
- mountPath: /etc/mysql/admin_user.cnf
name: mariadb-secrets
readOnly: true
subPath: admin_user.cnf
dnsPolicy: ClusterFirst
initContainers:
- command:
- kubernetes-entrypoint
env:
- name: POD_NAME
valueFrom:
fieldRef:
apiVersion: v1
fieldPath: metadata.name
- name: NAMESPACE
valueFrom:
fieldRef:
apiVersion: v1
fieldPath: metadata.namespace
- name: INTERFACE_NAME
value: eth0
- name: PATH
value: /usr/local/sbin:/usr/local/bin:/usr/sbin:/usr/bin:/sbin:/bin:/
- name: DEPENDENCY_SERVICE
- name: DEPENDENCY_DAEMONSET
- name: DEPENDENCY_CONTAINER
- name: DEPENDENCY_POD_JSON
- name: DEPENDENCY_CUSTOM_RESOURCE
image: docker-dev-kaas-local.docker.mirantis.net/openstack/extra/kubernetes-entrypoint:v1.0.0-20200311160233
imagePullPolicy: IfNotPresent
name: init
resources: {}
securityContext:
allowPrivilegeEscalation: false
readOnlyRootFilesystem: true
runAsUser: 65534
terminationMessagePath: /dev/termination-log
terminationMessagePolicy: File
nodeSelector:
openstack-control-plane: enabled
restartPolicy: Never
schedulerName: default-scheduler
securityContext:
runAsUser: 999
serviceAccount: mariadb-phy-backup
serviceAccountName: mariadb-phy-backup
terminationGracePeriodSeconds: 30
volumes:
- emptyDir: {}
name: pod-tmp
- name: mariadb-secrets
secret:
defaultMode: 292
secretName: mariadb-secrets
- configMap:
defaultMode: 365
name: mariadb-bin
name: mariadb-bin
schedule: 0 1 * * *
successfulJobsHistoryLimit: 3
suspend: false
To override the default configuration, set the parameters and environment variables that are passed to the CronJob as described in the tables below.
Parameter |
Type |
Default |
Description |
|---|---|---|---|
|
String |
|
Type of a backup. The list of possible values include:
Usage example: spec:
features:
database:
backup:
backup_type: incremental
|
|
Integer |
|
Timeout in seconds for the system to wait for the backup operation to succeed. Usage example: spec:
services:
database:
mariadb:
values:
conf:
phy_backup:
backup_timeout: 30000
|
|
Boolean |
|
Not recommended, removed since MOSK 22.4. If set to
Usage example: spec:
services:
database:
mariadb:
values:
conf:
phy_backup:
allow_unsafe_backup: true
|
Variable |
Type |
Default |
Description |
|---|---|---|---|
|
Integer |
|
Number of full backups to keep. Usage example: spec:
features:
database:
backup:
backups_to_keep: 3
|
|
String |
|
Persistent volume claim used to store backups. Usage example: spec:
services:
database:
mariadb:
values:
conf:
phy_backup:
backup_pvc_name: mariadb-phy-backup-data
|
|
Integer |
|
Number of seconds that defines a period between 2 full backups.
During this period, incremental backups are performed. The parameter
is taken into account only if Usage example: spec:
features:
database:
backup:
full_backup_cycle: 70000
|
|
Floating |
|
Multiplier for the database size to predict the space required to create a backup, either full or incremental, and perform a restoration keeping the uncompressed backup files on the same file system as the compressed ones. To estimate the size of The Usage example: spec:
services:
database:
mariadb:
values:
conf:
phy_backup:
backup_required_space_ratio: 1.4
|
For example, to perform full backups monthly and incremental backups
daily at 02:30 AM and keep the backups for the last six months,
configure the database backup in your OpenStackDeployment object
as follows:
spec:
features:
database:
backup:
enabled: true
backups_to_keep: 6
schedule_time: '30 2 * * *'
full_backup_cycle: 2628000
Remote storage for OpenStack database backups
By default, MOSK stores the OpenStack database backups locally in the Mirantis Ceph cluster, which is a part of the same cloud.
Alternatively, MOSK provides you with a capability to create remote backups using an external storage. This section contains configuration details for a remote backend to be used for the OpenStack data backup.
In general, the built-in automated backup routine saves the data to the
mariadb-phy-backup-data PersistentVolumeClaim (PVC), which is provisioned
from StorageClass specified in the spec.persistent_volume_storage_class
parameter of the OpenstackDeployment custom resource (CR).
TechPreview
A preconfigured NFS server with NFS share that a Unix backup and restore user has access to. By default, it is the same user that runs MySQL server in a MariaDB image.
To get the Unix user ID, run:
kubectl -n openstack get cronjob mariadb-phy-backup -o jsonpath='{.spec.jobTemplate.spec.template.spec.securityContext.runAsUser}'
Note
Verify that the NFS server is accessible through the network from all of the OpenStack control plane nodes of the cluster.
The
nfs-commonpackage installed on all OpenStack control plane nodes.
Only NFS Unix authentication is supported.
Removal of the NFS persistent volume does not automatically remove the data.
No validation of mount options. If mount options are specified incorrectly in the
OpenStackDeploymentCR, the mount command fails upon the creation of a backup runner pod.
To enable the NFS backend, configure the following structure in the
OpenStackDeployment object:
spec:
features:
database:
backup:
enabled: true
backend: pv_nfs
pv_nfs:
server: <ip-address/dns-name-of-the-server>
path: <path-to-the-share-folder-on-the-server>
TechPreview
To enhance cloud security, you can enable encryption of OpenStack
database backups using the OpenSSL aes-256-cbc encryption
through the OpenStackDeployment custom resource. Refer to
Backup encryption for configuration details.
Optionally, MOSK enables you to set the required mount options for the NFS mount command. You can set as many options of mount as you need. For example:
spec:
services:
database:
mariadb:
values:
volume:
phy_backup:
nfs:
mountOptions:
- "nfsvers=4"
- "hard"
Synchronization of local MariaDB backups with a remote S3 storage
Available since MOSK 25.1 TechPreview
MOSK provides the capability to synchronize local MariaDB backups with a remote S3 storage. Distributing backups across multiple locations increases their safety. Optionally, backup archives stored in S3 can be encrypted on the server side.
To enable synchronization, you need to have a preconfigured S3 storage and a user account for access.
Only one remote S3 storage can be configured
Disabling the S3 synchronization does not automatically remove the data
Verify that the S3 storage is accessible through the network from all OpenStack control plane nodes.
Create the secret to store credentials for access to the S3 storage:
--- apiVersion: v1 kind: Secret metadata: labels: openstack.lcm.mirantis.com/osdpl_secret: "true" name: mariadb-backup-s3-hidden namespace: openstack type: Opaque data: access_key: <ACCESS-KEY-FOR-S3-ACCOUNT> secret_key: <SECRET-KEY-FOR-S3-ACCOUNT> sse_kms_key_id: <SECRET-KEY-FOR-SERVER-SIDE-ENCRYPTION>
Enable synchronization by adding the following structure to the
OpenStackDeploymentcustom resource. For example, to use Ceph RadosGW as the S3 storage provider and enable server-side encryption for stored archives:spec: features: database: backup: enabled: true sync_remote: enabled: true remotes: << remote name >>: conf: type: s3 provider: Ceph endpoint: <URL-TO-S3-STORAGE> path: <BUCKET-NAME-FOR-BACKUPS-ON-S3-STORAGE> server_side_encryption: aws:kms access_key_id: value_from: secret_key_ref: key: access_key name: mariadb-backup-s3-hidden secret_access_key: value_from: secret_key_ref: key: secret_key name: mariadb-backup-s3-hidden sse_kms_key_id: value_from: secret_key_ref: key: sse_kms_key_id name: mariadb-backup-s3-hidden
Alternatively, you can set the
providerparameter toAWSif you prefer using AWS as a provider for S3 storage and omit theserver_side_encryptionandsse_kms_key_idparameters if encryption is not required.
OpenStack message bus
The internal components of Mirantis OpenStack for Kubernetes (MOSK) coordinate their operations and exchange status information using the cluster’s message bus (RabbitMQ).
Exposable OpenStack notifications
Available since MOSK 22.5
MOSK enables you to configure OpenStack services to emit
notification messages to the MOSK cluster messaging bus
(RabbitMQ) every time an OpenStack resource, for example, an instance, image,
and so on, changes its state due to a cloud user action or through its
lifecycle. For example, MOSK Compute service (OpenStack
Nova) can publish the instance.create.end notification once a newly created
instance is up and running.
Note
In certain cases, RabbitMQ notifications may prove unreliable, such as when the RabbitMQ server undergoes a restart or when communication between the server and the client reading the notifications breaks down. To optimize reliability, Mirantis suggests using multiple channels to store notification events, encompassing:
StackLight notifications
Storing audit as part of the OpenStack logs
Sample of an instance.create.end notification
{
"event_type": "instance.create.end",
"payload": {
"nova_object.data": {
"action_initiator_project": "6f70656e737461636b20342065766572",
"action_initiator_user": "fake",
"architecture": "x86_64",
"auto_disk_config": "MANUAL",
"availability_zone": "nova",
"block_devices": [],
"created_at": "2012-10-29T13:42:11Z",
"deleted_at": null,
"display_description": "some-server",
"display_name": "some-server",
"fault": null,
"flavor": {
"nova_object.data": {
"description": null,
"disabled": false,
"ephemeral_gb": 0,
"extra_specs": {
"hw:watchdog_action": "disabled"
},
"flavorid": "a22d5517-147c-4147-a0d1-e698df5cd4e3",
"is_public": true,
"memory_mb": 512,
"name": "test_flavor",
"projects": null,
"root_gb": 1,
"rxtx_factor": 1.0,
"swap": 0,
"vcpu_weight": 0,
"vcpus": 1
},
"nova_object.name": "FlavorPayload",
"nova_object.namespace": "nova",
"nova_object.version": "1.4"
},
"host": "compute",
"host_name": "some-server",
"image_uuid": "155d900f-4e14-4e4c-a73d-069cbf4541e6",
"instance_name": "instance-00000001",
"ip_addresses": [
{
"nova_object.data": {
"address": "192.168.1.3",
"device_name": "tapce531f90-19",
"label": "private",
"mac": "fa:16:3e:4c:2c:30",
"meta": {},
"port_uuid": "ce531f90-199f-48c0-816c-13e38010b442",
"version": 4
},
"nova_object.name": "IpPayload",
"nova_object.namespace": "nova",
"nova_object.version": "1.0"
}
],
"kernel_id": "",
"key_name": "my-key",
"keypairs": [
{
"nova_object.data": {
"fingerprint": "1e:2c:9b:56:79:4b:45:77:f9:ca:7a:98:2c:b0:d5:3c",
"name": "my-key",
"public_key": "ssh-rsa AAAAB3NzaC1yc2EAAAADAQABAAAAgQDx8nkQv/zgGgB4rMYmIf+6A4l6Rr+o/6lHBQdW5aYd44bd8JttDCE/F/pNRr0lRE+PiqSPO8nDPHw0010JeMH9gYgnnFlyY3/OcJ02RhIPyyxYpv9FhY+2YiUkpwFOcLImyrxEsYXpD/0d3ac30bNH6Sw9JD9UZHYcpSxsIbECHw== Generated-by-Nova",
"type": "ssh",
"user_id": "fake"
},
"nova_object.name": "KeypairPayload",
"nova_object.namespace": "nova",
"nova_object.version": "1.0"
}
],
"launched_at": "2012-10-29T13:42:11Z",
"locked": false,
"locked_reason": null,
"metadata": {},
"node": "fake-mini",
"os_type": null,
"power_state": "running",
"progress": 0,
"ramdisk_id": "",
"request_id": "req-5b6c791d-5709-4f36-8fbe-c3e02869e35d",
"reservation_id": "r-npxv0e40",
"state": "active",
"tags": [
"tag"
],
"task_state": null,
"tenant_id": "6f70656e737461636b20342065766572",
"terminated_at": null,
"trusted_image_certificates": [
"cert-id-1",
"cert-id-2"
],
"updated_at": "2012-10-29T13:42:11Z",
"user_id": "fake",
"uuid": "178b0921-8f85-4257-88b6-2e743b5a975c"
},
"nova_object.name": "InstanceCreatePayload",
"nova_object.namespace": "nova",
"nova_object.version": "1.12"
},
"priority": "INFO",
"publisher_id": "nova-compute:compute"
}
OpenStack notification messages can be consumed and processed by various corporate systems to integrate MOSK clouds into the company infrastructure and business processes.
The list of the most common use cases includes:
Using notification history for retrospective security audit
Using the real-time aggregation of notification messages to gather statistics on cloud resource consumption for further capacity planning
Cloud billing considerations
Notifications alone should not be considered as a source of data for any kind of financial reporting. The delivery of the messages can not be guaranteed due to various technical reasons. For example, messages can be lost if an external consumer is not fetching them from the queue fast enough.
Mirantis strongly recommends that your cloud billing solutions rely on the combination of the following data sources:
Periodic polling of the OpenStack API as a reliable source of information about allocated resources
Subscription to notifications to receive timely updates about the resource status change
If you are looking for a ready-to-use billing solution for your cloud, contact Mirantis or one of our partners.
A cloud administrator can securely expose part of a MOSK cluster message bus to the outside world. This enables an external consumer to subscribe to the notification messages emitted by the cluster services.
Important
The latest OpenStack release available in MOSK supports notifications from the following services:
Block storage (OpenStack Cinder)
DNS (OpenStack Designate)
Image (OpenStack Glance)
Orchestration (OpenStack Heat)
Bare Metal (OpenStack Ironic)
Identity (OpenStack Keystone)
Shared Filesystems (OpenStack Manila)
Instance High Avalability (OpenStack Masakari)
Networking (OpenStack Neutron)
Compute (OpenStack Nova)
To enable the external notification endpoint, add the following structure
to the OpenStackDeployment custom resource. For example:
spec:
features:
messaging:
notifications:
external:
enabled: true
topics:
- external-consumer-A
- external-consumer-2
For each topic name specified in the topics field, MOSK
creates a topic exchange in its RabbitMQ cluster together with a set of queues
bound to this topic. All enabled MOSK services will
publish their notification messages to all configured topics so that
multiple consumers can receive the same messages in parallel.
A topic name must follow Kubernetes standard format for object names and IDs
that is only lowercase alphanumeric characters, -, or . The topic
name notifications is reserved for the internal use.
MOSK supports the connection to message bus (RabbitMQ) through an encrypted or non-encrypted endpoint. Once connected, it supports authentication through either a plain text user name and password or mutual TLS authentication using encrypted X.509 client certificates.
Each topic exchange is protected by automatically generated authentication
credentials and certificates for secure connection that are stored as a secret
in the openstack-external namespace of a MOSK underlying
Kubernetes cluster. A secret is identified by the name of the topic. The list
of attributes for the secret object includes:
hostsThe IP addresses which an external notification endpoint is available on
port_amqp,port_amqp-tlsThe TCP ports which external notification endpoint is available on
vhostThe name of the RabbitMQ virtual host which the topic queues are created on
username,passwordAuthentication data
ca_certThe client CA certificate
client_certThe client certificate
client_keyThe client private key
For the configuration example above, the following objects will be created:
kubectl -n openstack-external get secret
NAME TYPE DATA AGE
openstack-external-consumer-A-notifications Opaque 4 4m51s
openstack-external-consumer-2-notifications Opaque 4 4m51s
Tungsten Fabric
Tungsten Fabric provides basic L2/L3 networking to an OpenStack environment running on the MKE cluster and includes the IP address management, security groups, floating IP addresses, and routing policies functionality. Tungsten Fabric is based on overlay networking, where all virtual machines are connected to a virtual network with encapsulation (MPLSoGRE, MPLSoUDP, VXLAN). This enables you to separate the underlay Kubernetes management network. A workload requires an external gateway, such as a hardware EdgeRouter or a simple gateway to route the outgoing traffic.
The Tungsten Fabric vRouter uses different gateways for the control and data planes.
Tungsten Fabric cluster
All services of Tungsten Fabric are delivered as separate containers, which are deployed by the Tungsten Fabric Operator (TFO). Each container has an INI-based configuration file that is available on the host system. The configuration file is generated automatically upon the container start and is based on environment variables provided by the TFO through Kubernetes ConfigMaps.
The main Tungsten Fabric containers run with the host network as
DeploymentSet, without using the Kubernetes networking layer. The services
listen directly on the host network interface.
The following diagram describes the minimum production installation of Tungsten Fabric with a Mirantis OpenStack for Kubernetes (MOSK) deployment.
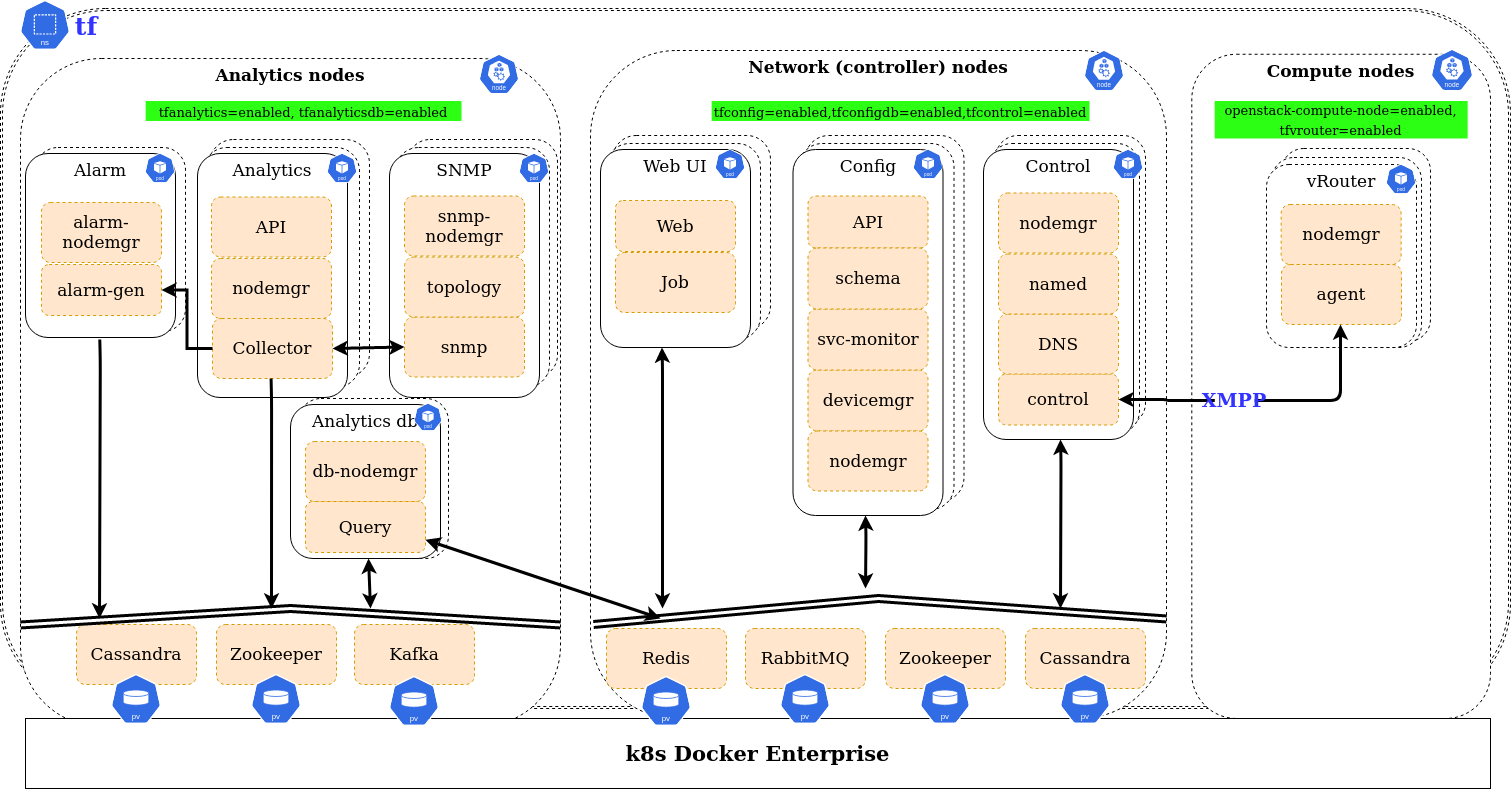
For the details about the Tungsten Fabric services included in MOSK deployments and the types of traffic and traffic flow directions, see the subsections below.
Tungsten Fabric cluster components
This section describes the Tungsten Fabric services and their distribution across the Mirantis OpenStack for Kubernetes (MOSK) deployment.
The Tungsten Fabric services run mostly as DaemonSets in separate containers for each service. The deployment and update processes are managed by the Tungsten Fabric Operator. However, Kubernetes manages the probe checks and restart of broken containers.
All configuration and control services run on the Tungsten Fabric Controller nodes.
Service name |
Service description |
|---|---|
|
Exposes a REST-based interface for the Tungsten Fabric API. |
|
Provisions the node for execution of configuration services. |
|
Communicates with the cluster gateways using BGP and with the vRouter agents using XMPP, as well as redistributes appropriate networking information. |
|
Provisions the node for execution of configuration services. |
|
Manages physical networking devices using |
|
Using the |
|
The customized Berkeley Internet Name Domain (BIND) daemon of
Tungsten Fabric that manages DNS zones for the |
|
Listens to configuration changes performed by a user and generates corresponding system configuration objects. In multi-node deployments, it works in the active-backup mode. |
|
Listens to configuration changes of |
|
Consists of the |
Unsupported since MOSK 24.2
All analytics services run on Tungsten Fabric analytics nodes.
Service name |
Service description |
|---|---|
|
Evaluates and manages the alarms rules. |
|
Provides a REST API to interact with the Cassandra analytics database. |
|
Collects all Tungsten Fabric analytics process data and sends
this information to the Tungsten Fabric |
|
Provisions the init model if needed. Collects data of the |
|
Collects and analyzes data from all Tungsten Fabric services. |
|
Handles the queries to access data from the Cassandra database. |
|
Receives the authorization and configuration of the physical routers
from the |
|
Reads the SNMP information from the physical router user-visible entities (UVEs), creates a neighbor list, and writes the neighbor information to the physical router UVEs. The Tungsten Fabric web UI uses the neighbor list to display the physical topology. |
The Tungsten Fabric vRouter provides data forwarding to an OpenStack tenant instance and reports statistics to the Tungsten Fabric analytics service. The Tungsten Fabric vRouter is installed on all OpenStack compute nodes. Mirantis OpenStack for Kubernetes (MOSK) supports the kernel-based deployment of the Tungsten Fabric vRouter.
Service name |
Service description |
|---|---|
|
Connects to the Tungsten Fabric Controller container and the Tungsten Fabric DNS system using the Extensible Messaging and Presence Protocol (XMPP). The vRouter Agent acts as a local control plane. Each Tungsten Fabric vRouter Agent is connected to at least two Tungsten Fabric controllers in an active-active redundancy mode. The Tungsten Fabric vRouter Agent is responsible for all networking-related functions including routing instances, routes, and others. The Tungsten Fabric vRouter uses different gateways for the control and data planes. For example, the Linux system gateway is located on the management network, and the Tungsten Fabric gateway is located on the data plane network. |
|
Provisions the node for the vRouter agent execution. |
The following diagram illustrates the Tungsten Fabric kernel vRouter set up by the TF operator:
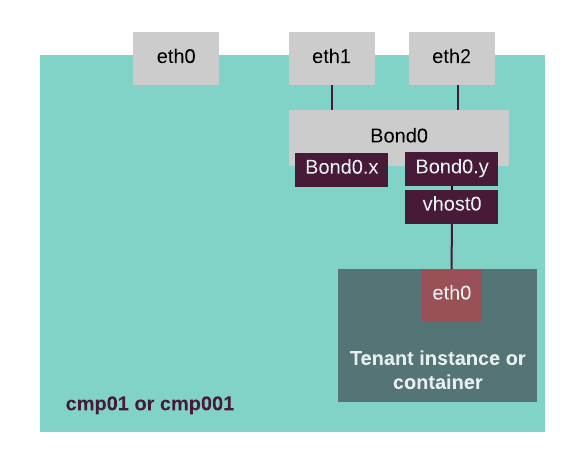
On the diagram above, the following types of networks interfaces are used:
eth0- for the management (PXE) network (eth1andeth2are the slave interfaces ofBond0)Bond0.x- for the MKE control plane networkBond0.y- for the MKE data plane network
Service name |
Service description |
|---|---|
|
|
|
The Kubernetes operator that enables the Cassandra clusters creation and management. |
|
Handles the messaging bus and generates alarms across the Tungsten Fabric analytics containers. |
|
The Kubernetes operator that enables Kafka clusters creation and management. |
|
Stores the physical router UVE storage and serves as a messaging bus for event notifications. |
|
The Kubernetes operator that enables Redis clusters creation and management. |
|
Holds the active-backup status for the |
|
The Kubernetes operator that enables ZooKeeper clusters creation and management. |
|
Exchanges messages between API servers and original request senders. |
|
The Kubernetes operator that enables RabbitMQ clusters creation and management. |
All Tungsten Fabric plugin services are installed on the OpenStack Controller (Rockoon) nodes.
Service name |
Service description |
|---|---|
|
The Neutron server that includes the Tungsten Fabric plugin. |
|
The Octavia API that includes the Tungsten Fabric Octavia driver. |
|
The Heat API that includes the Tungsten Fabric Heat resources and templates. |
Along with the Tungsten Fabric services, MOSK deploys and
updates special image precaching DaemonSets when the kind TFOperator
resource is created or image references in it get updated.
These DaemonSets precache container images on Kubernetes nodes minimizing
possible downtime when updating container images. Cloud operator can
disable image precaching through the TFOperator resource.
See also
Tungsten Fabric traffic flow
This section describes the types of traffic and traffic flow directions in a Mirantis OpenStack for Kubernetes (MOSK) cluster.
The following diagram illustrates all types of UI and API traffic in a Mirantis OpenStack for Kubernetes cluster, including the monitoring and OpenStack API traffic. The OpenStack Dashboard pod hosts Horizon and acts as a proxy for all other types of traffic. TLS termination is also performed for this type of traffic.
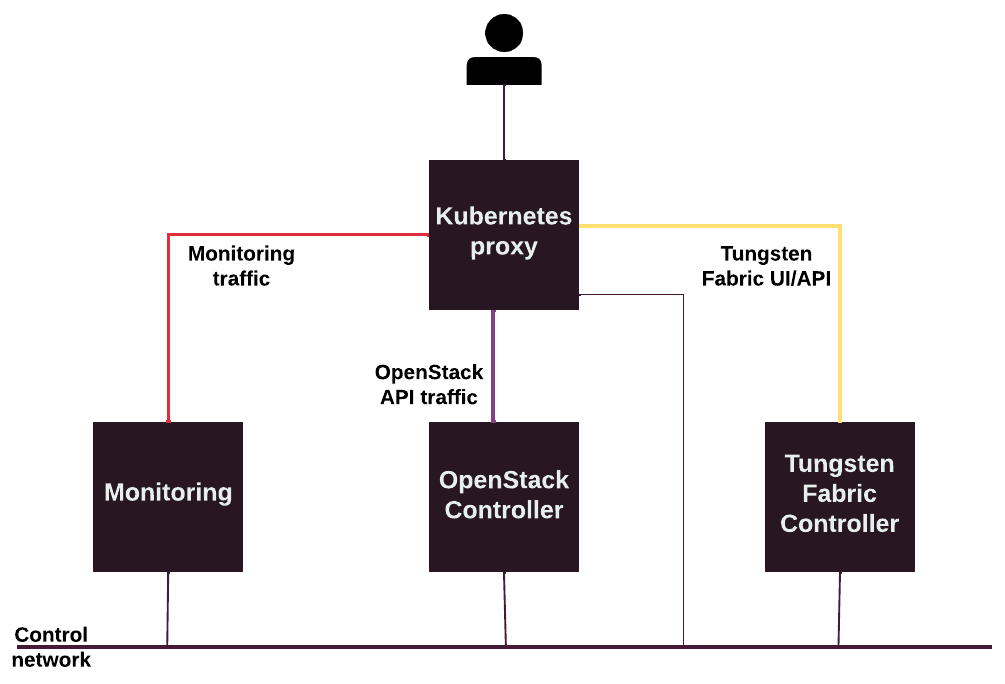
SDN or Tungsten Fabric traffic goes through the overlay Data network and processes east-west and north-south traffic for applications that run in a MOSK cluster. This network segment typically contains tenant networks as separate MPLS-over-GRE and MPLS-over-UDP tunnels. The traffic load depends on the workload.
The control traffic between the Tungsten Fabric controllers, edge routers, and vRouters uses the XMPP with TLS and iBGP protocols. Both protocols produce low traffic that does not affect MPLS over GRE and MPLS over UDP traffic. However, this traffic is critical and must be reliably delivered. Mirantis recommends configuring higher QoS for this type of traffic.
The following diagram displays both MPLS over GRE/MPLS over UDP and iBGP and XMPP traffic examples in a MOSK cluster:
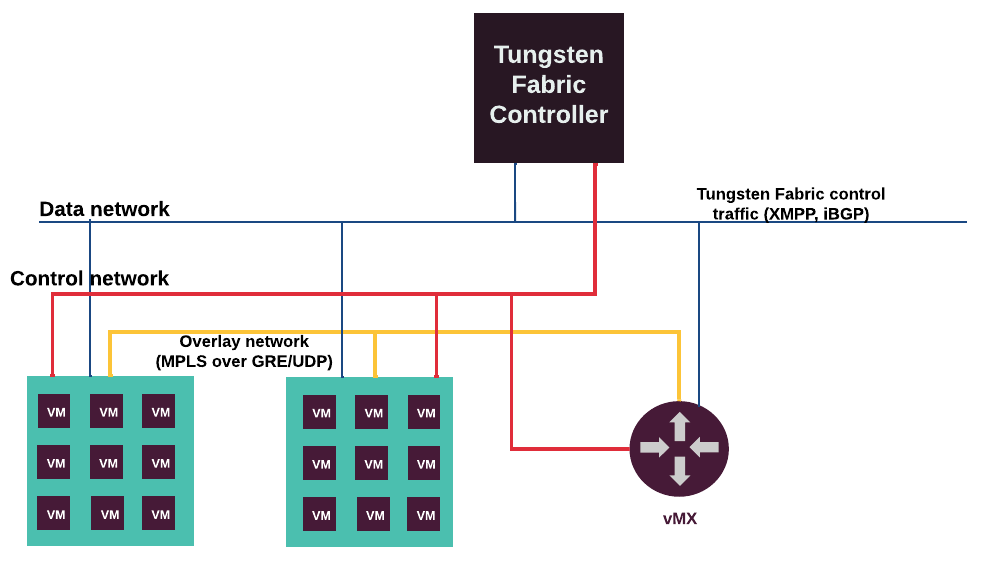
Tungsten Fabric lifecycle management
Mirantis OpenStack for Kubernetes (MOSK) provides the Tungsten Fabric lifecycle management including pre-deployment custom configurations, updates, data backup and restoration, as well as handling partial failure scenarios, by means of the Tungsten Fabric operator.
This section is intended for the cloud operators who want to gain insight into the capabilities provided by the Tungsten Fabric operator along with the understanding of how its architecture allows for easy management while addressing the concerns of users of Tungsten Fabric-based MOSK clusters.
Tungsten Fabric Operator
The Tungsten Fabric Operator (TFO) is based on the Kubernetes operator SDK project. The Kubernetes operator SDK is a framework that uses the controller-runtime library to make writing operators easier by providing the following:
High-level APIs and abstractions to write the operational logic more intuitively.
Tools for scaffolding and code generation to bootstrap a new project fast.
Extensions to cover common operator use cases.
The TFO deploys the following sub-operators. Each sub-operator handles a separate part of a TF deployment:
Network |
Description |
|---|---|
TFControl |
Deploys the Tungsten Fabric control services, such as:
|
TFConfig |
Deploys the Tungsten Fabric configuration services, such as: |
TFAnalytics Unsupported since MOSK 24.2 |
Deploys the Tungsten Fabric analytics services, such as: |
TFVrouter |
Deploys a vRouter on each compute node with the following services:
|
TFWebUI |
Deploys the following web UI services:
|
TFTool |
Deploys the following tools for debug purposes:
|
TFTest |
An operator to run Tempest tests. |
- 0(1,2,3,4,5,6,7)
Since MOSK 24.3,
Provisioneris a separate component for the vRouter, deployed as thetf-vrouter-provisionerDaemonSet. TheNodeManagerservice is no longer deployed in TF setups.
Besides the sub-operators that deploy TF services, TFO uses operators to deploy and maintain third-party services, such as different types of storage, cache, message system, and so on. The following table describes all third-party operators:
Network |
Description |
|---|---|
casandra-operator |
An upstream operator that automates the Cassandra HA storage operations for the configuration data. |
zookeeper-operator |
An upstream operator for deployment and automation of a ZooKeeper cluster. |
redis-operator |
An upstream operator that automates the Redis cluster deployment and keeps it healthy. |
rabbitmq-operator |
An operator for the messaging system based on RabbitMQ. |
The following diagram illustrates a simplified TFO workflow:
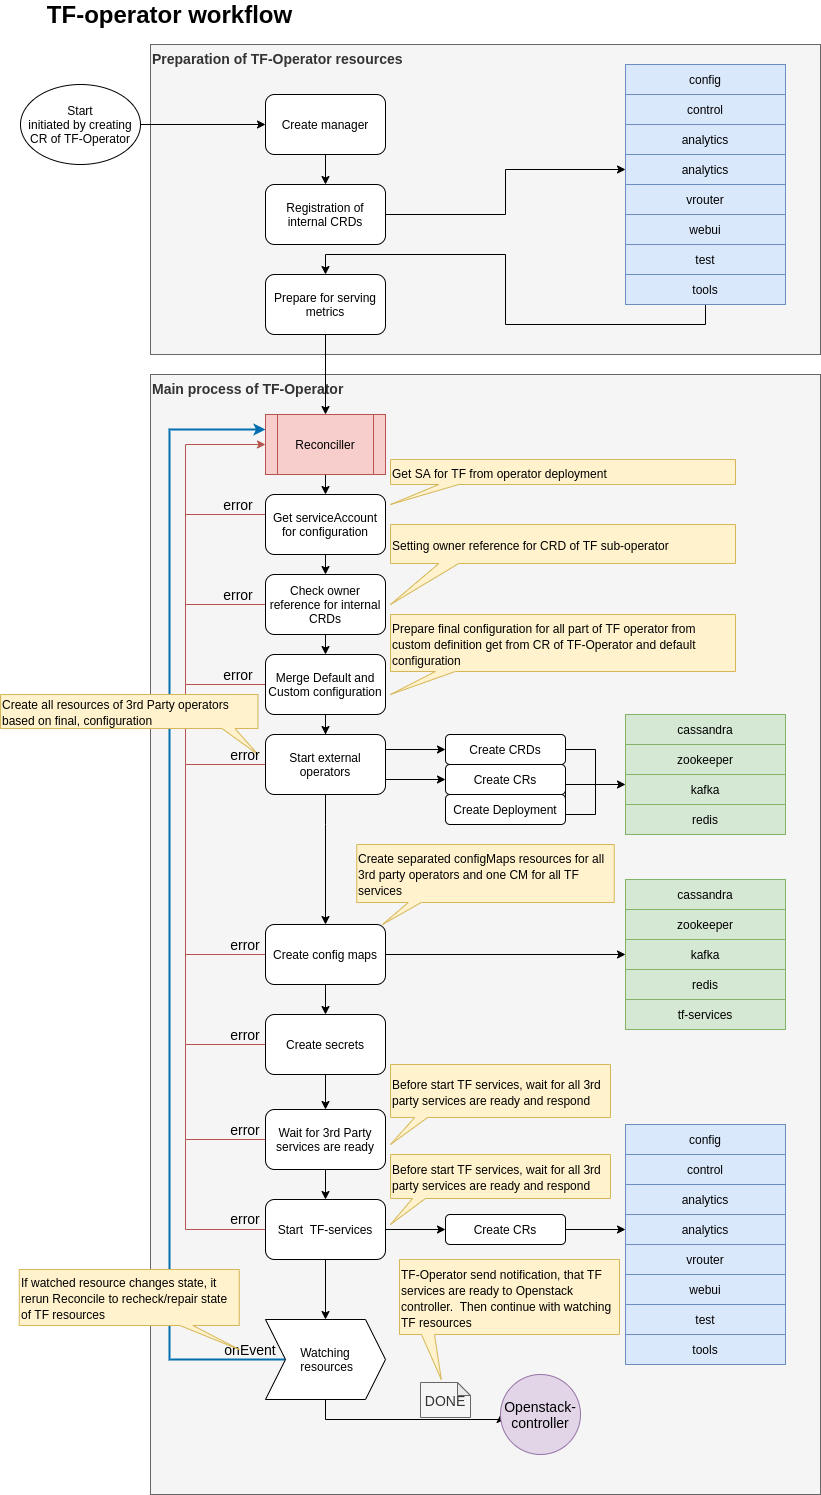
TFOperator custom resource
The resource of kind TFOperator is a custom resource defined by a resource
of kind CustomResourceDefinition.
The CustomResourceDefinition resource in Kubernetes uses the OpenAPI
Specification version 2 to specify the schema of the defined resource.
The Kubernetes API outright rejects the resources that do not pass this schema
validation. Along with schema validation, TFOperator uses
ValidatingAdmissionWebhook for extended validations when a custom resource
is created or updated.
Important
Since 24.1, MOSK introduces the technical preview support for the API v2 for the Tungsten Fabric Operator. This version of the Tungsten Fabric Operator API aligns with the OpenStack Controller API and provides better interface for advanced configurations. Refer to Key differences between TFOperator API v1alpha1 and v2 for details.
For the list of configuration options available to a cloud operator, refer to Tungsten Fabric configuration. Also, check out the Tungsten Fabric Operator resources document of the MOSK version that your cluster has been deployed with.
Tungsten Fabric Operator uses ValidatingAdmissionWebhook to validate
environment variables set to Tungsten Fabric components upon the TFOperator
object creation or update. The following validations are performed:
Environment variables passed to the Tungsten Fabric components containers
Mapping between
tfVersionandtfImageTag, if definedSchedule for
dbBackupData capacity format
Feature variable values
Availability of the
dataStorageClassclass
If required, you can disable ValidatingAdmissionWebhook through the
TFOperator HelmBundle resource:
apiVersion: lcm.mirantis.com/v1alpha1
kind: HelmBundle
metadata:
name: tungstenfabric-operator
namespace: tf
spec:
releases:
- name: tungstenfabric-operator
values:
admission:
enabled: false
Warning
The features section of the TFOperator specification
allows for easy configuration of all Tungsten Fabric features. Mirantis
recommends updating the environment variables through envSettings
directly.
Environment variables |
Tungsten Fabric service and |
|---|---|
|
|
|
|
|
|
|
|
|
|
|
|
|
|
|
|
|
|
|
|
Environment variables |
Tungsten Fabric components and containers |
|---|---|
|
|
|
|
|
|
|
|
|
|
|
|
|
|
|
|
|
|
|
|
|
|
Key differences between TFOperator API v1alpha1 and v2
This section outlines the main differences between the v1alpha1 and v2 versions of the TFOperator API:
Introduction of the
featuressection:All non-default Tungsten Fabric and Tungsten Fabric Operator features can now be set in the
featuressection.Setting environment variables is no longer necessary but can still be done using the
envSettingfield in each Tungsten Fabric service section.
Relocation of
CustomSpecfrom the vRouter agent specification to the nodes section.Reorganization of the
controllerssection:The
controllerssection has been integrated into theservicessection.The
servicessection is now divided into groups:analytics,config,control,vRouter, andwebUI.Configuration of third-party services can be performed through the
analyticsorconfigsections.
Configuration of the logging levels can be performed using the
loggingfield, which is a separate field in each Tungsten Fabric services configuration.Movement of the
dataStorageClassandtfVersionfields to the upper level of the specification.Introduction of the
devOptionssection enabling the setup of experimental development-related options.
See also
Tungsten Fabric configuration
Mirantis OpenStack for Kubernetes (MOSK) allows you to easily adapt
your Tungsten Fabric deployment to the needs of your environment through the
TFOperator custom resource.
This section includes custom configuration details available to you.
Important
Since 24.1, MOSK introduces the technical preview support for the API v2 for the Tungsten Fabric Operator. This version of the Tungsten Fabric Operator API aligns with the OpenStack Controller API and provides better interface for advanced configurations. In MOSK 24.1, the API v2 is available only for the new product deployments with Tungsten Fabric.
Since 24.2, the API v2 becomes default for new product deployments and
includes the ability to convert existing v1alpha1 TFOperator to v2
during update.
During the update to the 24.3 series, the old Tungsten Fabric cluster
configuration API v1alpha1 is automatically converted and replaced
with the v2 version. Therefore, since MOSK 24.3,
start using the v2 TFOperator custom resource for any updates.
The v1alpha1 TFOperator custom resource remains in the cluster
but is no longer reconciled and will be automatically removed in
MOSK 25.1.
Cassandra configuration
This section describes the Cassandra configuration through the Tungsten Fabric Operator custom resource.
By default, Tungsten Fabric Operator sets up the following resource limits for Cassandra analytics and configuration StatefulSets:
Limits:
cpu: 8
memory: 32Gi
Requests:
cpu: 1
memory: 16Gi
This is a verified configuration suitable for most cases. However, if nodes
are under a heavy load, the KubeContainerCPUThrottlingHigh StackLight alert
may raise for Tungsten Fabric Pods of the tf-cassandra-analytics and
tf-cassandra-config StatefulSets. If such alerts appear constantly, you can
increase the limits through the TFOperator custom resource. For example:
spec:
services:
analytics:
enabled: true
cassandra:
resources:
limits:
cpu: "12"
memory: 32Gi
requests:
cpu: "2"
memory: 16Gi
config:
cassandra:
resources:
limits:
cpu: "12"
memory: 32Gi
requests:
cpu: "2"
memory: 16Gi
spec:
controllers:
cassandra:
deployments:
- name: tf-cassandra-config
resources:
limits:
cpu: "12"
memory: 32Gi
requests:
cpu: "2"
memory: 16Gi
- name: tf-cassandra-analytics
resources:
limits:
cpu: "12"
memory: 32Gi
requests:
cpu: "2"
memory: 16Gi
To specify custom configurations for Cassandra clusters, use the
configOptions settings in the TFOperator custom resource.
For example, you may need to increase the file cache size in case
of a heavy load on the nodes labeled with tfanalyticsdb=enabled
or tfconfigdb=enabled:
spec:
services:
analytics:
enabled: true
cassandra:
configOptions:
file_cache_size_in_mb: 1024
spec:
controllers:
cassandra:
deployments:
- name: tf-cassandra-analytics
configOptions:
file_cache_size_in_mb: 1024
Custom vRouter settings
TechPreview
Depending on the Tungsten Fabric Operator API version in use, proceed with one of the following options:
To specify custom settings for the Tungsten Fabric vRouter nodes, for
example, to change the name of the tunnel network interface or enable
debug level logging on some subset of nodes, use the nodes settings in
the TFOperator custom resource.
For example, to enable debug level logging on a specific node or multiple nodes:
spec:
nodes:
<CUSTOMSPEC-NAME>:
labels:
name: <NODE-LABEL>
value: <NODE-LABEL-VALUE>
nodeVRouter:
enabled: true
envSettings:
agent:
env:
- name: LOG_LEVEL
value: SYS_DEBUG
To specify custom settings for the Tungsten Fabric vRouter nodes, for
example, to change the name of the tunnel network interface or enable
debug level logging on some subset of nodes, use the customSpecs
settings in the TFOperator custom resource.
For example, to enable debug level logging on a specific node or multiple nodes:
spec:
controllers:
tf-vrouter:
agent:
customSpecs:
- name: <CUSTOMSPEC-NAME>
label:
name: <NODE-LABEL>
value: <NODE-LABEL-VALUE>
containers:
- name: agent
env:
- name: LOG_LEVEL
value: SYS_DEBUG
Caution
The customspecs:name value must follow the RFC 1123
international format. Verify that the name of a DaemonSet object
is a valid DNS subdomain name.
The customSpecs parameter inherits all settings for the tf-vrouter
containers that are set on the spec:controllers:agent level and
overrides or adds additional parameters. The example configuration above
overrides the logging level from SYS_INFO, which is the default logging
level, to SYS_DEBUG.
For clusters with a multi-rack architecture, you may need to redefine the
gateway IP for the Tungsten Fabric vRouter nodes using the
VROUTER_GATEWAY parameter. For details, see Multi-rack architecture.
Control plane traffic interface
By default, the TF control service uses the management interface for
the BGP and XMPP traffic. You can change the control service interface
using the controlInterface parameter in the TFOperator custom resource,
for example, to combine the BGP and XMPP traffic with the data (tenant)
traffic:
spec:
features:
control:
controlInterface: <tunnel-interface>
spec:
settings:
controlInterface: <tunnel-interface>
Traffic encapsulation
Tungsten Fabric implements cloud tenants’ virtual networks as Layer 3 overlays. Tenant traffic gets encapsulated into one of the supported protocols and is carried over the infrastructure network between 2 compute nodes or a compute node and an edge router device.
In addition, Tungsten Fabric is capable of exchanging encapsulated traffic with external systems in order to build advanced virtual networking topologies, for example, BGP VPN connectivity between 2 MOSK clouds or a MOSK cloud and a cloud tenant premises.
MOSK supports the following encapsulation protocols:
- MPLS over Generic Routing Encapsulation (GRE)
A traditional encapsulation method supported by several router vendors, including Cisco and Juniper. The feature is applicable when other encapsulation methods are not available. For example, an SDN gateway runs software that does not support MPLS over UDP.
- MPLS over User Datagram Protocol (UDP)
A variation of the MPLS over GRE mechanism. It is the default and the most frequently used option in MOSK. MPLS over UDP replaces headers in UDP packets. In this case, a UDP port stores a hash of the packet payload (entropy). It provides a significant benefit for equal-cost multi-path (ECMP) routing load balancing. MPLS over UDP and MPLS over GRE transfer Layer 3 traffic only.
- Virtual Extensible LAN (VXLAN) TechPrev
The combination of VXLAN and EVPN technologies is often used for creating advanced cloud networking topologies. For example, it can provide transparent Layer 2 interconnections between Virtual Network Functions running on top of the cloud and physical traffic generator appliances hosted somewhere else.
The ENCAP_PRIORIY parameter defines the priority in which the
encapsulation protocols are attempted to be used when setting the BGP VPN
connectivity between the cloud and external systems.
By default, the encapsulation order is set to MPLSoUDP,MPLSoGRE,VXLAN.
The cloud operator can change it depending their needs in the TFOperator
custom resource as it is illustrated in Configuring encapsulation.
The list of supported encapsulated methods along with their order is shared between BGP peers as part of the capabilities information exchange when establishing a BGP session. Both parties must support the same encapsulation methods to build a tunnel for the network traffic.
For example, if the cloud operator wants to set up a Layer 2 VPN between the cloud and their network infrastructure, they configure the cloud’s virtual networks with VXLAN identifiers (VNIs) and do the same on the other side, for example, on a network switch. Also, VXLAN must be set in the first position in encapsulation priority order. Otherwise, VXLAN tunnels will not get established between endpoints, even though both endpoints may support the VXLAN protocol.
However, setting VXLAN first in the encapsulation priority order will not enforce VXLAN encapsulation between compute nodes or between compute nodes and gateway routers that use Layer 3 VPNs for communication.
The TFOperator custom resource allows you to define encapsulation settings
for your Tungsten Fabric cluster.
Important
The TFOperator custom resource must be the only place to
configure the cluster encapsulation. Performing these configurations through
the Tungsten Fabric web UI, CLI, or API does not provide the configuration
persistency, and the settings defined this way may get reset to defaults
during the cluster services restart or update.
Note
Defining the default values for encapsulation parameters in
the TFOperator custom resource is unnecessary.
Depending on the Tungsten Fabric operator API version in use, proceed with one of the following options:
Parameter |
Default value |
Description |
|---|---|---|
|
|
Defines the encapsulation priority order. |
|
|
Defines the Virtual Network ID type. The list of possible values includes:
|
Example configuration:
features:
config:
vxlanVnIdMode: automatic
encapPriority: VXLAN,MPLSoUDP,MPLSoGRE
Parameter |
Default value |
Description |
|---|---|---|
|
|
Defines the encapsulation priority order. |
|
|
Defines the Virtual Network ID type. The list of possible values includes:
Typically, for a Layer 2 VPN use case, the |
Example configuration:
controllers:
tf-config:
provisioner:
containers:
- env:
- name: VXLAN_VN_ID_MODE
value: automatic
- name: ENCAP_PRIORITY
value: VXLAN,MPLSoUDP,MPLSoGRE
name: provisioner
Autonomous System Number (ASN)
In the routing fabric of a data centre, a MOSK cluster with Tungsten Fabric enabled can be represented either by a separate Autonomous System (AS) or as part of a bigger autonomous system. In either case, Tungsten Fabric needs to participate in the BGP peering, exchanging routes with external devices and within the cloud.
The Tungsten Fabric Controller acts as an internal (iBGP) route reflector for
the cloud AS by populating /32 routes pointing to VMs across all compute
nodes as well as the cloud’s edge gateway devices in case they belong to the
same AS. Apart from being an iBGP router reflector for the cloud AS, the
Tungsten Fabric Controller can act as a BGP peer for autonomous systems
external to the cloud, for example, for the AS configured across the
leaf-spine fabric of the data center.
The Autonomous System Number (ASN) setting contains the unique identifier of the autonomous system that the MOSK cluster with Tungsten Fabric belongs to. The ASN number does not affect the internal iBGP communication between vRouters running on the compute nodes. Such communication will work regardless of the ASN number settings. However, any network appliance that is not managed by the Tungsten Fabric control plane will have BGP configured manually. Therefore, the ASN settings should be configured accordingly on both sides. Otherwise, it would result in the inability to establish BPG sessions, regardless of whether the external device peers with Tungsten Fabric over iBGP or eBGP.
The TFOperator custom resource enables you to define ASN settings for
your Tungsten Fabric cluster.
Important
The TFOperator CR must be the only place to configure
the cluster ASN. Performing these configurations through the Tungsten
Fabric web UI, CLI, or API does not provide the configuration persistency,
and the settings defined this way may get reset to defaults during
the cluster services restart or update.
Note
Defining the default values for ASN parameters in the Tungsten Fabric Operator custom resource is unnecessary.
Depending on the Tungsten Fabric Operator API version in use, proceed with one of the following options:
Parameter |
Default value |
Description |
|---|---|---|
|
|
Defines ASN of the control node. |
|
|
Enables the 4-byte ASN format. |
Example configuration:
features:
config:
bgpAsn: 64515
enable4ByteAS: true
Parameter |
Default value |
Description |
|---|---|---|
|
|
Defines ASN of the control node. |
|
|
Enables the 4-byte ASN format. |
Example configuration:
controllers:
tf-config:
provisioner:
containers:
- env:
- name: BGP_ASN
value: "64515"
- name: ENABLE_4BYTE_AS
value: "true"
name: provisioner
tf-control:
provisioner:
containers:
- env:
- name: BGP_ASN
value: "64515"
name: provisioner
Access to external DNS
By default, the Tungsten Fabric tf-control-dns-external service is created
to expose the Tungsten Fabric control dns. You can disable creation of this
service through the enableDNSExternal parameter in the TFOperator
custom resource. For example:
spec:
features:
control:
enableDNSExternal: false
spec:
controllers:
tf-control:
dns:
enableDNSExternal: false
Gateway for vRouter data plane network
If an edge router is accessible from the data plane through a gateway, define
the vRouter gateway in the TFOperator custom resource. Otherwise,
the default system gateway is used.
Depending on the Tungsten Fabric Operator API version in use, proceed with one of the following configurations:
Define the vRouterGateway parameter in the features section of
the TFOperator custom resource:
spec:
features:
vRouter:
vRouterGateway: <data-plane-network-gateway>
Define the VROUTER_GATEWAY parameter in the TFOperator custom
resource:
spec:
controllers:
tf-vrouter:
agent:
containers:
- name: agent
env:
- name: VROUTER_GATEWAY
value: <data-plane-network-gateway>
Tungsten Fabric image precaching
By default, MOSK deploys image precaching DaemonSets
to minimize possible downtime when updating container images. You can disable
creation of these DaemonSets by setting the imagePreCaching parameter in
the TFOperator custom resource to false:
spec:
features:
imagePreCaching: false
spec:
settings:
imagePreCaching: false
Graceful restart and long-lived graceful restart
Available since MOSK 23.2 for Tungsten Fabric 21.4 only TechPreview
Graceful restart and long-lived graceful restart are vital mechanisms within BGP (Border Gateway Protocol) routing, designed to optimize the routing tables convergence in scenarios where a BGP router restarts or a networking failure is experienced, leading to interruptions of router peering.
During a graceful restart, a router can signal its BGP peers about its impending restart, requesting them to retain the routes it had previously advertised as active. This allows for seamless network operation and minimal disruption to data forwarding during the router downtime.
The long-lived aspect of the long-lived graceful restart extends the graceful restart effectiveness beyond the usual restart duration. This extension provides an additional layer of resilience and stability to BGP routing updates, bolstering the network ability to manage unforeseen disruptions.
Caution
Mirantis does not generally recommend using the graceful restart and long-lived graceful restart features with the Tungsten Fabric XMPP helper, unless the configuration is done by proficient operators with at-scale expertise in networking domain and exclusively to address specific corner cases.
Tungsten Fabric Operator allows for easy enablement and configuration
of the graceful restart and long-lived graceful restart features through
the TFOperator custom resource:
spec:
features:
control:
gracefulRestart:
enabled: <BOOLEAN>
bgpHelperEnabled: <BOOLEAN>
xmppHelperEnabled: <BOOLEAN>
restartTime: <TIME_IN_SECONDS>
llgrRestartTime: <TIME_IN_SECONDS>
endOfRibTimeout: <TIME_IN_SECONDS>
spec:
settings:
settings:
gracefulRestart:
enabled: <BOOLEAN>
bgpHelperEnabled: <BOOLEAN>
xmppHelperEnabled: <BOOLEAN>
restartTime: <TIME_IN_SECONDS>
llgrRestartTime: <TIME_IN_SECONDS>
endOfRibTimeout: <TIME_IN_SECONDS>
Parameter |
Default value |
Description |
|---|---|---|
|
|
Enables or disables graceful restart and long-lived graceful restart features. |
|
|
Specifies the time interval, when the Tungsten Fabric control services act as a graceful restart helper to the edge router or any other BGP peer by retaining the routes learned from this peer and advertising them to the rest of the network as applicable. Note BGP peer should support and be configured with graceful restart for all of the address families used. |
|
|
Specifies the time interval, when the datapath agent should retain the last route path from the Tungsten Fabric Controller when an XMPP-based connection is lost. |
|
|
Configures a non-zero restart time in seconds to advertise for graceful restart capability from peers. |
|
|
Specifies the amount of time in seconds the vRouter datapath should keep advertised routes from the Tungsten Fabric control services, when an XMPP connection between the control and vRouter agent services is lost. Note When graceful restart and long-lived graceful restart are both configured, the duration of the long-lived graceful restart timer is the sum of both timers. |
|
|
Specifies the amount of time in seconds a control node waits to remove stale routes from a vRouter agent Routing Information Base (RIB). |
Configuring the protocol for connecting to Cassandra clusters
To streamline and improve the efficiency of communication between clients and the database, Cassandra is transitioning away from the Thrift protocol in favor of the Query Language (CQL) protocol starting with MOSK 24.1. Since MOSK 24.2, Cassandra uses the CQL protocol by default.
CQL provides a more user-friendly and SQL-like interface for interacting with the database. With the move towards CQL, the Thrift-based client drivers are no longer actively supported encouraging the users to migrate to CQL-based client drivers to take advantage of new features and improvements in Cassandra.
If your cluster is running MOSK 24.1.x, you can enable the CQL protocol proceeding with one of the options below depending on the Tungsten Fabric Operator API version in use.
During update to MOSK 24.2, switching from Thrift to CQL
is performed automatically. While it is possible to switch back to Thrift,
Mirantis does not recommend it. If you choose to do so, specify thrift
instead of cql in the configuration examples below.
Define the cassandraDriver parameter in the devOptions section of
the TFOperator custom resource:
spec:
devOptions:
cassandraDriver: cql
Define the CONFIGDB_CASSANDRA_DRIVER variable for the tf-analytics,
tf-config, and tf-control controllers in the TFOperator custom
resource:
spec:
controllers:
tf-analytics:
alarm-gen:
containers:
- env:
- name: CONFIGDB_CASSANDRA_DRIVER
value: cql
name: alarm-gen
api:
containers:
- env:
- name: CONFIGDB_CASSANDRA_DRIVER
value: cql
name: api
collector:
containers:
- env:
- name: CONFIGDB_CASSANDRA_DRIVER
value: cql
name: collector
snmp:
containers:
- env:
- name: CONFIGDB_CASSANDRA_DRIVER
value: cql
name: snmp
topology:
containers:
- env:
- name: CONFIGDB_CASSANDRA_DRIVER
value: cql
name: topology
tf-config:
api:
containers:
- env:
- name: CONFIGDB_CASSANDRA_DRIVER
value: cql
name: api
devicemgr:
containers:
- env:
- name: CONFIGDB_CASSANDRA_DRIVER
value: cql
name: devicemgr
schema:
containers:
- env:
- name: CONFIGDB_CASSANDRA_DRIVER
value: cql
name: schema
svc-monitor:
containers:
- env:
- name: CONFIGDB_CASSANDRA_DRIVER
value: cql
name: svc-monitor
tf-control:
control:
containers:
- env:
- name: CONFIGDB_CASSANDRA_DRIVER
value: cql
name: control
dns:
containers:
- env:
- name: CONFIGDB_CASSANDRA_DRIVER
value: cql
name: dns
SR-IOV Spoof Check control for Tungsten Fabric
Available since MOSK 24.2 TechPreview
MOSK provides the capability to enable SR-IOV Spoof Check control with the Neutron Tungsten Fabric backend.
The capability can be useful for certain network configurations. For example, you might need to allow traffic from a virtual function interface even when its MAC address does not match the MAC address inside the virtual machine. In this scenario, known as MAC spoofing, disabling spoof check enables the traffic to pass through regardless of the MAC address mismatch.
Caution
Certain NICs and drivers may not handle the spoofchk setting.
For example, the Intel 82599ES NIC paired with the ixgbe driver disregards
the spoofchk setting when VLAN tagging is enabled. Therefore, ensure
compatibility with your hardware configuration regarding spoofchk
handling before proceeding.
To enable SR-IOV Spoof Check control for Tungsten Fabric, enable SR-IOV
interfaces handling by Nova os-vif plugin in the OpenStackDeployment
custom resource:
services:
compute:
nova:
values:
conf:
nova:
workarounds:
pass_hwveb_ports_to_os_vif_plugin: true
Now, you can enable and disable spoof checking for certain SR-IOV ports through the OpenStack CLI. To disable spoof checking on an SR-IOV port:
openstack port set --no-security-group --disable-port-security <SRIOV-PORT>
To enable spoof checking on an SR-IOV port:
openstack port set --enable-port-security <SRIOV-PORT>
Availability zones
The Tungsten Fabric Operator provides a capability to configure
the netns_availability_zone parameter of the Tungsten Fabric
svc-monitor service through the netnsAZ parameter. This configuration
enables MOSK users to specify an availability zone for
Tungsten Fabric instances, such as HAProxy (load balancer instances) or SNAT
routers.
Configuration:
spec:
features:
config:
netnsAZ: <NETNS_AVAILABILITY_ZONE>
Tungsten Fabric database
Tungsten Fabric (TF) uses Cassandra and ZooKeeper to store its data. Cassandra is a fault-tolerant and horizontally scalable database that provides persistent storage of configuration and analytics data. ZooKeeper is used by TF for allocation of unique object identifiers and transactions implementation.
To prevent data loss, Mirantis recommends that you simultaneously back up the ZooKeeper database dedicated to configuration services and the Cassandra database.
The backup of database must be consistent across all systems because the state of the Tungsten Fabric databases is associated with other system databases, such as OpenStack databases.
Periodic Tungsten Fabric database backups
MOSK enables you to perform the automatic TF
data backup in the JSON format using the tf-dbbackup-job cron job.
By default, it is disabled. To back up the TF databases, enable
tf-dbBackup in the TF Operator custom resource:
spec:
features:
dbBackup:
enabled: true
spec:
controllers:
tf-dbBackup:
enabled: true
By default, the tf-dbbackup-job job is scheduled for weekly execution,
allocating PVC of 5 Gi size for storing backups and keeping 5 previous
backups. To configure the backup parameters according to the needs of your
cluster, use the following structure:
spec:
features:
dbBackup:
enabled: true
dataCapacity: 30Gi
schedule: "0 0 13 * 5"
storedBackups: 10
spec:
controllers:
tf-dbBackup:
enabled: true
dataCapacity: 30Gi
schedule: "0 0 13 * 5"
storedBackups: 10
To temporarily disable tf-dbbackup-job, suspend the job:
spec:
features:
dbBackup:
enabled: true
suspend: true
spec:
controllers:
tf-dbBackup:
enabled: true
suspend: true
To delete the tf-dbbackup-job job, disable tf-dbBackup in
the TF Operator custom resource:
spec:
features:
dbBackup:
enabled: false
spec:
controllers:
tf-dbBackup:
enabled: false
Remote storage for Tungsten Fabric database backups
MOSK enables you to store Tungsten Fabric database backups on a remote storage system. Using remote storage helps offload backups from the control plane nodes, improves data durability, and simplifies disaster recovery procedures. This section explains how to configure the supported remote storage options, including Network File System (NFS) storage and S3 object storage.
Available since MOSK 23.2 TechPreview
MOSK supports configuring a remote NFS storage for Tungsten
Fabric data backups through the TFOperator custom resource:
spec:
features:
dbBackup:
enabled: true
backupType: "pv_nfs"
nfsOptions:
path: <PATH_TO_SHARE_FOLDER_ON_SERVER>
server: <IP_ADDRESS/DNS_NAME_OF_SERVER>
spec:
controllers:
tf-dbBackup:
enabled: true
backupType: "pv_nfs"
nfsOptions:
path: <PATH_TO_SHARE_FOLDER_ON_SERVER>
server: <IP_ADDRESS/DNS_NAME_OF_SERVER>
If PVC backups were used previously, the old PVC will not be utilized. You can delete it with the following command:
kubectl -n tf delete pvc <TF_DB_BACKUP_PVC>
Available since MOSK 25.2 TechPreview
MOSK enables you to configure the Tungsten Fabric Operator to store and synchronize database backups with a remote S3 storage. This feature keeps backups off the control plane nodes and ensures that the backup data is protected by encryption both in flight and at rest.
Known limitations:
Only one remote S3 storage can be configured at a time.
Disabling S3 synchronization does not automatically remove existing data from the remote storage.
To enable synchronization with remote S3 storage:
Verify that the remote storage is accessible from all Tungsten Fabric control plane nodes.
Create a Kubernetes secret to store the S3 access credentials:
--- apiVersion: v1 kind: Secret metadata: name: tf-backup-s3-secret namespace: tf type: Opaque data: access_key: <ACCESS-KEY-FOR-S3-ACCOUNT> secret_key: <SECRET-KEY-FOR-S3-ACCOUNT> sse_kms_key_id: <SECRET-KEY-FOR-SERVER-SIDE-ENCRYPTION>
Enable synchronization by adding the following parameters to the
TFOperatorcustom resource:spec: features: dbBackup: enabled: true remoteSync: enabled: true provider: Ceph endpoint: https://openstack-store.it.just.works/ path: bucket_name type: s3 serverSideEncryption: aws:kms secretData: secretName: tf-backup-s3-secret accessKeyName: access_key secretAccessKeyName: secret_key sseKmsKeyName: sse_kms_key_id
Remote S3 backup configuration parameters¶ Parameter
Description
providerRemote backup provider. Supported values:
AWSorCeph.pathName of the remote S3 bucket. If the specified bucket does not exist, it is created automatically.
endpointEndpoint for the S3 API. Omit this parameter when using the
AWSprovider.regionAWS region to connect to. Used only when
provideris set toAWS.backupDirDirectory path within the bucket where backups are stored. The default value is
tf/data/backups/.serverSideEncryptionServer-side encryption algorithm to use when storing objects. Supported values:
AES256oraws:kms.
If server-side encryption is not required, omit the
serverSideEncryption and sseKmsKeyName parameters.
To restore a database from a remote S3 backup, use the same configuration
parameters as for remoteSync:
spec:
features:
dbRestoreMode:
enabled: true
syncFromRemote:
enabled: true
provider: Ceph
endpoint: https://openstack-store.it.just.works/
path: bucket_name
type: s3
serverSideEncryption: aws:kms
secretData:
secretName: tf-backup-s3-secret
accessKeyName: access_key
secretAccessKeyName: secret_key
sseKmsKeyName: sse_kms_key_id
Tungsten Fabric services
The section explains specifics of the Tungsten Fabric services provided by Mirantis OpenStack for Kubernetes (MOSK). The list of the services and their supported features included in this section is not full and is being constantly amended based on the complexity of the architecture and use of a particular service.
Tungsten Fabric load balancing (HAProxy)
Note
Since 23.1, MOSK provides technology preview for Octavia Amphora load balancing. To start experimenting with the new load balancing solution, refer to Octavia Amphora load balancing.
MOSK ensures Octavia with Tungsten Fabric integration by OpenStack Octavia Driver with Tungsten Fabric HAProxy as a backend.
The Tungsten Fabric-based MOSK deployment supports creation, update, and deletion operations with the following standard load balancing API entities:
Load balancers
Note
For a load balancer creation operation, the driver supports only the
vip-subnet-idargument, thevip-network-idargument is not supported.Listeners
Pools
Health monitors
The Tungsten Fabric-based MOSK deployment does not support the following load balancing capabilities:
L7 load balancing capabilities, such as L7 policies, L7 rules, and others
Setting specific availability zones for load balancers and their resources
Using of the UDP protocol
Operations with Octavia quotas
Operations with Octavia flavors
Warning
The Tungsten Fabric-based MOSK deployment enables you to manage the load balancer resources by means of the OpenStack CLI or OpenStack Horizon. Do not perform any manipulations with the load balancer resources through the Tungsten Fabric web UI because in this case the changes will not be reflected on the OpenStack API side.
Octavia Amphora load balancing
Available since MOSK 23.1 TechPreview
Octavia Amphora (Amphora v2) load balancing provides a scalable and flexible solution for load balancing in cloud environments. MOSK deploys Amphora load balancer on each node of the OpenStack environment ensuring that load balancing services are easily accessible, highly scalable, and highly reliable.
Compared to the Octavia Tungsten Fabric driver for LBaaS v2 solution, Amphora offers several advanced features including:
Full compatibility with the Octavia API, which provides a standardized interface for load balancing in MOSK OpenStack environments. This makes it easier to manage and integrate with other OpenStack services.
Layer 7 policies and rules, which allow for more granular control over traffic routing and load balancing decisions. This enables users to optimize their application performance and improve the user experience.
Support for the UDP protocol, which is commonly used for real-time communications and other high-performance applications. This enables users to deploy a wider range of applications with the same load balancing infrastructure.
By default, MOSK uses the Octavia Tungsten Fabric load balancing. Once Octavia Amphora load balancing is enabled, the existing Octavia Tungsten Fabric driver load balancers will continue to function normally. However, you cannot migrate your load balancer workloads from the old LBaaS v2 solution to Amphora.
Note
As long as MOSK provides Octavia Amphora load balancing as a technology preview feature, Mirantis cannot guarantee the stability of this solution and does not provide a migration path from Tungsten Fabric load balancing (HAProxy), which is used by default.
To enable Octavia Amphora load balancing:
Assign
openstack-gateway: enabledlabels to the compute nodes in either order.Caution
Assigning the
openstack-gateway: enabledlabels on compute nodes is crucial for the effective operation of Octavia Amphora load balancing within an OpenStack environment. Double-check the labels assignment to guarantee proper configuration.To make Amphora the default provider, specify it in the
OpenStackDeploymentcustom resource:spec: features: octavia: default_provider: amphorav2
Verify that the OpenStack Controller (Rockoon) has scheduled new Octavia pods that include health manager, worker, and housekeeping pods.
kubectl get pods -n openstack -l 'application=octavia,component in (worker, health_manager, housekeeping)'
Example of output for an environment with two compute nodes:
NAME READY STATUS RESTARTS AGE octavia-health-manager-default-48znl 1/1 Running 0 4h32m octavia-health-manager-default-jk82v 1/1 Running 0 4h34m octavia-housekeeping-7bdf9cbd6c-24vc4 1/1 Running 0 4h34m octavia-housekeeping-7bdf9cbd6c-h9ccv 1/1 Running 0 4h34m octavia-housekeeping-7bdf9cbd6c-rptvv 1/1 Running 0 4h34m octavia-worker-665f84fc7-8kdqd 1/1 Running 0 4h34m octavia-worker-665f84fc7-j6jn9 1/1 Running 0 4h31m octavia-worker-665f84fc7-kqf9t 1/1 Running 0 4h33m
The workflow for creating new load balancers with Amphora is identical to the workflow for creating load balancers with Octavia Tungsten Fabric driver for LBaaS v2. You can do it either through the OpenStack Horizon UI or OpenStack CLI.
If you have not defined amphorav2 as default provider in the
OpenStackDeployment custom resource, you can specify it explicitly
when creating a load balancer using the provider argument:
openstack loadbalancer create --provider amphorav2
Tungsten Fabric known limitations
This section describes the known limitations of Tungsten Fabric and OpenSDN.
Feature availability and limitations
This section contains a list of the Tungsten Fabric upstream features and use cases not supported in MOSK and features and use cases offered as Technology Preview in the current product release, if any.
Feature or use case |
Status |
Description |
|---|---|---|
Tungsten Fabric web UI |
Provided as is |
MOSK provides the TF web UI as is and does not include this service in the support Service Level Agreement. |
Automatic generation of network port records in DNSaaS (Designate) |
Not supported |
As a workaround, you can use the Tungsten Fabric built-in DNS service that enables virtual machines to resolve each other names. |
Secret management (Barbican) |
Not supported |
It is not possible to use the certificates stored in Barbican to terminate HTTPs on a load balancer in a Tungsten Fabric deployment. |
Role Based Access Control (RBAC) for Neutron objects |
Not supported |
|
Advanced Tungsten Fabric features |
Provided as is |
MOSK provides the following advanced Tungsten Fabric features as is and does not include them in the support Service Level Agreement:
|
Unsupported |
DPDK. For the deprecation note, refer to DPDK. |
|
Tungsten Fabric and OpenStack Octavia Amphora integration |
Technical Preview |
Due to Tungsten Fabric Simple Virtual Gateway restriction, each virtual
network can have only one VGW interface. As a result,
MOSK should be limited to a single compute node
with the |
Restriction to 256 addresses for Allowed Address Pairs
Tungsten Fabric enforces a maximum Allowed Address Pair (AAP) network size of 256 addresses — equivalent to a prefix of /24 — for both IPv4 and IPv6 tenant networks.
AAPs let a port use additional IP addresses beyond its primary one, enabling features like virtual IPs, load balancers, and network appliances that require multiple addresses. They are mainly used for high availability, failover, and advanced network services, providing flexibility while preserving the default port-level security model.
The vRouter agent on each compute node monitors AAP subnets by sending unicast ARP requests to every address in the subnet once per minute, and sends additional ARP requests when an AAP is added, modified, or during failover events. This behavior increases with network size and can result in higher resource usage and potential network disruptions.
This restriction is inherent to the Tungsten Fabric architecture and not expected to change. For details, see the upstream #1720118 bug description.
Warning
Mirantis cannot be held liable for any issues caused by using AAPs with network sizes greater than 256 addresses (/24 for IPv4 or /120 for IPv6). If degraded performance, instability, or service impact is observed in a MOSK cloud, the only supported resolution is to remove oversized AAPs.
Tungsten Fabric integration with OpenStack
The levels of integration between OpenStack and Tungsten Fabric (TF) include controllers and services integration levels.
Controllers integration
The integration between the OpenStack and TF controllers is
implemented through the shared Kubernetes openstack-tf-shared namespace.
Both controllers have access to this namespace to read and write the Kubernetes
kind: Secret objects.
The OpenStack Controller (Rockoon) posts the data into the
openstack-tf-shared namespace required by the TF services. The TF
controller watches this namespace. Once an appropriate secret is created,
the TF controller obtains it into the internal data structures for further
processing.
The OpenStack Controller includes the following data for the TF Controller:
tunnel_intefaceName of the network interface for the TF data plane. This interface is used by TF for the encapsulated traffic for overlay networks.
- Keystone authorization information
Keystone Administrator credentials and an up-and-running IAM service are required for the TF Controller to initiate the deployment process.
- Nova metadata information
Required for the TF vRrouter agent service.
Also, the OpenStack Controller watches the openstack-tf-shared namespace
for the vrouter_port parameter that defines the vRouter port number and
passes it to the nova-compute pod.
Services integration
The list of the OpenStack services that are integrated with TF through their API include:
neutron-server- integration is provided by thecontrail-neutron-plugincomponent that is used by theneutron-serverservice for transformation of the API calls to the TF API compatible requests.nova-compute- integration is provided by thecontrail-nova-vif-driverandcontrail-vrouter-apipackages used by thenova-computeservice for interaction with the TF vRouter to the network ports.octavia-api- integration is provided by the Octavia TF Driver that enables you to use OpenStack CLI and Horizon for operations with load balancers. See Tungsten Fabric load balancing (HAProxy) for details.
Warning
TF is not integrated with the following OpenStack services:
DNS service (Designate)
Key management (Barbican)
Tungsten Fabric IPv6 support
Tungsten Fabric allows running IPv6-enabled OpenStack tenant networks on top of the IPv4 underlay. You can create an IPv6 virtual network through the Tungsten Fabric web UI or OpenStack CLI in the same way as an IPv4 virtual network. The IPv6 functionality is enabled out of the box and does not require major changes in the cloud configuration. This section lists the IPv6 capabilities supported by MOSK, as well as those available and unavailable in the upstream OpenContrail software.
The following IPv6 features are supported and verified in MOSK:
Virtual machines with IPv6 and IPv4 interfaces
Virtual machines with IPv6-only interfaces
DHCPv6 and neighbor discovery
Policy and security groups
IPv6 flow set up, tear down, and aging
Flow set up and tear down based on a TCP state machine
Fat flow
Allowed address pair configuration with IPv6 addresses
Equal Cost Multi-Path (ECMP)
Additionally, the following IPv6 features are available in upstream OpenContrail according to its official documentation:
Protocol-based flow aging
IPv6 service chaining
Connectivity with gateway (MX Series device)
Virtual Domain Name Services (vDNS), name-to-IPv6 address resolution
The following IPv6 features are not available in upstream OpenContrail:
Any IPv6 Network Address Translation (NAT)
Load Balancing as a Service (LBaaS)
IPv6 fragmentation
Floating IPv6 address
Link-local and metadata services
Diagnostics for IPv6
Contrail Device Manager
Virtual customer premises equipment (vCPE)
Networking
Depending on the size of an OpenStack environment and the components that you use, you may want to have a single or multiple network interfaces, as well as run different types of traffic on a single or multiple VLANs.
This section provides the recommendations for planning the network configuration and optimizing the cloud performance.
Networking overview
Mirantis OpenStack for Kubernetes (MOSK) cluster networking is complex and defined by the security requirements and performance considerations. It is based on the Kubernetes cluster networking provided by Mirantis Container Cloud and expanded to facilitate the demands of the OpenStack virtualization platform.
A Container Cloud Kubernetes cluster provides a platform for MOSK and is considered a part of its control plane. All networks that serve Kubernetes and related traffic are considered control plane networks. The Kubernetes cluster networking is typically focused on connecting pods of different nodes as well as exposing the Kubernetes API and services running in pods into an external network.
The OpenStack networking connects virtual machines to each other and the outside world. Most of the OpenStack-related networks are considered a part of the data plane in an OpenStack cluster. Ceph networks are considered data plane networks for the purpose of this reference architecture.
When planning your OpenStack environment, consider the types of traffic that your workloads generate and design your network accordingly. If you anticipate that certain types of traffic, such as storage replication, will likely consume a significant amount of network bandwidth, you may want to move that traffic to a dedicated network interface to avoid performance degradation.
The following diagram provides a simplified overview of the underlay networking in a MOSK environment:
Management cluster networking
This page summarizes the recommended networking architecture of a management cluster for a Mirantis OpenStack for Kubernetes (MOSK) cluster.
The main purpose of networking in a management cluster is to provide access to the management API that consists of:
- Public API
Used by end users to provision and configure MOSK clusters and machines. Includes the management console.
- LCM API
Used by LCM agents in MOSK clusters to obtain configuration and report status. Contains provider-specific services and internal API including
LCMMachineandLCMClusterobjects.
We recommend deploying the management cluster with a dedicated interface for the provisioning (PXE) network. The separation of the provisioning network from the management network ensures additional security and resilience of the solution.
MOSK end users typically should have access to the Keycloak service in the management cluster for authentication to the Horizon web UI. Therefore, we recommend that you connect the management network of the management cluster to an external network through an IP router. The default route on the management cluster nodes must be configured with the default gateway in the management network.
If you deploy the multi-rack configuration, ensure that the provisioning network of the management cluster is connected to an IP router that connects it to the provisioning networks of all racks.
The following types of networks are supported for management clusters in MOSK:
- PXE network
Enables PXE boot of all bare metal machines. The PXE subnet provides IP addresses for DHCP and network boot of the bare metal hosts for initial inspection and operating system provisioning. This network may not have the default gateway or a router connected to it. The PXE subnet is defined by the operator during bootstrap.
Provides IP addresses for the bare metal management services, such as bare metal provisioning service (Ironic). These addresses are allocated and served by MetalLB.
- Management network
Connects LCM agents running on the hosts to the LCM API. Serves the external connections to the management API. This network is also used for communication between
kubeletand the Kubernetes API server inside a Kubernetes cluster. The MKE components use this network for communication inside a swarm cluster.The LCM subnet provides IP addresses for Kubernetes nodes in the management cluster. This network also provides a Virtual IP (VIP) address for the load balancer that enables external access to the Kubernetes API of the management cluster. This VIP is also the endpoint to access the management API in the management cluster.
Provides IP addresses for externally accessible services, such as Keycloak, management console, StackLight. These addresses are allocated and served by MetalLB.
- Kubernetes workloads network
Technology Preview
Serves the internal traffic between workloads on the management cluster. The Kubernetes workloads subnet provides IP addresses that are assigned to nodes and used by Calico.
- Out-of-Band (OOB) network
Connects to Baseboard Management Controllers of the servers that host the management cluster. The OOB subnet must be accessible from the management network through IP routing. The OOB network is not managed by MOSK and is not represented in the IPAM API.
MOSK cluster networking
Mirantis OpenStack for Kubernetes (MOSK) clusters managed by Mirantis Container Cloud use the following networks to serve different types of traffic:
Network role |
Description |
|---|---|
Provisioning (PXE) network |
Facilitates the iPXE boot of all bare metal machines in a MOSK cluster and provisioning of the operating system to machines. This network is only used during provisioning of the host. It must not be configured on an operational MOSK node. |
Life-cycle management (LCM) network |
Connects LCM Agents running on the hosts to the Container Cloud LCM API.
The LCM API is provided by the management cluster.
The LCM network is also used for communication between The LCM subnet(s) provides IP addresses that are statically allocated by the IPAM service to bare metal hosts. This network must be connected to the Kubernetes API endpoint of the management cluster through an IP router. LCM Agents running on MOSK clusters will connect to the management cluster API through this router. LCM subnets may be different per MOSK cluster as long as this connection requirement is satisfied. You can use more than one LCM network segment in a MOSK cluster. In this case, separated L2 segments and interconnected L3 subnets are still used to serve LCM and API traffic. All IP subnets in the LCM networks must be connected to each other by IP routes. These routes must be configured on the hosts through L2 templates. All IP subnets in the LCM network must be connected to the Kubernetes API endpoints of the management cluster through an IP router. You can manually select the load balancer IP address for external
access to the cluster API and specify it in the ARP or BGP announcement When using the ARP announcement of the IP address for the cluster API load balancer, the following limitations apply:
When using the BGP announcement of the IP address for the cluster API load balancer, which is available as Technology Preview since MOSK 23.2.2, no segment stretching is required between Kubernetes master nodes. Also, in this scenario, the load balancer IP address is not required to match the LCM subnet CIDR address. Depending of cluster needs, an operator can select how the VIP address for Kubernetes API is advertised. When BGP advertisement is used or the OpenStack control plane is deployed on separate nodes, as opposite to a compact control plane, it allows for a more flexible configuration and there is no need to search for a compromise such as the one described below. But, when using ARP advertisement on a compact control plane, the selection of network for advertising the VIP address for Kubernetes API may depend on whether the symmetry of service return traffic is required. Therefore, when using ARP advertisement on a compact control plane, select one of the following options in the drop-down list:
Network selection for advertising the VIP address for Kubernetes
API on a compact control plane
|
Kubernetes workloads network |
Serves as an underlay network for traffic between pods in the MOSK cluster. Do not share this network between clusters. There might be more than one Kubernetes pods network segment in the cluster. In this case, they must be connected through an IP router. Kubernetes workloads network does not need an external access. The Kubernetes workloads subnet(s) provides IP addresses that are statically allocated by the IPAM service to all nodes and that are used by Calico for cross-node communication inside a cluster. By default, VXLAN overlay is used for Calico cross-node communication. |
Kubernetes external network |
Serves for an access to the OpenStack endpoints in a MOSK cluster. When using the ARP announcement of the external endpoints of load-balanced services, the network must contain a VLAN segment extended to all MOSK nodes connected to this network. When using the BGP announcement of the external endpoints of load-balanced services, which is available as Technology Preview since MOSK 23.2.2, there is no requirement of having a single VLAN segment extended to all MOSK nodes connected to this network. A typical MOSK cluster only has one external network. The external network must include at least two IP address ranges
defined by separate
|
Storage access network |
Serves for the storage access traffic from and to Ceph OSD services. A MOSK cluster may have more than one VLAN segment and IP subnet in the storage access network. All IP subnets of this network in a single cluster must be connected by an IP router. The storage access network does not require external access unless you want to directly expose Ceph to the clients outside of a MOSK cluster. Note A direct access to Ceph by the clients outside of a MOSK cluster is technically possible but not supported by Mirantis. Use at your own risk. The IP addresses from subnets in this network are statically allocated by the IPAM service to Ceph nodes. The Ceph OSD services bind to these addresses on their respective nodes. This is a public network in Ceph terms. 1 |
Storage replication network |
Serves for the storage replication traffic between Ceph OSD services. A MOSK cluster may have more than one VLAN segment and IP subnet in this network as long as the subnets are connected by an IP router. This network does not require external access. The IP addresses from subnets in this network are statically allocated by the IPAM service to Ceph nodes. The Ceph OSD services bind to these addresses on their respective nodes. This is a cluster network in Ceph terms. 1 |
Out-of-Band (OOB) network |
Connects Baseboard Management Controllers (BMCs) of the bare metal hosts. Must not be accessible from a MOSK cluster. |
- 1(1,2)
For more details about Ceph networks, see Ceph Network Configuration Reference.
The following diagram illustrates the networking schema of the Container Cloud deployment on bare metal with a MOSK cluster using ARP announcements:
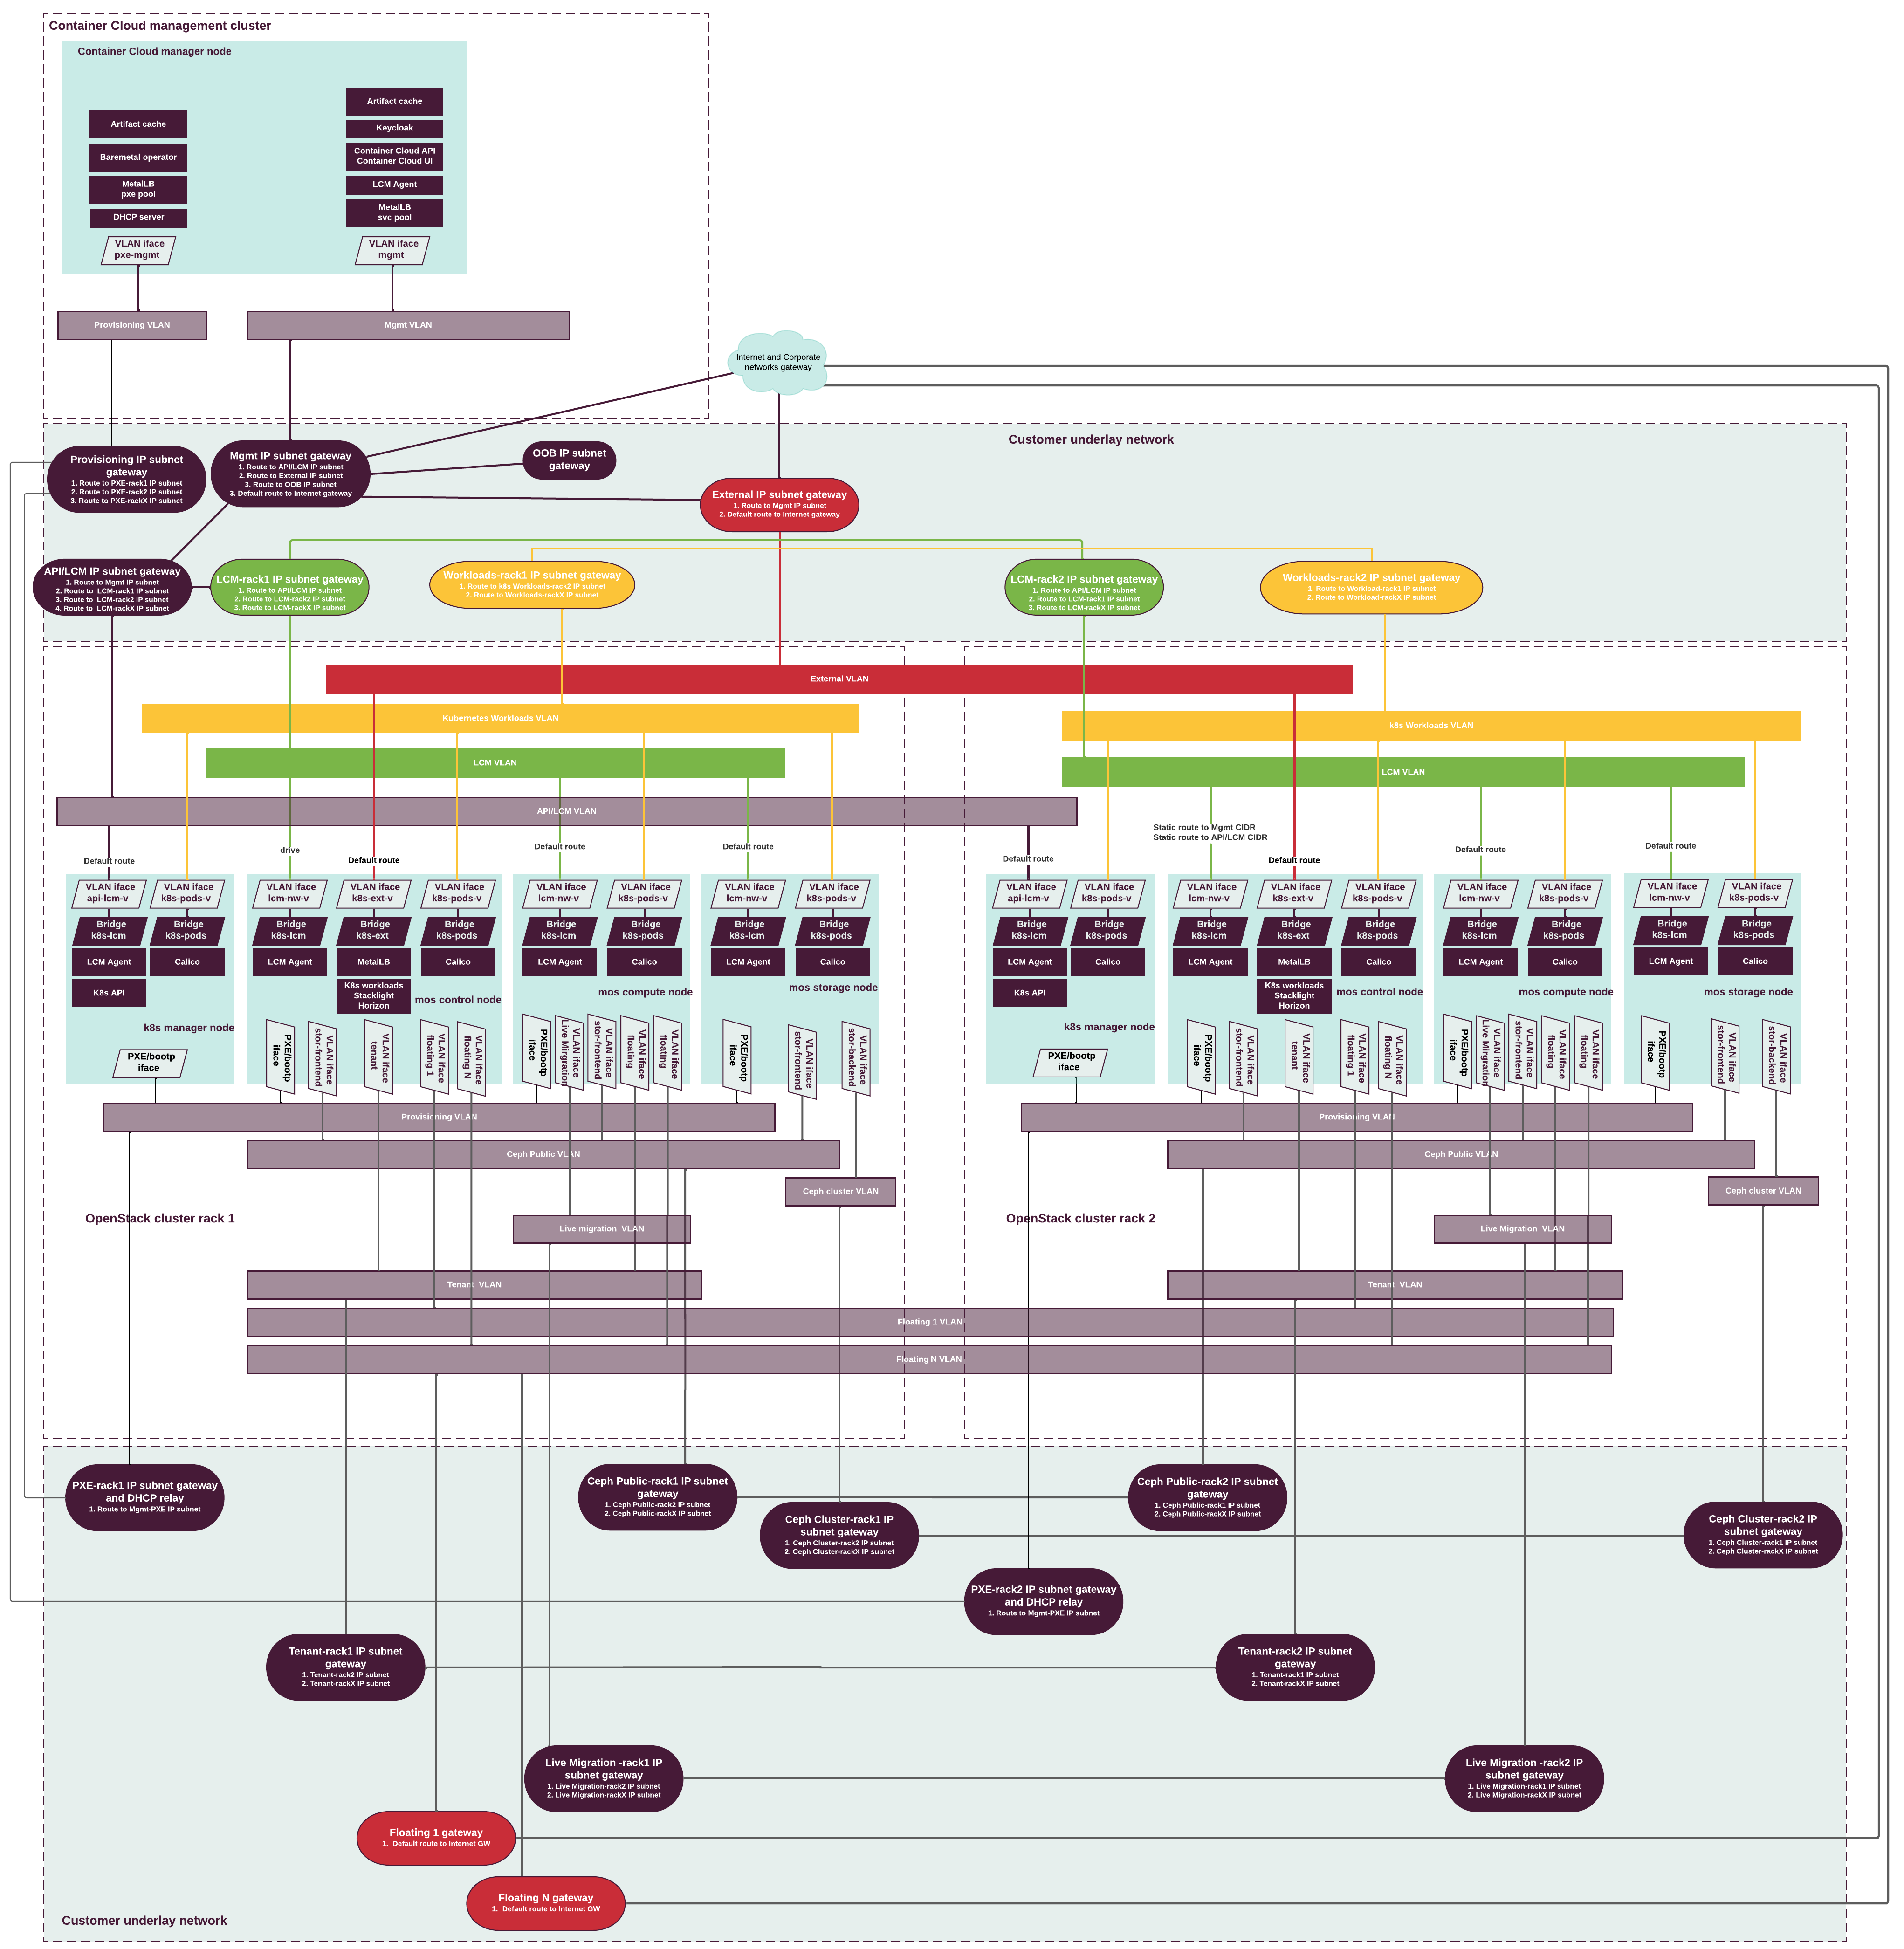
Since 23.2.2, MOSK supports full L3 networking topology in the Technology Preview scope. The following diagram illustrates the networking schema of the Container Cloud deployment on bare metal with a MOSK cluster using BGP announcements:
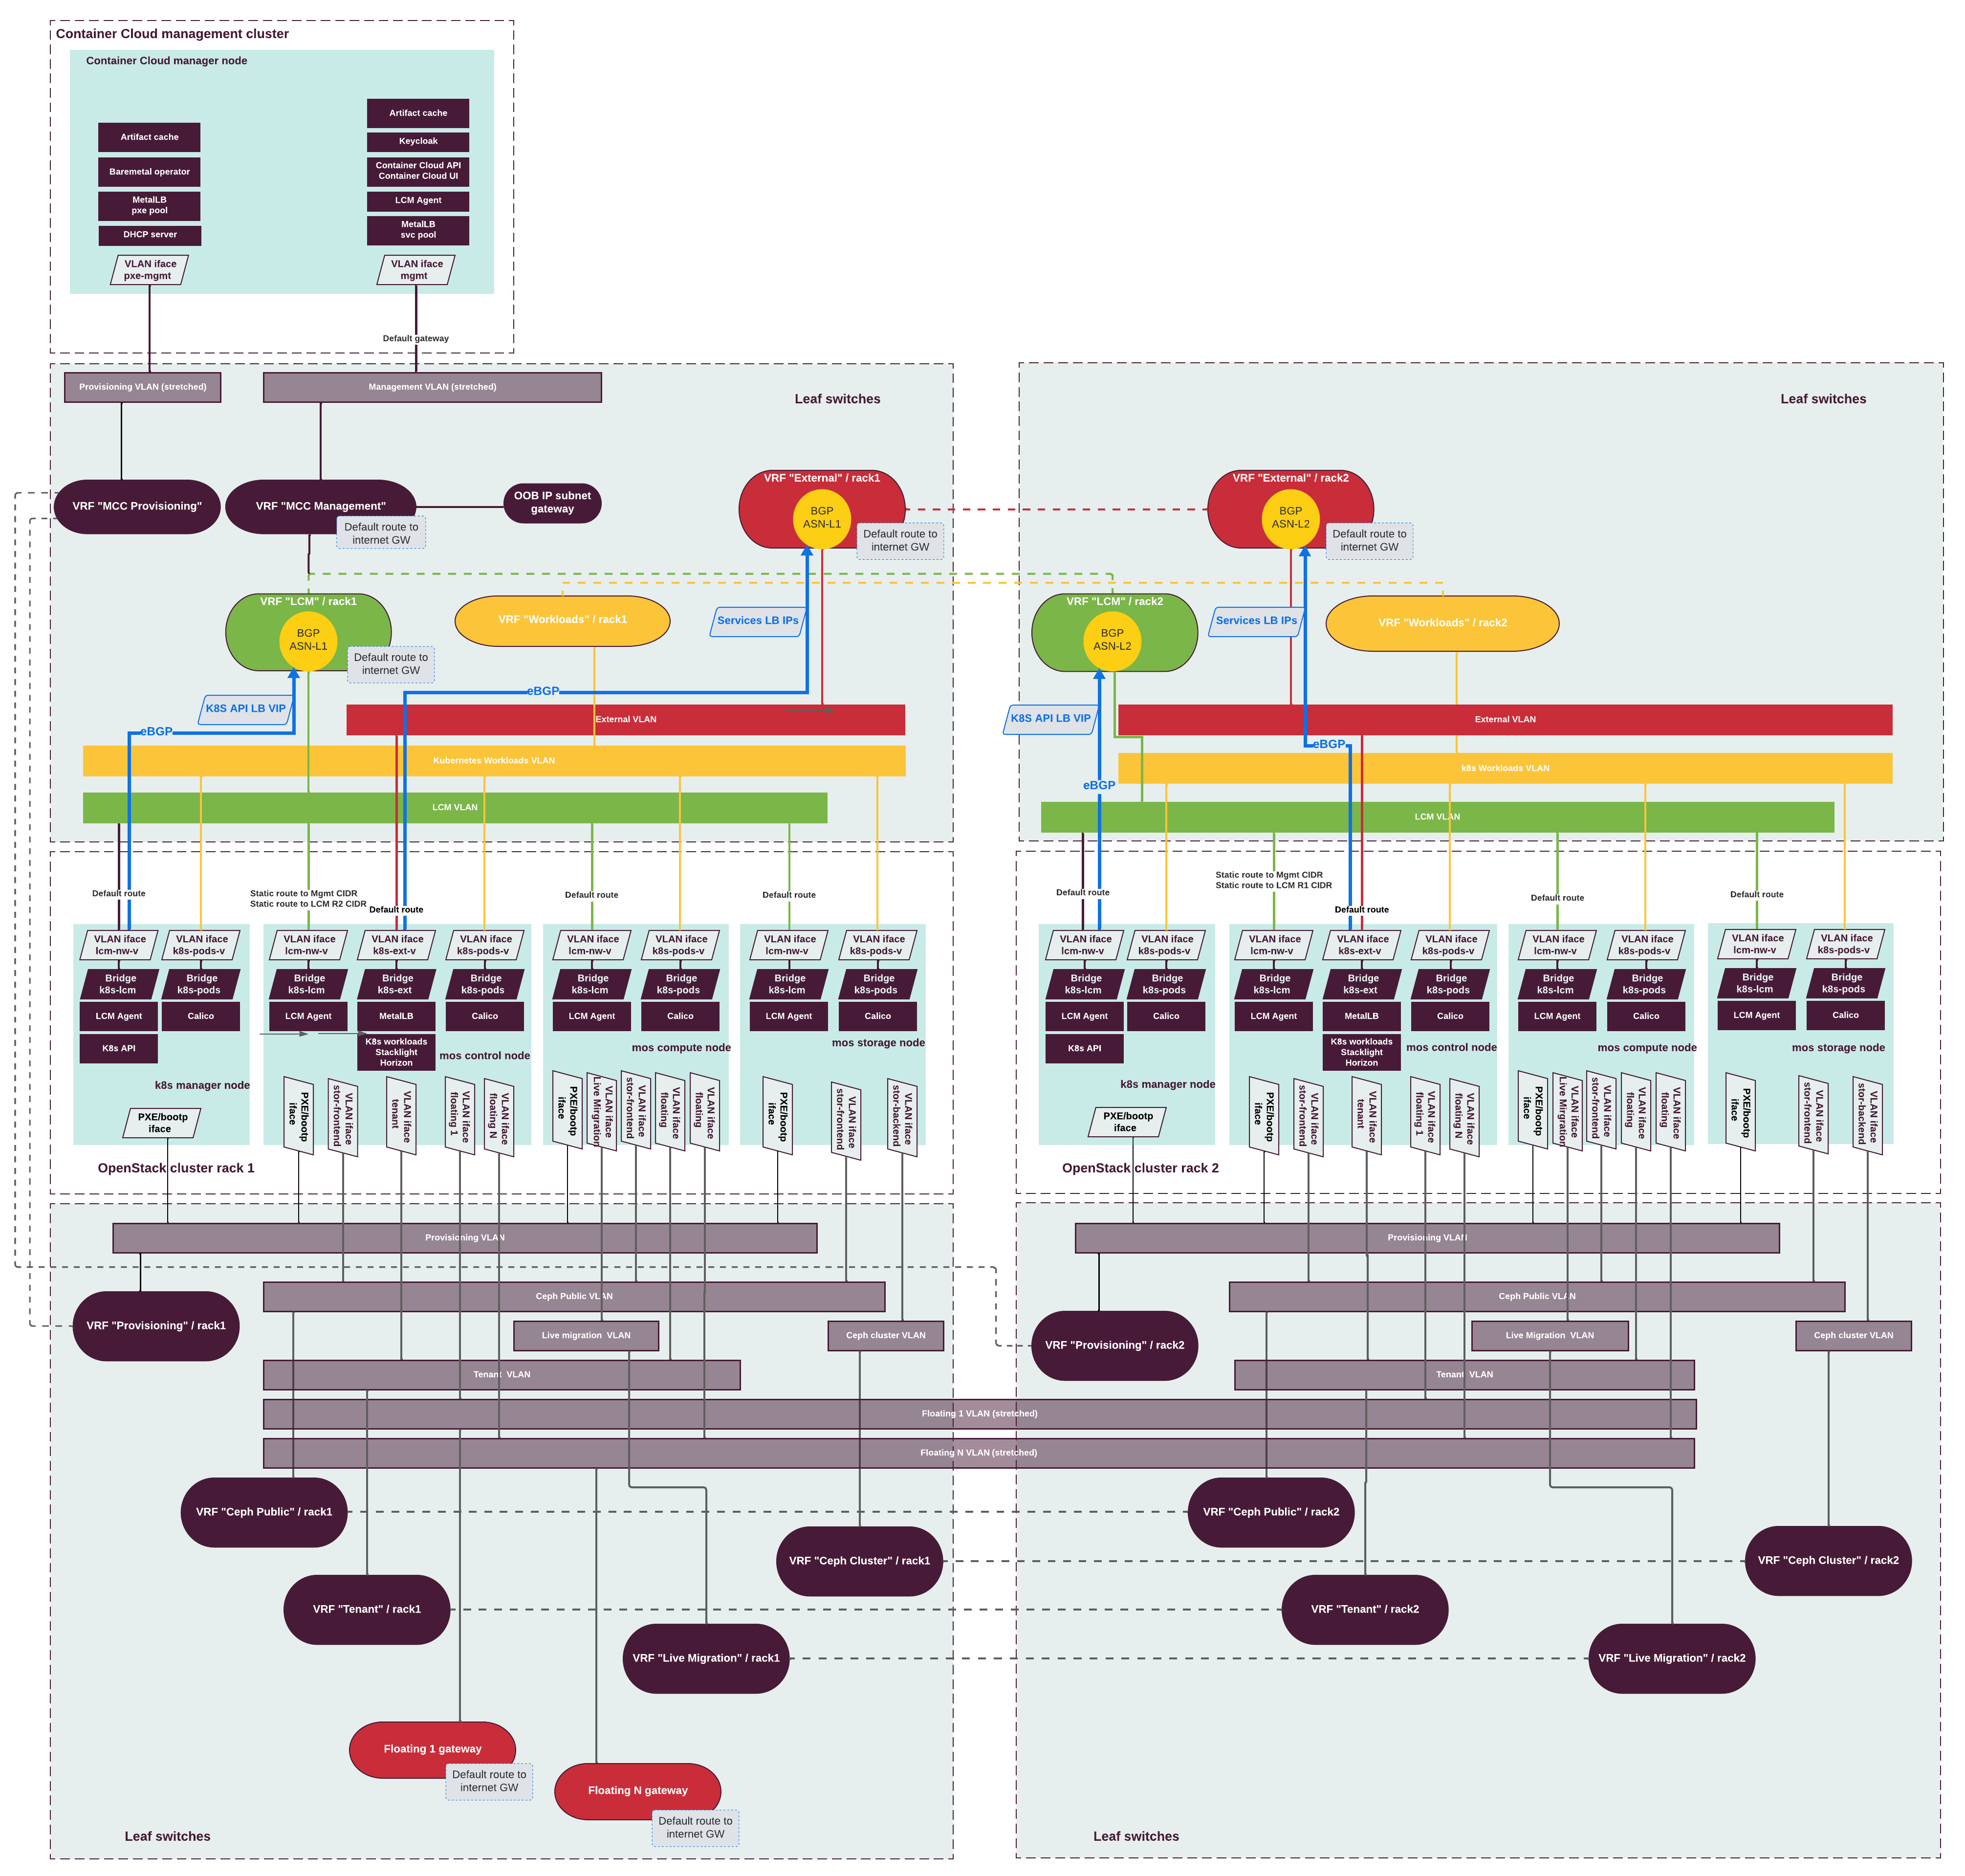
Network types
This section describes network types for Layer 3 networks used for Kubernetes and Mirantis OpenStack for Kubernetes (MOSK) clusters along with requirements for each network type.
Note
Only IPv4 is currently supported by Container Cloud and IPAM for infrastructure networks. Both IPv4 and IPv6 are supported for OpenStack workloads.
The following diagram provides an overview of the underlay networks in a MOSK environment:
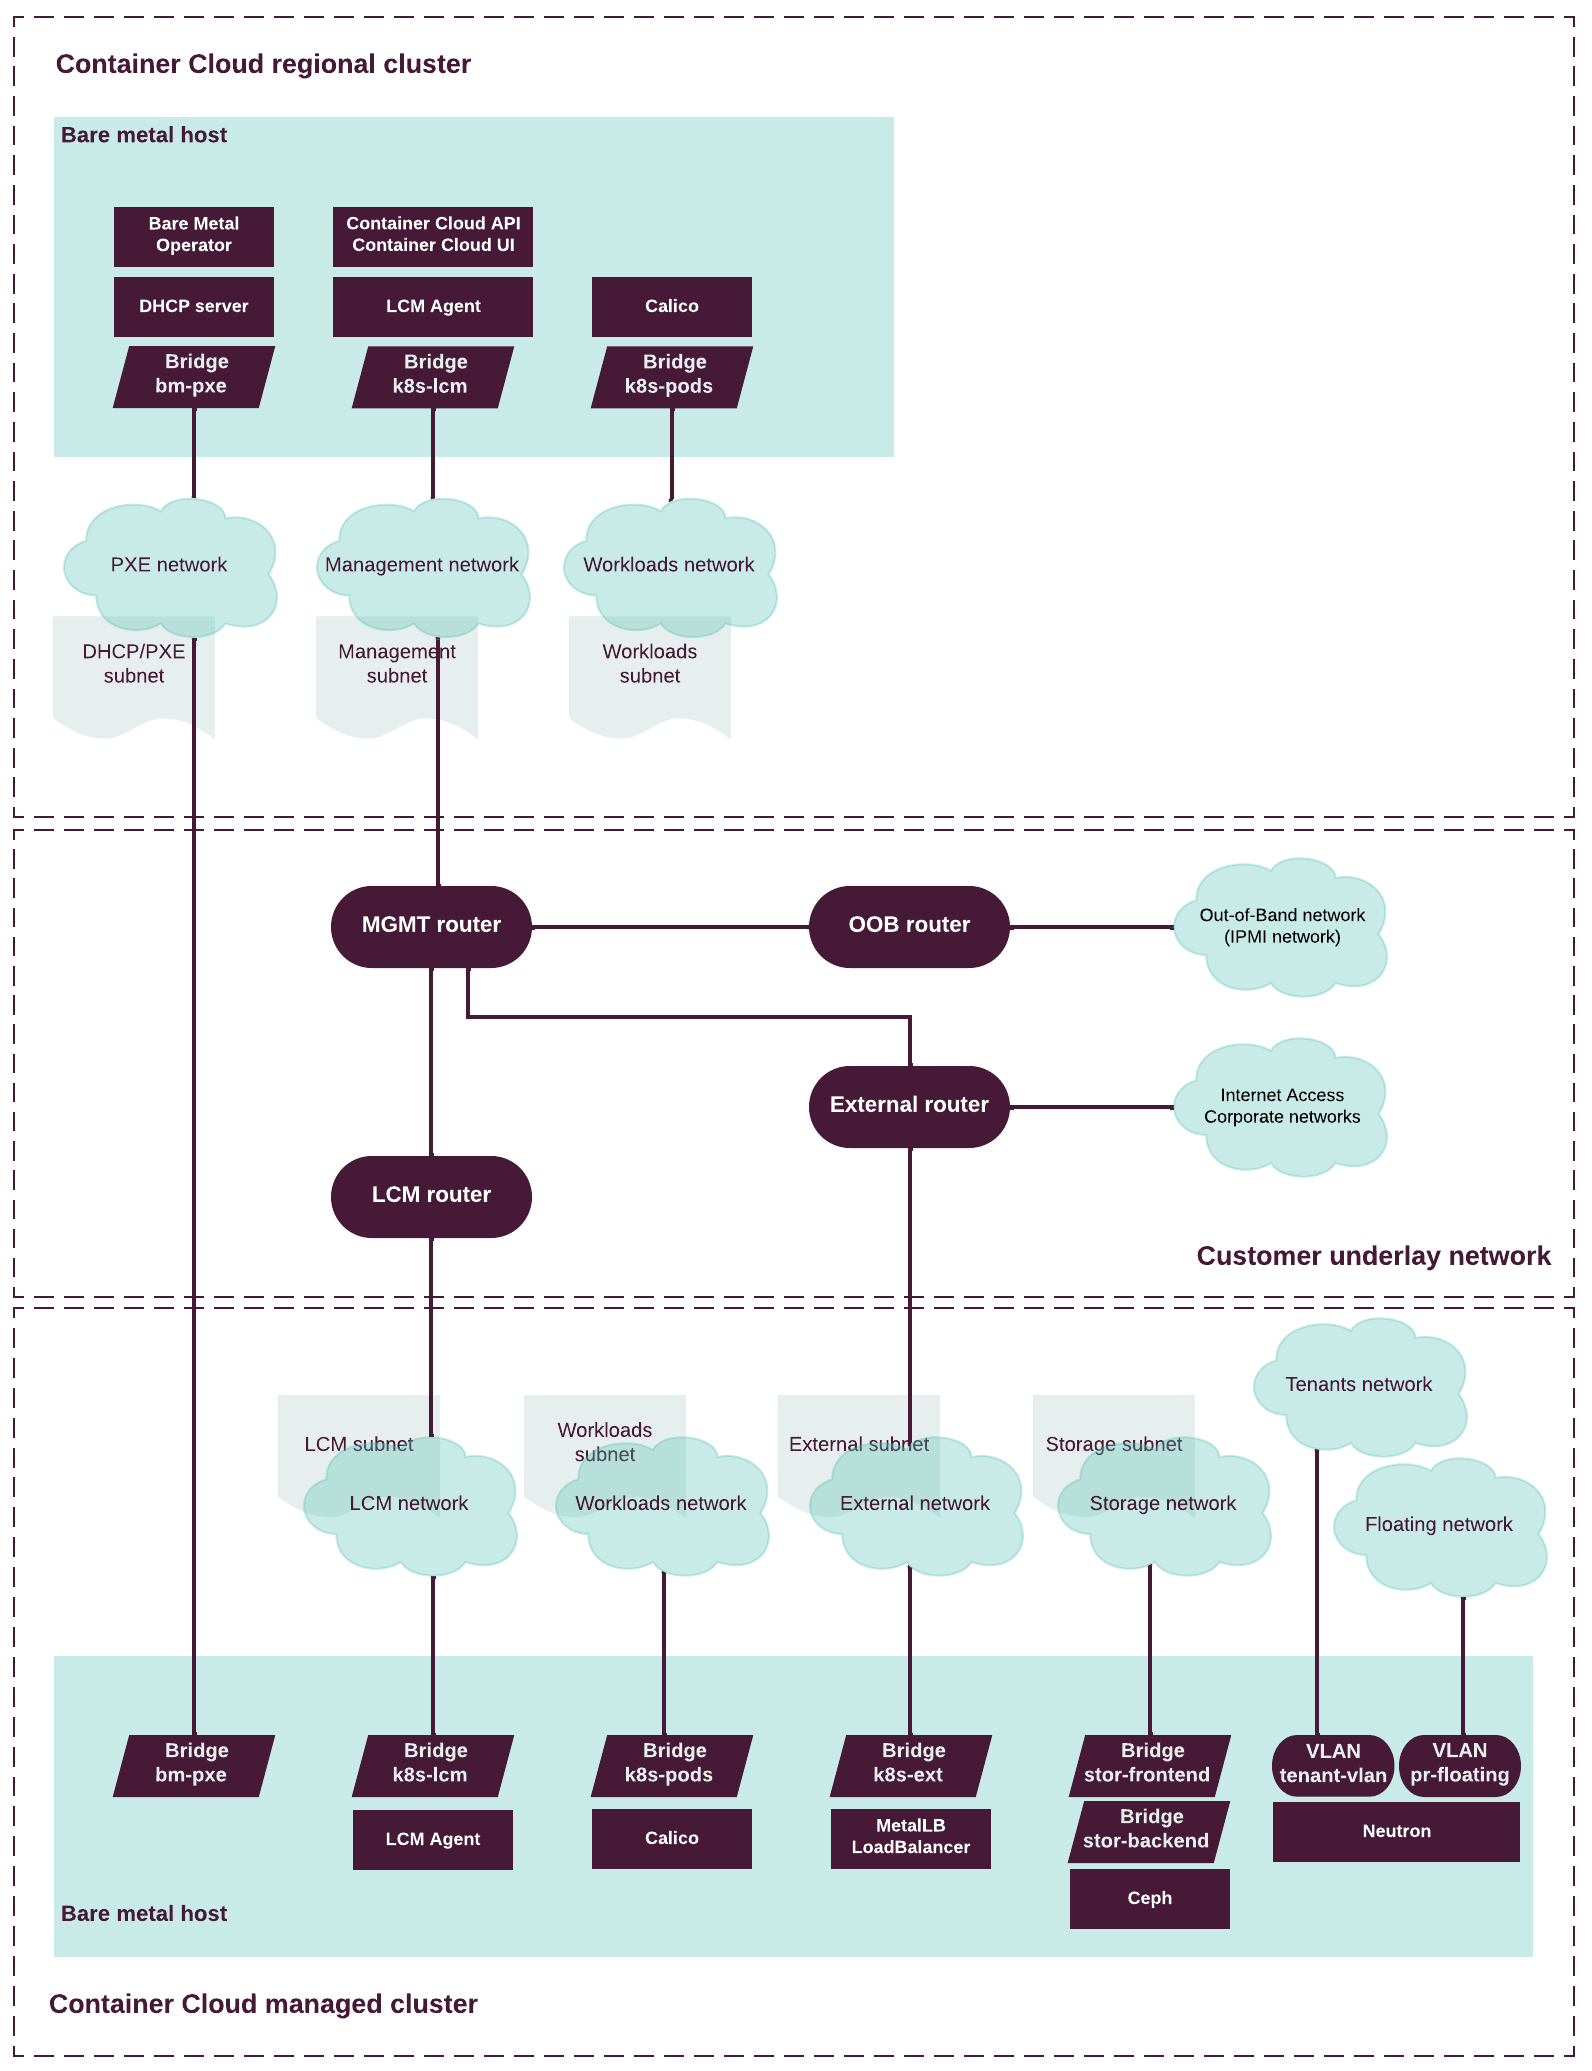
L3 networks for Kubernetes
A MOSK deployment typically requires the following types of networks:
- Out-of-band (OOB) network
Connects the Baseboard Management Controllers (BMCs) of the hosts in the network to Ironic. This network is out of band for the host operating system.
- PXE/provisioning network
Enables remote booting of servers through the PXE protocol. In management clusters, DHCP server listens on this network for hosts discovery and inspection. In managed clusters, hosts use this network for the initial PXE boot and provisioning.
- Management network
Used in management clusters for managing MOSK infrastructure and for communication between containers in Kubernetes. Serves external connections to the management API and services of the management cluster.
Note
Since Container Cloud 2.30.0 (Cluster releases 21.0.0 and 20.0.0), management cluster supports full L3 networking topology in the Technology Preview scope. This enables deployment of management cluster nodes in dedicated racks without the need for L2 layer extension between them.
For details, see Underlay networking: routing configuration.
- LCM/API network
Since 23.2.2, MOSK supports full L3 networking topology in the Technology Preview scope. This enables deployment of specific cluster segments in dedicated racks without the need for L2 layer extension between them. For configuration procedure, see Configure BGP announcement for cluster API LB address and Configure BGP announcement of external addresses of Kubernetes load-balanced services in Deployment Guide.
If you configure BGP announcement of the load-balancer IP address for the MOSK cluster API, the API/LCM network is not required. Announcement of the cluster API LB address is done using the LCM or external network.
If you configure ARP announcement of the load-balancer IP address for the MOSK cluster API, the API/LCM network must be configured on the Kubernetes manager nodes of the cluster. This network contains the Kubernetes API endpoint with the VRRP virtual IP address.
Depending of cluster needs, an operator can select how the VIP address for Kubernetes API is advertised. When BGP advertisement is used or the OpenStack control plane is deployed on separate nodes, as opposite to a compact control plane, it allows for a more flexible configuration and there is no need to search for a compromise such as the one described below.
But, when using ARP advertisement on a compact control plane, the selection of network for advertising the VIP address for Kubernetes API may depend on whether the symmetry of service return traffic is required. Therefore, when using ARP advertisement on a compact control plane, select one of the following options in the drop-down list:
Network selection for advertising the VIP address for Kubernetes API on a compact control plane
For traffic symmetry between MOSK and management clusters and asymmetry in case of external clients:
Use the API/LCM network to advertise the VIP address for Kubernetes API. Allocate this VIP address in the CIDR address of the API/LCM network.
The gateway in the API/LCM network for a MOSK cluster must have a route to the management subnet of the management cluster. This is required to ensure symmetric traffic flow between the management and MOSK clusters.
For traffic symmetry in case of external clients and asymmetry between MOSK and management clusters:
Use external network to advertise the VIP address for Kubernetes API. Allocate this VIP address in the CIDR address of the external network.
One of the gateways either in the API/LCM network, or in the external network for a MOSK cluster must have a route to the management subnet of the management cluster. This is required to establish the traffic flow between the management and MOSK clusters.
- LCM network
Connects LCM agents running on a node to the LCM API of the management cluster. It is also used for communication between
kubeletand the Kubernetes API server inside a Kubernetes cluster. The MKE components use this network for communication inside a swarm cluster. In management clusters, it is replaced by the management network.Multiple VLAN segments and IP subnets can be created for a multi-rack architecture. Each server must be connected to one of the LCM segments and have an IP from the corresponding subnet.
- Kubernetes external network
Used to expose the OpenStack, StackLight, and other services of the MOSK cluster. In management clusters, it is replaced by the management network.
Depending of cluster needs, an operator can select how the VIP address for Kubernetes API is advertised. When BGP advertisement is used or the OpenStack control plane is deployed on separate nodes, as opposite to a compact control plane, it allows for a more flexible configuration and there is no need to search for a compromise such as the one described below.
But, when using ARP advertisement on a compact control plane, the selection of network for advertising the VIP address for Kubernetes API may depend on whether the symmetry of service return traffic is required. Therefore, when using ARP advertisement on a compact control plane, select one of the following options in the drop-down list:
Network selection for advertising the VIP address for Kubernetes API on a compact control plane
For traffic symmetry between MOSK and management clusters and asymmetry in case of external clients:
Use the API/LCM network to advertise the VIP address for Kubernetes API. Allocate this VIP address in the CIDR address of the API/LCM network.
The gateway in the API/LCM network for a MOSK cluster must have a route to the management subnet of the management cluster. This is required to ensure symmetric traffic flow between the management and MOSK clusters.
For traffic symmetry in case of external clients and asymmetry between MOSK and management clusters:
Use external network to advertise the VIP address for Kubernetes API. Allocate this VIP address in the CIDR address of the external network.
One of the gateways either in the API/LCM network, or in the external network for a MOSK cluster must have a route to the management subnet of the management cluster. This is required to establish the traffic flow between the management and MOSK clusters.
- Kubernetes workloads (pods) network
Used for communication between containers in Kubernetes. Each host has an address on this network, and this address is used by Calico as an endpoint to the underlay network.
- Storage access network (Ceph)
Used for accessing the Ceph storage. Connects Ceph nodes to the storage clients. The Ceph OSD service is bound to the address on this network. In Ceph terms, this is a public network 0. We recommended that it is placed on a dedicated hardware interface.
Connects Ceph nodes to each other. Serves internal replication traffic. This is a cluster network in Ceph terms. 0
- Storage replication network (Ceph)
Used for Ceph storage replication. Connects Ceph nodes to each other. Serves internal replication traffic.In Ceph terms, this is a cluster network 0. To ensure low latency and fast access, place the network on a dedicated hardware interface.
- 0(1,2,3)
For details about Ceph networks, see Ceph Network Configuration Reference.
The following table summarizes the default names used for the bridges connected to the networks listed above:
Network type |
Bridge name |
Assignment method TechPreview |
|---|---|---|
OOB network |
N/A |
N/A |
PXE network |
|
By a static interface name |
Management network |
|
By a subnet label |
Kubernetes workloads network |
|
By a static interface name |
Kubernetes external network |
|
By a static interface name |
Network type |
Bridge name |
Assignment method |
|---|---|---|
OOB network |
N/A |
N/A |
PXE network |
N/A |
N/A |
LCM network |
|
By a subnet label |
Kubernetes workloads network |
|
By a static interface name |
Kubernetes external network |
|
By a static interface name |
Storage access (public) network |
|
By the subnet label |
Storage replication (cluster) network |
|
By the subnet label |
- 1(1,2)
Interface name for this network role is static and cannot be changed.
- 2(1,2)
The use of this network role is mandatory for every cluster.
- 3
Only if BGP mode is used for announcement of IP addresses of the load-balanced services and for the cluster API VIP.
Note
Since Container Cloud 2.30.0 (Cluster releases 21.0.0 and 20.0.0), management cluster supports full L3 networking topology in the Technology Preview scope. This enables deployment of management cluster nodes in dedicated racks without the need for L2 layer extension between them.
L3 networks for MOSK
The MOSK deployment additionally requires the following networks.
Service name |
Network |
Description |
VLAN name |
|---|---|---|---|
Networking |
Provider networks |
Typically, a routable network used to provide the external access to OpenStack instances (a floating network). Can be used by the OpenStack services such as Ironic, Manila, and others, to connect their management resources. |
|
Networking |
Overlay networks (virtual networks) |
The network used to provide denied, secure tenant networks with the help of the tunneling mechanism (VLAN/GRE/VXLAN). If the VXLAN and GRE encapsulation takes place, the IP address assignment is required on interfaces at the node level. |
|
Compute |
Live migration network |
The network used by the OpenStack compute service (Nova) to transfer data during live migration. Depending on the cloud needs, it can be placed on a dedicated physical network not to affect other networks during live migration. The IP address assignment is required on interfaces at the node level. |
|
The way of mapping of the logical networks described above to physical networks and interfaces on nodes depends on the cloud size and configuration. We recommend placing OpenStack networks on a dedicated physical interface (bond) that is not shared with storage and Kubernetes management network to minimize the influence on each other.
L3 networks requirements
The following tables describe networking requirements for the following cluster types: MOSK, management, and Ceph.
Note
Since Container Cloud 2.30.0 (Cluster releases 21.0.0 and 20.0.0), management cluster supports full L3 networking topology in the Technology Preview scope. This enables deployment of management cluster nodes in dedicated racks without the need for L2 layer extension between them.
Note
When BGP mode is used for announcement of IP addresses of load-balanced services and for the cluster API VIP, three BGP sessions are created for every node of a management cluster:
Two sessions are created by MetalLB for public and provisioning services
One session is created by the
birdBGP daemon for the cluster API VIP
BGP only allows one session to be established per a pair of endpoints. For details, see MetalLB documentation: Issues with Calico. To solve this issue, different methods can be used. MOSK allows configuring three networks for a management cluster: provisioning, management, and external. In this case, configure MetalLB to use provisioning and external networks, and BIRD to use the management network.
If you configure BGP announcement of the load-balancer IP address for a management cluster API and for load-balanced services of the cluster using three networks, ensure that your management cluster networking meets the following requirements:
Network type |
Provisioning |
Management |
External |
|---|---|---|---|
Suggested interface name |
|
|
|
Minimum number of VLANs |
1 |
1 |
1 |
Minimum number of IP subnets |
2 |
1 |
2 |
Minimum recommended IP subnet size |
|
|
|
External routing |
Not required |
Not required |
Required, may use proxy server |
Multiple segments/stretch segment |
Multiple |
Multiple |
Multiple |
Internal routing |
Routing to separate DHCP segments, if in use |
|
|
If you configure ARP announcement of the load-balancer IP address for a management cluster API and for load-balanced services of the cluster, ensure that your management cluster networking meets the following requirements:
Network type |
Provisioning |
Management |
|---|---|---|
Suggested interface name |
|
|
Minimum number of VLANs |
1 |
1 |
Minimum number of IP subnets |
3 |
2 |
Minimum recommended IP subnet size |
|
|
External routing |
Not required |
Required, may use proxy server |
Multiple segments/stretch segment |
Stretch segment for management cluster due to MetalLB Layer 2 limitations 4 |
Stretch segment due to VRRP, MetalLB Layer 2 limitations |
Internal routing |
Routing to separate DHCP segments, if in use |
|
- 4
Multiple VLAN segments with IP subnets can be added to the cluster configuration for separate DHCP domains.
Since 23.2.2, MOSK supports full L3 networking topology in the Technology Preview scope. This enables deployment of specific cluster segments in dedicated racks without the need for L2 layer extension between them. For configuration procedure, see Configure BGP announcement for cluster API LB address and Configure BGP announcement of external addresses of Kubernetes load-balanced services in Deployment Guide.
If you configure BGP announcement of the load-balancer IP address for a MOSK cluster API and for load-balanced services of the cluster, ensure that your MOSK cluster networking meets the following requirements:
Network type |
Provisioning |
LCM |
External |
Kubernetes workloads |
|---|---|---|---|---|
Minimum number of VLANs |
1 (optional) |
1 |
1 |
1 |
Suggested interface name |
N/A |
|
|
|
Minimum number of IP subnets |
1 (optional) |
1 |
2 |
1 |
Minimum recommended IP subnet size |
16 IPs (DHCP range) |
|
|
1 IP per cluster node |
Stretch or multiple segments |
Multiple |
Multiple |
Multiple For details, see Configure node selectors for MetalLB speakers. |
Multiple |
External routing |
Not required |
Not required |
Required, default route |
Not required |
Internal routing |
Routing to the provisioning network of the management cluster |
|
Routing to the IP subnet of the Container Cloud Management API |
Routing to all IP subnets of Kubernetes workloads |
If you configure ARP announcement of the load-balancer IP address for a MOSK cluster API and for load-balanced services of the cluster, ensure that your MOSK cluster networking meets the following requirements:
Network type |
Provisioning |
LCM/API |
LCM |
External |
Kubernetes workloads |
|---|---|---|---|---|---|
Minimum number of VLANs |
1 (optional) |
1 |
1 (optional) |
1 |
1 |
Suggested interface name |
N/A |
|
|
|
|
Minimum number of IP subnets |
1 (optional) |
1 |
1 (optional) |
2 |
1 |
Minimum recommended IP subnet size |
16 IPs (DHCP range) |
|
1 IP per MOSK node (Kubernetes worker) |
|
1 IP per cluster node |
Stretch or multiple segments |
Multiple |
Stretch due to VRRP limitations |
Multiple |
Stretch connected to all MOSK controller nodes. For details, see Configure node selectors for MetalLB speakers. |
Multiple |
External routing |
Not required |
Not required |
Not required |
Required, default route |
Not required |
Internal routing |
Routing to the provisioning network of the management cluster |
|
|
Routing to the IP subnet of the Container Cloud Management API |
Routing to all IP subnets of Kubernetes workloads |
- 5(1,2)
The bridge interface with this name is mandatory if you need to separate Kubernetes workloads traffic. You can configure this bridge over the VLAN or directly over the bonded or single interface.
Network type |
Storage access |
Storage replication |
|---|---|---|
Minimum number of VLANs |
1 |
1 |
Suggested interface name |
|
|
Minimum number of IP subnets |
1 |
1 |
Minimum recommended IP subnet size |
1 IP per cluster node |
1 IP per cluster node |
Stretch or multiple segments |
Multiple |
Multiple |
External routing |
Not required |
Not required |
Internal routing |
Routing to all IP subnets of the Storage access network |
Routing to all IP subnets of the Storage replication network |
Note
When selecting externally routable subnets, ensure that the subnet ranges do not overlap with the internal subnets ranges. Otherwise, internal resources of users will not be available from the MOSK cluster.
- 6(1,2)
For details about Ceph networks, see Ceph Network Configuration Reference.
IP Address Management
Mirantis OpenStack for Kubernetes (MOSK) uses IP Address Management (IPAM) to keep track of the network addresses allocated to bare metal hosts. This is necessary to avoid IP address conflicts and expiration of address leases to machines through DHCP.
Note
Only IPv4 address family is currently supported by MOSK and IPAM. IPv6 is neiter supported nor used.
IPAM is provided by the kaas-ipam controller. Its functions include:
Allocation of IP address ranges or subnets to newly created clusters using the
Subnetresource.Note
Before Container Cloud 2.27.0 (Cluster releases 17.1.0, 16.1.0, or earlier) the deprecated
SubnetPoolresource was also used for this purpose. For details, see Deprecation Notes: SubnetPool resource management.Allocation of IP addresses to machines and cluster services at the request of
baremetal-providerusing theIpamHostandIPaddrresources.Creation and maintenance of host networking configuration on bare metal hosts using the
IpamHostresources.
The IPAM service can support different networking topologies and network hardware configurations on the bare metal hosts.
In the most basic network configuration, IPAM uses a single L3 network to assign addresses to all bare metal hosts, as defined in MOSK cluster networking.
You can apply complex networking configurations to a bare metal host using L2 templates. L2 templates imply multihomed host networking and enable you to create a managed cluster where nodes use separate host networks for different types of traffic. Multihoming is required to ensure the security and performance of a MOSK cluster.
Caution
Modification of L2 templates in use is only allowed with a mandatory validation step from the infrastructure operator to prevent accidental cluster failures due to unsafe changes. The list of risks posed by modifying L2 templates includes:
Services running on hosts cannot reconfigure automatically to switch to the new IP addresses and/or interfaces.
Connections between services are interrupted unexpectedly, which can cause data loss.
Incorrect configurations on hosts can lead to irrevocable loss of connectivity between services and unexpected cluster partition or disassembly.
For details, see Modify network configuration on an existing machine.
Multi-rack architecture
TechPreview
Mirantis OpenStack for Kubernetes (MOSK) enables you to deploy a cluster with a multi-rack architecture, where every data center cabinet (a rack) incorporates its own Layer 2 network infrastructure that does not extend beyond its top-of-rack switch. The architecture allows a MOSK cloud to integrate natively with the Layer 3-centric networking topologies such as Spine-Leaf that are commonly seen in modern data centers.
The architecture eliminates the need to stretch and manage VLANs across parts of a single data center, or to build VPN tunnels between the segments of a geographically distributed cloud.
The set of networks present in each rack depends on the backend used by the OpenStack networking service.
Bare metal provisioning network
In the Mirantis Container Cloud and MOSK multi-rack reference architecture, every rack has its own L2 segment (VLAN) to bootstrap and install servers.
Segmentation of the provisioning network requires additional configuration of the underlay networking infrastructure and certain Container Cloud API objects. You need to configure a DHCP Relay agent on the border of each VLAN in the provisioning network. The agent handles broadcast DHCP requests coming from the bare metal servers in the rack and forwards them as unicast packets across L3 fabric of the data center to a Container Cloud management cluster.
From the standpoint of Container Cloud API, you need to configure per-rack DHCP
ranges by adding Subnet resources in Container Cloud as described in
Configure multiple DHCP address ranges.
The DHCP server of Container Cloud automatically leases a temporary IP address from the DHCP range to the requester host depending on the address of the DHCP agent that relays the request.
Note
Since Container Cloud 2.30.0 (Cluster releases 21.0.0 and 20.0.0), management cluster supports full L3 networking topology in the Technology Preview scope. This enables deployment of management cluster nodes in dedicated racks without the need for L2 layer extension between them.
For details, see Underlay networking: routing configuration.
Multi-rack MOSK cluster
To deploy a MOSK cluster with multi-rack reference architecture, you need to create a dedicated set of subnets and L2 templates for every rack in your cluster.
Every specific host type in the rack, which is defined by the role in the MOSK cluster and network-related hardware configuration, may require a specific L2 template.
Note
Since 23.2.2, MOSK supports full L3 networking topology in the Technology Preview scope. This enables deployment of specific cluster segments in dedicated racks without the need for L2 layer extension between them. For configuration procedure, see Configure BGP announcement for cluster API LB address and Configure BGP announcement of external addresses of Kubernetes load-balanced services in Deployment Guide.
For MOSK 23.1 and older versions, due to the Container Cloud limitations, you need to configure the following networks to have L2 segments (VLANs) stretch across racks to all hosts of certain types in a multi-rack environment:
- LCM/API network
Must be configured on the Kubernetes manager nodes of the MOSK cluster. Contains a Kubernetes API endpoint with a VRRP virtual IP address. Enables MKE cluster nodes to communicate with each other.
- External network
Exposes OpenStack, StackLight, and other services of the MOSK cluster to external clients.
For details, see Underlay networking: routing configuration.
When planning space allocation for IP addresses in your cluster, pick large IP ranges for each type of network. Then you will split these ranges into per-rack subnets.
For example, if you allocate a /20 address block for LCM network,
then you can create up to 16 Subnet objects with the /24 address block
each for up to 16 racks. This way you can simplify routing on your hosts using
the large /20 IP subnet as an aggregated route destination. For details,
see Underlay networking: routing configuration.
Multi-rack MOSK cluster with Tungsten Fabric
A typical medium and more sized MOSK cloud consists of three or more racks that can generally be divided into the following major categories:
Compute/Storage racks that contain the hypervisors and instances running on top of them. Additionally, they contain nodes that store cloud applications’ block, ephemeral, and object data as part of the Ceph cluster.
Control plane racks that incorporate all the components needed by the cloud operator to manage its life cycle. Also, they include the services through which the cloud users interact with the cloud to deploy their applications, such as cloud APIs and web UI.
A control plane rack may also contain additional compute and storage nodes.
The diagram below will help you to plan the networking layout of a multi-rack MOSK cloud with Tungsten Fabric.
Note
Since 23.2.2, MOSK supports full L3 networking topology in the Technology Preview scope. This enables deployment of specific cluster segments in dedicated racks without the need for L2 layer extension between them. For configuration procedure, see Configure BGP announcement for cluster API LB address and Configure BGP announcement of external addresses of Kubernetes load-balanced services in Deployment Guide.
For MOSK 23.1 and older versions, Kubernetes masters (3 nodes) either need to be placed into a single rack or, if distributed across multiple racks for better availability, require stretching of the L2 segment of the management network across these racks. This requirement is caused by the Mirantis Kubernetes Engine underlay for MOSK relying on the Layer 2 VRRP protocol to ensure high availability of the Kubernetes API endpoint.
The table below provides a mapping between the racks and the network types participating in a multi-rack MOSK cluster with the Tungsten Fabric backend.
Network |
VLAN name |
Control Plane rack |
Compute/Storage rack |
|---|---|---|---|
Common/PXE |
|
Yes |
Yes |
Management |
|
Yes |
Yes |
External (MetalLB) |
|
Yes |
No |
Kubernetes workloads |
|
Yes |
Yes |
Storage access (Ceph) |
|
Yes |
Yes |
Storage replication (Ceph) |
|
Yes |
Yes |
Overlay |
|
Yes |
Yes |
Live migration |
|
Yes |
Yes |
Physical networks layout
This section summarizes the requirements for the physical layout of underlay network and VLANs configuration for the multi-rack architecture of Mirantis OpenStack for Kubernetes (MOSK).
Physical networking of a management cluster
Due to limitations of virtual IP address for Kubernetes API and of MetalLB load balancing in MOSK, the management cluster nodes must share VLAN segments in the provisioning and management networks.
In the multi-rack architecture, the management cluster nodes may be placed to a single rack or spread across three racks. In either case, provisioning and management network VLANs must be stretched across ToR switches of the racks.
Note
Since Container Cloud 2.30.0 (Cluster releases 21.0.0 and 20.0.0), management cluster supports full L3 networking topology in the Technology Preview scope. This enables deployment of management cluster nodes in dedicated racks without the need for L2 layer extension between them.
For details, see Underlay networking: routing configuration.
The following diagram illustrates physical and L2 connections of a management cluster.
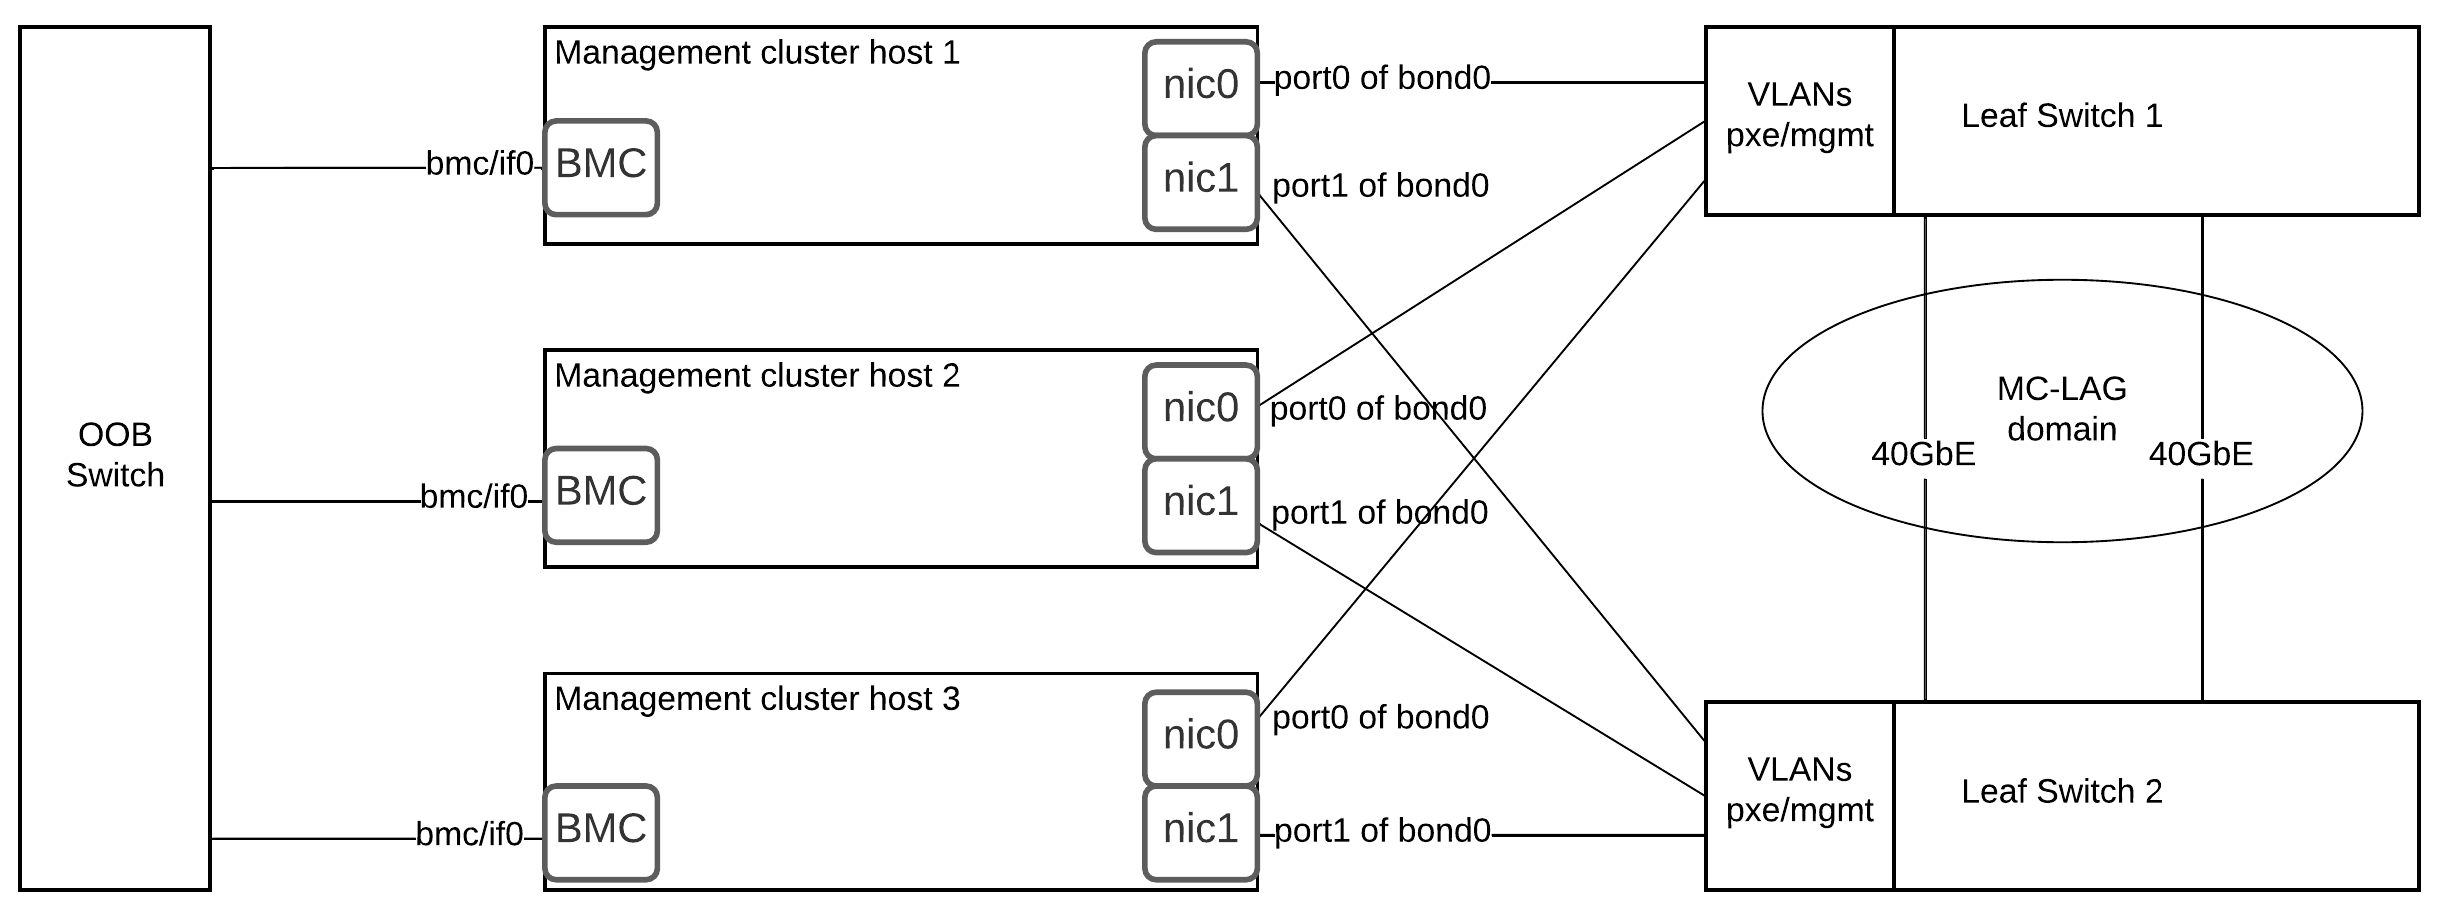
The network fabric reference configuration is a spine/leaf with 2 leaf ToR switches and one out-of-band (OOB) switch per rack.
Reference configuration uses the following switches for ToR and OOB:
Cisco WS-C3560E-24TD has 24 of 1 GbE ports. Used in OOB network segment.
Dell Force 10 S4810P has 48 of 1/10GbE ports. Used as ToR in Common/PXE network segment.
In the reference configuration, all odd interfaces from NIC0 are connected
to Leaf TOR Switch 1, and all even interfaces from NIC0 are connected
to Leaf TOR Switch 2. The Baseboard Management Controller (BMC) interfaces
of the servers are connected to OOB Switch 1.
The following recommendations apply to all types of nodes:
Use the Link Aggregation Control Protocol (LACP) bonding mode with MC-LAG domains configured on leaf switches. This corresponds to the
802.3adbond mode on hosts.Use ports from different multi-port NICs when creating bonds. This makes network connections redundant if failure of a single NIC occurs.
Configure the ports that connect servers to the PXE network with PXE VLAN as native or untagged. On these ports, configure LACP fallback to ensure that the servers can reach DHCP server and boot over network.
See also
Physical networking of a MOSK cluster
Since 23.2.2, MOSK supports full L3 networking topology in the Technology Preview scope. This enables deployment of specific cluster segments in dedicated racks without the need for L2 layer extension between them. For configuration procedure, see Configure BGP announcement for cluster API LB address and Configure BGP announcement of external addresses of Kubernetes load-balanced services in Deployment Guide.
If you configure BGP announcement for IP addresses of load-balanced services of a MOSK cluster, the external network can consist of multiple VLAN segments connected to all nodes of a MOSK cluster where MetalLB speaker components are configured to announce IP addresses for Kubernetes load-balanced services. Mirantis recommends that you use OpenStack controller nodes for this purpose.
If you configure ARP announcement for IP addresses of load-balanced services of a MOSK cluster, the external network must consist of a single VLAN stretched to the ToR switches of all the racks where MOSK nodes connected to the external network are located. Those are the nodes where MetalLB speaker components are configured to announce IP addresses for Kubernetes load-balanced services. Mirantis recommends that you use OpenStack controller nodes for this purpose.
Depending of cluster needs, an operator can select how the VIP address for Kubernetes API is advertised. When BGP advertisement is used or the OpenStack control plane is deployed on separate nodes, as opposite to a compact control plane, it allows for a more flexible configuration and there is no need to search for a compromise such as the one described below.
But, when using ARP advertisement on a compact control plane, the selection of network for advertising the VIP address for Kubernetes API may depend on whether the symmetry of service return traffic is required. Therefore, when using ARP advertisement on a compact control plane, select one of the following options in the drop-down list:
Network selection for advertising the VIP address for Kubernetes
API on a compact control plane
For traffic symmetry between MOSK and management clusters and asymmetry in case of external clients:
Use the API/LCM network to advertise the VIP address for Kubernetes API. Allocate this VIP address in the CIDR address of the API/LCM network.
The gateway in the API/LCM network for a MOSK cluster must have a route to the management subnet of the management cluster. This is required to ensure symmetric traffic flow between the management and MOSK clusters.
For traffic symmetry in case of external clients and asymmetry between MOSK and management clusters:
Use external network to advertise the VIP address for Kubernetes API. Allocate this VIP address in the CIDR address of the external network.
One of the gateways either in the API/LCM network, or in the external network for a MOSK cluster must have a route to the management subnet of the management cluster. This is required to establish the traffic flow between the management and MOSK clusters.
Note
Since 23.2.2, MOSK supports full L3 networking topology in the Technology Preview scope. This enables deployment of specific cluster segments in dedicated racks without the need for L2 layer extension between them. For configuration procedure, see Configure BGP announcement for cluster API LB address and Configure BGP announcement of external addresses of Kubernetes load-balanced services in Deployment Guide.
If BGP announcement is configured for MOSK cluster API LB address, Kubernetes manager nodes have no requirement to share the single stretched VLAN segment in the API/LCM network. All VLANs may be configured per rack.
If ARP announcement is configured for MOSK cluster API LB address, Kubernetes manager nodes must share the VLAN segment in the API/LCM network. In the multi-rack architecture, Kubernetes manager nodes may be spread across three racks. The API/LCM network VLAN must be stretched to the ToR switches of the racks. All other VLANs may be configured per rack. This requirement is caused by the Mirantis Kubernetes Engine underlay for MOSK relying on the Layer 2 VRRP protocol to ensure high availability of the Kubernetes API endpoint.
The following diagram illustrates physical and L2 network connections of the Kubernetes manager nodes in a MOSK cluster.
Caution
Such configuration does not apply to a compact control plane MOSK installation. See Create a MOSK cluster.
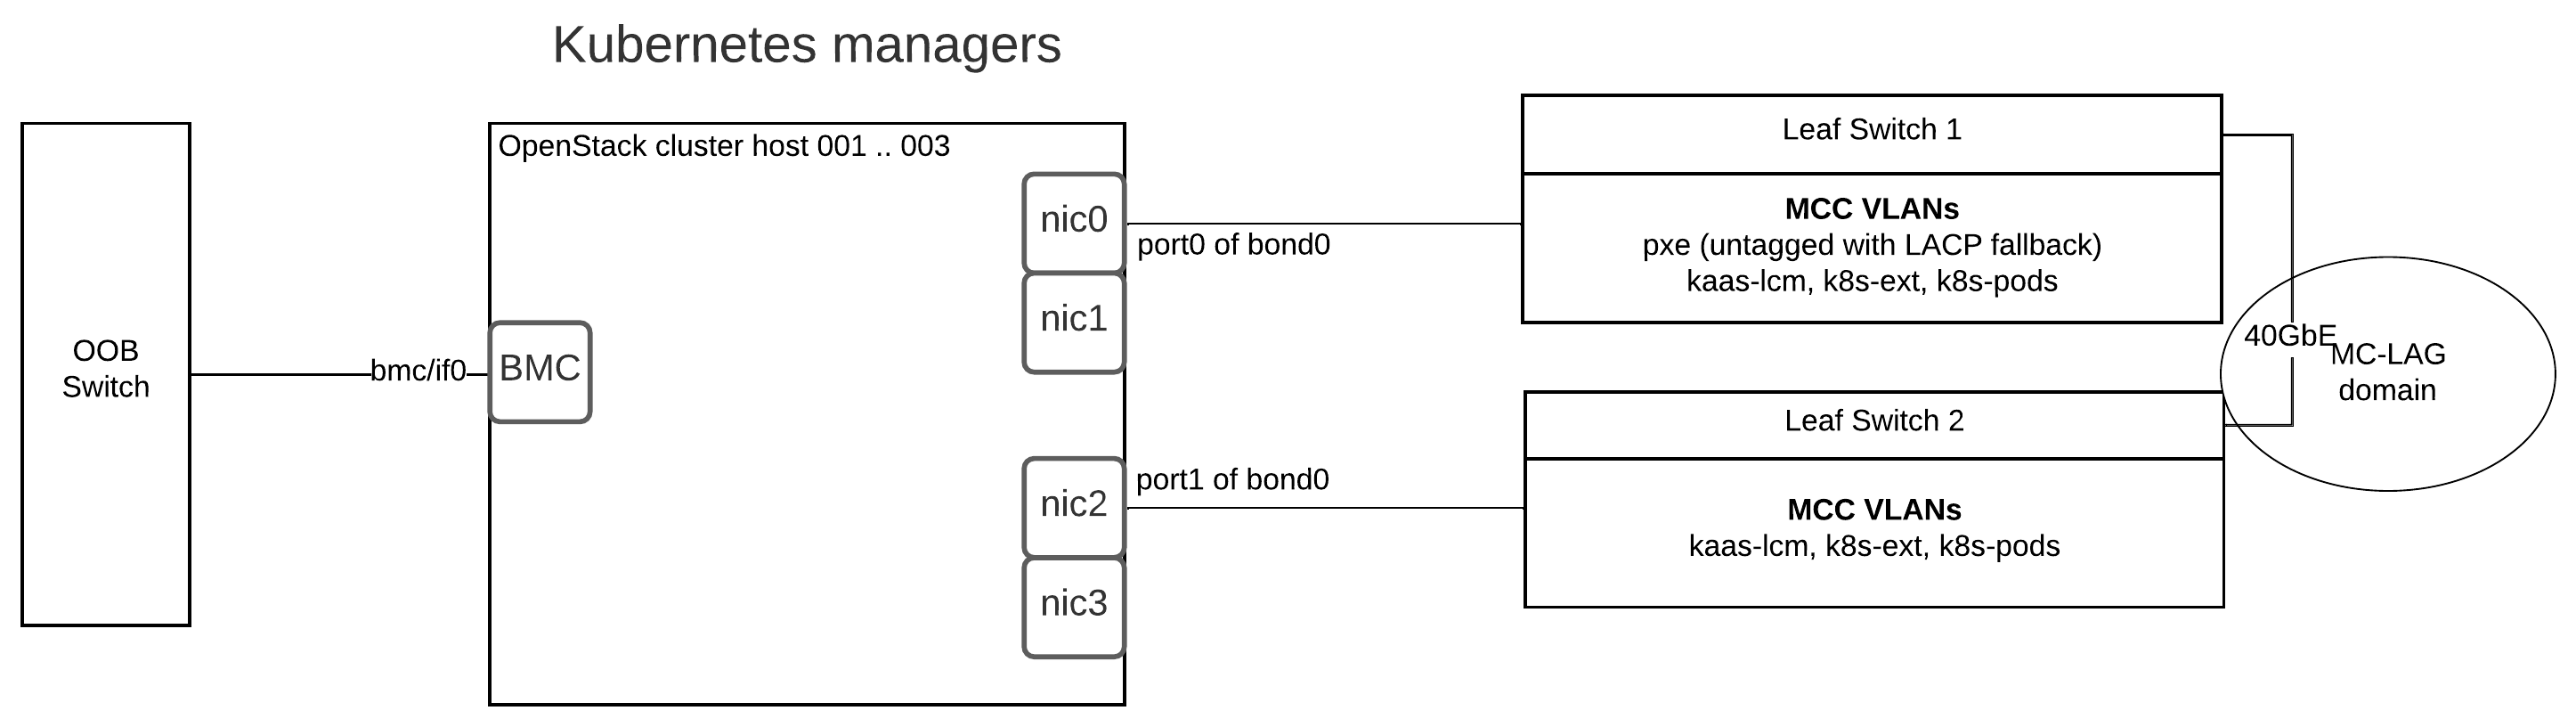
The following diagram illustrates physical and L2 network connections of the control plane nodes in a MOSK cluster.
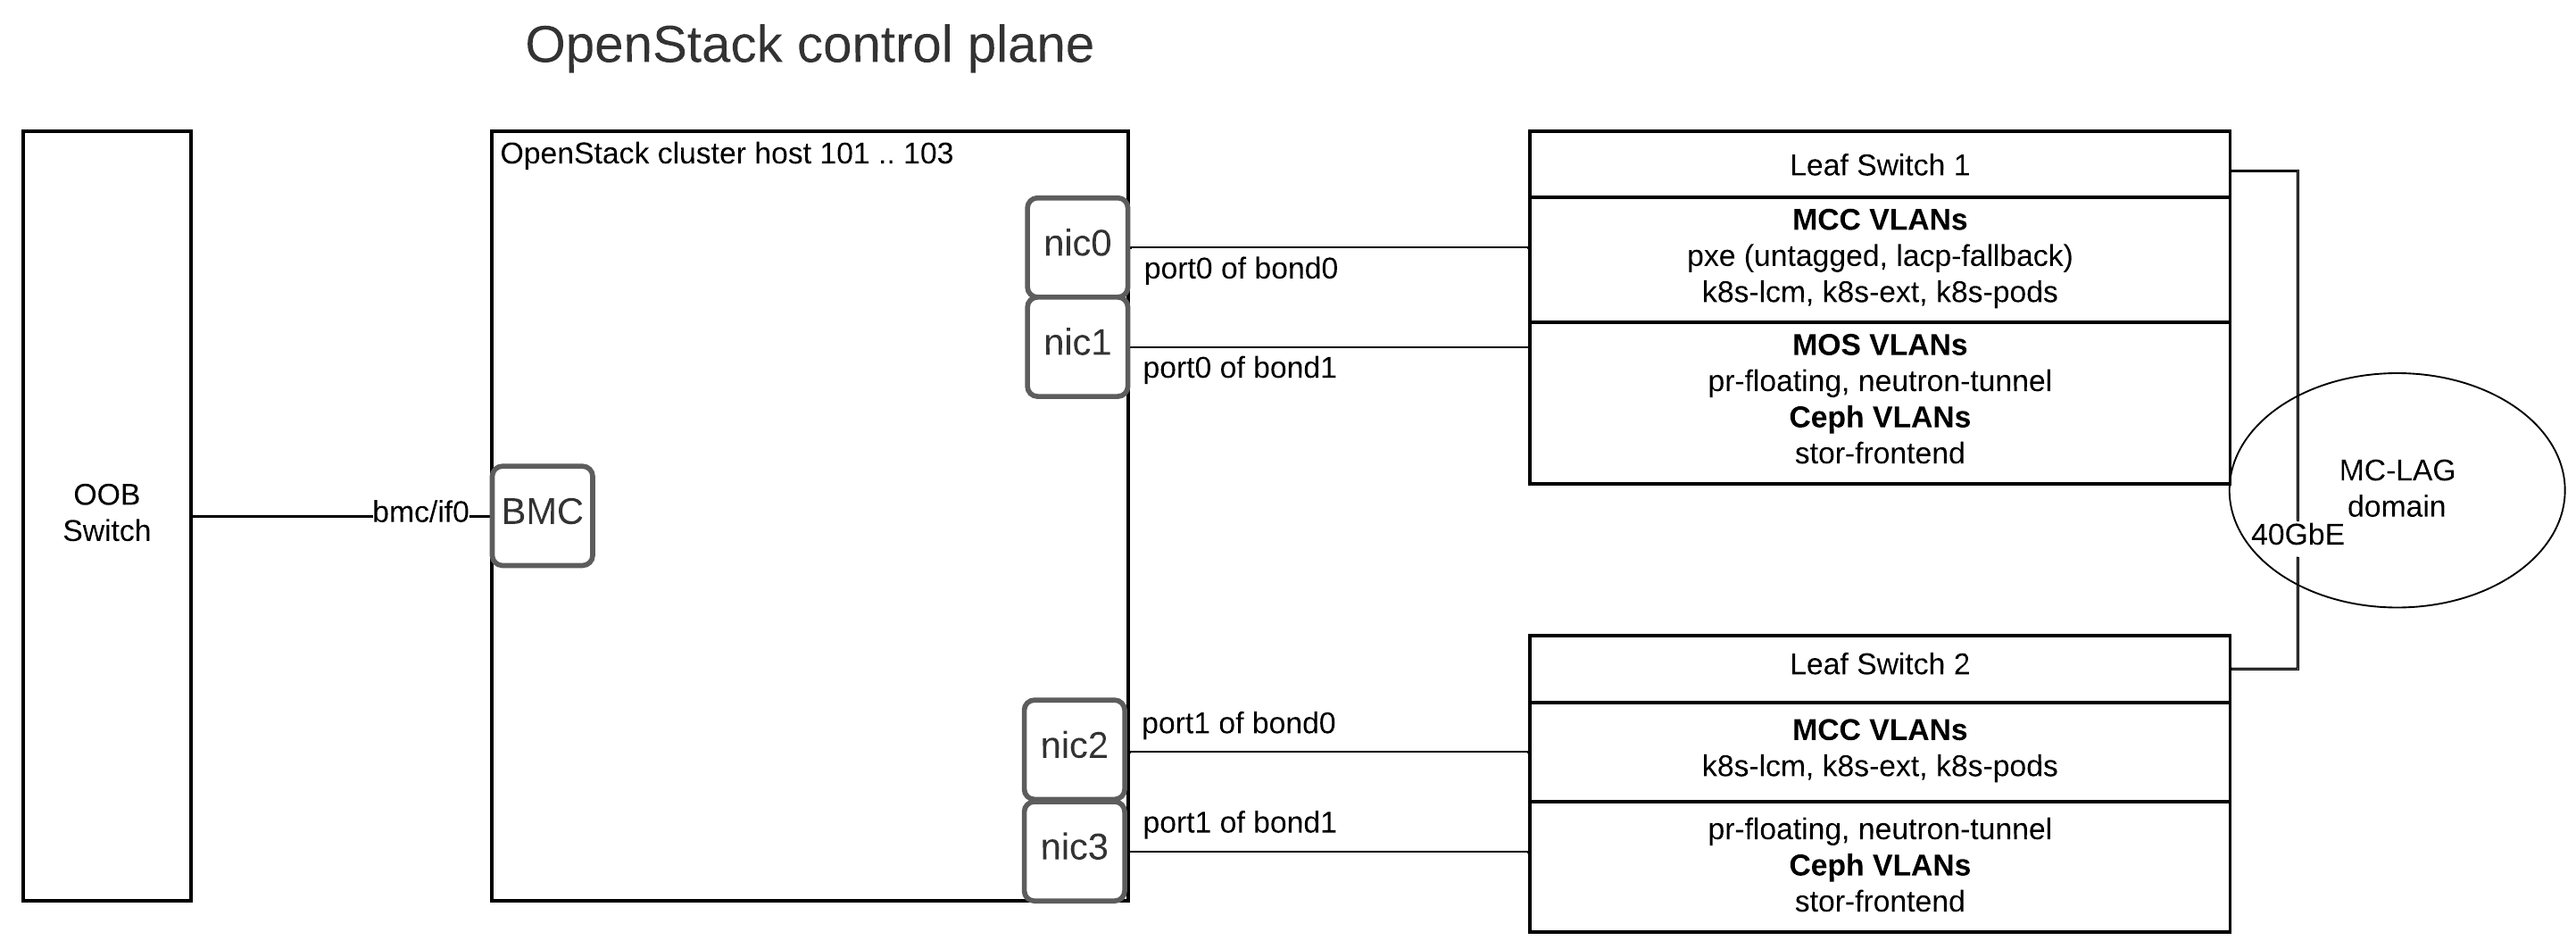
All VLANs for OpenStack compute nodes may be configured per rack. No VLAN should be stretched across multiple racks.
The following diagram illustrates physical and L2 network connections of the compute nodes in a MOSK cluster.
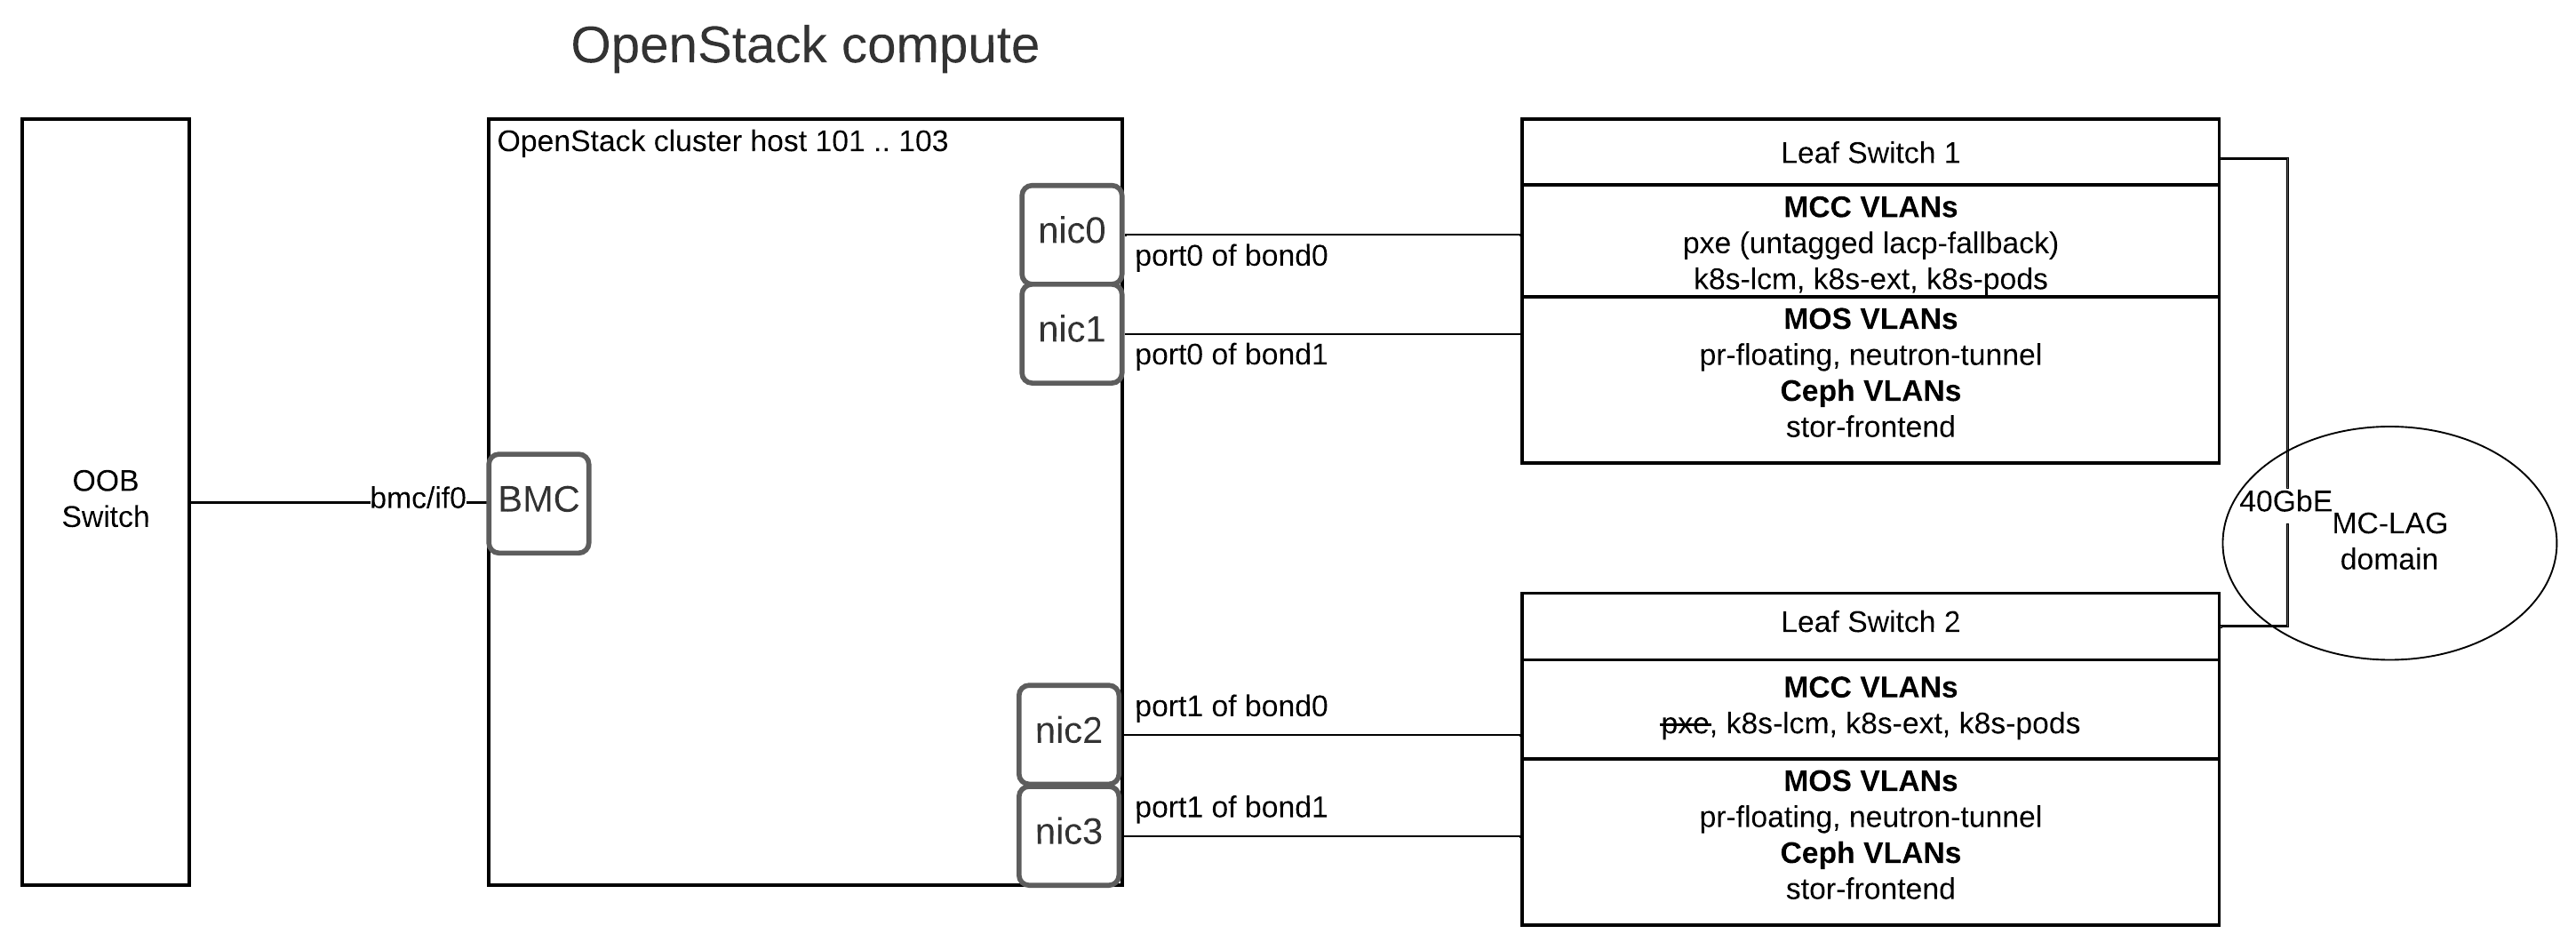
All VLANs for OpenStack storage nodes may be configured per rack. No VLAN should be stretched across multiple racks.
The following diagram illustrates physical and L2 network connections of the storage nodes in a MOSK cluster.
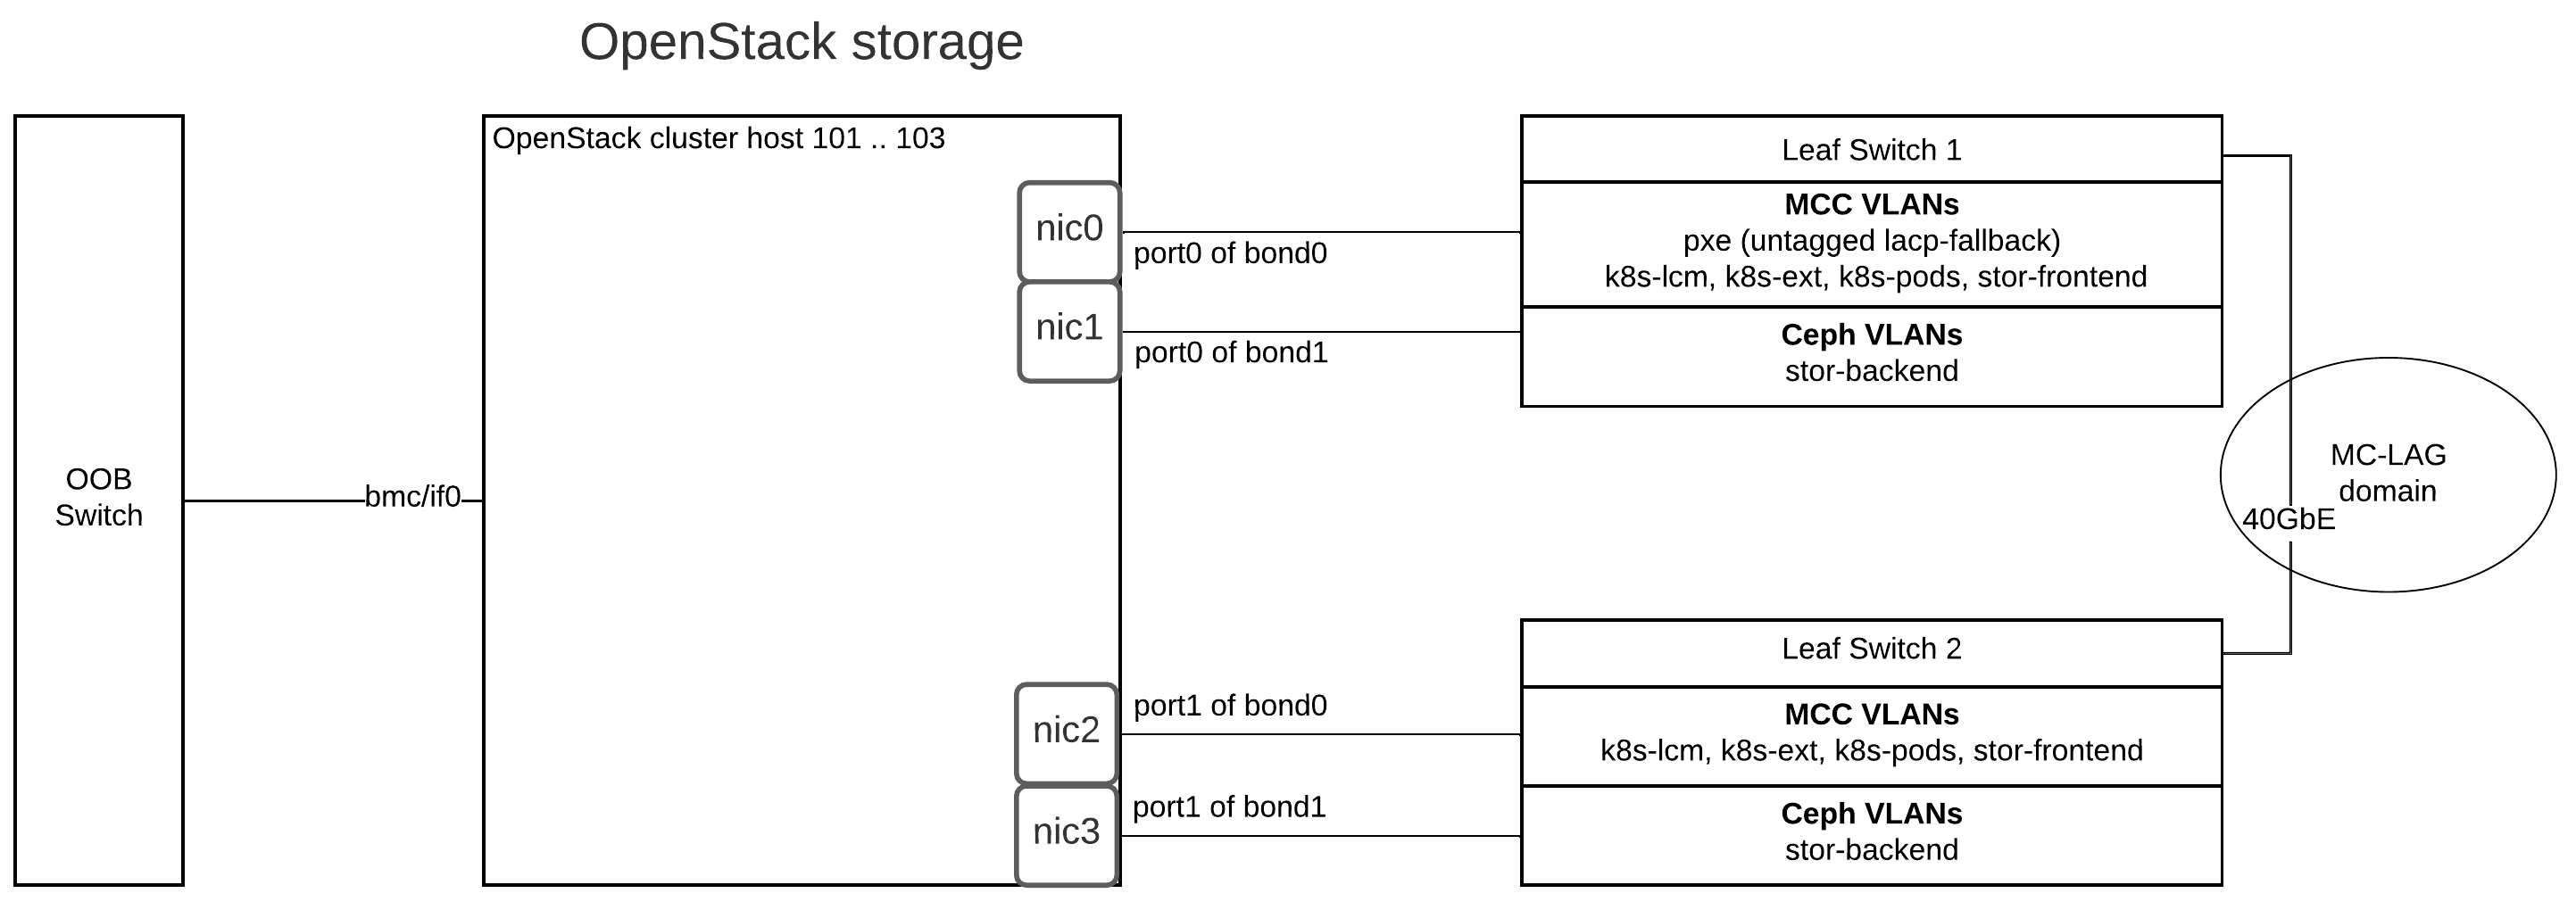
Underlay networking: routing configuration
This section describes requirements for the configuration of the underlay network for an MOSK cluster in a multi-rack reference configuration. The infrastructure operator must configure the underlay network according to these guidelines. MOSK will not configure routing on the network devices.
Provisioning network
In the multi-rack reference architecture, every server rack has its own layer-2 segment (VLAN) for network bootstrap and installation of physical servers.
You need to configure top-of-rack (ToR) switches in each rack with the default gateway for the provisioning network VLAN. This gateway must also serve as a DHCP Relay Agent on the border of the VLAN. The agent handles broadcast DHCP requests coming from the bare metal servers in the rack and forwards them as unicast packets across the data center L3 fabric to the provisioning network of a management cluster.
Therefore, each ToR gateway must have an IP route to the IP subnet of the provisioning network of the management cluster. The provisioning network gateway, in turn, must have routes to all IP subnets of all racks.
The hosts of the management cluster must have routes to all IP subnets in the provisioning network through the gateway in the provisioning network of the management cluster.
BGP or ARP announcement of IP addresses of the provisioning services
Since Container Cloud 2.30.0 (Cluster releases 21.0.0 and 20.0.0), management cluster supports full L3 networking topology in the Technology Preview scope. This enables deployment of management cluster nodes in dedicated racks without the need for L2 layer extension between them.
If you configure BGP announcement of IP addresses of the provisioning services for a management cluster, each host in the management cluster must have routes to all IP subnets in the provisioning network, through the ToR gateway for the rack of this host. The hosts of the management cluster that are mounted to different racks do not need to share a single provisioning VLAN segment.
If you configure ARP announcement of IP addresses of the provisioning services for a management cluster, all hosts in the management cluster must have IP addresses from the same IP subnet of the provisioning network. Even if the hosts of the management cluster are mounted to different racks, they must share a single provisioning VLAN segment.
Management network
This network connects a management cluster to Kubernetes API endpoints of MOSK clusters. It also connects LCM agents of MOSK nodes to the Kubernetes API endpoint of the management cluster.
The network gateway must have routes to all API/LCM subnets of all MOSK clusters.
BGP or ARP announcement of the load-balancer IP address
Since Container Cloud 2.30.0 (Cluster releases 21.0.0 and 20.0.0), management cluster supports full L3 networking topology in the Technology Preview scope. This enables deployment of management cluster nodes in dedicated racks without the need for L2 layer extension between them.
If you configure BGP announcement of the load-balancer IP address for a management cluster API, each host in the management cluster must have routes to all IP subnets in the management network, through the ToR gateway for the rack of this host. The hosts of the management cluster that are mounted to different racks do not need to share a single provisioning VLAN segment.
When BGP mode is used for announcement of IP addresses of load-balanced services and for the cluster API VIP, three BGP sessions are created for every node of a management cluster:
Two sessions are created by MetalLB for public and provisioning services
One session is created by the
birdBGP daemon for the cluster API VIP
BGP only allows one session to be established per a pair of endpoints. For details, see MetalLB documentation: Issues with Calico. To solve this issue, different methods can be used. MOSK allows configuring three networks for a management cluster: provisioning, management, and external. In this case, configure MetalLB to use provisioning and external networks, and BIRD to use the management network.
If you use the external network in the management cluster, the gateways in this network are used as the default routes on the nodes in the management cluster. Otherwise, the gateways in the management network are used as the default routes on the nodes in the management cluster. These gateways must connect to external Internet networks directly or through a proxy server. If the Internet is accessible through a proxy server, you must configure the bootstrap cluster to use it as well. For details, see Deploy a management cluster.
If you configure ARP announcement of the load-balancer IP address for a management cluster API, all hosts of a management cluster must have IP addresses from the same subnet of the management network. Even if hosts of a management cluster are mounted to different racks, they must share a single management VLAN segment.
The gateway in this network is used as the default route on the nodes in a management cluster. This gateway must connect to external Internet networks directly or through a proxy server. If the Internet is accessible through a proxy server, you must configure the bootstrap cluster to use it as well. For details, see Deploy a management cluster.
LCM network
This network may include multiple VLANs, typically, one VLAN per rack. Each VLAN may have one or more IP subnets with gateways configured on ToR switches.
Each ToR gateway must provide routes to all other IP subnets in all other VLANs in the LCM network to enable communication between nodes in the cluster.
BGP or ARP announcement of the load-balancer IP address
Since 23.2.2, MOSK supports full L3 networking topology in the Technology Preview scope. This enables deployment of specific cluster segments in dedicated racks without the need for L2 layer extension between them. For configuration procedure, see Configure BGP announcement for cluster API LB address and Configure BGP announcement of external addresses of Kubernetes load-balanced services in Deployment Guide.
If you configure BGP announcement of the load-balancer IP address for a MOSK cluster API:
All nodes of a MOSK cluster must be connected to the LCM network. Each host connected to this network must have routes to all IP subnets in the LCM network and to the management subnet of the management cluster, through the ToR gateway for the rack of this host.
It is not required to configure a separate API/LCM network. Announcement of the IP address of the load balancer is done using the LCM or external network.
If you configure ARP announcement of the load-balancer IP address for a MOSK cluster API:
All nodes of a MOSK cluster excluding manager nodes must be connected to the LCM network. Each host connected to this network must have routes to all IP subnets in the LCM network, including the API/LCM network of this MOSK cluster and to the management subnet of the management cluster, through the ToR gateway for the rack of this host.
It is required to configure a separate API/LCM network. All manager nodes of a MOSK cluster must be connected to the API/LCM network. IP address announcement for load balancing is done using the API/LCM or external network.
API/LCM network
Note
Since 23.2.2, MOSK supports full L3 networking topology in the Technology Preview scope. This enables deployment of specific cluster segments in dedicated racks without the need for L2 layer extension between them. For configuration procedure, see Configure BGP announcement for cluster API LB address and Configure BGP announcement of external addresses of Kubernetes load-balanced services in Deployment Guide.
If you configure BGP announcement of the load-balancer IP address for the MOSK cluster API, the API/LCM network is not required. Announcement of the cluster API LB address is done using the LCM or external network.
If you configure ARP announcement of the load-balancer IP address for the MOSK cluster API, the API/LCM network must be configured on the Kubernetes manager nodes of the cluster. This network contains the Kubernetes API endpoint with the VRRP virtual IP address.
This network consists of a single VLAN shared between all MOSK manager nodes in a MOSK cluster, even if the nodes are spread across multiple racks. All manager nodes of a MOSK cluster must be connected to this network and have IP addresses from the same subnet in this network.
The gateway in this network must have routes to all IP subnets in the LCM network of this MOSK cluster.
Depending of cluster needs, an operator can select how the VIP address for Kubernetes API is advertised. When BGP advertisement is used or the OpenStack control plane is deployed on separate nodes, as opposite to a compact control plane, it allows for a more flexible configuration and there is no need to search for a compromise such as the one described below.
But, when using ARP advertisement on a compact control plane, the selection of network for advertising the VIP address for Kubernetes API may depend on whether the symmetry of service return traffic is required. Therefore, when using ARP advertisement on a compact control plane, select one of the following options in the drop-down list:
Network selection for advertising the VIP address for Kubernetes
API on a compact control plane
For traffic symmetry between MOSK and management clusters and asymmetry in case of external clients:
Use the API/LCM network to advertise the VIP address for Kubernetes API. Allocate this VIP address in the CIDR address of the API/LCM network.
The gateway in the API/LCM network for a MOSK cluster must have a route to the management subnet of the management cluster. This is required to ensure symmetric traffic flow between the management and MOSK clusters.
For traffic symmetry in case of external clients and asymmetry between MOSK and management clusters:
Use external network to advertise the VIP address for Kubernetes API. Allocate this VIP address in the CIDR address of the external network.
One of the gateways either in the API/LCM network, or in the external network for a MOSK cluster must have a route to the management subnet of the management cluster. This is required to establish the traffic flow between the management and MOSK clusters.
External network
BGP or ARP announcement for IP addresses of MOSK load-balanced services
Since 23.2.2, MOSK supports full L3 networking topology in the Technology Preview scope. This enables deployment of specific cluster segments in dedicated racks without the need for L2 layer extension between them. For configuration procedure, see Configure BGP announcement for cluster API LB address and Configure BGP announcement of external addresses of Kubernetes load-balanced services in Deployment Guide.
If you configure BGP announcement for IP addresses of load-balanced services of a MOSK cluster, the external network can consist of multiple VLAN segments connected to all nodes of a MOSK cluster where MetalLB speaker components are configured to announce IP addresses for Kubernetes load-balanced services. Mirantis recommends that you use OpenStack controller nodes for this purpose.
If you configure ARP announcement for IP addresses of load-balanced services of a MOSK cluster, the external network must consist of a single VLAN stretched to the ToR switches of all the racks where MOSK nodes connected to the external network are located. Those are the nodes where MetalLB speaker components are configured to announce IP addresses for Kubernetes load-balanced services. Mirantis recommends that you use OpenStack controller nodes for this purpose.
The IP gateway in this network is used as the default route on all nodes in the MOSK cluster, which are connected to this network. This allows external users to connect to the OpenStack endpoints exposed as Kubernetes load-balanced services.
Dedicated IP address ranges must be configured as address pools for the MetalLB service. It is not obligatory to allocate these IP ranges from the external network CIDR address, but the route for the IP addresses that constitute these IP ranges must match the IP gateway in the external network. MetalLB allocates addresses from these address pools to Kubernetes load-balanced services.
Depending of cluster needs, an operator can select how the VIP address for Kubernetes API is advertised. When BGP advertisement is used or the OpenStack control plane is deployed on separate nodes, as opposite to a compact control plane, it allows for a more flexible configuration and there is no need to search for a compromise such as the one described below.
But, when using ARP advertisement on a compact control plane, the selection of network for advertising the VIP address for Kubernetes API may depend on whether the symmetry of service return traffic is required. Therefore, when using ARP advertisement on a compact control plane, select one of the following options in the drop-down list:
Network selection for advertising the VIP address for Kubernetes
API on a compact control plane
For traffic symmetry between MOSK and management clusters and asymmetry in case of external clients:
Use the API/LCM network to advertise the VIP address for Kubernetes API. Allocate this VIP address in the CIDR address of the API/LCM network.
The gateway in the API/LCM network for a MOSK cluster must have a route to the management subnet of the management cluster. This is required to ensure symmetric traffic flow between the management and MOSK clusters.
For traffic symmetry in case of external clients and asymmetry between MOSK and management clusters:
Use external network to advertise the VIP address for Kubernetes API. Allocate this VIP address in the CIDR address of the external network.
One of the gateways either in the API/LCM network, or in the external network for a MOSK cluster must have a route to the management subnet of the management cluster. This is required to establish the traffic flow between the management and MOSK clusters.
External network for a management cluster
Note
Since Container Cloud 2.30.0 (Cluster releases 21.0.0 and 20.0.0), management cluster supports full L3 networking topology in the Technology Preview scope. This enables deployment of management cluster nodes in dedicated racks without the need for L2 layer extension between them.
This network can only be used if you configure BGP announcement of IP addresses of the load-balanced services for a management cluster.
Note
When BGP mode is used for announcement of IP addresses of load-balanced services and for the cluster API VIP, three BGP sessions are created for every node of a management cluster:
Two sessions are created by MetalLB for public and provisioning services
One session is created by the
birdBGP daemon for the cluster API VIP
BGP only allows one session to be established per a pair of endpoints. For details, see MetalLB documentation: Issues with Calico. To solve this issue, different methods can be used. MOSK allows configuring three networks for a management cluster: provisioning, management, and external. In this case, configure MetalLB to use provisioning and external networks, and BIRD to use the management network.
The gateways in the external network are used as the default routes on the nodes in the management cluster. These gateways must connect to external Internet networks directly or through a proxy server. If the Internet is accessible through a proxy server, you must configure the bootstrap cluster to use it as well. For details, see Deploy a management cluster.
Ceph public network
This network may include multiple VLANs and IP subnets, typically, one VLAN and IP subnet per rack. All IP subnets in this network must be connected by IP routes on the ToR switches.
Typically, every node in a MOSK cluster is connected to this network and have routes to all IP subnets from this network through its rack IP gateway.
This network is not connected to the external networks.
Ceph cluster network
This network may include multiple VLANs and IP subnets, typically, one VLAN and IP subnet per rack. All IP subnets in this network must be connected by IP routes on the ToR switches.
Every Ceph OSD node in a MOSK cluster must be connected to this network and have routes to all IP subnets from this network through its rack IP gateway.
This network is not connected to the external networks.
Kubernetes workloads network
This network may include multiple VLANs and IP subnets, typically, one VLAN and IP subnet per rack. All IP subnets in this network must be connected by IP routes on the ToR switches.
All nodes in a MOSK cluster must be connected to this network and have routes to all IP subnets from this network through its rack IP gateway.
This network is not connected to the external networks.
Performance optimization
The following recommendations apply to all types of nodes in the Mirantis OpenStack for Kubernetes (MOSK) clusters.
Jumbo frames
To improve the goodput, we recommend that you enable jumbo frames where possible. The jumbo frames have to be enabled on the whole path of the packets traverse. If one of the network components cannot handle jumbo frames, the network path uses the smallest MTU.
Bonding
To provide fault tolerance of a single NIC, we recommend using the link aggregation, such as bonding. The link aggregation is useful for linear scaling of bandwidth, load balancing, and fault protection. Depending on the hardware equipment, different types of bonds might be supported. Use the multi-chassis link aggregation as it provides fault tolerance at the device level. For example, MLAG on Arista equipment or vPC on Cisco equipment.
The Linux kernel supports the following bonding modes:
active-backupbalance-xor802.3ad(LACP)balance-tlbbalance-alb
Since LACP is the IEEE standard 802.3ad supported by the majority of
network platforms, we recommend using this bonding mode.
Use the Link Aggregation Control Protocol (LACP) bonding mode
with MC-LAG domains configured on ToR switches. This corresponds to
the 802.3ad bond mode on hosts.
Additionally, follow these recommendations in regards to bond interfaces:
Use ports from different multi-port NICs when creating bonds. This makes network connections redundant if failure of a single NIC occurs.
Configure the ports that connect servers to the PXE network with PXE VLAN as native or untagged. On these ports, configure LACP fallback to ensure that the servers can reach DHCP server and boot over network.
Spanning tree portfast mode
Configure Spanning Tree Protocol (STP) settings on the network switch ports to ensure that the ports start forwarding packets as soon as the link comes up. It helps avoid iPXE timeout issues and ensures reliable boot over network.
Built-in load balancing
MOSK clusters use MetalLB for load balancing of services and HAProxy with VIP managed by Virtual Router Redundancy Protocol (VRRP) with Keepalived for the Kubernetes API load balancer.
Kubernetes API load balancing
Every control plane node of each Kubernetes cluster runs the kube-api
service in a container. This service provides a Kubernetes API endpoint. Every
control plane node also runs the haproxy server that provides load
balancing with backend health checking for all kube-api endpoints as
backends.
The default load balancing method is least_conn. With this method, a
request is sent to the server with the least number of active connections. The
default load balancing method cannot be changed using the
MOSK management API.
Only one of the control plane nodes at any given time serves as a frontend for the Kubernetes API. To ensure this, the Kubernetes clients use a virtual IP (VIP) address for accessing Kubernetes API. This VIP is assigned to one node at a time using VRRP. Keepalived running on each control plane node provides health checking and failover of the VIP.
Keepalived is configured in multicast mode.
Note
The use of VIP address for load balancing of Kubernetes API requires that all control plane nodes of a Kubernetes cluster are connected to a shared L2 segment. This limitation prevents from installing full L3 topologies where control plane nodes are split between different L2 segments and L3 networks.
Services load balancing
The services provided by the Kubernetes clusters, including
MOSK and user services, are balanced by MetalLB. The
metallb-speaker service runs on every worker node in the cluster and
handles connections to the service IP addresses.
MetalLB runs in the MAC-based (L2) mode. It means that all control plane nodes must be connected to a shared L2 segment. This is a limitation that does not allow installing full L3 cluster topologies.
Proxy support and cache of artifacts
Proxy support
If you require all Internet access to go through a proxy server for security and audit purposes, you can bootstrap management clusters using proxy. The proxy server settings consist of three standard environment variables that are set prior to the bootstrap process:
HTTP_PROXYHTTPS_PROXYNO_PROXY
These settings are not propagated to MOSK clusters. However, you can enable a separate proxy access on a MOSK cluster using the MOSK management console. This proxy is intended for the end user needs and is not used for a MOSK cluster deployment or for access to the Mirantis resources.
Caution
Since MOSK uses the OpenID Connect (OIDC) protocol for IAM authentication, management clusters require a direct non-proxy access from MOSK clusters.
StackLight components, which require external access, automatically use the same proxy that is configured for MOSK clusters.
On MOSK clusters with limited Internet access, a proxy is required for StackLight components that use HTTP and HTTPS and are disabled by default but need external access if enabled, for example, for the Salesforce integration and external rules of Alertmanager notifications. For more details about proxy implementation in StackLight, see StackLight proxy.
For the list of Mirantis resources and IP addresses to be accessible from MOSK clusters, see System requirements for the seed node.
After enabling proxy support on MOSK clusters, proxy is used for:
Docker traffic on MOSK clusters
StackLight
OpenStack
Warning
Any modification to the Proxy object used in any cluster, for
example, changing the proxy URL, NO_PROXY values, or
certificate, leads to cordon-drain and Docker
restart on the cluster machines.
Artifacts caching
MOSK clusters are deployed without direct Internet access to consume less Internet traffic in your cluster. The Mirantis artifacts used during MOSK clusters deployment are downloaded through a cache running on a management cluster. The feature is enabled by default.
Caution
IAM operations require a direct non-proxy access of a MOSK cluster to a management cluster.
Infrastructure connectivity monitoring
Available since MCC 2.30.0 (21.0.0 and 20.0.0)
Clusters may occasionally encounter issues due to failures in the underlying infrastructure, such as network switches, and data center networking fabric. Monitoring the cluster underlay networking allows the operator to:
Reduce the time spent diagnosing outages and restoring services
Correlate major software stack issues with the underlying infrastructure outages and visualize this data
Identify the weakest points in the software stack and improve product resilience
Using the InfraConnectivityMonitor resource, you can enable network
infrastructure monitoring to monitor network connectivity between management or
MOSK cluster nodes using ping checks. The operator can use
the monitoring data to correlate the major software stack issues with the
underlying infrastructure outages as well as identify the weakest points of the
software stack to make it more resilient.
Once the required objects are created, the NetChecker controller generates a
configuration for network checker based on Machine, L2Template, and
Subnet objects related to the target cluster and starts ping checks for
each target node.
StackLight is pre-configured to collect metrics from monitoring agents and
includes CnncAgentDown and CnncNodeDown alerts. It also contains the
dedicated Grafana Infra - Cross Node Connectivity dashboard to
provide information about cross-node network connectivity checks.
Caution
ICMP protocol for ping checks must be allowed within the whole network infrastructure including all baremetal hosts, switches, and routers in-between racks, if any.
The stack of infrastructure connectivity monitoring (NetChecker) consists of the following components.
On a management cluster:
netchecker-controllerManages the whole infrastructure connectivity monitoring configuration once the operator creates the
InfraConnectivityMonitorobject on the management cluster. The NetChecker controller creates and manages theCheckerInventoryConfigandNetCheckerTargetsConfigobjects on the target MOSK cluster.The
InfraConnectivityMonitorobject updates the configuration of theCheckerInventoryConfigandNetCheckerTargetsConfigobjects according to the state ofMachine,L2Template, andSubnetobjects of the target cluster.Also, the NetChecker controller monitors the state of related
Machineobjects. If a machine is moved to theMaintenancemode, becomesDisabled, or is scheduled for deletion, the corresponding Kubernetes node is automatically removed from the NetChecker configuration with the reason provided in the status of theInfraConnectivityMonitorobject.For more details on monitoring resources described above, see API Reference: InfraConnectivityMonitor, CheckerInventoryConfig, and NetCheckerTargetsConfig.
On a target MOSK cluster:
Note
By default, the following components are always present in the
netchecker namespace in new and existing clusters.
cnnc-inventory-agentPeriodically runs on each machine and collects IP addresses along with other meta information for the defined list of subnets. Updates the
CheckerInventoryConfigstatus on each run.cnnc-inventory-controllerMonitors and manages the
CheckerInventoryConfigstatus.Prepares the configuration for
cnnc-inventory-agentper node and analyzes output results of the node information collected bycnnc-inventory-agent.Verifies whether synchronization between
cnnc-inventory-agentandCheckerInventoryConfigis actual. If it does not detect target machines or their IP addresses from defined subnets, or in case of any misconfiguration,cnnc-inventory-controllerpropagates errors in theCheckerInventoryConfigstatus.
cnnc-netchecker-controllerMonitors and manages statuses of
CheckerInventoryConfigandNetCheckerTargetsConfigobjects on the target cluster.Propagates errors in statuses of
CheckerInventoryConfigandNetCheckerTargetsConfigobjects in case of inventory issues.Prepares configuration for
cnnc-agentto execute ping checks for IP addresses defined for each node with dedicated subnets.
cnnc-agentRuns on each node to execute ping checks according to the configuration prepared by
cnnc-netchecker-controller.
Bare metal
The bare metal service provides for the discovery, deployment, and management of bare metal hosts. The bare metal management in Mirantis OpenStack for Kubernetes (MOSK) is implemented as a set of modular microservices. Each microservice implements a certain requirement or function within the bare metal management system.
Bare metal components
The bare metal management solution for MOSK includes the following components:
Component |
Description |
|---|---|
OpenStack Ironic |
The backend bare metal manager in a standalone mode with its auxiliary
services that include |
OpenStack Ironic Inspector |
Introspects and discovers the bare metal hosts inventory. Includes OpenStack Ironic Python Agent (IPA) that is used as a provision-time agent for managing bare metal hosts. |
Ironic Operator |
Monitors changes in the external IP addresses of |
Bare Metal Operator |
Manages bare metal hosts through the Ironic API. The Bare Metal Operator implementation is based on the Metal³ project. |
Bare metal resources manager |
Ensures that the bare metal provisioning artifacts such as the distribution image of the operating system is available and up to date. |
|
The plugin for the Kubernetes Cluster API integrated with MOSK.
MOSK uses the Metal³ implementation of
|
HAProxy |
Load balancer for external access to the Kubernetes API endpoint. |
LCM Agent |
Used for physical and logical storage, physical and logical network, and control over the life cycle of a bare metal machine resources. |
Ceph |
Distributed shared storage is required by MOSK services for MOSK clusters to create persistent volumes to store their data. Ceph is not deployed on management clusters. |
MetalLB |
Load balancer for Kubernetes services on bare metal. 1 |
Keepalived |
Monitoring service that ensures availability of the virtual IP for the external load balancer endpoint (HAProxy). 1 |
IPAM |
IP address management services provide consistent IP address space to the machines in bare metal clusters. See details in IP Address Management. |
- 1(1,2)
For details, see Built-in load balancing.
The diagram below summarizes the following components and resource kinds:
Metal³-based bare metal management in MOSK (white)
Internal APIs (yellow)
External dependency components (blue)
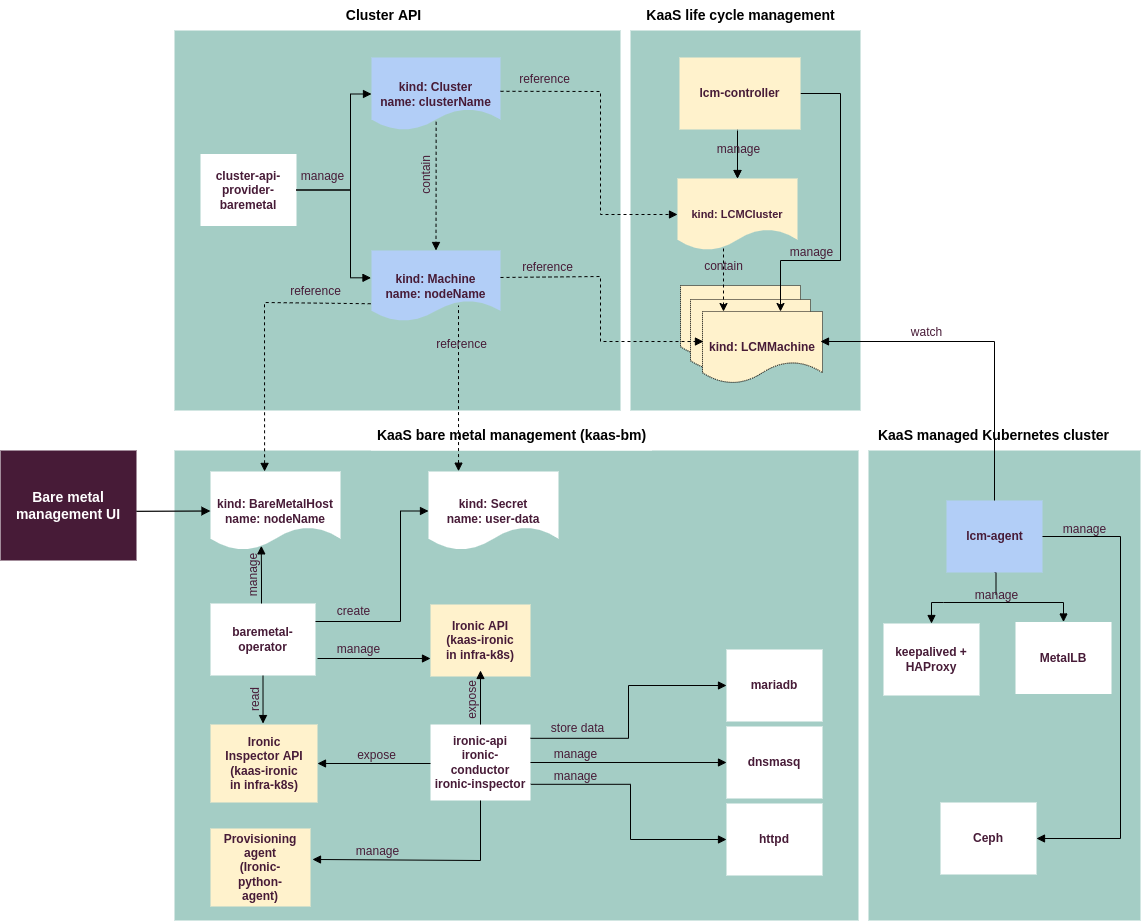
Extended hardware configuration
Mirantis Container Cloud provides APIs that enable you to define hardware configurations that extend the reference architecture:
Bare Metal Host Profile API
Enables for quick configuration of host boot and storage devices and assigning of custom configuration profiles to individual machines. See Create a custom bare metal host profile.
IP Address Management API
Enables for quick configuration of host network interfaces and IP addresses and setting up of IP addresses ranges for automatic allocation. See Create L2 templates.
Typically, operations with the extended hardware configurations are available through the API and CLI, but not the management console.
Kubernetes underlay
The Kubernetes lifecycle management (LCM) engine in MOSK consists of the following components:
- LCM Controller
Responsible for all LCM operations. Consumes the
LCMClusterobject and orchestrates actions through LCM Agent.- LCM Agent
Runs on the target host. Executes Ansible playbooks in headless mode.
- Helm Controller
Responsible for the Helm charts life cycle, is installed by the provider as a Helm v3 chart.
The Kubernetes LCM components handle the following custom resources:
LCMClusterLCMMachineHelmBundle
The following diagram illustrates handling of the LCM custom resources by the
Kubernetes LCM components. On a MOSK cluster, apiserver
handles multiple Kubernetes objects, for example, deployments, nodes, RBAC, and
so on.
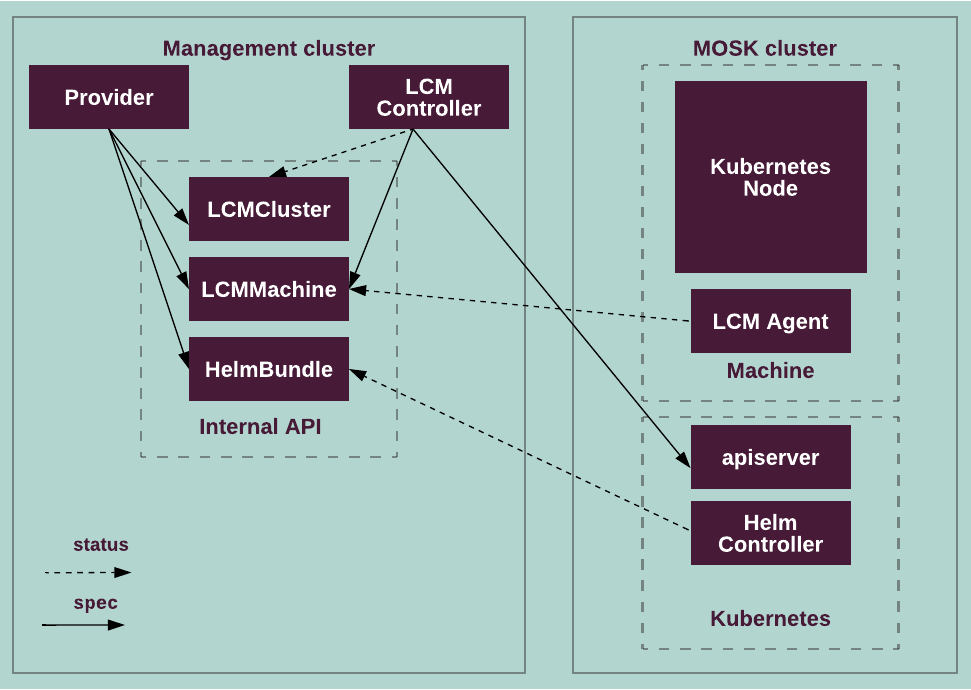
The following sections outline key components of the Kubernetes LCM engine in MOSK.
LCM custom resources
The Kubernetes LCM components handle the following custom resources (CRs):
- LCMMachine
Describes a machine that is located on a cluster. Contains the machine
type,control, orworkerStateItemsthat correspond to Ansible playbooks and miscellaneous actions, for example, downloading a file or executing a shell command.LCMMachinereflects the current state of a machine, for example, a node IP address, and eachStateItemthrough its status. MultipleLCMMachineCRs can correspond to a single cluster.- LCMCluster
Describes a MOSK cluster. In its
spec,LCMClustercontains a set ofStateItemsfor each type ofLCMMachine, which describe the actions that must be performed to deploy the cluster.LCMClusteris created by the provider usingmachineTypesof theReleaseobject. Thestatusfield ofLCMClusterreflects the status of the cluster, for example, the number of ready or requested nodes.- HelmBundle
Wrapper for Helm charts that is handled by Helm Controller.
HelmBundletracks what Helm charts must be installed on a MOSK cluster.
LCM Controller
LCM Controller runs on the management cluster and orchestrates the
LCMMachine objects according to their type and their LCMCluster object.
Once the LCMCluster and LCMMachine objects are created, LCM Controller
starts monitoring them to modify the spec fields and update the status
fields of the LCMMachine objects when required. The status field of
LCMMachine is updated by LCM Agent running on a node of a management or
MOSK cluster.
Each LCMMachine has the following lifecycle states:
Uninitialized - the machine is not yet assigned to an
LCMCluster.Pending - the agent reports a node IP address and host name.
Prepare - the machine executes
StateItemsthat correspond to thepreparephase. This phase usually involves downloading the necessary archives and packages.Deploy - the machine executes
StateItemsthat correspond to thedeployphase that is becoming a Mirantis Kubernetes Engine (MKE) node.Ready - the machine is being deployed.
Upgrade - the machine is being upgraded to the new MKE version.
Reconfigure - the machine executes
StateItemsthat correspond to thereconfigurephase. The machine configuration is being updated without affecting workloads running on the machine.
The templates for StateItems are stored in the machineTypes field of an
LCMCluster object, with separate lists for the MKE manager and worker
nodes. Each StateItem has the execution phase field for a management
and MOSK cluster:
The
preparephase is executed for all machines for which it was not executed yet. This phase comprises downloading the files necessary for the cluster deployment, installing the required packages, and so on.During the
deployphase, a node is added to the cluster. LCM Controller applies thedeployphase to the nodes in the following order:First manager node is deployed.
The remaining manager nodes are deployed one by one and the worker nodes are deployed in batches (by default, up to 50 worker nodes at the same time).
LCM Controller deploys and upgrades a MOSK cluster by
setting StateItems of LCMMachine objects following the corresponding
StateItems phases described above. A MOSK cluster update
process follows the same logic that is used for a new deployment, that is
applying a new set of StateItems to LCMMachines after updating the
LCMCluster object. But if the existing worker node is being updated, LCM
Controller performs draining and cordoning on this node honoring the
Pod Disruption Budgets.
This operation prevents unexpected disruptions of workloads.
LCM Agent
LCM Agent handles a single machine that belongs to a management or
MOSK cluster. It runs on the machine operating system but
communicates with apiserver of the management cluster. LCM Agent is
deployed as a systemd unit using cloud-init. LCM Agent has a built-in
self-upgrade mechanism.
LCM Agent monitors the spec of a particular LCMMachine object to
reconcile the machine state with the object StateItems and update the
LCMMachine status`` accordingly. The actions that LCM Agent performs while
handling StateItems are as follows:
Download configuration files
Run shell commands
Run Ansible playbooks in headless mode
LCM Agent provides the IP address and host name of the machine for the
status parameter of LCMMachine.
Helm Controller
Helm Controller handles management and MOSK clusters core addons, such as StackLight, and the application addons, such as the OpenStack components.
Helm Controller is installed as a separate Helm v3 chart by the provider. Its
Pods are created using Deployment.
The Helm release information is stored in the KaaSRelease object for the
management clusters and in the ClusterRelease object for management and
MOSK clusters. These objects are used by the provider that
uses the information from the ClusterRelease object together with the
management API Cluster spec. In Cluster spec, the operator can specify
the Helm release name and charts to use. By combining the information from the
providerSpec parameter of the Cluster object and its ClusterRelease
object, the cluster actuator generates LCMCluster objects. These objects
are further handled by LCM Controller, and the HelmBundle object is handled
by Helm Controller. HelmBundle must have the same name as the
LCMCluster object for the cluster that HelmBundle applies to.
Although a cluster actuator can only create a single HelmBundle per
cluster, Helm Controller can handle multiple HelmBundle objects per
cluster.
Helm Controller handles HelmBundle objects and reconciles them with the
state of Helm in its cluster.
Helm Controller can also be used by the management cluster with corresponding
HelmBundle objects created as part of the initial management cluster setup.
MKE API limitations
To ensure MOSK stability in managing Mirantis Kubernetes Engine (MKE) clusters, the following MKE API functionality is not available for the MOSK-based MKE clusters as compared to the MKE clusters that are deployed not by MOSK. Use the MOSK management console or CLI for this functionality instead.
API endpoint |
Limitation |
|---|---|
|
Swarm Join Tokens are filtered out for all users, including admins. |
|
All requests are forbidden. |
|
Requests for the following changes are forbidden:
|
|
All requests are forbidden. |
See also
MKE configuration management
This section describes configuration specifics of an MKE cluster deployed using MOSK.
MKE configuration managed by MOSK
Since Container Cloud 2.25.1 (Cluster releases 16.0.1 and 17.0.1), MOSK does not override changes in MKE configuration except the following list of parameters that are automatically managed by MOSK. These parameters are always overridden by MOSK default values if modified direclty using the MKE API. For details on configuration using the MKE API, see MKE configuration managed directly by the MKE API.
However, you can manually configure a few options from this list using the
Cluster object of a MOSK cluster. They are labeled with
the superscript and contain references to
the respective configuration procedures in the Comments columns of the
tables.
MKE parameter name |
Default value in MOSK |
Comments |
|---|---|---|
|
You can configure this option either using MKE API with no MOSK
overrides or using the If configured using the |
|
|
|
For configuration procedure, see comments above. |
MKE parameter name |
Default value in MOSK |
|---|---|
|
|
|
|
|
|
|
|
MKE parameter name |
Default value in MOSK |
|---|---|
|
|
|
|
|
|
|
|
|
|
|
|
|
|
|
|
MKE parameter name |
Default value in MOSK |
|---|---|
|
|
|
|
|
|
|
|
|
|
MKE parameter name |
Default value in MOSK |
|---|---|
|
|
|
|
MKE parameter name |
Default value in MOSK |
|---|---|
|
|
MKE parameter name |
Default value in MOSK |
Comments |
|---|---|---|
|
|
|
|
|
For configuration steps, see Set the MTU size for Calico. |
|
|
|
|
|
|
|
|
|
|
|
|
|
|
|
|
|
Applies only to MKE on the management cluster. |
|
|
|
|
|
|
|
|
|
|
|
For configuration steps, see Increase storage quota for etcd. |
|
|
|
|
|
|
|
For configuration steps, see Configure Kubernetes auditing and profiling. |
|
|
|
|
|
|
|
|
|
|
|
|
For configuration steps, see Configure Kubernetes auditing and profiling. |
|
|
|
|
|
|
|
|
|
|
|
|
|
|
|
|
|
|
|
|
|
|
|
You can override this value in |
|
|
|
|
|
|
|
|
|
|
|
|
|
|
|
|
|
|
|
|
You can override this value in |
|
|
|
|
|
|
|
|
|
|
|
|
|
|
- 2(1,2)
For
priv_attributesparameters, you can add custom options on top of existing parameters using the MKE API.- 3
For management clusters since MCC 2.26.0 (Cluster release 16.1.0).
- 4
For management and MOSK clusters since MCC 2.24.3 (Cluster releases 15.0.2 and 14.0.2).
- 5(1,2,3)
For management and MOSK clusters since MCC 2.27.0 (Cluster releases 17.2.0 and 16.2.0). For configuration steps, see Configure Kubernetes auditing and profiling.
Note
All possible values for parameters labeled with the
superscript, which you can manually
configure using the Cluster object are described in
MKE Operations Guide: Configuration options.
MKE configuration managed directly by the MKE API
Since Container Cloud 2.25.1 (Cluster releases 17.0.1 and 16.0.1), aside from MKE parameters described in MKE configuration managed by MOSK, MOSK does not override changes in MKE configuration that are applied directly through the MKE API. For configuration options and procedure, see MKE documentation:
Configure an existing MKE cluster
While using this procedure, replace the command to upload the newly edited MKE configuration file with the following one:
curl --silent --insecure -X PUT -H "X-UCP-Allow-Restricted-API: i-solemnly-swear-i-am-up-to-no-good" -H "accept: application/toml" -H "Authorization: Bearer $AUTHTOKEN" --upload-file 'mke-config.toml' https://$MKE_HOST/api/ucp/config-toml
Important
Mirantis cannot guarrantee the expected behavior of the functionality configured using the MKE API as long as customer-specific configuration does not undergo testing within MOSK. Therefore, Mirantis recommends that you test custom MKE settings configured through the MKE API on a staging environment before applying them to production.
Storage
A MOSK cluster uses Ceph as a distributed storage system for file, block, and object storage. This section provides an overview of a Ceph cluster deployed by Container Cloud.
Ceph overview
Mirantis Container Cloud deploys Ceph on MOSK using Helm charts with the following components:
- Rook Ceph Operator
A storage orchestrator that deploys Ceph on top of a Kubernetes cluster. Also known as
RookorRook Operator. Rook operations include:Deploying and managing a Ceph cluster based on provided Rook CRs such as
CephCluster,CephBlockPool,CephObjectStore, and so on.Orchestrating the state of the Ceph cluster and all its daemons.
- Ceph cluster custom resource (Ceph cluster CR)
Represents the customization of a Kubernetes installation and allows you to define the required Ceph configuration before deployment. For example, you can define the failure domain, Ceph pools, Ceph node roles, number of Ceph components such as Ceph OSDs, and so on. The Ceph cluster CR differs in MOSK releases:
The
MiraCephCR that is managed byceph-controlleron the MOSK cluster.The
KaaSCephClusterCR that is managed byceph-kcc-controlleron the management cluster.- Ceph Controller
A Kubernetes controller that obtains the parameters from Container Cloud through a CR, creates CRs for Rook and updates its CR status based on the Ceph cluster deployment progress. It creates users, pools, and keys for OpenStack and Kubernetes and provides Ceph configurations and keys to access them. Also, Ceph Controller eventually obtains the data from the OpenStack Controller (Rockoon) for the Keystone integration and updates the Ceph Object Gateway services configurations to use Kubernetes for user authentication.
The Ceph Controller operations include:
Transforming user parameters from the Container Cloud Ceph CR into Rook CRs and deploying a Ceph cluster using Rook.
Providing integration of the Ceph cluster with Kubernetes.
Providing data for OpenStack to integrate with the deployed Ceph cluster.
- Ceph Status Controller
A Kubernetes controller that collects all valuable parameters from the current Ceph cluster, its daemons, and entities and exposes them into the
MiraCephHealthstatus. Ceph Status Controller operations include:Collecting all statuses from a Ceph cluster and corresponding Rook CRs.
Collecting additional information on the health of Ceph daemons.
Provides information to the
statussection of theMiraCephHealthCR.
A Kubernetes controller that collects all valuable parameters from the current Ceph cluster, its daemons, and entities and exposes them into the
KaaSCephClusterstatus. Ceph Status Controller operations include:Collecting all statuses from a Ceph cluster and corresponding Rook CRs.
Collecting additional information on the health of Ceph daemons.
Provides information to the
statussection of theKaaSCephClusterCR.
- Ceph Request Controller
A Kubernetes controller that obtains the parameters from Container Cloud through a CR and manages Ceph OSD lifecycle management (LCM) operations. It allows for a safe Ceph OSD removal from the Ceph cluster. Ceph Request Controller operations include:
Providing an ability to perform Ceph OSD LCM operations.
Obtaining specific CRs to remove Ceph OSDs and executing them.
Pausing the regular Ceph Controller reconciliation until all requests are completed.
A typical Ceph cluster consists of the following components:
Ceph Managers:
Two Ceph Managers
One Ceph Manager
Three or, in rare cases, five Ceph Monitors
Ceph Object Gateway (
radosgw). Mirantis recommends having three or moreradosgwinstances for HA.Ceph OSDs. The number of Ceph OSDs may vary depending on deployment needs.
Warning
A Ceph cluster with 3 Ceph nodes does not provide hardware fault tolerance and is not eligible for recovery operations, such as a disk or an entire Ceph node replacement.
A Ceph cluster uses the replication factor that equals 3. If the number of Ceph OSDs is less than 3, a Ceph cluster moves to the degraded state with the write operations restriction until the number of alive Ceph OSDs equals the replication factor again.
The placement of Ceph Monitors and Ceph Managers is defined in the following CR:
MiraCeph
KaaSCephCluster
The following diagram illustrates the way a Ceph cluster is deployed in MOSK:
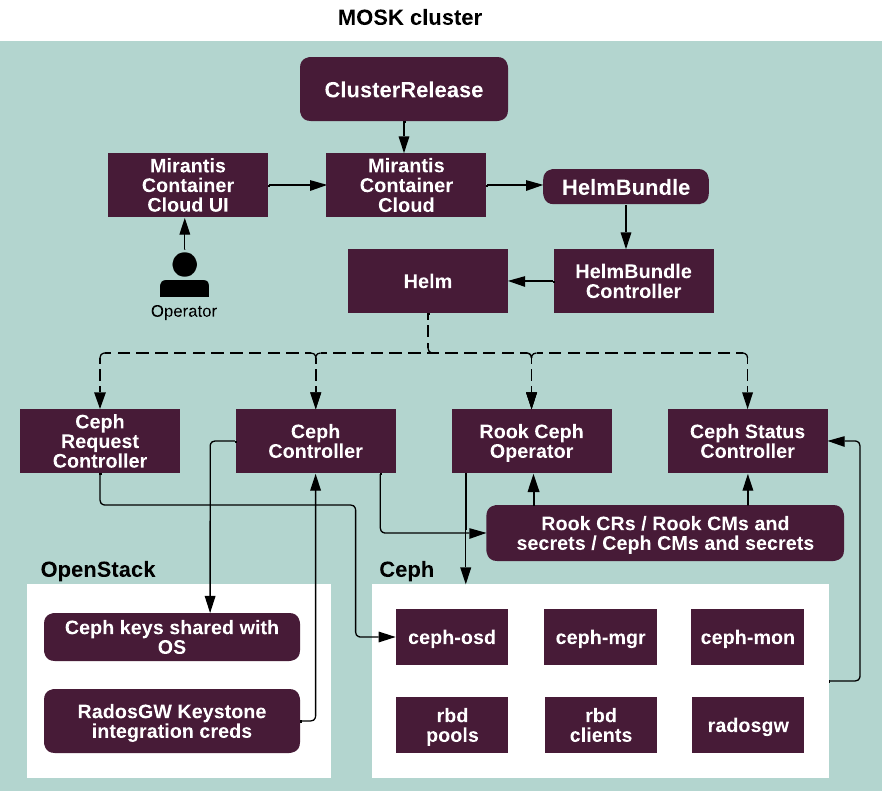
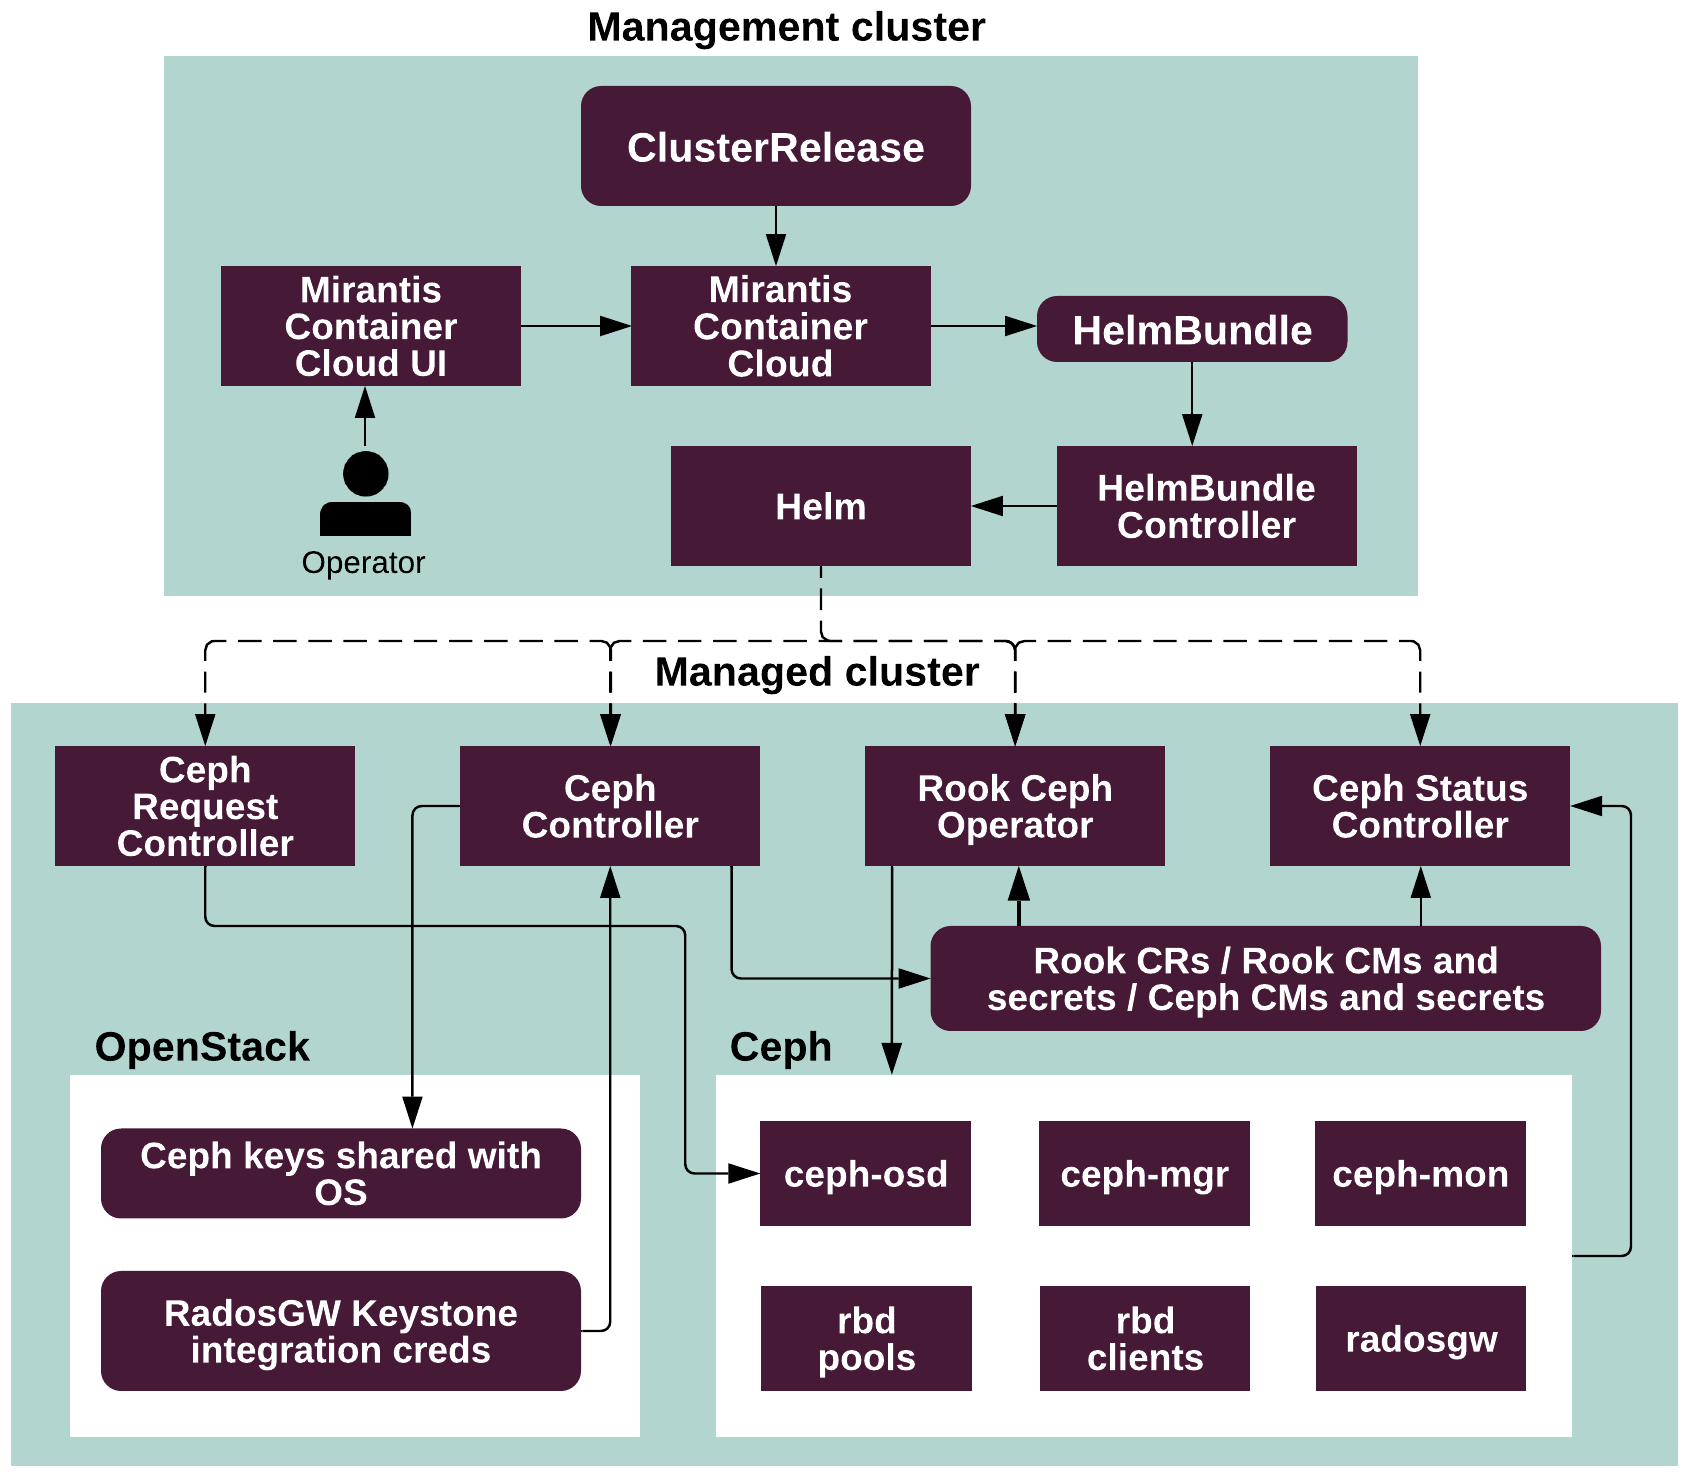
The following diagram illustrates the processes within a deployed Ceph cluster:
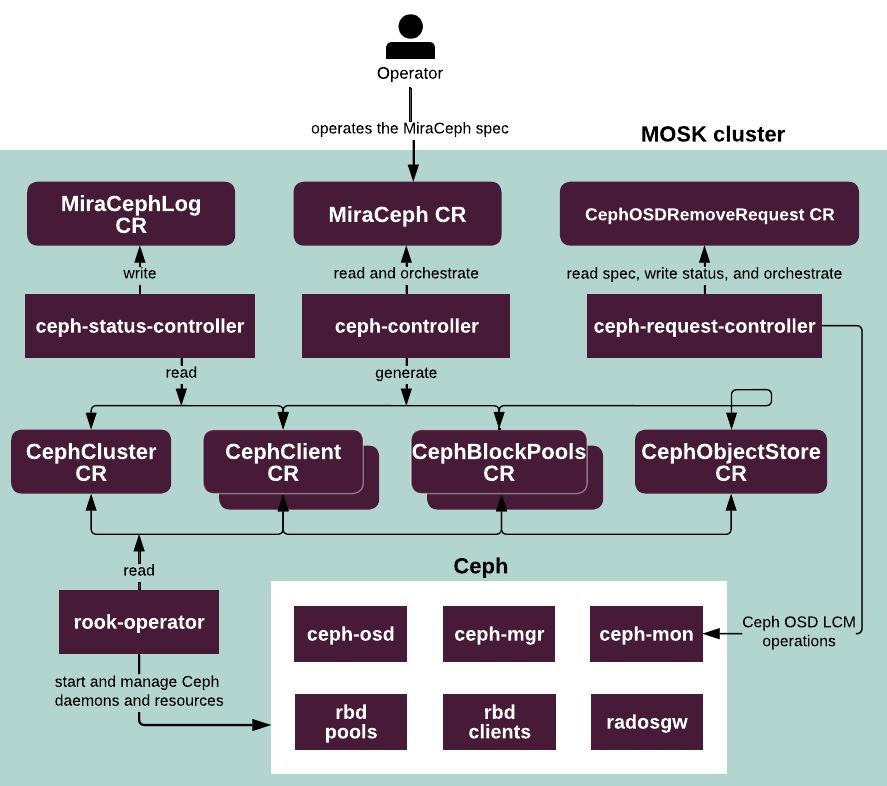
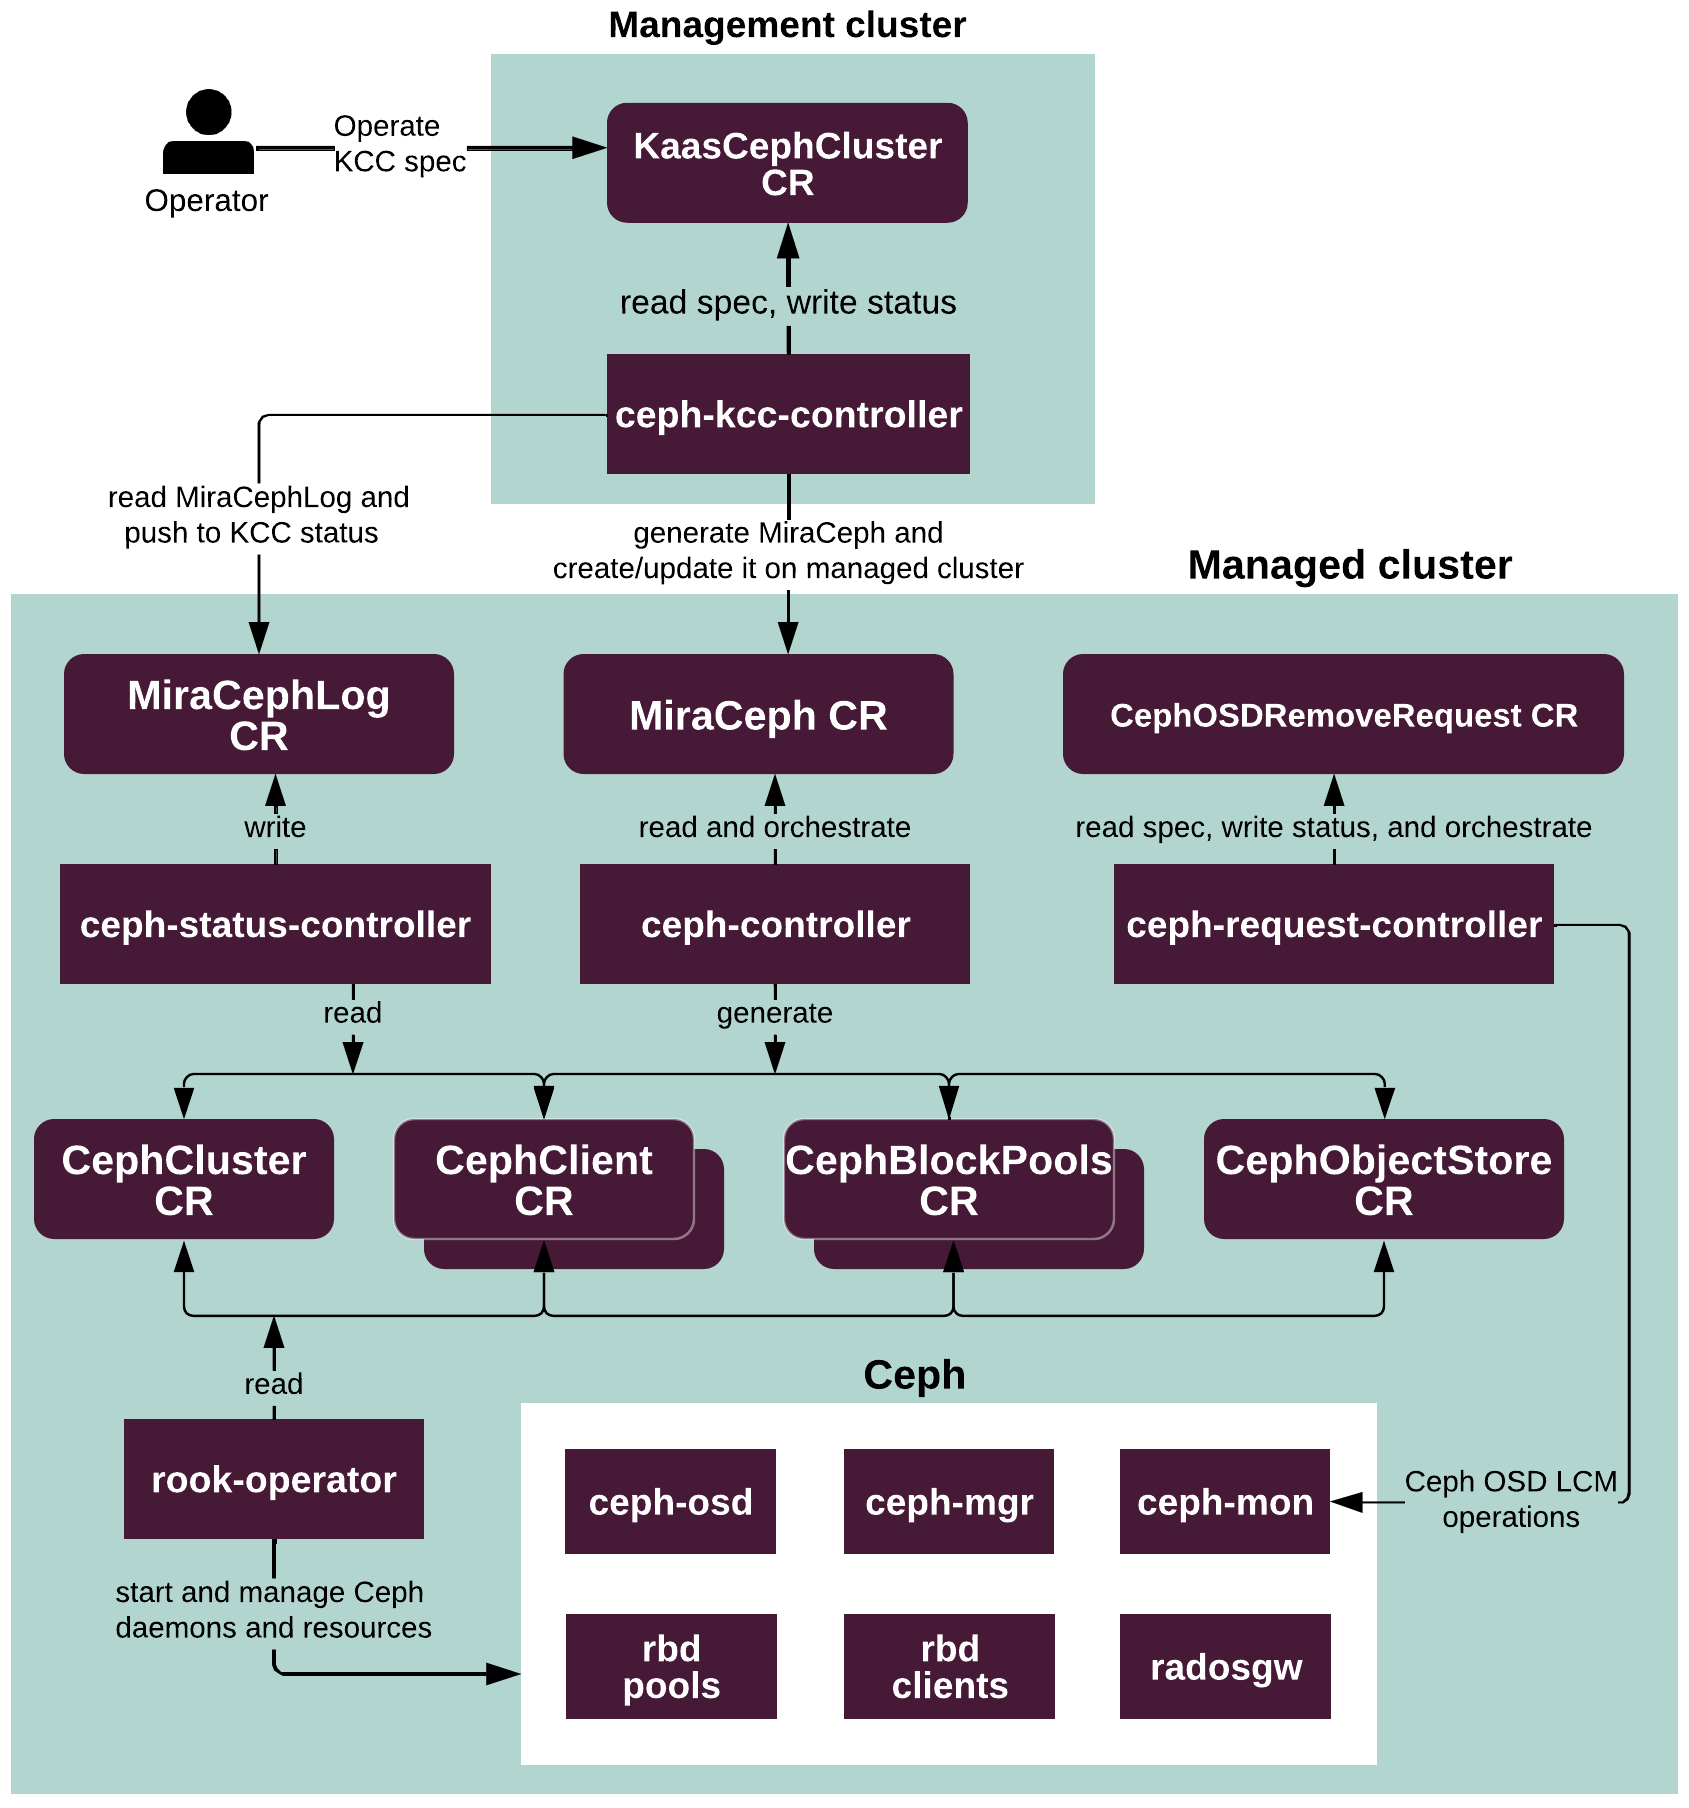
See also
Ceph limitations
A Ceph cluster configuration in MOSK includes but is not limited to the following limitations:
Only one Ceph Controller per MOSK cluster and only one Ceph cluster per Ceph Controller are supported.
The replication size for any Ceph pool must be set to more than 1.
Only one CRUSH tree per cluster. The separation of devices per Ceph pool is supported through device classes with only one pool of each type for a device class.
All CRUSH rules must have the same
failure_domain.Only the following types of CRUSH buckets are supported:
topology.kubernetes.io/regiontopology.kubernetes.io/zonetopology.rook.io/datacentertopology.rook.io/roomtopology.rook.io/podtopology.rook.io/pdutopology.rook.io/rowtopology.rook.io/racktopology.rook.io/chassis
RBD mirroring is not supported.
Consuming an existing Ceph cluster is not supported.
Lifted since MOSK 23.1 CephFS is unsupported. Multiple CephFS are supported since MOSK 25.1.
Only IPv4 is supported.
If two or more Ceph OSDs are located on the same device, there must be no dedicated WAL or DB for this class.
Only a full collocation or dedicated WAL and DB configurations are supported.
The minimum size of any defined Ceph OSD device is 5 GB.
Ceph OSDs support only raw disks as data devices meaning that no
dmorlvmdevices are allowed.Lifted since MOSK 23.3 Ceph cluster does not support removable devices (with hotplug enabled) for deploying Ceph OSDs.
When adding a Ceph node with the Ceph Monitor role, if any issues occur with the Ceph Monitor,
rook-cephremoves it and adds a new Ceph Monitor instead, named using the next alphabetic character in order. Therefore, the Ceph Monitor names may not follow the alphabetical order. For example,a,b,d, instead ofa,b,c.Reducing the number of Ceph Monitors is not supported and causes the Ceph Monitor daemons removal from random nodes.
Removal of the
mgrrole in thenodessection of theKaaSCephClusterCR does not remove Ceph Managers. To remove a Ceph Manager from a node, remove it from thenodesspec and manually delete themgrpod in the Rook namespace.Lifted since MOSK 24.1 Ceph does not support allocation of Ceph RGW pods on nodes where the Federal Information Processing Standard (FIPS) mode is enabled.
Ceph integration with OpenStack
The integration between Ceph and OpenStack (Rockoon) Controllers is implemented
through the shared Kubernetes openstack-ceph-shared namespace. Both
controllers have access to this namespace to read and write the Kubernetes
kind: Secret objects.
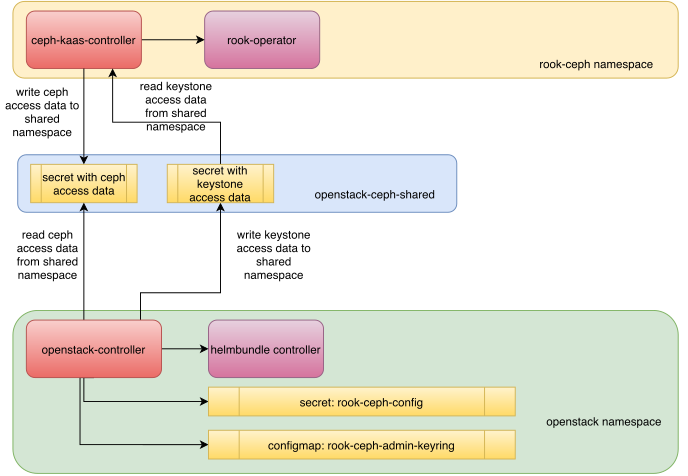
As Ceph is required and only supported backend for several OpenStack
services, all necessary Ceph pools must be specified in the configuration
of the kind: MiraCeph custom resource as part of the deployment.
Once the Ceph cluster is deployed, the Ceph Controller posts the
information required by the OpenStack services to be properly configured
as a kind: Secret object into the openstack-ceph-shared namespace.
The OpenStack Controller watches this namespace. Once the corresponding
secret is created, the OpenStack Controller transforms this secret to the
data structures expected by the OpenStack-Helm charts. Even if an OpenStack
installation is triggered at the same time as a Ceph cluster deployment, the
OpenStack Controller halts the deployment of the OpenStack services that
depend on Ceph availability until the secret in the shared namespace is
created by the Ceph Controller.
For the configuration of Ceph Object Gateway as an OpenStack Object
Storage, the reverse process takes place. The OpenStack Controller waits
for the OpenStack-Helm to create a secret with OpenStack Identity
(Keystone) credentials that Ceph Object Gateway must use to validate the
OpenStack Identity tokens, and posts it back to the same
openstack-ceph-shared namespace in the format suitable for
consumption by the Ceph Controller. The Ceph Controller then reads this
secret and reconfigures Ceph Object Gateway accordingly.
Addressing storage devices since MOSK 25.2
Warning
This procedure is valid for MOSK clusters that use the MiraCeph custom
resource (CR), which is available since MOSK 25.2 to replace the deprecated
KaaSCephCluster. For the equivalent procedure with the KaaSCephCluster
CR, refer to the following section:
There are several formats to use when specifying and addressing storage devices
of a Ceph cluster. The default and recommended one is the /dev/disk/by-id
format. This format is reliable and unaffected by the disk controller actions,
such as device name shuffling or /dev/disk/by-path recalculating.
Difference between by-id, name, and by-path formats
The storage device /dev/disk/by-id format mostly bases on a disk serial
number, which is unique for each disk. A by-id symlink is created by the
udev rules in the following format, where <BusID> is an ID of the bus
to which the disk is attached and <DiskSerialNumber> stands for a unique
disk serial number:
/dev/disk/by-id/<BusID>-<DiskSerialNumber>
Typical by-id symlinks for storage devices look as follows:
/dev/disk/by-id/nvme-SAMSUNG_MZ1LB3T8HMLA-00007_S46FNY0R394543
/dev/disk/by-id/scsi-SATA_HGST_HUS724040AL_PN1334PEHN18ZS
/dev/disk/by-id/ata-WDC_WD4003FZEX-00Z4SA0_WD-WMC5D0D9DMEH
In the example above, symlinks contain the following IDs:
Bus IDs:
nvme,scsi-SATAandataDisk serial numbers:
SAMSUNG_MZ1LB3T8HMLA-00007_S46FNY0R394543,HGST_HUS724040AL_PN1334PEHN18ZSandWDC_WD4003FZEX-00Z4SA0_WD-WMC5D0D9DMEH.
An exception to this rule is the wwn by-id symlinks, which are
programmatically generated at boot. They are not solely based on disk
serial numbers but also include other node information. This can lead
to the wwn being recalculated when the node reboots. As a result,
this symlink type cannot guarantee a persistent disk identifier and should
not be used as a stable storage device symlink in a Ceph cluster.
The storage device name and by-path formats cannot be considered
persistent because the sequence in which block devices are added during boot
is semi-arbitrary. This means that block device names, for example, nvme0n1
and sdc, are assigned to physical disks during discovery, which may vary
inconsistently from the previous node state. The same inconsistency applies
to by-path symlinks, as they rely on the shortest physical path
to the device at boot and may differ from the previous node state.
Therefore, Mirantis highly recommends using storage device by-id symlinks
that contain disk serial numbers. This approach enables you to use a persistent
device identifier addressed in the Ceph cluster specification.
Example MiraCeph with device by-id identifiers
Below is an example MiraCeph custom resource using the /dev/disk/by-id
format for storage devices specification:
Note
MOSK enables you to use fullPath for the
by-id symlinks since MOSK 23.3. For earlier product
versions, use the name field instead.
apiVersion: lcm.mirantis.com/v1alpha1
kind: MiraCeph
metadata:
name: rook-ceph
namespace: managed-ns
spec:
nodes:
# Add the exact node names.
# Obtain the name from the "kubectl get node" list.
- name: cz812-managed-cluster-storage-worker-noefi-58spl
roles:
- mgr
- mon
# All disk configuration must be reflected in ``status.providerStatus.hardware.storage`` of the ``Machine`` object
devices:
- config:
deviceClass: ssd
fullPath: /dev/disk/by-id/scsi-1ATA_WDC_WDS100T2B0A-00SM50_200231440912
- name: cz813-managed-cluster-storage-worker-noefi-lr4k4
roles:
- mgr
- mon
devices:
- config:
deviceClass: nvme
fullPath: /dev/disk/by-id/nvme-SAMSUNG_MZ1LB3T8HMLA-00007_S46FNY0R394543
- name: cz814-managed-cluster-storage-worker-noefi-z2m67
roles:
- mgr
- mon
devices:
- config:
deviceClass: nvme
fullPath: /dev/disk/by-id/nvme-SAMSUNG_ML1EB3T8HMLA-00007_S46FNY1R130423
pools:
- default: true
deviceClass: ssd
name: kubernetes
replicated:
size: 3
role: kubernetes
Migrating device names used in MiraCeph to device by-id symlinks
The majority of existing clusters uses device names as addressed storage
device identifiers in the spec.nodes section of the MiraCeph custom
resource. Therefore, they are prone to the issue of inconsistent storage device
identifiers during cluster update. Refer to
Migrate Ceph cluster to address storage devices using by-id to mitigate possible risks.
Addressing storage devices prior to MOSK 25.2
Warning
This procedure is valid for MOSK clusters that use the deprecated
KaaSCephCluster custom resource (CR) instead of the MiraCeph CR that is
available since MOSK 25.2 as a new Ceph configuration entrypoint. For the
equivalent procedure with the MiraCeph CR, refer to the following section:
There are several formats to use when specifying and addressing storage devices
of a Ceph cluster. The default and recommended one is the /dev/disk/by-id
format. This format is reliable and unaffected by the disk controller actions,
such as device name shuffling or /dev/disk/by-path recalculating.
Difference between by-id, name, and by-path formats
The storage device /dev/disk/by-id format in most of the cases bases on
a disk serial number, which is unique for each disk. A by-id symlink
is created by the udev rules in the following format, where <BusID>
is an ID of the bus to which the disk is attached and <DiskSerialNumber>
stands for a unique disk serial number:
/dev/disk/by-id/<BusID>-<DiskSerialNumber>
Typical by-id symlinks for storage devices look as follows:
/dev/disk/by-id/nvme-SAMSUNG_MZ1LB3T8HMLA-00007_S46FNY0R394543
/dev/disk/by-id/scsi-SATA_HGST_HUS724040AL_PN1334PEHN18ZS
/dev/disk/by-id/ata-WDC_WD4003FZEX-00Z4SA0_WD-WMC5D0D9DMEH
In the example above, symlinks contain the following IDs:
Bus IDs:
nvme,scsi-SATAandataDisk serial numbers:
SAMSUNG_MZ1LB3T8HMLA-00007_S46FNY0R394543,HGST_HUS724040AL_PN1334PEHN18ZSandWDC_WD4003FZEX-00Z4SA0_WD-WMC5D0D9DMEH.
An exception to this rule is the wwn by-id symlinks, which are
programmatically generated at boot. They are not solely based on disk
serial numbers but also include other node information. This can lead
to the wwn being recalculated when the node reboots. As a result,
this symlink type cannot guarantee a persistent disk identifier and should
not be used as a stable storage device symlink in a Ceph cluster.
The storage device name and by-path formats cannot be considered
persistent because the sequence in which block devices are added during boot
is semi-arbitrary. This means that block device names, for example, nvme0n1
and sdc, are assigned to physical disks during discovery, which may vary
inconsistently from the previous node state. The same inconsistency applies
to by-path symlinks, as they rely on the shortest physical path
to the device at boot and may differ from the previous node state.
Therefore, Mirantis highly recommends using storage device by-id symlinks
that contain disk serial numbers. This approach enables you to use a persistent
device identifier addressed in the Ceph cluster specification.
Example KaaSCephCluster with device by-id identifiers
Below is an example KaaSCephCluster custom resource using the
/dev/disk/by-id format for storage devices specification:
Note
MOSK enables you to use fullPath for the
by-id symlinks since MOSK 23.3. For earlier product
versions, use the name field instead.
apiVersion: kaas.mirantis.com/v1alpha1
kind: KaaSCephCluster
metadata:
name: ceph-cluster-managed-cluster
namespace: managed-ns
spec:
cephClusterSpec:
nodes:
# Add the exact ``nodes`` names.
# Obtain the name from the "get machine" list.
cz812-managed-cluster-storage-worker-noefi-58spl:
roles:
- mgr
- mon
# All disk configuration must be reflected in ``status.providerStatus.hardware.storage`` of the ``Machine`` object
storageDevices:
- config:
deviceClass: ssd
fullPath: /dev/disk/by-id/scsi-1ATA_WDC_WDS100T2B0A-00SM50_200231440912
cz813-managed-cluster-storage-worker-noefi-lr4k4:
roles:
- mgr
- mon
storageDevices:
- config:
deviceClass: nvme
fullPath: /dev/disk/by-id/nvme-SAMSUNG_MZ1LB3T8HMLA-00007_S46FNY0R394543
cz814-managed-cluster-storage-worker-noefi-z2m67:
roles:
- mgr
- mon
storageDevices:
- config:
deviceClass: nvme
fullPath: /dev/disk/by-id/nvme-SAMSUNG_ML1EB3T8HMLA-00007_S46FNY1R130423
pools:
- default: true
deviceClass: ssd
name: kubernetes
replicated:
size: 3
role: kubernetes
k8sCluster:
name: managed-cluster
namespace: managed-ns
Migrating device names used in KaaSCephCluster to device by-id symlinks
The majority of existing clusters uses device names as addressed storage
devices identifiers in the spec.cephClusterSpec.nodes section of
the KaaSCephCluster custom resource. Therefore, they are prone
to the issue of inconsistent storage device identifiers during cluster
update. Refer to Migrate Ceph cluster to address storage devices using by-id to mitigate possible
risks.
Logging, monitoring, and alerting
StackLight is the logging, monitoring, and alerting solution that provides a single pane of glass for cloud maintenance and day-to-day operations as well as offers critical insights into cloud health including operational information about the components deployed with Mirantis OpenStack for Kubernetes (MOSK). StackLight is based on Prometheus, an open-source monitoring solution and a time series database, and OpenSearch, the logs and notifications storage.
Deployment architecture
Mirantis OpenStack for Kubernetes (MOSK) deploys the StackLight stack
as a release of a Helm chart that contains the helm-controller
and helmbundles.lcm.mirantis.com (HelmBundle) custom resources. The
StackLight HelmBundle consists of a set of Helm charts describing the
StackLight components.
StackLight components
Apart from the OpenStack-specific components below, StackLight includes the following core components. By default, StackLight logging stack is disabled.
StackLight component |
Description |
|---|---|
Alerta |
Receives, consolidates, and deduplicates the alerts sent by Alertmanager and visually represents them through a simple web UI. Using the Alerta web UI, you can view the most recent or watched alerts, group, and filter alerts. |
Alertmanager |
Handles the alerts sent by client applications such as Prometheus,
deduplicates, groups, and routes alerts to receiver integrations.
Using the Alertmanager web UI, you can view the most recent |
Elasticsearch Curator |
Maintains the data (indexes) in OpenSearch by performing such operations as creating, closing, or opening an index as well as deleting a snapshot. Also, manages the data retention policy in OpenSearch. |
Elasticsearch Exporter Compatible with OpenSearch |
The Prometheus exporter that gathers internal OpenSearch metrics. |
Grafana |
Builds and visually represents metric graphs based on time series databases. Grafana supports querying of Prometheus using the PromQL language. |
Database backends |
StackLight uses PostgreSQL for Alerta and Grafana. PostgreSQL reduces the data storage fragmentation while enabling high availability. High availability is achieved using Patroni, the PostgreSQL cluster manager that monitors for node failures and manages failover of the primary node. StackLight also uses Patroni to manage major version upgrades of PostgreSQL clusters, which allows leveraging the database engine functionality and improvements as they are introduced upstream in new releases, maintaining functional continuity without version lock-in. |
Logging stack |
Responsible for collecting, processing, and persisting logs and Kubernetes events. By default, when deploying through the MOSK management console, only the metrics stack is enabled on MOSK clusters. To enable StackLight to gather MOSK cluster logs, enable the logging stack during deployment. On management clusters, the logging stack is enabled by default. The logging stack components include:
Note The logging mechanism performance depends on the cluster log
load. In case of a high load, you may need to increase the default
resource requests and limits for |
Metric collector |
Collects telemetry data (CPU or memory usage, number of active alerts, and so on) from Prometheus and sends the data to centralized cloud storage for further processing and analysis. Metric collector runs on the management cluster. Note This component is designated for internal StackLight use only. |
Prometheus |
Gathers metrics. Automatically discovers and monitors the endpoints. Using the Prometheus web UI, you can view simple visualizations and debug. By default, the Prometheus database stores metrics of the past 15 days or up to 15 GB of data depending on the limit that is reached first. |
Prometheus Blackbox Exporter |
Allows monitoring endpoints over HTTP, HTTPS, DNS, TCP, and ICMP. |
Prometheus-es-exporter |
Presents the OpenSearch data as Prometheus metrics by periodically sending configured queries to the OpenSearch cluster and exposing the results to a scrapable HTTP endpoint like other Prometheus targets. |
Prometheus Node Exporter |
Gathers hardware and operating system metrics exposed by kernel. |
Prometheus Relay |
Adds a proxy layer to Prometheus to merge the results from underlay Prometheus servers to prevent gaps in case some data is missing on some servers. Is available only in the HA StackLight mode. |
Salesforce notifier |
Enables sending Alertmanager notifications to Salesforce to allow creating Salesforce cases and closing them once the alerts are resolved. Disabled by default. |
Salesforce reporter |
Queries Prometheus for the data about the amount of vCPU, vRAM, and vStorage used and available, combines the data, and sends it to Salesforce daily. Mirantis uses the collected data for further analysis and reports to improve the quality of customer support. Disabled by default. |
Telegraf |
Collects metrics from the system. Telegraf is plugin-driven and has the concept of two distinct set of plugins: input plugins collect metrics from the system, services, or third-party APIs; output plugins write and expose metrics to various destinations. The Telegraf agents used in MOSK include:
|
Telemeter |
Enables a multi-cluster view through a Grafana dashboard of the management cluster. Telemeter includes a Prometheus federation push server and clients to enable isolated Prometheus instances, which cannot be scraped from a central Prometheus instance, to push metrics to the central location. The Telemeter services are distributed between the management cluster that hosts the Telemeter server and MOSK clusters that host the Telemeter client. The metrics from MOSK clusters are aggregated on management clusters. Note This component is designated for internal StackLight use only. |
StackLight component |
Description |
|---|---|
Prometheus native exporters and endpoints |
Export the existing metrics as Prometheus metrics and include:
|
Telegraf OpenStack plugin |
Collects and processes the OpenStack metrics. |
Every Helm chart contains a default values.yml file. These default values
are partially overridden by custom values defined in the StackLight Helm chart.
StackLight database modes
During the StackLight configuration when deploying a MOSK cluster, you can define the HA or non-HA StackLight architecture type. Non-HA StackLight requires a backend storage provider, for example, a Ceph cluster. For details, see Storage.
The non-HA mode is set by default on MOSK clusters. On management clusters, StackLight is deployed in the HA mode only. The following table lists the differences between the HA and non-HA modes:
Non-HA StackLight mode default |
HA StackLight mode |
|---|---|
One persistent volume is provided for storing data. In case of a service or node failure, a new pod is redeployed and the volume is reattached to provide the existing data. Such setup has a reduced hardware footprint but provides less performance. |
Local Volume Provisioner is used to provide local host storage. In case
of a service or node failure, the traffic is automatically redirected to
any other running Prometheus or OpenSearch server. For better
performance, Mirantis recommends that you deploy StackLight in the HA
mode. Two |
Note
Before Container Cloud 2.24.0 (Cluster releases 12.7.0, 11.7.0, or earlier), Alertmanager has 2 replicas in the non-HA mode.
Depending on the cluster type and selected StackLight database mode, StackLight is deployed on the following number of nodes:
Cluster |
StackLight database mode |
Target nodes |
|---|---|---|
Management |
HA mode |
All Kubernetes master nodes |
MOSK |
Non-HA mode |
|
HA mode |
All nodes with the |
Supported features
Using the MOSK management console, on the pre-deployment stage of a MOSK cluster, you can view, enable or disable, or tune the following StackLight features available:
StackLight HA mode.
Database retention size and time for Prometheus.
Tunable index retention period for OpenSearch.
Tunable
PersistentVolumeClaim(PVC) size for Prometheus and OpenSearch set to 16 GB for Prometheus and 30 GB for OpenSearch by default. The PVC size must be logically aligned with the retention periods or sizes for these components.Email and Slack receivers for the Alertmanager notifications.
Predefined set of dashboards.
Predefined set of alerts and capability to add new custom alerts for Prometheus in the following exemplary format:
- alert: HighErrorRate expr: job:request_latency_seconds:mean5m{job="myjob"} > 0.5 for: 10m labels: severity: page annotations: summary: High request latency
Authentication flow
StackLight provides five web UIs including Prometheus, Alertmanager, Alerta, OpenSearch Dashboards, and Grafana. Access to StackLight web UIs is protected by Keycloak-based Identity and access management (IAM). All web UIs except Alerta are exposed to IAM through the IAM proxy middleware. The Alerta configuration provides direct integration with IAM.
The following diagram illustrates accessing the IAM-proxied StackLight web UIs, for example, Prometheus web UI:
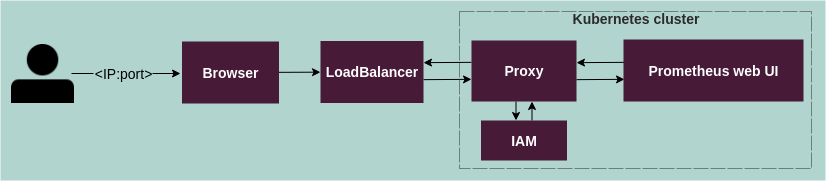
Authentication flow for the IAM-proxied StackLight web UIs:
A user enters the public IP of a StackLight web UI, for example, Prometheus web UI.
The public IP leads to IAM proxy, deployed as a Kubernetes LoadBalancer, which protects the Prometheus web UI.
LoadBalancer routes the HTTP request to Kubernetes internal IAM proxy service endpoints, specified in the X-Forwarded-Proto or X-Forwarded-Host headers.
The Keycloak login form opens (the
login_urlfield in the IAM proxy configuration, which points to Keycloak realm) and the user enters the user name and password.Keycloak validates the user name and password.
The user obtains access to the Prometheus web UI (the
upstreamsfield in the IAM proxy configuration).
Note
The discovery URL is the URL of the IAM service.
The upstream URL is the hidden endpoint of a web UI (Prometheus web UI in the example above).
The following diagram illustrates accessing the Alerta web UI:
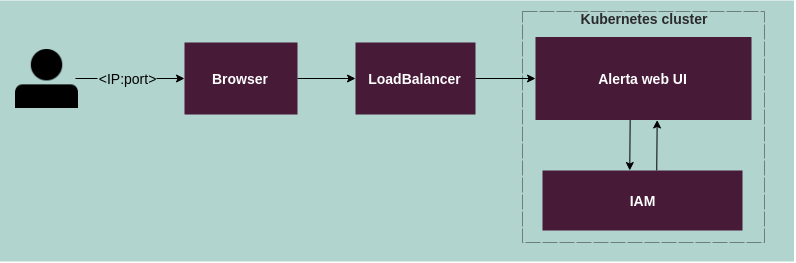
Authentication flow for the Alerta web UI:
A user enters the public IP of the Alerta web UI.
The public IP leads to Alerta deployed as a Kubernetes LoadBalancer type.
LoadBalancer routes the HTTP request to the Kubernetes internal Alerta service endpoint.
The Keycloak login form opens (Alerta refers to the IAM realm) and the user enters the user name and password.
Keycloak validates the user name and password.
The user obtains access to the Alerta web UI.
Monitored components
StackLight measures, analyzes, and reports in a timely manner about failures that may occur in the following Mirantis OpenStack for Kubernetes (MOSK) components and their sub-components.
StackLight monitors the following core components:
Component |
Sub-components |
|---|---|
Ceph |
n/a |
Ironic |
n/a |
Kubernetes services |
|
Node hardware and operating system |
n/a |
PostgreSQL |
n/a |
StackLight |
|
SSL certificates |
n/a |
Mirantis Kubernetes Engine (MKE) |
|
Apart from the core components above, StackLight monitors the following OpenStack-specific components:
Component |
Sub-components |
|---|---|
Libvirt |
n/a |
Memcached |
n/a |
MariaDB |
n/a |
NGINX Ingress Controller |
n/a |
NTP |
n/a |
OpenStack |
|
OpenStack SSL certificates |
n/a |
Tungsten Fabric |
|
RabbitMQ |
n/a |
Storage-based log retention strategy
Available since MCC 2.26.0 (17.1.0 and 16.1.0)
StackLight uses a storage-based log retention strategy that optimizes storage utilization and ensures effective data retention. A proportion of available disk space is defined as 80% of disk space allocated for the OpenSearch node with the following data types:
80% for system logs
10% for audit logs
5% for OpenStack notifications
5% for Kubernetes events
This approach ensures that storage resources are efficiently allocated based on the importance and volume of different data types.
The logging index management implies the following advantages:
- Storage-based rollover mechanism
The rollover mechanism for system and audit indices enforces shard size based on available storage, ensuring optimal resource utilization.
- Consistent shard allocation
The number of primary shards per index is dynamically set based on cluster size, which boosts search and facilitates ingestion for large clusters.
- Minimal size of cluster state
The logging size of the cluster state is minimal and uses static mappings, which are based on Elastic Common Schema (ESC) with slight deviations from the standard. Dynamic mapping in index templates is avoided to reduce overhead.
- Storage compression
The system and audit indices utilize the
best_compressioncodec that minimizes the size of stored indices, resulting in significant storage savings of up to 50% on average.
- No filter by logging level
In light of non-even severity level over components in MOSK, logs of all severity levels are collected to prevent ignorance of important logs of low severity while debugging a cluster. Filtering by tags is still available.
See also
OpenSearch and Prometheus storage sizing
Caution
Calculations in this document are based on numbers from a real-scale test cluster with 34 nodes. The exact space required for metrics and logs must be calculated depending on the ongoing cluster operations. Some operations force the generation of additional metrics and logs. The values below are approximate. Use them only as recommendations.
During the deployment of a new cluster, you must specify the OpenSearch retention time and Persistent Volume Claim (PVC) size, Prometheus PVC, retention time, and retention size. When configuring an existing cluster, you can only set OpenSearch retention time, Prometheus retention time, and retention size.
The following table describes the recommendations for both OpenSearch
and Prometheus retention size and PVC size for a cluster with 34 nodes.
Retention time depends on the space allocated for the data. To calculate
the required retention time, use the
{retention time} = {retention size} / {amount of data per day} formula.
Service |
Required space per day |
Description |
|---|---|---|
OpenSearch |
|
When setting Persistent Volume Claim Size for OpenSearch during the cluster creation, take into account that it defines the PVC size for a single instance of the OpenSearch cluster. StackLight in HA mode has 3 OpenSearch instances. Therefore, for a total OpenSearch capacity, multiply the PVC size by 3. |
Prometheus |
|
Every Prometheus instance stores the entire database. Multiple replicas store multiple copies of the same data. Therefore, treat the Prometheus PVC size as the capacity of Prometheus in the cluster. Do not sum them up. Prometheus has built-in retention mechanisms based on the database size and time series duration stored in the database. Therefore, if you miscalculate the PVC size, retention size set to ~1 GB less than the PVC size will prevent disk overfilling. |
StackLight integration with OpenStack
StackLight integration with OpenStack includes automatic discovery of RabbitMQ
credentials for notifications and OpenStack credentials for OpenStack API
metrics. For details, see the
openstack.rabbitmq.credentialsConfig and
openstack.telegraf.credentialsConfig parameters description in
StackLight configuration parameters.
Workload monitoring
Lifecycle management operations of a MOSK cluster may impose impact on its workloads and, specifically, may cause network connectivity interruptions for instances running in OpenStack. To make sure that the downtime caused on the cloud applications still fits into Service Level Agreements (SLAs), MOSK provides the tooling to measure the network availability of instances.
Additionally, continuous monitoring of the network connectivity in the cluster is essential for early detection of infrastructure problems.
MOSK offers cloud operators to oversee the availability of workloads hosted in their OpenStack infrastructure on several levels:
Monitoring of floating IP addresses through the Cloudprober service
Monitoring of network ports availability through the Portprober service
Floating IP address availability monitoring (Cloudprober)
Available since MOSK 23.2 TechPreview
The floating IP address availability monitoring service (Cloudprober) is a special probing agent that starts on controller nodes and periodically pings selected floating IP addresses. As of today, the agent supports only Internet Control Message Protocol (ICMP) to determine the IP address availability.
To monitor the availability of floating IP addresses, your MOSK cluster and workloads need to meet the following requirements:
There must be the layer-3 connectivity between the clusters floating IP networks and nodes running the OpenStack control plane.
The guest operating system of the monitored OpenStack instances must allow the ICMP ingress and egress traffic.
OpenStack security groups used by the monitored instances must allow the ICMP ingress and egress traffic.
To enable the floating IP address availability monitoring service, use the
following OpenStackDeployment definition:
spec:
features:
services:
- cloudprober
For the detailed configuration procedure of the floating IP address availability monitoring service, refer to Configure monitoring of cloud workload availability.
Network port availability monitoring (Portprober)
Available since MOSK 24.2 TechPreview
The network port availability monitoring service (Portprober) is implemented
as an extension to OpenStack Neutron service which gets enabled automatically
together with the cloudprober service described above.
Also, you can enable Portprober explicitly, regardless of whether Cloudprober
is enabled or not. To do so, specify the following structure in the
OpenStackDeployment custom resource:
spec:
features:
neutron:
extensions:
portprober:
enabled: true
The Portprober service is supported only for the following cloud configurations:
OpenStack version is Antelope or newer
Neutron OVS backend for networking (Tungsten Fabric and OVN backends are not supported)
The Portprober agent automatically connects to all OpenStack virtual networks
and probes all the ports that are plugged in there and are in the bound
state, meaning they are associated with an instance or a network service.
The service makes no difference between private and external networks and also reports the availability of the ports that belong to virtual routers.
The service relies on the ARP protocol to determine port availability and does not require any security groups to be assigned to monitored instances, as opposed to the Floating IP address monitoring service (Cloudprober).
Among the known limitations of the network port availability monitoring service is the lack of support for IPv6. The service ignores the ports that do not have IPv4 addresses associated with them.
Outbound cluster metrics
The data collected and transmitted through an encrypted channel back to Mirantis provides our Customer Success Organization information to better understand the operational usage patterns our customers are experiencing as well as to provide feedback on product usage statistics to enable our product teams to enhance our products and services for our customers.
Mirantis collects the following statistics using configuration-collector:
Mirantis collects hardware information using the following metrics:
mcc_hw_machine_chassismcc_hw_machine_cpu_modelmcc_hw_machine_cpu_numbermcc_hw_machine_nicsmcc_hw_machine_rammcc_hw_machine_storage(storage devices and disk layout)mcc_hw_machine_vendor
Mirantis collects the summary of all deployed MOSK configurations using the following objects, if any:
Note
The data is anonymized from all sensitive information, such as IDs, IP addresses, passwords, private keys, and so on.
|
|
|
Note
In Container Cloud 2.25.0 (Cluster releases 17.0.0 and 16.0.0),
Mirantis does not collect any configuration summary in light of the
configuration-collector refactoring.
The node-level resource data are broken down into three broad categories: Cluster, Node, and Namespace. The telemetry data tracks Allocatable, Capacity, Limits, Requests, and actual Usage of node-level resources.
Term |
Definition |
|---|---|
Allocatable |
On a Kubernetes Node, the amount of compute resources that are available for pods |
Capacity |
The total number of available resources regardless of current consumption |
Limits |
Constraints imposed by Administrators |
Requests |
The resources that a given container application is requesting |
Usage |
The actual usage or consumption of a given resource |
The full list of the outbound data includes:
From management clusters
hostos_module_usageSince MCC 2.28.0 (17.3.0, 16.3.0)
From MOSK clusters
cluster_alerts_firingSince MOSK 23.1cluster_filesystem_size_bytescluster_filesystem_usage_bytescluster_filesystem_usage_ratiocluster_master_nodes_totalcluster_nodes_totalcluster_persistentvolumeclaim_requests_storage_bytescluster_total_alerts_triggeredcluster_capacity_cpu_corescluster_capacity_memory_bytescluster_usage_cpu_corescluster_usage_memory_bytescluster_usage_per_capacity_cpu_ratiocluster_usage_per_capacity_memory_ratiocluster_worker_nodes_totalcluster_workload_pods_totalSince MOSK 23.1cluster_workload_containers_totalSince MOSK 23.1kaas_infokaas_cluster_machines_ready_totalkaas_cluster_machines_requested_totalkaas_clusterskaas_cluster_updatingSince MOSK 22.5kaas_license_expirykaas_machines_readykaas_machines_requestedkubernetes_api_availabilitymcc_cluster_update_plan_statusSince MOSK 24.3 as TechPreviewmke_api_availabilitymke_cluster_nodes_totalmke_cluster_containers_totalmke_cluster_vcpu_freemke_cluster_vcpu_usedmke_cluster_vram_freemke_cluster_vram_usedmke_cluster_vstorage_freemke_cluster_vstorage_usednode_labelsSince MOSK 23.2openstack_cinder_api_latency_90openstack_cinder_api_latency_99openstack_cinder_api_statusRemoved in MOSK 24.1openstack_cinder_availabilityopenstack_cinder_volumes_totalopenstack_glance_api_statusopenstack_glance_availabilityopenstack_glance_images_totalopenstack_glance_snapshots_totalRemoved in MOSK 24.1openstack_heat_availabilityopenstack_heat_stacks_totalopenstack_host_aggregate_instancesRemoved in MOSK 23.2openstack_host_aggregate_memory_used_ratioRemoved in MOSK 23.2openstack_host_aggregate_memory_utilisation_ratioRemoved in MOSK 23.2openstack_host_aggregate_cpu_utilisation_ratioRemoved in MOSK 23.2openstack_host_aggregate_vcpu_used_ratioRemoved in MOSK 23.2openstack_instance_availabilityopenstack_instance_create_endopenstack_instance_create_erroropenstack_instance_create_startopenstack_keystone_api_latency_90openstack_keystone_api_latency_99openstack_keystone_api_statusRemoved in MOSK 24.1openstack_keystone_availabilityopenstack_keystone_tenants_totalopenstack_keystone_users_totalopenstack_kpi_provisioningopenstack_lbaas_availabilityopenstack_mysql_flow_controlopenstack_neutron_api_latency_90openstack_neutron_api_latency_99openstack_neutron_api_statusRemoved in MOSK 24.1openstack_neutron_availabilityopenstack_neutron_lbaas_loadbalancers_totalopenstack_neutron_networks_totalopenstack_neutron_ports_totalopenstack_neutron_routers_totalopenstack_neutron_subnets_totalopenstack_nova_all_compute_cpu_utilisationopenstack_nova_all_compute_mem_utilisationopenstack_nova_all_computes_totalopenstack_nova_all_vcpus_totalopenstack_nova_all_used_vcpus_totalopenstack_nova_all_ram_total_gbopenstack_nova_all_used_ram_total_gbopenstack_nova_all_disk_total_gbopenstack_nova_all_used_disk_total_gbopenstack_nova_api_statusRemoved in MOSK 24.1openstack_nova_availabilityopenstack_nova_compute_cpu_utilisationopenstack_nova_compute_mem_utilisationopenstack_nova_computes_totalopenstack_nova_disk_total_gbopenstack_nova_instances_active_totalopenstack_nova_ram_total_gbopenstack_nova_used_disk_total_gbopenstack_nova_used_ram_total_gbopenstack_nova_used_vcpus_totalopenstack_nova_vcpus_totalopenstack_public_api_statusSince MOSK 22.5openstack_quota_instancesopenstack_quota_ram_gbopenstack_quota_vcpusopenstack_quota_volume_storage_gbopenstack_rmq_message_derivopenstack_usage_instancesopenstack_usage_ram_gbopenstack_usage_vcpusopenstack_usage_volume_storage_gbosdpl_aodh_alarmsSince MOSK 23.3osdpl_api_successSince MOSK 24.1osdpl_cinder_zone_volumesSince MOSK 23.3osdpl_ironic_nodesSince MOSK 25.1osdpl_manila_sharesSince MOSK 24.2osdpl_masakari_hostsSince MOSK 24.2osdpl_neutron_availability_zone_infoSince MOSK 23.3osdpl_neutron_zone_routersSince MOSK 23.3osdpl_nova_aggregate_hostsSince MOSK 23.3osdpl_nova_audit_orphaned_allocationsSince MOSK 24.3osdpl_nova_availability_zone_infoSince MOSK 23.3osdpl_nova_availability_zone_instancesSince MOSK 23.3osdpl_nova_availability_zone_hostsSince MOSK 23.3osdpl_version_infoSince MOSK 23.3tf_operator_infoSince MOSK 23.3 for Tungsten Fabric
StackLight logging indices
Available since MCC 2.26.0 (17.1.0 and 16.1.0)
StackLight logging indices are managed by OpenSearch data streams, which are introduced in OpenSearch 2.6. It is a convenient way to manage insert-only pipelines such as log message collection. The solution consists of the following elements:
Data stream objects that can be referred to as alias:
Audit - dedicated for Container Cloud, MKE, and host audit logs, ensuring data integrity and security.
System - replaces Logstash for system logs, provides a streamlined approach to log management.
Write index - current index where ingestion can be performed without removing a data stream.
Read indices - indices created after the rollover mechanism is applied.
Rollover policy - creating new write index for data stream based on the size of shards
Example of an initial index list:
health status index uuid pri rep docs.count docs.deleted store.size pri.store.size
green open .ds-audit-000001 30q4HLGmR0KmpRR8Kvy5jw 1 1 2961719 0 496.3mb 248mb
green open .ds-system-000001 5_eFtMAFQa6aFB7nttHjkA 1 1 2476 0 6.1mb 3mb
Example of the index after the rollover is applied to the audit index:
health status index uuid pri rep docs.count docs.deleted store.size pri.store.size
green open .ds-audit-000001 30q4HLGmR0KmpRR8Kvy5jw 1 1 9819913 0 1.5gb 784.8mb
green open .ds-audit-000002 U1fbs0i9TJmOsAOoR7cERg 1 1 2961719 0 496.3mb 248mb
green open .ds-system-000001 5_eFtMAFQa6aFB7nttHjkA 1 1 2476 0 6.1mb 3mb
Audit and system index templates
The following table contains a simplified template of the audit and system indices. The user can perform aggregation queries over keyword fields.
Field |
Type |
Description |
|---|---|---|
|
date |
Time when a log event was produced, if available in the parsed message. Otherwise time when the event was ingested. |
|
keyword |
Identifier of the Docker container that the application generating the event was running in. |
|
text |
Name of the Docker image defined as |
|
keyword |
Name of the Docker container that the application generating the event was running in. |
|
keyword |
Source of the event: |
|
keyword |
Name of the application that produced the message. |
|
keyword |
Name of the host that the message was collected from. |
|
keyword |
Path on the host to the source file for the message if the message was not produced by the application running in the container or system unit. |
|
keyword |
Severity level of the event taken from the parsed message content. |
|
text |
Unparsed content of the event message. |
|
flat_object |
Kubernetes metadata labels of the pod that runs the Docker container of the application. |
|
keyword |
Kubernetes namespace where the application pod was running. |
|
keyword |
Kubernetes pod name of the pod running the application Docker container. |
|
keyword |
Type of orchestrator: |
The following table contains a simplified template of extra fields for the system index that are not present in the audit template.
Field |
Type |
Description |
|---|---|---|
|
keyword |
IP address of the HTTP request destination. |
|
keyword |
Name of the OpenStack service that the HTTP request was sent to. |
|
long |
Request duration in nanoseconds. |
|
keyword |
Request ID generated by OpenStack. |
|
keyword |
HTTP request method. |
|
keyword |
Path of the HTTP URL request. |
|
long |
HTTP status code of the response. |
|
keyword |
IP address of the HTTP request source. |
System index mapping to the Logstash index
The following table lists mapping of the system index fields to the Logstash ones:
System |
Logstash Removed in MCC 2.26.0 (17.1.0 and 16.1.0) |
|---|---|
|
|
|
|
|
|
|
|
|
n/a |
|
|
|
|
|
|
|
|
|
|
|
|
|
|
|
|
|
|
|
|
|
n/a |
|
|
|
|
|
|
|
|
|
|
|
n/a |
StackLight proxy
StackLight components, which require external access, automatically use the same proxy that is configured for MOSK clusters. Therefore, you only need to configure proxy during deployment of your management or MOSK clusters. No additional actions are required to set up proxy for StackLight. For more details about implementation of proxy support in MOSK, see Proxy support and cache of artifacts.
Note
Proxy handles only the HTTP and HTTPS traffic. Therefore, for clusters with limited or no Internet access, it is not possible to set up Alertmanager email notifications, which use SMTP, when proxy is used.
Proxy is used for the following StackLight components:
Component |
Cluster type |
Usage |
|---|---|---|
Alertmanager |
Any |
As a default http_config
for all HTTP-based receivers except the predefined HTTP-alerta and
HTTP-salesforce. For these receivers, |
Metric Collector |
Management |
To send outbound cluster metrics to Mirantis. |
Salesforce notifier |
Any |
To send notifications to the Salesforce instance. |
Salesforce reporter |
Any |
To send metric reports to the Salesforce instance. |
Blueprints
This section contains a collection of Mirantis OpenStack for Kubernetes (MOSK) architecture blueprints that include common cluster topology and configuration patterns that can be referred to when building a MOSK cloud. Every blueprint is validated by Mirantis and is known to work. You can use these blueprints alone or in combination, although the interoperability of all possible combinations can not be guaranteed.
The section provides information on the target use cases, pros and cons of every blueprint and outlines the extents of its applicability. However, do not hesitate to reach out to Mirantis if you have any questions or doubts on whether a specific blueprint can be applied when designing your cloud.
Remote compute nodes
Introduction to edge computing
Although a classic cloud approach allows resources to be distributed across multiple regions, it still needs powerful data centers to host control planes and compute clusters. Such regional centralization poses challenges when the number of data consumers grows. It becomes hard to access the resources hosted in the cloud even though the resources are located in the same geographic region. The solution would be to bring the data closer to the consumer. And this is exactly what edge computing provides.
Edge computing is a paradigm that brings computation and data storage closer to the sources of data or the consumer. It is designed to improve response time and save bandwidth.
A few examples of use cases for edge computing include:
Hosting a video stream processing application on premises of a large stadium during the Super Bowl match
Placing the inventory or augmented reality services directly in the industrial facilities, such as storage, powerplant, shipyard, and so on
A small computation node deployed in a far-distanced village supermarket to host an application for store automatization and accounting
These and many other use cases could be solved by deploying multiple edge clusters managed from a single central place. The idea of centralized management plays a significant role for the business efficiency of the edge cloud environment:
Cloud operators obtain a single management console for the cloud that simplifies the Day-1 provisioning of new edge sites and Day-2 operations across multiple geographically distributed points of presence
Cloud users get ability to transparently connect their edge applications with central databases or business logic components hosted in data centers or public clouds
Depending on the size, location, and target use case, the points of presence comprising an edge cloud environment can be divided into five major categories. Mirantis OpenStack powered by Mirantis Container Cloud offers reference architectures to address the centralized management in core and regional data centers as well as edge sites.
Overview of the remote compute nodes approach
Remote compute nodes is one of the approaches to the implementation of the edge computing concept offered by MOSK. The topology consists of a MOSK cluster residing in a data center, which is extended with multiple small groups of compute nodes deployed in geographically distanced remote sites. Remote compute nodes are integrated into the MOSK cluster just like the nodes in the central site with their configuration and life cycle managed through the same means.
Along with compute nodes, remote sites need to incorporate network gateway components that allow application users to consume edge services directly without looping the traffic through the central site.
Design considerations for a remote site
Deployment of an edge cluster managed from a single central place starts with a proper planning. This section provides recommendations on how to approach the deployment design.
Mirantis recommends organizing nodes in each remote site into separate Availability Zones in the MOSK Compute (OpenStack Nova), Networking (OpenStack Neutron), and Block Storage (OpenStack Cinder) services. This enables the cloud users to be aware of the failure domain represented by a remote site and distribute the parts of their applications accordingly.
Typically, high latency in between the central control plane and remote sites makes it not feasible to rely on Ceph as a storage for the instance root/ephemeral and block data.
Mirantis recommends that you configure the remote sites to use the following backends:
Local storage (LVM or QCOW2) as a storage backend for the MOSK Compute service. See Image storage backend for the configuration details.
LVM on iSCSI backend for the MOSK Block Storage service. See Enable LVM block storage for the enablement procedure.
To maintain the small size of a remote site, the compute nodes need to be hyper-converged and combine the compute and block storage functions.
There is no limitation on the number of the remote sites and their size.
However, when planning the cluster, ensure consistency between the total number
of nodes managed by a single control plane and the value of the size
parameter set in the OpenStackDeployment custom resource. For the list of
supported sizes, refer to Main elements.
Additionally, the sizing of the remote site needs to take into account the characteristics of the networking channel with the main site.
Typically, an edge site consists of 3-7 compute nodes installed in a single, usually rented, rack.
Mirantis recommends keeping the network latency between the main and remote sites as low as possible. For stable interoperability of cluster components, the latency needs to be around 30-70 milliseconds. Though, depending on the cluster configuration and dynamism of the workloads running in the remote site, the stability of the cluster can be preserved with the latency of up to 190 milliseconds.
The bandwidth of the communication channel between the main and remote sites needs to be sufficient to run the following traffic:
The control plane and management traffic, such as OpenStack messaging, database access, MOSK underlay Kubernetes cluster control plane, and so on. A single remote compute node in the idle state requires at minimum 1.5 Mbit/s of bandwidth to perform the non-data plane communications.
The data plane traffic, such as OpenStack image operations, instances VNC console traffic, and so on, that heavily depend on the profile of the workloads and other aspects of the cloud usage.
In general, Mirantis recommends having a minimum of 100 MBit/s bandwidth between the main and remote sites.
MOSK remote compute nodes architecture is designed to tolerate a temporary loss of connectivity between the main cluster and the remote sites. In case of a disconnection, the instances running on remote compute nodes will keep running normally preserving their ability to read and write ephemeral and block storage data presuming it is located in the same site, as well as connectivity to their neighbours and edge application users. However, the instances will not have access to any cloud services or applications located outside of their remote site.
Since the MOSK control plane communicates with remote compute nodes through the same network channel, cloud users will not be able to perform any manipulations, for example, instance creation, deletion, snapshotting, and so on, over their edge applications until the connectivity gets restored. MOSK services providing high availability to cloud applications, such as the Instance HA service and Network service, need to be connected to the remote compute nodes to perform a failover of application components running in the remote site.
Once the connectivity between the main and the remote site restores, all functions become available again. The period during which an edge application can sustain normal function after a connectivity loss is determined by multiple factors including the selected networking backend for the MOSK cluster. Mirantis recommends that a cloud operator performs a set of test manipulations over the cloud resources hosted in the remote site to ensure that it has been fully restored.
When configured in Tungsten Fabric-powered clouds, the Graceful restart and long-lived graceful restart feature significantly improves the MOSK ability to sustain the connectivity of workloads running at remote sites in situations when a site experiences a loss of connection to the central hosting location of the control plane.
Extensive testing has demonstrated that remote sites can effectively withstand a 72-hour control plane disconnection with zero impact on the running applications.
Given that a remote site communicates with its main MOSK cluster across a wide area network (WAN), it becomes important to protect sensitive data from being intercepted and viewed by a third party. Specifically, you should ensure the protection of the data belonging to the following cloud components:
- Mirantis Container Cloud life-cycle management plane
Bare metal servers provisioning and control, Kubernetes cluster deployment and management, Mirantis StackLight telemetry
- MOSK control plane
Communication between the components of OpenStack, Tungsten Fabric, and Mirantis Ceph
- MOSK data plane
Cloud application traffic
The most reliable way to protect the data is to configure the network equipment in the data center and the remote site to encapsulate all the bypassing remote-to-main communications into an encrypted VPN tunnel. Alternatively, Mirantis Container Cloud and MOSK can be configured to force encryption of specific types of network traffic, such as:
Kubernetes networking for MOSK underlying Kubernetes cluster that handles the vast majority of in-MOSK communications
OpenStack tenant networking that carries all the cloud application traffic
The ability to enforce traffic encryption depends on the specific version of the Mirantis Container Cloud and MOSK in use, as well as the selected SDN backend for OpenStack.
Remote compute nodes with Tungsten Fabric
TechPreview
In MOSK, the main cloud that controls remote computes can be the regional site that locates the regional cluster and the MOSK control plane. Additionally, it can contain a local storage and compute nodes.
The remote computes implementation in MOSK considers Tungsten Fabric as an SDN solution.
Remote computes bare metal servers are configured as Kubernetes workers hosting the deployments for:
Tungsten Fabric vRouter-gateway service
Nova-compute
Local storage (LVM with iSCSI block storage)
Large clusters
This section describes a validated MOSK cluster architecture that is capable of handling 10,000 instances under a single control plane.
Hardware characteristics
Role |
Nodes count |
Server specification |
|---|---|---|
Management cluster Kubernetes nodes |
3 |
|
MOSK cluster Kubernetes master nodes |
3 |
|
OpenStack controller nodes |
5 |
|
OpenStack compute and storage nodes |
Up to 500 total |
|
StackLight nodes |
3 |
|
Cluster architecture
Configuration |
Value |
|---|---|
Dedicated StackLight nodes |
Yes |
Dedicated Ceph storage nodes |
Yes |
Dedicated control plane Kubernetes nodes |
Yes |
Dedicated OpenStack gateway nodes |
No, collocated with OpenStack controller nodes |
OpenStack networking backend |
Open vSwitch, no Distributed Virtual Router |
Cluster size in the |
|
Cluster validation
The architecture validation is perfomed by means of simultanious creation of multiple OpenStack resources of various types and execution of functional tests against each resource. The amount of resources hosted in the cluster at the moment when a certain threshold of non-operational resources starts being observed, is described below as cluster capacity limit.
Note
A successfully created resource has the Active status in the API
and passes the functional tests, for example, its floating IP address is
accessible. The MOSK cluster is considered to be able to
handle the created resources if it successfully performs the LCM operations
including the OpenStack services restart, both on the control and data
plane.
Note
The key limiting factor for creating more OpenStack objects in this illustrative setup is hardware resources (vCPU and RAM) available on the compute nodes.
OpenStack resource |
Limit |
|---|---|
Instances |
11101 |
Network ports - instances |
37337 |
Network ports - service (avg. per gateway node) |
3517 |
Volumes |
2784 |
Routers |
2448 |
Networks |
3383 |
Orchestration stacks |
2419 |
Node role |
Load average |
vCPU |
RAM in GB |
|---|---|---|---|
OpenStack controller + gateway |
10 |
10 |
100 |
OpenStack compute |
30 |
25 |
160 |
Ceph storage |
2 |
2 |
15 |
StackLight |
10 |
8 |
102 |
Kubernetes master |
10 |
6 |
13 |
Cephless cloud
Available since MOSK 23.2 TechPreview
Persistent storage is a key component of any MOSK deployment. Out of the box, MOSK includes an open-source software-defined storage solution (Ceph), which hosts various kinds of cloud application data, such as root and ephemeral disks for virtual machines, virtual machine images, attachable virtual block storage, and object data. In addition, a Ceph cluster usually acts as a storage for the internal MOSK components, such as Kubernetes, OpenStack, StackLight, and so on.
Being distributed and redundant by design, Ceph requires a certain minimum amount of servers, also known as OSD or storage nodes, to work. A production-grade Ceph cluster typically consists of at least nine storage nodes, while a development and test environment may include four to six servers. For details, refer to MOSK cluster hardware requirements.
It is possible to reduce the overall footprint of a MOSK cluster by collocating the Ceph components with hypervisors on the same physical servers; this is also known as hyper-converged design. However, this architecture still may not satisfy the requirements of certain use cases for the cloud.
Standalone telco-edge MOSK clouds typically consist of three to seven servers hosted in a single rack, where every piece of CPU, memory and disk resources is strictly accounted and better be dedicated to the cloud workloads, rather than control plane. For such clouds, where the cluster footprint is more important than the resiliency of the application data storage, it makes sense either not to have a Ceph cluster at all or to replace it with some primitive non-redundant solution.
Enterprise virtualization infrastructure with third-party storage is not a rare strategy among large companies that rely on proprietary storage appliances, provided by NetApp, Dell, HPE, Pure Storage, and other major players in the data storage sector. These industry leaders offer a variety of storage solutions meticulously designed to suit various enterprise demands. Many companies, having already invested substantially in proprietary storage infrastructure, prefer integrating MOSK with their existing storage systems. This approach allows them to leverage this investment rather than incurring new costs and logistical complexities associated with migrating to Ceph.
Architecture
Kind of data |
MOSK component |
Data storage in Cephless architecture |
Configuration |
|---|---|---|---|
Root and ephemeral disks of instances |
Compute service (OpenStack Nova) |
|
|
Volumes |
Block Storage service (OpenStack Cinder) |
|
|
Volumes backups |
Block Storage service (OpenStack Cinder) |
Alternatively, you can disable the volume backup functionality. |
|
Tungsten Fabric database backups |
Tungsten Fabric (Cassandra, ZooKeeper) |
External NFS share TechPreview Alternatively, you can disable the Tungsten Fabric database backups functionality. |
|
OpenStack database backups |
OpenStack (MariaDB) |
Alternatively, you can disable the database backup functionality. |
|
Results of functional testing |
OpenStack Tempest |
Local file system of MOSK controller nodes. The |
|
Instance images and snapshots |
Image service (OpenStack Glance) |
You can configure the Block Storage service (OpenStack Cinder) to be used as a storage backend for images and snapshots. In this case, each image is represented as a volume. Important Representing volumes as images implies a hard requirement for the selected block storage backend to support multi-attach capability that is concurrent reads and writes to and from a single volume. |
|
Application object data |
Object storage service (Ceph RADOS Gateway) |
External S3, Swift, or any other third-party storage solutions compatible with object access protocols. Note An external object storage solution will not be integrated into the MOSK identity service (OpenStack Keystone), the cloud applications will need to take care of managing access to their object data themselves. If no Ceph is deployed as part of a cluster, the MOSK built-in Object Storage service API endpoints are disabled automatically. |
|
Logs, metrics, alerts |
Mirantis StackLight (Prometeus, Alertmanager, Patroni, OpenSearch) |
Local file system of MOSK controller nodes. StackLight must be deployed in the HA mode, when all its data gets stored on the local file system of the nodes running StackLight services. In this mode, StackLight components get configured to handle the data replication themselves. |
Limitations
The determination of whether a MOSK cloud will include Ceph or not should take place during its planning and design phase. Once the deployment is complete, reconfiguring the cloud to switch between Ceph and non-Ceph architectures becomes impossible.
Mirantis recommends avoiding substitution of Ceph-backed persistent volumes in the MOSK underlying Kubernetes cluster with local volumes (local volume provisioner) for production environments. MOSK does not support such configuration unless the components that rely on these volumes can replicate their data themselves, for example, StackLight. Volumes provided by the local volume provisioner are not redundant, as they are bound to just a single node and can only be mounted from the Kubernetes pods running on the same nodes.
Air-gapped clusters
Available since MCC 2.30.0 (21.0.0 and 20.0.0) TechPreview
Aside from proxy, Mirantis supports deployment of air-gapped clusters that are useful in financial and other security-concerned areas. Such clusters exist in isolated environments that have no Internet connection, neither direct nor proxied. Such an isolated environment provides all required network services, such as NTP, DNS, file resources, image registries, and so on.
MOSK air-gapping solution allows you to create an offline copy of files and images required to deploy and upgrade a cluster. You can use this offline copy to create a private content delivery network (CDN) similar to the Mirantis public CDN. If required, you can also migrate an existing non-airgapped cluster to an air-gapped one.
The following diagram illustrates air gap implementation in MOSK:
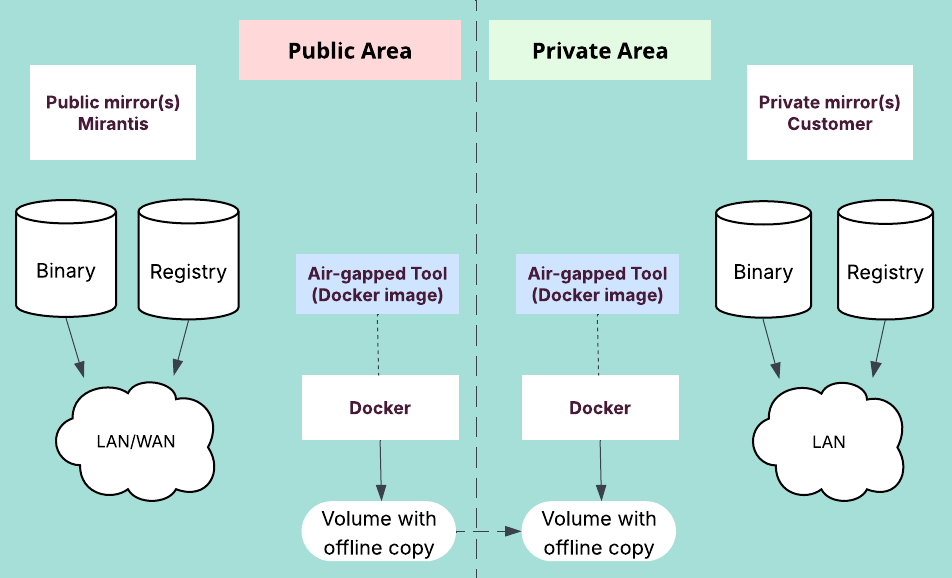
The following sections contain deployment and update details for air-gapped clusters.
Directory and URL structure
The URL structure in the air gap implementation contains three types of file CDN resources and one image CDN resource. The private file CDN resources emulate the following public resources:
binaryresource –> https://binary.mirantis.comdebianresource –> https://mirror.mirantis.commcr-reporesource –> https://repos.mirantis.com
The private image CDN resource emulates the mirantis.azurecr.io Docker
registry.
Each of these private file CDN resources contains a limited copy of files that
is necessary to deploy a specific ClusterRelease version. Any file on any
private CDN resource exists on the same path as on the corresponding public CDN
resource. For example, the LCM Agent binary 1.42.6 on the public CDN is located
on the https://binary.mirantis.com/core/bin/lcm-agent-1.42.6 binary
resource. When copied to the private CDN, its new URL becomes
<Private Binary Files CDN>/core/bin/lcm-agent-1.42.6.
The same principle applies to images: only images required for a specific
ClusterRelease are copied from the CDN with public images. On the private
CDN, images are available under the same <image name>:<tag>. The only thing
that differs is the registry base URL. For example,
image mirantis.azurecr.io/general/external/pause:3.1 becomes
<Private Images CDN>/general/external/pause:3.1.
Limitations on Logging, Monitoring, and Alerting
The following optional StackLight features require either a direct Internet access or HTTP proxy:
Salesforce integration (
sf-notifierandsf-reporter)Any receiver supported by Alertmanager that requires Internet access, for example, email, Microsoft Teams, ServiceNow, or Slack
For details on proxy implementation in MOSK, see Proxy support and cache of artifacts.
By default, the management cluster records outbound metrics in its logs instead of sending them to the telemetry endpoint (as it occurs in non-airgapped clusters). Since the cluster has no Internet connectivity, telemetry cannot be sent to Mirantis in real time, and Mirantis may request that you share a snapshot of these metrics offline instead. For details, see Outbound cluster metrics.
Requirements for air-gapped clusters
Available since MCC 2.30.0 (21.0.0 and 20.0.0) TechPreview
This section lists system requirements and storage size estimations for an air-gapped cluster. For implementation details, see Air-gapped clusters. For other resources required specifically for a seed node, management cluster, and MOSK cluster, refer to the corresponding sections in Requirements.
The system used to create an offline copy must meet the following minimal system requirements:
A Linux-based operating system (Ubuntu preferred)
Fast Internet connection
Docker installed and configured to be used by an unprivileged user
CPU: 4
RAM: 8 GB
Storage: 80 GB
Offline copy volume: depends on the selected versions of
KaasReleaseandClusterReleasesto be synchronized from public mirrorsTo synchronize the entire
ReleaseArtifactscontent, which includes oneKaasReleaseand all relatedClusterReleases, a volume of 512 GB is enough. But Mirantis recommends inspecting the release content before you start synchronization.Synchronization of only selected
ClusterReleasesrequires less space. For example, the storage space required for an initial deployment of MOSK 25.1.1, which includes oneKaasReleaseand twoClusterReleases, is 95.52 GiB.To obtain a rough size estimation, inspect the
ReleaseArtifactstarball as described in Estimate storage size.
Except a private CDN, the private area system must meet the following minimal system requirements:
A Linux-based operating system (Ubuntu preferred)
Docker and Docker Compose installed and configured to be used by an unprivileged user
CPU: 4
RAM: 8 GB
Storage: 80 GB + space for a demo CDN 0
- 0
A demo CDN is required for transfering an offline copy to a private CDN. You can also use it for testing purposes. It requires system storage to keep Docker registry data that depends on the selected
KaasReleaseandClusterReleasesize. For details, see Demo CDN storage size.
The private mirror requirements are as follows:
Binary CDN:
Must serve static binary files using HTTPS.
Must have enough storage depending on selected
KaasReleaseandClusterRelease. For details, see Estimate storage size.
Docker registry:
Must serve static Docker images using HTTPS.
Must have enough storage depending on selected
KaasReleaseandClusterRelease. For details, see Estimate storage size.
Demo CDN is a quick way to export files from an offline copy through HTTP/HTTPS and Docker registry. You can also use the demo CDN for testing purposes.
Warning
Do not use the demo CDN in production deployments.
To export regular files, some additional space on an offline copy volume is required. Before exporting files through HTTP/HTTPS, an original filesystem layout of a mirror must be restored by creating an original directory structure using symbolic links (as files) pointing to corresponding blobs. This adds some overhead but it is not comparable with copying the entire files to their new locations. Symbolic links are created on the same volume where file blobs are located (offline copy volume) and fit perfectly into an additional 20% of the reserved space.
Exporting Docker images has a different logic. Although OCI layout is created
using the same approach as for the files (directory tree + symbolic links),
images must be uploaded to a Docker registry first. By default, the Docker
registry service, which is created as Docker container, uses additional volume
to preserve its internal data including layer blobs. This volume is located on
a host drive, so the estimated size of Docker images must be added to the
initial 80 GB of storage space for a host. For example, the Docker registry
storage space required for an initial deployment of MOSK
25.1.1, which includes one KaasRelease and two ClusterReleases, is
24.3 GiB + 80 GiB = 104.3 GiB. To estimate this additional space size for your
use case, refer to the Estimate storage size procedure.
Configure and deploy an air-gapped cluster
Available since MCC 2.30.0 (21.0.0 and 20.0.0) TechPreview
Mirantis supports deployment of air-gapped clusters that are useful in financial and other security-concerned areas. Such clusters exist in isolated environments that have no Internet connection, neither direct nor proxied.
This section describes how to create an offline copy of files and images required to deploy and upgrade a MOSK cluster. You can use this offline copy to create a private content delivery network (CDN) similar to the Mirantis public CDN. If required, you can also migrate an existing non-airgapped cluster to an air-gapped one.
Available since MCC 2.30.0 (21.0.0 and 20.0.0) TechPreview
After you prepare resources as described in Requirements for air-gapped clusters, proceed to creating an offline copy of files and images required to deploy a MOSK cluster.
Ensure
dockeranddocker-composeare installed. For details, see Docker documentation: Install Docker Engine on Ubuntu.Ensure an unprivileged user can execute the docker command:
Add your current user to the
dockergroup:sudo usermod -a -G sudo $(whoami)
Log out and log back in so that your group membership is re-evaluated.
Download and run the latest bootstrap script:
wget https://binary.mirantis.com/releases/get_container_cloud.sh chmod +x get_container_cloud.sh ./get_container_cloud.sh
Change the directory to the
kaas-bootstrapdirectory created by the script.Identify the
container-cloudtool version:./container-cloud versionExample of system response:
Git Version: 1.42.26
Create and configure
~/kaas-bootstrap/airgapped.envusing the following variables. Define the required versions depending on thecontainer-cloudtool version. For example:AIRGAPPED_WORKSPACE=/opt/airgapped AIRGAPPED_IMAGE=mirantis.azurecr.io/core/airgapped-tools:1.42.26 RELEASE_ARTIFACTS_TAR=release_artifacts-mcc_2.29.6.tar.gz RELEASES_TAR=release_files-mcc_2.29.6.tar.gz
Environment variables for airgapped.env¶ Variable
Description
AIRGAPPED_WORKSPACEThe workspace directory where all content will be stored. Consider mounting an external volume at that location if running inside a cloud VM, for example, using OpenStack. An offline copy may consume a significant amount of disk space (~10 GiB per
KaasRelease+ ~50-130 GiB perClusterRelease). When selecting the volume size, add 20% to the total size, calculated by the inspect command.AIRGAPPED_IMAGEThe main entrypoint for the
airgaptool. The image version must match thecontainer-cloudtool version obtained in the previous step.RELEASE_ARTIFACTS_TARName of the tarball file with artifacts metadata. Its version matches the required
KaasReleaseversion defined in/kaas-bootstrap/releases/kaas/<version>.yaml.RELEASES_TARName of the tarball file with files metadata. Its version matches the required
KaasReleaseversion defined in/kaas-bootstrap/releases/kaas/<version>.yaml.
An offline copy and private mirror consist of regular files (text, binaries, archives, and so on) and Docker images (layers and metadata). The offline copy uses deduplication for efficient space usage and does not keep the same content of a file twice even if the file uses different names. Due to this reason, different rules are used below to estimate the required size for the offline copy volume and for private mirror storage.
Each release that is a ReleaseArtifacts tarball contains metadata for a
single KaasRelease and multiple ClusterReleases. Mirantis recommends
synchronizing KaasRelease and only those ClusterRelease versions that
you use for cluster deployment or update.
To estimate storage size of a private mirror and offline copy:
Set up
airgapped-toolsas described in Set up airgapped-tools.Estimate the size of all artifacts in the tarball:
./airgapped.sh inspectExample of system response:
2025-08-20 16:21:26 [INFO ] Inspecting ArtifactsTarball 'release_artifacts-mcc_2.29.6.tar.gz' (/workspace/release_artifacts-mcc_2.29.6.tar.gz) ... +-------------+---------------------+-------------+------------+--------------+-------------+-------------+------------+ | KaaSRelease | ClusterRelease | Files Count | Files Size | Images Count | Images Size | Total Count | Total Size | +-------------+---------------------+-------------+------------+--------------+-------------+-------------+------------+ | kaas-2-29-6 | | 109 | 26.0GiB | 387 | 2.9GiB | 496 | 28.9GiB | | kaas-2-29-6 | mke-16-3-0-3-7-12 | 83137 | 86.8GiB | 1054 | 9.2GiB | 84191 | 96.1GiB | | kaas-2-29-6 | mke-16-3-10-3-7-23 | 43065 | 44.9GiB | 1085 | 9.0GiB | 44150 | 53.9GiB | | kaas-2-29-6 | mke-16-3-4-3-7-17 | 83569 | 89.2GiB | 1064 | 8.8GiB | 84633 | 98.1GiB | | kaas-2-29-6 | mke-16-3-5-3-7-18 | 83445 | 90.4GiB | 1064 | 8.8GiB | 84509 | 99.2GiB | | kaas-2-29-6 | mke-16-3-6-3-7-20 | 42904 | 43.9GiB | 1063 | 8.8GiB | 43967 | 52.7GiB | | kaas-2-29-6 | mke-16-3-7-3-7-20 | 42921 | 43.6GiB | 1062 | 8.7GiB | 43983 | 52.4GiB | | kaas-2-29-6 | mke-16-3-8-3-7-22 | 42921 | 43.6GiB | 1061 | 8.8GiB | 43982 | 52.4GiB | | kaas-2-29-6 | mke-16-3-9-3-7-23 | 43028 | 44.5GiB | 1085 | 8.9GiB | 44113 | 53.4GiB | | kaas-2-29-6 | mke-16-4-0-3-7-19 | 42822 | 43.5GiB | 1085 | 8.7GiB | 43907 | 52.2GiB | | kaas-2-29-6 | mke-16-4-1-3-7-20 | 42905 | 43.9GiB | 1085 | 8.8GiB | 43990 | 52.7GiB | | kaas-2-29-6 | mke-16-4-2-3-7-20 | 42922 | 43.6GiB | 1085 | 8.8GiB | 44007 | 52.4GiB | | kaas-2-29-6 | mke-16-4-3-3-7-22 | 42922 | 43.6GiB | 1084 | 8.8GiB | 44006 | 52.5GiB | | kaas-2-29-6 | mke-16-4-4-3-7-23 | 43029 | 44.5GiB | 1108 | 8.9GiB | 44137 | 53.4GiB | | kaas-2-29-6 | mke-16-4-5-3-7-23 | 43066 | 44.9GiB | 1108 | 9.0GiB | 44174 | 53.9GiB | | kaas-2-29-6 | mke-16-4-6-3-7-24 | 43317 | 45.1GiB | 1109 | 9.1GiB | 44426 | 54.2GiB | | kaas-2-29-6 | mosk-17-3-0-24-3 | 83191 | 90.1GiB | 2007 | 34.0GiB | 85198 | 124.1GiB | | kaas-2-29-6 | mosk-17-3-10-24-3-7 | 43083 | 48.2GiB | 2007 | 34.3GiB | 45090 | 82.5GiB | | kaas-2-29-6 | mosk-17-3-4-24-3-1 | 83587 | 92.6GiB | 2020 | 33.8GiB | 85607 | 126.4GiB | | kaas-2-29-6 | mosk-17-3-5-24-3-2 | 83463 | 93.7GiB | 2020 | 33.7GiB | 85483 | 127.5GiB | | kaas-2-29-6 | mosk-17-3-6-24-3-3 | 42922 | 47.2GiB | 2019 | 34.4GiB | 44941 | 81.6GiB | | kaas-2-29-6 | mosk-17-3-7-24-3-4 | 42939 | 47.0GiB | 2032 | 34.8GiB | 44971 | 81.7GiB | | kaas-2-29-6 | mosk-17-3-8-24-3-5 | 42939 | 47.0GiB | 2034 | 34.9GiB | 44973 | 81.9GiB | | kaas-2-29-6 | mosk-17-3-9-24-3-6 | 43046 | 47.8GiB | 2033 | 34.6GiB | 45079 | 82.4GiB | | kaas-2-29-6 | mosk-17-4-0-25-1 | 42842 | 47.1GiB | 1745 | 27.0GiB | 44587 | 74.1GiB | | kaas-2-29-6 | mosk-17-4-6-25-1-1 | 43337 | 48.6GiB | 1704 | 27.1GiB | 45041 | 75.7GiB | | * | * | 1317431 | 1.4TiB | 36210 | 464.6GiB | 1353641 | 1.9TiB | +-------------+---------------------+-------------+------------+--------------+-------------+-------------+------------+
The last row with asterisks displays estimated sizes for files, images, and total files together with images for all selected versions. When estimating the size for a private mirror, pay attention to values in the
Files SizeandImages Sizecolumns.By default, a
ReleaseArtifactstarball contains artifacts for everyClusterReleasethat is supported by oneKaasRelease. For an initial deployment, it is enough to mirror only theKaasRelease(first row in the example above) and twoClusterReleases: one release with themke-prefix that has the latest version and one release with themosk-prefix:A major
mosk-version contains five numbers (for example,mosk-17-4-0-25-1)A patch
mosk-version contains six numbers (for example,mosk-17-4-0-25-1-1)
For the latest supported major and patch releases, see Release Notes. For differences between major and patch releases, see MOSK major and patch releases.
Select one
mke-and onemosk-release depending on your use case. Mirantis recommends using the latest available releases.Estimate the size of only necessary deduplicated artifacts for the offline copy. For example:
./airgapped.sh inspect \ --kaas-release kaas-2-29-6 \ --cluster-release mke-16-4-6-3-7-24 \ --cluster-release mosk-17-4-6-25-1-1 \ --unique
Example of system response:
2025-08-20 16:31:58 [INFO ] Inspecting ArtifactsTarball 'release_artifacts-mcc_2.29.6.tar.gz' (/workspace/release_artifacts-mcc_2.29.6.tar.gz) ... +-------------+--------------------+-------------+------------+--------------+-------------+-------------+------------+ | KaaSRelease | ClusterRelease | Files Count | Files Size | Images Count | Images Size | Total Count | Total Size | +-------------+--------------------+-------------+------------+--------------+-------------+-------------+------------+ | kaas-2-29-6 | | 86 | 10.7GiB | 317 | 2.7GiB | 403 | 13.4GiB | | kaas-2-29-6 | mke-16-4-6-3-7-24 | 43223 | 43.1GiB | 670 | 6.7GiB | 43893 | 49.7GiB | | kaas-2-29-6 | mosk-17-4-6-25-1-1 | 10 | 1.5GiB | 537 | 14.9GiB | 547 | 16.4GiB | | * | * | 43319 | 55.2GiB | 1524 | 24.3GiB | 44843 | 79.6GiB | +-------------+--------------------+-------------+------------+--------------+-------------+-------------+------------+
Mirantis recommends adding 20% to the total of
Files SizeandImages Size. For example: 79.6 GiB + 20% = 95.52 GiB.Estimate a demo CDN storage size for a quick export of files from an offline copy through HTTP/HTTPS and Docker registry. For details, see Demo CDN storage size.
Warning
Do not use the demo CDN in production deployments.
To estimate the volume size for the Docker registry to use a demo CDN, use the following example:
./airgapped.sh inspect \ --kaas-release kaas-2-29-6 \ --cluster-release mke-16-4-6-3-7-24 \ --cluster-release mosk-17-4-6-25-1-1 \ --unique
Example of system response:
2025-08-20 16:31:58 [INFO ] Inspecting ArtifactsTarball 'release_artifacts-mcc_2.29.6.tar.gz' (/workspace/release_artifacts-mcc_2.29.6.tar.gz) ... +-------------+--------------------+-------------+------------+--------------+-------------+-------------+------------+ | KaaSRelease | ClusterRelease | Files Count | Files Size | Images Count | Images Size | Total Count | Total Size | +-------------+--------------------+-------------+------------+--------------+-------------+-------------+------------+ | kaas-2-29-6 | | 86 | 10.7GiB | 317 | 2.7GiB | 403 | 13.4GiB | | kaas-2-29-6 | mke-16-4-6-3-7-24 | 43223 | 43.1GiB | 670 | 6.7GiB | 43893 | 49.7GiB | | kaas-2-29-6 | mosk-17-4-6-25-1-1 | 10 | 1.5GiB | 537 | 14.9GiB | 547 | 16.4GiB | | * | * | 43319 | 55.2GiB | 1524 | 24.3GiB | 44843 | 79.6GiB | +-------------+--------------------+-------------+------------+--------------+-------------+-------------+------------+
In the example above, use the value from the last row of the
Images Sizecolumn. The configuration disk size must be 24.3 GiB + 80 GiB = 104.3 GiB.
Change the directory to
~/kaas-bootstrap.Fetch the required
release_files-<version>tarball:./airgapped.sh fetch-release-filesExample of system response extract:
2025-08-13 16:35:13 [INFO ] Fetching release files ... 2025-08-13 16:35:14 [INFO ] Processing KaasRelease files ... 2025-08-13 16:35:21 [INFO ] Processing ClusterRelease files ... 2025-08-13 16:35:40 [INFO ] Processing DiagnosticRelease files ... 2025-08-13 16:35:40 [INFO ] Creating Release files tarball '/workspace/./release_files-mcc_2.29.6.tar.gz' from '/tmp/tmp5bqihq38' ... 2025-08-13 16:35:41 [INFO ] Release files fetched.
Sync the selected
KaasReleaseandClusterReleases. For example:./airgapped.sh sync \ --kaas-release kaas-2-29-6 \ --cluster-release mke-16-4-6-3-7-24 \ --cluster-release mosk-17-4-6-25-1-1
Example of system response extract:
... 2025-08-13 16:11:28 [INFO ] Synchronizing files ... 2025-08-13 16:25:19 [INFO ] Synchronizing images ... 2025-08-13 16:30:00 [INFO ] Synchronizing files - OK. Processed 43406 files, bad files - 0. 2025-08-13 16:30:00 [INFO ] Synchronizing images - OK. Processed 161 images, bad images - 0. Processed 1319 blobs, bad blobs - 0.
Depending on the selected
KaasReleaseandClusterReleasesand network connection, the process may take up to a few hours. The offline copy files are created in the directory set using theAIRGAPPED_WORKSPACEvariable.To monitor the sync status in JSON format, add the
--jsonflag: airgapped.sh --json sync .... For details, see Monitor the airgapped tool status in JSON format.Validate cached blobs to ensure that the sync was successful. For example:
./airgapped.sh validate --cached \ --kaas-release kaas-2-29-6 \ --cluster-release mke-16-4-6-3-7-24 \ --cluster-release mosk-17-4-6-25-1-1
Example of system response extract:
2025-08-13 16:38:10 [INFO ] Validating files ... 2025-08-13 16:38:10 [INFO ] Validating cached files ... 2025-08-13 16:38:22 [INFO ] Validating cached files - OK. Total files - 43406, bad files - 0. 2025-08-13 16:38:22 [INFO ] Validating files - OK. 2025-08-13 16:38:22 [INFO ] Validating images ... 2025-08-13 16:38:22 [INFO ] Validating cached images ... 2025-08-13 16:38:22 [INFO ] Validating cached images - OK. Total images - 161, bad images - 0, total blobs - 1319, bad blobs - 0. 2025-08-13 16:38:22 [INFO ] Validating images - OK.
To monitor the validation status in JSON format, add the
--jsonflag: airgapped.sh --json validate --cached .... For details, see Monitor the airgapped tool status in JSON format.If some artifacts are missing:
Repeat the sync step.
Repeat the cached artifacts validation step.
Export the following Docker images for the node dedicated for the offline copy:
airgapped-toolsnginxregistry
Use the helper
docker-save.shscript:Download the script:
Save the script in the same directory as
airgapped.env.Make the script executable and run it:
chmod +x ./docker-save.sh ./docker-save.sh
Prepare the helper
docker-load.shscript for importing Docker images:Download the script:
Save the script in
${AIRGAPPED_WORKSPACE}/kaas-bootstrap.Make the script executable:
chmod +x ./docker-load.sh
Prepare the helper
make-artifacts-list.pyscript for generating complete lists of artifacts available on each type of demo CDN. These lists help copy artifacts from a demo to a private CDN.Download the script:
Save the script in
${AIRGAPPED_WORKSPACE}/kaas-bootstrap.Make the script executable:
chmod +x ./make-artifacts-list.py
Copy the
kaas-bootstrapdirectory toAIRGAPPED_WORKSPACE:cp -r ~/kaas-bootstrap "${AIRGAPPED_WORKSPACE}"
Transfer the entire
AIRGAPPED_WORKSPACEdirectory of the offline copy to the airgapped environment.
Proceed to Create a local mirror.
After you prepare an offline copy of artifacts as described in Prepare an offline copy for an air-gapped cluster, proceed to create and configure a local mirror that is a demo CDN for testing purposes and for transfering an offline copy to a private CDN. For more details about demo CDN, see Demo CDN storage size.
Log in to the node where the offline copy is supposed to be located.
Make sure that the offline copy content is availabe in the
AIRGAPPED_WORKSPACEdirectory by either mounting the offline copy volume to theAIRGAPPED_WORKSPACEmount point, or copying its entire content toAIRGAPPED_WORKSPACE.Change the directory to
<AIRGAPPED_WORKSPACE>/kaas-bootstrap.Make sure that the
AIRGAPPED_WORKSPACEvariable inairgapped.envmatches your airgapped workspace path.Import the helper Docker images:
./docker-load.sh
Export the required files and images. For example:
./airgapped.sh export \ --kaas-release kaas-2-29-6 \ --cluster-release mke-16-4-6-3-7-24 \ --cluster-release mosk-17-4-6-25-1-1
Example of system response extract:
... 2025-08-14 11:13:07 [INFO ] Exporting files ... Reading cache 2025-08-14 11:13:19 [INFO ] Exporting filesystem layout ... 2025-08-14 11:13:24 [INFO ] Exporting filesystem layout - done. 2025-08-14 11:13:24 [INFO ] Exporting files - OK. Total files - 43406, failed files - 0. 2025-08-14 11:13:24 [INFO ] Exporting images ... Reading cache 2025-08-14 11:13:24 [INFO ] Exporting images to OCI layout ... 2025-08-14 11:13:25 [INFO ] Exporting images to OCI layout - done. 2025-08-14 11:13:25 [INFO ] Exporting images - OK. Total images - 161, failed images - 0.
Initialize the demo CDN services:
./airgapped.sh demo --init --san-ip <DEMO_CDN_IP>
DEMO_CDN_IPis an IP address of a system where you run the demo CDN Docker services. It can be either the host IP address of a physical node or a floating IP address of an OpenStack instance.Warning
Run the demo --init command only once as it creates a CA certificate each time unconditionally. Previously created
.crt / .keyfiles will be backed up, but backup keeps only one most recent version of each file.The CA certificate named
demo-ca.crtis saved in the${AIRGAPPED_WORKSPACE}/shared/directory and is available by thehttp://<DEMO_CDN_IP>:8080/demo-ca.crtlink.Start the demo CDN services:
./airgapped.sh demo up -d
Push Docker images. For example:
./airgapped.sh push \ --kaas-release kaas-2-29-6 \ --cluster-release mke-16-4-6-3-7-24 \ --cluster-release mosk-17-4-6-25-1-1 \ --url-map="registry=<DEMO_CDN_IP>" \ --insecure-registry
Example of system response extract:
... 2025-08-14 11:31:14 [INFO ] Pushing images to remote registry ... 2025-08-14 11:32:50 [INFO ] Pushing images done (passed / failed): 161 / 0
Validate the demo CDN. For example:
./airgapped.sh validate \ --kaas-release kaas-2-29-6 \ --cluster-release mke-16-4-6-3-7-24 \ --url-map "binary=https://<DEMO_CDN_IP>:8081" \ --url-map "debian=https://<DEMO_CDN_IP>:8082" \ --url-map "mcr-repo=https://<DEMO_CDN_IP>:8083" \ --url-map "registry=<DEMO_CDN_IP>"
Example of system response extract:
... 2025-08-14 11:48:47 [INFO ] Validating files ... 2025-08-14 11:48:47 [INFO ] Validating remote files ... Total files: 43406, running 75 workers. 2025-08-14 11:57:35 [INFO ] Validating release files ... Total files: 343, running 41 workers. 2025-08-14 11:57:37 [INFO ] Validating release files - OK. Total files: 343, bad files - 0. 2025-08-14 11:57:37 [INFO ] Validating remote files - OK. Total files: 43406, bad files - 0. 2025-08-14 11:57:37 [INFO ] Validating files - OK. 2025-08-14 11:57:37 [INFO ] Validating images ... 2025-08-14 11:57:37 [INFO ] Validating remote images ... Total images 161, running 18 threads. 2025-08-14 11:57:38 [INFO ] Validating remote images - OK. Total images - 161, failed images - 0, errors - 0 2025-08-14 11:57:38 [INFO ] Validating images - OK.
If some artifacts are missing:
Add missing artifacts:
For Docker images, run airgapped.sh push
For files, run airgapped.sh export --files --no-images
Repeat the demo CDN validation.
Copy validated artifacts from the demo CDN to the private CDN by keeping the directory structure under each CDN intact. Use your preferred tool, for example, skopeo,
curl,rsync, or JFrog CLI.If you need complete lists of files and images available on each type of demo CDN, use the previously prepared
make-artifacts-list.pyscript to generate these lists:./make-artifacts-list.py
The lists of files and images are available in the following locations:
binaryresource files –>http://<DEMO_CDN_IP>:8080/binary_files.txtdebianresource files –>http://<DEMO_CDN_IP>:8080/debian_repo_files.txtmcr-reporesource files –>http://<DEMO_CDN_IP>:8080/mcr_repo_files.txtregistryresource images –>http://<DEMO_CDN_IP>:8080/docker_images.txt
Caution
To keep these lists synchronized with the demo CDN content, run
make-artifacts-list.pyeach time after the airgapped.sh export command.Mandatory. Validate the artifacts in the private CDN after transfering. For example:
./airgapped.sh validate \ --kaas-release kaas-2-29-6 \ --cluster-release mke-16-4-6-3-7-24 \ --cluster-release mke-16-4-6-3-7-24 \ --url-map "binary=<MCC_CDN_BINARY>" \ --url-map "debian=<MCC_CDN_DEBIAN>" \ --url-map "mcr-repo=<MCC_CDN_MCR_REPO>" \ --url-map "registry=<MCC_CDN_DOCKER>"
Example of system response extract:
... 2025-08-14 11:48:47 [INFO ] Validating files ... 2025-08-14 11:48:47 [INFO ] Validating remote files ... Total files: 43406, running 75 workers. 2025-08-14 11:57:35 [INFO ] Validating release files ... Total files: 343, running 41 workers. 2025-08-14 11:57:37 [INFO ] Validating release files - OK. Total files: 343, bad files - 0. 2025-08-14 11:57:37 [INFO ] Validating remote files - OK. Total files: 43406, bad files - 0. 2025-08-14 11:57:37 [INFO ] Validating files - OK. 2025-08-14 11:57:37 [INFO ] Validating images ... 2025-08-14 11:57:37 [INFO ] Validating remote images ... Total images 161, running 18 threads. 2025-08-14 11:57:38 [INFO ] Validating remote images - OK. Total images - 161, failed images - 0, errors - 0 2025-08-14 11:57:38 [INFO ] Validating images - OK.
If some artifacts are missing in the offline copy:
Re-run
make-artifacts-list.pyto update the artifacts list.Repeat the artifacts transfering steps.
Repeat the artifacts validation.
Proceed to Deploy an air-gapped management cluster.
Available since MCC 2.30.0 (21.0.0 and 20.0.0) TechPreview
After you create and configure demo and private CDNs as described in Create a local mirror, proceed to configure the seed node and deploy a management cluster to be used for deployment of MOSK clusters.
To deploy an air-gapped management cluster:
Follow the seed node preparation steps 1.1-1.4 provided in Set up a bootstrap cluster.
If your private CDN uses a self-signed certificate or if you deploy a demo cluster using the demo CDN, add a root CA certificate to the seed node.
Note
The seed node must be able to validate the SSL certificate of your private or demo CDN.
To copy the root CA certificate:
For a private CDN, download the CA certificate and save it as
cdn-ca.crtin theHOMEdirectory of the current user.For the demo CDN, fetch its root CA certificate from the shared directory:
curl -o ~/cdn-ca.crt http://<DEMO_CDN_IP>:8080/demo-ca.crt
To register the root CA certificate:
sudo cp ~/cdn-ca.crt /usr/local/share/ca-certificates sudo update-ca-certificates
Make sure that the upstream Ubuntu package mirrors are accessible to the seed node, for example, using proxy.
Alternatively, enable package installation from the Ubuntu repository on the seed node, for example, from your existing internal mirror.
You may also configure your existing private or demo CDN repository as a source of packages using the
add-snaphot-repo.shscript:Download the script:
Copy the script to the
HOMEdirectory of the current user.Make the script executable:
chmod +x add-snaphot-repo.sh
Add the snapshot repository:
For a private CDN:
MCC_CDN_DEBIAN="<Private Debian Mirror CDN>" ./add-snaphot-repo.sh
For a demo CDN:
MCC_CDN_DEBIAN="https://<DEMO_CDN_IP>:8082" ./add-snaphot-repo.sh
Proceed with the step 1.5 provided in Set up a bootstrap cluster.
Export the
KAAS_CDN_BASE_URLenvironment variable pointing to your private or demo binary CDN:For a private CDN:
export KAAS_CDN_BASE_URL="<Private Binary CDN>"
For a demo CDN:
export KAAS_CDN_BASE_URL="https://${CDN_HOST}:8081"
Proceed with the step 2 provided in Set up a bootstrap cluster.
Configure
bootstrap.env:For a demo CDN:
export CDN_HOST="<DEMO_CDN_IP>" export MCC_CDN_DOCKER="${CDN_HOST}" export MCC_CDN_BINARY="https://${CDN_HOST}:8081" export MCC_CDN_DEBIAN="https://${CDN_HOST}:8082" export MCC_CDN_MCR_REPO="https://${CDN_HOST}:8083" export MCC_CDN_CA_BUNDLE_PATH=./cdn-ca.crt
For a private CDN:
export MCC_CDN_DOCKER="<Private Docker Registry>" export MCC_CDN_BINARY="<Private Binary CDN>" export MCC_CDN_DEBIAN="<Private Debian Mirror CDN>" export MCC_CDN_MCR_REPO="<Private MCR Repository CDN>" export MCC_CDN_CA_BUNDLE_PATH=./cdn-ca.crt
Follow the remaining steps provided in Set up a bootstrap cluster.
Deploy the management cluster as described in Deploy a management cluster using CLI.
The sync and validate commands of the airgapped tool
support machine-readable output in the JSONL (JSON lines) format, when each
line is a complete JSON string. This allows for line-by-line parsing and
progress tracking during command execution.
To enable JSON output, use the --json flag by adding it before a subcommand
name. For example:
./airgapped.sh --json sync ...
JSON strings contain the following fields:
timestampTimestamp of a log message.
levelVerbosity level of a message:
INFO,WARNING,ERROR,VERBOSE, orDEBUG.messageTextual description of an event or an action.
statusNon-mandatory. Status of a long-running action or additional information in the machine-readable form. The
statusfield contains the following mandatory boolean fields:completedIndicates whether an action has completed.
failedIndicates whether an action has failed (if
completedistrue) or only a step of an action has failed (ifcompletedisfalse). Usually, failed steps contain"level": "ERROR".progressingIndicates that an action is in progress.
When the status field is present, the message field contains
description of an action. Each log message related to the action contains the
same text in the message field allowing to select messages related to the
same action. Additional information may also be provided in
"status": {"message": "..."}.
Example of a successful sync output
./airgapped.sh --json sync --kaas-release kaas-2-29-6 --cluster-release mke-16-4-6-3-7-24
{"timestamp": 1755597563.0669844, "level": "WARNING", "message": "File '/workspace/release_artifacts-mcc_2.29.6.tar.gz' already exists, skipping download ..."}
{"timestamp": 1755597563.0672197, "level": "WARNING", "message": "File '/workspace/release_artifacts-mcc_2.29.6.tar.gz.digest' already exists, skipping download ..."}
{"timestamp": 1755597563.0941432, "level": "WARNING", "message": "File '/workspace/release_files-mcc_2.29.6.tar.gz' already exists, skipping download ..."}
{"timestamp": 1755597563.0943644, "level": "WARNING", "message": "File '/workspace/release_files-mcc_2.29.6.tar.gz.digest' already exists, skipping download ..."}
{"timestamp": 1755597564.067759, "level": "INFO", "message": "Synchronizing files", "status": {"completed": false, "failed": false, "progressing": true}}
{"timestamp": 1755597579.108996, "level": "INFO", "message": "Synchronizing images", "status": {"completed": false, "failed": false, "progressing": true}}
{"timestamp": 1755597579.5244758, "level": "INFO", "message": "Synchronizing files", "status": {"total_files": 43406, "bad_files": 0, "completed": true, "failed": false, "progressing": false, "message": "Processed 43406 files, bad files - 0."}}
{"timestamp": 1755597579.5299454, "level": "INFO", "message": "Synchronizing images", "status": {"total_images": 161, "bad_images": 0, "total_blobs": 1319, "bad_blobs": 0, "completed": true, "failed": false, "progressing": false, "message": "Processed 161 images, bad images - 0. Processed 1319 blobs, bad blobs - 0."}}
Example of a successful validate output
./airgapped.sh --json validate --cached --kaas-release kaas-2-29-6 --cluster-release mke-16-4-6-3-7-24
{"timestamp": 1755597514.4130914, "level": "WARNING", "message": "File '/workspace/release_artifacts-mcc_2.29.6.tar.gz' already exists, skipping download ..."}
{"timestamp": 1755597514.413293, "level": "WARNING", "message": "File '/workspace/release_artifacts-mcc_2.29.6.tar.gz.digest' already exists, skipping download ..."}
{"timestamp": 1755597514.4399714, "level": "WARNING", "message": "File '/workspace/release_files-mcc_2.29.6.tar.gz' already exists, skipping download ..."}
{"timestamp": 1755597514.440121, "level": "WARNING", "message": "File '/workspace/release_files-mcc_2.29.6.tar.gz.digest' already exists, skipping download ..."}
{"timestamp": 1755597515.4122643, "level": "INFO", "message": "Validating files", "status": {"completed": false, "failed": false, "progressing": true}}
{"timestamp": 1755597515.4124095, "level": "INFO", "message": "Validating cached files", "status": {"completed": false, "failed": false, "progressing": true}}
{"timestamp": 1755597524.7470822, "level": "INFO", "message": "Validating cached files", "status": {"total_files": 43406, "bad_files": 0, "completed": true, "failed": false, "progressing": false, "message": "Total files - 43406, bad files - 0."}}
{"timestamp": 1755597524.7553222, "level": "INFO", "message": "Validating files", "status": {"completed": true, "failed": false, "progressing": false}}
{"timestamp": 1755597524.7554657, "level": "INFO", "message": "Validating images", "status": {"completed": false, "failed": false, "progressing": true}}
{"timestamp": 1755597524.755511, "level": "INFO", "message": "Validating cached images", "status": {"completed": false, "failed": false, "progressing": true}}
{"timestamp": 1755597524.9610856, "level": "INFO", "message": "Validating cached images", "status": {"total_images": 161, "total_blobs": 1319, "bad_images": 0, "bad_blobs": 0, "completed": true, "failed": false, "progressing": false, "message": "Total images - 161, bad images - 0, total blobs - 1319, bad blobs - 0."}}
{"timestamp": 1755597524.9612145, "level": "INFO", "message": "Validating images", "status": {"completed": true, "failed": false, "progressing": false}}
Example of a failed validate output
./airgapped.sh --json validate --cached --kaas-release kaas-2-29-6 --cluster-release mke-16-4-6-3-7-24
{"timestamp": 1755597741.2202103, "level": "WARNING", "message": "File '/workspace/release_artifacts-mcc_2.29.6.tar.gz' already exists, skipping download ..."}
{"timestamp": 1755597741.220743, "level": "WARNING", "message": "File '/workspace/release_artifacts-mcc_2.29.6.tar.gz.digest' already exists, skipping download ..."}
{"timestamp": 1755597741.2485487, "level": "WARNING", "message": "File '/workspace/release_files-mcc_2.29.6.tar.gz' already exists, skipping download ..."}
{"timestamp": 1755597741.2487361, "level": "WARNING", "message": "File '/workspace/release_files-mcc_2.29.6.tar.gz.digest' already exists, skipping download ..."}
{"timestamp": 1755597742.2164998, "level": "INFO", "message": "Validating files", "status": {"completed": false, "failed": false, "progressing": true}}
{"timestamp": 1755597742.216663, "level": "INFO", "message": "Validating cached files", "status": {"completed": false, "failed": false, "progressing": true}}
{"timestamp": 1755597746.9459758, "level": "ERROR", "message": "Validating cached files", "status": {"filename": "kaas/ubuntu-2025-07-16-003900/pool/universe/h/haskell-listlike/libghc-listlike-prof_4.7.1-1build1_amd64.deb", "blob_digest": "sha256:02111e5e15c186581710b8e5517c5d1ee1284198fe30b8c5d6e1096031ac1152", "reason": "<Blob(sha256:02111e5e15c186581710b8e5517c5d1ee1284198fe30b8c5d6e1096031ac1152)> does not exist // [Errno 2] No such file or directory: '/workspace/files/blobs/sha256/02/02111e5e15c186581710b8e5517c5d1ee1284198fe30b8c5d6e1096031ac1152/data'", "completed": false, "failed": true, "progressing": true, "message": "Blob 'sha256:02111e5e15c186581710b8e5517c5d1ee1284198fe30b8c5d6e1096031ac1152' (kaas/ubuntu-2025-07-16-003900/pool/universe/h/haskell-listlike/libghc-listlike-prof_4.7.1-1build1_amd64.deb) invalid: <Blob(sha256:02111e5e15c186581710b8e5517c5d1ee1284198fe30b8c5d6e1096031ac1152)> does not exist // [Errno 2] No such file or directory: '/workspace/files/blobs/sha256/02/02111e5e15c186581710b8e5517c5d1ee1284198fe30b8c5d6e1096031ac1152/data'"}}
{"timestamp": 1755597752.2745066, "level": "ERROR", "message": "Validating cached files", "status": {"total_files": 43406, "bad_files": 1, "completed": true, "failed": true, "progressing": false, "message": "Total files - 43406, bad files - 1."}}
{"timestamp": 1755597752.2749348, "level": "ERROR", "message": "Validating files", "status": {"completed": true, "failed": true, "progressing": false}}
{"timestamp": 1755597752.2750237, "level": "INFO", "message": "Validating images", "status": {"completed": false, "failed": false, "progressing": true}}
{"timestamp": 1755597752.275078, "level": "INFO", "message": "Validating cached images", "status": {"completed": false, "failed": false, "progressing": true}}
{"timestamp": 1755597752.4782774, "level": "INFO", "message": "Validating cached images", "status": {"total_images": 161, "total_blobs": 1319, "bad_images": 0, "bad_blobs": 0, "completed": true, "failed": false, "progressing": false, "message": "Total images - 161, bad images - 0, total blobs - 1319, bad blobs - 0."}}
{"timestamp": 1755597752.4784915, "level": "INFO", "message": "Validating images", "status": {"completed": true, "failed": false, "progressing": false}}
Example of an error message for a file that failed validation
{
"timestamp": 1755597746.9459758,
"level": "ERROR",
"message": "Validating cached files",
"status": {
"filename": "kaas/ubuntu-2025-07-16-003900/pool/universe/h/haskell-listlike/libghc-listlike-prof_4.7.1-1build1_amd64.deb",
"blob_digest": "sha256:02111e5e15c186581710b8e5517c5d1ee1284198fe30b8c5d6e1096031ac1152",
"reason": "<Blob(sha256:02111e5e15c186581710b8e5517c5d1ee1284198fe30b8c5d6e1096031ac1152)> does not exist // [Errno 2] No such file or directory: /workspace/files/blobs/sha256/02/02111e5e15c186581710b8e5517c5d1ee1284198fe30b8c5d6e1096031ac1152/data",
"completed": false,
"failed": true,
"progressing": true,
"message": "Blob sha256:02111e5e15c186581710b8e5517c5d1ee1284198fe30b8c5d6e1096031ac1152 (kaas/ubuntu-2025-07-16-003900/pool/universe/h/haskell-listlike/libghc-listlike-prof_4.7.1-1build1_amd64.deb) invalid: <Blob(sha256:02111e5e15c186581710b8e5517c5d1ee1284198fe30b8c5d6e1096031ac1152)> does not exist // [Errno 2] No such file or directory: /workspace/files/blobs/sha256/02/02111e5e15c186581710b8e5517c5d1ee1284198fe30b8c5d6e1096031ac1152/data"
}
}
Example of the overall status of a completed action
{
"timestamp": 1755597752.2745066,
"level": "ERROR",
"message": "Validating cached files",
"status": {
"total_files": 43406,
"bad_files": 1,
"completed": true,
"failed": true,
"progressing": false,
"message": "Total files - 43406, bad files - 1."
}
}
Update a cluster in an air-gapped environment
Available since MCC 2.30.0 (21.0.0 and 20.0.0) TechPreview
Updating a cluster in an air-gapped private CDN involves the following additional steps aside from the standard MOSK update process depending on the way a cluster was originally deployed:
If a cluster was originally deployed in an air-gapped environment, the update process additionally includes stopping
release-controllerand transfering new release artifacts to a private CDN. Startingrelease-controllertriggers the standard MOSK update process. This option is available since 25.2 for MOSK clusters and 2.30.0 for management clusters.If a cluster was originally deployed in a non-airgapped environment, the update process is similar to updating an air-gapped cluster, but additionally includes applying a CA certificate and updating CDN paths in the
Clusterobject. This option is available since MOSK 25.1 after the management cluster update to 2.29.1.
Download the latest available release files and prepare a new offline copy using the procedure for initial deployment of an air-gapped cluster. For details, see Prepare an offline copy for an air-gapped cluster and Prepare a demo CDN.
Stop
release-controllerto prevent the cluster from an accidental update during data structure transfer:kubectl -n kaas scale deployment release-controller-release-controller --replicas 0
Back up existing release files located in the
releasesdirectory on your binary CDN.Transfer new artifacts to the private CDN as described in Transfer artifacts from the demo CDN to private CDN.
Start
release-controllerto trigger the management cluster update:kubectl -n kaas scale deployment release-controller-release-controller --replicas 1
Warning
This action cannot be paused. Therefore, ensure that all preparation steps are completed before starting
release-controller.Proceed to the usual update procedure as described in Update to a major version or Update to a patch version.
Prepare resources and storage for an offline copy of new release artifacts as described in Requirements for air-gapped clusters.
Download the latest available release files and prepare a new offline copy using the procedure for initial deployment of an air-gapped cluster. For details, see Prepare an offline copy for an air-gapped cluster and Prepare a demo CDN.
Stop
release-controllerto prevent the cluster from an accidental update during data structure transfer:kubectl -n kaas scale deployment release-controller-release-controller --replicas 0
Select one of the following options:
Management cluster 2.29.1 or later with MOSK 25.1 or later: apply a proxy CA certificate
Management cluster 2.30.0 or later with MOSK 25.2 or later: apply a CDN CA certificate
To apply a CDN CA certificate
Download the CA certificate
ca.crtfor your private CDN endpoints and convert it to a base64 string:cat ca.crt | base64 -w0; echo ''
In the
Clusterobject of the management cluster, updatecaBundlewith the base64 CA certificate created in the previous step:Important
The base64 value must be a single-line string.
apiVersion: cluster.k8s.io/v1alpha1 kind: Cluster spec: providerSpec: value: kaas: regional: - helmReleases: - name: baremetal-provider values: config: lcm: cdn: caBundle: <BASE64 CA certificate as a single-line string>
To apply a proxy CA certificate
Download the CA certificate
ca.crtfor your private CDN endpoints and convert it to a base64 string:cat ca.crt | base64 -w0; echo ''
Create a
fake-proxy.yamlProxyobject with the following content:apiVersion: kaas.mirantis.com/v1alpha1 kind: Proxy metadata: labels: kaas.mirantis.com/region: region-one name: fake-proxy namespace: default spec: httpProxy: http://127.0.0.1:3128 httpsProxy: http://127.0.0.1:3128 noProxy: <comma-separated private CDN IP addresses>,.mirantis.com,.mirantis.net,mirantis.azurecr.io caCertificate: <BASE64 CA certificate as a single-line string>
Important
The base64 CA certificate value must be a single-line string.
Apply
fake-proxy.yamlto your management cluster:kubectl create -f fake-proxy.yaml
Update the
Clusterobject of your management cluster with proxy data:kubectl patch cluster kaas-mgmt --type 'merge' -p '{"spec": {"providerSpec": {"value": {"proxy": "fake-proxy"}}}}'
While LCM is applying the CA certificate, the
Clusterobject switches to theNot Readystate.Wait until the
Clusterobject status switches back toReady:kubectl get cluster kaas-mgmt -o wide -w
Wait until all
LCMMachineobjects of the management cluster complete theReady → Prepare → Deploy → Reconfigure → Readycycle:kubectl get lcmmachine -o wide
Wait until the
Clusterobject status switches back toReady:kubectl get cluster kaas-mgmt -o wide -w
Note
Once done, manually interrupt the above command.
Back up existing release files located in the
releasesdirectory on your binary CDN.Transfer new artifacts to the private CDN as described in Transfer artifacts from the demo CDN to private CDN.
In the
Clusterobject of the management cluster, replace mirror URLs with endpoints of your private CDN:apiVersion: cluster.k8s.io/v1alpha1 kind: Cluster spec: providerSpec: value: kaas: management: helmReleases: - name: release-controller values: releasesBaseUrl: <MCC_CDN_BINARY>/releases - name: diagnostic-controller values: releasesBaseUrl: <MCC_CDN_BINARY>/releases regional: - helmReleases: - name: baremetal-provider values: config: lcm: cdn: binary: <MCC_CDN_BINARY> debian: <MCC_CDN_DEBIAN> docker: <MCC_CDN_DOCKER> mcrRepo: <MCC_CDN_MCR_REPO>
Parameter name
Description
Endpoint format
<MCC_CDN_BINARY>MOSK binary files such as Helm charts, deployment artifacts, release files, and so on.
https://binary.<private CDN domain suffix><MCC_CDN_DEBIAN>Ubuntu repository mirrors.
https://debian.<private CDN domain suffix><MCC_CDN_MCR_REPO>MCR Ubuntu repository.
https://mcr.<private CDN domain suffix><MCC_CDN_DOCKER>Docker reristry.
registry.<private CDN domain suffix>Wait until all
LCMMachineobjects of the management cluster complete theReady → Prepare → Deploy → Reconfigure → Readycycle:kubectl get lcmmachine -o wide
Wait until the
Clusterobject status switches back toReady:kubectl get cluster kaas-mgmt -o wide -w
Note
Once done, manually interrupt the above command.
Start
release-controllerto trigger the management cluster update:kubectl -n kaas scale deployment release-controller-release-controller --replicas 1
Warning
This action cannot be paused. Therefore, ensure that all preparation steps are completed before starting
release-controller.Proceed to the usual update procedure as described in Update to a major version or Update to a patch version.
Node maintenance API
This section describes internal implementation of the node maintenance API and how OpenStack and Tungsten Fabric controllers communicate with LCM and each other during a managed cluster update.
Node maintenance API objects
The node maintenance API consists of the following objects:
Cluster level:
ClusterWorkloadLockClusterMaintenanceRequest
Node level:
NodeWorkloadLockNodeMaintenanceRequest
WorkloadLock objects
The WorkloadLock objects are created by each Application Controller.
These objects prevent LCM from performing any changes on the cluster or node
level while the lock is in the active state. The inactive state of the lock
means that the Application Controller has finished its work and the LCM can
proceed with the node or cluster maintenance.
apiVersion: lcm.mirantis.com/v1alpha1
kind: ClusterWorkloadLock
metadata:
name: cluster-1-openstack
spec:
controllerName: openstack
status:
state: active # inactive;active;failed (default: active)
errorMessage: ""
release: "6.16.0+21.3"
apiVersion: lcm.mirantis.com/v1alpha1
kind: NodeWorkloadLock
metadata:
name: node-1-openstack
spec:
nodeName: node-1
controllerName: openstack
status:
state: active # inactive;active;failed (default: active)
errorMessage: ""
release: "6.16.0+21.3"
MaintenanceRequest objects
The MaintenanceRequest objects are created by LCM. These objects notify
Application Controllers about the upcoming maintenance of a cluster or
a specific node.
apiVersion: lcm.mirantis.com/v1alpha1
kind: ClusterMaintenanceRequest
metadata:
name: cluster-1
spec:
scope: drain # drain;os
apiVersion: lcm.mirantis.com/v1alpha1
kind: NodeMaintenanceRequest
metadata:
name: node-1
spec:
nodeName: node-1
scope: drain # drain;os
The scope parameter in the object specification defines the impact on
the managed cluster or node. The list of the available options include:
drainA regular managed cluster update. Each node in the cluster goes over a drain procedure. No node reboot takes place, a maximum impact includes restart of services on the node including Docker, which causes the restart of all containers present in the cluster.
osA node might be rebooted during the update. Triggers the workload evacuation by the OpenStack Controller (Rockoon).
When the MaintenanceRequest object is created, an Application Controller
executes a handler to prepare workloads for maintenance and put appropriate
WorkloadLock objects into the inactive state.
When maintenance is over, LCM removes MaintenanceRequest objects,
and the Application Controllers move their WorkloadLocks objects into
the active state.
OpenStack Controller maintenance API
When LCM creates the ClusterMaintenanceRequest object, the OpenStack
Controller (Rockoon) ensures that all OpenStack components are in the
Healthy state, which means that the pods are up and running, and the
readiness probes are passing.
ClusterMaintenanceRequest object creation flow
When LCM creates the NodeMaintenanceRequest, the OpenStack Controller:
Prepares components on the node for maintenance by removing
nova-computefrom scheduling.If the reboot of a node is possible, the instance migration workflow is triggered. The Operator can configure the instance migration flow through the Kubernetes node annotation and should define the required option before the managed cluster update. For configuration details, refer to Instance migration configuration for hosts.
Also, since MOSK 25.1, cloud users can mark their instances for LCM to handle them individually during host maintenance operations. This allows for greater flexibility during cluster updates, especially for workloads that are sensitive to live migration. For details, refer to Configure per-instance migration mode.
If the OpenStack Controller cannot migrate instances due to errors, it is suspended unless all instances are migrated manually or the
openstack.lcm.mirantis.com/instance_migration_modeannotation is set toskip.
NodeMaintenanceRequest object creation flow
When the node maintenance is over, LCM removes the NodeMaintenanceRequest
object and the OpenStack Controller:
Verifies that the Kubernetes Node becomes
Ready.Verifies that all OpenStack components on a given node are
Healthy, which means that the pods are up and running, and the readiness probes are passing.Ensures that the OpenStack components are connected to RabbitMQ. For example, the Neutron Agents become alive on the node, and compute instances are in the
UPstate.
Note
The OpenStack Controller enables you to have only one
nodeworkloadlock object at a time in the inactive state. Therefore,
the update process for nodes is sequential.
NodeMaintenanceRequest object removal flow
When the cluster maintenance is over, the OpenStack Controller sets the
ClusterWorkloadLock object to back active and the update completes.
CLusterMaintenanceRequest object removal flow
Tungsten Fabric Controller maintenance API
The Tungsten Fabric (TF) Controller creates and uses both types of
workloadlocks that include ClusterWorkloadLock and NodeWorkloadLock.
When the ClusterMaintenanceRequest object is created, the TF Controller
verifies the TF cluster health status and proceeds as follows:
If the cluster is
Ready, the TF Controller moves theClusterWorkloadLockobject to the inactive state.Otherwise, the TF Controller keeps the
ClusterWorkloadLockobject in the active state.
When the NodeMaintenanceRequest object is created, the TF Controller
verifies the vRouter pod state on the corresponding node and proceeds as
follows:
If all containers are
Ready, the TF Controller moves theNodeWorkloadLockobject to the inactive state.Otherwise, the TF Controller keeps the
NodeWorkloadLockin the active state.
Note
If there is a NodeWorkloadLock object in the inactive state
present in the cluster, the TF Controller does not process the
NodeMaintenanceRequest object for other nodes until this inactive
NodeWorkloadLock object becomes active.
When the cluster LCM removes the MaintenanceRequest object, the TF
Controller waits for the vRouter pods to become ready and proceeds as follows:
If all containers are in the
Readystate, the TF Controller moves theNodeWorkloadLockobject to the active state.Otherwise, the TF Controller keeps the
NodeWorkloadLockobject in the inactive state.
Cluster update flow
This section describes the MOSK cluster update flow to the product releases that contain major updates and require node reboot such as support for new Linux kernel, and similar.
The diagram below illustrates the sequence of operations controlled by
LCM and taking place during the update under the hood. We assume that the
ClusterWorkloadLock and NodeWrokloadLock objects present in the cluster
are in the active state before the cloud operator triggers the update.
See also
For details about the Application Controllers flow during different maintenance stages, refer to:
Phase 1: The Operator triggers the update
The Operator sets appropriate annotations on nodes and selects suitable migration mode for workloads.
The Operator triggers the managed cluster update through the Mirantis Container Cloud web UI as described in Step 2. Initiate MOSK cluster update.
LCM creates the
ClusterMaintenanceobject and notifies the application controllers about planned maintenance.
Phase 2: LCM triggers the OpenStack and Ceph update
The OpenStack update starts.
Ceph is waiting for the OpenStack
ClusterWorkloadLockobject to become inactive.When the OpenStack update is finalized, the OpenStack Controller marks
ClusterWorkloadLockas inactive.The Ceph Controller triggers an update of the Ceph cluster.
When the Ceph update is finalized, Ceph marks the
ClusterWorkloadLockobject as inactive.
Phase 3: LCM initiates the Kubernetes master nodes update
If a master node has collocated roles, LCM creates
NodeMainteananceRequestfor the node.All Application Controllers mark their
NodeWorkloadLockobjects for this node as inactive.LCM starts draining the node by gracefully moving out all pods from the node. The DaemonSet pods are not evacuated and left running.
LCM downloads the new version of the LCM Agent and runs its states.
Note
While running Ansible states, the services on the node may be restarted.
The above flow is applied to all Kubernetes master nodes one by one.
LCM removes
NodeMainteananceRequest.
Phase 4: LCM initiates the Kubernetes worker nodes update
LCM creates
NodeMaintenanceRequestfor the node with specifying scope.Application Controllers start preparing the node according to the scope.
LCM waits until all Application Controllers mark their
NodeWorkloadLockobjects for this node as inactive.All pods are evacuated from the node by draining it. This does not apply to the DaemonSet pods, which cannot be removed.
LCM downloads the new version of the LCM Agent and runs its states.
Note
While running Ansible states, the services on the node may be restarted.
The above flow is applied to all Kubernetes worker nodes one by one.
LCM removes
NodeMainteananceRequest.
Phase 5: Finalization
LCM triggers the update for all other applications present in the cluster, such as StackLight, Tungsten Fabric, and others.
LCM removes
ClusterMaintenanceRequest.
After a while the cluster update completes and becomes fully operable again.
Parallelizing node update operations
Available since MOSK 23.2 TechPreview
OpenStack Controller (Rockoon)
Since MOSK 25.1, the OpenStack Controller has been open-sourced under the name Rockoon and is maintained as an independent open-source project going forward.
As part of this transition, all openstack-controller pods are named
rockoon pods across the MOSK documentation and deployments. This change
does not affect functionality, but this is the reminder for the users to
utilize the new naming for pods and other related artifacts accordingly.
MOSK enables you to parallelize node update operations, significantly improving the efficiency of your deployment. This capability applies to any operation that utilizes the Node Maintenance API, such as cluster updates or graceful node reboots.
The core implementation of parallel updates is handled by the LCM Controller
ensuring seamless execution of parallel operations. LCM starts performing an
operation on the node only when all NodeWorkloadLock objects for the node
are marked as inactive. By default, the LCM Controller creates one
NodeMaintenanceRequest at a time.
Each application controller, including Ceph, OpenStack, and Tungsten Fabric
Controllers, manages parallel NodeMaintenanceRequest objects independently.
The controllers determine how to handle and execute parallel node maintenance
requests based on specific requirements of their respective applications.
To understand the workflow of the Node Maintenance API, refer to
WorkloadLock objects.
Enhancing parallelism during node updates
- Set the nodes update order.
You can optimize parallel updates by setting the order in which nodes are updated. You can accomplish this by configuring
upgradeIndexof theMachineobject. For the procedure, refer to Change the upgrade order of a machine.
- Increase parallelism.
Boost parallelism by adjusting the maximum number of worker node updates that are allowed during LCM operations using the
spec.providerSpec.value.maxWorkerUpgradeCountconfiguration parameter, which is set to1by default.For configuration details, refer to Configure the parallel update of worker nodes.
- Execute LCM operations.
Run LCM operations, such as cluster updates, taking advantage of the increased parallelism.
OpenStack nodes update
By default, the OpenStack Controller handles the NodeMaintenanceRequest
objects as follows:
Updates the OpenStack controller nodes sequentially (one by one).
Updates the gateway nodes sequentially. Technically, you can increase the number of gateway nodes upgrades allowed in parallel using the
nwl_parallel_max_gatewayparameter but Mirantis does not recommend to do so.Updates the compute nodes in parallel. The default number of allowed parallel updates is
30. You can adjust this value through thenwl_parallel_max_computeparameter.Parallelism considerations for compute nodes
When considering parallelism for compute nodes, take into account that during certain pod restarts, for example, the
openvswitch-vswitchdpods, a brief instance downtime may occur. Select a suitable level of parallelism to minimize the impact on workloads and prevent excessive load on the control plane nodes.If your cloud environment is distributed across failure domains, which are represented by Nova availability zones, you can limit the parallel updates of nodes to only those within the same availability zone. This behavior is controlled by the
respect_nova_azoption in the OpenStack Controller.
The OpenStack Controller configuration is stored in the
rockoon-config configMap of the osh-system namespace.
The options are picked up automatically after update. To learn more about
the OpenStack Controller (Rockoon) configuration parameters,
refer to OpenStack Controller configuration.
Ceph nodes update
By default, the Ceph Controller handles the NodeMaintenanceRequest
objects as follows:
Updates the non-storage nodes sequentially. Non-storage nodes include all nodes that have
mon,mgr,rgw, ormdsroles.Updates storage nodes in parallel. The default number of allowed parallel updates is calculated automatically based on the minimal failure domain in a Ceph cluster.
Parallelism calculations for storage nodes
The Ceph Controller automatically calculates the parallelism number in the following way:
Finds the minimal failure domain for a Ceph cluster. For example, the minimal failure domain is
rack.Filters all currently requested nodes by minimal failure domain. For example, parallelism equals to 5, and LCM requests 3 nodes from the
rack1rack and 2 nodes from therack2rack.Handles each filtered node group one by one. For example, the controller handles in parallel all nodes from
rack1before processing nodes fromrack2.
The Ceph Controller handles non-storage nodes before the storage ones. If there are node requests for both node types, the Ceph Controller handles sequentially the non-storage nodes first. Therefore, Mirantis recommends setting the upgrade index of a higher priority for the non-storage nodes to decrease the total upgrade time.
If the minimal failure domain is host, the Ceph Controller updates only
one storage node per failure domain unit. This results in updating all Ceph
nodes sequentially, despite the potential for increased parallelism.
Tungsten Fabric nodes update
By default, the Tungsten Fabric Controller handles the
NodeMaintenanceRequest objects as follows:
Updates the Tungsten Fabric Controller and gateway nodes sequentially.
Updates the vRouter nodes in parallel. The Tungsten Fabric Controller allows updating up to 30 vRouter nodes in parallel.
Maximum amount of vRouter nodes in maintenance
While the Tungsten Fabric Controller has the capability to process up to 30
NodeMaintenanceRequestobjects targeted to vRouter nodes, the actual amount may be lower. This is due to a check that ensures OpenStack readiness to unlock the relevant nodes for maintenance. If OpenStack allows for maintenance, the Tungsten Fabric Controller verifies the vRouter pods. Upon successful verification, theNodeWorkloadLockobject is switched to the maintenance mode.
Deployment Guide
Mirantis OpenStack for Kubernetes (MOSK) enables the operator to create, scale, update, and upgrade OpenStack deployments on Kubernetes through a declarative API.
The Kubernetes built-in features, such as flexibility, scalability, and declarative resource definition make MOSK a robust solution.
Plan the deployment
The detailed plan of any Mirantis OpenStack for Kubernetes (MOSK) deployment is determined on a per-cloud basis. For the MOSK reference architecture and design overview, see Reference Architecture.
Also, read through Bare metal components as a MOSK cluster is deployed on top of a bare metal management cluster.
Note
One of the industry best practices is to verify every new update or configuration change in a non-customer-facing environment before applying it to production. Therefore, Mirantis recommends having a staging cloud, deployed and maintained along with the production clouds. The recommendation is especially applicable to the environments that:
Receive updates often and use continuous delivery. For example, any non-isolated deployment of Mirantis Container Cloud.
Have significant deviations from the reference architecture or third party extensions installed.
Are managed under the Mirantis OpsCare program.
Run business-critical workloads where even the slightest application downtime is unacceptable.
A typical staging cloud is a complete copy of the production environment including the hardware and software configurations, but with a bare minimum of compute and storage capacity.
Provision and deploy a management cluster
The bare metal management system enables the Infrastructure Operator to deploy a Container Cloud management cluster on a set of bare metal servers. It also enables Container Cloud to deploy MOSK clusters on bare metal servers without a pre-provisioned operating system.
This section instructs you on how to provision and deploy a Container Cloud management cluster.
Deploy a management cluster
Note
The deprecated bootstrap procedure using Bootstrap v1 was removed for the sake of Bootstrap v2 in Container Cloud 2.26.0.
Introduction
Mirantis Container Cloud Bootstrap v2 provides best user experience to set up Container Cloud. Using Bootstrap v2, you can provision and operate management clusters using required objects through the Container Cloud API.
Basic concepts and components of Bootstrap v2 include:
- Bootstrap cluster
Bootstrap cluster is any kind-based Kubernetes cluster that contains a minimal set of Container Cloud bootstrap components allowing the user to prepare the configuration for management cluster deployment and start the deployment. The list of these components includes:
- Bootstrap Controller
Controller that is responsible for:
Configuration of a bootstrap cluster with provider charts through the bootstrap Helm bundle.
Configuration and deployment of a management cluster and its related objects.
- Helm Controller
Operator that manages Helm chart releases. It installs the Container Cloud bootstrap and provider charts configured in the bootstrap Helm bundle.
- Public API charts
Helm charts that contain custom resource definitions for Container Cloud resources.
- Admission Controller
Controller that performs mutations and validations for the Container Cloud resources including cluster and machines configuration.
Currently one bootstrap cluster can be used for deployment of only one management cluster. For example, to add a new management cluster with different settings, a new bootstrap cluster must be created from scratch.
- Bootstrap region
BootstrapRegionis the first object to create in the bootstrap cluster for the Bootstrap Controller to identify and install provider components onto the bootstrap cluster. After, the user can prepare and deploy a management cluster with related resources.The bootstrap region is a starting point for the cluster deployment. The user needs to approve the
BootstrapRegionobject. Otherwise, the Bootstrap Controller will not be triggered for the cluster deployment.
- Bootstrap Helm bundle
Helm bundle that contains charts configuration for the bootstrap cluster. This object is managed by the Bootstrap Controller that updates the provider bundle in the
BootstrapRegionobject. The Bootstrap Controller always configures provider charts listed in theregionalsection of the Container Cloud release for the provider. Depending on the cluster configuration, the Bootstrap Controller may update or reconfigure this bundle even after the cluster deployment starts. For example, the Bootstrap Controller enables the provider in the bootstrap cluster only after the bootstrap region is approved for the deployment.
Overview of the deployment workflow
Management cluster deployment consists of several sequential stages. Each stage finishes when a specific condition is met or specific configuration applies to a cluster or its machines.
In case of issues at any deployment stage, you can identify the problem
and adjust it on the fly. The cluster deployment does not abort until all
stages complete by means of the infinite-timeout option enabled
by default in Bootstrap v2.
Infinite timeout prevents the bootstrap failure due to timeout. This option is useful in the following cases:
The network speed is slow for artifacts downloading
The infrastructure configuration does not allow fast booting
The inspection of a bare-metal node presupposes more than two HDDSATA disks to attach to a machine
You can track the status of each stage in the bootstrapStatus section of
the Cluster object that is updated by the Bootstrap Controller.
The Bootstrap Controller starts deploying the cluster after you approve the
BootstrapRegion configuration.
The following table describes deployment states of a management cluster that apply in the strict order.
Step |
State |
Description |
|---|---|---|
1 |
|
Verifies proxy configuration in the |
2 |
|
Verifies SSH configuration for the cluster and machines. You can provide any number of SSH public keys, which are added to
cluster machines. But the Bootstrap Controller always adds the
The |
3 |
|
Synchronizes the provider and settings of its components between the
|
4 |
|
Enables the provider and its components if any were disabled by the Bootstrap Controller during preparation of the bootstrap region. A cluster and machines deployment starts after the provider enablement. |
5 |
Nodes readiness |
Waits for the provider to complete nodes deployment that comprises VMs creation and MKE installation. When controlled provisioning is enabled, machines require an approval from an operator during provisioning and deployment phases. For details, see Controlled bare metal provisioning workflows. |
6 |
|
Creates required namespaces and IAM secrets. |
7 |
|
Verifies the provider configuration in the provisioned cluster. |
8 |
|
Verifies the Helm bundle readiness for the provisioned cluster. |
9 |
|
Collects the list of deployment controllers and disables them to prepare for pivot. |
10 |
|
Moves all cluster-related objects from the bootstrap cluster to the
provisioned cluster. The copies of |
11 |
|
Enables controllers in the provisioned cluster. |
12 |
|
Updates the |
13 |
|
Disables the Helm Controller before reconfiguration. |
14 |
|
Updates the Helm Controller configuration for the provisioned cluster. |
15 |
Cluster readiness |
Contains information about the global cluster status. The Bootstrap Controller verifies that OIDC, Helm releases, and all Deployments are ready. Once the cluster is ready, the Bootstrap Controller stops managing the cluster. |
Controlled bare metal provisioning workflows
Available since MCC 2.30.0 (Cluster releases 21.0.0 and 20.0.0)
This section describes the controlled provisioning workflows that enable operators to have manual control over bare metal host provisioning and deployment phases. This feature allows verification of hardware inventory and configuration before proceeding with each deployment phase.
The controlled provisioning workflow comprises the following fields in the
Machine specification:
day1Provisioning- controls the start of bare metal host provisioningday1Deployment- controls the start of bare metal host deployment after provisioning
Both fields support the following values:
manual(default) - requires an explicit operator approval to proceedauto- enables provisioning workflow that occurs either automatically from the start or manually after inspection and approval by an operator.
When using manual control, machines enter the following waiting states:
AwaitsProvisioning- hardware is inspected, waiting for provisioning approvalAwaitsDeployment- provisioning complete, waiting for deployment approval
This workflow enables operators to complete the following tasks:
Verify that the discovered hardware inventory matches specifications
Validate disk layout and network configuration after provisioning
Correct configuration issues before proceeding to the next phase
Test representative machines before scaling to all machines in a group
The controlled provisioning workflow supports the following deployment scenarios.
Use this workflow when deploying a new management cluster where hardware verification is critical:
Create all cluster-related objects (
BareMetalHostInventory,BareMetalHostProfile, andMachine).Wait for bare metal hosts to switch to the
availablestate and machines to theAwaitsProvisioningstate.Review hardware inventory after inspection completes. If hardware inventory is valid, proceed to the next step. If a machine configuration is broken or invalid:
Delete the affected
Machineobject to initiate deprovisioning.Wait for the corresponding bare metal host cleanup and deprovision to complete.
Adjust the related
BareMetalHostProfileobject or create a new one with updated configuration.Recreate the
Machineobject and repeat the procedure from the step 2.
Approve the
BootstrapRegionobject to automatically setday1Provisioning: autofor all machines.Approve deployment for all machines by setting
day1Deployment: autofor all machines.
Note
Deployment starts after you add three controller nodes required for a management cluster.
Use this workflow when deploying a new MOSK cluster:
Create all cluster-related objects grouped by hardware type and role.
Wait for bare metal hosts to switch to the
availablestate and machines to theAwaitsProvisioningstate.Review hardware inventory. If it is valid, proceed to the next step. If a machine configuration is invalid:
Delete the affected
Machineobject to initiate deprovisioning.Wait for the corresponding bare metal host cleanup and deprovision to complete.
Adjust the related
BareMetalHostProfileobject or create a new one with updated configuration.Recreate the
Machineobject and repeat from the step 2.
Approve provisioning for one representative machine per group.
Validate provisioned configuration of representative machines. If it is valid, proceed to the next step. If it is invalid:
Delete the affected
Machineobject to initiate deprovisioning.Wait for the corresponding bare metal host cleanup and deprovision to complete.
Adjust the related
BareMetalHostProfileobject with updated provisioning configuration.Recreate the
Machineobject and repeat the procedure from the step 4.
Scale the provisioning approval to remaining machines in each group.
Approve deployment for all validated machines.
Note
Deployment starts when you add minimum 3 controller nodes and 2 worker nodes with corresponding resources for Ceph and StackLight.
Use this workflow when adding new nodes to an existing MOSK cluster with known hardware specifications:
Create
Machineobjects for new nodes.Wait for bare metal hosts to switch to the
availablestate and machines to theAwaitsProvisioningstate.Review hardware inventory and validate it against existing
BareMetalHostProfileobjects. If the inventory matches the existing objects, proceed to the next step. If it is invalid:Delete the affected
Machineobject to initiate deprovisioning.Wait for the corresponding bare metal host cleanup and deprovision to complete.
Adjust the related
BareMetalHostProfileobject with updated provisioning configuration or create a new one.Recreate the
Machineobject and repeat the procedure from the step 2.
Approve provisioning for one test machine.
Validate that the provisioned configuration of the test machine matches the configuration on existing cluster nodes. If it matches, proceed to the next step. If it does not match:
Delete the affected
Machineobject to initiate deprovisioning.Wait for the corresponding bare metal host cleanup and deprovision to complete.
Adjust the related
BareMetalHostProfileobject with updated provisioning configuration.Recreate the
Machineobject and repeat the procedure from the step 4.
Scale provisioning and deployment approval to remaining new machines, if any.
Set up a bootstrap cluster
The setup of a bootstrap cluster comprises preparation of the seed node, configuration of environment variables, acquisition of the Container Cloud license file, and execution of the bootstrap script.
To set up a bootstrap cluster:
Prepare the seed node:
Verify that the hardware allocated for the installation meets the minimal requirements described in Requirements.
Install basic Ubuntu 24.04 server using standard installation images of the operating system on the bare metal seed node.
Log in to the seed node that is running Ubuntu 24.04.
Configure the operating system and network:
Operating system and network configuration
Establish a virtual bridge using an IP address of the PXE network on the seed node. Use the following
netplan-based configuration file as an example:# cat /etc/netplan/config.yaml network: version: 2 renderer: networkd ethernets: ens3: dhcp4: false dhcp6: false bridges: br0: addresses: # Replace with IP address from PXE network to create a virtual bridge - 10.0.0.15/24 dhcp4: false dhcp6: false # Adjust for your environment gateway4: 10.0.0.1 interfaces: # Interface name may be different in your environment - ens3 nameservers: addresses: # Adjust for your environment - 8.8.8.8 parameters: forward-delay: 4 stp: false
Apply the new network configuration using
netplan:sudo netplan apply
Verify the new network configuration:
sudo apt update && sudo apt install -y bridge-utils sudo brctl show
Example of system response:
bridge name bridge id STP enabled interfaces br0 8000.fa163e72f146 no ens3
Verify that the interface connected to the PXE network belongs to the previously configured bridge.
Install the current Docker version available for Ubuntu 22.04:
sudo apt-get update sudo apt-get install docker.io
Verify that your logged
USERhas access to the Docker daemon:sudo usermod -aG docker $USER
Verify that the
br_netfilterkernel module is loaded:grep -q br_netfilter /proc/modules || sudo modprobe br_netfilter
Log out and log in again to the seed node to apply the changes.
Verify that Docker is configured correctly and has access to Container Cloud CDN. For example:
docker run --rm alpine sh -c "apk add --no-cache curl; \ curl https://binary.mirantis.com"
The system output must contain a
jsonfile with no error messages. In case of errors, follow the steps provided in Troubleshoot the bootstrap node configuration.Note
If you require all Internet access to go through a proxy server for security and audit purposes, configure Docker proxy settings as described in the official Docker documentation.
To verify that Docker is configured correctly and has access to Container Cloud CDN:
docker run --rm alpine sh -c "export http_proxy=http://<proxy_ip:proxy_port>; \ sed -i ‘s/https/http/g' /etc/apk/repositories; \ apk add --no-cache wget ; \ wget http://binary.mirantis.com; \ cat index.html
Verify that the seed node has direct access to the Baseboard Management Controller (BMC) of each bare metal host. All target hardware nodes must be in the
power offstate.For example, using the IPMI tool:
apt install ipmitool ipmitool -I lanplus -H 'IPMI IP' -U 'IPMI Login' -P 'IPMI password' \ chassis power status
Example of system response:
Chassis Power is off
Prepare the bootstrap script:
Download and run the Container Cloud bootstrap script:
sudo apt-get update sudo apt-get install wget wget https://binary.mirantis.com/releases/get_container_cloud.sh chmod 0755 get_container_cloud.sh ./get_container_cloud.sh
Change the directory to the
kaas-bootstrapfolder created by the script.
Obtain a Container Cloud license file required for the bootstrap:
Obtain a Container Cloud license
Select from the following options:
Open the email from support@mirantis.com with the subject Mirantis Container Cloud License File or Mirantis OpenStack License File
In the Mirantis CloudCare Portal, open the Account or Cloud page
Download the License File and save it as
mirantis.licunder thekaas-bootstrapdirectory on the bootstrap node.Verify that
mirantis.liccontains the previously downloaded Container Cloud license by decoding the license JWT token, for example, using jwt.io.Example of a valid decoded Container Cloud license data with the mandatory
licensefield:{ "exp": 1652304773, "iat": 1636669973, "sub": "demo", "license": { "dev": false, "limits": { "clusters": 10, "workers_per_cluster": 10 }, "openstack": null } }
Warning
The MKE license does not apply to
mirantis.lic. For details about MKE license, see MKE documentation.Export mandatory parameters:
Bare metal network mandatory parameters
Export the following mandatory parameters using the commands and table below:
export KAAS_BM_ENABLED="true" # export KAAS_BM_PXE_IP="172.16.59.5" export KAAS_BM_PXE_MASK="24" export KAAS_BM_PXE_BRIDGE="br0"
Bare metal prerequisites data¶ Parameter
Description
Example value
KAAS_BM_PXE_IPThe provisioning IP address in the PXE network. This address will be assigned on the seed node to the interface defined by the
KAAS_BM_PXE_BRIDGEparameter described below. The PXE service of the bootstrap cluster uses this address to network boot bare metal hosts.172.16.59.5KAAS_BM_PXE_MASKThe PXE network address prefix length to be used with the
KAAS_BM_PXE_IPaddress when assigning it to the seed node interface.24KAAS_BM_PXE_BRIDGEThe PXE network bridge name that must match the name of the bridge created on the seed node during preparation of the system and network configuration described earlier in this procedure.
br0Optional. Configure proxy settings to bootstrap the cluster using proxy:
Proxy configuration
Add the following environment variables:
HTTP_PROXYHTTPS_PROXYNO_PROXYPROXY_CA_CERTIFICATE_PATH
Example snippet:
export HTTP_PROXY=http://proxy.example.com:3128 export HTTPS_PROXY=http://user:pass@proxy.example.com:3128 export NO_PROXY=172.18.10.0,registry.internal.lan export PROXY_CA_CERTIFICATE_PATH="/home/ubuntu/.mitmproxy/mitmproxy-ca-cert.cer"
The following formats of variables are accepted:
Proxy configuration data¶ Variable
Format
HTTP_PROXYHTTPS_PROXYhttp://proxy.example.com:port- for anonymous access.http://user:password@proxy.example.com:port- for restricted access.
NO_PROXYComma-separated list of IP addresses or domain names.
PROXY_CA_CERTIFICATE_PATHOptional. Absolute path to the proxy CA certificate for man-in-the-middle (MITM) proxies. Must be placed on the bootstrap node to be trusted. For details, see Install a CA certificate for a MITM proxy on a bootstrap node.
Warning
If you require Internet access to go through a MITM proxy, ensure that the proxy has streaming enabled as described in Enable streaming for MITM.
For implementation details, see Proxy support and cache of artifacts.
After the bootstrap cluster is set up, the
bootstrap-proxyobject is created with the provided proxy settings. You can use this object later for theClusterobject configuration.Deploy the bootstrap cluster:
./bootstrap.sh bootstrapv2Make sure that port 80 is open for
localhostto prevent security requirements for the seed node:Note
Kind uses port mapping for the master node.
telnet localhost 80
Example of a positive system response:
Connected to localhost.
Example of a negative system response:
telnet: connect to address ::1: Connection refused telnet: Unable to connect to remote host
To open port 80:
iptables -A INPUT -p tcp --dport 80 -j ACCEPT
Deploy a management cluster
This section contains an overview of the cluster-related objects along with the configuration procedure of these objects during deployment of a management cluster using Bootstrap v2 through the Container Cloud API.
The following procedure describes how to prepare and deploy a management
cluster using Bootstrap v2 by operating YAML templates available in the
kaas-bootstrap/templates/ folder.
To deploy a management cluster using CLI:
Export
kubeconfigof the kind cluster:export KUBECONFIG=<pathToKindKubeconfig>
By default,
<pathToKindKubeconfig>is$HOME/.kube/kind-config-clusterapi.Navigate to
kaas-bootstrap/templates/bm.Warning
The kubectl apply command automatically saves the applied data as plain text into the
kubectl.kubernetes.io/last-applied-configurationannotation of the corresponding object. This may result in revealing sensitive data in this annotation when creating or modifying objects containing credentials. Such Container Cloud objects include:BareMetalHostCredentialClusterOIDCConfiguration
LicenseProxy
ServiceUserTLSConfig
Therefore, do not use kubectl apply on these objects. Use kubectl create, kubectl patch, or kubectl edit instead.
If you used kubectl apply on these objects, you can remove the
kubectl.kubernetes.io/last-applied-configurationannotation from the objects using kubectl edit.Create the
BootstrapRegionobject by modifyingbootstrapregion.yaml.template.Configuration of bootstrapregion.yaml.template
Set
provider: baremetaland use the default<regionName>, which isregion-one.apiVersion: kaas.mirantis.com/v1alpha1 kind: BootstrapRegion metadata: name: region-one namespace: default spec: provider: baremetal
Create the object:
./kaas-bootstrap/bin/kubectl create -f \ kaas-bootstrap/templates/bm/bootstrapregion.yaml.template
Note
In the following steps, apply the changes to objects using the commands below with the required template name:
./kaas-bootstrap/bin/kubectl create -f \ kaas-bootstrap/templates/bm/<templateName>.yaml.template
Create the
ServiceUserobject by modifyingserviceusers.yaml.template.Configuration of serviceusers.yaml.template
Service user is the initial user to create in Keycloak for access to a newly deployed management cluster. By default, it has the
global-admin,operator(namespaced), andbm-pool-operator(namespaced) roles.You can delete
serviceuserafter setting up other required users with specific roles or after any integration with an external identity provider, such as LDAP.apiVersion: kaas.mirantis.com/v1alpha1 kind: ServiceUserList items: - apiVersion: kaas.mirantis.com/v1alpha1 kind: ServiceUser metadata: name: <USERNAME> spec: password: value: <PASSWORD>
Optional. Prepare any number of additional SSH keys using the following example:
apiVersion: kaas.mirantis.com/v1alpha1 kind: PublicKey metadata: name: <SSHKeyName> namespace: default spec: publicKey: | <insert your public key here>
Optional. Add the
Proxyobject using the example below:apiVersion: kaas.mirantis.com/v1alpha1 kind: Proxy metadata: name: <proxyName> namespace: default spec: ...
Inspect the default bare metal host profile definition in
baremetalhostprofiles.yaml.templateand adjust it to fit your hardware configuration. For details, see Customize the default bare metal host profile.Warning
All data will be wiped during cluster deployment on devices defined directly or indirectly in the
fileSystemslist ofBareMetalHostProfile. For example:A raw device partition with a file system on it
A device partition in a volume group with a logical volume that has a file system on it
An mdadm RAID device with a file system on it
An LVM RAID device with a file system on it
The
wipefield is always consideredtruefor these devices. Thefalsevalue is ignored.Therefore, to prevent data loss, move the necessary data from these file systems to another server beforehand, if required.
In
baremetalhosts.yaml.template, update the bare metal host definitions according to your environment configuration. Use the reference table below to manually set all parameters that start withSET_.Mandatory parameters for a bare metal host template
Parameter
Description
Example value
SET_MACHINE_0_IPMI_USERNAMEThe IPMI user name to access the BMC. 0
userSET_MACHINE_0_IPMI_PASSWORDThe IPMI password to access the BMC. 0
passwordSET_MACHINE_0_MACThe MAC address of the first master node in the PXE network.
ac:1f:6b:02:84:71SET_MACHINE_0_BMC_ADDRESSThe IP address of the BMC endpoint for the first master node in the cluster. Must be an address from the OOB network that is accessible through the management network gateway.
192.168.100.11SET_MACHINE_1_IPMI_USERNAMEThe IPMI user name to access the BMC. 0
userSET_MACHINE_1_IPMI_PASSWORDThe IPMI password to access the BMC. 0
passwordSET_MACHINE_1_MACThe MAC address of the second master node in the PXE network.
ac:1f:6b:02:84:72SET_MACHINE_1_BMC_ADDRESSThe IP address of the BMC endpoint for the second master node in the cluster. Must be an address from the OOB network that is accessible through the management network gateway.
192.168.100.12SET_MACHINE_2_IPMI_USERNAMEThe IPMI user name to access the BMC. 0
userSET_MACHINE_2_IPMI_PASSWORDThe IPMI password to access the BMC. 0
passwordSET_MACHINE_2_MACThe MAC address of the third master node in the PXE network.
ac:1f:6b:02:84:73SET_MACHINE_2_BMC_ADDRESSThe IP address of the BMC endpoint for the third master node in the cluster. Must be an address from the OOB network that is accessible through the management network gateway.
192.168.100.13Configure cluster network:
Important
Bootstrap V2 supports only separated PXE and LCM networks.
Note
Since Container Cloud 2.30.0 (Cluster releases 21.0.0 and 20.0.0), management cluster supports full L3 networking topology in the Technology Preview scope. This enables deployment of management cluster nodes in dedicated racks without the need for L2 layer extension between them.
Note
When BGP mode is used for announcement of IP addresses of load-balanced services and for the cluster API VIP, three BGP sessions are created for every node of a management cluster:
Two sessions are created by MetalLB for public and provisioning services
One session is created by the
birdBGP daemon for the cluster API VIP
BGP only allows one session to be established per a pair of endpoints. For details, see MetalLB documentation: Issues with Calico. To solve this issue, different methods can be used. MOSK allows configuring three networks for a management cluster: provisioning, management, and external. In this case, configure MetalLB to use provisioning and external networks, and BIRD to use the management network.
If you configure BGP announcement of the load-balancer IP address for a management cluster API and for load-balanced services of the cluster using three networks, you can use the following example IPAM objects instead of the default
ipam-objects.yaml.templatefile.Example template with IPAM objects for a management cluster that uses BGP announcements and 3 networks
Substitute the default
ipam-objects.yaml.templatefile with the one that you create using the following example template:--- # This template allows you to configure networking for servers of the management cluster. # Network configuration requires the following resources: # Management cluster occupies rack1, rack2, rack3 # BGP announcement of cluster API LB & k8s services LBs is configured for management cluster. # MOSK cluster occupies rack1, rack2, rack3: one master node per rack, one or more workers in each rack. # BGP announcement of cluster API LB & k8s services LBs is configured for MOSK cluster. {# ==================== Define PXE subnet(s) ================================ #} apiVersion: "ipam.mirantis.com/v1alpha1" kind: Subnet metadata: name: k8s-pxe-nics-rack1 namespace: default labels: kaas.mirantis.com/provider: baremetal cluster.sigs.k8s.io/cluster-name: kaas-mgmt ipam/SVC-pxe-nics: "rack1" spec: cidr: SET_PXE_RACK1_CIDR gateway: SET_PXE_RACK1_GW includeRanges: - SET_PXE_RACK1_RANGE --- apiVersion: "ipam.mirantis.com/v1alpha1" kind: Subnet metadata: name: k8s-pxe-nics-rack2 namespace: default labels: kaas.mirantis.com/provider: baremetal cluster.sigs.k8s.io/cluster-name: kaas-mgmt ipam/SVC-pxe-nics: "rack2" spec: cidr: SET_PXE_RACK2_CIDR gateway: SET_PXE_RACK2_GW includeRanges: - SET_PXE_RACK2_RANGE --- apiVersion: "ipam.mirantis.com/v1alpha1" kind: Subnet metadata: name: k8s-pxe-nics-rack3 namespace: default labels: kaas.mirantis.com/provider: baremetal cluster.sigs.k8s.io/cluster-name: kaas-mgmt ipam/SVC-pxe-nics: "rack3" spec: cidr: SET_PXE_RACK3_CIDR gateway: SET_PXE_RACK3_GW includeRanges: - SET_PXE_RACK3_RANGE {# ==================== End PXE subnet(s) =================================== #} {# ==================== Define DHCP subnet(s) =============================== #} --- apiVersion: "ipam.mirantis.com/v1alpha1" kind: Subnet metadata: name: k8s-pxe-dhcp-rack1 namespace: default labels: kaas.mirantis.com/provider: baremetal ipam/SVC-dhcp-range: "rack1" spec: cidr: SET_DHCP_RACK1_CIDR gateway: SET_DHCP_RACK1_GW includeRanges: - SET_DHCP_RACK1_RANGE --- apiVersion: "ipam.mirantis.com/v1alpha1" kind: Subnet metadata: name: k8s-pxe-dhcp-rack2 namespace: default labels: kaas.mirantis.com/provider: baremetal ipam/SVC-dhcp-range: "rack2" spec: cidr: SET_DHCP_RACK2_CIDR gateway: SET_DHCP_RACK2_GW includeRanges: - SET_DHCP_RACK2_RANGE --- apiVersion: "ipam.mirantis.com/v1alpha1" kind: Subnet metadata: name: k8s-pxe-dhcp-rack3 namespace: default labels: kaas.mirantis.com/provider: baremetal ipam/SVC-dhcp-range: "rack3" spec: cidr: SET_DHCP_RACK3_CIDR gateway: SET_DHCP_RACK3_GW includeRanges: - SET_DHCP_RACK3_RANGE {# ==================== End DHCP subnet(s) ================================== #} {# ==================== Define LCM subnet(s) ================================ #} --- apiVersion: "ipam.mirantis.com/v1alpha1" kind: Subnet metadata: name: k8s-lcm-rack1 namespace: default labels: kaas.mirantis.com/provider: baremetal cluster.sigs.k8s.io/cluster-name: kaas-mgmt ipam/SVC-k8s-lcm: "rack1" spec: cidr: SET_LCM_RACK1_CIDR gateway: SET_LCM_RACK1_GW includeRanges: - SET_LCM_RACK1_RANGE --- apiVersion: "ipam.mirantis.com/v1alpha1" kind: Subnet metadata: name: k8s-lcm-rack2 namespace: default labels: kaas.mirantis.com/provider: baremetal cluster.sigs.k8s.io/cluster-name: kaas-mgmt ipam/SVC-k8s-lcm: "rack2" spec: cidr: SET_LCM_RACK2_CIDR gateway: SET_LCM_RACK2_GW includeRanges: - SET_LCM_RACK2_RANGE --- apiVersion: "ipam.mirantis.com/v1alpha1" kind: Subnet metadata: name: k8s-lcm-rack3 namespace: default labels: kaas.mirantis.com/provider: baremetal cluster.sigs.k8s.io/cluster-name: kaas-mgmt ipam/SVC-k8s-lcm: "rack3" spec: cidr: SET_LCM_RACK3_CIDR gateway: SET_LCM_RACK3_GW includeRanges: - SET_LCM_RACK3_RANGE {# ==================== End LCM subnet(s) =================================== #} {# ==================== Define EXT subnet(s) ================================ #} --- apiVersion: "ipam.mirantis.com/v1alpha1" kind: Subnet metadata: name: mgmt-k8s-ext-rack1 namespace: default labels: kaas.mirantis.com/provider: baremetal cluster.sigs.k8s.io/cluster-name: kaas-mgmt multirack-mgmt-ext-subnet: "rack1" spec: cidr: SET_EXT_RACK1_CIDR gateway: SET_EXT_RACK1_GW includeRanges: - SET_EXT_RACK1_RANGE nameservers: - SET_EXT_RACK1_NS --- apiVersion: "ipam.mirantis.com/v1alpha1" kind: Subnet metadata: name: mgmt-k8s-ext-rack2 namespace: default labels: kaas.mirantis.com/provider: baremetal cluster.sigs.k8s.io/cluster-name: kaas-mgmt multirack-mgmt-ext-subnet: "rack2" spec: cidr: SET_EXT_RACK2_CIDR gateway: SET_EXT_RACK2_GW includeRanges: - SET_EXT_RACK2_RANGE nameservers: - SET_EXT_RACK2_NS --- apiVersion: "ipam.mirantis.com/v1alpha1" kind: Subnet metadata: name: mgmt-k8s-ext-rack3 namespace: default labels: kaas.mirantis.com/provider: baremetal cluster.sigs.k8s.io/cluster-name: kaas-mgmt multirack-mgmt-ext-subnet: "rack3" spec: cidr: SET_EXT_RACK3_CIDR gateway: SET_EXT_RACK3_GW includeRanges: - SET_EXT_RACK3_RANGE nameservers: - SET_EXT_RACK3_NS {# ==================== End EXT subnet(s) =================================== #} {# ==================== Define LoadBalancer IP(s) =========================== #} --- apiVersion: "ipam.mirantis.com/v1alpha1" kind: Subnet metadata: name: k8s-api-lb namespace: default labels: kaas.mirantis.com/provider: baremetal cluster.sigs.k8s.io/cluster-name: kaas-mgmt ipam/SVC-LBhost: "presents" spec: cidr: SET_LB_HOST/32 useWholeCidr: true {# ==================== End LoadBalancer IP(s) ============================== #} {# ========================= Define Rack/MultiRack ======================== #} --- apiVersion: ipam.mirantis.com/v1alpha1 kind: MultiRackCluster metadata: labels: kaas.mirantis.com/provider: baremetal cluster.sigs.k8s.io/cluster-name: kaas-mgmt name: kaas-mgmt namespace: default spec: bgpdConfigFilePath: "/etc/bird" bgpdConfigFileName: "bird.conf" bgpdConfigTemplate: "# Default BGP daemon configuration file for a cluster" --- apiVersion: ipam.mirantis.com/v1alpha1 kind: Rack metadata: labels: kaas.mirantis.com/provider: baremetal cluster.sigs.k8s.io/cluster-name: kaas-mgmt rack-id: rack1 name: rack1 namespace: default {%- raw %} spec: bgpdConfigTemplate: | protocol device { } # protocol direct { interface "lo"; ipv4; } # protocol kernel { ipv4 { export all; }; } # protocol bgp bgp_lcm { local port SET_BGP_LCM_LOCAL_PORT as SET_BGP_LCM_LOCAL_ASN; neighbor SET_BGP_LCM_RACK1_PEER_IP as SET_BGP_LCM_RACK1_PEER_ASN; ipv4 { import none; export filter { if dest = RTD_UNREACHABLE then { reject; } accept; }; }; } {%- endraw %} --- apiVersion: ipam.mirantis.com/v1alpha1 kind: Rack metadata: labels: kaas.mirantis.com/provider: baremetal cluster.sigs.k8s.io/cluster-name: kaas-mgmt rack-id: rack2 name: rack2 namespace: default {%- raw %} spec: bgpdConfigTemplate: | protocol device { } # protocol direct { interface "lo"; ipv4; } # protocol kernel { ipv4 { export all; }; } # protocol bgp bgp_lcm { local port SET_BGP_LCM_LOCAL_PORT as SET_BGP_LCM_LOCAL_ASN; neighbor SET_BGP_LCM_RACK2_PEER_IP as SET_BGP_LCM_RACK2_PEER_ASN; ipv4 { import none; export filter { if dest = RTD_UNREACHABLE then { reject; } accept; }; }; } {%- endraw %} --- apiVersion: ipam.mirantis.com/v1alpha1 kind: Rack metadata: labels: kaas.mirantis.com/provider: baremetal cluster.sigs.k8s.io/cluster-name: kaas-mgmt rack-id: rack3 name: rack3 namespace: default {%- raw %} spec: bgpdConfigTemplate: | protocol device { } # protocol direct { interface "lo"; ipv4; } # protocol kernel { ipv4 { export all; }; } # protocol bgp bgp_lcm { local port SET_BGP_LCM_LOCAL_PORT as SET_BGP_LCM_LOCAL_ASN; neighbor SET_BGP_LCM_RACK3_PEER_IP as SET_BGP_LCM_RACK3_PEER_ASN; ipv4 { import none; export filter { if dest = RTD_UNREACHABLE then { reject; } accept; }; }; } {%- endraw %} {# ========================= End Rack / MultiRack ======================== #} {# ==================== Define L2Template object(s) ========================= #} --- apiVersion: ipam.mirantis.com/v1alpha1 kind: L2Template metadata: name: "mgmt-rack1" namespace: default labels: kaas.mirantis.com/provider: baremetal cluster.sigs.k8s.io/cluster-name: kaas-mgmt l2template-mgmt-rack1: "presents" # to be used in Machine's L2templateSelector spec: autoIfMappingPrio: - provision - eno - ens - enp l3Layout: - scope: namespace subnetName: k8s-pxe-nics-rack1 - scope: namespace subnetName: k8s-pxe-nics-rack2 - scope: namespace subnetName: k8s-pxe-nics-rack3 - scope: namespace subnetName: k8s-lcm-rack1 - scope: namespace subnetName: k8s-lcm-rack2 - scope: namespace subnetName: k8s-lcm-rack3 - scope: namespace subnetName: mgmt-k8s-ext-rack1 npTemplate: | version: 2 renderer: networkd {# protect go-template below from Jinja #} {% raw %} ethernets: lo: addresses: - {{ cluster_api_lb_ip }} dhcp4: false dhcp6: false {{ nic 0 }}: dhcp4: false dhcp6: false match: macaddress: {{ mac 0 }} set-name: {{ nic 0 }} mtu: 1500 {{ nic 1 }}: dhcp4: false dhcp6: false match: macaddress: {{ mac 1 }} set-name: {{ nic 1 }} mtu: 1500 {{ nic 2 }}: dhcp4: false dhcp6: false match: macaddress: {{ mac 2 }} set-name: {{ nic 2 }} mtu: 1500 {{ nic 3 }}: dhcp4: false dhcp6: false match: macaddress: {{ mac 3 }} set-name: {{ nic 3 }} mtu: 1500 bonds: # this example uses 2 bonds, you may have different interfaces configuration bond0: mtu: 1500 parameters: mode: 802.3ad mii-monitor-interval: 100 interfaces: - {{ nic 0 }} - {{ nic 1 }} bond1: mtu: 1500 parameters: mode: 802.3ad mii-monitor-interval: 100 interfaces: - {{ nic 2 }} - {{ nic 3 }} vlans: k8s-lcm: id: SET_LCM_VLAN_ID link: bond1 dhcp4: false dhcp6: false addresses: - {{ ip "k8s-lcm:mgmt-lcm-rack1" }} routes: - to: {{ cidr_from_subnet "k8s-lcm-rack2" }} via: {{ gateway_from_subnet "k8s-lcm-rack1" }} - to: {{ cidr_from_subnet "k8s-lcm-rack3" }} via: {{ gateway_from_subnet "k8s-lcm-rack1" }} k8s-ext: id: SET_EXT_VLAN_ID link: bond1 dhcp4: false dhcp6: false addresses: - {{ ip "k8s-ext:mgmt-k8s-ext-rack1" }} nameservers: addresses: {{ nameservers_from_subnet "mgmt-k8s-ext-rack1" }} routes: - to: 0.0.0.0/0 via: {{ gateway_from_subnet "mgmt-k8s-ext-rack1" }} bridges: k8s-pxe: mtu: 1500 interfaces: - bond0 dhcp4: false dhcp6: false addresses: - {{ ip "k8s-pxe:k8s-pxe-nics-rack1" }} routes: - to: {{ cidr_from_subnet "k8s-pxe-nics-rack2" }} via: {{ gateway_from_subnet "k8s-pxe-nics-rack1" }} - to: {{ cidr_from_subnet "k8s-pxe-nics-rack3" }} via: {{ gateway_from_subnet "k8s-pxe-nics-rack1" }} {% endraw %} --- apiVersion: ipam.mirantis.com/v1alpha1 kind: L2Template metadata: name: "mgmt-rack2" namespace: default labels: kaas.mirantis.com/provider: baremetal cluster.sigs.k8s.io/cluster-name: kaas-mgmt l2template-mgmt-rack2: "presents" # to be used in L2templateSelector of the Machine object spec: autoIfMappingPrio: - provision - eno - ens - enp l3Layout: - scope: namespace subnetName: k8s-pxe-nics-rack1 - scope: namespace subnetName: k8s-pxe-nics-rack2 - scope: namespace subnetName: k8s-pxe-nics-rack3 - scope: namespace subnetName: k8s-lcm-rack1 - scope: namespace subnetName: k8s-lcm-rack2 - scope: namespace subnetName: k8s-lcm-rack3 - scope: namespace subnetName: mgmt-k8s-ext-rack2 npTemplate: | version: 2 renderer: networkd {# protect go-template below from Jinja #} {% raw %} ethernets: lo: addresses: - {{ cluster_api_lb_ip }} dhcp4: false dhcp6: false {{ nic 0 }}: dhcp4: false dhcp6: false match: macaddress: {{ mac 0 }} set-name: {{ nic 0 }} mtu: 1500 {{ nic 1 }}: dhcp4: false dhcp6: false match: macaddress: {{ mac 1 }} set-name: {{ nic 1 }} mtu: 1500 {{ nic 2 }}: dhcp4: false dhcp6: false match: macaddress: {{ mac 2 }} set-name: {{ nic 2 }} mtu: 1500 {{ nic 3 }}: dhcp4: false dhcp6: false match: macaddress: {{ mac 3 }} set-name: {{ nic 3 }} mtu: 1500 bonds: # this example uses 2 bonds, you may have different interfaces configuration bond0: mtu: 1500 parameters: mode: 802.3ad mii-monitor-interval: 100 interfaces: - {{ nic 0 }} - {{ nic 1 }} bond1: mtu: 1500 parameters: mode: 802.3ad mii-monitor-interval: 100 interfaces: - {{ nic 2 }} - {{ nic 3 }} vlans: k8s-lcm: id: SET_LCM_VLAN_ID link: bond1 dhcp4: false dhcp6: false addresses: - {{ ip "k8s-lcm:mgmt-lcm-rack2" }} routes: - to: {{ cidr_from_subnet "k8s-lcm-rack1" }} via: {{ gateway_from_subnet "k8s-lcm-rack2" }} - to: {{ cidr_from_subnet "k8s-lcm-rack3" }} via: {{ gateway_from_subnet "k8s-lcm-rack2" }} k8s-ext: id: SET_EXT_VLAN_ID link: bond1 dhcp4: false dhcp6: false addresses: - {{ ip "k8s-ext:mgmt-k8s-ext-rack2" }} nameservers: addresses: {{ nameservers_from_subnet "mgmt-k8s-ext-rack2" }} routes: - to: 0.0.0.0/0 via: {{ gateway_from_subnet "mgmt-k8s-ext-rack2" }} bridges: k8s-pxe: mtu: 1500 interfaces: - bond0 dhcp4: false dhcp6: false addresses: - {{ ip "k8s-pxe:mgmt-pxe-nics-rack2" }} routes: - to: {{ cidr_from_subnet "k8s-pxe-nics-rack1" }} via: {{ gateway_from_subnet "k8s-pxe-nics-rack2" }} - to: {{ cidr_from_subnet "k8s-pxe-nics-rack3" }} via: {{ gateway_from_subnet "k8s-pxe-nics-rack2" }} {% endraw %} --- apiVersion: ipam.mirantis.com/v1alpha1 kind: L2Template metadata: name: "mgmt-rack3" namespace: default labels: kaas.mirantis.com/provider: baremetal cluster.sigs.k8s.io/cluster-name: kaas-mgmt l2template-mgmt-rack3: "presents" # to be used in Machine's L2templateSelector spec: autoIfMappingPrio: - provision - eno - ens - enp l3Layout: - scope: namespace subnetName: k8s-pxe-nics-rack1 - scope: namespace subnetName: k8s-pxe-nics-rack2 - scope: namespace subnetName: k8s-pxe-nics-rack3 - scope: namespace subnetName: k8s-lcm-rack1 - scope: namespace subnetName: k8s-lcm-rack2 - scope: namespace subnetName: k8s-lcm-rack3 - scope: namespace subnetName: mgmt-k8s-ext-rack3 npTemplate: | version: 2 renderer: networkd {# protect go-template below from Jinja #} {% raw %} ethernets: lo: addresses: - {{ cluster_api_lb_ip }} dhcp4: false dhcp6: false {{ nic 0 }}: dhcp4: false dhcp6: false match: macaddress: {{ mac 0 }} set-name: {{ nic 0 }} mtu: 1500 {{ nic 1 }}: dhcp4: false dhcp6: false match: macaddress: {{ mac 1 }} set-name: {{ nic 1 }} mtu: 1500 {{ nic 2 }}: dhcp4: false dhcp6: false match: macaddress: {{ mac 2 }} set-name: {{ nic 2 }} mtu: 1500 {{ nic 3 }}: dhcp4: false dhcp6: false match: macaddress: {{ mac 3 }} set-name: {{ nic 3 }} mtu: 1500 bonds: # this example uses 2 bonds, you may have different interfaces configuration bond0: mtu: 1500 parameters: mode: 802.3ad mii-monitor-interval: 100 interfaces: - {{ nic 0 }} - {{ nic 1 }} bond1: mtu: 1500 parameters: mode: 802.3ad mii-monitor-interval: 100 interfaces: - {{ nic 2 }} - {{ nic 3 }} vlans: k8s-lcm: id: SET_LCM_VLAN_ID link: bond1 dhcp4: false dhcp6: false addresses: - {{ ip "k8s-lcm:mgmt-lcm-rack3" }} routes: - to: {{ cidr_from_subnet "k8s-lcm-rack1" }} via: {{ gateway_from_subnet "k8s-lcm-rack3" }} - to: {{ cidr_from_subnet "k8s-lcm-rack2" }} via: {{ gateway_from_subnet "k8s-lcm-rack3" }} k8s-ext: id: SET_EXT_VLAN_ID link: bond1 dhcp4: false dhcp6: false addresses: - {{ ip "k8s-ext:mgmt-k8s-ext-rack3" }} nameservers: addresses: {{ nameservers_from_subnet "mgmt-k8s-ext-rack3" }} routes: - to: 0.0.0.0/0 via: {{ gateway_from_subnet "mgmt-k8s-ext-rack3" }} bridges: k8s-pxe: mtu: 1500 interfaces: - bond0 dhcp4: false dhcp6: false addresses: - {{ ip "k8s-pxe:mgmt-pxe-nics-rack3" }} routes: - to: {{ cidr_from_subnet "k8s-pxe-nics-rack1" }} via: {{ gateway_from_subnet "k8s-pxe-nics-rack3" }} - to: {{ cidr_from_subnet "k8s-pxe-nics-rack2" }} via: {{ gateway_from_subnet "k8s-pxe-nics-rack3" }} {% endraw %} {# ==================== End L2Template object(s) ============================ #}If you configure ARP announcement of the load-balancer IP address for a management cluster API and for load-balanced services of the cluster:
Update the network object definition in
ipam-objects.yaml.templateaccording to the environment configuration. By default, this template implies the use of separate PXE and life-cycle management (LCM) networks.Manually set all parameters that start with
SET_.To ensure successful bootstrap, enable asymmetric routing on the interfaces of the management cluster nodes. This is required because the seed node relies on one network by default, which can potentially cause traffic asymmetry.
In the
kernelParameterssection ofbaremetalhostprofiles.yaml.template, setrp_filterto2. This enables loose mode as defined in RFC3704.Example configuration of asymmetric routing
... kernelParameters: ... sysctl: # Enables the "Loose mode" for the "k8s-lcm" interface (management network) net.ipv4.conf.k8s-lcm.rp_filter: "2" # Enables the "Loose mode" for the "bond0" interface (PXE network) net.ipv4.conf.bond0.rp_filter: "2" ...
Note
More complicated solutions that are not described in this manual include getting rid of traffic asymmetry, for example:
Configure source routing on management cluster nodes.
Plug the seed node into the same networks as the management cluster nodes, which requires custom configuration of the seed node.
For configuration details of bond network interface for the PXE and management network, see Configure NIC bonding.
Example of the default L2 template snippet for a management cluster
bonds: bond0: interfaces: - {{ nic 0 }} - {{ nic 1 }} parameters: mode: active-backup primary: {{ nic 0 }} dhcp4: false dhcp6: false addresses: - {{ ip "bond0:mgmt-pxe" }} vlans: k8s-lcm: id: SET_VLAN_ID link: bond0 addresses: - {{ ip "k8s-lcm:kaas-mgmt" }} nameservers: addresses: {{ nameservers_from_subnet "kaas-mgmt" }} routes: - to: 0.0.0.0/0 via: {{ gateway_from_subnet "kaas-mgmt" }}
In this example, the following configuration applies:
A bond of two NIC interfaces
A static address in the PXE network set on the bond
An isolated L2 segment for the LCM network is configured using the
k8s-lcmVLAN with the static address in the LCM networkThe default gateway address is in the LCM network
For general concepts of configuring separate PXE and LCM networks for a management cluster, see Separate PXE and management networks. For current object templates and variable names to use, see the following tables.
Network parameters mapping overview
Deployment file name
Parameters list to update manually
ipam-objects.yaml.templateSET_LB_HOSTSET_MGMT_ADDR_RANGESET_MGMT_CIDRSET_MGMT_DNSSET_MGMT_NW_GWSET_MGMT_SVC_POOLSET_PXE_ADDR_POOLSET_PXE_ADDR_RANGESET_PXE_CIDRSET_PXE_SVC_POOLSET_VLAN_ID
bootstrap.envKAAS_BM_PXE_IPKAAS_BM_PXE_MASKKAAS_BM_PXE_BRIDGE
Mandatory network parameters of the IPAM object template
The following table contains examples of mandatory parameter values to set in
ipam-objects.yaml.templatefor the network scheme that has the following networks:172.16.59.0/24- PXE network172.16.61.0/25- LCM network
Parameter
Description
Example value
SET_PXE_CIDRThe IP address of the PXE network in the CIDR notation. The minimum recommended network size is 256 addresses (
/24prefix length).172.16.59.0/24SET_PXE_SVC_POOLThe IP address range to use for endpoints of load balancers in the PXE network for the Container Cloud services: Ironic-API, DHCP server, HTTP server, and caching server. The minimum required range size is 5 addresses.
172.16.59.6-172.16.59.15SET_PXE_ADDR_POOLThe IP address range in the PXE network to use for dynamic address allocation for hosts during inspection and provisioning.
The minimum recommended range size is 30 addresses for management cluster nodes if it is located in a separate PXE network segment. Otherwise, it depends on the number of managed cluster nodes to deploy in the same PXE network segment as the management cluster nodes.
172.16.59.51-172.16.59.200SET_PXE_ADDR_RANGEThe IP address range in the PXE network to use for static address allocation on each management cluster node. The minimum recommended range size is 6 addresses.
172.16.59.41-172.16.59.50SET_MGMT_CIDRThe IP address of the LCM network for the management cluster in the CIDR notation. If managed clusters will have their separate LCM networks, those networks must be routable to the LCM network. The minimum recommended network size is 128 addresses (
/25prefix length).172.16.61.0/25SET_MGMT_NW_GWThe default gateway address in the LCM network. This gateway must provide access to the OOB network of the Container Cloud cluster and to the Internet to download the Mirantis artifacts.
172.16.61.1SET_LB_HOSTThe IP address of the externally accessible MKE API endpoint of the cluster in the CIDR notation. This address must be within the management
SET_MGMT_CIDRnetwork but must NOT overlap with any other addresses or address ranges within this network. External load balancers are not supported.172.16.61.5/32SET_MGMT_DNSAn external (non-Kubernetes) DNS server accessible from the LCM network.
8.8.8.8SET_MGMT_ADDR_RANGEThe IP address range that includes addresses to be allocated to bare metal hosts in the LCM network for the management cluster.
When this network is shared with managed clusters, the size of this range limits the number of hosts that can be deployed in all clusters sharing this network.
When this network is solely used by a management cluster, the range must include at least 6 addresses for bare metal hosts of the management cluster.
172.16.61.30-172.16.61.40SET_MGMT_SVC_POOLThe IP address range to use for the externally accessible endpoints of load balancers in the LCM network for the Container Cloud services, such as Keycloak, web UI, and so on. The minimum required range size is 19 addresses.
172.16.61.10-172.16.61.29SET_VLAN_IDThe VLAN ID used for isolation of LCM network. The bootstrap.sh process and the seed node must have routable access to the network in this VLAN.
3975While using separate PXE and LCM networks, the management cluster services are exposed in different networks using two separate MetalLB address pools:
Services exposed through the PXE network are as follows:
Ironic API as a bare metal provisioning server
HTTP server that provides images for network boot and server provisioning
Caching server for accessing the Container Cloud artifacts deployed on hosts
Services exposed through the LCM network are all other Container Cloud services, such as Keycloak, web UI, and so on.
The default MetalLB configuration described in the
MetalLBConfigobject template ofmetallbconfig.yaml.templateuses two separate MetalLB address pools. Also, it uses theinterfacesselector in itsl2Advertisementstemplate.Caution
When you change the
L2Templateobject template inipam-objects.yaml.template, ensure that interfaces listed in theinterfacesfield of theMetalLBConfig.spec.l2Advertisementssection match those used in yourL2Template. For details about theinterfacesselector, see MetalLBConfig spec.See Configure and verify MetalLB for details on MetalLB configuration.
If you configure BGP announcement of the load-balancer IP address for a management cluster API and for load-balanced services of the cluster using three networks, you can use the following
MetalLBConfigexample instead of the defaultmetallbconfig.yaml.templatefile.Example MetalLBConfig template for a management cluster that uses BGP announcements and 3 networks
Substitute the default
metallbconfig.yaml.templatefile with the one that you create using the following example template.apiVersion: kaas.mirantis.com/v1alpha1 kind: MetalLBConfig metadata: labels: kaas.mirantis.com/provider: baremetal cluster.sigs.k8s.io/cluster-name: kaas-mgmt name: kaas-mgmt-metallb namespace: default spec: ipAddressPools: - name: default spec: addresses: - SET_MGMT_SVC_POOL autoAssign: true avoidBuggyIPs: false - name: services-pxe spec: addresses: - SET_PXE_SVC_POOL autoAssign: false avoidBuggyIPs: false # l2Advertisements are optional and can be used for the bootstrap cluster # (during provisioning of a management cluster) if the ARP announcement # from the bootstrap cluster is more suitable than BGP. l2Advertisements: - name: pxe-bootstrap spec: ipAddressPools: - services-pxe - dhcp-lb nodeSelectors: - matchLabels: kubernetes.io/hostname: clusterapi-control-plane # bootstrap cluster node bgpPeers: - name: bootstrap-bgp-peer-pxe # used for the bootstrap cluster only (during provisioning of a management cluster) spec: holdTime: 0s keepaliveTime: 0s myASN: SET_BGP_BOOTSTRAP_LOCAL_ASN nodeSelectors: - matchLabels: kubernetes.io/hostname: clusterapi-control-plane # bootstrap cluster node peerASN: SET_BGP_PXE_RACKX_PEER_ASN # can be in the same (or different) rack as for one of management cluster nodes peerAddress: SET_BGP_PXE_RACKX_PEER_IP# can be in the same (or different) rack as for one of management cluster nodes - name: bgp-peer-rack1-pxe spec: holdTime: 0s keepaliveTime: 0s myASN: SET_BGP_PXE_LOCAL_ASN nodeSelectors: - matchLabels: rack-id: rack1 peerASN: SET_BGP_PXE_RACK1_PEER_ASN peerAddress: SET_BGP_PXE_RACK1_PEER_IP - name: bgp-peer-rack2-pxe spec: holdTime: 0s keepaliveTime: 0s myASN: SET_BGP_PXE_LOCAL_ASN nodeSelectors: - matchLabels: rack-id: rack2 peerASN: SET_BGP_PXE_RACK2_PEER_ASN peerAddress: SET_BGP_PXE_RACK2_PEER_IP - name: bgp-peer-rack3-pxe spec: holdTime: 0s keepaliveTime: 0s myASN: SET_BGP_PXE_LOCAL_ASN nodeSelectors: - matchLabels: rack-id: rack3 peerASN: SET_BGP_PXE_RACK3_PEER_ASN peerAddress: SET_BGP_PXE_RACK3_PEER_IP - name: bgp-peer-rack1-ext spec: holdTime: 0s keepaliveTime: 0s myASN: SET_BGP_EXT_LOCAL_ASN nodeSelectors: - matchLabels: rack-id: rack1 peerASN: SET_BGP_EXT_RACK1_PEER_ASN peerAddress: SET_BGP_EXT_RACK1_PEER_IP - name: bgp-peer-rack2-ext spec: holdTime: 0s keepaliveTime: 0s myASN: SET_BGP_EXT_LOCAL_ASN nodeSelectors: - matchLabels: rack-id: rack2 peerASN: SET_BGP_EXT_RACK2_PEER_ASN peerAddress: SET_BGP_EXT_RACK2_PEER_IP - name: bgp-peer-rack3-ext spec: holdTime: 0s keepaliveTime: 0s myASN: SET_BGP_EXT_LOCAL_ASN nodeSelectors: - matchLabels: rack-id: rack3 peerASN: SET_BGP_EXT_RACK3_PEER_ASN peerAddress: SET_BGP_EXT_RACK3_PEER_IP bgpAdvertisements: - name: default spec: aggregationLength: 32 ipAddressPools: - default peers: - bgp-peer-rack1-ext - bgp-peer-rack2-ext - bgp-peer-rack3-ext - name: provision-pxe spec: aggregationLength: 32 ipAddressPools: - services-pxe peers: - bootstrap-bgp-peer-pxe - bgp-peer-rack1-pxe - bgp-peer-rack2-pxe - bgp-peer-rack3-pxe
In
cluster.yaml.template:Set the mandatory label:
labels: kaas.mirantis.com/provider: baremetal
Available since Container Cloud 2.30.0 (Cluster releases 21.0.0 and 20.0.0) as Technology Preview. If you configured BGP of the load-balancer IP address for the management cluster API in previous steps, enable the
useBGPAnnouncementparameter:spec: providerSpec: value: useBGPAnnouncement: true
Update other cluster-related settings to fit your deployment.
Optional. Technology Preview. Deprecated since Container Cloud 2.29.0 (Cluster release 16.4.0). Enable WireGuard for traffic encryption on the Kubernetes workloads network.
WireGuard configuration
Ensure that the Calico MTU size is at least 60 bytes smaller than the interface MTU size of the workload network. IPv4 WireGuard uses a 60-byte header. For details, see Set the MTU size for Calico.
In
cluster.yaml.template, enable WireGuard by adding thesecureOverlayparameter:spec: ... providerSpec: value: ... secureOverlay: true
Caution
Changing this parameter on a running cluster causes a downtime that can vary depending on the cluster size.
For more details about WireGuard, see Calico documentation: Encrypt in-cluster pod traffic.
Configure StackLight. For parameters description, see StackLight configuration parameters.
Optional. Configure additional cluster settings as described in Configure optional settings.
In
machines.yaml.template:Add the following mandatory machine labels:
labels: kaas.mirantis.com/provider: baremetal cluster.sigs.k8s.io/cluster-name: <clusterName> cluster.sigs.k8s.io/control-plane: "true"
Adjust
specandlabelssections of each entry according to your deployment.Adjust the
spec.providerSpec.value.hostSelectorvalues to matchBareMetalHostInventorycorresponding to each machine. For details, see spec:providerSpec for instance configuration.Available since Container Cloud 2.30.0 (Cluster releases 21.0.0 and 20.0.0). Optional. Configure the controlled provisioning workflow by adding the
day1Provisioningandday1Deploymentfields toBareMetalMachineProviderSpec:spec: providerSpec: value: day1Provisioning: manual # Default, requires approval day1Deployment: manual # Default, requires approval
When using controlled provisioning during bootstrap:
Machines switch to the
AwaitsProvisioningstate for hardware verification after bare metal host inspection.Approval of the
BootstrapRegionobject automatically setsday1Provisioning: autofor all machines.After provisioning, machines switch to the
AwaitsDeploymentstate.An operator validates the configuration and manually sets
day1Deployment: autoinBareMetalMachineProviderSpec.
For details, see Controlled bare metal provisioning workflows.
Note
If not specified, both fields are set to
manualby default. Set toautoeither initially to automatically start the bootstrap, or later to continue after a manual inspection and approval.Adjust the
spec.providerSpec.value.l2TemplateSelectorvalues to matchL2Templatecorresponding to each machine.This step is required if the nodes of the management cluster are deployed using different L2 templates, for example, if the nodes are deployed in a multi-rack environment.
Monitor the inspecting process of the baremetal hosts and wait until all hosts are in the
availablestate:kubectl get bmh -o go-template='{{- range .items -}} {{.status.provisioning.state}}{{"\n"}} {{- end -}}'
Example of system response:
available available available
Monitor the
BootstrapRegionobject status and wait until it is ready.kubectl get bootstrapregions -o go-template='{{(index .items 0).status.ready}}{{"\n"}}'
To obtain more granular status details, monitor
status.conditions:kubectl get bootstrapregions -o go-template='{{(index .items 0).status.conditions}}{{"\n"}}'
For a more user-friendly system response, consider using dedicated tools such as jq or yq and adjust the
-oflag to output in thejsonoryamlformat accordingly.Change the directory to
/kaas-bootstrap/.Approve the
BootstrapRegionobject to start the cluster deployment:./container-cloud bootstrap approve all
Caution
Once you approve the
BootstrapRegionobject, no cluster modification is allowed.A machine modification is allowed only while a machine is in the
AwaitsDeploymentstate. This state applies ifday1Deployment: manualis set inBareMetalMachineProviderSpec.Warning
Do not manually restart or power off any of the bare metal hosts during the bootstrap process.
Monitor the deployment progress. For description of deployment stages, see Overview of the deployment workflow.
Verify that network addresses used on your clusters do not overlap with the following default MKE network addresses for Swarm and MCR:
10.0.0.0/16is used for Swarm networks. IP addresses from this network are virtual.10.99.0.0/16is used for MCR networks. IP addresses from this network are allocated on hosts.
Verification of Swarm and MCR network addresses
To verify Swarm and MCR network addresses, run on any master node:
docker infoExample of system response:
Server: ... Swarm: ... Default Address Pool: 10.0.0.0/16 SubnetSize: 24 ... Default Address Pools: Base: 10.99.0.0/16, Size: 20 ...
Not all of Swarm and MCR addresses are usually in use. One Swarm Ingress network is created by default and occupies the
10.0.0.0/24address block. Also, three MCR networks are created by default and occupy three address blocks:10.99.0.0/20,10.99.16.0/20,10.99.32.0/20.To verify the actual networks state and addresses in use, run:
docker network ls docker network inspect <networkName>
Optional. If you plan to use multiple L2 segments for provisioning of managed cluster nodes, consider the requirements specified in Configure multiple DHCP address ranges.
Configure bare metal settings
During creation of a bare metal management cluster using Bootstrap v2, configure several cluster settings to fit your deployment.
Note
Before update of the management cluster to Container Cloud 2.29.0
(Cluster release 16.4.0), instead of BareMetalHostInventory, use the
BareMetalHost object. For details, see BareMetalHost resource.
Caution
While the Cluster release of the management cluster is 16.4.0,
BareMetalHostInventory operations are allowed to
m:kaas@management-admin only. This limitation is lifted once the
management cluster is updated to the Cluster release 16.4.1 or later.
Before adding new BareMetalHostInventory objects, configure hardware hosts
to correctly boot them over the PXE network.
Important
Consider the following common requirements for hardware hosts configuration:
Update firmware for BIOS and Baseboard Management Controller (BMC) to the latest available version, especially if you are going to apply the UEFI configuration.
Container Cloud uses the
ipxe.efibinary loader that might be not compatible with old firmware and have vendor-related issues with UEFI booting. For example, the Supermicro issue. In this case, we recommend using thelegacybooting format.Configure all or at least the
PXENIC on switches.If the hardware host has more than one PXE NIC to boot, we strongly recommend setting up only one in the boot order. It speeds up the provisioning phase significantly.
Some hardware vendors require a host to be rebooted during BIOS configuration changes from
legacytoUEFIor vice versa for the extra option with NIC settings to appear in the menu.Connect only one Ethernet port on a host to the PXE network at any given time. Collect the physical address (MAC) of this interface and use it to configure the
BareMetalHostInventoryobject describing the host.
To configure BIOS on a bare metal host:
Enable the global BIOS mode using BIOS > Boot > boot mode select > legacy. Reboot the host if required.
Enable the
LAN-PXE-OPROMsupport using the following menus:BIOS > Advanced > PCI/PCIe Configuration > LAB OPROM TYPE > legacy
BIOS > Advanced > PCI/PCIe Configuration > Network Stack > enabled
BIOS > Advanced > PCI/PCIe Configuration > IPv4 PXE Support > enabled
Set up the configured boot order:
BIOS > Boot > Legacy-Boot-Order#1 > Hard Disk
BIOS > Boot > Legacy-Boot-Order#2 > NIC
Save changes and power off the host.
Enable the global BIOS mode using BIOS > Boot > boot mode select > UEFI. Reboot the host if required.
Enable the
LAN-PXE-OPROMsupport using the following menus:BIOS > Advanced > PCI/PCIe Configuration > LAB OPROM TYPE > uefi
BIOS > Advanced > PCI/PCIe Configuration > Network Stack > enabled
BIOS > Advanced > PCI/PCIe Configuration > IPv4 PXE Support > enabled
Note
UEFI support might not apply to all NICs. But at least built-in network interfaces should support it.
Set up the configured boot order:
BIOS > Boot > UEFI-Boot-Order#1 > UEFI Hard Disk
BIOS > Boot > UEFI-Boot-Order#2 > UEFI Network
Save changes and power off the host.
This section provides description of the bare metal host profile settings and provides instructions on how to configure this profile before deploying Mirantis Container Cloud on physical servers.
The bare metal host profile is a Kubernetes custom resource. It allows the infrastructure operator to define how the storage devices and the operating system are provisioned and configured.
The bootstrap templates for a bare metal deployment include the template for
the default BareMetalHostProfile object in the following file that defines
the default bare metal host profile:
templates/bm/baremetalhostprofiles.yaml.template
Note
Using BareMetalHostProfile, you can configure LVM or mdadm-based
software RAID support during a management or managed cluster creation. For
details, see Configure RAID support.
Warning
All data will be wiped during cluster deployment on devices
defined directly or indirectly in the fileSystems list of
BareMetalHostProfile. For example:
A raw device partition with a file system on it
A device partition in a volume group with a logical volume that has a file system on it
An mdadm RAID device with a file system on it
An LVM RAID device with a file system on it
The wipe field is always considered true for these devices.
The false value is ignored.
Therefore, to prevent data loss, move the necessary data from these file systems to another server beforehand, if required.
The customization procedure of BareMetalHostProfile is almost the same for
the management and managed clusters, with the following differences:
For a management cluster, the customization automatically applies to machines during bootstrap. And for a managed cluster, you apply the changes using kubectl before creating a managed cluster.
For a management cluster, you edit the default
baremetalhostprofiles.yaml.template. And for a managed cluster, you create a newBareMetalHostProfilewith the necessary configuration.
For the procedure details, see Create a custom bare metal host profile. Use this procedure for both types of clusters considering the differences described above.
You can configure L2 templates for the management cluster to set up a bond network interface for the PXE and management network.
This configuration must be applied to the bootstrap templates, before you run the bootstrap script to deploy the management cluster.
Configuration requirements for NIC bonding
Add at least two physical interfaces to each host in your management cluster.
Connect at least two interfaces per host to an Ethernet switch that supports Link Aggregation Control Protocol (LACP) port groups and LACP fallback.
Configure an LACP group on the ports connected to the NICs of a host.
Configure the LACP fallback on the port group to ensure that the host can boot over the PXE network before the bond interface is set up on the host operating system.
Configure server BIOS for both NICs of a bond to be PXE-enabled.
If the server does not support booting from multiple NICs, configure the port of the LACP group that is connected to the PXE-enabled NIC of a server to be the primary port. With this setting, the port becomes active in the fallback mode.
Configure the ports that connect servers to the PXE network with the PXE VLAN as native or untagged.
For reference configuration of network fabric in a baremetal-based cluster, see Physical networks layout.
To configure a bond interface that aggregates two interfaces for the PXE and management network:
In
kaas-bootstrap/templates/bm/ipam-objects.yaml.template:Verify that only the following parameters for the declaration of
{{nic 0}}and{{nic 1}}are set, as shown in the example below:dhcp4dhcp6
matchset-name
Remove other parameters.
Verify that the declaration of the bond interface
bond0has theinterfacesparameter listing both Ethernet interfaces.Verify that the node address in the PXE network (
ip "bond0:mgmt-pxe"in the below example) is bound to the bond interface or to the virtual bridge interface tied to that bond.Caution
No VLAN ID must be configured for the PXE network from the host side.
Configure bonding options using the
parametersfield. The only mandatory option ismode. See the example below for details.Note
You can set any mode supported by netplan and your hardware.
Important
Bond monitoring is disabled in Ubuntu by default. However, Mirantis highly recommends enabling it using the Media Independent Interface (MII) monitoring by setting the
mii-monitor-intervalparameter to a non-zero value. For details, see Linux documentation: bond monitoring.
Verify your configuration using the following example:
kind: L2Template metadata: name: kaas-mgmt ... spec: ... l3Layout: - subnetName: kaas-mgmt scope: namespace npTemplate: | version: 2 ethernets: {{nic 0}}: dhcp4: false dhcp6: false match: macaddress: {{mac 0}} set-name: {{nic 0}} {{nic 1}}: dhcp4: false dhcp6: false match: macaddress: {{mac 1}} set-name: {{nic 1}} bonds: bond0: interfaces: - {{nic 0}} - {{nic 1}} parameters: mode: 802.3ad mii-monitor-interval: 100 dhcp4: false dhcp6: false addresses: - {{ ip "bond0:mgmt-pxe" }} vlans: k8s-lcm: id: SET_VLAN_ID link: bond0 addresses: - {{ ip "k8s-lcm:kaas-mgmt" }} nameservers: addresses: {{ nameservers_from_subnet "kaas-mgmt" }} routes: - to: 0.0.0.0/0 via: {{ gateway_from_subnet "kaas-mgmt" }} ...
Proceed to bootstrap your management cluster as described in Deploy a management cluster using CLI.
This section describes how to configure a dedicated PXE network for a management bare metal cluster. A separate PXE network allows isolating sensitive bare metal provisioning process from the end users. The users still have access to Container Cloud services, such as Keycloak, to authenticate workloads in managed clusters, such as Horizon in a Mirantis OpenStack for Kubernetes cluster.
Note
This additional configuration procedure must be completed as part of the main Deploy a management cluster using CLI procedure. It substitutes or appends some configuration parameters and templates that are used in the main procedure for the management cluster to use two networks, PXE and management, instead of one PXE/management network. Mirantis recommends considering the main procedure first.
The following table describes the overall network mapping scheme with all
L2/L3 parameters, for example, for two networks, PXE (CIDR 10.0.0.0/24)
and management (CIDR 10.0.11.0/24):
Deployment file name |
Network |
Parameters and values |
|---|---|---|
|
Management |
|
|
PXE |
|
|
Management |
|
|
PXE |
|
When using separate PXE and management networks, the management cluster services are exposed in different networks using two separate MetalLB address pools:
Services exposed through the PXE network are as follows:
Ironic API as a bare metal provisioning server
HTTP server that provides images for network boot and server provisioning
Caching server for accessing the Container Cloud artifacts deployed on hosts
Services exposed through the management network are all other Container Cloud services, such as Keycloak, web UI, and so on.
To configure separate PXE and management networks:
Inspect guidelines to follow during configuration of the
Subnetobject as a MetalLB address pool as described MetalLB configuration guidelines for subnets.To ensure successful bootstrap, enable asymmetric routing on the interfaces of the management cluster nodes. This is required because the seed node relies on one network by default, which can potentially cause traffic asymmetry.
In the
kernelParameterssection ofbaremetalhostprofiles.yaml.template, setrp_filterto2. This enables loose mode as defined in RFC3704.Example configuration of asymmetric routing
... kernelParameters: ... sysctl: # Enables the "Loose mode" for the "k8s-lcm" interface (management network) net.ipv4.conf.k8s-lcm.rp_filter: "2" # Enables the "Loose mode" for the "bond0" interface (PXE network) net.ipv4.conf.bond0.rp_filter: "2" ...
Note
More complicated solutions that are not described in this manual include getting rid of traffic asymmetry, for example:
Configure source routing on management cluster nodes.
Plug the seed node into the same networks as the management cluster nodes, which requires custom configuration of the seed node.
In
kaas-bootstrap/templates/bm/ipam-objects.yaml.template:Substitute all
Subnetobject templates with the new ones as described in the example template belowUpdate the L2 template
spec.l3Layoutandspec.npTemplatefields as described in the example template below
Example of the Subnet object templates
# Subnet object that provides IP addresses for bare metal hosts of # management cluster in the PXE network. apiVersion: "ipam.mirantis.com/v1alpha1" kind: Subnet metadata: name: mgmt-pxe namespace: default labels: kaas.mirantis.com/provider: baremetal kaas-mgmt-pxe-subnet: "" spec: cidr: SET_IPAM_CIDR gateway: SET_PXE_NW_GW nameservers: - SET_PXE_NW_DNS includeRanges: - SET_IPAM_POOL_RANGE excludeRanges: - SET_METALLB_PXE_ADDR_POOL --- # Subnet object that provides IP addresses for bare metal hosts of # management cluster in the management network. apiVersion: "ipam.mirantis.com/v1alpha1" kind: Subnet metadata: name: mgmt-lcm namespace: default labels: kaas.mirantis.com/provider: baremetal kaas-mgmt-lcm-subnet: "" ipam/SVC-k8s-lcm: "1" ipam/SVC-ceph-cluster: "1" ipam/SVC-ceph-public: "1" cluster.sigs.k8s.io/cluster-name: CLUSTER_NAME spec: cidr: {{ SET_LCM_CIDR }} includeRanges: - {{ SET_LCM_RANGE }} excludeRanges: - SET_LB_HOST - SET_METALLB_ADDR_POOL --- # Deprecated since 2.27.0. Subnet object that provides configuration # for "services-pxe" MetalLB address pool that will be used to expose # services LB endpoints in the PXE network. apiVersion: "ipam.mirantis.com/v1alpha1" kind: Subnet metadata: name: mgmt-pxe-lb namespace: default labels: kaas.mirantis.com/provider: baremetal metallb/address-pool-name: services-pxe metallb/address-pool-protocol: layer2 metallb/address-pool-auto-assign: "false" cluster.sigs.k8s.io/cluster-name: CLUSTER_NAME spec: cidr: SET_IPAM_CIDR includeRanges: - SET_METALLB_PXE_ADDR_POOL
Example of the L2 template spec
kind: L2Template ... spec: ... l3Layout: - scope: namespace subnetName: kaas-mgmt-pxe labelSelector: kaas.mirantis.com/provider: baremetal kaas-mgmt-pxe-subnet: "" - scope: namespace subnetName: kaas-mgmt-lcm labelSelector: kaas.mirantis.com/provider: baremetal kaas-mgmt-lcm-subnet: "" npTemplate: | version: 2 renderer: networkd ethernets: {{nic 0}}: dhcp4: false dhcp6: false match: macaddress: {{mac 0}} set-name: {{nic 0}} {{nic 1}}: dhcp4: false dhcp6: false match: macaddress: {{mac 1}} set-name: {{nic 1}} bridges: bm-pxe: interfaces: - {{ nic 0 }} dhcp4: false dhcp6: false addresses: - {{ ip "bm-pxe:kaas-mgmt-pxe" }} nameservers: addresses: {{ nameservers_from_subnet "kaas-mgmt-pxe" }} routes: - to: 0.0.0.0/0 via: {{ gateway_from_subnet "kaas-mgmt-pxe" }} k8s-lcm: interfaces: - {{ nic 1 }} dhcp4: false dhcp6: false addresses: - {{ ip "k8s-lcm:kaas-mgmt-lcm" }} nameservers: addresses: {{ nameservers_from_subnet "kaas-mgmt-lcm" }}
Deprecated since Container Cloud 2.27.0 (Cluster releases 17.2.0 and 16.2.0): the last
Subnettemplate namedmgmt-pxe-lbin the example above will be used to configure the MetalLB address pool in the PXE network. The bare metal provider will automatically configure MetalLB with address pools using theSubnetobjects identified by specific labels.Warning
The
bm-pxeaddress must have a separate interface with only one address on this interface.Verify the current MetalLB configuration that is stored in
MetalLBobjects:kubectl -n metallb-system get ipaddresspools,l2advertisements
For the example configuration described above, the system outputs a similar content:
NAME AGE ipaddresspool.metallb.io/default 129m ipaddresspool.metallb.io/services-pxe 129m NAME AGE l2advertisement.metallb.io/default 129m l2advertisement.metallb.io/services-pxe 129m
To verify the
MetalLBobjects:kubectl -n metallb-system get <object> -o json | jq '.spec'
For the example configuration described above, the system outputs a similar content for
ipaddresspoolobjects:{ "addresses": [ "10.0.11.61-10.0.11.80" ], "autoAssign": true, "avoidBuggyIPs": false } $ kubectl -n metallb-system get ipaddresspool.metallb.io/services-pxe -o json | jq '.spec' { "addresses": [ "10.0.0.61-10.0.0.70" ], "autoAssign": false, "avoidBuggyIPs": false }
The
auto-assignparameter will be set tofalsefor all address pools except thedefaultone. So, a particular service will get an address from such an address pool only if theServiceobject has a specialmetallb.universe.tf/address-poolannotation that points to the specific address pool name.Note
- It is expected that every Container Cloud service on a management
cluster will be assigned to one of the address pools. Current consideration is to have two MetalLB address pools:
services-pxeis a reserved address pool name to use for the Container Cloud services in the PXE network (Ironic API, HTTP server, caching server).The bootstrap cluster also uses the
services-pxeaddress pool for its provision services for management cluster nodes to be provisioned from the bootstrap cluster. After the management cluster is deployed, the bootstrap cluster is deleted and that address pool is solely used by the newly deployed cluster.defaultis an address pool to use for all other Container Cloud services in the management network. No annotation is required on theServiceobjects in this case.
In addition to the network parameters defined in Deploy a management cluster using CLI, configure the following ones by replacing them in
templates/bm/ipam-objects.yaml.template:New subnet template parameters¶ Parameter
Description
Example value
SET_LCM_CIDRAddress of a management network for the management cluster in the CIDR notation. You can later share this network with managed clusters where it will act as the LCM network. If managed clusters have their separate LCM networks, those networks must be routable to the management network.
10.0.11.0/24SET_LCM_RANGEAddress range that includes addresses to be allocated to bare metal hosts in the management network for the management cluster. When this network is shared with managed clusters, the size of this range limits the number of hosts that can be deployed in all clusters that share this network. When this network is solely used by a management cluster, the range should include at least 3 IP addresses for bare metal hosts of the management cluster.
10.0.11.100-10.0.11.109SET_METALLB_PXE_ADDR_POOLAddress range to be used for LB endpoints of the Container Cloud services: Ironic-API, HTTP server, and caching server. This range must be within the PXE network. The minimum required range is 5 IP addresses.
10.0.0.61-10.0.0.70The following parameters will now be tied to the management network while their meaning remains the same as described in Deploy a management cluster using CLI:
Subnet template parameters migrated to management network¶ Parameter
Description
Example value
SET_LB_HOSTIP address of the externally accessible API endpoint of the management cluster. This address must NOT be within the
SET_METALLB_ADDR_POOLrange but within the management network. External load balancers are not supported.10.0.11.90SET_METALLB_ADDR_POOLThe address range to be used for the externally accessible LB endpoints of the Container Cloud services, such as Keycloak, web UI, and so on. This range must be within the management network. The minimum required range is 19 IP addresses.
10.0.11.61-10.0.11.80Proceed to further steps in Deploy a management cluster using CLI.
To facilitate multi-rack and other types of distributed bare metal datacenter topologies, the dnsmasq DHCP server used for host provisioning in Container Cloud supports working with multiple L2 segments through network routers that support DHCP relay.
Container Cloud has its own DHCP relay running on one of the management cluster nodes. That DHCP relay serves for proxying DHCP requests in the same L2 domain where the management cluster nodes are located.
Caution
Networks used for hosts provisioning of a managed cluster must have routes to the PXE network of the management cluster. This configuration enables hosts to have access to the management cluster services that are used during host provisioning.
Management cluster nodes must have routes through the PXE network to PXE network segments used on a managed cluster. The following example contains L2 template fragments for a management cluster node:
Configuration example extract
l3Layout:
# PXE/static subnet for a management cluster
- scope: namespace
subnetName: kaas-mgmt-pxe
labelSelector:
kaas-mgmt-pxe-subnet: "1"
# management (LCM) subnet for a management cluster
- scope: namespace
subnetName: kaas-mgmt-lcm
labelSelector:
kaas-mgmt-lcm-subnet: "1"
# PXE/dhcp subnets for a managed cluster
- scope: namespace
subnetName: managed-dhcp-rack-1
- scope: namespace
subnetName: managed-dhcp-rack-2
- scope: namespace
subnetName: managed-dhcp-rack-3
...
npTemplate: |
...
bonds:
bond0:
interfaces:
- {{ nic 0 }}
- {{ nic 1 }}
parameters:
mode: active-backup
primary: {{ nic 0 }}
mii-monitor-interval: 100
dhcp4: false
dhcp6: false
addresses:
# static address on management node in the PXE network
- {{ ip "bond0:kaas-mgmt-pxe" }}
routes:
# routes to managed PXE network segments
- to: {{ cidr_from_subnet "managed-dhcp-rack-1" }}
via: {{ gateway_from_subnet "kaas-mgmt-pxe" }}
- to: {{ cidr_from_subnet "managed-dhcp-rack-2" }}
via: {{ gateway_from_subnet "kaas-mgmt-pxe" }}
- to: {{ cidr_from_subnet "managed-dhcp-rack-3" }}
via: {{ gateway_from_subnet "kaas-mgmt-pxe" }}
...
To configure DHCP ranges for dnsmasq, create the Subnet objects
tagged with the ipam/SVC-dhcp-range label while setting up subnets
for a managed cluster using CLI.
Caution
Support of multiple DHCP ranges has the following limitations:
Using of custom DNS server addresses for servers that boot over PXE is not supported.
The
Subnetobjects for DHCP ranges cannot be associated with any specific cluster, as DHCP server configuration is only applicable to the management cluster where DHCP server is running. Thecluster.sigs.k8s.io/cluster-namelabel will be ignored.
Create the
Subnetobjects tagged with theipam/SVC-dhcp-rangelabel.Caution
For cluster-specific subnets, create
Subnetobjects in the same namespace as the relatedClusterobject project. For shared subnets, createSubnetobjects in thedefaultnamespace.To create the
Subnetobjects, refer to Create subnets.Use the following
Subnetobject example to specify DHCP ranges and DHCP options to pass the default route address:apiVersion: "ipam.mirantis.com/v1alpha1" kind: Subnet metadata: name: mgmt-dhcp-range namespace: default labels: ipam/SVC-dhcp-range: "" kaas.mirantis.com/provider: baremetal spec: cidr: 10.11.0.0/24 gateway: 10.11.0.1 includeRanges: - 10.11.0.121-10.11.0.125 - 10.11.0.191-10.11.0.199
Note
Setting of custom nameservers in the DHCP subnet is not supported.
After creation of the above
Subnetobject, the provided data will be utilized to render theDnsmasqobject used for configuration of the dnsmasq deployment. You do not have to manually edit theDnsmasqobject.Verify that the changes are applied to the
Dnsmasqobject:kubectl --kubeconfig <pathToMgmtClusterKubeconfig> \ -n kaas get dnsmasq dnsmasq-dynamic-config -o json
See also
For servers to access the DHCP server across the L2 segment boundaries, for example, from another rack with a different VLAN for PXE network, you must configure DHCP relay (agent) service on the border switch of the segment. For example, on a top-of-rack (ToR) or leaf (distribution) switch, depending on the data center network topology.
Warning
To ensure predictable routing for the relay of DHCP packets, Mirantis strongly advises against the use of chained DHCP relay configurations. This precaution limits the number of hops for DHCP packets, with an optimal scenario being a single hop.
This approach is justified by the unpredictable nature of chained relay configurations and potential incompatibilities between software and hardware relay implementations.
The dnsmasq server listens on the PXE network of the management
cluster by using the dhcp-lb Kubernetes Service.
To configure the DHCP relay service, specify the external address of the
dhcp-lb Kubernetes Service as an upstream address for the relayed DHCP
requests, which is the IP helper address for DHCP. There is the dnsmasq
deployment behind this service that can only accept relayed DHCP requests.
Container Cloud has its own DHCP relay running on one of the management cluster nodes. That DHCP relay serves for proxying DHCP requests in the same L2 domain where the management cluster nodes are located.
To obtain the actual IP address issued to the dhcp-lb Kubernetes Service:
kubectl -n kaas get service dhcp-lb
Note
This section applies only to existing management clusters that are created before Container Cloud 2.24.0 (Cluster release 14.0.0).
Caution
Since Container Cloud 2.24.0, you can only remove the deprecated
dnsmasq.dhcp_range, dnsmasq.dhcp_ranges, dnsmasq.dhcp_routers,
and dnsmasq.dhcp_dns_servers values from the cluster spec.
The Admission Controller does not accept any other changes in these values.
This configuration is completely superseded by the Subnet object.
The DHCP configuration automatically migrated from the cluster spec to
Subnet objects after cluster upgrade to Container Cloud 2.21.0 (Cluster
release 11.5.0).
To remove the deprecated dnsmasq parameters from the cluster spec:
Open the management cluster
specfor editing.In the
baremetal-operatorrelease values, remove thednsmasq.dhcp_range,dnsmasq.dhcp_ranges,dnsmasq.dhcp_routers, anddnsmasq.dhcp_dns_serversparameters. For example:regional: - helmReleases: - name: baremetal-operator values: dnsmasq: dhcp_range: 10.204.1.0,10.204.5.255,255.255.255.0
Caution
The
dnsmasq.dhcp_<name>parameters of thebaremetal-operatorHelm chart values in theClusterspecare deprecated since the Cluster release 11.5.0 and removed in the Cluster release 14.0.0.Ensure that the required DHCP ranges and options are set in the
Subnetobjects. For configuration details, see Configure DHCP ranges for dnsmasq.
The dnsmasq configuration options dhcp-option=3 and dhcp-option=6
are absent in the default configuration. So, by default, dnsmasq
will send the DNS server and default route to DHCP clients as defined in the
dnsmasq official documentation:
The netmask and broadcast address are the same as on the host running dnsmasq.
The DNS server and default route are set to the address of the host running dnsmasq.
If the domain name option is set, this name is sent to DHCP clients.
Available since MCC 2.26.0 (Cluster release 16.1.0)
This section instructs you on how to enable dynamic IP allocation feature to increase the amount of baremetal hosts to be provisioned in parallel on managed clusters.
Using this feature, you can effortlessly deploy a large managed cluster by provisioning up to 100 hosts simultaneously. In addition to dynamic IP allocation, this feature disables the ping check in the DHCP server. Therefore, if you plan to deploy large managed clusters, enable this feature during the management cluster bootstrap.
Caution
Before using this feature, familiarize yourself with DHCP range requirements for PXE.
To enable dynamic IP allocation for large managed clusters:
In the Cluster object of the management cluster, modify the configuration
of baremetal-operator by setting dynamic_bootp to true:
spec:
...
providerSpec:
value:
kaas:
...
regional:
- helmReleases:
- name: baremetal-operator
values:
dnsmasq:
dynamic_bootp: true
provider: baremetal
...
Available since MCC 2.25.0 (Cluster release 16.0.0)
This section instructs you on how to set a custom external IP address for
the dhcp-lb service so that it remains the same during management cluster
upgrades and other LCM operations.
The changes of dhcp-lb service address may lead to the necessity of
changing configuration for DHCP relays on ToR switches.
The described procedure allows you to avoid such unwanted changes.
This configuration makes sense when you use multiple DHCP address ranges
on your deployment. See Configure multiple DHCP address ranges for details.
To set a custom external IP address for the dhcp-lb service:
In the
Clusterobject of the management cluster, modify the configuration of thebaremetal-operatorrelease by settingdnsmasq.dedicated_udp_service_address_pooltotrue:spec: ... providerSpec: value: kaas: ... regional: - helmReleases: ... - name: baremetal-operator values: dnsmasq: dedicated_udp_service_address_pool: true ... provider: baremetal ...
In the
MetalLBConfigobject of the management cluster, modify theipAddressPoolsobject list by adding thedhcp-lbobject and theserviceAllocationparameters for thedefaultobject:ipAddressPools: - name: default spec: addresses: - 112.181.11.41-112.181.11.60 autoAssign: true avoidBuggyIPs: false serviceAllocation: serviceSelectors: - matchExpressions: - key: app.kubernetes.io/name operator: NotIn values: - dhcp-lb - name: services-pxe spec: addresses: - 10.0.24.122-10.0.24.140 autoAssign: false avoidBuggyIPs: false - name: dhcp-lb spec: addresses: - 10.0.24.121/32 autoAssign: true avoidBuggyIPs: false serviceAllocation: namespaces: - kaas serviceSelectors: - matchExpressions: - key: app.kubernetes.io/name operator: In values: - dhcp-lb
Select non-overlapping IP addresses for all the
ipAddressPoolsthat you use:default,services-pxe, anddhcp-lb.In the
MetalLBConfigobject of the management cluster, modify thel2Advertisementsobject list by addingdhcp-lbto theipAddressPoolssection in thepxeobject spec:Note
A cluster may have a different
L2Advertisementobject name instead ofpxe.l2Advertisements: ... - name: pxe spec: ipAddressPools: - services-pxe - dhcp-lb ...
Configure optional settings
Note
Consider this section as part of the Bootstrap v2 CLI procedure.
During creation of a management cluster, you can configure optional cluster
settings using the Container Cloud API by modifying cluster.yaml.template.
To configure optional cluster settings:
Technology Preview. Enable custom host names for cluster machines. When enabled, any machine host name in a particular region matches the related
Machineobject name. For example, instead of the defaultkaas-node-<UID>, a machine host name will bemaster-0. The custom naming format is more convenient and easier to operate with.Configuration for custom host names on the management and its future managed clusters
In
cluster.yaml.template, find thespec.providerSpec.value.kaas.regional.helmReleases.name: baremetal-providersection.Under
values.config, addcustomHostnamesEnabled: true:regional: - helmReleases: - name: baremetal-provider values: config: allInOneAllowed: false customHostnamesEnabled: true internalLoadBalancers: false provider: baremetal-provider
Optional. Technology Preview. Enable the Linux Audit daemon auditd to monitor activity of cluster processes and prevent potential malicious activity.
Configuration for auditd
In the
Clusterobject orcluster.yaml.template, add the auditd parameters:spec: providerSpec: value: audit: auditd: enabled: <bool> enabledAtBoot: <bool> backlogLimit: <int> maxLogFile: <int> maxLogFileAction: <string> maxLogFileKeep: <int> mayHaltSystem: <bool> presetRules: <string> customRules: <string> customRulesX32: <text> customRulesX64: <text>
Configuration parameters for auditd:
enabledBoolean, default -
false. Enables theauditdrole to install the auditd packages and configure rules. CIS rules: 4.1.1.1, 4.1.1.2.enabledAtBootBoolean, default -
false. Configures grub to audit processes that can be audited even if they start up prior to auditd startup. CIS rule: 4.1.1.3.backlogLimitInteger, default - none. Configures the backlog to hold records. If during boot
audit=1is configured, the backlog holds 64 records. If more than 64 records are created during boot, auditd records will be lost with a potential malicious activity being undetected. CIS rule: 4.1.1.4.maxLogFileInteger, default - none. Configures the maximum size of the audit log file. Once the log reaches the maximum size, it is rotated and a new log file is created. CIS rule: 4.1.2.1.
maxLogFileActionString, default - none. Defines handling of the audit log file reaching the maximum file size. Allowed values:
keep_logs- rotate logs but never delete themrotate- add a cron job to compress rotated log files and keep maximum 5 compressed files.compress- compress log files and keep them under the/var/log/auditd/directory. Requiresauditd_max_log_file_keepto be enabled.
CIS rule: 4.1.2.2.
maxLogFileKeepInteger, default -
5. Defines the number of compressed log files to keep under the/var/log/auditd/directory. Requiresauditd_max_log_file_action=compress. CIS rules - none.mayHaltSystemBoolean, default -
false. Halts the system when the audit logs are full. Applies the following configuration:space_left_action = emailaction_mail_acct = rootadmin_space_left_action = halt
CIS rule: 4.1.2.3.
customRulesString, default - none. Base64-encoded content of the
60-custom.rulesfile for any architecture. CIS rules - none.customRulesX32String, default - none. Base64-encoded content of the
60-custom.rulesfile for thei386architecture. CIS rules - none.customRulesX64String, default - none. Base64-encoded content of the
60-custom.rulesfile for thex86_64architecture. CIS rules - none.presetRulesString, default - none. Comma-separated list of the following built-in preset rules:
accessactionsdeletedocker
identityimmutableloginsmac-policy
modulesmountsperm-modprivileged
scopesessionsystem-localetime-change
Since Container Cloud 2.28.0 (Cluster releases 17.3.0 and 16.3.0) in the Technology Preview scope, you can collect some of the preset rules indicated above as groups and use them in
presetRules:ubuntu-cis-rules- this group contains rules to comply with the Ubuntu CIS Benchmark recommendations, including the following CIS Ubuntu 20.04 v2.0.1 rules:scope- 5.2.3.1actions- same as 5.2.3.2time-change- 5.2.3.4system-locale- 5.2.3.5privileged- 5.2.3.6access- 5.2.3.7identity- 5.2.3.8
perm-mod- 5.2.3.9mounts- 5.2.3.10session- 5.2.3.11logins- 5.2.3.12delete- 5.2.3.13mac-policy- 5.2.3.14modules- 5.2.3.19
docker-cis-rules- this group contains rules to comply with Docker CIS Benchmark recommendations, including thedockerDocker CIS v1.6.0 rules 1.1.3 - 1.1.18.
You can also use two additional keywords inside
presetRules:none- select no built-in rules.all- select all built-in rules. When using this keyword, you can add the!prefix to a rule name to exclude some rules. You can use the!prefix for rules only if you add theallkeyword as the first rule. Place a rule with the!prefix only after theallkeyword.
Example configurations:
presetRules: none- disable all preset rulespresetRules: docker- enable only thedockerrulespresetRules: access,actions,logins- enable only theaccess,actions, andloginsrulespresetRules: ubuntu-cis-rules- enable all rules from theubuntu-cis-rulesgrouppresetRules: docker-cis-rules,actions- enable all rules from thedocker-cis-rulesgroup and theactionsrulepresetRules: all- enable all preset rulespresetRules: all,!immutable,!sessions- enable all preset rules exceptimmutableandsessions
CIS controls
4.1.3 (time-change)4.1.4 (identity)4.1.5 (system-locale)4.1.6 (mac-policy)4.1.7 (logins)4.1.8 (session)4.1.9 (perm-mod)4.1.10 (access)4.1.11 (privileged)4.1.12 (mounts)4.1.13 (delete)4.1.14 (scope)4.1.15 (actions)4.1.16 (modules)4.1.17 (immutable)Docker CIS controls
1.1.41.1.81.1.101.1.121.1.131.1.151.1.161.1.171.1.181.2.31.2.41.2.51.2.61.2.71.2.101.2.11
Configure OIDC integration with LDAP or Google OAuth. For details, see Configure LDAP for IAM or Configure Google OAuth IdP for IAM.
Configure NTP server. You can disable NTP that is enabled by default. This option disables the management of
chronyconfiguration by MOSK to use your own system forchronymanagement. Otherwise, configure the regional NTP server parameters as described below.NTP configuration
Configure the regional NTP server parameters to be applied to all machines of managed clusters.
In
cluster.yaml.templateor theClusterobject, add thentp:serverssection with the list of required server names:spec: ... providerSpec: value: kaas: ... ntpEnabled: true regional: - helmReleases: - name: baremetal-provider values: config: lcm: ... ntp: servers: - 0.pool.ntp.org ... provider: baremetal ...
To disable NTP:
spec: ... providerSpec: value: ... ntpEnabled: false ...
Applies since Container Cloud 2.26.0 (Cluster release 16.1.0). If you plan to deploy large managed clusters, enable dynamic IP allocation to increase the amount of baremetal hosts to be provisioned in parallel. For details, see Enable dynamic IP allocation.
Now, proceed with completing the bootstrap process using the Container Cloud Bootstrap API as described in Deploy a management cluster.
Post-deployment steps
After bootstrapping the management cluster, collect and save the following cluster details in a secure location:
Obtain the management cluster
kubeconfig:./container-cloud get cluster-kubeconfig \ --kubeconfig <pathToKindKubeconfig> \ --cluster-name <clusterName>
By default,
pathToKindKubeconfigis$HOME/.kube/kind-config-clusterapi.Obtain the Keycloak credentials as described in Access the Keycloak Admin Console.
Remove the kind cluster:
./bin/kind delete cluster -n <kindClusterName>
By default,
kindClusterNameisclusterapi.
Now, you can proceed with operating your management cluster through the Container Cloud web UI and deploying MOSK clusters as described in Operations Guide.
Create initial users after a management cluster bootstrap
Once you bootstrap your management cluster, create Keycloak users for access to the Container Cloud web UI.
Mirantis recommends creating at least two users, user and operator,
that are required for a typical MOSK deployment.
To create the user for access to the Container Cloud web UI:
./container-cloud bootstrap user add \
--username <userName> \
--roles <roleName> \
--kubeconfig <pathToMgmtKubeconfig>
Note
You will be asked for the user password interactively.
Flag |
Description |
|---|---|
|
Required. Name of the user to create. |
|
Required. Comma-separated list of roles to assign to the user.
|
|
Required. Path to the management cluster |
|
Optional. Name of the Container Cloud project where the user will be created. If not set, a global user will be created for all Container Cloud projects with the corresponding role access to view or manage all public objects. |
|
Optional. Flag to provide the user password through echo '$PASSWORD' | ./container-cloud bootstrap user add \
--username <userName> \
--roles <roleName> \
--kubeconfig <pathToMgmtKubeconfig> \
--password-stdin
|
To delete the user:
./container-cloud bootstrap user delete --username <userName> --kubeconfig <pathToMgmtKubeconfig>
Requirements for a MITM proxy
Note
For MOSK clusters, the feature is generally available since MOSK 23.1.
While bootstrapping a Container Cloud management cluster using proxy, you may require Internet access to go through a man-in-the-middle (MITM) proxy. Such configuration requires that you enable streaming and install a CA certificate on a bootstrap node.
Enable streaming for MITM
Ensure that the MITM proxy is configured with enabled streaming. For example, if you use mitmproxy, enable the stream_large_bodies=1 option:
./mitmdump --set stream_large_bodies=1
Install a CA certificate for a MITM proxy on a bootstrap node
Log in to the bootstrap node.
Install
ca-certificates:apt install ca-certificates
Copy your CA certificate to the
/usr/local/share/ca-certificates/directory. For example:sudo cp ~/.mitmproxy/mitmproxy-ca-cert.cer /usr/local/share/ca-certificates/mitmproxy-ca-cert.crt
Replace
~/.mitmproxy/mitmproxy-ca-cert.cerwith the path to your CA certificate.Caution
The target CA certificate file must be in the
PEMformat with the.crtextension.Apply the changes:
sudo update-ca-certificates
Now, proceed with bootstrapping your management cluster.
Configure external identity provider for IAM
This section describes how to configure authentication for management cluster depending on the external identity provider type integrated to your deployment.
Configure LDAP for IAM
If you integrate LDAP for IAM to Mirantis OpenStack for Kubernetes, add the required LDAP
configuration to cluster.yaml.template during the management cluster
bootstrap.
Note
The example below defines the recommended non-anonymous
authentication type. If you require anonymous authentication, replace the
following parameters with authType: "none":
authType: "simple"
bindCredential: ""
bindDn: ""
To configure LDAP for IAM:
Open
templates/bm/cluster.yaml.template.Configure the
keycloak:userFederation:providers:andkeycloak:userFederation:mappers:sections as required:spec: providerSpec: value: kaas: management: helmReleases: - name: iam values: keycloak: userFederation: providers: - displayName: "<LDAP_NAME>" providerName: "ldap" priority: 1 fullSyncPeriod: -1 changedSyncPeriod: -1 config: pagination: "true" debug: "false" searchScope: "1" connectionPooling: "true" usersDn: "<DN>" # "ou=People, o=<ORGANIZATION>, dc=<DOMAIN_COMPONENT>" userObjectClasses: "inetOrgPerson,organizationalPerson" usernameLDAPAttribute: "uid" rdnLDAPAttribute: "uid" vendor: "ad" editMode: "READ_ONLY" uuidLDAPAttribute: "uid" connectionUrl: "ldap://<LDAP_DNS>" syncRegistrations: "false" authType: "simple" bindCredential: "" bindDn: "" mappers: - name: "username" federationMapperType: "user-attribute-ldap-mapper" federationProviderDisplayName: "<LDAP_NAME>" config: ldap.attribute: "uid" user.model.attribute: "username" is.mandatory.in.ldap: "true" read.only: "true" always.read.value.from.ldap: "false" - name: "full name" federationMapperType: "full-name-ldap-mapper" federationProviderDisplayName: "<LDAP_NAME>" config: ldap.full.name.attribute: "cn" read.only: "true" write.only: "false" - name: "last name" federationMapperType: "user-attribute-ldap-mapper" federationProviderDisplayName: "<LDAP_NAME>" config: ldap.attribute: "sn" user.model.attribute: "lastName" is.mandatory.in.ldap: "true" read.only: "true" always.read.value.from.ldap: "true" - name: "email" federationMapperType: "user-attribute-ldap-mapper" federationProviderDisplayName: "<LDAP_NAME>" config: ldap.attribute: "mail" user.model.attribute: "email" is.mandatory.in.ldap: "false" read.only: "true" always.read.value.from.ldap: "true"
Verify that the
userFederationsection is located on the same level as theinitUserssection.Verify that all attributes set in the
mapperssection are defined for users in the specified LDAP system. Missing attributes may cause authorization issues.
Now, return to the bootstrap instruction for your management cluster.
Configure Google OAuth IdP for IAM
Caution
The instruction below applies to the DNS-based management clusters. If you bootstrap a non-DNS-based management cluster, configure Google OAuth IdP for Keycloak after bootstrap using the official Keycloak documentation.
If you integrate Google OAuth external identity provider for IAM to
Mirantis OpenStack for Kubernetes, create the authorization credentials for IAM in your
Google OAuth account and configure cluster.yaml.template during the
bootstrap of the management cluster.
To configure Google OAuth IdP for IAM:
Create Google OAuth credentials for IAM:
Log in to your https://console.developers.google.com.
Navigate to Credentials.
In the APIs Credentials menu, select OAuth client ID.
In the window that opens:
In the Application type menu, select Web application.
In the Authorized redirect URIs field, type in
<keycloak-url>/auth/realms/iam/broker/google/endpoint, where<keycloak-url>is the corresponding DNS address.Press Enter to add the URI.
Click Create.
A page with your client ID and client secret opens. Save these credentials for further usage.
Log in to the bootstrap node.
Open
templates/bm/cluster.yaml.template.In the
keycloak:externalIdP:section, add the following snippet with your credentials created in previous steps:keycloak: externalIdP: google: enabled: true config: clientId: <Google_OAuth_client_ID> clientSecret: <Google_OAuth_client_secret>
Now, return to the bootstrap instruction for your management cluster.
See also
Create a managed cluster
After bootstrapping your baremetal-based Mirantis Container Cloud management cluster, you can create a baremetal-based managed cluster to deploy Mirantis OpenStack for Kubernetes using the Container Cloud API.
Create a project for MOSK clusters
Note
The procedure below applies only to the Container Cloud web UI
users with the m:kaas@global-admin or m:kaas@writer access role
assigned by the infrastructure operator.
The default project (Kubernetes namespace) is dedicated for management
clusters only. MOSK clusters require a separate project.
You can create as many projects as required by your company infrastructure.
To create a project for MOSK clusters:
Log in to the Container Cloud web UI as
m:kaas@global-adminorm:kaas@writer.In the Projects tab, click Create.
Type the new project name.
Click Create.
Note
Due to the known issue 50168, access to the newly created project becomes available in five minutes after project creation.
Add a bare metal host
Before creating a bare metal managed cluster, add the required number of bare metal hosts either using the Container Cloud web UI for a default configuration or using CLI for an advanced configuration.
Add a bare metal host using web UI
This section describes how to add bare metal hosts using the Container Cloud web UI during a MOSK cluster creation.
Before you proceed with adding a bare metal host:
Verify that the physical network on the server has been configured correctly. For details, see Physical networks layout.
Prepare the host as described in Configure BIOS on a bare metal host.
To add a bare metal host to a MOSK cluster:
Optional. Create a custom bare metal host profile depending on your needs as described in Create a custom bare metal host profile.
Note
You can view the created profiles in the BM Host Profiles tab of the Container Cloud web UI.
Log in to the Container Cloud web UI with the
m:kaas@operatororm:kaas:namespace@bm-pool-operatorpermissions.Switch to the required non-
defaultproject using the Switch Project action icon located on top of the main left-side navigation panel.Caution
Do not create a MOSK cluster in the
defaultproject (Kubernetes namespace), which is dedicated for the management cluster only. If no projects are defined, first create a newmoskproject as described in Create a project for MOSK clusters.Optional. Available since Container Cloud 2.24.0 (Cluster releases 15.0.1 and 14.0.1). In the Credentials tab, click Add Credential and add the IPMI user name and password of the bare metal host to access the Baseboard Management Controller (BMC).
Select one of the following options:
Since Container Cloud 2.30.0 (21.0.0 and 20.0.0)
In the Baremetal tab, click Create Host Inventory.
Fill out the Create baremetal host inventory form:
- Name
Specify the name of the new bare metal host.
- Boot Mode
Specify the BIOS boot mode. Available options: Legacy, UEFI, or UEFISecureBoot.
- MAC Address
Specify the MAC address of the PXE network interface.
- Baseboard Management Controller (BMC)
Specify the following BMC details:
- IP Address
Specify the IP address to access the BMC.
- Credential Name
Specify the name of the previously added bare metal host credentials to associate with the current host.
- Cert Validation
Enable validation of the BMC API certificate. Applies only to the
redfish+httpBMC protocol. Disabled by default.
- Power off host inventory after creation
Experimental. Select to power off the bare metal host inventory after creation.
Caution
This option is experimental and intended only for testing and evaluation purposes. Do not use it for production deployments.
Since Container Cloud 2.26.0 (17.1.0 and 16.1.0)
In the Baremetal tab, click Create Host.
Fill out the Create baremetal host form as required:
- Name
Specify the name of the new bare metal host.
- Boot Mode
Specify the BIOS boot mode. Available options: Legacy, UEFI, or UEFISecureBoot.
- MAC Address
Specify the MAC address of the PXE network interface.
- Baseboard Management Controller (BMC)
Specify the following BMC details:
- IP Address
Specify the IP address to access the BMC.
- Credential Name
Specify the name of the previously added bare metal host credentials to associate with the current host.
- Cert Validation
Enable validation of the BMC API certificate. Applies only to the
redfish+httpBMC protocol. Disabled by default.
- Power off host after creation
Experimental. Select to power off the bare metal host after creation.
Caution
This option is experimental and intended only for testing and evaluation purposes. Do not use it for production deployments.
Before Container Cloud 2.26.0 (17.0.0, 16.0.0, or earlier)
In the Baremetal tab, click Add BM host.
Fill out the Add new BM host form as required:
- Baremetal host name
Specify the name of the new bare metal host.
- Provider Credential
Optional. Available since Container Cloud 2.24.0 (Cluster releases 15.0.1 and 14.0.1). Specify the name of the previously added bare metal host credentials to associate with the current host.
- Add New Credential
Optional. Available since Container Cloud 2.24.0 (Cluster releases 15.0.1 and 14.0.1). Applies if you did not add bare metal host credentials using the Credentials tab. Add the bare metal host credentials:
- Username
Specify the name of the IPMI user to access the BMC.
- Password
Specify the IPMI password of the user to access the BMC.
- Boot MAC address
Specify the MAC address of the PXE network interface.
- IP Address
Specify the IP address to access the BMC.
- Label
Assign the machine label to the new host that defines which type of machine may be deployed on this bare metal host. Only one label can be assigned to a host. The supported labels include:
- Manager
This label is selected and set by default. Assign this label t the bare metal hosts that can be used to deploy machines with the
managertype. These hosts must match the CPU and RAM requirements described in MOSK cluster hardware requirements.
- Worker
The host with this label may be used to deploy the
workermachine type. Assign this label to the bare metal hosts that have sufficient CPU and RAM resources, as described in MOSK cluster hardware requirements.
- Storage
Assign this label to the bare metal hosts that have sufficient storage devices to match MOSK cluster hardware requirements. Hosts with this label will be used to deploy machines with the storage type that run Ceph OSDs.
Click Create.
While adding the bare metal host, Container Cloud discovers and inspects the hardware of the bare metal host and adds it to
BareMetalHost.statusfor future references.During provisioning,
baremetal-operatorinspects the bare metal host and moves it to thePreparingstate. The host becomes ready to be linked to a bare metal machine.Verify the results of the hardware inspection to avoid unexpected errors during the host usage:
Select one of the following options:
In the left sidebar, click Baremetal. The Hosts page opens.
In the left sidebar, click BM Hosts.
Verify that the bare metal host is registered and switched to one of the following statuses:
Preparing for a newly added host
Ready for a previously used host or for a host that is already linked to a machine
Select one of the following options:
On the Hosts page, click the host kebab menu and select Host info.
On the BM Hosts page, click the name of the newly added bare metal host.
In the window with the host details, scroll down to the Hardware section.
Review the section and make sure that the number and models of disks, network interface cards, and CPUs match the hardware specification of the server.
If the hardware details are consistent with the physical server specifications for all your hosts, proceed to Create a MOSK cluster.
If you find any discrepancies in the hardware inspection results, it might indicate that the server has hardware issues or is not compatible with Container Cloud.
Add a bare metal host using CLI
This section describes how to add bare metal hosts using the Container Cloud CLI during a managed cluster creation.
To add a bare metal host:
Log in to the host where your management cluster
kubeconfigis located and where kubectl is installed.Describe the unique credentials of the new bare metal host:
Create a YAML file that describes the unique credentials of the new bare metal host as a
BareMetalHostCredentialobject.apiVersion: kaas.mirantis.com/v1alpha1 kind: BareMetalHostCredential metadata: labels: kaas.mirantis.com/provider: baremetal kaas.mirantis.com/region: region-one name: <bare-metal-host-credential-unique-name> namespace: <managed-cluster-project-name> spec: username: <ipmi-user-name> password: value: <ipmi-user-password>
In the
metadatasection, add a unique credentialsnameand the name of the non-defaultproject (namespace) dedicated for the managed cluster being created.In the
specsection, add the IPMI user name and password in plain text to access the Baseboard Management Controller (BMC). The password will not be stored in theBareMetalHostCredentialobject but will be erased and saved in an underlyingSecretobject.
Caution
Each bare metal host must have a unique
BareMetalHostCredential. For details about theBareMetalHostCredentialobject, refer to BareMetalHostCredential resource.Note
The
kaas.mirantis.com/regionlabel is removed from all MOSK objects in 24.1. Therefore, do not add the label starting with this release. On existing clusters updated to this release, or if added manually, MOSK ignores this label.Create a secret YAML file that describes the unique credentials of the new bare metal host. Example of the bare metal host secret:
apiVersion: v1 data: password: <credentials-password> username: <credentials-user-name> kind: Secret metadata: labels: kaas.mirantis.com/credentials: "true" kaas.mirantis.com/provider: baremetal kaas.mirantis.com/region: region-one name: <credentials-name> namespace: <managed-cluster-project-name> type: Opaque
In the
datasection, add the IPMI user name and password in the base64 encoding to access the BMC. To obtain the base64-encoded credentials, you can use the following command in your Linux console:echo -n <username|password> | base64
Caution
Each bare metal host must have a unique
Secret.In the
metadatasection, add the uniquenameof credentials and the name of the non-defaultproject (namespace) dedicated for the managed cluster being created.
Apply this secret YAML file to your deployment:
Warning
The kubectl apply command automatically saves the applied data as plain text into the
kubectl.kubernetes.io/last-applied-configurationannotation of the corresponding object. This may result in revealing sensitive data in this annotation when creating or modifying the object.Therefore, do not use kubectl apply on this object. Use kubectl create, kubectl patch, or kubectl edit instead.
If you used kubectl apply on this object, you can remove the
kubectl.kubernetes.io/last-applied-configurationannotation from the object using kubectl edit.kubectl create -n <managedClusterProjectName> -f ${<bmh-cred-file-name>}.yaml
Create a YAML file that contains a description of the new bare metal host:
Caution
While the Cluster release of the management cluster is 16.4.0,
BareMetalHostInventoryoperations are allowed tom:kaas@management-adminonly. This limitation is lifted once the management cluster is updated to the Cluster release 16.4.1 or later.apiVersion: kaas.mirantis.com/v1alpha1 kind: BareMetalHostInventory metadata: annotations: inspect.metal3.io/hardwaredetails-storage-sort-term: hctl ASC, wwn ASC, by_id ASC, name ASC labels: kaas.mirantis.com/baremetalhost-id: <unique-bare-metal-host-hardware-node-id> kaas.mirantis.com/provider: baremetal name: <bare-metal-host-unique-name> namespace: <managed-cluster-project-name> spec: bmc: address: <ip-address-for-bmc-access> bmhCredentialsName: <bare-metal-host-credential-unique-name> bootMACAddress: <bare-metal-host-boot-mac-address> online: true
Note
If you have a limited amount of free and unused IP addresses for server provisioning, you can add the
baremetalhost.metal3.io/detachedannotation that pauses automatic host management to manually allocate an IP address for the host. For details, see Manually allocate IP addresses for bare metal hosts.apiVersion: metal3.io/v1alpha1 kind: BareMetalHost metadata: annotations: kaas.mirantis.com/baremetalhost-credentials-name: <bare-metal-host-credential-unique-name> labels: kaas.mirantis.com/baremetalhost-id: <unique-bare-metal-host-hardware-node-id> hostlabel.bm.kaas.mirantis.com/worker: "true" kaas.mirantis.com/provider: baremetal kaas.mirantis.com/region: region-one name: <bare-metal-host-unique-name> namespace: <managed-cluster-project-name> spec: bmc: address: <ip-address-for-bmc-access> credentialsName: '' bootMACAddress: <bare-metal-host-boot-mac-address> online: true
Note
The
kaas.mirantis.com/regionlabel is removed from all MOSK objects in 24.1. Therefore, do not add the label starting with this release. On existing clusters updated to this release, or if added manually, MOSK ignores this label.Note
If you have a limited amount of free and unused IP addresses for server provisioning, you can add the
baremetalhost.metal3.io/detachedannotation that pauses automatic host management to manually allocate an IP address for the host. For details, see Manually allocate IP addresses for bare metal hosts.apiVersion: metal3.io/v1alpha1 kind: BareMetalHost metadata: labels: kaas.mirantis.com/baremetalhost-id: <unique-bare-metal-host-hardware-node-id> hostlabel.bm.kaas.mirantis.com/worker: "true" kaas.mirantis.com/provider: baremetal kaas.mirantis.com/region: region-one name: <bare-metal-host-unique-name> namespace: <managed-cluster-project-name> spec: bmc: address: <ip-address-for-bmc-access> credentialsName: <credentials-name> bootMACAddress: <bare-metal-host-boot-mac-address> online: true
For a detailed fields description, see API Reference: BareMetalHostInventory resource and BareMetalHost resource.
Apply this configuration YAML file to your deployment:
kubectl create -n <managedClusterProjectName> -f ${<bare-metal-host-config-file-name>}.yaml
During provisioning,
baremetal-operatorinspects the bare metal host and moves it to thePreparingstate. The host becomes ready to be linked to a bare metal machine.Caution
If changing or adding of DHCP subnets is required to bootstrap new nodes, wait after changing or adding of DHCP subnets until the
dnsmasqpod becomes ready, then create bare metal host objects as described above.For details about the related issue, refer to Inspection error on bare metal hosts after dnsmasq restart.
Verify the new bare metal host object status:
kubectl -n <managed-cluster-project-name> get bmh -o wide <bare-metal-host-unique-name>
Example of system response:
NAMESPACE NAME STATUS STATE CONSUMER BMC BOOTMODE ONLINE ERROR REGION my-project bmh1 OK preparing ip-address-for-bmc-access legacy true region-one
During provisioning, the status changes as follows:
registeringinspectingpreparing
After the bare metal host object switches to the
preparingstage, theinspectingphase finishes and you can verify that hardware information is available in the object status and matches the MOSK cluster hardware requirements. For example:Verify the status of hardware NICs:
kubectl -n <managed-cluster-project-name> get bmh <bare-metal-host-unique-name> -o json | jq -r '[.status.hardware.nics]'
Example of system response:
[ [ { "ip": "172.18.171.32", "mac": "ac:1f:6b:02:81:1a", "model": "0x8086 0x1521", "name": "eno1", "pxe": true }, { "ip": "fe80::225:90ff:fe33:d5ac%ens1f0", "mac": "00:25:90:33:d5:ac", "model": "0x8086 0x10fb", "name": "ens1f0" }, ...
Verify the status of RAM:
kubectl -n <managed-cluster-project-name> get bmh <bare-metal-host-unique-name> -o json | jq -r '[.status.hardware.ramMebibytes]'
Example of system response:
[ 98304 ]
Now, proceed with Create a custom bare metal host profile.
Create a custom bare metal host profile
The bare metal host profile is a Kubernetes custom resource. It enables the operator to define how the storage devices and the operating system are provisioned and configured.
This section describes the bare metal host profile default settings and configuration of custom profiles for managed clusters using Container Cloud API. The section also applies to a management cluster with a few differences described in Customize the default bare metal host profile.
Default configuration of the host system storage
The default host profile requires three storage devices in the following strict order:
- Boot device and operating system storage
This device contains boot data and operating system data. It is partitioned using the GUID Partition Table (GPT) labels. The root file system is an
ext4file system created on top of an LVM logical volume. For a detailed layout, refer to the table below.
- Local volumes device
This device contains an
ext4file system with directories mounted as persistent volumes to Kubernetes. These volumes are used by the Mirantis Container Cloud services to store its data, including monitoring and identity databases.
- Ceph storage device
This device is used as a Ceph datastore or Ceph OSD on managed clusters.
The following table summarizes the default configuration of the host system storage set up by the Container Cloud bare metal management.
Device/partition |
Name/Mount point |
Recommended size, GB |
Description |
|---|---|---|---|
|
|
4 MiB |
The mandatory GRUB boot partition required for non-UEFI systems. |
|
|
0.2 GiB |
The boot partition required for the UEFI boot mode. |
|
|
64 MiB |
The mandatory partition for the |
|
|
100% of the remaining free space in the LVM volume group |
The main LVM physical volume that is used to create the root file system. |
|
|
100% of the remaining free space in the LVM volume group |
The LVM physical volume that is used to create the file system
for |
|
|
100% of the remaining free space in the LVM volume group |
Clean raw disk that will be used for the Ceph storage backend on managed clusters. |
If required, you can customize the default host storage configuration. For details, see Create MOSK host profiles.
Wipe a device or partition
Available since MCC 2.26.0 (17.1.0 and 16.1.0)
Before deploying a cluster, you may need to erase existing data from hardware
devices to be used for deployment. You can either erase an existing partition
or remove all existing partitions from a physical device. For this purpose,
use the wipeDevice structure that configures cleanup behavior during
configuration of a custom bare metal host profile described in
Create MOSK host profiles.
The wipeDevice structure contains the following options:
eraseMetadataConfigures metadata cleanup of a device
eraseDeviceConfigures a complete cleanup of a device
When you enable the eraseMetadata option, which is disabled by default,
the Ansible provisioner attempts to clean up the existing metadata from
the target device. Examples of metadata include:
Existing file system
Logical Volume Manager (LVM) or Redundant Array of Independent Disks (RAID) configuration
The behavior of metadata erasure varies depending on the target device:
If a device is part of other logical devices, for example, a partition, logical volume, or MD RAID volume, such logical device is disassembled and its file system metadata is erased. On the final erasure step, the file system metadata of the target device is erased as well.
If a device is a physical disk, then all its nested partitions along with their nested logical devices, if any, are erased and disassembled. On the final erasure step, all partitions and metadata of the target device are removed.
Caution
None of the eraseMetadata actions include overwriting the
target device with data patterns. For this purpose, use the eraseDevice
option as described in Erase a device.
To enable the eraseMetadata option, use the wipeDevice field in the
spec:devices section of the BareMetalHostProfile object. For a
detailed description of the option, see BareMetalHostProfile resource.
If you require not only disassembling of existing logical volumes but also
removing of all data ever written to the target device, configure the
eraseDevice option, which is disabled by default. This option is not
applicable to paritions, LVM, or MD RAID logical volumes because such volumes
may use caching that prevents a physical device from being erased properly.
Important
The eraseDevice option does not replace the secure erase.
To configure the eraseDevice option, use the wipeDevice field in the
spec:devices section of the BareMetalHostProfile object. For a
detailed description of the option, see BareMetalHostProfile resource.
Create MOSK host profiles
Different types of MOSK nodes require differently configured host storage. This section describes how to create custom host profiles for different types of MOSK nodes.
You can create custom profiles for managed clusters using Container Cloud API.
Note
The procedure below also applies to management clusters.
You can use flexible size units throughout bare metal host profiles:
Ki, Mi, Gi, and so on. For example, size: 100Mi or
size: 1.5Gi that will be serialized as 1536Mi. The size without units
is counted in bytes. For example, size: 120 means 120 bytes.
Warning
All data will be wiped during cluster deployment on devices
defined directly or indirectly in the fileSystems list of
BareMetalHostProfile. For example:
A raw device partition with a file system on it
A device partition in a volume group with a logical volume that has a file system on it
An mdadm RAID device with a file system on it
An LVM RAID device with a file system on it
The wipe field is always considered true for these devices.
The false value is ignored.
Therefore, to prevent data loss, move the necessary data from these file systems to another server beforehand, if required.
To create MOSK bare metal host profiles:
Select from the following options:
For a management cluster, log in to the bare metal seed node that will be used to bootstrap the management cluster.
For a managed cluster, log in to the local machine where you management cluster
kubeconfigis located and wherekubectlis installed.
Note
The management cluster
kubeconfigis created automatically during the last stage of the management cluster bootstrap.Select from the following options:
For a management cluster, open
templates/bm/baremetalhostprofiles.yaml.templatefor editing.For a managed cluster, create a new bare metal host profile for MOSK compute nodes in a YAML file under the
templates/bm/directory.
Edit the host profile using the example template below to meet your hardware configuration requirements:
apiVersion: metal3.io/v1alpha1 kind: BareMetalHostProfile metadata: name: <PROFILE_NAME> namespace: <PROJECT_NAME> spec: devices: # From the HW node, obtain the first device, which size is at least 60Gib - device: workBy: "by_id,by_wwn,by_path,by_name" minSize: 60Gi type: ssd wipe: true partitions: - name: bios_grub partflags: - bios_grub size: 4Mi wipe: true - name: uefi partflags: - esp size: 200Mi wipe: true - name: config-2 size: 64Mi wipe: true # This partition is only required on compute nodes if you plan to # use LVM ephemeral storage. - name: lvm_nova_part wipe: true size: 100Gi - name: lvm_root_part size: 0 wipe: true # From the HW node, obtain the second device, which size is at least 60Gib # If a device exists but does not fit the size, # the BareMetalHostProfile will not be applied to the node - device: workBy: "by_id,by_wwn,by_path,by_name" minSize: 60Gi type: ssd wipe: true # From the HW node, obtain the disk device with the exact name - device: workBy: "by_id,by_wwn,by_path,by_name" minSize: 60Gi wipe: true partitions: - name: lvm_lvp_part size: 0 wipe: true # Example of wiping a device w\o partitioning it. # Mandatory for the case when a disk is supposed to be used for Ceph backend # later - device: workBy: "by_id,by_wwn,by_path,by_name" wipe: true fileSystems: - fileSystem: vfat partition: config-2 - fileSystem: vfat mountPoint: /boot/efi partition: uefi - fileSystem: ext4 logicalVolume: root mountPoint: / - fileSystem: ext4 logicalVolume: lvp mountPoint: /mnt/local-volumes/ logicalVolumes: - name: root size: 0 vg: lvm_root - name: lvp size: 0 vg: lvm_lvp postDeployScript: | #!/bin/bash -ex echo $(date) 'post_deploy_script done' >> /root/post_deploy_done preDeployScript: | #!/bin/bash -ex echo $(date) 'pre_deploy_script done' >> /root/pre_deploy_done volumeGroups: - devices: - partition: lvm_root_part name: lvm_root - devices: - partition: lvm_lvp_part name: lvm_lvp grubConfig: defaultGrubOptions: - GRUB_DISABLE_RECOVERY="true" - GRUB_PRELOAD_MODULES=lvm - GRUB_TIMEOUT=20 kernelParameters: sysctl: # For the list of options prohibited to change, refer to # https://docs.mirantis.com/mke/3.7/install/predeployment/set-up-kernel-default-protections.html kernel.dmesg_restrict: "1" kernel.core_uses_pid: "1" fs.file-max: "9223372036854775807" fs.aio-max-nr: "1048576" fs.inotify.max_user_instances: "4096" vm.max_map_count: "262144"
Add or edit the mandatory parameters in the new
BareMetalHostProfileobject. For the parameters description, see BareMetalHostProfile spec <bmhprofile-spec>.Note
If asymmetric traffic is expected on some of the managed cluster nodes, enable the loose mode for the corresponding interfaces on those nodes by setting the
net.ipv4.conf.<interface-name>.rp_filterparameter to"2"in thekernelParameters.sysctlsection. For example:kernelParameters: sysctl: net.ipv4.conf.k8s-lcm.rp_filter: "2"
Configure required disks for the Ceph cluster as described in Configure Ceph disks in a host profile.
Optional. Configure wiping of the target device or partition to be used for cluster deployment as described in Wipe a device or partition.
Optional. Configure multiple devices for LVM volume using the example template extract below for reference.
Caution
The following template extract contains only sections relevant to LVM configuration with multiple PVs. Expand the main template described in the previous step with the configuration below if required.
spec: devices: ... - device: ... partitions: - name: lvm_lvp_part1 size: 0 wipe: true - device: ... partitions: - name: lvm_lvp_part2 size: 0 wipe: true volumeGroups: ... - devices: - partition: lvm_lvp_part1 - partition: lvm_lvp_part2 name: lvm_lvp logicalVolumes: ... - name: root size: 0 vg: lvm_lvp fileSystems: ... - fileSystem: ext4 logicalVolume: root mountPoint: /
Optional. Technology Preview. Configure support of the Redundant Array of Independent Disks (RAID) that allows, for example, installing a cluster operating system on a RAID device, refer to Configure RAID support.
Optional. Configure the RX/TX buffer size for physical network interfaces and
txqueuelenfor any network interfaces.This configuration can greatly benefit high-load and high-performance network interfaces. You can configure these parameters using the
udevrules. For example:postDeployScript: | #!/bin/bash -ex ... echo 'ACTION=="add|change", SUBSYSTEM=="net", KERNEL=="eth*|en*", RUN+="/sbin/ethtool -G $name rx 4096 tx 4096"' > /etc/udev/rules.d/59-net.ring.rules echo 'ACTION=="add|change", SUBSYSTEM=="net", KERNEL=="eth*|en*|bond*|k8s-*|v*" ATTR{tx_queue_len}="10000"' > /etc/udev/rules.d/58-net.txqueue.rules
Select from the following options:
For a management cluster, proceed with the cluster bootstrap procedure as described in Deploy a management cluster.
For a managed cluster, select from the following options:
Log in to the Container Cloud web UI with the
operatorpermissions.Switch to the required non-
defaultproject using the Switch Project action icon located on top of the main left-side navigation panel.Caution
Do not create a MOSK cluster in the
defaultproject (Kubernetes namespace), which is dedicated for the management cluster only. If no projects are defined, first create a newmoskproject as described in Create a project for MOSK clusters.In the left sidebar, navigate to Baremetal and click the Host Profiles tab.
Click Create Host Profile.
Fill out the Create host profile form:
- Name
Name of the bare metal host profile.
- Specification
BareMetalHostProfileobject specification in the YAML format that you have previously created. Click Edit to edit theBareMetalHostProfileobject if required.Note
Before Container Cloud 2.28.0 (Cluster releases 17.3.0 and 16.3.0), the field name is YAML file, and you can upload the required YAML file instead of inserting and editing it.
- Labels
Available since Container Cloud 2.28.0 (Cluster releases 17.3.0 and 16.3.0). Key-value pairs attached to
BareMetalHostProfile.
Add the bare metal host profile to your management cluster:
kubectl --kubeconfig <pathToManagementClusterKubeconfig> -n <managedClusterProjectName> apply -f <pathToBareMetalHostProfileFile>
If required, further modify the host profile:
kubectl --kubeconfig <pathToManagementClusterKubeconfig> -n <managedClusterProjectName> edit baremetalhostprofile <hostProfileName>
Repeat the steps above to create host profiles for other OpenStack node roles such as control plane nodes and storage nodes.
Now, proceed to Enable huge pages in a host profile.
Configure Ceph disks in a host profile
This section describes how to configure devices for the Ceph cluster in the
BareMetalHostProfile object of a managed cluster.
To configure disks for a Ceph cluster:
Open the
BareMetalHostProfileobject of a managed cluster for editing.In the
spec.devicessection, add each disk intended for use as a Ceph OSD data device withsize: 0andwipe: true.Example configuration for
sde-sdhdisks to use as Ceph OSDs:spec: devices: ... - device: byPath: /dev/disk/by-path/pci-0000:00:05.0-scsi-0:0:0:1 size: 0 wipe: true - device: byPath: /dev/disk/by-path/pci-0000:00:05.0-scsi-0:0:0:2 size: 0 wipe: true - device: byPath: /dev/disk/by-path/pci-0000:00:05.0-scsi-0:0:0:3 size: 0 wipe: true - device: byPath: /dev/disk/by-path/pci-0000:00:05.0-scsi-0:0:0:4 size: 0 wipe: true
Since MOSK 23.2, if you plan to use a separate metadata device for Ceph OSD, configure the
spec.devicessection as described below.Important
Mirantis highly recommends configuring disk partitions for Ceph OSD metadata using
BareMetalHostProfile.Configuration of a separate metadata device for Ceph OSD
Add the device to
spec.deviceswith a single partition that will use the entire disk size.For example, if you plan to use four Ceph OSDs with a separate metadata device for each Ceph OSD, configure the
spec.devicessection as follows:spec: devices: ... - device: byPath: /dev/disk/by-path/pci-0000:00:05.0-scsi-0:0:0:5 wipe: true partitions: - name: ceph_meta size: 0 wipe: true
Create a volume group on top of the defined partition and create the required number of logical volumes (LVs) on top of the created volume group (VG). Add one logical volume per one Ceph OSD on the node.
Example snippet of an LVM configuration for a Ceph metadata disk:
spec: ... volumeGroups: ... - devices: - partition: ceph_meta name: bluedb logicalVolumes: ... - name: meta_1 size: 25%VG vg: bluedb - name: meta_2 size: 25%VG vg: bluedb - name: meta_3 size: 25%VG vg: bluedb - name: meta_4 size: 25%VG vg: bluedb
Important
Plan LVs of a separate metadata device thoroughly. Any logical volume misconfiguration causes redeployment of all Ceph OSDs that use this disk as metadata devices.
Note
General Ceph recommendation is to have a metadata device in between 1% to 4% of the Ceph OSD data size. Mirantis highly recommends having at least 4% of Ceph OSD data size.
If you plan using a disk as a separate metadata device for 10 Ceph OSDs, define the size of an LV for each Ceph OSD in between 1% to 4% of the corresponding Ceph OSD data size. If RADOS Gateway is enabled, the minimum data size must be 4%. For details, see Ceph documentation: Bluestore config reference.
For example, if the total data size of 10 Ceph OSDs equals
1Tbwith100Gbeach, assign a metadata disk less than10Gbwith1Gbper each LV. The recommended size is40Gbwith4Gbper each LV.After applying
BareMetalHostProfile, the bare metal provider creates an LVM partitioning for the metadata disk and places these volumes as/devpaths, for example,/dev/bluedb/meta_1or/dev/bluedb/meta_3.Example template of a host profile configuration for Ceph
spec: ... devices: ... - device: byPath: /dev/disk/by-path/pci-0000:00:05.0-scsi-0:0:0:1 wipe: true - device: byName: /dev/disk/by-path/pci-0000:00:05.0-scsi-0:0:0:2 wipe: true - device: byPath: /dev/disk/by-path/pci-0000:00:05.0-scsi-0:0:0:3 wipe: true - device: byPath: /dev/disk/by-path/pci-0000:00:05.0-scsi-0:0:0:4 wipe: true - device: byPath: /dev/disk/by-path/pci-0000:00:05.0-scsi-0:0:0:5 wipe: true partitions: - name: ceph_meta size: 0 wipe: true volumeGroups: ... - devices: - partition: ceph_meta name: bluedb logicalVolumes: ... - name: meta_1 size: 25%VG vg: bluedb - name: meta_2 size: 25%VG vg: bluedb - name: meta_3 size: 25%VG vg: bluedb - name: meta_4 size: 25%VG vg: bluedb
After applying such
BareMetalHostProfileto a node, thenodesspec of theKaaSCephClusterobject contains the followingstorageDevicessection:spec: cephClusterSpec: ... nodes: ... machine-1: ... storageDevices: - fullPath: /dev/disk/by-id/scsi-SATA_ST4000NM002A-2HZ_WS20NNKC config: metadataDevice: /dev/bluedb/meta_1 - fullPath: /dev/disk/by-id/ata-ST4000NM002A-2HZ101_WS20NEGE config: metadataDevice: /dev/bluedb/meta_2 - fullPath: /dev/disk/by-id/scsi-0ATA_ST4000NM002A-2HZ_WS20LEL3 config: metadataDevice: /dev/bluedb/meta_3 - fullPath: /dev/disk/by-id/ata-HGST_HUS724040ALA640_PN1334PEDN9SSU config: metadataDevice: /dev/bluedb/meta_4
spec: cephClusterSpec: ... nodes: ... machine-1: ... storageDevices: - name: sde config: metadataDevice: /dev/bluedb/meta_1 - name: sdf config: metadataDevice: /dev/bluedb/meta_2 - name: sdg config: metadataDevice: /dev/bluedb/meta_3 - name: sdh config: metadataDevice: /dev/bluedb/meta_4
Enable huge pages in a host profile
The BareMetalHostProfile API allows configuring a host to use the
huge pages feature of the Linux kernel on managed clusters. The procedure
included in this section applies to both new and existing cluster
deployments.
Note
Huge pages is a mode of operation of the Linux kernel. With huge pages enabled, the kernel allocates the RAM in bigger chunks, or pages. This allows kernel-based virtual machines and virtual machines running on it to use the host RAM more efficiently and improves the performance of the virtual machines.
To enable huge pages in a custom bare metal host profile for a managed cluster:
Log in to the local machine where you management cluster
kubeconfigis located and wherekubectlis installed.Note
The management cluster
kubeconfigis created automatically during the last stage of the management cluster bootstrap.Open for editing or create a new bare metal host profile under the
templates/bm/directory.Edit the
grubConfigsection of the host profilespecusing the example below to configure the kernel boot parameters and enable huge pages:spec: grubConfig: defaultGrubOptions: - GRUB_DISABLE_RECOVERY="true" - GRUB_PRELOAD_MODULES=lvm - GRUB_TIMEOUT=20 - GRUB_CMDLINE_LINUX_DEFAULT="hugepagesz=1G hugepages=N"
The example configuration above will allocate
Nhuge pages of 1 GB each on the server boot. The lasthugepageszparameter value is default unlessdefault_hugepageszis defined. For details about possible values, see official Linux kernel documentation.Add the bare metal host profile to your management cluster:
kubectl --kubeconfig <pathToManagementClusterKubeconfig> -n <projectName> apply -f <pathToBareMetalHostProfileFile>
If required, further modify the host profile:
kubectl --kubeconfig <pathToManagementClusterKubeconfig> -n <projectName> edit baremetalhostprofile <hostProfileName>
Proceed to Create a MOSK cluster.
Configure RAID support
TechPreview
During a management or MOSK cluster creation, you can
configure the support of the software-based Redundant Array of Independent
Disks (RAID) using BareMetalHosProfile to set up an LVM-based RAID level 1
(raid1) or an mdadm-based RAID level 0, 1, or 10 (raid0, raid1, or
raid10).
If required, you can further configure RAID in the same profile, for example, to install a cluster operating system onto a RAID device.
Caution
RAID configuration on already provisioned bare metal machines or on an existing cluster is not supported.
To start using any kind of RAIDs, reprovisioning of machines with a new
BaremetalHostProfileis required.Mirantis supports the
raid1type of RAID devices both for LVM and mdadm.Mirantis supports the
raid0type for the mdadm RAID to be on par with the LVMlineartype.Mirantis recommends having at least two physical disks for
raid0andraid1devices to prevent unnecessary complexity.Mirantis supports the
raid10type for mdadm RAID. At least four physical disks are required for this type of RAID.Only an even number of disks can be used for a
raid1orraid10device.
TechPreview
Warning
The EFI system partition partflags: ['esp'] must be
a physical partition in the main partition table of the disk, not under
LVM or mdadm software RAID.
During configuration of your custom bare metal host profile,
you can create an LVM-based software RAID device raid1 by adding
type: raid1 to the logicalVolume spec in BaremetalHostProfile.
For the LVM RAID parameters description, refer to BareMetalHostProfile spec.
For a bare metal host profile configuration, refer to Create a custom bare metal host profile.
Caution
The logicalVolume spec of the raid1 type requires at least
two devices (partitions) in volumeGroup where you build a logical
volume. For an LVM of the linear type, one device is enough.
You can use flexible size units throughout bare metal host profiles:
Ki, Mi, Gi, and so on. For example, size: 100Mi or
size: 1.5Gi that will be serialized as 1536Mi. The size without units
is counted in bytes. For example, size: 120 means 120 bytes.
Note
The LVM raid1 requires additional space to store the raid1
metadata on a volume group, roughly 4 MB for each partition.
Therefore, you cannot create a logical volume of exactly the same
size as the partitions it works on.
For example, if you have two partitions of 10 GiB, the corresponding
raid1 logical volume size will be less than 10 GiB. For that
reason, you can either set size: 0 to use all available
space on the volume group, or set a smaller size than the partition
size. For example, use size: 9.9Gi instead of
size: 10Gi for the logical volume.
The following example illustrates an extract of BaremetalHostProfile
with / on the LVM raid1.
...
devices:
- device:
workBy: "by_id,by_wwn,by_path,by_name"
minSize: 200Gi
type: hdd
wipe: true
partitions:
- name: root_part1
size: 120Gi
partitions:
- name: rest_sda
size: 0
- device:
workBy: "by_id,by_wwn,by_path,by_name"
minSize: 200Gi
type: hdd
wipe: true
partitions:
- name: root_part2
size: 120Gi
partitions:
- name: rest_sdb
size: 0
volumeGroups:
- name: vg-root
devices:
- partition: root_part1
- partition: root_part2
- name: vg-data
devices:
- partition: rest_sda
- partition: rest_sdb
logicalVolumes:
- name: root
type: raid1 ## <-- LVM raid1
vg: vg-root
size: 119.9Gi
- name: data
type: linear
vg: vg-data
size: 0
fileSystems:
- fileSystem: ext4
logicalVolume: root
mountPoint: /
mountOpts: "noatime,nodiratime"
- fileSystem: ext4
logicalVolume: data
mountPoint: /mnt/data
Warning
All data will be wiped during cluster deployment on devices
defined directly or indirectly in the fileSystems list of
BareMetalHostProfile. For example:
A raw device partition with a file system on it
A device partition in a volume group with a logical volume that has a file system on it
An mdadm RAID device with a file system on it
An LVM RAID device with a file system on it
The wipe field is always considered true for these devices.
The false value is ignored.
Therefore, to prevent data loss, move the necessary data from these file systems to another server beforehand, if required.
TechPreview
You can configure an LVM volume group on top of mdadm-based RAID devices as
physical volumes using the BareMetalHostProfile resource. List the
required RAID devices in a separate field of the volumeGroups definition
within the storage configuration of BareMetalHostProfile.
You can use flexible size units throughout bare metal host profiles:
Ki, Mi, Gi, and so on. For example, size: 100Mi or
size: 1.5Gi that will be serialized as 1536Mi. The size without units
is counted in bytes. For example, size: 120 means 120 bytes.
Warning
All data will be wiped during cluster deployment on devices
defined directly or indirectly in the fileSystems list of
BareMetalHostProfile. For example:
A raw device partition with a file system on it
A device partition in a volume group with a logical volume that has a file system on it
An mdadm RAID device with a file system on it
An LVM RAID device with a file system on it
The wipe field is always considered true for these devices.
The false value is ignored.
Therefore, to prevent data loss, move the necessary data from these file systems to another server beforehand, if required.
The following example illustrates an extract of BaremetalHostProfile with
a volume group named lvm_nova to be created on top of an mdadm-based
RAID device raid1:
...
devices:
- device:
workBy: "by_id,by_wwn,by_path,by_name"
minSize: 60Gi
type: ssd
wipe: true
partitions:
- name: bios_grub
partflags:
- bios_grub
size: 4Mi
- name: uefi
partflags:
- esp
size: 200Mi
- name: config-2
size: 64Mi
- device:
workBy: "by_id,by_wwn,by_path,by_name"
minSize: 30Gi
type: ssd
wipe: true
partitions:
- name: md0_part1
- device:
workBy: "by_id,by_wwn,by_path,by_name"
minSize: 30Gi
type: ssd
wipe: true
partitions:
- name: md0_part2
softRaidDevices:
- devices:
- partition: md0_part1
- partition: md0_part2
level: raid1
metadata: "1.0"
name: /dev/md0
volumeGroups:
- devices:
- softRaidDevice: /dev/md0
name: lvm_nova
...
TechPreview
Warning
The EFI system partition partflags: ['esp'] must be
a physical partition in the main partition table of the disk, not under
LVM or mdadm software RAID.
During configuration of your custom bare metal host profile as described in
Create a custom bare metal host profile, you can create an mdadm-based software RAID
device raid0 and raid1 by describing the mdadm devices under the
softRaidDevices field in BaremetalHostProfile. For example:
...
softRaidDevices:
- name: /dev/md0
devices:
- partition: sda1
- partition: sdb1
- name: raid-name
devices:
- partition: sda2
- partition: sdb2
...
You can also use the raid10 type for the mdadm-based software RAID devices.
This type requires at least four and in total an even number of storage devices
available on your servers. For example:
softRaidDevices:
- name: /dev/md0
level: raid10
devices:
- partition: sda1
- partition: sdb1
- partition: sdd1
The following fields in softRaidDevices describe RAID devices:
nameName of the RAID device to refer to throughout the
baremetalhostprofile.
levelType or level of RAID used to create a device, defaults to
raid1. Set toraid0orraid10to create a device of the corresponding type.
devicesList of physical devices or partitions used to build a software RAID device. It must include at least two partitions or devices to build a
raid0andraid1devices and at least four forraid10.
For the rest of the mdadm RAID parameters, see BareMetalHostProfile spec.
Caution
The mdadm RAID devices cannot be created on top of LVM devices.
You can use flexible size units throughout bare metal host profiles:
Ki, Mi, Gi, and so on. For example, size: 100Mi or
size: 1.5Gi that will be serialized as 1536Mi. The size without units
is counted in bytes. For example, size: 120 means 120 bytes.
Warning
All data will be wiped during cluster deployment on devices
defined directly or indirectly in the fileSystems list of
BareMetalHostProfile. For example:
A raw device partition with a file system on it
A device partition in a volume group with a logical volume that has a file system on it
An mdadm RAID device with a file system on it
An LVM RAID device with a file system on it
The wipe field is always considered true for these devices.
The false value is ignored.
Therefore, to prevent data loss, move the necessary data from these file systems to another server beforehand, if required.
The following example illustrates an extract of BaremetalHostProfile
with / on the mdadm raid1 and some data storage on raid0:
Example with / on the mdadm raid1 and data storage on raid0
...
devices:
- device:
workBy: "by_id,by_wwn,by_path,by_name"
type: nvme
wipe: true
partitions:
- name: root_part1
size: 120Gi
partitions:
- name: rest_sda
size: 0
- device:
workBy: "by_id,by_wwn,by_path,by_name"
type: nvme
wipe: true
partitions:
- name: root_part2
size: 120Gi
partitions:
- name: rest_sdb
size: 0
softRaidDevices:
- name: root
level: raid1 ## <-- mdadm raid1
devices:
- partition: root_part1
- partition: root_part2
- name: raid-name
level: raid0 ## <-- mdadm raid0
devices:
- partition: rest_sda
- partition: rest_sdb
fileSystems:
- fileSystem: ext4
softRaidDevice: root
mountPoint: /
mountOpts: "noatime,nodiratime"
- fileSystem: ext4
softRaidDevice: data
mountPoint: /mnt/data
...
The following example illustrates an extract of BaremetalHostProfile
with data storage on a raid10 device:
Example with data storage on the mdadm raid10
...
devices:
- device:
workBy: "by_id,by_wwn,by_path,by_name"
minSize: 60Gi
type: ssd
wipe: true
partitions:
- name: bios_grub1
partflags:
- bios_grub
size: 4Mi
wipe: true
- name: uefi
partflags:
- esp
size: 200Mi
wipe: true
- name: config-2
size: 64Mi
wipe: true
- name: lvm_root
size: 0
wipe: true
- device:
workBy: "by_id,by_wwn,by_path,by_name"
minSize: 60Gi
type: nvme
wipe: true
partitions:
- name: md_part1
partflags:
- raid
size: 40Gi
wipe: true
- device:
workBy: "by_id,by_wwn,by_path,by_name"
minSize: 60Gi
type: nvme
wipe: true
partitions:
- name: md_part2
partflags:
- raid
size: 40Gi
wipe: true
- device:
workBy: "by_id,by_wwn,by_path,by_name"
minSize: 60Gi
type: nvme
wipe: true
partitions:
- name: md_part3
partflags:
- raid
size: 40Gi
wipe: true
- device:
workBy: "by_id,by_wwn,by_path,by_name"
minSize: 60Gi
type: nvme
wipe: true
partitions:
- name: md_part4
partflags:
- raid
size: 40Gi
wipe: true
fileSystems:
- fileSystem: vfat
partition: config-2
- fileSystem: vfat
mountPoint: /boot/efi
partition: uefi
- fileSystem: ext4
mountOpts: rw,noatime,nodiratime,lazytime,nobarrier,commit=240,data=ordered
mountPoint: /
partition: root
- filesystem: ext4
mountPoint: /var
softRaidDevice: /dev/md0
softRaidDevices:
- devices:
- partition: md_root_part1
- partition: md_root_part2
- partition: md_root_part3
- partition: md_root_part4
level: raid10
metadata: "1.2"
name: /dev/md0
...
TechPreview
Warning
The EFI system partition partflags: ['esp'] must be
a physical partition in the main partition table of the disk, not under
LVM or mdadm software RAID.
You can deploy MOSK on local software-based Redundant Array of Independent Disks (RAID) devices to withstand failure of one device at a time.
Using a custom bare metal host profile, you can configure and create
an mdadm-based software RAID device of type raid10 if you have
an even number of devices available on your servers. At least four
storage devices are required for such RAID device.
During configuration of your custom bare metal host profile as described in
Create a custom bare metal host profile, create an mdadm-based software RAID device
raid10 by describing the mdadm devices under the softRaidDevices
field. For example:
...
softRaidDevices:
- name: /dev/md0
level: raid10
devices:
- partition: sda1
- partition: sdb1
- partition: sdc1
- partition: sdd1
...
The following fields in softRaidDevices describe RAID devices:
nameName of the RAID device to refer to throughout the
baremetalhostprofile.
devicesList of physical devices or partitions used to build a software RAID device. It must include at least four partitions or devices to build a
raid10device.
levelType or level of RAID used to create device. Set to
raid10orraid1to create a device of the corresponding type.
For the rest of the mdadm RAID parameters, see BareMetalHostProfile spec.
Caution
The mdadm RAID devices cannot be created on top of an LVM device.
The following example illustrates an extract of baremetalhostprofile
with data storage on a raid10 device:
...
devices:
- device:
minSize: 60Gi
wipe: true
partitions:
- name: bios_grub1
partflags:
- bios_grub
size: 4Mi
wipe: true
- name: uefi
partflags:
- esp
size: 200Mi
wipe: true
- name: config-2
size: 64Mi
wipe: true
- name: lvm_root
size: 0
wipe: true
- device:
minSize: 60Gi
wipe: true
partitions:
- name: md_part1
partflags:
- raid
size: 40Gi
wipe: true
- device:
minSize: 60Gi
wipe: true
partitions:
- name: md_part2
partflags:
- raid
size: 40Gi
wipe: true
- device:
minSize: 60Gi
wipe: true
partitions:
- name: md_part3
partflags:
- raid
size: 40Gi
wipe: true
- device:
minSize: 60Gi
wipe: true
partitions:
- name: md_part4
partflags:
- raid
size: 40Gi
wipe: true
fileSystems:
- fileSystem: vfat
partition: config-2
- fileSystem: vfat
mountPoint: /boot/efi
partition: uefi
- fileSystem: ext4
mountOpts: rw,noatime,nodiratime,lazytime,nobarrier,commit=240,data=ordered
mountPoint: /
partition: root
- filesystem: ext4
mountPoint: /var
softRaidDevice: /dev/md0
softRaidDevices:
- devices:
- partition: md_root_part1
- partition: md_root_part2
- partition: md_root_part3
- partition: md_root_part4
level: raid10
metadata: "1.2"
name: /dev/md0
...
Warning
When building the raid10 array on top of device partitions,
make sure that only one partition per device is used for a given array.
Although having two partitions located on the same physical device as array members is technically possible, it may lead to data loss if mdadm selects both partitions of the same drive to be mirrored. In such case, redundancy against entire drive failure is lost.
Warning
All data will be wiped during cluster deployment on devices
defined directly or indirectly in the fileSystems list of
BareMetalHostProfile. For example:
A raw device partition with a file system on it
A device partition in a volume group with a logical volume that has a file system on it
An mdadm RAID device with a file system on it
An LVM RAID device with a file system on it
The wipe field is always considered true for these devices.
The false value is ignored.
Therefore, to prevent data loss, move the necessary data from these file systems to another server beforehand, if required.
Create a MOSK cluster
With L2 networking templates, you can create MOSK clusters with advanced host networking configurations. For example, you can create bond interfaces on top of physical interfaces on the host or use multiple subnets to separate different types of network traffic.
You can use several host-specific L2 templates per one cluster to support different hardware configurations. For example, you can create L2 templates with a different number and layout of NICs to be applied to specific machines of one cluster.
You can also use multiple L2 templates to support different roles for nodes in a MOSK installation. You can create L2 templates with different logical interfaces and assign them to individual machines based on their roles in a MOSK cluster.
Caution
Modification of L2 templates in use is only allowed with a mandatory validation step from the infrastructure operator to prevent accidental cluster failures due to unsafe changes. The list of risks posed by modifying L2 templates includes:
Services running on hosts cannot reconfigure automatically to switch to the new IP addresses and/or interfaces.
Connections between services are interrupted unexpectedly, which can cause data loss.
Incorrect configurations on hosts can lead to irrevocable loss of connectivity between services and unexpected cluster partition or disassembly.
For details, see Modify network configuration on an existing machine.
Since MOSK 23.2.2, in the Technology Preview scope, you can create a MOSK cluster with the multi-rack topology, where cluster nodes including Kubernetes masters are distributed across multiple racks without L2 layer extension between them, and use BGP for announcement of the cluster API load balancer address and external addresses of Kubernetes load-balanced services.
Implementation of the multi-rack topology implies the use of Rack and
MultiRackCluster objects that support configuration of BGP announcement
of the cluster API load balancer address. For the configuration procedure,
refer to Configure BGP announcement for cluster API LB address. For configuring the BGP announcement of
external addresses of Kubernetes load-balanced services, refer to
Configure and verify MetalLB.
Follow the procedures described in the below subsections to configure initial settings and advanced network objects for your managed clusters.
Create a managed bare metal cluster
This section instructs you on how to configure and deploy a managed cluster that is based on the baremetal-based management cluster through the Mirantis Container Cloud web UI.
Note
Due to the known issue 50181, creation of a compact managed cluster or addition of any labels to the control plane nodes is not available through the Container Cloud web UI.
To create a managed cluster on bare metal:
Available since the Cluster release 16.1.0 on the management cluster. If you plan to deploy a large managed cluster, enable dynamic IP allocation to increase the amount of baremetal hosts to be provisioned in parallel. For details, see Enable dynamic IP allocation.
Available since Container Cloud 2.24.0 (Cluster release 14.0.0). Optional. Technology Preview. Enable custom host names for cluster machines. When enabled, any machine host name in a particular region matches the related
Machineobject name. For example, instead of the defaultkaas-node-<UID>, a machine host name will bemaster-0. The custom naming format is more convenient and easier to operate with.For details, see Configure host names for cluster machines.
Skip this step if you enabled this feature during management cluster bootstrap, because custom host names will be automatically enabled on the related managed cluster as well.
Log in to the Container Cloud web UI with the
writerpermissions.Switch to the required non-
defaultproject using the Switch Project action icon located on top of the main left-side navigation panel.Caution
Do not create a MOSK cluster in the
defaultproject (Kubernetes namespace), which is dedicated for the management cluster only. If no projects are defined, first create a newmoskproject as described in Create a project for MOSK clusters.In the SSH keys tab, click Add SSH Key to upload the public SSH key that will be used for the SSH access to VMs.
Optional. Enable proxy access to the managed cluster:
Proxy configuration
In the Proxies tab, configure proxy:
Click Add Proxy.
In the Add New Proxy wizard, fill out the form with the following parameters:
Proxy configuration¶ Parameter
Description
Proxy Name
Name of the proxy server to use during MOSK cluster creation.
Region Removed in MCC 2.26.0 (16.1.0 and 17.1.0)
From the drop-down list, select the required region.
HTTP Proxy
Add the HTTP proxy server domain name in the following format:
http://proxy.example.com:port- for anonymous accesshttp://user:password@proxy.example.com:port- for restricted access
HTTPS Proxy
Add the HTTPS proxy server domain name in the same format as for HTTP Proxy.
No Proxy
Comma-separated list of IP addresses or domain names.
For implementation details, see Proxy support and cache of artifacts.
If your proxy requires a trusted CA certificate, select the CA Certificate check box and paste a CA certificate for a MITM proxy to the corresponding field or upload a certificate using Upload Certificate.
Note
The possibility to use a MITM proxy with a CA certificate is available since MOSK 23.1.
For the list of Mirantis resources and IP addresses to be accessible from MOSK clusters, see Reference Architecture: Requirements.
In the Clusters tab, click Create Cluster.
Configure the new cluster in the Create New Cluster wizard that opens:
Define general and Kubernetes parameters:
Create new cluster: General, Provider, and Kubernetes¶ Section
Parameter name
Description
General settings
Cluster name
The cluster name.
Provider
Select Baremetal.
Region Removed since MOSK 24.1
From the drop-down list, select Baremetal.
Release version
Select a Container Cloud version with the OpenStack label tag. Otherwise, you will not be able to deploy MOSK on this managed cluster.
Proxy
Optional. From the drop-down list, select the proxy server name that you have previously created.
SSH keys
From the drop-down list, select the SSH key name that you have previously added for SSH access to the bare metal hosts.
Container Registry
From the drop-down list, select the Docker registry name that you have previously added using the Container Registries tab. For details, see Define a custom CA certificate for a private Docker registry.
Enable WireGuard
Optional. Technology Preview. Deprecated since Container Cloud 2.29.0 (Cluster releases 17.4.0 and 16.4.0). Available since Container Cloud 2.24.0 (Cluster release 14.0.0). Enable WireGuard for traffic encryption on the Kubernetes workloads network.
WireGuard configuration
Ensure that the Calico MTU size is at least 60 bytes smaller than the interface MTU size of the workload network. IPv4 WireGuard uses a 60-byte header. For details, see Set the MTU size for Calico.
Enable WireGuard by selecting the Enable WireGuard check box.
Caution
Changing this parameter on a running cluster causes a downtime that can vary depending on the cluster size.
Note
This parameter was renamed from Enable Secure Overlay to Enable WireGuard in Container Cloud 2.25.0 (Cluster releases 17.0.0 and 16.0.0).
For more details about WireGuard, see Calico documentation: Encrypt in-cluster pod traffic.
Parallel Upgrade Of Worker Machines
Optional. Available since Container Cloud 2.25.0 (Cluster releases 17.0.0 and 16.0.0).
The maximum number of the worker nodes to update simultaneously. It serves as an upper limit on the number of machines that are drained at a given moment of time. Defaults to
1.You can also configure this option after deployment before the cluster update.
Parallel Preparation For Upgrade Of Worker Machines
Optional. Available since Container Cloud 2.25.0 (Cluster releases 17.0.0 and 16.0.0)
The maximum number of worker nodes being prepared at a given moment of time, which includes downloading of new artifacts. It serves as a limit for the network load that can occur when downloading the files to the nodes. Defaults to
50.You can also configure this option after deployment before the cluster update.
Provider
LB host IP
The IP address of the load balancer endpoint that will be used to access the Kubernetes API of the new cluster. This IP address must be located in the API/LCM or external network for ARP announcement and in the LCM or external network for BGP announcement.
See Underlay networking: routing configuration for details.
LB address range Removed in 24.3
The range of IP addresses that can be assigned to load balancers for Kubernetes Services by MetalLB. For a more flexible MetalLB configuration, refer to Configure and verify MetalLB.
Note
Since MOSK 24.3, MetalLB configuration must be added after cluster creation.
Kubernetes
Services CIDR blocks
The Kubernetes Services CIDR blocks. For example,
10.233.0.0/18.Pods CIDR blocks
The Kubernetes pods CIDR blocks. For example,
10.233.64.0/18.Note
The network subnet size of Kubernetes pods influences the number of nodes that can be deployed in the cluster.
The default subnet size
/18is enough to create a cluster with up to 256 nodes. Each node uses the/26address blocks (64 addresses), at least one address block is allocated per node. These addresses are used by the Kubernetes pods withhostNetwork: false. The cluster size may be limited further when some nodes use more than one address block.Configure StackLight:
Note
If StackLight is enabled in non-HA mode but Ceph is not deployed yet, StackLight will not be installed and will be stuck in the
Yellowstate waiting for a successful Ceph installation. Once the Ceph cluster is deployed, the StackLight installation resumes. To deploy a Ceph cluster, refer to Add a Ceph cluster prior to MOSK 25.2.StackLight configuration
Section
Parameter name
Description
StackLight
Enable Monitoring
Selected by default. Deselect to skip StackLight deployment.
Note
You can also enable, disable, or configure StackLight parameters after deploying a managed cluster. For details, see Change a cluster configuration and StackLight configuration procedure.
Enable Logging
Select to deploy the StackLight logging stack. For details about the logging components, see Deployment architecture.
Note
The logging mechanism performance depends on the cluster log load. In case of a high load, you may need to increase the default resource requests and limits for
fluentdLogs. For details, see StackLight resource limits.HA Mode
Select to enable StackLight monitoring in High Availability (HA) mode. For differences between HA and non-HA modes, see Deployment architecture. If disabled, StackLight requires a Ceph cluster. To deploy a Ceph cluster, refer to Add a Ceph cluster prior to MOSK 25.2.
StackLight Default Logs Severity Level
Log severity (verbosity) level for all StackLight components. The default value for this parameter is Default component log level that respects original defaults of each StackLight component. For details about severity levels, see StackLight log verbosity.
StackLight Component Logs Severity Level
The severity level of logs for a specific StackLight component that overrides the value of the StackLight Default Logs Severity Level parameter. For details about severity levels, see StackLight log verbosity. Expand the drop-down menu for a specific component to display its list of available log levels.
OpenSearch
Logstash Retention Time Removed in MOSK 24.1
Available if you select Enable Logging. Specifies the
logstash-*index retention time.Events Retention Time
Available if you select Enable Logging. Specifies the
kubernetes_events-*index retention time.Notifications Retention Time
Available if you select Enable Logging. Specifies the
notification-*index retention time.Persistent Volume Claim Size
Available if you select Enable Logging. The OpenSearch persistent volume claim size.
Collected Logs Severity Level
Available if you select Enable Logging. The minimum severity of all Container Cloud components logs collected in OpenSearch. For details about severity levels, see StackLight logging.
Prometheus
Retention Time
The Prometheus database retention period.
Retention Size
The Prometheus database retention size.
Persistent Volume Claim Size
The Prometheus persistent volume claim size.
Enable Watchdog Alert
Select to enable the Watchdog alert that fires as long as the entire alerting pipeline is functional.
Custom Alerts
Specify alerting rules for new custom alerts or upload a YAML file in the following exemplary format:
- alert: HighErrorRate expr: job:request_latency_seconds:mean5m{job="myjob"} > 0.5 for: 10m labels: severity: page annotations: summary: High request latency
For details, see Official Prometheus documentation: Alerting rules. For the list of the predefined StackLight alerts, see Operations Guide: StackLight alerts.
StackLight Email Alerts
Enable Email Alerts
Select to enable the StackLight email alerts.
Send Resolved
Select to enable notifications about resolved StackLight alerts.
Require TLS
Select to enable transmitting emails through TLS.
Email alerts configuration for StackLight
Fill out the following email alerts parameters as required:
To - the email address to send notifications to.
From - the sender address.
SmartHost - the SMTP host through which the emails are sent.
Authentication username - the SMTP user name.
Authentication password - the SMTP password.
Authentication identity - the SMTP identity.
Authentication secret - the SMTP secret.
StackLight Slack Alerts
Enable Slack alerts
Select to enable the StackLight Slack alerts.
Send Resolved
Select to enable notifications about resolved StackLight alerts.
Slack alerts configuration for StackLight
Fill out the following Slack alerts parameters as required:
API URL - The Slack webhook URL.
Channel - The channel to send notifications to, for example, #channel-for-alerts.
Click Create.
To monitor cluster readiness, see Verify cluster status.
Available since Container Cloud 2.24.0 (Cluster releases 14.0.0 and 15.0.1). Optional. Technology Preview. Enable the Linux Audit daemon auditd to monitor activity of cluster processes and prevent potential malicious activity.
Configuration for auditd
In the
Clusterobject orcluster.yaml.template, add the auditd parameters:spec: providerSpec: value: audit: auditd: enabled: <bool> enabledAtBoot: <bool> backlogLimit: <int> maxLogFile: <int> maxLogFileAction: <string> maxLogFileKeep: <int> mayHaltSystem: <bool> presetRules: <string> customRules: <string> customRulesX32: <text> customRulesX64: <text>
Configuration parameters for auditd:
enabledBoolean, default -
false. Enables theauditdrole to install the auditd packages and configure rules. CIS rules: 4.1.1.1, 4.1.1.2.enabledAtBootBoolean, default -
false. Configures grub to audit processes that can be audited even if they start up prior to auditd startup. CIS rule: 4.1.1.3.backlogLimitInteger, default - none. Configures the backlog to hold records. If during boot
audit=1is configured, the backlog holds 64 records. If more than 64 records are created during boot, auditd records will be lost with a potential malicious activity being undetected. CIS rule: 4.1.1.4.maxLogFileInteger, default - none. Configures the maximum size of the audit log file. Once the log reaches the maximum size, it is rotated and a new log file is created. CIS rule: 4.1.2.1.
maxLogFileActionString, default - none. Defines handling of the audit log file reaching the maximum file size. Allowed values:
keep_logs- rotate logs but never delete themrotate- add a cron job to compress rotated log files and keep maximum 5 compressed files.compress- compress log files and keep them under the/var/log/auditd/directory. Requiresauditd_max_log_file_keepto be enabled.
CIS rule: 4.1.2.2.
maxLogFileKeepInteger, default -
5. Defines the number of compressed log files to keep under the/var/log/auditd/directory. Requiresauditd_max_log_file_action=compress. CIS rules - none.mayHaltSystemBoolean, default -
false. Halts the system when the audit logs are full. Applies the following configuration:space_left_action = emailaction_mail_acct = rootadmin_space_left_action = halt
CIS rule: 4.1.2.3.
customRulesString, default - none. Base64-encoded content of the
60-custom.rulesfile for any architecture. CIS rules - none.customRulesX32String, default - none. Base64-encoded content of the
60-custom.rulesfile for thei386architecture. CIS rules - none.customRulesX64String, default - none. Base64-encoded content of the
60-custom.rulesfile for thex86_64architecture. CIS rules - none.presetRulesString, default - none. Comma-separated list of the following built-in preset rules:
accessactionsdeletedocker
identityimmutableloginsmac-policy
modulesmountsperm-modprivileged
scopesessionsystem-localetime-change
Since Container Cloud 2.28.0 (Cluster releases 17.3.0 and 16.3.0) in the Technology Preview scope, you can collect some of the preset rules indicated above as groups and use them in
presetRules:ubuntu-cis-rules- this group contains rules to comply with the Ubuntu CIS Benchmark recommendations, including the following CIS Ubuntu 20.04 v2.0.1 rules:scope- 5.2.3.1actions- same as 5.2.3.2time-change- 5.2.3.4system-locale- 5.2.3.5privileged- 5.2.3.6access- 5.2.3.7identity- 5.2.3.8
perm-mod- 5.2.3.9mounts- 5.2.3.10session- 5.2.3.11logins- 5.2.3.12delete- 5.2.3.13mac-policy- 5.2.3.14modules- 5.2.3.19
docker-cis-rules- this group contains rules to comply with Docker CIS Benchmark recommendations, including thedockerDocker CIS v1.6.0 rules 1.1.3 - 1.1.18.
You can also use two additional keywords inside
presetRules:none- select no built-in rules.all- select all built-in rules. When using this keyword, you can add the!prefix to a rule name to exclude some rules. You can use the!prefix for rules only if you add theallkeyword as the first rule. Place a rule with the!prefix only after theallkeyword.
Example configurations:
presetRules: none- disable all preset rulespresetRules: docker- enable only thedockerrulespresetRules: access,actions,logins- enable only theaccess,actions, andloginsrulespresetRules: ubuntu-cis-rules- enable all rules from theubuntu-cis-rulesgrouppresetRules: docker-cis-rules,actions- enable all rules from thedocker-cis-rulesgroup and theactionsrulepresetRules: all- enable all preset rulespresetRules: all,!immutable,!sessions- enable all preset rules exceptimmutableandsessions
CIS controls
4.1.3 (time-change)4.1.4 (identity)4.1.5 (system-locale)4.1.6 (mac-policy)4.1.7 (logins)4.1.8 (session)4.1.9 (perm-mod)4.1.10 (access)4.1.11 (privileged)4.1.12 (mounts)4.1.13 (delete)4.1.14 (scope)4.1.15 (actions)4.1.16 (modules)4.1.17 (immutable)Docker CIS controls
1.1.41.1.81.1.101.1.121.1.131.1.151.1.161.1.171.1.181.2.31.2.41.2.51.2.61.2.71.2.101.2.11
Optional. Colocate the OpenStack control plane with the managed cluster Kubernetes manager nodes by adding the following field to the
Clusterobject spec:spec: providerSpec: value: dedicatedControlPlane: false
Note
This feature is available as technical preview. Use such configuration for testing and evaluation purposes only.
Optional. Customize MetalLB speakers that are deployed on all Kubernetes nodes except master nodes by default. For details, see Configure node selectors for MetalLB speakers.
Configure the MetalLB parameters related to IP address allocation and announcement for load-balanced cluster services. For details, see Configure and verify MetalLB.
Proceed to Obtain and use details about network interfaces.
Note
Once you have created a MOSK cluster, some StackLight alerts may raise as false-positive until you deploy the Mirantis OpenStack environment.
Configure MetalLB
Before configuring subnets for a MOSK cluster, set up and verify MetalLB parameters as described in the following subsections.
This section describes how to set up and verify MetalLB parameters before configuring subnets for a MOSK cluster.
Caution
This section also applies to the bootstrap procedure of a management cluster with the following differences:
Instead of the
Clusterobject, configuretemplates/bm/cluster.yaml.template.Instead of the
MetalLBConfigobject, configuretemplates/bm/metallbconfig.yaml.template.Instead of creating specific IPAM objects such as
SubnetandL2Template(as well asRackandMultiRackClusterwhen using BGP configuration), add their settings totemplates/bm/ipam-objects.yaml.template.
Caution
The use of the MetalLBConfig object is mandatory after your
management cluster upgrade to the Cluster release 16.0.0.
The following rules and requirements apply to configuration of the
MetalLBConfig object:
Define one
MetalLBConfigobject per cluster.Define the following mandatory labels:
cluster.sigs.k8s.io/cluster-nameSpecifies the cluster name where the MetalLB address pool is used.
kaas.mirantis.com/regionSpecifies the region name of the cluster where the MetalLB address pool is used.
kaas.mirantis.com/providerSpecifies the provider of the cluster where the MetalLB address pool is used.
Note
The
kaas.mirantis.com/regionlabel is removed from all MOSK objects in 24.1. Therefore, do not add the label starting with this release. On existing clusters updated to this release, or if added manually, MOSK ignores this label.Intersection of IP address ranges within any single MetalLB address pool is not allowed.
At least one MetalLB address pool must have the auto-assign policy enabled so that unannotated services can have load balancer IP addresses allocated for them.
When configuring multiple address pools with the auto-assign policy enabled, keep in mind that it is not determined in advance which pool of those multiple address pools is used to allocate an IP address for a particular unannotated service.
Note
You can optimize address announcement for load-balanced services
using the interfaces selector for the l2Advertisements object. This
selector allows for address announcement only on selected host interfaces.
For details, see MetalLBConfig spec.
Configuration rules for MetalLBConfigTemplate (obsolete since 24.2)
Caution
The MetalLBConfigTemplate object is deprecated since
MOSK 24.2 and unsupported since
MOSK 24.3. For details, see
Deprecation notes.
All rules described above for
MetalLBConfigalso apply toMetalLBConfigTemplate.Optional. Define one
MetalLBConfigTemplateobject per cluster. The use of this object withoutMetalLBConfigis not allowed.When using
MetalLBConfigTemplate:MetalLBConfigmust referenceMetalLBConfigTemplateby name:spec: templateName: <managed-metallb-template>
You can use
Subnetobjects for defining MetalLB address pools. Refer to MetalLB configuration guidelines for subnets for guidelines on configuring MetalLB address pools usingSubnetobjects.You can optimize address announcement for load-balanced services using the
interfacesselector for thel2Advertisementsobject. This selector allows for address announcement only on selected host interfaces. For details, see MetalLBConfigTemplate spec.
Available since MOSK 24.3
Note
The BGP configuration is not yet supported in the Container Cloud web UI. Meantime, use the CLI for this purpose. For details, see Configure and verify MetalLB using the CLI.
Read the MetalLB configuration guidelines described in Configuration rules for the ‘MetalLBConfig’ object.
Optional. Configure parameters related to MetalLB components life cycle such as deployment and update using the
metallbHelm chart values in theClusterspecsection. For example:Increase Pod resource limits for MetalLB as described in Limits for common components of any cluster type.
Configure Pod node selectors or affinity for MetalLB speakers as described in Configure node selectors for MetalLB speakers.
Log in to the Container Cloud web UI with the
writerpermissions.Switch to the required non-
defaultproject using the Switch Project action icon located on top of the main left-side navigation panel.Caution
Do not create a MOSK cluster in the
defaultproject (Kubernetes namespace), which is dedicated for the management cluster only. If no projects are defined, first create a newmoskproject as described in Create a project for MOSK clusters.In the Networks section, click the MetalLB Configs tab.
Click Create MetalLB Config.
Fill out the Create MetalLB Config form as required:
- Name
Name of the
MetalLBobject being created.
- Cluster
Name of the cluster that the
MetalLBobject is being created for
- IP Address Pools
List of MetalLB IP address pool descriptions that will be used to create the MetalLB
IPAddressPoolobjects. Click the + button on the right side of the section to add more objects.- Name
IP address pool name.
- Addresses
Comma-separated ranges of the IP addresses included into the address pool.
- Auto Assign
Enable auto-assign policy for unannotated services to have load balancer IP addresses allocated to them. At least one MetalLB address pool must have the auto-assign policy enabled.
- Service Allocation
IP address pool allocation to services. Click Edit to insert a service allocation object with required label selectors for services in the YAML format. For example:
serviceSelectors: - matchExpressions: - key: app.kubernetes.io/name operator: NotIn values: - dhcp-lb
For details on the MetalLB
IPAddressPoolobject type, see MetalLB documentation.- L2 Advertisements
List of
MetalLBL2Advertisementobjects to create MetalLBL2Advertisementobjects.The
l2Advertisementsobject allows defining interfaces to optimize the announcement. When you use theinterfacesselector, LB addresses are announced only on selected host interfaces.Mirantis recommends using the
interfacesselector if nodes use separate host networks for different types of traffic. The pros of such configuration are as follows: less spam on other interfaces and networks and limited chances to reach IP addresses of load-balanced services from irrelevant interfaces and networks.Caution
Interface names in the
interfaceslist must match those on the corresponding nodes.Add the following parameters:
- Name
Name of the
l2Advertisementsobject.
- Interfaces
Optional. Comma-separated list of interface names that must match the ones on the corresponding nodes. These names are defined in L2 templates that are linked to the selected cluster.
- IP Address Pools
Select the IP adress pool to use for the
l2Advertisementsobject.
- Node Selectors
Optional. Match labels and values for the Kubernetes node selector to limit the nodes announced as next hops for the
LoadBalancerIP. If you do not provide any labels, all nodes are announced as next hops.
For details on the MetalLB
L2Advertisementsobject type, see MetalLB documentation.
Click Create.
In Networks > MetalLB Configs, verify the status of the created MetalLB object:
Ready - object is operational.
Error - object is non-operational. Hover over the status to obtain details of the issue.
Note
To verify the object details, in Networks > MetalLB Configs, click the More action icon in the last column of the required object section and select MetalLB Config info.
Proceed to creating cluster subnets as described in Create subnets.
Optional. Configure parameters related to MetalLB components life cycle such as deployment and update using the
metallbHelm chart values in theClusterspecsection. For example:Increase Pod resource limits for MetalLB as described in Limits for common components of any cluster type.
Configure Pod node selectors or affinity for MetalLB speakers as described in Configure node selectors for MetalLB speakers.
Configure the MetalLB parameters related to IP address allocation and announcement for load-balanced cluster services:
Since MOSK 24.2
Mandatory after a management cluster upgrade to the Cluster release 17.2.0. Recommended and default since MOSK 24.2.
Create the
MetalLBConfigobject:For configuration rules and requirements, see Configuration rules for the ‘MetalLBConfig’ object.
For the object description, see MetalLBConfig.
For configuration examples that use
MetalLBConfig, see the following sections in the Container Cloud documentation:Example of a complete template configuration for cluster creation (the MetalLB configuration objects step)
In the Technology Preview scope, you can use BGP for announcement of external addresses of Kubernetes load-balanced services for a MOSK cluster. To configure the BGP announcement mode for MetalLB, use
MetalLBConfigobject.The use of BGP is required to announce IP addresses for load-balanced services when using MetalLB on nodes that are distributed across multiple racks. In this case, setting of
rack-idlabels on nodes is required, they are used in node selectors forBGPPeer,BGPAdvertisement, or both MetalLB objects to properly configure BGP connections from each node.Configuration example of the
Machineobject for the BGP announcement modeapiVersion: cluster.k8s.io/v1alpha1 kind: Machine metadata: name: test-cluster-compute-1 namespace: mosk-ns labels: cluster.sigs.k8s.io/cluster-name: test-cluster ipam/RackRef: rack-1 # reference to the "rack-1" Rack kaas.mirantis.com/provider: baremetal spec: providerSpec: value: ... nodeLabels: - key: rack-id # node label can be used in "nodeSelectors" inside value: rack-1 # "BGPPeer" and/or "BGPAdvertisement" MetalLB objects ...
Configuration example of the
MetalLBConfigobject for the BGP announcement modeapiVersion: ipam.mirantis.com/v1alpha1 kind: MetalLBConfig metadata: name: test-cluster-metallb-config namespace: mosk-ns labels: cluster.sigs.k8s.io/cluster-name: test-cluster kaas.mirantis.com/provider: baremetal spec: ... bgpPeers: - name: svc-peer-1 spec: holdTime: 0s keepaliveTime: 0s peerAddress: 10.77.42.1 peerASN: 65100 myASN: 65101 nodeSelectors: - matchLabels: rack-id: rack-1 # references the nodes having # the "rack-id=rack-1" label bgpAdvertisements: - name: services spec: aggregationLength: 32 aggregationLengthV6: 128 ipAddressPools: - services peers: - svc-peer-1 ...
The
bgpPeersandbgpAdvertisementsfields are used to configure BGP announcement instead ofl2Advertisements.The use of BGP for announcement also allows for better balancing of service traffic between cluster nodes as well as gives more configuration control and flexibility for infrastructure administrators. For configuration examples, refer to MetalLB configuration examples. For configuration procedure, refer to Configure BGP announcement for cluster API LB address.
Since MOSK 23.2
Select from the following options:
Deprecated since MOSK 24.2 and unsupported since MOSK 24.3. Mandatory after a management cluster upgrade to the Cluster release 16.0.0. Recommended and default since MOSK 23.2 in the Technology Preview scope. Create
MetalLBConfigandMetalLBConfigTemplateobjects. This method allows using theSubnetobject to define MetalLB address pools.For configuration rules and requirements, see Configuration rules for the ‘MetalLBConfig’ object.
For objects description, see MetalLBConfig and MetalLBConfigTemplate.
For configuration examples that use
MetalLBConfigandMetalLBConfigTemplate, see the following sections in Container Cloud documentation:Example of a complete template configuration for cluster creation (the MetalLB configuration objects step)
Since MOSK 23.2.2, in the Technology Preview scope, you can use BGP for announcement of external addresses of Kubernetes load-balanced services for a MOSK cluster. To configure the BGP announcement mode for MetalLB, use
MetalLBConfigandMetalLBConfigTemplateobjects.The use of BGP is required to announce IP addresses for load-balanced services when using MetalLB on nodes that are distributed across multiple racks. In this case, setting of
rack-idlabels on nodes is required, they are used in node selectors forBGPPeer,BGPAdvertisement, or both MetalLB objects to properly configure BGP connections from each node.Configuration example of the
Machineobject for the BGP announcement modeapiVersion: cluster.k8s.io/v1alpha1 kind: Machine metadata: name: test-cluster-compute-1 namespace: mosk-ns labels: cluster.sigs.k8s.io/cluster-name: test-cluster ipam/RackRef: rack-1 # reference to the "rack-1" Rack kaas.mirantis.com/provider: baremetal kaas.mirantis.com/region: region-one spec: providerSpec: value: ... nodeLabels: - key: rack-id # node label can be used in "nodeSelectors" inside value: rack-1 # "BGPPeer" and/or "BGPAdvertisement" MetalLB objects ...
Note
The
kaas.mirantis.com/regionlabel is removed from all MOSK objects in 24.1. Therefore, do not add the label starting with this release. On existing clusters updated to this release, or if added manually, MOSK ignores this label.Configuration example of the
MetalLBConfigTemplateobject for the BGP announcement modeapiVersion: ipam.mirantis.com/v1alpha1 kind: MetalLBConfigTemplate metadata: name: test-cluster-metallb-config-template namespace: mosk-ns labels: cluster.sigs.k8s.io/cluster-name: test-cluster kaas.mirantis.com/provider: baremetal kaas.mirantis.com/region: region-one spec: templates: ... bgpPeers: | - name: svc-peer-1 spec: peerAddress: 10.77.42.1 peerASN: 65100 myASN: 65101 nodeSelectors: - matchLabels: rack-id: rack-1 # references the nodes having # the "rack-id=rack-1" label bgpAdvertisements: | - name: services spec: ipAddressPools: - services peers: - svc-peer-1 ...
Note
The
kaas.mirantis.com/regionlabel is removed from all MOSK objects in 24.1. Therefore, do not add the label starting with this release. On existing clusters updated to this release, or if added manually, MOSK ignores this label.The
bgpPeersandbgpAdvertisementsfields are used to configure BGP announcement instead ofl2Advertisements.The use of BGP for announcement also allows for better balancing of service traffic between cluster nodes as well as gives more configuration control and flexibility for infrastructure administrators. For configuration examples, refer to MetalLBConfigTemplate. For configuration procedure, refer to Configure BGP announcement for cluster API LB address.
Not recommended. Configure the
configInlinevalue in the MetalLB chart of theClusterobject.Warning
This option is deprecated since MOSK 23.2 and is removed during the management cluster upgrade to the Cluster release 16.0.0, which is introduced in Container Cloud 2.25.0.
Therefore, this option becomes unavailable on MOSK 23.2 clusters after the parent management cluster upgrade to 2.25.0.
Not recommended. Configure the
Subnetobjects withoutMetalLBConfigTemplate.Warning
This option is deprecated since MOSK 23.2 and is removed during the management cluster upgrade to the Cluster release 16.0.0, which is introduced in Container Cloud 2.25.0.
Therefore, this option becomes unavailable on MOSK 23.2 clusters after the parent management cluster upgrade to 2.25.0.
Caution
If the
MetalLBConfigobject is not used for MetalLB configuration related to address allocation and announcement for load-balanced services, then automated migration applies during cluster creation or update to MOSK 23.2.During automated migration, the
MetalLBConfigandMetalLBConfigTemplateobjects are created and contents of the MetalLB chartconfigInlinevalue is converted to the parameters of theMetalLBConfigTemplateobject.Any change to the
configInlinevalue made on a MOSK 23.2 cluster will be reflected in theMetalLBConfigTemplateobject.This automated migration is removed during your management cluster upgrade to the Cluster release 16.0.0, which is introduced in Container Cloud 2.25.0, together with the possibility to use the
configInlinevalue of the MetalLB chart. After that, any changes in MetalLB configuration related to address allocation and announcement for load-balanced services are applied using theMetalLBConfig,MetalLBConfigTemplate, andSubnetobjects only.Before MOSK 23.2
Select from the following options:
Configure
Subnetobjects. For details, see MetalLB configuration guidelines for subnets.Configure the
configInlinevalue for the MetalLB chart in theClusterobject.Configure both the
configInlinevalue for the MetalLB chart andSubnetobjects.The resulting MetalLB address pools configuration will contain address ranges from both cluster specification and
Subnetobjects. All address ranges for L2 address pools will be aggregated into a single L2 address pool and sorted as strings.
Changes to be applied since MOSK 23.2
The configuration options above become deprecated since 23.2, and automated migration of MetalLB parameters applies during cluster creation or update to MOSK 23.2.
During automated migration, the
MetalLBConfigandMetalLBConfigTemplateobjects are created and contents of the MetalLB chartconfigInlinevalue is converted to the parameters of theMetalLBConfigTemplateobject.Any change to the
configInlinevalue made on a MOSK 23.2 cluster will be reflected in theMetalLBConfigTemplateobject.This automated migration is removed during your management cluster upgrade to Container Cloud 2.25.0 together with the possibility to use the
configInlinevalue of the MetalLB chart. After that, any changes in MetalLB configuration related to address allocation and announcement for load-balanced services will be applied using theMetalLBConfigTemplateandSubnetobjects only.Verify the current MetalLB configuration:
Verify the MetalLB configuration that is stored in
MetalLBobjects:kubectl -n metallb-system get ipaddresspools,l2advertisements
The example system output:
NAME AGE ipaddresspool.metallb.io/default 129m ipaddresspool.metallb.io/services-pxe 129m NAME AGE l2advertisement.metallb.io/default 129m l2advertisement.metallb.io/services-pxe 129m
Verify one of the listed above
MetalLBobjects:kubectl -n metallb-system get <object> -o json | jq '.spec'
The example system output for
ipaddresspoolobjects:$ kubectl -n metallb-system get ipaddresspool.metallb.io/default -o json | jq '.spec' { "addresses": [ "10.0.11.61-10.0.11.80" ], "autoAssign": true, "avoidBuggyIPs": false } $ kubectl -n metallb-system get ipaddresspool.metallb.io/services-pxe -o json | jq '.spec' { "addresses": [ "10.0.0.61-10.0.0.70" ], "autoAssign": false, "avoidBuggyIPs": false }
Verify the MetalLB configuration that is stored in the
ConfigMapobject:kubectl -n metallb-system get cm metallb -o jsonpath={.data.config}
An example of a successful output:
address-pools: - name: default protocol: layer2 addresses: - 10.0.11.61-10.0.11.80 - name: services-pxe protocol: layer2 auto-assign: false addresses: - 10.0.0.61-10.0.0.70
The
auto-assignparameter will be set tofalsefor all address pools except thedefaultone. So, a particular service will get an address from such an address pool only if theServiceobject has a specialmetallb.universe.tf/address-poolannotation that points to the specific address pool name.Note
It is expected that every Kubernetes service on a management cluster will be assigned to one of the address pools. Current consideration is to have two MetalLB address pools:
services-pxeis a reserved address pool name to use for the Kubernetes services in the PXE network (Ironic API, HTTP server, caching server).defaultis an address pool to use for all other Kubernetes services in the management network. No annotation is required on theServiceobjects in this case.
Proceed to creating cluster subnets as described in Create subnets.
By default, MetalLB speakers are deployed on all Kubernetes nodes except master nodes. You can configure MetalLB to run its speakers on a particular set of nodes. This decreases the number of nodes that should be connected to external network. In this scenario, only a few nodes are exposed for ingress traffic from the outside world.
To customize a node selector for a MetalLB speaker:
Using
kubeconfigof the Container Cloud management cluster, open the MOSKClusterobject for editing:kubectl --kubeconfig <pathToManagementClusterKubeconfig> -n <OSClusterNamespace> edit cluster <OSClusterName>
In the
spec:providerSpec:value:helmReleasessection, add thespeaker.nodeSelectorfield formetallb:spec: ... providerSpec: value: ... helmReleases: - name: metallb values: ... speaker: nodeSelector: metallbSpeakerEnabled: "true"
The
metallbSpeakerEnabled: "true"parameter in this example is the label on Kubernetes nodes where MetalLB speakers will be deployed. It can be an already existing node label or a new one.Note
The issue [24435] MetalLB speaker fails to announce the LB IP for the Ingress service, which is related to collocation of MetalLB speakers and the OpenStack Ingress service pods is addressed in MOSK 22.5. For details, see Release Notes: Set externalTrafficPolicy=Local for the OpenStack Ingress service.
You can add user-defined labels to nodes using the
nodeLabelsfield.This field contains the list of node labels to be attached to a node for the user to run certain components on separate cluster nodes. The list of allowed node labels is located in the
Clusterobject statusproviderStatus.releaseRef.current.allowedNodeLabelsfield.If the
valuefield is not defined inallowedNodeLabels, a label can have any value. For example:allowedNodeLabels: - displayName: Stacklight key: stacklight
Before or after a machine deployment, add the required label from the allowed node labels list with the corresponding value to
spec.providerSpec.value.nodeLabelsinmachine.yaml. For example:nodeLabels: - key: stacklight value: enabled
Adding of a node label that is not available in the list of allowed node labels is restricted.
Note
Consider this section as obsolete since MOSK
24.2 due to the MetalLBConfigTemplate object deprecation. For details,
see Deprecation Notes: MetalLBConfigTemplate object.
Caution
This section also applies to the bootstrap procedure of a
management cluster with the following difference: instead of creating the
Subnet object, add its configuration to
ipam-objects.yaml.template located in kaas-bootstrap/templates/bm/.
The Kubernetes Subnet object is created for a management cluster from
templates during bootstrap.
Each Subnet object can define either a MetalLB address range or MetalLB
address pool. A MetalLB address pool may contain one or several address
ranges. The following rules apply to creation of address ranges or pools:
To designate a subnet as a MetalLB address pool or range, use the
ipam/SVC-MetalLBlabel key. Set the label value to"1".The object must contain the
cluster.sigs.k8s.io/<cluster-name>label to reference the name of the target cluster where the MetalLB address pool is used.You may create multiple subnets with the
ipam/SVC-MetalLBlabel to define multiple IP address ranges or multiple address pools for MetalLB in the cluster.The IP addresses of the MetalLB address pool are not assigned to the interfaces on hosts. This subnet is virtual. Do not include such subnets to the L2 template definitions for your cluster.
If a
Subnetobject defines a MetalLB address range, no additional object properties are required.You can use any number of
Subnetobjects that define a single MetalLB address range. In this case, all address ranges are aggregated into a single MetalLB L2 address pool namedserviceshaving the auto-assign policy enabled.Intersection of IP address ranges within any single MetalLB address pool is not allowed.
The bare metal provider verifies intersection of IP address ranges. If it detects intersection, the MetalLB configuration is blocked and the provider logs contain corresponding error messages.
Use the following labels to identify the Subnet object as a MetalLB
address pool and configure the name and protocol for that address pool.
All labels below are mandatory for the Subnet object that configures
a MetalLB address pool.
Label |
Description |
|---|---|
Labels to link |
Note The |
|
Defines that the |
|
Every address pool must have a distinct name. The A bootstrap cluster also uses the |
|
Configures the auto-assign policy of an address pool. Boolean. Caution For the address pools defined using the MetalLB Helm chart
values in the For any service that does not have a specific MetalLB annotation
configured, MetalLB allocates external IPs from arbitrary address
pools that have the auto-assign policy set to Only for the service that has a specific MetalLB annotation with
the address pool name, MetalLB allocates external IPs from the address
pool having the auto-assign policy set to |
|
Sets the address pool protocol.
The only supported value is |
Caution
Do not set the same address pool name for two or more
Subnet objects. Otherwise, the corresponding MetalLB address pool
configuration fails with a warning message in the bare metal provider log.
Caution
For the auto-assign policy, the following configuration rules apply:
At least one MetalLB address pool must have the auto-assign policy enabled so that unannotated services can have load balancer IPs allocated for them. To satisfy this requirement, either configure one of address pools using the
Subnetobject withmetallb/address-pool-auto-assign: "true"or configure address range(s) using theSubnetobject(s) withoutmetallb/address-pool-*labels.When configuring multiple address pools with the auto-assign policy enabled, keep in mind that it is not determined in advance which pool of those multiple address pools is used to allocate an IP for a particular unannotated service.
Configure BGP announcement for cluster API LB address
Available since MOSK 23.2.2 TechPreview
When you create a MOSK cluster with the multi-rack topology, where Kubernetes masters are distributed across multiple racks without an L2 layer extension between them, you must configure BGP announcement of the cluster API load balancer address.
For clusters where Kubernetes masters are in the same rack or with an L2 layer extension between masters, you can configure either BGP or L2 (ARP) announcement of the cluster API load balancer address. The L2 (ARP) announcement is used by default and its configuration is covered in Create a managed bare metal cluster.
Caution
Create Rack and MultiRackCluster objects, which are
described in the below procedure, before initiating the provisioning
of master nodes to ensure that both BGP and netplan configurations
are applied simultaneously during the provisioning process.
To enable the use of BGP announcement for the cluster API LB address:
In the
Clusterobject, set theuseBGPAnnouncementparameter totrue:spec: providerSpec: value: useBGPAnnouncement: true
Create the
MultiRackClusterobject that is mandatory when configuring BGP announcement for the cluster API LB address. This object enables you to set cluster-wide parameters for configuration of BGP announcement.In this scenario, the
MultiRackClusterobject must be bound to the correspondingClusterobject using thecluster.sigs.k8s.io/cluster-namelabel.Container Cloud uses the
birdBGP daemon for announcement of the cluster API LB address. For this reason, set the correspondingbgpdConfigFileNameandbgpdConfigFilePathparameters in theMultiRackClusterobject, so thatbirdcan locate the configuration file. For details, see the configuration example below.The
bgpdConfigTemplateobject contains the default configuration file template for thebirdBGP daemon, which you can override inRackobjects.The
defaultPeerparameter contains default parameters of the BGP connection from master nodes to infrastructure BGP peers, which you can override inRackobjects.Configuration example for
MultiRackClusterapiVersion: ipam.mirantis.com/v1alpha1 kind: MultiRackCluster metadata: name: multirack-test-cluster namespace: mosk-ns labels: cluster.sigs.k8s.io/cluster-name: test-cluster kaas.mirantis.com/provider: baremetal kaas.mirantis.com/region: region-one spec: bgpdConfigFileName: bird.conf bgpdConfigFilePath: /etc/bird bgpdConfigTemplate: | ... defaultPeer: localASN: 65101 neighborASN: 65100 neighborIP: "" password: deadbeef
Note
The
kaas.mirantis.com/regionlabel is removed from all MOSK objects in 24.1. Therefore, do not add the label starting with this release. On existing clusters updated to this release, or if added manually, MOSK ignores this label.For the object description, see MultiRackCluster.
Create the
Rackobject(s). This object is mandatory when configuring BGP announcement for the cluster API LB address and it allows you to configure BGP announcement parameters for each rack.In this scenario,
Rackobjects must be bound toMachineobjects corresponding to master nodes of the cluster. EachRackobject describes the configuration for thebirdBGP daemon used to announce the cluster API LB address from a particular master node or from several master nodes in the same rack.The
Rackobject fields are described in Rack.Set a reference to the
Rackobject used to configure thebirdBGP daemon for a particular master node to announce the cluster API LB IP:In the
Machineobjects for all master nodes, set theipam/RackReflabel with the value equal to the name of the correspondingRackobject. For example:apiVersion: cluster.k8s.io/v1alpha1 kind: Machine metadata: labels: ipam/RackRef: rack-master-1 # reference to the "rack-master-1" Rack ...
In the
BareMetalHostobjects for all cluster nodes, set theipam.mirantis.com/rack-refannotation with the value equal to the name of the correspondingRackobject. For example:apiVersion: metal3.io/v1alpha1 kind: BareMetalHost metadata: annotations: ipam.mirantis.com/rack-ref: rack-master-1 # reference to the "rack-master-1" Rack ...
Optional. Using the
Machineobject, define therack-idnode label that is not used for BGP announcement of the cluster API LB IP but can be used for MetalLB.The
rack-idnode label is required for MetalLB node selectors when MetalLB is used to announce LB IP addresses on nodes that are distributed across multiple racks. In this scenario, the L2 (ARP) announcement mode cannot be used for MetalLB because master nodes are in different L2 segments. So, the BGP announcement mode must be used for MetalLB, and node selectors are required to properly configure BGP connections from each node. See Configure and verify MetalLB for details.The
L2Templateobject includes thelointerface configuration to set the IP address for thebirdBGP daemon that will be advertised as the cluster API LB address. The{{ cluster_api_lb_ip }}function is used innpTemplateto obtain the cluster API LB address value.Configuration example for
RackapiVersion: ipam.mirantis.com/v1alpha1 kind: Rack metadata: name: rack-master-1 namespace: mosk-ns labels: cluster.sigs.k8s.io/cluster-name: test-cluster kaas.mirantis.com/provider: baremetal kaas.mirantis.com/region: region-one spec: bgpdConfigTemplate: | # optional ... peeringMap: lcm-rack-control-1: peers: - neighborIP: 10.77.31.2 # "localASN" & "neighborASN" are taken from - neighborIP: 10.77.31.3 # "MultiRackCluster.spec.defaultPeer" if # not set here
Note
The
kaas.mirantis.com/regionlabel is removed from all MOSK objects in 24.1. Therefore, do not add the label starting with this release. On existing clusters updated to this release, or if added manually, MOSK ignores this label.Configuration example for
MachineapiVersion: cluster.k8s.io/v1alpha1 kind: Machine metadata: name: test-cluster-master-1 namespace: mosk-ns annotations: metal3.io/BareMetalHost: mosk-ns/test-cluster-master-1 labels: cluster.sigs.k8s.io/cluster-name: test-cluster cluster.sigs.k8s.io/control-plane: controlplane hostlabel.bm.kaas.mirantis.com/controlplane: controlplane ipam/RackRef: rack-master-1 # reference to the "rack-master-1" Rack kaas.mirantis.com/provider: baremetal kaas.mirantis.com/region: region-one spec: providerSpec: value: kind: BareMetalMachineProviderSpec apiVersion: baremetal.k8s.io/v1alpha1 hostSelector: matchLabels: kaas.mirantis.com/baremetalhost-id: test-cluster-master-1 l2TemplateSelector: name: test-cluster-master-1 nodeLabels: # optional. it is not used for BGP announcement - key: rack-id # of the cluster API LB IP but it can be used value: rack-master-1 # for MetalLB if "nodeSelectors" are required ...
Note
The
kaas.mirantis.com/regionlabel is removed from all MOSK objects in 24.1. Therefore, do not add the label starting with this release. On existing clusters updated to this release, or if added manually, MOSK ignores this label.Configuration example for
L2TemplateapiVersion: ipam.mirantis.com/v1alpha1 kind: L2Template metadata: labels: cluster.sigs.k8s.io/cluster-name: test-cluster kaas.mirantis.com/provider: baremetal kaas.mirantis.com/region: region-one name: test-cluster-master-1 namespace: mosk-ns spec: ... l3Layout: - subnetName: lcm-rack-control-1 # this network is referenced scope: namespace # in the "rack-master-1" Rack - subnetName: ext-rack-control-1 # optional. this network is used scope: namespace # for k8s services traffic and # MetalLB BGP connections ... npTemplate: | ... ethernets: lo: addresses: - {{ cluster_api_lb_ip }} # function for cluster API LB IP dhcp4: false dhcp6: false ...
Note
The
kaas.mirantis.com/regionlabel is removed from all MOSK objects in 24.1. Therefore, do not add the label starting with this release. On existing clusters updated to this release, or if added manually, MOSK ignores this label.The configuration example for the scenario where Kubernetes masters are in the same rack or with an L2 layer extension between masters is described in Single rack configuration example.
The configuration example for the scenario where Kubernetes masters are distributed across multiple racks without L2 layer extension between them is described in Multiple rack configuration example.
Obtain and use details about network interfaces
To simplify operations with L2 templates, before you start creating them, inspect the general workflow of a network interface name gathering and processing.
Network interface naming workflow:
The operator creates a
BareMetalHostInventoryobject.Note
Before update of the management cluster to Container Cloud 2.29.0 (Cluster release 16.4.0), instead of
BareMetalHostInventory, use theBareMetalHostobject. For details, see BareMetalHost resource.Caution
While the Cluster release of the management cluster is 16.4.0,
BareMetalHostInventoryoperations are allowed tom:kaas@management-adminonly. This limitation is lifted once the management cluster is updated to the Cluster release 16.4.1 or later.The
BareMetalHostInventoryobject executes theintrospectionstage and becomesready.The operator collects information about NIC count, naming, and so on for further changes in the mapping logic.
At this stage, the NICs order in the object may randomly change during each introspection, but the NICs names are always the same. For more details, see Predictable Network Interface Names.
For example:
# Example commands: # kubectl -n managed-ns get bmh baremetalhost1 -o custom-columns='NAME:.metadata.name,STATUS:.status.provisioning.state' # NAME STATE # baremetalhost1 ready # kubectl -n managed-ns get bmh baremetalhost1 -o yaml # Example output: apiVersion: metal3.io/v1alpha1 kind: BareMetalHost ... status: ... nics: - ip: fe80::ec4:7aff:fe6a:fb1f%eno2 mac: 0c:c4:7a:6a:fb:1f model: 0x8086 0x1521 name: eno2 pxe: false - ip: fe80::ec4:7aff:fe1e:a2fc%ens1f0 mac: 0c:c4:7a:1e:a2:fc model: 0x8086 0x10fb name: ens1f0 pxe: false - ip: fe80::ec4:7aff:fe1e:a2fd%ens1f1 mac: 0c:c4:7a:1e:a2:fd model: 0x8086 0x10fb name: ens1f1 pxe: false - ip: 192.168.1.151 # Temp. PXE network adress mac: 0c:c4:7a:6a:fb:1e model: 0x8086 0x1521 name: eno1 pxe: true ...
The operator selects from the following options:
Create an
L2Templateobject with theifMappingconfiguration. For details, see Create L2 templates.Create a
Machineobject, with thel2TemplateIfMappingOverrideconfiguration. For details, see Override network interfaces naming and order.
The operator creates a
MachineorSubnetobject.The
baremetal-providerservice links theMachineobject to theBareMetalHostInventoryobject.The
kaas-ipamandbaremetal-providerservices collect hardware information from theBareMetalHostInventoryobject and use it to configure host networking and services.The
kaas-ipamservice:Spawns the
IpamHostobject.Renders the
L2Templateobject.Spawns the
ipaddrobject.Updates the
IpamHostobject status with all rendered and linked information.
The
baremetal-providerservice collects the rendered networking information from theIpamHostobjectThe
baremetal-providerservice proceeds with theIpamHostobject provisioning.
Now proceed to Create subnets.
Create subnets
After creating the MetalLB configuration as described in Configure and verify MetalLB
and before creating L2 templates, ensure that you have the required subnets
that can be used in the L2 template to allocate IP addresses for the
MOSK cluster nodes.
Where required, create a number of subnets for a particular project
using the Subnet CR. A subnet has the following logical scopes:
Each subnet used in an L2 template has its logical scope that is set using the
scope parameter in the corresponding L2Template.spec.l3Layout section.
One of the following logical scopes is used for each subnet referenced in an
L2 template:
global - CR uses the
defaultnamespace. A subnet can be used for any cluster located in any project.namespaced - CR uses the namespace that corresponds to a particular project where MOSK clusters are located. A subnet can be used for any cluster located in the same project.
cluster - Unsupported since Container Cloud 2.28.0 (Cluster releases 17.3.0 and 16.3.0). CR uses the namespace where the referenced cluster is located. A subnet is only accessible to the cluster that
L2Template.metadata.labels:cluster.sigs.k8s.io/cluster-name(mandatory since MOSK 23.3) orL2Template.spec.clusterRef(deprecated since MOSK 23.3) refers to. TheSubnetobjects with theclusterscope will be created for every new cluster.
Note
The use of the ipam/SVC-MetalLB label in Subnet objects
is unsupported as part of the MetalLBConfigTemplate object deprecation
since Container Cloud 2.27.0 (Cluster releases 17.2.0 and 16.2.0). No
actions are required for existing objects. A Subnet object containing
this label will be ignored by baremetal-provider after cluster update
to the mentioned Cluster releases.
You can have subnets with the same name in different projects. In this case, the subnet that has the same project as the cluster will be used. One L2 template may often reference several subnets, those subnets may have different scopes in this case.
The IP address objects (IPaddr CR) that are allocated from subnets
always have the same project as their corresponding IpamHost objects,
regardless of the subnet scope.
You can create subnets using either the Container Cloud web UI or CLI.
Any Subnet object may contain ipam/SVC-<serviceName> labels.
All IP addresses allocated from the Subnet object that has service labels
defined inherit those labels.
When a particular IpamHost uses IP addresses allocated from such labeled
Subnet objects, the ServiceMap field in IpamHost.Status
contains information about which IPs and interfaces correspond to which service
labels (that have been set in the Subnet objects). Using ServiceMap,
you can understand what IPs and interfaces of a particular host are used
for network traffic of a given service.
Container Cloud uses the following service labels that allow using of the specific subnets for particular Container Cloud services:
ipam/SVC-k8s-lcmipam/SVC-ceph-clusteripam/SVC-ceph-publicipam/SVC-dhcp-rangeipam/SVC-MetalLBUnsupported since 24.3ipam/SVC-LBhost
Caution
The use of the ipam/SVC-k8s-lcm label is mandatory for every
cluster.
Important
A label value is not mandatory and can be empty but it must
match the value in the related L2Template object, in which the
corresponding subnet is used. Otherwise, network configuration for related
hosts will not be rendered due to not found subnets.
You can also add custom service labels to the Subnet objects the same way
you add Container Cloud service labels. The mapping of IPs and interfaces to
the defined services is displayed in IpamHost.Status.ServiceMap.
You can assign multiple service labels to one network. You can also assign the
ceph-* and dhcp-range services to multiple networks. In the latter
case, the system sorts the IP addresses in the ascending order:
serviceMap:
ipam/SVC-ceph-cluster:
- ifName: ceph-br2
ipAddress: 10.0.10.11
- ifName: ceph-br1
ipAddress: 10.0.12.22
ipam/SVC-ceph-public:
- ifName: ceph-public
ipAddress: 10.1.1.15
ipam/SVC-k8s-lcm:
- ifName: k8s-lcm
ipAddress: 10.0.1.52
You can add service labels during creation of subnets as described in Create subnets.
After creating the MetalLB configuration as described in Configure and verify MetalLB and before creating an L2 template, create the required subnets to use in the L2 template to allocate IP addresses for the managed cluster nodes.
To create subnets for a managed cluster using web UI:
Log in to the Container Cloud web UI with the
operatorpermissions.Switch to the required non-
defaultproject using the Switch Project action icon located on top of the main left-side navigation panel.Caution
Do not create a MOSK cluster in the
defaultproject (Kubernetes namespace), which is dedicated for the management cluster only. If no projects are defined, first create a newmoskproject as described in Create a project for MOSK clusters.Create basic cluster settings as described in Create a managed bare metal cluster.
Select one of the following options:
In the left sidebar, navigate to Networks. The Subnets tab opens.
Click Create Subnet.
Fill out the Create subnet form as required:
- Name
Subnet name.
- Subnet Type
Subnet type:
- DHCP Optional
DHCP subnet that configures DHCP address ranges used by the DHCP server on the management cluster. For details, see Configure multiple DHCP address ranges.
- LB
Cluster API LB subnet.
- LCM
LCM subnet(s).
- Storage access Optional
Available in the web UI since MOSK 24.3. Does not apply since MOSK 25.2 for
MiraCeph. Storage access subnet.
- Storage replication Optional
Available in the web UI since MOSK 24.3. Does not apply since MOSK 25.2 for
MiraCeph. Storage replication subnet.
- Custom Optional
Custom subnet. For example, external or for Kubernetes workloads. For details, see optional steps in Create subnets for a managed cluster using CLI.
- MetalLB
Services subnet(s).
Warning
Since MOSK 24.3, disregard this parameter during subnet creation. Configure MetalLB separately as described in Configure and verify MetalLB.
This parameter is removed from the Container Cloud web UI in MOSK 25.1.
For description of subnet types in a managed cluster, see MOSK cluster networking.
- Cluster
Cluster name that the subnet is being created for. Not required only for the DHCP subnet.
- CIDR
A valid IPv4 address of the subnet in the CIDR notation, for example, 10.11.0.0/24.
- Include Ranges Optional
A comma-separated list of IP address ranges within the given CIDR that should be used in the allocation of IPs for nodes. The gateway, network, broadcast, and DNSaddresses will be excluded (protected) automatically if they intersect with one of the range. The IPs outside the given ranges will not be used in the allocation. Each element of the list can be either an interval
10.11.0.5-10.11.0.70or a single address10.11.0.77.Warning
Do not use values that are out of the given CIDR.
- Exclude Ranges Optional
A comma-separated list of IP address ranges within the given CIDR that should not be used in the allocation of IPs for nodes. The IPs within the given CIDR but outside the given ranges will be used in the allocation. The gateway, network, broadcast, and DNS addresses will be excluded (protected) automatically if they are included in the CIDR. Each element of the list can be either an interval
10.11.0.5-10.11.0.70or a single address10.11.0.77.Warning
Do not use values that are out of the given CIDR.
- Gateway Optional
A valid IPv4 gateway address, for example, 10.11.0.9. Does not apply to the MetalLB subnet.
- Nameservers
IP addresses of nameservers separated by a comma. Does not apply to the DHCP and MetalLB subnet types.
- Use whole CIDR
Optional. Select to use the whole IPv4 address range that is set in the CIDR field. Useful when defining single IP address (/32), for example, in the Cluster API load balancer (LB) subnet.
If not set, the network address and broadcast address in the IP subnet are excluded from the address allocation.
- Labels
Key-value pairs attached to the selected subnet:
Caution
The values of the created subnet labels must match the ones in the
spec.l3Layoutsection of the correspondingL2Templateobject.Optional user-defined labels to distinguish different subnets of the same type. For an example of user-defined labels, see Expand IP addresses capacity in an existing cluster.
The following special values define the storage subnets:
ipam/SVC-ceph-clusteripam/SVC-ceph-public
For more examples of label usage, see Service labels and their life cycle and Create subnets for a managed cluster using CLI.
Click Add a label and assign the first custom label with the required name and value. To assign consecutive labels, use the + button located in the right side of the Labels section.
MetalLB:
Warning
Since MOSK 24.3, disregard this label during subnet creation. Configure MetalLB separately as described in Configure and verify MetalLB.
The label will be removed from the Container Cloud web UI in one of the following releases.
metallb/address-pool-nameName of the subnet address pool. Exemplary values:
services,default,external,services-pxe.The latter label is dedicated for management clusters only. For details about address pool names of a management cluster, see Separate PXE and management networks.
metallb/address-pool-auto-assignEnables automatic assignment of address pool. Boolean.
metallb/address-pool-protocolDefines the address pool protocol. Possible values:
layer2- announcement using the ARP protocol.bgp- announcement using the BGP protocol. Technology Preview.
For description of these protocols, refer to the MetalLB documentation.
Click Create.
In the Networks tab, verify the status of the created subnet:
Ready - object is operational.
Error - object is non-operational. Hover over the status to obtain details of the issue.
Note
To verify subnet details, in the Networks tab, click the More action icon in the last column of the required subnet and select Subnet info.
In the Clusters tab, click the required cluster and scroll down to the Subnets section.
Click Add Subnet.
Fill out the Add new subnet form as required:
- Subnet Name
Subnet name.
- CIDR
A valid IPv4 CIDR, for example, 10.11.0.0/24.
- Include Ranges Optional
A comma-separated list of IP address ranges within the given CIDR that should be used in the allocation of IPs for nodes. The gateway, network, broadcast, and DNSaddresses will be excluded (protected) automatically if they intersect with one of the range. The IPs outside the given ranges will not be used in the allocation. Each element of the list can be either an interval
10.11.0.5-10.11.0.70or a single address10.11.0.77.Warning
Do not use values that are out of the given CIDR.
- Exclude Ranges Optional
A comma-separated list of IP address ranges within the given CIDR that should not be used in the allocation of IPs for nodes. The IPs within the given CIDR but outside the given ranges will be used in the allocation. The gateway, network, broadcast, and DNS addresses will be excluded (protected) automatically if they are included in the CIDR. Each element of the list can be either an interval
10.11.0.5-10.11.0.70or a single address10.11.0.77.Warning
Do not use values that are out of the given CIDR.
- Gateway Optional
A valid gateway address, for example, 10.11.0.9.
Click Create.
Proceed to creating L2 templates as described in Create L2 templates.
After creating the MetalLB configuration as described in Configure and verify MetalLB and before creating an L2 template, create the required subnets to use in the L2 template to allocate IP addresses for the managed cluster nodes.
Ensure that the underlay network in your cluster satisfies the requirements listed in Networking.
Configure all required VLANs on the network switches as described in Network types.
Configure gateway IP addresses on the ToR switches. Set up static routes as described in Underlay networking: routing configuration.
Create a cluster using one of the following options:
Container Cloud web UI: Create a managed bare metal cluster
API Reference: Cluster resource
Log in to a local machine where your management cluster
kubeconfigis located and wherekubectlis installed.Note
The management cluster
kubeconfigis created during the last stage of the management cluster bootstrap.Create the
subnet.yamlfile with a number of global or namespaced subnets depending on the configuration of your cluster:kubectl --kubeconfig <pathToManagementClusterKubeconfig> apply -f <SubnetFileName.yaml>
Note
In the command above and in the steps below, substitute the parameters enclosed in angle brackets with the corresponding values.
Example of a
subnet.yamlfile:apiVersion: ipam.mirantis.com/v1alpha1 kind: Subnet metadata: name: demo namespace: demo-namespace labels: kaas.mirantis.com/provider: baremetal spec: cidr: 10.11.0.0/24 gateway: 10.11.0.9 includeRanges: - 10.11.0.5-10.11.0.70 nameservers: - 172.18.176.6
Note
The
kaas.mirantis.com/regionlabel is removed from all MOSK objects in 24.1. Therefore, do not add the label starting with this release. On existing clusters updated to this release, or if added manually, MOSK ignores this label.Specification fields of the Subnet object¶ Parameter
Description
cidr(singular)A valid IPv4 CIDR, for example, 10.11.0.0/24.
includeRanges(list)A comma-separated list of IP address ranges within the given CIDR that should be used in the allocation of IPs for nodes. The gateway, network, broadcast, and DNSaddresses will be excluded (protected) automatically if they intersect with one of the range. The IPs outside the given ranges will not be used in the allocation. Each element of the list can be either an interval
10.11.0.5-10.11.0.70or a single address10.11.0.77.Warning
Do not use values that are out of the given CIDR.
excludeRanges(list)A comma-separated list of IP address ranges within the given CIDR that should not be used in the allocation of IPs for nodes. The IPs within the given CIDR but outside the given ranges will be used in the allocation. The gateway, network, broadcast, and DNS addresses will be excluded (protected) automatically if they are included in the CIDR. Each element of the list can be either an interval
10.11.0.5-10.11.0.70or a single address10.11.0.77.Warning
Do not use values that are out of the given CIDR.
useWholeCidr(boolean)If set to
true, the subnet address (10.11.0.0 in the example above) and the broadcast address (10.11.0.255 in the example above) are included into the address allocation for nodes. Otherwise, (falseby default), the subnet address and broadcast address are excluded from the address allocation.gateway(singular)A valid gateway address, for example, 10.11.0.9.
nameservers(list)A list of the IP addresses of name servers. Each element of the list is a single address, for example, 172.18.176.6.
Configuration rules:
The subnet for the LCM network must contain the
ipam/SVC-k8s-lcm: "1"label. For details, see Service labels and their life cycle.Each cluster must use at least one subnet for its LCM network. Every node must have the address allocated in the LCM network using such subnet(s).
Each node of every cluster must have one and only IP address in the LCM network that is allocated from one of the
Subnetobjects having theipam/SVC-k8s-lcmlabel defined. Therefore, allSubnetobjects used for LCM networks must have theipam/SVC-k8s-lcmlabel defined.You can use any interface name for the LCM network traffic. The
Subnetobjects for the LCM network must have theipam/SVC-k8s-lcmlabel. For details, see Service labels and their life cycle.
Note
You may use different subnets to allocate IP addresses to different Container Cloud components in your cluster. Add a label with the
ipam/SVC-prefix to each subnet that is used to configure a Container Cloud service. For details, see Service labels and their life cycle and the optional steps below.Configure DHCP relay agents on the edges of the broadcast domains in the provisioning network, as needed.
Make sure to assign the IP address ranges you want to allocate to the hosts using DHCP for discovery and inspection. Create subnets using these IP parameters. Specify the IP address of your DHCP relay as the default gateway in the corresponding
Subnetobject.Caution
Support of multiple DHCP ranges has the following limitations:
Using of custom DNS server addresses for servers that boot over PXE is not supported.
The
Subnetobjects for DHCP ranges cannot be associated with any specific cluster, as the DHCP server configuration is only applicable to the management cluster where the DHCP server is running. Thecluster.sigs.k8s.io/cluster-namelabel will be ignored.
Configuration examples:
Single-rack cluster
apiVersion: "ipam.mirantis.com/v1alpha1" kind: Subnet metadata: name: mgmt-dhcp namespace: default labels: kaas.mirantis.com/provider: baremetal ipam/SVC-dhcp-range: "presents" spec: cidr: 10.20.10.0/24 includeRanges: - 10.20.10.10-10.20.10.20
Multi-rack cluster
apiVersion: ipam.mirantis.com/v1alpha1 kind: Subnet metadata: name: rack-1-dhcp namespace: default labels: ipam/SVC-dhcp-range: "1" kaas.mirantis.com/provider: baremetal spec: cidr: 10.20.101.0/24 gateway: 10.20.101.1 includeRanges: - 10.20.101.16-10.20.101.127 --- apiVersion: ipam.mirantis.com/v1alpha1 kind: Subnet metadata: name: rack-2-dhcp namespace: default labels: ipam/SVC-dhcp-range: "1" kaas.mirantis.com/provider: baremetal spec: cidr: 10.20.102.0/24 gateway: 10.20.102.1 includeRanges: - 10.20.102.16-10.20.102.127 --- apiVersion: ipam.mirantis.com/v1alpha1 kind: Subnet metadata: name: rack-3-dhcp namespace: default labels: ipam/SVC-dhcp-range: "1" kaas.mirantis.com/provider: baremetal spec: cidr: 10.20.103.0/24 gateway: 10.20.103.1 includeRanges: - 10.20.103.16-10.20.103.127 --- # Add more Subnet object templates as required using the above example # (one subnet per rack)
Optional. Add subnets for configuring multiple DHCP ranges. For details, see Configure multiple DHCP address ranges.
Add one or more subnets for the LCM network:
Set the
ipam/SVC-k8s-lcmlabel with the value"1"to create a subnet that will be used to assign IP addresses in the LCM network.Optional. Set the
cluster.sigs.k8s.io/cluster-namelabel to the name of the target cluster during the subnet creation.Use this subnet in the L2 template for cluster nodes.
Using the L2 template, assign this subnet to the interface connected to your LCM network.
Precautions for the LCM network usage
Each cluster must use at least one subnet for its LCM network. Every node must have the address allocated in the LCM network using such subnet(s).
Each node of every cluster must have one and only IP address in the LCM network that is allocated from one of the
Subnetobjects having theipam/SVC-k8s-lcmlabel defined. Therefore, allSubnetobjects used for LCM networks must have theipam/SVC-k8s-lcmlabel defined.You can use any interface name for the LCM network traffic. The
Subnetobjects for the LCM network must have theipam/SVC-k8s-lcmlabel. For details, see Service labels and their life cycle.
Configuration examples:
Single-rack cluster
apiVersion: ipam.mirantis.com/v1alpha1 kind: Subnet metadata: labels: kaas.mirantis.com/provider: baremetal ipam/SVC-k8s-lcm: "1" name: lcm-nw namespace: <MOSKClusterNamespace> spec: cidr: 172.16.43.0/24 gateway: 172.16.43.1 includeRanges: - 172.16.43.10-172.16.43.100 nameservers: - 8.8.8.8
Multi-rack cluster
Example
mosk-racks-lcm-subnets.yamlNote
Subnet labels such as
rack-x-lcm,rack-api-lcm, and so on are optional. You can use them in L2 templates to selectSubnetobjects by label.apiVersion: ipam.mirantis.com/v1alpha1 kind: Subnet metadata: name: rack-1-lcm namespace: mosk-namespace-name labels: ipam/SVC-k8s-lcm: "1" kaas.mirantis.com/provider: baremetal cluster.sigs.k8s.io/cluster-name: mosk-cluster-name rack-1-lcm: "true" spec: cidr: 10.20.111.0/24 gateway: 10.20.111.1 includeRanges: - 10.20.111.16-10.20.111.255 nameservers: - 8.8.8.8 --- apiVersion: ipam.mirantis.com/v1alpha1 kind: Subnet metadata: name: rack-2-lcm namespace: mosk-namespace-name labels: ipam/SVC-k8s-lcm: "1" kaas.mirantis.com/provider: baremetal cluster.sigs.k8s.io/cluster-name: mosk-cluster-name rack-2-lcm: "true" spec: cidr: 10.20.112.0/24 gateway: 10.20.112.1 includeRanges: - 10.20.112.16-10.20.112.255 nameservers: - 8.8.8.8 --- apiVersion: ipam.mirantis.com/v1alpha1 kind: Subnet metadata: name: rack-3-lcm namespace: mosk-namespace-name labels: ipam/SVC-k8s-lcm: "1" kaas.mirantis.com/provider: baremetal cluster.sigs.k8s.io/cluster-name: mosk-cluster-name rack-3-lcm: "true" spec: cidr: 10.20.113.0/24 gateway: 10.20.113.1 includeRanges: - 10.20.113.16-10.20.113.255 nameservers: - 8.8.8.8 --- # Add more subnet object templates as required using the above example # (one subnet per rack)
Example
mosk-racks-api-lcm-subnet.yamlNote
Since 23.2.2, MOSK supports full L3 networking topology in the Technology Preview scope. This enables deployment of specific cluster segments in dedicated racks without the need for L2 layer extension between them. For configuration procedure, see Configure BGP announcement for cluster API LB address and Configure BGP announcement of external addresses of Kubernetes load-balanced services in Deployment Guide.
If you configure BGP announcement of the load-balancer IP address for the MOSK cluster API, the API/LCM network is not required. Announcement of the cluster API LB address is done using the LCM or external network.
If you configure ARP announcement of the load-balancer IP address for the MOSK cluster API, the API/LCM network must be configured on the Kubernetes manager nodes of the cluster. This network contains the Kubernetes API endpoint with the VRRP virtual IP address.
This network contains Kubernetes API endpoint with the VRRP virtual IP address. This is the IP address space that Container Cloud uses to ensure communication between the LCM agents and the management API. These addresses are also used by Kubernetes nodes for communication. The addresses from the subnet are assigned to all Kubernetes manager nodes of the MOSK cluster.
apiVersion: ipam.mirantis.com/v1alpha1 kind: Subnet metadata: name: rack-api-lcm namespace: mosk-namespace-name labels: ipam/SVC-k8s-lcm: "1" kaas.mirantis.com/provider: baremetal cluster.sigs.k8s.io/cluster-name: mosk-cluster-name rack-api-lcm: "true" spec: cidr: 10.20.110.0/24 gateway: 10.20.110.1 includeRanges: - 10.20.110.16-10.20.110.25 nameservers: - 8.8.8.8
Mandatory and GA since MOSK 25.2. Optional and TechPreview before MOSK 25.2. Add a subnet for external connection to the Kubernetes services exposed by the MOSK cluster. The network is used to expose the OpenStack, StackLight, and other MOSK services. Configuration examples:
Single-rack cluster
apiVersion: ipam.mirantis.com/v1alpha1 kind: Subnet metadata: labels: kaas.mirantis.com/provider: baremetal name: k8s-ext-subnet namespace: <MOSKClusterNamespace> spec: cidr: 172.16.45.0/24 gateway: 172.16.45.1 includeRanges: - 172.16.45.10-172.16.45.100 nameservers: - 8.8.8.8
Multi-rack cluster
Note
Since 23.2.2, MOSK supports full L3 networking topology in the Technology Preview scope. This enables deployment of specific cluster segments in dedicated racks without the need for L2 layer extension between them. For configuration procedure, see Configure BGP announcement for cluster API LB address and Configure BGP announcement of external addresses of Kubernetes load-balanced services in Deployment Guide.
If you configure BGP announcement for IP addresses of load-balanced services of a MOSK cluster, the external network can consist of multiple VLAN segments connected to all nodes of a MOSK cluster where MetalLB speaker components are configured to announce IP addresses for Kubernetes load-balanced services. Mirantis recommends that you use OpenStack controller nodes for this purpose.
If you configure ARP announcement for IP addresses of load-balanced services of a MOSK cluster, the external network must consist of a single VLAN stretched to the ToR switches of all the racks where MOSK nodes connected to the external network are located. Those are the nodes where MetalLB speaker components are configured to announce IP addresses for Kubernetes load-balanced services. Mirantis recommends that you use OpenStack controller nodes for this purpose.
The subnets are used to assign addresses to the external interfaces of the MOSK controller nodes and will be used to assign the default gateway to these hosts. The default gateway for other hosts of the MOSK cluster is assigned using the LCM and optionally API/LCM subnets.
Example of a subnet where a single VLAN segment is stretched to all MOSK controller nodes:
apiVersion: ipam.mirantis.com/v1alpha1 kind: Subnet metadata: name: k8s-external namespace: mosk-namespace-name labels: kaas.mirantis.com/provider: baremetal cluster.sigs.k8s.io/cluster-name: mosk-cluster-name k8s-external: true spec: cidr: 10.20.120.0/24 gateway: 10.20.120.1 # This will be the default gateway on hosts includeRanges: - 10.20.120.16-10.20.120.20 nameservers: - 8.8.8.8
Example of subnets where separate VLAN segments per rack are used:
apiVersion: ipam.mirantis.com/v1alpha1 kind: Subnet metadata: name: rack-1-k8s-ext namespace: mosk-namespace-name labels: kaas.mirantis.com/provider: baremetal cluster.sigs.k8s.io/cluster-name: mosk-cluster-name rack-1-k8s-ext: true spec: cidr: 10.20.121.0/24 gateway: 10.20.121.1 # This will be the default gateway on hosts includeRanges: - 10.20.121.16-10.20.121.20 nameservers: - 8.8.8.8 --- apiVersion: ipam.mirantis.com/v1alpha1 kind: Subnet metadata: name: rack-2-k8s-ext namespace: mosk-namespace-name labels: kaas.mirantis.com/provider: baremetal cluster.sigs.k8s.io/cluster-name: mosk-cluster-name rack-2-k8s-ext: true spec: cidr: 10.20.122.0/24 gateway: 10.20.122.1 # This will be the default gateway on hosts includeRanges: - 10.20.122.16-10.20.122.20 nameservers: - 8.8.8.8 --- apiVersion: ipam.mirantis.com/v1alpha1 kind: Subnet metadata: name: rack-3-k8s-ext namespace: mosk-namespace-name labels: kaas.mirantis.com/provider: baremetal cluster.sigs.k8s.io/cluster-name: mosk-cluster-name rack-3-k8s-ext: true spec: cidr: 10.20.123.0/24 gateway: 10.20.123.1 # This will be the default gateway on hosts includeRanges: - 10.20.123.16-10.20.123.20 nameservers: - 8.8.8.8
Configuration rules:
Make sure that
loadBalancerHostis set to""(empty string) in theClusterspec.Note
Since MOSK 25.2,
loadBalancerHostis removed from the defaultClustertemplate. Therefore, skip this rule since the mentioned release.spec: providerSpec: value: apiVersion: baremetal.k8s.io/v1alpha1 kind: BaremetalClusterProviderSpec ... loadBalancerHost: ""
Create a subnet with the
ipam/SVC-LBhostlabel having the"1"value to make thebaremetal-provideruse this subnet for allocation of addresses for cluster API endpoints. One IP address will be allocated for each cluster to serve its Kubernetes/MKE API endpoint.Make sure that master nodes have host local-link addresses in the same subnet as the cluster API endpoint address. These host IP addresses will be used for VRRP traffic. The cluster API endpoint address will be assigned to the same interface on one of the master nodes where these host IP addresses are assigned.
Mirantis highly recommends that you assign the cluster API endpoint address from the LCM or external network. For details on cluster network types, refer to MOSK cluster networking.
To add an address allocation scope of API endpoints, create a subnet in the corresponding namespace with a reference to the target cluster using the
cluster.sigs.k8s.io/cluster-namelabel. For example:apiVersion: "ipam.mirantis.com/v1alpha1" kind: Subnet metadata: name: lbhost-mgmt-cluster namespace: default labels: kaas.mirantis.com/provider: baremetal cluster.sigs.k8s.io/cluster-name: mgmt-cluster ipam/SVC-LBhost: "presents" spec: cidr: "10.0.30.100/32" useWholeCidr: true
Optional. Does not apply since MOSK 25.2 for
MiraCeph. Add a subnet(s) for the storage access network. Ceph will automatically use this subnet for its external connections. A Ceph OSD will look for and bind to an address from this subnet when it is started on a machine. Configuration examples:Single-rack cluster
apiVersion: ipam.mirantis.com/v1alpha1 kind: Subnet metadata: labels: kaas.mirantis.com/provider: baremetal ipam/SVC-ceph-public: true cluster.sigs.k8s.io/cluster-name: <MOSKClusterName> name: ceph-public-subnet namespace: <MOSKClusterNamespace> spec: cidr: 10.12.0.0/24
Multi-rack cluster
This network may have per-rack VLANs and IP subnets. The addresses from the subnets are assigned to all MOSK cluster nodes besides Kubernetes manager nodes.
apiVersion: ipam.mirantis.com/v1alpha1 kind: Subnet metadata: name: rack-1-ceph-public namespace: mosk-namespace-name labels: ipam/SVC-ceph-public: "1" kaas.mirantis.com/provider: baremetal cluster.sigs.k8s.io/cluster-name: mosk-cluster-name rack-1-ceph-public: true spec: cidr: 10.20.131.0/24 gateway: 10.20.131.1 includeRanges: - 10.20.131.16-10.20.131.255 --- apiVersion: ipam.mirantis.com/v1alpha1 kind: Subnet metadata: name: rack-2-ceph-public namespace: mosk-namespace-name labels: ipam/SVC-ceph-public: "1" kaas.mirantis.com/provider: baremetal cluster.sigs.k8s.io/cluster-name: mosk-cluster-name rack-2-ceph-public: true spec: cidr: 10.20.132.0/24 gateway: 10.20.132.1 includeRanges: - 10.20.132.16-10.20.132.255 --- apiVersion: ipam.mirantis.com/v1alpha1 kind: Subnet metadata: name: rack-3-ceph-public namespace: mosk-namespace-name labels: ipam/SVC-ceph-public: "1" kaas.mirantis.com/provider: baremetal cluster.sigs.k8s.io/cluster-name: mosk-cluster-name rack-3-ceph-public: true spec: cidr: 10.20.133.0/24 gateway: 10.20.133.1 includeRanges: - 10.20.133.16-10.20.133.255 --- # Add more Subnet object templates as required using the above example # (one subnet per rack)
Configuration rules:
Set the
ipam/SVC-ceph-publiclabel with the value"1"to create a subnet that will be used to configure the Ceph public network.Set the
cluster.sigs.k8s.io/cluster-namelabel to the name of the target cluster during the subnet creation.Use this subnet in the L2 template for all cluster nodes except Kubernetes manager nodes.
Assign this subnet to the interface connected to your storage access network.
Optional. Does not apply since MOSK 25.2 for
MiraCeph. Add a subnet(s) for the storage replication network. Ceph will automatically use this network for its internal replication traffic. Configuration examples:Single-rack cluster
apiVersion: ipam.mirantis.com/v1alpha1 kind: Subnet metadata: labels: kaas.mirantis.com/provider: baremetal ipam/SVC-ceph-cluster: true cluster.sigs.k8s.io/cluster-name: <MOSKClusterName> name: ceph-cluster-subnet namespace: <MOSKClusterNamespace> spec: cidr: 10.12.1.0/24
Multi-rack cluster
This network may have per-rack VLANs and IP subnets. The addresses from the subnets are assigned to storage nodes in the MOSK cluster.
apiVersion: ipam.mirantis.com/v1alpha1 kind: Subnet metadata: name: rack-1-ceph-cluster namespace: mosk-namespace-name labels: ipam/SVC-ceph-cluster: "1" kaas.mirantis.com/provider: baremetal cluster.sigs.k8s.io/cluster-name: mosk-cluster-name rack-1-ceph-cluster: true spec: cidr: 10.20.141.0/24 gateway: 10.20.141.1 includeRanges: - 10.20.141.16-10.20.141.255 --- apiVersion: ipam.mirantis.com/v1alpha1 kind: Subnet metadata: name: rack-2-ceph-cluster namespace: mosk-namespace-name labels: ipam/SVC-ceph-cluster: "1" kaas.mirantis.com/provider: baremetal cluster.sigs.k8s.io/cluster-name: mosk-cluster-name rack-2-ceph-cluster: true spec: cidr: 10.20.142.0/24 gateway: 10.20.142.1 includeRanges: - 10.20.142.16-10.20.142.255 --- apiVersion: ipam.mirantis.com/v1alpha1 kind: Subnet metadata: name: rack-3-ceph-cluster namespace: mosk-namespace-name labels: ipam/SVC-ceph-cluster: "1" kaas.mirantis.com/provider: baremetal cluster.sigs.k8s.io/cluster-name: mosk-cluster-name rack-3-ceph-cluster: true spec: cidr: 10.20.143.0/24 gateway: 10.20.143.1 includeRanges: - 10.20.143.16-10.20.143.255 --- # Add more Subnet object templates as required using the above example # (one subnet per rack)
Configuration rules:
Set the
ipam/SVC-ceph-clusterlabel with the value"1"to create a subnet that will be used to configure the Ceph cluster network.Set the
cluster.sigs.k8s.io/cluster-namelabel to the name of the target cluster during the subnet creation.Use this subnet in the L2 template for storage nodes.
Assign this subnet to the interface connected to your storage replication network.
Optional. Add a subnet for the Kubernetes Pods traffic. The addresses from this subnet are assigned to interfaces connected to the Kubernetes workloads network and used by Calico CNI as underlay for traffic between the pods in the Kubernetes cluster. Configuration examples:
Single-rack cluster
apiVersion: ipam.mirantis.com/v1alpha1 kind: Subnet metadata: labels: kaas.mirantis.com/provider: baremetal name: k8s-pods-subnet namespace: <MOSKClusterNamespace> spec: cidr: 10.12.3.0/24 includeRanges: - 10.12.3.10-10.12.3.100
Multi-rack cluster
This network may include multiple per-rack VLANs and IP subnets. The addresses from the subnets are assigned to all MOSK cluster nodes. For details, see Network types.
apiVersion: ipam.mirantis.com/v1alpha1 kind: Subnet metadata: name: rack-1-k8s-pods namespace: mosk-namespace-name labels: kaas.mirantis.com/provider: baremetal cluster.sigs.k8s.io/cluster-name: mosk-cluster-name rack-1-k8s-pods: true spec: cidr: 10.20.151.0/24 gateway: 10.20.151.1 includeRanges: - 10.20.151.16-10.20.151.255 --- apiVersion: ipam.mirantis.com/v1alpha1 kind: Subnet metadata: name: rack-2-k8s-pods namespace: mosk-namespace-name labels: kaas.mirantis.com/provider: baremetal cluster.sigs.k8s.io/cluster-name: mosk-cluster-name rack-2-k8s-pods: true spec: cidr: 10.20.152.0/24 gateway: 10.20.152.1 includeRanges: - 10.20.152.16-10.20.152.255 --- apiVersion: ipam.mirantis.com/v1alpha1 kind: Subnet metadata: name: rack-3-k8s-pods namespace: mosk-namespace-name labels: kaas.mirantis.com/provider: baremetal cluster.sigs.k8s.io/cluster-name: mosk-cluster-name rack-3-k8s-pods: true spec: cidr: 10.20.153.0/24 gateway: 10.20.153.1 includeRanges: - 10.20.153.16-10.20.153.255 --- # Add more Subnet object templates as required using the above example # (one subnet per rack)
Configuration rules:
Use this subnet in the L2 template for all nodes in the cluster.
Use the
npTemplate.bridges.k8s-podsbridge name in the L2 template. This bridge name is reserved for the Kubernetes workloads network. When thek8s-podsbridge is defined in an L2 template, Calico CNI uses that network for routing the Pods traffic between nodes.
Optional. Add a subnet for the MOSK overlay network. this is the underlay network for VXLAN tunnels for the MOSK tenant traffic. If deployed with Tungsten Fabric, it is used for the MPLS over UDP+GRE traffic. Configuration examples:
Single-rack cluster
apiVersion: ipam.mirantis.com/v1alpha1 kind: Subnet metadata: labels: kaas.mirantis.com/provider: baremetal name: neutron-tunnel-subnet namespace: <MOSKClusterNamespace> spec: cidr: 10.12.2.0/24 includeRanges: - 10.12.2.10-10.12.2.100
Multi-rack cluster
apiVersion: ipam.mirantis.com/v1alpha1 kind: Subnet metadata: name: rack-1-tenant-tunnel namespace: mosk-namespace-name labels: kaas.mirantis.com/provider: baremetal cluster.sigs.k8s.io/cluster-name: mosk-cluster-name rack-1-tenant-tunnel: true spec: cidr: 10.20.161.0/24 gateway: 10.20.161.1 includeRanges: - 10.20.161.16-10.20.161.255 --- apiVersion: ipam.mirantis.com/v1alpha1 kind: Subnet metadata: name: rack-2-tenant-tunnel namespace: mosk-namespace-name labels: kaas.mirantis.com/provider: baremetal cluster.sigs.k8s.io/cluster-name: mosk-cluster-name rack-2-tenant-tunnel: true spec: cidr: 10.20.162.0/24 gateway: 10.20.162.1 includeRanges: - 10.20.162.16-10.20.162.255 --- apiVersion: ipam.mirantis.com/v1alpha1 kind: Subnet metadata: name: rack-3-tenant-tunnel namespace: mosk-namespace-name labels: kaas.mirantis.com/provider: baremetal cluster.sigs.k8s.io/cluster-name: mosk-cluster-name rack-3-tenant-tunnel: true spec: cidr: 10.20.163.0/24 gateway: 10.20.163.1 includeRanges: - 10.20.163.16-10.20.163.255 --- # Add more Subnet object templates as required using the above example # (one subnet per rack)
Configuration rules:
Use this subnet in the L2 template for the compute and gateway (controller) nodes in the MOSK cluster.
Assign this subnet to the interface connected to your MOSK overlay network.
This network is used to provide denied and secure tenant networks with the help of the tunneling mechanism (VLAN/GRE/VXLAN). If the VXLAN and GRE encapsulation takes place, the IP address assignment is required on interfaces at the node level. On the Tungsten Fabric deployments, this network is used for MPLS over UDP+GRE traffic.
Optional. Add a subnet for the MOSK live migration network. This subnet is used by the Compute service (OpenStack Nova) to transfer data during live migration. Depending on the cloud needs, you can place it on a dedicated physical network not to affect other networks during live migration. The IP address assignment is required on interfaces at the node level. Configuration examples:
Single-rack cluster
apiVersion: ipam.mirantis.com/v1alpha1 kind: Subnet metadata: labels: kaas.mirantis.com/provider: baremetal name: live-migration-subnet namespace: <MOSKClusterNamespace> spec: cidr: 10.12.7.0/24 includeRanges: - 10.12.7.10-10.12.7.100
Multi-rack cluster
apiVersion: ipam.mirantis.com/v1alpha1 kind: Subnet metadata: name: rack-1-live-migration namespace: mosk-namespace-name labels: kaas.mirantis.com/provider: baremetal cluster.sigs.k8s.io/cluster-name: mosk-cluster-name rack-1-live-migration: true spec: cidr: 10.20.171.0/24 gateway: 10.20.171.1 includeRanges: - 10.20.171.16-10.20.171.255 --- apiVersion: ipam.mirantis.com/v1alpha1 kind: Subnet metadata: name: rack-2-live-migration namespace: mosk-namespace-name labels: kaas.mirantis.com/provider: baremetal cluster.sigs.k8s.io/cluster-name: mosk-cluster-name rack-2-live-migration: true spec: cidr: 10.20.172.0/24 gateway: 10.20.172.1 includeRanges: - 10.20.172.16-10.20.172.255 --- apiVersion: ipam.mirantis.com/v1alpha1 kind: Subnet metadata: name: rack-3-live-migration namespace: mosk-namespace-name labels: kaas.mirantis.com/provider: baremetal cluster.sigs.k8s.io/cluster-name: mosk-cluster-name rack-3-live-migration: true spec: cidr: 10.20.173.0/24 gateway: 10.20.173.1 includeRanges: - 10.20.173.16-10.20.173.255 --- # Add more Subnet object templates as required using the above example # (one subnet per rack)
Configuration rules:
Use this subnet in the L2 template for compute nodes in the MOSK cluster.
Assign this subnet to the interface connected to your MOSK overlay network.
Verify that the subnet is successfully created:
kubectl get subnet kaas-mgmt -oyaml
In the system output, verify the
Subnetobject status.Status fields of the Subnet object¶ Parameter
Description
stateSince 23.1Contains a short state description and a more detailed one if applicable. The short status values are as follows:
OK- object is operational.ERR- object is non-operational. This status has a detailed description in themessageslist.TERM- object was deleted and is terminating.
messagesSince 23.1Contains error or warning messages if the object state is
ERR. For example,ERR: Wrong includeRange for CIDR….statusMessageDeprecated since MOSK 23.1 and will be removed in one of the following releases in favor of
stateandmessages. Since MOSK 23.2, this field is not set for the objects of newly created clusters.cidrReflects the actual CIDR, has the same meaning as
spec.cidr.gatewayReflects the actual gateway, has the same meaning as
spec.gateway.nameserversReflects the actual name servers, has same meaning as
spec.nameservers.rangesSpecifies the address ranges that are calculated using the fields from
spec: cidr, includeRanges, excludeRanges, gateway, useWholeCidr. These ranges are directly used for nodes IP allocation.allocatableIncludes the number of currently available IP addresses that can be allocated for nodes from the subnet.
allocatedIPsSpecifies the list of IPv4 addresses with the corresponding
IPaddrobject IDs that were already allocated from the subnet.capacityContains the total number of IP addresses being held by ranges that equals to a sum of the
allocatableandallocatedIPsparameters values.objCreatedDate, time, and IPAM version of the
SubnetCR creation.objStatusUpdatedDate, time, and IPAM version of the last update of the
statusfield in theSubnetCR.objUpdatedDate, time, and IPAM version of the last
SubnetCR update bykaas-ipam.Example of a successfully created subnet:
apiVersion: ipam.mirantis.com/v1alpha1 kind: Subnet metadata: labels: ipam/UID: 6039758f-23ee-40ba-8c0f-61c01b0ac863 kaas.mirantis.com/provider: baremetal ipam/SVC-k8s-lcm: "1" name: kaas-mgmt namespace: default spec: cidr: 10.0.0.0/24 excludeRanges: - 10.0.0.100 - 10.0.0.101-10.0.0.120 gateway: 10.0.0.1 includeRanges: - 10.0.0.50-10.0.0.90 nameservers: - 172.18.176.6 status: allocatable: 38 allocatedIPs: - 10.0.0.50:0b50774f-ffed-11ea-84c7-0242c0a85b02 - 10.0.0.51:1422e651-ffed-11ea-84c7-0242c0a85b02 - 10.0.0.52:1d19912c-ffed-11ea-84c7-0242c0a85b02 capacity: 41 cidr: 10.0.0.0/24 gateway: 10.0.0.1 objCreated: 2021-10-21T19:09:32Z by v5.1.0-20210930-121522-f5b2af8 objStatusUpdated: 2021-10-21T19:14:18.748114886Z by v5.1.0-20210930-121522-f5b2af8 objUpdated: 2021-10-21T19:09:32.606968024Z by v5.1.0-20210930-121522-f5b2af8 nameservers: - 172.18.176.6 ranges: - 10.0.0.50-10.0.0.90
Proceed to creating L2 templates as described in Create L2 templates.
Create L2 templates
After you create subnets for the MOSK cluster as described in Create subnets, follow the procedure below to create L2 templates for different types of OpenStack nodes in the cluster.
See the following subsections for templates that implement the MOSK Reference Architecture: Networking. You may adjust the templates according to the requirements of your architecture using the last two subsections of this section. They explain mandatory parameters of the templates and supported configuration options.
After you create subnets for one or more MOSK clusters or projects as described in Create subnets, follow the procedure below to create L2 templates for a MOSK cluster.
L2 templates are used directly during provisioning. This way, a hardware node obtains and applies a complete network configuration during the first system boot.
Caution
Update any L2 template created before Container Cloud 2.9.0 (Cluster releases 6.14.0, 5.15.0, or earlier) to the new format as described in Switch L2 templates to the new format.
Caution
Create L2 templates before adding any machines to your new MOSK cluster.
Log in to a local machine where your management cluster
kubeconfigis located and wherekubectlis installed.Note
The management cluster
kubeconfigis created during the last stage of the management cluster bootstrap.Create a set of
L2TemplateYAML files specific to your deployment using exemplary templates provided in Create L2 templates.Note
You can create several L2 templates with different configurations to be applied to different nodes of the same cluster. See Assign L2 templates to machines for details.
Add or edit the mandatory labels and parameters in the new L2 template. For description of mandatory labels and parameters, see L2Template.
Optional. To designate an L2 template as default, assign the
ipam/DefaultForClusterlabel to it. Only one L2 template in a cluster can have this label. It will be used for machines that do not have an L2 template explicitly assigned to them.Note
You may skip this step and add the default label along with other custom labels using the Container Cloud web UI, as described below in this procedure.
To assign the default template to the cluster:
Use the mandatory
cluster.sigs.k8s.io/cluster-namelabel in the L2 templatemetadatasection.Use the
cluster.sigs.k8s.io/cluster-namelabel or theclusterRefparameter in the L2 templatespecsection. During cluster update to 2.25.0, this deprecated parameter is automatically migrated to thecluster.sigs.k8s.io/cluster-namelabel.Optional. Add custom labels to the L2 template. You can refer to these labels to assign the L2 template to machines.
Add the L2 template to your management cluster. Select one of the following options:
kubectl --kubeconfig <pathToManagementClusterKubeconfig> apply -f <pathToL2TemplateYamlFile>
Log in to the Container Cloud web UI with the
m:kaas:namespace@operatororm:kaas:namespace@writerpermissions.Switch to the required non-
defaultproject using the Switch Project action icon located on top of the main left-side navigation panel.Caution
Do not create a MOSK cluster in the
defaultproject (Kubernetes namespace), which is dedicated for the management cluster only. If no projects are defined, first create a newmoskproject as described in Create a project for MOSK clusters.In the left sidebar, navigate to Networks and click the L2 Templates tab.
Click Create L2 Template.
Fill out the Create L2 Template form as required:
- Name
L2 template name.
- Cluster
Cluster name that the L2 template is being added for. To set the L2 template as default for all machines, also select Set default for the cluster.
- Specification
L2 specification in the YAML format that you have previously created. Click Edit to edit the L2 template if required.
Note
Before Container Cloud 2.28.0 (Cluster releases 17.3.0 and 16.3.0), the field name is YAML file, and you can upload the required YAML file instead of inserting and editing it.
- Labels
Available since Container Cloud 2.28.0 (Cluster releases 17.3.0 and 16.3.0). Key-value pairs attached to the L2 template. For details, see L2Template metadata.
Optional. Further modify the template, if required. For description of parameters, see L2Template.
kubectl --kubeconfig <pathToManagementClusterKubeconfig> \ -n <ProjectNameForNewMOSKCluster> edit l2template <L2templateName>
Caution
Modification of L2 templates in use is only allowed with a mandatory validation step from the infrastructure operator to prevent accidental cluster failures due to unsafe changes. The list of risks posed by modifying L2 templates includes:
Services running on hosts cannot reconfigure automatically to switch to the new IP addresses and/or interfaces.
Connections between services are interrupted unexpectedly, which can cause data loss.
Incorrect configurations on hosts can lead to irrevocable loss of connectivity between services and unexpected cluster partition or disassembly.
For details, see Modify network configuration on an existing machine.
Proceed with Add a machine. The resulting L2 template will be used to render the netplan configuration for the MOSK cluster machines.
The
kaas-ipamservice uses the data fromBareMetalHost,L2Template, andSubnetobjects to generate the netplan configuration for every cluster machine.Note
Before update of the management cluster to Container Cloud 2.29.0 (Cluster release 16.4.0), instead of
BareMetalHostInventory, use theBareMetalHostobject. For details, see BareMetalHost resource.Caution
While the Cluster release of the management cluster is 16.4.0,
BareMetalHostInventoryoperations are allowed tom:kaas@management-adminonly. This limitation is lifted once the management cluster is updated to the Cluster release 16.4.1 or later.The generated netplan configuration is saved in the
status.netconfigFilessection of theIpamHostobject. If thestatus.netconfigFilesStatefield of theIpamHostobject isOK, the configuration was rendered in theIpamHostobject successfully. Otherwise, the status contains an error message.Caution
The following fields of the
ipamHoststatus are renamed since MOSK 23.1 in the scope of theL2TemplateandIpamHostobjects refactoring:netconfigV2tonetconfigCandidatenetconfigV2statetonetconfigCandidateStatenetconfigFilesStatetonetconfigFilesStates(per file)
No user actions are required after renaming.
The format of
netconfigFilesStatechanged after renaming. ThenetconfigFilesStatesfield contains a dictionary of statuses of network configuration files stored innetconfigFiles. The dictionary contains the keys that are file paths and values that have the same meaning for each file thatnetconfigFilesStatehad:For a successfully rendered configuration file:
OK: <timestamp> <sha256-hash-of-rendered-file>, where a timestamp is in the RFC 3339 format.For a failed rendering:
ERR: <error-message>.
The
baremetal-providerservice copies data fromstatus.netconfigFilesof theIpamHostobject to theSpec.StateItemsOverwrites[‘deploy’][‘bm_ipam_netconfigv2’]parameter ofLCMMachine.The
lcm-agentservice on every host synchronizes theLCMMachinedata to its host. Thelcm-agentservice runs a playbook to update the netplan configuration on the host during thepre-downloadanddeployphases.
For a multi-rack MOSK cluster, you need to create one L2 template for each type of server in each rack. This may result in a large number of L2 templates in your configuration.
For example, if you have a three-rack deployment of MOSK with 4 types of nodes evenly distributed across three racks, you have to create at least the following L2 templates:
rack-1-k8s-manager,rack-2-k8s-manager,rack-3-k8s-managerfor Kubernetes control plane nodes, unless you use the compact control plane option.rack-1-mosk-control,rack-2-mosk-control,rack-3-mosk-controlfor OpenStack controller nodes in each rack.rack-1-mosk-compute,rack-2-mosk-compute,rack-3-mosk-computefor OpenStack compute nodes in each rack.rack-1-mosk-storage,rack-2-mosk-storage,rack-3-mosk-storagefor OpenStack storage nodes in each rack.
In total, twelve L2 templates are required for this relatively simple cluster. In the following sections, the examples cover only one rack, but can be easily expanded to more racks.
Note
Three servers are required for Kubernetes control plane and for the OpenStack control plane. So, you might not need more L2 templates for these roles when expanding beyond three racks.
Now, proceed to creating L2 templates for your cluster, starting from Create an L2 template for a Kubernetes manager node.
Caution
Modification of L2 templates in use is only allowed with a mandatory validation step from the infrastructure operator to prevent accidental cluster failures due to unsafe changes. The list of risks posed by modifying L2 templates includes:
Services running on hosts cannot reconfigure automatically to switch to the new IP addresses and/or interfaces.
Connections between services are interrupted unexpectedly, which can cause data loss.
Incorrect configurations on hosts can lead to irrevocable loss of connectivity between services and unexpected cluster partition or disassembly.
For details, see Modify network configuration on an existing machine.
According to the reference architecture, the Kubernetes manager nodes in the MOSK cluster must be connected to the following networks:
PXE network
API/LCM network (if you configure ARP announcement of the load-balancer IP address for the MOSK cluster API)
LCM network (if you configure BGP announcement of the load-balancer IP address for the MOSK cluster API)
Kubernetes workloads network
Caution
If you plan to deploy MOSK cluster with the compact control plane option, skip this section entirely and proceed with Create an L2 template for a MOSK controller node.
To create L2 templates for Kubernetes manager nodes:
Create or open the
mosk-l2templates.ymlfile that contains the L2 templates you are preparing.Add L2 templates using the following example. Adjust the values of specific parameters according to the specifications of your environment, specifically the name of your project (namespace) and cluster, IP address ranges and networks, subnet names.
L2 template example for Kubernetes manager node¶apiVersion: ipam.mirantis.com/v1alpha1 kind: L2Template metadata: labels: kaas.mirantis.com/provider: baremetal kaas.mirantis.com/region: region-one cluster.sigs.k8s.io/cluster-name: mosk-cluster-name rack1-mosk-manager: "true" name: rack1-mosk-manager namespace: mosk-namespace-name spec: autoIfMappingPrio: - provision - eno - ens - enp l3Layout: - subnetName: api-lcm scope: namespace - subnetName: rack1-k8s-pods scope: namespace npTemplate: |- version: 2 ethernets: {{nic 0}}: dhcp4: false dhcp6: false match: macaddress: {{mac 0}} set-name: {{nic 0}} mtu: 9000 {{nic 1}}: dhcp4: false dhcp6: false match: macaddress: {{mac 1}} set-name: {{nic 1}} mtu: 9000 {{nic 2}} dhcp4: false dhcp6: false match: macaddress: {{mac 2}} set-name: {{nic 2}} mtu: 9000 {{nic 3}}: dhcp4: false dhcp6: false match: macaddress: {{mac 3}} set-name: {{nic 3}} mtu: 9000 bonds: bond0: mtu: 9000 parameters: mode: 802.3ad mii-monitor-interval: 100 interfaces: - {{nic 0}} - {{nic 1}} vlans: k8s-lcm-v: id: 403 link: bond0 mtu: 9000 k8s-pods-v: id: 408 link: bond0 mtu: 9000 bridges: k8s-lcm: interfaces: [k8s-lcm-v] addresses: - {{ ip "k8s-lcm:api-lcm" }} nameservers: addresses: {{nameservers_from_subnet "api-lcm"}} gateway4: {{ gateway_from_subnet "api-lcm" }} k8s-pods: interfaces: [k8s-pods-v] addresses: - {{ip "k8s-pods:rack1-k8s-pods"}} mtu: 9000 routes: - to: 10.199.0.0/22 # aggregated address space for Kubernetes workloads via: {{gateway_from_subnet "rack1-k8s-pods"}}
Note
The
kaas.mirantis.com/regionlabel is removed from all MOSK objects in 24.1. Therefore, do not add the label starting with this release. On existing clusters updated to this release, or if added manually, MOSK ignores this label.Note
Before MOSK 23.3, an L2 template requires
clusterRef: <clusterName>in thespecsection. Since MOSK 23.3, this parameter is deprecated and automatically migrated to thecluster.sigs.k8s.io/cluster-name: <clusterName>label.To create L2 templates for other racks, change the rack identifier in the names and labels above.
Proceed with Create an L2 template for a MOSK controller node. The resulting L2 templates will be used to render the netplan configuration for the managed cluster machines.
Caution
Modification of L2 templates in use is only allowed with a mandatory validation step from the infrastructure operator to prevent accidental cluster failures due to unsafe changes. The list of risks posed by modifying L2 templates includes:
Services running on hosts cannot reconfigure automatically to switch to the new IP addresses and/or interfaces.
Connections between services are interrupted unexpectedly, which can cause data loss.
Incorrect configurations on hosts can lead to irrevocable loss of connectivity between services and unexpected cluster partition or disassembly.
For details, see Modify network configuration on an existing machine.
According to the reference architecture, MOSK controller nodes must be connected to the following networks:
PXE network
LCM network
External network
Kubernetes workloads network
Storage access network (if deploying with Ceph as a backend for ephemeral storage)
Floating IP and provider networks. Not required for deployment with Tungsten Fabric.
Tenant underlay networks. If deploying with VXLAN networking or with Tungsten Fabric. In the latter case, the BGP service is configured over this network.
To create L2 templates for MOSK controller nodes:
Create or open the
mosk-l2template.ymlfile that contains the L2 templates.Add L2 templates using the following example. Adjust the values of specific parameters according to the specification of your environment.
Example of an L2 template for a MOSK controller node¶apiVersion: ipam.mirantis.com/v1alpha1 kind: L2Template metadata: labels: kaas.mirantis.com/provider: baremetal kaas.mirantis.com/region: region-one cluster.sigs.k8s.io/cluster-name: mosk-cluster-name rack1-mosk-controller: "true" name: rack1-mosk-controller namespace: mosk-namespace-name spec: autoIfMappingPrio: - provision - eno - ens - enp l3Layout: - subnetName: mgmt-lcm scope: global - subnetName: rack1-k8s-lcm scope: namespace - subnetName: k8s-external scope: namespace - subnetName: rack1-k8s-pods scope: namespace - subnetName: rack1-ceph-public scope: namespace - subnetName: rack1-tenant-tunnel scope: namespace npTemplate: |- version: 2 ethernets: {{nic 0}}: dhcp4: false dhcp6: false match: macaddress: {{mac 0}} set-name: {{nic 0}} mtu: 9000 {{nic 1}}: dhcp4: false dhcp6: false match: macaddress: {{mac 1}} set-name: {{nic 1}} mtu: 9000 {{nic 2}} dhcp4: false dhcp6: false match: macaddress: {{mac 2}} set-name: {{nic 2}} mtu: 9000 {{nic 3}}: dhcp4: false dhcp6: false match: macaddress: {{mac 3}} set-name: {{nic 3}} mtu: 9000 bonds: bond0: mtu: 9000 parameters: mode: 802.3ad mii-monitor-interval: 100 interfaces: - {{nic 0}} - {{nic 1}} bond1: mtu: 9000 parameters: mode: 802.3ad mii-monitor-interval: 100 interfaces: - {{nic 2}} - {{nic 3}} vlans: k8s-lcm-v: id: 403 link: bond0 mtu: 9000 k8s-ext-v: id: 409 link: bond0 mtu: 9000 k8s-pods-v: id: 408 link: bond0 mtu: 9000 pr-floating: id: 407 link: bond1 mtu: 9000 stor-frontend: id: 404 link: bond0 addresses: - {{ip "stor-frontend:rack1-ceph-public"}} mtu: 9000 routes: - to: 10.199.16.0/22 # aggregated address space for Ceph public network via: {{ gateway_from_subnet "rack1-ceph-public" }} tenant-tunnel: id: 406 link: bond1 addresses: - {{ip "tenant-tunnel:rack1-tenant-tunnel"}} mtu: 9000 routes: - to: 10.195.0.0/22 # aggregated address space for tenant networks via: {{ gateway_from_subnet "rack1-tenant-tunnel" }} bridges: k8s-lcm: interfaces: [k8s-lcm-v] addresses: - {{ ip "k8s-lcm:rack1-k8s-lcm" }} nameservers: addresses: {{nameservers_from_subnet "rack1-k8s-lcm"}} routes: - to: 10.197.0.0/21 # aggregated address space for LCM and API/LCM networks via: {{ gateway_from_subnet "rack1-k8s-lcm" }} - to: {{ cidr_from_subnet "mgmt-lcm" }} via: {{ gateway_from_subnet "rack1-k8s-lcm" }} k8s-ext: interfaces: [k8s-ext-v] addresses: - {{ip "k8s-ext:k8s-external"}} nameservers: addresses: {{nameservers_from_subnet "k8s-external"}} gateway4: {{ gateway_from_subnet "k8s-external" }} mtu: 9000 k8s-pods: interfaces: [k8s-pods-v] addresses: - {{ip "k8s-pods:rack1-k8s-pods"}} mtu: 9000 routes: - to: 10.199.0.0/22 # aggregated address space for Kubernetes workloads via: {{ gateway_from_subnet "rack1-k8s-pods" }}
Note
The
kaas.mirantis.com/regionlabel is removed from all MOSK objects in 24.1. Therefore, do not add the label starting with this release. On existing clusters updated to this release, or if added manually, MOSK ignores this label.Note
Before MOSK 23.3, an L2 template requires
clusterRef: <clusterName>in thespecsection. Since MOSK 23.3, this parameter is deprecated and automatically migrated to thecluster.sigs.k8s.io/cluster-name: <clusterName>label.
Caution
If you plan to deploy a MOSK cluster with
the compact control plane option and configure ARP announcement of the
load-balancer IP address for the MOSK cluster API, the
API/LCM network will be used for MOSK controller nodes.
Therefore, change the rack1-k8s-lcm subnet to the api-lcm one in
the corresponding L2Template object:
spec:
...
l3Layout:
...
- subnetName: api-lcm
scope: namespace
...
npTemplate: |-
...
bridges:
k8s-lcm:
interfaces: [k8s-lcm-v]
addresses:
- {{ ip "k8s-lcm:api-lcm" }}
nameservers:
addresses: {{nameservers_from_subnet "api-lcm"}}
routes:
- to: 10.197.0.0/21 # aggregated address space for LCM and API/LCM networks
via: {{ gateway_from_subnet "api-lcm" }}
- to: {{ cidr_from_subnet "mgmt-lcm" }}
via: {{ gateway_from_subnet "api-lcm" }}
...
Proceed with Create an L2 template for a MOSK compute node.
Caution
Modification of L2 templates in use is only allowed with a mandatory validation step from the infrastructure operator to prevent accidental cluster failures due to unsafe changes. The list of risks posed by modifying L2 templates includes:
Services running on hosts cannot reconfigure automatically to switch to the new IP addresses and/or interfaces.
Connections between services are interrupted unexpectedly, which can cause data loss.
Incorrect configurations on hosts can lead to irrevocable loss of connectivity between services and unexpected cluster partition or disassembly.
For details, see Modify network configuration on an existing machine.
According to the reference architecture, MOSK compute nodes must be connected to the following networks:
PXE network
LCM network
Kubernetes workloads network
Storage access network (if deploying with Ceph as a backend for ephemeral storage)
Floating IP and provider networks (if deploying OpenStack with DVR)
Tenant underlay networks
To create L2 templates for MOSK compute nodes:
Add L2 templates to the
mosk-l2templates.ymlfile using the following example. Adjust the values of parameters according to the specification of your environment.Example of an L2 template for a MOSK compute node¶apiVersion: ipam.mirantis.com/v1alpha1 kind: L2Template metadata: labels: kaas.mirantis.com/provider: baremetal kaas.mirantis.com/region: region-one cluster.sigs.k8s.io/cluster-name: mosk-cluster-name rack1-mosk-compute: "true" name: rack1-mosk-compute namespace: mosk-namespace-name spec: autoIfMappingPrio: - provision - eno - ens - enp l3Layout: - subnetName: rack1-k8s-lcm scope: namespace - subnetName: rack1-k8s-pods scope: namespace - subnetName: rack1-ceph-public scope: namespace - subnetName: rack1-tenant-tunnel scope: namespace npTemplate: |- version: 2 ethernets: {{nic 0}}: dhcp4: false dhcp6: false match: macaddress: {{mac 0}} set-name: {{nic 0}} mtu: 9000 {{nic 1}}: dhcp4: false dhcp6: false match: macaddress: {{mac 1}} set-name: {{nic 1}} mtu: 9000 {{nic 2}} dhcp4: false dhcp6: false match: macaddress: {{mac 2}} set-name: {{nic 2}} mtu: 9000 {{nic 3}}: dhcp4: false dhcp6: false match: macaddress: {{mac 3}} set-name: {{nic 3}} mtu: 9000 bonds: bond0: mtu: 9000 parameters: mode: 802.3ad mii-monitor-interval: 100 interfaces: - {{nic 0}} - {{nic 1}} bond1: mtu: 9000 parameters: mode: 802.3ad mii-monitor-interval: 100 interfaces: - {{nic 2}} - {{nic 3}} vlans: k8s-lcm-v: id: 403 link: bond0 mtu: 9000 k8s-pods-v: id: 408 link: bond0 mtu: 9000 pr-floating: id: 407 link: bond1 mtu: 9000 stor-frontend: id: 404 link: bond0 addresses: - {{ip "stor-frontend:rack1-ceph-public"}} mtu: 9000 routes: - to: 10.199.16.0/22 # aggregated address space for Ceph public network via: {{ gateway_from_subnet "rack1-ceph-public" }} tenant-tunnel: id: 406 link: bond1 addresses: - {{ip "tenant-tunnel:rack1-tenant-tunnel"}} mtu: 9000 routes: - to: 10.195.0.0/22 # aggregated address space for tenant networks via: {{ gateway_from_subnet "rack1-tenant-tunnel" }} bridges: k8s-lcm: interfaces: [k8s-lcm-v] addresses: - {{ ip "k8s-lcm:rack1-k8s-lcm" }} nameservers: addresses: {{nameservers_from_subnet "rack1-k8s-lcm"}} gateway4: {{ gateway_from_subnet "rack1-k8s-lcm" }} k8s-pods: interfaces: [k8s-pods-v] addresses: - {{ip "k8s-pods:k8s-pods-subnet"}} mtu: 9000 routes: - to: 10.199.0.0/22 # aggregated address space for Kubernetes workloads via: {{gateway_from_subnet "rack1-k8s-pods"}}
Note
The
kaas.mirantis.com/regionlabel is removed from all MOSK objects in 24.1. Therefore, do not add the label starting with this release. On existing clusters updated to this release, or if added manually, MOSK ignores this label.Note
Before MOSK 23.3, an L2 template requires
clusterRef: <clusterName>in thespecsection. Since MOSK 23.3, this parameter is deprecated and automatically migrated to thecluster.sigs.k8s.io/cluster-name: <clusterName>label.Proceed with Create an L2 template for a MOSK storage node.
Caution
Modification of L2 templates in use is only allowed with a mandatory validation step from the infrastructure operator to prevent accidental cluster failures due to unsafe changes. The list of risks posed by modifying L2 templates includes:
Services running on hosts cannot reconfigure automatically to switch to the new IP addresses and/or interfaces.
Connections between services are interrupted unexpectedly, which can cause data loss.
Incorrect configurations on hosts can lead to irrevocable loss of connectivity between services and unexpected cluster partition or disassembly.
For details, see Modify network configuration on an existing machine.
According to the reference architecture, MOSK storage nodes in the MOSK cluster must be connected to the following networks:
PXE network
LCM network
Kubernetes workloads network
Storage access network
Storage replication network
To create L2 templates for MOSK storage nodes:
Add L2 templates to the
mosk-l2templates.ymlfile using the following example. Adjust the values of parameters according to the specification of your environment.Example of an L2 template for a MOSK storage node¶apiVersion: ipam.mirantis.com/v1alpha1 kind: L2Template metadata: labels: kaas.mirantis.com/provider: baremetal kaas.mirantis.com/region: region-one cluster.sigs.k8s.io/cluster-name: mosk-cluster-name rack1-mosk-storage: "true" name: rack1-mosk-storage namespace: mosk-namespace-name spec: autoIfMappingPrio: - provision - eno - ens - enp l3Layout: - subnetName: rack1-k8s-lcm scope: namespace - subnetName: rack1-k8s-pods scope: namespace - subnetName: rack1-ceph-public scope: namespace - subnetName: rack1-ceph-cluster scope: namespace npTemplate: |- version: 2 ethernets: {{nic 0}}: dhcp4: false dhcp6: false match: macaddress: {{mac 0}} set-name: {{nic 0}} mtu: 9000 {{nic 1}}: dhcp4: false dhcp6: false match: macaddress: {{mac 1}} set-name: {{nic 1}} mtu: 9000 {{nic 2}} dhcp4: false dhcp6: false match: macaddress: {{mac 2}} set-name: {{nic 2}} mtu: 9000 {{nic 3}}: dhcp4: false dhcp6: false match: macaddress: {{mac 3}} set-name: {{nic 3}} mtu: 9000 bonds: bond0: mtu: 9000 parameters: mode: 802.3ad mii-monitor-interval: 100 interfaces: - {{nic 0}} - {{nic 1}} bond1: mtu: 9000 parameters: mode: 802.3ad mii-monitor-interval: 100 interfaces: - {{nic 2}} - {{nic 3}} vlans: k8s-lcm-v: id: 403 link: bond0 mtu: 9000 k8s-pods-v: id: 408 link: bond0 mtu: 9000 stor-frontend: id: 404 link: bond0 addresses: - {{ip "stor-frontend:rack1-ceph-public"}} mtu: 9000 routes: - to: 10.199.16.0/22 # aggregated address space for Ceph public network via: {{ gateway_from_subnet "rack1-ceph-public" }} stor-backend: id: 405 link: bond1 addresses: - {{ip "stor-backend:rack1-ceph-cluster"}} mtu: 9000 routes: - to: 10.199.32.0/22 # aggregated address space for Ceph cluster network via: {{ gateway_from_subnet "rack1-ceph-cluster" }} bridges: k8s-lcm: interfaces: [k8s-lcm-v] addresses: - {{ ip "k8s-lcm:rack1-k8s-lcm" }} nameservers: addresses: {{nameservers_from_subnet "rack1-k8s-lcm"}} gateway4: {{ gateway_from_subnet "rack1-k8s-lcm" }} k8s-pods: interfaces: [k8s-pods-v] addresses: - {{ip "k8s-pods:k8s-pods-subnet"}} mtu: 9000 routes: - to: 10.199.0.0/22 # aggregated address space for Kubernetes workloads via: {{gateway_from_subnet "rack1-k8s-pods"}}
Note
The
kaas.mirantis.com/regionlabel is removed from all MOSK objects in 24.1. Therefore, do not add the label starting with this release. On existing clusters updated to this release, or if added manually, MOSK ignores this label.Note
Before MOSK 23.3, an L2 template requires
clusterRef: <clusterName>in thespecsection. Since MOSK 23.3, this parameter is deprecated and automatically migrated to thecluster.sigs.k8s.io/cluster-name: <clusterName>label.Proceed with the L2 template configuration procedure described in Create an L2 template for a new cluster.
This section contains an exemplary L2 template that demonstrates how to set up bonds and bridges on hosts for your managed clusters.
Configure bonding options using the parameters field. The only
mandatory option is mode. See the example below for details.
Note
You can set any mode supported by netplan and your hardware.
Important
Bond monitoring is disabled in Ubuntu by default. However,
Mirantis highly recommends enabling it using the Media Independent Interface
(MII) monitoring by setting the mii-monitor-interval parameter to a
non-zero value. For details, see Linux documentation: bond monitoring.
apiVersion: ipam.mirantis.com/v1alpha1
kind: L2Template
metadata:
name: test-managed
namespace: managed-ns
labels:
cluster.sigs.k8s.io/cluster-name: mosk-cluster-name
spec:
autoIfMappingPrio:
- provision
- eno
- ens
- enp
l3Layout:
- subnetName: mgmt-lcm
scope: global
- subnetName: demo-lcm
scope: namespace
- subnetName: demo-ext
scope: namespace
- subnetName: demo-pods
scope: namespace
- subnetName: demo-ceph-cluster
scope: namespace
- subnetName: demo-ceph-public
scope: namespace
npTemplate: |
version: 2
ethernets:
ten10gbe0s0:
dhcp4: false
dhcp6: false
match:
macaddress: {{mac 2}}
set-name: {{nic 2}}
ten10gbe0s1:
dhcp4: false
dhcp6: false
match:
macaddress: {{mac 3}}
set-name: {{nic 3}}
bonds:
bond0:
interfaces:
- ten10gbe0s0
- ten10gbe0s1
mtu: 9000
parameters:
mode: 802.3ad
mii-monitor-interval: 100
vlans:
k8s-lcm-vlan:
id: 1009
link: bond0
k8s-ext-vlan:
id: 1001
link: bond0
k8s-pods-vlan:
id: 1002
link: bond0
stor-frontend:
id: 1003
link: bond0
stor-backend:
id: 1004
link: bond0
bridges:
k8s-lcm:
interfaces: [k8s-lcm-vlan]
addresses:
- {{ip "k8s-lcm:demo-lcm"}}
routes:
- to: {{ cidr_from_subnet "mgmt-lcm" }}
via: {{ gateway_from_subnet "demo-lcm" }}
k8s-ext:
interfaces: [k8s-ext-vlan]
addresses:
- {{ip "k8s-ext:demo-ext"}}
nameservers:
addresses: {{nameservers_from_subnet "demo-ext"}}
gateway4: {{ gateway_from_subnet "demo-ext" }}
k8s-pods:
interfaces: [k8s-pods-vlan]
addresses:
- {{ip "k8s-pods:demo-pods"}}
ceph-cluster:
interfaces: [stor-backend]
addresses:
- {{ip "ceph-cluster:demo-ceph-cluster"}}
ceph-public:
interfaces: [stor-frontend]
addresses:
- {{ip "ceph-public:demo-ceph-public"}}
Note
Before MOSK 23.3, an L2 template requires
clusterRef: <clusterName> in the spec section. Since MOSK 23.3,
this parameter is deprecated and automatically migrated to the
cluster.sigs.k8s.io/cluster-name: <clusterName> label.
For description of networks, refer to Network types.
Unsupported since MCC 2.28.0 (17.3.0 and 16.3.0)
Warning
The SubnetPool object is unsupported since Container Cloud
2.28.0 (Cluster releases 17.3.0 and 16.3.0). For details, see
Deprecation Notes: SubnetPool resource management.
This section contains an exemplary L2 template for automatic multiple
subnet creation as described in Automate multiple subnet creation using SubnetPool. This template
also contains the L3Layout section that allows defining the Subnet
scopes and enables auto-creation of the Subnet objects from the
SubnetPool objects. For details about auto-creation of the Subnet
objects see Automate multiple subnet creation using SubnetPool.
For details on how to create L2 templates, see Create an L2 template for a new cluster.
Caution
Do not assign an IP address to the PXE nic 0 NIC explicitly
to prevent the IP duplication during updates. The IP address is
automatically assigned by the bootstrapping engine.
Example of an L2 template for multiple subnets:
apiVersion: ipam.mirantis.com/v1alpha1
kind: L2Template
metadata:
name: test-managed
namespace: managed-ns
labels:
kaas.mirantis.com/provider: baremetal
kaas.mirantis.com/region: region-one
cluster.sigs.k8s.io/cluster-name: my-cluster
spec:
autoIfMappingPrio:
- provision
- eno
- ens
- enp
l3Layout:
- subnetName: lcm-subnet
scope: namespace
- subnetName: subnet-1
subnetPool: kaas-mgmt
scope: namespace
- subnetName: subnet-2
subnetPool: kaas-mgmt
scope: cluster
npTemplate: |
version: 2
ethernets:
onboard1gbe0:
dhcp4: false
dhcp6: false
match:
macaddress: {{mac 0}}
set-name: {{nic 0}}
# IMPORTANT: do not assign an IP address here explicitly
# to prevent IP duplication issues. The IP will be assigned
# automatically by the bootstrapping engine.
# addresses: []
onboard1gbe1:
dhcp4: false
dhcp6: false
match:
macaddress: {{mac 1}}
set-name: {{nic 1}}
ten10gbe0s0:
dhcp4: false
dhcp6: false
match:
macaddress: {{mac 2}}
set-name: {{nic 2}}
addresses:
- {{ip "2:subnet-1"}}
ten10gbe0s1:
dhcp4: false
dhcp6: false
match:
macaddress: {{mac 3}}
set-name: {{nic 3}}
addresses:
- {{ip "3:subnet-2"}}
bridges:
k8s-lcm:
interfaces: [onboard1gbe0]
addresses:
- {{ip "k8s-lcm:lcm-subnet"}}
gateway4: {{gateway_from_subnet "lcm-subnet"}}
nameservers:
addresses: {{nameservers_from_subnet "lcm-subnet"}}
Note
The kaas.mirantis.com/region label is removed from all MOSK
objects in 24.1. Therefore, do not add the label starting with this release.
On existing clusters updated to this release, or if added manually, MOSK
ignores this label.
In the template above, the following networks are defined
in the l3Layout section:
lcm-subnet- the subnet name to use for the LCM network innpTemplate. This subnet is shared between the project clusters because it has thenamespacedscope.Since a subnet pool is not in use, create the corresponding
Subnetobject before machines are attached to cluster manually. For details, see Create subnets for a managed cluster using CLI.Mark this
Subnetwith theipam/SVC-k8s-lcmlabel. The L2 template must contain the definition of the virtual Linux bridge (k8s-lcmin the L2 template example) that is used to set up the LCM network interface. IP addresses for the defined bridge must be assigned from the LCM subnet, which is marked with theipam/SVC-k8s-lcmlabel.Each node of every cluster must have one and only IP address in the LCM network that is allocated from one of the
Subnetobjects having theipam/SVC-k8s-lcmlabel defined. Therefore, allSubnetobjects used for LCM networks must have theipam/SVC-k8s-lcmlabel defined.You can use any interface name for the LCM network traffic. The
Subnetobjects for the LCM network must have theipam/SVC-k8s-lcmlabel. For details, see Service labels and their life cycle.
subnet-1- unless already created, this subnet will be created from thekaas-mgmtsubnet pool. The subnet name must be unique within the project. This subnet is shared between the project clusters.subnet-2- will be created from thekaas-mgmtsubnet pool. This subnet has theclusterscope. Therefore, the real name of theSubnetCR object consists of the subnet name defined inl3Layoutand the cluster UID. But thenpTemplatesection of the L2 template must contain only the subnet name defined inl3Layout. The subnets of theclusterscope are not shared between clusters.
Caution
Using the l3Layout section, define all subnets that are used
in the npTemplate section.
Defining only part of subnets is not allowed.
If labelSelector is used in l3Layout, use any custom
label name that differs from system names. This allows for easier
cluster scaling in case of adding new subnets as described in
Expand IP addresses capacity in an existing cluster.
Mirantis recommends using a unique label prefix such as
user-defined/.
Example of a complete template configuration for cluster creation
The following example contains all required objects of an advanced network and host configuration for a managed cluster.
The procedure below contains:
Various
.yamlobjects to be applied with a managed clusterkubeconfigUseful comments inside the
.yamlexample filesExample hardware and configuration data, such as
network,disk,auth, that must be updated accordingly to fit your cluster configurationExample templates, such as
l2templateandbaremetalhostprofline, that illustrate how to implement a specific configuration
Caution
The exemplary configuration described below is not production ready and is provided for illustration purposes only.
For illustration purposes, all files provided in this exemplary procedure are named by the Kubernetes object types:
Note
Before update of the management cluster to Container Cloud 2.29.0
(Cluster release 16.4.0), instead of BareMetalHostInventory, use the
BareMetalHost object. For details, see BareMetalHost resource.
Caution
While the Cluster release of the management cluster is 16.4.0,
BareMetalHostInventory operations are allowed to
m:kaas@management-admin only. This limitation is lifted once the
management cluster is updated to the Cluster release 16.4.1 or later.
managed-ns_BareMetalHostInventory_cz7700-managed-cluster-control-noefi.yaml
managed-ns_BareMetalHostInventory_cz7741-managed-cluster-control-noefi.yaml
managed-ns_BareMetalHostInventory_cz7743-managed-cluster-control-noefi.yaml
managed-ns_BareMetalHostInventory_cz812-managed-cluster-storage-worker-noefi.yaml
managed-ns_BareMetalHostInventory_cz813-managed-cluster-storage-worker-noefi.yaml
managed-ns_BareMetalHostInventory_cz814-managed-cluster-storage-worker-noefi.yaml
managed-ns_BareMetalHostInventory_cz815-managed-cluster-worker-noefi.yaml
managed-ns_BareMetalHostProfile_bmhp-cluster-default.yaml
managed-ns_BareMetalHostProfile_worker-storage1.yaml
managed-ns_Cluster_managed-cluster.yaml
managed-ns_KaaSCephCluster_ceph-cluster-managed-cluster.yaml
managed-ns_L2Template_bm-1490-template-controls-netplan-cz7700-pxebond.yaml
managed-ns_L2Template_bm-1490-template-controls-netplan.yaml
managed-ns_L2Template_bm-1490-template-workers-netplan.yaml
managed-ns_Machine_cz7700-managed-cluster-control-noefi-.yaml
managed-ns_Machine_cz7741-managed-cluster-control-noefi-.yaml
managed-ns_Machine_cz7743-managed-cluster-control-noefi-.yaml
managed-ns_Machine_cz812-managed-cluster-storage-worker-noefi-.yaml
managed-ns_Machine_cz813-managed-cluster-storage-worker-noefi-.yaml
managed-ns_Machine_cz814-managed-cluster-storage-worker-noefi-.yaml
managed-ns_Machine_cz815-managed-cluster-worker-noefi-.yaml
managed-ns_PublicKey_managed-cluster-key.yaml
managed-ns_cz7700-cred.yaml
managed-ns_cz7741-cred.yaml
managed-ns_cz7743-cred.yaml
managed-ns_cz812-cred.yaml
managed-ns_cz813-cred.yaml
managed-ns_cz814-cred.yaml
managed-ns_cz815-cred.yaml
managed-ns_Subnet_lcm-nw.yaml
managed-ns_Subnet_api-lb.yaml
managed-ns_Subnet_metallb-public-for-managed.yaml (obsolete)
managed-ns_Subnet_metallb-public-for-extiface.yaml
managed-ns_Subnet_storage-backend.yaml
managed-ns_Subnet_storage-frontend.yaml
managed-ns_MetalLBConfig-lb-managed.yaml
managed-ns_MetalLBConfigTemplate-lb-managed-template.yaml (obsolete)
default_Namespace_managed-ns.yaml
Caution
The procedure below presumes that you apply each new .yaml
file using kubectl create -f <file_name.yaml>.
To create an example configuration for a managed cluster creation:
Verify that you have configured the following items:
All
bmhnodes for PXE boot as described in Add a bare metal host using CLIAll physical NICs of the
bmhnodesAll required physical subnets and routing
Create an empty
.yamlfile with thenamespaceobject:apiVersion: v1
Select from the following options:
Create the required number of
.yamlfiles with theBareMetalHostCredentialobjects for eachbmhnode with the uniquenameand authenticationdata. The following example contains oneBareMetalHostCredentialobject:Note
The
kaas.mirantis.com/regionlabel is removed from all MOSK objects in 24.1. Therefore, do not add the label starting with this release. On existing clusters updated to this release, or if added manually, MOSK ignores this label.managed-ns_cz815-cred.yamlapiVersion: kaas.mirantis.com/v1alpha1 kind: BareMetalHostCredential metadata: name: cz815-cred namespace: managed-ns labels: kaas.mirantis.com/region: region-one spec: username: admin password: value: supersecret
Create the required number of
.yamlfiles with theSecretobjects for eachbmhnode with the uniquenameand authenticationdata. The following example contains oneSecretobject:managed-ns_cz815-cred.yamlapiVersion: v1 data: password: YWRtaW4= username: ZW5naW5lZXI= kind: Secret metadata: labels: kaas.mirantis.com/credentials: 'true' kaas.mirantis.com/provider: baremetal kaas.mirantis.com/region: region-one name: cz815-cred namespace: managed-ns
Create a set of files with the
bmhnodes configuration:managed-ns_BareMetalHostInventory_cz7700-managed-cluster-control-noefi.yamlapiVersion: kaas.mirantis.com/v1alpha1 kind: BareMetalHostInventory metadata: annotations: inspect.metal3.io/hardwaredetails-storage-sort-term: hctl ASC, wwn ASC, by_id ASC, name ASC labels: cluster.sigs.k8s.io/cluster-name: managed-cluster # we will use those label, to link machine to exact bmh node kaas.mirantis.com/baremetalhost-id: cz7700 kaas.mirantis.com/provider: baremetal name: cz7700-managed-cluster-control-noefi namespace: managed-ns spec: bmc: address: 192.168.1.12 bmhCredentialsName: 'cz7740-cred' bootMACAddress: 0c:c4:7a:34:52:04 bootMode: legacy online: true
managed-ns_BareMetalHostInventory_cz7741-managed-cluster-control-noefi.yamlapiVersion: kaas.mirantis.com/v1alpha1 kind: BareMetalHostInventory metadata: annotations: inspect.metal3.io/hardwaredetails-storage-sort-term: hctl ASC, wwn ASC, by_id ASC, name ASC labels: cluster.sigs.k8s.io/cluster-name: managed-cluster kaas.mirantis.com/baremetalhost-id: cz7741 kaas.mirantis.com/provider: baremetal name: cz7741-managed-cluster-control-noefi namespace: managed-ns spec: bmc: address: 192.168.1.76 bmhCredentialsName: 'cz7741-cred' bootMACAddress: 0c:c4:7a:34:92:f4 bootMode: legacy online: true
managed-ns_BareMetalHostInventory_cz7743-managed-cluster-control-noefi.yamlapiVersion: kaas.mirantis.com/v1alpha1 kind: BareMetalHostInventory metadata: annotations: inspect.metal3.io/hardwaredetails-storage-sort-term: hctl ASC, wwn ASC, by_id ASC, name ASC labels: cluster.sigs.k8s.io/cluster-name: managed-cluster kaas.mirantis.com/baremetalhost-id: cz7743 kaas.mirantis.com/provider: baremetal name: cz7743-managed-cluster-control-noefi namespace: managed-ns spec: bmc: address: 192.168.1.78 bmhCredentialsName: 'cz7743-cred' bootMACAddress: 0c:c4:7a:34:66:fc bootMode: legacy online: true
managed-ns_BareMetalHostInventory_cz812-managed-cluster-storage-worker-noefi.yamlapiVersion: kaas.mirantis.com/v1alpha1 kind: BareMetalHostInventory metadata: annotations: inspect.metal3.io/hardwaredetails-storage-sort-term: hctl ASC, wwn ASC, by_id ASC, name ASC labels: cluster.sigs.k8s.io/cluster-name: managed-cluster kaas.mirantis.com/baremetalhost-id: cz812 kaas.mirantis.com/provider: baremetal name: cz812-managed-cluster-storage-worker-noefi namespace: managed-ns spec: bmc: address: 192.168.1.182 bmhCredentialsName: 'cz812-cred' bootMACAddress: 0c:c4:7a:bc:ff:2e bootMode: legacy online: true
managed-ns_BareMetalHostInventory_cz813-managed-cluster-storage-worker-noefi.yamlapiVersion: kaas.mirantis.com/v1alpha1 kind: BareMetalHostInventory metadata: annotations: inspect.metal3.io/hardwaredetails-storage-sort-term: hctl ASC, wwn ASC, by_id ASC, name ASC labels: cluster.sigs.k8s.io/cluster-name: managed-cluster kaas.mirantis.com/baremetalhost-id: cz813 kaas.mirantis.com/provider: baremetal name: cz813-managed-cluster-storage-worker-noefi namespace: managed-ns spec: bmc: address: 192.168.1.183 bmhCredentialsName: 'cz813-cred' bootMACAddress: 0c:c4:7a:bc:fe:36 bootMode: legacy online: true
managed-ns_BareMetalHostInventory_cz814-managed-cluster-storage-worker-noefi.yamlapiVersion: kaas.mirantis.com/v1alpha1 kind: BareMetalHostInventory metadata: annotations: inspect.metal3.io/hardwaredetails-storage-sort-term: hctl ASC, wwn ASC, by_id ASC, name ASC labels: cluster.sigs.k8s.io/cluster-name: managed-cluster kaas.mirantis.com/baremetalhost-id: cz814 kaas.mirantis.com/provider: baremetal name: cz814-managed-cluster-storage-worker-noefi namespace: managed-ns spec: bmc: address: 192.168.1.184 bmhCredentialsName: 'cz814-cred' bootMACAddress: 0c:c4:7a:bc:fb:20 bootMode: legacy online: true
managed-ns_BareMetalHostInventory_cz815-managed-cluster-worker-noefi.yamlapiVersion: kaas.mirantis.com/v1alpha1 kind: BareMetalHostInventory metadata: annotations: inspect.metal3.io/hardwaredetails-storage-sort-term: hctl ASC, wwn ASC, by_id ASC, name ASC labels: cluster.sigs.k8s.io/cluster-name: managed-cluster kaas.mirantis.com/baremetalhost-id: cz815 kaas.mirantis.com/provider: baremetal name: cz815-managed-cluster-worker-noefi namespace: managed-ns spec: bmc: address: 192.168.1.185 bmhCredentialsName: 'cz815-cred' bootMACAddress: 0c:c4:7a:bc:fc:3e bootMode: legacy online: true
managed-ns_BareMetalHost_cz7700-managed-cluster-control-noefi.yamlapiVersion: metal3.io/v1alpha1 kind: BareMetalHost metadata: labels: cluster.sigs.k8s.io/cluster-name: managed-cluster hostlabel.bm.kaas.mirantis.com/controlplane: controlplane # we will use those label, to link machine to exact bmh node kaas.mirantis.com/baremetalhost-id: cz7700 kaas.mirantis.com/provider: baremetal kaas.mirantis.com/region: region-one annotations: kaas.mirantis.com/baremetalhost-credentials-name: cz7700-cred name: cz7700-managed-cluster-control-noefi namespace: managed-ns spec: bmc: address: 192.168.1.12 # credentialsName is updated automatically during cluster deployment credentialsName: '' bootMACAddress: 0c:c4:7a:34:52:04 bootMode: legacy online: true
managed-ns_BareMetalHost_cz7741-managed-cluster-control-noefi.yamlapiVersion: metal3.io/v1alpha1 kind: BareMetalHost metadata: labels: cluster.sigs.k8s.io/cluster-name: managed-cluster hostlabel.bm.kaas.mirantis.com/controlplane: controlplane kaas.mirantis.com/baremetalhost-id: cz7741 kaas.mirantis.com/provider: baremetal kaas.mirantis.com/region: region-one annotations: kaas.mirantis.com/baremetalhost-credentials-name: cz7741-cred name: cz7741-managed-cluster-control-noefi namespace: managed-ns spec: bmc: address: 192.168.1.76 credentialsName: '' bootMACAddress: 0c:c4:7a:34:92:f4 bootMode: legacy online: true
managed-ns_BareMetalHost_cz7743-managed-cluster-control-noefi.yamlapiVersion: metal3.io/v1alpha1 kind: BareMetalHost metadata: labels: cluster.sigs.k8s.io/cluster-name: managed-cluster hostlabel.bm.kaas.mirantis.com/controlplane: controlplane kaas.mirantis.com/baremetalhost-id: cz7743 kaas.mirantis.com/provider: baremetal kaas.mirantis.com/region: region-one annotations: kaas.mirantis.com/baremetalhost-credentials-name: cz7743-cred name: cz7743-managed-cluster-control-noefi namespace: managed-ns spec: bmc: address: 192.168.1.78 credentialsName: '' bootMACAddress: 0c:c4:7a:34:66:fc bootMode: legacy online: true
managed-ns_BareMetalHost_cz812-managed-cluster-storage-worker-noefi.yamlapiVersion: metal3.io/v1alpha1 kind: BareMetalHost metadata: labels: cluster.sigs.k8s.io/cluster-name: managed-cluster hostlabel.bm.kaas.mirantis.com/worker: worker kaas.mirantis.com/baremetalhost-id: cz812 kaas.mirantis.com/provider: baremetal kaas.mirantis.com/region: region-one annotations: kaas.mirantis.com/baremetalhost-credentials-name: cz812-cred name: cz812-managed-cluster-storage-worker-noefi namespace: managed-ns spec: bmc: address: 192.168.1.182 credentialsName: '' bootMACAddress: 0c:c4:7a:bc:ff:2e bootMode: legacy online: true
managed-ns_BareMetalHost_cz813-managed-cluster-storage-worker-noefi.yamlapiVersion: metal3.io/v1alpha1 kind: BareMetalHost metadata: labels: cluster.sigs.k8s.io/cluster-name: managed-cluster hostlabel.bm.kaas.mirantis.com/worker: worker kaas.mirantis.com/baremetalhost-id: cz813 kaas.mirantis.com/provider: baremetal kaas.mirantis.com/region: region-one annotations: kaas.mirantis.com/baremetalhost-credentials-name: cz813-cred name: cz813-managed-cluster-storage-worker-noefi namespace: managed-ns spec: bmc: address: 192.168.1.183 credentialsName: '' bootMACAddress: 0c:c4:7a:bc:fe:36 bootMode: legacy online: true
managed-ns_BareMetalHost_cz814-managed-cluster-storage-worker-noefi.yamlapiVersion: metal3.io/v1alpha1 kind: BareMetalHost metadata: labels: cluster.sigs.k8s.io/cluster-name: managed-cluster hostlabel.bm.kaas.mirantis.com/worker: worker kaas.mirantis.com/baremetalhost-id: cz814 kaas.mirantis.com/provider: baremetal kaas.mirantis.com/region: region-one annotations: kaas.mirantis.com/baremetalhost-credentials-name: cz814-cred name: cz814-managed-cluster-storage-worker-noefi namespace: managed-ns spec: bmc: address: 192.168.1.184 credentialsName: '' bootMACAddress: 0c:c4:7a:bc:fb:20 bootMode: legacy online: true
managed-ns_BareMetalHost_cz815-managed-cluster-worker-noefi.yamlapiVersion: metal3.io/v1alpha1 kind: BareMetalHost metadata: labels: cluster.sigs.k8s.io/cluster-name: managed-cluster hostlabel.bm.kaas.mirantis.com/worker: worker kaas.mirantis.com/baremetalhost-id: cz815 kaas.mirantis.com/provider: baremetal kaas.mirantis.com/region: region-one annotations: kaas.mirantis.com/baremetalhost-credentials-name: cz815-cred name: cz815-managed-cluster-worker-noefi namespace: managed-ns spec: bmc: address: 192.168.1.185 credentialsName: '' bootMACAddress: 0c:c4:7a:bc:fc:3e bootMode: legacy online: true
managed-ns_BareMetalHost_cz7700-managed-cluster-control-noefi.yamlapiVersion: metal3.io/v1alpha1 kind: BareMetalHost metadata: labels: cluster.sigs.k8s.io/cluster-name: managed-cluster hostlabel.bm.kaas.mirantis.com/controlplane: controlplane # we will use those label, to link machine to exact bmh node kaas.mirantis.com/baremetalhost-id: cz7700 kaas.mirantis.com/provider: baremetal kaas.mirantis.com/region: region-one name: cz7700-managed-cluster-control-noefi namespace: managed-ns spec: bmc: address: 192.168.1.12 # The secret for credentials requires the username and password # keys in the Base64 encoding. credentialsName: cz7700-cred bootMACAddress: 0c:c4:7a:34:52:04 bootMode: legacy online: true
managed-ns_BareMetalHost_cz7741-managed-cluster-control-noefi.yamlapiVersion: metal3.io/v1alpha1 kind: BareMetalHost metadata: labels: cluster.sigs.k8s.io/cluster-name: managed-cluster hostlabel.bm.kaas.mirantis.com/controlplane: controlplane kaas.mirantis.com/baremetalhost-id: cz7741 kaas.mirantis.com/provider: baremetal kaas.mirantis.com/region: region-one name: cz7741-managed-cluster-control-noefi namespace: managed-ns spec: bmc: address: 192.168.1.76 credentialsName: cz7741-cred bootMACAddress: 0c:c4:7a:34:92:f4 bootMode: legacy online: true
managed-ns_BareMetalHost_cz7743-managed-cluster-control-noefi.yamlapiVersion: metal3.io/v1alpha1 kind: BareMetalHost metadata: labels: cluster.sigs.k8s.io/cluster-name: managed-cluster hostlabel.bm.kaas.mirantis.com/controlplane: controlplane kaas.mirantis.com/baremetalhost-id: cz7743 kaas.mirantis.com/provider: baremetal kaas.mirantis.com/region: region-one name: cz7743-managed-cluster-control-noefi namespace: managed-ns spec: bmc: address: 192.168.1.78 credentialsName: cz7743-cred bootMACAddress: 0c:c4:7a:34:66:fc bootMode: legacy online: true
managed-ns_BareMetalHost_cz812-managed-cluster-storage-worker-noefi.yamlapiVersion: metal3.io/v1alpha1 kind: BareMetalHost metadata: labels: cluster.sigs.k8s.io/cluster-name: managed-cluster hostlabel.bm.kaas.mirantis.com/worker: worker kaas.mirantis.com/baremetalhost-id: cz812 kaas.mirantis.com/provider: baremetal kaas.mirantis.com/region: region-one name: cz812-managed-cluster-storage-worker-noefi namespace: managed-ns spec: bmc: address: 192.168.1.182 credentialsName: cz812-cred bootMACAddress: 0c:c4:7a:bc:ff:2e bootMode: legacy online: true
managed-ns_BareMetalHost_cz813-managed-cluster-storage-worker-noefi.yamlapiVersion: metal3.io/v1alpha1 kind: BareMetalHost metadata: labels: cluster.sigs.k8s.io/cluster-name: managed-cluster hostlabel.bm.kaas.mirantis.com/worker: worker kaas.mirantis.com/baremetalhost-id: cz813 kaas.mirantis.com/provider: baremetal kaas.mirantis.com/region: region-one name: cz813-managed-cluster-storage-worker-noefi namespace: managed-ns spec: bmc: address: 192.168.1.183 credentialsName: cz813-cred bootMACAddress: 0c:c4:7a:bc:fe:36 bootMode: legacy online: true
managed-ns_BareMetalHost_cz814-managed-cluster-storage-worker-noefi.yamlapiVersion: metal3.io/v1alpha1 kind: BareMetalHost metadata: labels: cluster.sigs.k8s.io/cluster-name: managed-cluster hostlabel.bm.kaas.mirantis.com/worker: worker kaas.mirantis.com/baremetalhost-id: cz814 kaas.mirantis.com/provider: baremetal kaas.mirantis.com/region: region-one name: cz814-managed-cluster-storage-worker-noefi namespace: managed-ns spec: bmc: address: 192.168.1.184 credentialsName: cz814-cre bootMACAddress: 0c:c4:7a:bc:fb:20 bootMode: legacy online: true
managed-ns_BareMetalHost_cz815-managed-cluster-worker-noefi.yamlapiVersion: metal3.io/v1alpha1 kind: BareMetalHost metadata: labels: cluster.sigs.k8s.io/cluster-name: managed-cluster hostlabel.bm.kaas.mirantis.com/worker: worker kaas.mirantis.com/baremetalhost-id: cz815 kaas.mirantis.com/provider: baremetal kaas.mirantis.com/region: region-one name: cz815-managed-cluster-worker-noefi namespace: managed-ns spec: bmc: address: 192.168.1.185 credentialsName: cz815-cred bootMACAddress: 0c:c4:7a:bc:fc:3e bootMode: legacy online: true
Verify that the
inspectingphase has started:KUBECONFIG=kubeconfig kubectl -n managed-ns get bmh -o wide
Example of system response:
NAME STATUS STATE CONSUMER BMC BOOTMODE ONLINE ERROR REGION cz7700-managed-cluster-control-noefi OK inspecting 192.168.1.12 legacy true region-one cz7741-managed-cluster-control-noefi OK inspecting 192.168.1.76 legacy true region-one cz7743-managed-cluster-control-noefi OK inspecting 192.168.1.78 legacy true region-one cz812-managed-cluster-storage-worker-noefi OK inspecting 192.168.1.182 legacy true region-one
Wait for inspection to complete. Usually, it takes up to 15 minutes.
Collect the
bmhhardware information to create thel2templateandbmhobjects:KUBECONFIG=kubeconfig kubectl -n managed-ns get bmh -o wide
Example of system response:
NAME STATUS STATE CONSUMER BMC BOOTMODE ONLINE ERROR REGION cz7700-managed-cluster-control-noefi OK available 192.168.1.12 legacy true region-one cz7741-managed-cluster-control-noefi OK available 192.168.1.76 legacy true region-one cz7743-managed-cluster-control-noefi OK available 192.168.1.78 legacy true region-one cz812-managed-cluster-storage-worker-noefi OK available 192.168.1.182 legacy true region-one
KUBECONFIG=kubeconfig kubectl -n managed-ns get bmh cz7700-managed-cluster-control-noefi -o yaml | less
Example of system response:
.. nics: - ip: "" mac: 0c:c4:7a:1d:f4:a6 model: 0x8086 0x10fb # discovered interfaces name: ens4f0 pxe: false # temporary PXE address discovered from baremetal-mgmt - ip: 172.16.170.30 mac: 0c:c4:7a:34:52:04 model: 0x8086 0x1521 name: enp9s0f0 pxe: true # duplicates temporary PXE address discovered from baremetal-mgmt # since we have fallback-bond configured on host - ip: 172.16.170.33 mac: 0c:c4:7a:34:52:05 model: 0x8086 0x1521 # discovered interfaces name: enp9s0f1 pxe: false ... storage: - by_path: /dev/disk/by-path/pci-0000:00:1f.2-ata-1 model: Samsung SSD 850 name: /dev/sda rotational: false sizeBytes: 500107862016 - by_path: /dev/disk/by-path/pci-0000:00:1f.2-ata-2 model: Samsung SSD 850 name: /dev/sdb rotational: false sizeBytes: 500107862016 ....
Create bare metal host profiles:
managed-ns_BareMetalHostProfile_bmhp-cluster-default.yamlapiVersion: metal3.io/v1alpha1 kind: BareMetalHostProfile metadata: labels: cluster.sigs.k8s.io/cluster-name: managed-cluster # This label indicates that this profile will be default in # namespaces, so machines w\o exact profile selecting will use # this template kaas.mirantis.com/defaultBMHProfile: 'true' kaas.mirantis.com/provider: baremetal kaas.mirantis.com/region: region-one name: bmhp-cluster-default namespace: managed-ns spec: devices: - device: byPath: /dev/disk/by-path/pci-0000:00:1f.2-ata-1 minSize: 120Gi wipe: true partitions: - name: bios_grub partflags: - bios_grub size: 4Mi wipe: true - name: uefi partflags: - esp size: 200Mi wipe: true - name: config-2 size: 64Mi wipe: true - name: lvm_dummy_part size: 1Gi wipe: true - name: lvm_root_part size: 0 wipe: true - device: byPath: /dev/disk/by-path/pci-0000:00:1f.2-ata-2 minSize: 30Gi wipe: true - device: byPath: /dev/disk/by-path/pci-0000:00:1f.2-ata-3 minSize: 30Gi wipe: true partitions: - name: lvm_lvp_part size: 0 wipe: true - device: byPath: /dev/disk/by-path/pci-0000:00:1f.2-ata-4 wipe: true fileSystems: - fileSystem: vfat partition: config-2 - fileSystem: vfat mountPoint: /boot/efi partition: uefi - fileSystem: ext4 logicalVolume: root mountPoint: / - fileSystem: ext4 logicalVolume: lvp mountPoint: /mnt/local-volumes/ grubConfig: defaultGrubOptions: - GRUB_DISABLE_RECOVERY="true" - GRUB_PRELOAD_MODULES=lvm - GRUB_TIMEOUT=30 kernelParameters: modules: - content: 'options kvm_intel nested=1' filename: kvm_intel.conf sysctl: # For the list of options prohibited to change, refer to # https://docs.mirantis.com/mke/3.7/install/predeployment/set-up-kernel-default-protections.html fs.aio-max-nr: '1048576' fs.file-max: '9223372036854775807' fs.inotify.max_user_instances: '4096' kernel.core_uses_pid: '1' kernel.dmesg_restrict: '1' net.ipv4.conf.all.rp_filter: '0' net.ipv4.conf.default.rp_filter: '0' net.ipv4.conf.k8s-ext.rp_filter: '0' net.ipv4.conf.k8s-ext.rp_filter: '0' net.ipv4.conf.m-pub.rp_filter: '0' vm.max_map_count: '262144' logicalVolumes: - name: root size: 0 vg: lvm_root - name: lvp size: 0 vg: lvm_lvp postDeployScript: | #!/bin/bash -ex # used for test-debug only! echo "root:r00tme" | sudo chpasswd echo 'ACTION=="add|change", KERNEL=="sd[a-z]", ATTR{queue/rotational}=="0", ATTR{queue/scheduler}="deadline"' > /etc/udev/rules.d/60-ssd-scheduler.rules echo $(date) 'post_deploy_script done' >> /root/post_deploy_done preDeployScript: | #!/bin/bash -ex echo "$(date) pre_deploy_script done" >> /root/pre_deploy_done volumeGroups: - devices: - partition: lvm_root_part name: lvm_root - devices: - partition: lvm_lvp_part name: lvm_lvp - devices: - partition: lvm_dummy_part # here we can create lvm, but do not mount or format it somewhere name: lvm_forawesomeapp
managed-ns_BareMetalHostProfile_worker-storage1.yamlapiVersion: metal3.io/v1alpha1 kind: BareMetalHostProfile metadata: labels: cluster.sigs.k8s.io/cluster-name: managed-cluster kaas.mirantis.com/provider: baremetal kaas.mirantis.com/region: region-one name: worker-storage1 namespace: managed-ns spec: devices: - device: minSize: 120Gi wipe: true partitions: - name: bios_grub partflags: - bios_grub size: 4Mi wipe: true - name: uefi partflags: - esp size: 200Mi wipe: true - name: config-2 size: 64Mi wipe: true # Create dummy partition w\o mounting - name: lvm_dummy_part size: 1Gi wipe: true - name: lvm_root_part size: 0 wipe: true - device: # Will be used for Ceph, so required to be wiped byPath: /dev/disk/by-path/pci-0000:00:1f.2-ata-1 minSize: 30Gi wipe: true - device: byPath: /dev/disk/by-path/pci-0000:00:1f.2-ata-2 minSize: 30Gi wipe: true partitions: - name: lvm_lvp_part size: 0 wipe: true - device: byPath: /dev/disk/by-path/pci-0000:00:1f.2-ata-3 wipe: true - device: byPath: /dev/disk/by-path/pci-0000:00:1f.2-ata-4 minSize: 30Gi wipe: true partitions: - name: lvm_lvp_part_sdf wipe: true size: 0 fileSystems: - fileSystem: vfat partition: config-2 - fileSystem: vfat mountPoint: /boot/efi partition: uefi - fileSystem: ext4 logicalVolume: root mountPoint: / - fileSystem: ext4 logicalVolume: lvp mountPoint: /mnt/local-volumes/ grubConfig: defaultGrubOptions: - GRUB_DISABLE_RECOVERY="true" - GRUB_PRELOAD_MODULES=lvm - GRUB_TIMEOUT=30 kernelParameters: modules: - content: 'options kvm_intel nested=1' filename: kvm_intel.conf sysctl: # For the list of options prohibited to change, refer to # https://docs.mirantis.com/mke/3.6/install/predeployment/set-up-kernel-default-protections.html fs.aio-max-nr: '1048576' fs.file-max: '9223372036854775807' fs.inotify.max_user_instances: '4096' kernel.core_uses_pid: '1' kernel.dmesg_restrict: '1' net.ipv4.conf.all.rp_filter: '0' net.ipv4.conf.default.rp_filter: '0' net.ipv4.conf.k8s-ext.rp_filter: '0' net.ipv4.conf.k8s-ext.rp_filter: '0' net.ipv4.conf.m-pub.rp_filter: '0' vm.max_map_count: '262144' logicalVolumes: - name: root size: 0 vg: lvm_root - name: lvp size: 0 vg: lvm_lvp postDeployScript: | #!/bin/bash -ex # used for test-debug only! That would allow operator to logic via TTY. echo "root:r00tme" | sudo chpasswd # Just an example for enforcing "ssd" disks to be switched to use "deadline" i\o scheduler. echo 'ACTION=="add|change", KERNEL=="sd[a-z]", ATTR{queue/rotational}=="0", ATTR{queue/scheduler}="deadline"' > /etc/udev/ rules.d/60-ssd-scheduler.rules echo $(date) 'post_deploy_script done' >> /root/post_deploy_done preDeployScript: | #!/bin/bash -ex echo "$(date) pre_deploy_script done" >> /root/pre_deploy_done volumeGroups: - devices: - partition: lvm_root_part name: lvm_root - devices: - partition: lvm_lvp_part - partition: lvm_lvp_part_sdf name: lvm_lvp - devices: - partition: lvm_dummy_part name: lvm_forawesomeapp
Note
If you mount the
/vardirectory, before configuringBareMetalHostProfile, review Mounting recommendations for the /var directory.Create the
L2Templateobjects:managed-ns_L2Template_bm-1490-template-controls-netplan.yamlapiVersion: ipam.mirantis.com/v1alpha1 kind: L2Template metadata: labels: bm-1490-template-controls-netplan: anymagicstring cluster.sigs.k8s.io/cluster-name: managed-cluster kaas.mirantis.com/provider: baremetal kaas.mirantis.com/region: region-one name: bm-1490-template-controls-netplan namespace: managed-ns spec: ifMapping: - enp9s0f0 - enp9s0f1 - eno1 - ens3f1 l3Layout: - scope: namespace subnetName: lcm-nw - scope: namespace subnetName: storage-frontend - scope: namespace subnetName: storage-backend - scope: namespace subnetName: metallb-public-for-extiface npTemplate: |- version: 2 ethernets: {{nic 0}}: dhcp4: false dhcp6: false match: macaddress: {{mac 0}} set-name: {{nic 0}} mtu: 1500 {{nic 1}}: dhcp4: false dhcp6: false match: macaddress: {{mac 1}} set-name: {{nic 1}} mtu: 1500 {{nic 2}}: dhcp4: false dhcp6: false match: macaddress: {{mac 2}} set-name: {{nic 2}} mtu: 1500 {{nic 3}}: dhcp4: false dhcp6: false match: macaddress: {{mac 3}} set-name: {{nic 3}} mtu: 1500 bonds: bond0: parameters: mode: 802.3ad #transmit-hash-policy: layer3+4 #mii-monitor-interval: 100 interfaces: - {{ nic 0 }} - {{ nic 1 }} bond1: parameters: mode: 802.3ad #transmit-hash-policy: layer3+4 #mii-monitor-interval: 100 interfaces: - {{ nic 2 }} - {{ nic 3 }} vlans: stor-f: id: 1494 link: bond1 addresses: - {{ip "stor-f:storage-frontend"}} stor-b: id: 1489 link: bond1 addresses: - {{ip "stor-b:storage-backend"}} m-pub: id: 1491 link: bond0 bridges: k8s-ext: interfaces: [m-pub] addresses: - {{ ip "k8s-ext:metallb-public-for-extiface" }} k8s-lcm: dhcp4: false dhcp6: false gateway4: {{ gateway_from_subnet "lcm-nw" }} addresses: - {{ ip "k8s-lcm:lcm-nw" }} nameservers: addresses: [ 172.18.176.6 ] interfaces: - bond0
managed-ns_L2Template_bm-1490-template-workers-netplan.yamlapiVersion: ipam.mirantis.com/v1alpha1 kind: L2Template metadata: labels: bm-1490-template-workers-netplan: anymagicstring cluster.sigs.k8s.io/cluster-name: managed-cluster kaas.mirantis.com/provider: baremetal kaas.mirantis.com/region: region-one name: bm-1490-template-workers-netplan namespace: managed-ns spec: ifMapping: - eno1 - eno2 - ens7f0 - ens7f1 l3Layout: - scope: namespace subnetName: lcm-nw - scope: namespace subnetName: storage-frontend - scope: namespace subnetName: storage-backend - scope: namespace subnetName: metallb-public-for-extiface npTemplate: |- version: 2 ethernets: {{nic 0}}: match: macaddress: {{mac 0}} set-name: {{nic 0}} mtu: 1500 {{nic 1}}: dhcp4: false dhcp6: false match: macaddress: {{mac 1}} set-name: {{nic 1}} mtu: 1500 {{nic 2}}: dhcp4: false dhcp6: false match: macaddress: {{mac 2}} set-name: {{nic 2}} mtu: 1500 {{nic 3}}: dhcp4: false dhcp6: false match: macaddress: {{mac 3}} set-name: {{nic 3}} mtu: 1500 bonds: bond0: interfaces: - {{ nic 1 }} bond1: parameters: mode: 802.3ad #transmit-hash-policy: layer3+4 #mii-monitor-interval: 100 interfaces: - {{ nic 2 }} - {{ nic 3 }} vlans: stor-f: id: 1494 link: bond1 addresses: - {{ip "stor-f:storage-frontend"}} stor-b: id: 1489 link: bond1 addresses: - {{ip "stor-b:storage-backend"}} m-pub: id: 1491 link: {{ nic 1 }} bridges: k8s-lcm: interfaces: - {{ nic 0 }} gateway4: {{ gateway_from_subnet "lcm-nw" }} addresses: - {{ ip "k8s-lcm:lcm-nw" }} nameservers: addresses: [ 172.18.176.6 ] k8s-ext: interfaces: [m-pub]
managed-ns_L2Template_bm-1490-template-controls-netplan-cz7700-pxebond.yamlapiVersion: ipam.mirantis.com/v1alpha1 kind: L2Template metadata: labels: bm-1490-template-controls-netplan-cz7700-pxebond: anymagicstring cluster.sigs.k8s.io/cluster-name: managed-cluster kaas.mirantis.com/provider: baremetal kaas.mirantis.com/region: region-one name: bm-1490-template-controls-netplan-cz7700-pxebond namespace: managed-ns spec: ifMapping: - enp9s0f0 - enp9s0f1 - eno1 - ens3f1 l3Layout: - scope: namespace subnetName: lcm-nw - scope: namespace subnetName: storage-frontend - scope: namespace subnetName: storage-backend - scope: namespace subnetName: metallb-public-for-extiface npTemplate: |- version: 2 ethernets: {{nic 0}}: dhcp4: false dhcp6: false match: macaddress: {{mac 0}} set-name: {{nic 0}} mtu: 1500 {{nic 1}}: dhcp4: false dhcp6: false match: macaddress: {{mac 1}} set-name: {{nic 1}} mtu: 1500 {{nic 2}}: dhcp4: false dhcp6: false match: macaddress: {{mac 2}} set-name: {{nic 2}} mtu: 1500 {{nic 3}}: dhcp4: false dhcp6: false match: macaddress: {{mac 3}} set-name: {{nic 3}} mtu: 1500 bonds: bond0: parameters: mode: 802.3ad #transmit-hash-policy: layer3+4 #mii-monitor-interval: 100 interfaces: - {{ nic 0 }} - {{ nic 1 }} bond1: parameters: mode: 802.3ad #transmit-hash-policy: layer3+4 #mii-monitor-interval: 100 interfaces: - {{ nic 2 }} - {{ nic 3 }} vlans: stor-f: id: 1494 link: bond1 addresses: - {{ip "stor-f:storage-frontend"}} stor-b: id: 1489 link: bond1 addresses: - {{ip "stor-b:storage-backend"}} m-pub: id: 1491 link: bond0 bridges: k8s-ext: interfaces: [m-pub] addresses: - {{ ip "k8s-ext:metallb-public-for-extiface" }} k8s-lcm: dhcp4: false dhcp6: false gateway4: {{ gateway_from_subnet "lcm-nw" }} addresses: - {{ ip "k8s-lcm:lcm-nw" }} nameservers: addresses: [ 172.18.176.6 ] interfaces: - bond0
Create the
Subnetobjects:managed-ns_Subnet_lcm-nw.yamlapiVersion: ipam.mirantis.com/v1alpha1 kind: Subnet metadata: labels: cluster.sigs.k8s.io/cluster-name: managed-cluster ipam/SVC-k8s-lcm: '1' kaas.mirantis.com/provider: baremetal kaas.mirantis.com/region: region-one name: lcm-nw namespace: managed-ns spec: cidr: 172.16.170.0/24 excludeRanges: - 172.16.170.150 gateway: 172.16.170.1 includeRanges: - 172.16.170.150-172.16.170.250
managed-ns_Subnet_api-lb.yamlMandatory since Container Cloud 2.30.0 (Cluster releases 21.0.0 and 20.0.0). Before 2.30.0, mutually exclusive with the
cluster:spec:loadBalancerHostparameter that is deprecated in 2.30. For details, seemanaged-ns_Cluster_managed-cluster.yamlin one of the following steps.apiVersion: ipam.mirantis.com/v1alpha1 kind: Subnet metadata: labels: cluster.sigs.k8s.io/cluster-name: managed-cluster kaas.mirantis.com/provider: baremetal kaas.mirantis.com/region: region-one ipam/SVC-LBhost: "1" name: api-lb namespace: managed-ns spec: cidr: 172.16.168.0/24 includeRanges: - 172.16.168.3
managed-ns_Subnet_metallb-public-for-extiface.yamlapiVersion: ipam.mirantis.com/v1alpha1 kind: Subnet metadata: labels: cluster.sigs.k8s.io/cluster-name: managed-cluster kaas.mirantis.com/provider: baremetal kaas.mirantis.com/region: region-one name: metallb-public-for-extiface namespace: managed-ns spec: cidr: 172.16.168.0/24 gateway: 172.16.168.1 includeRanges: - 172.16.168.10-172.16.168.30
managed-ns_Subnet_storage-backend.yamlapiVersion: ipam.mirantis.com/v1alpha1 kind: Subnet metadata: labels: cluster.sigs.k8s.io/cluster-name: managed-cluster ipam/SVC-ceph-cluster: '1' kaas.mirantis.com/provider: baremetal kaas.mirantis.com/region: region-one name: storage-backend namespace: managed-ns spec: cidr: 10.12.0.0/24
managed-ns_Subnet_storage-frontend.yamlapiVersion: ipam.mirantis.com/v1alpha1 kind: Subnet metadata: labels: cluster.sigs.k8s.io/cluster-name: managed-cluster ipam/SVC-ceph-public: '1' kaas.mirantis.com/provider: baremetal kaas.mirantis.com/region: region-one name: storage-frontend namespace: managed-ns spec: cidr: 10.12.1.0/24
Create MetalLB configuration objects:
managed-ns_MetalLBConfig-lb-managed.yamlapiVersion: kaas.mirantis.com/v1alpha1 kind: MetalLBConfig metadata: labels: cluster.sigs.k8s.io/cluster-name: managed-cluster kaas.mirantis.com/provider: baremetal kaas.mirantis.com/region: region-one name: lb-managed namespace: managed-ns spec: ipAddressPools: - name: services spec: addresses: - 172.16.168.31-172.16.168.50 autoAssign: true avoidBuggyIPs: false l2Advertisements: - name: services spec: interfaces: - k8s-ext ipAddressPools: - services
managed-ns_Subnet_metallb-public-for-managed.yamlapiVersion: ipam.mirantis.com/v1alpha1 kind: Subnet metadata: labels: cluster.sigs.k8s.io/cluster-name: managed-cluster ipam/SVC-MetalLB: '1' kaas.mirantis.com/provider: baremetal kaas.mirantis.com/region: region-one name: metallb-public-for-managed namespace: managed-ns spec: cidr: 172.16.168.0/24 includeRanges: - 172.16.168.31-172.16.168.50
managed-ns_MetalLBConfig-lb-managed.yamlNote
Applies since Container Cloud 2.21.0 and 2.21.1 for MOSK as TechPreview and since 2.24.0 as GA for management clusters. For managed clusters, is generally available since Container Cloud 2.25.0.
apiVersion: kaas.mirantis.com/v1alpha1 kind: MetalLBConfig metadata: labels: cluster.sigs.k8s.io/cluster-name: managed-cluster kaas.mirantis.com/provider: baremetal kaas.mirantis.com/region: region-one name: lb-managed namespace: managed-ns spec: templateName: lb-managed-template
managed-ns_MetalLBConfigTemplate-lb-managed-template.yamlNote
The
MetalLBConfigTemplateobject is available as Technology Preview since Container Cloud 2.24.0 (Cluster release 14.0.0) and is generally available since Container Cloud 2.25.0 (Cluster releases 17.0.0 and 16.0.0).apiVersion: ipam.mirantis.com/v1alpha1 kind: MetalLBConfigTemplate metadata: labels: cluster.sigs.k8s.io/cluster-name: managed-cluster kaas.mirantis.com/provider: baremetal kaas.mirantis.com/region: region-one name: lb-managed-template namespace: managed-ns spec: templates: l2Advertisements: | - name: services spec: ipAddressPools: - services
managed-ns_Subnet_metallb-public-for-managed.yamlapiVersion: ipam.mirantis.com/v1alpha1 kind: Subnet metadata: labels: cluster.sigs.k8s.io/cluster-name: managed-cluster ipam/SVC-MetalLB: '1' kaas.mirantis.com/provider: baremetal kaas.mirantis.com/region: region-one name: metallb-public-for-managed namespace: managed-ns spec: cidr: 172.16.168.0/24 includeRanges: - 172.16.168.31-172.16.168.50
Create the
PublicKeyobject for a managed cluster connection. For details, see PublicKey resource.managed-ns_PublicKey_managed-cluster-key.yamlapiVersion: kaas.mirantis.com/v1alpha1 kind: PublicKey metadata: name: managed-cluster-key namespace: managed-ns spec: publicKey: ssh-rsa AAEXAMPLEXXX
Create the
Clusterobject. For details, see Cluster resource.managed-ns_Cluster_managed-cluster.yamlapiVersion: cluster.k8s.io/v1alpha1 kind: Cluster metadata: annotations: kaas.mirantis.com/lcm: 'true' labels: kaas.mirantis.com/provider: baremetal kaas.mirantis.com/region: region-one name: managed-cluster namespace: managed-ns spec: clusterNetwork: pods: cidrBlocks: - 192.169.0.0/16 serviceDomain: '' services: cidrBlocks: - 10.232.0.0/18 providerSpec: value: apiVersion: baremetal.k8s.io/v1alpha1 dedicatedControlPlane: false helmReleases: - name: ceph-controller - enabled: true name: stacklight values: alertmanagerSimpleConfig: email: enabled: false slack: enabled: false logging: persistentVolumeClaimSize: 30Gi highAvailabilityEnabled: false logging: enabled: false prometheusServer: customAlerts: [] persistentVolumeClaimSize: 16Gi retentionSize: 15GB retentionTime: 15d watchDogAlertEnabled: false - name: metallb values: {} kind: BaremetalClusterProviderSpec # loadBalancerHost: 172.16.168.3 # deprecated since MCC 2.30.0 (21.0.0 and 20.0.0), # configure managed-ns_Subnet_api-lb.yaml instead. publicKeys: - name: managed-cluster-key region: region-one release: mke-5-16-0-3-3-6
Create the
Machineobjects linked to eachbmhnode. For details, see Machine resource.managed-ns_Machine_cz7700-managed-cluster-control-noefi-.yamlapiVersion: cluster.k8s.io/v1alpha1 kind: Machine metadata: generateName: cz7700-managed-cluster-control-noefi- labels: cluster.sigs.k8s.io/cluster-name: managed-cluster cluster.sigs.k8s.io/control-plane: controlplane hostlabel.bm.kaas.mirantis.com/controlplane: controlplane kaas.mirantis.com/provider: baremetal kaas.mirantis.com/region: region-one namespace: managed-ns spec: providerSpec: value: apiVersion: baremetal.k8s.io/v1alpha1 hostSelector: matchLabels: kaas.mirantis.com/baremetalhost-id: cz7700 kind: BareMetalMachineProviderSpec l2TemplateSelector: label: bm-1490-template-controls-netplan-cz7700-pxebond publicKeys: - name: managed-cluster-key
managed-ns_Machine_cz7741-managed-cluster-control-noefi-.yamlapiVersion: cluster.k8s.io/v1alpha1 kind: Machine metadata: generateName: cz7741-managed-cluster-control-noefi- labels: cluster.sigs.k8s.io/cluster-name: managed-cluster cluster.sigs.k8s.io/control-plane: controlplane hostlabel.bm.kaas.mirantis.com/controlplane: controlplane kaas.mirantis.com/provider: baremetal kaas.mirantis.com/region: region-one namespace: managed-ns spec: providerSpec: value: apiVersion: baremetal.k8s.io/v1alpha1 bareMetalHostProfile: name: bmhp-cluster-default namespace: managed-ns hostSelector: matchLabels: kaas.mirantis.com/baremetalhost-id: cz7741 kind: BareMetalMachineProviderSpec l2TemplateSelector: label: bm-1490-template-controls-netplan publicKeys: - name: managed-cluster-key
managed-ns_Machine_cz7743-managed-cluster-control-noefi-.yamlapiVersion: cluster.k8s.io/v1alpha1 kind: Machine metadata: generateName: cz7743-managed-cluster-control-noefi- labels: cluster.sigs.k8s.io/cluster-name: managed-cluster cluster.sigs.k8s.io/control-plane: controlplane hostlabel.bm.kaas.mirantis.com/controlplane: controlplane kaas.mirantis.com/provider: baremetal kaas.mirantis.com/region: region-one namespace: managed-ns spec: providerSpec: value: apiVersion: baremetal.k8s.io/v1alpha1 bareMetalHostProfile: name: bmhp-cluster-default namespace: managed-ns hostSelector: matchLabels: kaas.mirantis.com/baremetalhost-id: cz7743 kind: BareMetalMachineProviderSpec l2TemplateSelector: label: bm-1490-template-controls-netplan publicKeys: - name: managed-cluster-key
managed-ns_Machine_cz812-managed-cluster-storage-worker-noefi-.yamlapiVersion: cluster.k8s.io/v1alpha1 kind: Machine metadata: generateName: cz812-managed-cluster-storage-worker-noefi- labels: cluster.sigs.k8s.io/cluster-name: managed-cluster hostlabel.bm.kaas.mirantis.com/storage: storage hostlabel.bm.kaas.mirantis.com/worker: worker kaas.mirantis.com/provider: baremetal kaas.mirantis.com/region: region-one namespace: managed-ns spec: providerSpec: value: apiVersion: baremetal.k8s.io/v1alpha1 bareMetalHostProfile: name: worker-storage1 namespace: managed-ns hostSelector: matchLabels: kaas.mirantis.com/baremetalhost-id: cz812 kind: BareMetalMachineProviderSpec l2TemplateSelector: label: bm-1490-template-workers-netplan publicKeys: - name: managed-cluster-key
managed-ns_Machine_cz813-managed-cluster-storage-worker-noefi-.yamlapiVersion: cluster.k8s.io/v1alpha1 kind: Machine metadata: generateName: cz813-managed-cluster-storage-worker-noefi- labels: cluster.sigs.k8s.io/cluster-name: managed-cluster hostlabel.bm.kaas.mirantis.com/storage: storage hostlabel.bm.kaas.mirantis.com/worker: worker kaas.mirantis.com/provider: baremetal kaas.mirantis.com/region: region-one namespace: managed-ns spec: providerSpec: value: apiVersion: baremetal.k8s.io/v1alpha1 bareMetalHostProfile: name: worker-storage1 namespace: managed-ns hostSelector: matchLabels: kaas.mirantis.com/baremetalhost-id: cz813 kind: BareMetalMachineProviderSpec l2TemplateSelector: label: bm-1490-template-workers-netplan publicKeys: - name: managed-cluster-key
managed-ns_Machine_cz814-managed-cluster-storage-worker-noefi-.yamlapiVersion: cluster.k8s.io/v1alpha1 kind: Machine metadata: generateName: cz814-managed-cluster-storage-worker-noefi- labels: cluster.sigs.k8s.io/cluster-name: managed-cluster hostlabel.bm.kaas.mirantis.com/storage: storage hostlabel.bm.kaas.mirantis.com/worker: worker kaas.mirantis.com/provider: baremetal kaas.mirantis.com/region: region-one namespace: managed-ns spec: providerSpec: value: apiVersion: baremetal.k8s.io/v1alpha1 bareMetalHostProfile: name: worker-storage1 namespace: managed-ns hostSelector: matchLabels: kaas.mirantis.com/baremetalhost-id: cz814 kind: BareMetalMachineProviderSpec l2TemplateSelector: label: bm-1490-template-workers-netplan publicKeys: - name: managed-cluster-key
managed-ns_Machine_cz815-managed-cluster-worker-noefi-.yamlapiVersion: cluster.k8s.io/v1alpha1 kind: Machine metadata: generateName: cz815-managed-cluster-worker-noefi- labels: cluster.sigs.k8s.io/cluster-name: managed-cluster hostlabel.bm.kaas.mirantis.com/worker: worker kaas.mirantis.com/provider: baremetal kaas.mirantis.com/region: region-one si-role/node-for-delete: 'true' namespace: managed-ns spec: providerSpec: value: apiVersion: baremetal.k8s.io/v1alpha1 bareMetalHostProfile: name: worker-storage1 namespace: managed-ns hostSelector: matchLabels: kaas.mirantis.com/baremetalhost-id: cz815 kind: BareMetalMachineProviderSpec l2TemplateSelector: label: bm-1490-template-workers-netplan publicKeys: - name: managed-cluster-key
Verify that the
bmhnodes are in theprovisioningstate:KUBECONFIG=kubectl kubectl -n managed-ns get bmh -o wide
Example of system response:
NAME STATUS STATE CONSUMER BMC BOOTMODE ONLINE ERROR REGION cz7700-managed-cluster-control-noefi OK provisioning cz7700-managed-cluster-control-noefi-8bkqw 192.168.1.12 legacy true region-one cz7741-managed-cluster-control-noefi OK provisioning cz7741-managed-cluster-control-noefi-42tp2 192.168.1.76 legacy true region-one cz7743-managed-cluster-control-noefi OK provisioning cz7743-managed-cluster-control-noefi-8cwpw 192.168.1.78 legacy true region-one ...
Wait until all
bmhnodes are in theprovisionedstate.Verify that the
lcmmachinephase has started:KUBECONFIG=kubeconfig kubectl -n managed-ns get lcmmachines -o wide
Example of system response:
NAME CLUSTERNAME TYPE STATE INTERNALIP HOSTNAME AGENTVERSION cz7700-managed-cluster-control-noefi-8bkqw managed-cluster control Deploy 172.16.170.153 kaas-node-803721b4-227c-4675-acc5-15ff9d3cfde2 v0.2.0-349-g4870b7f5 cz7741-managed-cluster-control-noefi-42tp2 managed-cluster control Prepare 172.16.170.152 kaas-node-6b8f0d51-4c5e-43c5-ac53-a95988b1a526 v0.2.0-349-g4870b7f5 cz7743-managed-cluster-control-noefi-8cwpw managed-cluster control Prepare 172.16.170.151 kaas-node-e9b7447d-5010-439b-8c95-3598518f8e0a v0.2.0-349-g4870b7f5 ...
Verify that the
lcmmachinephase is complete and the Kubernetes cluster is created:KUBECONFIG=kubeconfig kubectl -n managed-ns get lcmmachines -o wide
Example of system response:
NAME CLUSTERNAME TYPE STATE INTERNALIP HOSTNAME AGENTVERSION cz7700-managed-cluster-control-noefi-8bkqw managed-cluster control Ready 172.16.170.153 kaas-node-803721b4-227c-4675-acc5-15ff9d3cfde2 v0.2.0-349-g4870b7f5 cz7741-managed-cluster-control-noefi-42tp2 managed-cluster control Ready 172.16.170.152 kaas-node-6b8f0d51-4c5e-43c5-ac53-a95988b1a526 v0.2.0-349-g4870b7f5 cz7743-managed-cluster-control-noefi-8cwpw managed-cluster control Ready 172.16.170.151 kaas-node-e9b7447d-5010-439b-8c95-3598518f8e0a v0.2.0-349-g4870b7f5 ...
Create the
KaaSCephClusterobject:managed-ns_KaaSCephCluster_ceph-cluster-managed-cluster.yamlapiVersion: kaas.mirantis.com/v1alpha1 kind: KaaSCephCluster metadata: name: ceph-cluster-managed-cluster namespace: managed-ns spec: cephClusterSpec: nodes: # Add the exact ``nodes`` names. # Obtain the name from "get bmh -o wide" ``consumer`` field. cz812-managed-cluster-storage-worker-noefi-58spl: roles: - mgr - mon # All disk configuration must be reflected in ``baremetalhostprofile`` storageDevices: - config: deviceClass: ssd fullPath: /dev/disk/by-id/scsi-1ATA_WDC_WDS100T2B0A-00SM50_200231434939 cz813-managed-cluster-storage-worker-noefi-lr4k4: roles: - mgr - mon storageDevices: - config: deviceClass: ssd fullPath: /dev/disk/by-id/scsi-1ATA_WDC_WDS100T2B0A-00SM50_200231440912 cz814-managed-cluster-storage-worker-noefi-z2m67: roles: - mgr - mon storageDevices: - config: deviceClass: ssd fullPath: /dev/disk/by-id/scsi-1ATA_WDC_WDS100T2B0A-00SM50_200231443409 pools: - default: true deviceClass: ssd name: kubernetes replicated: size: 3 role: kubernetes k8sCluster: name: managed-cluster namespace: managed-ns
Note
The
storageDevices[].fullPathfield is available since Container Cloud 2.25.0 (Cluster releases 17.0.0 and 16.0.0). For the clusters running earlier product versions, define the/dev/disk/by-idsymlinks usingstorageDevices[].nameinstead.Obtain
kubeconfigof the newly created managed cluster:KUBECONFIG=kubeconfig kubectl -n managed-ns get secrets managed-cluster-kubeconfig -o jsonpath='{.data.admin\.conf}' | base64 -d | tee managed.kubeconfig
Verify the status of the Ceph cluster in your managed cluster:
KUBECONFIG=managed.kubeconfig kubectl -n rook-ceph exec -it $(KUBECONFIG=managed.kubeconfig kubectl -n rook-ceph get pod -l "app=rook-ceph-tools" -o jsonpath='{.items[0].metadata.name}') -- ceph -s
Example of system response:
cluster: id: e75c6abd-c5d5-4ae8-af17-4711354ff8ef health: HEALTH_OK services: mon: 3 daemons, quorum a,b,c (age 55m) mgr: a(active, since 55m) osd: 3 osds: 3 up (since 54m), 3 in (since 54m) data: pools: 1 pools, 32 pgs objects: 273 objects, 555 MiB usage: 4.0 GiB used, 1.6 TiB / 1.6 TiB avail pgs: 32 active+clean io: client: 51 KiB/s wr, 0 op/s rd, 4 op/s wr
Automate multiple subnet creation using SubnetPool
Unsupported since MCC 2.28.0 (17.3.0 and 16.3.0)
Warning
The SubnetPool object is unsupported since Container Cloud
2.28.0 (Cluster releases 17.3.0 and 16.3.0). For details, see
Deprecation Notes: SubnetPool resource management.
Operators of Mirantis Container Cloud for on-demand self-service Kubernetes deployments will want their users to create networks without extensive knowledge about network topology or IP addresses. For that purpose, the Operator can prepare L2 network templates in advance for users to assign these templates to machines in their clusters.
The Operator can ensure that the users’ clusters have separate
IP address spaces using the SubnetPool resource.
SubnetPool allows for automatic creation of Subnet objects
that will consume blocks from the parent SubnetPool CIDR IP address
range. The SubnetPool blockSize setting defines the IP address
block size to allocate to each child Subnet. SubnetPool has a global
scope, so any SubnetPool can be used to create the Subnet objects
for any namespace and for any cluster.
You can use the SubnetPool resource in the L2Template resources to
automatically allocate IP addresses from an appropriate IP range that
corresponds to a specific cluster, or create a Subnet resource
if it does not exist yet. This way, every cluster will use subnets
that do not overlap with other clusters.
To automate multiple subnet creation using SubnetPool:
Log in to a local machine where your management cluster
kubeconfigis located and wherekubectlis installed.Note
The management cluster
kubeconfigis created during the last stage of the management cluster bootstrap.Create the
subnetpool.yamlfile with a number of subnet pools:Note
You can define either or both subnets and subnet pools, depending on the use case. A single L2 template can use either or both subnets and subnet pools.
kubectl --kubeconfig <pathToManagementClusterKubeconfig> apply -f <SubnetFileName.yaml>
Note
In the command above and in the steps below, substitute the parameters enclosed in angle brackets with the corresponding values.
Example of a
subnetpool.yamlfile:apiVersion: ipam.mirantis.com/v1alpha1 kind: SubnetPool metadata: name: kaas-mgmt namespace: default labels: kaas.mirantis.com/provider: baremetal kaas.mirantis.com/region: region-one spec: cidr: 10.10.0.0/16 blockSize: /25 nameservers: - 172.18.176.6 gatewayPolicy: first
For the specification fields description of the
SubnetPoolobject, see SubnetPool spec.Note
The
kaas.mirantis.com/regionlabel is removed from all MOSK objects in 24.1. Therefore, do not add the label starting with this release. On existing clusters updated to this release, or if added manually, MOSK ignores this label.Verify that the subnet pool is successfully created:
kubectl get subnetpool kaas-mgmt -oyaml
In the system output, verify the
statusfields of thesubnetpool.yamlfile. For the status fields description of theSunbetPoolobject, see SubnetPool status.Proceed to creating an L2 template for one or multiple managed clusters as described in Create L2 templates. In this procedure, select the exemplary L2 template for multiple subnets.
Caution
Using the
l3Layoutsection, define all subnets that are used in thenpTemplatesection. Defining only part of subnets is not allowed.If
labelSelectoris used inl3Layout, use any custom label name that differs from system names. This allows for easier cluster scaling in case of adding new subnets as described in Expand IP addresses capacity in an existing cluster.Mirantis recommends using a unique label prefix such as
user-defined/.
Add a machine
This section describes how to add a machine to a managed MOSK cluster using CLI for advanced configuration.
Create a machine using CLI
This section describes adding machines to a new MOSK cluster using Mirantis Container Cloud CLI.
If you need to add more machines to an existing MOSK cluster, see Add a controller node and Add a compute node.
To add machine to the MOSK cluster:
Log in to the host where your management cluster
kubeconfigis located and where kubectl is installed.Create a new text file
mosk-cluster-machines.yamland create the YAML definitons of theMachineresources. Use this as an example, and see the descriptions of the fields below:apiVersion: cluster.k8s.io/v1alpha1 kind: Machine metadata: name: mosk-node-role-name namespace: mosk-project labels: kaas.mirantis.com/provider: baremetal kaas.mirantis.com/region: region-one cluster.sigs.k8s.io/cluster-name: mosk-cluster spec: providerSpec: value: apiVersion: baremetal.k8s.io/v1alpha1 kind: BareMetalMachineProviderSpec bareMetalHostProfile: name: mosk-k8s-mgr namespace: mosk-project l2TemplateSelector: name: mosk-k8s-mgr hostSelector: {} l2TemplateMappingOverride: []
Note
The
kaas.mirantis.com/regionlabel is removed from all MOSK objects in 24.1. Therefore, do not add the label starting with this release. On existing clusters updated to this release, or if added manually, MOSK ignores this label.Add the top level fields:
apiVersionAPI version of the object that is
cluster.k8s.io/v1alpha1.
kindObject type that is
Machine.
metadataThis section will contain the metadata of the object.
specThis section will contain the configuration of the object.
Add mandatory fields to the
metadatasection of theMachineobject definition.nameThe name of the
Machineobject.
namespaceThe name of the Project where the
Machinewill be created.
labelsThis section contains additional metadata of the machine. Set the following mandatory labels for the
Machineobject.kaas.mirantis.com/providerSet to
"baremetal".
kaas.mirantis.com/regionRegion name that matches the region name in the
Clusterobject.
cluster.sigs.k8s.io/cluster-nameThe name of the cluster to add the machine to.
Note
The
kaas.mirantis.com/regionlabel is removed from all MOSK objects in 24.1. Therefore, do not add the label starting with this release. On existing clusters updated to this release, or if added manually, MOSK ignores this label.
Configure the mandatory parameters of the
Machineobject inspecfield. AddproviderSpecfield that contains parameters for deployment on bare metal in a form of Kubernetes subresource.In the
providerSpecsection, add the following mandatory configuration parameters:apiVersionAPI version of the subresource that is
baremetal.k8s.io/v1alpha1.
kindObject type that is
BareMetalMachineProviderSpec.
bareMetalHostProfileReference to a configuration profile of a bare metal host. It helps to pick bare metal host with suitable configuration for the machine. This section includes two parameters:
nameName of a bare metal host profile
namespaceProject in which the bare metal host profile is created.
l2TemplateSelectorIf specified, contains the
name(first priority) orlabelof the L2 template that will be applied during a machine creation. Note that changing this field afterMachineobject is created will not affect the host network configuration of the machine.You should assign one of the templates you defined in Create L2 templates to the machine. If there is no suitable templates, you should create one per Create L2 templates.
hostSelectorThis parameter defines matching criteria for picking a bare metal host for the machine by label.
Any custom label that is assigned to one or more bare metal hosts using API can be used as a host selector. If the bare metal host objects with the specified label are missing, the
Machineobject will not be deployed until at least one bare metal host with the specified label is available.See Deploy a machine to a specific bare metal host for details.
l2TemplateIfMappingOverrideThis parameter contains a list of names of network interfaces of the host. It allows to override the default naming and ordering of network interfaces defined in L2 template referenced by the
l2TemplateSelector. This ordering informs the L2 templates how to generate the host network configuration.See Override network interfaces naming and order for details.
Depending on the role of the machine in the MOSK cluster, add labels to the
nodeLabelsfield.This field contains the list of node labels to be attached to a node for the user to run certain components on separate cluster nodes. The list of allowed node labels is located in the
Clusterobject statusproviderStatus.releaseRef.current.allowedNodeLabelsfield.If the
valuefield is not defined inallowedNodeLabels, a label can have any value. For example:allowedNodeLabels: - displayName: Stacklight key: stacklight
Before or after a machine deployment, add the required label from the allowed node labels list with the corresponding value to
spec.providerSpec.value.nodeLabelsinmachine.yaml. For example:nodeLabels: - key: stacklight value: enabled
Adding of a node label that is not available in the list of allowed node labels is restricted.
If you are NOT deploying MOSK with the compact control plane, add 3 dedicated Kubernetes manager nodes.
Add 3
Machineobjects for Kubernetes manager nodes using the following label:metadata: labels: cluster.sigs.k8s.io/control-plane: "true"
Note
The value of the label might be any non-empty string. On a worker node, this label must be omitted entirely.
Add 3
Machineobjects for MOSK controller nodes using the following labels:spec: providerSpec: value: nodeLabels: openstack-control-plane: enabled openstack-gateway: enabled
If you are deploying MOSK with compact control plane, add
Machineobjects for 3 combined control plane nodes using the following labels and parameters to thenodeLabelsfield:metadata: labels: cluster.sigs.k8s.io/control-plane: true spec: providerSpec: value: nodeLabels: openstack-control-plane: enabled openstack-gateway: enabled openvswitch: enabled
Add
Machineobjects for as many compute nodes as you want to install using the following labels:spec: providerSpec: value: nodeLabels: openstack-compute-node: enabled openvswitch: enabled
Available since Container Cloud 2.30.0 (Cluster releases 21.0.0 and 20.0.0). Optional. Configure controlled provisioning workflow using the
day1Provisioningandday1Deploymentcontrol fields inBareMetalMachineProviderSpecto allow hardware verification and validation before provisioning and deployment:apiVersion: cluster.k8s.io/v1alpha1 kind: Machine metadata: name: example-machine namespace: example-project spec: providerSpec: value: apiVersion: baremetal.k8s.io/v1alpha1 kind: BareMetalMachineProviderSpec day1Provisioning: manual # or "auto" for automatic provisioning day1Deployment: manual # or "auto" for automatic deployment bareMetalHostProfile: name: example-profile namespace: example-project # ... other configuration
When set to
manual(default), these fields enable controlled workflows:day1Provisioning: manual- a machine entersAwaitsProvisioningstate after bare metal host inspection, waiting for an operator approval to start provisioning.day1Deployment: manual- a machine entersAwaitsDeploymentstate after provisioning completes, waiting for an operator approval to start deployment.
For detailed workflows, see Controlled bare metal provisioning workflows.
Note
If not specified, both fields are set to
manualby default. Set toautoeither initially to automatically start provisioning and deployment, or later to continue after a manual inspection and approval.Save the text file and repeat the process to create configuration for all machines in your MOSK cluster.
Create machines in the cluster:
kubectl create -f mosk-cluster-machines.yaml
If a manual controlled provisioning and deployment is set, monitor the status to approve the corresponding phase:
kubectl -n <project-name> get machines
Example of system response where machines are waiting for a manual approval using
day1Provisioning: autoinBareMetalMachineProviderSpec:NAMESPACE NAME READY LCMPHASE demo-project control-1 false AwaitsProvisioning demo-project control-2 false AwaitsProvisioning demo-project control-3 false AwaitsProvisioning
To approve provisioning for machines in the
AwaitsProvisioningstate:kubectl -n <project-name> patch machine <machine-name> \ --type='merge' \ --patch='{"spec":{"providerSpec":{"value":{"day1Provisioning":"auto"}}}}'
To approve deployment for machines in the
AwaitsDeploymentstate:kubectl -n <project-name> patch machine <machine-name> \ --type='merge' \ --patch='{"spec":{"providerSpec":{"value":{"day1Deployment":"auto"}}}}'
Proceed to Add a Ceph cluster prior to MOSK 25.2.
See also
Create a machine using web UI
After you add bare metal hosts and create a managed cluster as described in Create a MOSK cluster, proceed with associating Kubernetes machines of your cluster with the previously added bare metal hosts using the Container Cloud web UI.
To add a Kubernetes machine to a MOSK cluster:
Log in to the Container Cloud web UI with the
m:kaas:namespace@operatororm:kaas:namespace@writerpermissions.Switch to the required project using the Switch Project action icon located on top of the main left-side navigation panel.
In the Clusters tab, click the required cluster name. The cluster page with the Machines list opens.
Click Create Machine button.
Fill out the Create New Machine form as required:
- Name
New machine name. If empty, a name is automatically generated in the
<clusterName>-<machineType>-<uniqueSuffix>format.
- Type
Machine type. Select Manager or Worker to create a Kubernetes manager or worker node.
Caution
The required minimum number of machines:
3 manager nodes for HA
3 worker storage nodes for a minimal Ceph cluster
- L2 Template
From the drop-down list, select the previously created L2 template, if any. For details, see Create L2 templates. Otherwise, leave the default selection to use the default L2 template of the cluster.
- Distribution
Operating system to provision the machine. From the drop-down list, select Ubuntu 22.04 Jammy as the machine distribution.
Warning
Do not use obsolete Ubuntu 20.04 distribution on greenfield deployments but only on existing clusters based on Ubuntu 20.04, which reaches end-of-life in April 2025. MOSK 24.3 release series is the last one to support Ubuntu 20.04 as the host operating system.
Update of management or MOSK clusters running Ubuntu 20.04 to the following major product release, where Ubuntu 22.04 is the only supported version, is not possible.
- Upgrade Index
Optional. A positive numeral value that defines the order of machine upgrade during a cluster update.
Note
You can change the upgrade order later on an existing cluster. For details, see Change the upgrade order of a machine.
Consider the following upgrade index specifics:
The first machine to upgrade is always one of the control plane machines with the lowest
upgradeIndex. Other control plane machines are upgraded one by one according to their upgrade indexes.If the
ClusterspecdedicatedControlPlanefield isfalse, worker machines are upgraded only after the upgrade of all control plane machines finishes. Otherwise, they are upgraded after the first control plane machine, concurrently with other control plane machines.If several machines have the same upgrade index, they have the same priority during upgrade.
If the value is not set, the machine is automatically assigned a value of the upgrade index.
- Host Configuration
Configuration settings of the bare metal host to be used for the machine:
- Host Inventory
From the drop-down list, select the previously created custom bare metal host to be used for the new machine.
Note
Before MOSK 25.2, the field name was Host.
- Host Profile
From the drop-down list, select the previously created custom bare metal host profile, if any. For details, see Create a custom bare metal host profile. Otherwise, leave the default selection.
- Labels
Add the required node labels for the worker machine to run certain components on a specific node. For example, for the StackLight nodes that run OpenSearch and require more resources than a standard node, add the StackLight label. The list of available node labels is obtained from
allowedNodeLabelsof your currentClusterrelease.If the
valuefield is not defined inallowedNodeLabels, from the drop-down list, select the required label and define an appropriate custom value for this label to be set to the node. For example, thenode-typelabel can have thestorage-ssdvalue to meet the service scheduling logic on a particular machine.Caution
If you deploy StackLight in the HA mode (recommended):
Add the StackLight label to minimum three worker nodes. Otherwise, StackLight will not be deployed until the required number of worker nodes is configured with the StackLight label.
Removal of the StackLight label from worker nodes along with removal of worker nodes with StackLight label can cause the StackLight components to become inaccessible. It is important to correctly maintain the worker nodes where the StackLight local volumes were provisioned. For details, see Delete a cluster machine.
To obtain the list of nodes where StackLight is deployed, refer to Upgrade managed clusters with StackLight deployed in HA mode.
If you move the StackLight label to a new worker machine on an existing cluster, manually deschedule all StackLight components from the old worker machine, which you remove the StackLight label from. For details, see Deschedule StackLight Pods from a worker machine.
Note
To add node labels after deploying a worker machine, navigate to the Machines page, click the More action icon in the last column of the required machine field, and select Configure machine.
- Auto-commence provisioning
Available since Container Cloud 2.30.0 (Cluster releases 21.0.0 and 20.0.0). Select to set
day1Provisioningtoauto, allowing immediate automatic provisioning after bare metal host inspection.If unselected (default), the machine will enter
AwaitsProvisioningstate and require a manual approval using the Provision button.
- Auto-commence deployment
Available since Container Cloud 2.30.0 (Cluster releases 21.0.0 and 20.0.0). Select to set
day1Deploymenttoauto, allowing immediate automatic deployment after provisioning completes.If unselected (default), the machine will enter
AwaitsDeploymentstate and require a manual approval using the Deploy button.
- Count
Specify the number of machines to create. If you create a machine pool, specify the replicas count of the pool.
- Manager
Select Manager or Worker to create a Kubernetes manager or worker node.
Caution
The required minimum number of machines:
3 manager nodes for HA
3 worker storage nodes for a minimal Ceph cluster
- BareMetal Host Label
Assign the role to the new machine(s) to link the machine to a previously created bare metal host with the corresponding label. You can assign one role type per machine. The supported labels include:
- Manager
This node hosts the manager services of a managed cluster. For the reliability reasons, Container Cloud does not permit running end user workloads on the manager nodes or use them as storage nodes.
- Worker
The default role for any node in a managed cluster. Only the
kubeletservice is running on the machines of this type.
- Upgrade Index
Optional. A positive numeral value that defines the order of machine upgrade during a cluster update.
Note
You can change the upgrade order later on an existing cluster. For details, see Change the upgrade order of a machine.
Consider the following upgrade index specifics:
The first machine to upgrade is always one of the control plane machines with the lowest
upgradeIndex. Other control plane machines are upgraded one by one according to their upgrade indexes.If the
ClusterspecdedicatedControlPlanefield isfalse, worker machines are upgraded only after the upgrade of all control plane machines finishes. Otherwise, they are upgraded after the first control plane machine, concurrently with other control plane machines.If several machines have the same upgrade index, they have the same priority during upgrade.
If the value is not set, the machine is automatically assigned a value of the upgrade index.
- Distribution
Operating system to provision the machine. From the drop-down list, select the required Ubuntu distribution.
- L2 Template
From the drop-down list, select the previously created L2 template, if any. For details, see Create L2 templates. Otherwise, leave the default selection to use the default L2 template of the cluster.
Note
Before Container Cloud 2.26.0 (Cluster releases 17.1.0 and 16.1.0), if you leave the default selection in the drop-down list, a preinstalled L2 template is used. Preinstalled templates are removed in the above-mentioned releases.
- BM Host Profile
From the drop-down list, select the previously created custom bare metal host profile, if any. For details, see Create a custom bare metal host profile. Otherwise, leave the default selection.
- Node Labels
Add the required node labels for the worker machine to run certain components on a specific node. For example, for the StackLight nodes that run OpenSearch and require more resources than a standard node, add the StackLight label. The list of available node labels is obtained from
allowedNodeLabelsof your currentClusterrelease.If the
valuefield is not defined inallowedNodeLabels, from the drop-down list, select the required label and define an appropriate custom value for this label to be set to the node. For example, thenode-typelabel can have thestorage-ssdvalue to meet the service scheduling logic on a particular machine.Caution
If you deploy StackLight in the HA mode (recommended):
Add the StackLight label to minimum three worker nodes. Otherwise, StackLight will not be deployed until the required number of worker nodes is configured with the StackLight label.
Removal of the StackLight label from worker nodes along with removal of worker nodes with StackLight label can cause the StackLight components to become inaccessible. It is important to correctly maintain the worker nodes where the StackLight local volumes were provisioned. For details, see Delete a cluster machine.
To obtain the list of nodes where StackLight is deployed, refer to Upgrade managed clusters with StackLight deployed in HA mode.
If you move the StackLight label to a new worker machine on an existing cluster, manually deschedule all StackLight components from the old worker machine, which you remove the StackLight label from. For details, see Deschedule StackLight Pods from a worker machine.
Note
To add node labels after deploying a worker machine, navigate to the Machines page, click the More action icon in the last column of the required machine field, and select Configure machine.
Click Create.
At this point, MOSK adds the new machine object to the specified cluster. And the Bare Metal Operator Controller creates the relation to a bare metal host with the labels matching the roles.
The workflow depends on the controlled provisioning settings:
If Auto-commence provisioning is selected, provisioning starts automatically after bare metal host inspection completes. Otherwise, the machine switches to the
AwaitsProvisioningstate. Click Provision in the machine menu to approve provisioning after verifying the hardware inventory.If Auto-commence deployment is selected, deployment starts automatically. Otherwise, the machine switches to the
AwaitsDeploymentstate. Click Deploy in the machine menu to approve deployment after verifying the provisioned configuration.
For details on the controlled provisioning workflow, see Controlled bare metal provisioning workflows.
Provisioning of the newly created machine starts when the
Machineobject is created and includes the following stages:Creation of partitions on local disks as required by the operating system and MOSK architecture.
Configuration of network interfaces on the host as required by the operating system and MOSK architecture.
Installation and configuration of the MOSK LCM Agent.
Repeat the steps above for the remaining machines.
Now, proceed to Add a Ceph cluster prior to MOSK 25.2.
Assign L2 templates to machines
To install MOSK on bare metal with Container Cloud, you must create L2 templates for each node type in the MOSK cluster. Additionally, you may have to create separate templates for nodes of the same type when they have different configuration.
To assign specific L2 templates to machines in a cluster:
Select from the following options to assign the templates to the cluster:
Since MOSK 23.3, use the
cluster.sigs.k8s.io/cluster-namelabel in thelabelssection.Before MOSK 23.3, use the
clusterRefparameter in thespecsection.
Add a unique identifier label to every L2 template. Typically, that would be the name of the MOSK node role, for example
l2template-compute, orl2template-compute-5nics.Assign an L2 template to a machine. Set the
l2TemplateSelectorfield in the machine spec to the name of the label added in the previous step. IPAM Controller uses this field to use a specific L2 template for the corresponding machine.Alternatively, you may set the
l2TemplateSelectorfield to the name of the L2 template.
Consider the following examples of an L2 template assignment to a machine.
apiVersion: ipam.mirantis.com/v1alpha1
kind: L2Template
metadata:
name: example-node-netconfig
namespace: my-project
labels:
kaas.mirantis.com/provider: baremetal
kaas.mirantis.com/region: region-one
l2template-example-node-netconfig: "1"
cluster.sigs.k8s.io/cluster-name: my-cluster
...
Note
The kaas.mirantis.com/region label is removed from all MOSK
objects in 24.1. Therefore, do not add the label starting with this release.
On existing clusters updated to this release, or if added manually, MOSK
ignores this label.
Note
Before MOSK 23.3, an L2 template requires
clusterRef: <clusterName> in the spec section. Since MOSK 23.3,
this parameter is deprecated and automatically migrated to the
cluster.sigs.k8s.io/cluster-name: <clusterName> label.
apiVersion: cluster.k8s.io/v1alpha1
kind: Machine
metadata:
name: machine1
namespace: my-project
labels:
cluster.sigs.k8s.io/cluster-name: my-cluster
...
...
spec:
providerSpec:
value:
l2TemplateSelector:
label: l2template-example-node-netconfig
...
apiVersion: cluster.k8s.io/v1alpha1
kind: Machine
metadata:
name: machine1
namespace: my-project
labels:
cluster.sigs.k8s.io/cluster-name: my-cluster
...
...
spec:
providerSpec:
value:
l2TemplateSelector:
name: example-node-netconfig
...
Now, proceed to Deploy a machine to a specific bare metal host.
Deploy a machine to a specific bare metal host
A machine in a MOSK cluster requires dedicated bare metal
host for deployment. In the Mirantis Container Cloud management API, bare metal
hosts are represented by the BareMetalHost objects that are automatically
generated by the related BareMetalHostInventory objects.
Note
The BareMetalHostInventory resource is available since the update
of the management cluster to the Cluster release 16.4.0 (Container Cloud
2.29.0). Before this release, the BareMetalHost object is used.
Since the above mentioned release, BareMetalHost is only used for
internal purposes of the Container Cloud private API. All configuration
changes must be applied using the BareMetalHostInventory objects.
For any existing BareMetalHost object, a BareMetalHostInventory
object is created automatically during cluster update.
Caution
While the Cluster release of the management cluster is 16.4.0,
BareMetalHostInventory operations are allowed to
m:kaas@management-admin only. This limitation is lifted once the
management cluster is updated to the Cluster release 16.4.1 or later.
All BareMetalHostInventory objects must be labeled upon creation with a
label that allows identifying the host and assigning it to a machine.
The labels may be unique, or applied to a group of hosts, based on similarities in their capacity, capabilities and hardware configuration, on their location, suitable role, or a combination of thereof.
In some cases, you may need to deploy a machine to a specific bare metal host. This is especially useful when some of your bare metal hosts have different hardware configuration than the rest.
To deploy a machine to a specific bare metal host:
Log in to the host where your management cluster
kubeconfigis located and where kubectl is installed.Identify the bare metal host that you want to associate with the specific machine. For example, host
host-1.kubectl get baremetalhostinventory host-1 -o yaml
kubectl get baremetalhost host-1 -o yaml
Add a label that will uniquely identify this host, for example, by the name of the host and machine that you want to deploy on it.
kubectl edit baremetalhostinventory host-1
Note
For details about labels, see BareMetalHostInventory resource.
kubectl edit baremetalhost host-1
Note
For details about labels, see BareMetalHost resource.
Configuration example:
kind: BareMetalHostInventory metadata: name: host-1 namespace: myProjectName labels: kaas.mirantis.com/baremetalhost-id: host-1-worker-HW11-cad5 ...
kind: BareMetalHost metadata: name: host-1 namespace: myProjectName labels: kaas.mirantis.com/baremetalhost-id: host-1-worker-HW11-cad5 ...
Open the text file with the YAML definition of the
Machineobject, created in Create a machine using CLI.Add a host selector that matches the label you have added to the
BareMetalHostobject in the previous step. For example:kind: Machine metadata: name: worker-HW11-cad5 namespace: myProjectName spec: ... providerSpec: value: apiVersion: baremetal.k8s.io/v1alpha1 kind: BareMetalMachineProviderSpec ... hostSelector: matchLabels: kaas.mirantis.com/baremetalhost-id: host-1-worker-HW11-cad5 ...
Once created, this machine will be associated with the specified bare metal host, and you can return to Create a machine using CLI.
Caution
The required minimum number of machines:
3 manager nodes for HA
3 worker storage nodes for a minimal Ceph cluster
Override network interfaces naming and order
An L2 template contains the ifMapping field that allows you to
identify Ethernet interfaces for the template. The Machine object
API enables the Operator to override the mapping from the L2 template
by enforcing a specific order of names of the interfaces when applied
to the template.
The field l2TemplateIfMappingOverride in the spec of the Machine
object contains a list of interfaces names. The order of the interfaces
names in the list is important because the L2Template object will
be rendered with NICs ordered as per this list.
Note
Changes in the l2TemplateIfMappingOverride field will apply
only once when the Machine and corresponding IpamHost objects
are created. Further changes to l2TemplateIfMappingOverride
will not reset the interfaces assignment and configuration.
Caution
The l2TemplateIfMappingOverride field must contain the names
of all interfaces of the bare metal host.
The following example illustrates how to include the override field to the
Machine object. In this example, we configure the interface eno1,
which is the second on-board interface of the server, to precede the first
on-board interface eno0.
apiVersion: cluster.k8s.io/v1alpha1
kind: Machine
metadata:
finalizers:
- foregroundDeletion
- machine.cluster.sigs.k8s.io
labels:
cluster.sigs.k8s.io/cluster-name: kaas-mgmt
cluster.sigs.k8s.io/control-plane: "true"
kaas.mirantis.com/provider: baremetal
kaas.mirantis.com/region: region-one
spec:
providerSpec:
value:
apiVersion: baremetal.k8s.io/v1alpha1
hostSelector:
matchLabels:
kaas.mirantis.com/baremetalhost-id: hw-master-0
image: {}
kind: BareMetalMachineProviderSpec
l2TemplateIfMappingOverride:
- eno1
- eno0
- enp0s1
- enp0s2
Note
The kaas.mirantis.com/region label is removed from all MOSK
objects in 24.1. Therefore, do not add the label starting with this release.
On existing clusters updated to this release, or if added manually, MOSK
ignores this label.
As a result of the configuration above, when used with the example
L2 template for bonds and bridges described in Create L2 templates,
the enp0s1 and enp0s2 interfaces will be in predictable
ordered state. This state will be used to create subinterfaces for
Kubernetes networks (k8s-pods) and for Kubernetes external
network (k8s-ext).
Also, you can use the non-case-sensitive list of NIC MAC addresses instead of the list of NIC names. For example:
apiVersion: cluster.k8s.io/v1alpha1
kind: Machine
...
spec:
providerSpec:
value:
...
kind: BareMetalMachineProviderSpec
l2TemplateIfMappingOverride:
- b4:96:91:6f:2e:10
- b4:96:91:6f:2e:11
- b5:a6:c1:6f:ee:02
- b5:a6:c1:6f:ee:02
Manually allocate IP addresses for bare metal hosts
Available since MCC 2.26.0 (16.1.0 and 17.1.0)
You can force the DHCP server to assign a particular IP address for a bare
metal host during PXE provisioning by adding the
host.dnsmasqs.metal3.io/address annotation with the desired IP address
value to the required bare metal host.
If you have a limited amount of free and unused IP addresses for a server provisioning, you can manually create bare metal hosts one by one and provision servers in small, manually managed batches.
For batching in small chunks, you can use the
host.dnsmasqs.metal3.io/address annotation to manually allocate IP
addresses along with the baremetalhost.metal3.io/detached annotation to
pause automatic host management by the bare metal Operator.
To pause bare metal hosts for a manual IP allocation during provisioning:
Set the
baremetalhost.metal3.io/detachedannotation for all bare metal hosts that pauses host management.Note
If the host provisioning has already started or completed, addition of this annotation deletes the information about the host from Ironic without triggering deprovisioning. The bare metal Operator recreates the host in Ironic once you remove the annotation. For details, see Metal3 documentation.
Add the
host.dnsmasqs.metal3.io/addressannotation with corresponding IP address values to a batch of bare metal hosts.Remove the
baremetalhost.metal3.io/detachedannotation from the batch used in the previous step.Repeat the steps 2 and 3 until all hosts are provisioned.
Add a Ceph cluster since MOSK 25.2
Warning
This procedure is valid for MOSK clusters that use the MiraCeph custom
resource (CR), which is available since MOSK 25.2 to replace the deprecated
KaaSCephCluster. For the equivalent procedure with the KaaSCephCluster
CR, refer to the following section:
After you add machines to your new MOSK cluster as described in Add a machine, create a Ceph cluster on top of this cluster using CLI.
For an advanced configuration through the MiraCeph CR, see
Ceph advanced configuration. For the Ceph Controller configuration through
Kubernetes templates to manage Ceph nodes resources, see
Enable management of Ceph tolerations and resources.
The procedure below enables you to create a Ceph cluster with minimum three Ceph nodes that provides persistent volumes to the Kubernetes workloads in the MOSK cluster.
To create a Ceph cluster in the MOSK cluster using CLI:
On the management cluster, verify that the MOSK cluster overall status is ready with all conditions in the
Readystate:kubectl -n <moskClusterProject> get cluster <clusterName> -o yaml
Substitute
<moskClusterProject>and<clusterName>with the corresponding managed cluster namespace and name accordingly.Example system response of a healthy cluster
status: providerStatus: ready: true conditions: - message: Helm charts are successfully installed(upgraded). ready: true type: Helm - message: Kubernetes objects are fully up. ready: true type: Kubernetes - message: All requested nodes are ready. ready: true type: Nodes - message: Maintenance state of the cluster is false ready: true type: Maintenance - message: TLS configuration settings are applied ready: true type: TLS - message: Kubelet is Ready on all nodes belonging to the cluster ready: true type: Kubelet - message: Swarm is Ready on all nodes belonging to the cluster ready: true type: Swarm - message: All provider instances of the cluster are Ready ready: true type: ProviderInstance - message: LCM agents have the latest version ready: true type: LCMAgent - message: StackLight is fully up. ready: true type: StackLight - message: OIDC configuration has been applied. ready: true type: OIDC - message: Load balancer 10.100.91.150 for kubernetes API has status HEALTHY ready: true type: LoadBalancer
Create a YAML file with the Ceph cluster specification:
apiVersion: lcm.mirantis.com/v1alpha1 kind: MiraCeph metadata: name: <cephClusterName> namespace: ceph-lcm-mirantis
Substitute
<cephClusterName>with the required name for the Ceph cluster. This name will be used in the Ceph LCM operations.Add explicit network configuration of the Ceph cluster using the
networksection:spec: network: publicNet: <publicNet> clusterNet: <clusterNet>
Substitute the following values:
<publicNet>is a CIDR definition or comma-separated list of CIDR definitions (if the MOSK cluster uses multiple networks) of public network for the Ceph data. The values must match the corresponding values of the clusterSubnetobject.<clusterNet>is a CIDR definition or comma-separated list of CIDR definitions (if the MOSK cluster uses multiple networks) of replication network for the Ceph data. The values must match the corresponding values of the clusterSubnetobject.
Configure Ceph Manager and Ceph Monitor roles to select nodes that should place Ceph Monitor and Ceph Manager daemons:
On a MOSK cluster, obtain node names to place Ceph Monitor and Ceph Manager daemons at:
kubectl get nodes
Add the
nodessection withmonandmgrroles defined:spec: nodes: - name: <mgr-node-1> roles: - <role-1> - <role-2> ... - name: <mgr-node-2> roles: - <role-1> - <role-2> ...
Substitute
<mgr-node-X>with the corresponding node names and<role-X>with the corresponding roles of daemon placement, for example,monormgr.For other optional node parameters, see Ceph advanced configuration.
Configure Ceph OSD daemons for Ceph cluster data storage:
Note
This step involves the deployment of Ceph Monitor and Ceph Manager daemons on nodes that are different from the ones hosting Ceph cluster OSDs. However, it is also possible to colocate Ceph OSDs, Ceph Monitor, and Ceph Manager daemons on the same nodes. You can achieve this by configuring the
rolesanddevicessections accordingly. This kind of configuration flexibility is particularly useful in scenarios such as hyper-converged clusters.Warning
The minimal production cluster requires at least three nodes for Ceph Monitor daemons and three nodes for Ceph OSDs.
On the management cluster, obtain the names of the machines with disks intended for storing Ceph data:
kubectl -n <moskClusterProject> get machine
For each machine, use
status.providerStatus.hardware.storageto obtain information about node disks:kubectl -n <moskClusterProject> get machine <machineName> -o yaml
Output example of the machine hardware details
status: providerStatus: hardware: storage: - byID: /dev/disk/by-id/wwn-0x05ad99618d66a21f byIDs: - /dev/disk/by-id/scsi-0QEMU_QEMU_HARDDISK_05ad99618d66a21f - /dev/disk/by-id/scsi-305ad99618d66a21f - /dev/disk/by-id/scsi-SQEMU_QEMU_HARDDISK_05ad99618d66a21f - /dev/disk/by-id/wwn-0x05ad99618d66a21f byPath: /dev/disk/by-path/pci-0000:00:05.0-scsi-0:0:0:0 byPaths: - /dev/disk/by-path/pci-0000:00:05.0-scsi-0:0:0:0 name: /dev/sda serialNumber: 05ad99618d66a21f size: 61 type: hdd - byID: /dev/disk/by-id/wwn-0x26d546263bd312b8 byIDs: - /dev/disk/by-id/scsi-0QEMU_QEMU_HARDDISK_26d546263bd312b8 - /dev/disk/by-id/scsi-326d546263bd312b8 - /dev/disk/by-id/scsi-SQEMU_QEMU_HARDDISK_26d546263bd312b8 - /dev/disk/by-id/wwn-0x26d546263bd312b8 byPath: /dev/disk/by-path/pci-0000:00:05.0-scsi-0:0:0:2 byPaths: - /dev/disk/by-path/pci-0000:00:05.0-scsi-0:0:0:2 name: /dev/sdb serialNumber: 26d546263bd312b8 size: 32 type: hdd - byID: /dev/disk/by-id/wwn-0x2e52abb48862dbdc byIDs: - /dev/disk/by-id/lvm-pv-uuid-MncrcO-6cel-0QsB-IKaY-e8UK-6gDy-k2hOtf - /dev/disk/by-id/scsi-0QEMU_QEMU_HARDDISK_2e52abb48862dbdc - /dev/disk/by-id/scsi-32e52abb48862dbdc - /dev/disk/by-id/scsi-SQEMU_QEMU_HARDDISK_2e52abb48862dbdc - /dev/disk/by-id/wwn-0x2e52abb48862dbdc byPath: /dev/disk/by-path/pci-0000:00:05.0-scsi-0:0:0:1 byPaths: - /dev/disk/by-path/pci-0000:00:05.0-scsi-0:0:0:1 name: /dev/sdc serialNumber: 2e52abb48862dbdc size: 61 type: hdd
Select
by-idsymlinks on the disks to be used in the Ceph cluster. The symlinks must meet the following requirements:A
by-idsymlink must containstatus.providerStatus.hardware.storage.serialNumberA
by-idsymlink must not containwwn
For the example above, if you are going to use the
sdcdisk to store Ceph data on it, use the/dev/disk/by-id/scsi-SQEMU_QEMU_HARDDISK_2e52abb48862dbdcsymlink. It will be persistent and will not be affected by node reboot.Note
For details about storage device formats, see Addressing storage devices since MOSK 25.2.
For each machine, use
status.instanceNameto obtain the corresponding node name:kubectl -n <moskClusterProject> get machine <machineName> -o yaml
Output example of the machine hardware details:
status: instanceName: kaas-node-a99016f5-68da-450b-a0c8-06b1f9bb7131
Specify the selected
by-idsymlinks in thespec.nodes.devices.fullPathfield along with thespec.nodes.devices.config.deviceClassfield:Example configuration
spec: nodes: - name: <storage-node-1> devices: - fullPath: <byIDSymlink-1> config: deviceClass: <deviceClass-1> - fullPath: <byIDSymlink-2> config: deviceClass: <deviceClass-1> - fullPath: <byIDSymlink-3> config: deviceClass: <deviceClass-2> ... - name: <storage-node-2> devices: - fullPath: <byIDSymlink-4> config: deviceClass: <deviceClass-1> - fullPath: <byIDSymlink-5> config: deviceClass: <deviceClass-1> - fullPath: <byIDSymlink-6> config: deviceClass: <deviceClass-2> ... - name: <storage-node-3> devices: - fullPath: <byIDSymlink-7> config: deviceClass: <deviceClass-1> - fullPath: <byIDSymlink-8> config: deviceClass: <deviceClass-1> - fullPath: <byIDSymlink-9> config: deviceClass: <deviceClass-2> ...
Substitute the following values:
<storage-node-X>with the corresponding node names<byIDSymlink-X>with the obtainedby-idsymlinks fromstatus.providerStatus.hardware.storage.byIDs<deviceClass-X>with the obtained disk types fromstatus.providerStatus.hardware.storage.type
Configure the pools for Image, Block Storage, and Compute services.
Note
Ceph validates the specified pools. Therefore, do not omit any of the following pools.
Ceph pool configuration
spec: pools: - default: false deviceClass: hdd name: volumes replicated: size: 3 role: volumes - default: false deviceClass: hdd name: vms replicated: size: 3 role: vms - default: false deviceClass: hdd name: backup replicated: size: 3 role: backup - default: false deviceClass: hdd name: images replicated: size: 3 role: images
Each Ceph pool, depending on its role, has a default
targetSizeRatiovalue that defines the expected consumption of the total Ceph cluster capacity. The default ratio values for MOSK pools are as follows:20.0% for a Ceph pool with role
volumes40.0% for a Ceph pool with role
vms10.0% for a Ceph pool with role
images10.0% for a Ceph pool with role
backup
Mirantis highly recommends overriding
targetSizeRatiodefaults. For details, see Calculate target ratio for Ceph pools.Configure Ceph Block Pools to use RBD. For the detailed configuration, refer to Pool parameters. Example configuration:
spec: pools: - default: true deviceClass: hdd name: kubernetes replicated: size: 3 role: kubernetes
Configure Ceph Object Storage to use OpenStack Swift Object Storage.
Example configuration
spec: objectStorage: rgw: dataPool: deviceClass: hdd erasureCoded: codingChunks: 1 dataChunks: 2 failureDomain: host gateway: instances: 3 port: 80 securePort: 8443 metadataPool: deviceClass: hdd failureDomain: host replicated: size: 3 name: object-store preservePoolsOnDelete: false
Optional. Configure Ceph Shared Filesystem to use CephFS. For the detailed configuration, refer to Configure Ceph Shared File System (CephFS).
Example configuration
spec: sharedFilesystem: cephFS: - name: cephfs-store dataPools: - name: cephfs-pool-1 deviceClass: hdd replicated: size: 3 failureDomain: host metadataPool: deviceClass: nvme replicated: size: 3 failureDomain: host metadataServer: activeCount: 1 activeStandby: false
When the Ceph cluster specification is complete, apply the built YAML file on the MOSK cluster:
kubectl apply -f <miraceph-template>.yaml
Substitue
<miraceph-template>with the name of the file containing theMiraCephspecification.The resulting example of the
MiraCephtemplateapiVersion: lcm.mirantis.com/v1alpha1 kind: MiraCeph metadata: name: kaas-ceph namespace: ceph-lcm-mirantis spec: network: publicNet: 10.10.0.0/24 clusterNet: 10.11.0.0/24 nodes: - name: master-1 roles: - mon - mgr - name: master-2 roles: - mon - mgr - name: master-3 roles: - mon - mgr - name: worker-1 devices: - fullPath: /dev/disk/by-id/scsi-1ATA_WDC_WDS100T2B0A-00SM50_200231443409 config: deviceClass: ssd - name: worker-2 devices: - fullPath: /dev/disk/by-id/scsi-1ATA_WDC_WDS100T2B0A-00SM50_200231440912 config: deviceClass: ssd - name: worker-3 devices: - fullPath: /dev/disk/by-id/scsi-1ATA_WDC_WDS100T2B0A-00SM50_200231434939 config: deviceClass: ssd pools: - default: true deviceClass: hdd name: kubernetes replicated: size: 3 role: kubernetes - default: false deviceClass: hdd name: volumes replicated: size: 3 role: volumes - default: false deviceClass: hdd name: vms replicated: size: 3 role: vms - default: false deviceClass: hdd name: backup replicated: size: 3 role: backup - default: false deviceClass: hdd name: images replicated: size: 3 role: images objectStorage: rgw: dataPool: deviceClass: ssd erasureCoded: codingChunks: 1 dataChunks: 2 failureDomain: host gateway: instances: 3 port: 80 securePort: 8443 metadataPool: deviceClass: ssd failureDomain: host replicated: size: 3 name: object-store preservePoolsOnDelete: false
Wait for the
MiraCephHealthobject to be created and then forstatus.shortClusterInfo.stateto becomeReady:kubectl -n ceph-lcm-mirantis get mchealth -o yaml
Verify the cluster as described in Verify Ceph.
Once all pools are created, verify that an appropriate secret required for a successful deployment of the OpenStack services that rely on Ceph is created in the
openstack-ceph-sharednamespace:kubectl -n openstack-ceph-shared get secrets openstack-ceph-keys
Example of a positive system response:
NAME TYPE DATA AGE openstack-ceph-keys Opaque 7 36m
Add a Ceph cluster prior to MOSK 25.2
Warning
This procedure is valid for MOSK clusters that use the deprecated
KaaSCephCluster custom resource (CR) instead of the MiraCeph CR that is
available since MOSK 25.2 as a new Ceph configuration entrypoint. For the
equivalent procedure with the MiraCeph CR, refer to the following section:
Warning
This procedure is valid for MOSK clusters that use the deprecated
KaaSCephCluster custom resource (CR) instead of the MiraCeph CR that is
available since MOSK 25.2 as a new Ceph configuration entrypoint. For the
equivalent procedure with the MiraCeph CR, refer to the following section:
After you add machines to your new bare metal managed cluster as described in Add a machine, create a Ceph cluster on top of this managed cluster.
For an advanced configuration through the KaaSCephCluster CR, see
Ceph advanced configuration. To configure Ceph Controller through Kubernetes
templates to manage Ceph node resources, see Enable Ceph tolerations and resources management.
The procedure below enables you to create a Ceph cluster with minimum three Ceph nodes that provides persistent volumes to the Kubernetes workloads in the managed cluster.
Create a Ceph cluster using the CLI
Verify that the overall status of the managed cluster is ready with all conditions in the
Readystate:kubectl -n <managedClusterProject> get cluster <clusterName> -o yaml
Substitute
<managedClusterProject>and<clusterName>with the corresponding managed cluster namespace and name.Example of system response:
status: providerStatus: ready: true conditions: - message: Helm charts are successfully installed(upgraded). ready: true type: Helm - message: Kubernetes objects are fully up. ready: true type: Kubernetes - message: All requested nodes are ready. ready: true type: Nodes - message: Maintenance state of the cluster is false ready: true type: Maintenance - message: TLS configuration settings are applied ready: true type: TLS - message: Kubelet is Ready on all nodes belonging to the cluster ready: true type: Kubelet - message: Swarm is Ready on all nodes belonging to the cluster ready: true type: Swarm - message: All provider instances of the cluster are Ready ready: true type: ProviderInstance - message: LCM agents have the latest version ready: true type: LCMAgent - message: StackLight is fully up. ready: true type: StackLight - message: OIDC configuration has been applied. ready: true type: OIDC - message: Load balancer 10.100.91.150 for kubernetes API has status HEALTHY ready: true type: LoadBalancer
Create a YAML file with the Ceph cluster specification:
apiVersion: kaas.mirantis.com/v1alpha1 kind: KaaSCephCluster metadata: name: <cephClusterName> namespace: <managedClusterProject> spec: k8sCluster: name: <clusterName> namespace: <managedClusterProject>
Substitute
<cephClusterName>with the required name of the Ceph cluster. This name will be used in the Ceph LCM operations.Select from the following options:
Add explicit network configuration of the Ceph cluster using the
networksection:spec: cephClusterSpec: network: publicNet: <publicNet> clusterNet: <clusterNet>
Substitute the following values:
<publicNet>is a CIDR definition or comma-separated list of CIDR definitions (if the MOSK cluster uses multiple networks) of public network for the Ceph data. The values must match the corresponding values of the clusterSubnetobject.<clusterNet>is a CIDR definition or comma-separated list of CIDR definitions (if the MOSK cluster uses multiple networks) of replication network for the Ceph data. The values must match the corresponding values of the clusterSubnetobject.
Configure
Subnetobjects for the storage access network by settingipam/SVC-ceph-public: "1"andipam/SVC-ceph-cluster: "1"labels to the correspondingSubnetobjects. For more details, refer to Create subnets for a managed cluster using CLI, steps about storage access and replication networks.
Configure Ceph Manager and Ceph Monitor roles to select nodes that must place Ceph Monitor and Ceph Manager daemons:
Obtain the names of machines to place Ceph Monitor and Ceph Manager daemons at:
kubectl -n <managedClusterProject> get machine
Add the
nodessection withmonandmgrroles defined:spec: cephClusterSpec: nodes: <mgr-node-1>: roles: - <role-1> - <role-2> ... <mgr-node-2>: roles: - <role-1> - <role-2> ...
Substitute
<mgr-node-X>with the correspondingMachineobject names and<role-X>with the corresponding roles of daemon placement, for example,monormgr.For other optional node parameters, see Ceph advanced configuration.
Configure Ceph OSD daemons for Ceph cluster data storage:
Note
This step involves the deployment of Ceph Monitor and Ceph Manager daemons on nodes that are different from the ones hosting Ceph cluster OSDs. However, you can also colocate Ceph OSDs, Ceph Monitor, and Ceph Manager daemons on the same nodes by configuring the
rolesandstorageDevicesorstorageDeviceFiltersections accordingly. This kind of configuration flexibility is particularly useful in scenarios such as hyper-converged clusters.Warning
The minimal production cluster requires at least three nodes for Ceph Monitor daemons and three nodes for Ceph OSDs.
Obtain the names of machines with disks intended for storing Ceph data:
kubectl -n <managedClusterProject> get machine
For each machine, use
status.providerStatus.hardware.storageto obtain information about node disks:kubectl -n <managedClusterProject> get machine <machineName> -o yaml
Example of system response with machine hardware details
status: providerStatus: hardware: storage: - byID: /dev/disk/by-id/wwn-0x05ad99618d66a21f byIDs: - /dev/disk/by-id/scsi-0QEMU_QEMU_HARDDISK_05ad99618d66a21f - /dev/disk/by-id/scsi-305ad99618d66a21f - /dev/disk/by-id/scsi-SQEMU_QEMU_HARDDISK_05ad99618d66a21f - /dev/disk/by-id/wwn-0x05ad99618d66a21f byPath: /dev/disk/by-path/pci-0000:00:05.0-scsi-0:0:0:0 byPaths: - /dev/disk/by-path/pci-0000:00:05.0-scsi-0:0:0:0 name: /dev/sda serialNumber: 05ad99618d66a21f size: 61 type: hdd - byID: /dev/disk/by-id/wwn-0x26d546263bd312b8 byIDs: - /dev/disk/by-id/scsi-0QEMU_QEMU_HARDDISK_26d546263bd312b8 - /dev/disk/by-id/scsi-326d546263bd312b8 - /dev/disk/by-id/scsi-SQEMU_QEMU_HARDDISK_26d546263bd312b8 - /dev/disk/by-id/wwn-0x26d546263bd312b8 byPath: /dev/disk/by-path/pci-0000:00:05.0-scsi-0:0:0:2 byPaths: - /dev/disk/by-path/pci-0000:00:05.0-scsi-0:0:0:2 name: /dev/sdb serialNumber: 26d546263bd312b8 size: 32 type: hdd - byID: /dev/disk/by-id/wwn-0x2e52abb48862dbdc byIDs: - /dev/disk/by-id/lvm-pv-uuid-MncrcO-6cel-0QsB-IKaY-e8UK-6gDy-k2hOtf - /dev/disk/by-id/scsi-0QEMU_QEMU_HARDDISK_2e52abb48862dbdc - /dev/disk/by-id/scsi-32e52abb48862dbdc - /dev/disk/by-id/scsi-SQEMU_QEMU_HARDDISK_2e52abb48862dbdc - /dev/disk/by-id/wwn-0x2e52abb48862dbdc byPath: /dev/disk/by-path/pci-0000:00:05.0-scsi-0:0:0:1 byPaths: - /dev/disk/by-path/pci-0000:00:05.0-scsi-0:0:0:1 name: /dev/sdc serialNumber: 2e52abb48862dbdc size: 61 type: hdd
Select
by-idsymlinks on the disks to be used in the Ceph cluster. The symlinks must meet the following requirements:A
by-idsymlink must containstatus.providerStatus.hardware.storage.serialNumberA
by-idsymlink must not containwwn
For the example above, to use the
sdcdisk to store Ceph data on it, select the/dev/disk/by-id/scsi-SQEMU_QEMU_HARDDISK_2e52abb48862dbdcsymlink. It is persistent and will not be affected by node reboot.Note
For details about storage device formats, see Addressing storage devices prior to MOSK 25.2.
Sepcify
by-idsymlinks:Specify the selected
by-idsymlinks in thespec.cephClusterSpec.nodes.storageDevices.fullPathfield along with thespec.cephClusterSpec.nodes.storageDevices.config.deviceClassfield:spec: cephClusterSpec: nodes: <storage-node-1>: storageDevices: - fullPath: <byIDSymlink-1> config: deviceClass: <deviceClass-1> - fullPath: <byIDSymlink-2> config: deviceClass: <deviceClass-1> - fullPath: <byIDSymlink-3> config: deviceClass: <deviceClass-2> ... <storage-node-2>: storageDevices: - fullPath: <byIDSymlink-4> config: deviceClass: <deviceClass-1> - fullPath: <byIDSymlink-5> config: deviceClass: <deviceClass-1> - fullPath: <byIDSymlink-6> config: deviceClass: <deviceClass-2> <storage-node-3>: storageDevices: - fullPath: <byIDSymlink-7> config: deviceClass: <deviceClass-1> - fullPath: <byIDSymlink-8> config: deviceClass: <deviceClass-1> - fullPath: <byIDSymlink-9> config: deviceClass: <deviceClass-2>
Specify the selected
by-idsymlinks in thespec.cephClusterSpec.nodes.storageDevices.namefield along with thespec.cephClusterSpec.nodes.storageDevices.config.deviceClassfield:spec: cephClusterSpec: nodes: <storage-node-1>: storageDevices: - name: <byIDSymlink-1> config: deviceClass: <deviceClass-1> - name: <byIDSymlink-2> config: deviceClass: <deviceClass-1> - name: <byIDSymlink-3> config: deviceClass: <deviceClass-2> ... <storage-node-2>: storageDevices: - name: <byIDSymlink-4> config: deviceClass: <deviceClass-1> - name: <byIDSymlink-5> config: deviceClass: <deviceClass-1> - name: <byIDSymlink-6> config: deviceClass: <deviceClass-2> <storage-node-3>: storageDevices: - name: <byIDSymlink-7> config: deviceClass: <deviceClass-1> - name: <byIDSymlink-8> config: deviceClass: <deviceClass-1> - name: <byIDSymlink-9> config: deviceClass: <deviceClass-2>
Substitute the following values:
<storage-node-X>with the correspondingMachineobject names<byIDSymlink-X>with theby-idsymlinks obtained fromstatus.providerStatus.hardware.storage.byIDs<deviceClass-X>with the disk types obtained fromstatus.providerStatus.hardware.storage.type
Configure the pools for Image, Block Storage, and Compute services:
Note
Ceph validates the specified pools. Therefore, do not omit any of the following pools.
spec: pools: - default: true deviceClass: hdd name: kubernetes replicated: size: 3 role: kubernetes - default: false deviceClass: hdd name: volumes replicated: size: 3 role: volumes - default: false deviceClass: hdd name: vms replicated: size: 3 role: vms - default: false deviceClass: hdd name: backup replicated: size: 3 role: backup - default: false deviceClass: hdd name: images replicated: size: 3 role: images
Each Ceph pool, depending on its role, has the default
targetSizeRatiovalue that defines the expected consumption of the total Ceph cluster capacity. The default ratio values for MOSK pools are as follows:20.0% for a Ceph pool with the role
volumes40.0% for a Ceph pool with the role
vms10.0% for a Ceph pool with the role
images10.0% for a Ceph pool with the role
backup
Optional. Configure Ceph Block Pools to use RBD. For the detailed configuration, refer to Pool parameters.
Example configuration:
spec: cephClusterSpec: pools: - name: kubernetes role: kubernetes deviceClass: hdd replicated: size: 3 targetSizeRatio: 10.0 default: true
Configure Ceph Object Storage to use OpenStack Swift Object Storage. For details, see RADOS Gateway parameters. Example configuration:
spec: cephClusterSpec: objectStorage: rgw: dataPool: deviceClass: hdd erasureCoded: codingChunks: 1 dataChunks: 2 failureDomain: host gateway: instances: 3 port: 80 securePort: 8443 metadataPool: deviceClass: hdd failureDomain: host replicated: size: 3 name: object-store preservePoolsOnDelete: false
Optional. Configure Ceph Shared Filesystem to use CephFS. For the detailed configuration, refer to Configure Ceph Shared File System (CephFS). Example configuration:
spec: cephClusterSpec: sharedFilesystem: cephFS: - name: cephfs-store dataPools: - name: cephfs-pool-1 deviceClass: hdd replicated: size: 3 failureDomain: host metadataPool: deviceClass: nvme replicated: size: 3 failureDomain: host metadataServer: activeCount: 1 activeStandby: false
When the Ceph cluster specification is complete, apply the built YAML file on the management cluster:
kubectl apply -f <kcc-template>.yaml
Substitue
<kcc-template>with the name of the file containing theKaaSCephClusterspecification.The resulting example of the
KaaSCephClustertemplateapiVersion: kaas.mirantis.com/v1alpha1 kind: KaaSCephCluster metadata: name: kaas-ceph namespace: mosk-namespace spec: k8sCluster: name: mosk-cluster namespace: mosk-namespace cephClusterSpec: network: publicNet: 10.10.0.0/24 clusterNet: 10.11.0.0/24 nodes: master-1: roles: - mon - mgr master-2: roles: - mon - mgr master-3: roles: - mon - mgr worker-1: storageDevices: - fullPath: /dev/disk/by-id/scsi-1ATA_WDC_WDS100T2B0A-00SM50_200231443409 config: deviceClass: ssd worker-2: storageDevices: - fullPath: /dev/disk/by-id/scsi-1ATA_WDC_WDS100T2B0A-00SM50_200231440912 config: deviceClass: ssd worker-3: storageDevices: - fullPath: /dev/disk/by-id/scsi-1ATA_WDC_WDS100T2B0A-00SM50_200231434939 config: deviceClass: ssd pools: - default: true deviceClass: hdd name: kubernetes replicated: size: 3 role: kubernetes - default: false deviceClass: hdd name: volumes replicated: size: 3 role: volumes - default: false deviceClass: hdd name: vms replicated: size: 3 role: vms - default: false deviceClass: hdd name: backup replicated: size: 3 role: backup - default: false deviceClass: hdd name: images replicated: size: 3 role: images objectStorage: rgw: dataPool: deviceClass: ssd erasureCoded: codingChunks: 1 dataChunks: 2 failureDomain: host gateway: instances: 3 port: 80 securePort: 8443 metadataPool: deviceClass: ssd failureDomain: host replicated: size: 3 name: object-store preservePoolsOnDelete: false
Wait for the
KaaSCephClusterstatus and forstatus.shortClusterInfo.stateto becomeReady:kubectl -n <managedClusterProject> get kcc -o yaml
Verify your Ceph cluster as described in Verify Ceph.
Once all pools are created, verify that an appropriate secret required for a successful deployment of the OpenStack services that rely on Ceph is created in the
openstack-ceph-sharednamespace:kubectl -n openstack-ceph-shared get secrets openstack-ceph-keys
Example of a positive system response:
NAME TYPE DATA AGE openstack-ceph-keys Opaque 7 36m
Create a Ceph cluster using the web UI
Warning
Mirantis highly recommends adding a Ceph cluster using the CLI instead of the web UI.
The web UI capabilities for adding a Ceph cluster are limited and lack flexibility in defining Ceph cluster specifications. For example, if an error occurs while adding a Ceph cluster using the web UI, usually you can address it only through the CLI.
The web UI functionality for managing Ceph cluster is going to be deprecated in one of the following releases.
Log in to the Container Cloud web UI with the
m:kaas:namespace@operatororm:kaas:namespace@writerpermissions.Switch to the required project using the Switch Project action icon located on top of the main left-side navigation panel.
In the Clusters tab, click the required cluster name. The Cluster page with the Machines and Ceph clusters lists opens.
In the Ceph Clusters block, click Create Cluster.
Configure the Ceph cluster in the Create New Ceph Cluster wizard that opens:
Create new Ceph cluster¶ Section
Parameter name
Description
General settings
Name
The Ceph cluster name.
Cluster Network
Replication network for Ceph OSDs. Must contain the CIDR definition and match the corresponding values of the cluster
L2Templateobject or the environment network values.Public Network
Public network for Ceph data. Must contain the CIDR definition and match the corresponding values of the cluster
L2Templateobject or the environment network values.Enable OSDs LCM
Select to enable LCM for Ceph OSDs.
Machines / Machine #1-3
Select machine
Select the name of the Kubernetes machine that will host the corresponding Ceph node in the Ceph cluster.
Manager, Monitor
Select the required Ceph services to install on the Ceph node.
Devices
Select the disk that Ceph will use.
Warning
Do not select the device for system services, for example,
sda.Warning
A Ceph cluster does not support removable devices that are hosts with hotplug functionality enabled. To use devices as Ceph OSD data devices, make them non-removable or disable the hotplug functionality in the BIOS settings for disks that are configured to be used as Ceph OSD data devices.
Enable Object Storage
Select to enable the single-instance RGW Object Storage.
To add more Ceph nodes to the new Ceph cluster, click + next to any Ceph Machine title in the Machines tab. Configure a Ceph node as required.
Warning
Do not add more than 3
Managerand/orMonitorservices to the Ceph cluster.After you add and configure all nodes in your Ceph cluster, click Create.
Open the
KaaSCephClusterCR for editing as described in Ceph advanced configuration.Verify that the following snippet is present in the
KaaSCephClusterconfiguration:network: clusterNet: 10.10.10.0/24 publicNet: 10.10.11.0/24
Configure the pools for Image, Block Storage, and Compute services.
Note
Ceph validates the specified pools. Therefore, do not omit any of the following pools.
spec: pools: - default: true deviceClass: hdd name: kubernetes replicated: size: 3 role: kubernetes - default: false deviceClass: hdd name: volumes replicated: size: 3 role: volumes - default: false deviceClass: hdd name: vms replicated: size: 3 role: vms - default: false deviceClass: hdd name: backup replicated: size: 3 role: backup - default: false deviceClass: hdd name: images replicated: size: 3 role: images
Each Ceph pool, depending on its role, has a default
targetSizeRatiovalue that defines the expected consumption of the total Ceph cluster capacity. The default ratio values for MOSK pools are as follows:20.0% for a Ceph pool with role
volumes40.0% for a Ceph pool with role
vms10.0% for a Ceph pool with role
images10.0% for a Ceph pool with role
backup
Once all pools are created, verify that an appropriate secret required for a successful deployment of the OpenStack services that rely on Ceph is created in the
openstack-ceph-sharednamespace:kubectl -n openstack-ceph-shared get secrets openstack-ceph-keys
Example of a positive system response:
NAME TYPE DATA AGE openstack-ceph-keys Opaque 7 36m
Verify your Ceph cluster as described in Verify Ceph.
See also
Deploy OpenStack
This section instructs you on how to deploy OpenStack on top of Kubernetes as well as how to troubleshoot the deployment and access your OpenStack environment after deployment.
Deploy an OpenStack cluster
This section instructs you on how to deploy OpenStack on top of Kubernetes
using the OpenStack Controller (Rockoon) and
openstackdeployments.lcm.mirantis.com (OsDpl) CR.
To deploy an OpenStack cluster:
Verify that you have pre-configured the networking according to Networking.
Verify that the TLS certificates that will be required for the OpenStack cluster deployment have been pre-generated.
Note
The Transport Layer Security (TLS) protocol is mandatory on public endpoints.
Caution
To avoid certificates renewal with subsequent OpenStack updates during which additional services with new public endpoints may appear, we recommend using wildcard SSL certificates for public endpoints. For example,
*.it.just.works, whereit.just.worksis a cluster public domain.The sample code block below illustrates how to generate a self-signed certificate for the
it.just.worksdomain. The procedure presumes the cfssl and cfssljson tools are installed on the machine.mkdir cert && cd cert tee ca-config.json << EOF { "signing": { "default": { "expiry": "8760h" }, "profiles": { "kubernetes": { "usages": [ "signing", "key encipherment", "server auth", "client auth" ], "expiry": "8760h" } } } } EOF tee ca-csr.json << EOF { "CN": "kubernetes", "key": { "algo": "rsa", "size": 2048 }, "names":[{ "C": "<country>", "ST": "<state>", "L": "<city>", "O": "<organization>", "OU": "<organization unit>" }] } EOF cfssl gencert -initca ca-csr.json | cfssljson -bare ca tee server-csr.json << EOF { "CN": "*.it.just.works", "hosts": [ "*.it.just.works" ], "key": { "algo": "rsa", "size": 2048 }, "names": [ { "C": "US", "L": "CA", "ST": "San Francisco" }] } EOF cfssl gencert -ca=ca.pem -ca-key=ca-key.pem --config=ca-config.json -profile=kubernetes server-csr.json | cfssljson -bare server
Create the
openstackdeployment.yamlfile that will include the OpenStack cluster deployment configuration. For the configuration details, refer to OpenStack configuration and OpenStack Operator resources.Note
The resource of kind
OpenStackDeployment(OsDpl) is a custom resource defined by a resource of kindCustomResourceDefinition. The resource is validated with the help of the OpenAPI v3 schema.Configure the OsDpl resource depending on the needs of your deployment. For the configuration details, refer to OpenStack configuration.
Example of an OpenStackDeployment CR of minimum configuration¶apiVersion: lcm.mirantis.com/v1alpha1 kind: OpenStackDeployment metadata: name: openstack-cluster namespace: openstack spec: openstack_version: victoria preset: compute size: tiny internal_domain_name: cluster.local public_domain_name: it.just.works features: neutron: tunnel_interface: ens3 external_networks: - physnet: physnet1 interface: veth-phy bridge: br-ex network_types: - flat vlan_ranges: null mtu: null floating_network: enabled: False nova: live_migration_interface: ens3 images: backend: local
If required, enable huge pages and other supported Telco features as described in Advanced OpenStack configuration (optional).
To the
openstackdeploymentobject, add information about the TLS certificates:ssl:public_endpoints:ca_cert- CA certificate content (ca.pem)ssl:public_endpoints:api_cert- server certificate content (server.pem)ssl:public_endpoints:api_key- server private key (server-key.pem)
Verify that the Load Balancer network does not overlap your corporate or internal Kubernetes networks, for example, Calico IP pools. Also, verify that the pool of Load Balancer network is big enough to provide IP addresses for all Amphora VMs (
loadbalancers).If required, reconfigure the Octavia network settings using the following sample structure:
spec: services: load-balancer: octavia: values: octavia: settings: lbmgmt_cidr: "10.255.0.0/16" lbmgmt_subnet_start: "10.255.1.0" lbmgmt_subnet_end: "10.255.255.254"
If you are using the default backend to store OpenStack database backups, which is Ceph, you may want to increase the default size of the allocated storage since there is no automatic way to resize the backup volume once the cloud is deployed.
For the default sizes and configuration details, refer to Size of a backup storage.
Trigger the OpenStack deployment:
kubectl apply -f openstackdeployment.yaml
Monitor the status of your OpenStack deployment:
kubectl -n openstack get pods kubectl -n openstack describe osdpl osh-dev
Assess the current status of the OpenStack deployment using the
statussection output in the OsDpl resource:Get the OsDpl YAML file:
kubectl -n openstack get osdpl osh-dev -o yaml
Analyze the
statusoutput using the detailed description in OpenStack configuration.
Verify that the OpenStack cluster has been deployed:
clinet_pod_name=$(kubectl -n openstack get pods -l application=keystone,component=client | grep keystone-client | head -1 | awk '{print $1}') kubectl -n openstack exec -it $clinet_pod_name -- openstack service list
Example of a positive system response:
+----------------------------------+---------------+----------------+ | ID | Name | Type | +----------------------------------+---------------+----------------+ | 159f5c7e59784179b589f933bf9fc6b0 | cinderv3 | volumev3 | | 6ad762f04eb64a31a9567c1c3e5a53b4 | keystone | identity | | 7e265e0f37e34971959ce2dd9eafb5dc | heat | orchestration | | 8bc263babe9944cdb51e3b5981a0096b | nova | compute | | 9571a49d1fdd4a9f9e33972751125f3f | placement | placement | | a3f9b25b7447436b85158946ca1c15e2 | neutron | network | | af20129d67a14cadbe8d33ebe4b147a8 | heat-cfn | cloudformation | | b00b5ad18c324ac9b1c83d7eb58c76f5 | radosgw-swift | object-store | | b28217da1116498fa70e5b8d1b1457e5 | cinderv2 | volumev2 | | e601c0749ce5425c8efb789278656dd4 | glance | image | +----------------------------------+---------------+----------------+
Register a record on the customer DNS:
Caution
The DNS component is mandatory to access OpenStack public endpoints.
Obtain the full list of endpoints:
kubectl -n openstack get ingress -ocustom-columns=NAME:.metadata.name,HOSTS:spec.rules[*].host | awk '/namespace-fqdn/ {print $2}'
Example of system response:
barbican.<spec:public_domain_name> cinder.<spec:public_domain_name> cloudformation.<spec:public_domain_name> designate.<spec:public_domain_name> glance.<spec:public_domain_name> heat.<spec:public_domain_name> horizon.<spec:public_domain_name> keystone.<spec:public_domain_name> metadata.<spec:public_domain_name> neutron.<spec:public_domain_name> nova.<spec:public_domain_name> novncproxy.<spec:public_domain_name> octavia.<spec:public_domain_name> placement.<spec:public_domain_name>
Obtain the public endpoint IP:
kubectl -n openstack get services ingress
In the system response, capture
EXTERNAL-IP.Example of system response:
NAME TYPE CLUSTER-IP EXTERNAL-IP PORT(S) AGE ingress LoadBalancer 10.96.32.97 10.172.1.101 80:34234/TCP,443:34927/TCP,10246:33658/TCP 4h56m
Ask the customer to create records for public endpoints, obtained earlier in this procedure, to
EXTERNAL-IPfrom the Ingress service.
See also
Advanced OpenStack configuration (optional)
This section provides configuration details for available advanced MOSK features that include huge pages, CPU pinning, and other Enhanced Platform Awareness (EPA) capabilities.
Enable LVM ephemeral storage
TechPreview
Note
Consider this section as part of Deploy an OpenStack cluster.
This section instructs you on how to configure LVM as backend for the VM disks and ephemeral storage.
You can use flexible size units throughout bare metal host profiles:
Ki, Mi, Gi, and so on. For example, size: 100Mi or
size: 1.5Gi that will be serialized as 1536Mi. The size without units
is counted in bytes. For example, size: 120 means 120 bytes.
Warning
All data will be wiped during cluster deployment on devices
defined directly or indirectly in the fileSystems list of
BareMetalHostProfile. For example:
A raw device partition with a file system on it
A device partition in a volume group with a logical volume that has a file system on it
An mdadm RAID device with a file system on it
An LVM RAID device with a file system on it
The wipe field is always considered true for these devices.
The false value is ignored.
Therefore, to prevent data loss, move the necessary data from these file systems to another server beforehand, if required.
Warning
Usage of more than one nonvolatile memory express (NVMe) drive per node may cause update issues and is therefore not supported.
To enable LVM ephemeral storage:
In
BareMetalHostProfilein thespec:volumeGroupssection, add the following configuration for the OpenStack compute nodes:spec: devices: - device: byName: /dev/nvme0n1 minSize: 30Gi wipe: true partitions: - name: lvm_nova_vol size: 0 wipe: true volumeGroups: - devices: - partition: lvm_nova_vol name: nova-vol
For details about
BareMetalHostProfile, see Operations Guide: Create a custom host profile.Configure the
OpenStackDeploymentCR to deploy OpenStack with LVM ephemeral storage. For example:spec: features: nova: images: backend: lvm lvm: volume_group: "nova-vol"
Optional. Enable encryption for the LVM ephemeral storage by adding the following metadata in the
OpenStackDeploymentCR:spec: features: nova: images: encryption: enabled: true cipher: "aes-xts-plain64" key_size: 256
Caution
Both live and cold migrations are not supported for such instances.
Enable LVM block storage
TechPreview
Note
Consider this section as part of Deploy an OpenStack cluster.
This section instructs you on how to configure LVM as a backend for the OpenStack Block Storage service.
You can use flexible size units throughout bare metal host profiles:
Ki, Mi, Gi, and so on. For example, size: 100Mi or
size: 1.5Gi that will be serialized as 1536Mi. The size without units
is counted in bytes. For example, size: 120 means 120 bytes.
Warning
All data will be wiped during cluster deployment on devices
defined directly or indirectly in the fileSystems list of
BareMetalHostProfile. For example:
A raw device partition with a file system on it
A device partition in a volume group with a logical volume that has a file system on it
An mdadm RAID device with a file system on it
An LVM RAID device with a file system on it
The wipe field is always considered true for these devices.
The false value is ignored.
Therefore, to prevent data loss, move the necessary data from these file systems to another server beforehand, if required.
To enable LVM block storage:
Open
BareMetalHostProfilefor editing.In the
spec:volumeGroupssection, specify the following data for the OpenStack compute nodes. In the following example, we deploy a Cinder volume with LVM on compute nodes. However, you can use dedicated nodes for this purpose.spec: devices: - device: byName: /dev/nvme0n1 minSize: 30Gi wipe: true partitions: - name: lvm_cinder_vol size: 0 wipe: true volumeGroups: - devices: - partition: lvm_cinder_vol name: cinder-vol
For details about
BareMetalHostProfile, see Operations Guide: Create a custom host profile.Configure the
OpenStackDeploymentCR to deploy OpenStack with LVM block storage. For example:spec: nodes: rockoon-openstack-compute-node::enabled: features: cinder: volume: backends: lvm: lvm: volume_group: "cinder-vol"
Enable DPDK with OVS
Unsupported since MOSK 25.2
Note
Consider this section as part of Deploy an OpenStack cluster.
This section instructs you on how to enable DPDK with the Neutron OVS back end.
Warning
Usage of third-party software, which is not part of Mirantis-supported configurations, for example, the use of custom DPDK modules, may block upgrade of an operating system distribution. Users are fully responsible for ensuring the compatibility of such custom components with the latest supported Ubuntu version.
To enable DPDK with OVS:
Verify that your deployment meets the following requirements:
The required drivers have been installed on the host operating system.
Different Poll Mode Driver (PMD) types may require different kernel drivers to properly work with NIC. For more information about the DPDK drivers, read DPDK official documentation: Linux Drivers and Overview of Networking Drivers.
The DPDK NICs are not used on the host operating system.
The huge pages feature is enabled on the host. See Enable huge pages for OpenStack for details.
Enable DPDK in the OsDpl custom resource through the
node specific overridessettings. For example:spec: nodes: <NODE-LABEL>::<NODE-LABEL-VALUE>: features: neutron: dpdk: bridges: - ip_address: 10.12.2.80/24 name: br-phy driver: igb_uio enabled: true nics: - bridge: br-phy name: nic01 pci_id: "0000:05:00.0" tunnel_interface: br-phy
Enable SR-IOV with OVS
Note
Consider this section as part of Deploy an OpenStack cluster.
This section instructs you on how to enable SR-IOV with the Neutron OVS back end.
To enable SR-IOV with OVS:
Verify that your deployment meets the following requirements:
NICs with the SR-IOV support are installed
SR-IOV and VT-d are enabled in BIOS
Enable IOMMU in the kernel by configuring
intel_iommu=onin the GRUB configuration file. Specify the parameter for compute nodes inBareMetalHostProfilein thegrubConfigsection:spec: grubConfig: defaultGrubOptions: - 'GRUB_CMDLINE_LINUX="$GRUB_CMDLINE_LINUX intel_iommu=on"'
Configure the
OpenStackDeploymentCR to deploy OpenStack with the VLAN tenant network encapsulation.Caution
To ensure correct appliance of the configuration changes, configure VLAN segmentation during the initial OpenStack deployment.
Configuration example:
spec: features: neutron: external_networks: - bridge: br-ex interface: pr-floating mtu: null network_types: - flat physnet: physnet1 vlan_ranges: null - bridge: br-tenant interface: bond0 network_types: - vlan physnet: tenant vlan_ranges: 490:499,1420:1459 tenant_network_types: - vlan
Enable SR-IOV in the
OpenStackDeploymentCR through the node-specific overrides settings. For example:spec: nodes: <NODE-LABEL>::<NODE-LABEL-VALUE>: features: neutron: sriov: enabled: true nics: - device: enp10s0f1 num_vfs: 7 physnet: tenant
Enable BGP VPN
Unsupported since MOSK 25.2
Note
Consider this section as part of Deploy an OpenStack cluster.
The BGP VPN service is an extra OpenStack Neutron plugin that enables connection of OpenStack Virtual Private Networks with external VPN sites through either BGP/MPLS IP VPNs or E-VPN.
To enable the BGP VPN service:
Enable BGP VPN in the OsDpl custom resource through the
node specific overrides settings. For example:
spec:
features:
neutron:
bgpvpn:
enabled: true
route_reflector:
# Enable deploygin FRR route reflector
enabled: true
# Local AS number
as_number: 64512
# List of subnets we allow to connect to
# router reflector BGP
neighbor_subnets:
- 10.0.0.0/8
- 172.16.0.0/16
nodes:
rockoon-openstack-compute-node::enabled:
features:
neutron:
bgpvpn:
enabled: true
When the service is enabled, a route reflector is scheduled on nodes with
the openstack-frrouting: enabled label. Mirantis recommends collocating
the route reflector nodes with the OpenStack controller nodes. By default, two
replicas are deployed.
Encrypt the east-west traffic
TechPreview
Note
Consider this section as part of Deploy an OpenStack cluster.
MOSK allows configuring Internet Protocol Security (IPSec) encryption for the east-west tenant traffic between the OpenStack compute nodes and gateways. The feature uses the strongSwan open source IPSec solution. Authentication is accomplished through a pre-shared key (PSK). However, other authentication methods are upcoming.
To encrypt the east-west tenant traffic, enable ipsec in the
spec:features:neutron settings of the OpenStackDeployment CR:
spec:
features:
neutron:
ipsec:
enabled: true
Caution
Enabling IPSec adds extra headers to the tenant traffic. The header size varies depending on IPSec configuration.
Therefore, Mirantis recommends decreasing network MTU for virtual networks and reserve 73 bytes overhead for the worst-case scenario as described in Cisco documentation: Configuring IPSec VPN Fragmentation and MTU.
Enable Cinder backend for Glance
TechPreview
Note
Consider this section as part of Deploy an OpenStack cluster.
This section instructs you on how to configure Cinder backend for the for images through the OpenStackDeployment CR.
Note
This feature depends heavily on Cinder multi-attach, which enables you to simultaneously attach volumes to multiple instances. Therefore, only the block storage backends that support multi-attach can be used.
To configure a Cinder backend for Glance, define the backend identity in the OpenStackDeployment CR. This identity will be used as a name for the backend section in the Glance configuration file.
When defining the backend:
Configure one of the backends as default.
Configure each backend to use specific Cinder volume type.
Note
You can use the
cinder_volume_typeparameter instead ofbackend_name. If so, you have to create this volume type beforehand and take into account that the bootstrap script does not manage such volume types.
The blockstore identity definition example:
spec:
features:
glance:
backends:
cinder:
blockstore:
default: true
backend_name: <volume_type:volume_name>
# e.g. backend_name: lvm:lvm_store
spec:
features:
glance:
backends:
cinder:
blockstore:
default: true
cinder_volume_type: netapp
Enable Cinder volume encryption
TechPreview
Note
Consider this section as part of Deploy an OpenStack cluster.
This section instructs you on how to enable Cinder volume encryption
through the OpenStackDeployment CR using Linux Unified Key Setup (LUKS)
and store the encryption keys in Barbican. For details, see
Volume encryption.
To enable Cinder volume encryption:
In the
OpenStackDeploymentCR, specify the LUKS volume type and configure the required encryption parameters for the storage system to encrypt or decrypt the volume.The
volume_typesdefinition example:spec: services: block-storage: cinder: values: bootstrap: volume_types: volumes-hdd-luks: arguments: encryption-cipher: aes-xts-plain64 encryption-control-location: front-end encryption-key-size: 256 encryption-provider: luks volume_backend_name: volumes-hdd
To create an encrypted volume as a non-admin user and store keys in the Barbican storage, assign the
creatorrole to the user since the default Barbican policy allows only theadminorcreatorrole:openstack role add --project <PROJECT-ID> --user <USER-ID> --creator <CREATOR-ID> creator
Optional. To define an encrypted volume as a default one, specify
volumes-hdd-luksindefault_volume_typein the Cinder configuration:spec: services: block-storage: cinder: values: conf: cinder: DEFAULT: default_volume_type: volumes-hdd-luks
Advanced configuration for OpenStack compute nodes
Note
Consider this section as part of Deploy an OpenStack cluster.
The section describes how to perform advanced configuration for the OpenStack compute nodes. Such configuration can be required in some specific use cases, such as SR-IOV and huge pages features usage.
This section contains recommendations for configuration of an
OpenStackDeployment custom resource for the compute nodes
of the following types:
Compute nodes with the default configuration, without local NVMe storage and SR-IOV network interface cards (NICs)
Compute nodes with the NVMe local storage
Compute nodes with the SR-IOV NICs
Compute nodes with both the NVMe local storage and SR-IOV NICs
Note
If the local NVMe storage is enabled, Mirantis recommends using it and enable SR-IOV if possible.
Caution
Before using the NVMe local storage and mount point, define them
in BareMetalHostProfile. For example:
apiVersion: metal3.io/v1alpha1
kind: BareMetalHostProfile
...
spec:
devices:
...
- device:
byName: /dev/nvme0n1
minSizeGiB: 30
wipe: true
partitions:
- name: local-volumes-partition
sizeGiB: 0
wipe: true
...
fileSystems:
...
- fileSystem: ext4
partition: local-volumes-partition
# mountpoint for Nova images
mountPoint: /var/lib/nova
Note
If you mount the /var directory, review Mounting recommendations for the /var directory
before configuring BareMetalHostProfile.
Caution
To control the storage type (local NVMe or Ceph) for virtual machines, place a node into the OpenStack aggregate. For details, see OpenStack documentation: Host aggregates.
As defined in Node-specific configuration, each node with a non-default configuration
must be configured separately. Each Machine object must have a
configuration-specific label. For example, for a compute node with the local
NVMe storage:
apiVersion: cluster.k8s.io/v1alpha1
kind: Machine
...
spec:
providerSpec:
value:
nodeLabels:
- key: node-type
value: compute-nvme
Caution
The <NODE-LABEL> value must match one of the allowed labels
defined in the nodeLabels section of the Cluster object:
nodeLabels:
- key: <NODE-LABEL>
value: <NODE-LABEL-VALUE>
Mirantis recommends using node-type as the <NODE-LABEL> key. To view
the full list of allowed node labels:
kubectl \
-n <CLUSTER-NAMESPACE> \
get <CLUSTER-NAME> \
-o json \
| jq .status.providerStatus.releaseRefs.current.allowedNodeLabels
The list of node labels is read-only and cannot be modified.
For compute nodes with the SR-IOV NIC, use compute-sriov as the
node-type value of nodeLabels:
apiVersion: cluster.k8s.io/v1alpha1
kind: Machine
...
spec:
providerSpec:
value:
nodeLabels:
- key: node-type
value: compute-sriov
For compute nodes with the local NVMe storage and SR-IOV NICs, use the
compute-nvme-sriov as the node-type value of nodeLabels:
apiVersion: cluster.k8s.io/v1alpha1
kind: Machine
...
spec:
providerSpec:
value:
nodeLabels:
- key: node-type
value: compute-nvme-sriov
In the examples above, compute-sriov, compute-nvme-sriov, and
compute-nvme are human-readable string identifiers. You can use any unique
string value for each type of compute node.
In the OpenStackDeployment object of each node group, define its own
section that starts with <NODE-LABEL>::<NODE-LABEL-VALUE>::
apiVersion: lcm.mirantis.com/v1alpha1
kind: OpenStackDeployment
...
spec:
...
nodes:
node-type::compute-nvme:
features:
nova:
images:
backend: local
node-type::compute-sriov:
features:
neutron:
sriov:
enabled: true
nics:
- device: enp10s0f1
num_vfs: 7
physnet: tenant
node-type::compute-nvme-sriov:
features:
nova:
images:
backend: local
neutron:
sriov:
enabled: true
nics:
- device: enp10s0f1
num_vfs: 7
physnet: tenant
Note
Consider this section as part of Deploy an OpenStack cluster.
Mirantis OpenStack for Kubernetes (MOSK) enables you to configure the
vCPU model for all instances managed by the OpenStack Compute service (Nova)
using the following osdpl definition:
spec:
features:
nova:
vcpu_type: host-model
For the supported values and configuration examples, see Virtual CPU.
Note
Consider this section as part of Deploy an OpenStack cluster.
Note
The instruction provided in this section applies to both OpenStack with OVS and OpenStack with Tungsten Fabric topologies.
The huge pages OpenStack feature provides essential performance improvements
for applications that are highly memory IO-bound. Huge pages should be enabled
on a per compute node basis. By default, NUMATopologyFilter is enabled.
To activate the feature, you need to enable huge pages on the dedicated bare metal host as described in Enable huge pages in a host profile during the predeployment bare metal configuration.
Note
The multi-size huge pages are not fully supported by Kubernetes versions before 1.19. Therefore, define only one size in kernel parameters.
CPU isolation is a way to force the system scheduler to use only some logical CPU cores for processes. For compute hosts, you should typically isolate system processes and virtual guests on different cores.
For a compute node running Ubuntu 22.04 and newer supporting cgroup v2, use the cpushield HOC module to configure the CPU isolation. For the procedure, refer to Host operating system configuration.
Note
Consider this section as part of Deploy an OpenStack cluster.
The majority of CPU topologies features are activated by NUMATopologyFilter
that is enabled by default. Such features do not require any further service
configuration and can be used directly on a vanilla MOSK
deployment. The list of the CPU topologies features includes, for example:
NUMA placement policies
CPU pinning policies
CPU thread pinning policies
CPU topologies
To enable libvirt CPU pinning through the node-specific overrides in the
OpenStackDeployment custom resource, use the following sample
configuration structure:
spec:
nodes:
<NODE-LABEL>::<NODE-LABEL-VALUE>:
services:
compute:
nova:
nova_compute:
values:
conf:
nova:
compute:
cpu_dedicated_set: 2-17
cpu_shared_set: 18-47
Note
Consider this section as part of Deploy an OpenStack cluster.
The Peripheral Component Interconnect (PCI) passthrough feature in OpenStack allows full access and direct control over physical PCI devices in guests. The mechanism applies to any kind of PCI devices including a Network Interface Card (NIC), Graphics Processing Unit (GPU), and any other device that can be attached to a PCI bus. The only requirement for the guest to properly use the device is to correctly install the driver.
To enable PCI passthrough in a MOSK deployment:
For Linux X86 compute nodes, verify that the following features are enabled on the host:
VT-d in BIOS
IOMMU on the host operating system as described in Enable SR-IOV with OVS.
Configure the
nova-apiservice that is scheduled on OpenStack controllers nodes. To generate the alias for PCI innova.conf, add the alias configuration through theOpenStackDeploymentCR.Note
When configuring PCI with SR-IOV on the same host, the values specified in
aliastake precedence. Therefore, add the SR-IOV devices topassthrough_whitelistexplicitly.For example:
spec: services: compute: nova: values: conf: nova: pci: alias: '{ "vendor_id":"8086", "product_id":"154d", "device_type":"type-PF", "name":"a1" }'
Configure the
nova-computeservice that is scheduled on OpenStack compute nodes. To enable Nova to pass PCI devices to virtual machines, configure thepassthrough_whitelistsection innova.confthrough the node-specific overrides in theOpenStackDeploymentCR. For example:spec: nodes: <NODE-LABEL>::<NODE-LABEL-VALUE>: services: compute: nova: nova_compute: values: conf: nova: pci: alias: '{ "vendor_id":"8086", "product_id":"154d", "device_type":"type-PF", "name":"a1" }' passthrough_whitelist: | [{"devname":"enp216s0f0","physical_network":"sriovnet0"}, { "vendor_id": "8086", "product_id": "154d" }]
Available since MOSK 23.1
MOSK enables you to configure initial oversubscription
through the OpenStackDeployment custom resource. For configuration details
and oversubscription considerations, refer to
Configuring initial resource oversubscription.
By default, the following values are applied:
8.0for the number of CPUs1.6for the disk space1.0for the amount of RAMNote
In MOSK 22.5 and earlier, the effective default value of RAM allocation ratio is
1.1.
Changing oversubscription configuration after deployment will only affect the newly added compute nodes and will not change oversubscription for already existing compute nodes. You can change oversubscription for existing compute nodes through the placement API as described in Change oversubscription settings for existing compute nodes.
Note
Consider this section as part of Deploy an OpenStack cluster.
Hyperconverged architecture combines OpenStack compute nodes along with Ceph nodes. To avoid nodes overloading, which can cause Ceph performance degradation and outage, limit the hardware resources consumption by the OpenStack compute services.
You can reserve hardware resources for non-workload related consumption using
the following nova-compute parameters. For details, see
OpenStack documentation: Overcommitting CPU and RAM
and OpenStack documentation: Configuration Options.
cpu_allocation_ratio- in case of a hyperconverged architecture, the value depends on the number of vCPU used for non-workload related operations, total number of vCPUs of a hyperconverged node, and on workload vCPU consumption:cpu_allocation_ratio = (${vCPU_count_on_a_hyperconverged_node} - ${vCPU_used_for_non_OpenStack_related_tasks}) / ${vCPU_count_on_a_hyperconverged_node} / ${workload_vCPU_utilization}To define the vCPU count used for non-OpenStack related tasks, use the following formula, considering the storage data plane performance tests:
vCPU_used_for_non-OpenStack_related_tasks = 2 * SSDs_per_hyperconverged_node + 1 * Ceph_OSDs_per_hyperconverged_node + 0.8 * Ceph_OSDs_per_hyperconverged_node
Consider the following example with 5 SSD disks for Ceph OSDs per hyperconverged node and 2 Ceph OSDs per disk:
vCPU_used_for_non-OpenStack_related_tasks = 2 * 5 + 1 * 10 + 0.8 * 10 = 28
In this case, if there are 40 vCPUs per hyperconverged node, 28 vCPUs are required for non-workload related calculations, and a workload consumes 50% of the allocated CPU time:
cpu_allocation_ratio = (40-28) / 40 / 0.5 = 0.6.
reserved_host_memory_mb- a dedicated variable in the OpenStack Nova configuration, to reserve memory for non-OpenStack related VM activities:reserved_host_memory_mb = 13 GB * Ceph_OSDs_per_hyperconverged_node
For example for 10 Ceph OSDs per hyperconverged node:
reserved_host_memory_mb = 13 GB * 10 = 130 GB = 133120
ram_allocation_ratio- the allocation ratio of virtual RAM to physical RAM. To completely exclude the possibility of memory overcommitting, set to1.
To limit HW resources for hyperconverged OpenStack compute nodes:
In the OpenStackDeployment CR, specify the cpu_allocation_ratio,
ram_allocation_ratio, and reserved_host_memory_mb parameters as
required using the calculations described above.
For example:
apiVersion: lcm.mirantis.com/v1alpha1
kind: OpenStackDeployment
spec:
services:
compute:
nova:
values:
conf:
nova:
DEFAULT:
cpu_allocation_ratio: 0.6
ram_allocation_ratio: 1
reserved_host_memory_mb: 133120
Note
For an existing OpenStack deployment:
Obtain the name of your
OpenStackDeploymentCR:kubectl -n openstack get osdpl
Open the
OpenStackDeploymentCR for editing and specify the parameters as required.kubectl -n openstack edit osdpl <osdpl name>
Available since MOSK 24.1 TechPreview
This section delves into virtual GPU configuration. It is specifically tailored for NVIDIA physical GPUs, with a focus on the A100 40GB GPU and NVIDIA AIE 4.1 drivers.
While setup procedures may vary among different cards and vendors, MOSK can generally ensure compatibility between the MOSK Compute service (Nova) and vGPU functionality, as long as the drivers for the physical GPU expose an VFIO mdev-compatible interface to the Linux host.
For configuration specifics of other physical GPUs, refer to the official documentation provided by the vendor.
Visit NVIDIA AI Enterprise documentation for comprehensive guidance on how to download the required drivers.
Also, if you have access to the NVIDIA NGC Catalog, search for the latest Infra Release that provides NVIDIA vGPU Host Driver there.
NVIDIA licensing
To fully utilize the capabilities of NVIDIA GPU virtualization, you may need to set up and configure the NVIDIA licensing server.
To install the acquired drivers within your cluster, add a custom
postDeployScript script to the custom BareMetalHostProfile object
used for the compute nodes with GPUs.
Note
For the instruction on how to create a BareMetalHostProfile
object, refer to Operations Guide: Create a custom host profile.
This script must solve the following tasks:
Download and install the drivers, if needed
Configure physical GPU according to your cluster requirements
Configure a startup task to reconfigure the physical GPU after node reboots.
Example postDeployScript script:
#!/bin/bash -ex
# Create a one time script that will initialize physical GPU right now and self-destruct
cat << EOF > /root/test_postdeploy_job.sh
#!/bin/bash -ex
systemctl enable initialize-vgpu
systemctl start --no-block initialize-vgpu
crontab -l | grep -v test_postdeploy_job.sh | crontab -
rm /root/test_postdeploy_job.sh
EOF
mkdir -p /var/spool/cron/crontabs/ && echo "*/1 * * * * sudo /root/test_postdeploy_job.sh >> /var/log/test_postdeploy_job.log 2>&1" >> /var/spool/cron/crontabs/root
chmod +x /root/test_postdeploy_job.sh
# Create a systemd unit that will re-initialize physical GPU on restart
cat << EOF > /etc/systemd/system/initialize-vgpu.service
[Unit]
Description=Configure VGPU
After=systemd-modules-load.service
[Service]
Type=oneshot
ExecStart=/root/initialize_vgpu.sh
RemainAfterExit=true
StandardOutput=journal
[Install]
RequiredBy=multi-user.target
EOF
cat << EOF > /root/initialize_vgpu.sh
#!/bin/bash
set -ex
while ! docker inspect ucp-kubelet;
do echo "Waiting lcm-agent is finished.";
sleep 1;
done
# Download and install the driver, dependencies and tools
if [[ ! -f /root/nvidia-vgpu-ubuntu-aie-535_535.129.03_amd64.deb ]]; then
apt update
apt install -y dkms unzip gcc libc-dev make linux-headers-$(uname -r) pciutils lshw mdevctl
wget https://my.intra.net//root/gpu-driver-x-y-z.deb -O /root/gpu-driver-x-y-z.deb
apt install /root/gpu-driver-x-y-z.deb
systemctl enable initialize-vgpu
fi
systemctl restart nvidia-vgpud.service
# Enable SR-IOV mode for the pGPU
/usr/lib/nvidia/sriov-manage -e <PCI-ADDRESS-OF-NVIDIA-CARD>
# Enable MIG mode for pGPU
nvidia-smi -i 0 -mig 1
systemctl enable nvidia-vgpu-mgr.service
systemctl start nvidia-vgpu-mgr.service
EOF
chmod +x /root/initialize_vgpu.sh
Virtual GPU types are similar to compute flavors as they determine the resources allocated to each virtual GPU. This allows for efficient allocation and optimization of GPU resources in virtualized environments.
Each physical GPU has a maximum number of virtual GPUs of a specific type that can be created on it, with no possibility for overallocation. In the time-sliced vGPU configuration, each particular physical GPU can only instantiate vGPUs of the same selected type. In the Multi-Instance GPU (MIG), a single physical GPU may be partitioned into several differently sized virtual GPUs.
Either way, prior to accepting workloads, Mirantis recommends determining the virtual GPU types that each of your physical GPU will provide. Altering these settings afterward necessitates terminating every virtual machine currently running on the physical GPU intended for reconfiguration or repurposing for another virtual GPU type.
This section outlines the process for partitioning physical GPUs into Multi-Instance GPUs (MIG) using the nvidia-smi tool provided by the NVIDIA Host GPU driver.
To list available virtual GPU instance profiles:
nvidia-smi mig -lgip
Example system response:
+-----------------------------------------------------------------------------+
| GPU instance profiles: |
| GPU Name ID Instances Memory P2P SM DEC ENC |
| Free/Total GiB CE JPEG OFA |
|=============================================================================|
| 0 MIG 1g.5gb 19 7/7 4.75 No 14 0 0 |
| 1 0 0 |
+-----------------------------------------------------------------------------+
| 0 MIG 1g.5gb+me 20 1/1 4.75 No 14 1 0 |
| 1 1 1 |
+-----------------------------------------------------------------------------+
| 0 MIG 1g.10gb 15 4/4 9.75 No 14 1 0 |
| 1 0 0 |
+-----------------------------------------------------------------------------+
| 0 MIG 2g.10gb 14 3/3 9.75 No 28 1 0 |
| 2 0 0 |
+-----------------------------------------------------------------------------+
| 0 MIG 3g.20gb 9 2/2 19.62 No 42 2 0 |
| 3 0 0 |
+-----------------------------------------------------------------------------+
| 0 MIG 4g.20gb 5 1/1 19.62 No 56 2 0 |
| 4 0 0 |
+-----------------------------------------------------------------------------+
| 0 MIG 7g.40gb 0 1/1 39.50 No 98 5 0 |
| 7 1 1 |
+-----------------------------------------------------------------------------+
To create seven, which is a maximum possible amount of instances according to the system response above, MIG vGPUs of the smallest size:
nvidia-smi mig -cgi 19,19,19,19,19,19,19
To create three differently sized vGPUs of 4g.20gb, 2g.10gb, and
1g.5gb sizes:
nvidia-smi mig -cgi 5,14,19
Caution
Keep in mind that not all combinations of differently sized vGPU instances are supported. Additionally, the order in which you create vGPUs is important.
For example configurations, see NVIDIA documentation.
To correctly configure the MOSK Compute service, you need to correlate the following naming schemes related to virtual GPU types:
The GPU instance profile as reported by nvidia-smi mig. For example,
MIG 1g.5gb.The vGPU type as reported by the driver. For example,
GRID A100-1-5C.The mdev class that corresponds to the vGPU type. For example,
nvidia-474.
For the compatibility between GPU instance profiles and virtual GPU types, refer to NVIDIA documentation: Virtual GPU Types for Supported GPUs.
To determine the mdev class supported by a specific virtual GPU type listed by a PCI device address, verify the output of the mdevctl types command executed on the compute node that has a physical GPU available on it:
mdevctl types
Example system response for MIGs:
0000:42:00.4
nvidia-1053
Available instances: 0
Device API: vfio-pci
Name: GRID A100-1-10C
Description: num_heads=1, frl_config=60, framebuffer=10240M, max_resolution=4096x2400, max_instance=4
...
nvidia-474
Available instances: 1
Device API: vfio-pci
Name: GRID A100-1-5C
Description: num_heads=1, frl_config=60, framebuffer=5120M, max_resolution=4096x2400, max_instance=7
...
The Name field from the example system output above corresponds to the
supported virtual GPU type, linking the GPU instance profile with the mdev class
supported by your physical GPU.
In the example above, the MIG 1g.5gb GPU instance profile corresponds
to the GRID A100-1-5C vGPU type as per NVIDIA documentation, and according
to the mdevctl types` output, it corresponds to the nvidia-474
mdev class.
Note
Notice that Available instances is zero for vGPU types that are
not actually supported by this given card and configuration. For MIGs,
the Available instances will be non-zero only for the virtual GPU types
for which the MIG virtual GPU instances have already been created. See
Partition to Multi-Instance GPUs.
The parameters you need to define for the nova-compute service on each
compute node with physical GPUs you want to expose as virtual GPUs include:
[devices]enabled_mdev_typesRequired. List of the mdev classes, see the previous step for details.
[devices]cleanup_mdev_devicesOptional. By default, the Compute service does not delete created mdev devices but reuses them instead. While this speeds up processes, it may pose challenges when reconfiguring the
enabled_mdev_typesparameter. Setcleanup_mdev_devicestoTruefor the Compute service to auto-delete created mdev devices upon instance deletion.
If you plan to use only time-sliced vGPUs and provide a single virtal GPU type
across the entire cloud, you only need to configure the options mentioned
above once globally for all compute nodes through the spec.services section
of the OpenStackDeployment custom resource.
With the configuration below, the Compute service will auto-detect all PCI
devices that provide this mdev type and automatically create required resource
providers in the placement service with the resource class VGPU.
Example configuration for the nvidia-474 mdev type:
kind: OpenStackDeployment
spec:
services:
compute:
nova:
values:
conf:
nova:
devices:
enabled_mdev_types: nvidia-474
cleanup_mdev_devices: true
If you plan to provide multiple time-sliced vGPU types, simplify the
configuration by grouping the nodes based on a node label (not necessarily
aggregates). Ensure that each group exposes only one mdev type using the
Node-specific configuration settings. Additionally, use custom resource classes to
facilitate flavor creation, ensuring consistent use of the CUSTOM_ prefix
for custom mdev_class.
For example, if you want to provide the nvidia-474 and nvidia-475 mdev
types, label your nodes with the vgpu-type=nvidia-474 and
vgpu-type=nvidia-475 labels and use the following node-specific settings:
kind: OpenStackDeployment
spec:
nodes:
vgpu-type::nvidia-474:
services:
compute:
nova:
nova_compute:
values:
conf:
nova:
devices:
enabled_mdev_types: nvidia-474
cleanup_mdev_devices: true
mdev_nvidia-474:
mdev_class: CUSTOM_VGPU_A100_1_5C
vgpu-type::nvidia-475:
services:
compute:
nova:
nova_compute:
values:
conf:
nova:
devices:
enabled_mdev_types: nvidia-475
cleanup_mdev_devices: true
mdev_nvidia-475:
mdev_class: CUSTOM_VGPU_A100_2_10C
The configuration above creates corresponding resource providers in the
placement service that provide CUSTOM_VGPU_A100_1_5C or
CUSTOM_VGPU_A100_2_10C resources.
You can use these resources during the definition of flavors for instances
with corresponding vGPU types.
In some cases, you may need to provide different vGPU types from a single compute node, for example, if the compute node has 2 physical GPUs and you want to create two different types of vGPU on them. For such scenarios, you should provide explicit PCI device addresses of these physical GPUs in the settings. This makes such configuration verbose in heterogeneous hardware environments where physical GPUs have different PCI addresses on each node. For example, when targeting node-specific settings by node name:
kind: OpenStackDeployment
spec:
nodes:
kubernetes.io/hostname::kaas-node-7af9aab1-596d-4ba3-a717-846653aa441a:
services:
compute:
nova:
nova_compute:
values:
conf:
nova:
devices:
enabled_mdev_types: nvidia-474,nvidia-475
cleanup_mdev_devices: true
mdev_nvidia-474:
device_addresses: 0000:42:00.0
mdev_class: CUSTOM_VGPU_A100_1_5C
mdev_nvidia-475:
device_addresses: 0000:43:00.0
mdev_class: CUSTOM_VGPU_A100_2_10C
In the SR-IOV mode, the driver typically creates more virtual functions than the maximum capacity of the physical GPU, even for the smallest virtual GPU type. Each virtual function can hold only one single virtual GPU. This leads to resource over-reporting to the placement service.
Therefore, to ensure efficient resource allocation and utilization within a homogeneous hardware environment, assuming that each compute node in it has the same PCI address for the physical GPU and the physical GPU has been partitioned to the MIG GPU instances identically:
Identify the number of instances created of each MIG profile.
Select random but not overlapping sets of PCI addresses from the list of virtual functions of the physical GPU. The amount of addresses in each set must correspond to the number of instances created of each MIG profile.
Assign the mdev type to the selected devices.
For example, for the environment with the following configuration:
3 MIG instances of
MIG 1.5gband 2 MIG instances ofMIG 2.10gb16 virtual functions created for the physical GPU with the PCI address range from
0000:42:00.0to0000:42:01.7
Pick 3 and 2 random PCI addresses from that pool and assign them to
CUSTOM_VGPU_A100_1_5C and CUSTOM_VGPU_A100_2_10C mdev classes
respectively:
spec:
services:
compute:
nova:
values:
conf:
nova:
devices:
enabled_mdev_types: nvidia-474,nvidia-475
cleanup_mdev_devices: true
mdev_nvidia-474:
device_addresses: 0000:42:00.0,0000:42:00.1,0000:42:00.2
mdev_class: CUSTOM_VGPU_A100_1_5C
mdev_nvidia-475:
device_addresses: 0000:42:01.0,0000:42:01.1
mdev_class: CUSTOM_VGPU_A100_2_10C
In a heterogeneous hardware environment, use node-specific settings to group nodes with the same PCI addresses and intended vGPU configuration, or use explicit setting for each node targeting node-specific settings to every node, sequentially if needed.
This section provides guidelines for verifying that virtual GPUs are correctly accounted for in the OpenStack Placement service, ensuring proper scheduling of instances that utilize virtual GPUs.
Firstly, verify that resource providers have been created with accurate
inventories. For each PCI device associated with a virtual GPU, including
virtual instances in the case of MIG/SR-IOV, there should be a nested resource
provider under the resource provider of the corresponding compute node.
The name of this nested resource provider should follow the format
<node-name>_pci_<pci-address-with-underscores>:
openstack resource provider list --resource CUSTOM_VGPU_A100_1_5C=1 -f yaml
Example system response:
- generation: 1
name: kaas-node-9d18b7c8-7ea8-4b13-abe9-0e76ee8db596.kaas-kubernetes-294cbb1cbf084789b931ebc54d3f9b05_pci_0000_42_00_4
parent_provider_uuid: c922488b-69eb-42a8-afad-dc7d3d56b8fd
root_provider_uuid: c922488b-69eb-42a8-afad-dc7d3d56b8fd
uuid: 963bb3ce-3ed1-421f-a186-a808c3460c48
...
Also, examine the inventory of each resource provider. It should exclusively
consist of the VGPU resource or any custom resource name configured in
the Compute service settings. The total capacity of the resource should match
the capacity reported by the mdevctl types output, reflecting the
capabilities of the PCI device for the specified mdev class. In the case
of MIG, this total capacity will always be 1.
openstack resource provider inventory list 963bb3ce-3ed1-421f-a186-a808c3460c48 -f yaml
Example system response:
- allocation_ratio: 1.0
max_unit: 1
min_unit: 1
reserved: 0
resource_class: CUSTOM_VGPU_A100_1_5C
step_size: 1
total: 1
used: 0
This section provides instructions for creating a flavor that requests a specific virtual GPU resource, using the mdev classes configured in the Compute service and registered in the placement service.
To create the flavor, use the openstack flavor create command.
Ensure that the flavor properties match the configured mdev classes in the
Compute service. For example, to request one vGPU of type nvidia-474 using
the resource class from the previous examples:
openstack flavor create --ram 1024 --vcpus 2 --disk 5 --property resources:CUSTOM_VGPU_A100_1_5C=1
Replace the --property resources:CUSTOM_VGPU_A100_1_5C=1 parameter with the
appropriate property matching the desired virtual GPU type and quantity.
Once the flavor is created, you can start launching instances using the created flavor as usual.
Enable image signature verification
Deprecated since MOSK 25.2
Note
Consider this section as part of Deploy an OpenStack cluster.
Mirantis OpenStack for Kubernetes (MOSK) enables you to perform image signature verification when booting an OpenStack instance, uploading a Glance image with signature metadata fields set, and creating a volume from an image.
To enable signature verification, use the following osdpl definition:
spec:
features:
glance:
signature:
enabled: true
When enabled during initial deployment, all internal images such as Amphora, Ironic, and test (CirrOS, Fedora, Ubuntu) images, will be signed by a self-signed certificate.
Configure LoadBalancer for PowerDNS
Note
Consider this section as part of Deploy an OpenStack cluster.
Mirantis OpenStack for Kubernetes (MOSK) allows configuring
LoadBalancer for the Designate PowerDNS backend. For example, you can expose a
TCP port for zone transferring using the following exemplary osdpl
definition:
spec:
designate:
backend:
external_ip: 10.172.1.101
protocol: udp
type: powerdns
For the supported values, see LoadBalancer type for PowerDNS.
Access OpenStack after deployment
This section contains the guidelines on how to access your MOSK OpenStack environment.
Configure DNS to access OpenStack
DNS is a mandatory component for MOSK deployment, all records must be created on the customer DNS server. The OpenStack services are exposed through the Ingress NGINX controller.
Warning
This document describes how to temporarily configure DNS. The workflow contains non-permanent changes that will be rolled back during a managed cluster update or reconciliation loop. Therefore, proceed at your own risk.
To configure DNS to access your OpenStack environment:
Obtain the external IP address of the Ingress service:
kubectl -n openstack get services ingress
Example of system response:
NAME TYPE CLUSTER-IP EXTERNAL-IP PORT(S) AGE ingress LoadBalancer 10.96.32.97 10.172.1.101 80:34234/TCP,443:34927/TCP,10246:33658/TCP 4h56m
Select from the following options:
If you have a corporate DNS server, update your corporate DNS service and create appropriate DNS records for all OpenStack public endpoints.
To obtain the full list of public endpoints:
kubectl -n openstack get ingress -ocustom-columns=NAME:.metadata.name,HOSTS:spec.rules[*].host | awk '/namespace-fqdn/ {print $2}'
Example of system response:
barbican.it.just.works cinder.it.just.works cloudformation.it.just.works designate.it.just.works glance.it.just.works heat.it.just.works horizon.it.just.works keystone.it.just.works neutron.it.just.works nova.it.just.works novncproxy.it.just.works octavia.it.just.works placement.it.just.works
If you do not have a corporate DNS server, perform one of the following steps:
Add the appropriate records to
/etc/hostslocally. For example:10.172.1.101 barbican.it.just.works 10.172.1.101 cinder.it.just.works 10.172.1.101 cloudformation.it.just.works 10.172.1.101 designate.it.just.works 10.172.1.101 glance.it.just.works 10.172.1.101 heat.it.just.works 10.172.1.101 horizon.it.just.works 10.172.1.101 keystone.it.just.works 10.172.1.101 neutron.it.just.works 10.172.1.101 nova.it.just.works 10.172.1.101 novncproxy.it.just.works 10.172.1.101 octavia.it.just.works 10.172.1.101 placement.it.just.works
Deploy your DNS server on top of Kubernetes:
Deploy a standalone CoreDNS server by including the following configuration into
coredns.yaml:apiVersion: lcm.mirantis.com/v1alpha1 kind: HelmBundle metadata: name: coredns namespace: osh-system spec: repositories: - name: hub_stable url: https://charts.helm.sh/stable releases: - name: coredns chart: hub_stable/coredns version: 1.8.1 namespace: coredns values: image: repository: mirantis.azurecr.io/openstack/extra/coredns tag: "1.6.9" isClusterService: false servers: - zones: - zone: . scheme: dns:// use_tcp: false port: 53 plugins: - name: cache parameters: 30 - name: errors # Serves a /health endpoint on :8080, required for livenessProbe - name: health # Serves a /ready endpoint on :8181, required for readinessProbe - name: ready # Required to query kubernetes API for data - name: kubernetes parameters: cluster.local - name: loadbalance parameters: round_robin # Serves a /metrics endpoint on :9153, required for serviceMonitor - name: prometheus parameters: 0.0.0.0:9153 - name: forward parameters: . /etc/resolv.conf - name: file parameters: /etc/coredns/it.just.works.db it.just.works serviceType: LoadBalancer zoneFiles: - filename: it.just.works.db domain: it.just.works contents: | it.just.works. IN SOA sns.dns.icann.org. noc.dns.icann.org. 2015082541 7200 3600 1209600 3600 it.just.works. IN NS b.iana-servers.net. it.just.works. IN NS a.iana-servers.net. it.just.works. IN A 1.2.3.4 *.it.just.works. IN A 1.2.3.4
Update the public IP address of the Ingress service:
sed -i 's/1.2.3.4/10.172.1.101/' coredns.yaml kubectl apply -f coredns.yaml
Verify that the DNS resolution works properly:
Assign an external IP to the service:
kubectl -n coredns patch service coredns-coredns --type='json' -p='[{"op": "replace", "path": "/spec/ports", "value": [{"name": "udp-53", "port": 53, "protocol": "UDP", "targetPort": 53}]}]' kubectl -n coredns patch service coredns-coredns --type='json' -p='[{"op": "replace", "path": "/spec/type", "value":"LoadBalancer"}]'
Obtain the external IP address of CoreDNS:
kubectl -n coredns get service coredns-coredns
Example of system response:
NAME TYPE CLUSTER-IP EXTERNAL-IP PORT(S) AGE coredns-coredns ClusterIP 10.96.178.21 10.172.1.102 53/UDP,53/TCP 25h
Point your machine to use the correct DNS. It is
10.172.1.102in the example system response above.If you plan to launch Tempest tests or use the OpenStack client from a
keystone-client-XXXpod, verify that the Kubernetes built-in DNS service is configured to resolve your public FQDN records by adding your public domain toCorefile. For example, to add theit.just.worksdomain:kubectl -n kube-system get configmap coredns -oyaml
Example of system response:
apiVersion: v1 data: Corefile: | .:53 { errors health ready kubernetes cluster.local in-addr.arpa ip6.arpa { pods insecure fallthrough in-addr.arpa ip6.arpa } prometheus :9153 forward . /etc/resolv.conf cache 30 loop reload loadbalance } it.just.works:53 { errors cache 30 forward . 10.96.178.21 }
Access your OpenStack environment
This section explains how to access your OpenStack environment as admin user.
Before you proceed, make sure that you can access the Kubernetes API and have
privileges to read secrets from the openstack-external namespace in
Kubernetes or you are able to exec to the pods in the openstack
namespace.
You can use the built-in admin CLI client and execute the openstack
commands from a dedicated pod deployed in the openstack namespace:
kubectl -n openstack exec \
$(kubectl -n openstack get pod -l application=keystone,component=client -ojsonpath='{.items[*].metadata.name}') \
-ti -- bash
This pod has python-openstackclient and all required plugins already
installed. The python-openstackclient command-line client is configured
to use the admin user credentials. You can view the detailed configuration
for the openstack command in /etc/openstack/clouds.yaml file in
the pod.
Configure the external DNS resolution for OpenStack services as described in Configure DNS to access OpenStack.
Obtain the admin user credentials from the
openstack-identity-credentialssecret in theopenstack-externalnamespace:kubectl -n openstack-external get secrets openstack-identity-credentials -o jsonpath='{.data.clouds\.yaml}' | base64 -d
Example of a system response:
clouds: admin: auth: auth_url: https://keystone.it.just.works/ password: <ADMIN_PWD> project_domain_name: <ADMIN_PROJECT_DOMAIN> project_name: <ADMIN_PROJECT> user_domain_name: <ADMIN_USER_DOMAIN> username: <ADMIN_USER_NAME> endpoint_type: public identity_api_version: 3 interface: public region_name: CustomRegion admin-system: auth: auth_url: https://keystone.it.just.works/ password: <ADMIN_PWD> system_scope: all user_domain_name: <ADMIN_USER_DOMAIN> username: <ADMIN_USER_NAME> endpoint_type: public identity_api_version: 3 interface: public region_name: CustomRegion
Access Horizon through your browser using its public service. For example,
https://horizon.it.just.works.To log in, specify the user name and domain name obtained in previous step from the
<ADMIN_USER_NAME>and<ADMIN_USER_DOMAIN>values.If the OpenStack Identity service has been deployed with the OpenID Connect integration:
From the Authenticate using drop-down menu, select OpenID Connect.
Click Connect. You will be redirected to your identity provider to proceed with the authentication.
Note
If OpenStack has been deployed with self-signed TLS certificates for public endpoints, you may get a warning about an untrusted certificate. To proceed, allow the connection.
To be able to access your OpenStack environment through the CLI,
you need to configure the openstack client environment
using either an openstackrc environment file or clouds.yaml file.
Log in to Horizon as described in Access an OpenStack environment through Horizon.
Download the
openstackrcfile from the web UI.On any shell from which you want to run OpenStack commands, source the environment file for the respective project.
Obtain
clouds.yaml:mkdir -p ~/.config/openstack kubectl -n openstack-external get secrets openstack-identity-credentials -o jsonpath='{.data.clouds\.yaml}' | base64 -d > ~/.config/openstack/clouds.yaml
The OpenStack client looks for
clouds.yamlin the following locations: current directory,~/.config/openstack, and/etc/openstack.Export the
OS_CLOUDenvironment variable:export OS_CLOUD=admin
Now, you can use the openstack CLI as usual. For example:
openstack user list
Example of an expected system response:
+----------------------------------+-----------------+
| ID | Name |
+----------------------------------+-----------------+
| dc23d2d5ee3a4b8fae322e1299f7b3e6 | internal_cinder |
| 8d11133d6ef54349bd014681e2b56c7b | admin |
+----------------------------------+-----------------+
Note
If OpenStack was deployed with self-signed TLS certificates for public endpoints, you may need to use the openstack command-line client with certificate validation disabled. For example:
openstack --insecure user list
Troubleshoot an OpenStack deployment
This section provides the general debugging instructions for your OpenStack on Kubernetes deployment. Start your troubleshooting with the determination of the failing component that can include the OpenStack Controller (Rockoon), Helm, a particular pod, or service.
Note
For Kubernetes cluster debugging and troubleshooting, refer to Kubernetes official documentation: Troubleshoot clusters and Docker Enterprise v3.0 documentation: Monitor and troubleshoot.
Debugging the Helm releases
OpenStack Controller (Rockoon)
Since MOSK 25.1, the OpenStack Controller has been open-sourced under the name Rockoon and is maintained as an independent open-source project going forward.
As part of this transition, all openstack-controller pods are named
rockoon pods across the MOSK documentation and deployments. This change
does not affect functionality, but this is the reminder for the users to
utilize the new naming for pods and other related artifacts accordingly.
Note
MOSK uses direct communication with Helm 3.
Log in to the
rockoonpod, where the Helm v3 client is installed, or download the Helm v3 binary locally:kubectl -n osh-system get pods |grep rockoon
Example of a system response:
rockoon-5c5965688b-knck5 9/9 Running 0 21h rockoon-admission-6795d594b4-rp7kf 1/1 Running 0 22h rockoon-exporter-6f66547b67-pcxhh 1/1 Running 0 22h
Verify the Helm releases statuses:
helm3 --namespace openstack list --all
Example of a system response:
NAME NAMESPACE REVISION UPDATED STATUS CHART APP VERSION etcd openstack 4 2021-07-09 11:06:25.377538008 +0000 UTC deployed etcd-0.1.0-mcp-2735 ingress-openstack openstack 4 2021-07-09 11:06:24.892822083 +0000 UTC deployed ingress-0.1.0-mcp-2735 openstack-barbican openstack 4 2021-07-09 11:06:25.733684392 +0000 UTC deployed barbican-0.1.0-mcp-3890 openstack-ceph-rgw openstack 4 2021-07-09 11:06:25.045759981 +0000 UTC deployed ceph-rgw-0.1.0-mcp-2735 openstack-cinder openstack 4 2021-07-09 11:06:42.702963544 +0000 UTC deployed cinder-0.1.0-mcp-3890 openstack-designate openstack 4 2021-07-09 11:06:24.400555027 +0000 UTC deployed designate-0.1.0-mcp-3890 openstack-glance openstack 4 2021-07-09 11:06:25.5916904 +0000 UTC deployed glance-0.1.0-mcp-3890 openstack-heat openstack 4 2021-07-09 11:06:25.3998706 +0000 UTC deployed heat-0.1.0-mcp-3890 openstack-horizon openstack 4 2021-07-09 11:06:23.27538297 +0000 UTC deployed horizon-0.1.0-mcp-3890 openstack-iscsi openstack 4 2021-07-09 11:06:37.891858343 +0000 UTC deployed iscsi-0.1.0-mcp-2735 v1.0.0 openstack-keystone openstack 4 2021-07-09 11:06:24.878052272 +0000 UTC deployed keystone-0.1.0-mcp-3890 openstack-libvirt openstack 4 2021-07-09 11:06:38.185312907 +0000 UTC deployed libvirt-0.1.0-mcp-2735 openstack-mariadb openstack 4 2021-07-09 11:06:24.912817378 +0000 UTC deployed mariadb-0.1.0-mcp-2735 openstack-memcached openstack 4 2021-07-09 11:06:24.852840635 +0000 UTC deployed memcached-0.1.0-mcp-2735 openstack-neutron openstack 4 2021-07-09 11:06:58.96398517 +0000 UTC deployed neutron-0.1.0-mcp-3890 openstack-neutron-rabbitmq openstack 4 2021-07-09 11:06:51.454918432 +0000 UTC deployed rabbitmq-0.1.0-mcp-2735 openstack-nova openstack 4 2021-07-09 11:06:44.277976646 +0000 UTC deployed nova-0.1.0-mcp-3890 openstack-octavia openstack 4 2021-07-09 11:06:24.775069513 +0000 UTC deployed octavia-0.1.0-mcp-3890 openstack-openvswitch openstack 4 2021-07-09 11:06:55.271711021 +0000 UTC deployed openvswitch-0.1.0-mcp-2735 openstack-placement openstack 4 2021-07-09 11:06:21.954550107 +0000 UTC deployed placement-0.1.0-mcp-3890 openstack-rabbitmq openstack 4 2021-07-09 11:06:25.431404853 +0000 UTC deployed rabbitmq-0.1.0-mcp-2735 openstack-tempest openstack 2 2021-07-09 11:06:21.330801212 +0000 UTC deployed tempest-0.1.0-mcp-3890
If a Helm release is not in the
DEPLOYEDstate, obtain the details from the output of the following command:helm3 --namespace openstack history <release-name>
To verify the status of a Helm release:
helm3 --namespace openstack status <release-name>
Example of a system response:
NAME: openstack-memcached
LAST DEPLOYED: Fri Jul 9 11:06:24 2021
NAMESPACE: openstack
STATUS: deployed
REVISION: 4
TEST SUITE: None
Debugging the OpenStack Controller
OpenStack Controller (Rockoon)
Since MOSK 25.1, the OpenStack Controller has been open-sourced under the name Rockoon and is maintained as an independent open-source project going forward.
As part of this transition, all openstack-controller pods are named
rockoon pods across the MOSK documentation and deployments. This change
does not affect functionality, but this is the reminder for the users to
utilize the new naming for pods and other related artifacts accordingly.
The OpenStack Controller (Rockoon) is running in several containers in the
rockoon-xxxx pod in the osh-system namespace. For the full list
of containers and their roles, refer to OpenStack Controller (Rockoon).
To verify the status of the OpenStack Controller, run:
kubectl -n osh-system get pods
Example of a system response:
NAME READY STATUS RESTARTS AGE
rockoon-5c5965688b-knck5 9/9 Running 0 21h
rockoon-admission-6795d594b4-rp7kf 1/1 Running 0 22h
rockoon-exporter-6f66547b67-pcxhh 1/1 Running 0 22h
To verify the logs for the osdpl container, run:
kubectl -n osh-system logs -f <rockoon-xxxx> -c osdpl
Debugging the OsDpl CR
This section includes the ways to mitigate the most common issues with the OsDpl CR. We assume that you have already debugged the Helm releases and OpenStack Controller to rule out possible failures with these components as described in Debugging the Helm releases and Debugging the OpenStack Controller.
osdpl has DEPLOYED=false¶Possible root cause: One or more Helm releases have not been deployed successfully.
To determine if you are affected:
Verify the status of the osdpl object:
kubectl -n openstack get osdpl osh-dev
Example of a system response:
NAME AGE DEPLOYED DRAFT
osh-dev 22h false false
To debug the issue:
Identify the failed release by assessing the
status:childrensection in the OsDpl resource:Get the OsDpl YAML file:
kubectl -n openstack get osdpl osh-dev -o yaml
Analyze the
statusoutput using the detailed description in OpenStackDeploymentStatus custom resource.
For further debugging, refer to Debugging the Helm releases.
Init¶Possible root cause: MOSK uses the Kubernetes entrypoint
init container to resolve dependencies between objects. If the pod is stuck
in Init:0/X, this pod may be waiting for its dependencies.
To debug the issue:
Verify the missing dependencies:
kubectl -n openstack logs -f placement-api-84669d79b5-49drw -c init
Example of a system response:
Entrypoint WARNING: 2020/04/21 11:52:50 entrypoint.go:72: Resolving dependency Job placement-ks-user in namespace openstack failed: Job Job placement-ks-user in namespace openstack is not completed yet .
Entrypoint WARNING: 2020/04/21 11:52:52 entrypoint.go:72: Resolving dependency Job placement-ks-endpoints in namespace openstack failed: Job Job placement-ks-endpoints in namespace openstack is not completed yet .
Possible root cause: some OpenStack services depend on Ceph. These services
include OpenStack Image, OpenStack Compute, and OpenStack Block Storage.
If the Helm releases for these services are not present, the
openstack-ceph-keys secret may be missing in the openstack-ceph-shared
namespace.
To debug the issue:
Verify that the Ceph Controller has created the openstack-ceph-keys
secret in the openstack-ceph-shared namespace:
kubectl -n openstack-ceph-shared get secrets openstack-ceph-keys
Example of a positive system response:
NAME TYPE DATA AGE
openstack-ceph-keys Opaque 7 23h
If the secret is not present, create one manually.
Support dump
TechPreview
OpenStack Controller (Rockoon)
Since MOSK 25.1, the OpenStack Controller has been open-sourced under the name Rockoon and is maintained as an independent open-source project going forward.
As part of this transition, all openstack-controller pods are named
rockoon pods across the MOSK documentation and deployments. This change
does not affect functionality, but this is the reminder for the users to
utilize the new naming for pods and other related artifacts accordingly.
Support dump described in this section specifically targets OpenStack components, providing valuable insights for troubleshooting OpenStack-related problems.
To generate a support dump for your MOSK environment,
use the osctl sos report tool present within the rockoon
image.
This section focuses only on the essential capabilities of the tool. For all available parameters, consult osctl sos report --help.
The support dump is modular. Each module is responsible for specific
functionality. To enable or disable specific modules during support
dump creation, use the --collector option. If not specified,
all collectors are used.
Collector |
Description |
|---|---|
|
Collects logs from StackLight by connecting to the OpenSearch API. |
|
Collects data about objects from Kubernetes. |
|
Collects metadata associated with the Compute service (OpenStack Nova) from the OpenStack nodes. This encompasses a wide range of data, including instance details, general libvirt information, and so on. |
|
Collects metadata associated with the Networking service (OpenStack Neutron) from the OpenStack nodes. This encompasses a wide range of data, including Open vSwitch statistics, list of namespaces, IP address statistics in namespaces, Open vSwitch flows, and so on. |
Given the substantial amount of information, you can manage the components
included in a support dump using the mutually exclusive --component
or --all-components options. Within the elastic collector component,
you can specify which loggers to gather logs for. For example,
the --component nova option restricts log collection to pods related
to Nova, which names start with nova-* and libvirt-*.
Another filtering criterion involves specifying the host for which you intend
to collect support information. This can be accomplished through the use of
mutually exclusive --host or --all-hosts options. This feature is
particularly valuable for limiting the volume of data included in
the support dump.
Support dump works in the following modes:
reportGeneric report is created, no specific information such as resource UUID is included. The tool collects as much information as possible.
traceProvides more sophisticated filtering criteria rather than the
reportmode. For example, you can search for specific message patterns in OpenSearch.
Since MOSK 23.2, you can execute the osctl sos
commands directly in the rockoon pod. For example:
kubectl -n osh-system exec -it deployment/rockoon bash
osctl sos --since 1d \
--all-hosts \
--component neutron \
--collector elastic \
--workspace /tmp/ report
To get trace for a specific resource UUID in Neutron for a specific host, use the following command as an example:
kubectl -n osh-system exec -it deployment/rockoon bash
osctl sos --since 1d \
--host kaas-node-fe0734de-20e8-4493-9f7d-52c4f8a8a98c \
--component neutron \
--workspace /workspace/ \
--collector elastic trace --message ".4a055675-89b0-45c2-a3b3-a10dffa07f31."
For older MOSK versions, to start generating support dumps, execute the osctl sos commands from a manually started Docker container on any node of your cluster. For example, to create a generic report for the Neutron component:
docker run -v /home/ubuntu/sosreport/:/workspace -v /root/.kube/config:/root/.kube/config -it mirantis.azurecr.io/openstack/rockoon:1.0.1 bash
osctl sos --since 1d \
--elastic-url http://172.16.37.11:9200 \
--all-hosts \
--component neutron \
--collector elastic \
--workspace /workspace/ report
Note
172.16.37.11 is the IP address of the opensearch-master
StackLight service. To obtain it, run:
kubectl -n stacklight get svc opensearch-master -o jsonpath='{.spec.clusterIP}')
Deploy Tungsten Fabric
This section describes how to deploy Tungsten Fabric as a backend for networking for your MOSK environment.
Caution
Before you proceed with the Tungsten Fabric deployment, read through Tungsten Fabric known limitations.
Tungsten Fabric deployment prerequisites
Before you proceed with the actual Tungsten Fabric (TF) deployment, verify that your deployment meets the following prerequisites:
Your MOSK OpenStack cluster is deployed as described in Deploy an OpenStack cluster with the Tungsten Fabric backend enabled for Neutron using the following structure:
spec: features: neutron: backend: tungstenfabric
Your MOSK OpenStack cluster uses the correct value of
features:neutron:tunnel_interfacein theopenstackdeploymentobject. The TF Operator will consume this value through the shared secret and use it as a network interface from the underlay network to create encapsulated tunnels with the tenant networks.Considerations for
tunnel_interfacePlan this interface as a dedicated physical interface for TF overlay networks. TF uses
features:neutron:tunnel_interfaceto create thevhost0virtual interface and transfers the IP configuration from thetunnel_interfaceto the virtual one.Do not use
bridgesfrom L2 templates astunnel_interface. Such usage might lead to networking performance degradation and data plane downtime.
The Kubernetes nodes are labeled according to the TF node roles:
Tungsten Fabric (TF) node roles¶ Node role
Description
Kubernetes labels
Minimal count
TF control plane
Hosts the TF control plane services such as
database,messaging,api,svc,config.tfconfig=enabledtfcontrol=enabledtfwebui=enabledtfconfigdb=enabled3
TF analytics Unsupported since {{ product_name_abbr }} 24.2
Hosts the TF analytics services.
tfanalytics=enabledtfanalyticsdb=enabled3
TF vRouter
Hosts the TF vRouter module and vRouter Agent.
tfvrouter=enabledVaries
Note
TF supports only Kubernetes OpenStack workloads. Therefore, you should label OpenStack compute nodes with the
tfvrouter=enabledlabel.Note
Do not specify the
openvswitch=enabledlabel for the OpenStack deployments with TF as a networking backend.
Deploy Tungsten Fabric
Deployment of Tungsten Fabric is managed by the tungstenfabric-operator
Helm resource in a respective ClusterRelease.
To deploy Tungsten Fabric:
Optional. Configure the ASN and encapsulation settings if you need custom values for these parameters. For configuration details, see Autonomous System Number (ASN).
Verify that you have completed all prerequisite steps as described in Tungsten Fabric deployment prerequisites.
Create the
tungstenfabric.yamlfile with the Tungsten Fabric resource configuration. For example:apiVersion: tf.mirantis.com/v2 kind: TFOperator metadata: name: openstack-tf namespace: tf spec: dataStorageClass: tungstenfabric-operator-bind-mounts
Configure the
TFOperatorcustom resource according to the needs of your deployment. For the configuration details, refer to TFOperator custom resource and Tungsten Fabric Operator resources.Trigger the Tungsten Fabric deployment:
kubectl apply -f tungstenfabric.yaml
Verify that Tungsten Fabric has been successfully deployed:
kubectl get pods -n tf
The successfully deployed TF services should appear in the
Runningstatus in the system response.If you have enabled StackLight, enable Tungsten Fabric monitoring by setting
tungstenFabricMonitoring.enabledtotrueas described in StackLight configuration procedure.Since MOSK 23.1,
tungstenFabricMonitoring.enabledis enabled by default during the Tungsten Fabric deployment. Therefore, skip this step.
Advanced Tungsten Fabric configuration (optional)
This section includes configuration details for available advanced MOSK features.
Enable huge pages for OpenStack with Tungsten Fabric
Note
The instruction provided in this section applies to both OpenStack with OVS and OpenStack with Tungsten Fabric topologies.
The huge pages OpenStack feature provides essential performance improvements
for applications that are highly memory IO-bound. Huge pages should be enabled
on a per compute node basis. By default, NUMATopologyFilter is enabled.
To activate the feature, you need to enable huge pages on the dedicated bare metal host as described in Enable huge pages in a host profile during the predeployment bare metal configuration.
Note
The multi-size huge pages are not fully supported by Kubernetes versions before 1.19. Therefore, define only one size in kernel parameters.
Enable DPDK for Tungsten Fabric
Unsupported since MOSK 25.2
This section describes how to enable DPDK mode for the Tungsten Fabric (TF) vRouter.
To enable DPDK for TF, follow one of the procedures below depending on the API version used:
Install the
vfio-pci(recommended) oruio_pci_genericdriver on the host operating system. For more information about drivers, see Linux Drivers.An example of the
DPDK_UIO_DRIVERconfiguration:spec: services: vRouter: agentDPDK: enabled: true envSettings: dpdk: - name: DPDK_UIO_DRIVER value: vfio-pci
Open the TF Operator custom resource for editing:
kubectl -n tf edit tfoperators.tf.mirantis.com openstack-tf
Enable DPDK:
spec: services: vRouter: agentDPDK: enabled: true
Enable SR-IOV for Tungsten Fabric
This section instructs you on how to enable SR-IOV with the Neutron Tungsten Fabric (TF) backend.
To enable SR-IOV for TF:
Verify that your deployment meets the following requirements:
NICs with the SR-IOV support are installed
SR-IOV and VT-d are enabled in BIOS
Enable IOMMU in the kernel by configuring
intel_iommu=onin the GRUB configuration file. Specify the parameter for compute nodes inBareMetalHostProfilein thegrubConfigsection:spec: grubConfig: defaultGrubOptions: - 'GRUB_CMDLINE_LINUX="$GRUB_CMDLINE_LINUX intel_iommu=on"'
Enable SR-IOV in the
OpenStackDeploymentCR through the node-specific overrides settings. For example:spec: nodes: <NODE-LABEL>::<NODE-LABEL-VALUE>: features: neutron: sriov: enabled: true nics: - device: enp10s0f1 num_vfs: 7 physnet: tenant
Warning
After the
OpenStackDeploymentCR modification, the TF Operator generates a separate vRouter DaemonSet with specified settings. Thetf-vrouter-agent-<XXXXX>pods will be automatically restarted on the affected nodes causing the network services interruption on virtual machines running on these hosts.Optional. To modify a vRouter DaemonSet according to the SR-IOV definition in the
OpenStackDevelopmentCR, add vRouter custom specs to the TF Operator CR with the node label specified in theOpenStackDeploymentCR. For example:spec: nodes: sriov: labels: name: <NODE-LABEL> value: <NODE-LABEL-VALUE> nodeVRouter: enabled: true envSettings: agent: - name: VROUTER_GATEWAY value: <VROUTER-GATEWAY-IP>
spec: controllers: tf-vrouter: agent: customSpecs: - name: sriov label: name: <NODE-LABEL> value: <NODE-LABEL-VALUE> containers: - name: agent env: - name: <VROUTER-GATEWAY> value: <VROUTER-GATEWAY-IP>
Configure multiple Contrail API workers
TechPreview
Tungsten Fabric MOSK deployments use six workers of the
contrail-api service by default. This section instructs you on how to
change the default configuration if needed.
To configure the number of Contrail API workers on a TF deployment:
Specify the required number of workers in the
TFOperatorcustom resource:spec: features: config: configApiWorkerCount: 7
spec: controllers: tf-config: api: containers: - env: - name: CONFIG_API_WORKER_COUNT value: "7" name: api
Wait until all
tf-config-*pods are restarted.Verify the number of workers inside the running API container:
kubectl -n tf exec -ti tf-config-rclzq -c api -- ps aux --width 500 kubectl -n tf exec -ti tf-config-rclzq -c api -- ls /etc/contrail/
Verify that the ps output lists one API process with PID
"1"and the number of workers set in theTFOperatorcustom resource.In
/etc/contrail/, verify that the number of configuration filescontrail-api-X.confmatches the number of workers set in theTFOperatorcustom resource.
Disable Tungsten Fabric analytics services
Available since MOSK 23.3
By default, the Tungsten Fabric analytics services are included in basic Tungsten Fabric setups up to, but not including, MOSK 24.1. For deployments upgraded to series 24.1 and 25.1, which still provide analytics services, you can disable them through the custom resource of the Tungsten Fabric Operator as described in this section.
Warning
Disabling of the Tungsten Fabric analytics services requires
restart of the data plane services for existing environments and must be
planned in advance. While calculating the maintenance window for this
operation, take into account the deletion of the analytics DaemonSets
and automatic restart of the tf-config, tf-control, and
tf-webui pods.
Starting with MOSK 25.2, analytics services are no longer part of the product. On existing deployments, analytics services are automatically removed during cluster update to 25.2.
To disable Tungsten Fabric analytics services:
Open the
TFOperatorcustom resource for editing:kubectl -n tf edit tfoperators.tf.mirantis.com openstack-tf
kubectl -n tf edit tfoperators.operator.tf.mirantis.com openstack-tf
Disable Tungsten Fabric analytics services in the
TFOperatorcustom resource:spec: services: analytics: enabled: false
spec: settings: disableTFAnalytics: true
Clean up the Kubernetes resources. To free up the space that has been used by Cassandra, ZooKeeper, and Kafka analytics storage, manually delete the related PVC:
kubectl -n tf delete pvc -l app=cassandracluster,cassandracluster=tf-cassandra-analytics kubectl -n tf delete pvc -l app=tf-zookeeper-nal kubectl -n tf delete pvc -l app=tf-kafka
Remove the
tfanalytics=enabledandtfanalyticsdb=enabledlabels from nodes, as they are not required by the Tungsten Fabric Operator anymore.Manually restart the vRouter pods:
Note
To avoid network disruption, restart the vRouter pods in chunks.
kubectl -n tf get pod -l app=tf-vrouter-agent kubectl -n tf delete pod <POD_NAME>
Delete terminated nodes from the Tungsten Fabric configuration through the Tungsten Fabric web UI:
Caution
With disabled Tungsten Fabric analytics, the Tungsten Fabric web UI may not work properly.
Log in to the Tungsten Fabric web UI.
On Configure > Infrastructure > Nodes > Analytics Nodes, delete all terminated analytics nodes.
On Configure > Infrastructure > Nodes > Database Analytics Nodes, delete all terminated database analytics nodes.
Depending on the MOSK version, proceed accordingly:
Disable monitoring of the Tungsten Fabric analytics services in StackLight by setting the following parameter in StackLight values of the
Clusterobject tofalse:tungstenFabricMonitoring: analyticsEnabled: false
When done, the monitoring of the Tungsten Fabric analytics components will become disabled and Kafka alerts along with the Kafka dashboard will disappear from StackLight.
The
tungstenFabricMonitoring.analyticsEnabledsetting is automatically configured based on the state of the Tungsten Fabric analytics services, which are enabled or disabled.However, you can still override this setting. If set manually, the configuration overrides the default behavior and does not reflect the actual state of Tungsten Fabric analytics.
Now, with the Tungsten Fabric analytics services successfully disabled, you have optimized resource utilization and system performance. While these services are deactivated, related alerts may still be present in StackLight. However, do not consider such alerts as indicative of the actual status of the analytics services.
Troubleshoot the Tungsten Fabric deployment
This section provides the general debugging instructions for your Tungsten Fabric (TF) on Kubernetes deployment.
Enable debug logs for the Tungsten Fabric services
To enable debug logging for the Tungsten Fabric (TF) services:
Open the TF custom resource for modification:
kubectl -n tf edit tfoperators.tf.mirantis.com openstack-tf
Set the
logLevelvariable to theSYS_DEBUGvalue for the required TF service. For example, for theconfig-apiservice:spec: services: config: tf: logging: api: logLevel: SYS_DEBUG
Open the TF custom resource for modification:
kubectl -n tf edit tfoperators.operator.tf.mirantis.com openstack-tf
Set the
LOG_LEVELvariable to theSYS_DEBUGvalue for the required TF service. For example, for theconfig-apiservice:spec: controllers: tf-config: api: containers: - name: api env: - name: LOG_LEVEL value: SYS_DEBUG
Warning
After the TF custom resource modification, the pods
related to the affected services will be restarted. This rule does not
apply to the tf-vrouter-agent-<XXXXX> pods as their update strategy
differs. Therefore, if you enable the debug logging for the services in
a tf-vrouter-agent-<XXXXX> pod, restart this pod manually after you
modify the custom resource.
Troubleshoot access to the Tungsten Fabric web UI
If you cannot access the Tungsten Fabric (TF) web UI service, verify that the FQDN of the TF web UI is resolvable on your PC by running one of the following commands:
host tf-webui.it.just.works
# or
ping tf-webui.it.just.works
# or
dig host tf-webui.it.just.works
All commands above should resolve the web UI domain name to the IP address
that should match the EXTERNAL-IPs subnet dedicated to Kubernetes.
If the TF web UI domain name has not been resolved to the IP address, your PC
is using a different DNS or the DNS does not contain the record for the TF web
UI service. To resolve the issue, define the IP address of the Ingress service
from the openstack namespace of Kubernetes in the hosts file of your
machine. To obtain the Ingress IP address:
kubectl -n openstack get svc ingress -o custom-columns=HOSTS:.status.loadBalancer.ingress[*].ip
If the web UI domain name is resolvable but you still cannot access the service, verify the connectivity to the cluster.
Disable TX offloading on NICs used by vRouter
In the following cases, a TCP-based service may not work on VMs:
If the setup has nested VMs.
If VMs are running in the ESXi hypervisor.
If the Network Interface Cards (NICs) do not support the IP checksum calculation and generate an incorrect checksum. For example, the Broadcom Corporation NetXtreme BCM5719 Gigabit Ethernet PCIe NIC cards.
To resolve the issue, disable the transmit (TX) offloading on all OpenStack compute nodes for the affected NIC used by the vRouter as described below.
To identify the issue:
Verify whether ping is working between VMs on different hypervisor hosts and the TCP services are working.
Run the following command for the vRouter Agent and verify whether the output includes the number of
Checksum errors:kubectl -n tf exec tf-vrouter-agent-XXXXX -c agent -- dropstats
Run the following command and verify if the output includes the
cksum incorrectentries:kubectl -n tf exec tf-vrouter-agent-XXXXX -c agent -- tcpdump -i <tunnel interface> -v -nn | grep -i incorrect
Example of system response:
tcpdump: listening on <tunnel interface>, link-type EN10MB (Ethernet), capture size 262144 bytes <src ip.port> > <dst ip.port>: Flags [S.], cksum 0x43bf (incorrect -> 0xb8dc), \ seq 1901889431, ack 1081063811, win 28960, options [mss 1420,sackOK,\ TS val 456361578 ecr 41455995,nop,wscale 7], length 0 <src ip.port> > <dst ip.port>: Flags [S.], cksum 0x43bf (incorrect -> 0xb8dc), \ seq 1901889183, ack 1081063811, win 28960, options [mss 1420,sackOK,\ TS val 456361826 ecr 41455995,nop,wscale 7], length 0 <src ip.port> > <dst ip.port>: Flags [S.], cksum 0x43bf (incorrect -> 0xb8dc), \ seq 1901888933, ack 1081063811, win 28960, options [mss 1420,sackOK,\ TS val 456362076 ecr 41455995,nop,wscale 7], length 0
Run the following command for the vRouter Agent container and verify whether the output includes the information about a drop for an unknown reason:
kubectl -n tf exec tf-vrouter-agent-XXXXX -c agent -- flow -l
To disable the TX offloading on NICs used by vRouter:
Open the
TFOperatorcustom resource (CR) for editing:kubectl -n tf edit tfoperators.operator.tf.mirantis.com openstack-tf
Specify the
DISABLE_TX_OFFLOADvariable with the"YES"value for the vRouter Agent container:spec: features: vRouter: disableTXOffload: true
spec: controllers: tf-vrouter: agent: containers: - name: agent env: - name: DISABLE_TX_OFFLOAD value: "YES"
Warning
Once you modify the
TFOperatorCR, thetf-vrouter-agent-<XXXXX>pods will not restart automatically because they use the OnDelete update strategy. Restart such pods manually, considering that the vRouter pods restart causes network services interruption for the VMs hosted on the affected nodes.To disable TX offloading on a specific subset of nodes, use custom vRouter settings. For details, see Custom vRouter settings.
Warning
Once you add a new
CustomSpec, a new daemon set will be generated and thetf-vrouter-agent-<XXXXX>pods will be automatically restarted. The vRouter pods restart causes network services interruption for VMs hosted on the affected node. Therefore, plan this procedure accordingly.
See also
Operations Guide
This guide outlines the post-deployment Day-2 operations for a Mirantis OpenStack for Kubernetes environment. It describes how to configure and manage the MOSK components, perform different types of cloud verification, and enable additional features depending on your cloud needs. The guide also contains day-to-day maintenance procedures such as how to back up and restore, update and upgrade, or troubleshoot your MOSK cluster.
Cluster update
Updating a MOSK cluster ensures that the system remains secure, efficient, and up-to-date with the latest features and performance improvements, as well as receives fixes for the known CVEs. This section provides comprehensive details and step-by-step procedures to guide you through the process of updating your cluster.
Cluster updates in MOSK encompass both management cluster and MOSK cluster updates:
Update type |
Description |
|---|---|
Management cluster update |
The management cluster update is performed automatically as long as the release of each managed cluster has either supported or deprecated status in the new version of MOSK management. In case any of the clusters managed by MOSK management is about to get an unsupported status as a result of an update, the MOSK management cluster updates will get blocked till the cluster gets to a later release. For the cluster release statuses, refer to Cluster support statuses. |
Cluster major update |
Major cluster update is initiated by a cloud operator through the MOSK management console. The update procedure is automated and covers all the life cycle management modules of the cluster that include OpenStack, Tungsten Fabric, Ceph, and StackLight. Refer to Update to a major version for the procedure. Version-specific considerations Before the MOSK 24.1 series, if between the major releases you apply at least one patch release belonging to the N series, you should obtain the last patch release in the series to be able to update to the N+1 major release version. Since MOSK 24.1.5, the product introduces a new approach to cluster updates. For details, refer to Cluster update scheme and Update schemes comparison. |
Cluster patch update |
Patch cluster update is initiated by a cloud operator through the MOSK management console. The update procedure is automated and covers all the life cycle management modules of the cluster that include OpenStack, Tungsten Fabric, Ceph, and StackLight. Refer to Update to a patch version for the procedure. Version-specific considerations Since MOSK 24.1.5, the product introduces a new approach to cluster updates. For details, refer to Cluster update scheme and Update schemes comparison. |
Update to a major version
This section describes the workflow you as a cloud operator need to follow to correctly update your Mirantis OpenStack for Kubernetes (MOSK) cluster to a major release version.
Note
The hereby guide applies to the clusters running MOSK of version 23.1 and above. In case you have an older version and looking to update, please contact Mirantis support to get intructions valid for your cluster.
The instructions below are generic and apply to any MOSK cluster regardless of its configuration specifics. However, every major release may have its own update peculiarities. Therefore, to accurately plan and successfully perform an update, in addition to the hereby document, read the update-related section in the Release Notes of the target MOSK version.
Depending on the payload of a target release, the update mechanism can perform the changes on different levels of the stack, from the configuration of the host operating system to the code of OpenStack itself. The update mechanism is designed to avoid the impact on the workloads and cloud users as much as possible. The life-cycle management logic minimizes the downtime for the cloud API by means of smart management of the cluster components under the hood and only requests your involvement when a human decision is required to proceed.
Though the update mechanism may change the internal components of the cluster, it will always preserve the major versions of OpenStack, that is, the APIs that cloud users and workloads deal with. After the cluster is successfully updated, you can initiate a separate upgrade procedure to obtain the latest supported OpenStack version.
See also
Before you begin
Before starting an update, we recommend that you closely peruse the Release Compatibility Matrix document and Release notes of the target release, as well as thoroughly plan maintenance windows for each update phase depending on the configurational of your cluster.
Read carefully Compatibility Matrix and Release Notes of the target MOSK version paying particular attention to the following:
Current Mirantis Container Cloud software version and the need to first update to the latest cluster release version
Update notes provided in the Release notes for the target MOSK version
New product features that will get enabled in your cloud by default
New product features that may have already been configured in your cloud as customizations and now need to be properly re-enabled to be eligible for further support
Any changes in the behavior of the product features enabled in your cloud
List of the addressed and known issues in the target MOSK version
Warning
If your cloud configuration is known to have any custom configuration that was not explicitly approved by Mirantis, make sure to bring this up with your dedicated Mirantis representative before proceeding with the update. Mirantis cannot guarantee the safe updating of a customized cloud.
Depending on the payload brought by a particular target release, a generic cluster update includes from three to six major phases.
The first three phases are present in any update. They focus on the containerized components of the software stack and have minimal impact on the cloud users and workloads.
The remaining phases are only present if any changes need to be made to the foundation layers: the underlay Kubernetes cluster and host operating system. For the changes to take effect, you may need to reboot the cluster nodes. This procedure imposes a severe impact on cloud workloads and, therefore, needs to be thoroughly planned across several sequential maintenance windows.
Important
To effectively plan a cluster update, keep in mind the architecture of your specific cloud. Depending on the selected design, the components of a MOSK cluster may have different distribution across the nodes (physical servers) comprising the underlay bare metal Kubernetes cluster. The more components are collocated on a single node, the harder is the impact on the functions of the cloud when the changes are applied.
Since the management cluster update to Container Cloud 2.30.0 (Cluster release
20.0.0), to obtain a cluster-specific update plan with automatically calculated
estimations, use the ClusterUpdatePlan object that contains description
and duration fields for each step. For details, see an example of a
completed ClusterUpdatePlan object provided in Granularly update MOSK using CLI. For
the same purpose, you may also use the update wizard in the management console
as described in Granularly update MOSK using the Container Cloud web UI.
Before the management cluster update to Container Cloud 2.30.0 or to manually calculate update estimations, use the tables below that include the following information for each mandatory and additional update phase:
- What happens during the phase
Includes the phase milestones. The nature of changes that are going to be applied is important to understand in order to estimate the exact impact the update is going to have on your cluster.
Consult the Update notes section of the target MOSK release for the detailed information about the changes it brings and the impact these changes are going to imply when getting applied to your cluster.
- Impact
Describes possible impact on cloud users and workloads.
The provided information about the impact represents the worst-case scenario in the cluster architectures that imply a combination of several roles on the same physical servers, such as hyper-converged compute nodes and clusters with a compact control plane.
The impact estimation presumes that your cluster uses one of the standard architectures provided by the product and follows Mirantis design guidelines.
- Time to complete
Provides a rough estimation of the time required to complete the phase.
The estimates for a phase timeline presume that your cluster uses one of the standard architectures provided by the product and follows Mirantis design guidelines.
Warning
During the update, try to prevent users from performing write operations on the cloud resources. Any intensive manipulations may lead to workload corruption.
Phase 1: Life-cycle management modules update
Important
This phase is mandatory. It is always present in the update flow regardless of the contents of the target release.
What happens during the phase |
New versions of OpenStack, Tungsten Fabric, and Ceph controllers downloaded and installed. OpenStack and Tungsten Fabric images precached. |
|---|---|
Impact |
None |
Time to complete |
Depending on the quality of the Internet connectivity, up to 45 minutes. |
Phase 2: OpenStack and Tungsten Fabric components update
Important
This phase is mandatory. It is always present in the update flow regardless of the contents of the target release.
What happens during the phase |
New versions of OpenStack and Tungsten Fabric container images downloaded, services restarted sequentially. |
|---|---|
Impact |
|
Time to complete |
|
Phase 3: Ceph cluster update and upgrade
Important
This phase is mandatory. It is always present in the update flow regardless of the contents of the target release.
What happens during the phase |
New versions of Ceph components downloaded, services restarted. If applicable, Ceph switched to the latest major version. |
|---|---|
Impact |
Workloads may experience IO performance degradation for the virtual storage devices backed by Ceph. |
Time to complete |
The update of a Ceph cluster with 30 storage nodes can take up to 35 minutes. Additionally, 15 minutes are required for the major Ceph version upgrade, if any. |
Phase 4a: Host operating system update on Kubernetes master nodes
Important
This phase is optional. The presence of this phase in the update flow depends on the contents of the target release.
What happens during the phase |
New system packages downloaded and installed on the host operating system, other major changes get applied. |
|---|---|
Impact |
None |
Time to complete |
The nodes are updated sequentially. Up to 15 minutes per node. |
Phase 4b: Kubernetes components update on Kubernetes master nodes
Important
This phase is optional. The presence of this phase in the update flow depends on the contents of the target release.
What happens during the phase |
New versions of Kubernetes control plane components downloaded and installed. |
|---|---|
Impact |
For clusters with the compact control plane, some of the running cloud operations may fail over the course of the phase due to minor unavailability of the cloud API. For the compact control plane with gateway nodes collocated (Open vSwitch networking backend), workloads can experience temporary loss of the North-South connectivity. The downtime depends on the type of virtual routers in use. |
Time to complete |
Up to 40 minutes total |
Phases 5a and 5b: Host operating system and Kubernetes cluster
update on Kubernetes worker nodes
Important
Both phases, 5a and 5b, are applied together, either node by node (default) or to several nodes in parallel. The parallel updating is available since 23.1.
Take this into consideration when estimating the impact and planning the maintenance window.
What happens during the phase |
During the host operating system update:
During the Kubernetes cluster update:
|
|---|---|
Impact |
|
Time to complete |
By default, the nodes are updated sequentially as follows:
For MOSK 23.1 to 23.2 and newer releases, you can reduce update time by enabling parallel node update. The procedure is described further in the Enable parallel update of Kubernetes worker nodes subsection. |
Phase 6: Cluster nodes reboot
Important
This phase is optional. The presence of this phase in the update flow depends on the contents of the target release.
Important
An update to a newer MOSK version may require reboot of the cluster nodes for changes to take effect. Although, you can decide when to restart each particular node, an update can not be considered complete until all of the nodes get restarted.
To determine whether the reboot is required, consult the Step 4. Reboot the nodes with optional instance migration section.
What happens during the phase |
|
|---|---|
Impact |
|
Time to complete |
|
Step 1. Verify that the management cluster is up-to-date
MOSK relies on Mirantis Container Cloud to manage the underlying software stack for a cluster, as well as to deliver updates for all the components.
Since every MOSK release is tightly coupled with a Container Cloud release, a MOSK cluster update becomes possible once the management cluster is known to run the latest Container Cloud version. The management cluster periodically verifies public Mirantis repositories and updates itself automatically when a newer version becomes available. Having any of the managed clusters, including MOSK, running outdated Container Cloud version will prevent the management cluster from automatic self-update.
To identify the current version of the Container Cloud software your management cluster is running, refer to the Container Cloud web UI. You can also verify your management cluster status using CLI as described in Verify the management cluster status before MOSK update.
Step 2. Initiate MOSK cluster update
During an update of a MOSK cluster, numerous alerts may be seen in StackLight. This is expected behavior. Therefore, ignore or temporarily mute the alerts as described in Silence alerts.
Caution
During update, the false positive CalicoDataplaneFailuresHigh
alert may be firing. Disregard this alert, which will disappear once update
succeeds.
The observed behavior is typical for calico-node during upgrades,
as workload changes occur frequently. Consequently, there is a possibility
of temporary desynchronization in the Calico dataplane. This can
occasionally result in throttling when applying workload changes to the
Calico dataplane.
Note
In non-HA StackLight deployments, the KubePodsCrashLooping alert
may temporarily be firing for the Grafana ReplicaSet. Such behavior is
expected in non-HA StackLight setups. For details, see
known issue 42463.
To prevent the issue, deploy StackLight in HA mode.
Note
If StackLight is enabled in HA mode, the
OpenSearchClusterStatusCritical alert may trigger during cluster update
when the next OpenSearch node restarts before shards from the previous node
finish assigning. For details, see [48581] OpenSearchClusterStatusCritical is firing during cluster update.
You can ignore this alert, it will disappear once update succeeds.
If you update MOSK to 23.1, verify that the
KaaSCephCluster custom resource does not contain the following entries.
If they exist, remove them.
In the
spec.cephClusterSpecsection, theexternalsection.In the
spec.cephClusterSpec.rookConfigsection, thems_crc_dataorms crc dataconfiguration key. After you remove the key, wait forrook-ceph-monpods to restart on the MOSK cluster.
Optional. Starting from MOSK 23.1 to 23.2 update, you can enable and configure parallel node update to reduce update time and minimize downtime:
To enable parallel update of Kubernetes worker nodes, set the
spec.providerSpec.value.maxWorkerUpgradeCountconfiguration parameter in the Mirantis Container Cloud management cluster as described in conf-upd-count.Consider the specifics of handling of parallel node updates by OpenStack, Ceph, and Tungsten Fabric Controllers to properly plan the maintenance window. For handling details and possible configuration, refer to Parallelizing node update operations.
TechPreview
Optional. Starting from MOSK 24.3, you can enable automatic node reboot of an update group, which contains a set of controller or worker machines. This option applies when a Cluster release update requires node reboot, for example, when kernel version update is available in the target Cluster release. The option reduces manual intervention and overall downtime during cluster update.
To enable automatic node reboot in an update group, set
spec.rebootIfUpdateRequires in the required UpdateGroup object. For
details, see UpdateGroup resource.
Caution
During a distribution upgrade, machines are always rebooted,
overriding rebootIfUpdateRequires: false.
Select from the following options:
Recommended since MOSK 24.2 and available as the only supported option since the management cluster update to Container Cloud 2.30.0 (Cluster release 20.0.0):
Not recommended since MOSK 24.2 and removed from the management console in MOSK 25.1:
Update using cluster.spec.providerSpec.value.release
Log in to the Container Cloud web UI with the
m:kaas:namespace@operatororm:kaas:namespace@writerpermissions.Switch to the required project using the Switch Project action icon located on top of the main left-side navigation panel.
In the Clusters tab, click Upgrade next to the More action icon located in the last column for each cluster where available.
Note
If Upgrade is greyed out, the cluster is in maintenance mode that must be disabled before you can proceed with cluster update. For details, see Disable maintenance mode on a cluster and machine.
If Upgrade does not display, your cluster is up-to-date.
In the Release Update window, select the required patch Cluster release to update your cluster to.
The Description section contains the list of components versions to be installed with a new Cluster release.
Click Update.
To view the update status, verify the cluster status on the Clusters page. Once the orange blinking dot near the cluster name disappears, the update is complete.
Before the cluster update starts, Container Cloud performs a backup of MKE and Docker Swarm. The backup directory is located under:
/srv/backup/swarmon every Container Cloud node for Docker Swarm/srv/backup/ucpon one of the controller nodes for MKE
Step 3. Watch the cluster update
To view the update status through the management console, navigate to the Clusters page. On the Updates page, monitor the update progress. For details, see Granularly update MOSK using the Container Cloud web UI.
Note
Granular update is available since MOSK 24.2.
Once the orange blinking dot next to the cluster name disappears, the cluster update is complete.
Also, you can see the general status of each node during the update on the cluster view page.
The whole update process is controlled by lcm-controller, which runs in
the kaas namespace of the management cluster. Follow its logs to watch the
progress of the update, discover, and debug any issues.
You can follow the update progress by fetching the ClusterUpdatePlan object
and monitoring its status as described in Granularly update MOSK using CLI.
Note
ClusterUpdatePlan is available since MOSK
24.2.
The lcmclusterstate and lcmmachines objects in the mos namespace
of the management cluster provide detailed information about the current phase
of the update process in the context of the managed cluster overall as well as
specific nodes.
The lcmmachine object being in the Ready state indicates that a node
has been successfully updated.
To display the detailed view of the cluster update state, run:
kubectl -n child-ns get lcmclusterstates -o wide
Example system response:
NAME CLUSTERNAME TYPE ARG VALUE ACTUALVALUE ATTEMPT MESSAGE
cd-cz7506-child-cl-storage-worker-noefi-rgxhk child-cl cordon-drain cz7506-child-cl-storage-worker-noefi-rgxhk true 0 Error: following NodeWorkloadLocks are still active - ceph: UpdatingController,openstack: InProgress
sd-cz7506-child-cl-storage-worker-noefi-rgxhk child-cl swarm-drain cz7506-child-cl-storage-worker-noefi-rgxhk true 0 Error: waiting for kubernetes node kaas-node-5222a92f-5523-457c-8c69-b7aa0ffc235c to be drained first
To display the detailed view of the nodes update state, run:
kubectl -n child-ns get lcmmachines
Example system response:
NAME CLUSTERNAME TYPE STATE
cz5018-child-cl-storage-worker-noefi-dzttw child-cl worker Prepare
cz5019-child-cl-storage-worker-noefi-vxcm9 child-cl worker Prepare
cz7500-child-cl-control-storage-worker-noefi-nkk9t child-cl control Ready
cz7501-child-cl-control-storage-worker-noefi-7pcft child-cl control Ready
cz7502-child-cl-control-storage-worker-noefi-c7k6f child-cl control Ready
cz7503-child-cl-storage-worker-noefi-5lvd7 child-cl worker Prepare
cz7505-child-cl-storage-worker-noefi-jh4mc child-cl worker Prepare
cz7506-child-cl-storage-worker-noefi-rgxhk child-cl worker Prepare
Step 4. Reboot the nodes with optional instance migration
Depending on the target release content, you may need to reboot the cluster nodes for the changes to take effect. Running a MOSK cluster in a semi-updated state for an extended period may result in unpredictable behavior of the cloud and impact users and workloads. Therefore, when it is required, you need to reboot the cluster nodes as soon as possible to avoid potential risks.
Note
If you enabled rebootIfUpdateRequires as described in
Enable automatic node reboot in update groups, nodes will be automatically rebooted in update
groups during a Cluster release update that requires a reboot, for example,
when kernel version update is available in the target Cluster release.
For a distribution upgrade, continue reading the following subsections.
Verify the YAML definitions of the LCMMachine and Machine objects.
The node must be rebooted if the rebootRequired flag is set to true.
In addition, objects explicitly specify the reason for rebooting. For example:
The
LCMMachineobject of the node that requires rebooting:... status: hostInfo: rebootRequired: true rebootReason: "linux-image-5.13.0-51-generic"
The
Machineobject of the node that does not require rebooting:... status: ... providerStatus: ... reboot: reason: "" required: false status: Ready
Since MOSK 23.1, you can also use the Mirantis Container Cloud web UI to identify the nodes requiring reboot:
In the Clusters tab, click the required cluster name. The page with Machines opens.
Hover over the status of every machine. A machine to reboot contains the Reboot > The machine requires a reboot notification in the Status tooltip.
Restarting the cluster causes downtime of the cloud services running on the nodes. While the MOSK control plane is built for high availability and can tolerate temporary loss of at least 1/3 of services without a significant impact on user experience, rebooting nodes that host the elements of cloud data plane, such as network gateway nodes and compute nodes, has a detrimental effect on the cloud workloads, if not performed gracefully.
To configure the instance migration policy:
Edit the target compute node resource. For example:
kubectl edit node kaas-node-03ab613d-cf79-4830-ac70-ed735453481a
To mitigate the potential impact on the cloud workloads, define the migration mode and the number of attempts the OpenStack Controller should make to migrate a single instance running on it:
Instance migration configuration for hosts¶ Node annotation
Default
Description
instance_migration_modeliveDefines the instance migration mode for the host. The list of available options include:
live: the OpenStack Controller live migrates instances automatically. The update mechanism tries to move the memory and local storage of all instances on the node to another node without interrupting before applying any changes to the node. By default, the update mechanism makes three attempts to migrate each instance before falling back to themanualmode. 0manual: the OpenStack Controller waits for the Operator to migrate instances from the host. When it is time to update the host, the update mechanism asks you to manually migrate the instances and proceeds only once you confirm the node is safe to update. 1skip: the OpenStack Controller skips the instance check on the node and reboots it.
instance_migration_attempts3Defines the number of times the OpenStack Controller attempts to live-migrate a single instance before falling back to the
manualmode.- 0
Success of live migration depends on many factors including the selected vCPU type and model, the amount of data that needs to be transferred, the intensity of the disk IO and memory writes, the type of the local storage, and others. Instances using the following product features are known to have issues with live migration:
LVM-based ephemeral storage with and without encryption
Encrypted block storage volumes
CPU and NUMA node pinning
- 1
For the clouds relying on the converged LVM with iSCSI block storage that offer persistent volumes in a remote edge sub-region, it is important to keep in mind that applying a major change to a compute node may impact not only the instances running on this node but also the instances attached to the LVM devices hosted there. Mirantis recommends that in such environments you perform the update procedure in the
manualmode with mitigation measures taken by the Operator for each compute node. Otherwise, all the instances that have LVM with iSCSI volumes attached would need reboot to restore connectivity.
Configuration example that sets the instance migration mode to
liveand the number of attempts to live-migrate to5:apiVersion: v1 kind: Node metadata: name: kaas-node-03ab613d-cf79-4830-ac70-ed735453481a selfLink: /api/v1/nodes/kaas-node-03ab613d-cf79-4830-ac70-ed735453481a uid: 54be5139-aba7-47e7-92bf-5575773a12a6 resourceVersion: '299734609' creationTimestamp: '2021-03-24T16:03:11Z' labels: ... openstack-compute-node: enabled openvswitch: enabled annotations: openstack.lcm.mirantis.com/instance_migration_mode: "live" openstack.lcm.mirantis.com/instance_migration_attempts: "5" ...
If needed, as a cloud user, mark the instances that require individual handling during instance migration using the
openstack.lcm.mirantis.com:maintenance_action=<ACTION-TAG>server tag. For details, refer to Configure per-instance migration mode.
See also
Since MOSK 23.1, you can reboot several cluster nodes in one go by using the Graceful reboot mechanism provided by Mirantis Container Cloud. The mechanism restarts the selected nodes one by one, honoring the instance migration policies.
For older versions of MOSK, you need to reboot each node manually as follows:
For each node in the cluster:
If
manualinstance migration policy is configured for the node, perform manual migration once the node is ready to reboot (see below).
When a node that has a manual instance migration policy is ready to be
restarted, the life-cycle management mechanism notifies you about that by
creating a NodeMaintenanceRequest object for the node and setting the
active status attribute for the corresponding NodeWorkloadLock object.
Note
Verify the status:errorMessage attribute before proceeding.
To view the NodeWorkloadLock objects details for a specific node, run:
kubectl get nodeworkloadlocks <NODE-NAME> -o yaml
Example system response:
apiVersion: lcm.mirantis.com/v1alpha1
kind: NodeWorkloadLock
metadata:
annotations:
inner_state: active
creationTimestamp: "2022-02-04T13:24:48Z"
generation: 1
name: openstack-kaas-node-b2a55089-5b03-4698-9879-8756e2e81df5
resourceVersion: "173934"
uid: 0cb4428f-dd0d-401d-9d5e-e9e97e077422
spec:
controllerName: openstack
nodeName: kaas-node-b2a55089-5b03-4698-9879-8756e2e81df5
status:
errorMessage: 2022-02-04 14:43:52.674125 Some servers ['0ab4dd8f-ef0d-401d-9d5e-e9e97e077422'] are still present on host kaas-node-b2a55089-5b03-4698-9879-8756e2e81df5.
Waiting unless all of them are migrated manually or instance_migration_mode is set to 'skip'
release: 8.5.0-rc+22.1
state: active
Note
For MOSK compute nodes, you need to manually shut down all instances running on it, or perform cold or live migration of the instances.
After the update
Once your MOSK cluster update is complete, proceed with the following:
Perform the post-update steps recommended in the update notes of the target release if any.
Use the standard configuration mechanisms to re-enable the new product features that could previously exist in your cloud as a custom configuration.
To ensure the cluster operability, execute a set of smoke tests as described in Run Tempest tests.
Optional. Proceed with the upgrade of OpenStack.
If necessary, expire alert silences in StackLight as described in Silence alerts.
Strongly recommended. Back up MKE as described in Mirantis Kubernetes Engine documentation: Back up MKE.
Since the procedure above modifies the cluster configuration, a fresh backup is required to restore the cluster in case further reconfigurations fail.
What to do if the update hangs or fails
If an update phase takes significantly longer than expected according to the update plan, you should consider the update process hung.
If you observe errors that are not described explicitly in the documentation, immediately contact Mirantis support.
To see any issues that might have occurred during the update, verify the logs
of the lcm-controller pods in the kaas namespace of the Container Cloud
management cluster.
To troubleshoot the update that involves the operating system upgrade with host reboot, refer to Troubleshoot an operating system upgrade with host restart.
Container Cloud and MOSK life-cycle management mechanism does not provide a way to perform a cluster-wide rollback of an update.
Update to a patch version
Patch releases aim to significantly shorten the cycle of CVE fixes delivery onto your MOSK deployments to help you avoid cyber threats and data breaches.
Your management bare-metal cluster obtains patch releases automatically the same way as major releases. A new patch MOSK release version becomes available through the Container Cloud web UI after the automatic upgrade of the management cluster.
It is not possible to update between the patch releases that belong to different release series in one go. For example, you can update from MOSK 23.1.1 to 23.1.2, but you cannot immediately update from MOSK 23.1.x to 23.2.x because you need to update to the major MOSK 23.2 release first.
Caution
If you delay the Container Cloud upgrade and schedule it at a later time as described in Schedule Mirantis Container Cloud updates, make sure to schedule a longer maintenance window as the upgrade queue can include several patch releases along with the major release upgrade.
Pre-update actions
Read the Update notes part of the target MOSK release notes to understand the changes it brings and the impact these changes are going to have on your cloud users and workloads.
The application of the patch releases may not require the cluster nodes reboot. Though, your cluster can contain nodes that require reboot after the last update to a major release, and this requirement will remain after update to any of the following patch releases. Therefore, Mirantis strongly recommends that you determine if there are such nodes in your cluster before you update to the next patch release and reboot them if any, as described in Step 4. Reboot the nodes with optional instance migration.
For some MOSK versions, applying a patch release may require restart of the containers that host the elements of the cloud data plane. In case of Open vSwitch-based clusters, this may result in up to 5 minute downtime of workload network connectivity for each compute node.
For MOSK prior to 24.1 series, you can determine whether applying a patch release is going to require the restart of the data plane by consulting the Release artifacts part of the release notes of the current and target MOSK releases. The data plane restart will only happen if there are new versions of the container images related to the data plane.
It is possible to avoid the downtime for the cloud data by explicitly pinning the image versions of the following components:
Open vSwitch
Kubernetes entrypoint
However, pinning these images will result in the cloud data plane not receiving any security or bugfixes during the update.
To pin the images:
Depending on the proxy configuration, the image base URL differs. To obtain the list of currently used images on the cluster, run:
kubectl -n openstack get ds openvswitch-openvswitch-vswitchd-default -o yaml |grep "image:" | sort -u
Example of system response:
image: mirantis.azurecr.io/general/openvswitch:2.13-focal-20230211095312 image: mirantis.azurecr.io/openstack/extra/kubernetes-entrypoint:v1.0.1-48d1e8a-20220919122849
Add the
openvswitchandkubernetes-entrypointimages used on your cluster:Create a ConfigMap in the
openstacknamespace with the following content, replacing<OPENSTACKDEPLOYMENT-NAME>with the name of yourOpenStackDeploymentcustom resource:apiVersion: v1 kind: ConfigMap metadata: labels: penstack.lcm.mirantis.com/watch: "true" name: <OPENSTACKDEPLOYMENT-NAME>-artifacts namespace: openstack data: caracal: | dep_check: <KUBERNETES-ENTRYPOINT-IMAGE-URL> openvswitch_db_server: <OPENVSWITCH-IMAGE-URL> openvswitch_vswitchd: <OPENVSWITCH-IMAGE-URL>
Edit the
OpenStackDeploymentcustom resoruce as follows:spec: services: networking: openvswitch: values: images: tags: dep_check: <KUBERNETES-ENTRYPOINT-IMAGE-URL> openvswitch_db_server: <OPENVSWITCH-IMAGE-URL> openvswitch_vswitchd: <OPENVSWITCH-IMAGE-URL>
For example:
spec: services: networking: openvswitch: values: images: tags: dep_check: mirantis.azurecr.io/openstack/extra/kubernetes-entrypoint:v1.0.1-48d1e8a-20220919122849 openvswitch_db_server: mirantis.azurecr.io/general/openvswitch:2.13-focal-20230211095312 openvswitch_vswitchd: mirantis.azurecr.io/general/openvswitch:2.13-focal-20230211095312
Update a patch Cluster release of a MOSK cluster
Select from the following options:
Recommended since MOSK 24.2 and available as the only supported option since the management cluster update to Container Cloud 2.30.0 (Cluster release 20.0.0):
Not recommended since MOSK 24.2 and removed from the management console in MOSK 25.1:
Update using cluster.spec.providerSpec.value.release
Log in to the Container Cloud web UI with the
m:kaas:namespace@operatororm:kaas:namespace@writerpermissions.Switch to the required project using the Switch Project action icon located on top of the main left-side navigation panel.
In the Clusters tab, click Upgrade next to the More action icon located in the last column for each cluster where available.
Note
If Upgrade is greyed out, the cluster is in maintenance mode that must be disabled before you can proceed with cluster update. For details, see Disable maintenance mode on a cluster and machine.
If Upgrade does not display, your cluster is up-to-date.
In the Release Update window, select the required patch Cluster release to update your cluster to.
The Description section contains the list of components versions to be installed with a new Cluster release.
Click Update.
To view the update status, verify the cluster status on the Clusters page. Once the orange blinking dot near the cluster name disappears, the update is complete.
Strongly recommended. Back up MKE as described in Mirantis Kubernetes Engine documentation: Back up MKE.
Since the procedure above modifies the cluster configuration, a fresh backup is required to restore the cluster in case further reconfigurations fail.
Note
Since Container Cloud 2.26.1 (patch Cluster releases 17.1.1 and 16.1.1), the update of Ubuntu packages with kernel minor version update may apply in certain releases.
In this case, cordon-drain and reboot of machines does not apply automatically, and all machines have the Reboot is required notification after the cluster update. You can manually handle the reboot of machines during a convenient maintenance window as described in Perform a graceful reboot of a cluster.
Note
In non-HA StackLight deployments, the KubePodsCrashLooping alert
may temporarily be firing for the Grafana ReplicaSet. Such behavior is
expected in non-HA StackLight setups. For details, see
known issue 42463.
To prevent the issue, deploy StackLight in HA mode.
Note
If StackLight is enabled in HA mode, the
OpenSearchClusterStatusCritical alert may trigger during cluster update
when the next OpenSearch node restarts before shards from the previous node
finish assigning. For details, see [48581] OpenSearchClusterStatusCritical is firing during cluster update.
You can ignore this alert, it will disappear once update succeeds.
Verify the management cluster status before MOSK update
Before you start updating your managed clusters, Mirantis recommends verifying that the associated management cluster is upgraded successfully.
To verify that the management cluster is upgraded successfully:
Using
kubeconfigof the management cluster, verify the Cluster release version of the management cluster machines:for i in $(kubectl get lcmmachines | awk '{print $1}' | sed '1d'); do echo $i; kubectl get lcmmachines $i -o yaml | grep release | tail -1; doneExample of system response:
master-0 release: 14.0.0+3.6.5 master-1 release: 14.0.0+3.6.5 master-2 release: 14.0.0+3.6.5
Obtain the name of the latest available Container Cloud release object:
kubectl get kaasrelease
Example of system response:
NAME AGE kaas-2-15-0 63m kaas-2-14-0 40d
Using the name of the latest Container Cloud release object, obtain the latest available Cluster release version:
kubectl get -o yaml clusterrelease $(kubectl get kaasrelease kaas-2-15-0 -o yaml | egrep "^ +clusterRelease:" | cut -d: -f2 | tr -d ' ') | egrep "^ version:"
Example of system response:
version: 14.0.0+3.6.4
Compare the output obtained in the previous step with the output from the first step. The Cluster releases must match. If this is not the case, contact Mirantis support for further details.
Proceed to Step 2. Initiate MOSK cluster update.
Change the upgrade order of a machine
You can define the upgrade sequence for existing machines to allow prioritized machines to be upgraded first during a cluster update.
Consider the following upgrade index specifics:
The first machine to upgrade is always one of the control plane machines with the lowest
upgradeIndex. Other control plane machines are upgraded one by one according to their upgrade indexes.If the
ClusterspecdedicatedControlPlanefield isfalse, worker machines are upgraded only after the upgrade of all control plane machines finishes. Otherwise, they are upgraded after the first control plane machine, concurrently with other control plane machines.If several machines have the same upgrade index, they have the same priority during upgrade.
If the value is not set, the machine is automatically assigned a value of the upgrade index.
To define the upgrade order of an existing machine:
Log in to the Container Cloud web UI with the
m:kaas:namespace@operatororm:kaas:namespace@writerpermissions.Switch to the required project using the Switch Project action icon located on top of the main left-side navigation panel.
In the Clusters tab, click the required cluster name. The cluster page with the Machines list opens.
In one of the Unassigned machines settings menu, select Change upgrade index.
In the Configure Upgrade Priority window that opens, use the Up and Down arrows in the Upgrade Index field to configure the upgrade sequence of a machine. Click Update to apply changes.
Using the Pool info or Machine info options in the machine settings menu, verify that the Upgrade Priority Index contains the updated value.
Configure the parallel update of worker nodes
Available since MCC 2.25.0 (17.0.0 and 16.0.0)
Note
You can start using the below procedure during cluster update from 23.1 to 23.2. For details, see Parallelizing node update operations.
By default, worker machines are upgraded sequentially, which includes node draining, software upgrade, services restart, and so on. Though, MOSK enables you to parallelize node upgrade operations, significantly improving the efficiency of your deployment, especially on large clusters.
For upgrade workflow of the control plane, see Change the upgrade order of a machine.
Configure the parallel update of worker nodes using web UI
Available since MCC 2.25.0 (17.0.0 and 16.0.0)
Log in to the Container Cloud web UI with the
m:kaas:namespace@operatororm:kaas:namespace@writerpermissions.Switch to the required project using the Switch Project action icon located on top of the main left-side navigation panel.
In the Clusters tab, click the required cluster name. The cluster page with the Machines list opens.
On the Clusters page, click the More action icon in the last column of the required cluster and select Configure cluster.
In General Settings of the Configure cluster window, define the following parameters:
- Parallel Upgrade Of Worker Machines
The maximum number of the worker nodes to update simultaneously. It serves as an upper limit on the number of machines that are drained at a given moment of time. Defaults to
1.You can configure this option after deployment before the cluster update.
- Parallel Preparation For Upgrade Of Worker Machines
The maximum number of worker nodes being prepared at a given moment of time, which includes downloading of new artifacts. It serves as a limit for the network load that can occur when downloading the files to the nodes. Defaults to
50.
Configure the parallel update of worker nodes using CLI
Available since MCC 2.24.0 (15.0.1 and 14.0.1)
Open the
Clusterobject for editing.Adjust the following parameters as required:
Configuration of the parallel node update¶ Parameter
Default
Description
spec.providerSpec.maxWorkerUpgradeCount1The maximum number of the worker nodes to update simultaneously. It serves as an upper limit on the number of machines that are drained at a given moment of time.
Caution
Since Container Cloud 2.27.0 (Cluster releases 17.2.0 and 16.2.0),
maxWorkerUpgradeCountis deprecated and will be removed in one of the following releases. Use theconcurrentUpdatesparameter in theUpdateGroupobject instead. For details, see Create update groups for worker machines.spec.providerSpec.maxWorkerPrepareCount50The maximum number of workers being prepared at a given moment of time, which includes downloading of new artifacts. It serves as a limit for the network load that can occur when downloading the files to the nodes.
Save the
Clusterobject to apply the change.
Create update groups for worker machines
Available since MCC 2.27.0 (17.2.0 and 16.2.0)
The use of update groups provides enhanced control over update of worker
machines by allowing granular concurrency settings for specific machine groups.
This feature uses the UpdateGroup object to decouple the concurrency
settings from the global cluster level, providing flexibility based on the
workload characteristics of different machine sets.
The UpdateGroup objects are processed sequentially based on their indexes.
Update groups with the same indexes are processed concurrently. The control
update group is always processed first.
Note
The update order of a machine within the same group is determined by the upgrade index of a specific machine. For details, see Change the upgrade order of a machine.
The maxWorkerUpgradeCount parameter of the Cluster object is inherited
by the default update group. Changing maxWorkerUpgradeCount leads to
changing the concurrentUpdates parameter of the default update group.
Note
The maxWorkerUpgradeCount parameter of the Cluster object is
deprecated and will be removed in one of the following Container Cloud
releases. You can still use this parameter to change the
concurrentUpdates value of the default update group. However, Mirantis
recommends changing this value directly in the UpdateGroup object.
Update group for controller nodes
Available since MCC 2.28.0 (17.3.0 and 16.3.0) TechPreview
The update group for controller nodes is automatically generated during initial cluster creation with the following settings:
name: <cluster-name>-controlindex: 1concurrentUpdates: 1rebootIfUpdateRequires: false
Caution
During a distribution upgrade, machines are always rebooted,
overriding rebootIfUpdateRequires: false.
All control plane machines are automatically assigned to the update group for controller nodes with no possibility to change it.
Note
On existing clusters created before Container Cloud 2.28.0 (Cluster releases 17.2.0, 16.2.0, or earlier), the update group for controller nodes is created after Container Cloud upgrade to 2.28.0 (Cluster release 16.3.0) on the management cluster.
Caution
The index and concurrentUpdates parameters of the update
group for controller nodes are hardcoded and cannot be changed.
Example of the update group for controller nodes:
apiVersion: kaas.mirantis.com/v1alpha1
kind: UpdateGroup
metadata:
name: example-cluster-control
namespace: example-ns
labels:
cluster.sigs.k8s.io/cluster-name: example-cluster
spec:
index: 1
concurrentUpdates: 1
rebootIfUpdateRequires: false
Default update group
The default update group is automatically created during initial cluster creation with the following settings:
name: <cluster-name>-defaultindex: 1rebootIfUpdateRequires: falseconcurrentUpdates: inherited from themaxWorkerUpgradeCountparameter set in theClusterobject
Caution
During a distribution upgrade, machines are always rebooted,
overriding rebootIfUpdateRequires: false.
Note
On existing clusters created before Container Cloud 2.27.0 (Cluster releases 17.1.0, 16.1.0, or earlier), the default update group is created after Container Cloud upgrade to 2.27.0 (Cluster release 16.2.0) on the management cluster.
Example of the default update group:
apiVersion: kaas.mirantis.com/v1alpha1
kind: UpdateGroup
metadata:
name: example-cluster-default
namespace: example-ns
labels:
cluster.sigs.k8s.io/cluster-name: example-cluster
spec:
index: 1
concurrentUpdates: 1
rebootIfUpdateRequires: false
If you require custom update settings for worker machines, create one or
several custom UpdateGroup objects as described below.
Assign a machine to an update group using CLI
Note
All worker machines that are not assigned to any update group are automatically assigned to the default update group.
Create an
UpdateGroupobject with the required specification. For description of the object fields, see UpdateGroup resource.Label the machines to associate them with the newly created
UpdateGroupobject:kubectl label machine <machineName> kaas.mirantis.com/update-group=<UpdateGroupObjectName>
To change the update group of a machine, update the
kaas.mirantis.com/update-grouplabel of the machine with the new update group name. Removing this label from a machine automatically assigns such machine to the default update group.Strongly recommended. Back up MKE as described in Mirantis Kubernetes Engine documentation: Back up MKE.
Since the procedure above modifies the cluster configuration, a fresh backup is required to restore the cluster in case further reconfigurations fail.
Note
After creation of a custom UpdateGroup object, if you plan to
add a new machine that requires a non-default update group, manually add
the corresponding label to the machine as described above. Otherwise, the
default update group is applied to such machine.
Note
Before removing the UpdateGroup object, reassign all machines to
another update group.
Granularly update MOSK using the ClusterUpdatePlan object
TechPreview since 24.2 GA since management cluster update to MCC 2.30.0 (20.0.0)
Note
Consider this section as part of Update to a major version or Update to a patch version.
You can control the process of a MOSK cluster update by
manually launching update stages using the ClusterUpdatePlan custom
resource. Between the update stages, a cluster remains functional from the
perspective of cloud users and workloads.
A ClusterUpdatePlan object contains the following functionality:
The object is automatically created by the bare metal provider when a new Cluster release becomes available for your cluster.
The object is created in the management cluster for the same namespace that the corresponding MOSK cluster refers to.
The object contains a list of self-descriptive update steps that are cluster-specific. These steps are defined in the
specsection of the object with information about their impact on the cluster.The object starts cluster update when the operator manually changes the
commencefield of the first update step totrue. All steps have thecommenceflag initially set tofalseso that the operator can decide when to pause or resume the update process.The object has the following naming convention:
<managedClusterName>-<targetClusterReleaseVersion>.Since Container Cloud 2.28.0 (Cluster release 17.3.0), the object contains several StackLight alerts to notify the operator about the update progress and potential update issues. For details, see StackLight alerts: Container Cloud.
Granularly update MOSK using CLI
Verify that the management cluster is upgraded successfully as described in Verify the management cluster status before MOSK update.
Optional. Available since MOSK 25.1 as Technology Preview. Enable update auto-pause to be triggered by specific StackLight alerts. For details, see Configure update auto-pause.
Open the
ClusterUpdatePlanobject for editing.Start cluster update by changing the
spec:steps:commencefield of the first update step totrue.Once done, the following actions are applied to the cluster:
The Cluster release in the corresponding
Clusterspecis changed to the target Cluster version defined in theClusterUpdatePlanspec.The cluster update starts and pauses before the next update step with
commence: falseset in theClusterUpdatePlanspec.
Caution
Cancelling an already started update
stepis not supported.The following example illustrates the
ClusterUpdatePlanobject of a MOSK cluster update that has completed:Example of a completed
ClusterUpdatePlanobjectObject: apiVersion: kaas.mirantis.com/v1alpha1 kind: ClusterUpdatePlan metadata: creationTimestamp: "2025-02-06T16:53:51Z" generation: 11 name: mosk-17.4.0 namespace: child resourceVersion: "6072567" uid: 82c072be-1dc5-43dd-b8cf-bc643206d563 spec: cluster: mosk releaseNotes: https://docs.mirantis.com/mosk/latest/25.1-series.html source: mosk-17-3-0-24-3 steps: - commence: true description: - install new version of OpenStack and Tungsten Fabric life cycle management modules - OpenStack and Tungsten Fabric container images pre-cached - OpenStack and Tungsten Fabric control plane components restarted in parallel duration: estimated: 1h30m0s info: - 15 minutes to cache the images and update the life cycle management modules - 1h to restart the components granularity: cluster id: openstack impact: info: - some of the running cloud operations may fail due to restart of API services and schedulers - DNS might be affected users: minor workloads: minor name: Update OpenStack and Tungsten Fabric - commence: true description: - Ceph version update - restart Ceph monitor, manager, object gateway (radosgw), and metadata services - restart OSD services node-by-node, or rack-by-rack depending on the cluster configuration duration: estimated: 8m30s info: - 15 minutes for the Ceph version update - around 40 minutes to update Ceph cluster of 30 nodes granularity: cluster id: ceph impact: info: - 'minor unavailability of object storage APIs: S3/Swift' - workloads may experience IO performance degradation for the virtual storage devices backed by Ceph users: minor workloads: minor name: Update Ceph - commence: true description: - new host OS kernel and packages get installed - host OS configuration re-applied - container runtime version gets bumped - new versions of Kubernetes components installed duration: estimated: 1h40m0s info: - about 20 minutes to update host OS per a Kubernetes controller, nodes updated one-by-one - Kubernetes components update takes about 40 minutes, all nodes in parallel granularity: cluster id: k8s-controllers impact: users: none workloads: none name: Update host OS and Kubernetes components on master nodes - commence: true description: - new host OS kernel and packages get installed - host OS configuration re-applied - container runtime version gets bumped - new versions of Kubernetes components installed - data plane components (Open vSwitch and Neutron L3 agents, TF agents and vrouter) restarted on gateway and compute nodes - storage nodes put to “no-out” mode to prevent rebalancing - by default, nodes are updated one-by-one, a node group can be configured to update several nodes in parallel duration: estimated: 8h0m0s info: - host OS update - up to 15 minutes per node (not including host OS configuration modules) - Kubernetes components update - up to 15 minutes per node - OpenStack controllers and gateways updated one-by-one - nodes hosting Ceph OSD, monitor, manager, metadata, object gateway (radosgw) services updated one-by-one granularity: machine id: k8s-workers-vdrok-child-default impact: info: - 'OpenStack controller nodes: some running OpenStack operations might not complete due to restart of components' - 'OpenStack compute nodes: minor loss of the East-West connectivity with the Open vSwitch networking back end that causes approximately 5 min of downtime' - 'OpenStack gateway nodes: minor loss of the North-South connectivity with the Open vSwitch networking back end: a non-distributed HA virtual router needs up to 1 minute to fail over; a non-distributed and non-HA virtual router failover time depends on many factors and may take up to 10 minutes' users: major workloads: major name: Update host OS and Kubernetes components on worker nodes, group vdrok-child-default - commence: true description: - restart of StackLight, MetalLB services - restart of auxiliary controllers and charts duration: estimated: 1h30m0s granularity: cluster id: mcc-components impact: info: - minor cloud API downtime due restart of MetalLB components users: minor workloads: none name: Auxiliary components update target: mosk-17-4-0-25-1 status: completedAt: "2025-02-07T19:24:51Z" startedAt: "2025-02-07T17:07:02Z" status: Completed steps: - duration: 26m36.355605528s id: openstack message: Ready name: Update OpenStack and Tungsten Fabric startedAt: "2025-02-07T17:07:02Z" status: Completed - duration: 6m1.124356485s id: ceph message: Ready name: Update Ceph startedAt: "2025-02-07T17:33:38Z" status: Completed - duration: 24m3.151554465s id: k8s-controllers message: Ready name: Update host OS and Kubernetes components on master nodes startedAt: "2025-02-07T17:39:39Z" status: Completed - duration: 1h19m9.359184228s id: k8s-workers-vdrok-child-default message: Ready name: Update host OS and Kubernetes components on worker nodes, group vdrok-child-default startedAt: "2025-02-07T18:03:42Z" status: Completed - duration: 2m0.772243006s id: mcc-components message: Ready name: Auxiliary components update startedAt: "2025-02-07T19:22:51Z" status: Completed
Monitor the
messageandstatusfields of the first step. Themessagefield contains information about the progress of the current step. Thestatusfield can have the following values:NotStartedScheduledSince 24.3InProgressAutoPausedTechPreview since 25.1StuckCompleted
The
Scheduledstatus indicates that a step is already triggered but its execution has not started yet.The
AutoPausedstatus indicates that the update process is paused by a firing StackLight alert defined in theUpdateAutoPauseobject. For details, see Configure update auto-pause.The
Stuckstatus indicates an issue and that the step can not fit into the ETA defined in thedurationfield for this step. The ETA for each step is defined statically and does not change depending on the cluster.Caution
The status is not populated for the
ClusterUpdatePlanobjects that have not been started by adding thecommence: trueflag to the first object step. Therefore, always start updating the object from the first step.Optional. Available since MOSK 24.3. Add or remove update groups of worker nodes on the fly, unless the update of the group that is being removed has already been scheduled, or if a newly set group will have an index that is lower or equal to another group that is already scheduled. These changes are reflected in
ClusterUpdatePlan.You can also reassign a machine to a different update group while the cluster is being updated, but only if the new update group has an index higher than the index of the last scheduled worker update group. Disabled machines are considered as updated immediately.
Note
Depending on the number of update groups for worker nodes present in the cluster, the number of steps in
specdiffers. Each update group for worker nodes that has at least one machine will be represented by a step with the IDk8s-workers-<UpdateGroupName>.Proceed with changing the
commenceflag of the following update steps granularly depending on the cluster update requirements.Caution
Launch the update steps sequentially. A consecutive step is not started until the previous step is completed.
Strongly recommended. Back up MKE as described in Mirantis Kubernetes Engine documentation: Back up MKE.
Since the procedure above modifies the cluster configuration, a fresh backup is required to restore the cluster in case further reconfigurations fail.
See also
Granularly update MOSK using the Container Cloud web UI
Available since MOSK 25.1
Verify that the management cluster is upgraded successfully as described in Verify the management cluster status before MOSK update.
Optional. Technology Preview. Enable update auto-pause to be triggered by specific StackLight alerts. For details, see Configure update auto-pause.
Log in to the Container Cloud web UI with the
m:kaas:namespace@operatororm:kaas:namespace@writerpermissions.Switch to the required project using the Switch Project action icon located on top of the main left-side navigation panel.
On the Clusters page, in the Updates column of the required cluster, click the Available link. The Updates tab opens.
Note
If the Updates column is absent, it indicates that the cluster is up-to-date.
Note
For your convenience, the Cluster updates menu is also available in the right-side kebab menu of the cluster on the Clusters page.
On the Updates page, click the required version in the Target column to open update details, including the list of update steps, current and target cluster versions, and estimated update time.
In the Target version section of the Cluster update window, click Release notes and carefully read updates about target release, including the Update notes section that contains important pre-update and post-update steps.
Expand each step to verify information about update impact and other useful details.
Select one of the following options:
Enable Auto-commence all at the top-right of the first update step section and click Start Update to launch update and start each step automatically.
Click Start Update to only launch the first update step.
Note
This option allows you to auto-commence consecutive steps while the current step is in progress. Enable the Auto-commence toggle for required steps and click Save to launch the selected steps automatically. You will only be prompted to confirm the consecutive step, all remaining steps will be launched without a manual confirmation.
Before launching the update, you will be prompted to manually type in the target Cluster release name and confirm that you have read release notes about target release.
Caution
Cancelling an already started update step is not supported.
Monitor the status of each step by hovering over the In Progress icon at the top-right of the step window. While the step is in progress, its current status is updated every minute.
Once the required step is completed, the Waiting for input status at the top of the update window is displayed requiring you to confirm the next step.
Strongly recommended. Back up MKE as described in Mirantis Kubernetes Engine documentation: Back up MKE.
Since the procedure above modifies the cluster configuration, a fresh backup is required to restore the cluster in case further reconfigurations fail.
The update history is retained in the Updates tab with the completion timestamp. The update plans that were not started and can no longer be used are cleaned up automatically.
Configure update auto-pause
Available since MOSK 25.1 TechPreview
Using the UpdateAutoPause object, the operator can define specific
StackLight alerts that trigger auto-pause of an update phase execution in
a MOSK cluster. The feature enhances update management of
MOSK clusters by preventing harmful changes to be propagated
across the entire cloud.
Note
The feature is not available for management clusters.
When an update auto-pause is configured on a cluster, the following workflow applies:
During cluster updates, the system continuously monitors for the alerts defined in the
UpdateAutoPauseobjectIf any configured alert fires:
The update process automatically pauses
The
commencefield is removed from all steps that have not startedThe
commencefield is removed from the steps related toUpdate host OS and Kubernetes components on worker nodeseven if the step is in progress, and the step is pausedThe
ClusterUpdatePlanstatus changes toAutoPausedThe firing alerts are recorded in the
UpdateAutoPausestatusA condition is added to the
Clusterobject indicating the pause state
Configure auto-pausing of a MOSK cluster update
Verify that StackLight is enabled on the MOSK cluster.
Create an
UpdateAutoPauseobject with the name that matches your cluster name within the cluster namespace. For example:apiVersion: kaas.mirantis.com/v1alpha1 kind: UpdateAutoPause metadata: name: managed-cluster-example # Must match cluster name namespace: managed-cluster-ns # Must match cluster namespace spec: alerts: - AlertName1 - AlertName2
The list of alerts can include standard and custom StackLight alerts previously configured for the cluster.
For the object spec, see UpdateAutoPause resource.
Apply the configuration:
kubectl apply -f update-autopause.yaml
Resume paused updates
Select one of the following options:
Investigate and resolve the conditions that triggered the alerts, then wait for the alerts to clear automatically
Remove the problematic alert from the
UpdateAutoPauseconfiguration
Set the
commencefield totruefor the relevantUpdatePlansteps to resume the update.
Caution
Admission Controller blocks attempts to set commence: true
while alerts defined in the UpdateAutoPause object are still firing.
Monitor the status of an update auto-pause
You can monitor the status of an update auto-pause using the following resources:
The
UpdateAutoPauseobject status:kubectl get updateautopause <cluster-name> -n <namespace> -o yaml
The
ClusterUpdatePlanobject status that displays the following details:The
AutoPausedstatus when updates are paused.Messages indicating which alerts caused the pause and other relevant information.
StackLight alerts:
ClusterUpdateAutoPaused, which indicates that an update is currently paused.ClusterUpdateStepAutoPaused, which describes specific steps that are paused.
For alert details, see Container Cloud.
Calculate a maintenance window duration for update Deprecated
Deprecation notice
The maintenance window duration calculator is deprecated. Starting from
MOSK 25.1, cloud operators should use the
ClusterUpdatePlan API instead. For details, refer to
ClusterUpdatePlan resource.
This section provides an online calculator for quick calculation of the approximate time required to update your MOSK cluster that uses Open vSwitch as a networking backend.
Additionally, for a more accurate calculation, consider any cluster-specific factors that can have a large impact on the update time in some edge cases, such as number of routers, frequency of CPU, and so on.
Getting access
This section contains instructions on how to get access to different systems of a MOSK cluster.
To obtain endpoints of the MKE web UI and StackLight web UIs such as Prometheus, Alertmanager, Alerta, OpenSearch Dashboards, and Grafana, in the Clusters tab of the Container Cloud web UI, navigate to More > Cluster info.
Note
The Alertmanager web UI displays alerts received by all configured receivers, which can be mistaken for duplicates. To only display the alerts received by a particular receiver, use the Receivers filter.
Generate a kubeconfig for a MOSK cluster using API
This section describes how to generate a MOSK cluster
kubeconfig using the Container Cloud API. You can also download a
MOSK cluster kubeconfig using the
Download Kubeconfig option in the Container Cloud web UI. For
details, see Connect to a MOSK cluster.
To generate a MOSK cluster kubeconfig using API:
Obtain the following details:
Your
<username>with the corresponding password that were created after the management cluster bootstrap as described in Create initial users after a management cluster bootstrap.The
kubeconfigof your<username>that you can download through the Container Cloud web UI using Download Kubeconfig located under your<username>on the top-left of the page.
Obtain the
<cluster>object of the<cluster_name>MOSK cluster:kubectl get cluster <cluster_name> -n <project_name> -o yaml
Obtain the access token from Keycloak for the
<username>user:curl -d 'client_id=<cluster.status.providerStatus.oidc.clientId>' --data-urlencode 'username=<username>' --data-urlencode 'password=<password>' -d 'grant_type=password' -d 'response_type=id_token' -d 'scope=openid' <cluster.status.providerStatus.oidc.issuerURL>/protocol/openid-connect/token
Generate the MOSK cluster
kubeconfigusing the data from<cluster.status>and<token>obtained in the previous steps. Use the following template as an example:apiVersion: v1 clusters: - name: <cluster_name> cluster: certificate-authority-data: <cluster.status.providerStatus.apiServerCertificate> server: https://<cluster.status.providerStatus.loadBalancerHost>:443 contexts: - context: cluster: <cluster_name> user: <username> name: <username>@<cluster_name> current-context: <username>@<cluster_name> kind: Config preferences: {} users: - name: <username> user: auth-provider: config: client-id: <cluster.status.providerStatus.oidc.clientId> idp-certificate-authority-data: <cluster.status.providerStatus.oidc.certificate> idp-issuer-url: <cluster.status.providerStatus.oidc.issuerUrl> refresh-token: <token.refresh_token> id-token: <token.id_token> name: oidc
Connect to a MOSK cluster
Note
The Container Cloud web UI communicates with Keycloak to authenticate users. Keycloak is exposed using HTTPS with self-signed TLS certificates that are not trusted by web browsers.
To use your own TLS certificates for Keycloak, refer to Configure TLS certificates for cluster applications.
After you deploy a MOSK management or managed cluster, connect to the cluster to verify the availability and status of the nodes as described below.
To connect to a MOSK cluster:
Log in to the Container Cloud web UI with the
m:kaas:namespace@operatororm:kaas:namespace@writerpermissions.Switch to the required project using the Switch Project action icon located on top of the main left-side navigation panel.
In the Clusters tab, click the required cluster name. The cluster page with the Machines list opens.
Verify the status of the manager nodes. Once the first manager node is deployed and has the Ready status, the Download Kubeconfig option for the cluster being deployed becomes active.
Open the Clusters tab.
Click the More action icon in the last column of the required cluster and select Download Kubeconfig:
Enter your user password.
Not recommended. Select Offline Token to generate an offline IAM token. Otherwise, for security reasons, the
kubeconfigtoken expires every 30 minutes of the Container Cloud API idle time and you have to downloadkubeconfigagain with a newly generated token.Click Download.
Verify the availability of the managed cluster machines:
Export the
kubeconfigparameters to your local machine with access to kubectl. For example:export KUBECONFIG=~/Downloads/kubeconfig-test-cluster.yml
Obtain the list of available machines:
kubectl get nodes -o wide
The system response must contain the details of the nodes in the
READYstatus.
To connect to a management cluster:
Log in to a local machine where your management cluster
kubeconfigis located and wherekubectlis installed.Note
The management cluster
kubeconfigis created during the last stage of the management cluster bootstrap.Obtain the list of available management cluster machines:
kubectl get nodes -o wide
The system response must contain the details of the nodes in the
READYstatus.
Access the Keycloak Admin Console
Using the Keycloak Admin Console, you can create or delete a user as well as grant or revoke roles to or from a user. The Keycloak administrator is responsible for assigning roles to users depending on the level of access they need in a cluster.
Obtain access credentials using the CLI
Available since MCC 2.22.0 (Cluster release 11.6.0)
./container-cloud get keycloak-creds --mgmt-kubeconfig <pathToManagementClusterKubeconfig>
Optionally, use the --output key to save credentials in a YAML file.
Example of system response:
Keycloak admin credentials:
Address: https://<keycloak-ip-adress>/auth
Login: keycloak
Password: foobar
Obtain access credentials using kubectl
kubectl get cluster <mgmtClusterName> -o=jsonpath='{.status.providerStatus.helm.releases.iam.keycloak.url}'
The system response contains the URL to access the Keycloak Admin Console.
The user name is keycloak by default. The password is located in
passwords.yaml generated during bootstrap.
You can also obtain the password from the iam-api-secrets secret
in the kaas namespace of the management cluster and
decode the content of the keycloak_password key:
kubectl get secret iam-api-secrets -n kaas -o=jsonpath='{.data.keycloak_password}' | base64 -d
Access the Tungsten Fabric web UI
The Tungsten Fabric (TF) web UI allows for easy and fast TF resources
configuration, monitoring, and debugging. You can access
the TF web UI through either the Ingress service or the Kubernetes Service
directly. TLS termination for the https protocol is performed through the
Ingress service.
Note
Mirantis OpenStack for Kubernetes provides the TF web UI as is and does not include this service in the support Service Level Agreement.
To access the TF web UI through Ingress:
Log in to a local machine where kubectl is installed.
Obtain and export
kubeconfigof your managed cluster as described in Connect to a MOSK cluster.Obtain the password of the Admin user:
kubectl -n openstack get secret keystone-keystone-admin -ojsonpath='{.data.OS_PASSWORD}' | base64 -d
Obtain the external IP address of the Ingress service:
kubectl -n openstack get services ingress
Example of system response:
NAME TYPE CLUSTER-IP EXTERNAL-IP PORT(S) AGE ingress LoadBalancer 10.96.32.97 10.172.1.101 80:34234/TCP,443:34927/TCP,10246:33658/TCP 4h56m
Note
Do not use the
EXTERNAL-IPvalue to directly access the TF web UI. Instead, use the FQDN from the list below.Obtain the FQDN of
tf-webui:Note
The command below outputs all host names assigned to the TF web UI service. Use one of them.
kubectl -n tf get ingress tf-webui -o custom-columns=HOSTS:.spec.rules[*].host
Configure DNS to access the TF web UI host as described in Configure DNS to access OpenStack.
Use your favorite browser to access the TF web UI at
https://<FQDN-WEBUI>.
Add a cluster to Lens
For quick and easy inspection and monitoring, you can add a MOSK cluster to Lens using the Container Cloud web UI. The following options are available in the More action icon menu of each cluster:
Add cluster to Lens
Open cluster in Lens
Before you can start monitoring your clusters in Lens, install the Container Cloud Lens extension as described below.
Install the Container Cloud Lens extension
Start Lens.
Verify that your Lens version is 4.2.4 or later.
Select Lens > Extensions.
Copy and paste the following text into the Install Extension field:
@mirantis/lens-extension-cc
Click Install.
Verify that the Container Cloud Lens extension appears in the Installed Extensions section.
Add a cluster to Lens
Enable your browser to open pop-ups for the Container Cloud web UI.
Log in to the Container Cloud web UI with the
m:kaas:namespace@operatororm:kaas:namespace@writerpermissions.Open the Clusters tab.
Verify that the target cluster is successfully deployed and is in the Ready status.
In the last column of the target cluster area, click the More action icon and select Add cluster to Lens.
In the Add Cluster To Lens window, click Add. The system redirects you to Lens that now contains the previously added cluster.
Caution
If prompted, allow your browser to open Lens.
Open a cluster in Lens
Add the target cluster to Lens as described above.
Log in to the Container Cloud web UI with the
m:kaas:namespace@operatororm:kaas:namespace@writerpermissions.Open the Clusters tab.
In the last column of the target cluster area, click the More action icon and select Open cluster in Lens.
OpenStack operations
The section covers the management aspects of an OpenStack cluster deployed on Kubernetes.
Migrate networking from Open vSwitch to Open Virtual Network
Available since MOSK 25.2
This section describes the in-place migration of the MOSK cloud from the Neutron ML2 plugin with the Open vSwitch (OVS) mechanism driver to the Neutron ML2 plugin with the Open Virtual Network (OVN) mechanism driver. The procedure is designed to minimize downtime for user workloads.
Caution
Mirantis strongly recommends performing the preparation and migration of your networking from OVS to OVN in a staging environment before executing the procedure in production.
Testing the full migration in a staging environment that closely mirrors the target environment configuration is essential to identify potential issues early and minimize operational risk.
Additionally, no automated rollback to OVS is available. The only option is to restore the Neutron database from a backup. Such a rollback may cause significant downtime for user workloads, and the network state may remain inconsistent even after restoration.
Step |
Description |
|---|---|
0 |
Staging environment setup. Performing the preparation and migration of your networking in a staging environment. |
1 |
Pre-migration verification. |
2 |
Resolution of the failed checks. This may include adjustement of MTU for VXLAN tenant networks that, due to long default DHCP lease duration, may take more than 24 hours |
3 |
Increase of the DHCP lease time. Due to long default DHCP lease duration, may take more than 24 hours. |
4 |
Main maintenance window:
|
5 |
Verification and cleanup |
For a detailed description of each step, refer to the sections below.
Migration limitations and impact
This section describes the known limitations, unsupported and partially supported features, and the potential impact on workloads and API availability when migrating from Open vSwitch (OVS) to Open Virtual Network (OVN). Review these considerations carefully before planning and performing the migration.
Caution
The behavior of partially supported features depends on the specifics of your hardware and software environment. Mirantis strongly recommends conducting additional preparation and testing in a staging environment for such functionality. For further guidance, contact Mirantis support.
Environments using SR-IOV ports with floating IP addresses as per upstream #1875852 known issue. This issue impacts scheduling of external ports used in OVN for SR-IOV ports and related router ports, which may lead to loss of connectivity to SR-IOV ports through the floating IP.
Networks that require North/South traffic fragmentation as per upstream #2032817 known issue.
Routed VLAN/Flat networks as per upstream #1995078 known issue.
DPDK acceleration
VLAN transparency
Migration from OVS with VXLAN to OVN with VXLAN. VXLAN encapsulation is not recommended for OVN and has several limitations compared to OVN with Geneve. The current migration implementation forcefully converts all existing VXLAN networks to Geneve.
BGP VPN aaS
East-West traffic encryption (IPSec)
Networks requiring East-West traffic fragmentation as per upstream #2085099 known issue
VPNaaS
Floating IP Port Forwarding and DVR as per upstream #2028846 known issue
Restarting the Networking service (OpenStack Neutron) components during migration may result in temporary workload downtime. The duration of downtime depends on the size and density of the environment.
During migration, the Networking service (OpenStack Neutron) API may be unavailable for several hours. While the API is down, new instance creation and most of the Compute and Networking API requests will fail. Plan the maintenance window carefully to minimize API activity in the environment during this period.
Prepare environment for migration
Before starting actual migration, assess the cloud’s eligibility and readiness. There are known differences between Open vSwitch (OVS) and Open Virtual Network (OVN) mechanism drivers that may cause functional gaps and user workload impact if not properly addressed beforehand.
MOSK provides the tooling to help assess the environment and determine whether it is safe to proceed. The assessment checks highlight potential risks and guide operators in remediating issues.
This subsection outlines the key differences between the two networking backends, the potential risks they may introduce, and how they can be mitigated. This content is conceptual. Detailed, step-by-step instructions for adjusting your environment to miniize risks and ensure smooth migration are provided later in this migration guide, exactly where the operator will need them.
Unlike OVS, the OVN mechanism driver uses Geneve as the tenant network encapsulation protocol. Geneve headers are larger than VXLAN headers, which may cause connectivity issues if the physical network MTU is too small to accommodate the encapsulated packet size (tenant network MTU plus Geneve overhead).
As part of the preparation activity, the operator needs to adjust the MTU for affected networks before migration.
See also
The OVS mechamism driver creates security group rules that allow unrestricted egress traffic. For example, this permits instances to access the DHCP server. If these rules are removed, Neutron automatically adds implicit rules to allow DHCP access.
The OVN mechanism driver does not create such implicit rules. If the environment relies on these rules, the operator must add them manually before migration.
There are significant differences in how Neutron with OVS and Neutron with OVN
propagates default DNS server addresses to instances when the subnet does not
have the dns_nameservers option set:
OVS: DHCP agents (dnsmasq) forward DNS requests to the upstream servers specified in the
spec:features:neutron:dns_serverskey of theOpenStackDeploymentcustom resource. Instances are configured to use the DHCP agent IP addresses as DNS servers and forward requests to them.OVN: OVN does not support forwarding DNS requests to upstream servers as per upstream known issue #1902950. In MOSK, OVN takes the DNS server IP addresses from the
spec:features:neutron:dns_serverskey in theOpenStackDeploymentcustom resource and provides them directly to instances through DHCP. OVN can then intercept DNS traffic sent to these addresses.
As a result, during migration, the DNS server address provided by the Neutron OVS mechanism driver stops working. It may take a long time for instances to obtain the new DNS server addresses because the lease renewal from Neutron DHCP to OVN DHCP occurs only through the broadcast request. If the lease duration is set to 24 hours, it can take up to 21 hours before the instance obtains the new DNS addresses, resulting in a long DNS unavailability.
To prevent this, the operator must explicitly configure DNS servers for each affected subnet before migration.
See also
Caution
Mirantis strongly recommends performing the preparation and migration of your networking from OVS to OVN in a staging environment before executing the procedure in production.
Testing the full migration in a staging environment that closely mirrors the target environment configuration is essential to identify potential issues early and minimize operational risk.
Additionally, no automated rollback to OVS is available. The only option is to restore the Neutron database from a backup. Such a rollback may cause significant downtime for user workloads, and the network state may remain inconsistent even after restoration.
Deploy reference canary workloads on all compute nodes. Mirantis recommends booting one instance per compute node. Ensure that instances use the same operating system as typical user workloads in the target environment.
If Workload Availability monitoring is available in your environment, you can add instances with floating IP addresses by setting the following tag:
openstack --os-compute-api-version 2.26 server set \ --tag openstack.lcm.mirantis.com:prober <INSTANCE-ID>
Run the pre-migration verification and resolve failed checks as described in Perform pre-migration verification.
Increase the DHCP lease duration by modifying the default value for the
dhcp_lease_durationparameter in theOpenStackDeploymentcustom resource. During migration, the DHCP server might temporarily become unavailable. To prevent early DHCP lease expiration, Mirantis recommends increasing the value to 3 days:spec: services: networking: neutron: values: conf: dhcp_agent: DEFAULT: dhcp_lease_duration: 259200
Normally, the default value of
dhcp_lease_durationis 24 hours. Therefore, wait at least 24 hours and verify that the newdhcp_lease_durationvalue is applied. For example, on Ubuntu:netplan ip leases <INTERFACE>
Example of system response:
ADDRESS=10.5.0.232 NETMASK=255.255.255.0 ROUTER=10.5.0.1 SERVER_ADDRESS=10.5.0.3 NEXT_SERVER=10.5.0.3 BROADCAST=10.5.0.255 MTU=1430 T1=56 T2=226796 LIFETIME=259200 DNS=10.172.1.100 DOMAINNAME=openstack.internal HOSTNAME=test-vm130 ROUTES=169.254.169.254/32,10.5.0.3 0.0.0.0/0,10.5.0.1 CLIENTID=ffb55e67ff00020000ab1186dc66d3eb27cdcc
Create a database backup as close as possible to maintenance window to ensure the backup reflects the latest state of the environment:
Log in to the
osdplcontainer:kubectl -n osh-system exec -it deployment/rockoon -c osdpl -- bash
Initiate the database backup:
osctl-ovs-ovn-migrate backup_dbAn example of backup utility log output:
osctl@rockoon-997c99cf6-6t7kf:/$ osctl-ovs-ovn-migrate backup_db 2025-08-06 10:44:53,615 [INFO] rockoon.cli.ovs_ovn_migration: Backing up database 2025-08-06 10:44:53,824 [WARNING] rockoon.cli.ovs_ovn_migration: Backup database in disabled state 2025-08-06 10:44:53,845 [INFO] rockoon.cli.ovs_ovn_migration: Backing up Neutron database 2025-08-06 10:44:56,837 [INFO] rockoon.kube: Waiting for 600 StatefulSet/mariadb-server is ready 2025-08-06 10:44:56,846 [INFO] rockoon.kube: The StatefulSet/mariadb-server is ready 2025-08-06 10:44:56,846 [INFO] rockoon.cli.ovs_ovn_migration: Desyncing mariadb on mariadb-server-2 from Galera cluster 2025-08-06 10:44:57,110 [INFO] rockoon.cli.ovs_ovn_migration: Waiting galera to become Desynced 2025-08-06 10:45:07,129 [INFO] rockoon.cli.ovs_ovn_migration: Waiting galera to become Desynced 2025-08-06 10:45:17,153 [INFO] rockoon.cli.ovs_ovn_migration: Waiting galera to become Desynced 2025-08-06 10:45:17,478 [INFO] rockoon.cli.ovs_ovn_migration: Galera cluster member is Desynced. 2025-08-06 10:45:17,479 [INFO] rockoon.cli.ovs_ovn_migration: Desynced mariadb on mariadb-server-2 from Galera cluster 2025-08-06 10:45:17,479 [INFO] rockoon.cli.ovs_ovn_migration: Starting Neutron database backup on mariadb-server-2 2025-08-06 10:45:18,577 [INFO] rockoon.cli.ovs_ovn_migration: Neutron database dump on mariadb-server-2 is completed 2025-08-06 10:45:18,578 [INFO] rockoon.cli.ovs_ovn_migration: Syncing mariadb on mariadb-server-2 back to Galera cluster 2025-08-06 10:45:18,917 [INFO] rockoon.kube: Waiting for 600 StatefulSet/mariadb-server is ready 2025-08-06 10:45:28,961 [INFO] rockoon.kube: The StatefulSet/mariadb-server is ready 2025-08-06 10:45:28,962 [INFO] rockoon.cli.ovs_ovn_migration: Synced mariadb on mariadb-server-2 back to Galera cluster
This command performs the following actions:
Triggers a full physical database backup using the
mariadb-phy-backupcronjob (only if periodic database backups are enabled inOpenStackDeployment).Executes a MySQL dump of the Neutron database on the highest-index
mariadb-serverreplica. The resulting dump is stored in the pod’s MariaDB data directory, which is/var/lib/mysql/.
Verify that the MySQL dump is present in the MariaDB pod:
kubectl -n openstack exec -t mariadb-server-2 -- bash -c \ 'find /var/lib/mysql/ -name neutron-ovs* -exec basename {} \; | sort -rn'
An example of positive system response:
neutron-ovs-ovn-migration-20250806104517.sql
After completing these steps, proceed with the migration as described in Perform migration.
Perform pre-migration verification
This section describes how to run the pre-migration check, collect the results, and resolve the critical issues before migrating your OpenStack deployment from Open vSwitch (OVS) to Open Virtual Network (OVN). This ensures smooth migration minimizing the risk of unexpected downtime and errors.
To run the pre-migration verification, execute the following command from the
OpenStackDeployment container in the Rockoon pod:
osctl-ovs-ovn-migrate preflight_checks
By default, MOSK stores the check results in the
/tmp/ovs-ovn-migration/preflight_checks-<TIMESTAMP>.yaml file inside the
OpenStackDeployment container. Use this file to resolve the detected
issues as it contains UUIDs of the OpenStack resources that violate conditions
of checks.
If any check with CRITICAL severity fails, it gets the ERROR state in
the results file. Mirantis strongly recommends avoiding migration until you
properly solve all critical issues detected by the pre-migration check.
Example of the content of the preflight_checks.yaml file
networks_mtu_size_check:
description: Found networks that have unsuitable MTU size for Geneve. Workloads
availability will be broken after migration. Please adjust MTU for networks. Migration
is not recommended.
state: ERROR
violations:
- 8b143e7c-9580-421a-adc0-788bef321b0d
networks_provider_type_check:
description: Found networks (containing instances) which have problematic provider
network type. OVN has multiple issues related to usage of ['vlan', 'flat'] networks.
state: WARNING
violations:
8cde0239-21a0-4d26-95bd-17fc77d13ad2:
instances:
- '74340fa3-6a70-4736-a378-2246deb52366'
provider_type: vlan
networks_provider_type_routing_check:
description: Found networks (containing instances) which have problematic provider
network type and are connected to routers. OVN has issues with routing of ['vlan',
'flat'] networks. Each use case should be carefully checked. Migration is not
recommended.
state: ERROR
violations:
31800eb1-fc73-47f6-a745-04bc04c99fa1:
instances:
- d6d84dde-c748-4efb-a053-4f3a617811f8
provider_type: vlan
routers:
- 9f4bdb50-d716-4473-9bf7-ec3b381f472d
754804bd-c7dd-488c-83ca-c6ac8af64cd0:
instances:
- 8edcc6df-ebc1-474c-961b-ad51bd74df6a
- b2dffcda-f809-4925-a113-704f628a021f
provider_type: vlan
routers:
- 9f4bdb50-d716-4473-9bf7-ec3b381f472d
d957e578-28e6-41a7-9936-c2ce5f5a7e1b:
instances:
- ba917876-c2a5-42a6-9f2a-9670187be122
provider_type: vlan
routers:
- 13d5afc2-9538-4d91-8e5a-e633ce93ec1a
neutron_tenant_network_types_check:
description: Found tenant_network_types option containing VXLAN network type. Recommended
network type for OVN is Geneve. When migrating to OVN all existing VXLAN networks
will be converted to Geneve regardless of this setting. As well as all new networks
will be created with Geneve network type.
state: WARNING
violations:
- features:neutron:tenant_network_types
- services:networking:neutron:values:conf:neutron:ml2:tenant_network_types
- services:networking:neutron:values:conf:plugins:ml2_conf:ml2:tenant_network_types
ports_with_blocked_access_to_dhcpv4_check:
description: Found ports which have incorrect security group rules for access to
DHCP. Instances may lose network connectivity after migration. Please configure
correct rules to allow access to DHCPv4 service. Migration is not recommended.
state: ERROR
violations:
- 7accccc6-b6dc-4947-82f2-61831cd21cf7
routers_gateway_mtu_check:
description: OVN can only send packet 'ICMP fragmentation needed'. It may not be
handled by all workloads correctly. Additional analysis is needed.
state: WARNING
violations:
513546e1-eeb2-49aa-a6d7-e52ae216aa46:
external_net_id: ab00080d-a5dc-4602-843b-9eceac07a213
networks_mtu:
59ea5d3d-ca4f-4fd5-b522-7108c8fa9c4f: 1300
ab00080d-a5dc-4602-843b-9eceac07a213: 1480
c7b27b46-ebbb-40a8-8e82-db78387aea1b: 1400
9f4bdb50-d716-4473-9bf7-ec3b381f472d:
external_net_id: ab00080d-a5dc-4602-843b-9eceac07a213
networks_mtu:
31800eb1-fc73-47f6-a745-04bc04c99fa1: 1400
754804bd-c7dd-488c-83ca-c6ac8af64cd0: 1300
ab00080d-a5dc-4602-843b-9eceac07a213: 1480
routers_internal_mtu_check:
description: Since OVN can not fragment packets by itself connectivity between specified
networks will be broken. Please make sure that all networks plugged into the router
have the same MTU value. Migration is not recommended.
state: ERROR
violations:
513546e1-eeb2-49aa-a6d7-e52ae216aa46:
networks_mtu:
59ea5d3d-ca4f-4fd5-b522-7108c8fa9c4f: 1300
c7b27b46-ebbb-40a8-8e82-db78387aea1b: 1400
9f4bdb50-d716-4473-9bf7-ec3b381f472d:
networks_mtu:
31800eb1-fc73-47f6-a745-04bc04c99fa1: 1400
754804bd-c7dd-488c-83ca-c6ac8af64cd0: 1300
sriov_ports_floating_ip_check:
description: No issues found
state: SUCCESS
violations: {}
subnets_ip_address_availability_check:
description: 'Found subnets that do not have free IPs. Metadata ports may not be
created aftser migration. Metadata will not be available for instances after migration. '
state: WARNING
violations:
- e0053e1b-ddf9-4192-a28c-7f661e7692e6
subnets_without_dns_nameservers_check:
description: Found subnets that do not have dns nameservers set. Access to DNS from
instances will be broken. Please set dns nameservers for subnets manually. Migration
is not recommended.
state: ERROR
violations:
- 33edd520-f14e-40ad-ba77-721084594949
- 711fd1b0-a763-42c3-986e-44a291b79db8
- 85ba9a6b-659c-4ce8-b58a-d3c34c796f45
- 96d72182-886e-4d12-ab20-76ce81d526af
- d4738c9a-a8d6-4e1b-a5a0-0eb92aafc4c6
- e0053e1b-ddf9-4192-a28c-7f661e7692e6
- e0be287d-0137-4ba4-a963-8739cc19465f
subnets_without_enabled_dhcp_check:
description: No issues found
state: SUCCESS
violations: []
unsupported_features_check:
description: No issues found
state: SUCCESS
violations: {}
Copy the pre-migration checks results file to the
keystone-clientpod:kubectl -n osh-system cp <ROCKOON-POD>:/tmp/ovs-ovn-migration/preflight_checks_<TIMESTAMP>.yaml ./reflight_checks_<TIMESTAMP>.yaml kubectl -n openstack cp preflight_checks_<TIMESTAMP>.yaml <KEYSTONE-CLIENT-POD>:/tmp/
Convert the pre-migration checks results file to the JSON format. You will use its content later to fix violating resources:
python3 -c 'import sys, yaml, json; y=yaml.safe_load(sys.stdin.read()); print(json.dumps(y))' < /tmp/preflight_checks_<TIMESTAMP>.yaml > /tmp/preflight_checks.json
Review every failed check carefully and resolve issues as described in the table below.
OVS to OVS pre-migration checks¶ Preflight check
Failure reason
Resolution
networks_mtu_size_checkNetwork MTU is not suitable for Geneve.
Adjust MTUs of the affected networks as described in Adjust MTU for VXLAN tenant networks.
networks_provider_type_checknetworks_provider_type_routing_checkVLAN or flat networks are used.
Contact Mirantis support for further guidance.
neutron_tenant_network_types_checkVXLAN tenant network type is configured in the
OpenStackDeploymentcustom resource while the recommended network type for OVN is Geneve.The result of this check contains all paths in
OpenStackDeployment, where VXLAN is configured. Remove the VXLAN network type after migration.ports_with_blocked_access_to_dhcpv4_checkSecurity group rules prevent DHCP access for instance ports.
The result of this check contains UUIDs of the affected instance ports. Adjust security groups to allow DHCP as described in Adjust security groups to allow access to DHCP and Metadata.
routers_gateway_mtu_checkRouter gateway MTU differs from networks MTU connected to this router.
Align the router MTU of gateway port with networks MTU connected to this router.
routers_internal_mtu_checkTenant networks connected to the router have inconsistent MTU.
Ensure that all tenant networks connected to the router have the same MTU.
sriov_ports_floating_ip_checkIssues with SR-IOV ports and assigned floating IP addresses.
Contact Mirantis support for further guidance.
subnets_ip_address_availability_checkSubnets have no available IP addresses.
The result of this check contains UUIDs of subnets that do not have available IP addresses. Free at least one IP address per subnet for the OVN Metadata agent.
If you cannot free IP addresses before migration, the IP adresses used for the Neutron OVS DHCP agent will be released automatically during migration when the related ports are cleaned up. To make the Neutron OVN Metadata agent use these freed addresses, restart the metadata agent pods. Then wait untill an instance renews the DHCP lease, or manually renew the address from inside the instance. By default, the DHCP lease is renewed every six hours.
Note
The route to the Metadata service used by an instance before migration may change during migration when the Metadata agent port is created. This route is updated when the instance renews its DHCP lease. Some operating systems may keep the old route in the instance routing table even after the lease renewal. In such cases, the operator must update the route manually.
subnets_without_dns_nameservers_checkSubnets are missing DNS nameservers.
Configure the DNS nameservers as described in Migrate networking from Open vSwitch to Open Virtual Network.
subnets_without_enabled_dhcp_checkVXLAN subnets have DHCP disabled.
The result of this check contains UUIDS of subnets related to the VXLAN networks that have DHCP disabled. Considering the need to adjust the MTU for VXLAN networks, such subnets will not receive the required MTU size automatically. You need to adjust the MTU size on instance ports within these subnets from inside each affected instance manually as descirbed in Adjust MTU for VXLAN tenant networks.
unsupported_features_checkUnsupported features detected for OVN.
Disable unsupported features before migration.
Caution
OVN supports VPNaaS, but MOSK does not currently support seamless migration from OVS to OVN in such setup. This limitation is not detected by
unsupported_features_check. If your deployment uses VPNaaS, avoid migrating to OVN.
After you resolve all issues, rerun the pre-migration check to verify that you have successfully resolved all critical issues and can proceed with the actual migration.
Adjust security groups to allow access to DHCP and Metadata
To ensure that instances have access to the DHCP and Neutron Metadata services
after migration to OVN, adjust the security groups that violate the
pre-migration ports_with_blocked_access_to_dhcpv4_check check:
Log in to the
keystone-clientpod:kubectl -n openstack exec -it deployment/keystone-client -- bash
Obtain the list of the ports with the blocked DHCPv4 access:
IFS=','; ports=$(cat /tmp/preflight_checks.json | jq -c .ports_with_blocked_access_to_dhcpv4_check.violations | tr -d [] | tr -d \")
Obtain the list of security groups for each port from the list obtained in the previous step:
for p in $ports; do echo "Port $p security groups:" openstack port show $p -f json -c security_group_ids | jq -c .security_group_ids | tr -d [] | tr -d \" done
Analyze security group rules for each security group associated with ports in question. To list security group rules:
openstack security group rule list <SECURITY-GROUP-ID>
To allow access from instances to the DHCP server, add the following rules to the related security group:
openstack security group rule create --egress \ --ethertype IPv4 \ --protocol udp\ --dst-port 67 ${SEC_GROUP_ID}
The remote IP address may differ depending on the DHCPv6 mode.
openstack security group rule create --egress \ --ethertype IPv6 \ --protocol udp \ --dst-port 547 \ --remote-ip ff02::1:2 ${SEC_GROUP_ID}
To allow access from instances to the Metadata server, add the following rules to the related security group:
openstack security group rule create --egress \ --ethertype IPv4 \ --protocol tcp \ --remote-ip 169.254.169.254 \ --dst-port 80 ${SEC_GROUP_ID}
The remote IP address may differ depending on the DHCPv6 mode.
openstack security group rule create --egress \ --ethertype IPv6 \ --protocol tcp \ --remote-ip fe80::a9fe:a9fe ${SEC_GROUP_ID}
Adjust MTU for VXLAN tenant networks
Incorrect MTU settings can lead to packet fragmentation, dropped packets, or even complete connectivity loss. To avoid these issues, you must ensure that the MTU is properly configured across all VXLAN tenant networks before migrating.
In OpenStack, the DHCP service distributes migration-sensitive
information, such as IP addresses, MTU size, and routes to metadata
services. If some of your networks have subnets with
enable_dhcp = False, you must manually configure each instance in
those subnets before migration.
Note
Not all operating systems allow the MTU size and DHCP renewal interval (T1) to be dynamically updated through DHCP. Ensure that the operating systems used in your instances can update MTU and T1 values upon DHCP lease renewal.
To adjust MTU for VXLAN tenant networks:
Decrease the DHCP renewal interval (T1).
This parameter sets the IP address renewal period in seconds. It also corresponds to the maximum potential network downtime during MTU size change. By default, T1 is set to half of the value of Neutron
dhcp_lease_durationoption. The default value ofdhcp_lease_durationis 24 hours. You must significantly reduce the T1 value before changing MTU size on Neutron networks.To set a new value for T1, edit the
OpenStackDeploymentobject as follows:spec: services: networking: neutron: values: conf: dhcp_agent: DEFAULT: dhcp_renewal_time: 60
In this example, T1 is set to 60 seconds. Setting this value too low increases the load on the DHCP server, as all instances will request IP renewals more often. After applying the new value, wait at least 24 hours before proceeding.
Ensure that the new DHCP settings are applied to all instances, for example, by running tcpdump inside an instance to verify the frequency of DHCP requests and replies:
tcpdump -nei <INTERFACE> udp port 67 or udp port 68
If some instances in VXLAN subnets have statically assigned IP addresses (DHCP is disabled for those subnets), manually decrease the MTU by updating the network interface configuration inside each affected instance.
Calculate the new MTU value, use the following formula:
NEW_MTU_SIZE = min(global_physnet_mtu, path_mtu) - tunnel_ip_header_size - geneve_overhead_size
Where:
tunnel_ip_header_sizeequals to20for IPv4 tunnelsgeneve_overhead_sizeequals to38
To obtain
global_physnet_mtu:kubectl -n openstack get osdpl osh-dev \ -o jsonpath='{.spec.services.networking.neutron.values.conf.neutron.DEFAULT.global_physnet_mtu}'
Note
If
global_physnet_mtuis not defined, use the default value of1500.To obtain
path_mtu:kubectl -n openstack get osdpl osh-dev \ -o jsonpath='{.spec.services.networking.neutron.values.conf.neutron.ml2.path_mtu}'
Note
If
path_mtuis not defined, ignore it.For example, if
global_physnet_mtu = 1500andpath_mtu = 0, the new MTU value should be1442:NEW_MTU_SIZE = 1500 - 20 - 38 = 1442
Update the MTU on Neutron VXLAN networks by copying the list of affected networks from the pre-migration check results and running the following commands inside the
keystone-clientpod:IFS=','; networks=$(cat /tmp/preflight_checks.json | jq -c .networks_mtu_size_check.violations | tr -d [] | tr -d \") for net in $networks; do openstack network set --mtu <NEW_MTU_SIZE> ${net} ; done
Verify that the new MTU value is applied by logging in to instances and running:
ip link show <INTERFACE>
Example output:
2: ens3: <BROADCAST,MULTICAST,UP,LOWER_UP> mtu 1442 qdisc fq_codel state UP mode DEFAULT group default qlen 1000 link/ether fa:16:3e:fb:a3:88 brd ff:ff:ff:ff:ff:ff
After completing these steps, all VXLAN tenant networks will use the correct MTU size. Instances will receive updated MTU settings, reducing the risk of packet loss or downtime during the migration to OVN.
Adjust DNS servers for subnets
Use this procedure if the subnets_without_dns_nameservers_check fails in
the pre-migration checks. This check indicates that some subnets are missing
DNS nameserver configuration. Configuring DNS servers is required to ensure
that instances can resolve domain names after migration from Open vSwitch
(OVS) to Open Virtual Network (OVN).
To configure DNS servers for affected subnets:
Obtain the list of addresses of default DNS nameservers from the
OpenStackDeploymentobject:kubectl -n openstack get osdpl osh-dev \ -o jsonpath='{.spec.features.neutron.dns_servers}'
Verify that these DNS servers are reachable and can resolve DNS queries from instances.
Update the DNS servers for affected subnets by logging in to the
keystone-clientpod and running:IFS=','; subnets=$(cat /tmp/preflight_checks.json | \ jq -c .subnets_without_dns_nameservers_check.violations | \ tr -d [] | tr -d \") for s in $subnets; do openstack subnet set --dns-nameserver <DNS0> \ --dns-nameserver <DNS1> $s; done
Replace
<DNS0>and<DNS1>with the DNS servers obtained in the previous step.Wait for the DHCP renewal interval to pass so that the new DNS settings are propagated to all instances.
Note
Setting of the DHCP renewal interval (T1) is described in Adjust MTU for VXLAN tenant networks.
Log in to a few instances and verify that the DNS server settings were updated. For example, on systemd-based operating systems, you can check the current DNS servers using:
systemd-resolve --status
After completing this procedure, all affected subnets will have explicitly configured DNS servers, and instances will use these servers for name resolution.
Perform migration
Before starting the migration, ensure that you, as a cloud operator, have read, understood, and assessed the risks and completed all steps described in Prepare environment for migration and Perform pre-migration verification.
Caution
Mirantis strongly recommends performing the preparation and migration of your networking from OVS to OVN in a staging environment before executing the procedure in production.
Testing the full migration in a staging environment that closely mirrors the target environment configuration is essential to identify potential issues early and minimize operational risk.
Additionally, no automated rollback to OVS is available. The only option is to restore the Neutron database from a backup. Such a rollback may cause significant downtime for user workloads, and the network state may remain inconsistent even after restoration.
Verify that the
OpenStackDeploymentobject is in thehealthystate.Launch the migration process from the
OpenStackDeploymentcontainer in the Rockoon pod:osctl-ovs-ovn-migrate migration <OPTIONAL-PARAMETERS>
Optional parameters:
--non-interactiveRuns migration in the non-interactive mode. Default is
False.In interactive mode, the utility prompts for confirmation after each stage. Interactive mode is recommended for production to maintain full control over each step.
--max-workersMaximum number of workers to spawn for parallel operations. Default is
0.By default, the internal defaults for operations are used. For example, for pods parallel operations, such as exec, the number of workers equals to the number of the target pods.
The tool writes all logs with INFO and higher levels to stdout,
and DEBUG level logs to the
/tmp/ovs-ovn-migration/ovs-ovn-migration.log file.
Also, logs from the CLEANUP stage are collected from all nodes
and saved under the /tmp/ovs-ovn-migration/<CLEANUP-DS-NAME/> directory.
Current state of migration execution is stored in ConfigMap that is
created on the first run of osctl-ovs-ovn-migrate migration.
To check the ConfigMap content:
kubectl -n openstack get cm ovs-ovn-migration-state \
-o jsonpath='{.data}' | jq
Example of a positive system response:
{
"10_PREPARE": "{\"status\": \"completed\", \"error\": null}",
"20_DEPLOY_OVN_DB": "{\"status\": \"init\", \"error\": null}",
"30_DEPLOY_OVN_CONTROLLERS": "{\"status\": \"init\", \"error\": null}",
"40_MIGRATE_DATAPLANE": "{\"status\": \"init\", \"error\": null}",
"50_FINALIZE_MIGRATION": "{\"status\": \"init\", \"error\": null}",
"60_CLEANUP": "{\"status\": \"init\", \"error\": null}"
}
Once started, the migration utility performs the following steps:
Checks if the migration state ConfigMap exists. If not, creates it with the
initstate for each stage.For each migration stage:
Checks the status of the stage. If
completed, skips it and moves to next stage.Otherwise:
Sets the status to
started.Executes the stage.
Updates the status to
completedorfaileddepending on the result.In interactive mode, prompts for confirmation before proceeding to the next stage. If running non-interactively, the migration stops immediately if an error occured or proceeds automatically to the next stage.
Example of log output from one of stages:
2025-08-08 14:45:57,640 [INFO] rockoon.cli.ovs_ovn_migration: Running 40_MIGRATE_DATAPLANE stage
Description:
Deploy OVN controller on the same nodes as openvswitch pods are running.
Switch dataplane to be managed by OVN controller and cleanup old dataplane
leftovers.
IMPACT:
WORKLOADS: Short periods of downtime ARE EXPECTED.
OPENSTACK API: Neutron Metadata downtime continues in this stage.
2025-08-08 14:45:59,472 [INFO] rockoon.cli.ovs_ovn_migration: Pre-migration check: Checking ovs db connectivity in ovn controllers
2025-08-08 14:45:59,541 [INFO] rockoon.cli.ovs_ovn_migration: Running command ['ovs-vsctl', '--no-wait', 'list-br'] on pods of daemonsets [<DaemonSet openvswitch-ovn-controller-57e1c5e45daece33>, <DaemonSet openvswitch-ovn-controller-5953263df82fbfb2>]
2025-08-08 14:45:59,547 [INFO] rockoon.cli.ovs_ovn_migration: Waiting command on pods of daemonsets [<DaemonSet openvswitch-ovn-controller-57e1c5e45daece33>, <DaemonSet openvswitch-ovn-controller-5953263df82fbfb2>]
2025-08-08 14:45:59,691 [INFO] rockoon.cli.ovs_ovn_migration: Done waiting command on pods of daemonsets [<DaemonSet openvswitch-ovn-controller-57e1c5e45daece33>, <DaemonSet openvswitch-ovn-controller-5953263df82fbfb2>]
2025-08-08 14:45:59,694 [INFO] rockoon.cli.ovs_ovn_migration: Pre-migration check: Ovs db connectivity check completed
2025-08-08 14:45:59,861 [INFO] rockoon.cli.ovs_ovn_migration: Waiting 600 for openvswitch-ovn-controller-57e1c5e45daece33 to be absent
2025-08-08 14:46:29,907 [INFO] rockoon.cli.ovs_ovn_migration: openvswitch-ovn-controller-57e1c5e45daece33 is absent
2025-08-08 14:46:29,907 [INFO] rockoon.cli.ovs_ovn_migration: Waiting 600 for openvswitch-ovn-controller-5953263df82fbfb2 to be absent
2025-08-08 14:46:29,919 [INFO] rockoon.cli.ovs_ovn_migration: openvswitch-ovn-controller-5953263df82fbfb2 is absent
2025-08-08 14:46:31,799 [INFO] rockoon.helm: Running helm command started: '['upgrade', 'openstack-openvswitch', '/opt/operator/charts/infra/openvswitch', '--namespace', 'openstack', '--values', '/tmp/openstack-openvswitch4n0_cpo2', '--history-max', '1', '--install']'
2025-08-08 14:46:34,891 [INFO] rockoon.helm: Running helm (<rockoon.helm.HelmManager object at 0x7f8074724670>, ['upgrade', 'openstack-openvswitch', '/opt/operator/charts/infra/openvswitch', '--namespace', 'openstack', '--values', '/tmp/openstack-openvswitch4n0_cpo2', '--history-max', '1', '--install'], True, 'openstack-openvswitch'), {} command took 3.091739
2025-08-08 14:46:34,892 [INFO] rockoon.cli.ovs_ovn_migration: Waiting for ['ovn-controller'] to be ready
2025-08-08 14:46:35,083 [INFO] rockoon.kube: Waiting for 600 DaemonSet/openvswitch-ovn-controller-57e1c5e45daece33 is ready
2025-08-08 14:47:05,159 [INFO] rockoon.kube: The DaemonSet/openvswitch-ovn-controller-57e1c5e45daece33 is ready
2025-08-08 14:47:05,160 [INFO] rockoon.kube: Waiting for 600 DaemonSet/openvswitch-ovn-controller-5953263df82fbfb2 is ready
2025-08-08 14:47:05,178 [INFO] rockoon.kube: The DaemonSet/openvswitch-ovn-controller-5953263df82fbfb2 is ready
2025-08-08 14:47:05,180 [INFO] rockoon.cli.ovs_ovn_migration: ['ovn-controller'] are ready
2025-08-08 14:47:05,217 [INFO] rockoon.cli.ovs_ovn_migration: Completed 40_MIGRATE_DATAPLANE stage
2025-08-08 14:47:05,217 [INFO] rockoon.cli.ovs_ovn_migration: Next stage to run is 50_FINALIZE_MIGRATION
Description:
Remove neutron l3 agent daemonsets.
Stop openvswitch pods and disbale migration mode (switch ovn
controllers to start own vswitchd and ovs db containers).
Enable Neutron metadata agents and Neutron rabbitmq.
IMPACT:
WORKLOADS: Short periods of downtime ARE EXPECTED.
OPENSTACK API: Neutron Metadata downtime stops in this stage.
[USER INPUT NEEDED] To proceed to next stage press Y, to abort WHOLE procedure press N --> Y
Step |
Description |
Impact |
|---|---|---|
|
Saving the original Neutron bridge mappings for each node. |
No downtime for the API or workloads. |
|
Disabling the Neutron server and metadata agents, removing all OVS-related Neutron components except for the Neutron L3 agents, and deploying the OVN database components. |
Neutron API and Metadata downtime starts, no downtime for workloads. |
|
Stopping the Neutron RabbitMQ service. Deploying OVN controllers in migration mode. These pods do not contain
Synchronizing the Neutron database with the Starting the Neutron server. |
Neutron metadata downtime continues during this stage. The Neutron API is started to process existing ports, but API operations may fail because OVN is not functional yet. |
|
Stopping the OVN controller. Switching the integration bridges under the OVN controller control on all nodes in parallel. Restoring the original bridge mappings saved during the Cleaning up the OVS dataplane leftovers. Starting the OVN controller. |
Neutron metadata downtime continues during this stage. Short workload downtime is expected. |
|
Removing the Neutron L3 agent DaemonSets. Stopping the OVS pods and disbaling migration mode during, switching
the OVN controllers to start their own Enabling the Neutron metadata agents and the Neutron RabbitMQ service. This stage can take a significant amount of time to complete, as OVN controller pods restart one by one on all nodes. |
Neutron metadata downtime ends. Short workload downtime is expected. |
|
Cleaning up the Neutron API resources. Cleaning up the node system resources related to OVS that include network namespaces, interfaces, and so on. |
No downtime for the API or workloads. |
Verification and cleanup
After completing the migration from Open vSwitch (OVS) to Open Virtual Network (OVN), you must verify that the cloud is fully operational and remove temporary migration-related configurations and reference workloads. This step ensures that the environment is clean, consistent, and ready for production use.
To verify the environment and clean up migration settings:
Verify that the
OpenStackDeploymentcustom resource reports statusAPPLIED.Verify networking connectivity of reference workloads:
Ping the floating IP addresses directly
Verify workload availability in OpenStack
Review the OpenStack Portprober dashboard
If applicable, verify reference workloads access to the Metadata service by logging in to instances through SSH and running, for example:
curl http://169.254.169.254Remove reference workloads that were created during preparation.
Remove migration-related settings from the
OpenStackDeploymentcustom resource. The migration utility patches this resource during its execution. After migration, delete the following keys fromOpenStackDeployment:From the root of
spec, remove themigration:neutron:ovs_ovn_migrationkey.From
spec:services:networking, remove:openvswitch:values:manifests:daemonset_ovn_controllerneutron:values:conf:dhcp_agentneutron:values:conf:manifests:daemonset_metadata_agentneutron:values:conf:manifests:deployment_server
Example of the
spec:services:networkingconfiguration before cleanup:spec: services: networking: neutron: values: conf: dhcp_agent: DEFAULT: dhcp_lease_duration: 259200 dhcp_renewal_time: 60 manifests: daemonset_metadata_agent: true deployment_server: true openvswitch: values: manifests: daemonset_ovn_controller: true
From
spec:services:compute, remove:libvirt:values:pod:lifecycle:upgrades:daemonsets:pod_replacement_strategynova:values:pod:lifecycle:upgrades:daemonsets:pod_replacement_strategy
Example of the
spec:services:computeconfiguration before cleanup:services: compute: libvirt: values: pod: lifecycle: upgrades: daemonsets: pod_replacement_strategy: RollingUpdate nova: values: pod: lifecycle: upgrades: daemonsets: pod_replacement_strategy: RollingUpdate
After completing these steps, your environment will be running with OVN in a clean state, with all temporary migration settings removed. This ensures a stable and maintainable production environment.
Upgrade OpenStack
This section provides instructions on how to upgrade OpenStack to a major version on a MOSK cluster.
Note
The update of the OpenStack components within the same major OpenStack version is performed seamlessly as part of the MOSK cluster update.
Prerequisites
Verify that your OpenStack cloud is running on the latest MOSK release. See Compatibility Matrix for the release matrix and supported upgrade paths.
Just before the upgrade, back up your OpenStack databases. See the following documentation for details:
Verify that OpenStack is healthy and operational. All OpenStack components in the
healthgroup in theOpenStackDeploymentStatusCR should be in theReadystate. See OpenStackDeploymentStatus custom resource for details.Verify the workability of your OpenStack deployment by running Tempest against the OpenStack cluster as described in Run Tempest tests. Verification of the testing pass rate before upgrading will help you measure your cloud quality before and after upgrade.
Read carefully through the Release Notes of your MOSK version paying attention to the Known issues section and the OpenStack upstream release notes for the target OpenStack version.
Calculate the maintenance window and notify users accordingly.
Perform the upgrade
To start the OpenStack upgrade, change the value of the
spec:openstack_version parameter in the OpenStackDeployment object
to the target OpenStack release.
After you change the value of the spec:openstack_version parameter,
the OpenStack Controller initializes the upgrade process.
To verify the upgrade status, use:
Logs from the
osdplcontainer in the OpenStack Controllerrockoonpod.The
OpenStackDeploymentStatusobject.When upgrade starts, the
OPENSTACK VERSIONfield content changes to the target OpenStack version, andSTATEdisplaysAPPLYING:kubectl -n openstack get osdplst
Example of system output:
NAME OPENSTACK VERSION CONTROLLER VERSION STATE osh-dev antelope 0.15.6 APPLYING
When upgrade finishes, the
STATEfield should displayAPPLIED:kubectl -n openstack get osdplst
Example of system output:
NAME OPENSTACK VERSION CONTROLLER VERSION STATE osh-dev antelope 0.15.6 APPLIED
The maintenance window for the OpenStack upgrade usually takes from two to four hours, depending on the cloud size.
Verify the upgrade
Verify that OpenStack is healthy and operational. All OpenStack components in the
healthgroup in theOpenStackDeploymentStatusCR should be in theReadystate. See OpenStackDeploymentStatus custom resource for details.Verify the workability of your OpenStack deployment by running Tempest against the OpenStack cluster as described in Run Tempest tests.
Upgrade from Caracal to Epoxy
Before upgrading, verify that you have completed the Prerequisites.
To upgrade the cloud, complete the upgrade steps
instruction changing the value of the spec:openstack_version parameter
in the OpenStackDeployment object from caracal to epoxy.
Upgrade from Antelope to Caracal
Before upgrading, verify that you have completed the Prerequisites and removed the domains from federation mappings as described below.
Warning
If your MOSK cluster is running version
24.3 and includes the Instance High Availability service (OpenStack
Masakari), the OpenStack upgrade will fail due to an incorrect migration
of the Masakari database from legacy SQLAlchemy Migrate to Alembic caused
by a misconfigured alembic_table. To avoid this issue, follow the
workaround steps outlined in [47603] Masakari fails during the OpenStack upgrade to Caracal before proceeding
with the upgrade.
Warning
If you initially deployed your MOSK cluster
with OpenStack Victoria or earlier releases and gradually upgraded it to
Antelope, and you do not perform periodic cleanups of OpenStack databases
from soft-deleted rows, the upgrade will stuck due to the failing
cinder-db-sync job.
To prevent, diagnose, and fix this issue, perform the workaround steps outlined in [47695] Cinder database sync job fails during upgrade from Antelope to Caracal before proceeding with the upgrade.
MOSK enables you to upgrade directly from Antelope to
Caracal without the need to upgrade to the intermediate Bobcat release.
To upgrade the cloud, complete the upgrade steps
instruction changing the value of the spec:openstack_version parameter
in the OpenStackDeployment object from antelope to caracal.
Important
Perform the domains removal from the federation mappings if your MOSK cluster configuration includes federated identity management system, such as IAM or any other supported identity provider.
Before Caracal, Keystone does not properly handle domain specifications for users in mappings. Even though domains are specified for users, Keystone always creates users in the domain associated with the identity provider the user logs in from.
Starting with Caracal, Keystone honors the domains specified for users in mappings. Many example mappings, including the previous default mapping in MOSK, use domain specifications. After upgrading to Caracal, the new users logging in through federation may be assigned to a different Keystone domain, while existing users will retain their current domain. This behaviour may negatively impact monitoring, compliance, and overall cluster operations.
To maintain the same functionality after the upgrade, remove the domain
element from both the local.user element and local element, which
sets default domain values for user and group elements, from the previous
default mappings.
You can use the openstack mapping commands to manage mappings:
To list available mappings: openstack mapping list
To display the mapping rules: openstack mapping show <name>
To modify the mapping rules: openstack mapping set <name> --rules <rules>
Example mapping rules in Antelope:
[
{
"local": [
{
"user": {
"name": "{0}",
"email": "{1}",
"domain": {
"name": "Default"
}
}
},
{
"groups": "{2}",
"domain": {
"name": "Default"
}
},
{
"domain": {
"name": "Default"
}
}
],
"remote": [
{
"type": "OIDC-iam_username"
},
{
"type": "OIDC-email"
},
{
"type": "OIDC-iam_roles"
}
]
}
]
Example mapping rules in Caracal:
[
{
"local": [
{
"user": {
"name": "{0}",
"email": "{1}"
}
},
{
"groups": "{2}",
"domain": {
"name": "Default"
}
}
],
"remote": [
{
"type": "OIDC-iam_username"
},
{
"type": "OIDC-email"
},
{
"type": "OIDC-iam_roles"
}
]
}
]
Upgrade from Yoga to Antelope
MOSK enables you to upgrade directly from Yoga to Antelope without the need to upgrade to the intermediate Zed release.
Before upgrading, verify that you have completed the Prerequisites.
Important
There are several known issue affecting MOSK clusters running OpenStack Antelope that can disrupt the network connectivity of the cloud workloads.
If your cluster is still running OpenStack Yoga, update to the MOSK 24.2.1 patch release first and only then upgrade to OpenStack Antelope. If you have not been applying patch releases previously and would prefer to switch back to major releases-only mode, you will be able to do this when MOSK 24.3 is released.
If you have updated your cluster to OpenStack Antelope, apply the workarounds described in Release notes: OpenStack known issues for the following issues:
[45879] [Antelope] Incorrect packet handling between instance and its gateway
[44813] Traffic disruption observed on trunk ports
To upgrade the cloud, complete the upgrade steps
instruction changing the value of the spec:openstack_version parameter
in the OpenStackDeployment object from yoga to antelope.
Upgrade from Victoria to Yoga
Caution
If your cluster is running on top of the MOSK 23.1.2 patch version, the OpenStack upgrade to Yoga may fail due to the delay in the Cinder start. For the workaround, see 23.1.2 known issues: OpenStack upgrade failure.
Before upgrading, verify that you have completed the Prerequisites.
If your cloud runs on top of the OpenStack Victoria release, you must first upgrade to the technical OpenStack releases Wallaby and Xena before upgrading to Yoga.
Caution
The Wallaby and Xena releases are not recommended for a long-run production usage. These versions are transitional, so-called technical releases with limited testing scopes. For the OpenStack versions support cycle, refer to OpenStack support cycle.
To upgrade the cloud, complete the upgrade steps for each release version in line in the following strict order:
Upgrade the cloud from
victoriatowallabyUpgrade the cloud from
wallabytoxenaUpgrade the cloud from
xenatoyoga
Backup and restore OpenStack databases
Mirantis OpenStack for Kubernetes (MOSK) relies on the MariaDB Galera cluster to provide its OpenStack components with reliable storage of persistent data. Mirantis recommends backing up your OpenStack databases daily to ensure the safety of your cloud data. Also, you should always create an instant backup before updating your cloud or performing any kind of potentially disruptive experiment.
MOSK has a built-in automated backup routine that can be
triggered manually or by schedule. Periodic backups are suspended by default
but you can easily enable them through the OpenStackDeployment custom
resource. For the details about enablement and configuration of the periodic
backups, refer to Periodic OpenStack database backups in the Reference Architecture.
This section includes more intricate procedures that involve additional steps
beyond editing the OpenStackDeployment custom resource, such as restoring
the OpenStack database from a backup or configuring a remote storage for
backups.
Enable OpenStack database remote backups
TechPreview
By default, MOSK stores the OpenStack database backups locally in the Mirantis Ceph cluster, which is a part of the same cloud.
Alternatively, MOSK enables you to save the backup data to an external storage. This section contains the details on how you, as a cloud operator, can configure a remote storage backend for OpenStack database backups.
In general, the built-in automated backup mechanism saves the data to the
mariadb-phy-backup-data PersistentVolumeClaim (PVC), which is provisioned
from StorageClass specified in the spec.persistent_volume_storage_class
parameter of the OpenstackDeployment custom resource (CR).
If your MOSK cluster was originally deployed with the default backup storage, proceed with this step. Otherwise, skip it.
Copy the already existing backup data to a storage different from the
mariadb-phy-backup-dataPVC.Remove the
mariadb-phy-backup-dataPVC manually:kubectl -n openstack delete pvc mariadb-phy-backup-data
Enable the NFS backend in the
OpenStackDeploymentobject by editing the backup section of theOpenStackDeploymentCR as follows:spec: features: database: backup: enabled: true backend: pv_nfs pv_nfs: server: <ip-address/dns-name-of-the-server> path: <path-to-the-share-folder-on-the-server>
Optional. Set the required mount options for the NFS mount command. You can set as many options of mount as you need. For example:
spec: services: database: mariadb: values: volume: phy_backup: nfs: mountOptions: - "nfsvers=4" - "hard"
Verify the
mariadb-phy-backup-dataPVC and NFS persistent volume (PV):kubectl -n openstack get pvc mariadb-phy-backup-data -o wide
kubectl -n openstack get pv mariadb-phy-backup-data-nfs-pv -o yaml
An example of a positive system response:
NAME STATUS VOLUME CAPACITY ACCESS MODES STORAGECLASS AGE VOLUMEMODE mariadb-phy-backup-data Bound mariadb-phy-backup-data-nfs-pv 20Gi RWO 5m40s Filesystem
apiVersion: v1 kind: PersistentVolume metadata: annotations: meta.helm.sh/release-name: openstack-mariadb meta.helm.sh/release-namespace: openstack <<<skipped>>>> name: mariadb-phy-backup-data-nfs-pv resourceVersion: "2279204" uid: 60db9f89-afc4-417b-bf44-8acab844f17e spec: accessModes: - ReadWriteOnce capacity: storage: 20Gi claimRef: apiVersion: v1 kind: PersistentVolumeClaim name: mariadb-phy-backup-data namespace: openstack resourceVersion: "2279201" uid: e0e08d73-e56f-425a-ad4e-e5393aa3cdc1 mountOptions: - nfsvers=4 - hard nfs: path: / server: 10.10.0.116 persistentVolumeReclaimPolicy: Retain volumeMode: Filesystem status: phase: Bound
Remove NFS PVC and PV:
kubectl -n openstack delete pvc mariadb-phy-backup-data
kubectl -n openstack delete pv mariadb-phy-backup-data-nfs-pv
Re-enable the local backup in the
OpenStackDeploymentCR:spec: features: database: backup: enabled: true backend: pvc
Verify that the
mariadb-phy-backup-dataPVC uses the default PV:kubectl -n openstack get pvc mariadb-phy-backup-data
An example of a positive system response:
NAME STATUS VOLUME CAPACITY ACCESS MODES STORAGECLASS AGE mariadb-phy-backup-data Bound pvc-a4f6e24b-c05b-4a76-bca2-bb6a5c8ef5b5 20Gi RWO mirablock-k8s-block-hdd 80m
Restore OpenStack databases from a backup
During the OpenStack database restoration, the MariaDB cluster is unavailable due to the MariaDB StatefulSet being scaled down to 0 replicas. Therefore, to safely restore the state of the OpenStack database, plan the maintenance window thoroughly and in accordance with the database size.
The duration of the maintenance window may depend on the following:
Network throughput
Performance of the storage where backups are kept, which is Mirantis Ceph by default
Local disks performance of the nodes where MariaDB data resides
To restore OpenStack databases:
Obtain an image of the MariaDB container:
kubectl -n openstack get pods mariadb-server-0 -o jsonpath='{.spec.containers[0].image}'
Create the
check_pod.yamlfile to create the helper pod required to view the backup volume content:--- apiVersion: v1 kind: ServiceAccount metadata: name: check-backup-helper namespace: openstack --- apiVersion: v1 kind: Pod metadata: name: check-backup-helper namespace: openstack labels: application: check-backup-helper spec: nodeSelector: openstack-control-plane: enabled containers: - name: helper securityContext: allowPrivilegeEscalation: false runAsUser: 0 readOnlyRootFilesystem: true command: - sleep - infinity image: << image of mariadb container >> imagePullPolicy: IfNotPresent volumeMounts: - name: pod-tmp mountPath: /tmp - mountPath: /var/backup name: mysql-backup restartPolicy: Never serviceAccount: check-backup-helper serviceAccountName: check-backup-helper volumes: - name: pod-tmp emptyDir: {} - name: mariadb-secrets secret: secretName: mariadb-secrets defaultMode: 0444 - name: mariadb-bin configMap: name: mariadb-bin defaultMode: 0555 - name: mysql-backup persistentVolumeClaim: claimName: mariadb-phy-backup-data
Create the helper pod:
kubectl -n openstack apply -f check_pod.yaml
Obtain the name of the backup to restore:
kubectl -n openstack exec -t check-backup-helper -- tree /var/backup
Example of system response:
/var/backup |-- base | `-- 2020-09-09_11-35-48 | |-- backup.stream.gz | |-- backup.successful | |-- grastate.dat | |-- xtrabackup_checkpoints | `-- xtrabackup_info |-- incr | `-- 2020-09-09_11-35-48 | |-- 2020-09-10_01-02-36 | |-- 2020-09-11_01-02-02 | |-- 2020-09-12_01-01-54 | |-- 2020-09-13_01-01-55 | `-- 2020-09-14_01-01-55 `-- lost+found 10 directories, 5 files
If you want to restore the full backup, the name from the example above is
2020-09-09_11-35-48. To restore a specific incremental backup, the name from the example above is2020-09-09_11-35-48/2020-09-12_01-01-54.In the example above, the backups will be restored in the following strict order:
2020-09-09_11-35-48- full backup, path/var/backup/base/2020-09-09_11-35-482020-09-10_01-02-36- incremental backup, path/var/backup/incr/2020-09-09_11-35-48/2020-09-10_01-02-362020-09-11_01-02-02- incremental backup, path/var/backup/incr/2020-09-09_11-35-48/2020-09-11_01-02-022020-09-12_01-01-54- incremental backup, path/var/backup/incr/2020-09-09_11-35-48/2020-09-12_01-01-54
Delete the helper pod:
kubectl -n openstack delete -f check_pod.yaml
Pass the following parameters to the
mariadb_resque.pyscript from the OsDpl object:Parameter
Type
Default
Description
--backup-nameString
Name of a folder with backup in
<BASE_BACKUP>or<BASE_BACKUP>/<INCREMENTAL_BACKUP>.--replica-restore-timeoutInteger
3600Timeout in seconds for 1 replica data to be restored to the
mysqldata directory. Also, includes time for spawning a rescue runner pod in Kubernetes and extracting data from a backup archive.Edit the
OpenStackDeploymentobject as follows:spec: services: database: mariadb: values: manifests: job_mariadb_phy_restore: true conf: phy_restore: backup_name: "2020-09-09_11-35-48/2020-09-12_01-01-54" replica_restore_timeout: 7200
Wait until the
mariadb-phy-restorejob suceeds:kubectl -n openstack get jobs mariadb-phy-restore -o jsonpath='{.status}'Important
If
mariadb-phy-restorefails, the MariaDB Pods do not start automatically. For example, the failure may occur due to discrepancy between the current and backup versions of MariaDB, broken backup archive, and so on.Assess the
mariadb-phy-restorejob log to identify the issue:kubectl -n openstack logs --tail=10000 -l application=mariadb-phy-restore,job-name=mariadb-phy-restore
If the restoration process does not start due to the MariaDB versions discrepancy:
Use other backup file with the corresponding MariaDB version for restoration, if any.
Start MariaDB Pods without restoration:
kubectl scale --replicas=3 sts/mariadb-server -n openstack
The command above restores the previous cluster state.
The
mariadb-phy-restorejob is an immutable object. Therefore, remove the job after each successful execution. To correctly remove the job, clean up all the settings from theOpenStackDeploymentobject that you have configured during step 7 of this procedure. This will remove all related pods as well.Resolve database discrepancies by analysing the following resources that may be inconsistent in the restored snapshot as opposed to the original environment:
Leftover VMs, volumes, images, and other dynamic resources. For example:
A VM is removed after a snapshot for restoration is created. Such VM will be present as an orphan entry in the database and the OpenStack API after restoration.
A VM is created after a snapshot for restoration is created. Such VM will disappear from the OpenStack API after database restoration but will still be present as a process on the compute host.
Broken Octavia Amphorae that may become unresponsive after restoration, potentially requiring LoadBalancer failover
Other broken or leftover resources
Verify the periodic backup jobs for the OpenStack database
Verify pods in the
openstacknamespace. After the backup jobs have succeeded, the pods stay in theCompletedstate:kubectl -n openstack get pods -l application=mariadb-phy-backup
Example of a posistive system response:
NAME READY STATUS RESTARTS AGE mariadb-phy-backup-1599613200-n7jqv 0/1 Completed 0 43h mariadb-phy-backup-1599699600-d79nc 0/1 Completed 0 30h mariadb-phy-backup-1599786000-d5kc7 0/1 Completed 0 6h17m
Note
By default, the system keeps three latest successful and one latest failed pods.
Obtain an image of the MariaDB container:
kubectl -n openstack get pods mariadb-server-0 -o jsonpath='{.spec.containers[0].image}'
Create the
check_pod.yamlfile to create the helper pod required to view the backup volume content.Configuration example:
apiVersion: v1 kind: ServiceAccount metadata: name: check-backup-helper namespace: openstack --- apiVersion: v1 kind: Pod metadata: name: check-backup-helper namespace: openstack labels: application: check-backup-helper spec: nodeSelector: openstack-control-plane: enabled containers: - name: helper securityContext: allowPrivilegeEscalation: false runAsUser: 0 readOnlyRootFilesystem: true command: - sleep - infinity image: << image of mariadb container >> imagePullPolicy: IfNotPresent volumeMounts: - name: pod-tmp mountPath: /tmp - mountPath: /var/backup name: mysql-backup restartPolicy: Never serviceAccount: check-backup-helper serviceAccountName: check-backup-helper volumes: - name: pod-tmp emptyDir: {} - name: mariadb-secrets secret: secretName: mariadb-secrets defaultMode: 0444 - name: mariadb-bin configMap: name: mariadb-bin defaultMode: 0555 - name: mysql-backup persistentVolumeClaim: claimName: mariadb-phy-backup-data
Apply the helper service account and pod resources:
kubectl -n openstack apply -f check_pod.yaml kubectl -n openstack get pods -l application=check-backup-helper
Example of a positive system response:
NAME READY STATUS RESTARTS AGE check-backup-helper 1/1 Running 0 27s
Verify the directories structure within the
/var/backupdirectory of the spawned pod:kubectl -n openstack exec -t check-backup-helper -- tree /var/backup
Example of a system response:
/var/backup |-- base | `-- 2020-09-09_11-35-48 | |-- backup.stream.gz | |-- backup.successful | |-- grastate.dat | |-- xtrabackup_checkpoints | `-- xtrabackup_info |-- incr | `-- 2020-09-09_11-35-48 | |-- 2020-09-10_01-02-36 | | |-- backup.stream.gz | | |-- backup.successful | | |-- grastate.dat | | |-- xtrabackup_checkpoints | | `-- xtrabackup_info | `-- 2020-09-11_01-02-02 | |-- backup.stream.gz | |-- backup.successful | |-- grastate.dat | |-- xtrabackup_checkpoints | `-- xtrabackup_info
The
basedirectory contains full backups. Each directory in theincrfolder contains incremental backups related to a certain full backup in thebasefolder. All incremental backups always have the base backup name as parent folder.Delete the helper pod:
kubectl delete -f check_pod.yaml
Add a controller node
This section describes how to add a new control plane node to the existing MOSK deployment.
To add an OpenStack controller node:
Add a bare metal host to the MOSK cluster as described in Add a bare metal host.
When adding the bare metal host YAML file, specify the following OpenStack control plane node labels for the OpenStack control plane services such as database, messaging, API, schedulers, conductors, L3 and L2 agents:
openstack-control-plane=enabledopenstack-gateway=enabledopenvswitch=enabled
Create a Kubernetes machine in your cluster as described in Add a machine.
When adding the machine, verify that OpenStack control plane node has the following labels:
openstack-control-plane=enabledopenstack-gateway=enabledopenvswitch=enabled
Note
Depending on the applications that were colocated on the failed controller node, you may need to specify some additional labels, for example,
ceph_role_mgr=trueandceph_role_mon=true. To successfuly replace a failedmonandmgrnode, refer to Ceph operations for KaaSCephCluster (prior to 25.2).Verify that the node is in the
Readystate through the Kubernetes API:kubectl get node <NODE-NAME> -o wide | grep Ready
Verify that the node has all required labels described in the previous steps:
kubectl get nodes --show-labels
Configure new Octavia health manager resources:
Rerun the
octavia-create-resourcesjob:kubectl -n osh-system exec -t <OS-CONTROLLER-POD> -c osdpl osctl-job-rerun octavia-create-resources openstack
Wait until the Octavia health manager pod on the newly added control plane node appears in the
Runningstate:kubectl -n openstack get pods -o wide | grep <NODE_ID> | grep octavia-health-manager
Note
If the pod is in the
crashloopbackoffstate, remove it:kubectl -n openstack delete pod <OCTAVIA-HEALTH-MANAGER-POD-NAME>
Verify that an OpenStack port for the node has been created and the node is in the
Activestate:kubectl -n openstack exec -t <KEYSTONE-CLIENT-POD-NAME> openstack port show octavia-health-manager-listen-port-<NODE-NAME>
Strongly recommended. Back up MKE as described in Mirantis Kubernetes Engine documentation: Back up MKE.
Since the procedure above modifies the cluster configuration, a fresh backup is required to restore the cluster in case further reconfigurations fail.
Replace a failed controller node
This section describes how to replace a failed control plane node in your
MOSK deployment. The procedure applies to the control plane
nodes that are, for example, permanently failed due to a hardware failure and
appear in the NotReady state:
kubectl get nodes <CONTAINER-CLOUD-NODE-NAME>
Example of system response:
NAME STATUS ROLES AGE VERSION
<CONTAINER-CLOUD-NODE-NAME> NotReady <none> 10d v1.18.8-mirantis-1
To replace a failed controller node:
Remove the Kubernetes labels from the failed node by editing the
.metadata.labelsnode object:kubectl edit node <CONTAINER-CLOUD-NODE-NAME>
If your cluster is deployed with a compact control plane, inspect precautions for a cluster machine deletion.
Add the control plane node to your deployment as described in Add a controller node.
Identify all stateful applications present on the failed node:
node=<CONTAINER-CLOUD-NODE-NAME> claims=$(kubectl -n openstack get pv -o jsonpath="{.items[?(@.spec.nodeAffinity.required.nodeSelectorTerms[0].matchExpressions[0].values[0] == '${node}')].spec.claimRef.name}") for i in $claims; do echo $i; done
Example of system response:
mysql-data-mariadb-server-2 openstack-operator-bind-mounts-rfr-openstack-redis-1 etcd-data-etcd-etcd-0
For MOSK 23.3 series or earlier, reschedule stateful applications pods to healthy controller nodes as described in Reschedule stateful applications. For the newer versions, MOSK performs the rescheduling of stateful applications automatically.
If the failed controller node had the
StackLightlabel, fix the StackLight volume node affinity conflict as described in Delete a cluster machine.Remove the OpenStack port related to the Octavia health manager pod of the failed node:
kubectl -n openstack exec -t <KEYSTONE-CLIENT-POD-NAME> openstack port delete octavia-health-manager-listen-port-<NODE-NAME>
For clouds using Open Virtual Network (OVN) as the networking backend, remove the Northbound and Southbound database members for the failed node:
Log in to the running
openvswitch-ovn-db-XXpod.Remove an old Northboud database member:
Identify the member to be removed:
ovs-appctl -t /var/run/ovn/ovnnb_db.ctl cluster/status OVN_Northbound
Example of system response:
5d02 Name: OVN_Northbound Cluster ID: 4d61 (4d61fde5-6cd5-449e-9846-34fcb470687b) Server ID: 5d02 (5d022977-982b-4de7-b125-e679746ece8d) Address: tcp:openvswitch-ovn-db-0.ovn-discovery.openstack.svc.cluster.local:6643 Status: cluster member Role: follower Term: 5402 Leader: c617 Vote: c617 Election timer: 10000 Log: [22917, 26535] Entries not yet committed: 0 Entries not yet applied: 0 Connections: ->c617 ->4d1e <-c617 <-0e28 Disconnections: 0 Servers: c617 (c617 at tcp:openvswitch-ovn-db-2.ovn-discovery.openstack.svc.cluster.local:6643) last msg 1153 ms ago 4d1e (4d1e at tcp:openvswitch-ovn-db-1.ovn-discovery.openstack.svc.cluster.local:6643) 0e28 (0e28 at tcp:openvswitch-ovn-db-1.ovn-discovery.openstack.svc.cluster.local:6643) last msg 109828 ms ago 5d02 (5d02 at tcp:openvswitch-ovn-db-0.ovn-discovery.openstack.svc.cluster.local:6643) (self)
In the above example output, the
4d1emember belongs to the failed node.Remove the old member:
ovs-appctl -t /var/run/ovn/ovnnb_db.ctl cluster/kick OVN_Northbound 4d1e sent removal request to leader
Verify that the old member has been removed successfully:
ovs-appctl -t /var/run/ovn/ovnnb_db.ctl cluster/status OVN_Northbound
Example of a successful system response:
5d02 Name: OVN_Northbound Cluster ID: 4d61 (4d61fde5-6cd5-449e-9846-34fcb470687b) Server ID: 5d02 (5d022977-982b-4de7-b125-e679746ece8d) Address: tcp:openvswitch-ovn-db-0.ovn-discovery.openstack.svc.cluster.local:6643 Status: cluster member Role: follower Term: 5402 Leader: c617 Vote: c617 Election timer: 10000 Log: [22917, 26536] Entries not yet committed: 0 Entries not yet applied: 0 Connections: ->c617 <-c617 <-0e28 ->0e28 Disconnections: 1 Servers: c617 (c617 at tcp:openvswitch-ovn-db-2.ovn-discovery.openstack.svc.cluster.local:6643) last msg 3321 ms ago 0e28 (0e28 at tcp:openvswitch-ovn-db-1.ovn-discovery.openstack.svc.cluster.local:6643) last msg 134877 ms ago 5d02 (5d02 at tcp:openvswitch-ovn-db-0.ovn-discovery.openstack.svc.cluster.local:6643) (self)
Remove an old Southbound database member by following the same steps used to remove an old Northbound database member:
Identify the member to be removed:
ovs-appctl -t /var/run/ovn/ovnsb_db.ctl cluster/status OVN_Southbound
Remove the old member:
ovs-appctl -t /var/run/ovn/ovnsb_db.ctl cluster/kick OVN_Southbound <SERVER-ID>
Strongly recommended. Back up MKE as described in Mirantis Kubernetes Engine documentation: Back up MKE.
Since the procedure above modifies the cluster configuration, a fresh backup is required to restore the cluster in case further reconfigurations fail.
Add a compute node
This section describes how to add a new compute node to your existing Mirantis OpenStack for Kubernetes deployment.
To add a compute node:
Add a bare metal host to the MOSK cluster as described in Add a bare metal host.
Create a Kubernetes machine in your cluster as described in Add a machine.
When adding the machine, specify the node labels as required for an OpenStack compute node:
OpenStack node roles¶ Node role
Description
Kubernetes labels
Minimal count
OpenStack control plane
Hosts the OpenStack control plane services such as database, messaging, API, schedulers, conductors, L3 and L2 agents.
openstack-control-plane=enabledopenstack-gateway=enabledopenvswitch=enabled3
OpenStack compute
Hosts the OpenStack compute services such as libvirt and L2 agents.
openstack-compute-node=enabledopenvswitch=enabled(for a deployment with Open vSwitch as a backend for networking)Varies
If required, configure the compute host to enable huge pages, SR-IOV, and other advanced features in your MOSK deployment. See Advanced OpenStack configuration (optional) for details.
Once the node is available in Kubernetes and when the
nova-computeandneutronpods are running on the node, verify that the compute service and Neutron Agents are healthy in OpenStack API.In the
keystone-clientpod, run:openstack network agent list --host <cmp_host_name> openstack compute service list --host <cmp_host_name>
Verify that the compute service is mapped to cell.
The OpenStack Controller triggers the
nova-cell-setupjob once it detects a new compute pod in theReadystate. This job sets mapping for new compute services to cells.In the
nova-api-osapipod, run:nova-manage cell_v2 list_hosts | grep <cmp_host_name>
Strongly recommended. Back up MKE as described in Mirantis Kubernetes Engine documentation: Back up MKE.
Since the procedure above modifies the cluster configuration, a fresh backup is required to restore the cluster in case further reconfigurations fail.
Change oversubscription settings for existing compute nodes
Available since MOSK 23.1
MOSK enables you to control the oversubscription of compute node resources through the placement service API.
To manage the oversubscription through the placement API:
Obtain the host name of the hypervisor in question:
openstack hypervisor list -f yaml
Example of system response:
- Host IP: 10.10.0.78 Hypervisor Hostname: ps-ps-obnqilm4xxlu-0-gdy3x46euaeu-server-ftp6p7j6pyjl.cluster.local Hypervisor Type: QEMU ID: 1 State: up - Host IP: 10.10.0.118 Hypervisor Hostname: ps-ps-obnqilm4xxlu-1-n36gax6zqgef-server-xtby2leuercd.cluster.local Hypervisor Type: QEMU ID: 7 State: up
Determine the resource provider that corresponds to the hypervisor:
openstack resource provider list -f yaml --name <hypervisor_hostname>
Example of system response:
- generation: 4 name: ps-ps-obnqilm4xxlu-1-n36gax6zqgef-server-xtby2leuercd.cluster.local parent_provider_uuid: null root_provider_uuid: b16e9094-3f0e-4b8e-a138-e0b1f0a980db uuid: b16e9094-3f0e-4b8e-a138-e0b1f0a980db
Verify the current values in the resource provider by its UUID:
openstack resource provider inventory list <provider_uuid> -f yaml
Example of system response:
- allocation_ratio: 8.0 max_unit: 8 min_unit: 1 reserved: 0 resource_class: VCPU step_size: 1 total: 8 used: 0 - allocation_ratio: 1.0 max_unit: 7956 min_unit: 1 reserved: 512 resource_class: MEMORY_MB step_size: 1 total: 7956 used: 0 - allocation_ratio: 1.6 max_unit: 145 min_unit: 1 reserved: 0 resource_class: DISK_GB step_size: 1 total: 145 used: 0
Update the allocation ratio for the required resource class in the resource provider and inspect the system response to verify that the change has been applied:
openstack resource provider inventory set <provider_uuid> --amend --resource VCPU:allocation_ratio=10
Caution
To ensure accurate resource updates, it is crucial to specify the
--amendargument when making requests. Failure to do so will require the inclusion of values for all fields associated with the resource provider.Example of system response:
- allocation_ratio: 10.0 max_unit: 8 min_unit: 1 reserved: 0 resource_class: VCPU step_size: 1 total: 8 used: 0 - allocation_ratio: 1.0 max_unit: 7956 min_unit: 1 reserved: 512 resource_class: MEMORY_MB step_size: 1 total: 7956 used: 0 - allocation_ratio: 1.6 max_unit: 145 min_unit: 1 reserved: 0 resource_class: DISK_GB step_size: 1 total: 145 used: 0
Delete a compute node
Since MOSK 23.2, the OpenStack-related metadata is automatically removed during the graceful machine deletion through the Mirantis Container Cloud web UI. For the procedure, refer to Delete a cluster machine.
During the graceful machine deletion, the OpenStack Controller (Rockoon) performs the following operations:
Disables the OpenStack Compute and Block Storage services on the node to prevent further scheduling of workloads to it.
Verifies if any resources are present on the node, for example, instances and volumes. By default, the OpenStack Controller blocks the removal process until the resources are removed by the user. To adjust this behavior to the needs of your cluster, refer to OpenStack Controller configuration.
Removes OpenStack services metadata including compute services, Neutron agents, and volume services.
Caution
You cannot collocate the OpenStack compute node with other cluster components, such as Ceph. If done so, refer to the removal steps of the collocated components when planning the maintenance window.
If your cluster runs MOSK 23.1 or older version, perfrom the following steps before you remove the node from the cluster through the web UI to correctly remove the OpenStack-related metadata from it:
Disable the compute service to prevent spawning of new instances. In the
keystone-clientpod, run:openstack compute service set --disable <cmp_host_name> nova-compute --disable-reason "Compute is going to be removed."
Migrate all workloads from the node. For more information, follow Nova official documentation: Migrate instances.
Ensure that there are no pods running on the node to delete by draining the node as instructed in the Kubernetes official documentation: Safely drain node.
Delete the compute service using the OpenStack API. In the
keystone-clientpod, run:openstack compute service delete <service_id>
Note
To obtain
<service_id>, run:openstack compute service list --host <cmp_host_name>
Depending on the networking backend in use, proceed with one of the following:
Obtain the network agent ID:
openstack network agent list --host <cmp_host_name>
Delete the Neutron Agent service running the following command in the
keystone-clientpod:openstack network agent delete <agent_id>
Log in to the Tungsten Fabric web UI.
Navigate to Configure > Infrastructure > Virtual Routers.
Select the target compute node.
Click Delete.
Strongly recommended. Back up MKE as described in Mirantis Kubernetes Engine documentation: Back up MKE.
Since the procedure above modifies the cluster configuration, a fresh backup is required to restore the cluster in case further reconfigurations fail.
Reschedule stateful applications
Note
The procedure applies to the MOSK clusters running MOSK 23.3 series or earlier versions. Starting from 24.1, MOSK performs the rescheduling of stateful applications automatically.
The rescheduling of stateful applications may be required when replacing a permanently failed node, decommissioning a node, migrating applications to nodes with a more suitable set of hardware, and in several other use cases.
MOSK deployment profiles include the following stateful applications:
OpenStack database (MariaDB)
OpenStack coordination (etcd)
OpenStack Time Series Database backend (Redis)
Each stateful application from the list above has a persistent volume claim (PVC) based on a local persistent volume per pod. Each of control plane nodes has a set of local volumes available. To migrate an application pod to another node, recreate a PVC with the persistent volume from the target node.
Caution
A stateful application pod can only be migrated to a node that does not contain other pods of this application.
Caution
When a PVC is removed, all data present in the related persistent volume is removed from the node as well.
Reschedule pods to another control plane node
This section describes how to reschedule pods for MariaDB, etcd, and Redis to another control plane node.
Important
Perform the pods rescheduling if you have to move a PVC to another node and the current node is still present in the cluster. If the current node has been removed already, MOSK reschedules pods automatically when a node with required labels is present in the cluster.
Recreate PVCs as described in Recreate a PVC on another control plane node.
Remove the pod:
Note
To remove a pod from a node in the
NotReadystate, add--grace-period=0 --forceto the following command.kubectl -n openstack delete pod <STATEFULSET-NAME>-<NUMBER>
Wait until the pod appears in the
Readystate.When the rescheduling is finalized, the
<STATEFULSET-NAME>-<NUMBER>pod rejoins the Galera cluster with a clean MySQL data directory and requests the Galera state transfer from the available nodes.
Important
Perform the pods rescheduling if you have to move a PVC to another node and the current node is still present in the cluster. If the current node has been removed already, MOSK reschedules pods automatically when a node with required labels is present in the cluster.
Recreate PVCs as described in Recreate a PVC on another control plane node.
Remove the pod:
Note
To remove a pod from a node in the
NotReadystate, add--grace-period=0 --forceto the following command.kubectl -n openstack-redis delete pod <STATEFULSET-NAME>-<NUMBER>
Wait until the pod is in the
Readystate.
Warning
During the reschedule procedure of the etcd LCM, a short cluster downtime is expected.
Before MOSK 23.1:
Identify the etcd replica ID that is a numeric suffix in a pod name. For example, the ID of the
etcd-etcd-0pod is0. This ID is required during the reschedule procedure.kubectl -n openstack get pods | grep etcd
Example of a system response:
etcd-etcd-0 0/1 Pending 0 3m52s etcd-etcd-1 1/1 Running 0 39m etcd-etcd-2 1/1 Running 0 39m
If the replica ID is
1or higher:Add the
coordinationsection to thespec.servicessection of the OsDpl object:spec: services: coordination: etcd: values: conf: etcd: ETCD_INITIAL_CLUSTER_STATE: existing
Wait for the etcd
statefulSetto update the new state parameter:kubectl -n openstack get sts etcd-etcd -o jsonpath='{.spec.template.spec.containers[0].env[?(@.name=="ETCD_INITIAL_CLUSTER_STATE")].value}'
Scale down the etcd
StatefulSetto0replicas. Verify that no replicas are running on the failed node.kubectl -n openstack scale sts etcd-etcd --replicas=0
Select from the following options:
If the current node is still present in the cluster and the PVC should be moved to another node, recreate the PVC as described in Recreate a PVC on another control plane node.
If the current node has been removed, remove the PVC related to the etcd replica of the failed node:
kubectl -n <NAMESPACE> delete pvc <PVC-NAME>
The PVC will be recreated automatically after the etcd
StatefulSetis scaled to the initial number of replicas.
Scale the etcd
StatefulSetto the initial number of replicas:kubectl -n openstack scale sts etcd-etcd --replicas=<NUMBER-OF-REPLICAS>
Wait until all etcd pods are in the
Readystate.Verify that the etcd cluster is healthy:
kubectl -n openstack exec -t etcd-etcd-1 -- etcdctl -w table endpoint --cluster status
Before MOSK 23.1, if the replica ID is
1or higher:Remove the
coordinationsection from thespec.servicessection of the OsDpl object.Wait until all etcd pods appear in the
Readystate.Verify that the etcd cluster is healthy:
kubectl -n openstack exec -t etcd-etcd-1 -- etcdctl -w table endpoint --cluster status
Recreate a PVC on another control plane node
This section describes how to recreate a PVC of a stateful application on another control plane node.
To recreate a PVC on another control plane node:
Select one of the persistent volumes available on the node:
Caution
A stateful application pod can only be migrated to the node that does not contain other pods of this application.
NODE_NAME=<NODE-NAME> STORAGE_CLASS=$(kubectl -n openstack get osdpl <OSDPL_OBJECT_NAME> -o jsonpath='{.spec.local_volume_storage_class}') kubectl -n openstack get pv -o json | jq --arg NODE_NAME $NODE_NAME --arg STORAGE_CLASS $STORAGE_CLASS -r '.items[] | select(.spec.nodeAffinity.required.nodeSelectorTerms[0].matchExpressions[0].values[0] == $NODE_NAME and .spec.storageClassName == $STORAGE_CLASS and .status.phase == "Available") | .metadata.name'
As the new PVC should contain the same parameters as the deleted one except for
volumeName, save the old PVC configuration in YAML:kubectl -n <NAMESPACE> get pvc <PVC-NAME> -o yaml > <OLD-PVC>.yaml
Note
<NAMESPACE>is a Kubernetes namespace where the PVC is created. For Redis, specifyopenstack-redis, for other applications specifyopenstack.Delete the old PVC:
kubectl -n <NAMESPACE> delete pvc <PVC-NAME>
Note
If a PVC has stuck in the
terminatingstate, runkubectl -n openstack edit pvc <PVC-NAME>and remove thefinalizerssection frommetadataof the PVC.Create a PVC with a new persistent volume:
cat <<EOF | kubectl apply -f - apiVersion: v1 kind: PersistentVolumeClaim metadata: name: <PVC-NAME> namespace: <NAMESPACE> spec: accessModes: - ReadWriteOnce resources: requests: storage: <STORAGE-SIZE> storageClassName: <STORAGE-CLASS> volumeMode: Filesystem volumeName: <PV-NAME> EOF
Caution
<STORAGE-SIZE>,<STORAGE-CLASS>, and<NAMESPACE>should correspond to thestorage,storageClassName, andnamespacevalues from the<OLD-PVC>.yamlfile with the old PVC configuration.
Run Tempest tests
The OpenStack Integration Test Suite (Tempest), is a set of integration tests to be run against a live OpenStack environment. This section instructs you on how to verify the workability of your OpenStack deployment using Tempest.
To verify an OpenStack deployment using Tempest:
Configure the Tempest run parameters using the
features:services:tempeststructure in theOpenStackDeploymentcustom resource.Note
To perform the smoke testing of your deployment, no additional configuration is required.
Configuration examples:
To perform the full Tempest testing:
spec: services: tempest: tempest: values: conf: script: | tempest run --config-file /etc/tempest/tempest.conf --concurrency 4 --blacklist-file /etc/tempest/test-blacklist --regex test
To set the image build timeout to
600:spec: services: tempest: tempest: values: conf: tempest: image: build_timeout: 600
Run Tempest. The OpenStack Tempest is deployed like other OpenStack services in a dedicated
openstack-tempestHelm release by addingtempesttospec:features:servicesin theOpenStackDeploymentcustom resource:spec: features: services: - tempest
Wait until Tempest is ready. The Tempest tests are launched by the
openstack-tempest-run-testsjob. To keep track of the tests execution, run:kubectl -n openstack logs -l application=tempest,component=run-tests
Get the Tempest results. The Tempest results can be stored in a
pvc-tempestPersistentVolumeClaim (PVC). To get them from a PVC, use:# Run pod and mount pvc to it cat <<EOF | kubectl apply -f - apiVersion: v1 kind: Pod metadata: name: tempest-test-results-pod namespace: openstack spec: nodeSelector: openstack-control-plane: enabled volumes: - name: tempest-pvc-storage persistentVolumeClaim: claimName: pvc-tempest containers: - name: tempest-pvc-container image: ubuntu command: ['sh', '-c', 'sleep infinity'] volumeMounts: - mountPath: "/var/lib/tempest/data" name: tempest-pvc-storage EOF
If required, copy the results locally:
kubectl -n openstack cp tempest-test-results-pod:/var/lib/tempest/data/report_file.xml .
Remove the Tempest test results pod:
kubectl -n openstack delete pod tempest-test-results-pod
To rerun Tempest:
Remove Tempest from the list of enabled services.
Wait until Tempest jobs are removed.
Add Tempest back to the list of the enabled services.
Remove an OpenStack cluster
This section instructs you on how to remove an OpenStack cluster, deployed on
top of Kubernetes, by deleting the openstackdeployments.lcm.mirantis.com
(OsDpl) CR.
To remove an OpenStack cluster:
Verify that the OsDpl object is present:
kubectl get osdpl -n openstack
Delete the OsDpl object:
kubectl delete osdpl osh-dev -n openstack
The deletion may take a certain amount of time.
Verify that all pods and jobs have been deleted and no objects are present in the command output:
kubectl get pods,jobs -n openstack
Delete Persistent Volume Claims (PVCs) using the following snippet. Deletion of PVCs causes data deletion on Persistent Volumes. The volumes themselves will become available for further operations.
Caution
Before deleting PVCs, save valuable data in a safe place.
#!/bin/bash PVCS=$(kubectl get pvc --all-namespaces |egrep "openstack|openstack-redis" | egrep "redis|etcd|mariadb" | awk '{print $1" "$2" "$4}'| column -t ) echo "$PVCS" | while read line; do PVC_NAMESPACE=$(echo "$line" | awk '{print $1}') PVC_NAME=$(echo "$line" | awk '{print $2}') echo "Deleting PVC ${PVC_NAME}" kubectl delete pvc ${PVC_NAME} -n ${PVC_NAMESPACE} done
Note
Deletion of PVCs may get stuck if a resource that uses the PVC is still running. Once the resource is deleted, the PVC deletion process will proceed.
Delete the MariaDB state ConfigMap:
kubectl delete configmap openstack-mariadb-mariadb-state -n openstack
Delete secrets using the following snippet:
#!/bin/bash SECRETS=$(kubectl get secret -n openstack | awk '{print $1}'| column -t | awk 'NR>1') echo "$SECRETS" | while read line; do echo "Deleting Secret ${line}" kubectl delete secret ${line} -n openstack done
Verify that OpenStack ConfigMaps and secrets have been deleted:
kubectl get configmaps,secrets -n openstack
Remove an OpenStack service
OpenStack Controller (Rockoon)
Since MOSK 25.1, the OpenStack Controller has been open-sourced under the name Rockoon and is maintained as an independent open-source project going forward.
As part of this transition, all openstack-controller pods are named
rockoon pods across the MOSK documentation and deployments. This change
does not affect functionality, but this is the reminder for the users to
utilize the new naming for pods and other related artifacts accordingly.
This section instructs you on how to remove an OpenStack service deployed on
top of Kubernetes. A service is typically removed by deleting a corresponding
entry in the spec.features.services section of the
openstackdeployments.lcm.mirantis.com (OsDpl) CR.
Caution
You cannot remove the default services built into the preset
section.
Remove a service
Verify that the
spec.features.servicessection is present in the OsDpl object:kubectl -n openstack get osdpl osh-dev -o jsonpath='{.spec.features.services}'
Example of system output:
[instance-ha object-storage]
Obtain the user name of the service database that will be required during Clean up OpenStack database leftovers after the service removal to substitute
SERVICE-DB-NAME:Note
For example, the
<SERVICE-NAME>for theinstance-haservice type ismasakari.kubectl -n osh-system exec -t <ROCKOON-POD-NAME> -- helm3 -n openstack get values openstack-<SERVICE-NAME> -o json | jq -r .endpoints.oslo_db.auth.<SERVICE-NAME>.username
Delete the service from the
spec.features.servicessection of the OsDpl CR:kubectl -n openstack edit osdpl osh-dev
The deletion may take a certain amount of time.
Verify that all related objects have been deleted and no objects are present in the output of the following command:
for i in $(kubectl api-resources --namespaced -o name | grep -v event); do kubectl -n openstack get $i 2>/dev/null | grep <SERVICE-NAME>; done
Clean up OpenStack API leftovers after the service removal
Log in to the Keystone client pod shell:
kubectl -n openstack exec -it <KEYSTONE-CLIENT-POD-NAME> -- bash
Remove service endpoints from the Keystone catalog:
for i in $(openstack endpoint list --service <SERVICE-NAME> -f value -c ID); do openstack endpoint delete $i; done
Remove the service user from the Keystone catalog:
openstack user list --project service | grep <SERVICE-NAME> openstack user delete <SERVICE-USER-ID>
Remove the service from the catalog:
openstack service list | grep <SERVICE-NAME> openstack service delete <SERVICE-ID>
Clean up OpenStack database leftovers after the service removal
Caution
The procedure below will permanently destroy the data of the removed service.
Log in to the
mariadb-serverpod shell:kubectl -n openstack exec -it mariadb-server-0 -- bash
Remove the service database user and its permissions:
Note
Use the user name for the service database obtained during the Remove a service procedure to substitute
SERVICE-DB-NAME:mysql -u root -p${MYSQL_DBADMIN_PASSWORD} -e "REVOKE ALL PRIVILEGES, GRANT OPTION FROM '<SERVICE-DB-USERNAME>'@'%';" mysql -u root -p${MYSQL_DBADMIN_PASSWORD} -e "DROP USER '<SERVICE-DB-USERNAME>'@'%';"
Remove the service database:
mysql -u root -p${MYSQL_DBADMIN_PASSWORD} -e "DROP DATABASE <SERVICE-NAME>;"
Enable uploading of an image through Horizon with untrusted SSL certificates
By default, the OpenStack Dashboard (Horizon) is configured to load images directly into Glance. However, if a MOSK cluster is deployed using untrusted certificates for public API endpoints and Horizon, uploading of images to Glance through the Horizon web UI may fail.
When accessing the Horizon web UI of such MOSK deployment
for the first time, a warning informs you that the site is insecure and you
must force trust the certificate of this site. However, when trying to upload
an image directly from a web browser, the certificate of the Glance API is
still not considered by the web browser as a trusted one since host:port
of the site is different. In this case, you must explicitly trust the
certificate of the Glance API.
To enable uploading of an image through Horizon with untrusted SSL certificates:
Navigate to the Horizon web UI.
Configure your web browser to trust the Horizon certificate if you have not done so yet:
In Google Chrome or Chromium, click Advanced > Proceed to <URL> (unsafe).
In Mozilla Firefox, navigate to Advanced > Add Exception, enter the URL in the Location field, and click Confirm Security Exception.
Note
For other web browsers, the steps may vary slightly.
Navigate to Project > API Access.
Copy the Service Endpoint URL of the Image service.
Open this URL in a new window or tab of the same web browser.
Configure your web browser to trust the certificate of this site as described in the step 2.
As a result, the version discovery document should appear with contents that varies depending on the OpenStack version. For example, for OpenStack Victoria:
{"versions": [{"id": "v2.9", "status": "CURRENT", "links": \ [{"rel": "self", "href": "https://glance.ic-eu.ssl.mirantis.net/v2/"}]}, \ {"id": "v2.7", "status": "SUPPORTED", "links": \ [{"rel": "self", "href": "https://glance.ic-eu.ssl.mirantis.net/v2/"}]}, \ {"id": "v2.6", "status": "SUPPORTED", "links": \ [{"rel": "self", "href": "https://glance.ic-eu.ssl.mirantis.net/v2/"}]}, \ {"id": "v2.5", "status": "SUPPORTED", "links": \ [{"rel": "self", "href": "https://glance.ic-eu.ssl.mirantis.net/v2/"}]}, \ {"id": "v2.4", "status": "SUPPORTED", "links": \ [{"rel": "self", "href": "https://glance.ic-eu.ssl.mirantis.net/v2/"}]}, \ {"id": "v2.3", "status": "SUPPORTED", "links": \ [{"rel": "self", "href": "https://glance.ic-eu.ssl.mirantis.net/v2/"}]}, \ {"id": "v2.2", "status": "SUPPORTED", "links": \ [{"rel": "self", "href": "https://glance.ic-eu.ssl.mirantis.net/v2/"}]}, \ {"id": "v2.1", "status": "SUPPORTED", "links": \ [{"rel": "self", "href": "https://glance.ic-eu.ssl.mirantis.net/v2/"}]}, \ {"id": "v2.0", "status": "SUPPORTED", "links": \ [{"rel": "self", "href": "https://glance.ic-eu.ssl.mirantis.net/v2/"}]}]}
Once done, you should be able to upload an image through Horizon with untrusted SSL certificates.
Rotate OpenStack credentials
OpenStack Controller (Rockoon)
Since MOSK 25.1, the OpenStack Controller has been open-sourced under the name Rockoon and is maintained as an independent open-source project going forward.
As part of this transition, all openstack-controller pods are named
rockoon pods across the MOSK documentation and deployments. This change
does not affect functionality, but this is the reminder for the users to
utilize the new naming for pods and other related artifacts accordingly.
The credential rotation procedure is designed to minimize the impact on service availability and workload downtime. It depends on the credential type and is based on the following principles:
Credentials for OpenStack admin database and messaging are immediately changed during one rotation cycle, without a transition period.
Credentials for OpenStack admin identity are rotated with a transition period of one extra rotation cycle. This means that the credentials become invalid after two rotations. MOSK exposes the latest valid credentials to the
openstack-externalnamespace. For details, refer to Access OpenStack through CLI from your local machine.Credentials for OpenStack service users, including those for messaging, identity, and database, undergo a transition period of one extra rotation cycle during rotation.
Note
If immediate inactivation of credentials is required, initiate the rotation procedure twice.
Impact on workloads availability
The restarts of the Networking service may cause workload downtimes. The exact lengths of these downtimes depend on the cloud density and scale.
Impact on APIs availability
Rotating both administrator and service credentials can potentially result in certain API operations failing.
Rotation prerequisites
Verify that the current
stateof the LCM action inOpenstackDeploymentStatusisAPPLIED:kubectl -n openstack get osdplst -o yaml
Example of an expected system response:
1 kind: OpenStackDeploymentStatus 2 metadata: 3 name: osh-dev 4 namespace: openstack 5 spec: {} 6 status: 7 ... 8 osdpl: 9 cause: update 10 changes: '((''add'', (''status'',), None, {''watched'': {''ceph'': {''secret'': 11 {''hash'': ''0fc01c5e2593bc6569562b451b28e300517ec670809f72016ff29b8cbaf3e729''}}}}),)' 12 controller_version: 0.5.3.dev12 13 fingerprint: a112a4a7d00c0b5b79e69a2c78c3b50b0caca76a15fe7d79a6ad1305b19ee5ec 14 openstack_version: ussuri 15 state: APPLIED 16 timestamp: "2021-09-08 17:01:45.633143"
Verify that there are no other LCM operations running on the OpenStack cluster.
Thoroughly plan the maintenance window taking into account the following considerations:
All OpenStack control plane services, components of the Networking service (OpenStack Neutron) responsible for the data plane and messaging services are restarted during service credentials rotation.
OpenStack database and OpenStack messaging services are restarted during administrator credentials rotation, as well as some of the Openstack control plane services, including the Instance High Availability service (OpenStack Masakari), Dashboard (OpenStack Horizon), and Identity service (OpenStack Keystone).
For approximate maintenance window duration, refer to Calculate a maintenance window duration for update Deprecated.
Rotate the credentials
Log in to the
osdplcontainer in therockoonpod:kubectl -n osh-system exec -it <rockoon-pod> -c osdpl -- bash
Use the osctl utility to trigger credentials rotation:
osctl credentials rotate --osdpl <osdpl-object-name> --type <credentials-type>
Where the
<credentials-type>value is eitheradminorservice.Note
Mirantis recommends rotating both admin and service credentials simultaneously to decrease the duration of the maintenance window and number of service restarts. You can do this by passing the
--typeargument twice:osctl credentials rotate --osdpl <osdpl-object-name> --type service --type admin
Wait until the
OpenStackDeploymentStatusobject has stateAPPLIEDand all OpenStack components in thehealthgroup in theOpenStackDeploymentStatuscustom resource are in theReadystate.Alternatively, you can launch the rotation command with the
--waitflag.
Now, the latest admin password for your OpenStack environment is available in
the openstack-identity-credentials secret in the openstack-external
namespace.
Customize OpenStack container images
This section provides instructions on how to customize the functionality of your MOSK OpenStack services by installing custom system or Python packages into their container images.
The MOSK services are running in Ubuntu-based containers, which can be extended to meet specific requirements or implement specific use cases, for example:
Enabling third-party storage driver for OpenStack Cinder
Implementing a custom scheduler for OpenStack Nova
Adding a custom dashboard to OpenStack Horizon
Building your own image importing workflow for OpenStack Glance
Warning
Mirantis cannot be held responsible for any consequences arising from using customized container images. Mirantis does not provide support for such actions, and any modifications to production systems are made at your own risk.
Note
Custom images are pinned in the OpenStackDeployment custom
resource. These images do not undergo automatic updates or upgrades.
Cloud administrator is responsible for image update during OpenStack
updating and upgrading.
Build a custom container image
Create a new directory and switch to it:
mkdir my-custom-image cd my-custom-image
Create a Dockerfile:
touch DockerfileSpecify the location for the base image in the Dockerfile.
A custom image can be derived from any OpenStack image shipped with MOSK. For locations of the images comprising a specific MOSK release, refer to a corresponding release artifacts page in the Release Notes.
ARG FROM=<images-base-url>/openstack/<image-name>:<tag> FROM $FROM
Note
Presuming the custom image will need to get rebuilt for every new MOSK release, Mirantis recommends parametrizing the location of its base by introducing the
$FROMargument to the Dockerfile.Instruct the Dockerfile to install additional system packages:
RUN apt-get update ;\ apt-get install --no-install-recommends -y <package name> ;\ apt-get clean -y
If you need to install packages from a third-party repository:
Make sure that the
add-apt-repositoryutility is installed:RUN apt-get install --no-install-recommends -y software-properties-common
Add the third-party repository:
RUN add-apt-repository <repository_name>
Instruct the Dockerfile to install additional Python packages:
Caution
Rules to comply with when extending MOSK container images with Python packages:
Use only Python wheel packaging standard, the older
*.eggpackage type is not supportedHonor upper constraints that MOSK defines for its OpenStack packages prerequisites
OpenStack components in every MOSK release are shipped together with their requirements packaged as Python wheels and constraints file. Download and extract these artifacts from the corresponding
requirementscontainer image, so that they can be used for building your packages as well. Use therequirementsimage with the same tag as the base image that you plan to customize:docker pull <images-base-url>/openstack/requirements:<tag> docker save -o requirements.tar <images-base-url>/openstack/requirements:<tag> mkdir requirements tar -xf requirements.tar -C requirements tar -xf requirements/<shasum>/layer.tar -C requirements
Build your Python wheel packages using one of the commands below depending on the place where the source code is stored:
Build from source:
pip wheel --no-binary <package> <package> --wheel-dir=custom-wheels -c requirements/dev-upper-constraints.txt
Build from an upstream pip repository:
pip wheel <package> --wheel-dir=custom-wheels -c requirements/dev-upper-constraints.txt
Build from a custom repository:
pip wheel <package> --extra-index-url <Repo-URL> --wheel-dir=custom-wheels -c requirements/dev-upper-constraints.txt
Include the built custom wheel packages and packages for the requirements into the Dockerfile:
COPY custom-wheels /tmp/custom-wheels COPY requirements /tmp/wheels
Install the necessary wheel packages to be stored along with other OpenStack components:
RUN source /var/lib/openstack/bin/activate ;\ pip install <package> --no-cache-dir --only-binary :all: --no-compile --find-links /tmp/wheels --find-links /tmp/custom-wheels -c /tmp/wheels/dev-upper-constraints.txt
Build the container image from your Dockerfile:
docker build --tag <user-name>/<repo-name>:<tag> .
When selecting the name for your image, Mirantis recommends following the common practice across major public Docker repositories, that is Docker Hub. The image name should be
<user-name>/<repo-name>, where<user-name>is a unique identifier of the user who authored it and<repo-name>is the name of the software shipped.Specify the current directory as the build context. Also, use the
--tagoption to assign the tag to your image. Assigning a tag:<tag>enables you to add multiple versions of the same image to the repository. Unless you assign a tag, it defaults tolatest.If you are adding Python packages, you can minimize the size of the custom image by building it with the
--squashflag. It merges all the image layers into one and instructs the system not to store the cache layers of the wheel packages.Verify that the image has been built and is present on your system:
docker image ls
Publish the image to the designated registry by its name and tag:
Note
Before pushing the image, make sure that you have authenticated with the registry using the docker login command.
docker push <user-name>/<repo-name>:<tag>
Attach a private Docker registry to MOSK Kubernetes underlay
To ensure that the Kubernetes worker nodes in your MOSK cluster can locate and download the custom image, it should be published to a container image registry that the cluster is configured to use.
To configure the MOSK Kubernetes underlay to use your
private registry, you need to create a ContainerRegistry resource in the
Mirantis Container Cloud API with the registry domain and CA certificate in it,
and specify the resource in the Cluster object that corresponds to
MOSK.
For the details, refer to Define a custom CA certificate for a private Docker registry and ContainerRegistry resource.
Inject a custom image into MOSK cluster
To inject a customized OpenStack container into your MOSK cluster:
Create a ConfigMap in the openstack namespace with the following
content, replacing <OPENSTACKDEPLOYMENT-NAME> with the name of your
OpenStackDeployment custom resource:
apiVersion: v1
kind: ConfigMap
metadata:
labels:
penstack.lcm.mirantis.com/watch: "true"
name: <OPENSTACKDEPLOYMENT-NAME>-artifacts
namespace: openstack
data:
caracal: |
horizon: <image_path>
Update the spec:services section in the OpenStackDeployment custom
resource to override the default location of the container image with your
own:
Open the
OpenStackDeploymentcustom resource for editing:kubectl -n openstack edit osdpl osh-dev
Specify the path to your custom image:
For MOSK Dashboard (OpenStack Horizon):
spec: services: dashboard: horizon: values: images: tags: horizon: <PATH-TO-IMAGE>
For the MOSK Block Storage service (OpenStack Cinder):
spec: services: block-storage: cinder: values: images: tags: <IMAGE-NAME>: <PATH-TO-IMAGE>
How to examples
To help you better understand the process, this section provides a few examples illustrating how to add various plugins to MOSK services.
Warning
Mirantis cannot be held responsible for any consequences arising from using storage drivers, plugins, or features that are not explicitly tested or documented with MOSK. Mirantis does not provide support for such configurations as a part of standard product subscription.
Troubleshoot orphaned resource allocations
Available since MOSK 24.3
OpenStack Controller (Rockoon)
Since MOSK 25.1, the OpenStack Controller has been open-sourced under the name Rockoon and is maintained as an independent open-source project going forward.
As part of this transition, all openstack-controller pods are named
rockoon pods across the MOSK documentation and deployments. This change
does not affect functionality, but this is the reminder for the users to
utilize the new naming for pods and other related artifacts accordingly.
Orphaned resource allocations are entries in the Placement database that track resource consumption, but the corresponding consumer (instance) no longer exists on the compute nodes. As a result, the Nova scheduler mistakenly believes that compute nodes have more resources allocated than they actually have.
For example, orphaned resource allocations may occur when an instance
is evacuated from a hypervisor while the related nova-compute service
is down.
This section provides instructions on how to resolve orphaned resource allocations in Nova if they are detected on compute nodes.
Detect orphaned allocations
Orphaned allocations are detected by the nova-placement-audit CronJob that
runs every four hours.
The osdpl-exporter service processes the nova-placement-audit CronJob
output and exports current number of orphaned allocations to StackLight as an
osdpl_nova_audit_orphaned_allocations metric. If the value of this metric
is greater than 0, StackLight raises a major alert
NovaOrphanedAllocationsDetected.
Collect logging data from the cluster
Obtain the mapping with IDs of resource providers and related orphaned consumers:
kubectl -n openstack logs -l application=nova,component=placement-audit -c placement-audit-report | \ jq .orphaned_allocations.detected
Example of a system response:
{ "12ed66d0-00d8-40e5-a28b-19cdecd2211d": [ { "consumer": "1e616d60-bc5b-436d-8d71-503d15de5c55", "resources": { "DISK_GB": 5, "MEMORY_MB": 512, "VCPU": 1 } } ] }
Obtain the list of the
nova-computeservices that have issues with orphaned allocations:Obtain the UUIDs of the resource providers containing orphaned allocations:
rp_uuids=$(kubectl -n openstack logs -l application=nova,component=placement-audit -c placement-audit-report | \ jq -c '.orphaned_allocations.detected|keys')
Obtain the hostnames of the compute nodes that correspond to the resource providers obtained in the previous step:
cmp_fqdns=$(kubectl -n openstack exec -t deployment/keystone-client -- \ openstack resource provider list -f json | \ jq --argjson rp_uuids "$rp_uuids" -c ' .[] | select( [.uuid] | inside($rp_uuids) ) | .name') cmp_hostnames=$(for n in $(echo ${cmp_fqdns} | tr -d \"); do echo ${n%%.*}; done)
List the
nova-computeservices that contain orphaned allocations:kubectl -n openstack exec -t deployment/keystone-client -- \ openstack compute service list --service nova-compute --long -f json | \ jq --arg hosts "$cmp_hostnames" -r '.[] | select( .Host | inside($hosts) )'
Example of a system response:
[{ "ID": "14a1685a-798e-40f1-b490-a09a5c8f6f66", "Binary": "nova-compute", "Host": "mk-ps-7bqjjdq7o53q-0-rlocum3rumf4-server-ir4n3ag33erk", "Zone": "nova", "Status": "enabled", "State": "down", "Updated At": "2024-08-12T07:52:46.000000", "Disabled Reason": null, "Forced Down": true }]
Analyze the list of the
nova-computeservices obtained during the previous step:For the
nova-computeservices in thedownstate, most probably there were evacuations of instances from the correspoding nodes when the services were down. If this is the case, proceed directly to Remove orphaned allocations. Otherwise, proceed with collecting the logs.To verify if the evacuations were performed:
openstack server migration list --type evacuation --host <CMP_HOSTNAME> -f json
Example of a system response:
[{ "Id": 3, "UUID": "d7c29e99-2f69-4f85-80ed-72e1ef71c099", "Source Node": "mk-ps-7bqjjdq7o53q-1-snwv3ahiip6i-server-3axzquptwsao.cluster.local", "Dest Node": "mk-ps-7bqjjdq7o53q-0-rlocum3rumf4-server-ir4n3ag33erk.cluster.local", "Source Compute": "mk-ps-7bqjjdq7o53q-1-snwv3ahiip6i-server-3axzquptwsao", "Dest Compute": "mk-ps-7bqjjdq7o53q-0-rlocum3rumf4-server-ir4n3ag33erk", "Dest Host": "10.10.0.61", "Status": "completed", "Server UUID": "1e616d60-bc5b-436d-8d71-503d15de5c55", "Old Flavor": null, "New Flavor": null, "Type": "evacuation", "Created At": "2024-08-07T09:01:08.000000", "Updated At": "2024-08-07T16:11:54.000000" }]
For the
nova-computeservices in theUPstate, proceed with collecting the logs.
Collect the following logs from the environment:
Caution
The log data can be significant in size. Ensure that there is sufficient space available in the
/tmp/directory of the OpenStack Controller (Rockoon) pod. Create a separate report for each node.Logs from compute nodes for a 3-day period around the time of the alert:
From the node with the orphaned allocation
From the node with the actual allocation (where the instance exists, if any)
kubectl -n osh-system exec -it deployment/rockoon -- bash osctl sos --between <REPORT_PERIOD_TIMESTAMPS> \ --host <CMP_HOSTNAME> \ --component nova \ --collector elastic \ --collector nova \ --workspace /tmp/ report
For example, if the alert was raised on 2024-08-12, set
<REPORT_PERIOD_TIMESTAMPS>to2024-08-11,2024-08-13.Logs from the
nova-scheduler,nova-api,nova-conductor,placement-apipods for a 3-day period around the time of the alert:ctl_nodes=$(kubectl get nodes -l openstack-control-plane=enabled -o name) kubectl -n osh-system exec -it deployment/rockoon -- bash # for each node in ctl_nodes execute: osctl sos --between <REPORT_PERIOD_TIMESTAMPS> \ --host <CTL_HOSTNAME> \ --component nova \ --component placement \ --collector elastic \ --workspace /tmp/ report
Logs from the Kubernetes objects:
kubectl -n osh-system exec -it deployment/rockoon -- bash osctl sos --collector k8s --workspace /tmp/ report
Nova service data from the API:
kubectl -n openstack exec -it deployment/keystone-client -- bash openstack server migration list openstack compute service list --long openstack resource provider list # Get the server event list for each orphaned consumer id openstack server event list <SERVER_ID>
Note
SERVER_IDis the orphaned consumer ID from thenova-placement-auditlogs.
Create a support case and attach the obtained information.
Remove orphaned allocations
Log in to the
nova-api-osapipod:kubectl -n openstack exec -it deployment/nova-api-osapi -- bash
Remove orphaned allocations:
To remove all found orphaned allocations:
nova-manage placement audit --verbose --delete
To remove orphaned allocations on a specific resource provider:
nova-manage placement audit --verbose --delete --resource_provider <RESOURCE_PROVIDER_UUID>
Verify that no orphaned allocations exist:
nova-manage placement audit --verbose
Start monitoring IP address capacity
Available since MOSK 25.1
Note
The MOSK deployments with Tungsten Fabric do not support IP address capacity monitoring.
Monitoring IP address capacity helps cloud operators allocate routable IP addresses efficiently for dynamic workloads in the clouds. This capability provides insights for predicting future needs for IP addresses, ensuring seamless communication between workloads, users, and services while optimizing IP address usage.
By monitoring IP address capacity, cloud operators can:
Predict when to add new IP address blocks to prevent service disruptions.
Identify networks or subnets nearing capacity to prevent issues.
Optimize the allocation of costly external IP address pools.
To start monitoring IP address capacity in your cloud:
Verify that all required networks and subnets are monitored.
By default, MOSK monitors IP address capacity for the external networks that have the
router:external=Externalattribute and segmentation type ofvlanorflat.To include additional networks and subnets in the monitoring:
Tag the network with the
openstack.lcm.mirantis.com:prometheustag. When a network is tagged, all its subnets are automatically included in the monitoring:openstack network set <NETWORK-ID> --tag openstack.lcm.mirantis.com:prometheus
Tag individual subnets with the
openstack.lcm.mirantis.com:prometheustag. This includes the subnet in the monitoring regardless of the network tagging:openstack subnet set <SUBNET_ID> --tag openstack.lcm.mirantis.com:prometheus
View and analyze the monitoring data.
The metrics of IP address capacity are collected by the OpenStack Exporter and are available in Prometheus within the StackLight monitoring suite as:
osdpl_neutron_network_total_ipsosdpl_neutron_network_free_ipsosdpl_neutron_subnet_total_ipsosdpl_neutron_subnet_free_ips
See also
Rotate Octavia Amphora (LBaaS) certificates
Available since MOSK 25.2
MOSK provides an automated procedure for rotating OpenStack Amphora load balancer certificates. This capability ensures that TLS certificates used by Amphora load balancers are renewed before expiration and replaced without manual reconfiguration. When initiated by the operator, the system generates and deploys new certificates.
Before you initiate the certificate rotation, thoroughly plan the maintenance window required to perform the operation based on the considerations below.
Impact on workloads availability
During certificate rotation, each affected load balancer undergoes a failover to apply the new certificate. A new amphora instance is created and configured with the updated certificate, after which the HA IP is switched over to it. This process may briefly interrupt network connections to workloads behind the load balancer. The downtime typically lasts up to 30 seconds per load balancer, depending on the environment size and workload.
Rotation duration
By default, the octavia-loadbalancers-failover job performs failovers
using five parallel workers, with each load balancer failover taking
approximately one minute. You can roughly estimate the total duration of
rotation in minutes by dividing the number of load balancers by the number
of workers.
If required, you can adjust the number of parallel workers through the
LB_FAILOVER_MAX_WORKERS parameter in the OpenStackDeployment
custom resource:
spec:
services:
load-balancer:
octavia:
values:
jobs:
lb_failover:
env:
LB_FAILOVER_MAX_WORKERS: 5
Rotate the LBaaS certificate
In the
OpenStackDeploymentStatuscustom resource, verify thatosdplis in theAPPLIEDstate and all OpenStack components listed under thehealthsection report theReadystatus:kubectl -n openstack get osdplst osh-dev -o yaml
Example of an expected system response:
kind: OpenStackDeploymentStatus metadata: name: osh-dev namespace: openstack spec: {} status: ... health: barbican: api: generation: 2 status: Ready cinder: api: generation: 2 status: Ready backup: generation: 1 status: Ready scheduler: generation: 1 status: Ready volume: generation: 1 status: Ready osdpl: cause: update controller_host: rockoon-5746446978-7dsxs controller_version: 1.1.8.dev46 fingerprint: 2b2357c7c7f41e5a08e14c90a726746909f8cdc68461f972f7d86304b5795a83 health: 23/23 lcm_progress: 20/20 openstack_version: epoxy state: APPLIED timestamp: "2025-08-12 14:46:42.120288"
Log in to the
osdplcontainer in therockoonpod:kubectl -n osh-system exec -ti deploy/rockoon -c osdpl -- bash
Trigger the rotation using the osctl utility:
osctl certificates rotate --osdpl osh-dev --type octavia:amphora
When the rotation is over, you can verify that the certificate has been rotated successfully by checking that the certificate expiration alerts in StackLight for the rotated service are cleared.
Additionally, you can check the execution logs for verification in the
octavia-loadbalancers-failover job pod or in the osdpl container
of the rockoon pod. At the end of the job run, a summary in a statistics
format is displayed showing the results for all processed load balancers,
for example:
2025-08-05 14:50:50 DEBUG Detailed statistics:
CANCELLED: []
FAILED: []
SKIPPED:
- acdcff9b-041b-4ba9-9fdb-03692ce9ac75
SUCCESS:
- a9186ea8-bed5-482a-8699-f55b19316946
- 8f214f52-bc90-4a77-aa13-c14c762efba9
- 968a47bb-6488-469f-8514-dc45f6003cff
- cc24f787-7c2b-4054-8a8f-9b1fba2927c3
- 9c79cf61-a1e9-4c67-b1b7-fe026fef0532
- a8b8a400-a58d-4e89-9fae-20748606199f
- f258ab32-0c20-4346-a3d5-d99a957bf8b0
2025-08-05 14:50:50 INFO General statistic for loadbalancer failover:
SUCCESS: 7 FAILED: 0 SKIPPED: 1 CANCELLED: 0
See also
OpenStack services configuration
This section covers post-deployment configuration of OpenStack services and
is intended for cloud operators responsible for maintaining a functional
cloud infrastructure for end users. It focuses on more complex procedures
that require additional steps beyond simply editing the OpenStackDeployment
custom resource.
For an overview of the capabilities provided by MOSK
OpenStack services and instructions on enabling and configuring them
at the OpenStackDeployment level, refer to Cloud services.
Configure high availability with Masakari
Instances High Availability Service or Masakari is an OpenStack project designed to ensure high availability of instances and compute processes running on hosts.
Before the end user can start enjoying the benefits of Masakari, the cloud operator has to configure the service properly. This section includes instructions on how to create segments and host through the Masakari API as well as provides the list of additional settings that can be useful in certain use cases.
Group compute nodes into segments
The segment object is a logical grouping of compute nodes into zones
also known as availability zones. The segment object enables
the cloud operator to list, create, show details for, update,
and delete segments.
To create a segment named allcomputes with service_type = compute,
and recovery_method = auto, run:
openstack segment create allcomputes auto compute
Example of a positive system response:
+-----------------+--------------------------------------+
| Field | Value |
+-----------------+--------------------------------------+
| created_at | 2021-07-06T07:34:23.000000 |
| updated_at | None |
| uuid | b8b0d7ca-1088-49db-a1e2-be004522f3d1 |
| name | allcomputes |
| description | None |
| id | 2 |
| service_type | compute |
| recovery_method | auto |
+-----------------+--------------------------------------+
Create hosts under segments
The host object represents compute service hypervisors. A host belongs
to a segment. The host can be any kind of virtual machine that has
compute service running on it. The host object enables the operator
to list, create, show details for, update, and delete hosts.
To create a host under a given segment:
Obtain the hypervisor hostname:
openstack hypervisor list
Example of a positive system response:
+----+-------------------------------------------------------+-----------------+------------+-------+ | ID | Hypervisor Hostname | Hypervisor Type | Host IP | State | +----+-------------------------------------------------------+-----------------+------------+-------+ | 2 | vs-ps-vyvsrkrdpusv-1-w2mtagbeyhel-server-cgpejthzbztt | QEMU | 10.10.0.39 | up | | 5 | vs-ps-vyvsrkrdpusv-0-ukqbpy2pkcuq-server-s4u2thvgxdfi | QEMU | 10.10.0.14 | up | +----+-------------------------------------------------------+-----------------+------------+-------+
Create the host under previously created segment. For example, with
uuid = b8b0d7ca-1088-49db-a1e2-be004522f3d1:Caution
The segment under which you create a host must exist.
openstack segment host create \ vs-ps-vyvsrkrdpusv-1-w2mtagbeyhel-server-cgpejthzbztt \ compute \ SSH \ b8b0d7ca-1088-49db-a1e2-be004522f3d1
Positive system response:
+---------------------+-------------------------------------------------------+ | Field | Value | +---------------------+-------------------------------------------------------+ | created_at | 2021-07-06T07:37:26.000000 | | updated_at | None | | uuid | 6f1bd5aa-0c21-446a-b6dd-c1b4d09759be | | name | vs-ps-vyvsrkrdpusv-1-w2mtagbeyhel-server-cgpejthzbztt | | type | compute | | control_attributes | SSH | | reserved | False | | on_maintenance | False | | failover_segment_id | b8b0d7ca-1088-49db-a1e2-be004522f3d1 | +---------------------+-------------------------------------------------------+
Enable notifications
The alerting API is used by Masakari monitors to notify about a failure
of either a host, process, or instance. The notification object enables
the operator to list, create, and show details of notifications.
Useful tunings
The list of useful tunings for the Masakari service includes:
[host_failure]\evacuate_all_instancesEnables the operator to decide whether to evacuate all instances or only the instances that have
[host_failure]\ha_enabled_instance_metadata_keyset toTrue. By default, the parameter is set toFalse.[host_failure]\ha_enabled_instance_metadata_keyEnables the operator to decide on the instance metadata key naming that affects the per instance behavior of
[host_failure]\evacuate_all_instances. The default is the same for both failure types, which includehostandinstance, but the value can be overridden to make the metadata key different per failure type.[host_failure]\ignore_instances_in_error_stateEnables the operator to decide whether error instances should be allowed for evacuation from a failed source compute node or not. If set to
True, it will ignore error instances from evacuation from a failed source compute node. Otherwise, it will evacuate error instances along with other instances from a failed source compute node.Available since MOSK 24.2
[host_failure]\ha_enabled_project_tagBy default, instances belonging to any project are evacuated. However, if the operator needs to restrict this functionality to specific projects, they can tag these projects with a designated tag and pass this tag as the value for this Masakari option. Consequently, instances from projects that do not have the specified tag are not considered for evacuation, even if they have the corresponding metadata key and value set.
[instance_failure]\process_all_instancesEnables the operator to decide whether all instances or only the ones that have
[instance_failure]\ha_enabled_instance_metadata_keyset toTrueshould be recovered from instance failure events. If set toTrue, it will execute instance failure recovery actions for an instance irrespective of whether that particular instance has[instance_failure]\ha_enabled_instance_metadata_keyset toTrueor not. Otherwise, it will only execute instance failure recovery actions for an instance which has[instance_failure]\ha_enabled_instance_metadata_keyset toTrue.[instance_failure]\ha_enabled_instance_metadata_keyEnables the operators to decide on the instance metadata key naming that affects the per-instance behavior of
[instance_failure]\process_all_instances. The default is the same for both failure types, which includehostandinstance, but you can override the value to make the metadata key different per failure type.
Configure monitoring of cloud workload availability
MOSK enables cloud operators to oversee the availability of workloads hosted in their OpenStack infrastructure through the monitoring of floating IP addresses availability (Cloudpprober) and network port availability (Portprober).
For the feature description and usage requirements, refer to Workload monitoring.
Configure floating IP address availability monitoring
Available since MOSK 23.2 TechPreview
MOSK allows you to monitor the floating IP address availability through the Cloudprober service. This section explains the details of the service configuration.
Enable the Cloudprober service in the
OpenStackDeploymentcustom resource:spec: features: services: - cloudprober
Wait untill the
OpenStackDeploymentstate becomesapplied:kubectl -n openstack get osdplst
Example of a positive system response:
NAME OPENSTACK VERSION CONTROLLER VERSION STATE osh-dev yoga 0.13.1.dev54 APPLIED
Verify that the Cloudprober service is running:
kubectl -n openstack get pods -l application=cloudprober
Example of a positive system response:
NAME READY STATUS RESTARTS AGE openstack-cloudprober-587b4bf7c4-lwmxx 2/2 Running 2 3d1h openstack-cloudprober-587b4bf7c4-v9tt9 2/2 Running 0 3d1h
Verify that the Cloudprober service is sending data to StackLight:
Log in to the StackLight Prometheus web UI.
Navigate to Status - Targets.
Search for the
openstack-cloudprobertarget and verify that it isUP.
By default, for outgoing traffic, the IP address for the Cloudprober Pod is translated to the node IP address. In this procedure, we assume no further translation of that node IP address on the path between the node and floating network.
Identify the node IP address used for traffic destined to floating network by selecting the IP address from the floating network and running the following command on each OpenStack control plane node:
ip r get <floating ip> | grep -E -o '(src .*)' | awk '{print $2}'
In the project where monitored virtual machines are running, create a security group:
openstack security group create --project <project_id> instance-monitoring
Create the rule for each IP address you obtain in step 1:
openstack security group rule create --proto icmp --ingress --remote-ip <node ip> instance-monitoring
Log in to the
keystone-clientPod to assign theopenstack.lcm.mirantis.com:probertag to each instance to be added to monitoring:openstack --os-compute-api-version 2.26 server set --tag openstack.lcm.mirantis.com:prober <INSTANCE_ID>
Assign the
instance-monitoringsecurity group to the server:openstack server add security group <SERVER_ID> <SECURITY_GROUP_ID>
Verify that the instances have been added successfully.
Cloudprober uses auto-discovery of instances on periodic basis. Therefore, wait for the discovery interval to pass (defaults to 600 seconds) and execute the following command inside the
keystone-clientPod:curl -s http://cloudprober.openstack.svc.cluster.local:9313/metrics | grep <INSTANCE_ID>
Example of a positive system response:
cloudprober_total{ptype="ping",probe="openstack-instances-icmp-probe",dst="d34a0c6b-91a2-4bd3-95ea-772da49b90c3-10.11.12.122",openstack_hypervisor_hostname="mk-ps-xp4m27lfl56j-1-w74pc7cinu67-server-42kx24m22xop.cluster.local",openstack_instance_id="d34a0c6b-91a2-4bd3-95ea-772da49b90c3",openstack_instance_name="test-vm-proj",openstack_project_id="1eb031db8add42fda2fdb0ef2c2ad8d7"} 266388 1685963215202 cloudprober_success{ptype="ping",probe="openstack-instances-icmp-probe",dst="d34a0c6b-91a2-4bd3-95ea-772da49b90c3-10.11.12.122",openstack_hypervisor_hostname="mk-ps-xp4m27lfl56j-1-w74pc7cinu67-server-42kx24m22xop.cluster.local",openstack_instance_id="d34a0c6b-91a2-4bd3-95ea-772da49b90c3",openstack_instance_name="test-vm-proj",openstack_project_id="1eb031db8add42fda2fdb0ef2c2ad8d7"} 266386 1685963215202 cloudprober_latency{ptype="ping",probe="openstack-instances-icmp-probe",dst="d34a0c6b-91a2-4bd3-95ea-772da49b90c3-10.11.12.122",openstack_hypervisor_hostname="mk-ps-xp4m27lfl56j-1-w74pc7cinu67-server-42kx24m22xop.cluster.local",openstack_instance_id="d34a0c6b-91a2-4bd3-95ea-772da49b90c3",openstack_instance_name="test-vm-proj",openstack_project_id="1eb031db8add42fda2fdb0ef2c2ad8d7"} 315484742.137 1685963215202 cloudprober_validation_failure{ptype="ping",probe="openstack-instances-icmp-probe",dst="d34a0c6b-91a2-4bd3-95ea-772da49b90c3-10.11.12.122",openstack_hypervisor_hostname="mk-ps-xp4m27lfl56j-1-w74pc7cinu67-server-42kx24m22xop.cluster.local",openstack_instance_id="d34a0c6b-91a2-4bd3-95ea-772da49b90c3",openstack_instance_name="test-vm-proj",openstack_project_id="1eb031db8add42fda2fdb0ef2c2ad8d7",validator="data-integrity"} 0 1685963215202
Note
You can adjust the instance auto-discovery interval in the
OpenStackDeploymentobject. However, Mirantis does not recommend setting it to too low values to avoid high load on the OpenStack API:spec: features: cloudprober: discovery: interval: 300
Now, you can start seeing the availability of instances floating IP addresses per OpenStack compute node and project, as well as viewing the probe statistics for individual instance floating IP addresses through the OpenStack Instances Availability dashboard in Grafana.
See also
Enable network port availability monitoring
Available since MOSK 24.2 TechPreview
MOSK allows you to monitor the network port availability through the Portprober service.
The Portprober service is enabled by default when the Cloudprober service is enabled as described above, on clouds running OpenStack Antelope or newer version and using Neutron OVS backend for networking.
Also, you can enable Portprober explicitly, regardless of whether Cloudprober is enabled or not. See Network port availability monitoring (Portprober) for details.
When the service is enabled, you can monitor the network port availability through the OpenStack PortProber dashboard in Grafana.
See also
Ceph operations for MiraCeph (since 25.2)
Warning
This procedure is valid for MOSK clusters that use the MiraCeph custom
resource (CR), which is available since MOSK 25.2 to replace the deprecated
KaaSCephCluster. For the equivalent procedure with the KaaSCephCluster
CR, refer to the following section:
This section outlines Ceph LCM operations such as adding Ceph Monitor, Ceph nodes, and RADOS Gateway nodes to an existing Ceph cluster or removing them, as well as removing or replacing Ceph OSDs. The section also includes OpenStack-specific operations for Ceph.
The following sections describe the Ceph cluster configuration options:
Ceph default configuration options
Warning
This procedure is valid for MOSK clusters that use the MiraCeph custom
resource (CR), which is available since MOSK 25.2 to replace the deprecated
KaaSCephCluster. For the equivalent procedure with the KaaSCephCluster
CR, refer to the following section:
Ceph Controller provides the capability to specify configuration options for
the Ceph cluster through the rookConfig key-value section of the
MiraCeph CR as if they were set in a usual ceph.conf file. For details,
see Ceph advanced configuration.
However, if rookConfig is empty, Ceph Controller still specifies the
following default configuration options for each Ceph cluster:
Required network parameters that you can change through the
networksection:cluster network = <spec.cephClusterSpec.network.clusterNet> public network = <spec.cephClusterSpec.network.publicNet>
General default configuration options that you can override using the
rookConfigparameter:mon target pg per osd = 200 mon max pg per osd = 600 # Workaround configuration option to avoid the # https://github.com/rook/rook/issues/7573 issue # when updating to Rook 1.6.x versions: rgw_data_log_backing = omap
If rookConfig is empty but the objectStore.rgw section is defined, Ceph
Controller specifies the following OpenStack-related default configuration
options for each Ceph cluster:
Ceph Object Gateway options that you can override using the
rookConfigparameter:rgw swift account in url = true rgw keystone accepted roles = '_member_, Member, member, swiftoperator' rgw keystone accepted admin roles = admin rgw keystone implicit tenants = true rgw swift versioning enabled = true rgw enforce swift acls = true rgw_max_attr_name_len = 64 rgw_max_attrs_num_in_req = 32 rgw_max_attr_size = 1024 rgw_bucket_quota_ttl = 0 rgw_user_quota_bucket_sync_interval = 0 rgw_user_quota_sync_interval = 0 rgw s3 auth use keystone = true
Additional parameters for the Keystone integration:
Warning
All values with the
keystoneprefix are programmatically specified for each MOSK deployment. Do not modify these parameters manually.rgw keystone api version = 3 rgw keystone url = <keystoneAuthURL> rgw keystone admin user = <keystoneUser> rgw keystone admin password = <keystonePassword> rgw keystone admin domain = <keystoneProjectDomain> rgw keystone admin project = <keystoneProjectName>
See also
Ceph advanced configuration
Warning
This procedure is valid for MOSK clusters that use the MiraCeph custom
resource (CR), which is available since MOSK 25.2 to replace the deprecated
KaaSCephCluster. For the equivalent procedure with the KaaSCephCluster
CR, refer to the following section:
This section describes how to configure a Ceph cluster using the MiraCeph
(miracephs.lcm.mirantis.com) custom resource (CR) during or after
MOSK deployment.
The MiraCeph CR spec specifies the nodes to deploy as Ceph components.
Based on the roles definitions in the MiraCeph CR, Ceph Controller
automatically labels nodes for Ceph Monitors and Managers. Ceph OSDs are
deployed based on the devices parameter defined for each Ceph node.
For the default MiraCeph CR, see the following example:
Example configuration of Ceph specification
apiVersion: lcm.mirantis.com/v1alpha1
kind: MiraCeph
metadata:
name: rook-ceph
namespace: ceph-lcm-mirantis
spec:
nodes:
- name: cz812-managed-cluster-storage-worker-noefi-58spl
roles:
- mgr
- mon
# All disk configurations must be reflected in ``baremetalhostprofile``
devices:
- config:
deviceClass: ssd
fullPath: /dev/disk/by-id/scsi-1ATA_WDC_WDS100T2B0A-00SM50_200231434939
- name: cz813-managed-cluster-storage-worker-noefi-lr4k4:
roles:
- mgr
- mon
devices:
- config:
deviceClass: ssd
fullPath: /dev/disk/by-id/scsi-1ATA_WDC_WDS100T2B0A-00SM50_200231440912
- name: cz814-managed-cluster-storage-worker-noefi-z2m67:
roles:
- mgr
- mon
devices:
- config:
deviceClass: ssd
fullPath: /dev/disk/by-id/scsi-1ATA_WDC_WDS100T2B0A-00SM50_200231443409
pools:
- default: true
deviceClass: hdd
name: kubernetes
replicated:
size: 3
role: kubernetes
- default: false
deviceClass: hdd
name: volumes
replicated:
size: 3
role: volumes
- default: false
deviceClass: hdd
name: vms
replicated:
size: 3
role: vms
- default: false
deviceClass: hdd
name: backup
replicated:
size: 3
role: backup
- default: false
deviceClass: hdd
name: images
replicated:
size: 3
role: images
objectStorage:
rgw:
name: rgw-store
dataPool:
deviceClass: hdd
erasureCoded:
codingChunks: 1
dataChunks: 2
failureDomain: host
metadataPool:
deviceClass: hdd
failureDomain: host
replicated:
size: 3
gateway:
allNodes: false
instances: 3
port: 80
securePort: 8443
preservePoolsOnDelete: false
Configure a Ceph cluster
Select from the following options:
If you do not have a MOSK cluster yet, open
miraceph.yaml.templatefor editing.If the MOSK cluster is already deployed, open the
MiraCephCR for editing:kubectl -n ceph-lcm-mirantis edit miraceph
Using the tables below, configure the Ceph cluster as required.
Select from the following options:
If you are creating a MOSK cluster, save the updated
MiraCephtemplate to the corresponding file and proceed with the MOSK cluster creation.If you are configuring
MiraCephof an existing MOSK cluster, exit the text editor to apply the change.
Ceph configuration options
The following subsections contain description of Ceph parameters for an advanced configuration.
Parameter |
Description |
|---|---|
|
Specifies networks for the Ceph cluster:
|
|
Specifies the list of Ceph nodes. For details, see
Node parameters. The nodes:
- name: node-0
<node spec>
- name: node-1
<node spec>
...
- name: group-1
nodeGroup: [node-2, node-3]
<node spec>
- name: group-2
nodeGroup: [node-4, node-5]
<node spec>
...
- name: group-3
nodesByLabel: <nodeLabelExpression-1>
<node spec>
- name: group-4
nodesByLabel: <nodeLabelExpression-2>
<node spec>
The |
|
Specifies the list of Ceph pools. For details, see Pool parameters. |
|
Specifies the parameters for Object Storage, such as RADOS Gateway, the Ceph Object Storage. Also specifies the RADOS Gateway Multisite configuration. For details, see RADOS Gateway parameters and Multisite parameters. objectStorage:
rgw:
<rgw-spec>
multisite:
<rgw-multisite-spec>
|
|
String key-value parameter that allows overriding Ceph configuration options. Use the The use of this option enables restart of only specific daemons related
to the corresponding section. If you do not specify the section,
a parameter is set in the For example: rookConfig:
"osd_max_backfills": "64"
"mon|mon_health_to_clog": "true"
"osd|osd_journal_size": "8192"
"osd.14|osd_journal_size": "6250"
|
|
Enables specification of extra options for a setup, includes the
|
|
Enables a custom ingress rule for public access on Ceph services, for example, Ceph RADOS Gateway. For details, see Configure Ceph Object Gateway TLS. |
|
Enables pools mirroring between two interconnected clusters. For details, see Enable Ceph RBD mirroring. |
|
List of Ceph clients. For details, see Clients parameters. |
|
Disables autogeneration of shared Ceph values for OpenStack
deployments. Set to |
|
Contains the
For example: mgr:
mgrModules:
- name: balancer
enabled: true
- name: pg_autoscaler
enabled: true
The Note Most Ceph Manager modules require additional configuration
that you can perform through the |
|
Configures health checks and liveness probe settings for Ceph daemons. For details, see HealthCheck parameters. |
Example configuration
spec:
network:
clusterNet: 10.10.10.0/24
publicNet: 10.10.11.0/24
nodes:
- name: node-0
<node spec>
...
pools:
- <pool spec>
...
rookConfig:
"mon max pg per osd": "600"
...
Parameter |
Description |
|---|---|
|
Mandatory. Specifies the following:
|
|
Optional. Specifies the list of nodes and used for specifying Ceph node specification for a group of nodes from the list. For example: nodes:
- name: group-1
nodeGroup: [node-X, node-Y]
|
|
Optional. Specifies label expression and used for specifying Ceph node specification for a group of nodes found by label. For example: nodes:
- name: group-1
nodesByLabel: "ceph-storage-node=true,!ceph-control-node"
|
|
Optional. Specifies the
If a Ceph node contains a If a Ceph node contains a If you assign the |
|
Optional. If defined, specifies a custom IP address for monitor which should be placed on the node. If not set, monitor on the node will use default LCM network IP address of a node. Mirantis recommends using IP address from Ceph public network address range. Note To update |
|
Mandatory. Specifies a map of device configurations that must contain a
mandatory For details, see Rook documentation. |
|
Optional. Specifies the list of devices to use for Ceph OSD deployment. Includes the following parameters: Note Mirantis recommends migrating all For details, refer to Addressing storage devices since MOSK 25.2.
|
|
Optional. Specifies regexp by names of devices to use for Ceph OSD
deployment. Mutually exclusive with deviceFilter: "^sd[def]$"
config:
deviceClass: hdd
For more details, see Rook documentation. |
|
Optional. Specifies regexp by paths of devices to use for Ceph OSD
deployment. Mutually exclusive with devicePathFilter: "^/dev/disk/by-id/scsi-SATA.+$"
config:
deviceClass: hdd
For more details, see Rook documentation. |
|
Optional. Specifies the explicit key-value CRUSH topology for a node. For details, see Ceph official documentation: CRUSH maps. Includes the following parameters:
Example configuration: crush:
datacenter: dc1
room: room1
pdu: pdu1
row: row1
rack: rack1
chassis: ch1
region: region1
zone: zone1
|
Parameter |
Description |
|---|---|
|
Mandatory. Specifies the pool name as a prefix for each Ceph block pool.
The resulting Ceph block pool name will be |
|
Optional. Enables Ceph block pool to use only the |
|
Mandatory. Specifies the pool role and is used mostly for MOSK pools. |
|
Optional. Defines whether the pool and dependent StorageClass must be set
as default. Must be enabled only for one pool. Defaults to |
|
Mandatory. Specifies the device class for the defined pool. Common possible
values are |
|
The
|
|
Enables the erasure-coded pool. For details, see Rook documentation:
Erasure coded
and Ceph documentation: Erasure coded pool. The
|
|
Optional. The failure domain across which the replicas or chunks
of data will be spread. Set to Caution Mirantis does not recommend using the following
intermediate topology keys: |
|
Optional. Enables the mirroring feature for the defined pool.
Includes the |
|
Optional. Not updatable as it applies only once. Enables expansion of
persistent volumes based on Note A Kubernetes cluster only supports increase of storage size. |
|
Optional. Not updatable as it applies only once. Specifies custom
|
|
Optional. Specifies the key-value map for the parameters of the Ceph pool. For details, see Ceph documentation: Set Pool values. |
|
Optional. Specifies reclaim policy for the underlying |
|
Optional.Enables skipping Ceph pool delete on |
Example configuration
pools:
- name: kubernetes
role: kubernetes
deviceClass: hdd
replicated:
size: 3
parameters:
target_size_ratio: "10.0"
default: true
preserveOnDelete: true
To configure additional required pools for MOSK, see Add a Ceph cluster since MOSK 25.2.
Caution
Since Ceph Pacific, Ceph CSI driver does not propagate the 777
permission on the mount point of persistent volumes based on any
StorageClass of the Ceph pool.
Parameter |
Description |
|---|---|
|
Ceph client name. |
|
Key-value parameter with Ceph client capabilities. For details about
|
Example configuration
clients:
- name: glance
caps:
mon: allow r, allow command "osd blacklist"
osd: profile rbd pool=images
Parameter |
Description |
|---|---|
|
Required. Ceph Object Storage instance name. |
|
Required if Object storage data pool spec that must only contain rgw:
dataPool:
deviceClass: hdd
failureDomain: host
erasureCoded:
codingChunks: 1
dataChunks: 2
|
|
Required if rgw:
metadataPool:
deviceClass: hdd
failureDomain: host
replicated:
size: 3
where Warning When using the non-recommended Ceph pools For example, if |
|
Required. The gateway settings corresponding to the
For example: rgw:
gateway:
allNodes: false
instances: 3
port: 80
securePort: 8443
|
|
Optional. Defines whether to delete the data and metadata pools in
the |
|
Optional. To create new Ceph RGW resources, such as buckets or users, specify the following keys. Ceph Controller will automatically create the specified object storage users and buckets in the Ceph cluster.
|
|
Required if For example: objectStorage:
multisite:
zones:
- name: master-zone
...
rgw:
zone:
name: master-zone
|
|
Optional. Custom TLS certificate parameters used to access the Ceph RGW endpoint. If not specified, a self-signed certificate will be generated. For example: objectStorage:
rgw:
SSLCert:
cacert: |
-----BEGIN CERTIFICATE-----
ca-certificate here
-----END CERTIFICATE-----
tlsCert: |
-----BEGIN CERTIFICATE-----
private TLS certificate here
-----END CERTIFICATE-----
tlsKey: |
-----BEGIN RSA PRIVATE KEY-----
private TLS key here
-----END RSA PRIVATE KEY-----
|
|
Optional. Available since MOSK 25.1. Flag to determine that a TLS
certificate for accessing the Ceph RGW endpoint is used but not exposed
in objectStorage:
rgw:
SSLCertInRef: true
The operator must manually provide TLS configuration using the
data:
cacert: <base64encodedCaCertificate>
cert: <base64encodedCertificate>
When removing an already existing When adding a new secret directly without exposing it in
|
Example configuration
rgw:
name: rgw-store
dataPool:
deviceClass: hdd
erasureCoded:
codingChunks: 1
dataChunks: 2
failureDomain: host
metadataPool:
deviceClass: hdd
failureDomain: host
replicated:
size: 3
gateway:
allNodes: false
instances: 3
port: 80
securePort: 8443
preservePoolsOnDelete: false
Parameter |
Description |
|---|---|
|
Optional. A key-value setting used to assign a specification label to any
available device on a specific node. These labels can then be used for the
Usage: extraOpts:
deviceLabels:
<node-name>:
<dev-label>: /dev/disk/by-id/<unique_ID>
...
<dev-label-n>: /dev/disk/by-id/<unique_ID>
...
<node-name-n>:
<dev-label>: /dev/disk/by-id/<unique_ID>
...
<dev-label-n>: /dev/disk/by-id/<unique_ID>
nodes:
- name: <group-name>:
devices:
- name: <dev_label>
- name: <dev_label_n>
nodes:
- <node_name>
- <node_name_n>
|
|
Optional. TechPreview. A list of custom device class names to use in the
specification. Enables you to specify the custom names different from
the default ones, which include Usage: extraOpts:
customDeviceClasses:
- <custom_class_name>
nodes:
- name: kaas-node-5bgk6
devices:
- config: # existing item
deviceClass: <custom_class_name>
fullPath: /dev/disk/by-id/<unique_ID>
pools:
- default: false
deviceClass: <custom_class_name>
erasureCoded:
codingChunks: 1
dataChunks: 2
failureDomain: host
|
TechPreview
Parameter |
Description |
|---|---|
|
Required. List of realms to use, represents the realm namespaces. Includes the following parameters:
|
|
Required. The list of zone groups for realms. Includes the following parameters:
|
|
Required. The list of zones used within one zone group. Includes the following parameters:
|
For configuration example, see Enable multisite for Ceph RGW Object Storage.
Parameter |
Description |
|---|---|
|
Optional. Specifies health check settings for Ceph daemons. Contains the following parameters:
Each parameter allows defining the following settings:
|
|
Optional. Key-value parameter with liveness probe settings for
the defined daemon types. Can be one of the following:
Note Ceph Controller specifies the following
|
|
Optional. Key-value parameter with startup probe settings for
the defined daemon types. Can be one of the following:
|
Example configuration
healthCheck:
daemonHealth:
mon:
disabled: false
interval: 45s
timeout: 600s
osd:
disabled: false
interval: 60s
status:
disabled: true
livenessProbe:
mon:
disabled: false
probe:
timeoutSeconds: 10
periodSeconds: 3
successThreshold: 3
mgr:
disabled: false
probe:
timeoutSeconds: 5
failureThreshold: 5
osd:
probe:
initialDelaySeconds: 5
timeoutSeconds: 10
failureThreshold: 7
startupProbe:
mon:
disabled: true
mgr:
probe:
successThreshold: 3
The following sections describe the OpenStack-related Ceph operations:
Configure Ceph Object Gateway TLS
Warning
This procedure is valid for MOSK clusters that use the MiraCeph custom
resource (CR), which is available since MOSK 25.2 to replace the deprecated
KaaSCephCluster. For the equivalent procedure with the KaaSCephCluster
CR, refer to the following section:
Once you enable Ceph Object Gateway (radosgw) as described in
Enable Ceph RGW Object Storage, you can configure the Transport Layer Security (TLS)
protocol for a Ceph Object Gateway public endpoint using the following options:
Using MOSK TLS, if it is enabled and exposes its certificates and domain for Ceph. In this case, Ceph Object Gateway will automatically create an ingress rule with MOSK certificates and domain to access the Ceph Object Gateway public endpoint. Therefore, you only need to reach the Ceph Object Gateway public and internal endpoints and set the CA certificates for a trusted TLS connection.
Using custom
ingressspecified in theMiraCephCR. In this case, Ceph Object Gateway public endpoint will use the public domain specified using theingressparameters.
Caution
External Ceph Object Gateway service is not supported and will be deleted during update. If your system already uses endpoints of an external Ceph Object Gateway service, reconfigure them to the ingress endpoints.
Caution
When using a custom or OpenStack ingress, ensure to configure the DNS name for RGW to target an external IP address of that ingress. If there is no OpenStack or custom ingress available, point the DNS to an external load balancer of RGW.
Note
If the cluster has tls-proxy enabled, TLS certificates specified
in ingress objects, including those configured in the MiraCeph
specification, are disregarded. Instead, common certificates are applied to
all ingresses from the OpenStackDeployment object. This implies that
tlsCert and other ingress certificates specified in MiraCeph are
ignored, and the common certificate from the OpenStackDeployment object
is used.
This section also describes how to specify a custom public endpoint for the Object Storage service.
To configure Ceph Object Gateway TLS:
Verify whether MOSK TLS is enabled. The
spec.features.ssl.public_endpointssection should be specified in theOpenStackDeploymentCR.To generate an SSL certificate for internal usage, verify that the gateway
securePortparameter is specified in theMiraCephCR. For details, see Enable Ceph RGW Object Storage.Select from the following options:
Configure TLS for Ceph Object Gateway using a custom
ingressConfig:Open the
MiraCephCR for editing.Specify the
ingressConfigparameters:Description of the tlsConfig section parameters¶ certsTLS configuration for ingress including certificates. Contains the following parameters:
cacertThe Certificate Authority (CA) certificate, used for the ingress rule TLS support.
tlsCertThe TLS certificate, used for the ingress rule TLS support.
tlsKeyThe TLS private key, used for the ingress rule TLS support.
publicDomainMandatory. The domain name to use for public endpoints.
Caution
The default ingress controller does not support
publicDomainvalues different from the OpenStack ingress public domain. Therefore, if you intend to use the default OpenStack Ingress Controller for your Ceph Object Storage public endpoint, plan to use the same public domain as your OpenStack endpoints.hostnameCustom name to override the Objectstore RGW name for public RGW access. Public RGW endpoint has the
https://<hostname>.<publicDomain>format.tlsSecretRefNameOptional. Secret name with TLS certs on the MOSK cluster in the
rook-cephnamespace prepared by the operator. Allows avoiding exposure of certs directly inspec. Must contain the following format:data: ca.cert: <base64encodedCaCertificate> tls.crt: <base64encodedTlsCert> tls.key: <base64encodedTlsKey>
Caution
When using
tlsSecretRefName, remove the following fields:cacert,tlsCert, andtlsKey.Optional parameters of the ingressConfig section¶ controllerClassNameName of the custom Ingress Controller. By default, the
openstack-ingress-nginxclass name is specified and Ceph uses the OpenStack Ingress Controller based on NGINX.annotationsExtra annotations for the ingress proxy that are a key-value mapping of strings to add or override ingress rule annotations. For details, see NGINX Ingress Controller: Annotations.
By default, the following annotations are set:
nginx.ingress.kubernetes.io/rewrite-targetis set to/nginx.ingress.kubernetes.io/upstream-vhostis set to<rgwName>.rook-ceph.svc.
The value for
<rgwName>is located inobjectStorage.rgw.name.Optional annotations:
nginx.ingress.kubernetes.io/proxy-request-buffering: "off"that disables buffering foringressto prevent the 413 (Request Entity Too Large) error when uploading large files usingradosgw.nginx.ingress.kubernetes.io/proxy-body-size: <size>that increases the default uploading size limit to prevent the 413 (Request Entity Too Large) error when uploading large files usingradosgw. Set the value in MB (m) or KB (k). For example,100m.
Note
By default, an ingress rule is created with an internal Ceph Object Gateway service endpoint as a backend. Also,
rgw dns nameis specified in the Ceph configuration and is set to<rgwName>.rook-ceph.svcby default.You can override
rgw dns nameusing therookConfigkey-value parameter. In this case, also change the corresponding ingress annotation.Configuration example with the
rgw dns nameoverrideobjectStorage: rgw: name: rgw-store ingressConfig: tlsConfig: publicDomain: public.domain.name certs: cacert: | -----BEGIN CERTIFICATE----- ... -----END CERTIFICATE----- tlsCert: | -----BEGIN CERTIFICATE----- ... -----END CERTIFICATE----- tlsKey: | -----BEGIN RSA PRIVATE KEY----- ... -----END RSA PRIVATE KEY----- controllerClassName: openstack-ingress-nginx annotations: nginx.ingress.kubernetes.io/rewrite-target: / nginx.ingress.kubernetes.io/upstream-vhost: rgw-store.public.domain.name nginx.ingress.kubernetes.io/proxy-body-size: 100m rookConfig: "rgw dns name": rgw-store.public.domain.name
For clouds with the
publicDomainparameter specified, align theupstream-vhostingress annotation with the name of the Ceph Object Storage and the specified public domain.Ceph Object Storage requires the
upstream-vhostandrgw dns nameparameters to be equal. Therefore, override the defaultrgw dns namewith the corresponding ingress annotation value.
Obtain the MOSK CA certificate for a trusted connection:
kubectl -n openstack-ceph-shared get secret openstack-rgw-creds -o jsonpath="{.data.ca_cert}" | base64 -d
If you use the HTTP scheme instead of HTTPS for internal or public Ceph Object Gateway endpoints, add custom annotations to the
ingressConfigsection of theMiraCephobject on the management cluster:ingressConfig: annotations: "nginx.ingress.kubernetes.io/force-ssl-redirect": "false" "nginx.ingress.kubernetes.io/ssl-redirect": "false"
You can omit TLS configuration for the default settings provided by OpenStack to be applied.
If both HTTP and HTTPS must be used, apply the following configuration in the
MiraCephobject:ingressConfig: tlsConfig: publicDomain: public.domain.name cacert: | -----BEGIN CERTIFICATE----- ... -----END CERTIFICATE----- tlsCert: | -----BEGIN CERTIFICATE----- ... -----END CERTIFICATE----- tlsKey: | -----BEGIN RSA PRIVATE KEY----- ... -----END RSA PRIVATE KEY----- annotations: "nginx.ingress.kubernetes.io/force-ssl-redirect": "false" "nginx.ingress.kubernetes.io/ssl-redirect": "false"
Access internal and public Ceph Object Gateway endpoints by selecting one of the following options:
Obtain the Ceph Object Gateway public endpoint:
kubectl -n rook-ceph get ingress
Obtain the public endpoint TLS CA certificate:
kubectl -n rook-ceph get secret $(kubectl -n rook-ceph get ingress -o jsonpath='{.items[0].spec.tls[0].secretName}{"\n"}') -o jsonpath='{.data.ca\.crt}' | base64 -d; echo
Obtain the internal endpoint name for Ceph Object Gateway:
kubectl -n rook-ceph get svc -l app=rook-ceph-rgw
The internal endpoint for Ceph Object Gateway has the following format:
https://<internal-svc-name>.rook-ceph.svc:<rgw-secure-port>/where
<rgw-secure-port>isrgw.gateway.securePortspecified in theMiraCephCR.Obtain the internal endpoint TLS CA certificate:
kubectl -n rook-ceph get secret rgw-ssl-certificate -o jsonpath="{.data.cacert}" | base64 -d
Skip this step if one of the following requirements is met:
The public hostname matches the public domain name set by the
ingressConfig.tlsConfig.publicDomainfieldThe OpenStack configuration has been applied
Otherwise, update the zonegroup
hostnamesof Ceph Object Gateway:To update the zonegroup hostnames
Enter the
rook-ceph-toolspod:kubectl -n rook-ceph exec -it deployment/rook-ceph-tools -- bash
Obtain Ceph Object Gateway default zonegroup configuration:
radosgw-admin zonegroup get --rgw-zonegroup=<objectStorageName> --rgw-zone=<objectStorageName> | tee zonegroup.json
Substitute
<objectStorageName>with the Ceph Object Storage name fromobjectStorage.rgw.name.Inspect
zonegroup.jsonand verify that thehostnameskey is a list that contains two endpoints: an internal endpoint and a custom public endpoint:"hostnames": ["rook-ceph-rgw-<objectStorageName>.rook-ceph.svc", <customPublicEndpoint>]
Substitute
<objectStorageName>with the Ceph Object Storage name and<customPublicEndpoint>with the public endpoint with a custom public domain.If one or both endpoints are omitted in the list, add the missing endpoints to the
hostnameslist in thezonegroup.jsonfile and update Ceph Object Gateway zonegroup configuration:radosgw-admin zonegroup set --rgw-zonegroup=<objectStorageName> --rgw-zone=<objectStorageName> --infile zonegroup.json radosgw-admin period update --commit
Verify that the
hostnameslist contains both the internal and custom public endpoint:radosgw-admin --rgw-zonegroup=<objectStorageName> --rgw-zone=<objectStorageName> zonegroup get | jq -r ".hostnames"
Example of system response:
[ "rook-ceph-rgw-obj-store.rook-ceph.svc", "obj-store.mcc1.cluster1.example.com" ]
Exit the
rook-ceph-toolspod:exit
Once done, Ceph Object Gateway becomes available by the custom public endpoint with an S3 API client, OpenStack Swift CLI, and OpenStack Horizon Containers plugin.
Use object storage server-side encryption
TechPreview
Warning
This procedure is valid for MOSK clusters that use the MiraCeph custom
resource (CR), which is available since MOSK 25.2 to replace the deprecated
KaaSCephCluster. For the equivalent procedure with the KaaSCephCluster
CR, refer to the following section:
When you use Ceph Object Gateway server-side encryption (SSE), unencrypted data sent over HTTPS is stored encrypted by the Ceph Object Gateway in the Ceph cluster. The current implementation integrates Barbican as a key management service.
The object storage SSE feature is enabled by default in MOSK deployments with Barbican. To use object storage SSE, the AWS CLI S3 client is used.
To use object storage server-side encryption:
Create Amazon Elastic Compute Cloud (EC2) credentials:
openstack ec2 credentials create
Configure AWS CLI with
accessandsecretcreated in the previous step:aws configureCreate a secret key in Barbican secret key:
openstack secret order create --name <name> --algorithm <algorithm> --mode <mode> --bit-length 256 --payload-content-type=<payload-content-type> key
Substitute the parameters enclosed in angle brackets:
<name>- human-friendly name.<algorithm>- algorithm to use with the requested key. For example,aes.<mode>- algorithm mode to use with the requested key. For example,ctr.<payload-content-type>- type/format of the secret to generate. For example,application/octet-stream.
Verify that the key has been created:
openstack secret order get <order-href>
Substitute
<order-href>with the corresponding value from the output of the previous command.Specify the
ceph-rgwuser in the Barbican secret Access Control List (ACL):Obtain the list of
ceph-rgwusers:openstack user list --domain service | grep ceph-rgw
Example output:
| c63b70134e0845a2b13c3f947880f66a | ceph-rgwZ6ycK3dY |
In the output, capture the first value as the
<user-id>, which isc63b70134e0845a2b13c3f947880f66ain the above example.Specify the
ceph-rgwuser in the Barbican ACL:openstack acl user add --user <user-id> <secret-href>
Substitute
<user-id>with the corresponding value from the output of the previous command and<secret-href>with the corresponding value obtained in step 3.
Create an S3 bucket:
aws --endpoint-url <rgw-endpoint-url> --ca-bundle <ca-bundle> s3api create-bucket --bucket <bucket-name>
Substitute the parameters enclosed in angle brackets:
<rgw-endpoint-url>- Ceph Object Gateway endpoint DNS name<ca-bundle>- CA Certificate Bundle<bucket-name>- human-friendly bucket name
Upload a file using object storage SSE:
aws --endpoint-url <rgw-endpoint-url> --ca-bundle <ca-bundle> s3 cp <path-to-file> "s3://<bucket-name>/<filename>" --sse aws:kms --sse-kms-key-id <key-id>
Substitute the parameters enclosed in angle brackets:
<path-to-file>- path to the file that you want to upload<filename>- name under which the uploaded file will be stored in the bucket<key-id>- Barbican secret key ID
Select one of the following options to download the file:
Download the file using a key:
aws --endpoint-url <rgw-endpoint-url> --ca-bundle <ca-bundle> s3 cp "s3://<bucket-name>/<filename>" <path-to-output-file> --sse aws:kms --sse-kms-key-id <key-id>
Substitute
<path-to-output-file>with the path to the file you want to download.Download the file without a key:
aws --endpoint-url <rgw-endpoint-url> --ca-bundle <ca-bundle> s3 cp "s3://<bucket-name>/<filename>" <output-filename>
Set an Amazon S3 bucket policy
Warning
This procedure is valid for MOSK clusters that use the MiraCeph custom
resource (CR), which is available since MOSK 25.2 to replace the deprecated
KaaSCephCluster. For the equivalent procedure with the KaaSCephCluster
CR, refer to the following section:
This section explains how to create an Amazon Simple Storage Service (Amazon S3 or S3) bucket and set an S3 bucket policy between two Ceph Object Storage users.
Create Ceph Object Storage users
Warning
This procedure is valid for MOSK clusters that use the MiraCeph custom
resource (CR), which is available since MOSK 25.2 to replace the deprecated
KaaSCephCluster. For the equivalent procedure with the KaaSCephCluster
CR, refer to the following section:
Ceph Object Storage users can create Amazon S3 buckets and bucket policies that grant access to other users.
This section describes how to create two Ceph Object Storage users and configure their S3 credentials.
To create and configure Ceph Object Storage users:
Open the
MiraCephCR:kubectl -n ceph-lcm-mirantis edit miraceph
In the
objectStorage.rgwsection, add new Ceph Object Storage users.Caution
For user
name, apply the UUID format with no capital letters.For example:
spec: objectStorage: rgw: objectUsers: - name: user-b displayName: user-a capabilities: bucket: "*" user: read - name: user-t displayName: user-t capabilities: bucket: "*" user: read
Verify that
rgwUserSecretsare created for both users:kubectl -n ceph-lcm-mirantis get mcsecret -o yaml
Example of a positive system response:
status: secretInfo: rgwUserSecrets: - name: user-a secretName: <user-aCredSecretName> secretNamespace: <user-aCredSecretNamespace> - name: user-t secretName: <user-tCredSecretName> secretNamespace: <user-tCredSecretNamespace>
Obtain S3 user credentials from the cluster secrets. Specify an access key and a secret key for both users:
kubectl -n <user-aCredSecretNamespace> get secret <user-aCredSecretName> -o jsonpath='{.data.AccessKey}' | base64 -d kubectl -n <user-aCredSecretNamespace> get secret <user-aCredSecretName> -o jsonpath='{.data.SecretKey}' | base64 -d kubectl -n <user-tCredSecretNamespace> get secret <user-tCredSecretName> -o jsonpath='{.data.AccessKey}' | base64 -d kubectl -n <user-tCredSecretNamespace> get secret <user-tCredSecretName> -o jsonpath='{.data.SecretKey}' | base64 -d
Substitute the corresponding
secretNamespaceandsecretNamefor both users.Obtain Ceph Object Storage public endpoint from the
MiraCephHealthstatus:kubectl -n ceph-lcm-mirantis get mchealth -o yaml | grep PublicEndpoint
Example of a positive system response:
objectStorePublicEndpoint: https://object-storage.mirantis.example.comObtain the CA certificate to use an HTTPS endpoint:
kubectl -n rook-ceph get secret $(kubectl -n rook-ceph get ingress -o jsonpath='{.items[0].spec.tls[0].secretName}{"\n"}') -o jsonpath='{.data.ca\.crt}' | base64 -d; echo
Save the output to
ca.crt.
Set a bucket policy for a Ceph Object Storage user
Warning
This procedure is valid for MOSK clusters that use the MiraCeph custom
resource (CR), which is available since MOSK 25.2 to replace the deprecated
KaaSCephCluster. For the equivalent procedure with the KaaSCephCluster
CR, refer to the following section:
Amazon S3 is an object storage service with different access policies. A bucket policy is a resource-based policy that grants permissions to a bucket and objects in it. For more details, see Amazon S3 documentation: Using bucket policies .
The following procedure illustrates the process of setting a bucket policy for
a bucket (test01) stored in a Ceph Object Storage. The bucket policy
requires at least two users: a bucket owner (user-a) and a bucket user
(user-t). The bucket owner creates the bucket and sets the policy that
regulates access for the bucket user.
Caution
For user name, apply the UUID format with no capital letters.
To configure an Amazon S3 bucket policy:
Note
The s3cmd is a free command-line tool and client for uploading, retrieving, and managing data in Amazon S3 and other cloud storage service providers that use the S3 protocol. You can download the s3cmd CLI tool from Amazon S3 tools: Download s3cmd.
Configure the s3cmd client with the
user-acredentials:s3cmd --configure --ca-certs=ca.crt
Specify the bucket access parameters as required:
Bucket access parameters¶ Parameter
Description
Comment
Access KeyPublic part of access credentials.
Specify a user access key.
Secret KeySecret part of access credentials.
Specify a user secret key.
Default RegionRegion of AWS servers where requests are sent by default.
Use the default value.
S3 EndpointConnection point to the Ceph Object Storage.
Specify the Ceph Object Storage public endpoint.
DNS-style bucket+hostname:port template for accessing a bucketBucket location.
Specify the Ceph Object Storage public endpoint.
Path to GPG programPath to the GNU Privacy Guard encryption suite.
Use the default value.
Use HTTPS protocolHTTPS protocol switch.
Specify
Yes.HTTP Proxy server nameHTTP Proxy server name.
Skip this parameter.
When configured correctly, the s3cmd tool connects to the Ceph Object Storage. Save new settings when prompted by the system.
As
user-a, create a new buckettest01:s3cmd mb s3://test01
Example of a positive system response:
Bucket 's3://test01/' created
Upload an object to the bucket:
touch test.txt s3cmd put test.txt s3://test01
Example of a positive system response:
upload: 'test.txt' -> 's3://test01/test.txt' [1 of 1] 0 of 0 0% in 0s 0.00 B/s done
Verify that the object is in the
test01bucket:s3cmd ls s3://test01
Example of a positive system response:
2022-09-02 13:06 0 s3://test01/test.txt
Create the bucket policy file and add bucket CRUD permissions for
user-t:{ "Version": "2012-10-17", "Id": "S3Policy1", "Statement": [ { "Sid": "BucketAllow", "Effect": "Allow", "Principal": { "AWS": ["arn:aws:iam:::user/user-t"] }, "Action": [ "s3:ListBucket", "s3:PutObject", "s3:GetObject" ], "Resource": [ "arn:aws:s3:::test01", "arn:aws:s3:::test01/*" ] } ] }
Set the bucket policy for the
test01bucket:s3cmd setpolicy policy.json s3://test01
Example of a positive system response:
s3://test01/: Policy updated
Verify that the
user-thas access for thetest01bucket by reconfiguring the s3cmd client with theuser-tcredentials:s3cmd --ca-certs=ca.crt --configure
Specify the bucket access parameters in a similar to the step 1 manner.
When configured correctly, the s3cmd tool connects to the Ceph Object Storage. Save new settings when prompted by the system.
Verify that the
user-tcan read the buckettest01content:s3cmd ls s3://test01
Example of a positive system response:
2022-09-02 13:06 0 s3://test01/test.txt
Download the object from the
test01bucket:s3cmd get s3://test01/test.txt check.txt
Example of a positive system response:
download: 's3://test01/test.txt' -> 'check.txt' [1 of 1] 0 of 0 0% in 0s 0.00 B/s done
Upload a new object to the
test01bucket:s3cmd put check.txt s3://test01
Example of a positive system response:
upload: 'check.txt' -> 's3://test01/check.txt' [1 of 1] 0 of 0 0% in 0s 0.00 B/s done
Verify that the object is in the
test01bucket:s3cmd ls s3://test01
Example of a positive system response:
2022-09-02 14:41 0 s3://test01/check.txt 2022-09-02 13:06 0 s3://test01/test.txt
Verify the new object by reconfiguring the s3cmd client with the
user-acredentials:s3cmd --configure --ca-certs=ca.crt
List
test01bucket objects:s3cmd ls s3://test01
Example of a positive system response:
2022-09-02 14:41 0 s3://test01/check.txt 2022-09-02 13:06 0 s3://test01/test.txt
Set a bucket policy for OpenStack users
Warning
This procedure is valid for MOSK clusters that use the MiraCeph custom
resource (CR), which is available since MOSK 25.2 to replace the deprecated
KaaSCephCluster. For the equivalent procedure with the KaaSCephCluster
CR, refer to the following section:
The following procedure illustrates the process of setting a bucket policy for a bucket between two OpenStack users.
Due to specifics of the Ceph integration with OpenStack projects, you should configure the bucket policy for OpenStack users indirectly through setting permissions for corresponding OpenStack projects.
For illustration purposes, we use the following names in the procedure:
test01for the bucketuser-a,user-tfor the OpenStack usersproject-a,project-tfor the OpenStack projects
To configure an Amazon S3 bucket policy for OpenStack users:
Specify the
rookConfigsection of theMiraCephcustom resource:spec: rookConfig: rgw keystone implicit tenants: "swift"
Prepare the Ceph Object Storage similarly to the procedure described in Create Ceph Object Storage users.
Create two OpenStack projects:
openstack project create project-a openstack project create project-t
Example of system response:
+-------------+----------------------------------+ | Field | Value | +-------------+----------------------------------+ | description | | | domain_id | default | | enabled | True | | id | faf957b776874a2e80384cb882ebf6ab | | is_domain | False | | name | project-a | | options | {} | | parent_id | default | | tags | [] | +-------------+----------------------------------+
You can also use existing projects. Save the ID of each project for the bucket policy specification.
Note
For details how to access OpenStack CLI, refer Access your OpenStack environment.
Create an OpenStack user for each project:
openstack user create user-a --project project-a openstack user create user-t --project project-t
Example of system response:
+---------------------+----------------------------------+ | Field | Value | +---------------------+----------------------------------+ | default_project_id | faf957b776874a2e80384cb882ebf6ab | | domain_id | default | | enabled | True | | id | cc2607dc383e4494948d68eeb556f03b | | name | user-a | | options | {} | | password_expires_at | None | +---------------------+----------------------------------+
You can also use existing project users.
Assign the
memberrole to the OpenStack users:openstack role add member --user user-a --project project-a openstack role add member --user user-t --project project-t
Verify that the OpenStack users have obtained the
memberroles paying attention to the role IDs:openstack role show member
Example of system response:
+-------------+----------------------------------+ | Field | Value | +-------------+----------------------------------+ | description | None | | domain_id | None | | id | 8f0ce4f6cd61499c809d6169b2b5bd93 | | name | member | | options | {'immutable': True} | +-------------+----------------------------------+
List the role assignments for the
user-aanduser-t:openstack role assignment list --user user-a --project project-a openstack role assignment list --user user-t --project project-t
Example of system response:
+----------------------------------+----------------------------------+-------+----------------------------------+--------+--------+-----------+ | Role | User | Group | Project | Domain | System | Inherited | +----------------------------------+----------------------------------+-------+----------------------------------+--------+--------+-----------+ | 8f0ce4f6cd61499c809d6169b2b5bd93 | cc2607dc383e4494948d68eeb556f03b | | faf957b776874a2e80384cb882ebf6ab | | | False | +----------------------------------+----------------------------------+-------+----------------------------------+--------+--------+-----------+
Create Amazon EC2 credentials for
user-aanduser-t:openstack ec2 credentials create --user user-a --project project-a openstack ec2 credentials create --user user-t --project project-t
Example of system response:
+------------+----------------------------------------------------------------------------------------------------------------------------------------------------------------+ | Field | Value | +------------+----------------------------------------------------------------------------------------------------------------------------------------------------------------+ | access | d03971aedc2442dd9a79b3b409c32046 | | links | {'self': 'http://keystone-api.openstack.svc.cluster.local:5000/v3/users/cc2607dc383e4494948d68eeb556f03b/credentials/OS-EC2/d03971aedc2442dd9a79b3b409c32046'} | | project_id | faf957b776874a2e80384cb882ebf6ab | | secret | 0a9fd8d9e0d24aecacd6e75951154d0f | | trust_id | None | | user_id | cc2607dc383e4494948d68eeb556f03b | +------------+----------------------------------------------------------------------------------------------------------------------------------------------------------------+
Obtain the values from the
accessandsecretfields to connect with Ceph Object Storage trough the s3cmd tool.Note
The s3cmd is a free command-line tool for uploading, retrieving, and managing data in Amazon S3 and other cloud storage service providers that use the S3 protocol. You can download the s3cmd tool from Amazon S3 tools: Download s3cmd.
Create bucket users and configure a bucket policy for the
project-tOpenStack project similarly to the procedure described in Set a bucket policy for a Ceph Object Storage user. Ceph integration does not allow providing permissions for OpenStack users directly. Therefore, you need to set permissions for the project that corresponds to the user:{ "Version": "2012-10-17", "Id": "S3Policy1", "Statement": [ { "Sid": "BucketAllow", "Effect": "Allow", "Principal": { "AWS": ["arn:aws:iam::<PROJECT-T_ID>:root"] }, "Action": [ "s3:ListBucket", "s3:PutObject", "s3:GetObject" ], "Resource": [ "arn:aws:s3:::test01", "arn:aws:s3:::test01/*" ] } ] }
You can configure different bucket policies for various situations. See examples below.
Provide access to a bucket from one OpenStack project to another
{
"Version": "2012-10-17",
"Id": "S3Policy1",
"Statement": [
{
"Sid": "BucketAllow",
"Effect": "Allow",
"Principal": {
"AWS": ["arn:aws:iam::<osProjectId>:root"]
},
"Action": [
"s3:ListBucket",
"s3:PutObject",
"s3:GetObject"
],
"Resource": [
"arn:aws:s3:::<bucketName>",
"arn:aws:s3:::<bucketName>/*"
]
}
]
}
Substitute the following parameters:
<osProjectId>- the target OpenStack project ID<bucketName>- the target bucket name where the policy will be set
Provide access to a bucket from a Ceph Object Storage user to an OpenStack project
{
"Version": "2012-10-17",
"Id": "S3Policy1",
"Statement": [
{
"Sid": "BucketAllow",
"Effect": "Allow",
"Principal": {
"AWS": ["arn:aws:iam::<osProjectId>:root"]
},
"Action": [
"s3:ListBucket",
"s3:PutObject",
"s3:GetObject"
],
"Resource": [
"arn:aws:s3:::<bucketName>",
"arn:aws:s3:::<bucketName>/*"
]
}
]
}
Substitute the following parameters:
<osProjectId>- the target OpenStack project ID<bucketName>- the target bucket name where policy will be set
Provide access to a bucket from an OpenStack user to a Ceph Object Storage user
{
"Version": "2012-10-17",
"Id": "S3Policy1",
"Statement": [
{
"Sid": "BucketAllow",
"Effect": "Allow",
"Principal": {
"AWS": ["arn:aws:iam:::user/<userName>"]
},
"Action": [
"s3:ListBucket",
"s3:PutObject",
"s3:GetObject"
],
"Resource": [
"arn:aws:s3:::<bucketName>",
"arn:aws:s3:::<bucketName>/*"
]
}
]
}
Substitute the following parameters:
<userName>- the target Ceph Object Storage user name<bucketName>- the target bucket name where policy will be set
Provide access to a bucket from one Ceph Object Storage user to another
{
"Version": "2012-10-17",
"Id": "S3Policy1",
"Statement": [
{
"Sid": "BucketAllow",
"Effect": "Allow",
"Principal": {
"AWS": ["arn:aws:iam:::user/<userName>"]
},
"Action": [
"s3:ListBucket",
"s3:PutObject",
"s3:GetObject"
],
"Resource": [
"arn:aws:s3:::<bucketName>",
"arn:aws:s3:::<bucketName>/*"
]
}
]
}
Substitute the following parameters:
<userName>- the target Ceph Object Storage user name<bucketName>- the target bucket name where policy will be set
Calculate target ratio for Ceph pools
Warning
This procedure is valid for MOSK clusters that use the MiraCeph custom
resource (CR), which is available since MOSK 25.2 to replace the deprecated
KaaSCephCluster. For the equivalent procedure with the KaaSCephCluster
CR, refer to the following section:
Ceph pool target ratio defines for the Placement Group (PG) autoscaler the amount of data the pools are expected to acquire over time in relation to each other. You can set initial PG values for each Ceph pool. Otherwise, the autoscaler starts with the minimum value and scales up, causing a lot of data to move in the background.
You can allocate several pools to use the same device class, which is a solid
block of available capacity in Ceph. For example, if three pools
(kubernetes-hdd, images-hdd, and volumes-hdd) are set to use the
same device class hdd, you can set the target ratio for Ceph pools to
provide 80% of capacity to the volumes-hdd pool and distribute the
remaining capacity evenly between the two other pools. This way, Ceph pool
target ratio instructs Ceph on when to warn that a pool is running out of free
space and, at the same time, instructs Ceph on how many placement groups Ceph
should allocate/autoscale for a pool for better data distribution.
Ceph pool target ratio is not a constant value and you can change it according to new capacity plans. Once you specify target ratio, if the PG number of a pool scales, other pools with specified target ratio will automatically scale accordingly.
For details, see Ceph Documentation: Autoscaling Placement Groups.
To calculate target ratio for each Ceph pool:
Define raw capacity of the entire storage by device class:
kubectl -n rook-ceph exec -it $(kubectl -n rook-ceph get pod -l "app=rook-ceph-tools" -o name) -- ceph df
For illustration purposes, the procedure below uses raw capacity of 185 TB or 189440 GB.
Design Ceph pools with the considered device class upper bounds of the possible capacity. For example, consider the
hdddevice class that contains the following pools:The
kubernetes-hddpool will contain not more than 2048 GB.The
images-hddpool will contain not more than 2048 GB.The
volumes-hddpool will contain 50 GB per VM. The upper bound of used VMs on the cloud is 204, the pool replicated size is3. Therefore, calculate the upper bounds forvolumes-hdd:50 GB per VM * 204 VMs * 3 replicas = 30600 GB
The
backup-hddpool can be calculated as a relative ofvolumes-hdd. For example, 1volumes-hddstorage unit per 5backup-hddunits.The
vms-hddis a pool for ephemeral storage Copy on Write (CoW). We recommend designing the amount of ephemeral data it should store. For example purposes, we use 500 GB. However, in reality, despite the CoW data reduction, this value is very optimistic.
Note
If
dataPoolis replicated and Ceph Object Store is planned for intensive use, also calculate upper bounds fordataPool.Calculate target ratio for each considered pool. For example:
Example bounds and capacity¶ Pools upper bounds
Pools capacity
kubernetes-hdd= 2048 GBimages-hdd= 2048 GBvolumes-hdd= 30600 GBbackup-hdd= 30600 GB * 5 = 153000 GBvms-hdd= 500 GB
Summary capacity = 188196 GB
Total raw capacity = 189440 GB
Calculate pools fit factor using the (total raw capacity) / (pools summary capacity) formula. For example:
pools fit factor = 189440 / 188196 = 1.0066
Calculate pools upper bounds size using the (pool upper bounds) * (pools fit factor) formula. For example:
kubernetes-hdd = 2048 GB * 1.0066 = 2061.5168 GB images-hdd = 2048 GB * 1.0066 = 2061.5168 GB volumes-hdd = 30600 GB * 1.0066 = 30801.96 GB backup-hdd = 153000 GB * 1.0066 = 154009.8 GB vms-hdd = 500 GB * 1.0066 = 503.3 GB
Calculate pool target ratio using the (pool upper bounds) * 100 / (total raw capacity) formula. For example:
kubernetes-hdd = 2061.5168 GB * 100 / 189440 GB = 1.088 images-hdd = 2061.5168 GB * 100 / 189440 GB = 1.088 volumes-hdd = 30801.96 GB * 100 / 189440 GB = 16.259 backup-hdd = 154009.8 GB * 100 / 189440 GB = 81.297 vms-hdd = 503.3 GB * 100 / 189440 GB = 0.266
If required, calculate the target ratio for erasure-coded pools.
Due to erasure-coded pools splitting each object into
Kdata parts andMcoding parts, the total used storage for each object is less than that in replicated pools. Indeed,Mis equal to the number of OSDs that can be missing from the cluster without the cluster experiencing data loss. This means that planned data is stored with an efficiency of(K+M)/2on the Ceph cluster. For example, if an erasure-coded data pool withK=2, M=2planned capacity is 200 GB, then the total used capacity is200*(2+2)/2, which is 400 GB.Open the
MiraCephCR on a MOSK cluster for editing:kubectl -n ceph-lcm-mirantis edit miraceph
In the
poolssection, specify the calculated relatives asparameters.target_size_ratiofor each considered replicated pool. For example:pools: - name: kubernetes deviceClass: hdd ... replicated: size: 3 parameters: target_size_ratio: "1.088" - name: images deviceClass: hdd ... replicated: size: 3 parameters: target_size_ratio: "1.088" - name: volumes deviceClass: hdd ... replicated: size: 3 parameters: target_size_ratio: "16.259" - name: backup deviceClass: hdd ... replicated: size: 3 parameters: target_size_ratio: "81.297" - name: vms deviceClass: hdd ... replicated: size: 3 parameters: target_size_ratio: "0.266"
If Ceph Object Store
dataPoolisreplicatedand a proper value is calculated, also specify it:objectStorage: rgw: name: rgw-store ... dataPool: deviceClass: hdd ... replicated: size: 3 parameters: target_size_ratio: "<relative>"
In the
poolssection, specify the calculated relatives asparameters.target_size_ratiofor each considered erasure-coded pool. For example:Note
The
parameterssection is a key-value mapping where the value is of the string type and should be quoted.spec: cephClusterSpec: pools: - name: ec-pool deviceClass: hdd ... parameters: target_size_ratio: "<relative>"
If Ceph Object Store
dataPooliserasure-codedand a proper value is calculated, also specify it:spec: cephClusterSpec: objectStorage: rgw: name: rgw-store ... dataPool: deviceClass: hdd ... parameters: target_size_ratio: "<relative>"
Verify that all target ratio has been successfully applied to the Ceph cluster:
kubectl -n rook-ceph exec -it deploy/rook-ceph-tools -- ceph osd pool autoscale-status
Example of system response:
POOL SIZE TARGET SIZE RATE RAW CAPACITY RATIO TARGET RATIO EFFECTIVE RATIO BIAS PG_NUM NEW PG_NUM AUTOSCALE device_health_metrics 0 2.0 149.9G 0.0000 1.0 1 on kubernetes-hdd 2068 2.0 149.9G 0.0000 1.088 1.0885 1.0 32 on volumes-hdd 19 2.0 149.9G 0.0000 16.259 16.2591 1.0 256 on vms-hdd 19 2.0 149.9G 0.0000 0.266 0.2661 1.0 128 on backup-hdd 19 2.0 149.9G 0.0000 81.297 81.2972 1.0 256 on images-hdd 888.8M 2.0 149.9G 0.0116 1.088 1.0881 1.0 32 on
Optional. Repeat the steps above for other device classes.
Ceph pools for Cinder multi-backend
Warning
This procedure is valid for MOSK clusters that use the MiraCeph custom
resource (CR), which is available since MOSK 25.2 to replace the deprecated
KaaSCephCluster. For the equivalent procedure with the KaaSCephCluster
CR, refer to the following section:
The MiraCeph object supports multiple Ceph pools with the volumes role
to configure Cinder multiple backends.
To define Ceph pools for Cinder multiple backends:
In the
MiraCephCR, add the desired number of Ceph pools to thepoolssection with thevolumesrole:kubectl -n ceph-lcm-mirantis edit miraceph
Example configuration:
pools: - default: false deviceClass: hdd name: volumes replicated: size: 3 role: volumes - default: false deviceClass: hdd name: volumes-backend-1 replicated: size: 3 role: volumes - default: false deviceClass: hdd name: volumes-backend-2 replicated: size: 3 role: volumes
Verify that Cinder backend pools are created and ready:
kubectl -n ceph-lcm-mirantis get mchealth -o yaml
Example output:
status: fullClusterStatus: blockStorageStatus: poolsStatus: volumes-hdd: present: true status: observedGeneration: 1 phase: Ready volumes-backend-1-hdd: present: true status: observedGeneration: 1 phase: Ready volumes-backend-2-hdd: present: true status: observedGeneration: 1 phase: Ready
Verify that the added Ceph pools are accessible from the Cinder service. For example:
kubectl -n openstack exec -it cinder-volume-0 -- rbd ls -p volumes-backend-1-hdd -n client.cinder kubectl -n openstack exec -it cinder-volume-0 -- rbd ls -p volumes-backend-2-hdd -n client.cinder
After the Ceph pool becomes available, it is automatically specified as an additional Cinder backend and registered as a new volume type, which you can use to create Cinder volumes.
The following sections describe how to configure, manage, and verify specific aspects of a Ceph cluster.
Caution
Before you proceed with any reading or writing operation, first verify the cluster status using the ceph tool as described in Verify the Ceph core services.
Automated Ceph LCM
Warning
This procedure is valid for MOSK clusters that use the MiraCeph custom
resource (CR), which is available since MOSK 25.2 to replace the deprecated
KaaSCephCluster. For the equivalent procedure with the KaaSCephCluster
CR, refer to the following section:
This section describes the supported automated Ceph lifecycle management (LCM) operations.
High-level workflow of Ceph OSD or node removal
Warning
This procedure is valid for MOSK clusters that use the MiraCeph custom
resource (CR), which is available since MOSK 25.2 to replace the deprecated
KaaSCephCluster. For the equivalent procedure with the KaaSCephCluster
CR, refer to the following section:
The Ceph LCM automated operations such as Ceph OSD or Ceph node removal are
performed by creating a corresponding CephOsdRemoveRequest CR. It allows
for automated removal of healthy or non-healthy Ceph OSDs from a Ceph cluster
and covers the following scenarios:
Reducing hardware - all Ceph OSDs are up/in but you want to decrease the number of Ceph OSDs by reducing the number of disks or hosts.
Hardware issues. For example, if a host unexpectedly goes down and will not be restored, or if a disk on a host goes down and requires replacement.
This section describes the CephOsdRemoveRequest CR creation workflow,
specification, and request status.
For step-by-step procedures, refer to Automated Ceph LCM.
Warning
This procedure is valid for MOSK clusters that use the MiraCeph custom
resource (CR), which is available since MOSK 25.2 to replace the deprecated
KaaSCephCluster. For the equivalent procedure with the KaaSCephCluster
CR, refer to the following section:
The workflow of creating a Ceph OSD removal request includes the following steps:
Removing obsolete nodes or disks from the
spec.nodessection of theMiraCephCR as described in Ceph advanced configuration.Note
Note the names of the removed nodes, devices or their paths exactly as they were specified in
MiraCephfor further usage.Creating a YAML template for the
CephOsdRemoveRequestCR. For details, see CephOsdRemoveRequest OSD removal specification.If
CephOsdRemoveRequestcontains information about Ceph OSDs to remove in a proper format, the information will be validated to eliminate human error and avoid a wrong Ceph OSD removal.If the
nodessection ofCephOsdRemoveRequestis empty, the Ceph Request Controller will automatically detect Ceph OSDs for removal, if any. Auto-detection is based not only on the information provided in theMiraCephbut also on the information from the Ceph cluster itself.
Once the validation or auto-detection completes, the entire information about the Ceph OSDs to remove appears in the
CephOsdRemoveRequestobject: hosts they belong to, OSD IDs, disks, partitions, and so on. The request then moves to theApproveWaitingphase until the Operator manually specifies theapproveflag in the spec.Manually adding an affirmative
approveflag in theCephOsdRemoveRequestspec. Once done, the Ceph Status Controller reconciliation pauses until the request is handled and executes the following:Stops regular Ceph Controller reconciliation
Removes Ceph OSDs
Runs batch jobs to clean up the device, if possible
Removes host information from the Ceph cluster if the entire Ceph node is removed
Marks the request with an appropriate result with a description of occurred issues
Note
If the request completes successfully, Ceph Controller reconciliation resumes. Otherwise, it remains paused until the issue is resolved.
Reviewing the Ceph OSD removal status. For details, see CephOsdRemoveRequest OSD removal status.
Manual removal of device cleanup jobs.
Note
Device cleanup jobs are not removed automatically and are kept in the
ceph-lcm-mirantisnamespace along with pods containing information about the executed actions. The jobs have the following labels:labels: app: miraceph-cleanup-disks host: <HOST-NAME> osd: <OSD-ID> rook-cluster: <ROOK-CLUSTER-NAME>
Additionally, jobs are labeled with disk names that will be cleaned up, such as
vdb=true. You can remove a single job or a group of jobs using any label described above, such as host, disk, and so on.
Example of CephOsdRemoveRequest resource
apiVersion: lcm.mirantis.com/v1alpha1
kind: CephOsdRemoveRequest
metadata:
name: remove-osd-3-4-request
namespace: ceph-lcm-namespace
spec:
approve: true
nodes:
worker-3:
cleanupByDevice:
- name: sdb
- path: /dev/disk/by-path/pci-0000:00:1t.9
Example of Ceph OSDs ready for removal
apiVersion: lcm.mirantis.com/v1alpha1
kind: CephOsdRemoveRequest
metadata:
generateName: remove-osds
namespace: ceph-lcm-mirantis
spec:
nodes: {}
Warning
This procedure is valid for MOSK clusters that use the MiraCeph custom
resource (CR), which is available since MOSK 25.2 to replace the deprecated
KaaSCephCluster. For the equivalent procedure with the KaaSCephCluster
CR, refer to the following section:
This section describes the CephOsdRemoveRequest CR specification.
For the procedure workflow, see Creating a Ceph OSD removal request.
Parameter |
Description |
|---|---|
|
Map of Kubernetes nodes that specifies how to remove Ceph OSDs: by host-devices or OSD IDs. For details, see CephOsdRemoveRequest nodes parameters spec. |
|
Flag that indicates whether a request is ready to execute removal. Can only be manually enabled by the Operator. For example: spec:
approve: true
|
|
Flag used to keep requests in handling and not to proceed to the next
request if the If the For example: spec:
keepOnFail: true
|
|
Optional. Flag that marks a finished request, even if it failed, to keep it in history. It allows resuming the Ceph Controller reconciliation without removing the failed request. The flag is used only by Ceph Controller and has no effect on request processing. Can only be manually specified. For example: spec:
resolved: true
|
|
Optional. Flag used to resume a failed request and proceed with Ceph OSD
removal if the spec:
resumeFailed: true
|
Parameter |
Description |
|---|---|
|
Flag used to clean up an entire node and drop it from the CRUSH map.
Mutually exclusive with |
|
List that describes devices to clean up by name or device path as they
were specified in
Warning Since MOSK 23.3, Mirantis does not recommend setting device
|
|
List of Ceph OSD IDs to remove. Mutually exclusive with
|
Example of CephOsdRemoveRequest with
spec.nodes
apiVersion: kaas.mirantis.com/v1alpha1
kind: CephOsdRemoveRequest
metadata:
name: remove-osd-request
namespace: ceph-lcm-mirantis
spec:
nodes:
"node-a":
completeCleanUp: true
"node-b":
cleanupByOsdId: [1, 15, 25]
"node-c":
cleanupByDevice:
- name: "sdb"
- path: "/dev/disk/by-path/pci-0000:00:1c.5"
- path: "/dev/disk/by-id/scsi-SATA_HGST_HUS724040AL_PN1334PEHN18ZS"
The example above includes the following actions:
For
node-a, full cleanup, including all OSDs on the node, node drop from the CRUSH map, and cleanup of all disks used for Ceph OSDs on this node.For
node-b, cleanup of Ceph OSDs with IDs1,15, and25along with the related disk information.For
node-c, cleanup of the device with namesdb, the device with path ID/dev/disk/by-path/pci-0000:00:1c.5, and the device withby-id/dev/disk/by-id/scsi-SATA_HGST_HUS724040AL_PN1334PEHN18ZS, dropping of OSDs running on these devices.
Warning
This procedure is valid for MOSK clusters that use the MiraCeph custom
resource (CR), which is available since MOSK 25.2 to replace the deprecated
KaaSCephCluster. For the equivalent procedure with the KaaSCephCluster
CR, refer to the following section:
This section describes the status fields of the
CephOsdRemoveRequest CR that you can use to review a Ceph OSD or node
removal phases. The following diagram represents the phases flow:
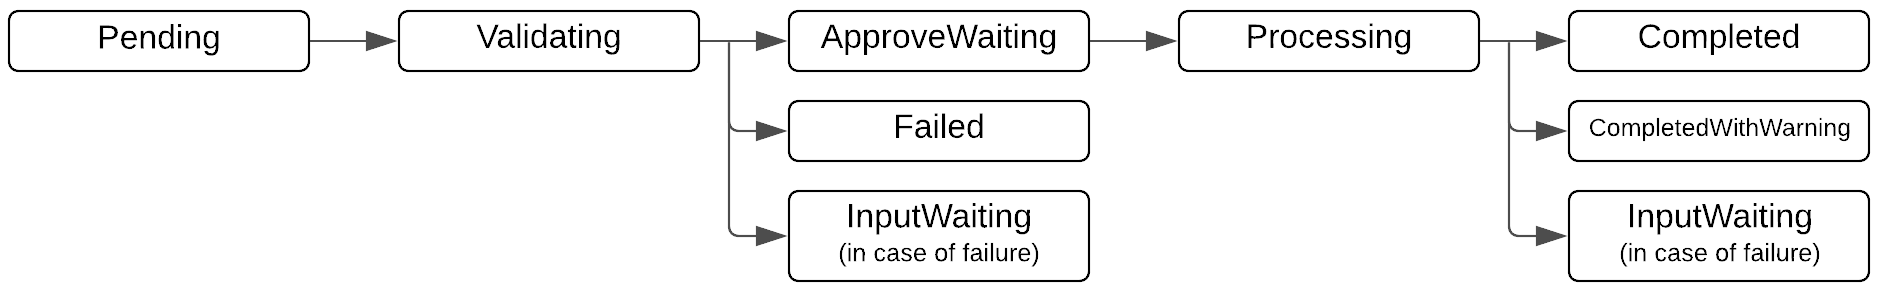
Parameter |
Description |
|---|---|
|
Describes the current request phase that can be one of:
|
|
The overall information about the Ceph OSDs to remove: final removal
map, issues, and warnings. Once the The
|
|
Informational messages describing the reason for the request transition to the next phase. |
|
History of spec updates for the request. |
Example of status.removeInfo after successful Validation
removeInfo:
cleanUpMap:
"node-a":
completeCleanUp: true
osdMapping:
"2":
deviceMapping:
"sdb":
path: "/dev/disk/by-path/pci-0000:00:0a.0"
partition: "/dev/ceph-a-vg_sdb/osd-block-b-lv_sdb"
type: "block"
class: "hdd"
zapDisk: true
"6":
deviceMapping:
"sdc":
path: "/dev/disk/by-path/pci-0000:00:0c.0"
partition: "/dev/ceph-a-vg_sdc/osd-block-b-lv_sdc-1"
type: "block"
class: "hdd"
zapDisk: true
"11":
deviceMapping:
"sdc":
path: "/dev/disk/by-path/pci-0000:00:0c.0"
partition: "/dev/ceph-a-vg_sdc/osd-block-b-lv_sdc-2"
type: "block"
class: "hdd"
zapDisk: true
"node-b":
osdMapping:
"1":
deviceMapping:
"sdb":
path: "/dev/disk/by-path/pci-0000:00:0a.0"
partition: "/dev/ceph-b-vg_sdb/osd-block-b-lv_sdb"
type: "block"
class: "ssd"
zapDisk: true
"15":
deviceMapping:
"sdc":
path: "/dev/disk/by-path/pci-0000:00:0b.1"
partition: "/dev/ceph-b-vg_sdc/osd-block-b-lv_sdc"
type: "block"
class: "ssd"
zapDisk: true
"25":
deviceMapping:
"sdd":
path: "/dev/disk/by-path/pci-0000:00:0c.2"
partition: "/dev/ceph-b-vg_sdd/osd-block-b-lv_sdd"
type: "block"
class: "ssd"
zapDisk: true
"node-c":
osdMapping:
"0":
deviceMapping:
"sdb":
path: "/dev/disk/by-path/pci-0000:00:1t.9"
partition: "/dev/ceph-c-vg_sdb/osd-block-c-lv_sdb"
type: "block"
class: "hdd"
zapDisk: true
"8":
deviceMapping:
"sde":
path: "/dev/disk/by-path/pci-0000:00:1c.5"
partition: "/dev/ceph-c-vg_sde/osd-block-c-lv_sde"
type: "block"
class: "hdd"
zapDisk: true
"sdf":
path: "/dev/disk/by-path/pci-0000:00:5a.5",
partition: "/dev/ceph-c-vg_sdf/osd-db-c-lv_sdf-1",
type: "db",
class: "ssd"
The example above is based on the example spec provided in
CephOsdRemoveRequest OSD removal specification.
During the Validation phase, the provided information was validated and
reflects the final map of the Ceph OSDs to remove:
For
node-a, Ceph OSDs with IDs2,6, and11will be removed with the related disk and its information: all block devices, names, paths, and disk class.For
node-b, the Ceph OSDs with IDs1,15, and25will be removed with the related disk information.For
node-c, the Ceph OSD with ID8will be removed, which is placed on the specifiedsdbdevice. The related partition on thesdfdisk, which is used as the BlueStore metadata device, will be cleaned up keeping the disk itself untouched. Other partitions on that device will not be touched.
Example of removeInfo with removeStatus succeeded
removeInfo:
cleanUpMap:
"node-a":
completeCleanUp: true
hostRemoveStatus:
status: Removed
osdMapping:
"2":
removeStatus:
osdRemoveStatus:
status: Removed
deploymentRemoveStatus:
status: Removed
name: "rook-ceph-osd-2"
deviceCleanUpJob:
status: Finished
name: "job-name-for-osd-2"
deviceMapping:
"sdb":
path: "/dev/disk/by-path/pci-0000:00:0a.0"
partition: "/dev/ceph-a-vg_sdb/osd-block-b-lv_sdb"
type: "block"
class: "hdd"
zapDisk: true
Example of removeInfo with removeStatus failed
removeInfo:
cleanUpMap:
"node-a":
completeCleanUp: true
osdMapping:
"2":
removeStatus:
osdRemoveStatus:
errorReason: "retries for cmd ‘ceph osd ok-to-stop 2’ exceeded"
status: Failed
deviceMapping:
"sdb":
path: "/dev/disk/by-path/pci-0000:00:0a.0"
partition: "/dev/ceph-a-vg_sdb/osd-block-b-lv_sdb"
type: "block"
class: "hdd"
zapDisk: true
Example of removeInfo with removeStatus failed by timeout
removeInfo:
cleanUpMap:
"node-a":
completeCleanUp: true
osdMapping:
"2":
removeStatus:
osdRemoveStatus:
errorReason: Timeout (30m0s) reached for waiting pg rebalance for osd 2
status: Failed
deviceMapping:
"sdb":
path: "/dev/disk/by-path/pci-0000:00:0a.0"
partition: "/dev/ceph-a-vg_sdb/osd-block-b-lv_sdb"
type: "block"
class: "hdd"
zapDisk: true
Note
In case of failures similar to the examples above, review the
ceph-request-controller logs and the Ceph cluster status. Such failures
may simply indicate timeout and retry issues. If no other issues were found,
re-create the request with a new name and skip adding successfully removed
Ceph OSDS or Ceph nodes.
Add, remove, or reconfigure Ceph nodes
Warning
This procedure is valid for MOSK clusters that use the MiraCeph custom
resource (CR), which is available since MOSK 25.2 to replace the deprecated
KaaSCephCluster. For the equivalent procedure with the KaaSCephCluster
CR, refer to the following section:
Mirantis Ceph Controller simplifies a Ceph cluster management by automating LCM operations. This section describes how to add, remove, or reconfigure Ceph nodes.
Note
When adding a Ceph node with the Ceph Monitor role, if any issues occur with
the Ceph Monitor, rook-ceph removes it and adds a new Ceph Monitor instead,
named using the next alphabetic character in order. Therefore, the Ceph Monitor
names may not follow the alphabetical order. For example, a, b, d,
instead of a, b, c.
Prepare a new machine for the required MOSK cluster as described in Add a machine. During machine preparation, update the settings of the related bare metal host profile for the Ceph node being replaced with the required machine devices as described in Create a custom bare metal host profile.
Open the
MiraCephCR on the MOSK cluster for editing:kubectl -n ceph-lcm-mirantis edit miraceph
In the
nodessection, specify the parameters for a Ceph node as required. For the parameters description, see Node parameters.The example configuration of the
nodessection with the new node:nodes: - name: kaas-node-5bgk6 roles: - mon - mgr devices: - config: deviceClass: hdd fullPath: /dev/disk/by-id/scsi-SATA_HGST_HUS724040AL_PN1334PEHN18ZS
You can also add a new node with device filters. For example:
nodes: - name: kaas-node-5bgk6 roles: - mon - mgr config: deviceClass: hdd devicePathFilter: "^/dev/disk/by-id/scsi-SATA_HGST+*"
Warning
Mirantis highly recommends using the non-wwn
by-idsymlinks to specify storage devices in thedeviceslist.For details, see Addressing storage devices since MOSK 25.2.
Note
To use a new Ceph node for a Ceph Monitor or Ceph Manager deployment, also specify the
rolesparameter.Reducing the number of Ceph Monitors is not supported and causes the Ceph Monitor daemons removal from random nodes.
Removal of the
mgrrole in thenodessection of theMiraCephCR does not remove Ceph Managers. To remove a Ceph Manager from a node, remove it from thenodesspec and manually delete themgrpod in the Rook namespace.
Verify that all new Ceph daemons for the specified node have been successfully deployed in the Ceph cluster. The
fullClusterInfosection should not contain any issues.kubectl -n ceph-lcm-mirantis get mchealth -o yaml
Example of system response
status: fullClusterInfo: daemonsStatus: mgr: running: a is active mgr status: Ok mon: running: '3/3 mons running: [a b c] in quorum' status: Ok osd: running: '3/3 running: 3 up, 3 in' status: Ok
Note
Ceph node removal presupposes usage of a CephOsdRemoveRequest
CR. For workflow overview, spec and phases description, see
High-level workflow of Ceph OSD or node removal.
Note
To remove a Ceph node with a mon role, first move the Ceph
Monitor to another node and remove the mon role from the Ceph node as
described in Move a Ceph Monitor daemon to another node.
Open the
MiraCephCR on a MOSK cluster for editing:kubectl -n ceph-lcm-mirantis edit miraceph
In the
nodessection, remove the required Ceph node specification.For example:
spec: nodes: - name: kaas-node-5bgk6 # remove the entire entry for the required node devices: {...} roles: [...]
Create a YAML template for the
CephOsdRemoveRequestCR. For example:apiVersion: lcm.mirantis.com/v1alpha1 kind: CephOsdRemoveRequest metadata: name: remove-osd-worker-5 namespace: ceph-lcm-mirantis spec: nodes: kaas-node-5bgk6: completeCleanUp: true
Apply the template on the MOSK cluster:
kubectl apply -f remove-osd-worker-5.yaml
Verify that the corresponding request has been created:
kubectl -n ceph-lcm-mirantis get cephosdremoverequest remove-osd-worker-5
Verify that the
removeInfosection appeared in theCephOsdRemoveRequestCRstatus:kubectl -n ceph-lcm-mirantis get cephosdremoverequest remove-osd-worker-5 -o yaml
Example of system response
status: removeInfo: cleanUpMap: kaas-node-5bgk6: osdMapping: "10": deviceMapping: sdb: path: "/dev/disk/by-path/pci-0000:00:1t.9" partition: "/dev/ceph-b-vg_sdb/osd-block-b-lv_sdb" type: "block" class: "hdd" zapDisk: true "16": deviceMapping: sdc: path: "/dev/disk/by-path/pci-0000:00:1t.10" partition: "/dev/ceph-b-vg_sdb/osd-block-b-lv_sdc" type: "block" class: "hdd" zapDisk: true
Verify that the
cleanUpMapsection matches the required removal and wait for theApproveWaitingphase to appear instatus:kubectl -n ceph-lcm-mirantis get cephosdremoverequest remove-osd-worker-5 -o yaml
Example of system response:
status: phase: ApproveWaiting
Edit the
CephOsdRemoveRequestCR and set theapproveflag totrue:kubectl -n ceph-lcm-mirantis edit cephosdremoverequest remove-osd-worker-5
For example:
spec: approve: true
Review the status of the
CephOsdRemoveRequestresource request processing. The valuable parameters are as follows:status.phase- the current state of request processingstatus.messages- the description of the current phasestatus.conditions- full history of request processing before the current phasestatus.removeInfo.issuesandstatus.removeInfo.warnings- contain error and warning messages occurred during request processing
Verify that the
CephOsdRemoveRequesthas been completed. For example:status: phase: Completed # or CompletedWithWarnings if there are non-critical issues
Remove the device cleanup jobs:
kubectl delete jobs -n ceph-lcm-mirantis -l app=miraceph-cleanup-disks
There is no hot reconfiguration procedure for existing Ceph OSDs and Ceph Monitors. To reconfigure an existing Ceph node, follow the steps below:
Remove the Ceph node from the Ceph cluster as described in Remove a Ceph node from a MOSK cluster.
Add the same Ceph node but with a modified configuration as described in Add Ceph nodes on a MOSK cluster.
Add, remove, or reconfigure Ceph OSDs
Warning
This procedure is valid for MOSK clusters that use the MiraCeph custom
resource (CR), which is available since MOSK 25.2 to replace the deprecated
KaaSCephCluster. For the equivalent procedure with the KaaSCephCluster
CR, refer to the following section:
Mirantis Ceph Controller simplifies Ceph cluster management by automating LCM operations. This section describes how to add, remove, or reconfigure Ceph OSDs.
Manually prepare the required machine devices with LVM2 on the existing node because
BareMetalHostProfiledoes not support in-place changes.To add a Ceph OSD to an existing or hot-plugged raw device
If you want to add a Ceph OSD on top of a raw device that already exists on a node or is hot-plugged, add the required device using the following guidelines:
You can add a raw device to a node during node deployment.
If a node supports adding devices without node reboot, you can hot plug a raw device to a node.
If a node does not support adding devices without node reboot, you can hot plug a raw device during node shutdown. In this case, complete the following steps:
Enable maintenance mode on the managed cluster.
Turn off the required node.
Attach the required raw device to the node.
Turn on the required node.
Disable maintenance mode on the managed cluster.
Open the
MiraCephCR on a managed cluster for editing:kubectl -n ceph-lcm-mirantis edit miraceph
In one of the following sections, specify parameters for Ceph OSD:
nodes.<nodeName>.devicesnodes.<nodeName>.deviceFilternodes.<nodeName>.devicePathFilter
For description of parameters, see Node parameters.
The example configuration of the
nodessection with the new node:nodes: - name: kaas-node-5bgk6 roles: - mon - mgr devices: - config: # existing item deviceClass: hdd fullPath: /dev/disk/by-id/scsi-SATA_HGST_HUS724040AL_PN1334PEHN18ZS - config: # new item deviceClass: hdd fullPath: /dev/disk/by-id/scsi-0ATA_HGST_HUS724040AL_PN1334PEHN1VBC
Warning
Mirantis highly recommends using the non-wwn
by-idsymlinks to specify storage devices in thedeviceslist.For details, see Addressing storage devices since MOSK 25.2.
Verify that the Ceph OSD on the specified node is successfully deployed. The
fullClusterInfosection should not contain any issues.kubectl -n ceph-lcm-mirantis get mchealth -o yaml
For example:
status: fullClusterInfo: daemonsStatus: ... osd: running: '3/3 running: 3 up, 3 in' status: Ok
Note
Since MOSK 23.2,
cephDeviceMappingis removed because its large size can potentially exceed the Kubernetes 1.5 MB quota.Verify the Ceph OSD on the managed cluster:
kubectl -n rook-ceph get pod -l app=rook-ceph-osd -o wide | grep <nodeName>
Note
Ceph OSD removal presupposes usage of a CephOsdRemoveRequest
CR. For workflow overview, spec and phases description, see
High-level workflow of Ceph OSD or node removal.
Warning
When using the non-recommended Ceph pools replicated.size of
less than 3, Ceph OSD removal cannot be performed. The minimal replica
size equals a rounded up half of the specified replicated.size.
For example, if replicated.size is 2, the minimal replica size is
1, and if replicated.size is 3, then the minimal replica size
is 2. The replica size of 1 allows Ceph having PGs with only one
Ceph OSD in the acting state, which may cause a PG_TOO_DEGRADED
health warning that blocks Ceph OSD removal. Mirantis recommends setting
replicated.size to 3 for each Ceph pool.
Open the
MiraCephCR on a managed cluster for editing:kubectl -n ceph-lcm-mirantis edit miraceph
Remove the required Ceph OSD specification from the
spec.nodes.<machineName>.storageDeviceslist:The example configuration of the
nodessection with the new node:nodes: - name: kaas-node-5bgk6 roles: - mon - mgr devices: - config: deviceClass: hdd fullPath: /dev/disk/by-id/scsi-SATA_HGST_HUS724040AL_PN1334PEHN18ZS - config: # remove the entire item entry from devices list deviceClass: hdd fullPath: /dev/disk/by-id/scsi-0ATA_HGST_HUS724040AL_PN1334PEHN1VBC
Create a YAML template for the
CephOsdRemoveRequestCR. Select from the following options:Remove Ceph OSD by device name,
by-pathsymlink, orby-idsymlink:apiVersion: lcm.mirantis.com/v1alpha1 kind: CephOsdRemoveRequest metadata: name: remove-osd-<nodeName>-sdb namespace: ceph-lcm-mirantis spec: nodes: <nodeName>: cleanupByDevice: - name: sdb
Warning
Since MOSK 23.3, Mirantis does not recommend setting device
nameor deviceby-pathsymlink in thecleanupByDevicefield as these identifiers are not persistent and can change at node boot. Remove Ceph OSDs withby-idsymlinks specified in thepathfield or usecleanupByOsdIdinstead. For details, see Addressing storage devices since MOSK 25.2.Note
If a device was physically removed from a node,
cleanupByDeviceis not supported. Therefore, usecleanupByOsdIdinstead. For details, see Remove a failed Ceph OSD by Ceph OSD ID.If the
devicesitem was specified with aby-pathdevice path, specify thepathparameter in thecleanupByDevicesection instead ofname.
Remove Ceph OSD by OSD ID:
apiVersion: lcm.mirantis.com/v1alpha1 kind: CephOsdRemoveRequest metadata: name: remove-osd-<nodeName>-sdb namespace: ceph-lcm-mirantis spec: nodes: <nodeName>: cleanupByOsdId: - 2
Apply the template on the managed cluster:
kubectl apply -f remove-osd-<nodeName>-sdb.yaml
Verify that the corresponding request has been created:
kubectl -n ceph-lcm-mirantis get cephosdremoverequest remove-osd-<nodeName>-sdb
Verify that the
removeInfosection appeared in theCephOsdRemoveRequestCRstatus:kubectl -n ceph-lcm-mirantis get cephosdremoverequest remove-osd-<nodeName>-sdb -o yaml
Example of system response:
status: removeInfo: cleanUpMap: kaas-node-d4aac64d-1721-446c-b7df-e351c3025591: osdMapping: "10": deviceMapping: sdb: path: "/dev/disk/by-path/pci-0000:00:1t.9" partition: "/dev/ceph-b-vg_sdb/osd-block-b-lv_sdb" type: "block" class: "hdd" zapDisk: true
Verify that the
cleanUpMapsection matches the required removal and wait for theApproveWaitingphase to appear instatus:kubectl -n ceph-lcm-mirantis get cephosdremoverequest remove-osd-<nodeName>-sdb -o yaml
Example of system response:
status: phase: ApproveWaiting
Edit the
CephOsdRemoveRequestCR and set theapproveflag totrue:kubectl -n ceph-lcm-mirantis edit cephosdremoverequest remove-osd-<nodeName>-sdb
For example:
spec: approve: true
Review the following
statusfields of the Ceph LCM CR request processing:status.phase- current state of request processingstatus.messages- description of the current phasestatus.conditions- full history of request processing before the current phasestatus.removeInfo.issuesandstatus.removeInfo.warnings- error and warning messages occurred during request processing, if any
Verify that the
CephOsdRemoveRequesthas been completed. For example:status: phase: Completed # or CompletedWithWarnings if there are non-critical issues
Remove the device cleanup jobs:
kubectl delete jobs -n ceph-lcm-mirantis -l app=miraceph-cleanup-disks
There is no hot reconfiguration procedure for existing Ceph OSDs. To reconfigure an existing Ceph node, follow the steps below:
Remove a Ceph OSD from the Ceph cluster as described in Remove a Ceph OSD from a managed cluster.
Add the same Ceph OSD but with a modified configuration as described in Add a Ceph OSD on a managed cluster.
Add, remove, or reconfigure Ceph OSDs with metadata devices
Warning
This procedure is valid for MOSK clusters that use the MiraCeph custom
resource (CR), which is available since MOSK 25.2 to replace the deprecated
KaaSCephCluster. For the equivalent procedure with the KaaSCephCluster
CR, refer to the following section:
Mirantis Ceph Controller simplifies Ceph cluster management by automating LCM operations. This section describes how to add, remove, or reconfigure Ceph OSDs with a separate metadata device.
From the Ceph disks defined in the
BareMetalHostProfileobject that was configured using the Configure Ceph disks in a host profile procedure, select one disk for data and one logical volume for metadata of a Ceph OSD to be added to the Ceph cluster.Note
If you add a new disk after machine provisioning, manually prepare the required machine devices using Logical Volume Manager (LVM) 2 on the existing node because
BareMetalHostProfiledoes not support in-place changes.To add a Ceph OSD to an existing or hot-plugged raw device
If you want to add a Ceph OSD on top of a raw device that already exists on a node or is hot-plugged, add the required device using the following guidelines:
You can add a raw device to a node during node deployment.
If a node supports adding devices without node reboot, you can hot plug a raw device to a node.
If a node does not support adding devices without node reboot, you can hot plug a raw device during node shutdown. In this case, complete the following steps:
Enable maintenance mode on the managed cluster.
Turn off the required node.
Attach the required raw device to the node.
Turn on the required node.
Disable maintenance mode on the managed cluster.
Open the
MiraCephobject for editing:kubectl -n ceph-lcm-mirantis edit miraceph
In the
nodes.<nodeName>.devicessection, specify the parameters for a Ceph OSD as required. For the parameters description, see Node parameters.The example configuration of the
nodessection with the new node:nodes: - name: kaas-node-6c5e76f9-c2d2-4b1a-b047-3c299913a4bf roles: - mon - mgr devices: - config: # existing item deviceClass: hdd fullPath: /dev/disk/by-id/scsi-SATA_HGST_HUS724040AL_PN1334PEHN18ZS - config: # new item deviceClass: hdd metadataDevice: /dev/bluedb/meta_1 fullPath: /dev/disk/by-id/scsi-0ATA_HGST_HUS724040AL_PN1334PEHN1VBC
Warning
Mirantis highly recommends using the non-wwn
by-idsymlinks to specify storage devices in thedeviceslist.For details, see Addressing storage devices since MOSK 25.2.
Verify that the Ceph OSD is successfully deployed on the specified node:
kubectl -n ceph-lcm-mirantis get mchealth -o yaml
In the system response, the
fullClusterInfosection should not contain any issues.Example of a successful system response:
status: fullClusterInfo: daemonsStatus: ... osd: running: '4/4 running: 4 up, 4 in' status: Ok
Verify the Ceph OSD status:
kubectl -n rook-ceph get pod -l app=rook-ceph-osd -o wide | grep <nodeName>
Substitute
<nodeName>with the corresponding node name.Example of system response:
rook-ceph-osd-0-7b8d4d58db-f6czn 1/1 Running 0 42h 10.100.91.6 kaas-node-6c5e76f9-c2d2-4b1a-b047-3c299913a4bf <none> <none> rook-ceph-osd-1-78fbc47dc5-px9n2 1/1 Running 0 21h 10.100.91.6 kaas-node-6c5e76f9-c2d2-4b1a-b047-3c299913a4bf <none> <none> rook-ceph-osd-3-647f8d6c69-87gxt 1/1 Running 0 21h 10.100.91.6 kaas-node-6c5e76f9-c2d2-4b1a-b047-3c299913a4bf <none> <none>
Note
Ceph OSD removal implies the usage of the
CephOsdRemoveRequest custom resource (CR). For workflow overview,
spec and phases description, see High-level workflow of Ceph OSD or node removal.
Warning
When using the non-recommended Ceph pools replicated.size of
less than 3, Ceph OSD removal cannot be performed. The minimal replica
size equals a rounded up half of the specified replicated.size.
For example, if replicated.size is 2, the minimal replica size is
1, and if replicated.size is 3, then the minimal replica size
is 2. The replica size of 1 allows Ceph having PGs with only one
Ceph OSD in the acting state, which may cause a PG_TOO_DEGRADED
health warning that blocks Ceph OSD removal. Mirantis recommends setting
replicated.size to 3 for each Ceph pool.
Open the
MiraCephobject of the MOSK cluster for editing:kubectl -n ceph-lcm-mirantis get miraceph
Remove the required Ceph OSD specification from the
spec.nodes.<nodeName>.deviceslist:The example configuration of the
nodessection with the new node:nodes: - name: kaas-node-5bgk6 roles: - mon - mgr storageDevices: - config: deviceClass: hdd fullPath: /dev/disk/by-id/scsi-SATA_HGST_HUS724040AL_PN1334PEHN18ZS - config: # remove the entire item entry from devices list deviceClass: hdd metadataDevice: /dev/bluedb/meta_1 fullPath: /dev/disk/by-id/scsi-0ATA_HGST_HUS724040AL_PN1334PEHN1VBC
Create a YAML template for the
CephOsdRemoveRequestCR. For example:apiVersion: lcm.mirantis.com/v1alpha1 kind: CephOsdRemoveRequest metadata: name: remove-osd-<nodeName>-sdb namespace: ceph-lcm-mirantis spec: nodes: <nodeName>: cleanupByDevice: - name: sdb
Warning
Since MOSK 23.3, Mirantis does not recommend setting device
nameor deviceby-pathsymlink in thecleanupByDevicefield as these identifiers are not persistent and can change at node boot. Remove Ceph OSDs withby-idsymlinks specified in thepathfield or usecleanupByOsdIdinstead. For details, see Addressing storage devices since MOSK 25.2.Note
If a device was physically removed from a node,
cleanupByDeviceis not supported . Therefore, usecleanupByOsdIdinstead. For details, see Remove a failed Ceph OSD by Ceph OSD ID.If the
devicesitem was specified with aby-pathdevice path, specify thepathparameter in thecleanupByDevicesection instead ofname.
Apply the template on the MOSK cluster:
kubectl apply -f remove-osd-<machineName>-sdb.yaml
Verify that the corresponding request has been created:
kubectl -n ceph-lcm-mirantis get cephosdremoverequest remove-osd-<nodeName>-sdb
Verify that the
removeInfosection appeared in theCephOsdRemoveRequestCRstatus:kubectl -n ceph-lcm-mirantis get cephosdremoverequest remove-osd-<nodeName>-sdb -o yaml
Example of system response:
status: removeInfo: cleanUpMap: kaas-node-d4aac64d-1721-446c-b7df-e351c3025591: osdMapping: "10": deviceMapping: sdb: path: "/dev/disk/by-path/pci-0000:00:1t.9" partition: "/dev/ceph-b-vg_sdb/osd-block-b-lv_sdb" type: "block" class: "hdd" zapDisk: true "5": deviceMapping: /dev/sdc: deviceClass: hdd devicePath: /dev/disk/by-path/pci-0000:00:0f.0 devicePurpose: block usedPartition: /dev/ceph-2d11bf90-e5be-4655-820c-fb4bdf7dda63/osd-block-e41ce9a8-4925-4d52-aae4-e45167cfcf5c zapDisk: true /dev/sdf: deviceClass: hdd devicePath: /dev/disk/by-path/pci-0000:00:12.0 devicePurpose: db usedPartition: /dev/bluedb/meta_1
Verify that the
cleanUpMapsection matches the required removal and wait for theApproveWaitingphase to appear instatus:kubectl -n ceph-lcm-mirantis get cephosdremoverequest remove-osd-<nodeName>-sdb -o yaml
Example of system response:
status: phase: ApproveWaiting
In the
CephOsdRemoveRequestCR, set theapproveflag totrue:kubectl -n ceph-lcm-mirantis edit cephosdremoverequest remove-osd-<nodeName>-sdb
Configuration snippet:
spec: approve: true
Review the following
statusfields of the Ceph LCM CR request processing:status.phase- current state of request processingstatus.messages- description of the current phasestatus.conditions- full history of request processing before the current phasestatus.removeInfo.issuesandstatus.removeInfo.warnings- error and warning messages occurred during request processing, if any
Verify that the
CephOsdRemoveRequesthas been completed.Example of the positive
status.phasefield:status: phase: Completed # or CompletedWithWarnings if there are non-critical issues
Remove the device cleanup jobs:
kubectl delete jobs -n ceph-lcm-mirantis -l app=miraceph-cleanup-disks
There is no hot reconfiguration procedure for existing Ceph OSDs. To reconfigure an existing Ceph node, remove and re-add a Ceph OSD with a metadata device using the following options:
If metadata device partitions are specified in the BareMetalHostProfile
object as described in Configure Ceph disks in a host profile, the metadata device definition is
an LVM path in metadataDevice of the MiraCeph object.
Therefore, automated LCM will clean up the logical volume without removal and it can be reused. For this reason, to reconfigure a partition of a Ceph OSD metadata device:
Remove a Ceph OSD from the Ceph cluster as described in Remove a Ceph OSD with a metadata device.
Add the same Ceph OSD but with a modified configuration as described in Add a Ceph OSD with a metadata device.
Replace a failed Ceph OSD
Warning
This procedure is valid for MOSK clusters that use the MiraCeph custom
resource (CR), which is available since MOSK 25.2 to replace the deprecated
KaaSCephCluster. For the equivalent procedure with the KaaSCephCluster
CR, refer to the following section:
After a physical disk replacement, you can use Ceph LCM API to redeploy a failed Ceph OSD. The common flow of replacing a failed Ceph OSD is as follows:
Remove the obsolete Ceph OSD from the Ceph cluster by device name, by Ceph OSD ID, or by path.
Add a new Ceph OSD on the new disk to the Ceph cluster.
Note
Ceph OSD replacement presupposes usage of a CephOsdRemoveRequest
CR. For workflow overview, spec and phases description, see
High-level workflow of Ceph OSD or node removal.
Warning
The procedure below presuppose that the operator knows the exact
device name, by-path, or by-id of the replaced device, as well as on
which node the replacement occurred.
Warning
A Ceph OSD removal using by-path, by-id, or device name is
not supported if a device was physically removed from a node. Therefore, use
cleanupByOsdId instead. For details, see
Remove a failed Ceph OSD by Ceph OSD ID.
Warning
Since MOSK 23.3, Mirantis does not recommend setting device
name or device by-path symlink in the cleanupByDevice field
as these identifiers are not persistent and can change at node boot. Remove
Ceph OSDs with by-id symlinks specified in the path field or use
cleanupByOsdId instead. For details, see Addressing storage devices since MOSK 25.2.
Open the
MiraCephCR of a MOSK cluster for editing:kubectl -n ceph-lcm-mirantis edit miraceph
In the
nodessection, remove the required device fromdevices. When using device filters, update thedeviceFilterordevicePathFilterregexp accordingly.For example:
spec: nodes: - name: <nodeName> devices: - name: <deviceName> # remove the entire item from devices list # fullPath: <deviceByPath> if device is specified with symlink instead of name config: deviceClass: hdd
Substitute
<nodeName>with the node name where the device<deviceName>or<deviceByPath>is going to be replaced.Save
MiraCephand close the editor.Create a
CephOsdRemoveRequestCR template and save it asreplace-failed-osd-<nodeName>-<deviceName>-request.yaml:apiVersion: lcm.mirantis.com/v1alpha1 kind: CephOsdRemoveRequest metadata: name: replace-failed-osd-<nodeName>-<deviceName> namespace: ceph-lcm-mirantis spec: nodes: <nodeName>: cleanupByDevice: - name: <deviceName> # If a device is specified with by-path or by-id instead of # name, path: <deviceByPath> or <deviceById>.
Apply the template to the cluster:
kubectl apply -f replace-failed-osd-<nodeName>-<deviceName>-request.yaml
Verify that the corresponding request has been created:
kubectl -n ceph-lcm-mirantis get cephosdremoverequest
Verify that the
removeInfosection appeared in theCephOsdRemoveRequestCRstatus:kubectl -n ceph-lcm-mirantis get cephosdremoverequest replace-failed-osd-<nodeName>-<deviceName> -o yaml
Example of system response:
status: osdRemoveStatus: removeInfo: cleanUpMap: <nodeName>: osdMapping: <osdId>: deviceMapping: <dataDevice>: deviceClass: hdd devicePath: <dataDeviceByPath> devicePurpose: block usedPartition: /dev/ceph-d2d3a759-2c22-4304-b890-a2d87e056bd4/osd-block-ef516477-d2da-492f-8169-a3ebfc3417e2 zapDisk: true
Definition of values in angle brackets:
<machineName>- name of the machine on which the device is being replaced, for example,worker-1<nodeName>- underlying node name of the machine, for example,kaas-node-5a74b669-7e53-4535-aabd-5b509ec844af<osdId>- Ceph OSD ID for the device being replaced, for example,1<dataDeviceByPath>-by-pathof the device placed on the node, for example,/dev/disk/by-path/pci-0000:00:1t.9<dataDevice>- name of the device placed on the node, for example,/dev/sdb
Verify that the
cleanUpMapsection matches the required removal and wait for theApproveWaitingphase to appear instatus:kubectl -n ceph-lcm-mirantis get cephosdremoverequest replace-failed-osd-<nodeName>-<deviceName> -o yaml
Example of system response:
status: phase: ApproveWaiting
Edit the
CephOsdRemoveRequestCR and set theapproveflag totrue:kubectl -n ceph-lcm-mirantis edit cephosdremoverequest replace-failed-osd-<nodeName>-<deviceName>
For example:
spec: approve: true
Review the following
statusfields of the Ceph LCM CR request processing:status.phase- current state of request processingstatus.messages- description of the current phasestatus.conditions- full history of request processing before the current phasestatus.removeInfo.issuesandstatus.removeInfo.warnings- error and warning messages occurred during request processing, if any
Verify that the
CephOsdRemoveRequesthas been completed. For example:status: phase: Completed # or CompletedWithWarnings if there are non-critical issues
Remove the device cleanup jobs:
kubectl delete jobs -n ceph-lcm-mirantis -l app=miraceph-cleanup-disks
Caution
The procedure below presupposes that the operator knows only the failed Ceph OSD ID.
Identify the node and device names used by the affected Ceph OSD. Using the Ceph CLI in the
rook-ceph-toolsPod, run:kubectl -n rook-ceph exec -it deploy/rook-ceph-tools -- ceph osd metadata <osdId>
Substitute
<osdId>with the affected OSD ID.Example output:
{ "id": 1, ... "bluefs_db_devices": "vdc", ... "bluestore_bdev_devices": "vde", ... "devices": "vdc,vde", ... "hostname": "kaas-node-6c5e76f9-c2d2-4b1a-b047-3c299913a4bf", ... },
In the example above,
hostnameis the node name anddevicesare all devices used by the affected Ceph OSD.Open the
MiraCephCR on a MOSK cluster for editing:kubectl -n ceph-lcm-mirantis edit miraceph
In the
nodessection, remove the required device:spec: nodes: - name: <nodeName> devices: - name: <deviceName> # remove the entire item from devices list config: deviceClass: hdd
Substitute
<nodeName>with the node name where the device<deviceName>is going to be replaced.Save
MiraCephand close the editor.Create a
CephOsdRemoveRequestCR template and save it asreplace-failed-<nodeName>-osd-<osdId>-request.yaml:apiVersion: lcm.mirantis.com/v1alpha1 kind: CephOsdRemoveRequest metadata: name: replace-failed-<nodeName>-osd-<osdId> namespace: ceph-lcm-mirantis spec: nodes: <nodeName>: cleanupByOsdId: - <osdId>
Apply the template to the cluster:
kubectl apply -f replace-failed-<nodeName>-osd-<osdId>-request.yaml
Verify that the corresponding request has been created:
kubectl -n ceph-lcm-mirantis get cephosdremoverequest
Verify that the
removeInfosection appeared in theCephOsdRemoveRequestCRstatus:kubectl -n ceph-lcm-mirantis get cephosdremoverequest replace-failed-<nodeName>-osd-<osdId>-request -o yaml
Example of system response
status: osdRemoveStatus: removeInfo: cleanUpMap: <nodeName>: osdMapping: <osdId>: deviceMapping: <dataDevice>: deviceClass: hdd devicePath: <dataDeviceByPath> devicePurpose: block usedPartition: /dev/ceph-d2d3a759-2c22-4304-b890-a2d87e056bd4/osd-block-ef516477-d2da-492f-8169-a3ebfc3417e2 zapDisk: true
Definition of values in angle brackets:
<machineName>- name of the machine on which the device is being replaced, for example,worker-1<nodeName>- underlying node name of the machine, for example,kaas-node-5a74b669-7e53-4535-aabd-5b509ec844af<osdId>- Ceph OSD ID for the device being replaced, for example,1<dataDeviceByPath>-by-pathof the device placed on the node, for example,/dev/disk/by-path/pci-0000:00:1t.9<dataDevice>- name of the device placed on the node, for example,/dev/sdb
Verify that the
cleanUpMapsection matches the required removal and wait for theApproveWaitingphase to appear instatus:kubectl -n ceph-lcm-mirantis get cephosdremoverequest replace-failed-<nodeName>-osd-<osdId>-request -o yaml
Example of system response:
status: phase: ApproveWaiting
Edit the
CephOsdRemoveRequestCR and set theapproveflag totrue:kubectl -n ceph-lcm-mirantis edit cephosdremoverequest replace-failed-<nodeName>-osd-<osdId>-request
For example:
spec: approve: true
Review the following
statusfields of the Ceph LCM CR request processing:status.phase- current state of request processingstatus.messages- description of the current phasestatus.conditions- full history of request processing before the current phasestatus.removeInfo.issuesandstatus.removeInfo.warnings- error and warning messages occurred during request processing, if any
Verify that the
CephOsdRemoveRequesthas been completed. For example:status: phase: Completed # or CompletedWithWarnings if there are non-critical issues
Remove the device cleanup jobs:
kubectl delete jobs -n ceph-lcm-mirantis -l app=miraceph-cleanup-disks
Note
You can spawn Ceph OSD on a raw device, but it must be clean and without any data or partitions. If you want to add a device that was in use, also ensure it is raw and clean. To clean up all data and partitions from a device, refer to official Rook documentation.
If you want to add a Ceph OSD on top of a raw device that already exists on a node or is hot-plugged, add the required device using the following guidelines:
You can add a raw device to a node during node deployment.
If a node supports adding devices without node reboot, you can hot plug a raw device to a node.
If a node does not support adding devices without node reboot, you can hot plug a raw device during node shutdown. In this case, complete the following steps:
Enable maintenance mode on the managed cluster.
Turn off the required node.
Attach the required raw device to the node.
Turn on the required node.
Disable maintenance mode on the managed cluster.
Open the
MiraCephCR on a MOSK cluster for editing:kubectl -n ceph-lcm-mirantis edit miraceph
In the
nodessection, add a new device:spec: nodes: - name: <nodeName> devices: - fullPath: <deviceByID> # Recommended. Non-wwn by-id symlink. # name: <deviceByID> # Not recommended. If a device is supposed to be added with by-id. # fullPath: <deviceByPath> # Not recommended. If a device is supposed to be added with by-path. config: deviceClass: hdd
Substitute
<nodeName>with the node name where device<deviceName>or<deviceByPath>is going to be added as a Ceph OSD.Verify that the new Ceph OSD has appeared in the Ceph cluster and is
inandup. ThefullClusterInfosection should not contain any issues.kubectl -n ceph-lcm-mirantis get mchealth -o yaml
For example:
status: fullClusterInfo: daemonStatus: osd: running: '3/3 running: 3 up, 3 in' status: Ok
Replace a failed Ceph OSD with a metadata device
Warning
This procedure is valid for MOSK clusters that use the MiraCeph custom
resource (CR), which is available since MOSK 25.2 to replace the deprecated
KaaSCephCluster. For the equivalent procedure with the KaaSCephCluster
CR, refer to the following section:
The document describes various scenarios of a Ceph OSD outage and recovery or replacement. More specifically, this section describes how to replace a failed Ceph OSD with a metadata device:
If the metadata device is specified as a logical volume in the
BareMetalHostProfileobject and defined in theMiraCephobject as a logical volume pathIf the metadata device is specified in the
MiraCephobject as a device name
Note
Ceph OSD replacement implies the usage of the
CephOsdRemoveRequest custom resource (CR). For workflow overview,
spec and phases description, see High-level workflow of Ceph OSD or node removal.
Warning
This procedure is valid for MOSK clusters that use the MiraCeph custom
resource (CR), which is available since MOSK 25.2 to replace the deprecated
KaaSCephCluster. For the equivalent procedure with the KaaSCephCluster
CR, refer to the following section:
Replace a failed Ceph OSD with a metadata device as a logical volume path
You can apply the below procedure in the following cases:
A Ceph OSD failed without data or metadata device outage. In this case, first remove a failed Ceph OSD and clean up all corresponding disks and partitions. Then add a new Ceph OSD to the same data and metadata paths.
A Ceph OSD failed with data or metadata device outage. In this case, you also first remove a failed Ceph OSD and clean up all corresponding disks and partitions. Then add a new Ceph OSD to a newly replaced data device with the same metadata path.
Note
The below procedure also applies to manually created metadata partitions.
Identify the ID of Ceph OSD related to a failed device. For example, use the Ceph CLI in the
rook-ceph-toolsPod:ceph osd metadata
Example of system response:
{ "id": 0, ... "bluestore_bdev_devices": "vdc", ... "devices": "vdc", ... "hostname": "kaas-node-6c5e76f9-c2d2-4b1a-b047-3c299913a4bf", ... "pod_name": "rook-ceph-osd-0-7b8d4d58db-f6czn", ... }, { "id": 1, ... "bluefs_db_devices": "vdf", ... "bluestore_bdev_devices": "vde", ... "devices": "vde,vdf", ... "hostname": "kaas-node-6c5e76f9-c2d2-4b1a-b047-3c299913a4bf", ... "pod_name": "rook-ceph-osd-1-78fbc47dc5-px9n2", ... }, ...
Open the
MiraCephcustom resource (CR) for editing:kubectl -n ceph-lcm-mirantis edit miraceph
In the
nodessection:Find and capture the
metadataDevicepath to reuse it during re-creation of the Ceph OSD.Remove the required device:
Example configuration snippet:
spec: nodes: - name: <nodeName> devices: - name: <deviceName> # remove the entire item from the devices list # fullPath: <deviceByPath> if device is specified using by-path instead of name config: deviceClass: hdd metadataDevice: /dev/bluedb/meta_1
In the example above,
<nodeName>is the name of node on which the device<deviceName>or<deviceByPath>must be replaced.Create a
CephOsdRemoveRequestCR template and save it asreplace-failed-osd-<nodeName>-<osdID>-request.yaml:apiVersion: lcm.mirantis.com/v1alpha1 kind: CephOsdRemoveRequest metadata: name: replace-failed-osd-<nodeName>-<deviceName> namespace: ceph-lcm-mirantis spec: nodes: <nodeName>: cleanupByOsdId: - <osdID>
Substitute the following parameters:
<nodeName>and<deviceName>with the node and device names from the previous step<osdID>with the ID of the affected Ceph OSD
Apply the template to the cluster:
kubectl apply -f replace-failed-osd-<nodeName>-<osdID>-request.yaml
Verify that the corresponding request has been created:
kubectl -n ceph-lcm-mirantis get cephosdremoverequest
Verify that the
statussection ofCephOsdRemoveRequestcontains theremoveInfosection:kubectl -n ceph-lcm-mirantis get cephosdremoverequest replace-failed-osd-<nodeName>-<osdID> -o yaml
Example of system response:
removeInfo: cleanUpMap: <nodeName>: osdMapping: "<osdID>": deviceMapping: <dataDevice>: deviceClass: hdd devicePath: <dataDeviceByPath> devicePurpose: block usedPartition: /dev/ceph-d2d3a759-2c22-4304-b890-a2d87e056bd4/osd-block-ef516477-d2da-492f-8169-a3ebfc3417e2 zapDisk: true <metadataDevice>: deviceClass: hdd devicePath: <metadataDeviceByPath> devicePurpose: db usedPartition: /dev/bluedb/meta_1 uuid: ef516477-d2da-492f-8169-a3ebfc3417e2
Definition of values in angle brackets:
<machineName>- name of the machine on which the device is being replaced, for example,worker-1<nodeName>- underlying node name of the machine, for example,kaas-node-5a74b669-7e53-4535-aabd-5b509ec844af<osdId>- Ceph OSD ID for the device being replaced, for example,1<dataDeviceByPath>-by-pathof the device placed on the node, for example,/dev/disk/by-path/pci-0000:00:1t.9<dataDevice>- name of the device placed on the node, for example,/dev/vde<metadataDevice>- metadata name of the device placed on the node, for example,/dev/vdf<metadataDeviceByPath>- metadataby-pathof the device placed on the node, for example,/dev/disk/by-path/pci-0000:00:12.0
Note
The partitions that are manually created or configured using the
BareMetalHostProfileobject can be removed only manually, or during a complete metadata disk removal, or during theMachineobject removal or re-provisioning.Verify that the
cleanUpMapsection matches the required removal and wait for theApproveWaitingphase to appear instatus:kubectl -n ceph-lcm-mirantis get cephosdremoverequest replace-failed-osd-<nodeName>-<osdID> -o yaml
Example of system response:
status: phase: ApproveWaiting
In the
CephOsdRemoveRequestCR, set theapproveflag totrue:kubectl -n ceph-lcm-mirantis edit cephosdremoverequest replace-failed-osd-<nodeName>-<osdID>
Configuration snippet:
spec: approve: true
Review the following
statusfields of the Ceph LCM CR request processing:status.phase- current state of request processingstatus.messages- description of the current phasestatus.conditions- full history of request processing before the current phasestatus.removeInfo.issuesandstatus.removeInfo.warnings- error and warning messages occurred during request processing, if any
Verify that the
CephOsdRemoveRequesthas been completed. For example:status: phase: Completed # or CompletedWithWarnings if there are non-critical issues
Note
You can spawn Ceph OSD on a raw device, but it must be clean and without any data or partitions. If you want to add a device that was in use, also ensure it is raw and clean. To clean up all data and partitions from a device, refer to official Rook documentation.
If you want to add a Ceph OSD on top of a raw device that already exists on a node or is hot-plugged, add the required device using the following guidelines:
You can add a raw device to a node during node deployment.
If a node supports adding devices without node reboot, you can hot plug a raw device to a node.
If a node does not support adding devices without node reboot, you can hot plug a raw device during node shutdown. In this case, complete the following steps:
Enable maintenance mode on the managed cluster.
Turn off the required node.
Attach the required raw device to the node.
Turn on the required node.
Disable maintenance mode on the managed cluster.
Open the
MiraCephCR for editing:kubectl -n ceph-lcm-mirantis edit miraceph
In the
nodessection, add the replaced device with the samemetadataDevicepath as on the removed Ceph OSD. For example:spec: nodes: - name: <nodeName> devices: - fullPath: <deviceByID> # Recommended. Add a new device by-id symlink, for example, /dev/disk/by-id/... #name: <deviceByID> # Not recommended. Add a new device by ID, for example, /dev/disk/by-id/... #fullPath: <deviceByPath> # Not recommended. Add a new device by path, for example, /dev/disk/by-path/... config: deviceClass: hdd metadataDevice: /dev/bluedb/meta_1 # Must match the value of the previously removed OSD
Substitute
<nodeName>with the node name where the new device<deviceByID>or<deviceByPath>must be added.Wait for the replaced disk to apply to the Ceph cluster as a new Ceph OSD.
You can monitor the application state using either the
statussection of theMiraCephCR or in therook-ceph-toolsPod:kubectl -n rook-ceph exec -it deploy/rook-ceph-tools -- ceph -s
Warning
This procedure is valid for MOSK clusters that use the MiraCeph custom
resource (CR), which is available since MOSK 25.2 to replace the deprecated
KaaSCephCluster. For the equivalent procedure with the KaaSCephCluster
CR, refer to the following section:
Replace a failed Ceph OSD disk with a metadata device as a device name
You can apply the below procedure if a Ceph OSD failed with data disk outage
and the metadata partition is not specified in the BareMetalHostProfile
custom resource (CR). This scenario implies that the Ceph cluster
automatically creates a required metadata logical volume on a desired device.
To remove the affected Ceph OSD with a metadata device as a device name, follow the Remove a failed Ceph OSD by ID with a defined metadata device procedure and capture the following details:
While editing
MiraCephin thenodessection, capture themetadataDevicepath to reuse it during re-creation of the Ceph OSD.Example of the
spec.nodessection:spec: nodes: - name: <nodeName> devices: - name: <deviceName> # remove the entire item from the devices list # fullPath: <deviceByPath> if device is specified using by-path instead of name config: deviceClass: hdd metadataDevice: /dev/nvme0n1
In the example above, save the
metadataDevicedevice name/dev/nvme0n1.During verification of
removeInfo, capture theusedPartitionvalue of the metadata device located in thedeviceMapping.<metadataDevice>section.Example of the
removeInfosection:removeInfo: cleanUpMap: <nodeName>: osdMapping: "<osdID>": deviceMapping: <dataDevice>: deviceClass: hdd devicePath: <dataDeviceByPath> devicePurpose: block usedPartition: /dev/ceph-d2d3a759-2c22-4304-b890-a2d87e056bd4/osd-block-ef516477-d2da-492f-8169-a3ebfc3417e2 zapDisk: true <metadataDevice>: deviceClass: hdd devicePath: <metadataDeviceByPath> devicePurpose: db usedPartition: /dev/ceph-b0c70c72-8570-4c9d-93e9-51c3ab4dd9f9/osd-db-ecf64b20-1e07-42ac-a8ee-32ba3c0b7e2f uuid: ef516477-d2da-492f-8169-a3ebfc3417e2
In the example above, capture the following values from the
<metadataDevice>section:ceph-b0c70c72-8570-4c9d-93e9-51c3ab4dd9f9- name of the volume group that contains all metadata partitions on the<metadataDevice>diskosd-db-ecf64b20-1e07-42ac-a8ee-32ba3c0b7e2f- name of the logical volume that relates to a failed Ceph OSD
After you remove the Ceph OSD disk, manually create a separate logical volume for the metadata partition in an existing volume group on the metadata device:
lvcreate -l 100%FREE -n meta_1 <vgName>
Subtitute <vgName> with the name of a volume group captured in the
usedPartiton parameter.
Note
If you removed more than one OSD, replace 100%FREE with the
corresponding partition size. For example:
lvcreate -l <partitionSize> -n meta_1 <vgName>
Substitute <partitionSize> with the corresponding value that matches the
size of other partitions placed on the affected metadata drive. To obtain
<partitionSize>, use the output of the lvs command. For example:
16G.
During execution of the lvcreate command, the system asks you to wipe the found bluestore label on a metadata device. For example:
WARNING: ceph_bluestore signature detected on /dev/ceph-b0c70c72-8570-4c9d-93e9-51c3ab4dd9f9/meta_1 at offset 0. Wipe it? [y/n]:
Using the interactive shell, answer n to keep all metadata partitions
alive. After answering n, the system outputs the following:
Aborted wiping of ceph_bluestore.
1 existing signature left on the device.
Logical volume "meta_1" created.
Note
You can spawn Ceph OSD on a raw device, but it must be clean and without any data or partitions. If you want to add a device that was in use, also ensure it is raw and clean. To clean up all data and partitions from a device, refer to official Rook documentation.
If you want to add a Ceph OSD on top of a raw device that already exists on a node or is hot-plugged, add the required device using the following guidelines:
You can add a raw device to a node during node deployment.
If a node supports adding devices without node reboot, you can hot plug a raw device to a node.
If a node does not support adding devices without node reboot, you can hot plug a raw device during node shutdown. In this case, complete the following steps:
Enable maintenance mode on the managed cluster.
Turn off the required node.
Attach the required raw device to the node.
Turn on the required node.
Disable maintenance mode on the managed cluster.
Open the
MiraCephCR for editing:kubectl -n ceph-lcm-mirantis edit miraceph
In the
nodessection, add the replaced device with the samemetadataDevicepath as in the previous Ceph OSD:spec: nodes: - name: <nodeName> devices: - fullPath: <deviceByID> # Recommended. Add a new device by-id symlink, for example, /dev/disk/by-id/... #name: <deviceByID> # Not recommended. Add a new device by ID, for example, /dev/disk/by-id/... #fullPath: <deviceByPath> # Not recommended. Add a new device by path, for example, /dev/disk/by-path/... config: deviceClass: hdd metadataDevice: /dev/<vgName>/meta_1
Substitute
<nodeName>with the node name where the new device<deviceByID>or<deviceByPath>must be added. Also specifymetadataDevicewith the path to the logical volume created during the Re-create the metadata partition on the existing metadata disk procedure.Wait for the replaced disk to apply to the Ceph cluster as a new Ceph OSD.
You can monitor the application state using either the
statussection of theMiraCephCR or in therook-ceph-toolsPod:kubectl -n rook-ceph exec -it deploy/rook-ceph-tools -- ceph -s
Replace a failed metadata device
Warning
This procedure is valid for MOSK clusters that use the MiraCeph custom
resource (CR), which is available since MOSK 25.2 to replace the deprecated
KaaSCephCluster. For the equivalent procedure with the KaaSCephCluster
CR, refer to the following section:
This section describes the scenario when an underlying metadata device fails with all related Ceph OSDs. In this case, the only solution is to remove all Ceph OSDs related to the failed metadata device, then attach a device that will be used as a new metadata device, and re-create all affected Ceph OSDs.
Caution
If you used BareMetalHostProfile to automatically partition
the failed device, you must create a manual partition of the new device
because BareMetalHostProfile does not support hot-load changes and
creates an automatic device partition only during node provisioning.
Save the
MiraCephspecification of all Ceph OSDs affected by the failed metadata device to re-use this specification during re-creation of Ceph OSDs after disk replacement.Identify Ceph OSD IDs related to the failed metadata device, for example, using Ceph CLI in the
rook-ceph-toolsPod:ceph osd metadata
Example of system response:
{ "id": 11, ... "bluefs_db_devices": "vdc", ... "bluestore_bdev_devices": "vde", ... "devices": "vdc,vde", ... "hostname": "kaas-node-6c5e76f9-c2d2-4b1a-b047-3c299913a4bf", ... }, { "id": 12, ... "bluefs_db_devices": "vdd", ... "bluestore_bdev_devices": "vde", ... "devices": "vdd,vde", ... "hostname": "kaas-node-6c5e76f9-c2d2-4b1a-b047-3c299913a4bf", ... }, { "id": 13, ... "bluefs_db_devices": "vdf", ... "bluestore_bdev_devices": "vde", ... "devices": "vde,vdf", ... "hostname": "kaas-node-6c5e76f9-c2d2-4b1a-b047-3c299913a4bf", ... }, ...
Open the
MiraCephcustom resource (CR) for editing:kubectl -n ceph-lcm-mirantis edit miraceph
In the
nodessection, remove alldevicesitems that relate to the failed metadata device.When using a metadata device with device filters, remove the whole node section, including the node
name: <nodeName>field, and perform a complete node cleanup as described in Remove a Ceph node from a MOSK cluster.For example:
spec: nodes: - name: <nodeName> devices: - name: <deviceName1> # remove the entire item from the devices list # fullPath: <deviceByPath> if device is specified using symlink instead of name config: deviceClass: hdd metadataDevice: <metadataDevice> - name: <deviceName2> # remove the entire item from the devices list config: deviceClass: hdd metadataDevice: <metadataDevice> - name: <deviceName3> # remove the entire item from the devices list config: deviceClass: hdd metadataDevice: <metadataDevice> ...
In the example above,
<nodeName>is the the node name where the metadata device<metadataDevice>must be replaced.Create a
CephOsdRemoveRequestCR template and save it asreplace-failed-meta-<nodeName>-<metadataDevice>-request.yaml:apiVersion: lcm.mirantis.com/v1alpha1 kind: CephOsdRemoveRequest metadata: name: replace-failed-meta-<nodeName>-<metadataDevice> namespace: ceph-lcm-mirantis spec: nodes: <nodeName>: cleanupByOsdId: - <osdID-1> - <osdID-2> ...
Substitute the following parameters:
<nodeName>and<metadataDevice>with the node and device names from the previous step<osdID-*>with IDs of the affected Ceph OSDs
Apply the template to the cluster:
kubectl apply -f replace-failed-meta-<nodeName>-<metadataDevice>-request.yaml
Verify that the corresponding request has been created:
kubectl -n ceph-lcm-mirantis get cephosdremoverequest
Verify that the
removeInfosection is present in theCephOsdRemoveRequestCRstatusand that thecleanUpMapsection matches the required removal:kubectl -n ceph-lcm-mirantis get cephosdremoverequest replace-failed-meta-<nodeName>-<metadataDevice> -o yaml
Example of system response:
removeInfo: cleanUpMap: <nodeName>: osdMapping: "<osdID-1>": deviceMapping: <dataDevice-1>: deviceClass: hdd devicePath: <dataDeviceByPath-1> devicePurpose: block usedPartition: <dataLvPartition-1> zapDisk: true <metadataDevice>: deviceClass: hdd devicePath: <metadataDeviceByPath> devicePurpose: db usedPartition: /dev/ceph-b0c70c72-8570-4c9d-93e9-51c3ab4dd9f9/osd-db-ecf64b20-1e07-42ac-a8ee-32ba3c0b7e2f uuid: ef516477-d2da-492f-8169-a3ebfc3417e2 "<osdID-2>": deviceMapping: <dataDevice-2>: deviceClass: hdd devicePath: <dataDeviceByPath-2> devicePurpose: block usedPartition: <dataLvPartition-2> zapDisk: true <metadataDevice>: deviceClass: hdd devicePath: <metadataDeviceByPath> devicePurpose: db usedPartition: /dev/ceph-b0c70c72-8570-4c9d-93e9-51c3ab4dd9f9/osd-db-ecf64b20-1e07-42ac-a8ee-32ba3c0b7e2f uuid: ef516477-d2da-492f-8169-a3ebfc3417e2 ...
Definition of values in angle brackets:
<machineName>- name of the machine on which the device is being replaced, for example,worker-1<nodeName>- underlying node name of the machine, for example,kaas-node-5a74b669-7e53-4535-aabd-5b509ec844af<osdId>- Ceph OSD ID for the device being replaced, for example,1<dataDeviceByPath>-by-pathof the device placed on the node, for example,/dev/disk/by-path/pci-0000:00:1t.9<dataDevice>- name of the device placed on the node, for example,/dev/vdc<metadataDevice>- metadata name of the device placed on the node, for example,/dev/vde<metadataDeviceByPath>- metadataby-pathof the device placed on the node, for example,/dev/disk/by-path/pci-0000:00:12.0<dataLvPartition>- logical volume partition of the data device
Wait for the
ApproveWaitingphase to appear instatus:kubectl -n ceph-lcm-mirantis get cephosdremoverequest replace-failed-meta-<nodeName>-<metadataDevice> -o yaml
Example of system response:
status: phase: ApproveWaiting
In the
CephOsdRemoveRequestCR, set theapproveflag totrue:kubectl -n ceph-lcm-mirantis edit cephosdremoverequest replace-failed-meta-<nodeName>-<metadataDevice>
Configuration snippet:
spec: approve: true
Review the following
statusfields of the Ceph LCM CR request processing:status.phase- current state of request processingstatus.messages- description of the current phasestatus.conditions- full history of request processing before the current phasestatus.removeInfo.issuesandstatus.removeInfo.warnings- error and warning messages occurred during request processing, if any
Verify that the
CephOsdRemoveRequesthas been completed. For example:status: phase: Completed # or CompletedWithWarnings if there are non-critical issues
Note
This section describes how to create a metadata disk partition on N logical volumes. To create one partition on a metadata disk, refer to Reconfigure a partition of a Ceph OSD metadata device.
Partition the replaced metadata device by N logical volumes (LVs), where N is the number of Ceph OSDs previously located on a failed metadata device.
Calculate the new metadata LV percentage of used volume group capacity using the
100 / Nformula.Log in to the node with the replaced metadata disk.
Create an LVM physical volume atop the replaced metadata device:
pvcreate <metadataDisk>Substitute
<metadataDisk>with the replaced metadata device.Create an LVM volume group atop of the physical volume:
vgcreate bluedb <metadataDisk>
Substitute
<metadataDisk>with the replaced metadata device.Create N LVM logical volumes with the calculated capacity per each volume:
lvcreate -l <X>%VG -n meta_<i> bluedb
Substitute
<X>with the result of the100 / Nformula and<i>with the current number of metadata partitions.
As a result, the replaced metadata device will have N LVM paths, for example,
/dev/bluedb/meta_1.
Note
You can spawn Ceph OSD on a raw device, but it must be clean and without any data or partitions. If you want to add a device that was in use, also ensure it is raw and clean. To clean up all data and partitions from a device, refer to official Rook documentation.
Open the
MiraCephCR for editing:kubectl -n ceph-lcm-mirantis edit miraceph
In the
nodessection, add the cleaned Ceph OSD device with the replaced LVM paths of the metadata device from previous steps. For example:spec: nodes: - name: <nodeName> devices: - fullPath: <deviceByID-1> # Recommended. Add the new device by ID /dev/disk/by-id/... #name: <deviceByID-1> # Not recommended. Add a new device by ID, for example, /dev/disk/by-id/... #fullPath: <deviceByPath-1> # Not recommended. Add a new device by path /dev/disk/by-path/... config: deviceClass: hdd metadataDevice: /dev/<vgName>/<lvName-1> - fullPath: <deviceByID-2> # Recommended. Add the new device by ID /dev/disk/by-id/... #name: <deviceByID-2> # Not recommended. Add a new device by ID, for example, /dev/disk/by-id/... #fullPath: <deviceByPath-2> # Not recommended. Add a new device by path /dev/disk/by-path/... config: deviceClass: hdd metadataDevice: /dev/<vgName>/<lvName-2> - fullPath: <deviceByID-3> # Recommended. Add the new device by ID /dev/disk/by-id/... #name: <deviceByID-3> # Not recommended. Add a new device by ID, for example, /dev/disk/by-id/... #fullPath: <deviceByPath-3> # Not recommended. Add a new device by path /dev/disk/by-path/... config: deviceClass: hdd metadataDevice: /dev/<vgName>/<lvName-3>
Substitute
<nodeName>with the node name where the metadata device has been replaced.Add all data devices for re-created Ceph OSDs and specify
metadataDevicethat is the path to the previously created logical volume. Substitute<vgName>with a volume group name that contains N logical volumes<lvName-i>.
Wait for the re-created Ceph OSDs to apply to the Ceph cluster.
You can monitor the application state using either the
statussection of theMiraCephCR or in therook-ceph-toolsPod:kubectl -n rook-ceph exec -it deploy/rook-ceph-tools -- ceph -s
Replace a failed Ceph node
Warning
This procedure is valid for MOSK clusters that use the MiraCeph custom
resource (CR), which is available since MOSK 25.2 to replace the deprecated
KaaSCephCluster. For the equivalent procedure with the KaaSCephCluster
CR, refer to the following section:
After a physical node replacement, you can use the Ceph LCM API to redeploy failed Ceph nodes. The common flow of replacing a failed Ceph node is as follows:
Remove the obsolete Ceph node from the Ceph cluster.
Add a new Ceph node with the same configuration to the Ceph cluster.
Note
Ceph OSD node replacement presupposes usage of a
CephOsdRemoveRequest CR. For workflow overview, spec and phases
description, see High-level workflow of Ceph OSD or node removal.
Open the
MiraCephCR on a MOSK cluster for editing:kubectl -n ceph-lcm-mirantis edit miraceph
In the
nodessection, remove the required device. When using device filters, update regexp accordingly.For example:
spec: nodes: - name: <nodeName> # remove the entire entry for the node to replace devices: {...} role: [...]
Substitute
<nodeName>with the node name to replace.Save
MiraCephand close the editor.Create a
CephOsdRemoveRequestCR template and save it asreplace-failed-<nodeName>-request.yaml:apiVersion: lcm.mirantis.com/v1alpha1 kind: CephOsdRemoveRequest metadata: name: replace-failed-<nodeName>-request namespace: ceph-lcm-mirantis spec: nodes: <nodeName>: completeCleanUp: true
Apply the template to the cluster:
kubectl apply -f replace-failed-<nodeName>-request.yaml
Verify that the corresponding request has been created:
kubectl -n ceph-lcm-mirantis get cephosdremoverequest
Verify that the
removeInfosection appeared in theCephOsdRemoveRequestCRstatus:kubectl -n ceph-lcm-mirantis get cephosdremoverequest replace-failed-<nodeName>-request -o yaml
Example of system response:
status: osdRemoveStatus: removeInfo: cleanUpMap: <nodeName>: osdMapping: ... <osdId>: deviceMapping: ... <deviceName>: path: <deviceByPath> partition: "/dev/ceph-b-vg_sdb/osd-block-b-lv_sdb" type: "block" class: "hdd" zapDisk: true
If needed, change the following values:
<nodeName>- underlying machine node name, for example,kaas-node-5a74b669-7e53-4535-aabd-5b509ec844af.<osdId>- actual Ceph OSD ID for the device being replaced, for example,1.<deviceName>- actual device name placed on the node, for example,sdb.<deviceByPath>- actual deviceby-pathplaced on the node, for example,/dev/disk/by-path/pci-0000:00:1t.9.
Verify that the
cleanUpMapsection matches the required removal and wait for theApproveWaitingphase to appear instatus:kubectl -n ceph-lcm-mirantis get cephosdremoverequest replace-failed-<nodeName>-request -o yaml
Example of system response:
status: phase: ApproveWaiting
Edit the
CephOsdRemoveRequestCR and set theapproveflag totrue:kubectl -n ceph-lcm-mirantis edit cephosdremoverequest replace-failed-<nodeName>-request
For example:
spec: approve: true
Review the following
statusfields of the Ceph LCM CR request processing:status.phase- current state of request processingstatus.messages- description of the current phasestatus.conditions- full history of request processing before the current phasestatus.removeInfo.issuesandstatus.removeInfo.warnings- error and warning messages occurred during request processing, if any
Verify that the
CephOsdRemoveRequesthas been completed. For example:status: phase: Completed # or CompletedWithWarnings if there are non-critical issues
Remove the device cleanup jobs:
kubectl delete jobs -n ceph-lcm-mirantis -l app=miraceph-cleanup-disks
Note
You can spawn Ceph OSD on a raw device, but it must be clean and without any data or partitions. If you want to add a device that was in use, also ensure it is raw and clean. To clean up all data and partitions from a device, refer to official Rook documentation.
Open the
MiraCephCR on a MOSK cluster for editing:kubectl -n ceph-lcm-mirantis edit miraceph
In the
nodessection, add a new device:spec: nodes: - name: <nodeName> # add new configuration for replaced Ceph node devices: - fullPath: <deviceByID> # Recommended. Non-wwn by-id symlink. # name: <deviceByID> # Not recommended. If a device is supposed to be added with by-id. # fullPath: <deviceByPath> # if device is supposed to be added with by-path. config: deviceClass: hdd ...
Substitute
<nodeName>with the replaced node name and configure it as required.Warning
Mirantis highly recommends using non-wwn
by-idsymlinks only to specify storage devices in thedeviceslist.For details, see Addressing storage devices since MOSK 25.2.
Verify that all Ceph daemons from the replaced node have appeared on the Ceph cluster and are
inandup. ThefullClusterInfosection should not contain any issues.kubectl -n ceph-lcm-mirantis get mchealth -o yaml
Example of system response:
status: fullClusterInfo: clusterStatus: ceph: health: HEALTH_OK ... daemonStatus: mgr: running: a is active mgr status: Ok mon: running: '3/3 mons running: [a b c] in quorum' status: Ok osd: running: '3/3 running: 3 up, 3 in' status: Ok
Verify the Ceph node on the MOSK cluster:
kubectl -n rook-ceph get pod -o wide | grep <nodeName>
Remove Ceph OSD manually
Warning
This procedure is valid for MOSK clusters that use the MiraCeph custom
resource (CR), which is available since MOSK 25.2 to replace the deprecated
KaaSCephCluster. For the equivalent procedure with the KaaSCephCluster
CR, refer to the following section:
You may need to manually remove a Ceph OSD, for example, in the following cases:
If you accidentally have removed an OSD with ceph CLI or
rook-ceph-osddeployment.If you do not want to rely on Ceph LCM operations and want to manage the Ceph OSDs life cycle manually.
To safely remove one or multiple Ceph OSDs from a Ceph cluster, perform the following procedure for each Ceph OSD one by one.
Warning
The procedure presupposes the Ceph OSD disk or logical volumes partition cleanup.
To remove a Ceph OSD manually:
Edit the
MiraCephresource on a MOSK cluster:kubectl -n ceph-lcm-mirantis edit miraceph
In the
spec.nodessection, remove the requireddevicesitem of the corresponding node spec. When usingdeviceFilterordevicePathFilter, update regexp accordingly.If after removal
devices,deviceFilter, ordevicePathFilterbecome empty and the node spec has no roles specified, also remove the node spec.Verify that all Ceph OSDs are
upandin, the Ceph cluster is healthy, and no rebalance or recovery is in progress:kubectl -n rook-ceph exec -it deploy/rook-ceph-tools -- ceph -s
Example of system response:
cluster: id: 8cff5307-e15e-4f3d-96d5-39d3b90423e4 health: HEALTH_OK ... osd: 4 osds: 4 up (since 10h), 4 in (since 10h)
Stop all deployments in
ceph-lcm-mirantisnamespace to prevent autoscalingrook-ceph-operatordeployment to 1 replica:kubectl -n ceph-lcm-mirantis scale deploy --all --replicas 0
Stop the
rook-ceph/rook-ceph-operatordeployment to avoid premature re-orchestration of the Ceph cluster:kubectl -n rook-ceph scale deploy rook-ceph-operator --replicas 0
Enter the
ceph-toolspod:kubectl -n rook-ceph exec -it deploy/rook-ceph-tools -- bash
Mark the required Ceph OSD as
out:ceph osd out osd.<ID>
Note
In the command above and in the steps below, substitute
<ID>with the number of the Ceph OSD to remove.Wait until data backfilling to other OSDs is complete:
ceph -sOnce all of the PGs are
active+clean, backfilling is complete and it is safe to remove the disk.Note
For additional information on PGs backfilling, run ceph pg dump_stuck.
Exit from the
ceph-toolspod:exitScale the
rook-ceph/rook-ceph-osd-<ID>deployment to 0 replicas:kubectl -n rook-ceph scale deploy rook-ceph-osd-<ID> --replicas 0
Enter the
ceph-toolspod:kubectl -n rook-ceph exec -it deploy/rook-ceph-tools -- bash
Verify that the number of Ceph OSDs that are
upandinhas decreased by one daemon:ceph -sExample of system response:
osd: 4 osds: 3 up (since 1h), 3 in (since 5s)
Remove the Ceph OSD from the Ceph cluster:
ceph osd purge <ID> --yes-i-really-mean-it
Delete the Ceph OSD
authentry, if present. Otherwise, skip this step.ceph auth del osd.<ID>
If you have removed the last Ceph OSD on the node and want to remove this node from the Ceph cluster, remove the CRUSH map entry:
ceph osd crush remove <nodeName>
Substitute
<nodeName>with the name of the node where the removed Ceph OSD was placed.Verify that the failure domain within Ceph OSDs has been removed from the CRUSH map:
ceph osd tree
If you have removed the node, it will be removed from the CRUSH map.
Exit from the
ceph-toolspod:exitClean up the disk used by the removed Ceph OSD. For details, see official Rook documentation.
Warning
If you are using multiple Ceph OSDs per device or metadata device, make sure that you can clean up the entire disk. Otherwise, instead clean up only the logical volume partitions for the volume group by running lvremove <lvpartion_uuid> any Ceph OSD pod that belongs to the same host as the removed Ceph OSD.
Delete the
rook-ceph/rook-ceph-osd-<ID>deployment previously scaled to0replicas:kubectl -n rook-ceph delete deploy rook-ceph-osd-<ID>
Substitute
<ID>with the number of the removed Ceph OSD.Scale the
rook-ceph/rook-ceph-operatordeployment to 1 replica and wait for the orchestration to complete:kubectl -n rook-ceph scale deploy rook-ceph-operator --replicas 1 kubectl -n rook-ceph get pod -w
Scale all deployments in
ceph-lcm-mirantisnamespace to continue spec reconcilation and regular Ceph Controller work:kubectl -n ceph-lcm-mirantis scale deploy --all --replicas 3
Once done, Ceph OSD removal is complete.
Migrate Ceph cluster to address storage devices using by-id
Warning
This procedure is valid for MOSK clusters that use the MiraCeph custom
resource (CR), which is available since MOSK 25.2 to replace the deprecated
KaaSCephCluster. For the equivalent procedure with the KaaSCephCluster
CR, refer to the following section:
The by-id identifier is the only persistent device identifier for a Ceph
cluster that remains stable after the cluster upgrade or any other maintenance.
Therefore, Mirantis recommends using device by-id symlinks rather than
device names or by-path symlinks.
MOSK uses the device by-id identifier as the default
method of addressing the underlying devices of Ceph OSDs. Thus, you should
migrate all existing Ceph clusters, which are still utilizing the device names
or device by-path symlinks, to the by-id format.
This section explains how to configure the MiraCeph specification to use
the by-id symlinks instead of disk names and by-path identifiers as the
default method of addressing storage devices.
Note
Mirantis recommends avoiding the use of wwn symlinks as by-id
identifiers due to their lack of persistence expressed in inconsistent
discovery during node boot.
Besides migrating to by-id, consider using the fullPath field for the
by-id symlinks configuration, instead of the name field in the
spec.nodes.devices section. This approach allows for
clear understanding of field namings and their use cases.
Migrate the Ceph nodes section to by-id identifiers
Make sure that your MOSK cluster is not currently running an upgrade or any other maintenance process.
Obtain the list of all
MiraCephstorage devices that use disk names or diskby-pathas identifiers of Ceph node storage devices:kubectl -n ceph-lcm-mirantis get miraceph -o yaml
Example of system response
spec: nodes: ... - name: managed-worker-1 devices: - config: deviceClass: hdd name: sdc - config: deviceClass: hdd fullPath: /dev/disk/by-path/pci-0000:00:05.0-scsi-0:0:0:2 - name: managed-worker-2 devices: - config: deviceClass: hdd name: /dev/disk/by-id/wwn-0x26d546263bd312b8 - config: deviceClass: hdd name: /dev/disk/by-id/scsi-SQEMU_QEMU_HARDDISK_2e52abb48862dsdc - name: managed-worker-3 devices: - config: deviceClass: nvme name: nvme3n1 - config: deviceClass: hdd fullPath: /dev/disk/by-id/scsi-SATA_HGST_HUS724040AL_PN1334PEHN18ZS
Verify the items from the
devicessections to be moved to theby-idsymlinks. The list of the items to migrate includes:A disk name in the
namefield. For example,sdc,nvme3n1, and so on.A disk
/dev/disk/by-pathsymlink in thefullPathfield. For example,/dev/disk/by-path/pci-0000:00:05.0-scsi-0:0:0:2.A disk
/dev/disk/by-idsymlink in thenamefield.A disk
/dev/disk/by-id/wwnsymlink, which is programmatically calculated at boot. For example,/dev/disk/by-id/wwn-0x26d546263bd312b8.
For the example above, we have to migrate both items of
managed-worker-1, both items ofmanaged-worker-2, and the first item ofmanaged-worker-3. The second item ofmanaged-worker-3has already been configured in the required format, therefore, we are leaving it as is.Open the
MiraCephcustom resource for editing to start migration of all affecteddevicesitems toby-idsymlinks:kubectl -n ceph-lcm-mirantis edit miraceph
For each affected node from the
spec.nodessection, obtain the correspondingstatus.providerStatus.hardware.storagesection in theMachinecustom resource located on the management cluster:kubectl -n <moskClusterProject> get machine <machineName> -o yaml
Substitute
<moskClusterProject>with the corresponding cluster namespace and<machineName>with the machine name.Example of system response for
managed-worker-1status: providerStatus: hardware: storage: - byID: /dev/disk/by-id/wwn-0x05ad99618d66a21f byIDs: - /dev/disk/by-id/scsi-0QEMU_QEMU_HARDDISK_05ad99618d66a21f - /dev/disk/by-id/scsi-305ad99618d66a21f - /dev/disk/by-id/scsi-SQEMU_QEMU_HARDDISK_05ad99618d66a21f - /dev/disk/by-id/wwn-0x05ad99618d66a21f byPath: /dev/disk/by-path/pci-0000:00:05.0-scsi-0:0:0:0 byPaths: - /dev/disk/by-path/pci-0000:00:05.0-scsi-0:0:0:0 name: /dev/sda serialNumber: 05ad99618d66a21f size: 61 type: hdd - byID: /dev/disk/by-id/wwn-0x26d546263bd312b8 byIDs: - /dev/disk/by-id/scsi-0QEMU_QEMU_HARDDISK_26d546263bd312b8 - /dev/disk/by-id/scsi-326d546263bd312b8 - /dev/disk/by-id/scsi-SQEMU_QEMU_HARDDISK_26d546263bd312b8 - /dev/disk/by-id/wwn-0x26d546263bd312b8 byPath: /dev/disk/by-path/pci-0000:00:05.0-scsi-0:0:0:2 byPaths: - /dev/disk/by-path/pci-0000:00:05.0-scsi-0:0:0:2 name: /dev/sdb serialNumber: 26d546263bd312b8 size: 32 type: hdd - byID: /dev/disk/by-id/wwn-0x2e52abb48862dbdc byIDs: - /dev/disk/by-id/lvm-pv-uuid-MncrcO-6cel-0QsB-IKaY-e8UK-6gDy-k2hOtf - /dev/disk/by-id/scsi-0QEMU_QEMU_HARDDISK_2e52abb48862dbdc - /dev/disk/by-id/scsi-32e52abb48862dbdc - /dev/disk/by-id/scsi-SQEMU_QEMU_HARDDISK_2e52abb48862dbdc - /dev/disk/by-id/wwn-0x2e52abb48862dbdc byPath: /dev/disk/by-path/pci-0000:00:05.0-scsi-0:0:0:1 byPaths: - /dev/disk/by-path/pci-0000:00:05.0-scsi-0:0:0:1 name: /dev/sdc serialNumber: 2e52abb48862dbdc size: 61 type: hdd
For each affected
devicesitem from the consideredMachine, obtain a correctby-idsymlink fromstatus.providerStatus.hardware.storage.byIDs. Suchby-idsymlink must containstatus.providerStatus.hardware.storage.serialNumberand must not containwwn.For
managed-worker-1, according to the example system response above, we can use the followingby-idsymlinks:Replace the first item of
devicesthat containsname: sdcwithfullPath: /dev/disk/by-id/scsi-SQEMU_QEMU_HARDDISK_2e52abb48862dbdcReplace the second item of
devicesthat containsfullPath: /dev/disk/by-path/pci-0000:00:05.0-scsi-0:0:0:2withfullPath: /dev/disk/by-id/scsi-SQEMU_QEMU_HARDDISK_26d546263bd312b8
Replace all affected
devicesitems inMiraCephwith the obtained ones.Resulting example of the storage device identifier migration
spec: nodes: ... - name: managed-worker-1 devices: - config: deviceClass: hdd fullPath: /dev/disk/by-id/scsi-SQEMU_QEMU_HARDDISK_2e52abb48862dbdc - config: deviceClass: hdd fullPath: /dev/disk/by-id/scsi-SQEMU_QEMU_HARDDISK_26d546263bd312b8 - name: managed-worker-2 devices: - config: deviceClass: hdd fullPath: /dev/disk/by-id/scsi-SQEMU_QEMU_HARDDISK_031d9054c9b48f79 - config: deviceClass: hdd fullPath: /dev/disk/by-id/scsi-SQEMU_QEMU_HARDDISK_2e52abb48862dsdc - name: managed-worker-3 devices: - config: deviceClass: nvme fullPath: /dev/disk/by-id/nvme-SAMSUNG_MZ1LB3T8HMLA-00007_S46FNY0R394543 - config: deviceClass: hdd fullPath: /dev/disk/by-id/scsi-SATA_HGST_HUS724040AL_PN1334PEHN18ZS
Save and quit editing the
MiraCephcustom resource.
After migration, the re-orchestration occurs. The whole procedure should not result in any real changes to the Ceph cluster state in Ceph OSDs.
Migrate the Ceph node groups to by-id identifiers
Besides single nodes in the nodes section, your cluster may contain node
groups in the nodes section specified with disk names instead of by-id
symlinks. Despite of inplace replacement of single nodes storage device
identifiers, node groups require another approach because of the repeatable
spec section for different nodes.
In the case of migrating storage devices for node groups, use the
deviceLabels section to label different disks with the same labels and use
these labels in node groups after. For the deviceLabels section
specification, refer to Ceph advanced configuration: extraOpts.
The following procedure describes how to keep node groups in the nodes
section but use unique by-id identifiers instead of disk names.
To migrate the Ceph node groups to by-id identifiers:
Make sure that your MOSK cluster is not currently running an upgrade or any other maintenance process.
Obtain the list of all
MiraCephstorage devices that use disk names or diskby-pathas identifiers of Ceph node group storage devices:kubectl -n ceph-lcm-mirantis get miraceph -o yaml
Example extract of the
MiraCephnode groups in thenodessection with disk names used as identifiers:spec: nodes: ... - name: rack-1 nodeGroup: - node-1 - node-2 crush: rack: "rack-1" devices: - name: nvme0n1 config: deviceClass: nvme - name: nvme1n1 config: deviceClass: nvme - name: nvme2n1 config: deviceClass: nvme - name: rack-2 nodeGroup: - node-3 - node-4 crush: rack: "rack-2" devices: - name: nvme0n1 config: deviceClass: nvme - name: nvme1n1 config: deviceClass: nvme - name: nvme2n1 config: deviceClass: nvme - name: rack-3: nodeGroup: - node-5 - node-6 crush: rack: "rack-3" devices: - name: nvme0n1 config: deviceClass: nvme - name: nvme1n1 config: deviceClass: nvme - name: nvme2n1 config: deviceClass: nvme
Verify the items from the
devicessections to be moved toby-idsymlinks. The list of the items to migrate includes:A disk name in the
namefield. For example,sdc,nvme3n1, and so on.A disk
/dev/disk/by-pathsymlink in thefullPathfield. For example,/dev/disk/by-path/pci-0000:00:05.0-scsi-0:0:0:2.A disk
/dev/disk/by-idsymlink in thenamefield.A disk
/dev/disk/by-id/wwnsymlink, which is programmatically calculated at boot. For example,/dev/disk/by-id/wwn-0x26d546263bd312b8.
All
devicessections in the example above contain disk names in thenamefield. Therefore, you need to replace them withby-idsymlinks.Open the
MiraCephcustom resource for editing to start migration of all affecteddevicesitems toby-idsymlinks:kubectl -n ceph-lcm-mirantis edit miraceph
Within each impacted Ceph node group in the
nodessection, add disk labels to thedeviceLabelssections for every affected storage device linked with the nodes listed innodeGroupof that specific node group. Verify that these disk labels are equal toby-idsymlinks of corresponding disks.For example, if the node group
rack-1contains two nodesnode-1andnode-2andspeccontains three items withname, you need to obtain properby-idsymlinks for disk names from both nodes and write it down with the same disk labels. The following example contains the labels forby-idsymlinks ofnvme0n1,nvme1n1, andnvme2n1disks fromnode-1andnode-2correspondingly:spec: extraOpts: deviceLabels: node-1: nvme-1: /dev/disk/by-id/nvme-SAMSUNG_MZ1LB3T8HMLA-00007_S46FNY0R394543 nvme-2: /dev/disk/by-id/nvme-SAMSUNG_MZ1LB3T8HMLA-00007_S46FNY0R372150 nvme-3: /dev/disk/by-id/nvme-SAMSUNG_MZ1LB3T8HMLA-00007_S46FNY0R183266 node-2: nvme-1: /dev/disk/by-id/nvme-SAMSUNG_MZ1LB4040ALR-00007_S46FNY0R900128 nvme-2: /dev/disk/by-id/nvme-SAMSUNG_MZ1LB4040ALR-00007_S46FNY0R805840 nvme-3: /dev/disk/by-id/nvme-SAMSUNG_MZ1LB4040ALR-00007_S46FNY0R848469
Note
Keep device labels repeatable for all nodes from the node group. This allows for specifying unified
specfor differentby-idsymlinks of different nodes.Example of the complete
deviceLabelssectionspec: extraOpts: deviceLabels: node-1: nvme-1: /dev/disk/by-id/nvme-SAMSUNG_MZ1LB3T8HMLA-00007_S46FNY0R394543 nvme-2: /dev/disk/by-id/nvme-SAMSUNG_MZ1LB3T8HMLA-00007_S46FNY0R372150 nvme-3: /dev/disk/by-id/nvme-SAMSUNG_MZ1LB3T8HMLA-00007_S46FNY0R183266 node-2: nvme-1: /dev/disk/by-id/nvme-SAMSUNG_MZ1LB4040ALR-00007_S46FNY0R900128 nvme-2: /dev/disk/by-id/nvme-SAMSUNG_MZ1LB4040ALR-00007_S46FNY0R805840 nvme-3: /dev/disk/by-id/nvme-SAMSUNG_MZ1LB4040ALR-00007_S46FNY0R848469 node-3: nvme-1: /dev/disk/by-id/nvme-SAMSUNG_MZ1LB00T2B0A-00007_S46FNY0R900128 nvme-2: /dev/disk/by-id/nvme-SAMSUNG_MZ1LB00T2B0A-00007_S46FNY0R805840 nvme-3: /dev/disk/by-id/nvme-SAMSUNG_MZ1LB00T2B0A-00007_S46FNY0R848469 node-4: nvme-1: /dev/disk/by-id/nvme-SAMSUNG_MZ1LB00Z4SA0-00007_S46FNY0R286212 nvme-2: /dev/disk/by-id/nvme-SAMSUNG_MZ1LB00Z4SA0-00007_S46FNY0R350024 nvme-3: /dev/disk/by-id/nvme-SAMSUNG_MZ1LB00Z4SA0-00007_S46FNY0R300756 node-5: nvme-1: /dev/disk/by-id/nvme-SAMSUNG_MZ1LB8UK0QBD-00007_S46FNY0R577024 nvme-2: /dev/disk/by-id/nvme-SAMSUNG_MZ1LB8UK0QBD-00007_S46FNY0R718411 nvme-3: /dev/disk/by-id/nvme-SAMSUNG_MZ1LB8UK0QBD-00007_S46FNY0R831424 node-6: nvme-1: /dev/disk/by-id/nvme-SAMSUNG_MZ1LB01DAU34-00007_S46FNY0R908440 nvme-2: /dev/disk/by-id/nvme-SAMSUNG_MZ1LB01DAU34-00007_S46FNY0R945405 nvme-3: /dev/disk/by-id/nvme-SAMSUNG_MZ1LB01DAU34-00007_S46FNY0R224911
For each affected node group in the
nodessection, replace the field with the insufficient disk identifier to thenamefield with the disk label from thedeviceLabelssection.Example of the updated
nodessectionspec: nodeGroups: ... - name: rack-1 nodeGroup: - node-1 - node-2 crush: rack: "rack-1" devices: - name: nvme-1 config: deviceClass: nvme - name: nvme-2 config: deviceClass: nvme - name: nvme-3 config: deviceClass: nvme - name: rack-2 nodeGroup: - node-3 - node-4 crush: rack: "rack-2" devices: - name: nvme-1 config: deviceClass: nvme - name: nvme-2 config: deviceClass: nvme - name: nvme-3 config: deviceClass: nvme - name: rack-3 nodes: - node-5 - node-6 crush: rack: "rack-3" devices: - name: nvme-1 config: deviceClass: nvme - name: nvme-2 config: deviceClass: nvme - name: nvme-3 config: deviceClass: nvme
Save and quit editing the
MiraCephcustom resource.
After migration, the re-orchestration occurs. The whole procedure should not result in any real changes to the Ceph cluster state in Ceph OSDs.
Obtain a by-id symlink of a storage device
Warning
This procedure is valid for MOSK clusters that use the MiraCeph custom
resource (CR), which is available since MOSK 25.2 to replace the deprecated
KaaSCephCluster. For the equivalent procedure with the KaaSCephCluster
CR, refer to the following section:
You can start using a storage device only after a corresponding Machine
becomes ready and accessible. Thus, MiraCeph can be created only
after all machines receive the status.providerStatus.hardware.storage
configuration containing all required device by-id symlinks.
To obtain a device by-id symlink:
Verify that the
MachineisReady:kubectl -n <moskClusterProject> get machine <machineName> -o jsonpath='{.status.phase}{"\n"}'
Substitute
<moskClusterProject>with the cluster namespace and<machineName>with the machine name.Obtain storage details for the
Machine:kubectl -n <moskClusterProject> get machine <machineName> -o yaml
Example of system response
status: providerStatus: hardware: storage: - byID: /dev/disk/by-id/wwn-0x05ad99618d66a21f byIDs: - /dev/disk/by-id/scsi-0QEMU_QEMU_HARDDISK_05ad99618d66a21f - /dev/disk/by-id/scsi-305ad99618d66a21f - /dev/disk/by-id/scsi-SQEMU_QEMU_HARDDISK_05ad99618d66a21f - /dev/disk/by-id/wwn-0x05ad99618d66a21f byPath: /dev/disk/by-path/pci-0000:00:05.0-scsi-0:0:0:0 byPaths: - /dev/disk/by-path/pci-0000:00:05.0-scsi-0:0:0:0 name: /dev/sda serialNumber: 05ad99618d66a21f size: 61 type: hdd - byID: /dev/disk/by-id/wwn-0x26d546263bd312b8 byIDs: - /dev/disk/by-id/scsi-0QEMU_QEMU_HARDDISK_26d546263bd312b8 - /dev/disk/by-id/scsi-326d546263bd312b8 - /dev/disk/by-id/scsi-SQEMU_QEMU_HARDDISK_26d546263bd312b8 - /dev/disk/by-id/wwn-0x26d546263bd312b8 byPath: /dev/disk/by-path/pci-0000:00:05.0-scsi-0:0:0:2 byPaths: - /dev/disk/by-path/pci-0000:00:05.0-scsi-0:0:0:2 name: /dev/sdb serialNumber: 26d546263bd312b8 size: 32 type: hdd - byID: /dev/disk/by-id/wwn-0x2e52abb48862dbdc byIDs: - /dev/disk/by-id/lvm-pv-uuid-MncrcO-6cel-0QsB-IKaY-e8UK-6gDy-k2hOtf - /dev/disk/by-id/scsi-0QEMU_QEMU_HARDDISK_2e52abb48862dbdc - /dev/disk/by-id/scsi-32e52abb48862dbdc - /dev/disk/by-id/scsi-SQEMU_QEMU_HARDDISK_2e52abb48862dbdc - /dev/disk/by-id/wwn-0x2e52abb48862dbdc byPath: /dev/disk/by-path/pci-0000:00:05.0-scsi-0:0:0:1 byPaths: - /dev/disk/by-path/pci-0000:00:05.0-scsi-0:0:0:1 name: /dev/sdc serialNumber: 2e52abb48862dbdc size: 61 type: hdd
In the
status.providerStatus.hardware.storagesection, obtain the item from thebyIDslist that containsserialNumberand does not containwwnas a bus ID.In the example above, for the disk with the
/dev/sdcname, you can use the/dev/disk/by-id/scsi-0QEMU_QEMU_HARDDISK_2e52abb48862dbdcsymlink as a persistent identifier of the storage device because it contains the2e52abb48862dbdcserial number and does not containwwn.Note
Do not rely on the
byIDfield only. This field may contain a/dev/disk/by-id/wwnsymlink that cannot be considered a persistent identifier of a storage device.
Increase Ceph cluster storage size
Warning
This procedure is valid for MOSK clusters that use the MiraCeph custom
resource (CR), which is available since MOSK 25.2 to replace the deprecated
KaaSCephCluster. For the equivalent procedure with the KaaSCephCluster
CR, refer to the following section:
This section describes how to increase the overall storage size for all Ceph
pools of the same device class: hdd, ssd, or nvme.
The procedure presupposes adding a new Ceph OSD. The overall storage size for
the required device class automatically increases once the Ceph OSD becomes
available in the Ceph cluster.
To increase the overall storage size for a device class:
Identify the current storage size for the required device class:
kubectl -n rook-ceph exec -it deploy/rook-ceph-tools -- ceph df
Example of system response:
--- RAW STORAGE --- CLASS SIZE AVAIL USED RAW USED %RAW USED hdd 128 GiB 101 GiB 23 GiB 27 GiB 21.40 TOTAL 128 GiB 101 GiB 23 GiB 27 GiB 21.40 --- POOLS --- POOL ID PGS STORED OBJECTS USED %USED MAX AVAIL device_health_metrics 1 1 0 B 0 0 B 0 30 GiB kubernetes-hdd 2 32 12 GiB 3.13k 23 GiB 20.57 45 GiB
Identify the number of Ceph OSDs with the required device class:
kubectl -n rook-ceph exec -it deploy/rook-ceph-tools -- ceph osd df <deviceClass>
Substitute
<deviceClass>with the required device class:hdd,ssd, ornvme.Example of system response for the
hdddevice class:ID CLASS WEIGHT REWEIGHT SIZE RAW USE DATA OMAP META AVAIL %USE VAR PGS STATUS 1 hdd 0.03119 1.00000 32 GiB 5.8 GiB 4.8 GiB 1.5 MiB 1023 MiB 26 GiB 18.22 0.85 14 up 3 hdd 0.03119 1.00000 32 GiB 6.9 GiB 5.9 GiB 1.1 MiB 1023 MiB 25 GiB 21.64 1.01 17 up 0 hdd 0.03119 0.84999 32 GiB 6.8 GiB 5.8 GiB 1013 KiB 1023 MiB 25 GiB 21.24 0.99 16 up 2 hdd 0.03119 1.00000 32 GiB 7.9 GiB 6.9 GiB 1.2 MiB 1023 MiB 24 GiB 24.55 1.15 20 up TOTAL 128 GiB 27 GiB 23 GiB 4.8 MiB 4.0 GiB 101 GiB 21.41 MIN/MAX VAR: 0.85/1.15 STDDEV: 2.29
Follow Add a Ceph OSD on a managed cluster to add a new device with a supported device class:
hdd,ssd, ornvme.Wait for the new Ceph OSD pod to start
Running:kubectl -n rook-ceph get pod -l app=rook-ceph-osd
Verify that the new Ceph OSD has rebalanced and Ceph health is
HEALTH_OK:kubectl -n rook-ceph exec -it deploy/rook-ceph-tools -- ceph -s
Verify that the new Ceph has been OSD added to the list of device class OSDs:
kubectl -n rook-ceph exec -it deploy/rook-ceph-tools -- ceph osd df <deviceClass>
Substitute
<deviceClass>with the required device class:hdd,ssd, ornvmeExample of system response for the
hdddevice class after adding a new Ceph OSD:ID CLASS WEIGHT REWEIGHT SIZE RAW USE DATA OMAP META AVAIL %USE VAR PGS STATUS 1 hdd 0.03119 1.00000 32 GiB 4.5 GiB 3.5 GiB 1.5 MiB 1023 MiB 28 GiB 13.93 0.78 10 up 3 hdd 0.03119 1.00000 32 GiB 5.5 GiB 4.5 GiB 1.1 MiB 1023 MiB 26 GiB 17.22 0.96 13 up 0 hdd 0.03119 0.84999 32 GiB 6.5 GiB 5.5 GiB 1013 KiB 1023 MiB 25 GiB 20.32 1.14 15 up 2 hdd 0.03119 1.00000 32 GiB 7.5 GiB 6.5 GiB 1.2 MiB 1023 MiB 24 GiB 23.43 1.31 19 up 4 hdd 0.03119 1.00000 32 GiB 4.6 GiB 3.6 GiB 0 B 1 GiB 27 GiB 14.45 0.81 10 up TOTAL 160 GiB 29 GiB 24 GiB 4.8 MiB 5.0 GiB 131 GiB 17.87 MIN/MAX VAR: 0.78/1.31 STDDEV: 3.62
Verify the total storage capacity increased for the entire device class:
kubectl -n rook-ceph exec -it deploy/rook-ceph-tools -- ceph df
Example of system response:
--- RAW STORAGE --- CLASS SIZE AVAIL USED RAW USED %RAW USED hdd 160 GiB 131 GiB 24 GiB 29 GiB 17.97 TOTAL 160 GiB 131 GiB 24 GiB 29 GiB 17.97 --- POOLS --- POOL ID PGS STORED OBJECTS USED %USED MAX AVAIL device_health_metrics 1 1 0 B 0 0 B 0 38 GiB kubernetes-hdd 2 32 12 GiB 3.18k 24 GiB 17.17 57 GiB
Move a Ceph Monitor daemon to another node
Warning
This procedure is valid for MOSK clusters that use the MiraCeph custom
resource (CR), which is available since MOSK 25.2 to replace the deprecated
KaaSCephCluster. For the equivalent procedure with the KaaSCephCluster
CR, refer to the following section:
This document describes how to migrate a Ceph Monitor daemon from one node to another without changing the general number of Ceph Monitors in the cluster. In the Ceph Controller concept, migration of a Ceph Monitor means manually removing it from one node and adding it to another.
Consider the following exemplary placement scheme of Ceph Monitors in the
nodes spec of the MiraCeph CR:
nodes:
node-1:
roles:
- mon
- mgr
node-2:
roles:
- mgr
Using the example above, if you want to move the Ceph Monitor from node-1
to node-2 without changing the number of Ceph Monitors, the roles table
of the nodes spec must result as follows:
nodes:
node-1:
roles:
- mgr
node-2:
roles:
- mgr
- mon
However, due to the Rook limitation related to Kubernetes architecture, once
you move the Ceph Monitor through the MiraCeph CR, changes will not
apply automatically. This is caused by the following Rook behavior:
Rook creates Ceph Monitor resources as deployments with
nodeSelector, which binds Ceph Monitor pods to a requested node.Rook does not recreate new Ceph Monitors with the new node placement if the current
monquorum works.
Therefore, to move a Ceph Monitor to another node, you must also manually apply the new Ceph Monitors placement to the Ceph cluster as described below.
To move a Ceph Monitor to another node:
Open the
MiraCephCR on a MOSK cluster:kubectl -n ceph-lcm-mirantis edit miraceph
In the
nodesspec of theMiraCephCR, change themonroles placement without changing the total number ofmonroles. For details, see the example above. Note the nodes on which themonroles have been removed and save thenamevalue of that nodes.If you perform a MOSK cluster update, follow additional steps:
Verify that the following conditions are met before proceeding to the next step:
There are at least 2 running and available Ceph Monitors so that the Ceph cluster is accessible during the Ceph Monitor migration:
kubectl -n rook-ceph get pod -l app=rook-ceph-mon kubectl -n rook-ceph exec -it deploy/rook-ceph-tools -- ceph -s
The
MiraCephobject on the MOSK cluster has the required node with themonrole added in thenodessection ofspec:kubectl -n ceph-lcm-mirantis get miraceph -o yaml
The Ceph
NodeWorkloadLockfor the required node is created:kubectl --kubeconfig child-kubeconfig get nodeworkloadlock -o jsonpath='{range .items[?(@.spec.nodeName == "<desiredNodeName>")]}{@.metadata.name}{"\n"}{end}' | grep ceph
Scale the
ceph-maintenance-controllerdeployment to0replicas:kubectl -n ceph-lcm-mirantis scale deploy ceph-maintenance-controller --replicas 0
Manually edit the MOSK cluster node labels: remove the
ceph_role_monlabel from the obsolete node and add this label to the new node:kubectl label node <obsoleteNodeName> ceph_role_mon- kubectl label node <newNodeName> ceph_role_mon=true
Verify that the
rook-ceph-operatordeployment is scaled to 0 replica:kubectl -n rook-ceph scale deploy rook-ceph-operator --replicas 0
Obtain the
rook-ceph-mondeployment name placed on the obsolete node using the previously obtained node name:kubectl -n rook-ceph get deploy -l app=rook-ceph-mon -o jsonpath="{.items[?(@.spec.template.spec.nodeSelector['kubernetes\.io/hostname'] == '<nodeName>')].metadata.name}"
Substitute
<nodeName>with the name of the node where you removed themonrole.Back up the
rook-ceph-mondeployment placed on the obsolete node:kubectl -n rook-ceph get deploy <rook-ceph-mon-name> -o yaml > <rook-ceph-mon-name>-backup.yaml
Remove the
rook-ceph-mondeployment placed on the obsolete node:kubectl -n rook-ceph delete deploy <rook-ceph-mon-name>
If you perform a MOSK cluster update, follow additional steps:
Enter the
ceph-toolspod:kubectl -n rook-ceph exec -it deploy/rook-ceph-tools -- bash
Remove the Ceph Monitor from the Ceph monmap by letter:
ceph mon rm <monLetter>
Substitute
<monLetter>with the old Ceph Monitor letter. For example,mon-bhas the letterb.Verify that the Ceph cluster does not have any information about the the removed Ceph Monitor:
ceph mon dump ceph -s
Exit the
ceph-toolspod.Scale up the
rook-ceph-operatordeployment to1replica:kubectl -n rook-ceph scale deploy rook-ceph-operator --replicas 1
Wait for the missing Ceph Monitor failover process to start:
kubectl -n rook-ceph logs -l app=rook-ceph-operator -f
Example of log extract:
2024-03-01 12:33:08.741215 W | op-mon: mon b NOT found in ceph mon map, failover 2024-03-01 12:33:08.741244 I | op-mon: marking mon "b" out of quorum ... 2024-03-01 12:33:08.766822 I | op-mon: Failing over monitor "b" 2024-03-01 12:33:08.766881 I | op-mon: starting new mon...
Select one of the following options:
Wait approximately 10 minutes until
rook-ceph-operatorperforms a failover of thePendingmonpod. Inspect the logs during the failover process:kubectl -n rook-ceph logs -l app=rook-ceph-operator -f
Example of log extract:
2021-03-15 17:48:23.471978 W | op-mon: mon "a" not found in quorum, waiting for timeout (554 seconds left) before failover
Note
If the failover process fails:
Scale down the
rook-ceph-operatordeployment to0replicas.Apply the backed-up
rook-ceph-mondeployment.Scale back the
rook-ceph-operatordeployment to1replica.
Scale the
rook-ceph-operatordeployment to0replicas:kubectl -n rook-ceph scale deploy rook-ceph-operator --replicas 0
Scale the
ceph-maintenance-controllerdeployment to3replicas:kubectl -n ceph-lcm-mirantis scale deploy ceph-maintenance-controller --replicas 3
Once done, Rook removes the obsolete Ceph Monitor from the node and creates
a new one on the specified node with a new letter. For example, if the a,
b, and c Ceph Monitors were in quorum and mon-c was obsolete, Rook
removes mon-c and creates mon-d. In this case, the new quorum includes
the a, b, and d Ceph Monitors.
Migrate a Ceph Monitor before machine replacement
Warning
This procedure is valid for MOSK clusters that use the MiraCeph custom
resource (CR), which is available since MOSK 25.2 to replace the deprecated
KaaSCephCluster. For the equivalent procedure with the KaaSCephCluster
CR, refer to the following section:
This document describes how to migrate a Ceph Monitor to another machine on baremetal-based clusters before node replacement as described in Delete a cluster machine using web UI.
Warning
Remove the Ceph Monitor role before the machine removal.
Make sure that the Ceph cluster always has an odd number of Ceph Monitors.
The procedure of a Ceph Monitor migration assumes that you temporarily move the Ceph Manager/Monitor to a worker machine. After a node replacement, we recommend migrating the Ceph Manager/Monitor to the new manager machine.
To migrate a Ceph Monitor to another machine:
Move the Ceph Manager/Monitor daemon from the affected machine to one of the worker machines as described in Move a Ceph Monitor daemon to another node.
Delete the affected machine as described in Delete a cluster machine.
Add a new manager machine without the Monitor and Manager role as described in Create a machine using CLI.
Warning
The addition of a new machine with the Monitor and Manager role breaks the odd number quorum of Ceph Monitors.
Move the previously migrated Ceph Manager/Monitor daemon to the new manager machine as described in Move a Ceph Monitor daemon to another node.
Enable Ceph RGW Object Storage
Warning
This procedure is valid for MOSK clusters that use the MiraCeph custom
resource (CR), which is available since MOSK 25.2 to replace the deprecated
KaaSCephCluster. For the equivalent procedure with the KaaSCephCluster
CR, refer to the following section:
Ceph Controller enables you to deploy RADOS Gateway (RGW) Object Storage instances and automatically manage its resources such as users and buckets. Ceph Object Storage has an integration with OpenStack Object Storage (Swift) in MOSK.
To enable the RGW Object Storage:
Open the
MiraCephCR on a MOSK cluster for editing:kubectl -n ceph-lcm-mirantis edit miraceph
Using the following table, update the
objectStorage.rgwsection specification as required:Caution
Explicitly specify the
deviceClassparameter fordataPoolandmetadataPool.RADOS Gateway parameters¶ Parameter
Description
nameRequired. Ceph Object Storage instance name.
dataPoolRequired if
zone:nameis not specified. Mutually exclusive withzone. Must be used together withmetadataPool.Object storage data pool spec that must only contain
replicatedorerasureCodedandfailureDomainparameters. ThefailureDomainparameter may be set tohost,rack,room, ordatacenter, defining the failure domain across which the data will be spread. ThedeviceClassmust be explicitly defined. FordataPool, Mirantis recommends using anerasureCodedpool. For details, see Rook documentation: Erasure coding. For example:rgw: dataPool: deviceClass: hdd failureDomain: host erasureCoded: codingChunks: 1 dataChunks: 2
metadataPoolRequired if
zone:nameis not specified. Mutually exclusive withzone. Must be used together withdataPool. Object storage metadata pool spec that must only containreplicatedandfailureDomainparameters. ThefailureDomainparameter may be set tohost,rack,room, ordatacenter, defining the failure domain across which the data will be spread. ThedeviceClassmust be explicitly defined. Can use onlyreplicatedsettings. For example:rgw: metadataPool: deviceClass: hdd failureDomain: host replicated: size: 3
where
replicated.sizeis the number of full copies of data on multiple nodes.Warning
When using the non-recommended Ceph pools
replicated.sizeof less than3, Ceph OSD removal cannot be performed. The minimal replica size equals a rounded up half of the specifiedreplicated.size.For example, if
replicated.sizeis2, the minimal replica size is1, and ifreplicated.sizeis3, then the minimal replica size is2. The replica size of1allows Ceph having PGs with only one Ceph OSD in theactingstate, which may cause aPG_TOO_DEGRADEDhealth warning that blocks Ceph OSD removal. Mirantis recommends settingreplicated.sizeto3for each Ceph pool.gatewayRequired. The gateway settings corresponding to the
rgwdaemon settings. Includes the following parameters:port- the port on which the Ceph RGW service will be listening on HTTP.securePort- the port on which the Ceph RGW service will be listening on HTTPS.instances- the number of pods in the Ceph RGW ReplicaSet. IfallNodesis set totrue, a DaemonSet is created instead.Note
Mirantis recommends using 3 instances for Ceph Object Storage.
allNodes- defines whether to start the Ceph RGW pods as a DaemonSet on all nodes. Theinstancesparameter is ignored ifallNodesis set totrue.
For example:
rgw: gateway: allNodes: false instances: 3 port: 80 securePort: 8443
preservePoolsOnDeleteOptional. Defines whether to delete the data and metadata pools in the
rgwsection if the object storage is deleted. Set this parameter totrueif you need to store data even if the object storage is deleted. However, Mirantis recommends setting this parameter tofalse.objectUsersandbucketsOptional. To create new Ceph RGW resources, such as buckets or users, specify the following keys. Ceph Controller will automatically create the specified object storage users and buckets in the Ceph cluster.
objectUsers- a list of user specifications to create for object storage. Contains the following fields:name- a user name to create.displayName- the Ceph user name to display.capabilities- user capabilities:user- admin capabilities to read/write Ceph Object Store users.bucket- admin capabilities to read/write Ceph Object Store buckets.metadata- admin capabilities to read/write Ceph Object Store metadata.usage- admin capabilities to read/write Ceph Object Store usage.zone- admin capabilities to read/write Ceph Object Store zones.
The available options are
*,read,write,read, write. For details, see Ceph documentation: Add/remove admin capabilities.quotas- user quotas:maxBuckets- the maximum bucket limit for the Ceph user. Integer, for example,10.maxSize- the maximum size limit of all objects across all the buckets of a user. String size, for example,10G.maxObjects- the maximum number of objects across all buckets of a user. Integer, for example,10.
For example:
objectUsers: - capabilities: bucket: '*' metadata: read user: read displayName: test-user name: test-user quotas: maxBuckets: 10 maxSize: 10G
buckets- a list of strings that contain bucket names to create for object storage.
zoneRequired if
dataPoolandmetadataPoolare not specified. Mutually exclusive with these parameters. Defines the Ceph Multisite zone where the object storage must be placed. Includes thenameparameter that must be set to one of thezonesitems. For details, see the Enable multisite for Ceph RGW Object Storage procedure depending on the Ceph custom resource being used: MiraCeph or KaaSCephCluster.For example:
objectStorage: multisite: zones: - name: master-zone ... rgw: zone: name: master-zone
SSLCertOptional. Custom TLS certificate parameters used to access the Ceph RGW endpoint. If not specified, a self-signed certificate will be generated.
For example:
objectStorage: rgw: SSLCert: cacert: | -----BEGIN CERTIFICATE----- ca-certificate here -----END CERTIFICATE----- tlsCert: | -----BEGIN CERTIFICATE----- private TLS certificate here -----END CERTIFICATE----- tlsKey: | -----BEGIN RSA PRIVATE KEY----- private TLS key here -----END RSA PRIVATE KEY-----
SSLCertInRefOptional. Available since MOSK 25.1. Flag to determine that a TLS certificate for accessing the Ceph RGW endpoint is used but not exposed in
spec. For example:objectStorage: rgw: SSLCertInRef: true
The operator must manually provide TLS configuration using the
rgw-ssl-certificatesecret in therook-cephnamespace of the managed cluster. The secret object must have the following structure:data: cacert: <base64encodedCaCertificate> cert: <base64encodedCertificate>
When removing an already existing
SSLCertblock, no additional actions are required, because this block uses the samergw-ssl-certificatesecret in therook-cephnamespace.When adding a new secret directly without exposing it in
spec, the following rules apply:cert- base64 representation of a file with the server TLS key, server TLS cert, and cacert.cacert- base64 representation of a cacert only.
For example:
rgw: name: rgw-store dataPool: deviceClass: hdd erasureCoded: codingChunks: 1 dataChunks: 2 failureDomain: host metadataPool: deviceClass: hdd failureDomain: host replicated: size: 3 gateway: allNodes: false instances: 3 port: 80 securePort: 8443 preservePoolsOnDelete: false
Enable multisite for Ceph RGW Object Storage
TechPreview
Warning
This procedure is valid for MOSK clusters that use the MiraCeph custom
resource (CR), which is available since MOSK 25.2 to replace the deprecated
KaaSCephCluster. For the equivalent procedure with the KaaSCephCluster
CR, refer to the following section:
The Ceph multisite feature allows object storage to replicate its data over multiple Ceph clusters. Using multisite, such object storage is independent and isolated from another object storage in the cluster. Only the multi-zone multisite setup is currently supported. For more details, see Ceph documentation: Multisite.
Enable the multisite RGW Object Storage
Select from the following options:
If you do not have a MOSKcluster yet, open
miraceph.yaml.templatefor editing.If the MOSK cluster is already deployed, open the
MiraCephCR of the cluster for editing:kubectl -n ceph-lcm-mirantis edit miraceph
Using the following table, update the
spec.objectStorage.multisitesection specification as required:Multisite parameters¶ Parameter
Description
realmsRequired. List of realms to use, represents the realm namespaces. Includes the following parameters:
name- required, the realm name.pullEndpoint- optional, required only when the master zone is in a different storage cluster. The endpoint, access key, and system key of the system user from the realm to pull from. Includes the following parameters:endpoint- the endpoint of the master zone in the master zone group.accessKey- the access key of the system user from the realm to pull from.secretKey- the system key of the system user from the realm to pull from.
zoneGroupsRequired. The list of zone groups for realms. Includes the following parameters:
name- required, the zone group name.realmName- required, the realm namespace name to which the zone group belongs to.
zonesRequired. The list of zones used within one zone group. Includes the following parameters:
name- required, the zone name.metadataPool- required, the settings used to create the Object Storage metadata pools. Must use replication. For details, see description of pool parameters depending on the Ceph custom resource being used: MiraCeph or KaaSCephCluster.dataPool- required, the settings used to create the Object Storage data pool. Can use replication or erasure coding. For details, see description of pool parameters depending on the Ceph custom resource being used: MiraCeph or KaaSCephCluster.zoneGroupName- required, the zone group name.endpointsForZone- optional, available since MOSK 24.2. The list of all endpoints in the zone group. If you use ingress proxy for RGW, the list of endpoints must contain that FQDN/IP address to access RGW. By default, if no ingress proxy is used, the list of endpoints is set to the IP address of the RGW external service. Endpoints must follow the HTTP URL format.
Caution
The multisite configuration requires master and secondary zones to be reachable from each other.
Select from the following options:
If you do not need to replicate data from a different storage cluster, and the current cluster represents the master zone, modify the current
objectStoragesection to use the multisite mode:Configure the
zoneRADOS Gateway (RGW) parameter by setting it to the RGW Object Storage name.Note
Leave
dataPoolandmetadataPoolempty. These parameters are ignored because thezoneblock in the multisite configuration specifies the pools parameters. Other RGW parameters do not require changes.For example:
objectStorage: rgw: dataPool: {} gateway: allNodes: false instances: 2 port: 80 securePort: 8443 healthCheck: {} metadataPool: {} name: openstack-store preservePoolsOnDelete: false zone: name: openstack-store
Create the
multiSitesection where the names of realm, zone group, and zone must match the current RGW name.Specify the
endpointsForZoneparameter according to your configuration:If you use ingress proxy, which is defined in the
spec.ingresssection, add the FQDN endpoint.If you do not use any ingress proxy and access the RGW API using the default RGW external service, add the IP address of the external service or leave this parameter empty.
The following example illustrates a complete
objectStoragesection:objectStorage: multiSite: realms: - name: openstack-store zoneGroups: - name: openstack-store realmName: openstack-store zones: - name: openstack-store zoneGroupName: openstack-store endpointsForZone: http://10.11.0.75:8080 metadataPool: failureDomain: host replicated: size: 3 dataPool: erasureCoded: codingChunks: 1 dataChunks: 2 failureDomain: host rgw: dataPool: {} gateway: allNodes: false instances: 2 port: 80 securePort: 8443 healthCheck: {} metadataPool: {} name: openstack-store preservePoolsOnDelete: false zone: name: openstack-store
If you use a different storage cluster, and its object storage data must be replicated, specify the realm and zone group names along with the
pullEndpointparameter. Additionally, specify the endpoint, access key, and system keys of the system user of the realm from which you need to replicate data. For details, see the step 2 of this procedure.Note
All commands below should be executed inside
ceph-toolspod.To obtain the endpoint of the cluster zone that must be replicated, run the following command by specifying the zone group name of the required master zone on the master zone side:
radosgw-admin zonegroup get --rgw-zonegroup=<ZONE_GROUP_NAME> | jq -r '.endpoints'
The endpoint is located in the
endpointsfield.To obtain the access key and the secret key of the system user, run the following command on the required Ceph cluster:
radosgw-admin user list
To obtain the system user name, which has your RGW
ObjectStoragename as prefix:radosgw-admin user info --uid="<USER_NAME>" | jq -r '.keys'
For example:
objectStorage: multiSite: realms: - name: openstack-store pullEndpoint: endpoint: http://10.11.0.75:8080 accessKey: DRND5J2SVC9O6FQGEJJF secretKey: qpjIjY4lRFOWh5IAnbrgL5O6RTA1rigvmsqRGSJk zoneGroups: - name: openstack-store realmName: openstack-store zones: - name: openstack-store-backup zoneGroupName: openstack-store metadataPool: failureDomain: host replicated: size: 3 dataPool: erasureCoded: codingChunks: 1 dataChunks: 2 failureDomain: host
Note
Mirantis recommends using the same
metadataPoolanddataPoolsettings as you use in the master zone.
Configure the
zoneRGW parameter and leavedataPoolandmetadataPoolempty. These parameters are ignored because thezonesection in the multisite configuration specifies the pools parameters.Also, you can split the RGW daemon on daemons serving clients and daemons running synchronization. To enable this option, specify
splitDaemonForMultisiteTrafficSyncin thegatewaysection.For example:
objectStorage: multiSite: realms: - name: openstack-store pullEndpoint: endpoint: http://10.11.0.75:8080 accessKey: DRND5J2SVC9O6FQGEJJF secretKey: qpjIjY4lRFOWh5IAnbrgL5O6RTA1rigvmsqRGSJk zoneGroups: - name: openstack-store realmName: openstack-store zones: - name: openstack-store-backup zoneGroupName: openstack-store metadataPool: failureDomain: host replicated: size: 3 dataPool: erasureCoded: codingChunks: 1 dataChunks: 2 failureDomain: host rgw: dataPool: {} gateway: allNodes: false instances: 2 splitDaemonForMultisiteTrafficSync: true port: 80 securePort: 8443 healthCheck: {} metadataPool: {} name: openstack-store-backup preservePoolsOnDelete: false zone: name: openstack-store-backup
On the
ceph-toolspod, verify the multisite status:radosgw-admin sync status
Once done, ceph-controller will create the required resources and Rook will
handle the multisite configuration. For details, see: Rook documentation:
Object Multisite.
Configure and clean up a multisite configuration
Warning
Rook does not handle multisite configuration changes and cleanup.
Therefore, once you enable multisite for Ceph RGW Object Storage, perform
these operations manually in the ceph-tools pod. For details, see
Rook documentation: Multisite cleanup.
If automatic update of zone group hostnames is disabled, manually specify all
required hostnames and update the zone group. In the ceph-tools pod, run
the following script:
/usr/local/bin/zonegroup_hostnames_update.sh --rgw-zonegroup <ZONEGROUP_NAME> --hostnames fqdn1[,fqdn2]
If the multisite setup is completely cleaned up, manually execute the following
steps on the ceph-tools pod:
Remove the
.rgw.rootpool:ceph osd pool rm .rgw.root .rgw.root --yes-i-really-really-mean-it
Some other RGW pools may also require a removal after cleanup.
Remove the related RGW crush rules:
ceph osd crush rule ls | grep rgw | xargs -I% ceph osd crush rule rm %
Manage Ceph RBD or CephFS clients and RGW users
Warning
This procedure is valid for MOSK clusters that use the MiraCeph custom
resource (CR), which is available since MOSK 25.2 to replace the deprecated
KaaSCephCluster. For the equivalent procedure with the KaaSCephCluster
CR, refer to the following section:
The section describes how to create, access, and remove Ceph RADOS Block Device (RBD) or Ceph File System (CephFS) clients and RADOS Gateway (RGW) users.
Manage Ceph RBD or CephFS clients
Warning
This procedure is valid for MOSK clusters that use the MiraCeph custom
resource (CR), which is available since MOSK 25.2 to replace the deprecated
KaaSCephCluster. For the equivalent procedure with the KaaSCephCluster
CR, refer to the following section:
The MiraCeph resource allows managing custom Ceph RADOS Block Device (RBD)
or Ceph File System (CephFS) clients. This section describes how to create,
access, and remove Ceph RBD or CephFS clients.
For all supported parameters of Ceph clients, refer to Clients parameters.
Edit the
MiraCephresource by adding a new Ceph client to thespecsection:kubectl -n ceph-lcm-mirantis edit miraceph
Example of adding an RBD client to the
kubernetes-ssdpool:spec: clients: - name: rbd-client caps: mon: allow r, allow command "osd blacklist" osd: profile rbd pool=kubernetes-ssd
Example of adding a CephFS client to the
cephfs-1Ceph File System:spec: clients: - name: cephfs-1-client caps: mds: allow rwp mon: allow r, allow command "osd blacklist" osd: allow rw tag cephfs data=cephfs-1 metadata=*
For details about
caps, refer to Ceph documentation: Authorization (capabilities).Note
Ceph supports only providing of client access to the whole Ceph File System with all data pools in it.
Wait for created clients to become ready in the
MiraCephHealthstatus:kubectl -n ceph-lcm-mirantis get mchealth -o yaml
Example output:
status: fullClusterInfo: blockStorageStatus: clientsStatus: rbd-client: present: true status: Ready cephfs-1-client: present: true status: Ready
Using the
MiraCephSecretstatus, obtainsecretInfowith the Ceph client credentials :kubectl -n ceph-lcm-mirantis get mcsecret -o yaml
Example output:
status: secretInfo: clientSecrets: - name: rbd-client secretName: rook-ceph-client-rbd-client secretNamespace: rook-ceph - name: cephfs-1-client secretName: rook-ceph-client-cephfs-1-client secretNamespace: rook-ceph
Use
secretNameandsecretNamespaceto access the Ceph client credentials from a MOSK cluster:kubectl -n <secretNamespace> get secret <secretName> -o jsonpath='{.data.<clientName>}' | base64 -d; echo
Substitute the following parameters:
<secretNamespace>withsecretNamespacefrom the previous step<secretName>withsecretNamefrom the previous step<clientName>with the Ceph RBD or CephFS client name set inspec.clientstheMiraCephresource, for example,rbd-client
Example output:
AQAGHDNjxWYXJhAAjafCn3EtC6KgzgI1x4XDlg==
Using the obtained credentials, create two configuration files on the required workloads to connect them with Ceph pools or file systems:
/etc/ceph/ceph.conf:[default] mon_host = <mon1IP>:6789,<mon2IP>:6789,...,<monNIP>:6789
where
mon_hostare the comma-separated IP addresses with6789ports of the current Ceph Monitors. For example,10.10.0.145:6789,10.10.0.153:6789,10.10.0.235:6789./etc/ceph/ceph.client.<clientName>.keyring:[client.<clientName>] key = <cephClientCredentials>
<clientName>is a client name set inspec.clientsof theMiraCephresource. For example,rbd-client.<cephClientCredentials>are the client credentials obtained in the previous steps. For example,AQAGHDNjxWYXJhAAjafCn3EtC6KgzgI1x4XDlg==.
If the client
capsparameters containmon: allow r, verify the client access using the following command:ceph -n client.<clientName> -s
Edit the
MiraCephresource by removing the Ceph client fromspec.clients:kubectl -n ceph-lcm-mirantis edit miraceph
Wait for the client to be removed from the
MiraCephHealthstatus instatus.fullClusterInfo.blockStorageStatus.clientsStatus:kubectl -n ceph-lcm-mirantis get mchealth -o yaml
Manage Ceph Object Storage users
Warning
This procedure is valid for MOSK clusters that use the MiraCeph custom
resource (CR), which is available since MOSK 25.2 to replace the deprecated
KaaSCephCluster. For the equivalent procedure with the KaaSCephCluster
CR, refer to the following section:
The MiraCeph resource allows managing custom Ceph Object Storage
users. This section describes how to create, access, and remove Ceph Object
Storage users.
For all supported parameters of Ceph Object Storage users, refer to RADOS Gateway parameters.
Edit the
MiraCephresource by adding a new Ceph Object Storage user to thespecsection:kubectl -n ceph-lcm-mirantis edit miraceph
Example of adding the Ceph Object Storage user
user-a:Caution
For user
name, apply the UUID format with no capital letters.spec: objectStorage: rgw: objectUsers: - capabilities: bucket: '*' metadata: read user: read displayName: user-a name: userA quotas: maxBuckets: 10 maxSize: 10G
Wait for the created user to become ready in the
MiraCephHealthstatus:kubectl -n ceph-lcm-mirantis get miracephhealth -o yaml
Example output:
status: fullClusterInfo: objectStorageStatus: objectStoreUsers: user-a: present: true phase: Ready
Using the
MiraCephSecretstatus, obtainsecretInfowith the Ceph user credentials :kubectl -n ceph-lcm-mirantis get mcsecret -o yaml
Example output:
status: secretInfo: rgwUserSecrets: - name: user-a secretName: rook-ceph-object-user-<objstoreName>-<username> secretNamespace: rook-ceph
Substitute
<objstoreName>with a Ceph Object Storage name and<username>with a Ceph Object Storage user name.Use
secretNameandsecretNamespaceto access the Ceph Object Storage user credentials. The secret contains Amazon S3 access and secret keys.To obtain the user S3 access key:
kubectl -n <secretNamespace> get secret <secretName> -o jsonpath='{.data.AccessKey}' | base64 -d; echo
Substitute the following parameters in the commands above and below:
<secretNamespace>withsecretNamespacefrom the previous step<secretName>withsecretNamefrom the previous step
Example output:
D49G060HQ86U5COBTJ13
To obtain the user S3 secret key:
kubectl -n <secretNamespace> get secret <secretName> -o jsonpath='{.data.SecretKey}' | base64 -d; echo
Example output:
bpuYqIieKvzxl6nzN0sd7L06H40kZGXNStD4UNda
Configure the S3 client with the access and secret keys of the created user. You can access the S3 client using various tools such as s3cmd or awscli.
Edit the
MiraCephresource by removing the required Ceph Object Storage user fromspec.objectStorage.rgw.objectUsers:kubectl -n ceph-lcm-mirantis edit miraceph
Wait for the removed user to be removed from the
MiraCephHealthstatus instatus.fullClusterInfo.objectStorageStatus.objectStoreUsers:kubectl -n ceph-lcm-mirantis get mchealth -o yaml
Verify Ceph
Warning
This procedure is valid for MOSK clusters that use the MiraCeph custom
resource (CR), which is available since MOSK 25.2 to replace the deprecated
KaaSCephCluster. For the equivalent procedure with the KaaSCephCluster
CR, refer to the following section:
This section describes how to verify the components of a Ceph cluster after deployment. For troubleshooting, verify Ceph Controller and Rook logs as described in Verify Ceph Controller and Rook.
Verify the Ceph core services
Warning
This procedure is valid for MOSK clusters that use the MiraCeph custom
resource (CR), which is available since MOSK 25.2 to replace the deprecated
KaaSCephCluster. For the equivalent procedure with the KaaSCephCluster
CR, refer to the following section:
To confirm that all Ceph components including mon, mgr, osd, and
rgw have joined your cluster properly, analyze the logs for each pod and
verify the Ceph status:
kubectl -n rook-ceph exec -it deploy/rook-ceph-tools -- bash
ceph -s
Example of a positive system response:
cluster:
id: 4336ab3b-2025-4c7b-b9a9-3999944853c8
health: HEALTH_OK
services:
mon: 3 daemons, quorum a,b,c (age 20m)
mgr: a(active, since 19m)
osd: 6 osds: 6 up (since 16m), 6 in (since 16m)
rgw: 1 daemon active (miraobjstore.a)
data:
pools: 12 pools, 216 pgs
objects: 201 objects, 3.9 KiB
usage: 6.1 GiB used, 174 GiB / 180 GiB avail
pgs: 216 active+clean
Verify rook-discover
Warning
This procedure is valid for MOSK clusters that use the MiraCeph custom
resource (CR), which is available since MOSK 25.2 to replace the deprecated
KaaSCephCluster. For the equivalent procedure with the KaaSCephCluster
CR, refer to the following section:
To ensure that rook-discover is running properly, verify if the
local-device configmap has been created for each Ceph node specified
in the cluster configuration:
Obtain the list of local devices:
kubectl get configmap -n rook-ceph | grep local-device
Example of a system response:
local-device-01 1 30m local-device-02 1 29m local-device-03 1 30m
Verify that each device from the list contains information about available devices for the Ceph node deployment:
kubectl describe configmap local-device-01 -n rook-ceph
Example of a positive system response:
Name: local-device-01 Namespace: rook-ceph Labels: app=rook-discover rook.io/node=01 Annotations: <none> Data ==== devices: ---- [{"name":"vdd","parent":"","hasChildren":false,"devLinks":"/dev/disk/by-id/virtio-41d72dac-c0ff-4f24-b /dev/disk/by-path/virtio-pci-0000:00:09.0","size":32212254720,"uuid":"27e9cf64-85f4-48e7-8862-faa7270202ed","serial":"41d72dac-c0ff-4f24-b","type":"disk","rotational":true,"readOnly":false,"Partitions":null,"filesystem":"","vendor":"","model":"","wwn":"","wwnVendorExtension":"","empty":true,"cephVolumeData":"{\"path\":\"/dev/vdd\",\"available\":true,\"rejected_reasons\":[],\"sys_api\":{\"size\":32212254720.0,\"scheduler_mode\":\"none\",\"rotational\":\"1\",\"vendor\":\"0x1af4\",\"human_readable_size\":\"30.00 GB\",\"sectors\":0,\"sas_device_handle\":\"\",\"rev\":\"\",\"sas_address\":\"\",\"locked\":0,\"sectorsize\":\"512\",\"removable\":\"0\",\"path\":\"/dev/vdd\",\"support_discard\":\"0\",\"model\":\"\",\"ro\":\"0\",\"nr_requests\":\"128\",\"partitions\":{}},\"lvs\":[]}","label":""},{"name":"vdb","parent":"","hasChildren":false,"devLinks":"/dev/disk/by-path/virtio-pci-0000:00:07.0","size":67108864,"uuid":"988692e5-94ac-4c9a-bc48-7b057dd94fa4","serial":"","type":"disk","rotational":true,"readOnly":false,"Partitions":null,"filesystem":"","vendor":"","model":"","wwn":"","wwnVendorExtension":"","empty":true,"cephVolumeData":"{\"path\":\"/dev/vdb\",\"available\":false,\"rejected_reasons\":[\"Insufficient space (\\u003c5GB)\"],\"sys_api\":{\"size\":67108864.0,\"scheduler_mode\":\"none\",\"rotational\":\"1\",\"vendor\":\"0x1af4\",\"human_readable_size\":\"64.00 MB\",\"sectors\":0,\"sas_device_handle\":\"\",\"rev\":\"\",\"sas_address\":\"\",\"locked\":0,\"sectorsize\":\"512\",\"removable\":\"0\",\"path\":\"/dev/vdb\",\"support_discard\":\"0\",\"model\":\"\",\"ro\":\"0\",\"nr_requests\":\"128\",\"partitions\":{}},\"lvs\":[]}","label":""},{"name":"vdc","parent":"","hasChildren":false,"devLinks":"/dev/disk/by-id/virtio-e8fdba13-e24b-41f0-9 /dev/disk/by-path/virtio-pci-0000:00:08.0","size":32212254720,"uuid":"190a50e7-bc79-43a9-a6e6-81b173cd2e0c","serial":"e8fdba13-e24b-41f0-9","type":"disk","rotational":true,"readOnly":false,"Partitions":null,"filesystem":"","vendor":"","model":"","wwn":"","wwnVendorExtension":"","empty":true,"cephVolumeData":"{\"path\":\"/dev/vdc\",\"available\":true,\"rejected_reasons\":[],\"sys_api\":{\"size\":32212254720.0,\"scheduler_mode\":\"none\",\"rotational\":\"1\",\"vendor\":\"0x1af4\",\"human_readable_size\":\"30.00 GB\",\"sectors\":0,\"sas_device_handle\":\"\",\"rev\":\"\",\"sas_address\":\"\",\"locked\":0,\"sectorsize\":\"512\",\"removable\":\"0\",\"path\":\"/dev/vdc\",\"support_discard\":\"0\",\"model\":\"\",\"ro\":\"0\",\"nr_requests\":\"128\",\"partitions\":{}},\"lvs\":[]}","label":""}]
Verify Ceph cluster state
Warning
This procedure is valid for MOSK clusters that use the MiraCeph custom
resource (CR), which is available since MOSK 25.2 to replace the deprecated
KaaSCephCluster. For the equivalent procedure with the KaaSCephCluster
CR, refer to the following section:
Verifying Ceph cluster state is an entry point for issues investigation.
This section describes how to verify Ceph state using MiraCeph,
MiraCephHealth, and MiraCephSecret resources.
Warning
This procedure is valid for MOSK clusters that use the MiraCeph custom
resource (CR), which is available since MOSK 25.2 to replace the deprecated
KaaSCephCluster. For the equivalent procedure with the KaaSCephCluster
CR, refer to the following section:
To verify the state of a Ceph cluster, Ceph Controller provides statuses to
MiraCeph and MiraCephHealth objects. These resources contain
information about the state of the Ceph cluster components, their health, and
potentially problematic components.
To verify the Ceph cluster state from a MOSK cluster:
Obtain
kubeconfigof a MOSK cluster and provide it as an environment variable:export KUBECONFIG=<pathToManagedKubeconfig>
Obtain the
MiraCephresource in the YAML format:kubectl -n ceph-lcm-mirantis get miraceph -o yaml
Information from
MiraCeph.statusreflects the spec handling state and validation result. For description of status fields, see MiraCeph status parameters.Obtain the
MiraCephHealthresource in the YAML format:kubectl -n ceph-lcm-mirantis get mchealth -o yaml
Information from
MiraCephHealth.statuscontains extensive details about Ceph cluster and a shortened version with status summary. For description of status fields, see MiraCephHealth status high-level parameters.
Warning
This procedure is valid for MOSK clusters that use the MiraCeph custom
resource (CR), which is available since MOSK 25.2 to replace the deprecated
KaaSCephCluster. For the equivalent procedure with the KaaSCephCluster
CR, refer to the following section:
Сeph cluster status is collected in three main resources:
MiraCephstatus contains validation and current step statuses of spec reconcile.MiraCephHealthallows you to verify the current health of a Ceph cluster and identify potentially problematic components.MiraCephSecretallows you to obtain the current secret refs to access Ceph storage. For details, refer to Manage Ceph RBD or CephFS clients and RGW users.
This section describes status parameters for these resources. To view
MiraCephHealth or MiraCephSecret, perform the steps described in
Verify Ceph cluster state.
Field |
Description |
|---|---|
|
Current handling phase of the applied Ceph cluster spec. Can equal to
|
|
Detailed description of the current phase or an error message if the phase
is |
|
|
|
Current Ceph cluster version, for example, |
|
Validation result ( validation:
result: Succeed or Failed
messages: ["error", "messages", "list"]
lastValidatedGeneration: <metadata.generation>
|
Field |
Description |
|---|---|
|
Complete information about Ceph cluste including cluster, Ceph resources,
and daemon health. It helps reveal potentially problematic components.
For |
|
|
|
|
|
List of strings of all issues found during cluster state check. |
|
Number of |
|
Cluster state that can be |
Field |
Description |
|---|---|
|
General information from Rook about the Ceph cluster health and current state. Contains the following fields: clusterStatus:
state: <rook ceph cluster common status>
phase: <rook ceph cluster spec reconcile phase>
message: <rook ceph cluster phase details>
conditions: <history of rook ceph cluster
reconcile steps>
ceph: <ceph cluster health>
storage:
deviceClasses: <list of used device classes
in ceph cluster>
version:
image: <ceph image used in ceph cluster>
version: <ceph version of ceph cluster>
|
|
Status of the Rook Ceph Operator pod that is |
|
Map of statuses for each Ceph cluster daemon type. Indicates the
expected and actual number of Ceph daemons on the cluster. Available
daemon types are: daemonsStatus:
<daemonType>:
status: <daemons status>
running: <number of running daemons with
details>
For example: daemonsStatus:
mgr:
running: a is active mgr ([] standBy)
status: Ok
mon:
running: '3/3 mons running: [a c d] in quorum'
status: Ok
osd:
running: '4/4 running: 4 up, 4 in'
status: Ok
rgw:
running: 2/2 running
([openstack.store.a openstack.store.b])
status: Ok
|
|
State of the Ceph cluster block storage resources. Includes the following fields:
|
|
State of the Ceph cluster object storage resources. Includes the following fields:
|
|
Verbose details of the Ceph cluster state. Contains the cephDetails:
diskUsage:
deviceClass:
<deviceClass>:
# The amount of raw storage consumed by user data (excluding bluestore database).
bytesUsed: "<number>"
# The amount of free space available in the cluster.
bytesAvailable: "<number>"
# The amount of storage capacity managed by the cluster.
bytesTotal: "<number>"
pools:
<poolName>:
# The space allocated for a pool over all OSDs. This includes replication,
# allocation granularity, and erasure-coding overhead. Compression savings
# and object content gaps are also taken into account. BlueStore database
# is not included in this amount.
bytesUsed: "<number>"
# The notional percentage of storage used per pool.
usedPercentage: "<number>"
# Number calculated with the formula: bytesTotal - bytesUsed.
bytesAvailable: "<number>"
# An estimate of the notional amount of data that can be written to this pool.
bytesTotal: "<number>"
|
|
Contains information, similar to the cephCSIPluginDaemonsStatus:
<csiPlugin>:
running: <number of running daemons with details>
status: <csi plugin status>
For example: cephCSIPluginDaemonsStatus:
csi-rbdplugin:
running: 1/3 running
status: Some csi-rbdplugin daemons are not ready
csi-cephfsplugin:
running: 3/3 running
status: Ok
|
Field |
Description |
|---|---|
|
Current state of the secret collector on the Ceph cluster:
|
|
|
|
|
|
List of secrets for Ceph clients and RADOS Gateway users:
For example: lastSecretCheck: "2022-09-05T07:05:35Z"
lastSecretUpdate: "2022-09-05T06:02:00Z"
secretInfo:
clientSecrets:
- name: client.admin
secretName: rook-ceph-admin-keyring
secretNamespace: rook-ceph
state: Ready
|
|
List of error or warning messages, if any, found when collecting information about the Ceph cluster. |
Verify Ceph Controller and Rook
Warning
This procedure is valid for MOSK clusters that use the MiraCeph custom
resource (CR), which is available since MOSK 25.2 to replace the deprecated
KaaSCephCluster. For the equivalent procedure with the KaaSCephCluster
CR, refer to the following section:
The starting point for Ceph troubleshooting is the ceph-controller and
rook-operator logs. Once you locate the component that causes issues,
verify the logs of the related pod. This section describes how to verify the
Ceph Controller and Rook objects of a Ceph cluster.
To verify Ceph Controller and Rook:
Verify that the status of each pod in the
ceph-lcm-mirantisandrook-cephnamespaces isRunning:For
ceph-lcm-mirantis:kubectl -n ceph-lcm-mirantis get pod
For
rook-ceph:kubectl -n rook-ceph get pod
Verify Ceph Controller that prepares the configuration for Rook to deploy the Ceph cluster, which is managed using the
MiraCephresource.List the pods:
kubectl -n ceph-lcm-mirantis get pods
Verify the logs of the required pod:
kubectl -n ceph-lcm-mirantis logs <ceph-controller-pod-name>
Verify the configuration:
kubectl -n ceph-lcm-mirantis get miraceph -o yaml
If Rook cannot finish the deployment, verify the Rook Operator logs as described in the following step.
Verify the Rook Operator logs. Rook deploys a Ceph cluster based on custom resources created by the Ceph Controller, such as pools, clients,
cephcluster, and so on. Rook logs contain details about components orchestration.Verify the Rook Operator logs:
kubectl -n rook-ceph logs -l app=rook-ceph-operator
Verify the
CephClusterconfiguration:Note
The Ceph Controller manages the
CephClusterCR. Use theCephClusterCR only for verification and do not modify it manually.kubectl get cephcluster -n rook-ceph -o yaml
For details about the Ceph cluster status and to get access to CLI tools, connect to the
ceph-toolspod as described in the following step.Verify the
ceph-toolspod:Execute the
ceph-toolspod:kubectl -n rook-ceph exec -it deploy/rook-ceph-tools -- bash
Verify that CLI commands can run on the
ceph-toolspod:ceph -s
Verify hardware:
Through the
ceph-toolspod, obtain the required device in your cluster:ceph osd tree
Enter all Ceph OSD pods in the
rook-cephnamespace one by one:kubectl exec -it -n rook-ceph <osd-pod-name> bash
Verify that the
ceph-volumetool is available on all pods running on the target node:ceph-volume lvm list
Verify data access. Ceph volumes can be consumed directly by Kubernetes workloads and internally, for example, by OpenStack services. To verify the Kubernetes storage:
Verify the available storage classes. The storage classes that are automatically managed by Ceph Controller use the
rook-ceph.rbd.csi.ceph.comprovisioner.kubectl get storageclass
Example of system response:
NAME PROVISIONER RECLAIMPOLICY VOLUMEBINDINGMODE ALLOWVOLUMEEXPANSION AGE kubernetes-ssd (default) rook-ceph.rbd.csi.ceph.com Delete Immediate false 55m stacklight-alertmanager-data kubernetes.io/no-provisioner Delete WaitForFirstConsumer false 55m stacklight-elasticsearch-data kubernetes.io/no-provisioner Delete WaitForFirstConsumer false 55m stacklight-postgresql-db kubernetes.io/no-provisioner Delete WaitForFirstConsumer false 55m stacklight-prometheus-data kubernetes.io/no-provisioner Delete WaitForFirstConsumer false 55m
Verify that volumes are properly connected to the Pod:
Obtain the list of volumes in all namespaces or use a particular one:
kubectl get persistentvolumeclaims -A
Example of system response:
NAMESPACE NAME STATUS VOLUME CAPACITY ACCESS MODES STORAGECLASS AGE rook-ceph app-test Bound pv-test 1Gi RWO kubernetes-ssd 11m
For each volume, verify the connection. For example:
kubectl describe pvc app-test -n rook-ceph
Example of a positive system response:
Name: app-test Namespace: kaas StorageClass: rook-ceph Status: Bound Volume: pv-test Labels: <none> Annotations: pv.kubernetes.io/bind-completed: yes pv.kubernetes.io/bound-by-controller: yes volume.beta.kubernetes.io/storage-provisioner: rook-ceph.rbd.csi.ceph.com Finalizers: [kubernetes.io/pvc-protection] Capacity: 1Gi Access Modes: RWO VolumeMode: Filesystem Events: <none>
In case of connection issues, inspect the Pod description for the volume information:
kubectl describe pod <crashloopbackoff-pod-name>
Example of system response:
... Events: FirstSeen LastSeen Count From SubObjectPath Type Reason Message --------- -------- ----- ---- ------------- -------- ------ ------- 1h 1h 3 default-scheduler Warning FailedScheduling PersistentVolumeClaim is not bound: "app-test" (repeated 2 times) 1h 35s 36 kubelet, 172.17.8.101 Warning FailedMount Unable to mount volumes for pod "wordpress-mysql-918363043-50pjr_default(08d14e75-bd99-11e7-bc4c-001c428b9fc8)": timeout expired waiting for volumes to attach/mount for pod "default"/"wordpress-mysql-918363043-50pjr". list of unattached/unmounted volumes=[mysql-persistent-storage] 1h 35s 36 kubelet, 172.17.8.101 Warning FailedSync Error syncing pod
Verify that the CSI provisioner plugins started properly and are in the
Runningstatus:Obtain the list of CSI provisioner plugins:
kubectl -n rook-ceph get pod -l app=csi-rbdplugin-provisioner
Verify the logs of the required CSI provisioner:
kubectl logs -n rook-ceph <csi-provisioner-plugin-name> csi-provisioner
Enable management of Ceph tolerations and resources
Warning
This procedure is valid for MOSK clusters that use the MiraCeph custom
resource (CR), which is available since MOSK 25.2 to replace the deprecated
KaaSCephCluster. For the equivalent procedure with the KaaSCephCluster
CR, refer to the following section:
This section describes how to configure Ceph Controller to manage Ceph node resources.
Enable management of Ceph tolerations and resources
Warning
This procedure is valid for MOSK clusters that use the MiraCeph custom
resource (CR), which is available since MOSK 25.2 to replace the deprecated
KaaSCephCluster. For the equivalent procedure with the KaaSCephCluster
CR, refer to the following section:
Warning
This document does not provide any specific recommendations on requests and limits for Ceph resources. The document stands for a native Ceph resources configuration for any cluster with MOSK.
You can configure Ceph Controller to manage Ceph resources by specifying their requirements and constraints. To configure the resources consumption for Ceph nodes, consider the following options that are based on different Helm release configuration values:
Configuring tolerations for taint nodes for the Ceph Monitor, Ceph Manager, and Ceph OSD daemons. For details, see Taints and Tolerations.
Configuring node resource requests or limits for the Ceph daemons and for each Ceph OSD device class such as HDD, SSD, or NVMe. For details, see Managing Resources for Containers.
To enable management of Ceph tolerations and resources:
To avoid Ceph cluster health issues during daemon configuration changes, set Ceph
noout,nobackfill,norebalance, andnorecoverflags through theceph-toolspod before editing Ceph tolerations and resources:kubectl -n rook-ceph exec deploy/rook-ceph-tools -- bash ceph osd set noout ceph osd set nobackfill ceph osd set norebalance ceph osd set norecover exit
Note
Skip this step if you are only configuring the PG rebalance timeout and replicas count parameters.
Edit the
MiraCephresource of a MOSK cluster:kubectl -n ceph-lcm-mirantis edit miraceph
Substitute
<moskClusterProjectName>with the project name of the required MOSK cluster.Specify the parameters in the
hyperconvergesection as required. Thehyperconvergesection includes the following parameters:tolerationsSpecifies tolerations for taint nodes for the defined daemon type. Each daemon type key contains the following parameters:
hyperconverge: tolerations: <daemonType>: rules: - key: "" operator: "" value: "" effect: "" tolerationSeconds: 0
Possible values for
<daemonType>areosd,mon,mgr, andrgw. The following values are also supported:all- specifies general toleration rules for all daemons if no separate daemon rule is specified.mds- specifies the CephFS Metadata Server daemons.
Example configuration
hyperconverge: tolerations: mon: rules: - effect: NoSchedule key: node-role.kubernetes.io/controlplane operator: Exists mgr: rules: - effect: NoSchedule key: node-role.kubernetes.io/controlplane operator: Exists osd: rules: - effect: NoSchedule key: node-role.kubernetes.io/controlplane operator: Exists rgw: rules: - effect: NoSchedule key: node-role.kubernetes.io/controlplane operator: Exists
resourcesSpecifies resources requests or limits. The parameter is a map with the daemon type as a key and the following structure as a value:
hyperconverge: resources: <daemonType>: requests: <kubernetes valid spec of daemon resource requests> limits: <kubernetes valid spec of daemon resource limits>
Possible values for
<daemonType>aremon,mgr,osd,osd-hdd,osd-ssd,osd-nvme,prepareosd,rgw, andmds. Theosd-hdd,osd-ssd, andosd-nvmeresource requirements handle only the Ceph OSDs with a corresponding device class.Example configuration
hyperconverge: resources: mon: requests: memory: 1Gi cpu: 2 limits: memory: 2Gi cpu: 3 mgr: requests: memory: 1Gi cpu: 2 limits: memory: 2Gi cpu: 3 osd: requests: memory: 1Gi cpu: 2 limits: memory: 2Gi cpu: 3 osd-hdd: requests: memory: 1Gi cpu: 2 limits: memory: 2Gi cpu: 3 osd-ssd: requests: memory: 1Gi cpu: 2 limits: memory: 2Gi cpu: 3 osd-nvme: requests: memory: 1Gi cpu: 2 limits: memory: 2Gi cpu: 3
For the Ceph node-specific resource settings, specify the
resourcessection in the correspondingnodesspec ofMiraCeph:spec: nodes: - name: <nodeName> resources: requests: <kubernetes valid spec of daemon resource requests> limits: <kubernetes valid spec of daemon resource limits>
Substitute
<nodeName>with the node requested for specific resources. For example:spec: nodes: - name: kaas-node-worker-1 resources: requests: memory: 1Gi cpu: 2 limits: memory: 2Gi cpu: 3
For the RADOS Gateway instances specific resource settings, specify the
resourcessection in thergwspec ofMiraCeph:spec: objectStorage: rgw: gateway: resources: requests: <kubernetes valid spec of daemon resource requests> limits: <kubernetes valid spec of daemon resource limits>
For example:
spec: objectStorage: rgw: gateway: resources: requests: memory: 1Gi cpu: 2 limits: memory: 2Gi cpu: 3
Save the reconfigured
MiraCephresource and wait forceph-controllerto apply the updated Ceph configuration. It will recreate Ceph Monitors, Ceph Managers, or Ceph OSDs according to the specifiedhyperconvergeconfiguration.If you have specified any
osdtolerations, additionally specify tolerations for therookinstances:Open the
Clusterresource of the required Ceph cluster on a management cluster:kubectl -n <ClusterProjectName> edit cluster
Substitute
<ClusterProjectName>with the project name of the required cluster.Specify the parameters in the
ceph-controllersection ofspec.providerSpec.value.helmReleases:Specify the
hyperconverge.tolerations.rookparameter as required:hyperconverge: tolerations: rook: | <yamlFormattedKubernetesTolerations>
In
<yamlFormattedKubernetesTolerations>, specify YAML-formatted tolerations fromhyperconverge.tolerations.osd.rulesof theMiraCephspec. For example:hyperconverge: tolerations: rook: | - effect: NoSchedule key: node-role.kubernetes.io/controlplane operator: Exists
In
controllers.cephRequest.parameters.pgRebalanceTimeoutMin, specify the PG rebalance timeout for requests. The default is30minutes. For example:controllers: cephRequest: parameters: pgRebalanceTimeoutMin: 35
In
controllers.cephController.replicas,controllers.cephRequest.replicas, andcontrollers.cephStatus.replicas, specify the replica count. The default is3replicas. For example:controllers: cephController: replicas: 1 cephRequest: replicas: 1 cephStatus: replicas: 1
Save the reconfigured
Clusterresource and wait for theceph-controllerHelm release update. It will recreate Ceph CSI and discover pods according to the specifiedhyperconverge.tolerations.rookconfiguration.
Specify tolerations for different Rook resources using the following chart-based options:
hyperconverge.tolerations.rook- general toleration rules for each Rook service if no exact rules specifiedhyperconverge.tolerations.csiplugin- for tolerations of theceph-csiplugins DaemonSetshyperconverge.tolerations.csiprovisioner- for theceph-csiprovisioner deployment tolerationshyperconverge.nodeAffinity.csiprovisioner- provides theceph-csiprovisioner node affinity with avaluesection
After a successful Ceph reconfiguration, unset the flags set in step 1 through the
ceph-toolspod:kubectl -n rook-ceph exec -it deploy/rook-ceph-tools -- bash ceph osd unset ceph osd unset noout ceph osd unset nobackfill ceph osd unset norebalance ceph osd unset norecover exit
Note
Skip this step if you have only configured the PG rebalance timeout and replicas count parameters.
Once done, proceed to Verify Ceph tolerations and resources.
Verify Ceph tolerations and resources
Warning
This procedure is valid for MOSK clusters that use the MiraCeph custom
resource (CR), which is available since MOSK 25.2 to replace the deprecated
KaaSCephCluster. For the equivalent procedure with the KaaSCephCluster
CR, refer to the following section:
After you enable Ceph resources management as described in Enable management of Ceph tolerations and resources, perform the steps below to verify that the configured tolerations, requests, or limits have been successfully specified in the Ceph cluster.
To verify Ceph tolerations and resources:
To verify that the required tolerations are specified in the Ceph cluster, inspect the output of the following commands:
kubectl -n rook-ceph get $(kubectl -n rook-ceph get cephcluster -o name) -o jsonpath='{.spec.placement.mon.tolerations}' kubectl -n rook-ceph get $(kubectl -n rook-ceph get cephcluster -o name) -o jsonpath='{.spec.placement.mgr.tolerations}' kubectl -n rook-ceph get $(kubectl -n rook-ceph get cephcluster -o name) -o jsonpath='{.spec.placement.osd.tolerations}'
To verify RADOS Gateway tolerations:
kubectl -n rook-ceph get $(kubectl -n rook-ceph get cephobjectstore -o name) -o jsonpath='{.spec.gateway.placement.tolerations}'
To verify that the required resource requests or limits are specified for the Ceph
mon,mgr, orosddaemons, inspect the output of the following command:kubectl -n rook-ceph get $(kubectl -n rook-ceph get cephcluster -o name) -o jsonpath='{.spec.resources}'
To verify that the required resource requests and limits are specified for the RADOS Gateway daemons, inspect the output of the following command:
kubectl -n rook-ceph get $(kubectl -n rook-ceph get cephobjectstore -o name) -o jsonpath='{.spec.gateway.resources}'
To verify that the required resource requests or limits are specified for the Ceph OSDs
hdd,ssd, ornvmedevice classes, perform the following steps:Identify which Ceph OSDs belong to the
<deviceClass>device class in question:kubectl -n rook-ceph exec -it deploy/rook-ceph-tools -- ceph osd crush class ls-osd <deviceClass>
For each
<osdID>obtained in the previous step, run the following command. Compare the output with the desired result.kubectl -n rook-ceph get deploy rook-ceph-osd-<osdID> -o jsonpath='{.spec.template.spec.containers[].resources}'
Enable Ceph multinetwork
Warning
This procedure is valid for MOSK clusters that use the MiraCeph custom
resource (CR), which is available since MOSK 25.2 to replace the deprecated
KaaSCephCluster. For the equivalent procedure with the KaaSCephCluster
CR, refer to the following section:
Ceph allows establishing multiple IP networks and subnet masks for clusters
with configured L3 network rules. You can configure multi-network through the
network section of the MiraCeph CR. Ceph Controller uses this section
to specify the Ceph networks for external access and internal daemon
communication. The parameters in the network section use the CIDR notation,
for example, 10.0.0.0/24.
Before enabling multiple networks for a Ceph cluster, consider the following requirements:
Do not confuse the IP addresses you define with the public-facing IP addresses the network clients may use to access the services.
If you define more than one IP address and subnet mask for the public or cluster network, ensure that the subnets within the network can route to each other.
Include each IP address or subnet in the
networksection to IP tables and open ports for them as necessary.The pods of the Ceph OSD and RadosGW daemons use cross-pods health checkers to verify that the entire Ceph cluster is healthy. Therefore, each CIDR must be accessible inside Ceph pods.
Avoid using the
0.0.0.0/0CIDR in thenetworksection. With a zero range inpublicNetand/orclusterNet, the Ceph daemons behavior is unpredictable.
To enable multinetwork for Ceph:
Select from the following options:
If the Ceph cluster is not deployed on a MOSK cluster yet, edit the deployment
MiraCephYAML template.If the Ceph cluster is already deployed on a MOSK cluster, open
MiraCephfor editing:kubectl -n ceph-lcm-mirantis edit miraceph
In the
clusterNetand/orpublicNetparameters of thenetworksection, define a comma-separated array of CIDRs. For example:network: publicNet: 10.12.0.0/24,10.13.0.0/24 clusterNet: 10.10.0.0/24,10.11.0.0/24
Select from the following options:
If you are creating a MOSK cluster, save the updated
MiraCephtemplate to the corresponding file and proceed with the MOSK cluster creation.If you are configuring
MiraCephof an existing MOSK cluster, exiting the text editor will apply the changes.
Once done, the specified network CIDRs will be passed to the Ceph daemons pods
through the rook-config-override ConfigMap.
Enable Ceph RBD mirroring
TechPreview
Warning
This procedure is valid for MOSK clusters that use the MiraCeph custom
resource (CR), which is available since MOSK 25.2 to replace the deprecated
KaaSCephCluster. For the equivalent procedure with the KaaSCephCluster
CR, refer to the following section:
This section describes how to configure and use RADOS Block Device (RBD)
mirroring for Ceph pools using the rbdMirror section in the
MiraCeph CR. The feature may be useful if, for example, you have
two interconnected MOSK clusters. Once you enable RBD
mirroring, the images in the specified pools will be replicated and if a
cluster becomes unreachable, the second one will provide users with instant
access to all images. For details, see Ceph Documentation: RBD Mirroring.
Note
Ceph Controller only supports bidirectional mirroring.
To enable Ceph RBD monitoring, follow the procedure below and use the following
rbdMirror parameters description:
Parameter |
Description |
|---|---|
|
Count of |
|
Optional. List of mirroring peers of an external cluster to connect to.
Only a single peer is supported. The
|
To enable Ceph RBD mirroring:
In
MiraCephCRs of both Ceph clusters where you want to enable mirroring, specify positivedaemonsCountin therbdMirrorsection:rbdMirror: daemonsCount: 1
On both Ceph clusters where you want to enable mirroring, wait for the Ceph RBD Mirror daemons to start running:
kubectl -n rook-ceph get pod -l app=rook-ceph-rbd-mirror
In
MiraCephCRs of both Ceph clusters where you want to enable mirroring, specify thepools.mirroring.modeparameter for allpoolsthat must be mirrored.Mirroring mode recommendations
Mirantis recommends using the
poolmode for mirroring. For thepoolmode, explicitly enable journaling for each image.To use the
imagemirroring mode, explicitly enable mirroring as described in the step 8.
pools: - name: image-hdd ... mirroring: mode: pool - name: volumes-hdd ... mirroring: mode: pool
Obtain the name of an external site to mirror with. On pools with mirroring enabled, the name is typically
ceph fsid:kubectl -n rook-ceph exec -it deploy/rook-ceph-tools -- rbd mirror pool info <mirroringPoolName> # or kubectl -n rook-ceph exec -it deploy/rook-ceph-tools -- ceph fsid
Substitute
<mirroringPoolName>with the name of a pool to be mirrored.On an external site to mirror with, create a new bootstrap peer token. Execute the following command within the
ceph-toolspod CLI:kubectl -n rook-ceph exec -it deploy/rook-ceph-tools -- rbd mirror pool peer bootstrap create <mirroringPoolName> --site-name <siteName>
Substitute
<mirroringPoolName>with the name of a pool to be mirrored. In<siteName>, assign a label for the external Ceph cluster that will be used along with mirroring.For details, see Ceph documentation: Bootstrap peers.
In
MiraCephCR on the cluster that should mirror pools, specifyrbdMirror.peerswith the obtained peer and pools to mirror:rbdMirror: ... peers: - site: <siteName> token: <bootstrapPeer> pools: [<mirroringPoolName1>, <mirroringPoolName2>, ...]
Substitute
<siteName>with the label assigned to the external Ceph cluster,<bootstrapPeer>with the token obtained in the previous step, and<mirroringPoolName>with names of pools that have themirroring.modeparameter defined.For example:
rbdMirror: ... peers: - site: cluster-b token: <base64-string> pools: - images-hdd - volumes-hdd - special-pool-ssd
Verify that mirroring is enabled and each pool with
pools.mirroring.modedefined has an external peer site:kubectl -n rook-ceph exec -it deploy/rook-ceph-tools -- rbd mirror pool info <mirroringPoolName>
Substitute
<mirroringPoolName>with the name of a pool with mirroring enabled.If you have set the
imagemirroring mode in thepoolssection, explicitly enable mirroring for each image withrbdwithin the pool:kubectl -n rook-ceph exec -it deploy/rook-ceph-tools -- rbd mirror image enable <poolName>/<imageName> <imageMirroringMode>
Substitute
<poolName>with the name of a pool with theimagemirroring mode,<imageName>with the name of an image stored in the specified pool. Substitute<imageMirroringMode>with one of:journal- for mirroring to use the RBD journaling image feature to replicate the image contents. If the RBD journaling image feature is not yet enabled on the image, it will be enabled automatically.snapshot- for mirroring to use RBD image mirror-snapshots to replicate the image contents. Once enabled, an initial mirror-snapshot will automatically be created. To create additional RBD image mirror-snapshots, use the rbd command.
For details, see Ceph Documentation: Enable image mirroring.
Specify placement of Ceph cluster daemons
Warning
This procedure is valid for MOSK clusters that use the MiraCeph custom
resource (CR), which is available since MOSK 25.2 to replace the deprecated
KaaSCephCluster. For the equivalent procedure with the KaaSCephCluster
CR, refer to the following section:
If you need to configure the placement of Rook daemons on nodes, you can add
extra values in the Cluster providerSpec section of the
ceph-controller Helm release.
The procedures in this section describe how to specify the placement of
rook-ceph-operator, rook-discover, and csi-rbdplugin.
To specify rook-ceph-operator placement:
On the management cluster, edit the
Clusterresource of the target MOSK cluster:kubectl -n <moskClusterProjectName> edit cluster
Add the following parameters to the
ceph-controllerHelm release values:spec: providerSpec: value: helmReleases: - name: ceph-controller values: rookOperatorPlacement: affinity: <rookOperatorAffinity> nodeSelector: <rookOperatorNodeSelector> tolerations: <rookOperatorTolerations>
<rookOperatorAffinity>is a key-value mapping that contains a valid Kubernetesaffinityspecification<rookOperatorNodeSelector>is a key-value mapping that contains a valid KubernetesnodeSelectorspecification<rookOperatorTolerations>is a list that contains valid Kubernetestolerationitems
Wait for some time and verify on the MOSK cluster that the changes have applied:
kubectl -n rook-ceph get deploy rook-ceph-operator -o yaml
To specify rook-discover and csi-rbdplugin placement simultaneously:
On the management cluster, edit the required
Clusterresource:kubectl -n <moskClusterProjectName> edit cluster
Add the following parameters to the
ceph-controllerHelm release values:spec: providerSpec: value: helmReleases: - name: ceph-controller values: rookExtraConfig: extraDaemonsetLabels: <labelSelector>
Substitute
<labelSelector>with a valid Kubernetes label selector expression to place therook-discoverandcsi-rbdpluginDaemonSet pods.Wait for some time and verify on the MOSK cluster that the changes have applied:
kubectl -n rook-ceph get ds rook-discover -o yaml kubectl -n rook-ceph get ds csi-rbdplugin -o yaml
To specify rook-discover and csi-rbdplugin placement separately:
On the management cluster, edit the required
Clusterresource:kubectl -n <moskClusterProjectName> edit cluster
If required, add the following parameters to the
ceph-controllerHelm release values:spec: providerSpec: value: helmReleases: - name: ceph-controller values: hyperconverge: nodeAffinity: csiplugin: <labelSelector1> rookDiscover: <labelSelector2>
Substitute
<labelSelectorX>with a valid Kubernetes label selector expression to place therook-discoverandcsi-rbdpluginDaemonSet pods. For example,"role=storage-node; discover=true".Wait for some time and verify on the MOSK cluster that the changes have applied:
kubectl -n rook-ceph get ds rook-discover -o yaml kubectl -n rook-ceph get ds csi-rbdplugin -o yaml
Migrate Ceph pools from one failure domain to another
Warning
This procedure is valid for MOSK clusters that use the MiraCeph custom
resource (CR), which is available since MOSK 25.2 to replace the deprecated
KaaSCephCluster. For the equivalent procedure with the KaaSCephCluster
CR, refer to the following section:
The document describes how to change the failure domain of an already deployed Ceph cluster.
Note
This document focuses on changing the failure domain from a smaller
to wider one, for example, from host to rack. Using the same
instruction, you can move the failure domain from a wider to smaller scale.
Caution
Data movement implies the Ceph cluster rebalancing that may impact cluster performance, depending on the cluster size.
High-level overview of the procedure includes the following steps:
Set correct labels on the nodes.
Create the new bucket hierarchy.
Move nodes to new buckets.
Modify the CRUSH rules.
Add the manual changes to the
MiraCephspec.Scale the Ceph controllers.
Prerequisites
Verify that the Ceph cluster has enough space for multiple copies of data to migrate. Mirantis highly recommends that the Ceph cluster has a minimum of 25% of free space for the procedure to succeed.
Note
The migration procedure implies data movement and optional modification of CRUSH rules that cause a large amount of data (depending on the cluster size) to be first copied to a new location in the Ceph cluster before data removal.
Create a backup of the current
MiraCephobject from the MOSK cluster:kubectl -n ceph-lcm-mirantis get miraceph -o yaml > mc-backup.yaml
In the
rook-ceph-toolspod on a MOSK cluster, obtain a backup of the CRUSH map:ceph osd getcrushmap -o /tmp/crush-map-orig crushtool -d /tmp/crush-map-orig -o /tmp/crush-map-orig.txt
Migrate Ceph pools
This procedure contains an example of moving failure domains of all pools from
host to rack. Using the same instruction, you can migrate pools from
other types of failure domains, migrate pools separately, and so on.
To migrate Ceph pools from one failure domain to another:
Set the required CRUSH topology in the
MiraCephobject for each defined node. For details on thecrushparameter, see Node parameters.Setting the CRUSH topology to each node causes the Ceph Controller to set proper Kubernetes labels on the nodes.
Example of adding the
rackCRUSH topology key for each node in thenodessectionspec: nodes: machine1: crush: rack: rack-1 machine2: crush: rack: rack-1 machine3: crush: rack: rack-2 machine4: crush: rack: rack-2 machine5: crush: rack: rack-3 machine6: crush: rack: rack-3
On the MOSK cluster, verify that the required buckets and bucket types are present in the Ceph hierarchy:
Enter the
ceph-toolspod:kubectl -n rook-ceph exec -it deploy/rook-ceph-tools -- bash
Verify that the required bucket type is present by default:
ceph osd getcrushmap -o /tmp/crush-map crushtool -d /tmp/crush-map -o /tmp/crush-map.txt cat /tmp/crush-map.txt # Look for the section named → “# types”
Example of system response:
# types type 0 osd type 1 host type 2 chassis type 3 rack type 4 row type 5 pdu type 6 pod type 7 room type 8 datacenter type 9 zone type 10 region type 11 root
Verify that the buckets with the required bucket type are present:
cat /tmp/crush-map.txt # Look for the section named → “# buckets”
Example of system response of an existing
rackbucket:# buckets rack rack-1 { id -15 id -16 class hdd # weight 0.00000 alg straw2 hash 0 }
If the required buckets are not created, create new ones with the required bucket type:
ceph osd crush add-bucket <bucketName> <bucketType> root=default
For example:
ceph osd crush add-bucket rack-1 rack root=default ceph osd crush add-bucket rack-2 rack root=default ceph osd crush add-bucket rack-3 rack root=default
Exit the
ceph-toolspod.
Optional. Order buckets as required:
On the MOSK cluster, add the first Ceph CRUSH smaller bucket to its respective wider bucket:
kubectl -n rook-ceph exec -it deploy/rook-ceph-tools -- bash ceph osd crush move <smallerBucketName> <bucketType>=<widerBucketName>
Substitute the following parameters:
<smallerBucketName>with the name of the smaller bucket, for example host name<bucketType>with the required bucket type, for examplerack<widerBucketName>with the name of the wider bucket, for example rack name
For example:
ceph osd crush move kaas-node-1 rack=rack-1 root=default
Warning
Mirantis highly recommends moving one bucket at a time.
For more details, refer to official Ceph documentation: CRUHS Maps: Moving a bucket.
After the bucket is moved to the new location in the CRUSH hierarchy, verify that no data rebalancing occurs:
ceph -sCaution
Wait for rebalancing to complete before proceeding to the next step.
Add the remaining Ceph CRUSH smaller buckets to their respective wider buckets one by one.
Scale the Ceph Controller and Rook Operator deployments to 0 replicas:
kubectl -n ceph-lcm-mirantis scale deploy --all --replicas 0 kubectl -n rook-ceph scale deploy rook-ceph-operator --replicas 0
On the MOSK cluster, manually modify the CRUSH rules for Ceph pools to enable data placement on a new failure domain:
Enter the
ceph-toolspod:kubectl -n rook-ceph exec -it deploy/rook-ceph-tools -- bash
List the CRUSH rules and erasure code profiles for the pools:
ceph osd pool ls detail
Example output
pool 1 'mirablock-k8s-block-hdd' replicated size 2 min_size 1 crush_rule 9 object_hash rjenkins pg_num 32 pgp_num 32 autoscale_mode on last_change 1193 lfor 0/0/85 flags hashpspool,selfmanaged_snaps stripe_width 0 application rbd read_balance_score 1.31 pool 2 '.mgr' replicated size 2 min_size 1 crush_rule 1 object_hash rjenkins pg_num 1 pgp_num 1 autoscale_mode on last_change 70 flags hashpspool stripe_width 0 pg_num_max 32 pg_num_min 1 application mgr read_balance_score 6.06 pool 3 'openstack-store.rgw.otp' replicated size 2 min_size 1 crush_rule 11 object_hash rjenkins pg_num 8 pgp_num 8 autoscale_mode on last_change 1197 flags hashpspool stripe_width 0 pg_num_min 8 application rook-ceph-rgw read_balance_score 2.27 pool 4 'openstack-store.rgw.meta' replicated size 2 min_size 1 crush_rule 12 object_hash rjenkins pg_num 8 pgp_num 8 autoscale_mode on last_change 1197 flags hashpspool stripe_width 0 pg_num_min 8 application rook-ceph-rgw read_balance_score 1.50 pool 5 'openstack-store.rgw.log' replicated size 2 min_size 1 crush_rule 10 object_hash rjenkins pg_num 8 pgp_num 8 autoscale_mode on last_change 1197 flags hashpspool stripe_width 0 pg_num_min 8 application rook-ceph-rgw read_balance_score 3.00 pool 6 'openstack-store.rgw.buckets.non-ec' replicated size 2 min_size 1 crush_rule 13 object_hash rjenkins pg_num 8 pgp_num 8 autoscale_mode on last_change 1197 flags hashpspool stripe_width 0 pg_num_min 8 application rook-ceph-rgw read_balance_score 1.50 pool 7 'openstack-store.rgw.buckets.index' replicated size 2 min_size 1 crush_rule 15 object_hash rjenkins pg_num 8 pgp_num 8 autoscale_mode on last_change 1197 flags hashpspool stripe_width 0 pg_num_min 8 application rook-ceph-rgw read_balance_score 2.25 pool 8 '.rgw.root' replicated size 2 min_size 1 crush_rule 14 object_hash rjenkins pg_num 8 pgp_num 8 autoscale_mode on last_change 1197 flags hashpspool stripe_width 0 pg_num_min 8 application rook-ceph-rgw read_balance_score 3.75 pool 9 'openstack-store.rgw.control' replicated size 2 min_size 1 crush_rule 16 object_hash rjenkins pg_num 8 pgp_num 8 autoscale_mode on last_change 1197 flags hashpspool stripe_width 0 pg_num_min 8 application rook-ceph-rgw read_balance_score 3.00 pool 10 'other-hdd' replicated size 2 min_size 1 crush_rule 19 object_hash rjenkins pg_num 32 pgp_num 32 autoscale_mode on last_change 1179 lfor 0/0/85 flags hashpspool,selfmanaged_snaps stripe_width 0 application rbd read_balance_score 1.69 pool 11 'openstack-store.rgw.buckets.data' erasure profile openstack-store.rgw.buckets.data_ecprofile size 3 min_size 2 crush_rule 18 object_hash rjenkins pg_num 32 pgp_num 32 autoscale_mode on last_change 1198 lfor 0/0/86 flags hashpspool,ec_overwrites stripe_width 8192 application rook-ceph-rgw pool 12 'vms-hdd' replicated size 2 min_size 1 crush_rule 21 object_hash rjenkins pg_num 256 pgp_num 256 autoscale_mode on last_change 1182 lfor 0/0/95 flags hashpspool,selfmanaged_snaps stripe_width 0 target_size_ratio 0.4 application rbd read_balance_score 1.24 pool 13 'volumes-hdd' replicated size 2 min_size 1 crush_rule 23 object_hash rjenkins pg_num 64 pgp_num 64 autoscale_mode on last_change 1185 lfor 0/0/89 flags hashpspool,selfmanaged_snaps stripe_width 0 target_size_ratio 0.2 application rbd read_balance_score 1.31 pool 14 'backup-hdd' replicated size 2 min_size 1 crush_rule 25 object_hash rjenkins pg_num 32 pgp_num 32 autoscale_mode on last_change 1188 lfor 0/0/90 flags hashpspool,selfmanaged_snaps stripe_width 0 target_size_ratio 0.1 application rbd read_balance_score 2.06 pool 15 'images-hdd' replicated size 2 min_size 1 crush_rule 27 object_hash rjenkins pg_num 32 pgp_num 32 autoscale_mode on last_change 1191 lfor 0/0/90 flags hashpspool,selfmanaged_snaps stripe_width 0 target_size_ratio 0.1 application rbd read_balance_score 1.50
For each replicated Ceph pool:
Obtain the current CRUSH rule name:
ceph osd crush rule dump <oldCrushRuleName>
Create a new CRUSH rule with the required bucket type using the same root, device class, and new bucket type:
ceph osd crush rule create-replicated <newCrushRuleName> <root> <bucketType> <deviceClass>
For example:
ceph osd crush rule create-replicated images-hdd-rack default rack hdd
For more details, refer to official Ceph documentation: CRUSH Maps: Creating a rule for a replicated pool.
Apply a new crush rule to the Ceph pool:
ceph osd pool set <poolName> crush_rule <newCrushRuleName>
For example:
ceph osd pool set images-hdd crush_rule images-hdd-rack
Wait for data to be rebalanced after moving the Ceph pool under the new failure domain (bucket type) by monitoring Ceph health:
ceph -sCaution
Update the following Ceph pool only after data rebalancing completes for the current Ceph pool.
Verify that the old CRUSH rule is not used anymore:
ceph osd pool ls detail
The rule ID is located in the CRUSH map and must match the rule ID in the output of ceph osd dump.
Remove the old unused CRUSH rule and rename the new one to the original name:
ceph osd crush rule rm <oldCrushRuleName> ceph osd crush rule rename <newCrushRuleName> <oldCrushRuleName>
For each erasure-coded Ceph pool:
Note
Erasure-coded pools require different number of buckets to store data. Instead of the number of replicas in replicated pools, erasure-coded pools require the
coding chunks + data chunksnumber of buckets existing in the Ceph cluster. For example, if an erasure-coded pool has 2 coding chunks and 2 data chunks configured, then the pool requires 4 different buckets, for example, 4 racks, to store data.Obtain the current parameters of the erasure-coded profile:
ceph osd erasure-code-profile get <ecProfile>
In the profile, add the new bucket type as the failure domain using the
crush-failure-domainparameter:ceph osd erasure-code-profile set <ecProfile> k=<int> m=<int> crush-failure-domain=<bucketType> crush-device-class=<deviceClass>
Create a new CRUSH rule in the profile:
ceph osd crush rule create-erasure <newEcCrushRuleName> <ecProfile>
Apply the new CRUSH rule to the pool:
ceph osd pool set <poolName> crush_rule <newEcCrushRuleName>
Wait for data to be rebalanced after moving the Ceph pool under the new failure domain (bucket type) by monitoring Ceph health:
ceph -sCaution
Update the following Ceph pool only after data rebalancing completes for the current Ceph pool.
Verify that the old CRUSH rule is not used anymore:
ceph osd pool ls detail
The rule ID is located in the CRUSH map and must match the rule ID in the output of ceph osd dump.
Remove the old unused CRUSH rule and rename the new one to the original name:
ceph osd crush rule rm <oldCrushRuleName> ceph osd crush rule rename <newCrushRuleName> <oldCrushRuleName>
Note
New erasure-coded profiles cannot be renamed, so they will not be removed automatically during pools cleanup. Remove them manually, if needed.
Exit the
ceph-toolspod.
Update the
MiraCephCRspecby setting thefailureDomain: rackparameter for each pool. The configuration from the Rook perspective must match the manually created configuration. For example:spec: pools: - name: images ... failureDomain: rack - name: volumes ... failureDomain: rack ... objectStorage: rgw: dataPool: failureDomain: rack ... metadataPool: failureDomain: rack ...
Monitor the Ceph cluster health and wait until rebalancing is completed:
ceph -sExample of a successful system response:
HEALTH_OK
Scale back the Ceph Controller and Rook Operator deployments:
kubectl -n ceph-lcm-mirantis scale deploy --all --replicas 3 kubectl -n rook-ceph scale deploy rook-ceph-operator --replicas 1
Enable periodic Ceph performance testing
TechPreview
Warning
This procedure is valid for MOSK clusters that use the MiraCeph custom
resource (CR), which is available since MOSK 25.2 to replace the deprecated
KaaSCephCluster. For the equivalent procedure with the KaaSCephCluster
CR, refer to the following section:
Warning
Performance testing affects the overall Ceph cluster performance. Do not run it unless you are sure that user load will not be affected.
This section describes how to configure periodic Ceph performance testing using Kubernetes batch or cron jobs that execute a fio process in a separate container with a connection to the Ceph cluster. The test results can then be stored in a persistent volume attached to the container.
Ceph performance testing is managed by the CephPerfTestRequest CR that
handles test run. You can create a performance test for a single or scheduled
runs.
Create a Ceph performance test request
TechPreview
Warning
This procedure is valid for MOSK clusters that use the MiraCeph custom
resource (CR), which is available since MOSK 25.2 to replace the deprecated
KaaSCephCluster. For the equivalent procedure with the KaaSCephCluster
CR, refer to the following section:
Warning
Performance testing affects the overall Ceph cluster performance. Do not run it unless you are sure that user load will not be affected.
This section describes how to create a Ceph performance test request through
the CephPerfTestRequest CR.
To create a Ceph performance test request:
Create an RBD image with the required parameters. For example, run the following command in
rook-ceph-toolspod to allow execution of theperftestexample below on a MOSK cluster:kubectl exec -ti -n rook-ceph deploy/rook-ceph-tools -- bash rbd create <pool_name>/<image_name> --size 10G
Substitute
<pool_name>and<image_name>with pool and image names, and specify the size. In the example below,mirablock-k8s-block-hddis used as pool name andtestsas image name:kubectl exec -ti -n rook-ceph deploy/rook-ceph-tools -- bash rbd create mirablock-k8s-block-hdd/tests --size 10G
Create a YAML template for the
CephPerfTestRequestCR. For details, see CephPerfTestRequest CR perftest specification.kubectl apply -f <example_file_name>.yaml
Example of the
CephPerfTestRequestresourceapiVersion: lcm.mirantis.com/v1alpha1 kind: CephPerfTestRequest metadata: name: test-perf-req namespace: ceph-lcm-mirantis spec: parameters: - --ioengine=rbd - --pool=mirablock-k8s-block-hdd - --rbdname=tests - --name=single_perftest - --rw=randrw:16k - --rwmixread=40 - --bs=4k - --size=500M - --iodepth=32 - --numjobs=8 - --group_reporting - --direct=1 - --fsync=32 - --buffered=0 - --exitall
Review the
CephPerfTestRequeststatus. For details, see CephPerfTestRequest perftest status.kubectl -n ceph-lcm-mirantis get cephperftestrequest test-mosk-req
Example of system response:
NAME AGE PHASE START TIME DURATION JOB STATUS SCHEDULE REFERENCE REFERENCE NAMESPACE test-perf-req 2m25s Finished 2025-01-16T13:51:00Z 9m15s Completed job/test-perf-req-cephperftest rook-ceph
Review the performance test result by inspecting logs for the corresponding job Pod on the MOSK cluster:
kubectl -n rook-ceph logs -l app=ceph-perftest,perftest=<name>
Substitute
<name>with theCephPerfTestRequestmetadata.name, for example,test-perf-req.Optional. Remove the
CephPerfTestRequest:kubectl -n ceph-lcm-mirantis get cephperftestrequest test-mosk-req
CephPerfTestRequest CR perftest specification
TechPreview
Warning
This procedure is valid for MOSK clusters that use the MiraCeph custom
resource (CR), which is available since MOSK 25.2 to replace the deprecated
KaaSCephCluster. For the equivalent procedure with the KaaSCephCluster
CR, refer to the following section:
This section describes the CephPerfTestRequest CR specification.
For the procedure workflow, see Create a Ceph performance test request.
Parameter |
Description |
|---|---|
|
A list of command arguments for a performance test execution. For all available parameters, see fio documentation. Note Performance test results will be saved on a PVC if the test
run parameters contain an argument to save to a file. Otherwise, test
results will be saved only as Pod logs. For example, for the default
|
|
Optional. Entrypoint command to run performance test in the container. If the performance image is updated, you may also update the command. By default, equals the image entry point. |
|
Container image to use for jobs. By default, |
|
Configuration of the performance test runs as periodic jobs. Leave empty if a single run is required. For details, see Ceph performance periodic parameters. |
|
Option that enables saving of the performance test results on a PVC. Contains the following fields:
|
Parameter |
Description |
|---|---|
|
Required. Schedule in base cron format. For example, |
|
Pause CronJob scheduling to prevent performance test execution. Only for future scheduling. |
|
Number of runs to keep in history. Supported only by keeping old run Pods with their outputs. |
Example of CephPerfTestRequest
apiVersion: lcm.mirantis.com/v1alpha1
kind: CephPerfTestRequest
metadata:
name: test-mosk-req
namespace: ceph-lcm-mirantis
spec:
parameters:
- --ioengine=rbd
- --pool=mirablock-k8s-block-hdd
- --rbdname=tests
- --name=single_perftest
- --rw=randrw:16k
- --rwmixread=40
- --bs=4k
- --size=500M
- --iodepth=32
- --numjobs=8
- --group_reporting
- --direct=1
- --fsync=32
- --buffered=0
- --exitall
CephPerfTestRequest perftest status
TechPreview
Warning
This procedure is valid for MOSK clusters that use the MiraCeph custom
resource (CR), which is available since MOSK 25.2 to replace the deprecated
KaaSCephCluster. For the equivalent procedure with the KaaSCephCluster
CR, refer to the following section:
This section describes the status fields of the CephPerfTestRequest CR
that you can use to check the status of a Ceph performance test request.
Note
Performance test results will be saved on PVC if the test run
parameters contain the saveResultOnPvc option. Otherwise, test
results will be saved only as Pod logs. For details, see
Ceph performance test parameters.
Parameter |
Description |
|---|---|
|
Describes the current request phase:
|
|
The last start time of the performance test execution. |
|
The duration of the last successful performance test. |
|
The execution status of the last performance test. |
|
Issues or warnings found during the performance test run. |
|
Location of the performance test result. Contains the following fields:
|
|
History of statuses and timings for cron jobs:
|
Example of CephPerfTestRequest status
status:
lastDurationTime: 5m53s
lastJobStatus: Completed
lastStartTime: "2022-06-17T09:29:57Z"
phase: Finished
results:
storedOnPvc:
pvcName: test-perf-req-cephperftest
pvcNamespace: rook-ceph
Ceph operations for KaaSCephCluster (prior to 25.2)
Warning
This procedure is valid for MOSK clusters that use the deprecated
KaaSCephCluster custom resource (CR) instead of the MiraCeph CR that is
available since MOSK 25.2 as a new Ceph configuration entrypoint. For the
equivalent procedure with the MiraCeph CR, refer to the following section:
This section outlines Ceph LCM operations such as adding Ceph Monitor, Ceph nodes, and RADOS Gateway nodes to an existing Ceph cluster or removing them, as well as removing or replacing Ceph OSDs. The section also includes OpenStack-specific operations for Ceph.
The following sections describe the Ceph cluster configuration options:
Ceph default configuration options
Warning
This procedure is valid for MOSK clusters that use the deprecated
KaaSCephCluster custom resource (CR) instead of the MiraCeph CR that is
available since MOSK 25.2 as a new Ceph configuration entrypoint. For the
equivalent procedure with the MiraCeph CR, refer to the following section:
Ceph Controller provides the capability to specify configuration options for
the Ceph cluster through the spec.cephClusterSpec.rookConfig key-value
parameter of the KaaSCephCluster resource as if they were set in a usual
ceph.conf file. For details, see Ceph advanced configuration.
However, if rookConfig is empty, Ceph Controller still specifies the
following default configuration options for each Ceph cluster:
Required network parameters that you can change through the
spec.cephClusterSpec.networksection:cluster network = <spec.cephClusterSpec.network.clusterNet> public network = <spec.cephClusterSpec.network.publicNet>
General default configuration options that you can override using the
rookConfigparameter:mon target pg per osd = 200 mon max pg per osd = 600 # Workaround configuration option to avoid the # https://github.com/rook/rook/issues/7573 issue # when updating to Rook 1.6.x versions: rgw_data_log_backing = omap
If rookConfig is empty but the spec.cephClsuterSpec.objectStore.rgw
section is defined, Ceph Controller specifies the following OpenStack-related
default configuration options for each Ceph cluster:
Ceph Object Gateway options, which you can override using the
rookConfigparameter:rgw swift account in url = true rgw keystone accepted roles = '_member_, Member, member, swiftoperator' rgw keystone accepted admin roles = admin rgw keystone implicit tenants = true rgw swift versioning enabled = true rgw enforce swift acls = true rgw_max_attr_name_len = 64 rgw_max_attrs_num_in_req = 32 rgw_max_attr_size = 1024 rgw_bucket_quota_ttl = 0 rgw_user_quota_bucket_sync_interval = 0 rgw_user_quota_sync_interval = 0 rgw s3 auth use keystone = true
Additional parameters for the Keystone integration:
Warning
All values with the
keystoneprefix are programmatically specified for each MOSK deployment. Do not modify these parameters manually.rgw keystone api version = 3 rgw keystone url = <keystoneAuthURL> rgw keystone admin user = <keystoneUser> rgw keystone admin password = <keystonePassword> rgw keystone admin domain = <keystoneProjectDomain> rgw keystone admin project = <keystoneProjectName>
See also
Ceph advanced configuration
Warning
This procedure is valid for MOSK clusters that use the deprecated
KaaSCephCluster custom resource (CR) instead of the MiraCeph CR that is
available since MOSK 25.2 as a new Ceph configuration entrypoint. For the
equivalent procedure with the MiraCeph CR, refer to the following section:
This section describes how to configure a Ceph cluster through the
KaaSCephCluster (kaascephclusters.kaas.mirantis.com) CR during or
after the deployment of a MOSK cluster.
The KaaSCephCluster CR spec has two sections, cephClusterSpec and
k8sCluster and specifies the nodes to deploy as Ceph components. Based on
the roles definitions in the KaaSCephCluster CR, Ceph Controller
automatically labels nodes for Ceph Monitors and Managers. Ceph OSDs are
deployed based on the storageDevices parameter defined for each Ceph node.
For a default KaaSCephCluster CR, see Example of a complete template configuration for cluster creation.
Configure a Ceph cluster
Select from the following options:
If you do not have a cluster yet, open
kaascephcluster.yaml.templatefor editing.If the cluster is already deployed, open the
KaasCephClusterCR for editing:kubectl edit kaascephcluster -n <ClusterProjectName>
Substitute
<ClusterProjectName>with a corresponding value.
Using the tables below, configure the Ceph cluster as required.
Select from the following options:
If you are creating a cluster, save the updated
KaaSCephClustertemplate to the corresponding file and proceed with the cluster creation.If you are configuring
KaaSCephClusterof an existing cluster, exit the text editor to apply the change.
Ceph configuration options
Parameter |
Description |
|---|---|
|
Describes a Ceph cluster in the MOSK cluster. For details
on |
|
Defines the cluster on which the spec:
k8sCluster:
name: kaas-mgmt
namespace: default
|
Parameter |
Description |
|---|---|
|
Specifies networks for the Ceph cluster:
|
|
Specifies the list of Ceph nodes. For details, see
Node parameters. The nodes:
master-0:
<node spec>
master-1:
<node spec>
...
worker-0:
<node spec>
|
|
Specifies the list of Ceph nodes grouped by node lists or node
labels. For details, see NodeGroups parameters. The nodes:
group-1:
spec: <node spec>
nodes: ["master-0", "master-1"]
group-2:
spec: <node spec>
label: <nodeLabelExpression>
...
group-3:
spec: <node spec>
nodes: ["worker-2", "worker-3"]
The |
|
Specifies the list of Ceph pools. For details, see Pool parameters. |
|
Specifies the parameters for Object Storage, such as RADOS Gateway, the Ceph Object Storage. Also specifies the RADOS Gateway Multisite configuration. For details, see RADOS Gateway parameters and Multisite parameters. |
|
Optional. String key-value parameter that allows overriding Ceph configuration options. Since MOSK 24.2, use the The use of this option enables restart of only specific daemons related
to the corresponding section. If you do not specify the section,
a parameter is set in the For example: rookConfig:
"osd_max_backfills": "64"
"mon|mon_health_to_clog": "true"
"osd|osd_journal_size": "8192"
"osd.14|osd_journal_size": "6250"
|
|
Available since MOSK 23.3. Enables specification of
extra options for a setup, includes the |
|
In MOSK 25.1, is automatically replaced with |
|
Available since MOSK 25.1 to automatically replace the
|
|
Enables pools mirroring between two interconnected clusters. For details, see Enable Ceph RBD mirroring. |
|
List of Ceph clients. For details, see Clients parameters. |
|
Disables autogeneration of shared Ceph values for OpenStack
deployments. Set to |
|
Contains the
For example: mgr:
mgrModules:
- name: balancer
enabled: true
settings:
balancerMode: upmap
- name: pg_autoscaler
enabled: true
The Note Most Ceph Manager modules require additional configuration
that you can perform through the |
|
Configures health checks and liveness probe settings for Ceph daemons. For details, see HealthCheck parameters.
Example configurationspec:
cephClusterSpec:
network:
clusterNet: 10.10.10.0/24
publicNet: 10.10.11.0/24
nodes:
master-0:
<node spec>
...
pools:
- <pool spec>
...
rookConfig:
"mon max pg per osd": "600"
...
|
Parameter |
Description |
|---|---|
|
Specifies the
If a Ceph node contains a If a Ceph node contains a
|
|
Specifies the list of devices to use for Ceph OSD deployment. Mutually
exclusive with Note Since MOSK 23.3, Mirantis recommends migrating
all
|
|
Available since MOSK 25.2. Mutually exclusive with
|
|
Specifies the explicit key-value CRUSH topology for a node. For details, see Ceph official documentation: CRUSH maps. Includes the following parameters:
Example configuration: crush:
datacenter: dc1
room: room1
pdu: pdu1
row: row1
rack: rack1
chassis: ch1
region: region1
zone: zone1
|
|
Optional. Available since MOSK 25.1. Specifies the custom monitor endpoint for the node on which the monitor is placed. The custom monitor endpoint can be equal, for example, to an IP address from the Ceph public network range. Example configuration: monitorIP: "192.168.13.1"
|
Parameter |
Description |
|---|---|
|
Specifies a Ceph node specification. For the entire spec, see Node parameters. |
|
Specifies a list of names of machines to which the Ceph node nodeGroups:
group-1:
spec: <node spec>
nodes:
- master-0
- master-1
- worker-0
|
|
Specifies a string with a valid label selector expression to
select machines to which the node spec must be applied. Mutually
exclusive with nodeGroup:
group-2:
spec: <node spec>
label: "ceph-storage-node=true,!ceph-control-node"
|
Parameter |
Description |
|---|---|
|
Mandatory. Specifies the pool name as a prefix for each Ceph block pool. The
resulting Ceph block pool name will be |
|
Optional. Enables Ceph block pool to use only the |
|
Mandatory. Specifies the pool role and is used mostly for (MOSK) pools. |
|
Mandatory. Defines if the pool and dependent StorageClass should be set as default. Must be enabled only for one pool. |
|
Mandatory. Specifies the device class for the defined pool. Possible values are HDD, SSD, and NVMe. |
|
Mandatory, mutually exclusive with
|
|
Mandatory, mutually exclusive with |
|
Mandatory. The failure domain across which the replicas or chunks of data will
be spread. Set to Caution Mirantis does not recommend using the following
intermediate topology keys: |
|
Optional. Enables the mirroring feature for the defined pool.
Includes the |
|
Optional. Not updatable as it applies only once. Enables expansion of
persistent volumes based on Note A Kubernetes cluster only supports increase of storage size. |
|
Optional. Not updatable as it applies only once. Specifies custom
|
|
Optional. Available since MOSK 23.1. Specifies the key-value map for the parameters of the Ceph pool. For details, see Ceph documentation: Set Pool values. |
|
Optional. Available since MOSK 23.3. Specifies reclaim
policy for the underlying |
Example configuration:
pools:
- name: kubernetes
role: kubernetes
deviceClass: hdd
replicated:
size: 3
targetSizeRatio: 10.0
default: true
To configure additional required pools for MOSK, see Add a Ceph cluster prior to MOSK 25.2.
Caution
Since Ceph Pacific, Ceph CSI driver does not propagate the
777 permission on the mount point of persistent volumes based on any
StorageClass of the Ceph pool.
Parameter |
Description |
|---|---|
|
Ceph client name. |
|
Key-value parameter with Ceph client capabilities. For details
about |
Example configuration:
clients:
- name: glance
caps:
mon: allow r, allow command "osd blacklist"
osd: profile rbd pool=images
Parameter |
Description |
|---|---|
|
Required. Ceph Object Storage instance name. |
|
Required if Object storage data pool spec that must only contain rgw:
dataPool:
deviceClass: hdd
failureDomain: host
erasureCoded:
codingChunks: 1
dataChunks: 2
|
|
Required if rgw:
metadataPool:
deviceClass: hdd
failureDomain: host
replicated:
size: 3
where Warning When using the non-recommended Ceph pools For example, if |
|
Required. The gateway settings corresponding to the
For example: rgw:
gateway:
allNodes: false
instances: 3
port: 80
securePort: 8443
|
|
Optional. Defines whether to delete the data and metadata pools in
the |
|
Optional. To create new Ceph RGW resources, such as buckets or users, specify the following keys. Ceph Controller will automatically create the specified object storage users and buckets in the Ceph cluster.
|
|
Required if For example: objectStorage:
multisite:
zones:
- name: master-zone
...
rgw:
zone:
name: master-zone
|
|
Optional. Custom TLS certificate parameters used to access the Ceph RGW endpoint. If not specified, a self-signed certificate will be generated. For example: objectStorage:
rgw:
SSLCert:
cacert: |
-----BEGIN CERTIFICATE-----
ca-certificate here
-----END CERTIFICATE-----
tlsCert: |
-----BEGIN CERTIFICATE-----
private TLS certificate here
-----END CERTIFICATE-----
tlsKey: |
-----BEGIN RSA PRIVATE KEY-----
private TLS key here
-----END RSA PRIVATE KEY-----
|
|
Optional. Available since MOSK 25.1. Flag to determine that a TLS
certificate for accessing the Ceph RGW endpoint is used but not exposed
in objectStorage:
rgw:
SSLCertInRef: true
The operator must manually provide TLS configuration using the
data:
cacert: <base64encodedCaCertificate>
cert: <base64encodedCertificate>
When removing an already existing When adding a new secret directly without exposing it in
|
For configuration example, see Enable Ceph RGW Object Storage.
Parameter |
Description |
|---|---|
|
Available since MOSK 23.3.
A key-value setting used to assign a specification label to any
available device on a specific node. These labels can then be
utilized within Usage: extraOpts:
deviceLabels:
<node-name>:
<dev-label>: /dev/disk/by-id/<unique_ID>
...
<node-name-n>:
<dev-label-n>: /dev/disk/by-id/<unique_ID>
nodesGroup:
<group-name>:
spec:
storageDevices:
- devLabel: <dev_label>
- devLabel: <dev_label_n>
nodes:
- <node_name>
- <node_name_n>
Before MOSK 23.3, you need to specify the device labels for each node separately: nodes:
<node-name>:
- storageDevices:
- fullPath: /dev/disk/by-id/<unique_ID>
<node-name-n>:
- storageDevices:
- fullPath: /dev/disk/by-id/<unique_ID>
|
|
Available since MOSK 23.3 as TechPreview.
A list of custom device class names to use in the specification.
Enables you to specify the custom names different from the default
ones, which include Usage: extraOpts:
customDeviceClasses:
- <custom_class_name>
nodes:
kaas-node-5bgk6:
storageDevices:
- config: # existing item
deviceClass: <custom_class_name>
fullPath: /dev/disk/by-id/<unique_ID>
pools:
- default: false
deviceClass: <custom_class_name>
erasureCoded:
codingChunks: 1
dataChunks: 2
failureDomain: host
Before MOSK 23.3, you cannot specify custom class names in the specification. |
Parameter |
Description |
|---|---|
|
Required. List of realms to use, represents the realm namespaces. Includes the following parameters:
|
|
Required. The list of zone groups for realms. Includes the following parameters:
|
|
Required. The list of zones used within one zone group. Includes the following parameters:
|
For configuration example, see Enable multisite for Ceph RGW Object Storage.
Parameter |
Description |
|---|---|
|
Specifies health check settings for Ceph daemons. Contains the following parameters:
Each parameter allows defining the following settings:
|
|
Key-value parameter with liveness probe settings for the defined
daemon types. Can be one of the following:
Note Ceph Controller specifies the following
|
|
Key-value parameter with startup probe settings for the defined
daemon types. Can be one of the following:
|
Example configuration
healthCheck:
daemonHealth:
mon:
disabled: false
interval: 45s
timeout: 600s
osd:
disabled: false
interval: 60s
status:
disabled: true
livenessProbe:
mon:
disabled: false
probe:
timeoutSeconds: 10
periodSeconds: 3
successThreshold: 3
mgr:
disabled: false
probe:
timeoutSeconds: 5
failureThreshold: 5
osd:
probe:
initialDelaySeconds: 5
timeoutSeconds: 10
failureThreshold: 7
startupProbe:
mon:
disabled: true
mgr:
probe:
successThreshold: 3
The following sections describe the OpenStack-related Ceph operations:
Configure Ceph Object Gateway TLS
Warning
This procedure is valid for MOSK clusters that use the deprecated
KaaSCephCluster custom resource (CR) instead of the MiraCeph CR that is
available since MOSK 25.2 as a new Ceph configuration entrypoint. For the
equivalent procedure with the MiraCeph CR, refer to the following section:
Once you enable Ceph Object Gateway (radosgw) as described in
Enable Ceph RGW Object Storage, you can configure the Transport Layer Security (TLS)
protocol for a Ceph Object Gateway public endpoint using the following options:
Using MOSK TLS, if it is enabled and exposes its certificates and domain for Ceph. In this case, Ceph Object Gateway will automatically create an ingress rule with MOSK certificates and domain to access the Ceph Object Gateway public endpoint. Therefore, you only need to reach the Ceph Object Gateway public and internal endpoints and set the CA certificates for a trusted TLS connection.
Using custom
ingressspecified in theKaaSCephClusterCR. In this case, Ceph Object Gateway public endpoint will use the public domain specified using theingressparameters.
Caution
External Ceph Object Gateway service is not supported and will be deleted during update. If your system already uses endpoints of an external Ceph Object Gateway service, reconfigure them to the ingress endpoints.
Caution
When using a custom or OpenStack ingress, ensure to configure the DNS name for RGW to target an external IP address of that ingress. If there is no OpenStack or custom ingress available, point the DNS to an external load balancer of RGW.
Note
Since MOSK 23.3, if the cluster has
tls-proxy enabled, TLS certificates specified in ingress objects,
including those configured in the KaaSCephCluster specification,
are disregarded. Instead, common certificates are applied to all ingresses
from the OpenStackDeployment object. This implies that tlsCert and
other ingress certificates specified in KaaSCephCluster are ignored,
and the common certificate from the OpenStackDeployment object is used.
This section also describes how to specify a custom public endpoint for the Object Storage service.
To configure Ceph Object Gateway TLS:
Verify whether MOSK TLS is enabled. The
spec.features.ssl.public_endpointssection should be specified in theOpenStackDeploymentCR.To generate an SSL certificate for internal usage, verify that the gateway
securePortparameter is specified in theKaasCephClusterCR. For details, see Enable Ceph RGW Object Storage.Select from the following options:
Configure TLS for Ceph Object Gateway using a custom
ingressConfig:Open the
KaasCephClusterCR for editing.Specify the
ingressConfigparameters:Description of the tlsConfig section parameters¶ certsTLS configuration for ingress including certificates. Contains the following parameters:
cacertThe Certificate Authority (CA) certificate, used for the ingress rule TLS support.
tlsCertThe TLS certificate, used for the ingress rule TLS support.
tlsKeyThe TLS private key, used for the ingress rule TLS support.
publicDomainMandatory. The domain name to use for public endpoints.
Caution
The default ingress controller does not support
publicDomainvalues different from the OpenStack ingress public domain. Therefore, if you intend to use the default OpenStack Ingress Controller for your Ceph Object Storage public endpoint, plan to use the same public domain as your OpenStack endpoints.hostnameCustom name to override the Objectstore RGW name for public RGW access. Public RGW endpoint has the
https://<hostname>.<publicDomain>format.tlsSecretRefNameOptional. Secret name with TLS certs on the managed cluster in the
rook-cephnamespace prepared by the operator. Allows avoiding exposure of certs directly inspec. Must contain the following format:data: ca.cert: <base64encodedCaCertificate> tls.crt: <base64encodedTlsCert> tls.key: <base64encodedTlsKey>
Caution
When using
tlsSecretRefName, remove the following fields:cacert,tlsCert, andtlsKey.Description of optional parameters in the ingressConfig section¶ controllerClassNameName of the custom Ingress Controller. By default, the
openstack-ingress-nginxclass name is specified and Ceph uses the OpenStack Ingress Controller based on NGINX.annotationsExtra annotations for the ingress proxy that are a key-value mapping of strings to add or override ingress rule annotations. For details, see NGINX Ingress Controller: Annotations.
By default, the following annotations are set:
nginx.ingress.kubernetes.io/rewrite-targetis set to/nginx.ingress.kubernetes.io/upstream-vhostis set to<rgwName>.rook-ceph.svc
The value for
<rgwName>is located inspec.cephClusterSpec.objectStorage.rgw.name.Optional annotations:
nginx.ingress.kubernetes.io/proxy-request-buffering: "off"that disables buffering foringressto prevent the 413 (Request Entity Too Large) error when uploading large files usingradosgw.nginx.ingress.kubernetes.io/proxy-body-size: <size>that increases the default uploading size limit to prevent the 413 (Request Entity Too Large) error when uploading large files usingradosgw. Set the value in MB (m) or KB (k). For example,100m.
Note
By default, an ingress rule is created with an internal Ceph Object Gateway service endpoint as a backend. Also,
rgw dns nameis specified in the Ceph configuration and is set to<rgwName>.rook-ceph.svcby default.You can override
rgw dns nameusing thespec.cephClusterSpec.rookConfigkey-value parameter. In this case, also change the corresponding ingress annotation.Configuration example with the
rgw dns nameoverridespec: cephClusterSpec: objectStorage: rgw: name: rgw-store ingressConfig: tlsConfig: publicDomain: public.domain.name certs: cacert: | -----BEGIN CERTIFICATE----- ... -----END CERTIFICATE----- tlsCert: | -----BEGIN CERTIFICATE----- ... -----END CERTIFICATE----- tlsKey: | -----BEGIN RSA PRIVATE KEY----- ... -----END RSA PRIVATE KEY----- controllerClassName: openstack-ingress-nginx annotations: nginx.ingress.kubernetes.io/rewrite-target: / nginx.ingress.kubernetes.io/upstream-vhost: rgw-store.public.domain.name nginx.ingress.kubernetes.io/proxy-body-size: 100m rookConfig: "rgw dns name": rgw-store.public.domain.name
For clouds with the
publicDomainparameter specified, align theupstream-vhostingress annotation with the name of the Ceph Object Storage and the specified public domain.Ceph Object Storage requires the
upstream-vhostandrgw dns nameparameters to be equal. Therefore, override the defaultrgw dns namewith the corresponding ingress annotation value.
Configure Ceph Object Gateway TLS using a custom
ingress:Warning
The
rgwsection is deprecated and theingressparameters are moved undercephClusterSpec.ingress. If you continue usingrgw.ingress, it will be automatically translated intocephClusterSpec.ingressduring the MOSK cluster release update.Open the
KaasCephClusterCR for editing.Specify the
ingressparameters:publicDomain- domain name to use for the external service.Caution
Since MOSK 23.3, the default ingress controller does not support
publicDomainvalues different from the OpenStack ingress public domain. Therefore, if you intend to use the default OpenStack ingress controller for your Ceph Object Storage public endpoint, plan to use the same public domain as your OpenStack endpoints.cacert- Certificate Authority (CA) certificate, used for the ingress rule TLS support.tlsCert- TLS certificate, used for the ingress rule TLS support.tlsKey- TLS private key, used for the ingress rule TLS support.customIngressOptional - includes the following custom Ingress Controller parameters:className- the custom Ingress Controller class name. If not specified, theopenstack-ingress-nginxclass name is used by default.annotations- extra annotations for the ingress proxy. For details, see NGINX Ingress Controller: Annotations.By default, the following annotations are set:
nginx.ingress.kubernetes.io/rewrite-targetis set to/nginx.ingress.kubernetes.io/upstream-vhostis set to<rgwName>.rook-ceph.svc.The value for
<rgwName>isspec.cephClusterSpec.objectStorage.rgw.name.
Optional annotations:
nginx.ingress.kubernetes.io/proxy-request-buffering: "off"that disables buffering foringressto prevent the 413 (Request Entity Too Large) error when uploading large files usingradosgw.nginx.ingress.kubernetes.io/proxy-body-size: <size>that increases the default uploading size limit to prevent the 413 (Request Entity Too Large) error when uploading large files usingradosgw. Set the value in MB (m) or KB (k). For example,100m.
For example:
customIngress: className: openstack-ingress-nginx annotations: nginx.ingress.kubernetes.io/rewrite-target: / nginx.ingress.kubernetes.io/upstream-vhost: openstack-store.rook-ceph.svc nginx.ingress.kubernetes.io/proxy-body-size: 100m
Note
An ingress rule is by default created with an internal Ceph Object Gateway service endpoint as a backend. Also,
rgw dns nameis specified in the Ceph configuration and is set to<rgwName>.rook-ceph.svcby default. You can override this option using thespec.cephClusterSpec.rookConfigkey-value parameter. In this case, also change the corresponding ingress annotation.For example:
spec: cephClusterSpec: objectStorage: rgw: name: rgw-store ingress: publicDomain: public.domain.name cacert: | -----BEGIN CERTIFICATE----- ... -----END CERTIFICATE----- tlsCert: | -----BEGIN CERTIFICATE----- ... -----END CERTIFICATE----- tlsKey: | -----BEGIN RSA PRIVATE KEY----- ... -----END RSA PRIVATE KEY----- customIngress: annotations: "nginx.ingress.kubernetes.io/upstream-vhost": rgw-store.public.domain.name rookConfig: "rgw dns name": rgw-store.public.domain.name
Warning
For clouds with the
publicDomainparameter specified, align theupstream-vhostingress annotation with the name of the Ceph Object Storage and the specified public domain.Ceph Object Storage requires the
upstream-vhostandrgw dns nameparameters to be equal. Therefore, override the defaultrgw dns nameto the corresponding ingress annotation value.
Obtain the MOSK CA certificate for a trusted connection:
kubectl -n openstack-ceph-shared get secret openstack-rgw-creds -o jsonpath="{.data.ca_cert}" | base64 -d
Access internal and public Ceph Object Gateway endpoints by selecting one of the following options:
Note
If you are using the HTTP scheme instead of HTTPS:
In the
KaaSCephClusterobject on the management cluster, find theingressConfigsection and add custom annotations:spec: cephClusterSpec: ingressConfig: annotations: "nginx.ingress.kubernetes.io/force-ssl-redirect": "false" "nginx.ingress.kubernetes.io/ssl-redirect": "false"
You can omit TLS configuration for the default settings provided by OpenStack to be applied.
If both HTTP and HTTPS must be used, apply the following configuration in the
KaaSCephClusterobject:spec: cephClusterSpec: ingressConfig: tlsConfig: publicDomain: public.domain.name cacert: | -----BEGIN CERTIFICATE----- ... -----END CERTIFICATE----- tlsCert: | -----BEGIN CERTIFICATE----- ... -----END CERTIFICATE----- tlsKey: | -----BEGIN RSA PRIVATE KEY----- ... -----END RSA PRIVATE KEY----- annotations: "nginx.ingress.kubernetes.io/force-ssl-redirect": "false" "nginx.ingress.kubernetes.io/ssl-redirect": "false"
In the
KaaSCephClusterobject on the management cluster, find theingresssection and add custom annotations:spec: cephClusterSpec: ingress: publicDomain: public.domain.name cacert: | -----BEGIN CERTIFICATE----- ... -----END CERTIFICATE----- tlsCert: | -----BEGIN CERTIFICATE----- ... -----END CERTIFICATE----- tlsKey: | -----BEGIN RSA PRIVATE KEY----- ... -----END RSA PRIVATE KEY----- customIngress: annotations: "nginx.ingress.kubernetes.io/force-ssl-redirect": "false" "nginx.ingress.kubernetes.io/ssl-redirect": "false"
In the
KaaSCephClusterobject on the management cluster, find theingresssection and add custom annotations:spec: cephClusterSpec: rookConfig: rgw_remote_addr_param: "HTTP_X_FORWARDED_FOR"
Obtain the Ceph Object Gateway public endpoint:
kubectl -n rook-ceph get ingress
Obtain the public endpoint TLS CA certificate:
kubectl -n rook-ceph get secret $(kubectl -n rook-ceph get ingress -o jsonpath='{.items[0].spec.tls[0].secretName}{"\n"}') -o jsonpath='{.data.ca\.crt}' | base64 -d; echo
Obtain the internal endpoint name for Ceph Object Gateway:
kubectl -n rook-ceph get svc -l app=rook-ceph-rgw
The internal endpoint for Ceph Object Gateway has the
https://<internal-svc-name>.rook-ceph.svc:<rgw-secure-port>/format, where<rgw-secure-port>isspec.rgw.gateway.securePortspecified in theKaaSCephClusterCR.Obtain the internal endpoint TLS CA certificate:
kubectl -n rook-ceph get secret rgw-ssl-certificate -o jsonpath="{.data.cacert}" | base64 -d
Update the zonegroup
hostnamesof Ceph Object Gateway:The
hostnameszonegroup of Ceph Object Gateway updates automatically and you can skip this step if one of the following requirements is met:The public hostname matches the public domain name set by the
spec.cephClusterSpec.ingressConfig.tlsConfig.publicDomainfieldThe OpenStack configuration has been applied
Otherwise, complete the steps for MOSK 22.4 and earlier product versions.
Note
Prior to MOSK 25.1, use the
spec.cephClusterSpec.ingress.publicDomainfield instead.Enter the
rook-ceph-toolspod:kubectl -n rook-ceph exec -it deployment/rook-ceph-tools -- bash
Obtain Ceph Object Gateway default zonegroup configuration:
radosgw-admin zonegroup get --rgw-zonegroup=<objectStorageName> --rgw-zone=<objectStorageName> | tee zonegroup.json
Substitute
<objectStorageName>with the Ceph Object Storage name fromspec.cephClusterSpec.objectStorage.rgw.name.Inspect
zonegroup.jsonand verify that thehostnameskey is a list that contains two endpoints: an internal endpoint and a custom public endpoint:"hostnames": ["rook-ceph-rgw-<objectStorageName>.rook-ceph.svc", <customPublicEndpoint>]
Substitute
<objectStorageName>with the Ceph Object Storage name and<customPublicEndpoint>with the public endpoint with a custom public domain.If one or both endpoints are omitted in the list, add the missing endpoints to the
hostnameslist in thezonegroup.jsonfile and update Ceph Object Gateway zonegroup configuration:radosgw-admin zonegroup set --rgw-zonegroup=<objectStorageName> --rgw-zone=<objectStorageName> --infile zonegroup.json radosgw-admin period update --commit
Verify that the
hostnameslist contains both the internal and custom public endpoint:radosgw-admin --rgw-zonegroup=<objectStorageName> --rgw-zone=<objectStorageName> zonegroup get | jq -r ".hostnames"
Example of system response:
[ "rook-ceph-rgw-obj-store.rook-ceph.svc", "obj-store.mcc1.cluster1.example.com" ]
Exit the
rook-ceph-toolspod:exit
Once done, Ceph Object Gateway becomes available by the custom public endpoint with an S3 API client, OpenStack Swift CLI, and OpenStack Horizon Containers plugin.
Use object storage server-side encryption
TechPreview
Warning
This procedure is valid for MOSK clusters that use the deprecated
KaaSCephCluster custom resource (CR) instead of the MiraCeph CR that is
available since MOSK 25.2 as a new Ceph configuration entrypoint. For the
equivalent procedure with the MiraCeph CR, refer to the following section:
When you use Ceph Object Gateway server-side encryption (SSE), unencrypted data sent over HTTPS is stored encrypted by the Ceph Object Gateway in the Ceph cluster. The current implementation integrates Barbican as a key management service.
The object storage SSE feature is enabled by default in MOSK deployments with Barbican. To use object storage SSE, the AWS CLI S3 client is used.
To use object storage server-side encryption:
Create Amazon Elastic Compute Cloud (EC2) credentials:
openstack ec2 credentials create
Configure AWS CLI with
accessandsecretcreated in the previous step:aws configureCreate a secret key in Barbican secret key:
openstack secret order create --name <name> --algorithm <algorithm> --mode <mode> --bit-length 256 --payload-content-type=<payload-content-type> key
Substitute the parameters enclosed in angle brackets:
<name>- human-friendly name.<algorithm>- algorithm to use with the requested key. For example,aes.<mode>- algorithm mode to use with the requested key. For example,ctr.<payload-content-type>- type/format of the secret to generate. For example,application/octet-stream.
Verify that the key has been created:
openstack secret order get <order-href>
Substitute
<order-href>with the corresponding value from the output of the previous command.Specify the
ceph-rgwuser in the Barbican secret Access Control List (ACL):Obtain the list of
ceph-rgwusers:openstack user list --domain service | grep ceph-rgw
Example output:
| c63b70134e0845a2b13c3f947880f66a | ceph-rgwZ6ycK3dY |
In the output, capture the first value as the
<user-id>, which isc63b70134e0845a2b13c3f947880f66ain the above example.Specify the
ceph-rgwuser in the Barbican ACL:openstack acl user add --user <user-id> <secret-href>
Substitute
<user-id>with the corresponding value from the output of the previous command and<secret-href>with the corresponding value obtained in step 3.
Create an S3 bucket:
aws --endpoint-url <rgw-endpoint-url> --ca-bundle <ca-bundle> s3api create-bucket --bucket <bucket-name>
Substitute the parameters enclosed in angle brackets:
<rgw-endpoint-url>- Ceph Object Gateway endpoint DNS name<ca-bundle>- CA Certificate Bundle<bucket-name>- human-friendly bucket name
Upload a file using object storage SSE:
aws --endpoint-url <rgw-endpoint-url> --ca-bundle <ca-bundle> s3 cp <path-to-file> "s3://<bucket-name>/<filename>" --sse aws:kms --sse-kms-key-id <key-id>
Substitute the parameters enclosed in angle brackets:
<path-to-file>- path to the file that you want to upload<filename>- name under which the uploaded file will be stored in the bucket<key-id>- Barbican secret key ID
Select from the following options to download the file:
Download the file using a key:
aws --endpoint-url <rgw-endpoint-url> --ca-bundle <ca-bundle> s3 cp "s3://<bucket-name>/<filename>" <path-to-output-file> --sse aws:kms --sse-kms-key-id <key-id>
Substitute
<path-to-output-file>with the path to the file you want to download.Download the file without a key:
aws --endpoint-url <rgw-endpoint-url> --ca-bundle <ca-bundle> s3 cp "s3://<bucket-name>/<filename>" <output-filename>
Set an Amazon S3 bucket policy
Warning
This procedure is valid for MOSK clusters that use the deprecated
KaaSCephCluster custom resource (CR) instead of the MiraCeph CR that is
available since MOSK 25.2 as a new Ceph configuration entrypoint. For the
equivalent procedure with the MiraCeph CR, refer to the following section:
This section explains how to create an Amazon Simple Storage Service (Amazon S3 or S3) bucket and set an S3 bucket policy between two Ceph Object Storage users.
Create Ceph Object Storage users
Warning
This procedure is valid for MOSK clusters that use the deprecated
KaaSCephCluster custom resource (CR) instead of the MiraCeph CR that is
available since MOSK 25.2 as a new Ceph configuration entrypoint. For the
equivalent procedure with the MiraCeph CR, refer to the following section:
Ceph Object Storage users can create Amazon S3 buckets and bucket policies that grant access to other users.
This section describes how to create two Ceph Object Storage users and configure their S3 credentials.
To create and configure Ceph Object Storage users:
Open the
KaaSCephClusterCR:kubectl --kubeconfig <managementKubeconfig> -n <managedClusterProject> edit kaascephcluster
Substitute
<managementKubeconfig>with a management clusterkubeconfigfile and<managedClusterProject>with a managed cluster project name.In the
cephClusterSpecsection, add new Ceph Object Storage users.Caution
For user
name, apply the UUID format with no capital letters.For example:
spec: cephClusterSpec: objectStorage: rgw: objectUsers: - name: user-b displayName: user-a capabilities: bucket: "*" user: read - name: user-t displayName: user-t capabilities: bucket: "*" user: read
Verify that
rgwUserSecretsare created for both users:kubectl --kubeconfig <managementKubeconfig> -n <managedClusterProject> get kaascephcluster -o yaml
Substitute
<managementKubeconfig>with a management clusterkubeconfigfile and<managedClusterProject>with a managed cluster project name.Example of a positive system response:
status: miraCephSecretsInfo: secretInfo: rgwUserSecrets: - name: user-a secretName: <user-aCredSecretName> secretNamespace: <user-aCredSecretNamespace> - name: user-t secretName: <user-tCredSecretName> secretNamespace: <user-tCredSecretNamespace>
Obtain S3 user credentials from the cluster secrets. Specify an access key and a secret key for both users:
kubectl --kubeconfig <managedKubeconfig> -n <user-aCredSecretNamespace> get secret <user-aCredSecretName> -o jsonpath='{.data.AccessKey}' | base64 -d kubectl --kubeconfig <managedKubeconfig> -n <user-aCredSecretNamespace> get secret <user-aCredSecretName> -o jsonpath='{.data.SecretKey}' | base64 -d kubectl --kubeconfig <managedKubeconfig> -n <user-tCredSecretNamespace> get secret <user-tCredSecretName> -o jsonpath='{.data.AccessKey}' | base64 -d kubectl --kubeconfig <managedKubeconfig> -n <user-tCredSecretNamespace> get secret <user-tCredSecretName> -o jsonpath='{.data.SecretKey}' | base64 -d
Substitute
<managementKubeconfig>with a management clusterkubeconfigand specify the correspondingsecretNamespaceandsecretNamefor both users.Obtain Ceph Object Storage public endpoint from the
KaaSCephClusterstatus:kubectl --kubeconfig <managementKubeconfig> -n <managedClusterProject> get kaascephcluster -o yaml | grep PublicEndpoint
Substitute
<managementKubeconfig>with a management clusterkubeconfigfile and<managedClusterProject>with a managed cluster project name.Example of a positive system response:
objectStorePublicEndpoint: https://object-storage.mirantis.example.comObtain the CA certificate to use an HTTPS endpoint:
kubectl --kubeconfig <managedKubeconfig> -n rook-ceph get secret $(kubectl -n rook-ceph get ingress -o jsonpath='{.items[0].spec.tls[0].secretName}{"\n"}') -o jsonpath='{.data.ca\.crt}' | base64 -d; echo
Save the output to
ca.crt.
Set a bucket policy for a Ceph Object Storage user
Available since 2.23.1 (Cluster release 12.7.0)
Warning
This procedure is valid for MOSK clusters that use the deprecated
KaaSCephCluster custom resource (CR) instead of the MiraCeph CR that is
available since MOSK 25.2 as a new Ceph configuration entrypoint. For the
equivalent procedure with the MiraCeph CR, refer to the following section:
Amazon S3 is an object storage service with different access policies. A bucket policy is a resource-based policy that grants permissions to a bucket and objects in it. For more details, see Amazon S3 documentation: Using bucket policies .
The following procedure illustrates the process of setting a bucket policy for
a bucket (test01) stored in a Ceph Object Storage. The bucket policy
requires at least two users: a bucket owner (user-a) and a bucket user
(user-t). The bucket owner creates the bucket and sets the policy that
regulates access for the bucket user.
Caution
For user name, apply the UUID format with no capital letters.
To configure an Amazon S3 bucket policy:
Note
The s3cmd is a free command-line tool and client for uploading, retrieving, and managing data in Amazon S3 and other cloud storage service providers that use the S3 protocol. You can download the s3cmd CLI tool from Amazon S3 tools: Download s3cmd.
Configure the s3cmd client with the
user-acredentials:s3cmd --configure --ca-certs=ca.crt
Specify the bucket access parameters as required:
Bucket access parameters¶ Parameter
Description
Comment
Access KeyPublic part of access credentials.
Specify a user access key.
Secret KeySecret part of access credentials.
Specify a user secret key.
Default RegionRegion of AWS servers where requests are sent by default.
Use the default value.
S3 EndpointConnection point to the Ceph Object Storage.
Specify the Ceph Object Storage public endpoint.
DNS-style bucket+hostname:port template for accessing a bucketBucket location.
Specify the Ceph Object Storage public endpoint.
Path to GPG programPath to the GNU Privacy Guard encryption suite.
Use the default value.
Use HTTPS protocolHTTPS protocol switch.
Specify
Yes.HTTP Proxy server nameHTTP Proxy server name.
Skip this parameter.
When configured correctly, the s3cmd tool connects to the Ceph Object Storage. Save new settings when prompted by the system.
As
user-a, create a new buckettest01:s3cmd mb s3://test01
Example of a positive system response:
Bucket 's3://test01/' created
Upload an object to the bucket:
touch test.txt s3cmd put test.txt s3://test01
Example of a positive system response:
upload: 'test.txt' -> 's3://test01/test.txt' [1 of 1] 0 of 0 0% in 0s 0.00 B/s done
Verify that the object is in the
test01bucket:s3cmd ls s3://test01
Example of a positive system response:
2022-09-02 13:06 0 s3://test01/test.txt
Create the bucket policy file and add bucket CRUD permissions for
user-t:{ "Version": "2012-10-17", "Id": "S3Policy1", "Statement": [ { "Sid": "BucketAllow", "Effect": "Allow", "Principal": { "AWS": ["arn:aws:iam:::user/user-t"] }, "Action": [ "s3:ListBucket", "s3:PutObject", "s3:GetObject" ], "Resource": [ "arn:aws:s3:::test01", "arn:aws:s3:::test01/*" ] } ] }
Set the bucket policy for the
test01bucket:s3cmd setpolicy policy.json s3://test01
Example of a positive system response:
s3://test01/: Policy updated
Verify that the
user-thas access for thetest01bucket by reconfiguring the s3cmd client with theuser-tcredentials:s3cmd --ca-certs=ca.crt --configure
Specify the bucket access parameters in a similar to the step 1 manner.
When configured correctly, the s3cmd tool connects to the Ceph Object Storage. Save new settings when prompted by the system.
Verify that the
user-tcan read the buckettest01content:s3cmd ls s3://test01
Example of a positive system response:
2022-09-02 13:06 0 s3://test01/test.txt
Download the object from the
test01bucket:s3cmd get s3://test01/test.txt check.txt
Example of a positive system response:
download: 's3://test01/test.txt' -> 'check.txt' [1 of 1] 0 of 0 0% in 0s 0.00 B/s done
Upload a new object to the
test01bucket:s3cmd put check.txt s3://test01
Example of a positive system response:
upload: 'check.txt' -> 's3://test01/check.txt' [1 of 1] 0 of 0 0% in 0s 0.00 B/s done
Verify that the object is in the
test01bucket:s3cmd ls s3://test01
Example of a positive system response:
2022-09-02 14:41 0 s3://test01/check.txt 2022-09-02 13:06 0 s3://test01/test.txt
Verify the new object by reconfiguring the s3cmd client with the
user-acredentials:s3cmd --configure --ca-certs=ca.crt
List
test01bucket objects:s3cmd ls s3://test01
Example of a positive system response:
2022-09-02 14:41 0 s3://test01/check.txt 2022-09-02 13:06 0 s3://test01/test.txt
Set a bucket policy for OpenStack users
Warning
This procedure is valid for MOSK clusters that use the deprecated
KaaSCephCluster custom resource (CR) instead of the MiraCeph CR that is
available since MOSK 25.2 as a new Ceph configuration entrypoint. For the
equivalent procedure with the MiraCeph CR, refer to the following section:
The following procedure illustrates the process of setting a bucket policy for a bucket between two OpenStack users.
Due to specifics of the Ceph integration with OpenStack projects, you should configure the bucket policy for OpenStack users indirectly through setting permissions for corresponding OpenStack projects.
For illustration purposes, we use the following names in the procedure:
test01for the bucketuser-a,user-tfor the OpenStack usersproject-a,project-tfor the OpenStack projects
To configure an Amazon S3 bucket policy for OpenStack users:
Specify the
rookConfigparameter in thecephClusterSpecsection of theKaaSCephClustercustom resource:spec: cephClusterSpec: rookConfig: rgw keystone implicit tenants: "swift"
Prepare the Ceph Object Storage similarly to the procedure described in Create Ceph Object Storage users.
Create two OpenStack projects:
openstack project create project-a openstack project create project-t
Example of system response:
+-------------+----------------------------------+ | Field | Value | +-------------+----------------------------------+ | description | | | domain_id | default | | enabled | True | | id | faf957b776874a2e80384cb882ebf6ab | | is_domain | False | | name | project-a | | options | {} | | parent_id | default | | tags | [] | +-------------+----------------------------------+
You can also use existing projects. Save the ID of each project for the bucket policy specification.
Note
For details how to access OpenStack CLI, refer Access your OpenStack environment.
Create an OpenStack user for each project:
openstack user create user-a --project project-a openstack user create user-t --project project-t
Example of system response:
+---------------------+----------------------------------+ | Field | Value | +---------------------+----------------------------------+ | default_project_id | faf957b776874a2e80384cb882ebf6ab | | domain_id | default | | enabled | True | | id | cc2607dc383e4494948d68eeb556f03b | | name | user-a | | options | {} | | password_expires_at | None | +---------------------+----------------------------------+
You can also use existing project users.
Assign the
memberrole to the OpenStack users:openstack role add member --user user-a --project project-a openstack role add member --user user-t --project project-t
Verify that the OpenStack users have obtained the
memberroles paying attention to the role IDs:openstack role show member
Example of system response:
+-------------+----------------------------------+ | Field | Value | +-------------+----------------------------------+ | description | None | | domain_id | None | | id | 8f0ce4f6cd61499c809d6169b2b5bd93 | | name | member | | options | {'immutable': True} | +-------------+----------------------------------+
List the role assignments for the
user-aanduser-t:openstack role assignment list --user user-a --project project-a openstack role assignment list --user user-t --project project-t
Example of system response:
+----------------------------------+----------------------------------+-------+----------------------------------+--------+--------+-----------+ | Role | User | Group | Project | Domain | System | Inherited | +----------------------------------+----------------------------------+-------+----------------------------------+--------+--------+-----------+ | 8f0ce4f6cd61499c809d6169b2b5bd93 | cc2607dc383e4494948d68eeb556f03b | | faf957b776874a2e80384cb882ebf6ab | | | False | +----------------------------------+----------------------------------+-------+----------------------------------+--------+--------+-----------+
Create Amazon EC2 credentials for
user-aanduser-t:openstack ec2 credentials create --user user-a --project project-a openstack ec2 credentials create --user user-t --project project-t
Example of system response:
+------------+----------------------------------------------------------------------------------------------------------------------------------------------------------------+ | Field | Value | +------------+----------------------------------------------------------------------------------------------------------------------------------------------------------------+ | access | d03971aedc2442dd9a79b3b409c32046 | | links | {'self': 'http://keystone-api.openstack.svc.cluster.local:5000/v3/users/cc2607dc383e4494948d68eeb556f03b/credentials/OS-EC2/d03971aedc2442dd9a79b3b409c32046'} | | project_id | faf957b776874a2e80384cb882ebf6ab | | secret | 0a9fd8d9e0d24aecacd6e75951154d0f | | trust_id | None | | user_id | cc2607dc383e4494948d68eeb556f03b | +------------+----------------------------------------------------------------------------------------------------------------------------------------------------------------+
Obtain the values from the
accessandsecretfields to connect with Ceph Object Storage trough the s3cmd tool.Note
The s3cmd is a free command-line tool for uploading, retrieving, and managing data in Amazon S3 and other cloud storage service providers that use the S3 protocol. You can download the s3cmd tool from Amazon S3 tools: Download s3cmd.
Create bucket users and configure a bucket policy for the
project-tOpenStack project similarly to the procedure described in Set a bucket policy for a Ceph Object Storage user. Ceph integration does not allow providing permissions for OpenStack users directly. Therefore, you need to set permissions for the project that corresponds to the user:{ "Version": "2012-10-17", "Id": "S3Policy1", "Statement": [ { "Sid": "BucketAllow", "Effect": "Allow", "Principal": { "AWS": ["arn:aws:iam::<PROJECT-T_ID>:root"] }, "Action": [ "s3:ListBucket", "s3:PutObject", "s3:GetObject" ], "Resource": [ "arn:aws:s3:::test01", "arn:aws:s3:::test01/*" ] } ] }
You can configure different bucket policies for various situations. See examples below.
Provide access to a bucket from one OpenStack project to another
{
"Version": "2012-10-17",
"Id": "S3Policy1",
"Statement": [
{
"Sid": "BucketAllow",
"Effect": "Allow",
"Principal": {
"AWS": ["arn:aws:iam::<osProjectId>:root"]
},
"Action": [
"s3:ListBucket",
"s3:PutObject",
"s3:GetObject"
],
"Resource": [
"arn:aws:s3:::<bucketName>",
"arn:aws:s3:::<bucketName>/*"
]
}
]
}
Substitute the following parameters:
<osProjectId>- the target OpenStack project ID<bucketName>- the target bucket name where the policy will be set
Provide access to a bucket from a Ceph Object Storage user to an OpenStack project
{
"Version": "2012-10-17",
"Id": "S3Policy1",
"Statement": [
{
"Sid": "BucketAllow",
"Effect": "Allow",
"Principal": {
"AWS": ["arn:aws:iam::<osProjectId>:root"]
},
"Action": [
"s3:ListBucket",
"s3:PutObject",
"s3:GetObject"
],
"Resource": [
"arn:aws:s3:::<bucketName>",
"arn:aws:s3:::<bucketName>/*"
]
}
]
}
Substitute the following parameters:
<osProjectId>- the target OpenStack project ID<bucketName>- the target bucket name where policy will be set
Provide access to a bucket from an OpenStack user to a Ceph Object Storage user
{
"Version": "2012-10-17",
"Id": "S3Policy1",
"Statement": [
{
"Sid": "BucketAllow",
"Effect": "Allow",
"Principal": {
"AWS": ["arn:aws:iam:::user/<userName>"]
},
"Action": [
"s3:ListBucket",
"s3:PutObject",
"s3:GetObject"
],
"Resource": [
"arn:aws:s3:::<bucketName>",
"arn:aws:s3:::<bucketName>/*"
]
}
]
}
Substitute the following parameters:
<userName>- the target Ceph Object Storage user name<bucketName>- the target bucket name where policy will be set
Provide access to a bucket from one Ceph Object Storage user to another
{
"Version": "2012-10-17",
"Id": "S3Policy1",
"Statement": [
{
"Sid": "BucketAllow",
"Effect": "Allow",
"Principal": {
"AWS": ["arn:aws:iam:::user/<userName>"]
},
"Action": [
"s3:ListBucket",
"s3:PutObject",
"s3:GetObject"
],
"Resource": [
"arn:aws:s3:::<bucketName>",
"arn:aws:s3:::<bucketName>/*"
]
}
]
}
Substitute the following parameters:
<userName>- the target Ceph Object Storage user name<bucketName>- the target bucket name where policy will be set
Calculate target ratio for Ceph pools
Warning
This procedure is valid for MOSK clusters that use the deprecated
KaaSCephCluster custom resource (CR) instead of the MiraCeph CR that is
available since MOSK 25.2 as a new Ceph configuration entrypoint. For the
equivalent procedure with the MiraCeph CR, refer to the following section:
Ceph pool target ratio defines for the Placement Group (PG) autoscaler the amount of data the pools are expected to acquire over time in relation to each other. You can set initial PG values for each Ceph pool. Otherwise, the autoscaler starts with the minimum value and scales up, causing a lot of data to move in the background.
You can allocate several pools to use the same device class, which is a solid
block of available capacity in Ceph. For example, if three pools
(kubernetes-hdd, images-hdd, and volumes-hdd) are set to use the
same device class hdd, you can set the target ratio for Ceph pools to
provide 80% of capacity to the volumes-hdd pool and distribute the
remaining capacity evenly between the two other pools. This way, Ceph pool
target ratio instructs Ceph on when to warn that a pool is running out of free
space and, at the same time, instructs Ceph on how many placement groups Ceph
should allocate/autoscale for a pool for better data distribution.
Ceph pool target ratio is not a constant value and you can change it according to new capacity plans. Once you specify target ratio, if the PG number of a pool scales, other pools with specified target ratio will automatically scale accordingly.
For details, see Ceph Documentation: Autoscaling Placement Groups.
To calculate target ratio for each Ceph pool:
Define raw capacity of the entire storage by device class:
kubectl -n rook-ceph exec -it $(kubectl -n rook-ceph get pod -l "app=rook-ceph-tools" -o name) -- ceph df
For illustration purposes, the procedure below uses raw capacity of 185 TB or 189440 GB.
Design Ceph pools with the considered device class upper bounds of the possible capacity. For example, consider the
hdddevice class that contains the following pools:The
kubernetes-hddpool will contain not more than 2048 GB.The
images-hddpool will contain not more than 2048 GB.The
volumes-hddpool will contain 50 GB per VM. The upper bound of used VMs on the cloud is 204, the pool replicated size is3. Therefore, calculate the upper bounds forvolumes-hdd:50 GB per VM * 204 VMs * 3 replicas = 30600 GB
The
backup-hddpool can be calculated as a relative ofvolumes-hdd. For example, 1volumes-hddstorage unit per 5backup-hddunits.The
vms-hddis a pool for ephemeral storage Copy on Write (CoW). We recommend designing the amount of ephemeral data it should store. For example purposes, we use 500 GB. However, in reality, despite the CoW data reduction, this value is very optimistic.
Note
If
dataPoolis replicated and Ceph Object Store is planned for intensive use, also calculate upper bounds fordataPool.Calculate target ratio for each considered pool. For example:
Example bounds and capacity¶ Pools upper bounds
Pools capacity
kubernetes-hdd= 2048 GBimages-hdd= 2048 GBvolumes-hdd= 30600 GBbackup-hdd= 30600 GB * 5 = 153000 GBvms-hdd= 500 GB
Summary capacity = 188196 GB
Total raw capacity = 189440 GB
Calculate pools fit factor using the (total raw capacity) / (pools summary capacity) formula. For example:
pools fit factor = 189440 / 188196 = 1.0066
Calculate pools upper bounds size using the (pool upper bounds) * (pools fit factor) formula. For example:
kubernetes-hdd = 2048 GB * 1.0066 = 2061.5168 GB images-hdd = 2048 GB * 1.0066 = 2061.5168 GB volumes-hdd = 30600 GB * 1.0066 = 30801.96 GB backup-hdd = 153000 GB * 1.0066 = 154009.8 GB vms-hdd = 500 GB * 1.0066 = 503.3 GB
Calculate pool target ratio using the (pool upper bounds) * 100 / (total raw capacity) formula. For example:
kubernetes-hdd = 2061.5168 GB * 100 / 189440 GB = 1.088 images-hdd = 2061.5168 GB * 100 / 189440 GB = 1.088 volumes-hdd = 30801.96 GB * 100 / 189440 GB = 16.259 backup-hdd = 154009.8 GB * 100 / 189440 GB = 81.297 vms-hdd = 503.3 GB * 100 / 189440 GB = 0.266
If required, calculate the target ratio for erasure-coded pools.
Due to erasure-coded pools splitting each object into
Kdata parts andMcoding parts, the total used storage for each object is less than that in replicated pools. Indeed,Mis equal to the number of OSDs that can be missing from the cluster without the cluster experiencing data loss. This means that planned data is stored with an efficiency of(K+M)/2on the Ceph cluster. For example, if an erasure-coded data pool withK=2, M=2planned capacity is 200 GB, then the total used capacity is200*(2+2)/2, which is 400 GB.Open the
KaasCephClusterCR of a managed cluster for editing:kubectl edit kaascephcluster -n <managedClusterProjectName>
Substitute
<managedClusterProjectName>with the corresponding value.In the
spec.cephClusterSpec.poolssection, specify the calculated relatives astargetSizeRatiofor each considered replicated pool. For example:spec: cephClusterSpec: pools: - name: kubernetes deviceClass: hdd ... replicated: size: 3 targetSizeRatio: 1.088 - name: images deviceClass: hdd ... replicated: size: 3 targetSizeRatio: 1.088 - name: volumes deviceClass: hdd ... replicated: size: 3 targetSizeRatio: 16.259 - name: backup deviceClass: hdd ... replicated: size: 3 targetSizeRatio: 81.297 - name: vms deviceClass: hdd ... replicated: size: 3 targetSizeRatio: 0.266
If Ceph Object Store
dataPoolisreplicatedand a proper value is calculated, also specify it:spec: cephClusterSpec: objectStorage: rgw: name: rgw-store ... dataPool: deviceClass: hdd ... replicated: size: 3 targetSizeRatio: <relative>
In the
spec.cephClusterSpec.poolssection, specify the calculated relatives asparameters.target_size_ratiofor each considered erasure-coded pool. For example:Note
The
parameterssection is a key-value mapping where the value is of the string type and should be quoted.spec: cephClusterSpec: pools: - name: ec-pool deviceClass: hdd ... parameters: target_size_ratio: "<relative>"
If Ceph Object Store
dataPooliserasure-codedand a proper value is calculated, also specify it:spec: cephClusterSpec: objectStorage: rgw: name: rgw-store ... dataPool: deviceClass: hdd ... parameters: target_size_ratio: "<relative>"
Verify that all target ratio has been successfully applied to the Ceph cluster:
kubectl -n rook-ceph exec -it $(kubectl -n rook-ceph get pod -l "app=rook-ceph-tools" -o name) -- ceph osd pool autoscale-status
Example of system response:
POOL SIZE TARGET SIZE RATE RAW CAPACITY RATIO TARGET RATIO EFFECTIVE RATIO BIAS PG_NUM NEW PG_NUM AUTOSCALE device_health_metrics 0 2.0 149.9G 0.0000 1.0 1 on kubernetes-hdd 2068 2.0 149.9G 0.0000 1.088 1.0885 1.0 32 on volumes-hdd 19 2.0 149.9G 0.0000 16.259 16.2591 1.0 256 on vms-hdd 19 2.0 149.9G 0.0000 0.266 0.2661 1.0 128 on backup-hdd 19 2.0 149.9G 0.0000 81.297 81.2972 1.0 256 on images-hdd 888.8M 2.0 149.9G 0.0116 1.088 1.0881 1.0 32 on
Optional. Repeat the steps above for other device classes.
Ceph pools for Cinder multi-backend
Available since MOSK 23.2
Warning
This procedure is valid for MOSK clusters that use the deprecated
KaaSCephCluster custom resource (CR) instead of the MiraCeph CR that is
available since MOSK 25.2 as a new Ceph configuration entrypoint. For the
equivalent procedure with the MiraCeph CR, refer to the following section:
The KaaSCephCluster object supports multiple Ceph pools with the
volumes role to configure Cinder multiple backends.
To define Ceph pools for Cinder multiple backends:
In the
KaaSCephClusterobject, add the desired number of Ceph pools to thepoolssection with thevolumesrole:kubectl -n <MOSKClusterProject> edit kaascephcluster
Substitute
<MOSKClusterProject>with corresponding namespace of the MOSK cluster.Example configuration:
spec: cephClusterSpec: pools: - default: false deviceClass: hdd name: volumes replicated: size: 3 role: volumes - default: false deviceClass: hdd name: volumes-backend-1 replicated: size: 3 role: volumes - default: false deviceClass: hdd name: volumes-backend-2 replicated: size: 3 role: volumes
Verify that Cinder backend pools are created and ready:
kubectl -n <managedClusterProject> get kaascephcluster -o yaml
Example output:
status: fullClusterStatus: blockStorageStatus: poolsStatus: volumes-hdd: present: true status: observedGeneration: 1 phase: Ready volumes-backend-1-hdd: present: true status: observedGeneration: 1 phase: Ready volumes-backend-2-hdd: present: true status: observedGeneration: 1 phase: Ready
Verify that the added Ceph pools are accessible from the Cinder service. For example:
kubectl -n openstack exec -it cinder-volume-0 -- rbd ls -p volumes-backend-1-hdd -n client.cinder kubectl -n openstack exec -it cinder-volume-0 -- rbd ls -p volumes-backend-2-hdd -n client.cinder
After the Ceph pool becomes available, it is automatically specified as an additional Cinder backend and registered as a new volume type, which you can use to create Cinder volumes.
The following sections describe how to configure, manage, and verify specific aspects of a Ceph cluster.
Caution
Before you proceed with any reading or writing operation, first verify the cluster status using the ceph tool as described in Verify the Ceph core services.
Automated Ceph LCM
Warning
This procedure is valid for MOSK clusters that use the deprecated
KaaSCephCluster custom resource (CR) instead of the MiraCeph CR that is
available since MOSK 25.2 as a new Ceph configuration entrypoint. For the
equivalent procedure with the MiraCeph CR, refer to the following section:
This section describes the supported automated Ceph lifecycle management (LCM) operations.
High-level workflow of Ceph OSD or node removal
Warning
This procedure is valid for MOSK clusters that use the deprecated
KaaSCephCluster custom resource (CR) instead of the MiraCeph CR that is
available since MOSK 25.2 as a new Ceph configuration entrypoint. For the
equivalent procedure with the MiraCeph CR, refer to the following section:
The Ceph LCM automated operations such as Ceph OSD or Ceph node removal are
performed by creating a corresponding KaaSCephOperationRequest CR that
creates separate CephOsdRemoveRequest requests. It allows for automated
removal of healthy or non-healthy Ceph OSDs from a Ceph cluster and covers the
following scenarios:
Reducing hardware - all Ceph OSDs are up/in but you want to decrease the number of Ceph OSDs by reducing the number of disks or hosts.
Hardware issues. For example, if a host unexpectedly goes down and will not be restored, or if a disk on a host goes down and requires replacement.
This section describes the KaaSCephOperationRequest CR creation workflow,
specification, and request status.
For step-by-step procedures, refer to Automated Ceph LCM.
Warning
This procedure is valid for MOSK clusters that use the deprecated
KaaSCephCluster custom resource (CR) instead of the MiraCeph CR that is
available since MOSK 25.2 as a new Ceph configuration entrypoint. For the
equivalent procedure with the MiraCeph CR, refer to the following section:
The workflow of creating a Ceph OSD removal request includes the following steps:
Removing obsolete nodes or disks from the
spec.nodessection of theKaaSCephClusterCR as described in Ceph advanced configuration.Note
Note the names of the removed nodes, devices or their paths exactly as they were specified in
KaaSCephClusterfor further usage.Creating a YAML template for the
KaaSCephOperationRequestCR. For details, see KaaSCephOperationRequest OSD removal specification.If
KaaSCephOperationRequestcontains information about Ceph OSDs to remove in a proper format, the information will be validated to eliminate human error and avoid a wrong Ceph OSD removal.If the
osdRemove.nodessection ofKaaSCephOperationRequestis empty, the Ceph Request Controller will automatically detect Ceph OSDs for removal, if any. Auto-detection is based not only on the information provided in theKaaSCephClusterbut also on the information from the Ceph cluster itself.
Once the validation or auto-detection completes, the entire information about the Ceph OSDs to remove appears in the
KaaSCephOperationRequestobject: hosts they belong to, OSD IDs, disks, partitions, and so on. The request then moves to theApproveWaitingphase until the Operator manually specifies theapproveflag in the spec.Manually adding an affirmative
approveflag in theKaaSCephOperationRequestspec. Once done, the Ceph Status Controller reconciliation pauses until the request is handled and executes the following:Stops regular Ceph Controller reconciliation
Removes Ceph OSDs
Runs batch jobs to clean up the device, if possible
Removes host information from the Ceph cluster if the entire Ceph node is removed
Marks the request with an appropriate result with a description of occurred issues
Note
If the request completes successfully, Ceph Controller reconciliation resumes. Otherwise, it remains paused until the issue is resolved.
Reviewing the Ceph OSD removal status. For details, see KaaSCephOperationRequest OSD removal status.
Manual removal of device cleanup jobs.
Note
Device cleanup jobs are not removed automatically and are kept in the
ceph-lcm-mirantisnamespace along with pods containing information about the executed actions. The jobs have the following labels:labels: app: miraceph-cleanup-disks host: <HOST-NAME> osd: <OSD-ID> rook-cluster: <ROOK-CLUSTER-NAME>
Additionally, jobs are labeled with disk names that will be cleaned up, such as
vdb=true. You can remove a single job or a group of jobs using any label described above, such as host, disk, and so on.
Example of KaaSCephOperationRequest resource
apiVersion: kaas.mirantis.com/v1alpha1
kind: KaaSCephOperationRequest
metadata:
name: remove-osd-3-4-request
namespace: managed-namespace
spec:
osdRemove:
approve: true
nodes:
worker-3:
cleanupByDevice:
- name: sdb
- path: /dev/disk/by-path/pci-0000:00:1t.9
kaasCephCluster:
name: ceph-cluster-managed-cluster
namespace: managed-namespace
Example of Ceph OSDs ready for removal
apiVersion: kaas.mirantis.com/v1alpha1
kind: KaaSCephOperationRequest
metadata:
generateName: remove-osds
namespace: managed-ns
spec:
osdRemove: {}
kaasCephCluster:
name: ceph-cluster-managed-cl
namespace: managed-ns
Warning
This procedure is valid for MOSK clusters that use the deprecated
KaaSCephCluster custom resource (CR) instead of the MiraCeph CR that is
available since MOSK 25.2 as a new Ceph configuration entrypoint. For the
equivalent procedure with the MiraCeph CR, refer to the following section:
This section describes the KaaSCephOperationRequest CR specification used
to automatically create a CephOsdRemoveRequest request. For the procedure
workflow, see Creating a Ceph OSD removal request.
Parameter |
Description |
|---|---|
|
Describes the definition for the |
|
Defines spec:
kaasCephCluster:
name: kaas-mgmt
namespace: default
|
Parameter |
Description |
|---|---|
|
Map of Kubernetes nodes that specifies how to remove Ceph OSDs: by host-devices or OSD IDs. For details, see KaaSCephOperationRequest ‘nodes’ parameters spec. |
|
Flag that indicates whether a request is ready to execute removal. Can only be manually enabled by the Operator. For example: spec:
osdRemove:
approve: true
|
|
Flag used to keep requests in handling and not to proceed to the next
request if the If the For example: spec:
osdRemove:
keepOnFail: true
|
|
Optional. Flag that marks a finished request, even if it failed, to keep it in history. It allows resuming the Ceph Controller reconciliation without removing the failed request. The flag is used only by Ceph Controller and has no effect on request processing. Can only be manually specified. For example: spec:
osdRemove:
resolved: true
|
|
Optional. Flag used to resume a failed request and proceed with Ceph OSD
removal if the spec:
osdRemove:
resumeFailed: true
|
Parameter |
Description |
|---|---|
|
Flag used to clean up an entire node and drop it from the CRUSH map.
Mutually exclusive with |
|
List that describes devices to clean up by name or device path as they
were specified in
Warning Since MOSK 23.3, Mirantis does not recommend setting device
|
|
List of Ceph OSD IDs to remove. Mutually exclusive with
|
Example of KaaSCephOperationRequest with
spec.osdRemove.nodes
apiVersion: kaas.mirantis.com/v1alpha1
kind: KaaSCephOperationRequest
metadata:
name: remove-osd-request
namespace: default
spec:
kaasCephCluster:
name: kaas-mgmt
namespace: default
osdRemove:
nodes:
"node-a":
completeCleanUp: true
"node-b":
cleanupByOsdId: [1, 15, 25]
"node-c":
cleanupByDevice:
- name: "sdb"
- path: "/dev/disk/by-path/pci-0000:00:1c.5"
- path: "/dev/disk/by-id/scsi-SATA_HGST_HUS724040AL_PN1334PEHN18ZS"
The example above includes the following actions:
For
node-a, full cleanup, including all OSDs on the node, node drop from the CRUSH map, and cleanup of all disks used for Ceph OSDs on this node.For
node-b, cleanup of Ceph OSDs with IDs1,15, and25along with the related disk information.For
node-c, cleanup of the device with namesdb, the device with path ID/dev/disk/by-path/pci-0000:00:1c.5, and the device withby-id/dev/disk/by-id/scsi-SATA_HGST_HUS724040AL_PN1334PEHN18ZS, dropping of OSDs running on these devices.
Warning
This procedure is valid for MOSK clusters that use the deprecated
KaaSCephCluster custom resource (CR) instead of the MiraCeph CR that is
available since MOSK 25.2 as a new Ceph configuration entrypoint. For the
equivalent procedure with the MiraCeph CR, refer to the following section:
This section describes the status.osdRemoveStatus.removeInfo fields of the
KaaSCephOperationRequest CR that you can use to review a Ceph OSD or node
removal phases. The following diagram represents the phases flow:
Parameter |
Description |
|---|---|
|
Describes the status of the current |
|
The key-value mapping that reflects the management cluster machine names with their corresponding Kubernetes node names. |
Parameter |
Description |
|---|---|
|
Describes the current request phase that can be one of:
|
|
The overall information about the Ceph OSDs to remove: final removal
map, issues, and warnings. Once the The
|
|
Informational messages describing the reason for the request transition to the next phase. |
|
History of spec updates for the request. |
Example of status.osdRemoveStatus.removeInfo after
successful Validation
removeInfo:
cleanUpMap:
"node-a":
completeCleanUp: true
osdMapping:
"2":
deviceMapping:
"sdb":
path: "/dev/disk/by-path/pci-0000:00:0a.0"
partition: "/dev/ceph-a-vg_sdb/osd-block-b-lv_sdb"
type: "block"
class: "hdd"
zapDisk: true
"6":
deviceMapping:
"sdc":
path: "/dev/disk/by-path/pci-0000:00:0c.0"
partition: "/dev/ceph-a-vg_sdc/osd-block-b-lv_sdc-1"
type: "block"
class: "hdd"
zapDisk: true
"11":
deviceMapping:
"sdc":
path: "/dev/disk/by-path/pci-0000:00:0c.0"
partition: "/dev/ceph-a-vg_sdc/osd-block-b-lv_sdc-2"
type: "block"
class: "hdd"
zapDisk: true
"node-b":
osdMapping:
"1":
deviceMapping:
"sdb":
path: "/dev/disk/by-path/pci-0000:00:0a.0"
partition: "/dev/ceph-b-vg_sdb/osd-block-b-lv_sdb"
type: "block"
class: "ssd"
zapDisk: true
"15":
deviceMapping:
"sdc":
path: "/dev/disk/by-path/pci-0000:00:0b.1"
partition: "/dev/ceph-b-vg_sdc/osd-block-b-lv_sdc"
type: "block"
class: "ssd"
zapDisk: true
"25":
deviceMapping:
"sdd":
path: "/dev/disk/by-path/pci-0000:00:0c.2"
partition: "/dev/ceph-b-vg_sdd/osd-block-b-lv_sdd"
type: "block"
class: "ssd"
zapDisk: true
"node-c":
osdMapping:
"0":
deviceMapping:
"sdb":
path: "/dev/disk/by-path/pci-0000:00:1t.9"
partition: "/dev/ceph-c-vg_sdb/osd-block-c-lv_sdb"
type: "block"
class: "hdd"
zapDisk: true
"8":
deviceMapping:
"sde":
path: "/dev/disk/by-path/pci-0000:00:1c.5"
partition: "/dev/ceph-c-vg_sde/osd-block-c-lv_sde"
type: "block"
class: "hdd"
zapDisk: true
"sdf":
path: "/dev/disk/by-path/pci-0000:00:5a.5",
partition: "/dev/ceph-c-vg_sdf/osd-db-c-lv_sdf-1",
type: "db",
class: "ssd"
The example above is based on the example spec provided in
KaaSCephOperationRequest OSD removal specification.
During the Validation phase, the provided information was validated and
reflects the final map of the Ceph OSDs to remove:
For
node-a, Ceph OSDs with IDs2,6, and11will be removed with the related disk and its information: all block devices, names, paths, and disk class.For
node-b, the Ceph OSDs with IDs1,15, and25will be removed with the related disk information.For
node-c, the Ceph OSD with ID8will be removed, which is placed on the specifiedsdbdevice. The related partition on thesdfdisk, which is used as the BlueStore metadata device, will be cleaned up keeping the disk itself untouched. Other partitions on that device will not be touched.
Example of removeInfo with removeStatus succeeded
removeInfo:
cleanUpMap:
"node-a":
completeCleanUp: true
hostRemoveStatus:
status: Removed
osdMapping:
"2":
removeStatus:
osdRemoveStatus:
status: Removed
deploymentRemoveStatus:
status: Removed
name: "rook-ceph-osd-2"
deviceCleanUpJob:
status: Finished
name: "job-name-for-osd-2"
deviceMapping:
"sdb":
path: "/dev/disk/by-path/pci-0000:00:0a.0"
partition: "/dev/ceph-a-vg_sdb/osd-block-b-lv_sdb"
type: "block"
class: "hdd"
zapDisk: true
Example of removeInfo with removeStatus failed
removeInfo:
cleanUpMap:
"node-a":
completeCleanUp: true
osdMapping:
"2":
removeStatus:
osdRemoveStatus:
errorReason: "retries for cmd ‘ceph osd ok-to-stop 2’ exceeded"
status: Failed
deviceMapping:
"sdb":
path: "/dev/disk/by-path/pci-0000:00:0a.0"
partition: "/dev/ceph-a-vg_sdb/osd-block-b-lv_sdb"
type: "block"
class: "hdd"
zapDisk: true
Example of removeInfo with removeStatus failed by timeout
removeInfo:
cleanUpMap:
"node-a":
completeCleanUp: true
osdMapping:
"2":
removeStatus:
osdRemoveStatus:
errorReason: Timeout (30m0s) reached for waiting pg rebalance for osd 2
status: Failed
deviceMapping:
"sdb":
path: "/dev/disk/by-path/pci-0000:00:0a.0"
partition: "/dev/ceph-a-vg_sdb/osd-block-b-lv_sdb"
type: "block"
class: "hdd"
zapDisk: true
Note
In case of failures similar to the examples above, review the
ceph-request-controller logs and the Ceph cluster status. Such failures
may simply indicate timeout and retry issues. If no other issues were found,
re-create the request with a new name and skip adding successfully removed
Ceph OSDS or Ceph nodes.
Add, remove, or reconfigure Ceph nodes
Warning
This procedure is valid for MOSK clusters that use the deprecated
KaaSCephCluster custom resource (CR) instead of the MiraCeph CR that is
available since MOSK 25.2 as a new Ceph configuration entrypoint. For the
equivalent procedure with the MiraCeph CR, refer to the following section:
Mirantis Ceph Controller simplifies a Ceph cluster management by automating LCM operations. This section describes how to add, remove, or reconfigure Ceph nodes.
Note
When adding a Ceph node with the Ceph Monitor role, if any issues occur with
the Ceph Monitor, rook-ceph removes it and adds a new Ceph Monitor instead,
named using the next alphabetic character in order. Therefore, the Ceph Monitor
names may not follow the alphabetical order. For example, a, b, d,
instead of a, b, c.
Prepare a new machine for the required managed cluster as described in Add a machine. During machine preparation, update the settings of the related bare metal host profile for the Ceph node being replaced with the required machine devices as described in Create a custom bare metal host profile.
Open the
KaasCephClusterCR of a managed cluster for editing:kubectl edit kaascephcluster -n <managedClusterProjectName>
Substitute
<managedClusterProjectName>with the corresponding value.In the
nodessection, specify the parameters for a Ceph node as required. For the parameters description, see Node parameters.The example configuration of the
nodessection with the new node:Example configuration with
storageDevices:nodes: kaas-node-5bgk6: roles: - mon - mgr storageDevices: - config: deviceClass: hdd fullPath: /dev/disk/by-id/scsi-SATA_HGST_HUS724040AL_PN1334PEHN18ZS
Example configuration with
storageDeviceFilter:kaas-node-5bgk6: roles: - mon - mgr storageDeviceFilter: config: deviceClass: hdd filterByPath: "^/dev/disk/by-id/scsi-SATA_HGST_.+$""
nodes: kaas-node-5bgk6: roles: - mon - mgr storageDevices: - config: deviceClass: hdd fullPath: /dev/disk/by-id/scsi-SATA_HGST_HUS724040AL_PN1334PEHN18ZS
nodes: kaas-node-5bgk6: roles: - mon - mgr storageDevices: - config: deviceClass: hdd name: sdb
Warning
Since MOSK 23.3, Mirantis highly recommends using the non-wwn
by-idsymlinks to specify storage devices in thestorageDeviceslist. For details, see Addressing storage devices prior to MOSK 25.2.Note
To use a new Ceph node for a Ceph Monitor or Ceph Manager deployment, also specify the
rolesparameter.Reducing the number of Ceph Monitors is not supported and causes the Ceph Monitor daemons removal from random nodes.
Removal of the
mgrrole in thenodessection of theKaaSCephClusterCR does not remove Ceph Managers. To remove a Ceph Manager from a node, remove it from thenodesspec and manually delete themgrpod in the Rook namespace.
Verify that all new Ceph daemons for the specified node have been successfully deployed in the Ceph cluster. The
fullClusterInfosection should not contain any issues.kubectl -n <managedClusterProjectName> get kaascephcluster -o yaml
Example of system response
status: fullClusterInfo: daemonsStatus: mgr: running: a is active mgr status: Ok mon: running: '3/3 mons running: [a b c] in quorum' status: Ok osd: running: '3/3 running: 3 up, 3 in' status: Ok
Note
Ceph node removal presupposes usage of a KaaSCephOperationRequest
CR. For workflow overview, spec and phases description, see
High-level workflow of Ceph OSD or node removal.
Note
To remove a Ceph node with a mon role, first move the Ceph
Monitor to another node and remove the mon role from the Ceph node as
described in Move a Ceph Monitor daemon to another node.
Open the
KaasCephClusterCR of a managed cluster for editing:kubectl edit kaascephcluster -n <managedClusterProjectName>
Substitute
<managedClusterProjectName>with the corresponding value.In the
spec.cephClusterSpec.nodes.<machineName>section, remove the required Ceph OSD node specification.Caution
If any other roles are present on the node, remove only the Ceph OSD specification for the node.
For example:
spec: cephClusterSpec: nodes: worker-5: # remove the entire entry for the required node storageDevices: {...} roles: [...]
Create a YAML template for the
KaaSCephOperationRequestCR. For example:apiVersion: kaas.mirantis.com/v1alpha1 kind: KaaSCephOperationRequest metadata: name: remove-osd-worker-5 namespace: <managedClusterProjectName> spec: osdRemove: nodes: worker-5: completeCleanUp: true kaasCephCluster: name: <kaasCephClusterName> namespace: <managedClusterProjectName>
Substitute
<managedClusterProjectName>with the corresponding cluster namespace and<kaasCephClusterName>with the correspondingKaaSCephClustername.Apply the template on the management cluster in the corresponding namespace:
kubectl apply -f remove-osd-worker-5.yaml
Verify that the corresponding request has been created:
kubectl get kaascephoperationrequest remove-osd-worker-5 -n <managedClusterProjectName>
Verify that the
removeInfosection appeared in theKaaSCephOperationRequestCRstatus:kubectl -n <managedClusterProjectName> get kaascephoperationrequest remove-osd-worker-5 -o yaml
Example of system response
status: childNodesMapping: kaas-node-d4aac64d-1721-446c-b7df-e351c3025591: worker-5 osdRemoveStatus: removeInfo: cleanUpMap: kaas-node-d4aac64d-1721-446c-b7df-e351c3025591: osdMapping: "10": deviceMapping: sdb: path: "/dev/disk/by-path/pci-0000:00:1t.9" partition: "/dev/ceph-b-vg_sdb/osd-block-b-lv_sdb" type: "block" class: "hdd" zapDisk: true "16": deviceMapping: sdc: path: "/dev/disk/by-path/pci-0000:00:1t.10" partition: "/dev/ceph-b-vg_sdb/osd-block-b-lv_sdc" type: "block" class: "hdd" zapDisk: true
Verify that the
cleanUpMapsection matches the required removal and wait for theApproveWaitingphase to appear instatus:kubectl -n <managedClusterProjectName> get kaascephoperationrequest remove-osd-worker-5 -o yaml
Example of system response:
status: phase: ApproveWaiting
Edit the
KaaSCephOperationRequestCR and set theapproveflag totrue:kubectl -n <managedClusterProjectName> edit kaascephoperationrequest remove-osd-worker-5
For example:
spec: osdRemove: approve: true
Review the status of the
KaaSCephOperationRequestresource request processing. The valuable parameters are as follows:status.phase- the current state of request processingstatus.messages- the description of the current phasestatus.conditions- full history of request processing before the current phasestatus.removeInfo.issuesandstatus.removeInfo.warnings- contain error and warning messages occurred during request processing
Verify that the
KaaSCephOperationRequesthas been completed. For example:status: phase: Completed # or CompletedWithWarnings if there are non-critical issues
Remove the device cleanup jobs:
kubectl delete jobs -n ceph-lcm-mirantis -l app=miraceph-cleanup-disks
There is no hot reconfiguration procedure for existing Ceph OSDs and Ceph Monitors. To reconfigure an existing Ceph node, follow the steps below:
Remove the Ceph node from the Ceph cluster as described in Remove a Ceph node from a managed cluster.
Add the same Ceph node but with a modified configuration as described in Add Ceph nodes on a managed cluster.
Add, remove, or reconfigure Ceph OSDs
Warning
This procedure is valid for MOSK clusters that use the deprecated
KaaSCephCluster custom resource (CR) instead of the MiraCeph CR that is
available since MOSK 25.2 as a new Ceph configuration entrypoint. For the
equivalent procedure with the MiraCeph CR, refer to the following section:
Mirantis Ceph Controller simplifies Ceph cluster management by automating LCM operations. This section describes how to add, remove, or reconfigure Ceph OSDs.
Manually prepare the required machine devices with LVM2 on the existing node because
BareMetalHostProfiledoes not support in-place changes.To add a Ceph OSD to an existing or hot-plugged raw device
If you want to add a Ceph OSD on top of a raw device that already exists on a node or is hot-plugged, add the required device using the following guidelines:
You can add a raw device to a node during node deployment.
If a node supports adding devices without node reboot, you can hot plug a raw device to a node.
If a node does not support adding devices without node reboot, you can hot plug a raw device during node shutdown. In this case, complete the following steps:
Enable maintenance mode on the managed cluster.
Turn off the required node.
Attach the required raw device to the node.
Turn on the required node.
Disable maintenance mode on the managed cluster.
Open the
KaasCephClusterCR of a managed cluster for editing:kubectl edit kaascephcluster -n <managedClusterProjectName>
Substitute
<managedClusterProjectName>with the corresponding value.In the
nodes.<machineName>.storageDevicesornodes.<machineName>.storageDeviceFiltersection, specify parameters for a Ceph OSD as required. For description of parameters, see Node parameters.The example configuration of the
nodessection with the new node:nodes: kaas-node-5bgk6: roles: - mon - mgr storageDevices: - config: # existing item deviceClass: hdd fullPath: /dev/disk/by-id/scsi-SATA_HGST_HUS724040AL_PN1334PEHN18ZS - config: # new item deviceClass: hdd fullPath: /dev/disk/by-id/scsi-0ATA_HGST_HUS724040AL_PN1334PEHN1VBC
nodes: kaas-node-5bgk6: roles: - mon - mgr storageDevices: - config: # existing item deviceClass: hdd name: sdb - config: # new item deviceClass: hdd name: sdc
Warning
Since MOSK 23.3, Mirantis highly recommends using the non-wwn
by-idsymlinks to specify storage devices in thestorageDeviceslist. For details, see Addressing storage devices prior to MOSK 25.2.Verify that the Ceph OSD on the specified node is successfully deployed. The
fullClusterInfosection should not contain any issues.kubectl -n <managedClusterProjectName> get kaascephcluster -o yaml
For example:
status: fullClusterInfo: daemonsStatus: ... osd: running: '3/3 running: 3 up, 3 in' status: Ok
Note
Since MOSK 23.2,
cephDeviceMappingis removed because its large size can potentially exceed the Kubernetes 1.5 MB quota.Verify the Ceph OSD on the managed cluster:
kubectl -n rook-ceph get pod -l app=rook-ceph-osd -o wide | grep <machineName>
Note
Ceph OSD removal presupposes usage of a KaaSCephOperationRequest
CR. For workflow overview, spec and phases description, see
High-level workflow of Ceph OSD or node removal.
Warning
When using the non-recommended Ceph pools replicated.size of
less than 3, Ceph OSD removal cannot be performed. The minimal replica
size equals a rounded up half of the specified replicated.size.
For example, if replicated.size is 2, the minimal replica size is
1, and if replicated.size is 3, then the minimal replica size
is 2. The replica size of 1 allows Ceph having PGs with only one
Ceph OSD in the acting state, which may cause a PG_TOO_DEGRADED
health warning that blocks Ceph OSD removal. Mirantis recommends setting
replicated.size to 3 for each Ceph pool.
Open the
KaasCephClusterCR of a managed cluster for editing:kubectl edit kaascephcluster -n <managedClusterProjectName>
Substitute
<managedClusterProjectName>with the corresponding value.In
spec.cephClusterSpec.nodes.<machineName>, remove the required Ceph OSD specification from thestorageDeviceslist or updatestorageDeviceFilter:The example configuration of the
nodessection with the new node:nodes: kaas-node-5bgk6: roles: - mon - mgr storageDevices: - config: deviceClass: hdd fullPath: /dev/disk/by-id/scsi-SATA_HGST_HUS724040AL_PN1334PEHN18ZS - config: # remove the entire item entry from storageDevices list deviceClass: hdd fullPath: /dev/disk/by-id/scsi-0ATA_HGST_HUS724040AL_PN1334PEHN1VBC
nodes: kaas-node-5bgk6: roles: - mon - mgr storageDevices: - config: deviceClass: hdd name: sdb - config: # remove the entire item entry from storageDevices list deviceClass: hdd name: sdc
Create a YAML template for the
KaaSCephOperationRequestCR. Select from the following options:Remove Ceph OSD by device name,
by-pathsymlink, orby-idsymlink:apiVersion: kaas.mirantis.com/v1alpha1 kind: KaaSCephOperationRequest metadata: name: remove-osd-<machineName>-sdb namespace: <managedClusterProjectName> spec: osdRemove: nodes: <machineName>: cleanupByDevice: - name: sdb kaasCephCluster: name: <kaasCephClusterName> namespace: <managedClusterProjectName>
Substitute
<managedClusterProjectName>with the corresponding cluster namespace and<kaasCephClusterName>with the correspondingKaaSCephClustername.Warning
Since MOSK 23.3, Mirantis does not recommend setting device
nameor deviceby-pathsymlink in thecleanupByDevicefield as these identifiers are not persistent and can change at node boot. Remove Ceph OSDs withby-idsymlinks specified in thepathfield or usecleanupByOsdIdinstead. For details, see Addressing storage devices since MOSK 25.2.Note
Since MOSK 23.1,
cleanupByDeviceis not supported if a device was physically removed from a node. Therefore, usecleanupByOsdIdinstead. For details, see Remove a failed Ceph OSD by Ceph OSD ID.Before MOSK 23.1, if the
storageDeviceitem was specified withby-id, specify thepathparameter in thecleanupByDevicesection instead ofname.If the
storageDeviceitem was specified with aby-pathdevice path, specify thepathparameter in thecleanupByDevicesection instead ofname.
Remove Ceph OSD by OSD ID:
apiVersion: kaas.mirantis.com/v1alpha1 kind: KaaSCephOperationRequest metadata: name: remove-osd-<machineName>-sdb namespace: <managedClusterProjectName> spec: osdRemove: nodes: <machineName>: cleanupByOsdId: - 2 kaasCephCluster: name: <kaasCephClusterName> namespace: <managedClusterProjectName>
Substitute
<managedClusterProjectName>with the corresponding cluster namespace and<kaasCephClusterName>with the correspondingKaaSCephClustername.
Apply the template on the management cluster in the corresponding namespace:
kubectl apply -f remove-osd-<machineName>-sdb.yaml
Verify that the corresponding request has been created:
kubectl get kaascephoperationrequest remove-osd-<machineName>-sdb -n <managedClusterProjectName>
Verify that the
removeInfosection appeared in theKaaSCephOperationRequestCRstatus:kubectl -n <managedClusterProjectName> get kaascephoperationrequest remove-osd-<machineName>-sdb -o yaml
Example of system response:
status: childNodesMapping: kaas-node-d4aac64d-1721-446c-b7df-e351c3025591: <machineName> osdRemoveStatus: removeInfo: cleanUpMap: kaas-node-d4aac64d-1721-446c-b7df-e351c3025591: osdMapping: "10": deviceMapping: sdb: path: "/dev/disk/by-path/pci-0000:00:1t.9" partition: "/dev/ceph-b-vg_sdb/osd-block-b-lv_sdb" type: "block" class: "hdd" zapDisk: true
Verify that the
cleanUpMapsection matches the required removal and wait for theApproveWaitingphase to appear instatus:kubectl -n <managedClusterProjectName> get kaascephoperationrequest remove-osd-<machineName>-sdb -o yaml
Example of system response:
status: phase: ApproveWaiting
Edit the
KaaSCephOperationRequestCR and set theapproveflag totrue:kubectl -n <managedClusterProjectName> edit kaascephoperationrequest remove-osd-<machineName>-sdb
For example:
spec: osdRemove: approve: true
Review the following
statusfields of the Ceph LCM CR request processing:status.phase- current state of request processingstatus.messages- description of the current phasestatus.conditions- full history of request processing before the current phasestatus.removeInfo.issuesandstatus.removeInfo.warnings- error and warning messages occurred during request processing, if any
Verify that the
KaaSCephOperationRequesthas been completed. For example:status: phase: Completed # or CompletedWithWarnings if there are non-critical issues
Remove the device cleanup jobs:
kubectl delete jobs -n ceph-lcm-mirantis -l app=miraceph-cleanup-disks
There is no hot reconfiguration procedure for existing Ceph OSDs. To reconfigure an existing Ceph node, follow the steps below:
Remove a Ceph OSD from the Ceph cluster as described in Remove a Ceph OSD from a managed cluster.
Add the same Ceph OSD but with a modified configuration as described in Add a Ceph OSD on a managed cluster.
Add, remove, or reconfigure Ceph OSDs with metadata devices
Warning
This procedure is valid for MOSK clusters that use the deprecated
KaaSCephCluster custom resource (CR) instead of the MiraCeph CR that is
available since MOSK 25.2 as a new Ceph configuration entrypoint. For the
equivalent procedure with the MiraCeph CR, refer to the following section:
Mirantis Ceph Controller simplifies Ceph cluster management by automating LCM operations. This section describes how to add, remove, or reconfigure Ceph OSDs with a separate metadata device.
From the Ceph disks defined in the
BareMetalHostProfileobject that was configured using the Configure Ceph disks in a host profile procedure, select one disk for data and one logical volume for metadata of a Ceph OSD to be added to the Ceph cluster.Note
If you add a new disk after machine provisioning, manually prepare the required machine devices using Logical Volume Manager (LVM) 2 on the existing node because
BareMetalHostProfiledoes not support in-place changes.To add a Ceph OSD to an existing or hot-plugged raw device
If you want to add a Ceph OSD on top of a raw device that already exists on a node or is hot-plugged, add the required device using the following guidelines:
You can add a raw device to a node during node deployment.
If a node supports adding devices without node reboot, you can hot plug a raw device to a node.
If a node does not support adding devices without node reboot, you can hot plug a raw device during node shutdown. In this case, complete the following steps:
Enable maintenance mode on the managed cluster.
Turn off the required node.
Attach the required raw device to the node.
Turn on the required node.
Disable maintenance mode on the managed cluster.
Open the
KaasCephClusterobject for editing:kubectl -n <managedClusterProjectName> edit kaascephcluster
Substitute
<managedClusterProjectName>with the corresponding value.In the
nodes.<machineName>.storageDevicessection, specify the parameters for a Ceph OSD as required. For the parameters description, see Node parameters.The example configuration of the
nodessection with the new node:nodes: kaas-node-5bgk6: roles: - mon - mgr storageDevices: - config: # existing item deviceClass: hdd fullPath: /dev/disk/by-id/scsi-SATA_HGST_HUS724040AL_PN1334PEHN18ZS - config: # new item deviceClass: hdd metadataDevice: /dev/bluedb/meta_1 fullPath: /dev/disk/by-id/scsi-0ATA_HGST_HUS724040AL_PN1334PEHN1VBC
nodes: kaas-node-5bgk6: roles: - mon - mgr storageDevices: - config: # existing item deviceClass: hdd name: sdb - config: # new item deviceClass: hdd metadataDevice: /dev/bluedb/meta_1 name: sdc
Warning
Since MOSK 23.3, Mirantis highly recommends using the non-wwn
by-idsymlinks to specify storage devices in thestorageDeviceslist. For details, see Addressing storage devices prior to MOSK 25.2.Verify that the Ceph OSD is successfully deployed on the specified node:
kubectl -n <managedClusterProjectName> get kaascephcluster -o yaml
In the system response, the
fullClusterInfosection should not contain any issues.Example of a successful system response:
status: fullClusterInfo: daemonsStatus: ... osd: running: '4/4 running: 4 up, 4 in' status: Ok
Obtain the name of the node on which the machine with the Ceph OSD is running:
kubectl -n <managedClusterProjectName> get machine <machineName> -o jsonpath='{.status.nodeRef.name}'
Substitute
<managedClusterProjectName>and<machineName>with corresponding values.Verify the Ceph OSD status:
kubectl -n rook-ceph get pod -l app=rook-ceph-osd -o wide | grep <nodeName>
Substitute
<nodeName>with the value obtained on the previous step.Example of system response:
rook-ceph-osd-0-7b8d4d58db-f6czn 1/1 Running 0 42h 10.100.91.6 kaas-node-6c5e76f9-c2d2-4b1a-b047-3c299913a4bf <none> <none> rook-ceph-osd-1-78fbc47dc5-px9n2 1/1 Running 0 21h 10.100.91.6 kaas-node-6c5e76f9-c2d2-4b1a-b047-3c299913a4bf <none> <none> rook-ceph-osd-3-647f8d6c69-87gxt 1/1 Running 0 21h 10.100.91.6 kaas-node-6c5e76f9-c2d2-4b1a-b047-3c299913a4bf <none> <none>
Note
Ceph OSD removal implies the usage of the
KaaSCephOperationRequest custom resource (CR). For workflow overview,
spec and phases description, see High-level workflow of Ceph OSD or node removal.
Warning
When using the non-recommended Ceph pools replicated.size of
less than 3, Ceph OSD removal cannot be performed. The minimal replica
size equals a rounded up half of the specified replicated.size.
For example, if replicated.size is 2, the minimal replica size is
1, and if replicated.size is 3, then the minimal replica size
is 2. The replica size of 1 allows Ceph having PGs with only one
Ceph OSD in the acting state, which may cause a PG_TOO_DEGRADED
health warning that blocks Ceph OSD removal. Mirantis recommends setting
replicated.size to 3 for each Ceph pool.
Open the
KaasCephClusterobject of the managed cluster for editing:kubectl edit kaascephcluster -n <managedClusterProjectName>
Substitute
<managedClusterProjectName>with the corresponding value.Remove the required Ceph OSD specification from the
spec.cephClusterSpec.nodes.<machineName>.storageDeviceslist:The example configuration of the
nodessection with the new node:nodes: kaas-node-5bgk6: roles: - mon - mgr storageDevices: - config: deviceClass: hdd fullPath: /dev/disk/by-id/scsi-SATA_HGST_HUS724040AL_PN1334PEHN18ZS - config: # remove the entire item entry from storageDevices list deviceClass: hdd metadataDevice: /dev/bluedb/meta_1 fullPath: /dev/disk/by-id/scsi-0ATA_HGST_HUS724040AL_PN1334PEHN1VBC
nodes: kaas-node-5bgk6: roles: - mon - mgr storageDevices: - config: deviceClass: hdd name: sdb - config: # remove the entire item entry from storageDevices list deviceClass: hdd metadataDevice: /dev/bluedb/meta_1 name: sdc
Create a YAML template for the
KaaSCephOperationRequestCR. For example:apiVersion: kaas.mirantis.com/v1alpha1 kind: KaaSCephOperationRequest metadata: name: remove-osd-<machineName>-sdb namespace: <managedClusterProjectName> spec: osdRemove: nodes: <machineName>: cleanupByDevice: - name: sdb kaasCephCluster: name: <kaasCephClusterName> namespace: <managedClusterProjectName>
Substitute
<managedClusterProjectName>with the corresponding cluster namespace and<kaasCephClusterName>with the correspondingKaaSCephClustername.Warning
Since MOSK 23.3, Mirantis does not recommend setting device
nameor deviceby-pathsymlink in thecleanupByDevicefield as these identifiers are not persistent and can change at node boot. Remove Ceph OSDs withby-idsymlinks specified in thepathfield or usecleanupByOsdIdinstead. For details, see Addressing storage devices since MOSK 25.2.Note
Since MOSK 23.1,
cleanupByDeviceis not supported if a device was physically removed from a node. Therefore, usecleanupByOsdIdinstead. For details, see Remove a failed Ceph OSD by Ceph OSD ID.Before MOSK 23.1, if the
storageDeviceitem was specified withby-id, specify thepathparameter in thecleanupByDevicesection instead ofname.If the
storageDeviceitem was specified with aby-pathdevice path, specify thepathparameter in thecleanupByDevicesection instead ofname.
Apply the template on the management cluster in the corresponding namespace:
kubectl apply -f remove-osd-<machineName>-sdb.yaml
Verify that the corresponding request has been created:
kubectl get kaascephoperationrequest remove-osd-<machineName>-sdb -n <managedClusterProjectName>
Verify that the
removeInfosection appeared in theKaaSCephOperationRequestCRstatus:kubectl -n <managedClusterProjectName> get kaascephoperationrequest remove-osd-<machineName>-sdb -o yaml
Example of system response:
status: childNodesMapping: kaas-node-d4aac64d-1721-446c-b7df-e351c3025591: <machineName> osdRemoveStatus: removeInfo: cleanUpMap: kaas-node-d4aac64d-1721-446c-b7df-e351c3025591: osdMapping: "10": deviceMapping: sdb: path: "/dev/disk/by-path/pci-0000:00:1t.9" partition: "/dev/ceph-b-vg_sdb/osd-block-b-lv_sdb" type: "block" class: "hdd" zapDisk: true "5": deviceMapping: /dev/sdc: deviceClass: hdd devicePath: /dev/disk/by-path/pci-0000:00:0f.0 devicePurpose: block usedPartition: /dev/ceph-2d11bf90-e5be-4655-820c-fb4bdf7dda63/osd-block-e41ce9a8-4925-4d52-aae4-e45167cfcf5c zapDisk: true /dev/sdf: deviceClass: hdd devicePath: /dev/disk/by-path/pci-0000:00:12.0 devicePurpose: db usedPartition: /dev/bluedb/meta_1
Verify that the
cleanUpMapsection matches the required removal and wait for theApproveWaitingphase to appear instatus:kubectl -n <managedClusterProjectName> get kaascephoperationrequest remove-osd-<machineName>-sdb -o yaml
Example of system response:
status: phase: ApproveWaiting
In the
KaaSCephOperationRequestCR, set theapproveflag totrue:kubectl -n <managedClusterProjectName> edit kaascephoperationrequest remove-osd-<machineName>-sdb
Configuration snippet:
spec: osdRemove: approve: true
Review the following
statusfields of the Ceph LCM CR request processing:status.phase- current state of request processingstatus.messages- description of the current phasestatus.conditions- full history of request processing before the current phasestatus.removeInfo.issuesandstatus.removeInfo.warnings- error and warning messages occurred during request processing, if any
Verify that the
KaaSCephOperationRequesthas been completed.Example of the positive
status.phasefield:status: phase: Completed # or CompletedWithWarnings if there are non-critical issues
Remove the device cleanup jobs:
kubectl delete jobs -n ceph-lcm-mirantis -l app=miraceph-cleanup-disks
There is no hot reconfiguration procedure for existing Ceph OSDs. To reconfigure an existing Ceph node, remove and re-add a Ceph OSD with a metadata device using the following options:
Since Container Cloud 2.24.0, if metadata device partitions are specified in the
BareMetalHostProfileobject as described in Configure Ceph disks in a host profile, the metadata device definition is an LVM path inmetadataDeviceof theKaaSCephClusterobject.Therefore, automated LCM will clean up the logical volume without removal and it can be reused. For this reason, to reconfigure a partition of a Ceph OSD metadata device:
Remove a Ceph OSD from the Ceph cluster as described in Remove a Ceph OSD with a metadata device.
Add the same Ceph OSD but with a modified configuration as described in Add a Ceph OSD with a metadata device.
Before MOSK 23.2 or if metadata device partitions are not specified in the
BareMetalHostProfileobject as described in Configure Ceph disks in a host profile, the most common definition of a metadata device is a full device name (by-pathorby-id) inmetadataDeviceof theKaaSCephClusterobject for Ceph OSD. For example,metadataDevice: /dev/nvme0n1. In this case, to reconfigure a partition of a Ceph OSD metadata device:Remove a Ceph OSD from the Ceph cluster as described in Remove a Ceph OSD with a metadata device. Automated LCM will clean up the data device and will remove the metadata device partition for the required Ceph OSD.
Reconfigure the metadata device partition manually to use it during addition of a new Ceph OSD.
Manual reconfiguration of a metadata device partition
Log in to the Ceph node running a Ceph OSD to reconfigure.
Find the required metadata device used for Ceph OSDs that should have LVM partitions with the
osd--dbsubstring:lsblk
Example of system response:
... vdf 252:80 0 32G 0 disk ├─ceph--7831901d--398e--415d--8941--e78486f3b019-osd--db--4bdbb0a0--e613--416e--ab97--272f237b7eab │ 253:3 0 16G 0 lvm └─ceph--7831901d--398e--415d--8941--e78486f3b019-osd--db--8f439d5c--1a19--49d5--b71f--3c25ae343303 253:5 0 16G 0 lvm
Capture the volume group UUID and logical volume sizes. In the example above, the volume group UUID is
ceph--7831901d--398e--415d--8941--e78486f3b019and the size is16G.Find the volume group of the metadata device:
vgs
Example of system response:
VG #PV #LV #SN Attr VSize VFree ceph-508c7a6d-db01-4873-98c3-52ab204b5ca8 1 1 0 wz--n- <32.00g 0 ceph-62d84b29-8de5-440c-a6e9-658e8e246af7 1 1 0 wz--n- <32.00g 0 ceph-754e0772-6d0f-4629-bf1d-24cb79f3ee82 1 1 0 wz--n- <32.00g 0 ceph-7831901d-398e-415d-8941-e78486f3b019 1 2 0 wz--n- <48.00g <17.00g lvm_root 1 1 0 wz--n- <61.03g 0
Capture the volume group with the name that matches the prefix of LVM partitions of the metadata device. In the example above, the required volume group is
ceph-7831901d-398e-415d-8941-e78486f3b019.Make a manual LVM partitioning for the new Ceph OSD. Create a new logical volume in the obtained volume group:
lvcreate -L <lvSize> -n <lvName> <vgName>
Substitute the following parameters:
<lvSize>with the previously obtained logical volume size. In the example above, it is16G.<lvName>with a new logical volume name. For example,meta_1.<vgName>with the previously obtained volume group name. In the example above, it isceph-7831901d-398e-415d-8941-e78486f3b019.
Note
Manually created partitions can be removed only manually, or during a complete metadata disk removal, or during the
Machineobject removal or re-provisioning.
Add the same Ceph OSD but with a modified configuration and manually created logical volume of the metadata device as described in Add a Ceph OSD with a metadata device.
For example, instead of
metadataDevice: /dev/bluedb/meta_1definemetadataDevice: /dev/ceph-7831901d-398e-415d-8941-e78486f3b019/meta_1that was manually created in the previous step.
Replace a failed Ceph OSD
Warning
This procedure is valid for MOSK clusters that use the deprecated
KaaSCephCluster custom resource (CR) instead of the MiraCeph CR that is
available since MOSK 25.2 as a new Ceph configuration entrypoint. For the
equivalent procedure with the MiraCeph CR, refer to the following section:
After a physical disk replacement, you can use Ceph LCM API to redeploy a failed Ceph OSD. The common flow of replacing a failed Ceph OSD is as follows:
Remove the obsolete Ceph OSD from the Ceph cluster by device name, by Ceph OSD ID, or by path.
Add a new Ceph OSD on the new disk to the Ceph cluster.
Note
Ceph OSD replacement presupposes usage of a
KaaSCephOperationRequest CR. For workflow overview, spec and phases
description, see High-level workflow of Ceph OSD or node removal.
Warning
The procedure below presuppose that the operator knows the exact
device name, by-path, or by-id of the replaced device, as well as on
which node the replacement occurred.
Warning
Since Container Cloud 2.23.1 (Cluster release 12.7.0),
a Ceph OSD removal using by-path, by-id, or device name is not
supported if a device was physically removed from a node. Therefore, use
cleanupByOsdId instead. For details, see
Remove a failed Ceph OSD by Ceph OSD ID.
Warning
Since MOSK 23.3, Mirantis does not recommend setting device
name or device by-path symlink in the cleanupByDevice field
as these identifiers are not persistent and can change at node boot. Remove
Ceph OSDs with by-id symlinks specified in the path field or use
cleanupByOsdId instead. For details, see Addressing storage devices since MOSK 25.2.
Open the
KaasCephClusterCR of a managed cluster for editing:kubectl edit kaascephcluster -n <managedClusterProjectName>
Substitute
<managedClusterProjectName>with the corresponding value.In the
nodessection, remove the required device fromstorageDevicesor updatestorageDeviceFilterregexp accordingly. For example:spec: cephClusterSpec: nodes: <machineName>: storageDevices: - name: <deviceName> # remove the entire item from storageDevices list # fullPath: <deviceByPath> if device is specified with symlink instead of name config: deviceClass: hdd
Substitute
<machineName>with the machine name of the node where the device<deviceName>or<deviceByPath>is going to be replaced.Save
KaaSCephClusterand close the editor.Create a
KaaSCephOperationRequestCR template and save it asreplace-failed-osd-<machineName>-<deviceName>-request.yaml:apiVersion: kaas.mirantis.com/v1alpha1 kind: KaaSCephOperationRequest metadata: name: replace-failed-osd-<machineName>-<deviceName> namespace: <managedClusterProjectName> spec: osdRemove: nodes: <machineName>: cleanupByDevice: - name: <deviceName> # If a device is specified with by-path or by-id instead of # name, path: <deviceByPath> or <deviceById>. kaasCephCluster: name: <kaasCephClusterName> namespace: <managedClusterProjectName>
Substitute
<kaasCephClusterName>with the correspondingKaaSCephClusterresource from the<managedClusterProjectName>namespace.Apply the template to the cluster:
kubectl apply -f replace-failed-osd-<machineName>-<deviceName>-request.yaml
Verify that the corresponding request has been created:
kubectl get kaascephoperationrequest -n <managedClusterProjectName>
Verify that the
removeInfosection appeared in theKaaSCephOperationRequestCRstatus:kubectl -n <managedClusterProjectName> get kaascephoperationrequest replace-failed-osd-<machineName>-<deviceName> -o yaml
Example of system response:
status: childNodesMapping: <nodeName>: <machineName> osdRemoveStatus: removeInfo: cleanUpMap: <nodeName>: osdMapping: <osdId>: deviceMapping: <dataDevice>: deviceClass: hdd devicePath: <dataDeviceByPath> devicePurpose: block usedPartition: /dev/ceph-d2d3a759-2c22-4304-b890-a2d87e056bd4/osd-block-ef516477-d2da-492f-8169-a3ebfc3417e2 zapDisk: true
Definition of values in angle brackets:
<machineName>- name of the machine on which the device is being replaced, for example,worker-1<nodeName>- underlying node name of the machine, for example,kaas-node-5a74b669-7e53-4535-aabd-5b509ec844af<osdId>- Ceph OSD ID for the device being replaced, for example,1<dataDeviceByPath>-by-pathof the device placed on the node, for example,/dev/disk/by-path/pci-0000:00:1t.9<dataDevice>- name of the device placed on the node, for example,/dev/sdb
Verify that the
cleanUpMapsection matches the required removal and wait for theApproveWaitingphase to appear instatus:kubectl -n <managedClusterProjectName> get kaascephoperationrequest replace-failed-osd-<machineName>-<deviceName> -o yaml
Example of system response:
status: phase: ApproveWaiting
Edit the
KaaSCephOperationRequestCR and set theapproveflag totrue:kubectl -n <managedClusterProjectName> edit kaascephoperationrequest replace-failed-osd-<machineName>-<deviceName>
For example:
spec: osdRemove: approve: true
Review the following
statusfields of the Ceph LCM CR request processing:status.phase- current state of request processingstatus.messages- description of the current phasestatus.conditions- full history of request processing before the current phasestatus.removeInfo.issuesandstatus.removeInfo.warnings- error and warning messages occurred during request processing, if any
Verify that the
KaaSCephOperationRequesthas been completed. For example:status: phase: Completed # or CompletedWithWarnings if there are non-critical issues
Remove the device cleanup jobs:
kubectl delete jobs -n ceph-lcm-mirantis -l app=miraceph-cleanup-disks
Caution
The procedure below presupposes that the operator knows only the failed Ceph OSD ID.
Identify the node and device names used by the affected Ceph OSD:
Using the Ceph CLI in the
rook-ceph-toolsPod, run:kubectl -n rook-ceph exec -it deploy/rook-ceph-tools -- ceph osd metadata <osdId>
Substitute
<osdId>with the affected OSD ID.Example output:
{ "id": 1, ... "bluefs_db_devices": "vdc", ... "bluestore_bdev_devices": "vde", ... "devices": "vdc,vde", ... "hostname": "kaas-node-6c5e76f9-c2d2-4b1a-b047-3c299913a4bf", ... },
In the example above,
hostnameis the node name anddevicesare all devices used by the affected Ceph OSD.In the
statussection of theKaaSCephClusterCR, obtain theosd-devicemapping:kubectl get kaascephcluster -n <managedClusterProjectName> -o yaml
Substitute
<managedClusterProjectName>with the corresponding value.For example:
status: fullClusterInfo: cephDetails: cephDeviceMapping: <nodeName>: <osdId>: <deviceName>
In the system response, capture the following parameters:
<nodeName>- the corresponding node name that hosts the Ceph OSD<osdId>- the ID of the Ceph OSD to replace<deviceName>- an actual device name to replace
Obtain
<machineName>for<nodeName>where the Ceph OSD is placed:kubectl -n rook-ceph get node -o jsonpath='{range .items[*]}{@.metadata.name}{" "}{@.metadata.labels.kaas\.mirantis\.com\/machine-name}{"\n"}{end}'
Open the
KaasCephClusterCR of a managed cluster for editing:kubectl edit kaascephcluster -n <managedClusterProjectName>
Substitute
<managedClusterProjectName>with the corresponding value.In the
nodessection, remove the required device fromstorageDevicesor update thestorageDeviceFilterregexp accordingly. For example:spec: cephClusterSpec: nodes: <machineName>: storageDevices: - name: <deviceName> # remove the entire item from storageDevices list config: deviceClass: hdd
Substitute
<machineName>with the machine name of the node where the device<deviceName>is going to be replaced.Save
KaaSCephClusterand close the editor.Create a
KaaSCephOperationRequestCR template and save it asreplace-failed-<machineName>-osd-<osdId>-request.yaml:apiVersion: kaas.mirantis.com/v1alpha1 kind: KaaSCephOperationRequest metadata: name: replace-failed-<machineName>-osd-<osdId> namespace: <managedClusterProjectName> spec: osdRemove: nodes: <machineName>: cleanupByOsdId: - <osdId> kaasCephCluster: name: <kaasCephClusterName> namespace: <managedClusterProjectName>
Substitute
<kaasCephClusterName>with the correspondingKaaSCephClusterresource from the<managedClusterProjectName>namespace.Apply the template to the cluster:
kubectl apply -f replace-failed-<machineName>-osd-<osdId>-request.yaml
Verify that the corresponding request has been created:
kubectl get kaascephoperationrequest -n <managedClusterProjectName>
Verify that the
removeInfosection appeared in theKaaSCephOperationRequestCRstatus:kubectl -n <managedClusterProjectName> get kaascephoperationrequest replace-failed-<machineName>-osd-<osdId>-request -o yaml
Example of system response
status: childNodesMapping: <nodeName>: <machineName> osdRemoveStatus: removeInfo: cleanUpMap: <nodeName>: osdMapping: <osdId>: deviceMapping: <dataDevice>: deviceClass: hdd devicePath: <dataDeviceByPath> devicePurpose: block usedPartition: /dev/ceph-d2d3a759-2c22-4304-b890-a2d87e056bd4/osd-block-ef516477-d2da-492f-8169-a3ebfc3417e2 zapDisk: true
Definition of values in angle brackets:
<machineName>- name of the machine on which the device is being replaced, for example,worker-1<nodeName>- underlying node name of the machine, for example,kaas-node-5a74b669-7e53-4535-aabd-5b509ec844af<osdId>- Ceph OSD ID for the device being replaced, for example,1<dataDeviceByPath>-by-pathof the device placed on the node, for example,/dev/disk/by-path/pci-0000:00:1t.9<dataDevice>- name of the device placed on the node, for example,/dev/sdb
Verify that the
cleanUpMapsection matches the required removal and wait for theApproveWaitingphase to appear instatus:kubectl -n <managedClusterProjectName> get kaascephoperationrequest replace-failed-<machineName>-osd-<osdId>-request -o yaml
Example of system response:
status: phase: ApproveWaiting
Edit the
KaaSCephOperationRequestCR and set theapproveflag totrue:kubectl -n <managedClusterProjectName> edit kaascephoperationrequest replace-failed-<machineName>-osd-<osdId>-request
For example:
spec: osdRemove: approve: true
Review the following
statusfields of the Ceph LCM CR request processing:status.phase- current state of request processingstatus.messages- description of the current phasestatus.conditions- full history of request processing before the current phasestatus.removeInfo.issuesandstatus.removeInfo.warnings- error and warning messages occurred during request processing, if any
Verify that the
KaaSCephOperationRequesthas been completed. For example:status: phase: Completed # or CompletedWithWarnings if there are non-critical issues
Remove the device cleanup jobs:
kubectl delete jobs -n ceph-lcm-mirantis -l app=miraceph-cleanup-disks
Note
You can spawn Ceph OSD on a raw device, but it must be clean and without any data or partitions. If you want to add a device that was in use, also ensure it is raw and clean. To clean up all data and partitions from a device, refer to official Rook documentation.
If you want to add a Ceph OSD on top of a raw device that already exists on a node or is hot-plugged, add the required device using the following guidelines:
You can add a raw device to a node during node deployment.
If a node supports adding devices without node reboot, you can hot plug a raw device to a node.
If a node does not support adding devices without node reboot, you can hot plug a raw device during node shutdown. In this case, complete the following steps:
Enable maintenance mode on the managed cluster.
Turn off the required node.
Attach the required raw device to the node.
Turn on the required node.
Disable maintenance mode on the managed cluster.
Open the
KaasCephClusterCR of a managed cluster for editing:kubectl edit kaascephcluster -n <managedClusterProjectName>
Substitute
<managedClusterProjectName>with the corresponding value.In the
nodessection, add new required device tostorageDevicesor updatestorageDeviceFilterregexp accordingly. For example:spec: cephClusterSpec: nodes: <machineName>: storageDevices: - fullPath: <deviceByID> # Since 2.25.0 (17.0.0) if device is supposed to be added with by-id # name: <deviceByID> # Prior MCC 2.25.0 if device is supposed to be added with by-id # fullPath: <deviceByPath> # if device is supposed to be added with by-path config: deviceClass: hdd
Substitute
<machineName>with the machine name of the node where device<deviceName>or<deviceByPath>is going to be added as a Ceph OSD.Verify that the new Ceph OSD has appeared in the Ceph cluster and is
inandup. ThefullClusterInfosection should not contain any issues.kubectl -n <managedClusterProjectName> get kaascephcluster -o yaml
For example:
status: fullClusterInfo: daemonStatus: osd: running: '3/3 running: 3 up, 3 in' status: Ok
Replace a failed Ceph OSD with a metadata device
Warning
This procedure is valid for MOSK clusters that use the deprecated
KaaSCephCluster custom resource (CR) instead of the MiraCeph CR that is
available since MOSK 25.2 as a new Ceph configuration entrypoint. For the
equivalent procedure with the MiraCeph CR, refer to the following section:
The document describes various scenarios of a Ceph OSD outage and recovery or replacement. More specifically, this section describes how to replace a failed Ceph OSD with a metadata device:
If the metadata device is specified as a logical volume in the
BareMetalHostProfileobject and defined in theKaaSCephClusterobject as a logical volume pathIf the metadata device is specified in the
KaaSCephClusterobject as a device name
Note
Ceph OSD replacement implies the usage of the
KaaSCephOperationRequest custom resource (CR). For workflow overview,
spec and phases description, see High-level workflow of Ceph OSD or node removal.
Warning
This procedure is valid for MOSK clusters that use the deprecated
KaaSCephCluster custom resource (CR) instead of the MiraCeph CR that is
available since MOSK 25.2 as a new Ceph configuration entrypoint. For the
equivalent procedure with the MiraCeph CR, refer to the following section:
Replace a failed Ceph OSD with a metadata device as a logical volume path
You can apply the below procedure in the following cases:
A Ceph OSD failed without data or metadata device outage. In this case, first remove a failed Ceph OSD and clean up all corresponding disks and partitions. Then add a new Ceph OSD to the same data and metadata paths.
A Ceph OSD failed with data or metadata device outage. In this case, you also first remove a failed Ceph OSD and clean up all corresponding disks and partitions. Then add a new Ceph OSD to a newly replaced data device with the same metadata path.
Note
The below procedure also applies to manually created metadata partitions.
Identify the ID of Ceph OSD related to a failed device. For example, use the Ceph CLI in the
rook-ceph-toolsPod:ceph osd metadata
Example of system response:
{ "id": 0, ... "bluestore_bdev_devices": "vdc", ... "devices": "vdc", ... "hostname": "kaas-node-6c5e76f9-c2d2-4b1a-b047-3c299913a4bf", ... "pod_name": "rook-ceph-osd-0-7b8d4d58db-f6czn", ... }, { "id": 1, ... "bluefs_db_devices": "vdf", ... "bluestore_bdev_devices": "vde", ... "devices": "vde,vdf", ... "hostname": "kaas-node-6c5e76f9-c2d2-4b1a-b047-3c299913a4bf", ... "pod_name": "rook-ceph-osd-1-78fbc47dc5-px9n2", ... }, ...
Open the
KaasCephClustercustom resource (CR) for editing:kubectl edit kaascephcluster -n <managedClusterProjectName>
Substitute
<managedClusterProjectName>with the corresponding value.In the
nodessection:Find and capture the
metadataDevicepath to reuse it during re-creation of the Ceph OSD.Remove the required device:
Example configuration snippet:
spec: cephClusterSpec: nodes: <machineName>: storageDevices: - name: <deviceName> # remove the entire item from the storageDevices list # fullPath: <deviceByPath> if device is specified using by-path instead of name config: deviceClass: hdd metadataDevice: /dev/bluedb/meta_1
In the example above,
<machineName>is the name of machine that relates to the node on which the device<deviceName>or<deviceByPath>must be replaced.Create a
KaaSCephOperationRequestCR template and save it asreplace-failed-osd-<machineName>-<osdID>-request.yaml:apiVersion: kaas.mirantis.com/v1alpha1 kind: KaaSCephOperationRequest metadata: name: replace-failed-osd-<machineName>-<deviceName> namespace: <managedClusterProjectName> spec: osdRemove: nodes: <machineName>: cleanupByOsdId: - <osdID> kaasCephCluster: name: <kaasCephClusterName> namespace: <managedClusterProjectName>
Substitute the following parameters:
<machineName>and<deviceName>with the machine and device names from the previous step<managedClusterProjectName>with the cluster project name<osdID>with the ID of the affected Ceph OSD<kaasCephClusterName>with theKaaSCephClusterresource name<managedClusterProjectName>with the project name of the related managed cluster
Apply the template to the cluster:
kubectl apply -f replace-failed-osd-<machineName>-<osdID>-request.yaml
Verify that the corresponding request has been created:
kubectl get kaascephoperationrequest -n <managedClusterProjectName>
Verify that the
statussection ofKaaSCephOperationRequestcontains theremoveInfosection:kubectl -n <managedClusterProjectName> get kaascephoperationrequest replace-failed-osd-<machineName>-<osdID> -o yaml
Example of system response:
childNodesMapping: <nodeName>: <machineName> removeInfo: cleanUpMap: <nodeName>: osdMapping: "<osdID>": deviceMapping: <dataDevice>: deviceClass: hdd devicePath: <dataDeviceByPath> devicePurpose: block usedPartition: /dev/ceph-d2d3a759-2c22-4304-b890-a2d87e056bd4/osd-block-ef516477-d2da-492f-8169-a3ebfc3417e2 zapDisk: true <metadataDevice>: deviceClass: hdd devicePath: <metadataDeviceByPath> devicePurpose: db usedPartition: /dev/bluedb/meta_1 uuid: ef516477-d2da-492f-8169-a3ebfc3417e2
Definition of values in angle brackets:
<machineName>- name of the machine on which the device is being replaced, for example,worker-1<nodeName>- underlying node name of the machine, for example,kaas-node-5a74b669-7e53-4535-aabd-5b509ec844af<osdId>- Ceph OSD ID for the device being replaced, for example,1<dataDeviceByPath>-by-pathof the device placed on the node, for example,/dev/disk/by-path/pci-0000:00:1t.9<dataDevice>- name of the device placed on the node, for example,/dev/vde<metadataDevice>- metadata name of the device placed on the node, for example,/dev/vdf<metadataDeviceByPath>- metadataby-pathof the device placed on the node, for example,/dev/disk/by-path/pci-0000:00:12.0
Note
The partitions that are manually created or configured using the
BareMetalHostProfileobject can be removed only manually, or during a complete metadata disk removal, or during theMachineobject removal or re-provisioning.Verify that the
cleanUpMapsection matches the required removal and wait for theApproveWaitingphase to appear instatus:kubectl -n <managedClusterProjectName> get kaascephoperationrequest replace-failed-osd-<machineName>-<osdID> -o yaml
Example of system response:
status: phase: ApproveWaiting
In the
KaaSCephOperationRequestCR, set theapproveflag totrue:kubectl -n <managedClusterProjectName> edit kaascephoperationrequest replace-failed-osd-<machineName>-<osdID>
Configuration snippet:
spec: osdRemove: approve: true
Review the following
statusfields of the Ceph LCM CR request processing:status.phase- current state of request processingstatus.messages- description of the current phasestatus.conditions- full history of request processing before the current phasestatus.removeInfo.issuesandstatus.removeInfo.warnings- error and warning messages occurred during request processing, if any
Verify that the
KaaSCephOperationRequesthas been completed. For example:status: phase: Completed # or CompletedWithWarnings if there are non-critical issues
Note
You can spawn Ceph OSD on a raw device, but it must be clean and without any data or partitions. If you want to add a device that was in use, also ensure it is raw and clean. To clean up all data and partitions from a device, refer to official Rook documentation.
If you want to add a Ceph OSD on top of a raw device that already exists on a node or is hot-plugged, add the required device using the following guidelines:
You can add a raw device to a node during node deployment.
If a node supports adding devices without node reboot, you can hot plug a raw device to a node.
If a node does not support adding devices without node reboot, you can hot plug a raw device during node shutdown. In this case, complete the following steps:
Enable maintenance mode on the managed cluster.
Turn off the required node.
Attach the required raw device to the node.
Turn on the required node.
Disable maintenance mode on the managed cluster.
Open the
KaasCephClusterCR for editing:kubectl edit kaascephcluster -n <managedClusterProjectName>
Substitute
<managedClusterProjectName>with the corresponding value.In the
nodessection, add the replaced device with the samemetadataDevicepath as on the removed Ceph OSD. For example:spec: cephClusterSpec: nodes: <machineName>: storageDevices: - name: <deviceByID> # Recommended. Add a new device by ID, for example, /dev/disk/by-id/... #fullPath: <deviceByPath> # Add a new device by path, for example, /dev/disk/by-path/... config: deviceClass: hdd metadataDevice: /dev/bluedb/meta_1 # Must match the value of the previously removed OSD
Substitute
<machineName>with the machine name of the node where the new device<deviceByID>or<deviceByPath>must be added.Wait for the replaced disk to apply to the Ceph cluster as a new Ceph OSD.
You can monitor the application state using either the
statussection of theKaaSCephClusterCR or in therook-ceph-toolsPod:kubectl -n rook-ceph exec -it deploy/rook-ceph-tools -- ceph -s
Warning
This procedure is valid for MOSK clusters that use the deprecated
KaaSCephCluster custom resource (CR) instead of the MiraCeph CR that is
available since MOSK 25.2 as a new Ceph configuration entrypoint. For the
equivalent procedure with the MiraCeph CR, refer to the following section:
Replace a failed Ceph OSD disk with a metadata device as a device name
You can apply the below procedure if a Ceph OSD failed with data disk outage
and the metadata partition is not specified in the BareMetalHostProfile
custom resource (CR). This scenario implies that the Ceph cluster
automatically creates a required metadata logical volume on a desired device.
To remove the affected Ceph OSD with a metadata device as a device name, follow the Remove a failed Ceph OSD by ID with a defined metadata device procedure and capture the following details:
While editing
KaasCephClusterin thenodessection, capture themetadataDevicepath to reuse it during re-creation of the Ceph OSD.Example of the
spec.nodessection:spec: cephClusterSpec: nodes: <machineName>: storageDevices: - name: <deviceName> # remove the entire item from the storageDevices list # fullPath: <deviceByPath> if device is specified using by-path instead of name config: deviceClass: hdd metadataDevice: /dev/nvme0n1
In the example above, save the
metadataDevicedevice name/dev/nvme0n1.During verification of
removeInfo, capture theusedPartitionvalue of the metadata device located in thedeviceMapping.<metadataDevice>section.Example of the
removeInfosection:removeInfo: cleanUpMap: <nodeName>: osdMapping: "<osdID>": deviceMapping: <dataDevice>: deviceClass: hdd devicePath: <dataDeviceByPath> devicePurpose: block usedPartition: /dev/ceph-d2d3a759-2c22-4304-b890-a2d87e056bd4/osd-block-ef516477-d2da-492f-8169-a3ebfc3417e2 zapDisk: true <metadataDevice>: deviceClass: hdd devicePath: <metadataDeviceByPath> devicePurpose: db usedPartition: /dev/ceph-b0c70c72-8570-4c9d-93e9-51c3ab4dd9f9/osd-db-ecf64b20-1e07-42ac-a8ee-32ba3c0b7e2f uuid: ef516477-d2da-492f-8169-a3ebfc3417e2
In the example above, capture the following values from the
<metadataDevice>section:ceph-b0c70c72-8570-4c9d-93e9-51c3ab4dd9f9- name of the volume group that contains all metadata partitions on the<metadataDevice>diskosd-db-ecf64b20-1e07-42ac-a8ee-32ba3c0b7e2f- name of the logical volume that relates to a failed Ceph OSD
After you remove the Ceph OSD disk, manually create a separate logical volume for the metadata partition in an existing volume group on the metadata device:
lvcreate -l 100%FREE -n meta_1 <vgName>
Subtitute <vgName> with the name of a volume group captured in the
usedPartiton parameter.
Note
If you removed more than one OSD, replace 100%FREE with the
corresponding partition size. For example:
lvcreate -l <partitionSize> -n meta_1 <vgName>
Substitute <partitionSize> with the corresponding value that matches the
size of other partitions placed on the affected metadata drive. To obtain
<partitionSize>, use the output of the lvs command. For example:
16G.
During execution of the lvcreate command, the system asks you to wipe the found bluestore label on a metadata device. For example:
WARNING: ceph_bluestore signature detected on /dev/ceph-b0c70c72-8570-4c9d-93e9-51c3ab4dd9f9/meta_1 at offset 0. Wipe it? [y/n]:
Using the interactive shell, answer n to keep all metadata partitions
alive. After answering n, the system outputs the following:
Aborted wiping of ceph_bluestore.
1 existing signature left on the device.
Logical volume "meta_1" created.
Note
You can spawn Ceph OSD on a raw device, but it must be clean and without any data or partitions. If you want to add a device that was in use, also ensure it is raw and clean. To clean up all data and partitions from a device, refer to official Rook documentation.
If you want to add a Ceph OSD on top of a raw device that already exists on a node or is hot-plugged, add the required device using the following guidelines:
You can add a raw device to a node during node deployment.
If a node supports adding devices without node reboot, you can hot plug a raw device to a node.
If a node does not support adding devices without node reboot, you can hot plug a raw device during node shutdown. In this case, complete the following steps:
Enable maintenance mode on the managed cluster.
Turn off the required node.
Attach the required raw device to the node.
Turn on the required node.
Disable maintenance mode on the managed cluster.
Open the
KaasCephClusterCR for editing:kubectl edit kaascephcluster -n <managedClusterProjectName>
Substitute
<managedClusterProjectName>with the corresponding value.In the
nodessection, add the replaced device with the samemetadataDevicepath as in the previous Ceph OSD:spec: cephClusterSpec: nodes: <machineName>: storageDevices: - fullPath: <deviceByID> # Recommended since MCC 2.25.0 (17.0.0). # Add a new device by-id symlink, for example, /dev/disk/by-id/... #name: <deviceByID> # Add a new device by ID, for example, /dev/disk/by-id/... #fullPath: <deviceByPath> # Add a new device by path, for example, /dev/disk/by-path/... config: deviceClass: hdd metadataDevice: /dev/<vgName>/meta_1
Substitute
<machineName>with the machine name of the node where the new device<deviceByID>or<deviceByPath>must be added. Also specifymetadataDevicewith the path to the logical volume created during the Re-create the metadata partition on the existing metadata disk procedure.Wait for the replaced disk to apply to the Ceph cluster as a new Ceph OSD.
You can monitor the application state using either the
statussection of theKaaSCephClusterCR or in therook-ceph-toolsPod:kubectl -n rook-ceph exec -it deploy/rook-ceph-tools -- ceph -s
Replace a failed metadata device
Warning
This procedure is valid for MOSK clusters that use the deprecated
KaaSCephCluster custom resource (CR) instead of the MiraCeph CR that is
available since MOSK 25.2 as a new Ceph configuration entrypoint. For the
equivalent procedure with the MiraCeph CR, refer to the following section:
This section describes the scenario when an underlying metadata device fails with all related Ceph OSDs. In this case, the only solution is to remove all Ceph OSDs related to the failed metadata device, then attach a device that will be used as a new metadata device, and re-create all affected Ceph OSDs.
Caution
If you used BareMetalHostProfile to automatically partition
the failed device, you must create a manual partition of the new device
because BareMetalHostProfile does not support hot-load changes and
creates an automatic device partition only during node provisioning.
Save the
KaaSCephClusterspecification of all Ceph OSDs affected by the failed metadata device to re-use this specification during re-creation of Ceph OSDs after disk replacement.Identify Ceph OSD IDs related to the failed metadata device, for example, using Ceph CLI in the
rook-ceph-toolsPod:ceph osd metadata
Example of system response:
{ "id": 11, ... "bluefs_db_devices": "vdc", ... "bluestore_bdev_devices": "vde", ... "devices": "vdc,vde", ... "hostname": "kaas-node-6c5e76f9-c2d2-4b1a-b047-3c299913a4bf", ... }, { "id": 12, ... "bluefs_db_devices": "vdd", ... "bluestore_bdev_devices": "vde", ... "devices": "vdd,vde", ... "hostname": "kaas-node-6c5e76f9-c2d2-4b1a-b047-3c299913a4bf", ... }, { "id": 13, ... "bluefs_db_devices": "vdf", ... "bluestore_bdev_devices": "vde", ... "devices": "vde,vdf", ... "hostname": "kaas-node-6c5e76f9-c2d2-4b1a-b047-3c299913a4bf", ... }, ...
Open the
KaasCephClustercustom resource (CR) for editing:kubectl edit kaascephcluster -n <managedClusterProjectName>
Substitute
<managedClusterProjectName>with the corresponding value.In the
nodessection, remove allstorageDevicesitems that relate to the failed metadata device.When using a metadata device with
storageDeviceFilter, remove the whole node section, including the nodename: <nodeName>field, and perform a complete node cleanup as described in Remove a Ceph node from a managed cluster.For example:
spec: cephClusterSpec: nodes: <machineName>: storageDevices: - name: <deviceName1> # remove the entire item from the storageDevices list # fullPath: <deviceByPath> if device is specified using symlink instead of name config: deviceClass: hdd metadataDevice: <metadataDevice> - name: <deviceName2> # remove the entire item from the storageDevices list config: deviceClass: hdd metadataDevice: <metadataDevice> - name: <deviceName3> # remove the entire item from the storageDevices list config: deviceClass: hdd metadataDevice: <metadataDevice> ...
In the example above,
<machineName>is the machine name of the node where the metadata device<metadataDevice>must be replaced.Create a
KaaSCephOperationRequestCR template and save it asreplace-failed-meta-<machineName>-<metadataDevice>-request.yaml:apiVersion: kaas.mirantis.com/v1alpha1 kind: KaaSCephOperationRequest metadata: name: replace-failed-meta-<machineName>-<metadataDevice> namespace: <managedClusterProjectName> spec: osdRemove: nodes: <machineName>: cleanupByOsdId: - <osdID-1> - <osdID-2> ... kaasCephCluster: name: <kaasCephClusterName> namespace: <managedClusterProjectName>
Substitute the following parameters:
<machineName>and<metadataDevice>with the machine and device names from the previous step<managedClusterProjectName>with the cluster project name<osdID-*>with IDs of the affected Ceph OSDs<kaasCephClusterName>with theKaaSCephClusterCR name<managedClusterProjectName>with the project name of the related managed cluster
Apply the template to the cluster:
kubectl apply -f replace-failed-meta-<machineName>-<metadataDevice>-request.yaml
Verify that the corresponding request has been created:
kubectl get kaascephoperationrequest -n <managedClusterProjectName>
Verify that the
removeInfosection is present in theKaaSCephOperationRequestCRstatusand that thecleanUpMapsection matches the required removal:kubectl -n <managedClusterProjectName> get kaascephoperationrequest replace-failed-meta-<machineName>-<metadataDevice> -o yaml
Example of system response:
childNodesMapping: <nodeName>: <machineName> removeInfo: cleanUpMap: <nodeName>: osdMapping: "<osdID-1>": deviceMapping: <dataDevice-1>: deviceClass: hdd devicePath: <dataDeviceByPath-1> devicePurpose: block usedPartition: <dataLvPartition-1> zapDisk: true <metadataDevice>: deviceClass: hdd devicePath: <metadataDeviceByPath> devicePurpose: db usedPartition: /dev/ceph-b0c70c72-8570-4c9d-93e9-51c3ab4dd9f9/osd-db-ecf64b20-1e07-42ac-a8ee-32ba3c0b7e2f uuid: ef516477-d2da-492f-8169-a3ebfc3417e2 "<osdID-2>": deviceMapping: <dataDevice-2>: deviceClass: hdd devicePath: <dataDeviceByPath-2> devicePurpose: block usedPartition: <dataLvPartition-2> zapDisk: true <metadataDevice>: deviceClass: hdd devicePath: <metadataDeviceByPath> devicePurpose: db usedPartition: /dev/ceph-b0c70c72-8570-4c9d-93e9-51c3ab4dd9f9/osd-db-ecf64b20-1e07-42ac-a8ee-32ba3c0b7e2f uuid: ef516477-d2da-492f-8169-a3ebfc3417e2 ...
Definition of values in angle brackets:
<machineName>- name of the machine on which the device is being replaced, for example,worker-1<nodeName>- underlying node name of the machine, for example,kaas-node-5a74b669-7e53-4535-aabd-5b509ec844af<osdId>- Ceph OSD ID for the device being replaced, for example,1<dataDeviceByPath>-by-pathof the device placed on the node, for example,/dev/disk/by-path/pci-0000:00:1t.9<dataDevice>- name of the device placed on the node, for example,/dev/vdc<metadataDevice>- metadata name of the device placed on the node, for example,/dev/vde<metadataDeviceByPath>- metadataby-pathof the device placed on the node, for example,/dev/disk/by-path/pci-0000:00:12.0<dataLvPartition>- logical volume partition of the data device
Wait for the
ApproveWaitingphase to appear instatus:kubectl -n <managedClusterProjectName> get kaascephoperationrequest replace-failed-meta-<machineName>-<metadataDevice> -o yaml
Example of system response:
status: phase: ApproveWaiting
In the
KaaSCephOperationRequestCR, set theapproveflag totrue:kubectl -n <managedClusterProjectName> edit kaascephoperationrequest replace-failed-meta-<machineName>-<metadataDevice>
Configuration snippet:
spec: osdRemove: approve: true
Review the following
statusfields of the Ceph LCM CR request processing:status.phase- current state of request processingstatus.messages- description of the current phasestatus.conditions- full history of request processing before the current phasestatus.removeInfo.issuesandstatus.removeInfo.warnings- error and warning messages occurred during request processing, if any
Verify that the
KaaSCephOperationRequesthas been completed. For example:status: phase: Completed # or CompletedWithWarnings if there are non-critical issues
Note
This section describes how to create a metadata disk partition on N logical volumes. To create one partition on a metadata disk, refer to Reconfigure a partition of a Ceph OSD metadata device.
Partition the replaced metadata device by N logical volumes (LVs), where N is the number of Ceph OSDs previously located on a failed metadata device.
Calculate the new metadata LV percentage of used volume group capacity using the
100 / Nformula.Log in to the node with the replaced metadata disk.
Create an LVM physical volume atop the replaced metadata device:
pvcreate <metadataDisk>Substitute
<metadataDisk>with the replaced metadata device.Create an LVM volume group atop of the physical volume:
vgcreate bluedb <metadataDisk>
Substitute
<metadataDisk>with the replaced metadata device.Create N LVM logical volumes with the calculated capacity per each volume:
lvcreate -l <X>%VG -n meta_<i> bluedb
Substitute
<X>with the result of the100 / Nformula and<i>with the current number of metadata partitions.
As a result, the replaced metadata device will have N LVM paths, for example,
/dev/bluedb/meta_1.
Note
You can spawn Ceph OSD on a raw device, but it must be clean and without any data or partitions. If you want to add a device that was in use, also ensure it is raw and clean. To clean up all data and partitions from a device, refer to official Rook documentation.
Open the
KaasCephClusterCR for editing:kubectl edit kaascephcluster -n <managedClusterProjectName>
Substitute
<managedClusterProjectName>with the corresponding value.In the
nodessection, add the cleaned Ceph OSD device with the replaced LVM paths of the metadata device from previous steps. For example:spec: cephClusterSpec: nodes: <machineName>: storageDevices: - name: <deviceByID-1> # Recommended. Add the new device by ID /dev/disk/by-id/... #fullPath: <deviceByPath-1> # Add a new device by path /dev/disk/by-path/... config: deviceClass: hdd metadataDevice: /dev/<vgName>/<lvName-1> - name: <deviceByID-2> # Recommended. Add the new device by ID /dev/disk/by-id/... #fullPath: <deviceByPath-2> # Add a new device by path /dev/disk/by-path/... config: deviceClass: hdd metadataDevice: /dev/<vgName>/<lvName-2> - name: <deviceByID-3> # Recommended. Add the new device by ID /dev/disk/by-id/... #fullPath: <deviceByPath-3> # Add a new device by path /dev/disk/by-path/... config: deviceClass: hdd metadataDevice: /dev/<vgName>/<lvName-3>
Substitute
<machineName>with the machine name of the node where the metadata device has been replaced.Add all data devices for re-created Ceph OSDs and specify
metadataDevicethat is the path to the previously created logical volume. Substitute<vgName>with a volume group name that contains N logical volumes<lvName-i>.
Wait for the re-created Ceph OSDs to apply to the Ceph cluster.
You can monitor the application state using either the
statussection of theKaaSCephClusterCR or in therook-ceph-toolsPod:kubectl -n rook-ceph exec -it deploy/rook-ceph-tools -- ceph -s
Replace a failed Ceph node
Warning
This procedure is valid for MOSK clusters that use the deprecated
KaaSCephCluster custom resource (CR) instead of the MiraCeph CR that is
available since MOSK 25.2 as a new Ceph configuration entrypoint. For the
equivalent procedure with the MiraCeph CR, refer to the following section:
After a physical node replacement, you can use the Ceph LCM API to redeploy failed Ceph nodes. The common flow of replacing a failed Ceph node is as follows:
Remove the obsolete Ceph node from the Ceph cluster.
Add a new Ceph node with the same configuration to the Ceph cluster.
Note
Ceph OSD node replacement presupposes usage of a
KaaSCephOperationRequest CR. For workflow overview, spec and phases
description, see High-level workflow of Ceph OSD or node removal.
Open the
KaasCephClusterCR of a managed cluster for editing:kubectl edit kaascephcluster -n <managedClusterProjectName>
Substitute
<managedClusterProjectName>with the corresponding value.In the
nodessection, remove the required device or update thestorageDeviceFilterregexp accordingly. For example:spec: cephClusterSpec: nodes: <machineName>: # remove the entire entry for the node to replace storageDevices: {...} role: [...]
Substitute
<machineName>with the machine name to replace.Save
KaaSCephClusterand close the editor.Create a
KaaSCephOperationRequestCR template and save it asreplace-failed-<machineName>-request.yaml:apiVersion: kaas.mirantis.com/v1alpha1 kind: KaaSCephOperationRequest metadata: name: replace-failed-<machineName>-request namespace: <managedClusterProjectName> spec: osdRemove: nodes: <machineName>: completeCleanUp: true kaasCephCluster: name: <kaasCephClusterName> namespace: <managedClusterProjectName>
Substitute
<kaasCephClusterName>with the correspondingKaaSCephClusterresource from the<managedClusterProjectName>namespace.Apply the template to the cluster:
kubectl apply -f replace-failed-<machineName>-request.yaml
Verify that the corresponding request has been created:
kubectl get kaascephoperationrequest -n <managedClusterProjectName>
Verify that the
removeInfosection appeared in theKaaSCephOperationRequestCRstatus:kubectl -n <managedClusterProjectName> get kaascephoperationrequest replace-failed-<machineName>-request -o yaml
Example of system response:
status: childNodesMapping: <nodeName>: <machineName> osdRemoveStatus: removeInfo: cleanUpMap: <nodeName>: osdMapping: ... <osdId>: deviceMapping: ... <deviceName>: path: <deviceByPath> partition: "/dev/ceph-b-vg_sdb/osd-block-b-lv_sdb" type: "block" class: "hdd" zapDisk: true
If needed, change the following values:
<machineName>- machine name where the replacement occurs, for example,worker-1.<nodeName>- underlying machine node name, for example,kaas-node-5a74b669-7e53-4535-aabd-5b509ec844af.<osdId>- actual Ceph OSD ID for the device being replaced, for example,1.<deviceName>- actual device name placed on the node, for example,sdb.<deviceByPath>- actual deviceby-pathplaced on the node, for example,/dev/disk/by-path/pci-0000:00:1t.9.
Verify that the
cleanUpMapsection matches the required removal and wait for theApproveWaitingphase to appear instatus:kubectl -n <managedClusterProjectName> get kaascephoperationrequest replace-failed-<machineName>-request -o yaml
Example of system response:
status: phase: ApproveWaiting
Edit the
KaaSCephOperationRequestCR and set theapproveflag totrue:kubectl -n <managedClusterProjectName> edit kaascephoperationrequest replace-failed-<machineName>-request
For example:
spec: osdRemove: approve: true
Review the following
statusfields of the Ceph LCM CR request processing:status.phase- current state of request processingstatus.messages- description of the current phasestatus.conditions- full history of request processing before the current phasestatus.removeInfo.issuesandstatus.removeInfo.warnings- error and warning messages occurred during request processing, if any
Verify that the
KaaSCephOperationRequesthas been completed. For example:status: phase: Completed # or CompletedWithWarnings if there are non-critical issues
Remove the device cleanup jobs:
kubectl delete jobs -n ceph-lcm-mirantis -l app=miraceph-cleanup-disks
Note
You can spawn Ceph OSD on a raw device, but it must be clean and without any data or partitions. If you want to add a device that was in use, also ensure it is raw and clean. To clean up all data and partitions from a device, refer to official Rook documentation.
Open the
KaasCephClusterCR of a managed cluster for editing:kubectl edit kaascephcluster -n <managedClusterProjectName>
Substitute
<managedClusterProjectName>with the corresponding value.In the
nodessection, add a new device:spec: cephClusterSpec: nodes: <machineName>: # add new configuration for replaced Ceph node storageDevices: - fullPath: <deviceByID> # Recommended since MCC 2.25.0 (17.0.0), non-wwn by-id symlink # name: <deviceByID> # Prior MCC 2.25.0, non-wwn by-id symlink # fullPath: <deviceByPath> # if device is supposed to be added with by-path config: deviceClass: hdd ...
Substitute
<machineName>with the machine name of the replaced node and configure it as required.Warning
Since MOSK 23.3, Mirantis highly recommends using non-wwn
by-idsymlinks only to specify storage devices in thestorageDeviceslist. For details, see Addressing storage devices prior to MOSK 25.2.Verify that all Ceph daemons from the replaced node have appeared on the Ceph cluster and are
inandup. ThefullClusterInfosection should not contain any issues.kubectl -n <managedClusterProjectName> get kaascephcluster -o yaml
Example of system response:
status: fullClusterInfo: clusterStatus: ceph: health: HEALTH_OK ... daemonStatus: mgr: running: a is active mgr status: Ok mon: running: '3/3 mons running: [a b c] in quorum' status: Ok osd: running: '3/3 running: 3 up, 3 in' status: Ok
Verify the Ceph node on the managed cluster:
kubectl -n rook-ceph get pod -o wide | grep <machineName>
Remove Ceph OSD manually
Warning
This procedure is valid for MOSK clusters that use the deprecated
KaaSCephCluster custom resource (CR) instead of the MiraCeph CR that is
available since MOSK 25.2 as a new Ceph configuration entrypoint. For the
equivalent procedure with the MiraCeph CR, refer to the following section:
You may need to manually remove a Ceph OSD, for example, in the following cases:
If you have removed a device or node from the
KaaSCephClusterspec.cephClusterSpec.nodesorspec.cephClusterSpec.nodeGroupssection withmanageOsdsset tofalse.If you do not want to rely on Ceph LCM operations and want to manage the Ceph OSDs life cycle manually.
To safely remove one or multiple Ceph OSDs from a Ceph cluster, perform the following procedure for each Ceph OSD one by one.
Warning
The procedure presupposes the Ceph OSD disk or logical volumes partition cleanup.
To remove a Ceph OSD manually:
Edit the
KaaSCephClusterresource on a management cluster:kubectl --kubeconfig <mgmtKubeconfig> -n <managedClusterProjectName> edit kaascephcluster
Substitute
<mgmtKubeconfig>with the management clusterkubeconfigand<managedClusterProjectName>with the project name of the managed cluster.In the
spec.cephClusterSpec.nodessection, remove the requiredstorageDevicesitem from the corresponding node spec or exclude the required item fromstorageDeviceFilter. If after removalstorageDevicesbecomes empty and the node spec has no roles specified, also remove the node spec.Obtain
kubeconfigof the managed cluster and provide it as an environment variable:export KUBECONFIG=<pathToManagedKubeconfig>
Verify that all Ceph OSDs are
upandin, the Ceph cluster is healthy, and no rebalance or recovery is in progress:kubectl -n rook-ceph exec -it $(kubectl -n rook-ceph get pod -l \ app=rook-ceph-tools -o jsonpath='{.items[0].metadata.name}') -- ceph -s
Example of system response:
cluster: id: 8cff5307-e15e-4f3d-96d5-39d3b90423e4 health: HEALTH_OK ... osd: 4 osds: 4 up (since 10h), 4 in (since 10h)
Stop the
rook-ceph/rook-ceph-operatordeployment to avoid premature reorchestration of the Ceph cluster:kubectl -n rook-ceph scale deploy rook-ceph-operator --replicas 0
Enter the
ceph-toolspod:kubectl -n rook-ceph exec -it $(kubectl -n rook-ceph get pod -l \ app=rook-ceph-tools -o jsonpath='{.items[0].metadata.name}') bash
Mark the required Ceph OSD as
out:ceph osd out osd.<ID>
Note
In the command above and in the steps below, substitute
<ID>with the number of the Ceph OSD to remove.Wait until data backfilling to other OSDs is complete:
ceph -sOnce all of the PGs are
active+clean, backfilling is complete and it is safe to remove the disk.Note
For additional information on PGs backfilling, run ceph pg dump_stuck.
Exit from the
ceph-toolspod:exitScale the
rook-ceph/rook-ceph-osd-<ID>deployment to0replicas:kubectl -n rook-ceph scale deploy rook-ceph-osd-<ID> --replicas 0
Enter the
ceph-toolspod:kubectl -n rook-ceph exec -it $(kubectl -n rook-ceph get pod -l \ app=rook-ceph-tools -o jsonpath='{.items[0].metadata.name}') bash
Verify that the number of Ceph OSDs that are
upandinhas decreased by one daemon:ceph -sExample of system response:
osd: 4 osds: 3 up (since 1h), 3 in (since 5s)
Remove the Ceph OSD from the Ceph cluster:
ceph osd purge <ID> --yes-i-really-mean-it
Delete the Ceph OSD
authentry, if present. Otherwise, skip this step.ceph auth del osd.<ID>
If you have removed the last Ceph OSD on the node and want to remove this node from the Ceph cluster, remove the CRUSH map entry:
ceph osd crush remove <nodeName>
Substitute
<nodeName>with the name of the node where the removed Ceph OSD was placed.Verify that the failure domain within Ceph OSDs has been removed from the CRUSH map:
ceph osd tree
If you have removed the node, it will be removed from the CRUSH map.
Exit from the
ceph-toolspod:exitClean up the disk used by the removed Ceph OSD. For details, see official Rook documentation.
Warning
If you are using multiple Ceph OSDs per device or metadata device, make sure that you can clean up the entire disk. Otherwise, instead clean up only the logical volume partitions for the volume group by running lvremove <lvpartion_uuid> any Ceph OSD pod that belongs to the same host as the removed Ceph OSD.
Delete the
rook-ceph/rook-ceph-osd-<ID>deployment previously scaled to0replicas:kubectl -n rook-ceph delete deploy rook-ceph-osd-<ID>
Substitute
<ID>with the number of the removed Ceph OSD.Scale the
rook-ceph/rook-ceph-operatordeployment to1replica and wait for the orchestration to complete:kubectl -n rook-ceph scale deploy rook-ceph-operator --replicas 1 kubectl -n rook-ceph get pod -w
Once done, Ceph OSD removal is complete.
Migrate Ceph cluster to address storage devices using by-id
Warning
This procedure is valid for MOSK clusters that use the deprecated
KaaSCephCluster custom resource (CR) instead of the MiraCeph CR that is
available since MOSK 25.2 as a new Ceph configuration entrypoint. For the
equivalent procedure with the MiraCeph CR, refer to the following section:
The by-id identifier is the only persistent device identifier for a Ceph
cluster that remains stable after the cluster upgrade or any other maintenance.
Therefore, Mirantis recommends using device by-id symlinks rather than
device names or by-path symlinks.
Container Cloud uses the device by-id identifier as the default method
of addressing the underlying devices of Ceph OSDs. Thus, you should migrate
all existing Ceph clusters, which are still utilizing the device names or
device by-path symlinks, to the by-id format.
This section explains how to configure the KaaSCephCluster specification
to use the by-id symlinks instead of disk names and by-path
identifiers as the default method of addressing storage devices.
Note
Mirantis recommends avoiding the use of wwn symlinks as
by-id identifiers due to their lack of persistence expressed in
inconsistent discovery during node boot.
Besides migrating to by-id, consider using the fullPath field for the
by-id symlinks configuration, instead of the name field in the
spec.cephClusterSpec.nodes.storageDevices section. This approach allows for
clear understanding of field namings and their use cases.
Note
MOSK enables you to use fullPath for the
by-id symlinks since MCC 2.25.0 (Cluster release 17.0.0). For earlier
product versions, use the name field instead.
Migrate the Ceph nodes section to by-id identifiers
Available since MCC 2.25.0 (Cluster release 17.0.0)
Make sure that your managed cluster is not currently running an upgrade or any other maintenance process.
Obtain the list of all
KaasCephClusterstorage devices that use disk names or diskby-pathas identifiers of Ceph node storage devices:kubectl -n <managedClusterProject> get kcc -o yaml
Substitute
<managedClusterProject>with the corresponding managed cluster namespace.Output example:
spec: cephClusterSpec: nodes: ... managed-worker-1: storageDevices: - config: deviceClass: hdd name: sdc - config: deviceClass: hdd fullPath: /dev/disk/by-path/pci-0000:00:05.0-scsi-0:0:0:2 managed-worker-2: storageDevices: - config: deviceClass: hdd name: /dev/disk/by-id/wwn-0x26d546263bd312b8 - config: deviceClass: hdd name: /dev/disk/by-id/scsi-SQEMU_QEMU_HARDDISK_2e52abb48862dsdc managed-worker-3: storageDevices: - config: deviceClass: nvme name: nvme3n1 - config: deviceClass: hdd fullPath: /dev/disk/by-id/scsi-SATA_HGST_HUS724040AL_PN1334PEHN18ZS
Verify the items from the
storageDevicessections to be moved to theby-idsymlinks. The list of the items to migrate includes:A disk name in the
namefield. For example,sdc,nvme3n1, and so on.A disk
/dev/disk/by-pathsymlink in thefullPathfield. For example,/dev/disk/by-path/pci-0000:00:05.0-scsi-0:0:0:2.A disk
/dev/disk/by-idsymlink in thenamefield.Note
This condition applies since MCC 2.25.0 (Cluster release 17.0.0).
A disk
/dev/disk/by-id/wwnsymlink, which is programmatically calculated at boot. For example,/dev/disk/by-id/wwn-0x26d546263bd312b8.
For the example above, we have to migrate both items of
managed-worker-1, both items ofmanaged-worker-2, and the first item ofmanaged-worker-3. The second item ofmanaged-worker-3has already been configured in the required format, therefore, we are leaving it as is.To migrate all affected
storageDevicesitems toby-idsymlinks, open theKaaSCephClustercustom resource for editing:kubectl -n <managedClusterProject> edit kcc
For each affected node from the
spec.cephClusterSpec.nodessection, obtain a correspondingstatus.providerStatus.hardware.storagesection from theMachinecustom resource:kubectl -n <managedClusterProject> get machine <machineName> -o yaml
Substitute
<managedClusterProject>with the corresponding cluster namespace and<machineName>with the machine name.Output example for
managed-worker-1:status: providerStatus: hardware: storage: - byID: /dev/disk/by-id/wwn-0x05ad99618d66a21f byIDs: - /dev/disk/by-id/scsi-0QEMU_QEMU_HARDDISK_05ad99618d66a21f - /dev/disk/by-id/scsi-305ad99618d66a21f - /dev/disk/by-id/scsi-SQEMU_QEMU_HARDDISK_05ad99618d66a21f - /dev/disk/by-id/wwn-0x05ad99618d66a21f byPath: /dev/disk/by-path/pci-0000:00:05.0-scsi-0:0:0:0 byPaths: - /dev/disk/by-path/pci-0000:00:05.0-scsi-0:0:0:0 name: /dev/sda serialNumber: 05ad99618d66a21f size: 61 type: hdd - byID: /dev/disk/by-id/wwn-0x26d546263bd312b8 byIDs: - /dev/disk/by-id/scsi-0QEMU_QEMU_HARDDISK_26d546263bd312b8 - /dev/disk/by-id/scsi-326d546263bd312b8 - /dev/disk/by-id/scsi-SQEMU_QEMU_HARDDISK_26d546263bd312b8 - /dev/disk/by-id/wwn-0x26d546263bd312b8 byPath: /dev/disk/by-path/pci-0000:00:05.0-scsi-0:0:0:2 byPaths: - /dev/disk/by-path/pci-0000:00:05.0-scsi-0:0:0:2 name: /dev/sdb serialNumber: 26d546263bd312b8 size: 32 type: hdd - byID: /dev/disk/by-id/wwn-0x2e52abb48862dbdc byIDs: - /dev/disk/by-id/lvm-pv-uuid-MncrcO-6cel-0QsB-IKaY-e8UK-6gDy-k2hOtf - /dev/disk/by-id/scsi-0QEMU_QEMU_HARDDISK_2e52abb48862dbdc - /dev/disk/by-id/scsi-32e52abb48862dbdc - /dev/disk/by-id/scsi-SQEMU_QEMU_HARDDISK_2e52abb48862dbdc - /dev/disk/by-id/wwn-0x2e52abb48862dbdc byPath: /dev/disk/by-path/pci-0000:00:05.0-scsi-0:0:0:1 byPaths: - /dev/disk/by-path/pci-0000:00:05.0-scsi-0:0:0:1 name: /dev/sdc serialNumber: 2e52abb48862dbdc size: 61 type: hdd
For each affected
storageDevicesitem from the consideredMachine, obtain a correctby-idsymlink fromstatus.providerStatus.hardware.storage.byIDs. Suchby-idsymlink must containstatus.providerStatus.hardware.storage.serialNumberand must not containwwn.For
managed-worker-1, according to the example output above, we can use the followingby-idsymlinks:Replace the first item of
storageDevicesthat containsname: sdcwithfullPath: /dev/disk/by-id/scsi-SQEMU_QEMU_HARDDISK_2e52abb48862dbdc;Replace the second item of
storageDevicesthat containsfullPath: /dev/disk/by-path/pci-0000:00:05.0-scsi-0:0:0:2withfullPath: /dev/disk/by-id/scsi-SQEMU_QEMU_HARDDISK_26d546263bd312b8.
Replace all affected
storageDevicesitems inKaaSCephClusterwith the obtained ones.Note
Prior to MCC 2.25.0 (Cluster release 17.0.0), place the
by-idsymlinks in thenamefield instead of thefullPathfield.The resulting example of the storage device identifier migration:
spec: cephClusterSpec: nodes: ... managed-worker-1: storageDevices: - config: deviceClass: hdd fullPath: /dev/disk/by-id/scsi-SQEMU_QEMU_HARDDISK_2e52abb48862dbdc - config: deviceClass: hdd fullPath: /dev/disk/by-id/scsi-SQEMU_QEMU_HARDDISK_26d546263bd312b8 managed-worker-2: storageDevices: - config: deviceClass: hdd fullPath: /dev/disk/by-id/scsi-SQEMU_QEMU_HARDDISK_031d9054c9b48f79 - config: deviceClass: hdd fullPath: /dev/disk/by-id/scsi-SQEMU_QEMU_HARDDISK_2e52abb48862dsdc managed-worker-3: storageDevices: - config: deviceClass: nvme fullPath: /dev/disk/by-id/nvme-SAMSUNG_MZ1LB3T8HMLA-00007_S46FNY0R394543 - config: deviceClass: hdd fullPath: /dev/disk/by-id/scsi-SATA_HGST_HUS724040AL_PN1334PEHN18ZS
Save and quit editing the
KaaSCephClustercustom resource.
After migration, the re-orchestration occurs. The whole procedure should not result in any real changes to the Ceph cluster state in Ceph OSDs.
Migrate the Ceph nodeGroups section to by-id identifiers
Available since MCC 2.25.0 (Cluster release 17.0.0)
Besides the nodes section, your cluster may contain the nodeGroups
section specified with disk names instead of by-id symlinks. Despite
of inplace replacement of the nodes storage device identifiers,
nodeGroups requires another approach because of the repeatable spec
section for different nodes.
In the case of migrating nodeGroups storage devices, the deviceLabels
section should be used to label different disks with the same labels and use
these labels in node groups after. For the deviceLabels section
specification, refer to Ceph advanced configuration: extraOpts.
The following procedure describes how to keep the nodeGroups section
but use unique by-id identifiers instead of disk names.
To migrate the Ceph nodeGroups section to by-id identifiers:
Make sure that your managed cluster is not currently running an upgrade or any other maintenance process.
Obtain the list of all
KaasCephClusterstorage devices that use disk names or diskby-pathas identifiers of Ceph node group storage devices:kubectl -n <managedClusterProject> get kcc -o yaml
Substitute
<managedClusterProject>with the corresponding managed cluster namespace.Output example of the
KaaSCephClusternodeGroupssection with disk names used as identifiers:spec: cephClusterSpec: nodeGroups: ... rack-1: nodes: - node-1 - node-2 spec: crush: rack: "rack-1" storageDevices: - name: nvme0n1 config: deviceClass: nvme - name: nvme1n1 config: deviceClass: nvme - name: nvme2n1 config: deviceClass: nvme rack-2: nodes: - node-3 - node-4 spec: crush: rack: "rack-2" storageDevices: - name: nvme0n1 config: deviceClass: nvme - name: nvme1n1 config: deviceClass: nvme - name: nvme2n1 config: deviceClass: nvme rack-3: nodes: - node-5 - node-6 spec: crush: rack: "rack-3" storageDevices: - name: nvme0n1 config: deviceClass: nvme - name: nvme1n1 config: deviceClass: nvme - name: nvme2n1 config: deviceClass: nvme
Verify the items from the
storageDevicessections to be moved toby-idsymlinks. The list of the items to migrate includes:A disk name in the
namefield. For example,sdc,nvme3n1, and so on.A disk
/dev/disk/by-pathsymlink in thefullPathfield. For example,/dev/disk/by-path/pci-0000:00:05.0-scsi-0:0:0:2.A disk
/dev/disk/by-idsymlink in thenamefield.Note
This condition applies since MCC 2.25.0 (Cluster release 17.0.0).
A disk
/dev/disk/by-id/wwnsymlink, which is programmatically calculated at boot. For example,/dev/disk/by-id/wwn-0x26d546263bd312b8.
All
storageDevicesections in the example above contain disk names in thenamefield. Therefore, you need to replace them withby-idsymlinks.Open the
KaaSCephClustercustom resource for editing to start migration of all affectedstorageDevicesitems toby-idsymlinks:kubectl -n <managedClusterProject> edit kccWithin each impacted Ceph node group in the
nodeGroupssection, add disk labels to thedeviceLabelssections for every affected storage device linked with the nodes listed innodesof that specific node group. Verify that these disk labels are equal toby-idsymlinks of corresponding disks.For example, if the node group
rack-1contains two nodesnode-1andnode-2andspeccontains three items withname, you need to obtain properby-idsymlinks for disk names from both nodes and write it down with the same disk labels. The following example contains the labels forby-idsymlinks ofnvme0n1,nvme1n1, andnvme2n1disks fromnode-1andnode-2correspondingly:spec: cephClusterSpec: extraOpts: deviceLabels: node-1: nvme-1: /dev/disk/by-id/nvme-SAMSUNG_MZ1LB3T8HMLA-00007_S46FNY0R394543 nvme-2: /dev/disk/by-id/nvme-SAMSUNG_MZ1LB3T8HMLA-00007_S46FNY0R372150 nvme-3: /dev/disk/by-id/nvme-SAMSUNG_MZ1LB3T8HMLA-00007_S46FNY0R183266 node-2: nvme-1: /dev/disk/by-id/nvme-SAMSUNG_MZ1LB4040ALR-00007_S46FNY0R900128 nvme-2: /dev/disk/by-id/nvme-SAMSUNG_MZ1LB4040ALR-00007_S46FNY0R805840 nvme-3: /dev/disk/by-id/nvme-SAMSUNG_MZ1LB4040ALR-00007_S46FNY0R848469
Note
Keep device labels repeatable for all nodes from the node group. This allows for specifying unified
specfor differentby-idsymlinks of different nodes.Example of the full
deviceLabelssection for thenodeGroupssection:spec: cephClusterSpec: extraOpts: deviceLabels: node-1: nvme-1: /dev/disk/by-id/nvme-SAMSUNG_MZ1LB3T8HMLA-00007_S46FNY0R394543 nvme-2: /dev/disk/by-id/nvme-SAMSUNG_MZ1LB3T8HMLA-00007_S46FNY0R372150 nvme-3: /dev/disk/by-id/nvme-SAMSUNG_MZ1LB3T8HMLA-00007_S46FNY0R183266 node-2: nvme-1: /dev/disk/by-id/nvme-SAMSUNG_MZ1LB4040ALR-00007_S46FNY0R900128 nvme-2: /dev/disk/by-id/nvme-SAMSUNG_MZ1LB4040ALR-00007_S46FNY0R805840 nvme-3: /dev/disk/by-id/nvme-SAMSUNG_MZ1LB4040ALR-00007_S46FNY0R848469 node-3: nvme-1: /dev/disk/by-id/nvme-SAMSUNG_MZ1LB00T2B0A-00007_S46FNY0R900128 nvme-2: /dev/disk/by-id/nvme-SAMSUNG_MZ1LB00T2B0A-00007_S46FNY0R805840 nvme-3: /dev/disk/by-id/nvme-SAMSUNG_MZ1LB00T2B0A-00007_S46FNY0R848469 node-4: nvme-1: /dev/disk/by-id/nvme-SAMSUNG_MZ1LB00Z4SA0-00007_S46FNY0R286212 nvme-2: /dev/disk/by-id/nvme-SAMSUNG_MZ1LB00Z4SA0-00007_S46FNY0R350024 nvme-3: /dev/disk/by-id/nvme-SAMSUNG_MZ1LB00Z4SA0-00007_S46FNY0R300756 node-5: nvme-1: /dev/disk/by-id/nvme-SAMSUNG_MZ1LB8UK0QBD-00007_S46FNY0R577024 nvme-2: /dev/disk/by-id/nvme-SAMSUNG_MZ1LB8UK0QBD-00007_S46FNY0R718411 nvme-3: /dev/disk/by-id/nvme-SAMSUNG_MZ1LB8UK0QBD-00007_S46FNY0R831424 node-6: nvme-1: /dev/disk/by-id/nvme-SAMSUNG_MZ1LB01DAU34-00007_S46FNY0R908440 nvme-2: /dev/disk/by-id/nvme-SAMSUNG_MZ1LB01DAU34-00007_S46FNY0R945405 nvme-3: /dev/disk/by-id/nvme-SAMSUNG_MZ1LB01DAU34-00007_S46FNY0R224911
For each affected node group in the
nodeGroupssection, replace the field with the insufficient disk identifier to thedevLabelfield with the disk label from thedeviceLabelssection.For the example above, the updated
nodeGroupssection looks as follows:spec: cephClusterSpec: nodeGroups: ... rack-1: nodes: - node-1 - node-2 spec: crush: rack: "rack-1" storageDevices: - devLabel: nvme-1 config: deviceClass: nvme - devLabel: nvme-2 config: deviceClass: nvme - devLabel: nvme-3 config: deviceClass: nvme rack-2: nodes: - node-3 - node-4 spec: crush: rack: "rack-2" storageDevices: - devLabel: nvme-1 config: deviceClass: nvme - devLabel: nvme-2 config: deviceClass: nvme - devLabel: nvme-3 config: deviceClass: nvme rack-3: nodes: - node-5 - node-6 spec: crush: rack: "rack-3" storageDevices: - devLabel: nvme-1 config: deviceClass: nvme - devLabel: nvme-2 config: deviceClass: nvme - devLabel: nvme-3 config: deviceClass: nvme
Save and quit editing the
KaaSCephClustercustom resource.
After migration, the re-orchestration occurs. The whole procedure should not result in any real changes to the Ceph cluster state in Ceph OSDs.
Obtain a by-id symlink of a storage device
Warning
This procedure is valid for MOSK clusters that use the deprecated
KaaSCephCluster custom resource (CR) instead of the MiraCeph CR that is
available since MOSK 25.2 as a new Ceph configuration entrypoint. For the
equivalent procedure with the MiraCeph CR, refer to the following section:
You can start using a storage device only after a corresponding Machine
becomes ready and accessible. Thus, KaaSCephCluster can be created only
after all machines receive the status.providerStatus.hardware.storage
configuration containing all required device by-id symlinks.
To obtain a device by-id symlink:
Verify that the
MachineisReady:kubectl -n <managedClusterProject> get machine <machineName> -o jsonpath='{.status.phase}{"\n"}'
Substitute
<managedClusterProject>with the cluster namespace and<machineName>with the machine name.Obtain storage details for the
Machine:kubectl -n <managedClusterProject> get machine <machineName> -o yaml
Output example:
status: providerStatus: hardware: storage: - byID: /dev/disk/by-id/wwn-0x05ad99618d66a21f byIDs: - /dev/disk/by-id/scsi-0QEMU_QEMU_HARDDISK_05ad99618d66a21f - /dev/disk/by-id/scsi-305ad99618d66a21f - /dev/disk/by-id/scsi-SQEMU_QEMU_HARDDISK_05ad99618d66a21f - /dev/disk/by-id/wwn-0x05ad99618d66a21f byPath: /dev/disk/by-path/pci-0000:00:05.0-scsi-0:0:0:0 byPaths: - /dev/disk/by-path/pci-0000:00:05.0-scsi-0:0:0:0 name: /dev/sda serialNumber: 05ad99618d66a21f size: 61 type: hdd - byID: /dev/disk/by-id/wwn-0x26d546263bd312b8 byIDs: - /dev/disk/by-id/scsi-0QEMU_QEMU_HARDDISK_26d546263bd312b8 - /dev/disk/by-id/scsi-326d546263bd312b8 - /dev/disk/by-id/scsi-SQEMU_QEMU_HARDDISK_26d546263bd312b8 - /dev/disk/by-id/wwn-0x26d546263bd312b8 byPath: /dev/disk/by-path/pci-0000:00:05.0-scsi-0:0:0:2 byPaths: - /dev/disk/by-path/pci-0000:00:05.0-scsi-0:0:0:2 name: /dev/sdb serialNumber: 26d546263bd312b8 size: 32 type: hdd - byID: /dev/disk/by-id/wwn-0x2e52abb48862dbdc byIDs: - /dev/disk/by-id/lvm-pv-uuid-MncrcO-6cel-0QsB-IKaY-e8UK-6gDy-k2hOtf - /dev/disk/by-id/scsi-0QEMU_QEMU_HARDDISK_2e52abb48862dbdc - /dev/disk/by-id/scsi-32e52abb48862dbdc - /dev/disk/by-id/scsi-SQEMU_QEMU_HARDDISK_2e52abb48862dbdc - /dev/disk/by-id/wwn-0x2e52abb48862dbdc byPath: /dev/disk/by-path/pci-0000:00:05.0-scsi-0:0:0:1 byPaths: - /dev/disk/by-path/pci-0000:00:05.0-scsi-0:0:0:1 name: /dev/sdc serialNumber: 2e52abb48862dbdc size: 61 type: hdd
Obtain the item from the
byIDslist from thestatus.providerStatus.hardware.storagesection that containsserialNumberand does not containwwnas a bus ID.In the example above, for the disk with the
/dev/sdcname, you can use the/dev/disk/by-id/scsi-0QEMU_QEMU_HARDDISK_2e52abb48862dbdcsymlink as a persistent identifier of the storage device because it contains the2e52abb48862dbdcserial number and does not containwwn.Note
Do not rely on the
byIDfield only. This field may contain a/dev/disk/by-id/wwnsymlink that cannot be considered a persistent identifier of a storage device.
Increase Ceph cluster storage size
Warning
This procedure is valid for MOSK clusters that use the deprecated
KaaSCephCluster custom resource (CR) instead of the MiraCeph CR that is
available since MOSK 25.2 as a new Ceph configuration entrypoint. For the
equivalent procedure with the MiraCeph CR, refer to the following section:
This section describes how to increase the overall storage size for all Ceph
pools of the same device class: hdd, ssd, or nvme.
The procedure presupposes adding a new Ceph OSD. The overall storage size for
the required device class automatically increases once the Ceph OSD becomes
available in the Ceph cluster.
To increase the overall storage size for a device class:
Identify the current storage size for the required device class:
kubectl --kubeconfig <managedClusterKubeconfig> -n rook-ceph exec -it deploy/rook-ceph-tools -- ceph df
Substitute
<managedClusterKubeconfig>with a managed clusterkubeconfig.Example of system response:
--- RAW STORAGE --- CLASS SIZE AVAIL USED RAW USED %RAW USED hdd 128 GiB 101 GiB 23 GiB 27 GiB 21.40 TOTAL 128 GiB 101 GiB 23 GiB 27 GiB 21.40 --- POOLS --- POOL ID PGS STORED OBJECTS USED %USED MAX AVAIL device_health_metrics 1 1 0 B 0 0 B 0 30 GiB kubernetes-hdd 2 32 12 GiB 3.13k 23 GiB 20.57 45 GiB
Identify the number of Ceph OSDs with the required device class:
kubectl --kubeconfig <managedClusterKubeconfig> -n rook-ceph exec -it deploy/rook-ceph-tools -- ceph osd df <deviceClass>
Substitute the following parameters:
<managedClusterKubeconfig>with a managed clusterkubeconfig<deviceClass>with the required device class:hdd,ssd, ornvme
Example of system response for the
hdddevice class:ID CLASS WEIGHT REWEIGHT SIZE RAW USE DATA OMAP META AVAIL %USE VAR PGS STATUS 1 hdd 0.03119 1.00000 32 GiB 5.8 GiB 4.8 GiB 1.5 MiB 1023 MiB 26 GiB 18.22 0.85 14 up 3 hdd 0.03119 1.00000 32 GiB 6.9 GiB 5.9 GiB 1.1 MiB 1023 MiB 25 GiB 21.64 1.01 17 up 0 hdd 0.03119 0.84999 32 GiB 6.8 GiB 5.8 GiB 1013 KiB 1023 MiB 25 GiB 21.24 0.99 16 up 2 hdd 0.03119 1.00000 32 GiB 7.9 GiB 6.9 GiB 1.2 MiB 1023 MiB 24 GiB 24.55 1.15 20 up TOTAL 128 GiB 27 GiB 23 GiB 4.8 MiB 4.0 GiB 101 GiB 21.41 MIN/MAX VAR: 0.85/1.15 STDDEV: 2.29
Follow Add a Ceph OSD on a managed cluster to add a new device with a supported device class:
hdd,ssd, ornvme.Wait for the new Ceph OSD pod to start
Running:kubectl --kubeconfig <managedClusterKubeconfig> -n rook-ceph get pod -l app=rook-ceph-osd
Substitute
<managedClusterKubeconfig>with a managed clusterkubeconfig.Verify that the new Ceph OSD has rebalanced and Ceph health is
HEALTH_OK:kubectl --kubeconfig <managedClusterKubeconfig> -n rook-ceph exec -it deploy/rook-ceph-tools -- ceph -s
Substitute
<managedClusterKubeconfig>with a managed cluster kubeconfig.Verify that the new Ceph has been OSD added to the list of device class OSDs:
kubectl --kubeconfig <managedClusterKubeconfig> -n rook-ceph exec -it deploy/rook-ceph-tools -- ceph osd df <deviceClass>
Substitute the following parameters:
<managedClusterKubeconfig>with a managed clusterkubeconfig<deviceClass>with the required device class:hdd,ssd, ornvme
Example of system response for the
hdddevice class after adding a new Ceph OSD:ID CLASS WEIGHT REWEIGHT SIZE RAW USE DATA OMAP META AVAIL %USE VAR PGS STATUS 1 hdd 0.03119 1.00000 32 GiB 4.5 GiB 3.5 GiB 1.5 MiB 1023 MiB 28 GiB 13.93 0.78 10 up 3 hdd 0.03119 1.00000 32 GiB 5.5 GiB 4.5 GiB 1.1 MiB 1023 MiB 26 GiB 17.22 0.96 13 up 0 hdd 0.03119 0.84999 32 GiB 6.5 GiB 5.5 GiB 1013 KiB 1023 MiB 25 GiB 20.32 1.14 15 up 2 hdd 0.03119 1.00000 32 GiB 7.5 GiB 6.5 GiB 1.2 MiB 1023 MiB 24 GiB 23.43 1.31 19 up 4 hdd 0.03119 1.00000 32 GiB 4.6 GiB 3.6 GiB 0 B 1 GiB 27 GiB 14.45 0.81 10 up TOTAL 160 GiB 29 GiB 24 GiB 4.8 MiB 5.0 GiB 131 GiB 17.87 MIN/MAX VAR: 0.78/1.31 STDDEV: 3.62
Verify the total storage capacity increased for the entire device class:
kubectl --kubeconfig <managedClusterKubeconfig> -n rook-ceph exec -it deploy/rook-ceph-tools -- ceph df
Substitute
<managedClusterKubeconfig>with a managed clusterkubeconfig.Example of system response:
--- RAW STORAGE --- CLASS SIZE AVAIL USED RAW USED %RAW USED hdd 160 GiB 131 GiB 24 GiB 29 GiB 17.97 TOTAL 160 GiB 131 GiB 24 GiB 29 GiB 17.97 --- POOLS --- POOL ID PGS STORED OBJECTS USED %USED MAX AVAIL device_health_metrics 1 1 0 B 0 0 B 0 38 GiB kubernetes-hdd 2 32 12 GiB 3.18k 24 GiB 17.17 57 GiB
Move a Ceph Monitor daemon to another node
Warning
This procedure is valid for MOSK clusters that use the deprecated
KaaSCephCluster custom resource (CR) instead of the MiraCeph CR that is
available since MOSK 25.2 as a new Ceph configuration entrypoint. For the
equivalent procedure with the MiraCeph CR, refer to the following section:
This document describes how to migrate a Ceph Monitor daemon from one node to another without changing the general number of Ceph Monitors in the cluster. In the Ceph Controller concept, migration of a Ceph Monitor means manually removing it from one node and adding it to another.
Consider the following exemplary placement scheme of Ceph Monitors in the
nodes spec of the KaaSCephCluster CR:
nodes:
node-1:
roles:
- mon
- mgr
node-2:
roles:
- mgr
Using the example above, if you want to move the Ceph Monitor from node-1
to node-2 without changing the number of Ceph Monitors, the roles table
of the nodes spec must result as follows:
nodes:
node-1:
roles:
- mgr
node-2:
roles:
- mgr
- mon
However, due to the Rook limitation related to Kubernetes architecture, once
you move the Ceph Monitor through the KaaSCephCluster CR, changes will not
apply automatically. This is caused by the following Rook behavior:
Rook creates Ceph Monitor resources as deployments with
nodeSelector, which binds Ceph Monitor pods to a requested node.Rook does not recreate new Ceph Monitors with the new node placement if the current
monquorum works.
Therefore, to move a Ceph Monitor to another node, you must also manually apply the new Ceph Monitors placement to the Ceph cluster as described below.
To move a Ceph Monitor to another node:
Open the
KaasCephClusterCR of a managed cluster:kubectl edit kaascephcluster -n <managedClusterProjectName>
Substitute
<managedClusterProjectName>with the corresponding value.In the
nodesspec of theKaaSCephClusterCR, change themonroles placement without changing the total number ofmonroles. For details, see the example above. Note the nodes on which themonroles have been removed.Wait until the corresponding
MiraCephresource is updated with the newnodesspec:kubectl --kubeconfig <kubeconfig> -n ceph-lcm-mirantis get miraceph -o yaml
Substitute
<kubeconfig>with the Container Cloud clusterkubeconfigthat hosts the required Ceph cluster.In the
MiraCephresource, determine which node has been changed in thenodesspec. Save thenamevalue of the node where themonrole has been removed for further usage.kubectl -n <managedClusterProjectName> get machine -o jsonpath='{range .items[*]}{.metadata.name .status.nodeRef.name}{"\n"}{end}'
Substitute
<managedClusterProjectName>with the corresponding value.If you perform a managed cluster update, follow additional steps:
Verify that the following conditions are met before proceeding to the next step:
There are at least 2 running and available Ceph Monitors so that the Ceph cluster is accessible during the Ceph Monitor migration:
kubectl -n rook-ceph get pod -l app=rook-ceph-mon kubectl -n rook-ceph exec -it deploy/rook-ceph-tools -- ceph -s
The
MiraCephobject on the managed cluster has the required node with themonrole added in thenodessection ofspec:kubectl -n ceph-lcm-mirantis get miraceph -o yaml
The Ceph
NodeWorkloadLockfor the required node is created:kubectl --kubeconfig child-kubeconfig get nodeworkloadlock -o jsonpath='{range .items[?(@.spec.nodeName == "<desiredNodeName>")]}{@.metadata.name}{"\n"}{end}' | grep ceph
Scale the
ceph-maintenance-controllerdeployment to0replicas:kubectl -n ceph-lcm-mirantis scale deploy ceph-maintenance-controller --replicas 0
Manually edit the managed cluster node labels: remove the
ceph_role_monlabel from the obsolete node and add this label to the new node:kubectl label node <obsoleteNodeName> ceph_role_mon- kubectl label node <newNodeName> ceph_role_mon=true
Verify that the
rook-ceph-operatordeployment is scaled to0replica:kubectl -n rook-ceph scale deploy rook-ceph-operator --replicas 0
Obtain the
rook-ceph-mondeployment name placed on the obsolete node using the previously obtained node name:kubectl -n rook-ceph get deploy -l app=rook-ceph-mon -o jsonpath="{.items[?(@.spec.template.spec.nodeSelector['kubernetes\.io/hostname'] == '<nodeName>')].metadata.name}"
Substitute
<nodeName>with the name of the node where you removed themonrole.Back up the
rook-ceph-mondeployment placed on the obsolete node:kubectl -n rook-ceph get deploy <rook-ceph-mon-name> -o yaml > <rook-ceph-mon-name>-backup.yaml
Remove the
rook-ceph-mondeployment placed on the obsolete node:kubectl -n rook-ceph delete deploy <rook-ceph-mon-name>
If you perform a managed cluster update, follow additional steps:
Enter the
ceph-toolspod:kubectl -n rook-ceph exec -it deploy/rook-ceph-tools -- bash
Remove the Ceph Monitor from the Ceph monmap by letter:
ceph mon rm <monLetter>
Substitute
<monLetter>with the old Ceph Monitor letter. For example,mon-bhas the letterb.Verify that the Ceph cluster does not have any information about the the removed Ceph Monitor:
ceph mon dump ceph -s
Exit the
ceph-toolspod.Scale up the
rook-ceph-operatordeployment to1replica:kubectl -n rook-ceph scale deploy rook-ceph-operator --replicas 1
Wait for the missing Ceph Monitor failover process to start:
kubectl -n rook-ceph logs -l app=rook-ceph-operator -f
Example of log extract:
2024-03-01 12:33:08.741215 W | op-mon: mon b NOT found in ceph mon map, failover 2024-03-01 12:33:08.741244 I | op-mon: marking mon "b" out of quorum ... 2024-03-01 12:33:08.766822 I | op-mon: Failing over monitor "b" 2024-03-01 12:33:08.766881 I | op-mon: starting new mon...
Select one of the following options:
Wait approximately 10 minutes until
rook-ceph-operatorperforms a failover of thePendingmonpod. Inspect the logs during the failover process:kubectl -n rook-ceph logs -l app=rook-ceph-operator -f
Example of log extract:
2021-03-15 17:48:23.471978 W | op-mon: mon "a" not found in quorum, waiting for timeout (554 seconds left) before failover
Note
If the failover process fails:
Scale down the
rook-ceph-operatordeployment to0replicas.Apply the backed-up
rook-ceph-mondeployment.Scale back the
rook-ceph-operatordeployment to1replica.
Scale the
rook-ceph-operatordeployment to0replicas:kubectl -n rook-ceph scale deploy rook-ceph-operator --replicas 0
Scale the
ceph-maintenance-controllerdeployment to3replicas:kubectl -n ceph-lcm-mirantis scale deploy ceph-maintenance-controller --replicas 3
Once done, Rook removes the obsolete Ceph Monitor from the node and creates
a new one on the specified node with a new letter. For example, if the a,
b, and c Ceph Monitors were in quorum and mon-c was obsolete, Rook
removes mon-c and creates mon-d. In this case, the new quorum includes
the a, b, and d Ceph Monitors.
Migrate a Ceph Monitor before machine replacement
Available since MCC 2.25.0 (Cluster release 17.0.0)
Warning
This procedure is valid for MOSK clusters that use the deprecated
KaaSCephCluster custom resource (CR) instead of the MiraCeph CR that is
available since MOSK 25.2 as a new Ceph configuration entrypoint. For the
equivalent procedure with the MiraCeph CR, refer to the following section:
This document describes how to migrate a Ceph Monitor to another machine on baremetal-based clusters before node replacement as described in Delete a cluster machine using web UI.
Warning
Remove the Ceph Monitor role before the machine removal.
Make sure that the Ceph cluster always has an odd number of Ceph Monitors.
The procedure of a Ceph Monitor migration assumes that you temporarily move the Ceph Manager/Monitor to a worker machine. After a node replacement, we recommend migrating the Ceph Manager/Monitor to the new manager machine.
To migrate a Ceph Monitor to another machine:
Move the Ceph Manager/Monitor daemon from the affected machine to one of the worker machines as described in Move a Ceph Monitor daemon to another node.
Delete the affected machine as described in Delete a cluster machine.
Add a new manager machine without the Monitor and Manager role as described in Create a machine using CLI.
Warning
The addition of a new machine with the Monitor and Manager role breaks the odd number quorum of Ceph Monitors.
Move the previously migrated Ceph Manager/Monitor daemon to the new manager machine as described in Move a Ceph Monitor daemon to another node.
Enable Ceph RGW Object Storage
Warning
This procedure is valid for MOSK clusters that use the deprecated
KaaSCephCluster custom resource (CR) instead of the MiraCeph CR that is
available since MOSK 25.2 as a new Ceph configuration entrypoint. For the
equivalent procedure with the MiraCeph CR, refer to the following section:
Ceph Controller enables you to deploy RADOS Gateway (RGW) Object Storage instances and automatically manage its resources such as users and buckets. Ceph Object Storage has an integration with OpenStack Object Storage (Swift) in MOSK.
To enable the RGW Object Storage:
Open the
KaasCephClusterCR of a managed cluster for editing:kubectl edit kaascephcluster -n <managedClusterProjectName>
Substitute
<managedClusterProjectName>with a corresponding value.Using the following table, update the
cephClusterSpec.objectStorage.rgwsection specification as required:Caution
Since MCC 2.24.0 (Cluster releases 15.0.1 and 14.0.1), explicitly specify the
deviceClassparameter fordataPoolandmetadataPool.Warning
Since Container Cloud 2.6.0, the
spec.rgwsection is deprecated and its parameters are moved underobjectStorage.rgw. If you continue usingspec.rgw, it is automatically translated intoobjectStorage.rgwduring the Container Cloud update to 2.6.0.We strongly recommend changing
spec.rgwtoobjectStorage.rgwin allKaaSCephClusterCRs beforespec.rgwbecomes unsupported and is deleted.RADOS Gateway parameters¶ Parameter
Description
nameRequired. Ceph Object Storage instance name.
dataPoolRequired if
zone:nameis not specified. Mutually exclusive withzone. Must be used together withmetadataPool.Object storage data pool spec that must only contain
replicatedorerasureCodedandfailureDomainparameters. ThefailureDomainparameter may be set tohost,rack,room, ordatacenter, defining the failure domain across which the data will be spread. ThedeviceClassmust be explicitly defined. FordataPool, Mirantis recommends using anerasureCodedpool. For details, see Rook documentation: Erasure coding. For example:rgw: dataPool: deviceClass: hdd failureDomain: host erasureCoded: codingChunks: 1 dataChunks: 2
metadataPoolRequired if
zone:nameis not specified. Mutually exclusive withzone. Must be used together withdataPool. Object storage metadata pool spec that must only containreplicatedandfailureDomainparameters. ThefailureDomainparameter may be set tohost,rack,room, ordatacenter, defining the failure domain across which the data will be spread. ThedeviceClassmust be explicitly defined. Can use onlyreplicatedsettings. For example:rgw: metadataPool: deviceClass: hdd failureDomain: host replicated: size: 3
where
replicated.sizeis the number of full copies of data on multiple nodes.Warning
When using the non-recommended Ceph pools
replicated.sizeof less than3, Ceph OSD removal cannot be performed. The minimal replica size equals a rounded up half of the specifiedreplicated.size.For example, if
replicated.sizeis2, the minimal replica size is1, and ifreplicated.sizeis3, then the minimal replica size is2. The replica size of1allows Ceph having PGs with only one Ceph OSD in theactingstate, which may cause aPG_TOO_DEGRADEDhealth warning that blocks Ceph OSD removal. Mirantis recommends settingreplicated.sizeto3for each Ceph pool.gatewayRequired. The gateway settings corresponding to the
rgwdaemon settings. Includes the following parameters:port- the port on which the Ceph RGW service will be listening on HTTP.securePort- the port on which the Ceph RGW service will be listening on HTTPS.instances- the number of pods in the Ceph RGW ReplicaSet. IfallNodesis set totrue, a DaemonSet is created instead.Note
Mirantis recommends using 3 instances for Ceph Object Storage.
allNodes- defines whether to start the Ceph RGW pods as a DaemonSet on all nodes. Theinstancesparameter is ignored ifallNodesis set totrue.
For example:
rgw: gateway: allNodes: false instances: 3 port: 80 securePort: 8443
preservePoolsOnDeleteOptional. Defines whether to delete the data and metadata pools in the
rgwsection if the object storage is deleted. Set this parameter totrueif you need to store data even if the object storage is deleted. However, Mirantis recommends setting this parameter tofalse.objectUsersandbucketsOptional. To create new Ceph RGW resources, such as buckets or users, specify the following keys. Ceph Controller will automatically create the specified object storage users and buckets in the Ceph cluster.
objectUsers- a list of user specifications to create for object storage. Contains the following fields:name- a user name to create.displayName- the Ceph user name to display.capabilities- user capabilities:user- admin capabilities to read/write Ceph Object Store users.bucket- admin capabilities to read/write Ceph Object Store buckets.metadata- admin capabilities to read/write Ceph Object Store metadata.usage- admin capabilities to read/write Ceph Object Store usage.zone- admin capabilities to read/write Ceph Object Store zones.
The available options are
*,read,write,read, write. For details, see Ceph documentation: Add/remove admin capabilities.quotas- user quotas:maxBuckets- the maximum bucket limit for the Ceph user. Integer, for example,10.maxSize- the maximum size limit of all objects across all the buckets of a user. String size, for example,10G.maxObjects- the maximum number of objects across all buckets of a user. Integer, for example,10.
For example:
objectUsers: - capabilities: bucket: '*' metadata: read user: read displayName: test-user name: test-user quotas: maxBuckets: 10 maxSize: 10G
buckets- a list of strings that contain bucket names to create for object storage.
zoneRequired if
dataPoolandmetadataPoolare not specified. Mutually exclusive with these parameters. Defines the Ceph Multisite zone where the object storage must be placed. Includes thenameparameter that must be set to one of thezonesitems. For details, see the Enable multisite for Ceph RGW Object Storage procedure depending on the Ceph custom resource being used: MiraCeph or KaaSCephCluster.For example:
objectStorage: multisite: zones: - name: master-zone ... rgw: zone: name: master-zone
SSLCertOptional. Custom TLS certificate parameters used to access the Ceph RGW endpoint. If not specified, a self-signed certificate will be generated.
For example:
objectStorage: rgw: SSLCert: cacert: | -----BEGIN CERTIFICATE----- ca-certificate here -----END CERTIFICATE----- tlsCert: | -----BEGIN CERTIFICATE----- private TLS certificate here -----END CERTIFICATE----- tlsKey: | -----BEGIN RSA PRIVATE KEY----- private TLS key here -----END RSA PRIVATE KEY-----
SSLCertInRefOptional. Available since MOSK 25.1. Flag to determine that a TLS certificate for accessing the Ceph RGW endpoint is used but not exposed in
spec. For example:objectStorage: rgw: SSLCertInRef: true
The operator must manually provide TLS configuration using the
rgw-ssl-certificatesecret in therook-cephnamespace of the managed cluster. The secret object must have the following structure:data: cacert: <base64encodedCaCertificate> cert: <base64encodedCertificate>
When removing an already existing
SSLCertblock, no additional actions are required, because this block uses the samergw-ssl-certificatesecret in therook-cephnamespace.When adding a new secret directly without exposing it in
spec, the following rules apply:cert- base64 representation of a file with the server TLS key, server TLS cert, and cacert.cacert- base64 representation of a cacert only.
For example:
cephClusterSpec: objectStorage: rgw: name: rgw-store dataPool: deviceClass: hdd erasureCoded: codingChunks: 1 dataChunks: 2 failureDomain: host metadataPool: deviceClass: hdd failureDomain: host replicated: size: 3 gateway: allNodes: false instances: 3 port: 80 securePort: 8443 preservePoolsOnDelete: false
Enable multisite for Ceph RGW Object Storage
TechPreview
Warning
This procedure is valid for MOSK clusters that use the deprecated
KaaSCephCluster custom resource (CR) instead of the MiraCeph CR that is
available since MOSK 25.2 as a new Ceph configuration entrypoint. For the
equivalent procedure with the MiraCeph CR, refer to the following section:
The Ceph multisite feature allows object storage to replicate its data over multiple Ceph clusters. Using multisite, such object storage is independent and isolated from another object storage in the cluster. Only the multi-zone multisite setup is currently supported. For more details, see Ceph documentation: Multisite.
Enable the multisite RGW Object Storage
Select from the following options:
If you do not have a Container cloud cluster yet, open
kaascephcluster.yaml.templatefor editing.If the Container cloud cluster is already deployed, open the
KaasCephClusterCR of a managed cluster for editing:kubectl edit kaascephcluster -n <managedClusterProjectName>
Substitute
<managedClusterProjectName>with a corresponding value.
Using the following table, update the
cephClusterSpec.objectStorage.multisitesection specification as required:Multisite parameters¶ Parameter
Description
realmsRequired. List of realms to use, represents the realm namespaces. Includes the following parameters:
name- required, the realm name.pullEndpoint- optional, required only when the master zone is in a different storage cluster. The endpoint, access key, and system key of the system user from the realm to pull from. Includes the following parameters:endpoint- the endpoint of the master zone in the master zone group.accessKey- the access key of the system user from the realm to pull from.secretKey- the system key of the system user from the realm to pull from.
zoneGroupsRequired. The list of zone groups for realms. Includes the following parameters:
name- required, the zone group name.realmName- required, the realm namespace name to which the zone group belongs to.
zonesRequired. The list of zones used within one zone group. Includes the following parameters:
name- required, the zone name.metadataPool- required, the settings used to create the Object Storage metadata pools. Must use replication. For details, see description of pool parameters depending on the Ceph custom resource being used: MiraCeph or KaaSCephCluster.dataPool- required, the settings used to create the Object Storage data pool. Can use replication or erasure coding. For details, see description of pool parameters depending on the Ceph custom resource being used: MiraCeph or KaaSCephCluster.zoneGroupName- required, the zone group name.endpointsForZone- optional, available since MOSK 24.2. The list of all endpoints in the zone group. If you use ingress proxy for RGW, the list of endpoints must contain that FQDN/IP address to access RGW. By default, if no ingress proxy is used, the list of endpoints is set to the IP address of the RGW external service. Endpoints must follow the HTTP URL format.
Caution
The multisite configuration requires master and secondary zones to be reachable from each other.
Select from the following options:
If you do not need to replicate data from a different storage cluster, and the current cluster represents the master zone, modify the current
objectStoragesection to use the multisite mode:Configure the
zoneRADOS Gateway (RGW) parameter by setting it to the RGW Object Storage name.Note
Leave
dataPoolandmetadataPoolempty. These parameters are ignored because thezoneblock in the multisite configuration specifies the pools parameters. Other RGW parameters do not require changes.For example:
objectStorage: rgw: dataPool: {} gateway: allNodes: false instances: 2 port: 80 securePort: 8443 healthCheck: {} metadataPool: {} name: openstack-store preservePoolsOnDelete: false zone: name: openstack-store
Create the
multiSitesection where the names of realm, zone group, and zone must match the current RGW name.Since MCC 2.27.0 (Cluster release 17.2.0), specify the
endpointsForZoneparameter according to your configuration:If you use ingress proxy, which is defined in the
spec.cephClusterSpec.ingresssection, add the FQDN endpoint.If you do not use any ingress proxy and access the RGW API using the default RGW external service, add the IP address of the external service or leave this parameter empty.
The following example illustrates a complete
objectStoragesection:objectStorage: multiSite: realms: - name: openstack-store zoneGroups: - name: openstack-store realmName: openstack-store zones: - name: openstack-store zoneGroupName: openstack-store endpointsForZone: http://10.11.0.75:8080 metadataPool: failureDomain: host replicated: size: 3 dataPool: erasureCoded: codingChunks: 1 dataChunks: 2 failureDomain: host rgw: dataPool: {} gateway: allNodes: false instances: 2 port: 80 securePort: 8443 healthCheck: {} metadataPool: {} name: openstack-store preservePoolsOnDelete: false zone: name: openstack-store
If you use a different storage cluster, and its object storage data must be replicated, specify the realm and zone group names along with the
pullEndpointparameter. Additionally, specify the endpoint, access key, and system keys of the system user of the realm from which you need to replicate data. For details, see the step 2 of this procedure.To obtain the endpoint of the cluster zone that must be replicated, run the following command by specifying the zone group name of the required master zone on the master zone side:
radosgw-admin zonegroup get --rgw-zonegroup=<ZONE_GROUP_NAME> | jq -r '.endpoints'
The endpoint is located in the
endpointsfield.To obtain the access key and the secret key of the system user, run the following command on the required Ceph cluster:
radosgw-admin user list
To obtain the system user name, which has your RGW
ObjectStoragename as prefix:radosgw-admin user info --uid="<USER_NAME>" | jq -r '.keys'
For example:
objectStorage: multiSite: realms: - name: openstack-store pullEndpoint: endpoint: http://10.11.0.75:8080 accessKey: DRND5J2SVC9O6FQGEJJF secretKey: qpjIjY4lRFOWh5IAnbrgL5O6RTA1rigvmsqRGSJk zoneGroups: - name: openstack-store realmName: openstack-store zones: - name: openstack-store-backup zoneGroupName: openstack-store metadataPool: failureDomain: host replicated: size: 3 dataPool: erasureCoded: codingChunks: 1 dataChunks: 2 failureDomain: host
Note
Mirantis recommends using the same
metadataPoolanddataPoolsettings as you use in the master zone.
Configure the
zoneRGW parameter and leavedataPoolandmetadataPoolempty. These parameters are ignored because thezonesection in the multisite configuration specifies the pools parameters.Also, you can split the RGW daemon on daemons serving clients and daemons running synchronization. To enable this option, specify
splitDaemonForMultisiteTrafficSyncin thegatewaysection.For example:
objectStorage: multiSite: realms: - name: openstack-store pullEndpoint: endpoint: http://10.11.0.75:8080 accessKey: DRND5J2SVC9O6FQGEJJF secretKey: qpjIjY4lRFOWh5IAnbrgL5O6RTA1rigvmsqRGSJk zoneGroups: - name: openstack-store realmName: openstack-store zones: - name: openstack-store-backup zoneGroupName: openstack-store metadataPool: failureDomain: host replicated: size: 3 dataPool: erasureCoded: codingChunks: 1 dataChunks: 2 failureDomain: host rgw: dataPool: {} gateway: allNodes: false instances: 2 splitDaemonForMultisiteTrafficSync: true port: 80 securePort: 8443 healthCheck: {} metadataPool: {} name: openstack-store-backup preservePoolsOnDelete: false zone: name: openstack-store-backup
On the
ceph-toolspod, verify the multisite status:radosgw-admin sync status
Once done, ceph-operator will create the required resources and Rook will
handle the multisite configuration. For details, see: Rook documentation:
Object Multisite.
Configure and clean up a multisite configuration
Warning
Rook does not handle multisite configuration changes and cleanup.
Therefore, once you enable multisite for Ceph RGW Object Storage, perform
these operations manually in the ceph-tools pod. For details, see
Rook documentation: Multisite cleanup.
If automatic update of zone group hostnames is disabled, manually specify all
required hostnames and update the zone group. In the ceph-tools pod, run
the following script:
/usr/local/bin/zonegroup_hostnames_update.sh --rgw-zonegroup <ZONEGROUP_NAME> --hostnames fqdn1[,fqdn2]
If the multisite setup is completely cleaned up, manually execute the following
steps on the ceph-tools pod:
Remove the
.rgw.rootpool:ceph osd pool rm .rgw.root .rgw.root --yes-i-really-really-mean-it
Some other RGW pools may also require a removal after cleanup.
Remove the related RGW crush rules:
ceph osd crush rule ls | grep rgw | xargs -I% ceph osd crush rule rm %
Manage Ceph RBD or CephFS clients and RGW users
Available since 2.23.1 (Cluster release 12.7.0)
Warning
This procedure is valid for MOSK clusters that use the deprecated
KaaSCephCluster custom resource (CR) instead of the MiraCeph CR that is
available since MOSK 25.2 as a new Ceph configuration entrypoint. For the
equivalent procedure with the MiraCeph CR, refer to the following section:
The section describes how to create, access, and remove Ceph RADOS Block Device (RBD) or Ceph File System (CephFS) clients and RADOS Gateway (RGW) users.
Manage Ceph RBD or CephFS clients
Available since 2.23.1 (Cluster release 12.7.0)
Warning
This procedure is valid for MOSK clusters that use the deprecated
KaaSCephCluster custom resource (CR) instead of the MiraCeph CR that is
available since MOSK 25.2 as a new Ceph configuration entrypoint. For the
equivalent procedure with the MiraCeph CR, refer to the following section:
The KaaSCephCluster resource allows managing custom Ceph RADOS Block
Device (RBD) or Ceph File System (CephFS) clients. This section describes
how to create, access, and remove Ceph RBD or CephFS clients.
For all supported parameters of Ceph clients, refer to Clients parameters.
Edit the
KaaSCephClusterresource by adding a new Ceph client to thespecsection:kubectl -n <managedClusterProjectName> edit kaascephcluster
Substitute
<managedClusterProject>with the corresponding Container Cloud project where the managed cluster was created.Example of adding an RBD client to the
kubernetes-ssdpool:spec: cephClusterSpec: clients: - name: rbd-client caps: mon: allow r, allow command "osd blacklist" osd: profile rbd pool=kubernetes-ssd
Example of adding a CephFS client to the
cephfs-1Ceph File System:spec: cephClusterSpec: clients: - name: cephfs-1-client caps: mds: allow rwp mon: allow r, allow command "osd blacklist" osd: allow rw tag cephfs data=cephfs-1 metadata=*
For details about
caps, refer to Ceph documentation: Authorization (capabilities).Note
Ceph supports only providing of client access to the whole Ceph File System with all data pools in it.
Wait for created clients to become ready in the
KaaSCephClusterstatus:kubectl -n <managedClusterProject> get kaascephcluster -o yaml
Example output:
status: fullClusterInfo: blockStorageStatus: clientsStatus: rbd-client: present: true status: Ready cephfs-1-client: present: true status: Ready
Using the
KaaSCephClusterstatus, obtainsecretInfowith the Ceph client credentials :kubectl -n <managedClusterProject> get kaascephcluster -o yaml
Example output:
status: miraCephSecretsInfo: secretInfo: clientSecrets: - name: rbd-client secretName: rook-ceph-client-rbd-client secretNamespace: rook-ceph - name: cephfs-1-client secretName: rook-ceph-client-cephfs-1-client secretNamespace: rook-ceph
Use
secretNameandsecretNamespaceto access the Ceph client credentials from a managed cluster:kubectl --kubeconfig <managedClusterKubeconfig> -n <secretNamespace> get secret <secretName> -o jsonpath='{.data.<clientName>}' | base64 -d; echo
Substitute the following parameters:
<managedClusterKubeconfig>with a managed clusterkubeconfig<secretNamespace>withsecretNamespacefrom the previous step<secretName>withsecretNamefrom the previous step<clientName>with the Ceph RBD or CephFS client name set inspec.cephClusterSpec.clientstheKaaSCephClusterresource, for example,rbd-client
Example output:
AQAGHDNjxWYXJhAAjafCn3EtC6KgzgI1x4XDlg==
Using the obtained credentials, create two configuration files on the required workloads to connect them with Ceph pools or file systems:
/etc/ceph/ceph.conf:[default] mon_host = <mon1IP>:6789,<mon2IP>:6789,...,<monNIP>:6789
where
mon_hostare the comma-separated IP addresses with6789ports of the current Ceph Monitors. For example,10.10.0.145:6789,10.10.0.153:6789,10.10.0.235:6789./etc/ceph/ceph.client.<clientName>.keyring:[client.<clientName>] key = <cephClientCredentials>
<clientName>is a client name set inspec.cephClusterSpec.clientstheKaaSCephClusterresource, for example,rbd-client<cephClientCredentials>are the client credentials obtained in the previous steps. For example,AQAGHDNjxWYXJhAAjafCn3EtC6KgzgI1x4XDlg==
If the client
capsparameters containmon: allow r, verify the client access using the following command:ceph -n client.<clientName> -s
Edit the
KaaSCephClusterresource by removing the Ceph client fromspec.cephClusterSpec.clients:kubectl -n <managedClusterProject> edit kaascephcluster
Wait for the client to be removed from the
KaaSCephClusterstatus instatus.fullClusterInfo.blockStorageStatus.clientsStatus:kubectl -n <managedClusterProject> get kaascephcluster -o yaml
Manage Ceph Object Storage users
Available since 2.23.1 (Cluster release 12.7.0)
Warning
This procedure is valid for MOSK clusters that use the deprecated
KaaSCephCluster custom resource (CR) instead of the MiraCeph CR that is
available since MOSK 25.2 as a new Ceph configuration entrypoint. For the
equivalent procedure with the MiraCeph CR, refer to the following section:
The KaaSCephCluster resource allows managing custom Ceph Object Storage
users. This section describes how to create, access, and remove Ceph Object
Storage users.
For all supported parameters of Ceph Object Storage users, refer to RADOS Gateway parameters.
Edit the
KaaSCephClusterresource by adding a new Ceph Object Storage user to thespecsection:kubectl -n <managedClusterProject> edit kaascephcluster
Substitute
<managedClusterProject>with the corresponding Container Cloud project where the managed cluster was created.Example of adding the Ceph Object Storage user
user-a:Caution
For user
name, apply the UUID format with no capital letters.spec: cephClusterSpec: objectStorage: rgw: objectUsers: - capabilities: bucket: '*' metadata: read user: read displayName: user-a name: userA quotas: maxBuckets: 10 maxSize: 10G
Wait for the created user to become ready in the
KaaSCephClusterstatus:kubectl -n <managedClusterProject> get kaascephcluster -o yaml
Example output:
status: fullClusterInfo: objectStorageStatus: objectStoreUsers: user-a: present: true phase: Ready
Using the
KaaSCephClusterstatus, obtainsecretInfowith the Ceph user credentials :kubectl -n <managedClusterProject> get kaascephcluster -o yaml
Example output:
status: miraCephSecretsInfo: secretInfo: rgwUserSecrets: - name: user-a secretName: rook-ceph-object-user-<objstoreName>-<username> secretNamespace: rook-ceph
Substitute
<objstoreName>with a Ceph Object Storage name and<username>with a Ceph Object Storage user name.Use
secretNameandsecretNamespaceto access the Ceph Object Storage user credentials from a managed cluster. The secret contains Amazon S3 access and secret keys.To obtain the user S3 access key:
kubectl --kubeconfig <managedClusterKubeconfig> -n <secretNamespace> get secret <secretName> -o jsonpath='{.data.AccessKey}' | base64 -d; echo
Substitute the following parameters in the commands above and below:
<managedClusterKubeconfig>with a managed clusterkubeconfig<secretNamespace>withsecretNamespacefrom the previous step<secretName>withsecretNamefrom the previous step
Example output:
D49G060HQ86U5COBTJ13To obtain the user S3 secret key:
kubectl --kubeconfig <managedClusterKubeconfig> -n <secretNamespace> get secret <secretName> -o jsonpath='{.data.SecretKey}' | base64 -d; echo
Example output:
bpuYqIieKvzxl6nzN0sd7L06H40kZGXNStD4UNda
Configure the S3 client with the access and secret keys of the created user. You can access the S3 client using various tools such as s3cmd or awscli.
Edit the
KaaSCephClusterresource by removing the required Ceph Object Storage user fromspec.cephClusterSpec.objectStorage.rgw.objectUsers:kubectl -n <managedClusterProject> edit kaascephcluster
Wait for the removed user to be removed from the
KaaSCephClusterstatus instatus.fullClusterInfo.objectStorageStatus.objectStoreUsers:kubectl -n <managedClusterProject> get kaascephcluster -o yaml
Verify Ceph
Warning
This procedure is valid for MOSK clusters that use the deprecated
KaaSCephCluster custom resource (CR) instead of the MiraCeph CR that is
available since MOSK 25.2 as a new Ceph configuration entrypoint. For the
equivalent procedure with the MiraCeph CR, refer to the following section:
This section describes how to verify the components of a Ceph cluster after deployment. For troubleshooting, verify Ceph Controller and Rook logs as described in Verify Ceph Controller and Rook.
Verify the Ceph core services
Warning
This procedure is valid for MOSK clusters that use the deprecated
KaaSCephCluster custom resource (CR) instead of the MiraCeph CR that is
available since MOSK 25.2 as a new Ceph configuration entrypoint. For the
equivalent procedure with the MiraCeph CR, refer to the following section:
To confirm that all Ceph components including mon, mgr, osd, and
rgw have joined your cluster properly, analyze the logs for each pod and
verify the Ceph status:
kubectl -n rook-ceph exec -it $(kubectl -n rook-ceph get pod -l "app=rook-ceph-tools" -o jsonpath='{.items[0].metadata.name}') bash
ceph -s
Example of a positive system response:
cluster:
id: 4336ab3b-2025-4c7b-b9a9-3999944853c8
health: HEALTH_OK
services:
mon: 3 daemons, quorum a,b,c (age 20m)
mgr: a(active, since 19m)
osd: 6 osds: 6 up (since 16m), 6 in (since 16m)
rgw: 1 daemon active (miraobjstore.a)
data:
pools: 12 pools, 216 pgs
objects: 201 objects, 3.9 KiB
usage: 6.1 GiB used, 174 GiB / 180 GiB avail
pgs: 216 active+clean
Verify rook-discover
Warning
This procedure is valid for MOSK clusters that use the deprecated
KaaSCephCluster custom resource (CR) instead of the MiraCeph CR that is
available since MOSK 25.2 as a new Ceph configuration entrypoint. For the
equivalent procedure with the MiraCeph CR, refer to the following section:
To ensure that rook-discover is running properly, verify if the
local-device configmap has been created for each Ceph node specified
in the cluster configuration:
Obtain the list of local devices:
kubectl get configmap -n rook-ceph | grep local-device
Example of a system response:
local-device-01 1 30m local-device-02 1 29m local-device-03 1 30m
Verify that each device from the list contains information about available devices for the Ceph node deployment:
kubectl describe configmap local-device-01 -n rook-ceph
Example of a positive system response:
Name: local-device-01 Namespace: rook-ceph Labels: app=rook-discover rook.io/node=01 Annotations: <none> Data ==== devices: ---- [{"name":"vdd","parent":"","hasChildren":false,"devLinks":"/dev/disk/by-id/virtio-41d72dac-c0ff-4f24-b /dev/disk/by-path/virtio-pci-0000:00:09.0","size":32212254720,"uuid":"27e9cf64-85f4-48e7-8862-faa7270202ed","serial":"41d72dac-c0ff-4f24-b","type":"disk","rotational":true,"readOnly":false,"Partitions":null,"filesystem":"","vendor":"","model":"","wwn":"","wwnVendorExtension":"","empty":true,"cephVolumeData":"{\"path\":\"/dev/vdd\",\"available\":true,\"rejected_reasons\":[],\"sys_api\":{\"size\":32212254720.0,\"scheduler_mode\":\"none\",\"rotational\":\"1\",\"vendor\":\"0x1af4\",\"human_readable_size\":\"30.00 GB\",\"sectors\":0,\"sas_device_handle\":\"\",\"rev\":\"\",\"sas_address\":\"\",\"locked\":0,\"sectorsize\":\"512\",\"removable\":\"0\",\"path\":\"/dev/vdd\",\"support_discard\":\"0\",\"model\":\"\",\"ro\":\"0\",\"nr_requests\":\"128\",\"partitions\":{}},\"lvs\":[]}","label":""},{"name":"vdb","parent":"","hasChildren":false,"devLinks":"/dev/disk/by-path/virtio-pci-0000:00:07.0","size":67108864,"uuid":"988692e5-94ac-4c9a-bc48-7b057dd94fa4","serial":"","type":"disk","rotational":true,"readOnly":false,"Partitions":null,"filesystem":"","vendor":"","model":"","wwn":"","wwnVendorExtension":"","empty":true,"cephVolumeData":"{\"path\":\"/dev/vdb\",\"available\":false,\"rejected_reasons\":[\"Insufficient space (\\u003c5GB)\"],\"sys_api\":{\"size\":67108864.0,\"scheduler_mode\":\"none\",\"rotational\":\"1\",\"vendor\":\"0x1af4\",\"human_readable_size\":\"64.00 MB\",\"sectors\":0,\"sas_device_handle\":\"\",\"rev\":\"\",\"sas_address\":\"\",\"locked\":0,\"sectorsize\":\"512\",\"removable\":\"0\",\"path\":\"/dev/vdb\",\"support_discard\":\"0\",\"model\":\"\",\"ro\":\"0\",\"nr_requests\":\"128\",\"partitions\":{}},\"lvs\":[]}","label":""},{"name":"vdc","parent":"","hasChildren":false,"devLinks":"/dev/disk/by-id/virtio-e8fdba13-e24b-41f0-9 /dev/disk/by-path/virtio-pci-0000:00:08.0","size":32212254720,"uuid":"190a50e7-bc79-43a9-a6e6-81b173cd2e0c","serial":"e8fdba13-e24b-41f0-9","type":"disk","rotational":true,"readOnly":false,"Partitions":null,"filesystem":"","vendor":"","model":"","wwn":"","wwnVendorExtension":"","empty":true,"cephVolumeData":"{\"path\":\"/dev/vdc\",\"available\":true,\"rejected_reasons\":[],\"sys_api\":{\"size\":32212254720.0,\"scheduler_mode\":\"none\",\"rotational\":\"1\",\"vendor\":\"0x1af4\",\"human_readable_size\":\"30.00 GB\",\"sectors\":0,\"sas_device_handle\":\"\",\"rev\":\"\",\"sas_address\":\"\",\"locked\":0,\"sectorsize\":\"512\",\"removable\":\"0\",\"path\":\"/dev/vdc\",\"support_discard\":\"0\",\"model\":\"\",\"ro\":\"0\",\"nr_requests\":\"128\",\"partitions\":{}},\"lvs\":[]}","label":""}]
Verify Ceph cluster state through CLI
Warning
This procedure is valid for MOSK clusters that use the deprecated
KaaSCephCluster custom resource (CR) instead of the MiraCeph CR that is
available since MOSK 25.2 as a new Ceph configuration entrypoint. For the
equivalent procedure with the MiraCeph CR, refer to the following section:
Verifying Ceph cluster state is an entry point for issues investigation.
This section describes how to verify Ceph state using the KaaSCephCluster,
MiraCeph, and MiraCephLog resources.
Note
Before MOSK 25.1, use MiraCephLog
instead of MiraCephHealth.
Warning
This procedure is valid for MOSK clusters that use the deprecated
KaaSCephCluster custom resource (CR) instead of the MiraCeph CR that is
available since MOSK 25.2 as a new Ceph configuration entrypoint. For the
equivalent procedure with the MiraCeph CR, refer to the following section:
To verify the state of a Ceph cluster, Ceph Controller provides special
sections in KaaSCephCluster.status. The resource contains information about
the state of the Ceph cluster components, their health, and potentially
problematic components.
To verify the Ceph cluster state from a managed cluster:
Obtain
kubeconfigof a managed cluster and provide it as an environment variable:export KUBECONFIG=<pathToManagedKubeconfig>
Obtain the
MiraCephresource in YAML format:kubectl -n ceph-lcm-mirantis get miraceph -o yaml
Information from
MiraCeph.statusis passed to themiraCephInfosection of theKaaSCephClusterCR. For details, see KaaSCephCluster.status miraCephInfo specification.Obtain the
MiraCephHealthresource in YAML format:kubectl -n ceph-lcm-mirantis get miracephhealth -o yaml
Information from
MiraCephHealthis passed to thefullClusterInfoandshortClusterInfosections of theKaaSCephClusterCR. For details, see KaaSCephCluster.status shortClusterInfo specification and KaaSCephCluster.status fullClusterInfo specification.Note
Before MOSK 25.1, use
MiraCephLoginstead ofMiraCephHealthas the resource name and in the command above.
To verify the Ceph cluster state from a management cluster:
Obtain the
KaaSCephClusterresource in the YAML format:kubectl -n <projectName> get kaascephcluster -o yaml
Substitute
<projectName>with the project name of the managed cluster.Verify the state of the required component using KaaSCephCluster.status description.
Warning
This procedure is valid for MOSK clusters that use the deprecated
KaaSCephCluster custom resource (CR) instead of the MiraCeph CR that is
available since MOSK 25.2 as a new Ceph configuration entrypoint. For the
equivalent procedure with the MiraCeph CR, refer to the following section:
KaaSCephCluster.status allows you to learn the current health of a Ceph
cluster and identify potentially problematic components. This section describes
KaaSCephCluster.status and its fields. To view KaaSCephCluster.status,
perform the steps described in Verify Ceph cluster state through CLI.
KaaSCephCluster.status miraCephSecretsInfo specification Since MCC 2.23.1 (Cluster release 12.7.0)
Field |
Description |
|---|---|
|
Available since MCC 2.25.0 (Cluster release 17.0.0).
Describes the current state of |
|
Describes the current phase of Ceph spec reconciliation and spec
validation result. The |
|
Reresents a short version of |
|
Contains a complete Ceph cluster information including cluster, Ceph
resources, and daemons health. It helps to reveal the potentially
problematic components. For |
|
Contains information about secrets of the managed cluster that are used
in the Ceph cluster, such as keyrings, Ceph clients, RADOS Gateway user
credentials, and so on. For |
The following tables describe all sections of KaaSCephCluster.status.
Field |
Description |
|---|---|
|
Contains the current phase of handling of the applied Ceph cluster spec.
Can equal to |
|
Contains a detailed description of the current phase or an error message
if the phase is |
|
Contains the validation:
result: Succeed or Failed
messages: ["error", "messages", "list"]
|
Field |
Description |
|---|---|
|
Current Ceph cluster collector status:
|
|
|
|
|
|
List of error or warning messages found when gathering the facts about the Ceph cluster. |
Field |
Description |
|---|---|
|
General information from Rook about the Ceph cluster health and current
state. The clusterStatus:
state: <rook ceph cluster common status>
phase: <rook ceph cluster spec reconcile phase>
message: <rook ceph cluster phase details>
conditions: <history of rook ceph cluster
reconcile steps>
ceph: <ceph cluster health>
storage:
deviceClasses: <list of used device classes
in ceph cluster>
version:
image: <ceph image used in ceph cluster>
version: <ceph version of ceph cluster>
|
|
Status of the Rook Ceph Operator pod that is |
|
Map of statuses for each Ceph cluster daemon type. Indicates the
expected and actual number of Ceph daemons on the cluster. Available
daemon types are: daemonsStatus:
<daemonType>:
status: <daemons status>
running: <number of running daemons with
details>
For example: daemonsStatus:
mgr:
running: a is active mgr ([] standBy)
status: Ok
mon:
running: '3/3 mons running: [a c d] in quorum'
status: Ok
osd:
running: '4/4 running: 4 up, 4 in'
status: Ok
rgw:
running: 2/2 running
([openstack.store.a openstack.store.b])
status: Ok
|
|
State of the Ceph cluster block storage resources. Includes the following fields:
|
|
State of the Ceph cluster object storage resources. Includes the following fields:
|
|
Verbose details of the Ceph cluster state.
|
|
Contains information, similar to the cephCSIPluginDaemonsStatus:
<csiPlugin>:
running: <number of running daemons with details>
status: <csi plugin status>
For example: cephCSIPluginDaemonsStatus:
csi-rbdplugin:
running: 1/3 running
status: Some csi-rbdplugin daemons are not ready
csi-cephfsplugin:
running: 3/3 running
status: Ok
|
Field |
Description |
|---|---|
|
Current state of the secret collector on the Ceph cluster:
|
|
|
|
|
|
List of secrets for Ceph clients and RADOS Gateway users:
For example: lastSecretCheck: "2022-09-05T07:05:35Z"
lastSecretUpdate: "2022-09-05T06:02:00Z"
secretInfo:
clientSecrets:
- name: client.admin
secretName: rook-ceph-admin-keyring
secretNamespace: rook-ceph
state: Ready
|
|
List of error or warning messages, if any, found when collecting information about the Ceph cluster. |
View Ceph cluster summary through the Container Cloud web UI
Warning
Mirantis highly recommends verifying a Ceph cluster using the CLI instead of the web UI. For details, see Verify Ceph cluster state through CLI.
The web UI capabilities for adding and managing a Ceph cluster are limited and lack flexibility in defining Ceph cluster specifications. For example, if an error occurs while adding a Ceph cluster using the web UI, usually you can address it only through the CLI.
The web UI functionality for managing Ceph cluster is going to be deprecated in one of the following releases.
Verifying Ceph cluster state is an entry point for issues investigation. Through the Ceph Clusters page of the Container Cloud web UI, you can view a detailed summary on all Ceph clusters deployed, including the cluster name and ID, health status, number of Ceph OSDs, and so on.
To view Ceph cluster summary:
Log in to the Container Cloud web UI with the
m:kaas:namespace@operatororm:kaas:namespace@writerpermissions.Switch to the required project using the Switch Project action icon located on top of the main left-side navigation panel.
In the Clusters tab, click the required cluster name. The page with cluster details opens.
In the Ceph Clusters tab, verify the overall cluster health and rebalancing statuses.
Available since MCC 2.25.0 (Cluster release 17.0.0). Click Cluster Details:
The Machines tab contains the list of deployed Ceph machines with the following details:
Status - deployment status
Role - role assigned to a machine, manager or monitor
Storage devices - number of storage devices assigned to a machine
UP OSDs and IN OSDs - number of
upandinCeph OSDs belonging to a machine
Note
To obtain details about a specific machine used for Ceph deployment, in the Clusters > <clusterName> > Machines tab, click the required machine name containing the storage label.
The OSDs tab contains the list of Ceph OSDs comprising the Ceph cluster with the following details:
OSD - Ceph OSD ID
Storage Device ID - storage device ID assigned to a Ceph OSD
Type - type of storage device assigned to a Ceph OSD
Partition - partition name where Ceph OSD is located
Machine - machine name where Ceph OSD is located
UP/DOWN - status of a Ceph OSD in a cluster
IN/OUT - service state of a Ceph OSD in a cluster
Verify Ceph Controller and Rook
Warning
This procedure is valid for MOSK clusters that use the deprecated
KaaSCephCluster custom resource (CR) instead of the MiraCeph CR that is
available since MOSK 25.2 as a new Ceph configuration entrypoint. For the
equivalent procedure with the MiraCeph CR, refer to the following section:
The starting point for Ceph troubleshooting is the ceph-controller and
rook-operator logs. Once you locate the component that causes issues,
verify the logs of the related pod. This section describes how to verify the
Ceph Controller and Rook objects of a Ceph cluster.
To verify Ceph Controller and Rook:
Verify that the status of each pod in the
ceph-lcm-mirantisandrook-cephnamespaces isRunning:For
ceph-lcm-mirantis:kubectl -n ceph-lcm-mirantis get pod
For
rook-ceph:kubectl -n rook-ceph get pod
Verify Ceph Controller. Ceph Controller prepares the configuration that Rook uses to deploy the Ceph cluster, managed using the
KaasCephClusterresource. If Rook cannot finish the deployment, verify the Rook Operator logs as described in the step 4.List the pods:
kubectl -n ceph-lcm-mirantis get pods
Verify the logs of the required pod:
kubectl -n ceph-lcm-mirantis logs <ceph-controller-pod-name>
Verify the configuration:
kubectl get kaascephcluster -n <managedClusterProjectName> -o yaml
On the managed cluster, verify the
MiraCephsubresource:kubectl get miraceph -n ceph-lcm-mirantis -o yaml
Verify the Rook Operator logs. Rook deploys a Ceph cluster based on custom resources created by the Ceph Controller, such as pools, clients,
cephcluster, and so on. Rook logs contain details about components orchestration. For details about the Ceph cluster status and to get access to CLI tools, connect to theceph-toolspod as described in the step 5.Verify the Rook Operator logs:
kubectl -n rook-ceph logs -l app=rook-ceph-operator
Verify the
CephClusterconfiguration:Note
The Ceph Controller manages the
CephClusterCR . Open theCephClusterCR only for verification and do not modify it manually.kubectl get cephcluster -n rook-ceph -o yaml
Verify the
ceph-toolspod:Execute the
ceph-toolspod:kubectl --kubeconfig <pathToManagedClusterKubeconfig> -n rook-ceph exec -it $(kubectl --kubeconfig <pathToManagedClusterKubeconfig> -n rook-ceph get pod -l app=rook-ceph-tools -o jsonpath='{.items[0].metadata.name}') bash
Verify that CLI commands can run on the
ceph-toolspod:ceph -s
Verify hardware:
Through the
ceph-toolspod, obtain the required device in your cluster:ceph osd tree
Enter all Ceph OSD pods in the
rook-cephnamespace one by one:kubectl exec -it -n rook-ceph <osd-pod-name> bash
Verify that the
ceph-volumetool is available on all pods running on the target node:ceph-volume lvm list
Verify data access. Ceph volumes can be consumed directly by Kubernetes workloads and internally, for example, by OpenStack services. To verify the Kubernetes storage:
Verify the available storage classes. The storage classes that are automatically managed by Ceph Controller use the
rook-ceph.rbd.csi.ceph.comprovisioner.kubectl get storageclass
Example of system response:
NAME PROVISIONER RECLAIMPOLICY VOLUMEBINDINGMODE ALLOWVOLUMEEXPANSION AGE kubernetes-ssd (default) rook-ceph.rbd.csi.ceph.com Delete Immediate false 55m stacklight-alertmanager-data kubernetes.io/no-provisioner Delete WaitForFirstConsumer false 55m stacklight-elasticsearch-data kubernetes.io/no-provisioner Delete WaitForFirstConsumer false 55m stacklight-postgresql-db kubernetes.io/no-provisioner Delete WaitForFirstConsumer false 55m stacklight-prometheus-data kubernetes.io/no-provisioner Delete WaitForFirstConsumer false 55m
Verify that volumes are properly connected to the Pod:
Obtain the list of volumes in all namespaces or use a particular one:
kubectl get persistentvolumeclaims -A
Example of system response:
NAMESPACE NAME STATUS VOLUME CAPACITY ACCESS MODES STORAGECLASS AGE rook-ceph app-test Bound pv-test 1Gi RWO kubernetes-ssd 11m
For each volume, verify the connection. For example:
kubectl describe pvc app-test -n rook-ceph
Example of a positive system response:
Name: app-test Namespace: kaas StorageClass: rook-ceph Status: Bound Volume: pv-test Labels: <none> Annotations: pv.kubernetes.io/bind-completed: yes pv.kubernetes.io/bound-by-controller: yes volume.beta.kubernetes.io/storage-provisioner: rook-ceph.rbd.csi.ceph.com Finalizers: [kubernetes.io/pvc-protection] Capacity: 1Gi Access Modes: RWO VolumeMode: Filesystem Events: <none>
In case of connection issues, inspect the Pod description for the volume information:
kubectl describe pod <crashloopbackoff-pod-name>
Example of system response:
... Events: FirstSeen LastSeen Count From SubObjectPath Type Reason Message --------- -------- ----- ---- ------------- -------- ------ ------- 1h 1h 3 default-scheduler Warning FailedScheduling PersistentVolumeClaim is not bound: "app-test" (repeated 2 times) 1h 35s 36 kubelet, 172.17.8.101 Warning FailedMount Unable to mount volumes for pod "wordpress-mysql-918363043-50pjr_default(08d14e75-bd99-11e7-bc4c-001c428b9fc8)": timeout expired waiting for volumes to attach/mount for pod "default"/"wordpress-mysql-918363043-50pjr". list of unattached/unmounted volumes=[mysql-persistent-storage] 1h 35s 36 kubelet, 172.17.8.101 Warning FailedSync Error syncing pod
Verify that the CSI provisioner plugins started properly and are in the
Runningstatus:Obtain the list of CSI provisioner plugins:
kubectl -n rook-ceph get pod -l app=csi-rbdplugin-provisioner
Verify the logs of the required CSI provisioner:
kubectl logs -n rook-ceph <csi-provisioner-plugin-name> csi-provisioner
Enable Ceph tolerations and resources management
Warning
This procedure is valid for MOSK clusters that use the deprecated
KaaSCephCluster custom resource (CR) instead of the MiraCeph CR that is
available since MOSK 25.2 as a new Ceph configuration entrypoint. For the
equivalent procedure with the MiraCeph CR, refer to the following section:
This section describes how to configure Ceph Controller to manage Ceph nodes resources.
Enable Ceph tolerations and resources management
Warning
This procedure is valid for MOSK clusters that use the deprecated
KaaSCephCluster custom resource (CR) instead of the MiraCeph CR that is
available since MOSK 25.2 as a new Ceph configuration entrypoint. For the
equivalent procedure with the MiraCeph CR, refer to the following section:
Warning
This document does not provide any specific recommendations on requests and limits for Ceph resources. The document stands for a native Ceph resources configuration for any cluster with MOSK.
You can configure Ceph Controller to manage Ceph resources by specifying their requirements and constraints. To configure the resources consumption for the Ceph nodes, consider the following options that are based on different Helm release configuration values:
Configuring tolerations for taint nodes for the Ceph Monitor, Ceph Manager, and Ceph OSD daemons. For details, see Taints and Tolerations.
Configuring nodes resources requests or limits for the Ceph daemons and for each Ceph OSD device class such as HDD, SSD, or NVMe. For details, see Managing Resources for Containers.
To enable Ceph tolerations and resources management:
To avoid Ceph cluster health issues during daemons configuration changing, set Ceph
noout,nobackfill,norebalance, andnorecoverflags through theceph-toolspod before editing Ceph tolerations and resources:kubectl -n rook-ceph exec -it $(kubectl -n rook-ceph get pod -l \ "app=rook-ceph-tools" -o jsonpath='{.items[0].metadata.name}') bash ceph osd set noout ceph osd set nobackfill ceph osd set norebalance ceph osd set norecover exit
Note
Skip this step if you are only configuring the PG rebalance timeout and replicas count parameters.
Edit the
KaaSCephClusterresource of a managed cluster:kubectl -n <managedClusterProjectName> edit kaascephcluster
Substitute
<managedClusterProjectName>with the project name of the required managed cluster.Specify the parameters in the
hyperconvergesection as required. Thehyperconvergesection includes the following parameters:Ceph tolerations and resources parameters¶ Parameter
Description
Example values
tolerationsSpecifies tolerations for taint nodes for the defined daemon type. Each daemon type key contains the following parameters:
cephClusterSpec: hyperconverge: tolerations: <daemonType>: rules: - key: "" operator: "" value: "" effect: "" tolerationSeconds: 0
Possible values for
<daemonType>areosd,mon,mgr, andrgw. The following values are also supported:all- specifies general toleration rules for all daemons if no separate daemon rule is specified.mds- specifies the CephFS Metadata Server daemons.
hyperconverge: tolerations: mon: rules: - effect: NoSchedule key: node-role.kubernetes.io/controlplane operator: Exists mgr: rules: - effect: NoSchedule key: node-role.kubernetes.io/controlplane operator: Exists osd: rules: - effect: NoSchedule key: node-role.kubernetes.io/controlplane operator: Exists rgw: rules: - effect: NoSchedule key: node-role.kubernetes.io/controlplane operator: Exists
resourcesSpecifies resources requests or limits. The parameter is a map with the daemon type as a key and the following structure as a value:
hyperconverge: resources: <daemonType>: requests: <kubernetes valid spec of daemon resource requests> limits: <kubernetes valid spec of daemon resource limits>
Possible values for
<daemonType>aremon,mgr,osd,osd-hdd,osd-ssd,osd-nvme,prepareosd,rgw, andmds. Theosd-hdd,osd-ssd, andosd-nvmeresource requirements handle only the Ceph OSDs with a corresponding device class.hyperconverge: resources: mon: requests: memory: 1Gi cpu: 2 limits: memory: 2Gi cpu: 3 mgr: requests: memory: 1Gi cpu: 2 limits: memory: 2Gi cpu: 3 osd: requests: memory: 1Gi cpu: 2 limits: memory: 2Gi cpu: 3 osd-hdd: requests: memory: 1Gi cpu: 2 limits: memory: 2Gi cpu: 3 osd-ssd: requests: memory: 1Gi cpu: 2 limits: memory: 2Gi cpu: 3 osd-nvme: requests: memory: 1Gi cpu: 2 limits: memory: 2Gi cpu: 3
For the Ceph node specific resources settings, specify the
resourcessection in the correspondingnodesspec ofKaaSCephCluster:spec: cephClusterSpec: nodes: <nodeName>: resources: requests: <kubernetes valid spec of daemon resource requests> limits: <kubernetes valid spec of daemon resource limits>
Substitute
<nodeName>with the node requested for specific resources. For example:spec: cephClusterSpec: nodes: <nodeName>: resources: requests: memory: 1Gi cpu: 2 limits: memory: 2Gi cpu: 3
For the RADOS Gateway instances specific resources settings, specify the
resourcessection in thergwspec ofKaaSCephCluster:spec: cephClusterSpec: objectStorage: rgw: gateway: resources: requests: <kubernetes valid spec of daemon resource requests> limits: <kubernetes valid spec of daemon resource limits>
For example:
spec: cephClusterSpec: objectStorage: rgw: gateway: resources: requests: memory: 1Gi cpu: 2 limits: memory: 2Gi cpu: 3
Save the reconfigured
KaaSCephClusterresource and wait forceph-controllerto apply the updated Ceph configuration. It will recreate Ceph Monitors, Ceph Managers, or Ceph OSDs according to the specifiedhyperconvergeconfiguration.If you have specified any
osdtolerations, additionally specify tolerations for therookinstances:Open the
Clusterresource of the required Ceph cluster on a management cluster:kubectl -n <ClusterProjectName> edit cluster
Substitute
<ClusterProjectName>with the project name of the required cluster.Specify the parameters in the
ceph-controllersection ofspec.providerSpec.value.helmReleases:Specify the
hyperconverge.tolerations.rookparameter as required:hyperconverge: tolerations: rook: | <yamlFormattedKubernetesTolerations>
In
<yamlFormattedKubernetesTolerations>, specify YAML-formatted tolerations fromcephClusterSpec.hyperconverge.tolerations.osd.rulesof theKaaSCephClusterspec. For example:hyperconverge: tolerations: rook: | - effect: NoSchedule key: node-role.kubernetes.io/controlplane operator: Exists
In
controllers.cephRequest.parameters.pgRebalanceTimeoutMin, specify the PG rebalance timeout for requests. The default is30minutes. For example:controllers: cephRequest: parameters: pgRebalanceTimeoutMin: 35
In
controllers.cephController.replicas,controllers.cephRequest.replicas, andcontrollers.cephStatus.replicas, specify the replicas count. The default is3replicas. For example:controllers: cephController: replicas: 1 cephRequest: replicas: 1 cephStatus: replicas: 1
Save the reconfigured
Clusterresource and wait for theceph-controllerHelm release update. It will recreate Ceph CSI and discover pods according to the specifiedhyperconverge.tolerations.rookconfiguration.
Specify tolerations for different Rook resources using the following chart-based options:
hyperconverge.tolerations.rook- general toleration rules for each Rook service if no exact rules specifiedhyperconverge.tolerations.csiplugin- for tolerations of theceph-csiplugins DaemonSetshyperconverge.tolerations.csiprovisioner- for theceph-csiprovisioner deployment tolerationshyperconverge.nodeAffinity.csiprovisioner- provides theceph-csiprovisioner node affinity with avaluesection
After a successful Ceph reconfiguration, unset the flags set in step 1 through the
ceph-toolspod:kubectl -n rook-ceph exec -it $(kubectl -n rook-ceph get pod -l \ "app=rook-ceph-tools" -o jsonpath='{.items[0].metadata.name}') bash ceph osd unset ceph osd unset noout ceph osd unset nobackfill ceph osd unset norebalance ceph osd unset norecover exit
Note
Skip this step if you have only configured the PG rebalance timeout and replicas count parameters.
Once done, proceed to Verify Ceph tolerations and resources management.
Verify Ceph tolerations and resources management
Warning
This procedure is valid for MOSK clusters that use the deprecated
KaaSCephCluster custom resource (CR) instead of the MiraCeph CR that is
available since MOSK 25.2 as a new Ceph configuration entrypoint. For the
equivalent procedure with the MiraCeph CR, refer to the following section:
After you enable Ceph resources management as described in Enable Ceph tolerations and resources management, perform the steps below to verify that the configured tolerations, requests, or limits have been successfully specified in the Ceph cluster.
To verify Ceph tolerations and resources management:
To verify that the required tolerations are specified in the Ceph cluster, inspect the output of the following commands:
kubectl -n rook-ceph get $(kubectl -n rook-ceph get cephcluster -o name) -o jsonpath='{.spec.placement.mon.tolerations}' kubectl -n rook-ceph get $(kubectl -n rook-ceph get cephcluster -o name) -o jsonpath='{.spec.placement.mgr.tolerations}' kubectl -n rook-ceph get $(kubectl -n rook-ceph get cephcluster -o name) -o jsonpath='{.spec.placement.osd.tolerations}'
To verify RADOS Gateway tolerations:
kubectl -n rook-ceph get $(kubectl -n rook-ceph get cephobjectstore -o name) -o jsonpath='{.spec.gateway.placement.tolerations}'
To verify that the required resources requests or limits are specified for the Ceph
mon,mgr, orosddaemons, inspect the output of the following command:kubectl -n rook-ceph get $(kubectl -n rook-ceph get cephcluster -o name) -o jsonpath='{.spec.resources}'
To verify that the required resources requests and limits are specified for the RADOS Gateway daemons, inspect the output of the following command:
kubectl -n rook-ceph get $(kubectl -n rook-ceph get cephobjectstore -o name) -o jsonpath='{.spec.gateway.resources}'
To verify that the required resources requests or limits are specified for the Ceph OSDs
hdd,ssd, ornvmedevice classes, perform the following steps:Identify which Ceph OSDs belong to the
<deviceClass>device class in question:kubectl -n rook-ceph exec -it $(kubectl -n rook-ceph get pod -l app=rook-ceph-tools -o name) -- ceph osd crush class ls-osd <deviceClass>
For each
<osdID>obtained in the previous step, run the following command. Compare the output with the desired result.kubectl -n rook-ceph get deploy rook-ceph-osd-<osdID> -o jsonpath='{.spec.template.spec.containers[].resources}'
Enable Ceph multinetwork
Warning
This procedure is valid for MOSK clusters that use the deprecated
KaaSCephCluster custom resource (CR) instead of the MiraCeph CR that is
available since MOSK 25.2 as a new Ceph configuration entrypoint. For the
equivalent procedure with the MiraCeph CR, refer to the following section:
Ceph allows establishing multiple IP networks and subnet masks for clusters
with configured L3 network rules. In MOSK, you can configure
multinetwork through the network section of the KaaSCephCluster CR.
Ceph Controller uses this section to specify the Ceph networks for external
access and internal daemon communication. The parameters in the network
section use the CIDR notation, for example, 10.0.0.0/24.
Before enabling multiple networks for a Ceph cluster, consider the following requirements:
Do not confuse the IP addresses you define with the public-facing IP addresses the network clients may use to access the services.
If you define more than one IP address and subnet mask for the public or cluster network, ensure that the subnets within the network can route to each other.
Include each IP address or subnet in the
networksection to IP tables and open ports for them as necessary.The pods of the Ceph OSD and RadosGW daemons use cross-pods health checkers to verify that the entire Ceph cluster is healthy. Therefore, each CIDR must be accessible inside Ceph pods.
Avoid using the
0.0.0.0/0CIDR in thenetworksection. With a zero range inpublicNetand/orclusterNet, the Ceph daemons behavior is unpredictable.
To enable multinetwork for Ceph:
Select from the following options:
If the Ceph cluster is not deployed on a managed cluster yet, edit the deployment
KaaSCephClusterYAML template.If the Ceph cluster is already deployed on a managed cluster, open
KaaSCephClusterfor editing:kubectl -n <managedClusterProjectName> edit kaascephcluster
Substitute
<managedClusterProjectName>with a corresponding value.
In the
clusterNetand/orpublicNetparameters of thecephClusterSpec.networksection, define a comma-separated array of CIDRs. For example:network: publicNet: 10.12.0.0/24,10.13.0.0/24 clusterNet: 10.10.0.0/24,10.11.0.0/24
Select from the following options:
If you are creating a managed cluster, save the updated
KaaSCephClustertemplate to the corresponding file and proceed with the managed cluster creation.If you are configuring
KaaSCephClusterof an existing managed cluster, exiting the text editor will apply the changes.
Once done, the specified network CIDRs will be passed to the Ceph daemons pods
through the rook-config-override ConfigMap.
Enable Ceph RBD mirroring
TechPreview
Warning
This procedure is valid for MOSK clusters that use the deprecated
KaaSCephCluster custom resource (CR) instead of the MiraCeph CR that is
available since MOSK 25.2 as a new Ceph configuration entrypoint. For the
equivalent procedure with the MiraCeph CR, refer to the following section:
This section describes how to configure and use RADOS Block Device (RBD)
mirroring for Ceph pools using the rbdMirror section in the
KaaSCephCluster CR. The feature may be useful if, for example, you have
two interconnected managed clusters. Once you enable RBD mirroring, the
images in the specified pools will be replicated and if a cluster becomes
unreachable, the second one will provide users with instant access to all
images. For details, see Ceph Documentation: RBD Mirroring.
Note
Ceph Controller only supports bidirectional mirroring.
To enable Ceph RBD monitoring, follow the procedure below and use the following
rbdMirror parameters description:
Parameter |
Description |
|---|---|
|
Count of |
|
Optional. List of mirroring peers of an external cluster to connect to.
Only a single peer is supported. The
|
To enable Ceph RBD mirroring:
In
KaaSCephClusterCRs of both Ceph clusters where you want to enable mirroring, specify positivedaemonsCountin thespec.cephClusterSpec.rbdMirrorsection:spec: cephClusterSpec: rbdMirror: daemonsCount: 1
On both Ceph clusters where you want to enable mirroring, wait for the Ceph RBD Mirror daemons to start running:
kubectl -n rook-ceph get pod -l app=rook-ceph-rbd-mirror
In
KaaSCephClusterof both Ceph clusters where you want to enable mirroring, specify thespec.cephClusterSpec.pools.mirroring.modeparameter for allpoolsthat must be mirrored.Mirroring mode recommendations
Mirantis recommends using the
poolmode for mirroring. For thepoolmode, explicitly enable journaling for each image.To use the
imagemirroring mode, explicitly enable mirroring as described in the step 8.
spec: cephClusterSpec: pools: - name: image-hdd ... mirroring: mode: pool - name: volumes-hdd ... mirroring: mode: pool
Obtain the name of an external site to mirror with. On pools with mirroring enabled, the name is typically
ceph fsid:kubectl -n rook-ceph exec -it $(kubectl -n rook-ceph get pod -l \ "app=rook-ceph-tools" -o name rbd mirror pool info <mirroringPoolName> # or ceph fsid
Substitute
<mirroringPoolName>with the name of a pool to be mirrored.On an external site to mirror with, create a new bootstrap peer token. Execute the following command within the
ceph-toolspod CLI:kubectl -n rook-ceph exec -it $(kubectl -n rook-ceph get pod -l \ "app=rook-ceph-tools" -o jsonpath='{.items[0].metadata.name}') bash rbd mirror pool peer bootstrap create <mirroringPoolName> --site-name <siteName>
Substitute
<mirroringPoolName>with the name of a pool to be mirrored. In<siteName>, assign a label for the external Ceph cluster that will be used along with mirroring.For details, see Ceph documentation: Bootstrap peers.
In
KaaSCephClusteron the cluster that should mirror pools, specifyspec.cephClusterSpec.rbdMirror.peerswith the obtained peer and pools to mirror:spec: cephClusterSpec: rbdMirror: ... peers: - site: <siteName> token: <bootstrapPeer> pools: [<mirroringPoolName1>, <mirroringPoolName2>, ...]
Substitute
<siteName>with the label assigned to the external Ceph cluster,<bootstrapPeer>with the token obtained in the previous step, and<mirroringPoolName>with names of pools that have themirroring.modeparameter defined.For example:
spec: cephClusterSpec: rbdMirror: ... peers: - site: cluster-b token: <base64-string> pools: - images-hdd - volumes-hdd - special-pool-ssd
Verify that mirroring is enabled and each pool with
spec.cephClusterSpec.pools.mirroring.modedefined has an external peer site:kubectl -n rook-ceph exec -it $(kubectl -n rook-ceph get pod -l \ "app=rook-ceph-tools" -o jsonpath='{.items[0].metadata.name}') bash rbd mirror pool info <mirroringPoolName>
Substitute
<mirroringPoolName>with the name of a pool with mirroring enabled.If you have set the
imagemirroring mode in thepoolssection, explicitly enable mirroring for each image withrbdwithin the pool:Note
Execute the following command within the
ceph-toolspod withcephandrbdCLI.rbd mirror image enable <poolName>/<imageName> <imageMirroringMode>
Substitute
<poolName>with the name of a pool with theimagemirroring mode,<imageName>with the name of an image stored in the specified pool. Substitute<imageMirroringMode>with one of:journal- for mirroring to use the RBD journaling image feature to replicate the image contents. If the RBD journaling image feature is not yet enabled on the image, it will be enabled automatically.snapshot- for mirroring to use RBD image mirror-snapshots to replicate the image contents. Once enabled, an initial mirror-snapshot will automatically be created. To create additional RBD image mirror-snapshots, use the rbd command.
For details, see Ceph Documentation: Enable image mirroring.
Specify placement of Ceph cluster daemons
Warning
This procedure is valid for MOSK clusters that use the deprecated
KaaSCephCluster custom resource (CR) instead of the MiraCeph CR that is
available since MOSK 25.2 as a new Ceph configuration entrypoint. For the
equivalent procedure with the MiraCeph CR, refer to the following section:
If you need to configure the placement of Rook daemons on nodes, you can add
extra values in the Cluster providerSpec section of the
ceph-controller Helm release.
The procedures in this section describe how to specify the placement of
rook-ceph-operator, rook-discover, and csi-rbdplugin.
To specify rook-ceph-operator placement:
On the management cluster, edit the
Clusterresource of the target managed cluster:kubectl -n <managedClusterProjectName> edit cluster
Add the following parameters to the
ceph-controllerHelm release values:spec: providerSpec: value: helmReleases: - name: ceph-controller values: rookOperatorPlacement: affinity: <rookOperatorAffinity> nodeSelector: <rookOperatorNodeSelector> tolerations: <rookOperatorTolerations>
<rookOperatorAffinity>is a key-value mapping that contains a valid Kubernetesaffinityspecification<rookOperatorNodeSelector>is a key-value mapping that contains a valid KubernetesnodeSelectorspecification<rookOperatorTolerations>is a list that contains valid Kubernetestolerationitems
Wait for some time and verify on a managed cluster that the changes have applied:
kubectl -n rook-ceph get deploy rook-ceph-operator -o yaml
To specify rook-discover and csi-rbdplugin placement simultaneously:
On the management cluster, edit the desired
Clusterresource:kubectl -n <managedClusterProjectName> edit cluster
Add the following parameters to the
ceph-controllerHelm release values:spec: providerSpec: value: helmReleases: - name: ceph-controller values: rookExtraConfig: extraDaemonsetLabels: <labelSelector>
Substitute
<labelSelector>with a valid Kubernetes label selector expression to place therook-discoverandcsi-rbdpluginDaemonSet pods.Wait for some time and verify on a managed cluster that the changes have applied:
kubectl -n rook-ceph get ds rook-discover -o yaml kubectl -n rook-ceph get ds csi-rbdplugin -o yaml
To specify rook-discover and csi-rbdplugin placement separately:
On the management cluster, edit the desired
Clusterresource:kubectl -n <managedClusterProjectName> edit cluster
If required, add the following parameters to the
ceph-controllerHelm release values:spec: providerSpec: value: helmReleases: - name: ceph-controller values: hyperconverge: nodeAffinity: csiplugin: <labelSelector1> rookDiscover: <labelSelector2>
Substitute
<labelSelectorX>with a valid Kubernetes label selector expression to place therook-discoverandcsi-rbdpluginDaemonSet pods. For example,"role=storage-node; discover=true".Wait for some time and verify on the managed cluster that the changes have applied:
kubectl -n rook-ceph get ds rook-discover -o yaml kubectl -n rook-ceph get ds csi-rbdplugin -o yaml
Migrate Ceph pools from one failure domain to another
Warning
This procedure is valid for MOSK clusters that use the deprecated
KaaSCephCluster custom resource (CR) instead of the MiraCeph CR that is
available since MOSK 25.2 as a new Ceph configuration entrypoint. For the
equivalent procedure with the MiraCeph CR, refer to the following section:
The document describes how to change the failure domain of an already deployed Ceph cluster.
Note
This document focuses on changing the failure domain from a smaller
to wider one, for example, from host to rack. Using the same
instruction, you can move the failure domain from a wider to smaller scale.
Caution
Data movement implies the Ceph cluster rebalancing that may impact cluster performance, depending on the cluster size.
High-level overview of the procedure includes the following steps:
Set correct labels on the nodes.
Create the new bucket hierarchy.
Move nodes to new buckets.
Modify the CRUSH rules.
Add the manual changes to the
KaaSCephClusterspec.Scale the Ceph controllers.
Prerequisites
Verify that the Ceph cluster has enough space for multiple copies of data to migrate. Mirantis highly recommends that the Ceph cluster has a minimum of 25% of free space for the procedure to succeed.
Note
The migration procedure implies data movement and optional modification of CRUSH rules that cause a large amount of data (depending on the cluster size) to be first copied to a new location in the Ceph cluster before data removal.
Create a backup of the current
KaaSCephClusterobject from the managed namespace of the management cluster:kubectl -n <managedClusterProject> get kaascephcluster -o yaml > kcc-backup.yaml
Substitute
<managedClusterProject>with the corresponding managed cluster namespace of the management cluster.In the
rook-ceph-toolspod on a managed cluster, obtain a backup of the CRUSH map:ceph osd getcrushmap -o /tmp/crush-map-orig crushtool -d /tmp/crush-map-orig -o /tmp/crush-map-orig.txt
Migrate Ceph pools
This procedure contains an example of moving failure domains of all pools from
host to rack. Using the same instruction, you can migrate pools from
other types of failure domains, migrate pools separately, and so on.
To migrate Ceph pools from one failure domain to another:
Set the required CRUSH topology in the
KaaSCephClusterobject for each defined node. For details on thecrushparameter, see Node parameters.Setting the CRUSH topology to each node causes the Ceph Controller to set proper Kubernetes labels on the nodes.
Example of adding the
rackCRUSH topology key for each node in thenodessectionspec: cephClusterSpec: nodes: machine1: crush: rack: rack-1 machine2: crush: rack: rack-1 machine3: crush: rack: rack-2 machine4: crush: rack: rack-2 machine5: crush: rack: rack-3 machine6: crush: rack: rack-3
On the managed cluster, verify that the required buckets and bucket types are present in the Ceph hierarchy:
Enter the
ceph-toolspod:kubectl -n rook-ceph exec -it deploy/rook-ceph-tools -- bash
Verify that the required bucket type is present by default:
ceph osd getcrushmap -o /tmp/crush-map crushtool -d /tmp/crush-map -o /tmp/crush-map.txt cat /tmp/crush-map.txt # Look for the section named → “# types”
Example of system response:
# types type 0 osd type 1 host type 2 chassis type 3 rack type 4 row type 5 pdu type 6 pod type 7 room type 8 datacenter type 9 zone type 10 region type 11 root
Verify that the buckets with the required bucket type are present:
cat /tmp/crush-map.txt # Look for the section named → “# buckets”
Example of system response of an existing
rackbucket:# buckets rack rack-1 { id -15 id -16 class hdd # weight 0.00000 alg straw2 hash 0 }
If the required buckets are not created, create new ones with the required bucket type:
ceph osd crush add-bucket <bucketName> <bucketType> root=default
For example:
ceph osd crush add-bucket rack-1 rack root=default ceph osd crush add-bucket rack-2 rack root=default ceph osd crush add-bucket rack-3 rack root=default
Exit the
ceph-toolspod.
Optional. Order buckets as required:
On the managed cluster, add the first Ceph CRUSH smaller bucket to its respective wider bucket:
kubectl -n rook-ceph exec -it deploy/rook-ceph-tools -- bash ceph osd crush move <smallerBucketName> <bucketType>=<widerBucketName>
Substitute the following parameters:
<smallerBucketName>with the name of the smaller bucket, for example host name<bucketType>with the required bucket type, for examplerack<widerBucketName>with the name of the wider bucket, for example rack name
For example:
ceph osd crush move kaas-node-1 rack=rack-1 root=default
Warning
Mirantis highly recommends moving one bucket at a time.
For more details, refer to official Ceph documentation: CRUHS Maps: Moving a bucket.
After the bucket is moved to the new location in the CRUSH hierarchy, verify that no data rebalancing occurs:
ceph -sCaution
Wait for rebalancing to complete before proceeding to the next step.
Add the remaining Ceph CRUSH smaller buckets to their respective wider buckets one by one.
Scale the Ceph Controller and Rook Operator deployments to
0replicas:kubectl -n ceph-lcm-mirantis scale deploy --all --replicas 0 kubectl -n rook-ceph scale deploy rook-ceph-operator --replicas 0
On the managed cluster, manually modify the CRUSH rules for Ceph pools to enable data placement on a new failure domain:
Enter the
ceph-toolspod:kubectl -n rook-ceph exec -it deploy/rook-ceph-tools -- bash
List the CRUSH rules and erasure code profiles for the pools:
ceph osd pool ls detail
Example output
pool 1 'mirablock-k8s-block-hdd' replicated size 2 min_size 1 crush_rule 9 object_hash rjenkins pg_num 32 pgp_num 32 autoscale_mode on last_change 1193 lfor 0/0/85 flags hashpspool,selfmanaged_snaps stripe_width 0 application rbd read_balance_score 1.31 pool 2 '.mgr' replicated size 2 min_size 1 crush_rule 1 object_hash rjenkins pg_num 1 pgp_num 1 autoscale_mode on last_change 70 flags hashpspool stripe_width 0 pg_num_max 32 pg_num_min 1 application mgr read_balance_score 6.06 pool 3 'openstack-store.rgw.otp' replicated size 2 min_size 1 crush_rule 11 object_hash rjenkins pg_num 8 pgp_num 8 autoscale_mode on last_change 1197 flags hashpspool stripe_width 0 pg_num_min 8 application rook-ceph-rgw read_balance_score 2.27 pool 4 'openstack-store.rgw.meta' replicated size 2 min_size 1 crush_rule 12 object_hash rjenkins pg_num 8 pgp_num 8 autoscale_mode on last_change 1197 flags hashpspool stripe_width 0 pg_num_min 8 application rook-ceph-rgw read_balance_score 1.50 pool 5 'openstack-store.rgw.log' replicated size 2 min_size 1 crush_rule 10 object_hash rjenkins pg_num 8 pgp_num 8 autoscale_mode on last_change 1197 flags hashpspool stripe_width 0 pg_num_min 8 application rook-ceph-rgw read_balance_score 3.00 pool 6 'openstack-store.rgw.buckets.non-ec' replicated size 2 min_size 1 crush_rule 13 object_hash rjenkins pg_num 8 pgp_num 8 autoscale_mode on last_change 1197 flags hashpspool stripe_width 0 pg_num_min 8 application rook-ceph-rgw read_balance_score 1.50 pool 7 'openstack-store.rgw.buckets.index' replicated size 2 min_size 1 crush_rule 15 object_hash rjenkins pg_num 8 pgp_num 8 autoscale_mode on last_change 1197 flags hashpspool stripe_width 0 pg_num_min 8 application rook-ceph-rgw read_balance_score 2.25 pool 8 '.rgw.root' replicated size 2 min_size 1 crush_rule 14 object_hash rjenkins pg_num 8 pgp_num 8 autoscale_mode on last_change 1197 flags hashpspool stripe_width 0 pg_num_min 8 application rook-ceph-rgw read_balance_score 3.75 pool 9 'openstack-store.rgw.control' replicated size 2 min_size 1 crush_rule 16 object_hash rjenkins pg_num 8 pgp_num 8 autoscale_mode on last_change 1197 flags hashpspool stripe_width 0 pg_num_min 8 application rook-ceph-rgw read_balance_score 3.00 pool 10 'other-hdd' replicated size 2 min_size 1 crush_rule 19 object_hash rjenkins pg_num 32 pgp_num 32 autoscale_mode on last_change 1179 lfor 0/0/85 flags hashpspool,selfmanaged_snaps stripe_width 0 application rbd read_balance_score 1.69 pool 11 'openstack-store.rgw.buckets.data' erasure profile openstack-store.rgw.buckets.data_ecprofile size 3 min_size 2 crush_rule 18 object_hash rjenkins pg_num 32 pgp_num 32 autoscale_mode on last_change 1198 lfor 0/0/86 flags hashpspool,ec_overwrites stripe_width 8192 application rook-ceph-rgw pool 12 'vms-hdd' replicated size 2 min_size 1 crush_rule 21 object_hash rjenkins pg_num 256 pgp_num 256 autoscale_mode on last_change 1182 lfor 0/0/95 flags hashpspool,selfmanaged_snaps stripe_width 0 target_size_ratio 0.4 application rbd read_balance_score 1.24 pool 13 'volumes-hdd' replicated size 2 min_size 1 crush_rule 23 object_hash rjenkins pg_num 64 pgp_num 64 autoscale_mode on last_change 1185 lfor 0/0/89 flags hashpspool,selfmanaged_snaps stripe_width 0 target_size_ratio 0.2 application rbd read_balance_score 1.31 pool 14 'backup-hdd' replicated size 2 min_size 1 crush_rule 25 object_hash rjenkins pg_num 32 pgp_num 32 autoscale_mode on last_change 1188 lfor 0/0/90 flags hashpspool,selfmanaged_snaps stripe_width 0 target_size_ratio 0.1 application rbd read_balance_score 2.06 pool 15 'images-hdd' replicated size 2 min_size 1 crush_rule 27 object_hash rjenkins pg_num 32 pgp_num 32 autoscale_mode on last_change 1191 lfor 0/0/90 flags hashpspool,selfmanaged_snaps stripe_width 0 target_size_ratio 0.1 application rbd read_balance_score 1.50
For each replicated Ceph pool:
Obtain the current CRUSH rule name:
ceph osd crush rule dump <oldCrushRuleName>
Create a new CRUSH rule with the required bucket type using the same root, device class, and new bucket type:
ceph osd crush rule create-replicated <newCrushRuleName> <root> <bucketType> <deviceClass>
For example:
ceph osd crush rule create-replicated images-hdd-rack default rack hdd
For more details, refer to official Ceph documentation: CRUSH Maps: Creating a rule for a replicated pool.
Apply a new crush rule to the Ceph pool:
ceph osd pool set <poolName> crush_rule <newCrushRuleName>
For example:
ceph osd pool set images-hdd crush_rule images-hdd-rack
Wait for data to be rebalanced after moving the Ceph pool under the new failure domain (bucket type) by monitoring Ceph health:
ceph -sCaution
Update the following Ceph pool only after data rebalancing completes for the current Ceph pool.
Verify that the old CRUSH rule is not used anymore:
ceph osd pool ls detail
The rule ID is located in the CRUSH map and must match the rule ID in the output of ceph osd dump.
Remove the old unused CRUSH rule and rename the new one to the original name:
ceph osd crush rule rm <oldCrushRuleName> ceph osd crush rule rename <newCrushRuleName> <oldCrushRuleName>
For each erasure-coded Ceph pool:
Note
Erasure-coded pools require different number of buckets to store data. Instead of the number of replicas in replicated pools, erasure-coded pools require the
coding chunks + data chunksnumber of buckets existing in the Ceph cluster. For example, if an erasure-coded pool has 2 coding chunks and 2 data chunks configured, then the pool requires 4 different buckets, for example, 4 racks, to store data.Obtain the current parameters of the erasure-coded profile:
ceph osd erasure-code-profile get <ecProfile>
In the profile, add the new bucket type as the failure domain using the
crush-failure-domainparameter:ceph osd erasure-code-profile set <ecProfile> k=<int> m=<int> crush-failure-domain=<bucketType> crush-device-class=<deviceClass>
Create a new CRUSH rule in the profile:
ceph osd crush rule create-erasure <newEcCrushRuleName> <ecProfile>
Apply the new CRUSH rule to the pool:
ceph osd pool set <poolName> crush_rule <newEcCrushRuleName>
Wait for data to be rebalanced after moving the Ceph pool under the new failure domain (bucket type) by monitoring Ceph health:
ceph -sCaution
Update the following Ceph pool only after data rebalancing completes for the current Ceph pool.
Verify that the old CRUSH rule is not used anymore:
ceph osd pool ls detail
The rule ID is located in the CRUSH map and must match the rule ID in the output of ceph osd dump.
Remove the old unused CRUSH rule and rename the new one to the original name:
ceph osd crush rule rm <oldCrushRuleName> ceph osd crush rule rename <newCrushRuleName> <oldCrushRuleName>
Note
New erasure-coded profiles cannot be renamed, so they will not be removed automatically during pools cleanup. Remove them manually, if needed.
Exit the
ceph-toolspod.
In the management cluster, update the
KaaSCephClusterobject by setting thefailureDomain: rackparameter for each pool. The configuration from the Rook perspective must match the manually created configuration. For example:spec: cephClusterSpec: pools: - name: images ... failureDomain: rack - name: volumes ... failureDomain: rack ... objectStorage: rgw: dataPool: failureDomain: rack ... metadataPool: failureDomain: rack ...
Monitor the Ceph cluster health and wait until rebalancing is completed:
ceph -sExample of a successful system response:
HEALTH_OK
Scale back the Ceph Controller and Rook Operator deployments:
kubectl -n ceph-lcm-mirantis scale deploy --all --replicas 3 kubectl -n rook-ceph scale deploy rook-ceph-operator --replicas 1
Enable periodic Ceph performance testing
TechPreview
Warning
This procedure is valid for MOSK clusters that use the deprecated
KaaSCephCluster custom resource (CR) instead of the MiraCeph CR that is
available since MOSK 25.2 as a new Ceph configuration entrypoint. For the
equivalent procedure with the MiraCeph CR, refer to the following section:
Warning
Performance testing affects the overall Ceph cluster performance. Do not run it unless you are sure that user load will not be affected.
This section describes how to configure periodic Ceph performance testing using Kubernetes batch or cron jobs that execute a fio process in a separate container with a connection to the Ceph cluster. The test results can then be stored in a persistent volume attached to the container.
Ceph performance testing is managed by the KaaSCephOperationRequest CR that
creates separate CephPerfTestRequest requests to handle the test run. Once
you configure the perfTest section of the KaaSCephOperationRequest
spec, it propagates to CephPerfTestRequest on the managed cluster in the
ceph-lcm-mirantis namespace. You can create a performance test for a single
or scheduled runs.
Create a Ceph performance test request
TechPreview
Warning
This procedure is valid for MOSK clusters that use the deprecated
KaaSCephCluster custom resource (CR) instead of the MiraCeph CR that is
available since MOSK 25.2 as a new Ceph configuration entrypoint. For the
equivalent procedure with the MiraCeph CR, refer to the following section:
Warning
Performance testing affects the overall Ceph cluster performance. Do not run it unless you are sure that user load will not be affected.
This section describes how to create a Ceph performance test request through
the KaaSCephOperationRequest CR.
To create a Ceph performance test request:
Create an RBD image with the required parameters. For example, run the following command in
ceph-tools-containerto allow execution of theperftestexample below on a managed cluster:kubectl exec -ti -n rook-ceph <ceph-tools-pod> -- bash rbd create <pool_name>/<image_name> --size 10G
Substitute
<ceph-tools-pod>with theceph-toolsPod ID,<pool_name>and<image_name>with pool and image names, and specify the size. In the example below,mirablock-k8s-block-hddis used as pool name andtestsas image name:kubectl exec -ti -n rook-ceph rook-ceph-tools-94985cd9f-tjl29 -- bash rbd create mirablock-k8s-block-hdd/tests --size 10G
Create a YAML template for the
KaaSCephOperationRequestCR. For details, see KaaSCephOperationRequest CR perftest specification.kubectl apply -f <example_file_name>.yaml
Example of the
KaaSCephOperationRequestresourceapiVersion: kaas.mirantis.com/v1alpha1 kind: KaaSCephOperationRequest metadata: name: test-perf-req namespace: managed-ns spec: kaasCephCluster: name: ceph-kaas-managed namespace: managed-ns perfTest: parameters: - --ioengine=rbd - --pool=mirablock-k8s-block-hdd - --rbdname=tests - --name=single_perftest - --rw=randrw:16k - --rwmixread=40 - --bs=4k - --size=500M - --iodepth=32 - --numjobs=8 - --group_reporting - --direct=1 - --fsync=32 - --buffered=0 - --exitall
Review the
KaaSCephOperationRequeststatus. For details, see KaaSCephOperationRequest perftest status.kubectl get kaascephoperationrequest test-managed-req -n managed-ns
Example of system response:
NAME KAASCEPHCLUSTER CLUSTER AGE PHASE MESSAGE test-perf-req ceph-kaas-managed kaas-managed 20m Completed
Review the
CephPerfTestRequeststatus on the managed cluster.kubectl get cephperftestrequest -n ceph-lcm-mirantis
Example of system response:
NAME AGE PHASE START TIME DURATION JOB STATUS SCHEDULE test-perf-req 55m Finished 2022-06-17T09:29:57Z 5m53s Completed
Review the performance test result by inspecting logs for the corresponding job Pod on the managed cluster:
kubectl --kubeconfig <managedKubeconfig> -n rook-ceph logs -l app=ceph-perftest,perftest=<name>
Substitute
<managedKubeconfig>with the managed clusterkubeconfigand<name>with theKaaSCephOperationRequestmetadata.name, for example,test-perf-req.Optional. Remove the
KaaSCephOperationRequest. Removal ofKaaSCephOperationRequestalso removes theCephPerfTestRequestCR propagated to the managed cluster.
KaaSCephOperationRequest CR perftest specification
TechPreview
Warning
This procedure is valid for MOSK clusters that use the deprecated
KaaSCephCluster custom resource (CR) instead of the MiraCeph CR that is
available since MOSK 25.2 as a new Ceph configuration entrypoint. For the
equivalent procedure with the MiraCeph CR, refer to the following section:
This section describes the KaaSCephOperationRequest CR specification used
to automatically create a CephPerfTestRequest request. For the procedure
workflow, see Enable periodic Ceph performance testing.
Parameter |
Description |
|---|---|
|
Describes the definition for the |
|
Defines spec:
kaasCephCluster:
name: ceph-kaas-mgmt
namespace: default
|
|
Defines the cluster on which the spec:
k8sCluster:
name: kaas-mgmt
namespace: default
If you omit this parameter, |
Parameter |
Description |
|---|---|
|
A list of command arguments for a performance test execution. For all available parameters, see fio documentation. Note Performance test results will be saved on a PVC if the test
run parameters contain an argument to save to a file. Otherwise, test
results will be saved only as Pod logs. For example, for the default
|
|
Optional. Entrypoint command to run performance test in the container. If the performance image is updated, you may also update the command. By default, equals the image entry point. |
|
Container image to use for jobs. By default, |
|
Configuration of the performance test runs as periodic jobs. Leave empty if a single run is required. For details, see Ceph performance periodic parameters. |
|
Option that enables saving of the performance test results on a PVC. Contains the following fields:
|
Parameter |
Description |
|---|---|
|
Required. Schedule in base cron format. For example, |
|
Pause CronJob scheduling to prevent performance test execution. Only for future scheduling. |
|
Number of runs to keep in history. Supported only by keeping old run Pods with their outputs. |
Example of KaaSCephOperationRequest
apiVersion: kaas.mirantis.com/v1alpha1
kind: KaaSCephOperationRequest
metadata:
name: test-managed-req
namespace: managed-ns
spec:
kaasCephCluster:
name: ceph-cluster-managed-cluster
namespace: managed-ns
perfTest:
parameters:
- --ioengine=rbd
- --pool=mirablock-k8s-block-hdd
- --rbdname=tests
- --name=single_perftest
- --rw=randrw:16k
- --rwmixread=40
- --bs=4k
- --size=500M
- --iodepth=32
- --numjobs=8
- --group_reporting
- --direct=1
- --fsync=32
- --buffered=0
- --exitall
KaaSCephOperationRequest perftest status
TechPreview
Warning
This procedure is valid for MOSK clusters that use the deprecated
KaaSCephCluster custom resource (CR) instead of the MiraCeph CR that is
available since MOSK 25.2 as a new Ceph configuration entrypoint. For the
equivalent procedure with the MiraCeph CR, refer to the following section:
This section describes the status.perfTestStatus fields of the
KaaSCephOperationRequest CR that you can use to check the status of a Ceph
performance test request.
Note
Performance test results will be saved on PVC if the test run
parameters contain the saveResultOnPvc option. Otherwise, test
results will be saved only as Pod logs. For details, see
Ceph performance test parameters.
Parameter |
Description |
|---|---|
|
Describes the status of the current |
Parameter |
Description |
|---|---|
|
Describes the current request phase:
|
|
The last start time of the performance test execution. |
|
The duration of the last successful performance test. |
|
The execution status of the last performance test. |
|
Issues or warnings found during the performance test run. |
|
Location of the performance test result. Contains the following fields:
|
|
History of statuses and timings for cron jobs:
|
Example of status.perfTestStatus
status:
perfTestStatus:
lastDurationTime: 5m53s
lastJobStatus: Completed
lastStartTime: "2022-06-17T09:29:57Z"
phase: Finished
results:
storedOnPvc:
pvcName: test-perf-req-cephperftest
pvcNamespace: rook-ceph
phase: Completed
StackLight operations
The section covers the StackLight management aspects.
Configure StackLight
This section describes how to configure StackLight in your Mirantis OpenStack on Kubernetes deployment and includes the description of StackLight parameters and their verification.
StackLight configuration procedure
This section describes the StackLight configuration workflow.
To configure StackLight:
Download your management cluster
kubeconfig:Log in to the Container Cloud web UI with the
m:kaas:namespace@operatororm:kaas:namespace@writerpermissions.Switch to the required project using the Switch Project action icon located on top of the main left-side navigation panel.
Expand the menu of the tab with your user name.
Click Download kubeconfig to download
kubeconfigof your management cluster.Log in to any local machine with
kubectlinstalled.Copy the downloaded
kubeconfigto this machine.
Run one of the following commands:
For a management cluster:
kubectl --kubeconfig <mgmtClusterKubeconfigPath> edit -n default cluster <mgmtClusterName>
For a managed cluster:
kubectl --kubeconfig <mgmtClusterKubeconfigPath> edit -n <managedClusterProjectName> cluster <managedClusterName>
In the following section of the opened manifest, configure the required StackLight parameters as described in StackLight configuration parameters.
spec: providerSpec: value: helmReleases: - name: stacklight values:
StackLight configuration parameters
This section describes the StackLight configuration keys that you can specify
in the values section to change StackLight settings as required. Prior to
making any changes to StackLight configuration, perform the steps described in
StackLight configuration procedure.
After changing StackLight configuration, verify the changes as described in
Verify StackLight after configuration.
Important
Some parameters are marked as mandatory. Failure to specify values for such parameters causes the Admission Controller to reject cluster creation.
This section describes the OpenStack-related StackLight configuration keys. For MOSK cluster configuration keys, see MOSK cluster configuration parameters.
Key |
Description |
Example values |
|---|---|---|
|
Enables Gnocchi monitoring. Set to |
|
Key |
Description |
Example values |
|---|---|---|
|
Enables Ironic monitoring. Set to |
|
Key |
Description |
Example values |
|---|---|---|
|
Enables OpenStack monitoring. Set to |
|
|
Defines the namespace within which the OpenStack virtualized control
plane is installed. Set to |
|
Key |
Description |
Example values |
|---|---|---|
|
Defines the RabbitMQ credentials to use if credentials discovery is disabled or some required parameters were not found during the discovery. |
credentialsConfig:
username: "stacklight"
password: "stacklight"
host: "rabbitmq.openstack.svc"
queue: "notifications"
vhost: "openstack"
|
|
Enables the credentials discovery to obtain the username and password from the secret object. |
credentialsDiscovery:
enabled: true
namespace: openstack
secretName: os-rabbitmq-user-credentials
|
Key |
Description |
Example values |
|---|---|---|
|
External FQDN used to communicate with OpenStack services for
certificates monitoring. The option is deprecated, use
|
|
|
External FQDN used to communicate with OpenStack services. Used for
certificates monitoring. Set to |
|
|
Defines whether to verify the trust chain of the OpenStack endpoint SSL certificates during monitoring. |
insecure:
internal: true
external: false
|
Key |
Description |
Example values |
|---|---|---|
|
Specifies the OpenStack credentials to use if the credentials discovery is disabled or some required parameters were not found during the discovery. |
credentialsConfig:
identityEndpoint: "" # "http://keystone-api.openstack.svc:5000/v3"
domain: "" # "default"
password: "" # "workshop"
project: "" # "admin"
region: "" # "RegionOne"
username: "" # "admin"
|
|
Enables the credentials discovery to obtain all required parameters from the secret object. |
credentialsDiscovery:
enabled: true
namespace: openstack
secretName: keystone-keystone-admin
|
|
Specifies the interval of metrics gathering from the OpenStack API. Set
to |
|
|
Enables or disables the server certificate chain and host name
verification. Set to |
|
|
Enables or disables HTTP probes for public endpoints from the OpenStack
service catalog. Set to |
|
Key |
Description |
Example values |
|---|---|---|
|
Enables Tungsten Fabric monitoring. Since MOSK 23.1, the parameter is set
to Before MOSK 23.1, the parameter is set to
|
|
|
Available since MOSK 23.3. Defines the timeout of
the |
tungstenFabricMonitoring:
exportersTimeout: "5s"
|
|
Available since MOSK 24.1. Enables or disables monitoring of the Tungsten Fabric analytics services. In MOSK 24.1, defaults to Since MOSK 24.2, the default value is set automatically based on the real state of the Tungsten Fabric analytics services (enabled or disabled) in the Tungsten Fabric cluster. |
|
This section describes the MOSK cluster StackLight configuration keys. For OpenStack cluster configuration keys, see OpenStack cluster configuration parameters.
Key |
Description |
Example values |
|---|---|---|
|
Defines custom alerts. Also, modifies or disables existing alert configurations. For the list of predefined alerts, see StackLight alerts. While adding or modifying alerts, follow the Alerting rules. |
customAlerts:
# To add a new alert:
- alert: ExampleAlert
annotations:
description: Alert description
summary: Alert summary
expr: example_metric > 0
for: 5m
labels:
severity: warning
# To modify an existing alert expression:
- alert: AlertmanagerFailedReload
expr: alertmanager_config_last_reload_successful == 5
# To disable an existing alert:
- alert: TargetDown
enabled: false
An optional field |
Key |
Description |
Example values |
|---|---|---|
|
Enables or disables Alerta. Using the Alerta web UI, you can view the
most recent or watched alerts, group, and filter alerts. Set to |
|
On the managed clusters with limited Internet access, proxy is required for StackLight components that use HTTP and HTTPS and are disabled by default but need external access if enabled, for example, for the Salesforce integration and Alertmanager notifications external rules.
Key |
Description |
Example values |
|---|---|---|
|
Provides a generic template for notifications receiver configurations. For a list of supported receivers, see Prometheus Alertmanager documentation: Receiver. |
For example, to enable notifications to OpsGenie: alertmanagerSimpleConfig:
genericReceivers:
- name: HTTP-opsgenie
enabled: true # optional
opsgenie_configs:
- api_url: "https://example.app.eu.opsgenie.com/"
api_key: "secret-key"
send_resolved: true
|
|
Provides a template for notifications route configuration. For details, see Prometheus Alertmanager documentation: Route. |
genericRoutes:
- receiver: HTTP-opsgenie
enabled: true # optional
matchers:
severity=~"major|critical"
continue: true
|
|
Disables or enables alert inhibition rules. If enabled, Alertmanager decreases alert noise by suppressing dependent alerts notifications to provide a clearer view on the cloud status and simplify troubleshooting. Enabled by default. For details, see Alert dependencies. For details on inhibition rules, see Prometheus documentation. |
|
Key |
Description |
Example values |
|---|---|---|
|
Enables or disables Alertmanager integration with email. Set to
|
|
|
Defines the notification parameters for Alertmanager integration with email. For details, see Prometheus Alertmanager documentation: Email configuration. |
email:
enabled: false
send_resolved: true
to: "to@test.com"
from: "from@test.com"
smarthost: smtp.gmail.com:587
auth_username: "from@test.com"
auth_password: password
auth_identity: "from@test.com"
require_tls: true
|
|
Defines the route for Alertmanager integration with email. For details, see Prometheus Alertmanager documentation: Route. |
route:
matchers: []
routes: []
|
On the managed clusters with limited Internet access, proxy is required for StackLight components that use HTTP and HTTPS and are disabled by default but need external access if enabled. The Microsoft Teams integration depends on the Internet access through HTTPS.
Key |
Description |
Example values |
|---|---|---|
|
Enables or disables Alertmanager integration with Microsoft Teams.
Requires a set up Microsoft Teams channel and a channel connector. Set
to |
|
|
Defines the URL of an Incoming Webhook connector of a Microsoft Teams channel. For details about channel connectors, see Microsoft documentation. |
|
|
Defines the notifications route for Alertmanager integration with MS Teams. For details, see Prometheus Alertmanager documentation: Route. |
route:
matchers: []
routes: []
|
On the managed clusters with limited Internet access, proxy is required for StackLight components that use HTTP and HTTPS and are disabled by default but need external access if enabled. The Salesforce integration depends on the Internet access through HTTPS.
Key |
Description |
Example values |
|---|---|---|
|
Unique cluster identifier
The |
Do not modify |
|
Enables or disables Alertmanager integration with Salesforce using the
|
|
|
Defines the Salesforce parameters and credentials for integration with Alertmanager. |
auth:
url: "<SF instance URL>"
username: "<SF account email address>"
password: "<SF password>"
environment_id: "<Cloud identifier>"
organization_id: "<Organization identifier>"
sandbox_enabled: "<Set to true or false>"
|
|
Defines the notifications route for Alertmanager integration with Salesforce. For details, see Prometheus Alertmanager documentation: Route. |
route:
matchers:
- severity="critical"
routes: []
Note By default, only |
|
Enables or disables feed update in Salesforce. To save API calls, this
parameter is set to |
|
|
Enables or disables links to the Prometheus web UI in alerts sent to
Salesforce. To simplify troubleshooting, set to |
|
Caution
Prior to configuring the integration with ServiceNow, perform the following prerequisite steps using the ServiceNow documentation of the required version.
In a new or existing Incident table, add the Alert ID field as described in Add fields to a table. To avoid alerts duplication, select Unique.
Create an Access Control List (ACL) with read/write permissions for the Incident table as described in Securing table records.
Key |
Description |
Example values |
|---|---|---|
|
Enables or disables Alertmanager integration with ServiceNow. Set to
|
|
|
Defines the ServiceNow parameters and credentials for integration with Alertmanager:
|
serviceNow:
enabled: true
incident_table: "incident"
api_version: "v1"
alert_id_field: "u_alert_id"
auth:
instance: "https://dev00001.service-now.com"
username: "testuser"
password: "testpassword"
|
On the managed clusters with limited Internet access, proxy is required for StackLight components that use HTTP and HTTPS and are disabled by default but need external access if enabled. The Slack integration depends on the Internet access through HTTPS.
Key |
Description |
Example values |
|---|---|---|
|
Enables or disables Alertmanager integration with Slack. For
details, see Prometheus Alertmanager documentation: Slack configuration.
Set to |
|
|
Defines the Slack webhook URL. |
|
|
Defines the Slack channel or user to send notifications to. |
|
|
Defines the notifications route for Alertmanager integration with Slack. For details, see Prometheus Alertmanager documentation: Route. |
route:
matchers: []
routes: []
|
Key |
Description |
Example values |
|---|---|---|
|
Enables or disables the |
|
Available since MCC 2.30.0 (21.0.0 and 20.0.0)
Key |
Description |
Example values |
|---|---|---|
|
Enables the bond interface monitoring. Defaults to |
|
For internal StackLight use only
Key |
Description |
Example values |
|---|---|---|
|
Specifies the size limit of the incoming data length in bytes for the
Telemeter client. Defaults to |
|
Key |
Description |
Example values |
|---|---|---|
|
Specifies the approximate expected cluster size. Set to Caution Since Container Cloud 2.28.0 (Cluster releases 17.3.0 and
16.3.0), The values differ by the OpenSearch and Prometheus resource limits:
|
|
Key |
Description |
Example values |
|---|---|---|
|
Removed in Container Cloud 2.27.0 (Cluster releases 17.2.0 and 16.2.0). Disables Grafana Image Renderer. For example, for resource-limited environments. Enabled by default. |
|
|
Defines the home dashboard. Set to |
|
Key |
Description |
Example values |
|---|---|---|
|
Enables or disables StackLight multiserver mode. For details, see
StackLight database modes in Deployment architecture.
On managed clusters, set to |
|
Available since MCC 2.25.1 (Cluster releases 17.0.1 and 16.0.1)
Key |
Description |
Example values |
|---|---|---|
|
Enables or disables the Kubernetes Network Policy resource that allows
controlling network connections to and from Pods deployed in the
For the list of network policy rules, refer to StackLight rules for Kubernetes network policies. Customization of network policies is not supported. |
|
Key |
Description |
Example values |
|---|---|---|
|
Kubernetes tolerations to add to all StackLight components. |
default:
- key: "com.docker.ucp.manager"
operator: "Exists"
effect: "NoSchedule"
|
|
Defines Kubernetes tolerations (overrides the default ones) for any StackLight component. |
component:
# elasticsearch:
opensearch:
- key: "com.docker.ucp.manager"
operator: "Exists"
effect: "NoSchedule"
postgresql:
- key: "node-role.kubernetes.io/master"
operator: "Exists"
effect: "NoSchedule"
|
Available since MCC 2.25.0 (Cluster releases 17.0.0 and 16.0.0)
Key |
Description |
Example values |
|---|---|---|
|
Limits the number of namespaces for Pods log collection. Enabled by default with the following list of monitored Kubernetes namespaces:
Kubernetes namespaces monitored by default
|
|
|
Adds extra namespaces to collect Kubernetes Pod logs from. Requires
|
logging:
namespaceFiltering:
logs:
enabled: true
extraNamespaces:
- custom-ns-1
|
|
Limits the number of namespaces for Kubernetes events collection.
Disabled by default due to sysdig scanner present on some
MOSK clusters and due to cluster-scoped objects
producing events by default to the |
|
|
Adds extra namespaces to collect Kubernetes events from. Requires
|
logging:
namespaceFiltering:
events:
enabled: true
extraNamespaces:
- custom-ns-1
|
Key |
Description |
Example values |
|---|---|---|
|
Defines the log verbosity level for all StackLight components if not
defined using |
|
|
Defines (overrides the |
component:
kubeStateMetrics: ""
prometheusAlertManager: ""
prometheusBlackboxExporter: ""
prometheusNodeExporter: ""
prometheusServer: ""
alerta: ""
alertmanagerWebhookServicenow: ""
elasticsearchCurator: ""
postgresql: ""
prometheusEsExporter: ""
sfNotifier: ""
sfReporter: ""
fluentd: ""
# fluentdElasticsearch ""
fluentdLogs: ""
telemeterClient: ""
telemeterServer: ""
tfControllerExporter: ""
tfVrouterExporter: ""
telegrafDs: ""
telegrafS: ""
# elasticsearch: ""
opensearch: ""
# kibana: ""
grafana: ""
opensearchDashboards: ""
metricbeat: ""
prometheusMsTeams: ""
|
Key |
Description |
Example values |
|---|---|---|
|
Enables or disables the StackLight logging stack. For details about the
logging components, see Deployment architecture.
Set to |
|
|
Removed in Container Cloud 2.26.0 (Cluster releases 17.1.0 and 16.1.0). For details, see Logging parameters. No replacement exists for this redundant parameter. You can safely remove it on existing clusters. Sets the least important level of log messages to send to OpenSearch.
Requires The default logging level is Note The |
|
|
Allows configuring OpenSearch queries for the data present in OpenSearch. Prometheus Elasticsearch Exporter then queries the OpenSearch database and exposes such metrics in the Prometheus format. For details, see Create logs-based metrics. Includes the following parameters:
|
For usage example, see Create logs-based metrics. |
|
Removed in Container Cloud 2.26.0 (Cluster releases 17.1.0 and 16.1.0). For details, see Logging parameters. No replacement exists for this redundant parameter. You can safely remove it on existing clusters. Specifies the retention time per index. Includes the following parameters:
The allowed values include integers (days) and numbers with suffixes: y, m, w, d, h, including capital letters. |
logging:
retentionTime:
logstash: 3
events: "2w"
notifications: "1M"
|
Available since MCC 2.25.0 (Cluster releases 17.0.0 and 16.0.0)
Key |
Description |
Example values |
|---|---|---|
|
Enforces 32 GB of heap size, unless the defined memory limit allows using
50 GB of heap. Requires |
logging:
enforceOopsCompression: true
|
Available since MCC 2.23.0 (Cluster release 11.7.0)
Key |
Description |
Example values |
|---|---|---|
|
Specifies external Elasticsearch, OpenSearch, and syslog destinations
as |
logging:
externalOutputs:
elasticsearch:
# disabled: false
type: elasticsearch
level: info
plugin_log_level: info
tag_exclude: '{fluentd-logs,systemd}'
host: elasticsearch-host
port: 9200
logstash_date_format: '%Y.%m.%d'
logstash_format: true
logstash_prefix: logstash
...
buffer:
# disabled: false
chunk_limit_size: 16m
flush_interval: 15s
flush_mode: interval
overflow_action: block
...
opensearch:
disabled: true
type: opensearch
...
|
Available since MCC 2.23.0 (Cluster release 11.7.0)
Key |
Description |
Example values |
|---|---|---|
|
Specifies authentication secret mounts for external log destinations.
Requires
|
Secret mount configuration: logging:
externalOutputSecretMounts:
- secretName: elasticsearch-certs
mountPath: /tmp/elasticsearch-certs
defaultMode: 420
- secretName: opensearch-certs
mountPath: /tmp/opensearch-certs
Elasticsearch configuration for the above secret mount: logging:
externalOutputs:
elasticsearch:
...
ca_file: /tmp/elasticsearch-certs/ca.pem
client_cert: /tmp/elasticsearch-certs/client.pem
client_key: /tmp/elasticsearch-certs/client.key
client_key_pass: password
|
Deprecated since MCC 2.23.0 (Cluster release 11.7.0)
Note
Since Container Cloud 2.23.0 (Cluster release 11.7.0),
logging.syslog is deprecated for the sake of
logging.externalOutputs. For details, see
Logging to external outputs.
Key |
Description |
Example values |
|---|---|---|
|
Enables or disables remote logging to syslog. Disabled by default.
Requires |
|
|
Specifies the remote syslog host. |
|
|
Removed in Container Cloud 2.26.0 (Cluster releases 17.1.0 and 16.1.0). For details, see Logging parameters. No replacement exists for this redundant parameter. You can safely remove it on existing clusters. Specifies logging level for the syslog output. |
|
|
Specifies the remote syslog port. |
|
|
Defines the packet size in bytes for the syslog logging output. Set to
|
|
|
Specifies the remote syslog protocol. Set to |
|
|
Optional. Disabled by default. Enables or disables TLS. Use TLS only for the TCP protocol. TLS will not be enabled if you set a protocol other than TCP. |
|
|
Optional. Configures TLS verification. |
|
|
Defines how to pass the certificate.
|
certificate:
secret: ""
hostPath: "/etc/ssl/certs/ca-bundle.pem"
|
tag_exclude (string)Since MCC 2.23.0 (11.7.0)
|
Optional. Overrides
How to obtain tags for logsSelect from the following options:
The values for |
|
tag_include (string)Since MCC 2.23.0 (11.7.0)
|
Optional. Is overridden by |
|
Key |
Description |
Example values |
|---|---|---|
|
Enables or disables Ceph monitoring on managed clusters. Set to |
|
Key |
Description |
Example values |
|---|---|---|
|
Enables or disables HTTP endpoints monitoring. If enabled, the
monitoring tool performs the probes against the defined endpoints every
15 seconds. Set to |
|
|
Defines the directory path with external endpoints certificates on host. |
|
|
Defines the list of HTTP endpoints to monitor. The endpoints must successfully respond to a liveness probe. For success, a request to a specific endpoint must result in a 2xx HTTP response code. |
domains:
- https://prometheus.io/health
- http://example.com:8080/status
- http://example.net:8080/pulse
|
Key |
Description |
Example values |
|---|---|---|
|
Enables or disables monitoring of bare metal Ironic. To enable, specify the Ironic API URL. |
|
|
Defines whether to skip the chain and host verification. Set to
|
|
Key |
Description |
Example values |
|---|---|---|
|
Enables or disables Mirantis Kubernetes Engine (MKE) monitoring.
Set to |
|
|
Defines the dockerd data root directory of persistent Docker state. For details, see Docker documentation: Daemon CLI (dockerd). |
|
Key |
Description |
Example values |
|---|---|---|
|
Enables or disables StackLight to monitor and alert on the expiration
date of the TLS certificate of an HTTPS endpoint. If enabled, the
monitoring tool performs the probes against the defined endpoints every
hour. Set to |
|
|
Defines the list of HTTPS endpoints to monitor the certificates from. |
domains:
- https://prometheus.io
- https://example.com:8080
|
Key |
Description |
Example values |
|---|---|---|
|
On the clusters that run large-scale workloads, workload monitoring generates a big amount of resource-consuming metrics. To prevent generation of excessive metrics, you can disable workload monitoring in the StackLight metrics and monitor only the infrastructure. The |
metricFilter:
enabled: true
action: keep
namespaces:
- kaas
- kube-system
- stacklight
|
Key |
Description |
Example values |
|---|---|---|
|
Defines the |
default:
role: stacklight
|
|
Defines the |
component:
alerta:
role: stacklight
component: alerta
# kibana:
# role: stacklight
# component: kibana
opensearchDashboards:
role: stacklight
component: opensearchdashboards
|
Key |
Description |
Example values |
|---|---|---|
|
Removed in Container Cloud 2.26.0 (Cluster releases 17.1.0 and 16.1.0). For details, see Logging parameters. No replacement exists for this redundant parameter. You can safely remove it on existing clusters. Specifies the retention time per index. Includes the following parameters:
The allowed values include integers (days) and numbers with suffixes: y, m, w, d, h, including capital letters. By default, values set in |
elasticsearch:
retentionTime:
logstash: 3
events: "2w"
notifications: "1M"
|
|
Removed in Container Cloud 2.26.0 (Cluster releases 17.1.0 and 16.1.0). For details, see Logging parameters. No replacement exists for this redundant parameter. You can safely remove it on existing clusters. Defines the OpenSearch (Elasticsearch) |
|
|
Specifies the OpenSearch (Elasticsearch) PVC(s) size. The number of PVCs depends on the StackLight database mode. For HA, three PVCs will be created, each of the size specified in this parameter. For non-HA, one PVC of the specified size. Important You cannot modify this parameter after cluster creation. |
elasticsearch:
persistentVolumeClaimSize: 30Gi
|
|
Available since Container Cloud 2.26.0 (Cluster releases 17.1.0 and 16.1.0). Optional. Specifies the number of gigabytes that is exclusively available for the OpenSearch data.
If not set (by default), the number of gigabytes from
This parameter is useful in the following cases:
|
elasticsearch:
persistentVolumeUsableStorageSizeGB: 160
|
Key |
Description |
Example values |
|---|---|---|
|
Additional configuration for |
logging:
dashboardsExtraConfig:
opensearch.requestTimeout: 60000
|
Key |
Description |
Example values |
|---|---|---|
|
Additional configuration for Since Container Cloud 2.29.0 and MOSK 25.1, by default,
StackLight manages watermarks efficiently (low/high/flood: 150/100/50 GB).
If |
logging:
extraConfig:
cluster.max_shards_per_node: 5000
|
Key |
Description |
Example values |
|---|---|---|
|
Defines the minimum amount of time for Prometheus to wait before
resending an alert to Alertmanager. Passed to the
|
|
|
Available since Container Cloud 2.26.0 (Cluster releases 17.1.0 and 16.1.0). Defines the list of labels to be injected to firing alerts while they are sent to Alertmanager. Empty by default. The following labels are reserved for internal purposes and cannot
be overridden: Caution When new labels are injected, Prometheus sends alert updates with a new set of labels, which can potentially cause Alertmanager to have duplicated alerts for a short period of time if the cluster currently has firing alerts. Warning Before MOSK management 2.31.0 and
MOSK 26.1, do not use the |
alertsCommonLabels:
region: west
env: prod
|
|
Specifies the Prometheus PVC(s) size. The number of PVCs depends on the StackLight database mode. For HA, three PVCs will be created, each of the size specified in this parameter. For non-HA, one PVC of the specified size. Important You cannot modify this parameter after cluster creation. |
prometheusServer:
persistentVolumeClaimSize: 16Gi
|
|
Available since Container Cloud 2.24.0 (Cluster release 14.0.0).
Defines the number of concurrent queries limit. Passed to the
|
|
|
Defines the Prometheus database retention size. Passed to the
|
|
|
Defines the Prometheus database retention period. Passed to the
|
|
Key |
Description |
Example values |
|---|---|---|
|
Specifies a set of custom Blackbox Exporter modules. For details, see
Blackbox Exporter configuration: module.
The |
customModules:
http_post_2xx:
prober: http
timeout: 5s
http:
method: POST
headers:
Content-Type: application/json
body: '{}'
|
|
Specifies the offset to subtract from timeout in seconds
( |
|
Key |
Description |
Example values |
|---|---|---|
|
Defines custom Prometheus recording rules. Overriding of existing recording rules is not supported. |
customRecordingRules:
- name: ExampleRule.http_requests_total
rules:
- expr: sum by(job) (rate(http_requests_total[5m]))
record: job:http_requests:rate5m
- expr: avg_over_time(job:http_requests:rate5m[1w])
record: job:http_requests:rate5m:avg_over_time_1w
|
Key |
Description |
Example values |
|---|---|---|
|
Defines custom Prometheus scrape configurations. For details, see Prometheus documentation: scrape_config. The names of default StackLight scrape configurations, which you can view in the Status -> Targets tab of the Prometheus web UI, are reserved for internal usage and any overrides will be discarded. Therefore, provide unique names to avoid overrides. |
customScrapeConfigs:
custom-grafana:
scrape_interval: 10s
scrape_timeout: 5s
kubernetes_sd_configs:
- role: endpoints
relabel_configs:
- source_labels:
- __meta_kubernetes_service_label_app
- __meta_kubernetes_endpoint_port_name
regex: grafana;service
action: keep
- source_labels:
- __meta_kubernetes_pod_name
target_label: pod
|
Available since Container Cloud 2.24.0 (Cluster release 14.0.0)
Key |
Description |
Example values |
|---|---|---|
|
Configuration for managing Prometheus metrics filtering. When enabled (default), only actively used and explicitly white-listed metrics get scraped by Prometheus. |
prometheusServer:
metricsFiltering:
enabled: true
|
|
List of extra metrics to whitelist, which are dropped by default. Contains the following parameters:
|
prometheusServer:
metricsFiltering:
enabled: true
extraMetricsInclude:
cadvisor:
- container_memory_failcnt
- container_network_transmit_errors_total
calico:
- felix_route_table_per_iface_sync_seconds_sum
- felix_bpf_dataplane_endpoints
_group-go-collector-metrics:
- go_gc_heap_goal_bytes
- go_gc_heap_objects_objects
|
Key |
|
|---|---|
Description |
Deprecated since Container Cloud 2.30.0 (Cluster releases 21.0.0 and 20.0.0) for the sake of extraArgs. Excludes monitoring of RegExp-specified network devices. The number of network interface-related metrics is significant and may cause extended Prometheus RAM usage in big clusters. Therefore, Prometheus Node Exporter only collects information of a basic set of interfaces (both host and container) and excludes the following monitoring interfaces:
To enable information collecting for the interfaces above, edit the list of blacklisted devices as needed. |
Example values |
nodeExporter:
netDeviceExclude: "^(veth.+|cali.+|o-hm0|tap.+|qg-.+|qr-.+|ha-.+|br-.+|ovs-system|docker0)$"
|
Key |
|
|||
|---|---|---|---|---|
Description |
Deprecated since Container Cloud 2.30.0 (Cluster releases 21.0.0 and 20.0.0) for the sake of extraArgs. Enables Node Exporter collectors. For a list of available collectors, see Node Exporter Collectors. The following collectors are enabled by default in StackLight:
|
|||
Example values |
extraCollectorsEnabled:
- bcache
- bonding
- softnet
|
Key |
|
|---|---|
Description |
Available since Container Cloud 2.30.0 (Cluster releases 21.0.0 and 20.0.0).
Additional command-line arguments passed to Node Exporter. This field has
the highest priority when merging with default and other user-provided
arguments, including The value should be a map of flags to values. For boolean flags, use an
empty string ( |
Example values |
extraArgs:
collector.filesystem.ignored-mount-points: "^/(dev|proc|sys|var/lib/docker/.+)($|/)"
collector.netdev.device-exclude: "lo"
collector.cpu: ""
|
Key |
|
|---|---|
Description |
Available since Container Cloud 2.30.0 (Cluster releases 21.0.0 and 20.0.0).
Additional volumes to be mounted into the Node Exporter pod. Do not define
volumes using the following names, as they are already defined by default.
Duplicating them will break the following Helm upgrades: |
Example values |
extraVolumes:
- name: custom-mount
hostPath:
path: /custom
type: Directory
|
Key |
|
|---|---|
Description |
Available since Container Cloud 2.30.0 (Cluster releases 21.0.0 and 20.0.0). Additional volume mounts to be added to the Node Exporter container. Do not define mounts using the following mountPaths, as they are already included by default. Adding them here will result in duplicate definitions and cause Helm upgrade failures:
|
Example values |
extraVolumeMounts:
- name: custom-mount
mountPath: /host/custom
readOnly: true
|
Note
Prometheus Relay is set up as an endpoint in the Prometheus datasource in Grafana. Therefore, all requests from Grafana are sent to Prometheus through Prometheus Relay. If Prometheus Relay reports request timeouts or exceeds the response size limits, you can configure the parameters below. In this case, Prometheus Relay resource limits may also require tuning.
Key |
Description |
Example values |
|---|---|---|
|
Specifies the client timeout in seconds. If empty, defaults to a value
determined by the cluster size: Note The cluster size parameters are available since Container Cloud 2.24.0 (Cluster release 14.0.0). |
|
|
Specifies the response size limit in bytes. If empty, defaults to a
value determined by the cluster size: Note The cluster size parameters are available since Container Cloud 2.24.0 (Cluster release 14.0.0). |
|
Allows sending of metrics from Prometheus to a custom monitoring endpoint. For details, see Prometheus Documentation: remote_write.
Key |
Description |
Example values |
|---|---|---|
|
Skip this step if your remote server does not have authorization.
Defines additional mounts for Note To create more than one file for the same remote write
endpoint, for example, to configure TLS connections,
use a single secret object with multiple keys in the ...
data:
cert_file: aWx1dnRlc3Rz
key_file: dGVzdHVzZXI=
...
|
remoteWriteSecretMounts:
- secretName: prom-secret-files
mountPath: /etc/config/remote_write
|
|
Defines the configuration of a custom remote_write endpoint for sending Prometheus samples. Note If the remote server uses authorization, first create
secret(s) in the |
remoteWrites:
- url: http://remote_url/push
authorization:
credentials_file: /etc/config/remote_write/key_file
|
Key |
Description |
Example values |
|---|---|---|
|
Provides the capability to override the default resource requests or limits for any StackLight component for the predefined cluster sizes. Caution Since Container Cloud 2.28.0 (Cluster releases 17.3.0 and
16.3.0),
StackLight components for resource limits customizationNote The below list has the
alerta: alerta/alerta
alertmanager: prometheus-alertmanager/prometheus-alertmanager
alertmanagerWebhookServicenow: alertmanager-webhook-servicenow/alertmanager-webhook-servicenow
blackboxExporter: prometheus-blackbox-exporter/blackbox-exporter
elasticsearch: opensearch-master/opensearch # Deprecated
elasticsearchCurator: elasticsearch-curator/elasticsearch-curator
elasticsearchExporter: elasticsearch-exporter/elasticsearch-exporter
fluentdElasticsearch: fluentd-logs/fluentd-logs # Deprecated
fluentdLogs: fluentd-logs/fluentd-logs
fluentdNotifications: fluentd-notifications/fluentd
grafana: grafana/grafana
grafanaRenderer: grafana/grafana-renderer # Removed in MCC 2.27.0 (17.2.0 and 16.2.0)
iamProxy: iam-proxy/iam-proxy # Deprecated
iamProxyAlerta: iam-proxy-alerta/iam-proxy
iamProxyAlertmanager: iam-proxy-alertmanager/iam-proxy
iamProxyGrafana: iam-proxy-grafana/iam-proxy
iamProxyKibana: iam-proxy-kibana/iam-proxy # Deprecated
iamProxyOpenSearchDashboards: iam-proxy-kibana/iam-proxy
iamProxyPrometheus: iam-proxy-prometheus/iam-proxy
kibana: opensearch-dashboards/opensearch-dashboards # Deprecated
kubeStateMetrics: prometheus-kube-state-metrics/prometheus-kube-state-metrics
libvirtExporter: prometheus-libvirt-exporter/prometheus-libvirt-exporter
metricCollector: metric-collector/metric-collector
metricbeat: metricbeat/metricbeat
nodeExporter: prometheus-node-exporter/prometheus-node-exporter
opensearch: opensearch-master/opensearch
opensearchDashboards: opensearch-dashboards/opensearch-dashboards
patroniExporter: patroni/patroni-patroni-exporter
pgsqlExporter: patroni/patroni-pgsql-exporter
postgresql: patroni/patroni
prometheusEsExporter: prometheus-es-exporter/prometheus-es-exporter
prometheusMsTeams: prometheus-msteams/prometheus-msteams
prometheusRelay: prometheus-relay/prometheus-relay
prometheusServer: prometheus-server/prometheus-server
sfNotifier: sf-notifier/sf-notifier
sfReporter: sf-reporter/sf-reporter
stacklightHelmControllerController: stacklight-helm-controller/controller
telegrafDockerSwarm: telegraf-docker-swarm/telegraf-docker-swarm
telegrafDs: telegraf-ds-smart/telegraf-ds-smart # Deprecated
telegrafDsSmart: telegraf-ds-smart/telegraf-ds-smart
telegrafOpenstack: telegraf-openstack/telegraf-openstack # replaced with osdpl-exporter in 24.1
telegrafS: telegraf-docker-swarm/telegraf-docker-swarm # Deprecated
telemeterClient: telemeter-client/telemeter-client
telemeterServer: telemeter-server/telemeter-server
telemeterServerAuthServer: telemeter-server/telemeter-server-authorization-server
tfControllerExporter: prometheus-tf-controller-exporter/prometheus-tungstenfabric-exporter
tfVrouterExporter: prometheus-tf-vrouter-exporter/prometheus-tungstenfabric-exporter
|
resourcesPerClusterSize:
# elasticsearch:
opensearch:
small:
limits:
cpu: "1000m"
memory: "4Gi"
medium:
limits:
cpu: "2000m"
memory: "8Gi"
requests:
cpu: "1000m"
memory: "4Gi"
large:
limits:
cpu: "4000m"
memory: "16Gi"
|
|
Provides the capability to override the containers resource requests or limits for any StackLight component.
StackLight components for resource limits customizationNote The below list has the
alerta: alerta/alerta
alertmanager: prometheus-alertmanager/prometheus-alertmanager
alertmanagerWebhookServicenow: alertmanager-webhook-servicenow/alertmanager-webhook-servicenow
blackboxExporter: prometheus-blackbox-exporter/blackbox-exporter
elasticsearch: opensearch-master/opensearch # Deprecated
elasticsearchCurator: elasticsearch-curator/elasticsearch-curator
elasticsearchExporter: elasticsearch-exporter/elasticsearch-exporter
fluentdElasticsearch: fluentd-logs/fluentd-logs # Deprecated
fluentdLogs: fluentd-logs/fluentd-logs
fluentdNotifications: fluentd-notifications/fluentd
grafana: grafana/grafana
grafanaRenderer: grafana/grafana-renderer # Removed in MCC 2.27.0 (17.2.0 and 16.2.0)
iamProxy: iam-proxy/iam-proxy # Deprecated
iamProxyAlerta: iam-proxy-alerta/iam-proxy
iamProxyAlertmanager: iam-proxy-alertmanager/iam-proxy
iamProxyGrafana: iam-proxy-grafana/iam-proxy
iamProxyKibana: iam-proxy-kibana/iam-proxy # Deprecated
iamProxyOpenSearchDashboards: iam-proxy-kibana/iam-proxy
iamProxyPrometheus: iam-proxy-prometheus/iam-proxy
kibana: opensearch-dashboards/opensearch-dashboards # Deprecated
kubeStateMetrics: prometheus-kube-state-metrics/prometheus-kube-state-metrics
libvirtExporter: prometheus-libvirt-exporter/prometheus-libvirt-exporter
metricCollector: metric-collector/metric-collector
metricbeat: metricbeat/metricbeat
nodeExporter: prometheus-node-exporter/prometheus-node-exporter
opensearch: opensearch-master/opensearch
opensearchDashboards: opensearch-dashboards/opensearch-dashboards
patroniExporter: patroni/patroni-patroni-exporter
pgsqlExporter: patroni/patroni-pgsql-exporter
postgresql: patroni/patroni
prometheusEsExporter: prometheus-es-exporter/prometheus-es-exporter
prometheusMsTeams: prometheus-msteams/prometheus-msteams
prometheusRelay: prometheus-relay/prometheus-relay
prometheusServer: prometheus-server/prometheus-server
sfNotifier: sf-notifier/sf-notifier
sfReporter: sf-reporter/sf-reporter
stacklightHelmControllerController: stacklight-helm-controller/controller
telegrafDockerSwarm: telegraf-docker-swarm/telegraf-docker-swarm
telegrafDs: telegraf-ds-smart/telegraf-ds-smart # Deprecated
telegrafDsSmart: telegraf-ds-smart/telegraf-ds-smart
telegrafOpenstack: telegraf-openstack/telegraf-openstack # replaced with osdpl-exporter in 24.1
telegrafS: telegraf-docker-swarm/telegraf-docker-swarm # Deprecated
telemeterClient: telemeter-client/telemeter-client
telemeterServer: telemeter-server/telemeter-server
telemeterServerAuthServer: telemeter-server/telemeter-server-authorization-server
tfControllerExporter: prometheus-tf-controller-exporter/prometheus-tungstenfabric-exporter
tfVrouterExporter: prometheus-tf-vrouter-exporter/prometheus-tungstenfabric-exporter
|
resources:
alerta:
requests:
cpu: "50m"
memory: "200Mi"
limits:
memory: "500Mi"
Using the example above, each pod in the Note The logging mechanism performance depends on the cluster log
load. If the cluster components send an excessive amount of logs, the
default resource requests and limits for resources:
# fluentdElasticsearch:
fluentdLogs:
requests:
memory: "500Mi"
limits:
memory: "1500Mi"
|
On the managed clusters with limited Internet access, proxy is required for StackLight components that use HTTP and HTTPS and are disabled by default but need external access if enabled. The Salesforce reporter depends on the Internet access through HTTPS.
Key |
Description |
Example values |
|---|---|---|
|
Unique cluster identifier
The |
Do not modify |
|
Enables or disables reporting of Prometheus metrics to Salesforce. For details, see Deployment architecture. Disabled by default. |
|
|
Salesforce parameters and credentials for the metrics reporting integration. |
Note Modify this parameter if salesForceAuth:
url: "<SF instance URL>"
username: "<SF account email address>"
password: "<SF password>"
environment_id: "<Cloud identifier>"
organization_id: "<Organization identifier>"
sandbox_enabled: "<Set to true or false>"
|
|
Defines the Kubernetes cron job for sending metrics to Salesforce. By default, reports are sent at midnight server time. |
cronjob:
schedule: "0 0 * * *"
concurrencyPolicy: "Allow"
failedJobsHistoryLimit: ""
successfulJobsHistoryLimit: ""
startingDeadlineSeconds: 200
|
In an HA StackLight setup, when highAvailabilityEnabled is set to true,
all StackLight Persistent Volumes (PVs) use the Local Volume Provisioner (LVP)
storage class not to rely on dynamic provisioners such as Ceph, which are not
available in every deployment. In a non-HA StackLight setup, when no storage
class is specified, PVs use the default storage class of a cluster.
Key |
Description |
Example values |
|---|---|---|
|
Defines the |
|
|
Defines (overrides the |
componentStorageClasses:
elasticsearch: ""
opensearch: ""
fluentd: ""
postgresql: ""
prometheusAlertManager: ""
prometheusServer: ""
|
Available since MCC 2.30.0 (21.0.0 and 20.0.0)
Key |
Description |
Example values |
|---|---|---|
|
Enables the Telegraf S.M.A.R.T input plugin. Enabled by default. |
|
|
Configuration block for the S.M.A.R.T input plugin. The list of the supported parameters includes:
Warning When the Refer to the official Telegraf S.M.A.R.T Input Plugin documentation for details and expected formats. |
configParameters:
enable_extensions:
- "auto-on"
excludes:
- "/dev/sdb"
attributes: true
tag_with_device_type: false
interval: "30s"
timeout: "25s"
|
Verify StackLight after configuration
This section describes how to verify StackLight after configuring its parameters as described in StackLight configuration procedure and StackLight configuration parameters. Perform the verification procedure described for a particular modified StackLight key.
Key |
Verification procedure |
|---|---|
|
|
|
|
|
|
|
|
|
In the OpenSearch Dashboards web UI, click Discover and
verify that the |
|
In the Grafana web UI, verify that the OpenStack dashboards are present and not empty. |
|
|
Key |
Verification procedure |
|---|---|
|
Verify that Alerta is present in the list of StackLight resources. An empty output indicates that Alerta is disabled. kubectl get all -n stacklight -l app=alerta
|
|
In the Alertmanager web UI, navigate to Status and verify
that the Config section contains the |
|
In the Alertmanager web UI, navigate to Status and verify that the Config section contains the intended receiver(s). |
|
In the Alertmanager web UI, navigate to Status and verify that the Config section contains the intended route(s). |
|
Run the following command. An empty output indicates either a failure or that the feature is disabled. kubectl get cm -n stacklight prometheus-alertmanager -o \
yaml | grep -A 6 inhibit_rules
|
|
|
|
|
|
|
|
Verify that kubectl get deployment sf-notifier \
-o=jsonpath='{.spec.template.spec.containers[0].env}' | jq .
|
|
In case of any failure:
|
|
In the Alertmanager web UI, navigate to Status and verify
that the Config section contains the |
|
|
|
Verify that the kubectl get deployment.apps/prometheus-blackbox-exporter -n stacklight \
-o=jsonpath='{.spec.template.spec.containers[?(@.name=="blackbox-exporter")].args}'
For example, for |
|
|
|
|
elasticsearch.logstashRetentionTimeRemoved in MCC 2.26.0 (17.1.0, 16.1.0)
|
Verify that the kubectl get cm elasticsearch-curator-config -n \
stacklight -o=jsonpath='{.data.action_file\.yml}'
|
|
Verify that the PVC(s) capacity is equal or higher (in case of statically provisioned volumes) than specified: kubectl get pvc -n stacklight -l "app=opensearch-master"
|
|
|
|
|
|
In the Grafana web UI, verify that the desired dashboard is set as a home dashboard. |
grafana.renderer.enabledRemoved in MCC 2.27.0 (17.2.0, 16.2.0)
|
Verify the Grafana Image Renderer. If set to kubectl logs -f -n stacklight -l app=grafana \
--container grafana-renderer
|
|
Verify the number of service replicas for the HA or non-HA StackLight mode. For details, see Deployment architecture. kubectl get sts -n stacklight
|
|
In the Grafana web UI, verify that the Ironic BM dashboard displays valuable data (no false-positive or empty panels). |
|
Verify that the customization has applied: kubectl -n stacklight get cm opensearch-dashboards -o=jsonpath='{.data}'
Example of system response: {"opensearch_dashboards.yml":"opensearch.hosts: http://opensearch-master:9200\
\nopensearch.requestTimeout: 60000\
\nopensearchDashboards.defaultAppId: dashboard/2d53aa40-ad1f-11e9-9839-052bda0fdf49\
\nserver:\
\n host: 0.0.0.0\
\n name: opensearch-dashboards\n"}
|
|
Verify that OpenSearch, Fluentd, and OpenSearch Dashboards are present in the list of StackLight resources. An empty output indicates that the StackLight logging stack is disabled. kubectl get all -n stacklight -l 'app in
(opensearch-master,opensearchDashboards,fluentd-logs)'
|
|
To troubleshoot issues with Splunk, refer to No logs are forwarded to Splunk. |
|
Verify that files were created for the specified path in the Fluentd container: kubectl get pods -n stacklight -o name | grep fluentd-logs | \
xargs -I{} kubectl exec -i {} -c fluentd-logs -n stacklight -- \
ls <logging.externalOutputSecretMounts.mountPath>
|
|
Verify that the customization has applied: kubectl -n stacklight get cm opensearch-master-config -o=jsonpath='{.data}'
Example of system response: {"opensearch.yml":"cluster.name: opensearch\
\nnetwork.host: 0.0.0.0\
\nplugins.security.disabled: true\
\nplugins.index_state_management.enabled: false\
\npath.data: /usr/share/opensearch/data\
\ncompatibility.override_main_response_version: true\
\ncluster.max_shards_per_node: 5000\n"}
|
logging.levelRemoved in MCC 2.26.0 (17.1.0, 16.1.0)
|
|
|
For details, see steps 4.2 and 4.3 in Create logs-based metrics. |
|
|
|
Verify that kubectl get cm -n stacklight fluentd-logs -o \
yaml | grep packet_size
|
|
|
|
In the Prometheus web UI, navigate to Alerts and verify that
the |
|
|
|
In the Prometheus web UI, run the following PromQL queries. The result should not be empty. node_scrape_collector_duration_seconds{collector="<COLLECTOR_NAME>"}
node_scrape_collector_success{collector="<COLLECTOR_NAME>"}
|
|
|
|
Verify that the appropriate components pods are located on the intended nodes: kubectl get pod -o=custom-columns=NAME:.metadata.name,\
STATUS:.status.phase,NODE:.spec.nodeName -n stacklight
|
|
|
|
|
|
In the Prometheus web UI, navigate to Alerts and verify that the list of alerts has changed according to your customization. |
|
|
|
It may take up to 10 minutes for the change to apply. |
|
Verify that the PVC(s) capacity equals or is higher (in case of statically provisioned volumes) than specified: kubectl get pvc -n stacklight -l "app=prometheus,component=server"
|
|
|
|
|
|
Verify that files were created for the specified path in the Prometheus container: kubectl exec -it prometheus-server-0 -c prometheus-server -n \
stacklight -- ls <remoteWriteSecretMounts.mountPath>
|
|
In the Prometheus web UI, navigate to Alerts and verify that
the list of alerts contains the |
|
|
|
|
|
Verify that the appropriate components PVCs have been created according
to the configured kubectl get pvc -n stacklight
|
Tune OpenSearch performance
The following hardware recommendations and software settings apply for better OpenSearch performance in a MOSK cluster.
To tune OpenSearch performance:
Depending on your cluster size, set the required disk and CPU size along with memory limit and heap size.
Heap size is calculated in StackLight as ⅘ of the specified memory limit. If the calculated heap size exceeds 32 GB, slightly crossing this threshold causes significant waste of memory due to loss of Ordinary Object Pointers (OOPS) compression, which allows storing 64-bit pointers in 32-bits.
Since Container Cloud 2.25.0 (Cluster releases 17.0.0 and 16.0.0), to prevent this behavior, for the memory limit in the 31-50 GB range, the heap size is set to fixed 31 GB using the
enforceOopsCompressionparameter, which is enabled by default. For details, see Logging: Enforce OOPS compression. Exceeding the range causes loss of benefit of OOPS compression, so the ⅘ formula applies again.OpenSearch is write-heavy, so SSD is preferable as a disk type.
Hardware recommendations for OpenSearch¶ Cluster size
Memory limit (GB)
Heap size (GB)
CPU (# of cores)
Small
16
12.8
2
Medium
32
25.6
4
Large
64
51.2
8
To configure hardware settings for OpenSearch, refer to Resource limits in the StackLight configuration procedure section.
Configure the maximum count of
mmapfiles. OpenSearch uses mmapfs to map shards stored on disk, which is set to65530by default.To verify
max_map_count:sysctl -n vm.max_map_count
To increase
max_map_count, follow the Create MOSK host profiles procedure.Example configuration:
kernelParameters: sysctl: vm.max_map_count: "<value>"
Extended retention periods, which depend on open shards, require increasing this value significantly. For example, to
262144.Configure swap as it significantly degrades performance. Lower
swappinessto1or0(to disable swap). For details, use the Create MOSK host profiles procedure.Example configuration:
kernelParameters: sysctl: vm.swappiness: "<value>"
Configure the kernel I/O scheduler to improve timing of disk writing operations. Change it to one of the following options:
none- applies the FIFO queue.mq-deadline- applies three queues: FIFO read, FIFO write, and sorted.
Changing I/O scheduling is also possible through
BareMetalHostProfile. However, the specific implementation highly depends on the disk type used:cat /sys/block/sda/queue/scheduler mq-deadline kyber bfq [none]
Export logs from OpenSearch Dashboards to CSV
Available since MCC 2.23.0 (12.7.0 and 11.7.0)
This section describes how to export logs from the OpenSearch Dashboards navigation panel to the CSV format.
Caution
The log limit is set 10 000 rows, and it does not take into account the resulted file size.
Note
The following instruction describes how to export all logs from the
opensearch-master-0 node of an OpenSearch cluster.
To export logs from the OpenSearch Dashboards navigation panel to CSV:
Log in to the OpenSearch Dashboards web UI as described in Getting access.
Navigate to the Discover page.
In the left navigation panel, select the required log index pattern from the top drop-down menu. For example, system* for system logs and audit* for audit logs.
In the middle top menu, click Add filter and add the required filters. For example:
event.provider matches the
opensearch-masterloggerorchestrator.pod matches the
opensearch-master-0node name
In Search field names, search for required fields to be present in the resulting CSV file. For example:
orchestrator.pod for
opensearch-master-0message for the log message
In the right top menu:
Click Save to save the filter after naming it.
Click Reporting > Generate CSV.
When the report generation completes, download the file depending on your browser settings.
OpenSearch Dashboards
This section describes OpenSearch Dashboards that enable you to observe visual representation of logs and Kubernetes events of your cluster.
View OpenSearch Dashboards
OpenSearch Dashboards is part of the StackLight logging stack. Using the OpenSearch Dashboards web UI, you can view the visual representation of your OpenStack deployment notifications, logs, Kubernetes events, and other cluster notifications related to your deployment.
Note
By default, StackLight logging stack, including OpenSearch Dashboards, is disabled. For details, see Deployment architecture.
To view the OpenSearch Dashboards:
Log in to the OpenSearch Dashboards web UI as described in Getting access.
Click the required dashboard to inspect the visualizations or perform a search:
Dashboard
Description
Notifications
Provides visualizations on the number of notifications over time per source and severity, host, and breakdowns. The dashboard includes search.
K8s events
Provides visualizations on the number of Kubernetes events per type, and top event-producing resources and namespaces by reason and event type. Includes search.
System Logs
Available for clusters created since Container Cloud 2.26.0 (Cluster releases 17.1.x, 16.1.x, or later).
Provides visualizations on the number of log messages per severity, source, and top log-producing host, namespaces, containers, and applications. Includes search.
Caution
Due to a known issue, this dashboard does not exist in Container Cloud 2.26.0 (Cluster releases 17.1.0 and 16.1.0). The issue is addressed in Container Cloud 2.26.1 (Cluster releases 17.1.1 and 16.1.1). To work around the issue in 2.26.0, you can map the fields of the
logstashindex to thesystemone and view logs in the deprecated Logs dashboard. For mapping details, see System index fields mapped to Logstash index fields.Logs Deprecated in 2.26.0 (17.1.0 and 16.1.0)
Available only for clusters created before Container Cloud 2.26.0 (Cluster releases 17.0.x, 16.0.x, or earlier).
Analogous to System Logs but contains logs generated only for the mentioned Cluster releases.
Search in OpenSearch Dashboards
OpenSearch Dashboards provide the following search tools:
Filters
Queries
Full-text search
Filters enable you to organize the output information using the interface tools. You can search for information by a set of indexed fields using a variety of logical operators.
Queries enable you to construct search commands using OpenSearch query domain-specific language (DSL) expressions. These expressions allow you to search by the fields not included in the index.
In addition to filters and queries, you can use the Search input field for full-text search.
From the dashboard view, click Add filter.
In the dialog that opens, select the field of search in the Field drop-down menu.
Select the logical operator in the Operator drop-down menu.
Type or select the filter value from the Value drop-down menu.
Available since MCC 2.23.0 (12.7.0 and 11.7.0)
For the orchestrator.labels field of the system and audit log indices,
you can use the flat_object field type to apply the filtering using
value or valueAndPath. For example:
Using
value: to obtain all logs produced byiam-proxy, add the following filters:orchestrator.typethat matcheskubernetesorchestrator.labels._valuethat matchesiam-proxy
Using
valueAndPath: to obtain all logs produced by the OpenSearch cluster, add the following filters:orchestrator.typethat matcheskubernetesorchestrator.labels._valueAndPaththat matchesorchestrator.labels.app=opensearch-master
From the dashboard view, click Add filter.
In the dialog that opens, click Edit as Query DSL and type in the search request.
View Grafana dashboards
Using the Grafana web UI, you can view the visual representation of the metric graphs based on the time series databases.
Most Grafana dashboards include a View logs in OpenSearch Dashboards link to immediately view relevant logs in the OpenSearch Dashboards web UI. The OpenSearch Dashboards web UI displays logs filtered using the Grafana dashboard variables, such as the drop-downs. Once you amend the variables, wait for Grafana to generate a new URL.
Note
Due to the known issue, the View logs in OpenSearch Dashboards link does not work in Container Cloud 2.26.0 (Cluster releases 17.1.0 and 16.1.0). The issue is addressed in Container Cloud 2.26.1 (Cluster releases 17.1.1 and 16.1.1).
Caution
The Grafana dashboards that contain drop-down lists are limited to 1000 lines. Therefore, if you require data on a specific item, use the filter by name instead.
Note
Grafana dashboards that present node data have an additional Node identifier drop-down menu. By default, it is set to machine to display short names for Kubernetes nodes. To display Kubernetes node name labels, change this option to node.
To view the Grafana dashboards:
Log in to the Grafana web UI as described Getting access.
From the drop-down list, select the required dashboard to inspect the status and statistics of the corresponding service in your management or MOSK cluster:
Component
Dashboard
Description
Ceph cluster
Ceph Cluster
Provides the overall health status of the Ceph cluster, capacity, latency, and recovery metrics.
Ceph Nodes
Provides an overview of the host-related metrics, such as the number of Ceph Monitors, Ceph OSD hosts, average usage of resources across the cluster, network and hosts load.
This dashboard is deprecated since Container Cloud 2.25.0 (Cluster releases 17.0.0 and 16.0.0) and is removed in Container Cloud 2.26.0 (Cluster releases 17.1.0 and 16.1.0).
Therefore, Mirantis recommends switching to the following dashboards in the current release:
For Ceph stats, use the Ceph Cluster dashboard.
For resource utilization, use the System dashboard, which includes filtering by Ceph node labels, such as
ceph_role_osd,ceph_role_mon, andceph_role_mgr.
Ceph OSDs
Provides metrics for Ceph OSDs, including the Ceph OSD read and write latencies, distribution of PGs per Ceph OSD, Ceph OSDs and physical device performance.
Ceph Pools
Provides metrics for Ceph pools, including the client IOPS and throughput by pool and pools capacity usage.
Cross-node connectivity
Infra - Cross Node Connectivity
Available since Container Cloud 2.30.0 (21.0.0 and 20.0.0). Provides information about cross-node connectivity checks. Displays nodes that are currently failing to pass checks and detailed statistics of all cross-node connectivity checks.
Ironic
Ironic BM
Provides graphs on Ironic health, HTTP API availability, provisioned nodes by state and installed
ironic-conductorbackend drivers.Container Cloud
Clusters Overview
Represents the main cluster capacity statistics for all clusters of a Container Cloud deployment where StackLight is installed.
Note
Due to the known issue, the Prometheus Targets Unavailable panel of the Clusters Overview dashboard does not display data for managed clusters of the 11.7.0, 11.7.4, 12.5.0, and 12.7.x series Cluster releases after update to Container Cloud 2.24.0.
Etcd
Available since Container Cloud 2.21.0 (Cluster release 11.5.0). Provides graphs on database size, leader elections, requests duration, incoming and outgoing traffic.
MCC Applications Performance
Available since Container Cloud 2.23.0 (Cluster release 11.7.0). Provides information on the Container Cloud internals work based on Golang, controller runtime, and custom metrics. You can use it to verify performance of applications and for troubleshooting purposes.
Keycloak
Keycloak
Available since Container Cloud 2.30.0 (Cluster releases 21.0.0 and 20.0.0). Provides information about Keycloak. Displays application health status, statistics of user events and HTTP responses.
Kubernetes resources
Kubernetes Calico
Provides metrics of the entire Calico cluster usage, including the cluster status, host status, and Felix resources.
Kubernetes Cluster
Provides metrics for the entire Kubernetes cluster, including the cluster status, host status, and resources consumption.
Kubernetes Containers
Provides charts showing resource consumption per deployed Pod containers running on Kubernetes nodes.
Kubernetes Deployments
Provides information on the desired and current state of all service replicas deployed on a Container Cloud cluster.
Kubernetes Namespaces
Provides the Pods state summary and the CPU, MEM, network, and IOPS resources consumption per name space.
Kubernetes Nodes
Provides charts showing resources consumption per Container Cloud cluster node.
Kubernetes Pods
Provides charts showing resources consumption per deployed Pod.
OpenStack
OpenStack - Overview
Provides general information on OpenStack services resources consumption, API errors, deployed OpenStack compute nodes and block storage usage.
OpenStack Ingress controller
Available since MOSK 23.3. Monitors the number of requests, response times and statuses, as well as the number of Ingress SSL certificates including expiration time and resources usage.
OpenStack Instances Availability
Available since MOSK 23.2. Provides information about the availability of instance floating IPs per OpenStack compute node and project. Also, enables monitoring of probe statistics for individual instance floating IPs.
OpenStack Network IP Capacity
Available since MOSK 25.1. Provides information about the statistics of IP address allocation for external networks and subnets on non-Tungsten Fabric based MOSK clusters. For configuration details, see Start monitoring IP address capacity.
OpenStack PortProber
Available since MOSK 24.2. Provides information about the availability of Neutron ports per OpenStack compute node, project, and port owner.
OpenStack PortProber [Deprecated]
Available since MOSK 25.1. Provides information about the availability of Neutron ports per OpenStack compute node, project, and port owner. Deprecated in favor of the OpenStack PortProber dashboard.
Use this deprecated dashboard only to access old data collected before MOSK 25.1.
OpenStack PowerDNS
Available since MOSK 24.3. Provides different stats about OpenStack PowerDNS servers such as connections, resources, queries, rings, errors, and other.
OpenStack Usage Efficiency
Available since MOSK 23.3. Provides information about requested (allocated) CPU and memory usage efficiency on a per-project and per-flavor basis. Aims to identify flavors that specific projects are not effectively using, with allocations significantly exceeding actual usage. Also, evaluates per-instance underuse for specific projects.
KPI - Provisioning
Provides provisioning statistics for OpenStack compute instances, including graphs on VM creation results by day.
Cinder
Provides graphs on the OpenStack Block Storage service health, HTTP API availability, pool capacity and utilization, number of created volumes and snapshots.
Glance
Provides graphs on the OpenStack Image service health, HTTP API availability, number of created images and snapshots.
Gnocchi
Provides panels and graphs on the Gnocchi health and HTTP API availability.
Heat
Provides graphs on the OpenStack Orchestration service health, HTTP API availability and usage.
Ironic OpenStack
Provides graphs on the OpenStack Bare Metal Provisioning service health, HTTP API availability, provisioned nodes by state and installed ironic-conductor backend drivers.
Keystone
Provides graphs on the OpenStack Identity service health, HTTP API availability, number of tenants and users by state.
Neutron
Provides graphs on the OpenStack networking service health, HTTP API availability, agents status and usage of Neutron L2 and L3 resources.
NGINX Ingress controller
Not recommended. Deprecated since MOSK 23.3 and is removed in MOSK 24.1. Use OpenStack Ingress controller instead.
Monitors the number of requests, response times and statuses, as well as the number of Ingress SSL certificates including expiration time and resources usage.
Nova - Availability Zones
Provides detailed graphs on the OpenStack availability zones and hypervisor usage.
Nova - Hypervisor Overview
Provides a set of single-stat panels presenting resources usage by host.
Nova - Instances
Provides graphs on libvirt Prometheus exporter health and resources usage. Monitors the number of running instances and tasks and allows sorting the metrics by top instances.
Nova - Overview
Provides graphs on the OpenStack compute services (
nova-scheduler,nova-conductor, andnova-compute) health, as well as HTTP API availability.Nova - Tenants
Provides graphs on CPU, RAM, disk throughput, IOPS, and space usage and allocation and allows sorting the metrics by top tenants.
Nova - Users
Provides graphs on CPU, RAM, disk throughput, IOPS, and space usage and allocation and allows sorting the metrics by top users.
Nova - Utilization
Provides detailed graphs on Nova hypervisor resources capacity and consumption.
Memcached
Memcached Prometheus exporter dashboard. Monitors Kubernetes Memcached pods and displays memory usage, hit rate, evicts and reclaims rate, items in cache, network statistics, and commands rate.
MySQL
MySQL Prometheus exporter dashboard. Monitors Kubernetes MySQL pods, resources usage and provides details on current connections and database performance.
RabbitMQ [Deprecated]
Not recommended. Deprecated since MOSK 25.1 and removed in 25.2. RabbitMQ Prometheus exporter dashboard. Monitors Kubernetes RabbitMQ pods, resources usage and provides details on cluster utilization and performance.
Caution
This dashboard is renamed from RabbitMQ to RabbitMQ [Deprecated] in MOSK 25.1 and is removed in 25.2 for the sake of the RabbitMQ Overview and RabbitMQ Erlang dashboards.
For deprecation details, see Deprecation notes: RabbitMQ Prometheus Exporter.
RabbitMQ Erlang
Available since MOSK 25.1. Monitors RabbitMQ BEAM performance, memory details, load and distribution metrics using native Prometheus plugin metrics.
RabbitMQ Overview
Available since MOSK 25.1. Monitors RabbitMQ node performance, resource usage, message queue, channel, and connection statistics using native Prometheus plugin metrics.
Cassandra
Provides graphs on Cassandra clusters’ health, ongoing operations, and resource consumption.
Kafka
Provides graphs on Kafka clusters’ and broker health, as well as broker and topic usage.
Redis
Provides graphs on Redis clusters’ and pods’ health, connections, command calls, and resource consumption.
Tungsten Fabric
Tungsten Fabric Controller
Provides graphs on the overall Tungsten Fabric Controller cluster processes and usage.
Tungsten Fabric vRouter
Provides graphs on the overall Tungsten Fabric vRouter cluster processes and usage.
ZooKeeper
Provides graphs on ZooKeeper clusters’ quorum health and resource consumption.
StackLight
Alertmanager
Provides performance metrics on the overall health status of the Prometheus Alertmanager service, the number of firing and resolved alerts received for various periods, the rate of successful and failed notifications, and the resources consumption.
OpenSearch
Provides information about the overall health status of the OpenSearch cluster, including the resources consumption, number of operations and their performance.
OpenSearch Indices
Provides detailed information about the state of indices, including their size, the number and the size of segments.
Grafana
Provides performance metrics for the Grafana service, including the total number of Grafana entities, CPU and memory consumption.
PostgreSQL
Provides PostgreSQL statistics, including read (DQL) and write (DML) row operations, transaction and lock, replication lag and conflict, and checkpoint statistics, as well as PostgreSQL performance metrics.
Prometheus
Provides the availability and performance behavior of the Prometheus servers, the sample ingestion rate, and system usage statistics per server. Also, provides statistics about the overall status and uptime of the Prometheus service, the chunks number of the local storage memory, target scrapes, and queries duration.
Prometheus Relay
Provides service status and resources consumption metrics.
Telemeter Server
Provides statistics and the overall health status of the Telemeter service.
Note
Due to the known issue, the Telemeter Client Status panel of the Telemeter Server dashboard does not display data for managed clusters of the 11.7.0, 11.7.4, 12.5.0, and 12.7.x series Cluster releases after update to Container Cloud 2.24.0.
System
System
Provides a detailed resource consumption and operating system information per Container Cloud cluster node.
Mirantis Kubernetes Engine (MKE)
MKE Cluster
Provides a global overview of an MKE cluster: statistics about the number of the worker and manager nodes, containers, images, Swarm services.
MKE Containers
Provides per container resources consumption metrics for the MKE containers such as CPU, RAM, network.
Export data from Table panels of Grafana dashboards to CSV
This section describes how to export data from Table panels of
Grafana dashboards to .csv files.
Note
Grafana performs data exports for individual panels on a dashboard, not the entire dashboard.
To export data from Table panels of Grafana dashboards to CSV:
Log in to the Grafana web UI as described in Getting access.
In the right top corner of the required Table panel, click the kebab menu icon and select Inspect > Data.
In Data options of the Data tab, configure export options:
Enable Apply panel transformation
Leave Formatted data enabled
Enable Download for Excel, if required
Click Download CSV.
StackLight alerts
This section provides an overview of the available predefined StackLight alerts, including OpenStack, Tungsten Fabric, Container Cloud, Ceph, StackLight, MKE, and other alerts that can contain information about both OpenStack and MOSK clusters.
To view the alerts, use the Prometheus web UI. To view the firing alerts, use Alertmanager or Alerta web UI.
For alert troubleshooting guidelines, see Troubleshoot alerts.
OpenStack
This section describes the alerts available for OpenStack services.
This section describes the alerts available for the OpenStack system services.
This section lists the alerts for the libvirt service.
Severity |
Critical |
|---|---|
Summary |
Failure to gather libvirt metrics. |
Description |
Libvirt Exporter fails to gather metrics on the
|
Severity |
Major |
|---|---|
Summary |
Libvirt Exporter Prometheus target is down. |
Description |
Prometheus fails to scrape metrics from the Libvirt Exporter endpoint
on the |
Severity |
Critical |
|---|---|
Summary |
Libvirt Exporter Prometheus targets outage. |
Description |
Prometheus fails to scrape metrics from all Libvirt Exporter endpoints. |
This section lists the alerts for the MariaDB service.
Severity |
Critical |
|---|---|
Summary |
MariaDB cluster is down. |
Description |
The MariaDB |
Replaced with MariadbExporterTargetDown in 23.3
Severity |
Critical |
|---|---|
Summary |
MariaDB Exporter cluster Prometheus targets outage. |
Description |
Prometheus fails to scrape metrics from 2/3 of the
|
Since 23.3 to replace MariadbExporterClusterTargetsOutage
Severity |
Critical |
|---|---|
Summary |
MariaDB Exporter cluster Prometheus target down. |
Description |
Prometheus fails to scrape metrics from the
|
Severity |
Warning |
|---|---|
Summary |
MariaDB node is falling behind. |
Description |
The |
Severity |
Major |
|---|---|
Summary |
MariaDB cluster node is not ready. |
Description |
The |
Severity |
Warning |
|---|---|
Summary |
MariaDB cluster node is out of sync. |
Description |
The |
Severity |
Warning |
|---|---|
Summary |
MariaDB InnoDB log writes are stalling. |
Description |
The |
Severity |
Warning |
|---|---|
Summary |
MariaDB table lock waits are high. |
Description |
The |
This section lists the alerts for the Memcached service.
Severity |
Critical |
|---|---|
Summary |
Memcached cluster is down. |
Description |
The Memcached |
Severity |
Warning |
|---|---|
Summary |
Memcached has no open connections. |
Description |
The Memcached database cluster |
Severity |
Warning |
|---|---|
Summary |
Memcached has no open connections on all nodes. |
Description |
The Memcached database cluster |
Severity |
Warning |
|---|---|
Summary |
10 Memcached evictions. |
Description |
An average of |
Since 23.3 to replace MemcachedExporterClusterTargetsOutage
Severity |
Critical |
|---|---|
Summary |
Memcached Exporter cluster Prometheus target down. |
Description |
Prometheus fails to scrape metrics from the
|
Replaced with MemcachedExporterTargetDown in 23.3
Severity |
Critical |
|---|---|
Summary |
Memcached Exporter cluster Prometheus targets outage. |
Description |
Prometheus fails to scrape metrics from 2/3 of the
|
This section describes the alerts for the OpenStack SSL certificates.
By default, these alerts are disabled. To enable them, set
openstack.externalFQDNs.enabled to true. For details, see
Configuration options for SSL certificates.
Severity |
Critical |
|---|---|
Summary |
SSL certificate for an OpenStack service expires on |
Description |
The SSL certificate for the OpenStack |
Severity |
Major |
|---|---|
Summary |
SSL certificate for an OpenStack service expires on |
Description |
The SSL certificate for the OpenStack |
Severity |
Critical |
|---|---|
Summary |
SSL certificate probes for an OpenStack service are failing. |
Description |
The SSL certificate probes for the OpenStack
|
Severity |
Critical |
|---|---|
Summary |
OpenStack |
Description |
Prometheus fails to probe the OpenStack
|
This section lists the alerts for the RabbitMQ service.
Note
Before Container Cloud 2.29.0 (Cluster releases 17.4.0 and 16.4.0),
this alert was named RabbitMQNetworkPartitionsDetected.
Severity |
Major |
|---|---|
Summary |
RabbitMQ unreachable peers detected. |
Description |
The |
Removed in MCC 2.30.0 (21.0.0 and 20.0.0)
Severity |
Critical |
|---|---|
Summary |
RabbitMQ is down. |
Description |
The |
Removed in MCC 2.30.0 (21.0.0 and 20.0.0)
Severity |
Critical |
|---|---|
Summary |
|
Description |
Prometheus fails to scrape metrics from the
|
Severity |
Major |
|---|---|
Summary |
RabbitMQ operator Prometheus target is down. |
Description |
Prometheus fails to scrape metrics from the
|
Severity |
Warning |
|---|---|
Summary |
RabbitMQ file descriptors usage is high for the last 10 minutes. |
Description |
The |
Severity |
Warning |
|---|---|
Summary |
RabbitMQ disk space usage is high. |
Description |
The |
Severity |
Major |
|---|---|
Summary |
RabbitMQ memory usage is high. |
Description |
The |
Available since MCC 2.29.0 (17.4.0 and 16.4.0)
Severity |
Major |
|---|---|
Summary |
|
Description |
Prometheus fails to scrape metrics from the |
This section describes the alerts available for the OpenStack core services.
This section describes the alerts for the OpenStack services API:
Severity |
Critical |
|---|---|
Summary |
OpenStack ingress controller Prometheus targets outage. |
Description |
Prometheus fails to scrape metrics from all OpenStack ingress controller endpoints. |
Severity |
Critical |
|---|---|
Summary |
OpenStack API responds with HTTP 401. |
Description |
The OpenStack API |
Severity |
Critical |
|---|---|
Summary |
OpenStack API responds with HTTP 5xx. |
Description |
The OpenStack API |
Available since MOSK 24.1
Severity |
Critical |
|---|---|
Summary |
OpenStack |
Description |
The OpenStack |
Severity |
Critical |
|---|---|
Summary |
OpenStack public API responds with HTTP 401. |
Description |
The OpenStack |
Severity |
Critical |
|---|---|
Summary |
OpenStack Public API responds with HTTP 5xx. |
Description |
The OpenStack |
Removed in MOSK 24.1
Severity |
Critical |
|---|---|
Summary |
OpenStack |
Description |
The OpenStack |
Removed in MOSK 24.1
Severity |
Critical |
|---|---|
Summary |
OpenStack |
Description |
The OpenStack |
This section lists the alerts for Cinder:
Severity |
Critical |
|---|---|
Summary |
|
Description |
The |
Severity |
Warning |
|---|---|
Summary |
|
Description |
The |
Severity |
Critical |
|---|---|
Summary |
|
Description |
At least 50% of the enabled hosts are in the |
Available since MCC 2.30.0 (21.0.0 and 20.0.0)
Severity |
Critical |
|---|---|
Summary |
|
Description |
The |
Available since MCC 2.30.0 (21.0.0 and 20.0.0)
Severity |
Warning |
|---|---|
Summary |
|
Description |
|
Available since MCC 2.30.0 (21.0.0 and 20.0.0)
Severity |
Critical |
|---|---|
Summary |
|
Description |
At least 50% of the enabled hosts are in the |
This section lists the alerts for Horizon.
Available since MOSK 25.2
Severity |
Critical |
|---|---|
Summary |
OpenStack Horizon login probes failing |
Description |
Horizon login probes for user
To troubleshoot the issue, attempt to log in to Horizon directly. If the login fails, review the Horizon and Keystone service logs for errors. |
This section lists the alerts for Ironic.
Severity |
Major |
|---|---|
Summary |
|
Description |
The |
This section lists the alerts for Neutron:
Severity |
Critical |
|---|---|
Summary |
|
Description |
The |
Severity |
Critical |
|---|---|
Summary |
|
Description |
The |
Severity |
Critical |
|---|---|
Summary |
|
Description |
The |
This section lists the alerts for Nova:
Available since MOSK 25.2
Severity |
Critical |
|---|---|
Summary |
Nova data directory is mounted as read-only. |
Description |
Nova data directory ( |
Available since MOSK 24.3
Severity |
Major |
|---|---|
Summary |
Openstack Nova orphaned allocations detected. |
Description |
Orphaned resource allocations are detected on compute nodes. |
Severity |
Critical |
|---|---|
Summary |
|
Description |
The |
Severity |
Critical |
|---|---|
Summary |
|
Description |
The |
Severity |
Critical |
|---|---|
Summary |
|
Description |
The |
This section lists the alerts for the Cloudprober service:
Since 23.3 to replace OpenstackCloudproberTargetsOutage TechPreview
Severity |
Major |
|---|---|
Summary |
Openstack Cloudprober Prometheus target down. |
Description |
Prometheus fails to scrape metrics from the
|
Replaced with OpenstackCloudproberTargetDown in 23.3 Available since 23.2 TechPreview
Severity |
Major |
|---|---|
Summary |
Openstack Cloudprober Prometheus targets outage. |
Description |
Prometheus fails to scrape metrics from all OpenStack Cloudprober endpoints (more than 1/10 failed scrapes). |
This section lists the alerts for the Portprober service:
Available since MOSK 24.2 TechPreview
Severity |
Major |
|---|---|
Summary |
OpenStack Portprober Prometheus targets outage. |
Description |
Prometheus fails to scrape metrics from more than one OpenStack Portprober endpoint. |
Available since MOSK 24.3
This section lists the alerts for the PowerDNS service:
Severity |
Critical |
|---|---|
Summary |
DNS probe failure for |
Description |
The DNS probe failed at least 3 times for the DNS |
Severity |
Critical |
|---|---|
Summary |
DNS probe target experienced outage for |
Description |
Prometheus failed to probe the DNS |
Severity |
Warning |
|---|---|
Summary |
High DNS query duration for |
Description |
The DNS query duration for the DNS |
Severity |
Critical |
|---|---|
Summary |
PowerDNS Prometheus target is down |
Description |
Prometheus fails to scrape metrics from the |
Severity |
Critical |
|---|---|
Summary |
Openstack PowerDNS UDP checksum errors detected |
Description |
The number of UDP checksum errors has increased by |
Severity |
Critical |
|---|---|
Summary |
Openstack PowerDNS UDP input errors detected |
Description |
The number of UDP input errors has increased by |
Severity |
Critical |
|---|---|
Summary |
Openstack PowerDNS UDP receive buffer errors detected |
Description |
The number of UDP receive buffer errors has increased by |
Severity |
Critical |
|---|---|
Summary |
Openstack PowerDNS UDP send buffer errors detected |
Description |
The number of UDP send buffer errors has increased by |
Available since MOSK 24.1
This section lists the alerts for OpenStack credential rotation:
Note
You can adjust thresholds for the alerts included in this section. If needed, refer to Alerts configuration.
Severity |
Warning |
|---|---|
Summary |
OpenStack administrator credentials are overdue for rotation |
Description |
The OpenStack administrator credentials have not been rotated since
|
Severity |
Warning |
|---|---|
Summary |
OpenStack service user credentials are overdue for rotation |
Description |
The OpenStack service user credentials have not been rotated since
|
See also
This section describes the alerts available for the OpenStack Controller (Rockoon).
Available since MOSK 24.3
Severity |
Major |
|---|---|
Summary |
Collector failure in the OpenStackDeployment Exporter. |
Description |
The |
Severity |
Critical |
|---|---|
Summary |
OpenStackDeployment Exporter Prometheus target is down. |
Description |
Prometheus fails to scrape metrics from the OpenStackDeployment Exporter endpoint. |
Severity |
Warning |
|---|---|
Summary |
SSL certificate for an OpenStack service expires on |
Description |
The SSL certificate |
Severity |
Major |
|---|---|
Summary |
SSL certificate for an OpenStack service expires on |
Description |
The SSL certificate |
Tungsten Fabric
This section describes the alerts available for the Tungsten Fabric services.
This section lists the alerts for Cassandra.
Severity |
Warning |
|---|---|
Summary |
Cassandra authentication failures. |
Description |
The |
Severity |
Major |
|---|---|
Summary |
Cassandra cache hit rate is too low. |
Description |
The average hit rate for the |
Severity |
Major |
|---|---|
Summary |
Cassandra client |
Description |
The |
Available since 23.3 to replace CassandraClusterTargetsOutage
Severity |
Critical |
|---|---|
Summary |
Cassandra cluster target down. |
Description |
Prometheus fails to scrape metrics from the
|
Replaced by CassandraClusterTargetDown in 23.3
Severity |
Critical |
|---|---|
Summary |
Cassandra cluster Prometheus targets outage. |
Description |
Prometheus fails to scrape metrics from 2/3 of the
|
Severity |
Warning |
|---|---|
Summary |
Cassandra |
Description |
The |
Severity |
Warning |
|---|---|
Summary |
Cassandra compaction executor tasks are blocked. |
Description |
The |
Severity |
Warning |
|---|---|
Summary |
Cassandra has too many pending compactions. |
Description |
The pending compaction tasks in the
|
Severity |
Critical |
|---|---|
Summary |
Cassandra connection timeouts. |
Description |
The |
Severity |
Warning |
|---|---|
Summary |
Cassandra flush writer tasks are blocked. |
Description |
The |
Severity |
Major |
|---|---|
Summary |
Cassandra has too many hints. |
Description |
The |
Severity |
Warning |
|---|---|
Summary |
Cassandra repair tasks are blocked. |
Description |
The |
Severity |
Critical |
|---|---|
Summary |
Cassandra storage exceptions. |
Description |
The |
Severity |
Critical |
|---|---|
Summary |
Cassandra scanned 50000 tombstones. |
Description |
The |
Severity |
Major |
|---|---|
Summary |
Cassandra scanned 25000 tombstones. |
Description |
The |
Severity |
Warning |
|---|---|
Summary |
Cassandra scanned 10000 tombstones. |
Description |
The |
Severity |
Warning |
|---|---|
Summary |
Cassandra high view/write latency. |
Description |
The |
This section lists the alerts for Kafka.
Since 23.3 to replace KafkaClusterTargetsOutage
Severity |
Critical |
|---|---|
Summary |
Kafka cluster Prometheus target down. |
Description |
Prometheus fails to scrape metrics from the
|
Replaced with KafkaClusterTargetDown in 23.3
Severity |
Critical |
|---|---|
Summary |
Kafka cluster Prometheus targets outage. |
Description |
Prometheus fails to scrape metrics from 2/3 of the
|
Severity |
Critical |
|---|---|
Summary |
Kafka cluster has missing brokers. |
Description |
The |
Severity |
Critical |
|---|---|
Summary |
Kafka cluster controller is missing. |
Description |
The |
Severity |
Critical |
|---|---|
Summary |
Unavailable partitions in Kafka cluster. |
Description |
Partitions without a primary replica have been detected in the
|
Severity |
Critical |
|---|---|
Summary |
Kafka cluster has too many controllers. |
Description |
The |
Severity |
Major |
|---|---|
Summary |
Unclean Kafka broker was elected as cluster leader. |
Description |
A Kafka broker that has not finished the replication state has been
elected as leader in |
Severity |
Warning |
|---|---|
Summary |
Kafka cluster has underreplicated partitions. |
Description |
The topics in the |
This section lists the alerts for Redis.
Severity |
Major |
|---|---|
Summary |
Redis cluster is flapping. |
Description |
Changes have been detected in the |
Since 23.3 to replace RedisClusterTargetsOutage
Severity |
Major |
|---|---|
Summary |
Redis cluster Prometheus targets outage. |
Description |
Prometheus fails to scrape metrics from the
|
Replaced with RedisClusterTargetDown in 23.3
Severity |
Major |
|---|---|
Summary |
Redis cluster Prometheus targets outage. |
Description |
Prometheus fails to scrape metrics from 2/3 of the
|
Severity |
Warning |
|---|---|
Summary |
Redis has disconnected replicas. |
Description |
The |
Severity |
Critical |
|---|---|
Summary |
Redis Pod is down. |
Description |
The |
Severity |
Critical |
|---|---|
Summary |
Redis cluster has no primary node. |
Description |
The |
Severity |
Major |
|---|---|
Summary |
Redis has multiple primaries. |
Description |
The |
Severity |
Major |
|---|---|
Summary |
Redis cluster has rejected connections. |
Description |
Some connections to the |
Severity |
Major |
|---|---|
Summary |
Redis replication is broken. |
Description |
The |
This section lists alerts for the Tungsten Fabric Operator.
Available since MOSK 23.3
Severity |
Critical |
|---|---|
Summary |
Tungsten Fabric Operator Prometheus target is down. |
Description |
Prometheus fails to scrape metrics from the Tungsten Fabric Operator metrics service. |
This section lists the alerts for Tungsten Fabric.
Severity |
Critical |
|---|---|
Summary |
Tungsten Fabric API responds with HTTP 401. |
Description |
The Tungsten Fabric API responds with HTTP 401 for more than 5% of requests for the last 10 minutes. |
Severity |
Critical |
|---|---|
Summary |
Tungsten Fabric API responds with HTTP 5xx. |
Description |
The Tungsten Fabric API responds with HTTP 5xx for more than 1% of requests for the last 10 minutes. |
Severity |
Warning |
|---|---|
Summary |
Tungsten Fabric BGP sessions are down. |
Description |
|
Severity |
Warning |
|---|---|
Summary |
No active Tungsten Fabric BGP sessions. |
Description |
There are no active Tungsten Fabric BGP sessions on the
|
Severity |
Warning |
|---|---|
Summary |
No established Tungsten Fabric BGP sessions. |
Description |
There are no established Tungsten Fabric BGP sessions on the
|
Severity |
Warning |
|---|---|
Summary |
Tungsten Fabric Controller is down. |
Description |
The Tungsten Fabric Controller on the |
Severity |
Critical |
|---|---|
Summary |
All Tungsten Fabric Controllers are down. |
Description |
All Tungsten Fabric Controllers are down for 2 minutes. |
Severity |
Critical |
|---|---|
Summary |
Tungsten Fabric Controller Prometheus targets outage. |
Description |
Prometheus fails to scrape metrics from 2/3 of the Tungsten Fabric Controller exporter endpoints. |
Severity |
Warning |
|---|---|
Summary |
Tungsten Fabric vRouter is down. |
Description |
The Tungsten Fabric vRouter on the |
Severity |
Warning |
|---|---|
Summary |
Tungsten Fabric vRouter LLS sessions changes reached the limit of 5. |
Description |
The Tungsten Fabric vRouter LLS sessions on the |
Severity |
Warning |
|---|---|
Summary |
Tungsten Fabric vRouter LLS sessions reached the limit of 10. |
Description |
|
Severity |
Critical |
|---|---|
Summary |
Tungsten Fabric metadata is unavailable. |
Description |
The Tungsten Fabric metadata on the |
Severity |
Critical |
|---|---|
Summary |
All Tungsten Fabric vRouters are down. |
Description |
All Tungsten Fabric vRouters are down for 2 minutes. |
Severity |
Major |
|---|---|
Summary |
Tungsten Fabric vRouter Prometheus target is down. |
Description |
Prometheus fails to scrape metrics from the Tungsten Fabric vRouter
exporter endpoint on the |
Severity |
Critical |
|---|---|
Summary |
Tungsten Fabric vRouter Prometheus targets outage. |
Description |
Prometheus fails to scrape metrics from all Tungsten Fabric vRouter exporter endpoints. |
Severity |
Warning |
|---|---|
Summary |
Tungsten Fabric vRouter XMPP sessions changes reached the limit of 5. |
Description |
The Tungsten Fabric vRouter XMPP sessions on the |
Severity |
Warning |
|---|---|
Summary |
Tungsten Fabric vRouter XMPP sessions reached the limit of 10. |
Description |
|
Severity |
Warning |
|---|---|
Summary |
No Tungsten Fabric vRouter XMPP sessions. |
Description |
There are no Tungsten Fabric vRouter XMPP sessions on the
|
Severity |
Warning |
|---|---|
Summary |
Tungsten Fabric XMPP sessions changes reached the limit of 100. |
Description |
The Tungsten Fabric XMPP sessions on the |
Severity |
Warning |
|---|---|
Summary |
Tungsten Fabric XMPP sessions are down. |
Description |
|
Severity |
Warning |
|---|---|
Summary |
Missing Tungsten Fabric XMPP sessions. |
Description |
|
Severity |
Warning |
|---|---|
Summary |
Missing established Tungsten Fabric XMPP sessions. |
Description |
|
Severity |
Warning |
|---|---|
Summary |
Tungsten Fabric XMPP sessions reached the limit of 500. |
Description |
|
This section lists the alerts for ZooKeeper.
Since 23.3 to replace ZooKeeperClusterTargetsOutage
Severity |
Major |
|---|---|
Summary |
ZooKeeper cluster Prometheus targets outage. |
Description |
Prometheus fails to scrape metrics from the
|
Replaced with ZooKeeperClusterTargetDown in 23.3
Severity |
Major |
|---|---|
Summary |
ZooKeeper cluster Prometheus targets outage. |
Description |
Prometheus fails to scrape metrics from 2/3 of the
|
Severity |
Warning |
|---|---|
Summary |
ZooKeeper cluster has missing followers. |
Description |
The |
Severity |
Warning |
|---|---|
Summary |
ZooKeeper server request overload. |
Description |
The |
Severity |
Warning |
|---|---|
Summary |
ZooKeeper server is running out of file descriptors. |
Description |
The |
Severity |
Warning |
|---|---|
Summary |
ZooKeeper leader synchronization overload. |
Description |
The ZooKeeper leader in the |
StackLight
This section describes the alerts available for StackLight components.
This section describes the alerts for the Alertmanager service.
Available since MCC 2.25.0 (17.0.0 and 16.0.0)
Severity |
Major |
|---|---|
Summary |
Prometheus Alertmanager target down. |
Description |
Prometheus fails to scrape metrics from the {{ $labels.pod }} Pod on the {{ $labels.node }} node. |
Replaced with AlertmanagerTargetDown in MCC 2.25.0 (17.0.0 and 16.0.0)
Severity |
Major |
|---|---|
Summary |
Prometheus Alertmanager targets outage. |
Description |
Prometheus fails to scrape metrics from all Alertmanager endpoints (more than 1/10 failed scrapes). |
Severity |
Warning |
|---|---|
Summary |
Failure to reload Alertmanager configuration. |
Description |
Reloading the Alertmanager configuration has failed. |
Severity |
Major |
|---|---|
Summary |
Alertmanager cluster members cannot be found. |
Description |
Alertmanager has not found all other members of the cluster. |
Severity |
Warning |
|---|---|
Summary |
Alertmanager notifications fail. |
Description |
Alertmanager |
Severity |
Warning |
|---|---|
Summary |
Alertmanager alerts are invalid. |
Description |
An average of |
This section lists the alerts for the cAdvisor service. For troubleshooting guidelines, see Troubleshoot cAdvisor alerts.
Severity |
Major |
|---|---|
Summary |
cAdvisor Prometheus target is down. |
Description |
Prometheus fails to scrape metrics from the cAdvisor endpoint on the
|
Severity |
Critical |
|---|---|
Summary |
cAdvisor Prometheus targets outage. |
Description |
Prometheus fails to scrape metrics from all cAdvisor endpoints. |
Severity |
Warning |
|---|---|
Summary |
Containers CPU throttling. |
Description |
|
Severity |
Warning |
|---|---|
Summary |
Failure to get Kubernetes container metrics. |
Description |
cAdvisor was not able to scrape metrics from some containers on the
|
This section describes the alerts for the Elasticsearch Exporter service.
Severity |
Critical |
|---|---|
Summary |
Elasticsearch Exporter Prometheus target is down. |
Description |
Prometheus fails to scrape metrics from the Elasticsearch Exporter service. |
Severity |
Major |
|---|---|
Summary |
Prometheus Elasticsearch Exporter Prometheus target is down. |
Description |
Prometheus fails to scrape metrics from the Prometheus Elasticsearch Exporter service. |
This section describes the alerts for Fluentd-logs.
Severity |
Major |
|---|---|
Summary |
Fluentd Prometheus target is down. |
Description |
Prometheus fails to scrape metrics from the Fluentd pod on the
|
Severity |
Critical |
|---|---|
Summary |
Fluentd Prometheus targets outage. |
Description |
Prometheus fails to scrape metrics from all Fluentd pods. |
This section describes general StackLight alerts.
Severity |
None |
|---|---|
Summary |
Watchdog alert that is always firing. |
Description |
This alert ensures that the entire alerting pipeline is functional.
This alert should always be firing in Alertmanager against a receiver.
Some integrations with various notification mechanisms can send a
notification when this alert is not firing. For example, the
|
Severity |
Major |
|---|---|
Summary |
|
Description |
Prometheus fails to scrape metrics from all
|
This section describes the alerts for Grafana.
Severity |
Major |
|---|---|
Summary |
Grafana Prometheus target is down. |
Description |
Prometheus fails to scrape metrics from the
|
This section lists the alerts for monitoring of external endpoints.
Severity |
Critical |
|---|---|
Summary |
External endpoint is down. |
Description |
The |
Severity |
Critical |
|---|---|
Summary |
Failure to establish a TCP or TLS connection. |
Description |
The system cannot establish a TCP or TLS connection to
|
Severity |
Critical |
|---|---|
Summary |
|
Description |
Prometheus fails to probe the |
Severity |
Major |
|---|---|
Summary |
SSL certificate expires on |
Description |
The SSL certificate for |
Severity |
Critical |
|---|---|
Summary |
SSL certificate expires on |
Description |
The SSL certificate for |
Severity |
Critical |
|---|---|
Summary |
SSL certificate probes are failing. |
Description |
The SSL certificate probes for |
Severity |
Critical |
|---|---|
Summary |
|
Description |
Prometheus fails to probe the |
This section describes the alerts for the OpenSearch service.
See also
Severity |
Critical |
|---|---|
Summary |
OpenSearch heap usage is too high (>90%). |
Description |
The heap usage of the OpenSearch |
Severity |
Warning |
|---|---|
Summary |
OpenSearch heap usage is high (>80%). |
Description |
The heap usage of the OpenSearch |
Severity |
Critical |
|---|---|
Summary |
OpenSearch critical status. |
Description |
The OpenSearch |
Severity |
Warning |
|---|---|
Summary |
OpenSearch warning status. |
Description |
The OpenSearch |
Available since MCC 2.22.0 (Cluster release 11.6.0)
Severity |
Warning |
|---|---|
Summary |
OpenSearch PVC size mismatch |
Description |
The PVC size requested by OpenSearch StatefulSet does not match the configured PVC size. To troubleshoot the issue, refer to OpenSearchPVCMismatch alert raises due to the OpenSearch PVC size mismatch. |
Severity |
Warning |
|---|---|
Summary |
Shards relocation takes more than 20 minutes. |
Description |
The number of relocating shards in the OpenSearch cluster
|
Severity |
Warning |
|---|---|
Summary |
Shards initialization takes more than 10 minutes. |
Description |
The number of initializing shards in the OpenSearch cluster
|
Removed in MCC 2.27.0 (17.2.0 and 16.2.0)
Severity |
Major |
|---|---|
Summary |
Shards have unassigned status for 10 minutes. |
Description |
The number of unassigned shards in the OpenSearch cluster
|
Severity |
Warning |
|---|---|
Summary |
Tasks have pending state for 10 minutes. |
Description |
The number of pending tasks in the OpenSearch cluster
|
Available since MCC 2.26.0 (17.1.0 and 16.1.0)
Severity |
Critical |
|---|---|
Summary |
OpenSearch node reached 95% of storage usage |
Description |
Storage usage of |
Available since MCC 2.26.0 (17.1.0 and 16.1.0)
Severity |
Major |
|---|---|
Summary |
OpenSearch node reached 90% of storage usage |
Description |
Storage usage of |
This section lists the alerts for the PoststgreSQL and Patroni services.
Severity |
Critical |
|---|---|
Summary |
Patroni cluster member is experiencing data page corruption. |
Description |
The |
Severity |
Warning |
|---|---|
Summary |
PostgreSQL transactions deadlocks. |
Description |
The transactions submitted to the |
Severity |
Warning |
|---|---|
Summary |
Insufficient memory for PostgreSQL queries. |
Description |
The query data does not fit into working memory of the
|
Severity |
Critical |
|---|---|
Summary |
Patroni cluster split-brain detected. |
Description |
The |
Severity |
Major |
|---|---|
Summary |
Patroni cluster primary node is missing. |
Description |
The |
Severity |
Warning |
|---|---|
Summary |
Patroni cluster has replicas with inoperable PostgreSQL. |
Description |
The |
Severity |
Warning |
|---|---|
Summary |
Patroni cluster has non-streaming replicas. |
Description |
The |
Severity |
Major |
|---|---|
Summary |
Replication has stopped. |
Description |
Replication has stopped on the
|
Severity |
Warning |
|---|---|
Summary |
WAL segment application is slow. |
Description |
Slow replication while applying WAL segments on the
|
Severity |
Warning |
|---|---|
Summary |
Streaming replication is slow. |
Description |
Slow replication while downloading WAL segments for the
|
See also
Severity |
Major |
|---|---|
Summary |
Patroni cluster WAL segment writes are failing. |
Description |
The |
Replaced with PostgresqlTargetDown in MCC 2.25.0 (17.0.0 and 16.0.0)
Severity |
Critical |
|---|---|
Summary |
Patroni cluster Prometheus targets outage. |
Description |
Prometheus fails to scrape metrics from 2/3 of Patroni
|
Since MCC 2.25.0 (17.0.0 and 16.0.0) to replace PostgresqlTargetsOutage
Severity |
Critical |
|---|---|
Summary |
Patroni cluster Prometheus target down. |
Description |
Prometheus fails to scrape metrics from the
|
This section describes the alerts for the Prometheus service.
Severity |
Warning |
|---|---|
Summary |
Failure to reload the Prometheus configuration. |
Description |
Reloading of the Prometheus configuration has failed. |
Severity |
Warning |
|---|---|
Summary |
Prometheus alert notification queue is running full. |
Description |
The Prometheus alert notification queue is running full for the
|
Severity |
Warning |
|---|---|
Summary |
Errors while sending alerts from Prometheus. |
Description |
Errors while sending alerts from the
|
Severity |
Major |
|---|---|
Summary |
Errors while sending alerts from Prometheus. |
Description |
Errors while sending alerts from the
|
Severity |
Warning |
|---|---|
Summary |
Prometheus is not connected to any Alertmanager. |
Description |
The |
Severity |
Warning |
|---|---|
Summary |
Prometheus has issues reloading data blocks from disk. |
Description |
The |
Severity |
Warning |
|---|---|
Summary |
Prometheus has issues compacting sample blocks. |
Description |
The |
Severity |
Warning |
|---|---|
Summary |
Prometheus encountered WAL corruptions. |
Description |
The |
Severity |
Major |
|---|---|
Summary |
Prometheus does not ingest samples. |
Description |
The |
Severity |
Warning |
|---|---|
Summary |
Prometheus has many samples rejected. |
Description |
The |
Severity |
Warning |
|---|---|
Summary |
Prometheus failed to evaluate recording rules. |
Description |
The |
Since MCC 2.25.0 (17.0.0 and 16.0.0) to replace PrometheusServerTargetsOutage
Severity |
Critical |
|---|---|
Summary |
Prometheus server target down. |
Description |
Prometheus fails to scrape metrics from the
|
Replaced with PrometheusServerTargetDown in MCC 2.25.0 (17.0.0 and 16.0.0)
Severity |
Critical |
|---|---|
Summary |
Prometheus server targets outage. |
Description |
Prometheus fails to scrape metrics from all of its endpoints (more than 1/10 failed scrapes). |
This section lists the alerts for the Prometheus MS Teams service.
Severity |
Major |
|---|---|
Summary |
Prometheus MS Teams Prometheus target is down. |
Description |
Prometheus fails to scrape metrics from the
|
This section describes the alerts for the Prometheus Relay service.
Severity |
Major |
|---|---|
Summary |
Prometheus Relay Prometheus target is down. |
Description |
Prometheus fails to scrape metrics from the
|
This section lists the alerts for the ServiceNow receiver service.
Severity |
Major |
|---|---|
Summary |
|
Description |
The |
Severity |
Major |
|---|---|
Summary |
|
Description |
Prometheus fails to scrape metrics from the
|
This section lists the alerts for the Salesforce notifier service.
Severity |
Critical |
|---|---|
Summary |
Failure to authenticate to Salesforce. |
Description |
The |
Severity |
Critical |
|---|---|
Summary |
Salesforce notifier Prometheus target is down. |
Description |
Prometheus fails to scrape metrics from the
|
This section lists the alerts for the Telegraf service.
Removed in MCC 2.29.0 (17.4.0 and 16.4.0)
Note
TelegrafGatherErrors was replaced with
TelegrafDockerSwarmGatherErrors and TelegrafSMARTGatherErrors.
Severity |
Major |
|---|---|
Summary |
|
Description |
The |
Since MCC 2.29.0 (17.4.0 and 16.4.0)
Severity |
Major |
|---|---|
Summary |
Telegraf Docker Swarm failed to gather metrics. |
Description |
The Telegraf Docker Swarm Prometheus target contains gathering errors for the last 30 minutes. |
Severity |
Critical |
|---|---|
Summary |
Telegraf Docker Swarm Prometheus target is down. |
Description |
Prometheus fails to scrape metrics from the |
Removed in MOSK 24.1
Severity |
Critical |
|---|---|
Summary |
Telegraf OpenStack Prometheus target is down. |
Description |
Prometheus fails to scrape metrics from the Telegraf OpenStack service. |
Since MCC 2.29.0 (17.4.0 and 16.4.0)
Severity |
Major |
|---|---|
Summary |
Telegraf SMART failed to gather metrics. |
Description |
The Telegraf SMART Prometheus target contains gathering errors for the last 10 minutes. |
Severity |
Major |
|---|---|
Summary |
Telegraf SMART Prometheus target is down. |
Description |
Prometheus fails to scrape metrics from the Telegraf SMART endpoint on
the |
Severity |
Critical |
|---|---|
Summary |
Telegraf SMART Prometheus targets outage. |
Description |
Prometheus fails to scrape metrics from all Telegraf SMART endpoints. |
This section describes the alerts for the Telemeter service.
Severity |
Warning |
|---|---|
Summary |
Telemeter client failed to federate or send data. |
Description |
Telemeter client has failed to federate data from the Prometheus or send data to the Telemeter server more than four times for the last 10 minutes. |
Severity |
Warning |
|---|---|
Summary |
Telemeter client failed to federate or send data. |
Description |
Telemeter client has failed to federate data from the Prometheus or send data to the Telemeter server more than once for the last 10 minutes. |
Severity |
Major |
|---|---|
Summary |
Telemeter client Prometheus target is down. |
Description |
Prometheus fails to scrape metrics from the
|
Severity |
Major |
|---|---|
Summary |
Telemeter server Prometheus federation target is down. |
Description |
Prometheus fails to federate metrics from the
|
Severity |
Major |
|---|---|
Summary |
Telemeter server Prometheus target is down. |
Description |
Prometheus fails to scrape metrics from the
|
Ceph
This section describes the alerts for the Ceph cluster.
Severity |
Warning |
|---|---|
Summary |
Ceph cluster health is |
Description |
The Ceph cluster is in the |
Severity |
Critical |
|---|---|
Summary |
Ceph cluster health is |
Description |
The Ceph cluster is in the |
Severity |
Critical |
|---|---|
Summary |
Ceph cluster Prometheus target is down. |
Description |
Prometheus fails to scrape metrics from the
|
Available MCC 2.24.0 (Cluster release 14.0.0)
Severity |
Warning |
|---|---|
Summary |
|
Description |
|
Available MCC 2.24.0 (Cluster release 14.0.0)
Severity |
Warning |
|---|---|
Summary |
Ceph Monitor clock skew detected. |
Description |
Ceph Monitor clock drift exceeds configured threshold on the Ceph cluster. |
Severity |
Major |
|---|---|
Summary |
Ceph cluster quorum at risk. |
Description |
The Ceph Monitors quorum on the Ceph cluster is low. |
Removed in MCC 2.25.0 (Cluster releases 17.0.0 and 16.0.0)
Severity |
Critical |
|---|---|
Summary |
Ceph OSDs are down. |
Description |
|
Available MCC 2.24.0 (Cluster release 14.0.0)
Severity |
Warning |
|---|---|
Summary |
Ceph OSDs flap due to network issues. |
Description |
The Ceph OSD |
Severity |
Critical |
|---|---|
Summary |
Disk not responding. |
Description |
The |
Available MCC 2.24.0 (Cluster release 14.0.0)
Severity |
Critical |
|---|---|
Summary |
Cluster network slows down Ceph OSD heartbeats. |
Description |
Ceph OSD heartbeats on the cluster network (backend) of the cluster are slow. |
Available MCC 2.24.0 (Cluster release 14.0.0)
Severity |
Critical |
|---|---|
Summary |
Public network slows down Ceph OSD heartbeats. |
Description |
Ceph OSD heartbeats on the public network (front end) are running slow. |
Severity |
Warning |
|---|---|
Summary |
Ceph cluster is nearly full. |
Description |
The Ceph cluster utilization has crossed 85%. Expansion is required. |
Severity |
Critical |
|---|---|
Summary |
Ceph cluster is full. |
Description |
The Ceph cluster utilization has crossed 95% and needs immediate expansion. |
Severity |
Warning |
|---|---|
Summary |
Ceph OSDs have more than 200 PGs. |
Description |
Some Ceph OSDs contain more than 200 Placement Groups. This may have a negative impact on the cluster performance. For details, run ceph pg dump. |
Severity |
Critical |
|---|---|
Summary |
Ceph OSDs have more than 300 PGs. |
Description |
Some Ceph OSDs contain more than 300 Placement Groups. This may have a negative impact on the cluster performance. For details, run ceph pg dump. |
Severity |
Major |
|---|---|
Summary |
Ceph cluster has too many leader changes. |
Description |
The Ceph Monitor |
Since MCC 2.25.0 (17.0.0 and 16.0.0) to replace CephNodeDown
Severity |
Critical |
|---|---|
Summary |
Ceph node |
Description |
The Ceph OSD node |
“Renamed to CephOSDNodeDown in MCC 2.25.0 (17.0.0 and 16.0.0)
Severity |
Critical |
|---|---|
Summary |
Ceph node |
Description |
The Ceph node |
Severity |
Warning |
|---|---|
Summary |
Multiple versions of Ceph OSDs running. |
Description |
|
Severity |
Warning |
|---|---|
Summary |
Multiple versions of Ceph Monitors running. |
Description |
|
Severity |
Warning |
|---|---|
Summary |
Too many inconsistent Ceph PGs. |
Description |
The Ceph cluster detects inconsistencies in one or more replicas of an
object in |
Severity |
Warning |
|---|---|
Summary |
Too many undersized Ceph PGs. |
Description |
The Ceph cluster reports |
Bare metal
This section describes the alerts available for bare metal services.
Available since MCC 2.24.0 (14.0.0)
This section describes the alerts for bond interface issues.
Severity |
Critical |
|---|---|
Summary |
|
Description |
The |
Severity |
Warning |
|---|---|
Summary |
|
Description |
The |
Severity |
Critical |
|---|---|
Summary |
|
Description |
The |
Severity |
Major |
|---|---|
Summary |
|
Description |
The |
This section describes the alerts for Ironic bare metal. The alerted events include Ironic API availability and Ironic processes availability.
Removed in 2.24.0 (14.0.0) in favor of IronicBmApiOutage
Severity |
Major |
|---|---|
Summary |
Ironic metrics missing. |
Description |
Metrics retrieved from the Ironic Exporter are not available for 2 minutes. |
Severity |
Critical |
|---|---|
Summary |
Ironic API outage. |
Description |
The Ironic API is not accessible. |
Severity |
Critical |
|---|---|
Summary |
Ironic Prometheus target is down. |
Description |
Prometheus fails to scrape metrics from the Ironic service. |
This section describes the alerts for Ubuntu kernel.
Available since MCC 2.27.0 (Cluster releases 17.2.0 and 16.2.0)
Severity |
Critical |
|---|---|
Summary |
The |
Description |
The |
Available since MCC 2.28.0 (17.3.0 and 16.3.0) TechPreview
This section lists alerts for the host-os-modules-controller service,
including alerts for HostOSConfiguration and HostOSConfigurationModules
custom resources. For details about these resources, refer to API Reference:
HostOSConfiguration and HostOSConfigurationModules.
For troubleshooting guidelines, see Troubleshoot Host Operating System Modules Controller alerts.
Severity |
Critical |
|---|---|
Summary |
|
Description |
Prometheus fails to scrape metrics from the
|
Severity |
Informational |
|---|---|
Summary |
Configuration with deprecated module in use |
Description |
Deprecated module |
Generic
This section lists the generic alerts that apply to a number of Kubernetes or MOSK cluster components.
This section describes the alerts for Calico.
Severity |
Warning |
|---|---|
Summary |
Data plane updates fail. |
Description |
The Felix daemon on the |
Severity |
Warning |
|---|---|
Summary |
Interface address messages in a batch exceed 5. |
Description |
The Felix daemon on the |
Severity |
Warning |
|---|---|
Summary |
Interface state messages in a batch exceed 5. |
Description |
The Felix daemon on the |
Severity |
Warning |
|---|---|
Summary |
ipset commands fail. |
Description |
The Felix daemon on the |
Severity |
Warning |
|---|---|
Summary |
iptables-save fails. |
Description |
The Felix daemon on the |
Severity |
Warning |
|---|---|
Summary |
iptables-restore fails. |
Description |
The Felix daemon on the |
Severity |
Major |
|---|---|
Summary |
Calico Prometheus target is down. |
Description |
Prometheus fails to scrape metrics from the Calico pod on the
|
Severity |
Critical |
|---|---|
Summary |
Calico Prometheus targets outage. |
Description |
Prometheus fails to scrape metrics from all Calico pods. |
This section describes the alerts for the etcd service.
Available since MCC 2.21.0 (11.5.0 and 7.11.0)
Severity |
Critical |
|---|---|
Summary |
Etcd database passed 95% of quota. |
Description |
The |
Available since MCC 2.21.0 (11.5.0 and 7.11.0)
Severity |
Major |
|---|---|
Summary |
Etcd database passed 85% of quota. |
Description |
The |
Severity |
Critical |
|---|---|
Summary |
Etcd cluster has insufficient members. |
Description |
The |
Severity |
Critical |
|---|---|
Summary |
Etcd cluster has no leader. |
Description |
The |
Severity |
Warning |
|---|---|
Summary |
Etcd cluster has detected more than 3 leader changes within the last hour. |
Description |
The |
Severity |
Warning |
|---|---|
Summary |
Etcd cluster has more than 5 proposal failures. |
Description |
The |
Since MCC 2.25.0 (17.0.0 and 16.0.0) to replace etcdTargetsOutage
Severity |
Critical |
|---|---|
Summary |
Etcd cluster Prometheus target down. |
Description |
Prometheus fails to scrape metrics from the etcd
|
Replaced with etcdTargetDown in MCC 2.25.0 (17.0.0 and 16.0.0)
Severity |
Critical |
|---|---|
Summary |
Etcd cluster Prometheus targets outage. |
Description |
Prometheus fails to scrape metrics from 2/3 of etcd nodes (more than 1/10 failed scrapes). |
Kubernetes
This section describes the alerts available for Kubernetes services.
This section lists the alerts for Kubernetes applications.
For troubleshooting guidelines, see Troubleshoot Kubernetes applications alerts.
Severity |
Warning |
|---|---|
Summary |
Pod of |
Description |
At least one Pod container of
|
Removed in MCC 2.25.0 (17.0.0 and 16.0.0)
Severity |
Warning |
|---|---|
Summary |
Pods of |
Description |
|
Severity |
Warning |
|---|---|
Summary |
|
Description |
The Pod of |
Severity |
Major |
|---|---|
Summary |
Deployment |
Description |
The |
Severity |
Major |
|---|---|
Summary |
Deployment |
Description |
The |
Severity |
Critical |
|---|---|
Summary |
Deployment |
Description |
The |
Severity |
Major |
|---|---|
Summary |
StatefulSet |
Description |
The |
Severity |
Major |
|---|---|
Summary |
StatefulSet |
Description |
The |
Severity |
Critical |
|---|---|
Summary |
StatefulSet |
Description |
The |
Severity |
Major |
|---|---|
Summary |
StatefulSet |
Description |
The |
Severity |
Major |
|---|---|
Summary |
DaemonSet |
Description |
|
Severity |
Warning |
|---|---|
Summary |
DaemonSet |
Description |
|
Removed in 2.27.0 (17.2.0 and 16.2.0)
Severity |
Warning |
|---|---|
Summary |
DaemonSet |
Description |
|
Severity |
Critical |
|---|---|
Summary |
DaemonSet |
Description |
All Pods of the |
Severity |
Warning |
|---|---|
Summary |
CronJob |
Description |
The |
Severity |
Warning |
|---|---|
Summary |
Job |
Description |
|
This section lists the alerts for Kubernetes resources.
For troubleshooting guidelines, see Troubleshoot Kubernetes resources alerts.
Severity |
Warning |
|---|---|
Summary |
Kubernetes has overcommitted CPU requests. |
Description |
The Kubernetes cluster has overcommitted CPU resource requests for Pods and cannot tolerate node failure. |
Severity |
Warning |
|---|---|
Summary |
Kubernetes has overcommitted memory requests. |
Description |
The Kubernetes cluster has overcommitted memory resource requests for Pods and cannot tolerate node failure. |
This section lists the alerts for Kubernetes storage.
For troubleshooting guidelines, see Troubleshoot Kubernetes storage alerts.
Caution
Due to the upstream bug in Kubernetes,
metrics for the KubePersistentVolumeUsageCritical and
KubePersistentVolumeFullInFourDays alerts that are collected for
persistent volumes provisioned by cinder-csi-plugin are not available.
Severity |
Critical |
|---|---|
Summary |
PersistentVolume |
Description |
The PersistentVolume claimed by |
Severity |
Warning |
|---|---|
Summary |
PersistentVolume |
Description |
The PersistentVolume claimed by |
Severity |
Critical |
|---|---|
Summary |
PersistentVolume |
Description |
The PersistentVolume |
This section lists the alerts for the Kubernetes system.
For troubleshooting guidelines, see Troubleshoot Kubernetes system alerts.
Severity |
Critical |
|---|---|
Summary |
Kubernetes API certificate expires on |
Description |
The SSL certificate for Kubernetes API expires on |
Severity |
Major |
|---|---|
Summary |
Kubernetes API certificate expires on |
Description |
The SSL certificate for Kubernetes API expires on |
Severity |
Critical |
|---|---|
Summary |
A Kubernetes API endpoint is down. |
Description |
The |
Severity |
Major |
|---|---|
Summary |
API server is returning errors for more than 3% of requests. |
Description |
The |
Severity |
Warning |
|---|---|
Summary |
API server is returning errors for more than 1% of requests. |
Description |
The API server is returning errors for |
Severity |
Critical |
|---|---|
Summary |
Kubernetes API is down. |
Description |
The Kubernetes API is not accessible for the last 30 seconds. |
Severity |
Major |
|---|---|
Summary |
API server is returning errors for 10% of requests. |
Description |
The |
Severity |
Warning |
|---|---|
Summary |
API server is returning errors for 5% of requests. |
Description |
The |
Removed in MCC 2.28.0 (17.3.0 and 16.3.0)
Severity |
Critical |
|---|---|
Summary |
Client certificate expires in 24 hours. |
Description |
The client certificate used to authenticate to the API server expires in less than 24 hours. |
Removed in MCC 2.28.0 (17.3.0 and 16.3.0)
Severity |
Major |
|---|---|
Summary |
Client certificate expires in 7 days. |
Description |
The client certificate used to authenticate to the API server expires in less than 7 days. |
Severity |
Warning |
|---|---|
Summary |
Kubernetes API client has more than 1% of error requests. |
Description |
The |
Removed in MCC 2.25.0 (17.0.0 and 16.0.0)
Severity |
Critical |
|---|---|
Summary |
CoreDNS Prometheus targets outage. |
Description |
Prometheus fails to scrape metrics from all CoreDNS endpoints (more than 1/10 failed scrapes). |
Severity |
Critical |
|---|---|
Summary |
Kubelet Prometheus target is down. |
Description |
Prometheus fails to scrape metrics from kubelet on the
|
Severity |
Critical |
|---|---|
Summary |
Kubelet Prometheus targets outage. |
Description |
Prometheus fails to scrape metrics from kubelet on all nodes (more than 1/10 failed scrapes). |
Severity |
Warning |
|---|---|
Summary |
kubelet reached 90% of Pods limit. |
Description |
The kubelet container on the |
Severity |
Warning |
|---|---|
Summary |
Node |
Description |
The |
Severity |
Critical |
|---|---|
Summary |
Kubernetes API server Prometheus targets outage. |
Description |
Prometheus fails to scrape metrics from 2/3 of Kubernetes API server endpoints. |
Severity |
Critical |
|---|---|
Summary |
Kubernetes master API Prometheus targets outage. |
Description |
Prometheus fails to scrape metrics from 2/3 of Kubernetes master API nodes. |
Severity |
Critical |
|---|---|
Summary |
|
Description |
Prometheus fails to scrape metrics from the |
Severity |
Warning |
|---|---|
Summary |
Kubernetes components version mismatch. |
Description |
There are |
Keycloak
This section describes the alerts available for Keycloak services.
Severity |
Critical |
|---|---|
Summary |
Blackbox probe for Keycloak service endpoint is failing. |
Description |
Blackbox probe failed at least 3 times for the Keycloak
|
Severity |
Critical |
|---|---|
Summary |
Blackbox probe for Keycloak service is failing. |
Description |
Blackbox probe failed at least 3 times for the Keycloak
|
Severity |
Major |
|---|---|
Summary |
Keycloak is returning client (4xx) errors for more than 8% of HTTP requests. |
Description |
Keycloak is returning client (4xx) errors for |
Severity |
Warning |
|---|---|
Summary |
Keycloak is returning client (4xx) errors for more than 5% of HTTP requests. |
Description |
Keycloak is returning client (4xx) errors for |
Severity |
Major |
|---|---|
Summary |
Keycloak is returning server (5xx) errors for more than 3% of HTTP requests. |
Description |
Keycloak is returning server (5xx) errors for |
Severity |
Warning |
|---|---|
Summary |
Keycloak is returning server (5xx) errors for HTTP requests. |
Description |
At least one HTTP request to Keycloak resulted in a server (5xx) error. |
Severity |
Major |
|---|---|
Summary |
Keycloak is returning login errors for more than 3% of requests. |
Description |
Keycloak is returning login errors for |
Severity |
Warning |
|---|---|
Summary |
Keycloak is returning login errors for more than 1% of requests. |
Description |
Keycloak is returning login errors for |
Severity |
Critical |
|---|---|
Summary |
SSL certificate for Keycloak service expires on |
Description |
The SSL certificate for the Keycloak |
Severity |
Major |
|---|---|
Summary |
SSL certificate for Keycloak service expires on |
Description |
The SSL certificate for the Keycloak |
Severity |
Major |
|---|---|
Summary |
Prometheus Keycloak target is down. |
Description |
Prometheus fails to scrape metrics from the |
Mirantis Container Cloud
This section describes the alerts available for Mirantis Container Cloud services.
This section lists the alerts for the Helm Controller service
and the HelmBundle custom resources.
For troubleshooting guidelines, see Troubleshoot Helm Controller alerts.
Severity |
Critical |
|---|---|
Summary |
HelmBundle release is not deployed. |
Description |
The |
Severity |
Critical |
|---|---|
Summary |
Helm Controller reconciliation is down. |
Description |
Reconciliation fails in the |
Severity |
Critical |
|---|---|
Summary |
Helm Controller Prometheus target is down |
Description |
Prometheus fails to scrape metrics from the
|
This section describes the alerts for Mirantis Container Cloud. These alerts are based on metrics from the Mirantis Container Cloud Metric Exporter (MCC Exporter) service.
For troubleshooting guidelines, see Troubleshoot Mirantis Container Cloud Exporter alerts.
Available since MCC 2.29.0 (17.4.0 and 16.4.0) TechPreview
Severity |
Warning |
|---|---|
Summary |
The Container Cloud cluster update is auto-paused |
Description |
The |
:bdg-success::Available since MCC 2.28.0 (17.3.0 and 16.3.0) TechPreview
Note
Before Container Cloud 2.29.2 (Cluster releases 17.3.7, 16.4.2, and
16.3.7), this alert was named ClusterUpdateInProggress, which
contained a typo.
Severity |
Informational |
|---|---|
Summary |
The Container Cloud cluster is updating |
Description |
The |
Available since MCC 2.29.0 (17.4.0 and 16.4.0) TechPreview
Severity |
Warning |
|---|---|
Summary |
Step |
Description |
Step |
Available since MCC 2.28.0 (17.3.0 and 16.3.0) TechPreview
Note
Before Container Cloud 2.29.2 (Cluster releases 17.3.7, 16.4.2, and
16.3.7), this alert was named ClusterUpdateStepInProggress, which
contained a typo.
Severity |
Informational |
|---|---|
Summary |
Step |
Description |
Step |
Available since MCC 2.28.0 (17.3.0 and 16.3.0) TechPreview
Severity |
Critical |
|---|---|
Summary |
Step |
Description |
Step |
Available since MCC 2.28.0 (17.3.0 and 16.3.0) TechPreview
Severity |
Critical |
|---|---|
Summary |
The Container Cloud cluster update is stuck |
Description |
The |
Available since MCC 2.28.0 (17.3.0 and 16.3.0)
Severity |
Major |
|---|---|
Summary |
LCM of the Container Cloud cluster is unhealthy. |
Description |
Some LCM operations have issues on the
|
Severity |
Informational |
|---|---|
Summary |
The Container Cloud cluster is updating. |
Description |
The |
Severity |
Critical |
|---|---|
Summary |
MCC Exporter Prometheus target is down. |
Description |
Prometheus fails to scrape metrics from the MCC Exporter service. |
Severity |
Critical |
|---|---|
Summary |
Mirantis Container Cloud license expires on |
Description |
The Mirantis Container Cloud license expires on |
Severity |
Warning |
|---|---|
Summary |
Mirantis Container Cloud license expires on |
Description |
The Mirantis Container Cloud license expires on |
Available since MCC 2.28.0 (17.3.0 and 16.3.0)
Severity |
Warning |
|---|---|
Summary |
Container Cloud update is blocked |
Description |
The Container Cloud update from |
Available since MCC 2.28.0 (17.3.0 and 16.3.0)
Severity |
Informational |
|---|---|
Summary |
Container Cloud update is scheduled |
Description |
The Container Cloud update from |
This section describes the alerts for the mcc-cache service.
Severity |
Major |
|---|---|
Summary |
|
Description |
Prometheus fails to scrape metrics from the
|
Available since MCC 2.23.0 (Cluster release 11.7.0)
This section describes the alerts for the mcc-controllers service.
Severity |
Critical |
|---|---|
Summary |
|
Description |
Prometheus fails to scrape metrics from the
|
Available since MCC 2.23.0 (Cluster release 11.7.0)
This section describes the alerts for the mcc-providers service.
Severity |
Critical |
|---|---|
Summary |
|
Description |
Prometheus fails to scrape metrics from the
|
This section describes the alerts available for SSL services and certificates in Mirantis Container Cloud.
Severity |
Critical |
|---|---|
Summary |
SSL certificate for a Mirantis Container Cloud service expires on
|
Description |
The SSL certificate for the Mirantis Container Cloud
|
Severity |
Major |
|---|---|
Summary |
SSL certificate for a Mirantis Container Cloud service expires in less than 30 days. |
Description |
The SSL certificate for the Mirantis Container Cloud
|
Severity |
Major |
|---|---|
Summary |
Mirantis Container Cloud |
Description |
Prometheus fails to probe 2/3 of the Mirantis Container Cloud
|
Severity |
Critical |
|---|---|
Summary |
SSL certificate probes for a Mirantis Container Cloud service are failing. |
Description |
SSL certificate probes for the Mirantis Container Cloud
|
Severity |
Critical |
|---|---|
Summary |
Mirantis Container Cloud |
Description |
Prometheus fails to probe the Mirantis Container Cloud
|
This section describes the alerts for the Mirantis Container Cloud Release Controller service.
For troubleshooting guidelines, see Troubleshoot Release Controller alerts.
Severity |
Critical |
|---|---|
Summary |
Release Controller deployment is missing or has 0 replicas. |
Description |
The Release Controller deployment is not present or scaled down to 0 replicas. |
Mirantis Kubernetes Engine
This section describes the alerts for the Mirantis Kubernetes Engine (MKE) cluster, including the Docker Swarm service.
For troubleshooting guidelines, see Troubleshoot Mirantis Kubernetes Engine alerts.
Severity |
Warning |
|---|---|
Summary |
Docker Swarm network unhealthy. |
Description |
The Note For the |
Replaced with MKENodeFlapping in MCC 2.29.0 (Cluster releases 17.4.0 and 16.4.0)
Severity |
Major |
|---|---|
Summary |
Docker Swarm node is flapping. |
Description |
The |
Severity |
Major |
|---|---|
Summary |
Docker Swarm replica is down. |
Description |
The |
Severity |
Major |
|---|---|
Summary |
Docker Swarm service is flapping. |
Description |
The |
Severity |
Critical |
|---|---|
Summary |
Docker Swarm service outage. |
Description |
All |
Severity |
Critical |
|---|---|
Summary |
MKE API certificate expires on |
Description |
The SSL certificate for MKE API expires on |
Severity |
Major |
|---|---|
Summary |
MKE API certificate expires on |
Description |
The SSL certificate for MKE API expires on |
Severity |
Critical |
|---|---|
Summary |
MKE API endpoint is down. |
Description |
The MKE API endpoint on the |
Severity |
Critical |
|---|---|
Summary |
MKE API is down. |
Description |
The MKE API (port 443) is not accessible for the last 1 minute. |
Severity |
Major |
|---|---|
Summary |
MKE containers are |
Description |
|
Severity |
Critical |
|---|---|
Summary |
MKE manager API cluster Prometheus targets outage. |
Description |
Prometheus fails to scrape metrics from 2/3 of MKE manager API nodes. |
Severity |
Critical |
|---|---|
Summary |
MKE metrics controller Prometheus targets outage. |
Description |
Prometheus fails to scrape metrics from all MKE metrics controller endpoints. |
Severity |
Major |
|---|---|
Summary |
MKE metrics engine Prometheus target is down. |
Description |
Prometheus fails to scrape metrics from the MKE metrics engine on the
|
Severity |
Critical |
|---|---|
Summary |
MKE metrics engine Prometheus targets outage. |
Description |
Prometheus fails to scrape metrics from the MKE metrics engine on all nodes. |
Severity |
Critical |
|---|---|
Summary |
MKE node disk is 95% full. |
Description |
The |
Severity |
Warning |
|---|---|
Summary |
MKE node disk is 85% full. |
Description |
The |
Available since MCC 2.29.0 (17.4.0 and 16.4.0)
Severity |
Major |
|---|---|
Summary |
MKE node is flapping. |
Description |
The |
Severity |
Critical |
|---|---|
Summary |
MKE node is down. |
Description |
The |
Node
This section describes the alerts for node state in terms of operating system and resource consumption.
This section lists the general alerts for Kubernetes nodes.
Severity |
Major |
|---|---|
Summary |
Node uses 90% of file descriptors. |
Description |
The |
Severity |
Warning |
|---|---|
Summary |
Node uses 80% of file descriptors. |
Description |
The |
Severity |
Critical |
|---|---|
Summary |
|
Description |
The |
Available since MCC 2.30.0 (21.0.0 and 20.0.0)
Severity |
Warning |
|---|---|
Summary |
Node Exporter failure detected for |
Description |
The |
Severity |
Critical |
|---|---|
Summary |
Node Exporter Prometheus target is down. |
Description |
Prometheus fails to scrape metrics from the Node Exporter endpoint on
the |
Severity |
Critical |
|---|---|
Summary |
Node Exporter Prometheus targets outage. |
Description |
Prometheus fails to scrape metrics from all Node Exporter endpoints. |
Severity |
Warning |
|---|---|
Summary |
High CPU consumption. |
Description |
The average CPU consumption on the |
Severity |
Warning |
|---|---|
Summary |
System load is more than 1 per CPU. |
Description |
The system load per CPU on the |
Severity |
Critical |
|---|---|
Summary |
System load is more than 2 per CPU. |
Description |
The system load per CPU on the |
Severity |
Warning |
|---|---|
Summary |
Disk partition |
Description |
The |
Severity |
Major |
|---|---|
Summary |
Disk partition |
Description |
The |
Severity |
Warning |
|---|---|
Summary |
|
Description |
The |
Severity |
Major |
|---|---|
Summary |
|
Description |
The |
Severity |
Warning |
|---|---|
Summary |
85% of inodes for |
Description |
The |
Severity |
Major |
|---|---|
Summary |
95% of inodes for |
Description |
The |
Available since MCC 2.30.0 (21.0.0 and 20.0.0)
Severity |
Critical |
|---|---|
Summary |
System with vulnerable AMD CPU (Erratum 1474) exceeds uptime of 1000 days. |
Description |
Node |
Available since MCC 2.30.0 (21.0.0 and 20.0.0)
Severity |
Warning |
|---|---|
Summary |
System with vulnerable AMD CPU (Erratum 1474) exceeds uptime of 800 days. |
Description |
Node |
This section lists the alerts for a Kubernetes node network.
Severity |
Critical |
|---|---|
Summary |
|
Description |
The |
Severity |
Critical |
|---|---|
Summary |
|
Description |
The |
Severity |
Major |
|---|---|
Summary |
60 received packets were dropped. |
Description |
|
Severity |
Major |
|---|---|
Summary |
100 transmitted packets were dropped. |
Description |
|
Severity |
Warning |
|---|---|
Summary |
|
Description |
The |
This section lists the alerts for a Kubernetes node time.
Severity |
Warning |
|---|---|
Summary |
NTP offset reached the limit of 0.03 seconds. |
Description |
Clock skew was detected on the |
Cross-node connectivity
Available since MCC 2.30.0 (21.0.0 and 20.0.0)
This section describes the alerts available for monitoring cross-node connectivity.
Severity |
Major |
|---|---|
Summary |
Prometheus target |
Description |
Prometheus failed to scrape metrics from the |
Severity |
Critical |
|---|---|
Summary |
Node |
Description |
All cross-node connectivity checks from all nodes to the
|
See also
Alert dependencies
Using alert inhibition rules, Alertmanager decreases alert noise by suppressing dependent alerts notifications to provide a clearer view on the cloud status and simplify troubleshooting. Alert inhibition rules are enabled by default.
The following tables describe the dependencies between the OpenStack-related and MOSK cluster alerts.
Once an alert from the Alert column raises, the alert from the Inhibits and rules column will be suppressed with the Inhibited status in the Alertmanager web UI.
The Inhibits and rules column lists the labels and conditions, if any, for the inhibition to apply.
Alert inhibition rules for OpenStack clusters
Alert |
Inhibits and rules |
|---|---|
|
|
|
|
|
|
|
And other alerts described in Alert inhibition rules for MOSK clusters. |
|
And other alerts described in Alert inhibition rules for MOSK clusters. |
|
And other alerts described in Alert inhibition rules for MOSK clusters. |
|
|
|
|
|
|
|
|
|
|
|
|
|
|
|
|
|
|
|
|
|
|
Alert inhibition rules for MOSK clusters
Alert |
Inhibits and rules |
|---|---|
|
|
|
|
|
|
|
|
|
|
|
|
|
With the same
|
|
|
|
|
|
|
|
|
|
|
|
|
|
|
|
|
|
|
KeycloakBlackboxServiceProbeFailingSince MCC 2.30.0 (21.0.0 and 20.0.0)
|
|
KeycloakHttpErrors4xxHighMajorSince MCC 2.30.0 (21.0.0 and 20.0.0)
|
|
KeycloakHttpErrors5xxHighMajorSince MCC 2.30.0 (21.0.0 and 20.0.0)
|
|
KeycloakLoginErrorsHighMajorSince MCC 2.30.0 (21.0.0 and 20.0.0)
|
|
KeycloakSSLCertExpirationHighSince MCC 2.30.0 (21.0.0 and 20.0.0)
|
|
|
|
|
|
|
|
|
|
|
|
|
|
|
|
|
|
|
|
|
With the same
|
|
|
|
|
|
|
|
|
|
|
|
|
|
|
|
|
|
|
|
|
|
|
|
|
|
|
OpenSearchClusterStatusWarningSince MCC 2.26.0 (17.1.0 and 16.1.0)
|
OpenSearchNumberOfUnassignedShards with the same cluster labelRemoved in MCC 2.27.0 (17.2.0 and 16.2.0)
|
|
|
OpenSearchStorageUsageCriticalSince MCC 2.26.0 (17.1.0 and 16.1.0)
|
|
OpenSearchStorageUsageMajorSince MCC 2.26.0 (17.1.0 and 16.1.0)
|
|
|
With the same
|
|
|
|
|
|
|
|
|
|
|
|
|
|
|
SystemUptimeCriticalSince MCC 2.30.0 (21.0.0 and 20.0.0)
|
|
|
|
|
|
Silence alerts
Due to the Alertmanager issue, silences with
regexp matchers do not mute all notifications for all alerts matched by the
specified regular expression.
If you need to mute multiple alerts, for example, for maintenance or before
cluster update, Mirantis recommends using a set of fixed-matcher silences
instead. As an example, this section describes how to silence all alerts for a
specified period through the Alertmanager web UI or CLI without using the
regexp matchers. You can also manually force silence expiration before the
specified period ends.
To silence all alerts:
Silence alerts through the Alertmanager web UI:
Log in to the Alertmanager web UI as described in Getting access.
Click New Silence.
Create four Prometheus Alertmanager silences. In Matchers, set Name to severity and Value to warning, minor, major, and critical, one for each silence.
Note
To silence the
Watchdogalert, create an additional silence with severity set in Name and informational set in Value.
Silence alerts through CLI:
Log in to the host where your management cluster
kubeconfigis located and wherekubectlis installed.Run the following command setting the required
duration:kubectl exec -it -n stacklight prometheus-alertmanager-1 prometheus-alertmanager -- sh -c 'rm -f /tmp/all_silences; \ touch /tmp/all_silences; \ for severity in warning minor major critical; do \ echo $severity; \ amtool silence add severity=${severity} \ --alertmanager.url=<http://prometheus-alertmanager> \ --comment="silence them all" \ --duration="2h" | tee /tmp/all_silences; \ done'
Note
To silence the
Watchdogalert, addinformationalto the list of severities.
To expire alert silences:
To expire alert silences through the Alertmanager web UI, click Expire next to each silence.
To expire alert silences through CLI, run the following command:
kubectl exec -it -n stacklight prometheus-alertmanager-1 prometheus-alertmanager -- sh -c 'for silence in $(cat /tmp/all_silences); do \ echo $severity; \ amtool silence expire $silence \ --alertmanager.url=<http://prometheus-alertmanager;> \ done'
StackLight rules for Kubernetes network policies
Available since Cluster releases 17.0.1 and 16.0.1
The Kubernetes NetworkPolicy resource allows controlling network connections to and from Pods within a cluster. This enhances security by restricting communication from compromised Pod applications and provides transparency into how applications communicate with each other.
Network Policies are enabled by default in StackLight using the
networkPolicies parameter. For configuration details, see
Kubernetes network policies.
The following table contains general network policy rules applied to StackLight components:
Network policy rule |
Component |
|---|---|
Deny all ingress for Pods not expecting incoming traffic (including Prometheus scrape) |
|
Deny all egress for Pods not expecting outgoing traffic |
|
Allow all ingress for Pods that can be exposed through load balancers |
|
Allow all egress for Pods connecting to outside world or external APIs (Kubernetes, Docker, Keycloak, OpenStack) |
|
Allow DNS traffic from all Pods specifying communication endpoints of other StackLight workloads. |
|
The following exceptions apply to the StackLight network policy rules:
Because Prometheus Node Exporter uses the host network, the allow-all rule applies to both ingress and egress that is the no-op placeholder.
Due to dynamically created scrape configurations, the allow-all rule applies to egress for Prometheus Server.
Calculate the storage retention time
Obsolete since MCC 2.26.0 (17.1.0, 16.1.0) for OpenSearch
Caution
In Container Cloud 2.26.0 (Cluster releases 17.1.0 and 16.1.0), the storage-based log retention together with the updated proportion of available disk space replaces the estimated storage retention management in OpenSearch. For details, see Storage-based log retention strategy.
The logging.retentionTime parameter is removed from the StackLight
configuration. While the Estimated Retention panel of the
OpenSearch dashboard in Grafana can provide some information,
it does not provide any guarantees. The panel is removed in Container Cloud
2.26.1 (Cluster releases 17.1.1 and 16.1.1). Therefore, consider this section
as obsolete for OpenSearch.
Using the following panels in the OpenSearch and Prometheus dashboards, you can view details about the storage usage on managed clusters. These details allow you to calculate the possible retention time based on provisioned storage and its average usage:
OpenSearch dashboard:
Shards > Estimated Retention
Resources > Disk
Resources > File System Used Space by Percentage
Resources > Stored Indices Disk Usage
Resources > Age of Logs
Prometheus dashboard:
General > Estimated Retention
Resources > Storage
Resources > Storage by Percentage
To calculate the storage retention time:
Log in to the Grafana web UI. For details, see Getting access.
Assess the OpenSearch and Prometheus dashboards. For details on Grafana dashboards, see View Grafana dashboards.
On each dashboard, select the required period for calculation.
Tip
Mirantis recommends analyzing at least one day of data collected in the respective component to benefit from results presented on the Estimated Retention panels.
Assess the Cluster > Estimated Retention panel of each dashboard.
The panel displays maximum possible retention days while other panels provide details on utilized and available storage.
If persistent volumes of some StackLight components share storage, partition the storage logically to separate components before estimating the retention threshold. This is required since the Estimated Retention panel uses the entire provisioned storage as the calculation base.
For example, if StackLight is deployed in the default HA mode, then it uses Local Volume Provisioner that provides shared storage unless two separate partitions are configured for each cluster node for exclusive use of Prometheus and OpenSearch.
Two main storage provisioners are OpenSearch and Prometheus. The level of storage usage by other StackLight components is relatively low. For example, you can share storage logically as follows:
35% for Prometheus
35% for OpenSearch
30% for other components
In this case, take 35% of the calculated maximum retention value and set it as threshold.
In the Prometheus dashboard, navigate to Resources (Row) > Storage (Panel) > total provisioned disk per pod (Metric) to verify the retention size for the Prometheus storage.
If both retention time and size are set, Prometheus applies retention to the first reached threshold.
Caution
Mirantis does not recommend setting the retention size to
0and replying on the retention time only.
You can change the retention settings through either the web UI or API:
Using the Container Cloud web UI, navigate to the Configure cluster menu and use the StackLight tab
Using the Container Cloud API:
For OpenSearch, use the
logging.retentionTimeparameterFor Prometheus, use the
prometheusServer.retentionTimeandprometheusServer.retentionSizeparameters
For details, see Change a cluster configuration and Configure StackLight.
Tune StackLight for long-term log retention
Available since MCC 2.24.0 (Cluster release 14.0.0)
If you plan to switch to a long log retention period (months), tune StackLight
by increasing the cluster.max_shards_per_node limit. This configuration
enables OpenSearch to successfully accept new logs and prevents the
maximum open shards error.
To tune StackLight for long-term log retention:
Increase the
cluster.max_shards_per_nodelimit:logging: extraConfig: cluster.max_shards_per_node: 10000
If you increase the limit to more than double the default value, increase the memory and CPU limit for
opensearchto preventMaxHeapUsagewarnings.For example, if you set
cluster.max_shards_per_node: 20000, configure theresources:opensearch:limitssection as follows:resources: opensearch: limits: cpu: "8" memory: "45Gi"
Enable log forwarding to external destinations
Available since MCC 2.23.0 (Cluster release 11.7.0)
By default, StackLight sends logs to OpenSearch. However, you can
configure StackLight to add external Elasticsearch, OpenSearch, and syslog
destinations as the fluentd-logs output. In this case, StackLight will
send logs both to an external server(s) and OpenSearch.
Since Container Cloud 2.25.0 (Cluster releases 17.0.0 and 16.0.0), you can also enable sending of Container Cloud service logs to Splunk using the syslog external output configuration. The feature is available in the Technology Preview scope.
Warning
Sending logs to Splunk implies that the target Splunk instance is available from the MOSK cluster. If proxy is enabled, the feature is not supported.
Prior to enabling the functionality, complete the following prerequisites:
Enable StackLight logging
Deploy an external server outside MOSK
Make sure that Container Cloud proxy is not enabled since it only supports the HTTP(S) traffic
For Splunk, configure the server to accept logs:
Create an index and set its type to
EventConfigure data input:
Open the required port
Configure the required protocol (TCP/UDP)
Configure connection to the created index
To enable log forwarding to external destinations:
Perform the steps 1-2 described in StackLight configuration procedure.
In the
stacklight.valuessection of the opened manifest, configure thelogging.externalOutputsparameters using the following table.Key
Description
Example values
disabled(bool)Optional. Disables the output destination using
disabled: true. If not set, defaults todisabled: false.trueorfalsetype(string)Required. Specifies the type of log destination. The following values are accepted:
elasticsearch,opensearch,remote_syslog, andopensearch_data_stream(since Container Cloud 2.26.0, Cluster releases 17.1.0 and 16.1.0).remote_sysloglevel(string)Removed in MCC 2.26.0 (17.1.0, 16.1.0)Optional. Sets the least important level of log messages to send. For example, values that are defined using the
severity_labelfield, see thelogging.leveldescription in Logging.warningplugin_log_level(string)Optional. Defaults to
info. Sets the value of@log_levelof the output plugin for a particular backend. For other available values, refer to thelogging.leveldescription in Logging.noticetag_exclude(string)Optional. Overrides
tag_include. Sets logs by tags to exclude from the destination output. For example, to exclude all logs with thetesttag, settag_exclude: '/.*test.*/'.How to obtain tags for logs
Select from the following options:
In the main OpenSearch output, use the
loggerfield that equals the tag.Use logs of a particular Pod or container by following the below order, with the first match winning:
The value of the
appPod label. For example, forapp=opensearch-master, useopensearch-masteras the log tag.The value of the
k8s-appPod label.The value of the
app.kubernetes.io/namePod label.If a
release_groupPod label exists and the component Pod label starts withapp, use the value of the component label as the tag. Otherwise, the tag is the application label joined to the component label with a-.The name of the container from which the log is taken.
The values for
tag_excludeandtag_includeare placed into<match>directives of Fluentd and only accept regex types that are supported by the<match>directive of Fluentd. For details, refer to the Fluentd official documentation.'{fluentd-logs,systemd}'tag_include(string)Optional. Is overridden by
tag_exclude. Sets logs by tags to include to the destination output. For example, to include all logs with theauthtag, settag_include: '/.*auth.*/'.'/.*auth.*/'<pluginConfigOptions>(map)Configures plugin settings. Has a hierarchical structure. The first-level configuration parameters are dynamic except
type,id, andlog_levelthat are reserved by StackLight. For available options, refer to the required plugin documentation. Mirantis does not set any default values for plugin configuration settings except the reserved ones.The second-level configuration options are predefined and limited to
buffer(for any type of log destination) andformat(forremote_syslogonly). Inside the second-level configuration, the parameters are dynamic.For available configuration options, refer to the following documentation:
First-level configuration options:
elasticsearch: ... tag_exclude: '{fluentd-logs,systemd}' host: elasticsearch-host port: 9200 logstash_date_format: '%Y.%m.%d' logstash_format: true logstash_prefix: logstash ...
Second-level configuration options:
syslog: format: "@type": single_value message_key: message
buffer(map)Configures buffering of events using the second-level configuration options. Applies to any type of log destinations. Parameters are dynamic except the following mandatory ones that should not be modified:
type: filethat sets the default buffer typepath: <pathToBufferFile>that sets the path to the buffer destination fileoverflow_action: blockthat prevents Fluentd from crashing if the output destination is down
For details about other mandatory and optional
bufferparameters, see the Fluentd: Output Plugins documentation.Note
To disable
bufferwithout deleting it, usebuffer.disabled: true.buffer: # disabled: false chunk_limit_size: 16m flush_interval: 15s flush_mode: interval overflow_action: block
output_kind(string)Since MCC 2.26.0 (17.1.0, 16.1.0)Configures the type of logs to forward. If set to
audit, only audit logs are forwarded. If unset, only system logs are forwarded.opensearch: output_kind: audit
Example configuration for logging.externalOutputs
logging: externalOutputs: elasticsearch: # disabled: false type: elasticsearch level: info # Removed in MCC 2.26.0 (17.1.0, 16.1.0) plugin_log_level: info tag_exclude: '{fluentd-logs,systemd}' host: elasticsearch-host port: 9200 logstash_date_format: '%Y.%m.%d' logstash_format: true logstash_prefix: logstash ... buffer: # disabled: false chunk_limit_size: 16m flush_interval: 15s flush_mode: interval overflow_action: block ... opensearch: disabled: true type: opensearch level: info # Removed in MCC 2.26.0 (17.1.0, 16.1.0) plugin_log_level: info tag_include: '/.*auth.*/' host: opensearch-host port: 9200 logstash_date_format: '%Y.%m.%d' logstash_format: true logstash_prefix: logstash output_kind: audit # Since MCC 2.26.0 (17.1.0, 16.1.0) ... buffer: chunk_limit_size: 16m flush_interval: 15s flush_mode: interval overflow_action: block ... syslog: type: remote_syslog plugin_log_level: info level: info # Removed in MCC 2.26.0 (17.1.0, 16.1.0) tag_include: '{iam-proxy,systemd}' host: remote-syslog.svc port: 514 hostname: example-hostname packet_size: 1024 protocol: udp tls: false buffer: disabled: true format: "@type": single_value message_key: message ... splunk_syslog_output: type: remote_syslog host: remote-splunk-syslog.svc port: 514 protocol: tcp tls: true ca_file: /etc/ssl/certs/splunk-syslog.pem verify_mode: 0 buffer: chunk_limit: 16MB total_limit: 128MB externalOutputSecretMounts: - secretName: syslog-pem mountPath: /etc/ssl/certs/splunk-syslog.pem
Note
Mirantis recommends that you tune the
packet_sizeparameter value to allow sending full log lines.This parameter defines the packet size in bytes for the syslog logging output. It is useful for syslog setups allowing packet size larger than 1 kB.
Optional. Mount authentication secrets for the required external destination to Fluentd using
logging.externalOutputSecretMounts. For the parameter options, see Logging to external outputs: secrets.Example command to create a secret:
kubectl -n stacklight create secret generic elasticsearch-certs \ --from-file=./ca.pem \ --from-file=./client.pem \ --from-file=./client.key
Recommended. Increase the CPU limit for the
fluentd-logsDaemonSet by 50% of the original value per each external output.The following table describes default and recommended limits for the
fluentd-logsDaemonSet per external destination on clusters of different sizes:CPU limits for fluentd-logs per external output¶ Cluster size
Default CPU limit
Recommended CPU limit
Small
1000m1500mMedium
1500m2250mLarge
2000m3000mTo increase the CPU limit for
fluentd-logs, configure theresourcesStackLight parameter. For details, see StackLight configuration procedure and Resource limits.Verify remote logging to syslog as described in Verify StackLight after configuration.
Note
- If Fluentd cannot flush logs and the buffer of the external output
starts to fill depending on resources and configuration of the external Elasticsearch or OpenSearch server, the
Data too large, circuit_breaking_exceptionerror may occur even after you resolve the external output issues.
This error indicates that the output destination cannot accept logs data sent in bulk because of their size. To mitigate the issue, select from the following options:
Set
bulk_message_request_thresholdto10MBor lower. It is unlimited by default. For details, see the Fluentd plugin documentation for Elasticsearch.Adjust output destinations to accept a large amount of data at once. For details, refer to the official documentation of the required external system.
Enable remote logging to syslog
Deprecated since MCC 2.23.0 (Cluster release 11.7.0)
Caution
Since Container Cloud 2.23.0 (Cluster release 11.7.0), this
procedure and the logging.syslog parameter are deprecated. For a new
configuration of remote logging to syslog, follow the
Enable log forwarding to external destinations procedure instead.
By default, StackLight sends logs to OpenSearch. However, you can configure StackLight to forward all logs to an external syslog server. In this case, StackLight will send logs both to the syslog server and to OpenSearch. Prior to enabling the functionality, consider the following requirements:
StackLight logging must be enabled
A remote syslog server must be deployed outside MOSK
Container Cloud proxy must not be enabled since it only supports the HTTP(S) traffic
To enable sending of logs to syslog:
Perform the steps 1-2 described in StackLight configuration procedure.
In the
stacklight.valuessection of the opened manifest, configure thelogging.syslogparameters as described in StackLight configuration parameters.For example:
logging: enabled: true syslog: enabled: true host: remote-syslog.svc port: 514 packetSize: 1024 protocol: tcp tls: enabled: true certificate: secret: "" hostPath: "/etc/ssl/certs/ca-bundle.pem" verify_mode: 1
Note
Mirantis recommends that you tune the
packetSizeparameter value to allow sending full log lines.The
hostnamefield in the remote syslog database will be set based onclusterIdspecified in the StackLight chart values. For example, ifclusterIdisns/cluster/example-uid, thehostnamewill transform tons_cluster_example-uid. For details, seeclusterIdin StackLight configuration parameters.
Verify remote logging to syslog as described in Verify StackLight after configuration.
Create logs-based metrics
StackLight provides a vast variety of metrics for MOSK components. However, you may need to create a custom log-based metric to use it for alert notifications, for example, in the following cases:
If a component producing logs does not expose scraping targets. In this case, component-specific metrics may be missing.
If a scraping target lacks information that can be collected by aggregating the log messages.
If alerting reasons are more explicitly presented in log messages.
For example, you want to receive alert notifications when more than 10 cases
are created in Salesforce within an hour. The sf-notifier scraping
endpoint does not expose such information. However, sf-notifier logs are
stored in OpenSearch and using prometheus-es-exporter you can perform the
following:
Configure a query using Query DSL (Domain Specific Language) and test it in Dev Tools in in OpenSearch Dashboards.
Configure Prometheus Elasticsearch Exporter to expose the result as a Prometheus metric showing the total amount of Salesforce cases created daily, for example,
salesforce_cases_daily_total_value.Configure StackLight to send a notification once the value of this metric increases by 10 or more within an hour.
Caution
StackLight logging must be enabled and functional.
Prometheus-es-exporteruses OpenSearch Search API. Therefore, configured queries must be tuned for this specific API and must include:The query part to filter documents
The aggregation part to combine filtered documents into a metric-oriented result
For details, see Supported Aggregations.
The following procedure is based on the salesforce_cases_daily_total_value
metric described in the example above.
To create a custom logs-based metric:
Perform steps 1-2 as described in Configure StackLight.
In the manifest that opens, verify that StackLight logging is enabled:
logging: enabled: true
Create a query using Query DSL:
Select one of the following options:
In the OpenSearch Dashboards web UI, select an index to query. StackLight stores logs in hourly OpenSearch indices.
Note
Optimize the query time by limiting the number of results. For example, we will use the OpenSearch
event.providerfield set tosf-notifierto limit the number of logs to search.For example:
GET system/_search { "query": { "bool": { "filter": [ { "term": { "event.provider": { "value": "sf-notifier" } } }, { "range": { "@timestamp": { "gte": "now/d" } } } ] } } }
In the OpenSearch Dashboards web UI, select an index to query. StackLight stores logs in hourly OpenSearch indices. To select all indices for a day, use the
<logstash-{now/d}*>index pattern, which stands for%3Clogstash-%7Bnow%2Fd%7D*%3Ewhen URL-encoded.Note
Optimize the query time by limiting the number of results. For example, we will use the OpenSearch
loggerfield set tosf-notifierto limit the number of logs to search.For example:
GET /%3Clogstash-%7Bnow%2Fd%7D*%3E/_search { "query": { "bool": { "must": { "term": { "logger": { "value": "sf-notifier" } } } } } }
Test the query in Dev Tools in OpenSearch Dashboards.
Select the log lines that include information about Salesforce cases creation. For the
infologging level, to indicate case creation,sf-notifierproduces log messages similar to the following one:[2021-07-02 12:35:28,596] INFO in client: Created case: OrderedDict([('id', '5007h000007iqmKAAQ'), ('success', True), ('errors', [])]).
Such log messages include the Created case phrase. Use it in the query to filter log messages for created cases:
"filter": { "match_phrase_prefix" : { "message" : "Created case" } }
Combine the query result to a single value that
prometheus-es-exporterwill expose as a metric. Use thevalue_countaggregation:GET system/_search { "query": { "bool": { "filter": [ { "term": { "event.provider": { "value": "sf-notifier" } } }, { "range": { "@timestamp": { "gte": "now/d" } } }, { "match_phrase_prefix" : { "message" : "Created case" } } ] } }, "aggs" : { "daily_total": { "value_count": { "field" : "event.provider" } } } }
GET /%3Clogstash-%7Bnow%2Fd%7D*%3E/_search { "query": { "bool": { "must": { "term": { "logger": { "value": "sf-notifier" } } }, "filter": { "match_phrase_prefix" : { "message" : "Created case" } } } }, "aggs" : { "daily_total": { "value_count": { "field" : "logger" } } } }
The aggregation result in Dev Tools should look as follows:
"aggregations" : { "daily_total" : { "value" : 19 } }
Note
The metric name is suffixed with the aggregation name and the result field name:
salesforce_cases_daily_total_value.
Configure Prometheus Elasticsearch Exporter:
In StackLight values of the cluster resource, specify the new metric using the
logging.metricQueriesparameter and configure the query parameters as described in StackLight configuration parameters: logging.metricQueries.In the example below,
salesforce_casesis the query name. The final metric name can be generalized using the<query_name>_<aggregation_name>_<aggregation_result_field_name>template.logging: metricQueries: salesforce_cases: indices: system interval: 600 timeout: 60 onError: preserve onMissing: zero body: "{\"query\":{\"bool\":{\"filter\":[{\"term\":{\"event.provider\":{\"value\":\"sf-notifier\"}}},{\"range\":{\"@timestamp\":{\"gte\":\"now/d\"}}},{\"match_phrase_prefix\":{\"message\":\"Created case\"}}]}},\"aggs\":{\"daily_total\":{\"value_count\":{\"field\":\"event.provider\"}}}}"
logging: metricQueries: salesforce_cases: indices: '<logstash-{now/d}*>' interval: 600 timeout: 60 onError: preserve onMissing: zero body: "{\"query\":{\"bool\":{\"must\":{\"term\":{\"logger\":{\"value\":\"sf-notifier\"}}},\"filter\":{\"match_bool_prefix\":{\"message\":\"Created case\"}}}},\"aggs\":{\"daily_total\":{\"value_count\":{\"field\":\"logger\"}}}}"
Verify that the
prometheus-es-exporterConfigMap has been updated:kubectl describe cm -n stacklight prometheus-es-exporter
Example of system response:
QueryOnError = preserve QueryOnMissing = zero QueryJson = "{\"aggs\":{\"component\":{\"terms\":{\"field\":\"event.provider\"}}},\"query\":{\"match_all\":{}},\"size\":0}" [query_salesforce_cases] QueryIntervalSecs = 600 QueryTimeoutSecs = 60 QueryIndices = system QueryOnError = preserve QueryOnMissing = zero QueryJson = "{\"query\":{\"bool\":{\"filter\":[{\"term\":{\"event.provider\":{\"value\":\"sf-notifier\"}}},{\"range\":{\"@timestamp\":{\"gte\":\"now/d\"}}},{\"match_phrase_prefix\":{\"message\":\"Created case\"}}]}},\"aggs\":{\"daily_total\":{\"value_count\":{\"field\":\"event.provider\"}}}}" Events: <none>
QueryOnError = preserve QueryOnMissing = zero QueryJson = "{\"aggs\":{\"component\":{\"terms\":{\"field\":\"logger\"}}},\"query\":{\"match_all\":{}},\"size\":0}" [query_salesforce_cases] QueryIntervalSecs = 600 QueryTimeoutSecs = 60 QueryIndices = <logstash-{now/d}*> QueryOnError = preserve QueryOnMissing = zero QueryJson = "{\"query\":{\"bool\":{\"must\":{\"term\":{\"logger\":{\"value\":\"sf-notifier\"}}},\"filter\":{\"match_phrase_prefix\":{\"message\":\"Created case\"}}}},\"aggs\":{\"daily_total\":{\"value_count\":{\"field\":\"logger\"}}}}" Events: <none>
ConfigMap update triggers the
prometheus-es-exporterpod restart.Verify that the newly configured query has been executed.
kubectl logs -f -n stacklight <prometheus-es-exporter-pod-id>
Example of system response:
[...] [2021-08-04 12:08:51,989] opensearch.info MainThread POST http://opensearch-master:9200/%3Cnotification-%7Bnow%2Fd%7D%3E/_search [status:200 request:0.040s] [2021-08-04 12:08:52,089] opensearch.info MainThread POST http://opensearch-master:9200/%3Cnotification-%7Bnow%2Fd%7D%3E/_search [status:200 request:0.100s] [2021-08-04 12:08:54,469] opensearch.info MainThread POST http://opensearch-master:9200/%3Csystem-%7Bnow%2Fd%7D*%3E/_search [status:200 request:2.278s]
Once done,
prometheus-es-exporterwill expose metrics from Prometheus in its scraping endpoint. You can view the new metric in the Prometheus web UI.
Optional. Configure StackLight notifications:
Add a new alert as described in Alert configuration. For example:
prometheusServer: customAlerts: - alert: SalesforceCasesDailyWarning annotations: description: The number of cases created today in Salesforce increased by 10 within the last hour. summary: Too many cases in Salesforce expr: increase(salesforce_cases_daily_total_value[1h]) >= 10 labels: severity: warning service: custom
Configure receivers as described in StackLight configuration parameters. For example, to send alert notifications to Slack only:
alertmanagerSimpleConfig: slack: enabled: true api_url: https://hooks.slack.com/services/i45f3k3/w3bh00kU9L/06vi0u5ly channel: Slackbot route: match: alertname: SalesforceCasesDailyWarning salesForce: enabled: true route: routes: - receiver: HTTP-slack match: - alertname: SalesforceCasesDailyWarning
Enable generic metric scraping
StackLight can scrape metrics from any service that exposes Prometheus metrics
and is running on the Kubernetes cluster. Such metrics appear in Prometheus
under the
{job="stacklight-generic",service="<service_name>",namespace="<service_namespace>"}
set of labels. If the Kubernetes service is backed by Kubernetes pods, the set
of labels also includes {pod="<pod_name>"}.
To enable the functionality, define at least one of the following annotations in the service metadata:
"generic.stacklight.mirantis.com/scrape-port"- the HTTP endpoint port. By default, the port number found through Kubernetes service discovery, usually __meta_kubernetes_pod_container_port_number. If none discovered, use the default port for the chosen scheme."generic.stacklight.mirantis.com/scrape-path"- the HTTP endpoint path, related to the Prometheusscrape_config.metrics_pathoption. By default,/metrics."generic.stacklight.mirantis.com/scrape-scheme"- the HTTP endpoint scheme between HTTP and HTTPS, related to the Prometheusscrape_config.schemeoption. By default,http.
For example:
metadata:
annotations:
"generic.stacklight.mirantis.com/scrape-path": "/metrics"
metadata:
annotations:
"generic.stacklight.mirantis.com/scrape-port": "8080"
Manage metrics filtering
Available since MCC 2.24.0 (Cluster release 14.0.0)
By default, StackLight drops unused metrics to increase Prometheus performance providing better resource utilization and faster query response. The following list contains white-listed scrape jobs grouped by the job name. Prometheus collects metrics from this list by default.
White list of Prometheus scrape jobs
_group-blackbox-metrics:
- probe_dns_lookup_time_seconds
- probe_duration_seconds
- probe_http_content_length
- probe_http_duration_seconds
- probe_http_ssl
- probe_http_uncompressed_body_length
- probe_ssl_earliest_cert_expiry
- probe_success
_group-controller-runtime-metrics:
- workqueue_adds_total
- workqueue_depth
- workqueue_queue_duration_seconds_count
- workqueue_queue_duration_seconds_sum
- workqueue_retries_total
- workqueue_work_duration_seconds_count
- workqueue_work_duration_seconds_sum
_group-etcd-metrics:
- etcd_cluster_version
- etcd_debugging_snap_save_total_duration_seconds_sum
- etcd_disk_backend_commit_duration_seconds_bucket
- etcd_disk_backend_commit_duration_seconds_count
- etcd_disk_backend_commit_duration_seconds_sum
- etcd_disk_backend_snapshot_duration_seconds_count
- etcd_disk_backend_snapshot_duration_seconds_sum
- etcd_disk_wal_fsync_duration_seconds_bucket
- etcd_disk_wal_fsync_duration_seconds_count
- etcd_disk_wal_fsync_duration_seconds_sum
- etcd_mvcc_db_total_size_in_bytes
- etcd_network_client_grpc_received_bytes_total
- etcd_network_client_grpc_sent_bytes_total
- etcd_network_peer_received_bytes_total
- etcd_network_peer_sent_bytes_total
- etcd_server_go_version
- etcd_server_has_leader
- etcd_server_leader_changes_seen_total
- etcd_server_proposals_applied_total
- etcd_server_proposals_committed_total
- etcd_server_proposals_failed_total
- etcd_server_proposals_pending
- etcd_server_quota_backend_bytes
- etcd_server_version
- grpc_server_handled_total
- grpc_server_started_total
_group-go-collector-metrics:
- go_gc_duration_seconds
- go_gc_duration_seconds_count
- go_gc_duration_seconds_sum
- go_goroutines
- go_info
- go_memstats_alloc_bytes
- go_memstats_alloc_bytes_total
- go_memstats_buck_hash_sys_bytes
- go_memstats_frees_total
- go_memstats_gc_sys_bytes
- go_memstats_heap_alloc_bytes
- go_memstats_heap_idle_bytes
- go_memstats_heap_inuse_bytes
- go_memstats_heap_released_bytes
- go_memstats_heap_sys_bytes
- go_memstats_lookups_total
- go_memstats_mallocs_total
- go_memstats_mcache_inuse_bytes
- go_memstats_mcache_sys_bytes
- go_memstats_mspan_inuse_bytes
- go_memstats_mspan_sys_bytes
- go_memstats_next_gc_bytes
- go_memstats_other_sys_bytes
- go_memstats_stack_inuse_bytes
- go_memstats_stack_sys_bytes
- go_memstats_sys_bytes
- go_threads
_group-process-collector-metrics:
- process_cpu_seconds_total
- process_max_fds
- process_open_fds
- process_resident_memory_bytes
- process_start_time_seconds
- process_virtual_memory_bytes
_group-rest-client-metrics:
- rest_client_request_latency_seconds_count
- rest_client_request_latency_seconds_sum
_group-service-handler-metrics:
- service_handler_count
- service_handler_sum
_group-service-http-metrics:
- service_http_count
- service_http_sum
_group-service-reconciler-metrics:
- service_reconciler_count
- service_reconciler_sum
alertmanager-webhook-servicenow:
- servicenow_auth_ok
blackbox: []
blackbox-external-endpoint: []
cadvisor:
- cadvisor_version_info
- container_cpu_cfs_periods_total
- container_cpu_cfs_throttled_periods_total
- container_cpu_usage_seconds_total
- container_fs_reads_bytes_total
- container_fs_reads_total
- container_fs_writes_bytes_total
- container_fs_writes_total
- container_memory_usage_bytes
- container_memory_working_set_bytes
- container_network_receive_bytes_total
- container_network_transmit_bytes_total
- container_scrape_error
- machine_cpu_cores
calico:
- felix_active_local_endpoints
- felix_active_local_policies
- felix_active_local_selectors
- felix_active_local_tags
- felix_cluster_num_host_endpoints
- felix_cluster_num_hosts
- felix_cluster_num_workload_endpoints
- felix_host
- felix_int_dataplane_addr_msg_batch_size_count
- felix_int_dataplane_addr_msg_batch_size_sum
- felix_int_dataplane_failures
- felix_int_dataplane_iface_msg_batch_size_count
- felix_int_dataplane_iface_msg_batch_size_sum
- felix_ipset_errors
- felix_ipsets_calico
- felix_iptables_chains
- felix_iptables_restore_errors
- felix_iptables_save_errors
- felix_resyncs_started
etcd-server: []
fluentd:
- apache_http_request_duration_seconds_bucket
- apache_http_request_duration_seconds_count
- docker_networkdb_stats_netmsg
- docker_networkdb_stats_qlen
- kernel_io_errors_total # Since MCC 2.27.0 (17.2.0 and 16.2.0)
helm-controller:
- helmbundle_reconcile_up
- helmbundle_release_ready
- helmbundle_release_status
- helmbundle_release_success
- rest_client_requests_total
host-os-modules-controller:
- hostos_module_deprecation_info # Since MCC 2.28.0 (17.3.0 and 16.3.0)
- hostos_module_usage # Since MCC 2.28.0 (17.3.0 and 16.3.0)
ironic:
- ironic_driver_metadata
- ironic_drivers_total
- ironic_nodes
- ironic_up
kaas-exporter:
- kaas_cluster_info
- kaas_cluster_lcm_healthy # Since MCC 2.28.0 (17.3.0 and 16.3.0)
- kaas_cluster_ready # Since MCC 2.28.0 (17.3.0 and 16.3.0)
- kaas_cluster_updating
- kaas_clusters
- kaas_info
- kaas_license_expiry
- kaas_machine_ready
- kaas_machines_ready
- kaas_machines_requested
- mcc_cluster_pending_update_schedule_time # Since MCC 2.28.0 (17.3.0 and 16.3.0)
- mcc_cluster_pending_update_status # Since MCC 2.28.0 (17.3.0 and 16.3.0)
- mcc_cluster_update_plan_status # Since MCC 2.28.0 (17.3.0 and 16.3.0) as TechPreview
- mcc_cluster_update_plan_step_status # Since MCC 2.28.0 (17.3.0 and 16.3.0) as TechPreview
- rest_client_requests_total
keycloak: # Since MCC 2.30.0 (21.0.0 and 20.0.0)
- keycloak_user_events_total
- http_server_requests_seconds_count
keycloak-blackbox: [] # Since MCC 2.30.0 (21.0.0 and 20.0.0)
kubelet:
- kubelet_running_containers
- kubelet_running_pods
- kubelet_volume_stats_available_bytes
- kubelet_volume_stats_capacity_bytes
- kubelet_volume_stats_used_bytes # Since MCC 2.26.0 (17.1.0 and 16.1.0)
- kubernetes_build_info
- rest_client_requests_total
kubernetes-apiservers:
- apiserver_client_certificate_expiration_seconds_bucket
- apiserver_client_certificate_expiration_seconds_count
- apiserver_request_total
- kubernetes_build_info
- rest_client_requests_total
kubernetes-master-api: []
mcc-blackbox: []
mcc-cache: []
mcc-controllers:
- rest_client_requests_total
mcc-providers:
- rest_client_requests_total
mke-manager-api: []
mke-metrics-controller:
- ucp_controller_services
- ucp_engine_node_health
mke-metrics-engine:
- ucp_engine_container_cpu_percent
- ucp_engine_container_cpu_total_time_nanoseconds
- ucp_engine_container_health
- ucp_engine_container_memory_usage_bytes
- ucp_engine_container_network_rx_bytes_total
- ucp_engine_container_network_tx_bytes_total
- ucp_engine_container_unhealth
- ucp_engine_containers
- ucp_engine_disk_free_bytes
- ucp_engine_disk_total_bytes
- ucp_engine_images
- ucp_engine_memory_total_bytes
- ucp_engine_num_cpu_cores
msr-api: []
openstack-blackbox-ext: []
openstack-cloudprober: # Since MOSK 24.2
- cloudprober_success
- cloudprober_total
openstack-dns-probes: # Since MOSK 24.3
- probe_dns_duration_seconds
openstack-ingress-controller:
- nginx_ingress_controller_build_info
- nginx_ingress_controller_config_hash
- nginx_ingress_controller_config_last_reload_successful
- nginx_ingress_controller_nginx_process_connections
- nginx_ingress_controller_nginx_process_cpu_seconds_total
- nginx_ingress_controller_nginx_process_resident_memory_bytes
- nginx_ingress_controller_request_duration_seconds_bucket
- nginx_ingress_controller_request_size_sum
- nginx_ingress_controller_requests
- nginx_ingress_controller_response_size_sum
- nginx_ingress_controller_ssl_expire_time_seconds
- nginx_ingress_controller_success
openstack-portprober:
- portprober_arping_target_success
- portprober_arping_target_total
openstack-powerdns: # Since MOSK 24.3
- pdns_auth_backend_latency
- pdns_auth_backend_queries
- pdns_auth_cache_latency
- pdns_auth_corrupt_packets
- pdns_auth_cpu_iowait
- pdns_auth_cpu_steal
- pdns_auth_dnsupdate_answers
- pdns_auth_dnsupdate_queries
- pdns_auth_dnsupdate_refused
- pdns_auth_fd_usage
- pdns_auth_incoming_notifications
- pdns_auth_open_tcp_connections
- pdns_auth_qsize_q
- pdns_auth_receive_latency
- pdns_auth_ring_logmessages_capacity
- pdns_auth_ring_logmessages_size
- pdns_auth_ring_noerror_queries_capacity
- pdns_auth_ring_noerror_queries_size
- pdns_auth_ring_nxdomain_queries_capacity
- pdns_auth_ring_nxdomain_queries_size
- pdns_auth_ring_queries_capacity
- pdns_auth_ring_queries_size
- pdns_auth_ring_remotes_capacity
- pdns_auth_ring_remotes_size
- pdns_auth_ring_remotes_unauth_capacity
- pdns_auth_ring_remotes_unauth_size
- pdns_auth_ring_servfail_queries_capacity
- pdns_auth_ring_servfail_queries_size
- pdns_auth_ring_unauth_queries_capacity
- pdns_auth_ring_unauth_queries_size
- pdns_auth_signatures
- pdns_auth_sys_msec
- pdns_auth_tcp4_answers
- pdns_auth_tcp4_answers_bytes
- pdns_auth_tcp4_queries
- pdns_auth_tcp6_answers
- pdns_auth_tcp6_answers_bytes
- pdns_auth_tcp6_queries
- pdns_auth_timedout_packets
- pdns_auth_udp4_answers
- pdns_auth_udp4_answers_bytes
- pdns_auth_udp4_queries
- pdns_auth_udp6_answers
- pdns_auth_udp6_answers_bytes
- pdns_auth_udp6_queries
- pdns_auth_udp_in_csum_errors
- pdns_auth_udp_in_errors
- pdns_auth_udp_noport_errors
- pdns_auth_udp_recvbuf_errors
- pdns_auth_udp_sndbuf_errors
- pdns_auth_uptime
- pdns_auth_user_msec
osdpl-exporter: # Removed in MOSK 24.1
- osdpl_aodh_alarms
- osdpl_certificate_expiry
- osdpl_cinder_zone_volumes
- osdpl_neutron_availability_zone_info
- osdpl_neutron_zone_routers
- osdpl_nova_aggregate_hosts
- osdpl_nova_availability_zone_info
- osdpl_nova_availability_zone_instances
- osdpl_nova_availability_zone_hosts
- osdpl_version_info
patroni:
- patroni_patroni_cluster_unlocked
- patroni_patroni_info
- patroni_postgresql_info
- patroni_replication_info
- patroni_xlog_location
- patroni_xlog_paused
- patroni_xlog_received_location
- patroni_xlog_replayed_location
- python_info
postgresql:
- pg_database_size
- pg_locks_count
- pg_stat_activity_count
- pg_stat_activity_max_tx_duration
- pg_stat_archiver_failed_count
- pg_stat_bgwriter_buffers_alloc_total
- pg_stat_bgwriter_buffers_backend_fsync_total
- pg_stat_bgwriter_buffers_backend_total
- pg_stat_bgwriter_buffers_checkpoint_total
- pg_stat_bgwriter_buffers_clean_total
- pg_stat_bgwriter_checkpoint_sync_time_total
- pg_stat_bgwriter_checkpoint_write_time_total
- pg_stat_database_blks_hit
- pg_stat_database_blks_read
- pg_stat_database_checksum_failures
- pg_stat_database_conflicts
- pg_stat_database_conflicts_confl_bufferpin
- pg_stat_database_conflicts_confl_deadlock
- pg_stat_database_conflicts_confl_lock
- pg_stat_database_conflicts_confl_snapshot
- pg_stat_database_conflicts_confl_tablespace
- pg_stat_database_deadlocks
- pg_stat_database_temp_bytes
- pg_stat_database_tup_deleted
- pg_stat_database_tup_fetched
- pg_stat_database_tup_inserted
- pg_stat_database_tup_returned
- pg_stat_database_tup_updated
- pg_stat_database_xact_commit
- pg_stat_database_xact_rollback
- postgres_exporter_build_info
prometheus-alertmanager:
- alertmanager_active_alerts
- alertmanager_active_silences
- alertmanager_alerts
- alertmanager_alerts_invalid_total
- alertmanager_alerts_received_total
- alertmanager_build_info
- alertmanager_cluster_failed_peers
- alertmanager_cluster_health_score
- alertmanager_cluster_members
- alertmanager_cluster_messages_pruned_total
- alertmanager_cluster_messages_queued
- alertmanager_cluster_messages_received_size_total
- alertmanager_cluster_messages_received_total
- alertmanager_cluster_messages_sent_size_total
- alertmanager_cluster_messages_sent_total
- alertmanager_cluster_peer_info
- alertmanager_cluster_peers_joined_total
- alertmanager_cluster_peers_left_total
- alertmanager_cluster_reconnections_failed_total
- alertmanager_cluster_reconnections_total
- alertmanager_config_last_reload_success_timestamp_seconds
- alertmanager_config_last_reload_successful
- alertmanager_nflog_gc_duration_seconds_count
- alertmanager_nflog_gc_duration_seconds_sum
- alertmanager_nflog_gossip_messages_propagated_total
- alertmanager_nflog_queries_total
- alertmanager_nflog_query_duration_seconds_bucket
- alertmanager_nflog_query_errors_total
- alertmanager_nflog_snapshot_duration_seconds_count
- alertmanager_nflog_snapshot_duration_seconds_sum
- alertmanager_nflog_snapshot_size_bytes
- alertmanager_notification_latency_seconds_bucket
- alertmanager_notifications_failed_total
- alertmanager_notifications_total
- alertmanager_oversize_gossip_message_duration_seconds_bucket
- alertmanager_oversized_gossip_message_dropped_total
- alertmanager_oversized_gossip_message_failure_total
- alertmanager_oversized_gossip_message_sent_total
- alertmanager_partial_state_merges_failed_total
- alertmanager_partial_state_merges_total
- alertmanager_silences
- alertmanager_silences_gc_duration_seconds_count
- alertmanager_silences_gc_duration_seconds_sum
- alertmanager_silences_gossip_messages_propagated_total
- alertmanager_silences_queries_total
- alertmanager_silences_query_duration_seconds_bucket
- alertmanager_silences_query_errors_total
- alertmanager_silences_snapshot_duration_seconds_count
- alertmanager_silences_snapshot_duration_seconds_sum
- alertmanager_silences_snapshot_size_bytes
- alertmanager_state_replication_failed_total
- alertmanager_state_replication_total
prometheus-elasticsearch-exporter:
- elasticsearch_breakers_estimated_size_bytes
- elasticsearch_breakers_limit_size_bytes
- elasticsearch_breakers_tripped
- elasticsearch_cluster_health_active_primary_shards
- elasticsearch_cluster_health_active_shards
- elasticsearch_cluster_health_delayed_unassigned_shards
- elasticsearch_cluster_health_initializing_shards
- elasticsearch_cluster_health_number_of_data_nodes
- elasticsearch_cluster_health_number_of_nodes
- elasticsearch_cluster_health_number_of_pending_tasks
- elasticsearch_cluster_health_relocating_shards
- elasticsearch_cluster_health_status
- elasticsearch_cluster_health_unassigned_shards
- elasticsearch_exporter_build_info
- elasticsearch_indices_docs
- elasticsearch_indices_docs_deleted
- elasticsearch_indices_docs_primary
- elasticsearch_indices_fielddata_evictions
- elasticsearch_indices_fielddata_memory_size_bytes
- elasticsearch_indices_filter_cache_evictions
- elasticsearch_indices_flush_time_seconds
- elasticsearch_indices_flush_total
- elasticsearch_indices_get_exists_time_seconds
- elasticsearch_indices_get_exists_total
- elasticsearch_indices_get_missing_time_seconds
- elasticsearch_indices_get_missing_total
- elasticsearch_indices_get_time_seconds
- elasticsearch_indices_get_total
- elasticsearch_indices_indexing_delete_time_seconds_total
- elasticsearch_indices_indexing_delete_total
- elasticsearch_indices_indexing_index_time_seconds_total
- elasticsearch_indices_indexing_index_total
- elasticsearch_indices_merges_docs_total
- elasticsearch_indices_merges_total
- elasticsearch_indices_merges_total_size_bytes_total
- elasticsearch_indices_merges_total_time_seconds_total
- elasticsearch_indices_query_cache_evictions
- elasticsearch_indices_query_cache_memory_size_bytes
- elasticsearch_indices_refresh_time_seconds_total
- elasticsearch_indices_refresh_total
- elasticsearch_indices_search_fetch_time_seconds
- elasticsearch_indices_search_fetch_total
- elasticsearch_indices_search_query_time_seconds
- elasticsearch_indices_search_query_total
- elasticsearch_indices_segment_count_primary
- elasticsearch_indices_segment_count_total
- elasticsearch_indices_segment_memory_bytes_primary
- elasticsearch_indices_segment_memory_bytes_total
- elasticsearch_indices_segments_count
- elasticsearch_indices_segments_memory_bytes
- elasticsearch_indices_store_size_bytes
- elasticsearch_indices_store_size_bytes_primary
- elasticsearch_indices_store_size_bytes_total
- elasticsearch_indices_store_throttle_time_seconds_total
- elasticsearch_indices_translog_operations
- elasticsearch_indices_translog_size_in_bytes
- elasticsearch_jvm_gc_collection_seconds_count
- elasticsearch_jvm_gc_collection_seconds_sum
- elasticsearch_jvm_memory_committed_bytes
- elasticsearch_jvm_memory_max_bytes
- elasticsearch_jvm_memory_pool_peak_used_bytes
- elasticsearch_jvm_memory_used_bytes
- elasticsearch_os_load1
- elasticsearch_os_load15
- elasticsearch_os_load5
- elasticsearch_process_cpu_percent
- elasticsearch_process_cpu_seconds_total
- elasticsearch_process_cpu_time_seconds_sum
- elasticsearch_process_open_files_count
- elasticsearch_thread_pool_active_count
- elasticsearch_thread_pool_completed_count
- elasticsearch_thread_pool_queue_count
- elasticsearch_thread_pool_rejected_count
- elasticsearch_transport_rx_size_bytes_total
- elasticsearch_transport_tx_size_bytes_total
prometheus-grafana:
- grafana_api_dashboard_get_milliseconds
- grafana_api_dashboard_get_milliseconds_count
- grafana_api_dashboard_get_milliseconds_sum
- grafana_api_dashboard_save_milliseconds
- grafana_api_dashboard_save_milliseconds_count
- grafana_api_dashboard_save_milliseconds_sum
- grafana_api_dashboard_search_milliseconds
- grafana_api_dashboard_search_milliseconds_count
- grafana_api_dashboard_search_milliseconds_sum
- grafana_api_dataproxy_request_all_milliseconds
- grafana_api_dataproxy_request_all_milliseconds_count
- grafana_api_dataproxy_request_all_milliseconds_sum
- grafana_api_login_oauth_total
- grafana_api_login_post_total
- grafana_api_response_status_total
- grafana_build_info
- grafana_feature_toggles_info
- grafana_http_request_duration_seconds_count
- grafana_page_response_status_total
- grafana_plugin_build_info
- grafana_proxy_response_status_total
- grafana_stat_total_orgs
- grafana_stat_total_users
- grafana_stat_totals_dashboard
prometheus-kube-state-metrics:
- kube_cronjob_next_schedule_time
- kube_daemonset_created
- kube_daemonset_status_current_number_scheduled
- kube_daemonset_status_desired_number_scheduled
- kube_daemonset_status_number_available
- kube_daemonset_status_number_misscheduled
- kube_daemonset_status_number_ready
- kube_daemonset_status_number_unavailable
- kube_daemonset_status_observed_generation
- kube_daemonset_status_updated_number_scheduled
- kube_deployment_created
- kube_deployment_metadata_generation
- kube_deployment_spec_replicas
- kube_deployment_status_observed_generation
- kube_deployment_status_replicas
- kube_deployment_status_replicas_available
- kube_deployment_status_replicas_unavailable
- kube_deployment_status_replicas_updated
- kube_endpoint_address # Since MOSK 25.1
- kube_endpoint_address_available # Deprecated since MOSK 25.1 and removed in MOSK 25.2
- kube_job_status_active
- kube_job_status_failed
- kube_job_status_succeeded
- kube_namespace_created
- kube_namespace_status_phase
- kube_node_info
- kube_node_labels
- kube_node_role
- kube_node_spec_taint
- kube_node_spec_unschedulable
- kube_node_status_allocatable
- kube_node_status_capacity
- kube_node_status_condition
- kube_persistentvolume_capacity_bytes
- kube_persistentvolume_status_phase
- kube_persistentvolumeclaim_resource_requests_storage_bytes
- kube_pod_container_info
- kube_pod_container_resource_limits
- kube_pod_container_resource_requests
- kube_pod_container_status_restarts_total
- kube_pod_container_status_running
- kube_pod_container_status_terminated
- kube_pod_container_status_waiting
- kube_pod_info
- kube_pod_init_container_status_running
- kube_pod_status_phase
- kube_service_status_load_balancer_ingress
- kube_statefulset_created
- kube_statefulset_metadata_generation
- kube_statefulset_replicas
- kube_statefulset_status_current_revision
- kube_statefulset_status_observed_generation
- kube_statefulset_status_replicas
- kube_statefulset_status_replicas_available
- kube_statefulset_status_replicas_current
- kube_statefulset_status_replicas_ready
- kube_statefulset_status_replicas_updated
- kube_statefulset_status_update_revision
prometheus-libvirt-exporter:
- libvirt_domain_block_stats_allocation
- libvirt_domain_block_stats_capacity
- libvirt_domain_block_stats_physical
- libvirt_domain_block_stats_read_bytes_total
- libvirt_domain_block_stats_read_requests_total
- libvirt_domain_block_stats_write_bytes_total
- libvirt_domain_block_stats_write_requests_total
- libvirt_domain_info_cpu_time_seconds_total
- libvirt_domain_info_maximum_memory_bytes
- libvirt_domain_info_memory_usage_bytes
- libvirt_domain_info_state
- libvirt_domain_info_virtual_cpus
- libvirt_domain_interface_stats_receive_bytes_total
- libvirt_domain_interface_stats_receive_drops_total
- libvirt_domain_interface_stats_receive_errors_total
- libvirt_domain_interface_stats_receive_packets_total
- libvirt_domain_interface_stats_transmit_bytes_total
- libvirt_domain_interface_stats_transmit_drops_total
- libvirt_domain_interface_stats_transmit_errors_total
- libvirt_domain_interface_stats_transmit_packets_total
- libvirt_domain_memory_actual_balloon_bytes
- libvirt_domain_memory_available_bytes
- libvirt_domain_memory_rss_bytes
- libvirt_domain_memory_unused_bytes
- libvirt_domain_memory_usable_bytes
- libvirt_up
prometheus-memcached-exporter:
- memcached_commands_total
- memcached_current_bytes
- memcached_current_connections
- memcached_current_items
- memcached_exporter_build_info
- memcached_items_evicted_total
- memcached_items_reclaimed_total
- memcached_limit_bytes
- memcached_read_bytes_total
- memcached_up
- memcached_version
- memcached_written_bytes_total
prometheus-msteams: []
prometheus-mysql-exporter:
- mysql_global_status_aborted_clients
- mysql_global_status_aborted_connects
- mysql_global_status_buffer_pool_pages
- mysql_global_status_bytes_received
- mysql_global_status_bytes_sent
- mysql_global_status_commands_total
- mysql_global_status_created_tmp_disk_tables
- mysql_global_status_created_tmp_files
- mysql_global_status_created_tmp_tables
- mysql_global_status_handlers_total
- mysql_global_status_innodb_log_waits
- mysql_global_status_innodb_num_open_files
- mysql_global_status_innodb_page_size
- mysql_global_status_max_used_connections
- mysql_global_status_open_files
- mysql_global_status_open_table_definitions
- mysql_global_status_open_tables
- mysql_global_status_opened_files
- mysql_global_status_opened_table_definitions
- mysql_global_status_opened_tables
- mysql_global_status_qcache_free_memory
- mysql_global_status_qcache_hits
- mysql_global_status_qcache_inserts
- mysql_global_status_qcache_lowmem_prunes
- mysql_global_status_qcache_not_cached
- mysql_global_status_qcache_queries_in_cache
- mysql_global_status_queries
- mysql_global_status_questions
- mysql_global_status_select_full_join
- mysql_global_status_select_full_range_join
- mysql_global_status_select_range
- mysql_global_status_select_range_check
- mysql_global_status_select_scan
- mysql_global_status_slow_queries
- mysql_global_status_sort_merge_passes
- mysql_global_status_sort_range
- mysql_global_status_sort_rows
- mysql_global_status_sort_scan
- mysql_global_status_table_locks_immediate
- mysql_global_status_table_locks_waited
- mysql_global_status_threads_cached
- mysql_global_status_threads_connected
- mysql_global_status_threads_created
- mysql_global_status_threads_running
- mysql_global_status_wsrep_flow_control_paused
- mysql_global_status_wsrep_local_recv_queue
- mysql_global_status_wsrep_local_state
- mysql_global_status_wsrep_ready
- mysql_global_variables_innodb_buffer_pool_size
- mysql_global_variables_innodb_log_buffer_size
- mysql_global_variables_key_buffer_size
- mysql_global_variables_max_connections
- mysql_global_variables_open_files_limit
- mysql_global_variables_query_cache_size
- mysql_global_variables_table_definition_cache
- mysql_global_variables_table_open_cache
- mysql_global_variables_thread_cache_size
- mysql_global_variables_wsrep_desync
- mysql_up
- mysql_version_info
- mysqld_exporter_build_info
prometheus-node-exporter:
- node_arp_entries
- node_bonding_active
- node_bonding_slaves
- node_boot_time_seconds
- node_context_switches_total
- node_cpu_info # Since MCC 2.30.0 (21.0.0 and 20.0.0)
- node_cpu_seconds_total
- node_disk_io_now
- node_disk_io_time_seconds_total
- node_disk_io_time_weighted_seconds_total
- node_disk_read_bytes_total
- node_disk_read_time_seconds_total
- node_disk_reads_completed_total
- node_disk_reads_merged_total
- node_disk_write_time_seconds_total
- node_disk_writes_completed_total
- node_disk_writes_merged_total
- node_disk_written_bytes_total
- node_entropy_available_bits
- node_exporter_build_info
- node_filefd_allocated
- node_filefd_maximum
- node_filesystem_avail_bytes
- node_filesystem_files
- node_filesystem_files_free
- node_filesystem_free_bytes
- node_filesystem_readonly
- node_filesystem_size_bytes
- node_forks_total
- node_hwmon_temp_celsius
- node_hwmon_temp_crit_alarm_celsius
- node_hwmon_temp_crit_celsius
- node_hwmon_temp_crit_hyst_celsius
- node_hwmon_temp_max_celsius
- node_intr_total
- node_load1
- node_load15
- node_load5
- node_memory_Active_anon_bytes
- node_memory_Active_bytes
- node_memory_Active_file_bytes
- node_memory_AnonHugePages_bytes
- node_memory_AnonPages_bytes
- node_memory_Bounce_bytes
- node_memory_Buffers_bytes
- node_memory_Cached_bytes
- node_memory_CommitLimit_bytes
- node_memory_Committed_AS_bytes
- node_memory_DirectMap1G
- node_memory_DirectMap2M_bytes
- node_memory_DirectMap4k_bytes
- node_memory_Dirty_bytes
- node_memory_HardwareCorrupted_bytes
- node_memory_HugePages_Free
- node_memory_HugePages_Rsvd
- node_memory_HugePages_Surp
- node_memory_HugePages_Total
- node_memory_Hugepagesize_bytes
- node_memory_Inactive_anon_bytes
- node_memory_Inactive_bytes
- node_memory_Inactive_file_bytes
- node_memory_KernelStack_bytes
- node_memory_Mapped_bytes
- node_memory_MemAvailable_bytes
- node_memory_MemFree_bytes
- node_memory_MemTotal_bytes
- node_memory_Mlocked_bytes
- node_memory_NFS_Unstable_bytes
- node_memory_PageTables_bytes
- node_memory_SReclaimable_bytes
- node_memory_SUnreclaim_bytes
- node_memory_Shmem_bytes
- node_memory_Slab_bytes
- node_memory_SwapCached_bytes
- node_memory_SwapFree_bytes
- node_memory_SwapTotal_bytes
- node_memory_Unevictable_bytes
- node_memory_VmallocChunk_bytes
- node_memory_VmallocTotal_bytes
- node_memory_VmallocUsed_bytes
- node_memory_WritebackTmp_bytes
- node_memory_Writeback_bytes
- node_netstat_TcpExt_TCPSynRetrans
- node_netstat_Tcp_ActiveOpens
- node_netstat_Tcp_AttemptFails
- node_netstat_Tcp_CurrEstab
- node_netstat_Tcp_EstabResets
- node_netstat_Tcp_InCsumErrors
- node_netstat_Tcp_InErrs
- node_netstat_Tcp_InSegs
- node_netstat_Tcp_MaxConn
- node_netstat_Tcp_OutRsts
- node_netstat_Tcp_OutSegs
- node_netstat_Tcp_PassiveOpens
- node_netstat_Tcp_RetransSegs
- node_netstat_Udp_InCsumErrors
- node_netstat_Udp_InDatagrams
- node_netstat_Udp_InErrors
- node_netstat_Udp_NoPorts
- node_netstat_Udp_OutDatagrams
- node_netstat_Udp_RcvbufErrors
- node_netstat_Udp_SndbufErrors
- node_network_mtu_bytes
- node_network_receive_bytes_total
- node_network_receive_compressed_total
- node_network_receive_drop_total
- node_network_receive_errs_total
- node_network_receive_fifo_total
- node_network_receive_frame_total
- node_network_receive_multicast_total
- node_network_receive_packets_total
- node_network_transmit_bytes_total
- node_network_transmit_carrier_total
- node_network_transmit_colls_total
- node_network_transmit_compressed_total
- node_network_transmit_drop_total
- node_network_transmit_errs_total
- node_network_transmit_fifo_total
- node_network_transmit_packets_total
- node_network_up
- node_nf_conntrack_entries
- node_nf_conntrack_entries_limit
- node_procs_blocked
- node_procs_running
- node_scrape_collector_duration_seconds
- node_scrape_collector_success
- node_sockstat_FRAG_inuse
- node_sockstat_FRAG_memory
- node_sockstat_RAW_inuse
- node_sockstat_TCP_alloc
- node_sockstat_TCP_inuse
- node_sockstat_TCP_mem
- node_sockstat_TCP_mem_bytes
- node_sockstat_TCP_orphan
- node_sockstat_TCP_tw
- node_sockstat_UDPLITE_inuse
- node_sockstat_UDP_inuse
- node_sockstat_UDP_mem
- node_sockstat_UDP_mem_bytes
- node_sockstat_sockets_used
- node_textfile_scrape_error
- node_time_seconds
- node_timex_estimated_error_seconds
- node_timex_frequency_adjustment_ratio
- node_timex_maxerror_seconds
- node_timex_offset_seconds
- node_timex_sync_status
- node_uname_info
prometheus-rabbitmq-exporter: # Removed in MOSK 25.2, use rabbitmq-prometheus-plugin instead
- rabbitmq_channels
- rabbitmq_connections
- rabbitmq_consumers
- rabbitmq_exchanges
- rabbitmq_exporter_build_info
- rabbitmq_fd_available
- rabbitmq_fd_used
- rabbitmq_node_disk_free
- rabbitmq_node_disk_free_alarm
- rabbitmq_node_mem_alarm
- rabbitmq_node_mem_used
- rabbitmq_partitions
- rabbitmq_queue_messages_global
- rabbitmq_queue_messages_ready_global
- rabbitmq_queue_messages_unacknowledged_global
- rabbitmq_queues
- rabbitmq_sockets_available
- rabbitmq_sockets_used
- rabbitmq_up
- rabbitmq_uptime
- rabbitmq_version_info
prometheus-relay: []
prometheus-server:
- prometheus_build_info
- prometheus_config_last_reload_success_timestamp_seconds
- prometheus_config_last_reload_successful
- prometheus_engine_query_duration_seconds
- prometheus_engine_query_duration_seconds_sum
- prometheus_http_request_duration_seconds_count
- prometheus_notifications_alertmanagers_discovered
- prometheus_notifications_errors_total
- prometheus_notifications_queue_capacity
- prometheus_notifications_queue_length
- prometheus_notifications_sent_total
- prometheus_rule_evaluation_failures_total
- prometheus_target_interval_length_seconds
- prometheus_target_interval_length_seconds_count
- prometheus_target_scrapes_sample_duplicate_timestamp_total
- prometheus_tsdb_blocks_loaded
- prometheus_tsdb_compaction_chunk_range_seconds_count
- prometheus_tsdb_compaction_chunk_range_seconds_sum
- prometheus_tsdb_compaction_chunk_samples_count
- prometheus_tsdb_compaction_chunk_samples_sum
- prometheus_tsdb_compaction_chunk_size_bytes_sum
- prometheus_tsdb_compaction_duration_seconds_bucket
- prometheus_tsdb_compaction_duration_seconds_count
- prometheus_tsdb_compaction_duration_seconds_sum
- prometheus_tsdb_compactions_failed_total
- prometheus_tsdb_compactions_total
- prometheus_tsdb_compactions_triggered_total
- prometheus_tsdb_head_active_appenders
- prometheus_tsdb_head_chunks
- prometheus_tsdb_head_chunks_created_total
- prometheus_tsdb_head_chunks_removed_total
- prometheus_tsdb_head_gc_duration_seconds_sum
- prometheus_tsdb_head_samples_appended_total
- prometheus_tsdb_head_series
- prometheus_tsdb_head_series_created_total
- prometheus_tsdb_head_series_removed_total
- prometheus_tsdb_reloads_failures_total
- prometheus_tsdb_reloads_total
- prometheus_tsdb_storage_blocks_bytes
- prometheus_tsdb_wal_corruptions_total
- prometheus_tsdb_wal_fsync_duration_seconds_count
- prometheus_tsdb_wal_fsync_duration_seconds_sum
- prometheus_tsdb_wal_truncations_failed_total
- prometheus_tsdb_wal_truncations_total
rabbitmq-operator-metrics:
- rest_client_requests_total
rabbitmq-prometheus-plugin: # Since MOSK 25.1 to replace prometheus-rabbitmq-exporter
- erlang_vm_allocators
- erlang_vm_dist_node_queue_size_bytes
- erlang_vm_dist_node_state
- erlang_vm_dist_recv_bytes
- erlang_vm_dist_recv_cnt
- erlang_vm_dist_send_bytes
- erlang_vm_dist_send_cnt
- erlang_vm_ets_limit
- erlang_vm_memory_bytes_total
- erlang_vm_memory_dets_tables
- erlang_vm_memory_ets_tables
- erlang_vm_memory_system_bytes_total
- erlang_vm_port_count
- erlang_vm_port_limit
- erlang_vm_process_count
- erlang_vm_process_limit
- erlang_vm_statistics_bytes_output_total
- erlang_vm_statistics_bytes_received_total
- erlang_vm_statistics_context_switches
- erlang_vm_statistics_dirty_cpu_run_queue_length
- erlang_vm_statistics_dirty_io_run_queue_length
- erlang_vm_statistics_garbage_collection_bytes_reclaimed
- erlang_vm_statistics_garbage_collection_number_of_gcs
- erlang_vm_statistics_reductions_total
- erlang_vm_statistics_run_queues_length
- erlang_vm_statistics_run_queues_length_total
- erlang_vm_statistics_runtime_milliseconds
- rabbitmq_alarms_free_disk_space_watermark
- rabbitmq_alarms_memory_used_watermark
- rabbitmq_build_info
- rabbitmq_channels
- rabbitmq_channels_closed_total
- rabbitmq_channels_opened_total
- rabbitmq_connections
- rabbitmq_connections_closed_total
- rabbitmq_connections_opened_total
- rabbitmq_consumers
- rabbitmq_disk_space_available_bytes
- rabbitmq_erlang_uptime_seconds
- rabbitmq_global_messages_acknowledged_total
- rabbitmq_global_messages_confirmed_total
- rabbitmq_global_messages_delivered_consume_auto_ack_total
- rabbitmq_global_messages_delivered_consume_manual_ack_total
- rabbitmq_global_messages_delivered_get_auto_ack_total
- rabbitmq_global_messages_delivered_get_manual_ack_total
- rabbitmq_global_messages_get_empty_total
- rabbitmq_global_messages_received_confirm_total
- rabbitmq_global_messages_received_total
- rabbitmq_global_messages_redelivered_total
- rabbitmq_global_messages_routed_total
- rabbitmq_global_messages_unroutable_dropped_total
- rabbitmq_global_messages_unroutable_returned_total
- rabbitmq_global_publishers
- rabbitmq_identity_info
- rabbitmq_process_max_fds
- rabbitmq_process_max_tcp_sockets # Removed in MOSK 25.2
- rabbitmq_process_open_fds
- rabbitmq_process_open_tcp_sockets
- rabbitmq_process_resident_memory_bytes
- rabbitmq_queue_messages
- rabbitmq_queue_messages_ready
- rabbitmq_queue_messages_unacked
- rabbitmq_queues
- rabbitmq_queues_created_total
- rabbitmq_queues_declared_total
- rabbitmq_queues_deleted_total
- rabbitmq_resident_memory_limit_bytes
- rabbitmq_unreachable_cluster_peers_count
sf-notifier:
- sf_auth_ok
- sf_error_count_created
- sf_error_count_total
- sf_request_count_created
- sf_request_count_total
telegraf-docker-swarm:
- docker_n_containers
- docker_n_containers_paused
- docker_n_containers_running
- docker_n_containers_stopped
- docker_swarm_node_ready # Removed in MOSK 25.1
- docker_swarm_tasks_desired
- docker_swarm_tasks_running
- internal_agent_gather_errors
telemeter-client:
- federate_errors
- federate_filtered_samples
- federate_samples
telemeter-server:
- telemeter_cleanups_total
- telemeter_partitions
- telemeter_samples_total
tf-cassandra-jmx-exporter:
- cassandra_cache_entries
- cassandra_cache_estimated_size_bytes
- cassandra_cache_hits_total
- cassandra_cache_requests_total
- cassandra_client_authentication_failures_total
- cassandra_client_native_connections
- cassandra_client_request_failures_total
- cassandra_client_request_latency_seconds_count
- cassandra_client_request_latency_seconds_sum
- cassandra_client_request_timeouts_total
- cassandra_client_request_unavailable_exceptions_total
- cassandra_client_request_view_write_latency_seconds
- cassandra_commit_log_pending_tasks
- cassandra_compaction_bytes_compacted_total
- cassandra_compaction_completed_total
- cassandra_dropped_messages_total
- cassandra_endpoint_connection_timeouts_total
- cassandra_storage_exceptions_total
- cassandra_storage_hints_total
- cassandra_storage_load_bytes
- cassandra_table_estimated_pending_compactions
- cassandra_table_repaired_ratio
- cassandra_table_sstables_per_read_count
- cassandra_table_tombstones_scanned
- cassandra_thread_pool_active_tasks
- cassandra_thread_pool_blocked_tasks
tf-control:
- tf_controller_sessions
- tf_controller_up
tf-kafka-jmx:
- jmx_exporter_build_info
- kafka_controller_controllerstats_count
- kafka_controller_controllerstats_oneminuterate
- kafka_controller_kafkacontroller_value
- kafka_log_log_value
- kafka_network_processor_value
- kafka_network_requestmetrics_99thpercentile
- kafka_network_requestmetrics_mean
- kafka_network_requestmetrics_oneminuterate
- kafka_network_socketserver_value
- kafka_server_brokertopicmetrics_count
- kafka_server_brokertopicmetrics_oneminuterate
- kafka_server_delayedoperationpurgatory_value
- kafka_server_kafkarequesthandlerpool_oneminuterate
- kafka_server_replicamanager_oneminuterate
- kafka_server_replicamanager_value
tf-operator:
- tf_operator_info # Since MOSK 23.3
tf-redis:
- redis_commands_duration_seconds_total
- redis_commands_processed_total
- redis_commands_total
- redis_connected_clients
- redis_connected_slaves
- redis_db_keys
- redis_db_keys_expiring
- redis_evicted_keys_total
- redis_expired_keys_total
- redis_exporter_build_info
- redis_instance_info
- redis_keyspace_hits_total
- redis_keyspace_misses_total
- redis_memory_max_bytes
- redis_memory_used_bytes
- redis_net_input_bytes_total
- redis_net_output_bytes_total
- redis_rejected_connections_total
- redis_slave_info
- redis_up
- redis_uptime_in_seconds
tf-vrouter:
- tf_vrouter_ds_discard
- tf_vrouter_ds_flow_action_drop
- tf_vrouter_ds_flow_queue_limit_exceeded
- tf_vrouter_ds_flow_table_full
- tf_vrouter_ds_frag_err
- tf_vrouter_ds_invalid_if
- tf_vrouter_ds_invalid_label
- tf_vrouter_ds_invalid_nh
- tf_vrouter_flow_active
- tf_vrouter_flow_aged
- tf_vrouter_flow_created
- tf_vrouter_lls_session_info
- tf_vrouter_up
- tf_vrouter_xmpp_connection_state
tf-zookeeper:
- approximate_data_size
- bytes_received_count
- commit_count
- connection_drop_count
- connection_rejected
- connection_request_count
- dead_watchers_cleaner_latency_sum
- dead_watchers_cleared
- dead_watchers_queued
- digest_mismatches_count
- election_time_sum
- ephemerals_count
- follower_sync_time_count
- follower_sync_time_sum
- fsynctime_sum
- global_sessions
- jvm_classes_loaded
- jvm_gc_collection_seconds_sum
- jvm_info
- jvm_memory_pool_bytes_used
- jvm_threads_current
- jvm_threads_deadlocked
- jvm_threads_state
- leader_uptime
- learner_commit_received_count
- learner_proposal_received_count
- learners
- local_sessions
- max_file_descriptor_count
- node_changed_watch_count_sum
- node_children_watch_count_sum
- node_created_watch_count_sum
- node_deleted_watch_count_sum
- num_alive_connections
- om_commit_process_time_ms_sum
- om_proposal_process_time_ms_sum
- open_file_descriptor_count
- outstanding_requests
- packets_received
- packets_sent
- pending_syncs
- proposal_count
- quorum_size
- response_packet_cache_hits
- response_packet_cache_misses
- response_packet_get_children_cache_hits
- response_packet_get_children_cache_misses
- revalidate_count
- snapshottime_sum
- stale_sessions_expired
- synced_followers
- synced_non_voting_followers
- synced_observers
- unrecoverable_error_count
- uptime
- watch_count
- znode_count
ucp-kv: []
Note
The following Prometheus metrics are removed from the list of white-listed scrape jobs in Container Cloud 2.25.0 (Cluster releases 17.0.0 and 16.0.0):
The
prometheus-kube-state-metricsgroup:kube_deployment_spec_pausedkube_deployment_spec_strategy_rollingupdate_max_unavailablekube_deployment_status_conditionkube_deployment_status_replicas_ready
The
prometheus-corednsjob from thego-collector-metricsandprocess-collector-metricsgroups
You can add necessary metrics that are dropped to this white list as described below. It is also possible to disable the filtering feature. However, Mirantis does not recommend disabling the feature to prevent direct impact on the Prometheus index size, which affects query speed. For clusters with extended retention period, performance degradation will be the most noticeable.
Add dropped metrics to the white list
You can expand the default white list of Prometheus
metrics using the prometheusServer.metricsFiltering.extraMetricsInclude
parameter to enable metrics that are dropped by default. For the
parameter description, see Prometheus metrics filtering. For configuration
steps, see Configure StackLight.
Example configuration:
prometheusServer:
metricsFiltering:
enabled: true
extraMetricsInclude:
cadvisor:
- container_memory_failcnt
- container_network_transmit_errors_total
calico:
- felix_route_table_per_iface_sync_seconds_sum
- felix_bpf_dataplane_endpoints
_group-go-collector-metrics:
- go_gc_heap_goal_bytes
- go_gc_heap_objects_objects
Disable metrics filtering
Mirantis does not recommend disabling metrics filtering to prevent direct impact on the Prometheus index size, which affects query speed. In clusters with an extended retention period, performance degradation will be the most noticeable. Therefore, the best option is to keep the feature enabled and add the required dropped metrics to the white list as described in Add dropped metrics to the white list.
If disabling of metrics filtering is absolutely necessary, set the
prometheusServer.metricsFiltering.enabled parameter to false:
prometheusServer:
metricsFiltering:
enabled: false
For configuration steps, see Configure StackLight.
Use S.M.A.R.T. metrics for creating alert rules
Available since MCC 2.27.0 (Cluster releases 17.2.0 and 16.2.0)
The StackLight telegraf-ds-smart exporter uses the
S.M.A.R.T. plugin to
obtain detailed disk information and export it as metrics on a
MOSK cluster. S.M.A.R.T. is a commonly used system across
vendors with performance data provided as attributes, whereas attribute names
can be different across vendors. Each attribute contains the following
different values:
- Raw value
Actual value of the attribute for the time being. Units may not be the same across vendors.
- Current value
Health valuation where values can range from
1to253(1represents the worst case and253represents the best one). Depending on the manufacturer, a value of100or200will often be selected as the normal value.
- Worst value
The worst value ever observed as a current one for a particular device.
- Threshold value
Lower threshold for the current value. If the current value drops below the lower threshold, it requires attention.
The following table provides examples for alert rules based on S.M.A.R.T. metrics. These examples may not work for all clusters depending on vendor or disk types.
Caution
Before creating alert rules, manually test these expressions to verify whether they are valid for the cluster. You can also implement any other alerts based on S.M.A.R.T. metrics.
To create custom alert rules in StackLight, use the customAlerts
parameter described in Alert configuration.
Expression |
Description |
|
Alerts when a device |
|
Indicates disk health failure. |
|
Targets any S.M.A.R.T. attribute reaching its predefined threshold, indicating a potential risk or imminent failure of the disk. Utilizing this alert might eliminate the need for more specific attribute alerts by relying on the vendor’s established thresholds, streamlining the monitoring process. Implementing inhibition rules may be necessary to manage overlaps with other alerts effectively. |
|
Is triggered when disk temperature exceeds 60°C, indicating potential overheating issues. |
|
Identifies an increase in UDMA CRC errors, indicating data transmission issues between the disk and controller. |
|
Is triggered during a noticeable increase in the rate of read errors on the disk. This is a strong indicator of issues with the disk surface or read/write heads that can affect data integrity and accessibility. |
|
Is triggered when the disk experiences an increase in attempts to spin up to its operational speed, indicating potential issues with the disk motor, bearings, or power supply, which can lead to drive failure. |
|
Is triggered during an increase in the number of disk sectors that cannot be corrected by the error correction algorithms of the drive, pointing towards serious disk surface or read/write head issues. |
|
Is triggered on a rise in sectors that are marked as pending for remapping due to read errors. Persistent increases can indicate deteriorating disk health and impending failure. |
|
Detects an upsurge in errors during the process of data transmission from the host to the disk and vice versa, highlighting potential issues in data integrity during transfer operations. |
|
Is triggered during an increase in sectors that have been reallocated due to being deemed defective. A rising count is a critical sign of ongoing wear and tear, or damage to the disk surface. |
The following table describes S.M.A.R.T. metrics provided by Stacklight that you can use for creating alert rules depending on your cluster requirements:
Metric |
Description |
|
Reports current S.M.A.R.T. attribute values with labels for detailed context. |
|
Indicates the fetching status of individual attributes. A non-zero code indicates monitoring issues. |
|
Reports raw S.M.A.R.T. attribute values with labels for detailed context. |
|
Reports S.M.A.R.T. attribute threshold values with labels for detailed context. |
|
Reports the worst recorded values of S.M.A.R.T. attributes with labels for detailed context. |
|
Counts timeouts when a drive fails to respond to a command, indicating responsiveness issues. |
|
Reflects the overall device status post-checks, where values other than
|
|
Indicates overall device health, where values other than |
The following table describes metrics from various S.M.A.R.T. attributes that
are part of the above smart_attribute* metrics. But their value
representation can be different, such as unified units or counter information.
Also, vendors may have different attribute namings. The following metrics are
standardized across different vendors. Depending on the disk or vendor type,
a cluster may miss some of the following metrics or have extra ones.
Metric |
Description |
|
Monitors data transmission errors, where an increase suggests potential transfer issues. |
|
Counts sectors awaiting remapping due to unrecoverable errors, with decreases over time indicating successful remapping. |
|
Tracks errors occurring during disk data reads. |
|
Counts defective sectors that have been remapped, with increases indicating drive degradation. |
|
Measures the error frequency of the drive positioning mechanism, with high values indicating mechanical issues. |
|
Tracks the drive attempts to spin up to operational speed, with increases indicating mechanical issues. |
|
Reports the drive temperature in Celsius. |
|
Counts errors in data communication between the drive and host. |
|
Records total uncorrectable read/write errors. |
|
Counts sectors that cannot be corrected indicating potentially damaged sectors. |
Deschedule StackLight Pods from a worker machine
On an existing managed cluster, addition of a worker machine that replaces the one containing the StackLight node label requires the label migration to the new machine and a manual removal of StackLight Pods from the old machine, which you remove the label from.
Caution
In this procedure, replace <machine-name> with the name of
the machine from which you remove the StackLight node label.
To deschedule StackLight Pods from a worker machine:
Remove the
stacklight=enablednode label from thespecsection of the targetMachineobject.Connect to the required cluster using its
kubeconfig.Verify that the
stacklight=enabledlabel was removed successfully:kubectl get node -l "kaas.mirantis.com/machine-name=<machine name>" --show-labels | grep "stacklight=enabled"
A positive system response must be empty.
Verify the list of StackLight Pods to be deleted that run on the target machine:
kubectl get pods -n stacklight -o wide --field-selector spec.nodeName=$(kubectl get node -l "kaas.mirantis.com/machine-name=<machine name>" -o jsonpath='{.items[0].metadata.name}')
Example of system response extract:
NAME READY STATUS AGE IP NODE alerta-fc45c8f6-6qlfx 1/1 Running 63m 10.233.76.3 node-3a0de232-c1b4-43b0-8f21-44cd1 grafana-9bc56cdff-sl5w6 3/3 Running 63m 10.233.76.4 node-3a0de232-c1b4-43b0-8f21-44cd1 iam-proxy-alerta-57585798d7-kqwd7 1/1 Running 58m 10.233.76.17 node-3a0de232-c1b4-43b0-8f21-44cd1 iam-proxy-alertmanager-6b4c4c8867-pdwcs 1/1 Running 56m 10.233.76.18 node-3a0de232-c1b4-43b0-8f21-44cd1 iam-proxy-grafana-87b984c45-2qwvb 1/1 Running 55m 10.233.76.19 node-3a0de232-c1b4-43b0-8f21-44cd1 iam-proxy-prometheus-545789585-9mll8 1/1 Running 54m 10.233.76.21 node-3a0de232-c1b4-43b0-8f21-44cd1 patroni-13-0 3/3 Running 61m 10.233.76.11 node-3a0de232-c1b4-43b0-8f21-44cd1 prometheus-alertmanager-0 1/1 Running 55m 10.233.76.20 node-3a0de232-c1b4-43b0-8f21-44cd1 prometheus-blackbox-exporter-9f6bdfd75-8zn4w 2/2 Running 61m 10.233.76.8 node-3a0de232-c1b4-43b0-8f21-44cd1 prometheus-kube-state-metrics-67ff88649f-tslxc 1/1 Running 61m 10.233.76.7 node-3a0de232-c1b4-43b0-8f21-44cd1 prometheus-node-exporter-zl8pj 1/1 Running 61m 10.10.10.143 node-3a0de232-c1b4-43b0-8f21-44cd1 telegraf-docker-swarm-69567fcf7f-jvbgn 1/1 Running 61m 10.233.76.10 node-3a0de232-c1b4-43b0-8f21-44cd1 telemeter-client-55d465dcc5-9thds 1/1 Running 61m 10.233.76.9 node-3a0de232-c1b4-43b0-8f21-44cd1
Delete all StackLight Pods from the target machine:
kubectl -n stacklight delete $(kubectl get pods -n stacklight -o wide --field-selector spec.nodeName=$(kubectl get node -l "kaas.mirantis.com/machine-name=<machine name>" -o jsonpath='{.items[0].metadata.name}') -o name)
Example of system response:
pod "alerta-fc45c8f6-6qlfx" deleted pod "grafana-9bc56cdff-sl5w6" deleted pod "iam-proxy-alerta-57585798d7-kqwd7" deleted pod "iam-proxy-alertmanager-6b4c4c8867-pdwcs" deleted pod "iam-proxy-grafana-87b984c45-2qwvb" deleted pod "iam-proxy-prometheus-545789585-9mll8" deleted pod "patroni-13-0" deleted pod "prometheus-alertmanager-0" deleted pod "prometheus-blackbox-exporter-9f6bdfd75-8zn4w" deleted pod "prometheus-kube-state-metrics-67ff88649f-tslxc" deleted pod "prometheus-node-exporter-zl8pj" deleted pod "telegraf-docker-swarm-69567fcf7f-jvbgn" deleted pod "telemeter-client-55d465dcc5-9thds" deleted
Wait about three minutes for Pods to be rescheduled.
Verify that you do not have
PendingPods in thestacklightnamespace:kubectl -n stacklight get pods --field-selector status.phase=Pending
If the system response is
No resources found in stacklight namespace, all Pods are rescheduled successfully.If the system response still contains some Pods, remove local persistent volumes (LVP) bound to the target machine.
Remove LVP from a machine
Connect to the managed cluster as described in the steps 5-7 in Connect to a MOSK cluster.
Define the pods in the
Pendingstate:kubectl get po -n stacklight | grep Pending
Example of system response:
opensearch-master-2 0/1 Pending 0 49s patroni-12-0 0/3 Pending 0 51s patroni-13-0 0/3 Pending 0 48s prometheus-alertmanager-1 0/1 Pending 0 47s prometheus-server-0 0/2 Pending 0 47s
Verify that the reason for the pod
Pendingstate isvolume node affinity conflict:kubectl describe pod <POD_NAME> -n stacklight
Example of system response:
Events: Type Reason Age From Message ---- ------ ---- ---- ------- Warning FailedScheduling 6m53s default-scheduler 0/6 nodes are available: 3 node(s) didn't match node selector, 3 node(s) had volume node affinity conflict. Warning FailedScheduling 6m53s default-scheduler 0/6 nodes are available: 3 node(s) didn't match node selector, 3 node(s) had volume node affinity conflict.
Obtain the PVC of one of the pods:
kubectl get pod <POD_NAME> -n stacklight -o=jsonpath='{range .spec.volumes[*]}{.persistentVolumeClaim}{"\n"}{end}'
Example of system response:
{"claimName":"opensearch-master-opensearch-master-2"}
Remove the PVC using the obtained name. For example, for
opensearch-master-opensearch-master-2:kubectl delete pvc opensearch-master-opensearch-master-2 -n stacklight
Delete the pod:
kubectl delete po <POD_NAME> -n stacklight
Verify that a new pod is created and scheduled to the spare node. This may take some time. For example:
kubectl get po opensearch-master-2 -n stacklight NAME READY STATUS RESTARTS AGE opensearch-master-2 1/1 Running 0 7m1s
Repeat the steps above for the remaining pods in the
Pendingstate.
Tungsten Fabric operations
The section covers the management aspects of a Tungsten Fabric cluster deployed on Kubernetes.
Caution
Before you proceed with the Tungsten Fabric management, read through Tungsten Fabric known limitations.
Update Tungsten Fabric
The Tungsten Fabric cluster update is performed during the MOSK cluster release update.
The control plane update is performed automatically. To complete the data plane update, you will need to manually remove the vRouter pods. See Cluster update for details.
Back up TF databases
Important
Before MOSK 25.2, due to the known issue 53831, do not use the below procedure in clusters that have undergone at least one major or patch cluster update.
Restoration of Tungsten Fabric database from a backup may lead to missing
default configuration objects such as default IPAM, global configuration
settings, and so on. This may result in critical components such as
tf-config and tf-config-db to repeatedly crash, which renders the
Dashboard service (OpenStack Horizon) and other services non-functional and
impacts workloads.
MOSK enables you to perform the automatic TF
data backup using the tf-dbbackup-job cron job. Also, you can configure
a remote NFS storage for TF data backups. For configuration details,
refer to the Tungsten Fabric database section in Reference Architecture.
This section provides instructions on how to back up the TF data manually if needed.
Manually back up TF data in the JSON format
Disable the Neutron server that is used by OpenStack to communicate with the Tungsten Fabric API:
Note
The database changes associated with northbound APIs must be stopped on all systems before performing any backup operations.
Scale the
neutron-serverdeployment to 0 replicas:kubectl -n openstack scale deploy neutron-server --replicas 0
Verify the number of replicas:
kubectl -n openstack get deploy neutron-server
Example of a positive system response:
NAME READY UP-TO-DATE AVAILABLE AGE neutron-server 0/0 0 0 6d22h
Join the Tungsten Fabric API that is part of the
configDaemonSet:Obtain the
tf-configpod:kubectl -n tf get pod -l tungstenfabric=config
Example of a system response:
NAME READY STATUS RESTARTS AGE tf-config-6ppvc 5/5 Running 0 5d4h tf-config-rgqqq 5/5 Running 0 5d4h tf-config-sb4kk 5/5 Running 0 5d4h
Join the Bash shell of one of the
apicontainer from the previous step:kubectl -n tf exec -it tf-config-<hash> -c api -- bash
Example of a system response:
(config-api[hostname])[<USER>@<HOSTNAME> /]$
Inside the
apicontainer, change the directory to the Pythonconfig managementpackages:cd /usr/lib/python3.6/site-packages/cfgm_common
cd /usr/lib/python2.7/site-packages/cfgm_common
Back up data using
db_json_eximin JSON format:python db_json_exim.py --export-to /tmp/db-dump.json
Verify the created dump:
cat /tmp/db-dump.json | python -m json.tool | less
Copy the backup from the container:
kubectl -n tf cp tf-config-<hash>:/tmp/db-dump.json <DESTINATION-PATH-FOR-BACKUP>
On the same
confignode, copy thecontrail-api.conffile from the container to the host:kubectl -n tf cp tf-config-<hash>:/etc/contrail/contrail-api.conf <DESTINATION-PATH-FOR-CONF>
Enable the Neutron server:
Scale the
neutron-serverdeployment back to the desired number of replicas. Default is 3.kubectl -n openstack scale deploy neutron-server --replicas <DESIRED-NUM-REPLICAS>
Verify the number of replicas:
kubectl -n openstack get deploy neutron-server
Example of a system response:
NAME READY UP-TO-DATE AVAILABLE AGE neutron-server 3/3 3 3 6d23h
See also
Restore Tungsten Fabric data
Important
Before MOSK 25.2, due to the known issue 53831, do not use the below procedure in clusters that have undergone at least one major or patch cluster update.
Restoration of Tungsten Fabric database from a backup may lead to missing
default configuration objects such as default IPAM, global configuration
settings, and so on. This may result in critical components such as
tf-config and tf-config-db to repeatedly crash, which renders the
Dashboard service (OpenStack Horizon) and other services non-functional and
impacts workloads.
This section describes how to restore the Cassandra and ZooKeeper databases from the backups created either automatically or manually as described in Back up TF databases.
Caution
The data backup must be consistent across all systems because the state of the Tungsten Fabric databases is associated with other system databases, such as OpenStack databases.
Automatically restore the data
Verify that the cluster does not have the
tfdbrestoreobject. If there is still one remaining from the previous restoration, delete it:kubectl -n tf delete tfdbrestores.tf.mirantis.com tf-dbrestore
kubectl -n tf delete tfdbrestores.tf-dbrestore.tf.mirantis.com tf-dbrestore
Edit the
TFOperatorcustom resource to perform the data restoration:spec: features: dbRestoreMode: enabled: true
spec: settings: dbRestoreMode: enabled: true
Warning
When restoring the data, MOSK stops the Tungsten Fabric services and recreates the database backends that include Cassandra, Kafka, and ZooKeeper.
Note
The automated restoration process relies on automated database backups configured by the Tungsten Fabric Operator. The Tungsten Fabric data is restored from the backup type specified in the
tf-dbBackupsection of the Tungsten Fabric Operator custom resource, or the defaultpvctype if not specified. For the configuration details, refer to Periodic Tungsten Fabric database backups.Optional. Specify the name of the backup to be used for the
dbDumpNameparameter. By default, the latestdb-dumpis used.spec: features: dbRestoreMode: enabled: true dbDumpName: db-dump-20220111-110138.json
spec: settings: dbRestoreMode: enabled: true dbDumpName: db-dump-20220111-110138.json
To verify the restoration status and stage, verify the events recorded for the
tfdbrestoreobject:kubectl -n tf describe tfdbrestores.tf.mirantis.com tf-dbrestore
kubectl -n tf describe tfdbrestores.tf-dbrestore.tf.mirantis.com
Example of a system response:
... Status: Health: Ready Events: Type Reason Age From Message ---- ------ ---- ---- ------- Normal TfDaemonSetsDeleted 18m (x4 over 18m) tf-dbrestore TF DaemonSets were deleted Normal zookeeperOperatorScaledDown 18m tf-dbrestore zookeeper operator scaled to 0 Normal zookeeperStsScaledDown 18m tf-dbrestore tf-zookeeper statefulset scaled to 0 Normal cassandraOperatorScaledDown 17m tf-dbrestore cassandra operator scaled to 0 Normal cassandraStsScaledDown 17m tf-dbrestore tf-cassandra-config-dc1-rack1 statefulset scaled to 0 Normal cassandraStsPodsDeleted 16m tf-dbrestore tf-cassandra-config-dc1-rack1 statefulset pods deleted Normal cassandraPVCDeleted 16m tf-dbrestore tf-cassandra-config-dc1-rack1 PVC deleted Normal zookeeperStsPodsDeleted 16m tf-dbrestore tf-zookeeper statefulset pods deleted Normal zookeeperPVCDeleted 16m tf-dbrestore tf-zookeeper PVC deleted Normal kafkaOperatorScaledDown 16m tf-dbrestore kafka operator scaled to 0 Normal kafkaStsScaledDown 16m tf-dbrestore tf-kafka statefulset scaled to 0 Normal kafkaStsPodsDeleted 16m tf-dbrestore tf-kafka statefulset pods deleted Normal AllOperatorsStopped 16m tf-dbrestore All 3rd party operator's stopped Normal CassandraOperatorScaledUP 16m tf-dbrestore CassandraOperator scaled to 1 Normal CassandraStsScaledUP 16m tf-dbrestore Cassandra statefulset scaled to 3 Normal CassandraPodsActive 12m tf-dbrestore Cassandra pods active Normal ZookeeperOperatorScaledUP 12m tf-dbrestore Zookeeper Operator scaled to 1 Normal ZookeeperStsScaledUP 12m tf-dbrestore Zookeeper Operator scaled to 3 Normal ZookeeperPodsActive 12m tf-dbrestore Zookeeper pods active Normal DBRestoreFinished 12m tf-dbrestore TF db restore finished Normal TFRestoreDisabled 12m tf-dbrestore TF Restore disabled
Note
If the restoration was completed several hours ago, events may not be shown with kubectl describe. If so, verify the
Statusfield and get events using the following command:kubectl -n tf get events --field-selector involvedObject.name=tf-dbrestore
After the job completes, it can take around 15 minutes to stabilize
tf-controlservices. If some pods are still in theCrashLoopBackOffstatus, restart these pods manually one by one:List the
tf-controlpods:kubectl -n tf get pods -l app=tf-control
Verify that the new pods are successfully spawned.
Verify that no vRouters are connected to only the
tf-controlpod that will be restarted.Restart the
tf-controlpods sequentially:kubectl -n tf delete pod tf-control-<hash>
When the restoration completes, MOSK automatically sets
dbRestoreModetofalsein the Tungsten Fabric Operator custom resource.Delete the
tfdbrestoreobject from the cluster to be able to perform the next restoration:kubectl -n tf delete tfdbrestores.tf.mirantis.com tf-dbrestore
kubectl -n tf delete tfdbrestores.tf-dbrestore.tf.mirantis.com tf-dbrestore
Manually restore the data
Obtain the config API image repository and tag.
kubectl -n tf get tfconfig tf-config -o jsonpath='{.spec.images.config.configAPI}'
kubectl -n tf get tfconfig tf-config -o=jsonpath='{.spec.api.containers[?(@.name=="api")].image}'
From the output, copy the entire image link.
Terminate the configuration and analytics services, if the latter are present in your deployment, and stop the database changes associated with northbound APIs on all systems.
Note
The Tungsten Fabric Operator watches related resources and keeps them updated and healthy. If any resource is deleted or changed, the Tungsten Fabric Operator automatically runs reconciling to create a resource or change the configuration back to the required state. Therefore, the Tungsten Fabric Operator must not be running during the data restoration.
Scale the
tungstenfabric-operatordeployment to 0 replicas:kubectl -n tf scale deploy tungstenfabric-operator --replicas 0
Verify the number of replicas:
kubectl -n tf get deploy tungstenfabric-operator
Example of a positive system response:
NAME READY UP-TO-DATE AVAILABLE AGE tungstenfabric-operator 0/0 0 0 10h
Delete the Tungsten Fabric configuration and analytics DaemonSets, if the latter are present in your deployment:
kubectl -n tf delete daemonset tf-config kubectl -n tf delete daemonset tf-config-db kubectl -n tf delete daemonset tf-analytics kubectl -n tf delete daemonset tf-analytics-snmp
The Tungsten Fabric configuration pods should be automatically terminated.
Verify that the Tungsten Fabric configuration and analytics pods, if the latter are present in your deployment, are terminated:
kubectl -n tf get pod -l app=tf-config kubectl -n tf get pod -l tungstenfabric=analytics kubectl -n tf get pod -l tungstenfabric=analytics-snmp
Example of a positive system response:
No resources found.
Stop Kafka:
Scale the
kafka-operatordeployment to 0 replicas:kubectl -n tf scale deploy kafka-operator --replicas 0
Scale the
tf-kafkastatefulSet to 0 replicas:kubectl -n tf scale sts tf-kafka --replicas 0
Verify the number of replicas:
kubectl -n tf get sts tf-kafka
Example of a positive system response:
NAME READY AGE tf-kafka 0/0 10h
Stop and wipe the Cassandra database:
Scale the
cassandra-operatordeployment to 0 replicas:kubectl -n tf scale deploy cassandra-operator --replicas 0
Scale the
tf-cassandra-config-dc1-rack1statefulSet to 0 replicas:kubectl -n tf scale sts tf-cassandra-config-dc1-rack1 --replicas 0
Verify the number of replicas:
kubectl -n tf get sts tf-cassandra-config-dc1-rack1
Example of a positive system response:
NAME READY AGE tf-cassandra-config-dc1-rack1 0/0 10h
Delete Persistent Volume Claims (PVCs) for the Cassandra configuration pods:
kubectl -n tf delete pvc -l app=cassandracluster,cassandracluster=tf-cassandra-config
Once PVCs are deleted, the related Persistent Volumes are automatically released. The release process takes approximately one minute.
Stop and wipe the ZooKeeper database:
Scale the
zookeeper-operatordeployment to 0 replicas:kubectl -n tf scale deploy zookeeper-operator --replicas 0
Scale the
tf-zookeeperstatefulSet to 0 replicas:kubectl -n tf scale sts tf-zookeeper --replicas 0
Verify the number of replicas:
kubectl -n tf get sts tf-zookeeper
Example of a positive system response:
NAME READY AGE tf-zookeeper 0/0 10h
Delete PVCs for the ZooKeeper configuration pods:
kubectl -n tf delete pvc -l app=tf-zookeeper
Once PVCs are deleted, the related Persistent Volumes are automatically released. The release process takes approximately one minute.
Restore the number of replicas to run Cassandra and ZooKeeper and restore the deleted PVCs.
Restore the
cassandra-operatordeployment replicas:kubectl -n tf scale deploy cassandra-operator --replicas 1
Restore the
tf-cassandra-config-dc1-rack1statefulSet replicas:kubectl -n tf scale sts tf-cassandra-config-dc1-rack1 --replicas 3
Verify that Cassandra pods have been created and are running:
kubectl -n tf get pod -l app=cassandracluster,cassandracluster=tf-cassandra-config
Example of a positive system response:
NAME READY STATUS RESTARTS AGE tf-cassandra-config-dc1-rack1-0 1/1 Running 0 4m43s tf-cassandra-config-dc1-rack1-1 1/1 Running 0 3m30s tf-cassandra-config-dc1-rack1-2 1/1 Running 0 2m6s
Restore the
zookeeper-operatordeployment replicas:kubectl -n tf scale deploy zookeeper-operator --replicas 1
Restore the
tf-zookeeperstatefulSet replicas:kubectl -n tf scale sts tf-zookeeper --replicas 3
Verify that ZooKeeper pods have been created and are running:
kubectl -n tf get pod -l app=tf-zookeeper
Example of a positive system response:
NAME READY STATUS RESTARTS AGE tf-zookeeper-0 1/1 Running 0 3m23s tf-zookeeper-1 1/1 Running 0 2m56s tf-zookeeper-2 1/1 Running 0 2m20s
Restore the data from the backup:
Note
Do not use the Tungsten Fabric API container used for the backup file creation. In this case, a session with the Cassandra and ZooKeeper databases is created once the Tungsten Fabric API service starts but the Tungsten Fabric configuration services are stopped. The tools for the data backup and restore are available only in the Tungsten Fabric configuration API container. Using the steps below, start a blind container based on the
config-apiimage.Deploy a pod using the configuration API image obtained in the first step:
Note
Since MOSK 24.1, if your deployment uses the
cqlCassandra driver, update the value of theCONFIGDB_CASSANDRA_DRIVERenvironment variable tocql.cat <<EOF | kubectl apply -f - apiVersion: v1 kind: Pod metadata: annotations: kubernetes.io/psp: privileged labels: app: tf-restore-db name: tf-restore-db namespace: tf spec: containers: - name: api image: <PUT_LINK_TO_CONFIG_API_IMAGE_FROM_STEP_ABOVE> command: - sleep - infinity envFrom: - configMapRef: name: tf-rabbitmq-cfgmap - configMapRef: name: tf-zookeeper-cfgmap - configMapRef: name: tf-cassandra-cfgmap - configMapRef: name: tf-services-cfgmap - secretRef: name: tf-os-secret env: - name: CONFIGDB_CASSANDRA_DRIVER value: thrift imagePullPolicy: Always nodeSelector: tfcontrol: enabled dnsPolicy: ClusterFirstWithHostNet enableServiceLinks: true hostNetwork: true priority: 0 restartPolicy: Always serviceAccount: default serviceAccountName: default EOF
If you use the backup that was created automatically, extend the YAML file content above with the following configuration:
... spec: containers: - name: api volumeMounts: - mountPath: </PATH/TO/MOUNT> name: <TF-DBBACKUP-VOL-NAME> volumes: - name: <TF-DBBACKUP-VOL-NAME> persistentVolumeClaim: claimName: <TF-DBBACKUP-PVC-NAME>
Copy the database dump to the container:
Warning
Skip this step if you use the auto-backup and have provided the volume definition as described above.
kubectl cp <PATH_TO_DB_DUMP> tf/tf-restore-db:/tmp/db-dump.json
Copy the
contrail-api.conffile to the container:kubectl cp <PATH-TO-CONFIG> tf/tf-restore-db:/tmp/contrail-api.conf
Join the restarted container:
kubectl -n tf exec -it tf-restore-db -- bash
Restore the Cassandra database from the backup:
(config-api) $ cd /usr/lib/python3.6/site-packages/cfgm_common (config-api) $ python db_json_exim.py --import-from /tmp/db-dump.json --api-conf /tmp/contrail-api.conf
(config-api) $ cd /usr/lib/python2.7/site-packages/cfgm_common (config-api) $ python db_json_exim.py --import-from /tmp/db-dump.json --api-conf /tmp/contrail-api.conf
Delete the restore container:
kubectl -n tf delete pod tf-restore-db
Restore the replica number to run Kafka:
Restore the
kafka-operatordeployment replicas:kubectl -n tf scale deploy kafka-operator --replicas 1
Kafka operator should automatically restore the number of replicas of the appropriate StatefulSet.
Verify the number of replicas:
kubectl -n tf get sts tf-kafka
Example of a positive system response:
NAME READY AGE tf-kafka 3/3 10h
Run the Tungsten Fabric Operator to restore the Tungsten Fabric configuration and analytics services, if the latter were present in your deployment:
Restore the replica for the Tungsten Fabric Operator Deployment:
kubectl -n tf scale deploy tungstenfabric-operator --replicas 1
Verify that the Tungsten Fabric Operator is running properly without any restarts:
kubectl -n tf get pod -l name=tungstenfabric-operator
Verify that the configuration and analytics pods, if the latter were present in your deployment, have been automatically started:
kubectl -n tf get pod -l app=tf-config kubectl -n tf get pod -l tungstenfabric=analytics kubectl -n tf get pod -l tungstenfabric=analytics-snmp
Restart the
tf-controlservices:Caution
To avoid network downtime, do not restart all pods simultaneously.
List the
tf-controlpodskubectl -n tf get pods -l app=tf-control
Restart the
tf-controlpods one by one.Caution
Before restarting the
tf-controlpods:Verify that the new pods are successfully spawned.
Verify that no vRouters are connected to only one
tf-controlpod that will be restarted.
kubectl -n tf delete pod tf-control-<hash>
Convert v1alpha1 TFOperator custom resource to v2
Available since MOSK 24.2
In 24.1, MOSK introduces the API v2 for Tungsten Fabric.
Since 24.2, Tungsten Fabric API v2 becomes default for new deployments and
includes the ability to convert the existing v1alpha1 TFOperator to v2.
During the update to the 24.3 series, the old Tungsten Fabric cluster configuration API v1alpha1 is automatically converted and replaced with the v2 version. And since MOSK 25.1, Tungsten Fabric API v1alpha1 is not present in the product.
To learn more about the new TFOperator structure, refer to
Tungsten Fabric API v2 Reference of the cluster version in question
at Tungsten Fabric Operator resources and Key differences between TFOperator API v1alpha1 and v2.
Convert v1alpha1 TFOperator to v2
During cluster update to MOSK 24.3, the automatic
conversion of the TFOperator v1alpha1 to the v2 version takes place.
Therefore, there is no need to perform any manual conversion.
Warning
- Since MOSK 24.3, start using the v2
TFOperatorcustom resource for any updates.
The v1alpha1 TFOperator custom resource remains in the cluster
but is no longer reconciled and will be automatically removed in
MOSK 25.1.
Caution
Conversion of TFOperator causes recreation of the Tungsten
Fabric service pods. Therefore, Mirantis recommends performing
the conversion during a maintenance window.
Update the tungstenfabric-operator Helm release values in
the corresponding ClusterRelease resource:
spec:
helm:
releases:
- name: tungstenfabric-operator
values:
operator:
convertToV2: true
When the chart changes apply, the tungstenfabric-operator-convert-to-v2
job performs the following:
Saves the existing v1alpha1
TFOperatorspecification to thetfoperator-v1alpha1-copyConfigMapCreates the v2
TFOperatorcustom resourceRemoves the redundant v1alpha1
TFOperatorcustom resource
While the conversion is being performed, monitor the recreation of the
Tungsten Fabric service pods. Verify that TFOperator v2 has been
created successfully:
kubectl -n tf describe tf.mirantis.com openstack-tf
Reverse the conversion of v1alpha1 TFOperator to v2
Caution
During the reverse conversion, the Tungsten Fabric service pods will get updated. Therefore, Mirantis recommends performing the procedure during the maintenance window.
Caution
Reverse conversion is not possible since MOSK 25.1 because v1alpha1 TFOperator is removed from the product.
Update Helm release values in the corresponding
ClusterReleaseresource:values: operator: convertToV2: false
When the controller starts, it should use the v1alpha1
TFOperatorcustom resources for reconcilation.
Caution
During the conversion reverse, the Tungsten Fabric service pods will get recreated. Therefore, Mirantis recommends performing the conversion during the maintenance window.
Update the
TFOperatorHelmBundle:values: operator: convertToV2: false
Manually, delete the v2
TFOperatorcustom resource:kubectl -n tf delete tf.mirantis.com openstack-tf
Manually, create the v1alpha1
TFOperatorcustom resource using data from thetfoperator-v1alpha1-copyConfigMap.
Replace a failed TF controller node
If one of the Tungsten Fabric (TF) controller nodes has failed, follow this procedure to replace it with a new node.
To replace a TF controller node:
Note
Pods that belong to the failed node can stay in the Terminating
state.
If a failed node has
tfconfigdb=enabledortfanalyticsdb=enabled, or both labels assigned to it, get and note down the IP addresses of the Cassandra pods that run on the node to be replaced:kubectl -n tf get pods -owide | grep 'tf-cassandra.*<FAILED-NODE-NAME>'
Delete the failed TF controller node from the Kubernetes cluster using the Mirantis Container Cloud web UI or CLI. For the procedure, refer to Delete a cluster machine.
Note
Once the failed node has been removed from the cluster, all pods that hanged in the
Terminatingstate should be removed.Remove the
control(with the BGP router),config, andconfig-dbnodes from the TF configuration database:To remove
control(with the BGP router) nodes:Log in to the TF web UI.
Navigate to Configure > BGP Routers.
Delete all terminated control nodes.
To remove other type nodes:
Log in to the TF web UI.
Navigate to Configure > Nodes.
Delete the terminated nodes.
Log in to the Keystone client container:
kubectl -n openstack exec -it deployment/keystone-client -- bash
Get a link for the failed TF
confignode:curl -s -H "X-Auth-Token: $(openstack token issue | awk '/ id / {print $4}')" http://tf-config-api.tf.svc:8082/config-nodes | jq
Remove the failed
confignode:curl -s -H "X-Auth-Token: $(openstack token issue | awk '/ id / {print $4}')" -X "DELETE" <LINK_FROM_HREF_WITH_NODE_UUID>
Obtain the list of
config-databaseandcontrolnodes:curl -s -H "X-Auth-Token: $(openstack token issue | awk '/ id / {print $4}')" http://tf-config-api.tf.svc:8082/config-database-nodes | jq curl -s -H "X-Auth-Token: $(openstack token issue | awk '/ id / {print $4}')" http://tf-config-api.tf.svc:8082/control-nodes | jq
Identify the
config-databaseandcontrolnodes to be deleted using thehreffield from the system output from the previous step. Delete the nodes as required:curl -s -H "X-Auth-Token: $(openstack token issue | awk '/ id / {print $4}')" -X "DELETE" <LINK_FROM_HREF_WITH_NODE_UUID>
Enable the
tf-api-cliDeployment as described in Enable tf-api-cli.Log in to the
tf-api-clicontainer:kubectl -n tf exec -it deployment/tf-tool-cli -- bash
Obtain the list of the Tungsten Fabric
confignodes and identify the one to be removed using thecatargument and checking thenamefield:tf-api-cli ls config-node tf-api-cli cat config-node/<UUID>
Remove the
confignode, confirm the removal command:tf-api-cli rm config-node/<UUID>
Obtain the list of the Tungsten Fabric
config-databasenodes and identify the one to be removed using thecatargument and checking thenamefield:tf-api-cli ls config-database-node tf-api-cli cat config-database-node/<UUID>
Remove the
config-databasenode, confirm the removal command:tf-api-cli rm config-database-node/<UUID>
Obtain the list of the BGP routers and identify the one to be removed using the
catargument and checking thenamefield:tf-api-cli ls bgp-router tf-api-cli cat bgp-router/<UUID>
Remove the Tugsten Fabric control node with the BGP router, confirm the removal command:
tf-api-cli rm bgp-router/<UUID>
Assign the TF labels for the new control plane node as per the table below using the following command:
kubectl label node <NODE-NAME> <LABEL-KEY=LABEL-VALUE> ...
Tungsten Fabric (TF) node roles¶ Node role
Description
Kubernetes labels
Minimal count
TF control plane
Hosts the TF control plane services such as
database,messaging,api,svc,config.tfconfig=enabledtfcontrol=enabledtfwebui=enabledtfconfigdb=enabled3
TF analytics Unsupported since {{ product_name_abbr }} 24.2
Hosts the TF analytics services.
tfanalytics=enabledtfanalyticsdb=enabled3
TF vRouter
Hosts the TF vRouter module and vRouter Agent.
tfvrouter=enabledVaries
Note
TF supports only Kubernetes OpenStack workloads. Therefore, you should label OpenStack compute nodes with the
tfvrouter=enabledlabel.Note
Do not specify the
openvswitch=enabledlabel for the OpenStack deployments with TF as a networking backend.Once you label the new Kubernetes node, new pods start scheduling on the node. Though, pods that use Persistent Volume Claims are stuck in the
Pendingstate as their volume claims stay bounded to the local volumes from the deleted node. To resolve the issue:Delete the PersistentVolumeClaim (PVC) bounded to the local volume from the failed node:
kubectl -n tf delete pvc <PVC-BOUNDED-TO-NON-EXISTING-VOLUME>
Note
Clustered services that use PVC, such as Cassandra, Kafka, and ZooKeeper, start the replication process when new pods move to the
Readystate.Check the PersistenceVolumes (PVs) claimed by the deleted PVCs. If a PV is stuck in the
Releasedstate, delete it manually:kubectl -n tf delete pv <PV>
Delete the pod that is using the removed PVC:
kubectl -n tf delete pod <POD-NAME>
Verify that the pods have successfully started on the replaced controller node and stay in the
Readystate.If the failed controller node had
tfconfigdb=enabledortfanalyticsdb=enabled, or both labels assigned to it, remove old Cassandra hosts from theconfigandanalyticscluster configuration:Get the host ID of the removed Cassandra host using the pod IP addresses saved during Step 1:
kubectl -n tf exec tf-cassandra-<config/analytics>-dc1-rack1-1 -c cassandra -- nodetool status
Verify that the removed Cassandra node has the
DNstatus that indicates that this node is currently offline.Remove the failed Cassandra host:
kubectl -n tf exec tf-cassandra-<config/analytics>-dc1-rack1-1 -c cassandra -- nodetool removenode <HOST-ID>
Delete a vRouter node
Tungsten Fabric vRouter collocates with the OpenStack compute node. Therefore, to delete the vRouter node from your cluster, follow the node deletion procedure in Delete a compute node.
Additionally, you need to remove the vhost0 OpenStack port and
the Node object of the deleted node from the Tungsten Fabric database:
Log in to the
keystone-clientpod in theopenstacknamespace through the command line.Obtain the OpenStack token required to authenticate with the Tungsten Fabric API service:
TOKEN=$(openstack token issue | awk '/ id / {print $4}')
Obtain the list of vRouter nodes to retrieve the link for the deleted node:
curl -s -H "X-Auth-Token: ${TOKEN}" http://tf-config-api.tf.svc:8082/virtual-routers | jq
Obtain the UUID of the
vhost0port to be removed:curl -s -H "X-Auth-Token: ${TOKEN}" http://tf-config-api.tf.svc:8082/virtual-router/<VROUTER_UUID> | jq '.["virtual-router"]["virtual_machine_interfaces"][0]["uuid"]'
Delete the
vhost0OpenStack port through the Openstack Horizon or CLI:openstack port delete <VHOST0_PORT_UUID>
Delete the vRouter
Nodeobject from the Tungsten Fabric configuration database:curl -s -X DELETE -H "X-Auth-Token: ${TOKEN}" http://tf-config-api.tf.svc:8082/virtual-router/<VROUTER_NODE_UUID>
Verify the Tungsten Fabric deployment
This section explains how to use the tungsten-pytest test set to
verify your Tungsten Fabric (TF) deployment. The tungsten-pytest test
set is part of the TF operator and allows for prompt verification of the
Kubernetes objects related to TF and basic verification of the TF services.
To verify the TF deployment using tungsten-pytest:
Enable the
tf-testcontroller in the TF Operator resource for the Operator to start the pod with the test set:spec: controllers: tf-test: tungsten-pytest: enabled: true
Wait until the
tungsten-pytestpod is ready. To keep track of the tests execution and view the results, run:kubectl -n tf logs -l app=tf-test
Optional. The test results are stored in the
tf-test-tungsten-pytestPVC. To obtain the results:Deploy the pod with the mounted volume:
# Run pod and mount pvc to it cat <<EOF | kubectl apply -f - apiVersion: v1 kind: Pod metadata: name: tf-test-results-pod namespace: tf spec: volumes: - name: tf-test-data-volume persistentVolumeClaim: claimName: tf-test-tungsten-pytest containers: - name: tempest-pvc-container image: ubuntu command: ['sh', '-c', 'sleep infinity'] volumeMounts: - mountPath: "/tungsten-pytest/data" name: tf-test-data-volume EOF
Copy the results locally:
kubectl -n tf cp tf-test-results-pod:tungsten-pytest/data/results.xml results.xml
Remove the Tempest test results pod:
kubectl -n tf delete pod tf-test-results-pod
Disable the
tf-testcontroller:kubectl -n tf patch tfoperator openstack-tf --type='json' -p='[{"op": "replace", "path": "/spec/controllers/tf-test/tungsten-pytest/enabled", "value": false}]'
Manually remove the pod with tests:
kubectl -n tf delete pod -l app=tf-test
Configure load balancing
This section describes a simple load balancing configuration. As an example, we use a topology for balancing the traffic between two HTTP servers listening on port 80. The example topology includes the following parameters:
Backend servers
10.10.0.4and10.10.0.3in theprivate-subnetsubnet run an HTTP application that listens on the TCP port 80.The
public-subnetsubnet is a shared external subnet created by the cloud operator and accessible from the Internet.The created load balancer is accessible through an IP address from the public subnet that will distribute web requests between the backend servers.
To configure load balancing:
Log in to a
keystone-clientpod.Create a load balancer:
openstack loadbalancer create --vip-subnet-id=private-subnet --name test-lb
Note
By default, MOSK uses the Octavia Tungsten Fabric load balancing. Since 23.1, you can explicitly specify
amphorav2as a provider when creating a load balancer using theproviderargument:openstack loadbalancer create --provider amphorav2
Octavia Amphora load balancing is available as a Technology Preview feature. For details, refer to Octavia Amphora load balancing.
Create an HTTP listener:
openstack loadbalancer listener create --name test-listener \ --protocol HTTP --protocol-port 80 test-lb
Create a LBaaS pool that will be used by default for
test-listener:openstack loadbalancer pool create --protocol HTTP \ --lb-algorithm ROUND_ROBIN --name test-pool --listener test-listener
Create a health monitor that ensures health of the pool members:
openstack loadbalancer healthmonitor create --delay 5 --name test-hm \ --timeout 3 --max-retries 3 --type HTTP test-pool
Add backend servers to the pool. The following example adds the
10.10.0.3and10.10.0.4backend servers:openstack loadbalancer member create --address 10.10.0.3 --protocol-port 80 test-pool openstack loadbalancer member create --address 10.10.0.4 --protocol-port 80 test-pool
Create a floating IP address in a public network and associate it with a port of the load balancer VIP:
vip_port_id=$(openstack loadbalancer show test-lb -c vip_port_id \ -f value) fip_id=$openstack floating ip create public -c floating_ip_address \ -f value) openstack floating ip set --port $vip_port_id $fip_id
Optionally, enable security groups using the Tungsten Fabric web UI:
Navigate to Configure > Networking > Ports.
Find the load balancer ports.
In the Device column, find the VIP port.
Using the gear icon menu of the VIP port, enable Security Groups.
Access the VIP floating IP address and verify that requests are distributed between the two servers. For example:
curl http://10.11.12.103:80 Welcome to addr:10.10.10.4 curl http://10.11.12.103:80 Welcome to addr:10.10.10.3
In the example above, an HTTP application that runs on the backend servers returns an IP address of the host on which it runs.
Enable Tungsten Fabric Cassandra repairs
Available since MOSK 25.1
MOSK enables you to activate automatic Tungsten Fabric
database repairs using the tf-dbrepair-job CronJob. Running this repair
job is essential for maintaining the health and consistency of a Cassandra
cluster.
Below are scenarios where running the repair job is recommended:
- Node recovery
If a node has been down for an extended period or replaced, run a repair after bringing it back online to ensure it has all the latest data
- Major changes
After significant changes, such as cluster update or schema modifications, run a repair to ensure data consistency
- Cluster modifications
When nodes are added or removed, data may not immediately be consistent across replicas. Run a repair to reconcile the data across the cluster
To enable the repair job:
Edit the
TFOperatorcustom resource to enable the database repair job:spec: features: dbRepair: enabled: true
Optional. Specify the job schedule. By default, the job will run weekly. For example, to schedule the job to run daily:
spec: features: dbRepair: enabled: true schedule: '@daily'
You can also use default cron expressions with five fields. For example, to schedule the job to run at
8:30on Mondays:spec: eatures: dbRepair: enabled: true schedule: '30 8 * * 1'
Enable contrail-tools
The contrail-tools container provides a centralized location for all
available Tungsten Fabric tools and CLI commands. The container includes such
utilities as vif, flow, nh, and other tools
to debug network issues. MOSK deploys contrail-tools
using the Tungsten Fabric Operator through the TFOperator custom resource.
To enable the Tungsten Fabric contrail-tools Deployment:
Enable the
toolsDeployment in theTFOperatorresource for the operator to start the Pods with utilities to debug Tungsten Fabric on nodes with thetfvrouter:enabledlabel:spec: features: tfTools: tfToolsEnabled: true labels: tfvrouter: enabled
spec: controllers: tf-tool: tools: enabled: true labels: tfvrouter: enabled
Note
Use the
labelssection to specify target nodes for thecontrail-toolsDeployment. If thelabelssection is not specified, thetf-tool-ctools-<xxxxx>Pods will be scheduled to all available nodes in current Deployment.Wait until the
tf-tool-ctools-<xxxxx>Pods are ready in thetfnamespace.Note
The
<xxxxx>string in a Pod name consists of random alpha-numeric symbols generated by Kubernetes to differentiate thetf-tool-ctoolsPods.Use interactive shell in the
tf-tool-ctools-<xxxxx>Pod to debug current Deployment or run commands throughkubectl, for example:kubectl -n tf exec tf-tool-ctools-<xxxxx> -- vif --list
Disable the
toolsDeployment:kubectl -n tf patch tfoperator.tf.mirantis.com <TFOperator CR name> --type='json' -p='[{"op": "replace", "path": "/spec/features/tfTools/tfToolsEnabled", "value": false}]'
kubectl -n tf patch tfoperator.operator.tf.mirantis.com <TFOperator CR name> --type='json' -p='[{"op": "replace", "path": "/spec/controllers/tf-tool/tools/enabled", "value": false}]'
Enable tf-api-cli
The tf-api-cli container provides access to the Tungsten Fabric
API through the command-line interface (CLI). See the
contrail-api-cli documentation
for details.
Note
The tf-api-cli tool was initially called contrail-api-cli.
To enable the Tungsten Fabric API CLI Deployment:
Enable the
tf-cliDeployment in theTFOperatorcustom resource to start the Pod with utilities to access the Tungsten Fabric API CLI:spec: features: tfTools: tfCliEnabled: true
spec: controllers: tf-tool: tf-cli: enabled: true
Wait for the
tf-tool-cliPod to start running in thetfnamespace.
Once the tf-tool-cli Pod is running, use the interactive shell to
access the Tungsten Fabric API CLI:
kubectl -n tf exec tf-tool-cli -it -- bash
The following example illustrates the use of the tf-api-cli command inside
a container:
tf-api-cli ls virtual-network
To disable the Tungsten Fabric API CLI Deployment:
Update the TFOperator custom resource and disable the tf-cli
Deployment:
kubectl -n tf patch tfoperator.tf.mirantis.com <TFOperator CR name> --type='json' -p='[{"op": "replace", "path": "/spec/features/tfTools/tfCliEnabled", "value": false}]'
kubectl -n tf patch tfoperator.operator.tf.mirantis.com <TFOperator CR name> --type='json' -p='[{"op": "replace", "path": "/spec/controllers/tf-tool/tf-cli/enabled", "value": false}]'
Bare metal operations
This section covers the management aspects of the bare metal operations of a MOSK cluster.
Upgrade an operating system distribution
Available since MCC 2.24.0 (14.0.0)
Caution
Usage of third-party software, which is not part of Mirantis-supported configurations, for example, the use of custom DPDK modules, may block upgrade of an operating system distribution. Users are fully responsible for ensuring the compatibility of such custom components with the latest supported Ubuntu version.
Distribution upgrade of an operating system (OS) is implemented for management and MOSK clusters.
For management clusters, an OS distribution upgrade occurs automatically since Container Cloud 2.24.0 (Cluster release 14.0.0) as part of cluster update and requires machines reboot. The upgrade workflow is as follows:
The distribution ID value is taken from the
idfield of the distribution from theallowedDistributionslist in the spec of theClusterReleaseobject.The distribution that has the
default: truevalue is used during update. This distribution ID is set in thespec:providerSpec:value:distributionfield of theMachineobject during cluster update.
For MOSK clusters, an in-place OS distribution upgrade should be performed between cluster updates. This scenario implies a machine cordoning, draining, and reboot.
The table below illustrates the correlation between the cluster updates and upgrade to Ubuntu 22.04 and 24.04 to help you effectively plan and perform the upgrade.
Management cluster version |
MOSK cluster version |
Default Ubuntu version |
Key impact |
Action required |
|---|---|---|---|---|
2.28.5 |
24.3.0
24.3.1
24.3.2
|
22.04 |
No impact |
Strongly recommended to upgrade Ubuntu to 22.04 on all MOSK cluster nodes. 0 Management cluster nodes are automatically upgraded to Ubuntu 22.04 during cluster upgrade to Container Cloud 2.27.0 (Cluster release 16.2.0). |
2.29 |
25.1 |
22.04 |
MOSK cluster requires Ubuntu 22.04. Upgrade to 25.1 is blocked unless all cluster nodes are running on Ubuntu 22.04. |
Upgrade all MOSK cluster nodes to Ubuntu 22.04 to unblock the MOSK cluster update to 25.1. 0 |
2.29.1 |
24.3.3 |
22.04 |
Management cluster update to 2.29.1 is blocked unless all nodes present in your deployment are running on Ubuntu 22.04. |
Upgrade all nodes to Ubuntu 22.04 to unblock your management cluster update. 0 |
2.30.0 |
25.1.x
25.2
|
22.04
24.04 1
|
No impact |
Management cluster nodes are automatically upgraded to Ubuntu 24.04 during cluster update to Container Cloud 2.30.0 (Cluster release 20.0.0). Upgrade of MOSK clusters to Ubuntu 24.04 will become available in one of the following releases. |
- 0(1,2,3)
Upgrading all nodes at once is not mandatory. You can upgrade them individually or in small batches, depending on time constraints in the maintenance window.
- 1
Ubuntu 22.04 on MOSK clusters and Ubuntu 24.04 on management clusters.
Caution
After the major cluster update, make sure to change the
postponeDistributionUpdate parameter back to false unless you want
to postpone new OS distribution upgrades.
Note
If you want to migrate container runtime on cluster machines from Docker to containerd and have not upgraded the OS distribution to Jammy yet, Mirantis recommends combining both procedures to minimize the maintenance window. In this case, ensure that all cluster machines are updated during one maintenance window to prevent machines from running different container runtimes.
Container runtime migration to containerd is available since Container Cloud 2.28.4 (Cluster releases 17.3.4 and 16.3.4). For details, see Migrate container runtime from Docker to containerd.
To upgrade an OS distribution on MOSK between releases:
Caution
A machine reboot occurs automatically during distribution update.
Open the required
Machineobject for editing.In
spec:providerSpec:value:distribution, set the required ID of the new OS version. For example,ubuntu/jammy.For description of the
Machineobject fields, see Machine resource.The machine reboot occurs automatically after completion of deployment phases.
Once the distribution upgrade completes, verify that
currentDistributionmatches thedistributionvalue previously set in the objectspec. For description of the status fields, see Machine status.Repeat the procedure with the remaining machines.
Optional. Available since Container Cloud 2.28.4 (Cluster releases 17.3.4 and 16.3.4). Upgrade container runtime from Docker to containerd together with distribution upgrade as described in Migrate container runtime from Docker to containerd to minimize the size of maintenance window.
Caution
Container runtime migration becomes mandatory in the scope of Container Cloud 2.29.x (Cluster releases 17.4.x and 16.4.x). Otherwise, the management cluster update to Container Cloud 2.30.0 will be blocked.
Strongly recommended. Back up MKE as described in Mirantis Kubernetes Engine documentation: Back up MKE.
Since the procedure above modifies the cluster configuration, a fresh backup is required to restore the cluster in case further reconfigurations fail.
See also
Automatic upgrade of a host operating system
To keep operating system on a bare metal host up to date with the latest security updates, the operating system requires periodic software packages upgrade that may or may not require the host reboot.
MOSK uses life cycle management tools to update the operating system packages on the bare metal hosts.
In a management cluster, software package upgrade and host restart are applied automatically when a new Container Cloud version with available kernel or software packages upgrade is released.
In a MOSK cluster, package upgrade and host restart are applied as part of usual cluster update, when applicable. To start planning the maintenance window and proceed with the MOSK cluster update, see Cluster update.
Operating system upgrade and host restart are applied to cluster nodes one by one. If Ceph is installed in the cluster, the MOSK orchestration securely pauses the Ceph OSDs on the node before restart. This allows avoiding degradation of the storage service.
Remove old Ubuntu kernel packages
Available since MCC 2.25.0 (17.0.0 and 16.0.0)
During a management or managed cluster update with Ubuntu package updates, MOSK automatically removes unnecessary kernel and system packages.
During cleanup, MOSK keeps a number of kernel versions following the default behavior of the Ubuntu apt autoremove command:
- Booted kernel
The currently booted kernel is always kept.
- Latest kernel
If there are any kernel packages with versions higher than the booted kernel version, then the kernel package with the highest version is also kept.
- Previous kernel
If there are any installed kernel packages with versions lower than the one of the latest kernel that equals the booted kernel, then the kernel with version previous to the latest kernel is kept.
Note
Previous kernel does not equal the previously booted kernel. Previous kernel is an N-1 kernel in a sorted list of all kernels installed in the system where N is the kernel with the highest version.
Caution
If a kernel package is a dependency of another package, it will not be automatically removed. The rules above do not apply to such a case.
The number of kernel packages may be more than two if the apt autoremove command has never been used or if the cluster is affected by the known issue 46808.
Mirantis recommends keeping previous kernel version for fallback in case the current kernel becomes unstable. However, if you absolutely require leaving only the booted version of kernel packages, you can use the script described below after considering all possible risks.
To remove all kernel packages of the previous version:
Verify that the cluster is successfully updated and is in the
Readystate.Log in as
rootto the required node using SSH.Run the following script that calls an Ansible module targeted at local host. The module outputs a list of packages to remove, if any, without actually removing them.
cleanup-kernel-packages
The script workflow includes the following tasks:
Task order
Task name
Description
1
Get kernels to cleanupCollect installed kernel packages and detect the candidates for removal.
2
Get kernels to cleanup (LOG)Print the log from the first task.
3
Kernel packages to removePrint the list of packages collected by the first task.
4
Remove kernel packagesRemove packages that are detected as candidates for removal if the following conditions are met:
The script detects at least one candidate for removal
You add the
--cleanupflag to the cleanup-kernel-packages command
If the system outputs any packages to remove, carefully assess the list from the output of the
Kernel packages to removetask.Caution
The script removes all detected packages. There is no possibility to modify the list of candidates for removal.
Example of system response with no found packages to remove
PLAY [localhost] TASK [Get kernels to cleanup] ok: [localhost] TASK [Get kernels to cleanup (LOG)] ok: [localhost] => { "cleanup_kernels.log": [ "2023-09-27 12:49:31,925 [INFO] Logging enabled", "2023-09-27 12:49:31,937 [DEBUG] Found kernel package linux-headers-5.15.0-83-generic, version 5.15.0.post83-generic", "2023-09-27 12:49:31,938 [DEBUG] Found kernel package linux-image-5.15.0-83-generic, version 5.15.0.post83-generic", "2023-09-27 12:49:31,938 [DEBUG] Found kernel package linux-modules-5.15.0-83-generic, version 5.15.0.post83-generic", "2023-09-27 12:49:31,938 [DEBUG] Found kernel package linux-modules-extra-5.15.0-83-generic, version 5.15.0.post83-generic", "2023-09-27 12:49:31,944 [DEBUG] Current kernel is 5.15.0.post83-generic", "2023-09-27 12:49:31,944 [INFO] No kernel packages prior version '5.15.0.post83' found, nothing to remove.", "2023-09-27 12:49:31,944 [INFO] Exiting successfully" ] } TASK [Kernel packages to remove] ok: [localhost] => { "cleanup_kernels.packages": [] } TASK [Remove kernel packages] skipping: [localhost]
Example of system response with several packages to remove
TASK [Get kernels to cleanup] ok: [localhost] TASK [Get kernels to cleanup (LOG)] ok: [localhost] => { "cleanup_kernels.log": [ "2023-09-28 10:08:42,849 [INFO] Logging enabled", "2023-09-28 10:08:42,865 [DEBUG] Found kernel package linux-headers-5.15.0-79-generic, version 5.15.0.post79-generic", "2023-09-28 10:08:42,865 [DEBUG] Found kernel package linux-headers-5.15.0-83-generic, version 5.15.0.post83-generic", "2023-09-28 10:08:42,865 [DEBUG] Found kernel package linux-hwe-5.15-headers-5.15.0-79, version 5.15.0.post79", "2023-09-28 10:08:42,865 [DEBUG] Found kernel package linux-hwe-5.15-headers-5.15.0-83, version 5.15.0.post83", "2023-09-28 10:08:42,866 [DEBUG] Found kernel package linux-image-5.15.0-79-generic, version 5.15.0.post79-generic", "2023-09-28 10:08:42,866 [DEBUG] Found kernel package linux-image-5.15.0-83-generic, version 5.15.0.post83-generic", "2023-09-28 10:08:42,866 [DEBUG] Found kernel package linux-modules-5.15.0-79-generic, version 5.15.0.post79-generic", "2023-09-28 10:08:42,866 [DEBUG] Found kernel package linux-modules-5.15.0-83-generic, version 5.15.0.post83-generic", "2023-09-28 10:08:42,866 [DEBUG] Found kernel package linux-modules-extra-5.15.0-79-generic, version 5.15.0.post79-generic", "2023-09-28 10:08:42,866 [DEBUG] Found kernel package linux-modules-extra-5.15.0-83-generic, version 5.15.0.post83-generic", "2023-09-28 10:08:42,871 [DEBUG] Current kernel is 5.15.0.post83-generic", "2023-09-28 10:08:42,871 [INFO] Kernel package version prior '5.15.0.post83': 5.15.0.post79", "2023-09-28 10:08:42,872 [INFO] No kernel packages after version '5.15.0.post83' found.", "2023-09-28 10:08:42,872 [INFO] Kernel package versions to remove: 5.15.0.post79", "2023-09-28 10:08:42,872 [DEBUG] The following packages are candidates for autoremoval: linux-headers-5.15.0-79-generic, linux-hwe-5.15-headers-5.15.0-79,linux-image-5.15.0-79-generic, linux-modules-5.15.0-79-generic, linux-modules-extra-5.15.0-79-generic", "2023-09-28 10:08:45,338 [DEBUG] The following packages are resolved reverse dependencies for autoremove candidates: linux-modules-5.15.0-79-generic, linux-modules-extra-5.15.0-79-generic, linux-hwe-5.15-headers-5.15.0-79, linux-headers-5.15.0-79-generic, linux-image-5.15.0-79-generic", "2023-09-28 10:08:45,338 [INFO] No protected packages found", "2023-09-28 10:08:45,339 [INFO] Exiting successfully" ] } TASK [Kernel packages to remove] ok: [localhost] => { "cleanup_kernels.packages": [ "linux-headers-5.15.0-79-generic", "linux-hwe-5.15-headers-5.15.0-79", "linux-image-5.15.0-79-generic", "linux-modules-5.15.0-79-generic", "linux-modules-extra-5.15.0-79-generic" ] } TASK [Remove kernel packages] **************** skipping: [localhost]
If you decide to proceed with removal of package candidates, rerun the script with the
--cleanupflag:cleanup-kernel-packages --cleanup
Host operating system configuration
Available since MCC 2.26.0 (17.1.0 and 16.1.0) TechPreview
Important
The cloud operator takes all risks and responsibility for module execution on cluster machines. For any questions, contact Mirantis support.
Caution
Due to the known issue 49678
addressed in MOSK 25.1, the HostOSConfiguration object may not work
as expected after migration to containerd. For details, see the issue
description.
The host operating system (OS) configuration API extends configuration management of baremetal-based clusters and machines after initial deployment. The feature allows managing the operating system of a bare metal host granularly using modules without rebuilding the node from scratch. Such approach prevents workload evacuation and significantly reduces configuration time.
The host OS configuration API does not limit the cloud operator’s ability to configure machines in any way, making the operator responsible for day-2 adjustments.
This section provides guidelines for MOSK or custom modules
that are used by the HostOSConfiguration and HostOSConfigurationModules
custom resources designed for MOSK clusters.
Host OS configuration management workflow
Available since MCC 2.26.0 (17.1.0 and 16.1.0) TechPreview
The workflow of the host operating system (OS) configuration API that use modules provided by MOSK or custom modules is as follows:
Select one of the following options:
If you do not intend to use custom modules, skip to step 2.
If you intend to use custom modules:
Contact the module creator to obtain the link to the module and its SHA256.
Add the module to an existing
HostOSConfigurationModules(hocm) object or create a newhocmobject. For details, see HostOSConfigurationModules and Add a custom module to a MOSK deployment.
Add the configuration of the Container Cloud or custom module to an existing
HostOSConfiguration(hoc) object or create a newhocobject with the following details:Add the required configuration details of the module.
Set the selector for machines to apply the configuration.
For details, see HostOSConfiguration along with HostOSConfiguration and HostOSConfigurationModules concepts.
Optional. Retrigger the same successfully applied module configuration. For details, see Retrigger a module configuration.
Create a custom configuration module as required. For reference, see Format and structure of a module package and Modules provided by MOSK.
Publish the module in a repository from which the cloud operator can fetch the module.
Share the module details with the cloud operator.
The following diagram illustrates the high-level overview of the host OS configuration operations API:
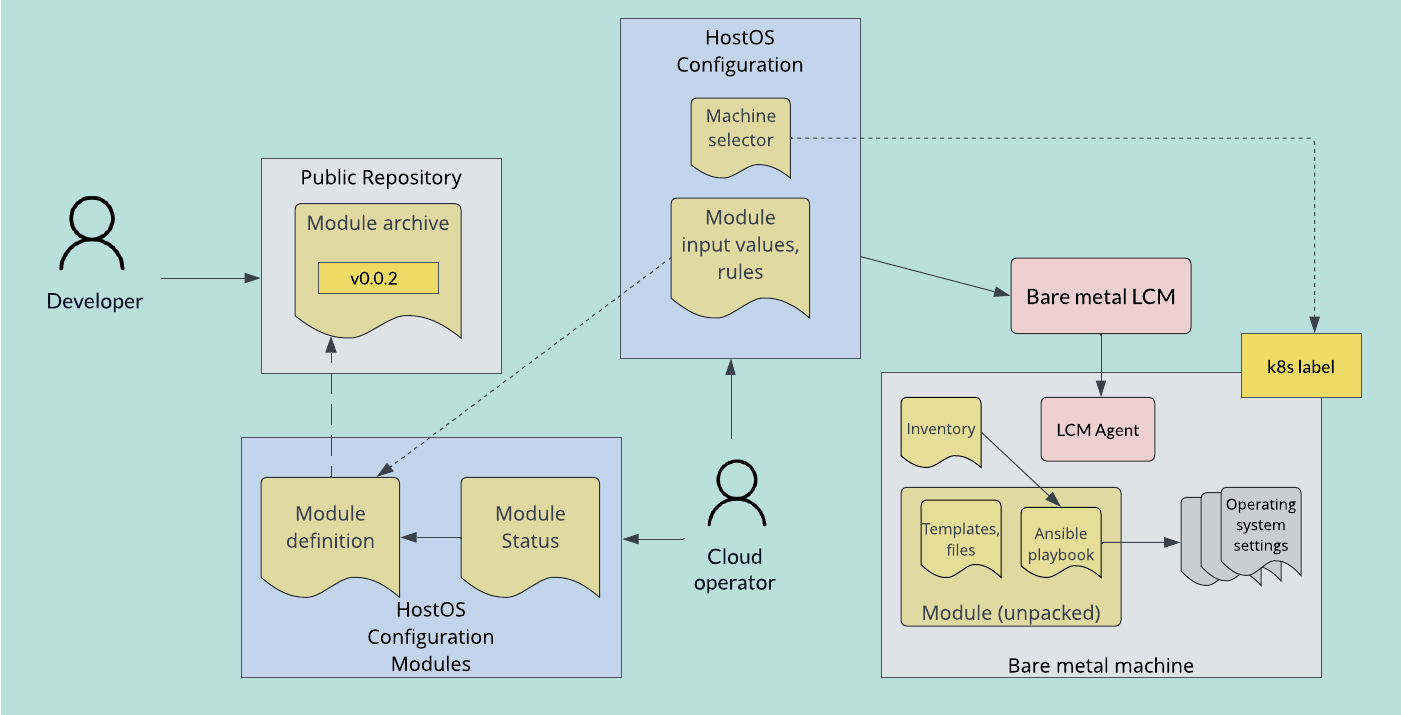
Global recommendations for implementation of custom modules
The following global recommendations are intended to help creators of modules and cloud operators to work with the host operating system (OS) configuration management API for module implementation and execution, in order to keep the cluster and machines healthy and ensure safe and reliable cluster operability.
Module functionality is limited only by the Ansible itself along with playbook rules for a particular Ansible version. But Mirantis highly recommends paying a special attention to critical components of Container Cloud, some of which are mentioned below, and not managing them by the means of host OS configuration modules.
Important
The cloud operator takes all risks and responsibility for module execution on cluster machines. For any questions, contact Mirantis support.
Do not restart Docker, containerd, and Kubernetes-related services.
Do not configure Docker and Kubernetes node labels.
Do not reconfigure or upgrade MKE.
Do not change the MKE bundle.
Do not reboot nodes using a host OS configuration module.
Do not change network configuration, especially on critical LCM and external networks, so that they remain consistent with
kaas-ipamobjects.Do not change iptables, especially for Docker, Kubernetes, and Calico rules.
Do not change partitions on the fly, especially the
/and/var/lib/dockerones.
Since Container Cloud 2.27.0 (Cluster releases 17.2.0 and 16.2.0), the following Ansible versions are supported for Ubuntu 20.04 and 22.04: Ansible 2.12.10 and Ansible 5.10.0-collection. Therefore, your custom modules must be compatible with the corresponding Ansible versions provided for a specific Cluster release, on which your cluster is based.
To verify the Ansible version in a specific Cluster release, refer to the Release artifacts > Management cluster artifacts > System and MCR artifacts section of the required release. For example, ClusterRelease artifacts.
Available since MCC 2.28.0 (17.3.0 and 16.3.0)
By default, any Ansible execution in Container Cloud uses
/etc/ansible/mcc.cfg as Ansible configuration. A custom module may require
a specific Ansible configuration that you can add using ansible.cfg in the
root folder of the module and package it in the module archive. Such
configuration has higher priority than the default one.
Treat a host OS configuration module as an Ansible module to control a limited set of system resources related to one component, for example, a service or driver, so that a module contains a very limited amount of tasks to set up that component.
For example, if you need to configure a service on a host, the module must manage only package installation, related configuration files, and service enablement. Do not implement the module in a way so that it manages all tasks required for the day-2 configuration of a host. Split such functionality on tasks (modules) responsible for management of a single component. This helps to re-apply (re-run) every module separately in case of any changes.
Mirantis highly recommends using the following key principles during module implementation:
- Idempotency
Any module re-run with the same configuration values must lead to the same result.
- Granularity
The module must manage only one specific component on a host.
- Reset action
The module must be able to revert changes introduced by the module, or at least the module must be able to disable the component controller. The Container Cloud LCM does not provide a way to revert a day-2 change due to unpredictability of potential functionality of any module. Therefore, the reset action must be implemented on the module level. For example, the package or file state can be
presentorabsent, a service can beenabledordisabled. And these states must be controlled by the configuration values.
Mirantis highly recommends verifying any Container Cloud or custom module on one machine before applying it to all target machines. For the testing procedure, see Test a custom or MOSK module after creation.
A custom module may require node reboot after execution.
Implement a custom module using the following options, so that it can notify
lcm-agent and Container Cloud controllers about the required reboot:
If a module installs a package that requires a host reboot, then the
/run/reboot-requiredand/var/run/reboot-required.pkgsfiles are created automatically by the package manager. LCM Agent detects these files and places information about the reboot reason in theLCMMachinestatus.A module can create the
/run/reboot-requiredfile on the node. You can add the reason for reboot in one of the following files as plain text:/run/day2/reboot-requiredSince Container Cloud 2.28.0 (Cluster releases 17.3.0 and 16.3.0)/run/lcm/reboot-requiredDeprecated since Container Cloud 2.28.0
This text is passed to the reboot reason in the
LCMMachinestatus.
Once done, you can handle a machine reboot using GracefulRebootRequest. For
details, see GracefulRebootRequest resource.
Available since MCC 2.28.0 (17.3.0 and 16.3.0)
You can deprecate a module. Deprecation is soft, meaning that no actual restrictions are applied to the usage of a deprecated module.
To deprecate a module, add the deprecates field to the metadata.yaml
file of the custom module. For example:
name: module-sample
version: 1.0.0
description: 'Module for sample purposes'
playbook: main.yaml
deprecates:
- name: another-module-to-deprecate
version: 0.1.0
- version: 0.1.0
If the name field is absent, then the deprecation logic is applied to the
module with the same name, meaning that the example above effectively equals
to the following one:
name: module-sample
version: 1.0.0
description: 'Module for sample purposes'
playbook: main.yaml
deprecates:
- name: another-module-to-deprecate
version: 0.1.0
- name: module-sample
version: 0.1.0
Deprecating a version automatically deprecates all lower SemVer versions of the specified module.
Format and structure of a module package
Available since MCC 2.26.0 (17.1.0 and 16.1.0) TechPreview
A module package for host operating system configuration management is an archive that contains Ansible playbooks, metadata, and optionally a JSON-validation schema.
Archive the file with the module package in the GZIP format.
Implement all playbooks for Ansible version used by a specific Cluster release of your Container Cloud cluster. For example, in Cluster releases 16.2.0 and 17.2.0, Ansible collection 5.10.0 and Ansible core 2.12.10 are used.
To verify the Ansible version in a specific Cluster release, refer to the Release artifacts > Management cluster artifacts > System and MCR artifacts section of the required release. For example, ClusterRelease artifacts.
Note
Mirantis recommends implementing each module in modular approach avoiding a single module for everything. This ensures maintainability and readability, as well as improves testing and debugging. For details, refer to Global recommendations for implementation of custom modules.
The common structure within a module archive is as follows:
main.yamlFile name of the primary playbook that defines tasks to be executed.
metadata.yamlMetadata of the module such as name, version, and relevant documentation URLs.
schema.jsonOptional. JSON schema for validating module-specific configurations that are restricted values.
The common structure of metadata.yaml is as follows:
nameRequired. Name of the module.
versionRequired. Version of the module.
docURLOptional. URL to the module documentation.
descriptionOptional. Brief summary of the module, useful if the complete documentation is too detailed.
playbookRequired. Path to the module playbook. Path must be related to the archive root that is
directory/playbook.yamlifdirectoryis a directory in the root of the archive.
valuesJsonSchemaOptional. Path to the JSON-validation schema of the module. Path must be related to the archive root that is
directory/schema.jsonifdirectoryis a directory in the root of the archive.
deprecatesOptional. Available since Container Cloud 2.28.0 (Cluster releases 17.3.0 and 16.3.0). List of modules that are deprecated by the module. For details, see Module deprecation.
supportedDistributionsOptional. Available since Container Cloud 2.28.0 (Cluster releases 17.3.0 and 16.3.0). List of operating system distributions that are supported by the current module. An empty list means support of any distribution by the current module.
Example of metadata.yaml:
name: module-sample
version: 1.0.0
docURL: https://docs.mirantis.com
description: 'Module for sample purposes'
playbook: main.yaml
valuesJsonSchema: schema.json
deprecates:
- name: another-module-to-deprecate
version: 0.1.0
For description of JSON schema and its format, refer to JSON Schema official documentation.
Example of schema.json:
{
"$schema": "http://json-schema.org/draft-07/schema#",
"type": "object",
"properties": {
"kernel.panic": {"type": "string", "const": "1"}
}
}
A playbook for a module must follow the rules of a particular Ansible
version as mentioned in Requirements.
The only specific requirement for playbook format is to use the values
variable that consists of values described in the
inventory file.
Note
As hosts are selected in a HostOSConfiguration object, Mirantis
recommends using hosts: all in module playbooks.
For example:
- name: <variable-name>
hosts: all
become: true
tasks:
- name: <value-name>
module:
name: "{{ item.key }}"
value: "{{ item.value }}"
state: present
reload: yes
with_dict: "{{ values }}"
An archive of a module does not require an inventory because the inventory
is generated by lcm-controller while processing configurations.
The format of the generated inventory is as follows:
all:
hosts:
localhost:
ansible_connection: local
vars:
values:
{{- range $key, $value := .Values }}
{{ $key }}: {{ $value }}
{{- end }}
The .Values parameter contains the values from the provided module
configuration of the HostOSConfiguration object. For details, see
HostOSConfiguration.
Modules provided by MOSK
Available since MCC 2.27.0 (17.2.0 and 16.2.0) TechPreview
MOSK provides several configuration modules that use the
designated hocm object named mcc-modules. Modules listed in this object
are supported by Mirantis and released independently from the
MOSK product release cycle. Once a new module or a new
version of an existing module becomes available, the mcc-modules hocm
object is updated automatically. This update does not trigger any LCM
operations, such as MOSK update, on clusters or machines.
All other hocm objects contain custom modules. For configuration modules
provided by Mirantis, refer to mosk-host-os-modules documentation.
Warning
Do not modify the mcc-modules object that contains only
Mirantis-provided modules. Any changes to this object will be overwritten
with data from an external source.
HostOSConfiguration and HostOSConfigurationModules concepts
Available since MCC 2.26.0 (17.1.0 and 16.1.0) TechPreview
This section outlines fundamental concepts of the HostOSConfiguration, aka
hoc, and HostOSConfigurationModules, aka hocm, custom resources
as well as provides usage guidelines for these resources. For detailed
descriptions of these resources, see HostOSConfiguration and
HostOSConfigurationModules.
MOSK provides modules, which are described in
mosk-host-os-modules documentation
, using the designated hocm object named mcc-modules. All other
hocm objects contain custom modules.
Warning
Do not modify the mcc-modules object that contains only
Mirantis-provided modules. Any changes to this object will be overwritten
with data from an external source.
When the value of the machineSelector field in a hoc object is empty
(by default), no machines are selected. Therefore, no actions are triggered
until you provide a non-empty machineSelector.
This approach differs from the default behavior of Kubernetes selectors to ensure that none of configurations are applied to all machines in a cluster accidentally.
It is crucial to ensure that the namespace of a hoc object is the same as
the namespace of the associated Machine objects defined in the
machineSelector field.
For example, the following machines are located in two separate namespaces,
default and other-ns, and the hoc object is located in
other-ns:
NAMESPACE NAME LABELS
default machine.cluster.k8s.io/master-0 example-label="1"
default machine.cluster.k8s.io/master-1 example-label="1"
default machine.cluster.k8s.io/master-2 example-label="1"
other-ns machine.cluster.k8s.io/worker-0 example-label="1"
other-ns machine.cluster.k8s.io/worker-1 example-label="1"
other-ns machine.cluster.k8s.io/worker-2 example-label="1"
NAMESPACE NAME LABELS
other-ns hostosconfigurations.kaas.mirantis.com/example <none>
And although machineSelector in the hoc object contains
example-label="1", which is set for machines in both namespaces, but only
worker-0, worker-1, worker-2 will be selected because the hoc
object is located in the other-ns namespace.
machineSelector:
matchLabels:
example-label: "1"
You may use arbitrary types for primitive (non-nested) values. But for optimal
compatibility and clarity, Mirantis recommends using string values for
primitives in the values section of a hoc object. This practice helps
maintain consistency and simplifies the interpretation of configurations.
Under the hood, all primitive values are converted to strings.
For example:
values:
# instead of
# primitive-float-value: 1.05
primitive-float-value: "1.05"
# instead of
# primitive-boolean-value: true
primitive-boolean-value: "true"
object-value:
object-key: "string-data"
You can pass the values of any host operating system configuration module to
the HostOSConfiguration object using both the values and
secretValues fields simultaneously. But if a key is present in both fields,
the value from secretValues is applied.
The values field supports the YAML format for values with any nesting
level. The HostOSConfiguration controller and provider use the YAML parser
underneath to manage the values. The following examples illustrate simple and
nested configuration formats:
Simple key-value map:
apiVersion: kaas.mirantis.com/v1alpha1 kind: HostOSConfiguration ... spec: configs: - module: somemodule moduleVersion: 1.0.0 values: key1: value1 key2: value2
Nested YAML:
apiVersion: kaas.mirantis.com/v1alpha1 kind: HostOSConfiguration ... spec: configs: - module: somemodule moduleVersion: 1.0.0 values: nestedkey1: nestedkey2: - value1 - value2 key2: value3
The secretValues field is a reference (namespace and name) to the
Secret object.
Warning
The referenced Secret object must contain only
primitive non-nested values. Otherwise, the values will not be applied
correctly. Therefore, implement your custom modules in a way that secret
parameters are on the top level and not used within nested module
parameters.
You can create a Secret object in the YAML format. For example:
apiVersion: v1
data:
key1: <base64-encoded-string-value1>
key2: <base64-encoded-string-value2>
kind: Secret
metadata:
name: top-secret
namespace: default
type: Opaque
Caution
Manually encode secret values using the base64 format and ensure
that the value does not contain trailing whitespaces or line translation
such as the \n symbol. For example:
echo -n "secret" | base64
You can also create the Secret object using the kubectl command.
This way, the secret values are automatically base64-encoded:
kubectl create secret generic top-secret --from-literal=key1=value1 --from-literal=key2=value2
The following example illustrates the use of a secret in
HostOSConfiguration:
apiVersion: kaas.mirantis.com/v1alpha1
kind: HostOSConfiguration
...
spec:
configs:
- module: somemodule
moduleVersion: 1.0.0
secretValues:
name: top-secret
namespace: default
values:
key3: value3
key4: value4
For details about execution order of configurations, see API Reference: HostOSConfiguration - spec.configs.order.
Available since MCC 2.28.0 (17.3.0 and 16.3.0)
To identify whether a cluster has hoc objects with deprecated modules:
kubectl get hoc -A -o go-template="{{range .items}}HOC {{.metadata.namespace}}/{{.metadata.name}} has deprecated modules: {{if .status.containsDeprecatedModules}}yes{{else}}no{{end}}{{\"\n\"}}{{end}}"
Example output:
HOC default/hoc-example1 has deprecated modules: yes
HOC default/hoc-example2 has deprecated modules: yes
HOC default/hoc-example3 has deprecated modules: no
HOC default/hoc-example4 has deprecated modules: yes
To identify specific deprecated modules:
kubectl get hoc -A -o go-template="{{range .items}}HOC {{.metadata.namespace}}/{{.metadata.name}} deprecated modules:{{\"\n\"}}{{range .status.configs}}{{if .moduleDeprecatedBy}}{{.moduleName}}-{{.moduleVersion}}{{\"\n\"}}{{end}}{{end}}{{end}}"
Example output:
HOC default/hoc-example1 deprecated modules:
foo-1.1.0
HOC default/hoc-example2 deprecated modules:
bar-1.1.0
HOC default/hoc-example3 deprecated modules:
HOC default/hoc-example4 deprecated modules:
baz-1.1.0
qux-1.1.0
Internal API for host OS configuration management
Available since MCC 2.26.0 (17.1.0 and 16.1.0) TechPreview
This section describes integrations between the HostOSConfiguration
custom resouce, aka hoc, HostOSConfigurationModules custom resouce,
aka hocm, LCMCluster, and LCMMachine.
The implementation of the internal API used by host operating system
configuration management utilizes the current approach of StateItems,
including the way how they are processed and passed to lcm-agent.
The workflow of the internal API implementation is as follows:
Create a set of
StateItementries inLCMClustertaking into account allhocobjects in the namespace ofLCMCluster.Fill out
StateItemsfor eachLCMMachinethat was selected by themachineSelectorfield value of ahocobject.Pass
StateItemstolcm-agentthat is responsible for their execution on nodes.
The machineSelector field selects Machine objects, but they map to
LCMMachine objects in 1-1 relation. This way, each selected Machine
exactly maps to a relevant LCMMachine object.
LCMCluster utilizes empty StateItem to establish
a baseline connection between the hoc, LCMMachine objects
and lcm-agent on nodes. These empty items have no parameters and
serve as placeholders, providing a template for further processing.
To identify items added from hoc objects, these StateItems along with
other state items of an LCMCluster object are located in the
.spec.machinesTypes.control and .spec.machinesTypes.worker blocks
with the following fields in an LCMCluster object:
paramsis absentphaseisreconfigureas the only supported valueversionisv1as the only supported valuerunnercan be eitherdownloaderoransible:downloaderdownloads the package of a module of the provided version into machine.ansibleexecutes the module on the machine with provided values.
namehas the following patterns:host-os-<hocObjectName>-<moduleName>-<moduleVersion>-<modulePhase>if therunnerfield has theansiblevalue sethost-os-download-<hocObjectName>-<moduleName>-<moduleVersion> -<modulePhase>if therunnerfield has thedownloadervalue set.
The following example of an LCMCluster object illustrates empty
StateItems for the following configuration:
Machine type -
workerhocobject name -testwith a single entry in theconfigsfieldModule name -
sample-moduleModule version -
1.0.0
spec:
machineTypes:
worker:
- name: host-os-download-test-sample-module-1.0.0-reconfigure
runner: downloader
version: "v1"
phase: reconfigure
- name: host-os-test-sample-module-1.0.0-reconfigure
runner: ansible
version: "v1"
phase: reconfigure
To properly execute the StateItem list according to given configurations
from a hoc object, the implementation utilizes the
.spec.stateItemsOverwrites field in an LCMMachine object.
For each state item that corresponds to a hoc object selected for current
machine, each entry of the stateItemsOverwrites field dictionary is filled
in with key-value pairs:
Key is a
StateItemnameValue is a set of parameters from the module configuration values that will be passed as parameters to
StateItem.
After the stateItemsOverwrites field is updated, the corresponding
StateItem entries are filled out with values from the
stateItemsOverwrites.
Once the StateItem list is updated, it is passed to lcm-agent to be
finally applied on nodes.
The following example of an LCMMachine object illustrates the
stateItemsOverwrites field having a hoc object with a single entry
in the configs field, configuring a module named sample-module with
version 1.0.0:
spec:
stateItemsOverwrites:
host-os-download-test-sample-module-1.0.0-reconfigure:
playbook: directory/playbook-name.yaml
ansible: /usr/bin/ansible-playbook
host-os-test-sample-module-1.0.0-reconfigure:
path: "/root/host-os-modules/sample-module-1.0.0"
sha256: <sha256sum>
url: https://example.mirantis.com/path/to/sample-module.tgz
While processing the hoc object, baremetal-provider verifies the
hoc resource for both controlled LCMCluster and LCMMachine
resources.
Each change to a hoc object immediately triggers its resources if
host-os-modules-controller has successfully validated changes.
This behavior enables updates to existing LCMCluster and LCMMachine
objects described in the sections above. Thus, all empty StateItems,
overwrites, and filled out StateItems appear almost instantly.
This behavior also applies when removing a hoc object, thereby cleaning
everything related to the object. The object deletion is suspended until the
corresponding StateItems of a particular LCMMachine object is cleaned
up from the object status field.
Warning
A configuration that is already applied using the deleted hoc
object will not be reverted from nodes, because the feature does not provide
rollback mechanism. For module implementation details, refer to
Global recommendations for implementation of custom modules.
Add a custom module to a MOSK deployment
TechPreview since MCC 2.26.0 (17.1.0 and 16.1.0)
Important
The cloud operator takes all risks and responsibility for module execution on cluster machines. For any questions, contact Mirantis support.
You can create a new hocm object or add a new entry with a custom-made
module to the .spec.modules list in the existing hocm object. For the
object specification, see HostOSConfigurationModules.
Warning
Do not modify the mcc-modules object that contains only
Mirantis-provided modules. Any changes to this object will be overwritten
with data from an external source.
To add a custom module to a MOSK deployment:
If you use a proxy on the management and/or managed cluster, ensure that the custom module can be downloaded through that proxy, or domain address of the module URL is added to the
NO_PROXYvalue of the relatedProxyobjects.This way, the HostOSConfiguration Controller can download and verify the module and its input parameters on the management cluster. After that, the LCM Agent can download the module to any cluster machines for execution.
Caution
A management and managed cluster can use different
Proxyobjects. In this case, both proxies must satisfy the requirement above. For theProxyobject details, see Proxy support and cache of artifacts.In the
hocmobject, set thenameandversionfields with the same values from the corresponding fields inmetadata.yamlof the module archive. For details, see Metadata file format.Set the
urlfield with the URL to the archive file of the module. For details, see Format and structure of a module package.Set the
sha256sumfield with the calculated SHA256 hash sum of the archive file.To obtain the SHA256 hash sum, you can use the following example command:
curl -sSL https://fully.qualified.domain.name/to/module/archive/name-1.0.0.tgz | shasum -a 256 | tr -d ' -' bc5fafd15666cb73379d2e63571a0de96fff96ac28e5bce603498cc1f34de299
After applying the changes, monitor the hocm object status to ensure that
the new module has been successfully validated and is ready to use. For the
hocm status description, see HostOSConfigurationModules status.
After you add a custom module to a Container Cloud deployment, the process of fetching a module archive involves the following automatic steps:
Retrieve the
.tgzarchive of the module and unpack it into a temporary directory.Retrieve the metadata.yaml file and validate its contents. Once done, the status of the module in the
hocmobject reflects whether the archive fetching and validating succeeded or failed.
The validation process includes the following verifications:
Validate that the SHA256 hash sum of the archive equals the value defined in the
sha256sumfield.Validate that the
playbookkey is present.Validate that the file defined in the
playbookkey value exists in the archive and has a non-zero length.Validate that the
nameandversionvalues frommetadata.yamlequal the corresponding fields in thehocmobject.If the
valuesJsonSchemakey is defined, validate that the file from the key value exists in the archive and has a non-zero length.
Test a custom or MOSK module after creation
Available since MCC 2.26.0 (17.1.0 and 16.1.0) TechPreview
Important
The cloud operator takes all risks and responsibility for module execution on cluster machines. For any questions, contact Mirantis support.
After you create a custom or configure a MOSK module, verify it on one machine before applying it to all target machines. This approach ensures safe and reliable cluster operability.
To test a module:
Add a custom label to one
Machineobject:kubectl edit machine master-0
apiVersion: cluster.k8s.io/v1alpha1 kind: Machine metadata: ... labels: ... day2-module-testing-example: "true" name: master-0 namespace: default ...
Create the
HostOSConfigurationobject withmachineSelectorfor that custom label. For example:apiVersion: kaas.mirantis.com/v1alpha1 kind: HostOSConfiguration metadata: name: day2-test namespace: default spec: ... machineSelector: matchLabels: day2-module-testing-example: "true"
Verify that the
statusfield of modules execution is healthy, validate logs, and verify that the machine is in thereadystate.If the execution result meets your expectations, continue applying
HostOSConfigurationon other machines using one of the following options:Use the same
HostOSConfigurationobject:Change the
matchLabelsvalue in themachineSelectorfield to match all target machines.Assign the labels from the
matchLabelsvalue to other target machines.
Create a new
HostOSConfigurationobject.
Note
Mirantis highly recommends using specific custom labels on machines
and in the HostOSConfiguration selector, so that HostOSConfiguration
is applied only to the machines with the specific custom label.
Retrigger a module configuration
Important
The cloud operator takes all risks and responsibility for module execution on cluster machines. For any questions, contact Mirantis support.
There is no API to reexecute the same successfully applied module configuration
upon user request. Once executed, the same configuration will never be executed
prior to either of the following actions is taken on the hoc object:
Change the module-related
valuesof theconfigsfield listChange the data of the
Secretobject referenced by the module-relatedsecretValuesof theconfigsfield list
To retrigger exactly the same configuration for a module, select one of the following options:
Reapply
machineSelector:Save the current selector value.
Update the selector to match no machines (empty value) or those machines where configuration should not be reapplied.
Update the selector to the previously saved value.
Re-create the
hocobject:Dump the whole
hocobject.Remove the
hocobject.Reapply the
hocobject from the dump.
Caution
The above steps retrigger all configuration from the configs
field of the hoc object. To avoid such behavior, Mirantis recommends
the following procedure:
Copy a particular module configuration to a new
hocobject and remove the previousmachineSelectorfield.Remove this configuration from the original
hocobject.Add the required values to the
machineSelectorfield in the new object.
Troubleshooting
This section describes possible issues you may encounter while managing host operating system (OS) configuration as well as approaches on how to address these issues.
In .status.modules, verify whether all modules have been loaded and
verified successfully. Each module must have the available value in the
state field. If not, the error field contains the reason of the issue.
Example of different erroneous states in a hocm object:
status:
modules:
# error state: hashes mismatched
- error: 'hashes are not the same: got ''d78352e51792bbe64e573b841d12f54af089923c73bc185bac2dc5d0e6be84cd''
want ''c726ab9dfbfae1d1ed651bdedd0f8b99af589e35cb6c07167ce0ac6c970129ac'''
name: sysctl
sha256sum: d78352e51792bbe64e573b841d12f54af089923c73bc185bac2dc5d0e6be84cd
state: error
url: <url-to-package>
version: 1.0.0
# error state: an archive is not available because of misconfigured proxy
- error: 'failed to perform request to fetch the module archive: Get "<url-to-package>": Forbidden'
name: custom-module
state: error
url: <url-to-package>
version: 0.0.1
# successfully loaded and verified module
- description: Module for package installation
docURL: https://docs.mirantis.com
name: package
playbookName: main.yaml
sha256sum: 2c7c91206ce7a81a90e0068cd4ce7ca05eab36c4da1893555824b5ab82c7cc0e
state: available
url: <url-to-package>
valuesValidationSchema: <gzip+base64 encoded data>
version: 1.0.0
If a module is in the error state, it might affect the corresponding
hoc object that contains the module configuration.
Example of erroneous status in a hoc object:
status:
configs:
- moduleName: sysctl
moduleVersion: 1.0.0
modulesReference: mcc-modules
error: module is not found or not verified in any HostOSConfigurationModules object
To resolve an issue described in the error field:
Address the root cause. For example, ensure that a package has the correct hash sum, or adjust the proxy configuration to fetch the package, and so on.
Recreate the
hocmobject with correct settings.
Setting syncPeriod for debug sessions
During test or debug sessions where errors are inevitable, you can set a
reasonable sync period for host-os-modules-controller to avoid manual
recreation of hocm objects.
To enable the option, set the syncPeriod parameter in the
spec:providerSpec:value:kaas:regional:helmReleases: section of the
management Cluster object:
spec:
providerSpec:
value:
kaas:
regional:
- provider: baremetal
helmReleases:
- name: host-os-modules-controller
values:
syncPeriod: 2m
Normally, syncPeriod is not required in the cluster settings. Therefore,
you can remove this option after completing a debug session.
After creation of a hoc object with various configurations,
perform the following steps with reference to HostOSConfiguration status:
Verify that the
.status.isValidfield has thetruevalue.Verify that the
.status.configs[*].errorfields are absent.Verify that all
.status.machinesStates.<machineName>.configStateItemsStatuseshave noFailedstatus.
For details on the HostOSConfiguration status, refer to HostOSConfiguration status.
Also, verify the LCM-related objects:
Verify that the corresponding
LCMClusterobject has all related StateItems.Verify that all selected
LCMMachineshave the .spec.stateItemsOverwrites field, in which allStateItemsfrom the previous step are present.Verify that all
StateItemsfrom the previous step have been successfully processed bylcm-agent. Otherwise, a manual intervention is required.
To address an issue with a specific StateItem for which the lcm-agent
is reporting an error, log in to the corresponding node and
inspect Ansible execution logs:
ssh -i <path-to-ssh-key> mcc-user@<ip-addr-of-the-node>
sudo -i
cd /var/log/lcm/runners/
# from 2 directories, select the one
# with subdirectories having 'host-os-' prefix
cd <selected-dir>/<name-of-the-erroneous-state-item>
less <logs-file>
After the inspection, either resolve the issue manually or escalate the issue to Mirantis support.
The host OS configuration management API allows enabling logs of debug level,
which is integrated into the baremetal-provider controller and
host-os-modules-controller. Both may be helpful during debug sessions.
To enable log debugging in host-os-modules-controller, add the following
snippet to the Cluster object:
providerSpec:
# ...
value:
# ...
kaas:
regional:
- helmReleases:
- name: host-os-modules-controller
values:
logLevel: 2
To enable log debugging in baremetal-provider, add the following snippet
to the Cluster object:
providerSpec:
# ...
value:
# ...
kaas:
regional:
- helmReleases:
- name: baremetal-provider
values:
cluster_api_provider_baremetal:
log:
verbosity: 3
To obtain the logs related to host OS configuration management in
baremetal-provider, filter them by the .host-os. key:
kubectl logs -n kaas <baremetal-provider-pod> | grep ".host-os."
Migrate container runtime from Docker to containerd
Available since 2.28.4 (Cluster releases 17.3.4 and 16.3.4)
Caution
Due to the known issue 49678,
which is resolved in Container Cloud 2.29.0 after the management cluster
update to the Cluster release 16.4.0, the HostOSConfiguration object
may not work as expected after migration to containerd. For details, see the
issue description.
Migration of container runtime from Docker to containerd is implemented for existing management and managed clusters. The use of containerd allows for better Kubernetes performance and component update without pod restart when applying fixes for CVEs.
Note
On greenfield deployments, containerd is the default container runtime since Container Cloud 2.29.0 and MOSK 25.1. Before that, Docker remains the default option.
Precautions
Before the container runtime mirgation, consider the following precautions:
The migration involves machine cordoning and draining.
Cluster update is not allowed during migration to prevent machines from running different container runtimes. However, you can still scale clusters and replace nodes as required.
The migration is mandatory during the scope of Container Cloud 2.29.x. The management cluster update to Container Cloud 2.30.0 is blocked on clusters still running Docker as the container runtime.
Note
If you have not upgraded the operating system distribution on your machines to Jammy yet, Mirantis recommends migrating machines from Docker to containerd on managed clusters together with distribution upgrade to minimize the maintenance window.
In this case, ensure that all cluster machines are updated at once during the same maintenance window to prevent machines from running different container runtimes.
Upgrade container runtime between releases
The following procedure applies to both management and managed clusters.
Verify that the managed cluster is updated to the Cluster release 17.3.4 or later as described in Cluster update.
Note
Management clusters must be updated to the Cluster release 16.3.4 or later.
Verify that the managed cluster distribution is upgraded to Ubuntu Jammy as described in Upgrade an operating system distribution.
Open the required
Machineobject for editing.You can schedule more than one machine for migration at the same time. In this case, the process is automatically orchestrated without service interruption.
In the
metadata.annotationssection, add the following annotation to trigger migration to containerd runtime:apiVersion: cluster.k8s.io/v1alpha1 kind: Machine metadata: name: example-machine namespace: example-ns annotations: kaas.mirantis.com/preferred-container-runtime: containerd
The machine will be cordoned and drained, and container runtime will be migrated.
For description of the
Machineobject fields, see Machine resource.Once migration is completed, verify that
ContainerRuntimeContainerdcondition istrueinstatus.providerStatus.For description of the the
Machineobjectstatusfields, see Machine status.Repeat the procedure with the remaining machines.
Strongly recommended. Back up MKE as described in Mirantis Kubernetes Engine documentation: Back up MKE.
Since the procedure above modifies the cluster configuration, a fresh backup is required to restore the cluster in case further reconfigurations fail.
Caution
If an emergency related to containerd occurs on workloads before
migration is complete on all machines, you can temporarily roll back
containerd to Docker. Use the procedure above by changing the
kaas.mirantis.com/preferred-container-runtime annotation from
containerd to docker.
Change a user name and password for a bare metal host
This section describes how to change a user name and password of a bare metal
host using an existing BareMetalHostCredential object.
To change a user name and password for a bare metal host:
Open the
BareMetalHostCredentialobject of the required bare metal host for editing.In the
specsection:Update the
usernamefieldReplace
password.name: <secretName>withpassword.value: <hostPasswordInPlainText>
For example:
spec: username: admin password: value: superpassword
This action triggers creation of a new
Secretobject with updated credentials. After that, sensitivepassworddata is replaced with the newSecretobject name. For a detailed workflow description, see BareMetalHostCredential resource.Caution
Adding a password value is mandatory for a user name change. You can either create a new password value or copy the existing one from the related
Secretobject.Caution
Changing a user name in the related
Secretobject does not automatically update theBareMetalHostCredentialobject. Therefore, Mirantis recommends updating credentials only using the theBareMetalHostCredentialobject.Warning
The kubectl apply command automatically saves the applied data as plain text into the
kubectl.kubernetes.io/last-applied-configurationannotation of the corresponding object. This may result in revealing sensitive data in this annotation when creating or modifying the object.Therefore, do not use kubectl apply on this object. Use kubectl create, kubectl patch, or kubectl edit instead.
If you used kubectl apply on this object, you can remove the
kubectl.kubernetes.io/last-applied-configurationannotation from the object using kubectl edit.
Restart the inspection of a bare metal host
You can use the Container Cloud API to restart an inspection of a bare metal host in MOSK clusters. For example, this procedure is useful when hardware was changed. This works for bare metal hosts that were not provisioned yet or were successfully deprovisioned.
The workflow of the reinspection procedure desribed above is as follows:
Ensure that the
BareMetalHostInventoryobject is not bound to anyMachineobject and it is in theavailablestate.Edit the
BareMetalHostInventoryobject to initiate an inspection of the bare metal server that hosts the node.
Note
Before update of the management cluster to Container Cloud 2.29.0
(Cluster release 16.4.0), instead of BareMetalHostInventory, use the
BareMetalHost object. For details, see BareMetalHost resource.
Caution
While the Cluster release of the management cluster is 16.4.0,
BareMetalHostInventory operations are allowed to
m:kaas@management-admin only. This limitation is lifted once the
management cluster is updated to the Cluster release 16.4.1 or later.
To restart the inspection of a bare metal host:
Using
kubeconfigof the management cluster, access the Container Cloud API and inspect theBareMetalHostobject:kubectl -n <project-name> get baremetalhost <bare-metal-host-name>
Example of the system response:
NAME STATE CONSUMER ONLINE ERROR AGE ... managed-worker-a-storage-worker preparing managed-worker-a-storage-worker false 5d3h managed-worker-b-storage-worker preparing managed-worker-b-storage-worker false 5d3h managed-worker-c-storage-worker available false 5d3h
In the system response above, the
managed-worker-c-storage-workerbare metal host is in theavailablestate and has noconsumer(not bound to anyMachine). Therefore, you can reinspect it.Open the required bare metal host object for editing:
kubectl -n <project-name> edit baremetalhostinventory <host-name>
kubectl -n <project-name> edit baremetalhost <host-name>
Annotate the object with the
inspect.metal3.ioannotation and ensure thatonlineequalstruein the objectspec:metadata: annotations: ... inspect.metal3.io: ""
spec: ... online: true
Once you save changes, approximately in one minute, the state of the bare metal host changes to
inspecting.Verify the state of the bare metal host:
kubectl -n <project-name> get baremetalhost <host-name>
Example of a system response:
NAME STATE CONSUMER ONLINE ERROR AGE managed-worker-c-storage-worker inspecting true 5d3h
Restart a bare metal host
You can use the Container Cloud API to restart a bare metal host in Mirantis OpenStack for Kubernetes clusters. The workflow of the host restart is as follows:
Set the maintenance mode on the cluster that contains the target node.
Set the maintenance mode on the target node for OpenStack and Container Cloud to drain it from workloads. No new workloads will be provisioned to a host in the maintenance mode.
Use the bare metal host object to initiate a hard reboot of the bare metal server that hosts the node.
To restart a bare metal host:
Using
kubeconfigof the Container Cloud management cluster, access the Container Cloud API and open theClusterobject for editing:kubectl -n <project-name> edit cluster <cluster-name>
Add the following field to the
specsection to set the maintenance mode on the cluster:spec: providerSpec: value: maintenance: true
Verify that the
Clusterobject status forMaintenanceisready: true:kubectl -n <project-name> get cluster <cluster-name>
Example of a negative system response:
... status: providerStatus: conditions: ... - message: 'Maintenance state of the cluster is false, expected: # true. Waiting for the cluster to enter the maintenance state' ready: false type: Maintenance ... maintenance: true
Open the required
Machineobject for editing:kubectl -n <project-name> edit machine <machine-name>
In the
spec:providerSpecsection, set the maintenance mode on the node:spec: providerSpec: value: maintenance: true
In the
annotationssection of theMachinedefinition, capture the bare metal host name connected to the machine:metadata: annotations: metal3.io/BareMetalHost: <project-name>/<host-name>
Verify that the
Machinemaintenance status istrue:status: maintenance: true
Important
Proceed with the node maintenance only after the machine switches to the maintenance mode.
Open the required bare metal host object for editing using the previously captured
<host-name>:kubectl -n <project-name> edit baremetalhostinventory <host-name>
Caution
While the Cluster release of the management cluster is 16.4.0,
BareMetalHostInventoryoperations are allowed tom:kaas@management-adminonly. This limitation is lifted once the management cluster is updated to the Cluster release 16.4.1 or later.kubectl -n <project-name> edit baremetalhost <host-name>
In the
specsection, set theonlinefield tofalse:spec: online: false
Wait for the host to shut down.
In the
specsection, set theonlinefield totrue:spec: online: true
Restore the machine from the maintenance mode by deleting the previously set
maintenance: trueline from theMachineobject:kubectl -n <project-name> edit machine <machine-name>Restore the cluster from the maintenance mode by deleting the previously set
maintenance: trueline from theClusterobject.kubectl -n <project-name> edit cluster <cluster-name>
Replace a failed manager node
This section describes how to replace a failed manager node in your
MOSK deployment. The procedure applies to the manager
nodes that are, for example, permanently failed due to a hardware failure and
remain in the NotReady state.
Note
If your cluster is deployed with a compact control plane, follow the Replace a failed controller node procedure.
To replace a failed manager node:
Verify that the affected manager node is in the
NotReadystate:kubectl get nodes <CONTAINER-CLOUD-NODE-NAME>
Example of system response:
NAME STATUS ROLES AGE VERSION <CONTAINER-CLOUD-NODE-NAME> NotReady <none> 10d v1.18.8-mirantis-1
Delete the affected manager node as described in Delete a cluster machine.
Add a manager node as described in Add a machine.
Strongly recommended. Back up MKE as described in Mirantis Kubernetes Engine documentation: Back up MKE.
Since the procedure above modifies the cluster configuration, a fresh backup is required to restore the cluster in case further reconfigurations fail.
Modify network configuration on an existing machine
TechPreview
Caution
Modification of L2 templates in use is only allowed with a mandatory validation step from the infrastructure operator to prevent accidental cluster failures due to unsafe changes. The list of risks posed by modifying L2 templates includes:
Services running on hosts cannot reconfigure automatically to switch to the new IP addresses and/or interfaces.
Connections between services are interrupted unexpectedly, which can cause data loss.
Incorrect configurations on hosts can lead to irrevocable loss of connectivity between services and unexpected cluster partition or disassembly.
Warning
Netplan does not handle arbitrary configuration changes. For details, see Netplan documentation.
To modify network configuration of an existing machine, you need to create a new L2 template and change the assignment of the template for that particular machine.
Warning
When a new network configuration is being applied on nodes, sequential draining of corresponding nodes and re-running of LCM on them occurs the same way as it is done during cluster update.
Therefore, before proceeding with modifying the network configuration, verify that the management cluster is up-to-date as described in Verify the management cluster status before MOSK update.
To modify network configuration on an existing machine:
Select from the following options:
Create a new L2 template using the Create L2 templates procedure.
Duplicate the existing
L2Templateobject associated with the machine to be configured, ensuring that the duplicatedL2Template:Contains a unique name in the
metadata.namefieldDoes not contain the
ipam/DefaultForClusterlabelSince MOSK 23.3, refers to the cluster using the
cluster.sigs.k8s.io/cluster-namelabelBefore MOSK 23.3, refers to the cluster using
Spec.clusterRef: <cluster-name>
Create the new
L2Templateobject:kubectl create -f <new-l2template-object-name>.yaml
Assign the new
L2Templateobject to an existing machine:In the related
Machineobject, add the following fields to thespecsection:kubectl edit machine <machine-name>
spec: providerSpec: value: l2TemplateSelector: name: <new-l2-template-name>
In the
IpamHostobject associated with the required machine, add the following fields to thespecsection:Note
The
IpamHostobject is automatically created with the same name as the relatedMachineobject and is located in the same namespace.kubectl edit ipamhost <ipamhost-name>
spec: l2TemplateSelector: name: <new-l2-template-name>
Caution
The
namefield must match the name of the createdL2Templateobject. To verify the list of availableL2Templateobjects:kubectl get l2Template -n <MOSK namespace>
Verify the statuses of the
IpamHostobjects that use the objects updated in the previous step:kubectl get IpamHost <ipamHostName> -o=jsonpath-as-json='{.status.netconfigCandidate}{"\n"}{.status.netconfigCandidateState}{"\n"}{.status.netconfigFilesStates}{"\n"}{.status.messages}'
Caution
The following fields of the
ipamHoststatus are renamed since MOSK 23.1 in the scope of theL2TemplateandIpamHostobjects refactoring:netconfigV2tonetconfigCandidatenetconfigV2statetonetconfigCandidateStatenetconfigFilesStatetonetconfigFilesStates(per file)
No user actions are required after renaming.
The format of
netconfigFilesStatechanged after renaming. ThenetconfigFilesStatesfield contains a dictionary of statuses of network configuration files stored innetconfigFiles. The dictionary contains the keys that are file paths and values that have the same meaning for each file thatnetconfigFilesStatehad:For a successfully rendered configuration file:
OK: <timestamp> <sha256-hash-of-rendered-file>, where a timestamp is in the RFC 3339 format.For a failed rendering:
ERR: <error-message>.
If the configuration is valid:
The
netconfigCandidatefield contains the Netplan configuration file candidate rendered using the modified objectsThe
netconfigCandidateStateandnetconfigFilesStatesfields have theOKstatusThe
netconfigFilesStatesfield contains the old date and checksum meaning that the effective Netplan configuration is still based on the previous versions of the modified objectsThe
messagesfield may contain some warnings but no errors
If the L2 template rendering fails, the candidate for Netplan configuration is empty and its
netconfigCandidateStatestatus contains an error message. A broken candidate for Netplan configuration cannot be approved and become the effective Netplan configuration.
Warning
Do not proceed to the next step until you make sure that the
netconfigCandidatefield contains the valid configuration and this configuration meets your expectations.Approve the new network configuration for the related
IpamHostobjects:kubectl patch IpamHost <ipamHostName> --type='merge' -p "{\"spec\":{\"netconfigUpdateAllow\":true}}"
Once applied, the new configuration is copied to the
netconfigFilesfield of the effective Netplan configuration, then copied to the correspondingLCMMachineobjects.Verify the statuses of the updated
IpamHostobjects:kubectl get IpamHost <ipamHostName> -o=jsonpath-as-json='{.status.netconfigCandidate}{"\n"}{.status.netconfigCandidateState}{"\n"}{.status.netconfigFilesStates}{"\n"}{.status.messages}'
Caution
The following fields of the
ipamHoststatus are renamed since MOSK 23.1 in the scope of theL2TemplateandIpamHostobjects refactoring:netconfigV2tonetconfigCandidatenetconfigV2statetonetconfigCandidateStatenetconfigFilesStatetonetconfigFilesStates(per file)
No user actions are required after renaming.
The format of
netconfigFilesStatechanged after renaming. ThenetconfigFilesStatesfield contains a dictionary of statuses of network configuration files stored innetconfigFiles. The dictionary contains the keys that are file paths and values that have the same meaning for each file thatnetconfigFilesStatehad:For a successfully rendered configuration file:
OK: <timestamp> <sha256-hash-of-rendered-file>, where a timestamp is in the RFC 3339 format.For a failed rendering:
ERR: <error-message>.
The new configuration is copied to the effective Netplan configuration and both configurations are valid when:
The
netconfigCandidateStateandnetconfigFilesStatesfields have theOKstatus and the same checksumThe messages list does not contain any errors
Verify the updated
LCMMachineobjects:kubectl get LCMMachine <LCMMachineName> -o=jsonpath-as-json='{.spec.stateItemsOverwrites}'
In the output of the above command, hash sums contained in the
bm_ipam_netconfig_filesvalues must match those in theIpamHost.status.netconfigFilesStatesoutput. If so, the new configuration is copied toLCMMachineobjects.Monitor the update operations that start on nodes. For details, see Verify machine status.
Add more racks to an existing MOSK cluster
This section describes exemplary L2 templates to demonstrate how to add more racks to an existing MOSK cluster.
The following exemplary L2 template belongs to a single-rack MOSK cluster. This template has the following characteristics:
Describes all networks that are used for cluster nodes communication
Can be transformed into several L2 templates depending on nodes roles
Uses the IP gateway in the external network as default route on the nodes in the MOSK cluster
Example of an L2 template for a single-rack cluster
l3Layout:
- subnetName: kaas-mgmt
scope: global
labelSelector:
kaas.mirantis.com/provider: baremetal
kaas-mgmt-subnet: ""
- subnetName: k8s-lcm
scope: namespace
- subnetName: k8s-ext-ipam
scope: namespace
- subnetName: tenant
scope: namespace
- subnetName: k8s-pods
scope: namespace
- subnetName: ceph-front
scope: namespace
- subnetName: ceph-back
scope: namespace
npTemplate: |-
version: 2
ethernets:
{{nic 0}}:
dhcp4: false
dhcp6: false
match:
macaddress: {{mac 0}}
set-name: {{nic 0}}
mtu: 1500
{{nic 1}}:
dhcp4: false
dhcp6: false
match:
macaddress: {{mac 1}}
set-name: {{nic 1}}
mtu: 1500
{{nic 2}}:
dhcp4: false
dhcp6: false
match:
macaddress: {{mac 2}}
set-name: {{nic 2}}
mtu: 9050
{{nic 3}}:
dhcp4: false
dhcp6: false
match:
macaddress: {{mac 3}}
set-name: {{nic 3}}
mtu: 9050
bonds:
bond0:
interfaces:
- {{nic 0}}
- {{nic 1}}
parameters:
mode: 802.3ad
transmit-hash-policy: layer3+4
mtu: 1500
bond1:
interfaces:
- {{nic 2}}
- {{nic 3}}
parameters:
mode: 802.3ad
transmit-hash-policy: layer3+4
mtu: 9050
vlans:
k8s-lcm-v:
id: 738
link: bond0
k8s-pod-v:
id: 731
link: bond1
mtu: 9000
k8s-ext-v:
id: 736
link: bond1
mtu: 9000
tenant-vlan:
id: 732
link: bond1
addresses:
- {{ip "tenant-vlan:tenant"}}
mtu: 9050
ceph-front-v:
id: 733
link: bond1
addresses:
- {{ip "ceph-front-v:ceph-front"}}
mtu: 9000
ceph-back-v:
id: 734
link: bond1
addresses:
- {{ip "ceph-back-v:ceph-back"}}
mtu: 9000
bridges:
k8s-lcm:
interfaces: [k8s-lcm-v]
addresses:
- {{ip "k8s-lcm:k8s-lcm"}}
routes:
# to management network of MCC cluster
- to: {{cidr_from_subnet "kaas-mgmt"}}
via: {{gateway_from_subnet "k8s-lcm"}}
table: 101
# fips network
- to: 10.159.156.0/22
via: {{gateway_from_subnet "k8s-lcm"}}
table: 101
routing-policy:
- from: {{cidr_from_subnet "k8s-lcm"}}
table: 101
k8s-pods:
interfaces: [k8s-pod-v]
addresses:
- {{ip "k8s-pods:k8s-pods"}}
mtu: 9000
k8s-ext:
interfaces: [k8s-ext-v]
addresses:
- {{ip "k8s-ext:k8s-ext-ipam"}}
gateway4: {{gateway_from_subnet "k8s-ext-ipam"}}
nameservers:
addresses: {{nameservers_from_subnet "k8s-ext-ipam"}}
mtu: 9000
## FIP Bridge
br-fip:
interfaces: [bond1]
mtu: 9050
To add nodes to the new rack of the same cluster:
Create
Subnetobjects for the following networks: LCM, workload, tenant, and Ceph (where applicable).Create a new L2 template that nodes in a new rack will use.
In this template, configure the external network to be either stretched between racks or connected to the first rack only.
Caution
API/LCM network is the first rack LCM network in our example, since a single-rack MOSK cluster was deployed first. Therefore, only the first rack can contain Kubernetes master nodes that provide access to Kubernetes API.
In the L2 template for the first rack, add IP routes pointing to the networks in the new rack.
The following examples contain:
The modified L2 template for the first rack. Routes added to the second rack are highlighted.
The new L2 template for the second rack with external network that is stretched between racks. The IP gateway in the external network is used as the default route on the nodes of the second rack.
Example of a modified L2 template for the first rack with routes
to the second rack
l3Layout:
- subnetName: kaas-mgmt
scope: global
labelSelector:
kaas.mirantis.com/provider: baremetal
kaas-mgmt-subnet: ""
- subnetName: k8s-lcm
scope: namespace
- subnetName: k8s-ext-ipam
scope: namespace
- subnetName: tenant
scope: namespace
- subnetName: k8s-pods
scope: namespace
- subnetName: ceph-front
scope: namespace
- subnetName: ceph-back
scope: namespace
- subnetName: k8s-lcm-rack2
scope: namespace
- subnetName: tenant-rack2
scope: namespace
- subnetName: k8s-pods-rack2
scope: namespace
- subnetName: ceph-front-rack2
scope: namespace
- subnetName: ceph-back-rack2
scope: namespace
npTemplate: |-
version: 2
ethernets:
{{nic 0}}:
dhcp4: false
dhcp6: false
match:
macaddress: {{mac 0}}
set-name: {{nic 0}}
mtu: 1500
{{nic 1}}:
dhcp4: false
dhcp6: false
match:
macaddress: {{mac 1}}
set-name: {{nic 1}}
mtu: 1500
{{nic 2}}:
dhcp4: false
dhcp6: false
match:
macaddress: {{mac 2}}
set-name: {{nic 2}}
mtu: 9050
{{nic 3}}:
dhcp4: false
dhcp6: false
match:
macaddress: {{mac 3}}
set-name: {{nic 3}}
mtu: 9050
bonds:
bond0:
interfaces:
- {{nic 0}}
- {{nic 1}}
parameters:
mode: 802.3ad
transmit-hash-policy: layer3+4
mtu: 1500
bond1:
interfaces:
- {{nic 2}}
- {{nic 3}}
parameters:
mode: 802.3ad
transmit-hash-policy: layer3+4
mtu: 9050
vlans:
k8s-lcm-v:
id: 738
link: bond0
k8s-pod-v:
id: 731
link: bond1
mtu: 9000
k8s-ext-v:
id: 736
link: bond1
mtu: 9000
tenant-vlan:
id: 732
link: bond1
addresses:
- {{ip "tenant-vlan:tenant"}}
routes:
# to 2nd rack of MOSK cluster
- to: {{cidr_from_subnet "tenant-rack2"}}
via: {{gateway_from_subnet "tenant"}}
mtu: 9050
ceph-front-v:
id: 733
link: bond1
addresses:
- {{ip "ceph-front-v:ceph-front"}}
routes:
# to 2nd rack of MOSK cluster
- to: {{cidr_from_subnet "ceph-front-rack2"}}
via: {{gateway_from_subnet "ceph-front"}}
mtu: 9000
ceph-back-v:
id: 734
link: bond1
addresses:
- {{ip "ceph-back-v:ceph-back"}}
routes:
# to 2nd rack of MOSK cluster
- to: {{cidr_from_subnet "ceph-back-rack2"}}
via: {{gateway_from_subnet "ceph-back"}}
mtu: 9000
bridges:
k8s-lcm:
interfaces: [k8s-lcm-v]
addresses:
- {{ip "k8s-lcm:k8s-lcm"}}
nameservers:
addresses: {{nameservers_from_subnet "k8s-lcm"}}
routes:
# to management network of Container Cloud cluster
- to: {{cidr_from_subnet "kaas-mgmt"}}
via: {{gateway_from_subnet "k8s-lcm"}}
table: 101
# fips network
- to: 10.159.156.0/22
via: {{gateway_from_subnet "k8s-lcm"}}
table: 101
# to 2nd rack of MOSK cluster
- to: {{cidr_from_subnet "k8s-lcm-rack2"}}
via: {{gateway_from_subnet "k8s-lcm"}}
table: 101
routing-policy:
- from: {{cidr_from_subnet "k8s-lcm"}}
table: 101
k8s-pods:
interfaces: [k8s-pod-v]
addresses:
- {{ip "k8s-pods:k8s-pods"}}
routes:
# to 2nd rack of MOSK cluster
- to: {{cidr_from_subnet "k8s-pods-rack2"}}
via: {{gateway_from_subnet "k8s-pods"}}
mtu: 9000
k8s-ext:
interfaces: [k8s-ext-v]
addresses:
- {{ip "k8s-ext:k8s-ext-ipam"}}
gateway4: {{gateway_from_subnet "k8s-ext-ipam"}}
nameservers:
addresses: {{nameservers_from_subnet "k8s-ext-ipam"}}
mtu: 9000
## FIP Bridge
br-fip:
interfaces: [bond1]
mtu: 9050
Example of a new L2 template for the second rack with external
network
l3Layout: - subnetName: kaas-mgmt scope: global labelSelector: kaas.mirantis.com/provider: baremetal kaas-mgmt-subnet: "" - subnetName: k8s-lcm scope: namespace - subnetName: k8s-ext-ipam scope: namespace - subnetName: tenant scope: namespace - subnetName: k8s-pods scope: namespace - subnetName: ceph-front scope: namespace - subnetName: ceph-back scope: namespace - subnetName: k8s-lcm-rack2 scope: namespace - subnetName: tenant-rack2 scope: namespace - subnetName: k8s-pods-rack2 scope: namespace - subnetName: ceph-front-rack2 scope: namespace - subnetName: ceph-back-rack2 scope: namespace npTemplate: |- version: 2 ethernets: {{nic 0}}: dhcp4: false dhcp6: false match: macaddress: {{mac 0}} set-name: {{nic 0}} mtu: 1500 {{nic 1}}: dhcp4: false dhcp6: false match: macaddress: {{mac 1}} set-name: {{nic 1}} mtu: 1500 {{nic 2}}: dhcp4: false dhcp6: false match: macaddress: {{mac 2}} set-name: {{nic 2}} mtu: 9050 {{nic 3}}: dhcp4: false dhcp6: false match: macaddress: {{mac 3}} set-name: {{nic 3}} mtu: 9050 bonds: bond0: interfaces: - {{nic 0}} - {{nic 1}} parameters: mode: 802.3ad transmit-hash-policy: layer3+4 mtu: 1500 bond1: interfaces: - {{nic 2}} - {{nic 3}} parameters: mode: 802.3ad transmit-hash-policy: layer3+4 mtu: 9050 vlans: k8s-lcm-v: id: 738 link: bond0 k8s-pod-v: id: 731 link: bond1 mtu: 9000 k8s-ext-v: id: 736 link: bond1 mtu: 9000 tenant-vlan: id: 732 link: bond1 addresses: - {{ip "tenant-vlan:tenant-rack2"}} routes: # to 2nd rack of MOSK cluster - to: {{cidr_from_subnet "tenant"}} via: {{gateway_from_subnet "tenant-rack2"}} mtu: 9050 ceph-front-v: id: 733 link: bond1 addresses: - {{ip "ceph-front-v:ceph-front-rack2"}} routes: # to 1st rack of MOSK cluster - to: {{cidr_from_subnet "ceph-front"}} via: {{gateway_from_subnet "ceph-front-rack2"}} mtu: 9000 ceph-back-v: id: 734 link: bond1 addresses: - {{ip "ceph-back-v:ceph-back-rack2"}} routes: # to 2nd rack of MOSK cluster - to: {{cidr_from_subnet "ceph-back"}} via: {{gateway_from_subnet "ceph-back-rack2"}} mtu: 9000 bridges: k8s-lcm: interfaces: [k8s-lcm-v] addresses: - {{ip "k8s-lcm:k8s-lcm-rack2"}} nameservers: addresses: {{nameservers_from_subnet "k8s-lcm-rack2"}} routes: # to management network of Container Cloud cluster - to: {{cidr_from_subnet "kaas-mgmt"}} via: {{gateway_from_subnet "k8s-lcm-rack2"}} table: 101 # fips network - to: 10.159.156.0/22 via: {{gateway_from_subnet "k8s-lcm-rack2"}} table: 101 # to API/LCM network of MOSK cluster - to: {{cidr_from_subnet "k8s-lcm"}} via: {{gateway_from_subnet "k8s-lcm-rack2"}} table: 101 routing-policy: - from: {{cidr_from_subnet "k8s-lcm-rack2"}} table: 101 k8s-pods: interfaces: [k8s-pod-v] addresses: - {{ip "k8s-pods:k8s-pods-rack2"}} routes: # to 2nd rack of MOSK cluster - to: {{cidr_from_subnet "k8s-pods"}} via: {{gateway_from_subnet "k8s-pods-rack2"}} mtu: 9000 k8s-ext: interfaces: [k8s-ext-v] addresses: - {{ip "k8s-ext:k8s-ext-ipam"}} gateway4: {{gateway_from_subnet "k8s-ext-ipam"}} nameservers: addresses: {{nameservers_from_subnet "k8s-ext-ipam"}} mtu: 9000 ## FIP Bridge br-fip: interfaces: [bond1] mtu: 9050
Expand IP addresses capacity in an existing cluster
If the subnet capacity on your existing cluster is not enough to add new
machines, use the l2TemplateSelector feature to expand the IP addresses
capacity:
Create new
Subnetobject(s) to define additional address ranges for new machines.Set up routing between the existing and new subnets.
Create new L2 template(s) with the new subnet(s) being used in
l3Layout.Set up
l2TemplateSelectorin theMachineobjects for new machines.
To expand IP addresses capacity for an existing cluster:
Verify the capacity of the subnet(s) currently associated with the L2 template(s) used for cluster deployment:
If
labelSelectoris not used for the given subnet, use thenamespacevalue of the L2 template and thesubnetNamevalue from thel3Layoutsection:kubectl get subnet -n <namespace> <subnetName>
If
labelSelectoris used for the given subnet, use thenamespacevalue of the L2 template and comma-separated key-value pairs from thelabelSelectorsection for the given subnet in thel3Layoutsection:kubectl get subnet -n <namespace> -l <key1=value1>[<,key2=value2>...]
Example command:
kubectl get subnet -n test-ns -l cluster.sigs.k8s.io/cluster-name=managed123,user-defined/purpose=lcm-base
Example of system response:
NAME AGE CIDR GATEWAY CAPACITY ALLOCATABLE STATUS old-lcm-network 8d 192.168.1.0/24 192.168.1.1 253 0 OK
Existing Subnet example
apiVersion: "ipam.mirantis.com/v1alpha1" kind: Subnet metadata: name: old-lcm-network namespace: test-ns labels: cluster.sigs.k8s.io/cluster-name: managed123 ipam/SVC-k8s-lcm: "1" kaas.mirantis.com/provider: baremetal kaas.mirantis.com/region: region-one user-defined/purpose: lcm-base spec: cidr: 192.168.1.0/24 gateway: 192.168.1.1 . . . status: allocatable: 0 allocatedIPs: . . . capacity: 253 cidr: 192.168.1.0/24 gateway: 192.168.1.1 ranges: - 192.168.1.2-192.168.1.254
Note
The
kaas.mirantis.com/regionlabel is removed from all MOSK objects in 24.1. Therefore, do not add the label starting with this release. On existing clusters updated to this release, or if added manually, MOSK ignores this label.Existing L2 template example
apiVersion: ipam.mirantis.com/v1alpha1 kind: L2Template metadata: name: base-template namespace: test-ns labels: ipam/DefaultForCluster: "1" kaas.mirantis.com/provider: baremetal kaas.mirantis.com/region: region-one cluster.sigs.k8s.io/cluster-name: managed123 spec: autoIfMappingPrio: - provision - eno - ens l3Layout: - scope: namespace subnetName: lcm-subnet1 labelSelector: cluster.sigs.k8s.io/cluster-name: managed123 user-defined/purpose: lcm-base npTemplate: | version: 2 renderer: networkd ethernets: {{nic 0}}: match: macaddress: {{mac 0}} set-name: {{nic 0}} bridges: k8s-lcm: interfaces: - {{nic 0}} addresses: - {{ip "k8s-lcm:lcm-subnet1"}} gateway4: {{gateway_from_subnet "lcm-subnet1"}} nameservers: addresses: {{nameservers_from_subnet "lcm-subnet1"}}
Note
The
kaas.mirantis.com/regionlabel is removed from all MOSK objects in 24.1. Therefore, do not add the label starting with this release. On existing clusters updated to this release, or if added manually, MOSK ignores this label.Note
Before MOSK 23.3, an L2 template requires
clusterRef: <clusterName>in thespecsection. Since MOSK 23.3, this parameter is deprecated and automatically migrated to thecluster.sigs.k8s.io/cluster-name: <clusterName>label.Create new objects:
Subnetwith theuser-defined/purpose: lcm-additionallabel.L2Templatewith thealternative-template: “1”label. The L2 template should reference the newSubnetobject using theuser-defined/purpose: lcm-additionallabel in thelabelSelectorfield.
Note
The label name
user-defined/purposeis used for illustration purposes. Use any custom label name that differs from system names. Use of a unique prefix such asuser-defined/is recommended.New subnet example
apiVersion: "ipam.mirantis.com/v1alpha1" kind: Subnet metadata: name: new-lcm-network namespace: test-ns labels: cluster.sigs.k8s.io/cluster-name: managed123 ipam/SVC-k8s-lcm: "1" kaas.mirantis.com/provider: baremetal kaas.mirantis.com/region: region-one user-defined/purpose: lcm-additional spec: cidr: 192.168.200.0/24 gateway: 192.168.200.1 . . . status: allocatable: 253 allocatedIPs: . . . capacity: 253 cidr: 192.168.200.0/24 gateway: 192.168.200.1 ranges: - 192.168.200.2-192.168.200.254
Note
The
kaas.mirantis.com/regionlabel is removed from all MOSK objects in 24.1. Therefore, do not add the label starting with this release. On existing clusters updated to this release, or if added manually, MOSK ignores this label.Alternative L2 template example
apiVersion: ipam.mirantis.com/v1alpha1 kind: L2Template metadata: name: alternative-template namespace: test-ns labels: kaas.mirantis.com/provider: baremetal kaas.mirantis.com/region: region-one cluster.sigs.k8s.io/cluster-name: managed123 alternative-template: “1” spec: autoIfMappingPrio: - provision - eno - ens l3Layout: - scope: namespace subnetName: lcm-subnet2 labelSelector: cluster.sigs.k8s.io/cluster-name: managed123 user-defined/purpose: lcm-additional npTemplate: | version: 2 renderer: networkd ethernets: {{nic 0}}: match: macaddress: {{mac 0}} set-name: {{nic 0}} bridges: k8s-lcm: interfaces: - {{nic 0}} addresses: - {{ip "k8s-lcm:lcm-subnet2"}} gateway4: {{gateway_from_subnet "lcm-subnet2"}} nameservers: addresses: {{nameservers_from_subnet "lcm-subnet2"}}
Note
The
kaas.mirantis.com/regionlabel is removed from all MOSK objects in 24.1. Therefore, do not add the label starting with this release. On existing clusters updated to this release, or if added manually, MOSK ignores this label.Note
Before MOSK 23.3, an L2 template requires
clusterRef: <clusterName>in thespecsection. Since MOSK 23.3, this parameter is deprecated and automatically migrated to thecluster.sigs.k8s.io/cluster-name: <clusterName>label.You can also reference the new
Subnetobject by using its name in thel3Layoutsection of thealternative-templateL2 template.Snippet example of an alternative L2 template
... spec: ... l3Layout: - scope: namespace subnetName: new-lcm-network ... npTemplate: | ... bridges: k8s-lcm: interfaces: - {{nic 0}} addresses: - {{ip "k8s-lcm:new-lcm-network"}} gateway4: {{gateway_from_subnet "new-lcm-network"}} nameservers: addresses: {{nameservers_from_subnet "new-lcm-network"}}
Set up IP routing between the existing and new subnets using the tools of your cloud network infrastructure.
In the
providerSpecsection of the newMachineobject, define thealternative-templatelabel forl2TemplateSelector:Snippet example of the new Machine object
apiVersion: cluster.k8s.io/v1alpha1 kind: Machine metadata: labels: cluster.sigs.k8s.io/cluster-name: managed123 kaas.mirantis.com/provider: baremetal kaas.mirantis.com/region: region-one name: additional-machine namespace: test-ns spec: ... providerSpec: value: ... l2TemplateSelector: label: alternative-template
Note
The
kaas.mirantis.com/regionlabel is removed from all MOSK objects in 24.1. Therefore, do not add the label starting with this release. On existing clusters updated to this release, or if added manually, MOSK ignores this label.After creation, the new machine will use the alternative L2 template that uses the
new-lcm-networksubnet linked byL3Layout.Optional. Configure an additional IP address pool for MetalLB:
Configure the additional
extensionIP address pool for themetallbload balancer service.Open the
MetalLBConfigobject of the management cluster for editing:kubectl edit metallbconfig <MetalLBConfigName>
In the
ipAddressPoolssection, add:... spec: ipAddressPools: - name: extension spec: addresses: - <pool_start_ip>-<pool_end_ip> autoAssign: false avoidBuggyIPs: false ...
In the snippet above, replace the following parameters:
<pool_start_ip>- first IP address in the required range<pool_end_ip>- last IP address in the range
Add the
extensionIP address pool name to theL2Advertisementsdefinition. You can add it to the same L2 advertisement as thedefaultIP address pool, or create a new L2 advertisement if required.... spec: l2Advertisements: - name: default spec: interfaces: - k8s-lcm ipAddressPools: - default - extension ...
Save and exit the object to apply changes.
Define additional address ranges for MetalLB. For details, see the optional step for the MetalLB service in Create subnets.
You can create one or several
Subnetobjects to extend the MetalLB address pool with additional ranges. When the MetalLB traffic is routed through the default gateway, you can add the MetalLB address ranges that belong to different CIDR subnet addresses.For example:
MetalLB configuration example snippet
apiVersion: ipam.mirantis.com/v1alpha1 kind: Subnet metadata: labels: cluster.sigs.k8s.io/cluster-name: managed123 ipam/SVC-MetalLB: '1' kaas.mirantis.com/region: region-one kaas.mirantis.com/provider: baremetal user-defined/purpose: metallb-additional1 name: metallb-svc1-for-managed namespace: test-ns spec: cidr: 172.16.168.0/24 includeRanges: - 172.16.168.11-172.16.168.30 - 172.16.168.41-172.16.168.50 apiVersion: ipam.mirantis.com/v1alpha1 kind: Subnet metadata: labels: cluster.sigs.k8s.io/cluster-name: managed123 ipam/SVC-MetalLB: '1' kaas.mirantis.com/region: region-one kaas.mirantis.com/provider: baremetal user-defined/purpose: metallb-additional2 name: metallb-svc2-for-managed namespace: test-ns spec: cidr: 172.16.169.0/24 includeRanges: - 172.16.169.11-172.16.169.20
Note
The
kaas.mirantis.com/regionlabel is removed from all MOSK objects in 24.1. Therefore, do not add the label starting with this release. On existing clusters updated to this release, or if added manually, MOSK ignores this label.Verify the created objects for MetalLB. For reference, use the following files in Example of a complete template configuration for cluster creation:
Since MOSK 24.2:
managed-ns_MetalLBConfig-lb-managed.yamlBefore MOSK 24.2:
managed-ns_Subnet_metallb-public-for-managed.yaml
Enable network infrastructure monitoring
Available since MCC 2.30.0 (21.0.0 and 20.0.0)
Using the InfraConnectivityMonitor resource, you can enable network
infrastructure monitoring to monitor network connectivity between management or
MOSK cluster nodes using ping checks. The operator can use
the monitoring data to correlate the major software stack issues with the
underlying infrastructure outages as well as identify the weakest points of the
software stack to make it more resilient. For implementation details, see
Infrastructure connectivity monitoring.
By default, all components of network infrastructure monitoring run on any
cluster, and StackLight is pre-configured to collect metrics from monitoring
agents. So you only need to create and configure the
InfraConnectivityMonitor object to start network infrastructure monitoring
on the required MOSK cluster.
You can also adjust the initial auto-generated configuration to optimize network monitoring coverage, if required.
To enable network infrastructure monitoring on the target cluster:
On the management cluster, create an
InfraConnectivityMonitorobject using the following example:apiVersion: kaas.mirantis.com/v1alpha1 kind: InfraConnectivityMonitor metadata: name: icm-object-name namespace: default spec: targetCluster: mosk-cluster-name
Optional. Select specific machines where network infrastructure monitoring must run by specifying the machine selector. Machines that do not match this selector will be excluded from monitoring.
apiVersion: kaas.mirantis.com/v1alpha1 kind: InfraConnectivityMonitor metadata: name: icm-object-name namespace: default spec: targetCluster: mosk-cluster-name machineSelector: matchLabels: label-name: "label-value"
Wait several minutes for
netchecker-controllerto prepare all related objects in the target cluster and collect statuses of these objects.Verify that the
InfraConnectivityMonitorstatus contains no errors. Otherwise, investigate error messages and fix the issues.Also, verify statuses of
CheckerInventoryConfigandNetCheckerTargetsConfigobjects. For description of status fields, see CheckerInventoryConfig and NetCheckerTargetsConfig.Status example of a successful configuration:
status: inventoryConfigStatus: nodes: - machineName: master-0 nodeName: master-0 status: ok - machineName: master-1 nodeName: master-1 status: ok - machineName: master-2 nodeName: master-2 status: ok statusMsg: ok targetsConfigStatus: nodes: - machineName: master-0 nodeName: master-0 status: ok targetsCount: "4" - machineName: master-1 nodeName: master-1 status: ok targetsCount: "4" - machineName: master-2 nodeName: master-2 status: ok targetsCount: "4" statusMsg: ok
Manual configuration of network infrastructure monitoring
The default configuration of network infrastructure monitoring is based on
Machine, L2Template, and Subnet objects related to the target
cluster. The netchecker-controller attempts to collect as much information
from these objects as possible to include all nodes and subnets into monitoring
and prepare configuration with all collected data.
If such default configuration is not enough or, on the contrary, is too wide-ranging, you can manually configure network infrastructure monitoring.
To manually configure network infrastructure monitoring:
In the
InfraConnectivityMonitorobject, add thekaas.mirantis.com/skip-netchecker-config-updatesannotation.apiVersion: kaas.mirantis.com/v1alpha1 kind: InfraConnectivityMonitor metadata: annotations: "kaas.mirantis.com/skip-netchecker-config-updates": "true" name: icm-object-name namespace: default spec: targetCluster: mosk-cluster-name machineSelector: matchLabels: label-name: "label-value"
The annotation disables automatic management of
InfraConnectivityMonitor,CheckerInventoryConfig, andNetCheckerTargetsConfigobjects bynetchecker-controller.Manually apply the required changes to the
CheckerInventoryConfigandNetCheckerTargetsConfigobjects. They will not be overwritten while the annotation defined in the previous step is set. The status of these objects will not be propagated to theInfraConnectivityMonitorstatus anymore.Note
Always keep the
InfraConnectivityMonitorobject on the management cluster, even if you manually manage the configuration.
Run cluster self-diagnostics
Available since MOSK 24.3 TechPreview
MOSK provides cloud operators with a unified tool to perform automatic self-diagnostic checks on both management and managed clusters. This capability allows for easier troubleshooting and preventing potential issues. For instance, self-diagnostic checks can notify you of deprecated features that, if left unresolved, may block upgrades to subsequent versions.
Examples of self-diagnostic checks include:
An SSL/TLS certificate is not set explicitly as plain text
Deprecated
OpenStackDeploymentSecretdoes not exist
Running self-diagnostics is essential to ensure the overall health and optimal performance of your cluster. Mirantis recommends running self-diagnostics before cluster update, node replacement, or any other significant changes in the cluster to optimize maintenance window.
The Diagnostic Controller is a tool with a set of diagnostic checks to automatically perform self-diagnostics of any cluster and help the operator to easily understand, troubleshoot, and resolve potential issues against the following major subsystems: core, bare metal, Ceph, StackLight, Tungsten Fabric, and OpenStack. For illustration of diagnostic checks, refer to the subsection describing the bare metal provider checks.
The Diagnostic Controller analyzes the configuration of the cluster subsystems and reports results of checks that contain useful information about cluster health. These reports may include references to documentation on known issues related to results of checks, along with ticket numbers for tracking the resolution progress of related issues.
The Diagnostic Controller watches for the Diagnostic objects and runs a set
of diagnostic checks depending on the cluster version and type, which are
identified by the cluster name defined in the spec.cluster section of the
Diagnostic object.
Trigger self-diagnostics for a management or managed cluster
Available since MCC 2.28.0 (17.3.0 and 16.3.0)
To run self-diagnostics for a cluster, the operator must create a
Diagnostic object. The creation of this object triggers
diagnostic-controller to start all available checks for the target cluster
defined in the spec.cluster section of the object.
After a successful completion of the required set of diagnostic checks,
diagnostics is never retriggered. To retrigger diagnostics for the same
cluster, the operator must create a new Diagnostic object.
The objects of the Diagnostic kind are not removed automatically so that
you can assess the result of each diagnostics later.
To trigger self-diagnostics for a cluster:
Log in to the host where
kubeconfigof your management cluster is located and where kubectl is installed.Create the
Diagnosticobject in the namespace where the target cluster is located. For example:apiVersion: diagnostic.mirantis.com/v1alpha1 kind: Diagnostic metadata: name: test-diagnostic namespace: test-namespace spec: cluster: test-cluster
Wait until diagnostics is finished. To monitor the progress:
while [ -z "$(kubectl -n <diagnosticObjectNamespace> get diagnostic <diagnosticObjectName> -o go-template='{{.status.finishedAt}}')" ]; do sleep 1; done;
Verify the
statussection of theDiagnosticobject:If diagnostics is finished successfully, its result is displayed in the
resultmap containing key-value pairs describing results of the corresponding diagnostic checks.If diagnostics is finished unsuccessfully, or the Diagnostic Controller version is outdated,
diagnostic-controllersaves the issue description to thestatus.errorfield.If the Diagnostic Controller version is outdated, ensure that
release-controlleris running and a newDiagnosticReleasehas been created. Also, verify logs of the bare metal provider andrelease-controllerfor issues.If the
statussection is empty,diagnostic-controllerhas not run any diagnostics yet.
For details about the object status, see Diagnostic resource.
Self-upgrades of the Diagnostic Controller
Available since MCC 2.28.0 (17.3.0 and 16.3.0)
The Diagnostic Controller is upgraded outside the Container Cloud release cycle. Once the new version of the Diagnostic Controller is released, it is automatically installed on the management cluster.
The Diagnostic Controller does not run any diagnostics until it is upgraded to
the latest version. If diagnostics is triggered before the Diagnostic
Controller is fully upgraded, the status field of the Diagnostic object
contains the corresponding error. For example:
apiVersion: diagnostic.mirantis.com/v1alpha1
kind: Diagnostic
metadata:
name: test-diagnostic
namespace: test-namespace
spec:
cluster: test-cluster
status:
error: The controller has outdated version v1.40.1 (the latest version is
v1.40.2). Wait until the controller is updated to the latest version. Ensure
that the release controller is running and the new DiagnosticRelease has
been created. Check the release controller and the provider logs for issues.
controllerVersion: v1.40.1
Diagnostic checks for the bare metal provider
Available since MCC 2.28.0 (17.3.0 and 16.3.0) TechPreview
This section describes specifics of the diagnostic checks designed for the bare metal provider.
The bm_address_capacity check verifies that the available capacities
of IP addresses in the Subnet and MetalLBConfig objects are sufficient.
This check verifies the Subnet objects only with the following labels:
ipam/SVC-k8s-lcmipam/SVC-pxe-nics
For the MetalLBConfig objects, the check uses only the IP addresses
defined in .spec.ipAddressPools and verifies only the MetalLBConfig
objects with the following configuration for the IP address pool:
.spec.autoAssignis set totrue.spec.serviceAllocation.serviceSelectorsis no set
The minimum thresholds for IP address capacity are as follows:
Subnet— 5MetalLBConfig— 10
Capacity below these thresholds is reported as insufficient.
If thresholds are met, then the output status is INFO. Otherwise,
the status is WARNING.
The check reports the number of available IP addresses for each matching
Subnet object and for each matching IP address pool of a matching
MetalLBConfig object.
Applicable to a management cluster only
The bm_artifacts_overrides check verifies that no undesirable overrides are
present in the baremetal-operator release, including
but not limited to the values.init_bootstrap.provisioning_files.artifacts
path.
The bm_objects_statuses check verifies that no errors or undesired states
are present in the status of the following objects: IPAMHost,
MetalLBConfig, and LCMMachine.
Object name |
Checks applied by bm_objects_statuses |
|---|---|
|
|
|
|
|
|
See also
IAM operations
Note
The Container Cloud web UI communicates with Keycloak to authenticate users. Keycloak is exposed using HTTPS with self-signed TLS certificates that are not trusted by web browsers.
To use your own TLS certificates for Keycloak, refer to Configure TLS certificates for cluster applications.
Manage user roles through Container Cloud API
You can manage IAM user role bindings through Container Cloud API. For the API reference of the IAM custom resources, see iam-api. You can also manage user roles using the Container Cloud web UI.
Note
User management for the Mirantis OpenStack for Kubernetes m:os roles is not
yet available through API or web UI. Therefore, continue managing these
roles using Keycloak.
You can use the following objects depending on the way you want the role to be assigned to the user:
IAMGlobalRoleBindingfor global role bindingsAny IAM role can be used in
IAMGlobalRoleBindingand will be applied globally, not limited to a specific project or cluster. For example, theglobal-adminrole.
IAMRoleBindingfor project role bindingsAny role except the
global-adminone apply. For example, using theoperatoranduserIAM roles inIAMRoleBindingof theexampleproject corresponds to assigning ofm:kaas:example@operator/userin Keycloak. You can also use these IAM roles inIAMGlobalRoleBinding. In this case, the roles corresponding to every project will be assigned to a user in Keycloak.
IAMClusterRoleBindingfor cluster role bindingsOnly the
cluster-adminandstacklight-adminroles apply toIAMClusterRoleBinding. Creation of such objects corresponds to the assignment ofm:k8s:namespace:cluster@cluster-admin/stacklight-adminin Keycloak. You can also bind these roles to eitherIAMGlobalRoleBindingorIAMRoleBinding. In this case, the roles corresponding to all clusters and in all projects or one particular project will be assigned to a user.
This section describes available IAM roles with use cases and the Container
Cloud API IAM*RoleBinding mapping with Keycloak.
Available IAM roles and use cases
This section describes IAM roles and access rights they provide with possible use cases.
The following table illustrates the IAM roles available in MOSK and read/write or read-only permissions for specific project and cluster operations:
Roles |
global-admin |
management-admin |
bm-pool-operator |
operator |
user |
member |
cluster-admin |
stacklight-admin |
|---|---|---|---|---|---|---|---|---|
Scope |
Global |
Global |
Namespace |
Namespace |
Namespace |
Namespace |
Cluster |
Cluster |
User Role
Management API
|
r/w |
r/w |
- |
r/w |
r/o |
- |
- |
- |
Create BM hosts |
- |
r/w |
r/w |
- |
- |
- |
- |
- |
Create BareMetalHostInventories 0 |
- |
r/w |
r/w 1 |
r/w 1 |
r/o 1 |
r/w 1 |
- |
- |
Ceph objects |
- |
r/w |
- |
r/w |
- |
r/w |
- |
- |
Projects (Kubernetes namespaces) |
r/w |
r/w |
r/o |
r/o |
r/o |
r/o |
- |
- |
Container Cloud API |
- |
r/w |
- |
r/w |
r/o |
r/w |
- |
- |
Kubernetes API (managed cluster) |
- |
- |
- |
r/w |
- |
r/w |
r/w |
- |
StackLight UI/API (managed cluster) |
- |
- |
- |
r/w |
- |
r/w |
r/w |
r/w |
The following table illustrates possible role use cases for a better understanding on which roles should be assigned to users who perform particular operations in a MOSK cluster:
Role |
Use case |
|---|---|
kind: IAMGlobalRoleBinding
metadata:
name: mybinding-ga
role:
name: global-admin
user:
name: myuser-1943c384
|
Infrastructure operator with the
|
kind: IAMGlobalRoleBinding
metadata:
name: mybinding-ma
role:
name: management-admin
user:
name: myuser-1943c384
|
Available since Container Cloud 2.25.0 (Cluster releases 17.0.0 and
16.0.0).
Infrastructure operator with the |
kind: IAMRoleBinding
metadata:
name: mybinding-bm
namespace: mynamespace
role:
name: bm-pool-operator
user:
name: myuser-1943c384
|
Infrastructure operator with the |
kind: IAMRoleBinding
metadata:
name: mybinding-op
namespace: mynamespace
role:
name: operator
user:
name: myuser-1943c384
|
Infrastructure operator with the
|
kind: IAMRoleBinding
metadata:
name: mybinding-us
namespace: mynamespace
role:
name: user
user:
name: myuser-1943c384
|
Infrastructure support operator with the
|
kind: IAMRoleBinding
metadata:
name: mybinding-me
namespace: mynamespace
role:
name: member
user:
name: myuser-1943c384
|
Infrastructure support operator with the |
kind: IAMClusterRoleBinding
metadata:
name: mybinding-ca
namespace: mynamespace
role:
name: cluster-admin
user:
name: myuser-1943c384
cluster:
name: mycluster
|
User with the
|
kind: IAMClusterRoleBinding
metadata:
name: mybinding-sa
namespace: mynamespace
role:
name: stacklight-admin
user:
name: myuser-1943c384
cluster:
name: mycluster
|
User with the
|
Mapping of Keycloak roles to IAM*RoleBinding objects
Starting from Container Cloud 2.14.0 (Cluster releases 7.4.0, 6.20.0, and 5.21.0), MOSK role naming has changed. The old role names logic has been reworked and new role names are introduced.
Old-style role mappings are reflected in the Container Cloud API with the new
roles and the legacy: true and legacyRole: “<oldRoleName>” fields set.
If you remove the legacy flag, user-controller automatically performs
the following update in Keycloak:
Grants the new-style role
Removes the old-style role mapping
Note
You can assign the old-style roles using Keycloak only. These roles will be synced into the Container Cloud API as the corresponding
IAM*RoleBindingobjects with theexternal: true,legacy: true, andlegacyRole: “<oldRoleName>”fields set.If you assign new-style roles using Keycloak, they will be synced into the Container Cloud API with the
external: truefield set.
The following table describes how the IAM*RoleBinding objects in the
Container Cloud API map to roles in Keycloak.
Container Cloud new role names |
global-admin |
bm-pool-operator |
operator |
user |
cluster-admin |
stacklight-admin |
|---|---|---|---|---|---|---|
m:kaas@global-admin |
||||||
m:kaas@management-admin Since 2.25.0 (17.0.0 and 16.0.0) |
||||||
m:kaas:{ns}@bm-pool-operator |
||||||
m:kaas:{ns}@operator |
||||||
m:kaas:{ns}@user |
||||||
m:k8s:{ns}:{cluster}@cluster-admin |
||||||
m:sl:{ns}:{cluster}@stacklight-admin |
The following table describes how the role names available before the
Container Cloud 2.14.0 (Cluster releases 7.4.0, 6.20.0, and 5.21.0) map with
the current IAM*RoleBinding objects in the Container Cloud API map:
Container Cloud new role names |
global-admin |
bm-pool-operator |
operator |
user |
cluster-admin |
stacklight-admin |
|---|---|---|---|---|---|---|
m:kaas@writer |
||||||
m:kaas@reader |
||||||
m:kaas@operator |
||||||
m:kaas:{ns}@writer |
||||||
m:kaas:{ns}@reader |
||||||
m:k8s:{ns}:{cluster}@cluster-admin |
||||||
m:sl:{ns}:{cluster}@admin |
The following tables contain several examples of role assignment either through Keycloak or the Container Cloud IAM objects with the corresponding role mappings for each use case.
Use case |
Namespace operator role binding |
IAM*RoleBinding example |
apiVersion: iam.mirantis.com/v1alpha1
kind: IAMRoleBinding
metadata:
namespace: ns1
name: user1-operator
role:
name: operator
user:
name: user1-f150d839
|
Mapped role in Keycloak |
The role |
Use case |
Cluster-admin role assigned globally |
IAM*RoleBinding example |
apiVersion: iam.mirantis.com/v1alpha1
kind: IAMGlobalRoleBinding
metadata:
name: user1-global-cluster-admin
role:
name: cluster-admin
user:
name: user1-f150d839
|
Mapped role in Keycloak |
For example, if you have two namespaces (
If you create a new |
The following table provides the new-style and old-style examples on how a role assigned to a user through Keycloak will be translated into IAM objects.
Role type |
New-style role |
Role example in Keycloak |
The role The |
Mapped IAM*RoleBinding example |
apiVersion: iam.mirantis.com/v1alpha1
kind: IAMRoleBinding
metadata:
namespace: ns1
name: user1-f150d839-operator
external: true
role:
name: operator
user:
name: user1-f150d839
|
Role type |
Old-style role |
Role example in Keycloak |
The role Creation of this role through Keycloak triggers creation of two
To migrate the old-style For example, if you have two namespaces (
If you create a new If you do not remove the |
Mapped IAM*RoleBinding example |
apiVersion: iam.mirantis.com/v1alpha1
kind: IAMGlobalRoleBinding
metadata:
name: user1-f150d839-global-admin
external: true
legacy: true
legacyRole: m:kaas@writer
role:
name: global-admin
user:
name: user1-f150d839
apiVersion: iam.mirantis.com/v1alpha1
kind: IAMGlobalRoleBinding
metadata:
name: user1-f150d839-operator
external: true
legacy: true
legacyRole: m:kaas@writer
role:
name: operator
user:
name: user1-f150d839
|
Manage user roles through the Container Cloud web UI
If you are assigned the global-admin role, you can manage the
IAM*RoleBinding objects through the Container Cloud web UI. The possibility
to manage project role bindings using the operator role will become
available in one of the following Container Cloud releases.
To add or remove a role binding using the Container Cloud web UI:
Log in to the Container Cloud web UI as
global-admin.In the left-side navigation panel, click Users to open the active users list and view the number and types of bindings for each user. Click on a user name to open the details page with the user Role Bindings.
Select from the following options:
To add a new binding:
Click Create Role Binding.
In the window that opens, configure the following fields:
Parameter
Description
Role
global-adminManage all types of role bindings for all users
management-adminSince MCC 2.25.0 (17.0.0 and 16.0.0)Have full access to the management cluster
bm-pool-operatorManage bare metal hosts of a particular namespace
operatorManage Container Cloud API and Ceph-related objects in a particular project, create clusters and machines, have full access to Kubernetes clusters and StackLight APIs deployed by anyone in this project
Manage role bindings in the current namespace for users who require the
bm-pool-operator,operator, oruserrole
userManage infrastructure of a particular project with access to live statuses of the project cluster machines to monitor cluster health
cluster-adminHave admin access to Kubernetes clusters and StackLight components of a particular cluster and project
stacklight-adminHave admin access to the StackLight components of a particular Kubernetes cluster deployed in a particular project to monitor the cluster health.
Binding type
- Global
Bind a role globally, not limited to a specific project or cluster. By default,
global-adminhas the global binding type.You can bind any role globally. For example, you can change the default project binding of the
operatorrole to apply this role globally, to all existing and new projects.
- Project
Bind a role to a specific project. If selected, also define the Project name that the binding is assigned to.
By default, the following IAM roles have the project binding type:
bm-pool-operator,operator, anduser. You can bind any role to a project except theglobal-adminone.
- Cluster
Bind a role to a specific cluster. If selected, also define the Project and Cluster name that the binding is assigned to. You can bind only the
cluster-adminandstacklight-adminroles to a cluster.
To remove a binding, click the Delete action icon located in the last column of the required role binding.
Bindings that have the
externalflag set totruewill be synced back from Keycloak during the nextuser-controllerreconciliation. Therefore, manage such bindings through Keycloak.
Manage user roles through Keycloak
Note
Since Container Cloud 2.14.0 (Cluster releases 7.4.0, 6.20.0, and 5.21.0):
User roles management is available through the Container Cloud API and web UI.
User management for the
m:osroles is not yet available through API or web UI. Therefore, continue managing these roles using Keycloak.Role names have been updated. For details, see Mapping of Keycloak roles to IAM*RoleBinding objects.
Mirantis Container Cloud creates the IAM roles in scopes.
For each application type, such as kaas, k8s, or sl,
Container Cloud creates a set of roles such as @admin, @cluster-admin,
@reader, @writer, @operator.
Depending on the role, you can perform specific operations in a cluster. For example:
With the
m:kaas@writerrole, you can create a project using the Container Cloud web UI. The corresponding project-specific roles will be automatically created in Keycloak byiam-controller.With the
m:kaas*roles, you can download thekubeconfigof the management cluster.
The semantic structure of role naming in MOSK is as follows:
m:<appType>:<namespaceName>:<clusterName>@<roleName>
Element |
Description |
|---|---|
|
Prefix for all IAM roles in MOSK |
|
Application type:
|
|
Namespace name that is optional depending on the application type |
|
Managed cluster name that is optional depending on the application type |
|
Delimiter between a scope and role |
|
Short name of a role within a scope |
This section outlines the IAM roles and scopes structure in MOSK and role assignment to users using the Keycloak Admin Console.
MOSK roles and scopes
MOSK roles can have three types of scopes:
Scope |
Application type |
Components |
Example |
|---|---|---|---|
Global |
|
|
This scope applies to all managed clusters and namespaces. |
Namespace |
|
|
|
Cluster |
|
|
|
Recommended
Since Container Cloud 2.14.0 (Cluster releases 7.4.0, 6.20.0, 5.21.0), new-style roles were introduced. They can be assigned to users through Keycloak directly as well as by using IAM API objects. Mirantis recommends using IAM API for roles assignment.
Users with the m:kaas@global-admin role can create MOSK
projects, which are Kubernetes namespaces in a management cluster, and all
IAM API objects that manage users access to MOSK.
Users with the m:kaas@management-admin role have full access to the
management cluster. This role is available since Container Cloud 2.25.0
(Cluster releases 17.0.0 and 16.0.0).
After project creation, iam-controller creates the following roles in
Keycloak:
m:kaas:<namespaceName>@operatorProvides the same permissions as
m:kaas:<namespaceName>@writer
m:kaas:<namespaceName>@bm-pool-operatorProvides the same permissions as
m:kaas@operatorbut restricted to a single namespace
m:kaas:<namespaceName>@userProvides the same permissions as
m:kaas:<namespaceName>@reader
m:kaas:<namespaceName>@memberProvides the same permissions as
m:kaas:<namespaceName>@operatorexcept for IAM API access
The old-style m:k8s:<namespaceName>:<clusterName>@cluster-admin role is
unchanged in the new-style format and is recommended for usage.
When a managed cluster is created, a new role
m:sl:<namespaceName>:<clusterName>@stacklight-admin for the sl
application is created. This role provides the same access to the StackLight
resources in the managed cluster as
m:sl:<namespaceName>:<clusterName>@admin and is included into the
corresponding m:k8s:<namespaceName>:<clusterName>@cluster-admin role.
Not recommended
Users with the m:kaas@writer role are considered global
MOSK administrators. They can create MOSK
projects that are Kubernetes namespaces in the management cluster. After a
project is created, the m:kaas:<namespaceName>@writer and
m:kaas:<namespaceName>@reader roles are created in Keycloak by
iam-controller. These roles are automatically included into the
corresponding global roles, such as m:kaas@writer, so that users with the
global-scoped role also obtain the rights provided by the namespace-scoped
roles. The global role m:kaas@operator provides full access to bare metal
objects.
When a managed cluster is created, roles for the sl and k8s
applications are created:
m:k8s:<namespaceName>:<clusterName>@cluster-admin(also applies to new-style roles, recommended)m:sl:<namespaceName>:<clusterName>@admin
These roles provide access to the corresponding resources in a managed cluster
and are included into the corresponding m:kaas:<namespaceName>@writer role.
The following tables include MOSK scopes and descriptions of their roles by three application types:
Scope identifier |
Short role name |
Full role name |
Role description |
|---|---|---|---|
|
|
|
List the API resources within the Container Cloud scope. |
|
|
Create, update, or delete the API resources within the Container Cloud scope. Create projects. |
|
|
|
Add or delete a bare metal host and, since Container Cloud 2.29.1 (Cluster release 16.4.1), bare metal inventory within the Container Cloud scope. |
|
|
|
Create, update, or delete the IAM API resources within the Container Cloud scope. Create projects. |
|
|
|
Available since Container Cloud 2.25.0 (Cluster releases 17.0.0 and 16.0.0). Have full access to the management cluster. |
|
|
|
|
List the API resources within the specified Container Cloud project. |
|
|
Create, update, or delete the API resources within the specified Container Cloud project. |
|
|
|
List the API resources within the specified Container Cloud project. |
|
|
|
Create, update, or delete the API resources within the specified Container Cloud project. |
|
|
|
Add or delete a bare metal host and, since Container Cloud 2.29.1 (Cluster release 16.4.1), bare metal inventory within the specified Container Cloud project. |
|
|
|
Create, update, or delete the API resources within the specified Container Cloud project, except IAM API. |
- 0(1,2,3,4,5)
Role is available by default. Other roles will be added during a managed cluster deployment or project creation.
Scope identifier |
Short role name |
Full role name |
Role description |
|---|---|---|---|
|
|
|
Allow the superuser to perform any action on any resource in the specified cluster. |
Scope identifier |
Short role name |
Full role name |
Role description |
|---|---|---|---|
|
|
|
Access the following web UIs within the scope:
|
|
|
Access the following web UIs within the scope:
|
Use cases
This section illustrates possible use cases for a better understanding on which roles should be assigned to users who perform particular operations in a MOSK cluster:
Role |
Use case |
|---|---|
|
Member of a dedicated infrastructure team who only manages bare metal hosts and, since Container Cloud 2.29.1 (Cluster release 16.4.1), bare metal inventories in MOSK |
|
Infrastructure Operator who performs the following operations:
|
|
Member of a dedicated infrastructure support team responsible for the MOSK infrastructure who performs the following operations:
|
|
User who administers a particular project:
|
|
Member of a dedicated infrastructure support team in a particular project.
For use cases, see the |
|
User who has admin access to a Kubernetes cluster deployed in a particular project. |
|
User who has full access to the StackLight components of a particular Kubernetes cluster deployed in a particular project to monitor the cluster health status. |
See also
Change passwords for IAM users
This section describes how to change passwords for IAM users on publicly accessible MOSK deployments using the Keycloak web UI.
To change the IAM passwords:
Obtain the Keycloak admin password:
kubectl get secret -n kaas iam-api-secrets -o jsonpath='{.data.keycloak_password}' | base64 -d ; echo
Obtain the Keycloak load balancer IP:
kubectl get svc -n kaas iam-keycloak-http
Log in to the Keycloak web UI using the following link form with the default
keycloakadmin user and the Keycloak credentials obtained in the previous steps:https://<Keycloak-LB-IP>/auth/admin/master/console/#/iam/usersNavigate to Users > User list that contains all users in the IAM realm.
Click the required user name. The page with user settings opens.
Open Credentials tab.
Using the Reset password form, update the password as required.
Note
To change the password permanently, toggle the Temporary switch to the OFF position. Otherwise, the user will be prompted to change the password after the next login.
Obtain MariaDB credentials for IAM
Available since MCC 2.22.0 (11.6.0)
To obtain the MariaDB credentials for IAM, use the Container Cloud binary:
./container-cloud get iam-creds --mgmt-kubeconfig <pathToManagementClusterKubeconfig>
Example of system response:
IAM DB credentials:
MYSQL_DBADMIN_PASSWORD: foobar
MYSQL_DBSST_PASSWORD: barbaz
Caution
Credentials provided in the system response allow operating
MariaDB with the root user inside a container. Therefore, use them with
caution.
Manage Keycloak truststore using the Container Cloud web UI
Available since MCC 2.26.0 (17.1.0 and 16.1.0)
While communicating with external services, Keycloak must validate the certificate of the remote server to ensure secured connection.
By default, the standard Java Truststore configuration is used for validating outgoing requests. In order to properly validate client self-signed certificates, the truststore configuration must be added. The truststore is used to ensure secured connection to identity brokers, LDAP identity providers, and so on.
If a custom truststore is set, only certificates from that truststore are used. If trusted public CA certificates are also required, they must be included in the custom truststore.
To add a custom truststore for Keycloak using the Container Cloud web UI:
Log in to the Container Cloud web UI with the
m:kaas:namespace@operatororm:kaas:namespace@writerpermissions.Switch to the default project using the Switch Project action icon located on top of the main left-side navigation panel.
In the Clusters tab, click the More action icon in the last column of the management cluster and select Configure cluster.
In the window that opens, click Keycloak and select Configure trusted certificates.
Note
The Configure trusted certificates check box is available since Container Cloud 2.26.4 (Cluster releases 17.1.4 and 16.1.4).
In the Truststore section that opens, fill out and save the form with the following parameters:
Parameter
Description
Data
Content of the truststore file. Click Upload to select the required file.
Password
Password of the truststore. Mandatory.
Type
Supported truststore types: jks, pkcs12, or bcfks.
Hostname verification policy
Optional verification of the host name of the server certificate:
The default WILDCARD value allows wildcards in subdomain names.
The STRICT value requires the Common Name (CN) to match the host name.
Click Update.
Once a custom truststore for Keycloak is applied, the following configuration
is added to the Cluster object:
spec:
providerSpec:
value:
kaas:
management:
keycloak:
truststore:
data:
value: # base64 encoded truststore file content
password:
value: # string
type: # string
hostnameVerificationPolicy: # string
Note
Use the same web UI menu to customize an existing truststore or reset it to default settings, which is available since Container Cloud 2.26.4 (Cluster releases 17.1.4 and 16.1.4).
Management cluster operations
Note
The Container Cloud web UI communicates with Keycloak to authenticate users. Keycloak is exposed using HTTPS with self-signed TLS certificates that are not trusted by web browsers.
To use your own TLS certificates for Keycloak, refer to Configure TLS certificates for cluster applications.
Caution
Regional clusters are unsupported since Container Cloud 2.25.0 (Cluster releases 17.0.0 and 16.0.0). Mirantis does not perform functional integration testing of the feature and the related code is removed in Container Cloud 2.26.0 (Cluster releases 17.1.0 and 16.1.0). If you still require this feature, contact Mirantis support for further information.
This section covers the management aspects of the bare metal management cluster that MOSK is based on.
The Mirantis Container Cloud web UI enables you to perform the following operations with management clusters:
View the cluster details (such as cluster ID, creation date, node count, and so on) as well as obtain a list of cluster endpoints including the StackLight components, depending on your deployment configuration.
To view generic cluster details, in the Clusters tab, click the More action icon in the last column of the required cluster and select Cluster info.
Note
Adding more than 3 nodes to a management cluster is not supported.
Removing a management cluster using the Container Cloud web UI is not supported. Use the dedicated cleanup script instead. For details, see Remove a management cluster.
Verify the current release version of the cluster including the list of installed components with their versions and the cluster release change log.
To view details of a Cluster release version, in the Clusters tab, click the version in the Release column next to the name of the required cluster.
This section outlines the operations that you can perform with a management cluster.
Container Cloud CLI
The Container Cloud APIs are implemented using the Kubernetes
CustomResourceDefinitions (CRDs) that enable you to expand the Kubernetes
API. For details, see API Reference.
You can operate a cluster using the kubectl command-line tool that is based on the Kubernetes API. For the kubectl reference, see the official Kubernetes documentation.
Workflow and configuration of management cluster upgrade
This section describes specifics of automatic upgrade workflow of a management cluster as well as provides configuration procedures that you may apply before and after automatic upgrade.
For the upgrade procedure of an air-gapped cluster, see Update a cluster in an air-gapped environment.
Automatic upgrade workflow
A management cluster upgrade to a newer version is performed automatically once a new Container Cloud version is released. For more details about the Container Cloud release upgrade mechanism, see Release Controller.
The Operator can delay the automatic update procedure for a limited amount of time or schedule update to run at desired hours or weekdays. For details, see Schedule Mirantis Container Cloud updates.
MOSK remains operational during the management cluster update. MOSK clusters are not affected during this update. For the list of components that are updated, see the Release artifacts section for the management cluster of the corresponding major release in Release Notes.
When Mirantis announces support of the newest versions of Mirantis Container Runtime (MCR) and Mirantis Kubernetes Engine (MKE), MOSK automatically upgrades these components as well. For the maintenance window best practices before upgrade of these components, see MKE Documentation.
Since Container Cloud 2.23.2 (Cluster releases 12.7.1 and 11.7.1), the release update train includes patch release updates being delivered between major releases. Patch release updates also involve automatic upgrade of a management cluster.
Post-upgrade steps
Once the management cluster is automatically upgraded to the latest version, proceed with the following steps:
Update the original bootstrap tarball for successful cluster management, such as collecting logs and so on:
Select from the following options:
For clusters deployed using Container Cloud 2.11.0 (Cluster releases 7.1.0 and 6.18.0) or later:
./container-cloud bootstrap download --management-kubeconfig <pathToMgmtKubeconfig> \ --target-dir <pathToBootstrapDirectory>
For clusters deployed using the Container Cloud release earlier than 2.11.0 (7.0.0, 6.16.0, or earlier), or if you deleted the
kaas-bootstrapfolder, download and run the Container Cloud bootstrap script:wget https://binary.mirantis.com/releases/get_container_cloud.sh chmod 0755 get_container_cloud.sh ./get_container_cloud.sh
Strongly recommended. Back up MKE as described in Mirantis Kubernetes Engine documentation: Back up MKE.
Since the procedure above modifies the cluster configuration, a fresh backup is required to restore the cluster in case further reconfigurations fail.
Schedule Mirantis Container Cloud updates
By default, Container Cloud automatically updates to the latest version, once available. An Operator can delay or reschedule Container Cloud automatic update process using CLI or web UI. The scheduling feature allows:
Limiting hours and weekdays when Container Cloud update can run. For example, if a release becomes available on Monday, you can delay it until Sunday by setting Sunday as the only permitted day for auto-updates.
Available since Container Cloud 2.28.0 (Cluster release 16.3.0):
Blocking Container Cloud auto-update immediately on the release date. The delay period is minimum 20 days for each newly discovered release. The exact number of delay days is set in the release metadata and cannot be changed by the user. It depends on the specifics of each release cycle and on optional configuration of week days and hours selected for update.
You can verify the exact date of a scheduled auto-update either in the Status section of the Management Cluster Updates page in the web UI or in the
statussection of theMCCUpgradeobject.Monitoring availability of new releases with corresponding alerts from StackLight. For details, see StackLight alerts: Container Cloud.
Deprecated since Container Cloud 2.28.0 (Cluster release 16.3.0) in the CLI and removed in the web UI. Blocking Container Cloud update process for up to 7 days from the current date and up to 30 days from the latest Container Cloud release
Caution
Since Container Cloud 2.23.2 (Cluster release 11.7.1), the release update train includes patch release updates being delivered between major releases. The new approach increases the frequency of the release updates. Therefore, schedule a longer maintenance window for the Container Cloud update as there can be more than one scheduled update in the queue.
Schedule update of a management cluster using the web UI
Log in to the Container Cloud web UI as
m:kaas@global-adminorm:kaas@writer.In the left-side navigation panel, click Admin > Updates.
On the Management Cluster Updates page, verify the status of the next release in the Status section.
If the management cluster update is delayed, the section contains the following information about the new release: version, publish date, link to release notes, scheduled date and time of update.
If the management cluster contains managed clusters running unsupported Cluster versions, a tooltip with a notification about blocked update is displayed.
If the cluster is updated to the latest version, the corresponding message is displayed.
On the left side of the page, click Settings.
On the Configure updates schedule page, select Auto-delay cluster updates to delay every new consecutive release for minimum 20 days from the release publish date.
Note
Changing the number of delay days in unsupported. The exact number of delay days depends on specifics of each release cycle and on optional configuration of week days and hours selected for update.
Optional. Select Apply updates only within specific hours:
From the Time Zone list, select the required time zone or type in the required location.
In Allowed Time for update, set the time intervals and week days allowed for update. To set additional update hours, use the + button on the right side of the window.
Note
You can use this option with or without the auto-delay option. When both options are enabled, the next available update starts after the 20-day interval at the earliest allowed hour and week day that are allowed by the defined time window.
Log in to the Container Cloud web UI as
m:kaas@global-adminorm:kaas@writer.In the left-side navigation panel, click Upgrade Schedule in the Admin section.
Click Configure Schedule.
Select the time zone from the Time Zone list. You can also type the necessary location to find it in the list.
Optional. In Delay Upgrade, configure the update delay. You can set no delay or select the exact day, hour, and minute. You can delay the update up to 7 days, but not more than 30 days from the latest release date. For example, the current time is 10:00 March 28, and the latest release was on March 1. In this case, the maximum delay you can set is 10:00 March 31. Regardless of your time zone, configure time in accordance with the previously selected time zone.
Optional. In Allowed Time for Upgrade, set the time intervals when to allow update. Select the update hours in the From and To time input fields. Select days of the week in the corresponding check boxes. Click + to set additional update hours.
Schedule update of a management cluster using CLI
You can delay or reschedule Container Cloud automatic update by editing the
MCCUpgrade object named mcc-upgrade in Kubernetes API.
Caution
Only the management cluster admin and users with the operator
(or writer in old-style Keycloak roles) permissions can edit the
MCCUpgrade object. For object editing, use kubeconfig generated
during the management cluster bootstrap or kubeconfig generated with the
operator (or writer) permissions.
To edit the current configuration, run the following command in the command line:
kubectl edit mccupgrade mcc-upgrade
In the system response, the editor displays the current state of the
MCCUpgrade object in the YAML format. The spec section contains
the current update schedule configuration, for example:
spec:
autoDelay: true
timeZone: CET
schedule:
- hours:
from: 10
to: 17
weekdays:
monday: true
tuesday: true
- hours:
from: 7
to: 10
weekdays:
monday: true
friday: true
In this example, all schedule calculations are done in the CET timezone and upgrades are allowed only:
From 7:00 to 17:00 on Mondays
From 10:00 to 17:00 on Tuesdays
From 7:00 to 10:00 on Fridays
For details about the MCCUpgrade object, see MCCUpgrade resource.
On every update step, the Release Controller verifies if the current time is allowed by the schedule and does not start or proceed with the update if it is not.
Renew the Container Cloud and MKE licenses
When your Mirantis Container Cloud expires, contact you account manager to
request a new license by submitting a ticket through the
Mirantis CloudCare Portal.
If your trial license has expired, contact
Mirantis support for further
information.
Once you obtain a new mirantis.lic file, update Container Cloud along
with MKE clusters using the instructions below.
Important
Once your Container Cloud license expires, all API operations with new and existing clusters are blocked until license renewal. Existing workloads are not affected.
Additionally, since Container Cloud 2.25.0 (Cluster releases 17.0.0 and 16.0.0), you cannot perform the following operations on your cluster with an expired license:
Create new clusters and machines
Automatically upgrade the management cluster
Update managed clusters
To update the Container Cloud and MKE licenses:
Log in to the Container Cloud web UI with the
m:kaas@global-adminrole.Navigate to Admin > License.
Click Update License and upload your new license.
Click Update.
Caution
Machines are not cordoned and drained, user workloads are not interrupted, and the MKE license is updated automatically for all clusters.
See also
Configure NTP server
If you did not add the NTP server parameters during the management cluster bootstrap, configure them on the existing management cluster as required. These parameters are applied to all machines of managed clusters deployed within the configured management cluster.
Caution
The procedure below applies only if ntpEnabled=true (default)
was set during a management cluster bootstrap. Enabling or disabling NTP
after bootstrap is not supported.
Warning
The procedure below triggers an upgrade of all clusters in a specific management cluster, which may lead to workload disruption during nodes cordoning and draining.
To configure an NTP server for managed clusters:
Download your management cluster
kubeconfig:Log in to the Container Cloud web UI with the
m:kaas:namespace@operatororm:kaas:namespace@writerpermissions.Switch to the required project using the Switch Project action icon located on top of the main left-side navigation panel.
Expand the menu of the tab with your user name.
Click Download kubeconfig to download
kubeconfigof your management cluster.Log in to any local machine with
kubectlinstalled.Copy the downloaded
kubeconfigto this machine.
Use the downloaded
kubeconfigto edit the management cluster:kubectl --kubeconfig <kubeconfigPath> edit -n <projectName> cluster <managementClusterName>
In the command above and the step below, replace the parameters enclosed in angle brackets with the corresponding values of your cluster.
In the
regionalsection, add thentp:serverssection with the list of required server names:spec: ... providerSpec: value: kaas: ... ntpEnabled: true ... regional: - helmReleases: - name: baremetal-provider values: config: lcm: ... ntp: servers: - 0.pool.ntp.org ...
Automatically propagate Salesforce configuration to all clusters
You can enable automatic propagation of the Salesforce configuration of your
management cluster to the related managed clusters using the
autoSyncSalesForceConfig=true flag added to the Cluster object of the
management cluster. This option allows for automatic update and sync of the
Salesforce settings on all your clusters after you update your management
cluster configuration.
You can also set custom settings for managed clusters that always override automatically propagated Salesforce values.
Enable propagation of Salesforce configuration using web UI
Log in to the Container Cloud web UI as
m:kaas@global-adminorm:kaas@writer.In the Clusters tab, click the More action icon in the last column of the required management cluster and select Configure.
In the Configure cluster window, navigate to StackLight > Salesforce and select Salesforce Configuration Propagation To Managed Clusters.
Click Update.
Once the automatic propagation applies, the Events section of the corresponding managed cluster displays the following message: Propagated Cluster Salesforce Config From Management <clusterName> Cluster uses SalesForce configuration from management cluster.
Note
To set custom Salesforce settings for your managed clusters that will override the related management cluster settings, refer to the optional step in Enable propagation of Salesforce configuration using CLI.
Enable propagation of Salesforce configuration using CLI
Download your management cluster
kubeconfig:Log in to the Container Cloud web UI with the
m:kaas:namespace@operatororm:kaas:namespace@writerpermissions.Switch to the required project using the Switch Project action icon located on top of the main left-side navigation panel.
Expand the menu of the tab with your user name.
Click Download kubeconfig to download
kubeconfigof your management cluster.Log in to any local machine with
kubectlinstalled.Copy the downloaded
kubeconfigto this machine.
In the
Clusterobjects of the required managed cluster, remove all Salesforce settings that you want to automatically sync with the same settings of the management cluster:kubectl --kubeconfig <mgmtClusterKubeconfigPath> edit -n <managedClusterProjectName> cluster <managedClusterName>
From the StackLight
valuessection, remove the following Salesforce parameters:spec: ... providerSpec: value: helmReleases: - name: stacklight values: ...
alertmanagerSimpleConfig.salesForce.enabled alertmanagerSimpleConfig.salesForce.auth sfReporter.salesForceAuth sfReporter.enabled sfReporter.cronjob
For details about these parameters, refer to StackLight configuration parameters for Salesforce.
In the
managementsection of the management clusterClusterobject, add theautoSyncSalesForceConfig: trueflag:kubectl --kubeconfig <kubeconfigPath> edit -n <projectName> cluster <managementClusterName>
spec: ... providerSpec: value: kaas: ... management: ... autoSyncSalesForceConfig: true
Note
If the
autoSyncSalesForceConfigis not set to any value, automatic propagation is disabled.Once enabled, the following Salesforce parameters are copied to all managed clusters where these settings were not configured yet:
alertmanagerSimpleConfig.salesForce.enabled alertmanagerSimpleConfig.salesForce.auth sfReporter.salesForceAuth sfReporter.enabled sfReporter.cronjob
The existing Salesforce settings of managed clusters will not be overridden after you enable automatic propagation.
To verify the automatic propagation status:
kubectl edit helmbundles <managedClusterName> -n <managedClusterProjectName>
Optional. Set custom Salesforce settings for your managed cluster to override the related management cluster settings. Add the required custom settings to the StackLight
valuessection of the correspondingClusterobject of your managed cluster:spec: ... providerSpec: value: helmReleases: - name: stacklight values: ...
For details, refer to Configure StackLight and StackLight configuration parameters for Salesforce.
Note
Custom settings are not overridden if you update the management cluster settings for Salesforce.
Update the Keycloak IP address on bare metal clusters
The following instruction describes how to update the IP address of the Keycloak service on management clusters.
Note
The commands below contain the default kaas-mgmt name of the
management cluster. If you changed the default name, replace it accordingly.
To verify the cluster name, run kubectl get clusters.
To update the Keycloak IP address on a management cluster:
Log in to a node that contains
kubeconfigof the required management cluster.Make sure that the configuration file is in your
.kubedirectory. Otherwise, set theKUBECONFIGenvironment variable with a full path to the configuration file.Configure the additional
externalIP address pool for themetallbload balancer service.The Keycloak service requires one IP address. Therefore, the
externalIP address pool must contain at least one IP address.Open the
MetalLBConfigobject of the management cluster for editing:kubectl edit metallbconfig <MetalLBConfigName>
In the
ipAddressPoolssection, add:... spec: ipAddressPools: - name: external spec: addresses: - <pool_start_ip>-<pool_end_ip> autoAssign: false avoidBuggyIPs: false ...
In the snippet above, replace the following parameters:
<pool_start_ip>- first IP address in the required range<pool_end_ip>- last IP address in the range
Add the
externalIP address pool name to theL2Advertisementsdefinition. You can add it to the same L2 advertisement as thedefaultIP address pool, or create a new L2 advertisement if required.... spec: l2Advertisements: - name: default spec: interfaces: - k8s-lcm ipAddressPools: - default - external ...
Save and exit the object to apply changes.
Create the
Subnetobject template with the following content:apiVersion: ipam.mirantis.com/v1alpha1 kind: Subnet metadata: labels: cluster.sigs.k8s.io/cluster-name: kaas-mgmt kaas.mirantis.com/provider: baremetal kaas.mirantis.com/region: region-one metallb/address-pool-auto-assign: "false" metallb/address-pool-name: external metallb/address-pool-protocol: layer2 name: master-lb-external namespace: default spec: cidr: <pool_cidr> includeRanges: - <pool_start_ip>-<pool_end_ip>
Note
The
kaas.mirantis.com/regionlabel is removed from all MOSK objects in 24.1. Therefore, do not add the label starting with this release. On existing clusters updated to this release, or if added manually, MOSK ignores this label.In the template above, replace the following parameters:
<pool_start_ip>- first IP address in the desired range.<pool_end_ip>- last IP address in the range.<pool_cidr>- corresponding CIDR address. The only requirement for this CIDR address is that the address range mentioned above must fit into this CIDR. The CIDR address is not used by MetalLB, it is just formally required forSubnetobjects.
Note
If required, use a different IP address pool name.
Apply the
Subnettemplate created in the previous step:kubectl create -f <subnetTemplateName>
Open the
MetalLBConfigTemplateobject of the management cluster for editing:kubectl edit <MetalLBConfigTemplateName>
Add the
externalIP address pool name to theL2Advertisementsdefinition. You can add it to the same L2 advertisement as thedefaultIP address pool, or create a new L2 advertisement if required.... spec: templates: l2Advertisements: | - name: management-lcm spec: ipAddressPools: - default - external interfaces: - k8s-lcm - name: provision-pxe spec: ipAddressPools: - services-pxe interfaces: - k8s-pxe ...
Save and exit the object to apply changes.
Open the
Clusterobject for editing:kubectl edit cluster <clusterName>
Add the following highlighted lines by replacing
<pool_start_ip>with the first IP address in the desired range and<pool_end_ip>with the last IP address in the range:spec: providerSpec: value: helmReleases: - name: metallb values: configInline: address-pools: - name: default protocol: layer2 addresses: - 10.0.0.100-10.0.0.120 // example values - name: external protocol: layer2 auto-assign: false addresses: - <pool_start_ip>-<pool_end_ip>
Note
If required, use a different IP address pool name.
Save and exit the object to apply changes.
Obtain the current Keycloak IP address for reference:
kubectl -n kaas get service iam-keycloak-http -o jsonpath='{.status.loadBalancer.ingress[0].ip}{"\n"}'
Configure the
iam-keycloak-httpservice to listen on one of the IP addresses from theexternalpool:kubectl -n kaas edit service iam-keycloak-http
Add the following annotation to the service:
kind: Service metadata: annotations: metallb.universe.tf/address-pool: external
Save and exit to apply changes.
Verify that the Keycloak service IP address has changed:
kubectl -n kaas get service iam-keycloak-http -o jsonpath='{.status.loadBalancer.ingress[0].ip}{"\n"}'
Monitor the cluster status to verify that the changes are applied:
kubectl get cluster kaas-mgmt -o yaml
In the output, monitor the
urlparameter value in thekeycloakfield:... status: providerStatus: helm: ready: true ... releases: ... iam: keycloak: url: https://<pool_start_ip>
The value of the parameter is typically the first address of the
externalpool rage.Once the parameter has updated, delete the old certificate for the former address:
kubectl delete secret keycloak-tls-certs -n kaas
Note
The new certificate secret with the same name
keycloak-tls-certswill be generated automatically.Verify the new certificate, once available:
kubectl get secret keycloak-tls-certs -n kaas -o yaml
Restart the
iam-keycloak-httppod to ensure that the new certificate is used:Change the number of the
iam-keycloakStatefulSetreplicas to0:kubectl -n kaas scale statefulsets iam-keycloak --replicas=0
Wait until the
READYcolumn has0/0pods:kubectl -n kaas get statefulsets iam-keycloak
Change the number of the
iam-keycloakStatefulSetreplicas back to 3:kubectl -n kaas scale statefulsets iam-keycloak --replicas=3
Wait until the
READYcolumn has at least1/3pods:kubectl -n kaas get statefulsets iam-keycloak
Verify that the IP address in the
status.providerStatus.oidc.issuerUrlfield of theClusterobject has changed:kubectl get cluster kaas-mgmt -o jsonpath='{.status.providerStatus.oidc.issuerUrl}{"\n"}'
If it still contains the old IP address, update it manually:
kubectl edit cluster kaas-mgmt
Under
spec.providerSpec.value.kaas.management.helmReleases, update thevalues.api.keycloak.urlfield inside theiamHelm object definition:spec: providerSpec: value: kaas: management: helmReleases: - name: iam values: api: keycloak: url: https://<newKeycloakServiceIpAddress>
Save and exit to apply changes.
Wait a few minutes until
issuerUrlis changed and OIDC is ready.To verify
issuerUrl:kubectl get cluster kaas-mgmt -o jsonpath='{.status.providerStatus.oidc.issuerUrl}{"\n"}'
To verify OIDC readiness:
kubectl get cluster kaas-mgmt -o jsonpath='{.status.providerStatus.oidc.ready}{"\n"}'
Verify that the Container Cloud and MKE web UIs are accessible with the new Keycloak IP address and certificate.
Configure host names for cluster machines
Available since MCC 2.24.0 (Cluster release 14.0.1) TechPreview
You can enable custom host names for cluster machines so that any machine host
name in a particular management cluster and its managed clusters matches
the related Machine object name.
For example, instead of the default kaas-node-<UID>, a machine host name
will be master-0. The custom naming format is more convenient and easier
to operate with.
Note
After you enable custom host names on an existing management cluster, names of all newly deployed machines in this cluster and its managed clusters will match machine host names. Existing host names will remain the same.
If you are going to clean up a management cluster with this feature enabled after cluster deployment, make sure to manually delete machines with existing non-custom host names before cluster cleanup to prevent cleanup failure. For details, see Remove a management cluster.
You can enable custom host names during management cluster bootstrap during initial cluster configuration. For details, see Deploy a management cluster. To enable the feature on an existing cluster, see the procedure below.
To enable custom host names on an existing management cluster:
Open the
Clusterobject of the management cluster for editing:kubectl edit cluster <mgmtClusterName>
In the
spec.providerSpec.value.kaas.regionalsection of the required region, find the required providernameunderhelmReleasesand addcustomHostnamesEnabled: trueundervalues.config. For example:regional: - helmReleases: - name: baremetal-provider values: config: allInOneAllowed: false customHostnamesEnabled: true internalLoadBalancers: false
The configuration applies in several minutes after the bare metal provider Pods restart automatically.
Verify that
customHostnamesis present in the provider ConfigMap:kubectl -n kaas get configmap provider-config-<providerName> -o=yaml | grep customHostnames
kubectl -n kaas get configmap provider-config-<providerName>-<regionName> -o=yaml | grep customHostnames
Back up MariaDB on a management cluster
Available since MCC 2.27.0 (Cluster release 16.2.0)
MOSK uses a MariaDB database to store data generated by the Container Cloud components. Mirantis recommends backing up your databases to ensure the integrity of your data. Also, you should create an instant backup before upgrading your database to restore it if required.
The Kubernetes cron job responsible for the MariaDB backup is enabled by default to create daily backups. You can modify the default configuration before or after the management cluster deployment.
Warning
A local volume of only one node of a management cluster is selected when the backup is created for the first time. This volume is used for all subsequent backups.
If the node containing backup data must be redeployed, first move the MySQL backup to another node and update the PVC binding along with the MariaDB backup job to use another node as described in Change the storage node for MariaDB.
Important
Mirantis highly recommends that you also back up MKE on management and MOSK clusters regularly, especially after any major action. For example, after the following operations:
Deployment of a management and its MOSK cluster
Updating a cluster to a major or patch version
Adding or redeploying nodes, including host operating system operations using
HostOSConfigurationobjectsChanging the operating system distribution
Reconfiguration of a cluster, for example:
Switching to a new container runtime
Configuring proxy
Updating MKE or Keycloak certificates
Minor cluster changes, for example:
Adding or removing node labels
Creating or removing
UpdateGroupobjects
For the backup procedure, see Mirantis Kubernetes Engine documentation: Back up MKE.
Configure periodic backups of MariaDB
After the management cluster deployment, the cluster configuration includes the MariaDB backup functionality. The Kubernetes cron job responsible for the MariaDB backup is enabled by default. For the MariaDB backup workflow, see Workflows of the OpenStack database backup and restoration.
Warning
A local volume of only one node of a management cluster is selected when the backup is created for the first time. This volume is used for all subsequent backups.
If the node containing backup data must be redeployed, first move the MySQL backup to another node and update the PVC binding along with the MariaDB backup job to use another node as described in Change the storage node for MariaDB.
To manually create a MariaDB database backup:
kubectl -n kaas create job --from=cronjob/mariadb-phy-backup mariadb-phy-backup-manual-001
To modify the default backup configuration for MariaDB:
Select from the following options:
If the management cluster is not bootstrapped yet, proceed to the next step.
If the management cluster is already deployed, verify that the
mariadb-phy-backupCronJobobject is present:kubectl -n kaas get cronjob mariadb-phy-backup
Example of a positive system response:
NAME SCHEDULE SUSPEND ACTIVE LAST SCHEDULE AGE mariadb-phy-backup 0 0 * * * False 0 6h3m 10d
If the object is missing, make sure that your management cluster is successfully upgraded to the latest version.
Select from the following options:
If the management cluster is not bootstrapped yet, modify
cluster.yaml.templateusing the steps below.If the management cluster is already deployed, modify the configuration kubectl edit <mgmtClusterName> using the steps below. By default, the management cluster name is
kaas-mgmt.
Enable the MariaDB backup in the
Clusterobject:spec: providerSpec: value: kaas: management: helmReleases: ... - name: iam values: keycloak: mariadb: conf: phy_backup: enabled: true
Modify the configuration as required. By default, the backup is set up as follows:
Runs on a daily basis at 00:00 AM
Creates full backups daily
Keeps 5 latest full backups
Saves backups to the
mariadb-phy-backup-dataPVCThe backup timeout is
21600secondsThe backup type is
full
The
mariadb-phy-backupcron job launches backups of the MariaDB Galera cluster. The job accepts settings through parameters and environment variables.Modify the following backup parameters that you can pass to the cron job and override from the
Clusterobject:MariaDB backup: Configuration parameters¶ Parameter
Default
Description
--backup-type(string)fullBackup type. The list of possible values include:
incrementalIf the newest full backup is older than the value of the
full_backup_cycleparameter, the system performs a full backup. Otherwise, the system performs an incremental backup of the newest full backup.
fullAlways performs only a full backup.
Usage example:
spec: providerSpec: value: kaas: management: helmReleases: - name: iam values: keycloak: mariadb: conf: phy_backup: backup_type: incremental
--backup-timeout(integer)21600Timeout in seconds for the system to wait for the backup operation to succeed.
Usage example:
spec: providerSpec: value: kaas: management: helmReleases: - name: iam values: keycloak: mariadb: conf: phy_backup: backup_timeout: 30000
--allow-unsafe-backup(boolean)falseIf set to
true, enables the MariaDB cluster backup on a not fully operational cluster where:The current number of ready pods is not equal to
MARIADB_REPLICASSome replicas do not have healthy wsrep statuses
Usage example:
spec: providerSpec: value: kaas: management: helmReleases: - name: iam values: keycloak: mariadb: conf: phy_backup: allow_unsafe_backup: true
Modify the following environment variables that you can pass to the cron job and override from the
Clusterobject:MariaDB backup: Environment variables¶ Variable
Default
Description
MARIADB_BACKUPS_TO_KEEP(integer)10Number of full backups to keep.
Usage example:
spec: providerSpec: value: kaas: management: helmReleases: - name: iam values: keycloak: mariadb: conf: phy_backup: backups_to_keep: 3
MARIADB_BACKUP_PVC_NAME(string)mariadb-phy-backup-dataPersistent volume claim used to store backups.
Usage example:
spec: providerSpec: value: kaas: management: helmReleases: - name: iam values: keycloak: mariadb: conf: phy_backup: backup_pvc_name: mariadb-phy-backup-data
MARIADB_FULL_BACKUP_CYCLE(integer)604800Number of seconds that defines a period between 2 full backups. During this period, incremental backups are performed. The parameter is taken into account only if
backup_typeis set toincremental. Otherwise, it is ignored. For example, withfull_backup_cycleset to604800seconds, a full backup is performed weekly and, if cron is set to0 0 * * *, an incremental backup is performed daily.Usage example:
spec: providerSpec: value: kaas: management: helmReleases: - name: iam values: keycloak: mariadb: conf: phy_backup: full_backup_cycle: 70000
MARIADB_BACKUP_REQUIRED_SPACE_RATIO(floating)1.2Multiplier for the database size to predict the space required to create a backup, either full or incremental, and perform a restoration keeping the uncompressed backup files on the same file system as the compressed ones.
To estimate the size of
MARIADB_BACKUP_REQUIRED_SPACE_RATIO, use the following formula: size of (1 uncompressed full backup + all related incremental uncompressed backups + 1 full compressed backup) in KB =< (DB_SIZE*MARIADB_BACKUP_REQUIRED_SPACE_RATIO) in KB.The
DB_SIZEis the disk space allocated in the MySQL data directory, which is/var/lib/mysql, for databases data excludinggalera.cacheandib_logfile*files. This parameter prevents the backup PVC from being full in the middle of the restoration and backup procedures. If the current available space is lower thanDB_SIZE*MARIADB_BACKUP_REQUIRED_SPACE_RATIO, the backup script fails before the system starts the actual backup and the overall status of the backup job is failed.Usage example:
spec: providerSpec: value: kaas: management: helmReleases: - name: iam values: keycloak: mariadb: conf: phy_backup: backup_required_space_ratio: 1.4
Configuration example:
To perform full backups monthly and incremental backups daily at 02:30 AM and
keep the backups for the last six months, configure the database backup in your
Cluster object as follows:
spec:
providerSpec:
value:
kaas:
management:
helmReleases:
- name: iam
values:
keycloak:
mariadb:
conf:
phy_backup:
enabled: true
backups_to_keep: 6
schedule_time: '30 2 * * *'
full_backup_cycle: 2628000
See also
Verify operability of the MariaDB backup jobs
After you configure the MariaDB periodic jobs, verify that backup jobs are operational by creating a helper pod to view the backup volume content.
To verify operability of the MariaDB backup jobs:
Verify pods in the
kaasproject. After the backup jobs have succeeded, the pods remain in theCompletedstate:kubectl -n kaas get pods -l application=mariadb-phy-backup
Example of a positive system response:
NAME READY STATUS RESTARTS AGE mariadb-phy-backup-1599613200-n7jqv 0/1 Completed 0 43h mariadb-phy-backup-1599699600-d79nc 0/1 Completed 0 30h mariadb-phy-backup-1599786000-d5kc7 0/1 Completed 0 6h17m
Note
By default, the system keeps five latest successful and one latest failed pods.
Obtain an image of the MariaDB container:
kubectl -n kaas get pods mariadb-server-0 -o jsonpath='{.spec.containers[0].image}'
Create the
check_pod.yamlfile to create the helper pod required to view the backup volume content.Configuration example:
apiVersion: v1 kind: ServiceAccount metadata: name: check-backup-helper namespace: kaas --- apiVersion: v1 kind: Pod metadata: name: check-backup-helper namespace: kaas labels: application: check-backup-helper spec: containers: - name: helper securityContext: allowPrivilegeEscalation: false runAsUser: 0 readOnlyRootFilesystem: true command: - sleep - infinity # using image from mariadb sts image: <<insert_image_of_mariadb_container_here>> imagePullPolicy: IfNotPresent volumeMounts: - name: pod-tmp mountPath: /tmp - mountPath: /var/backup name: mysql-backup restartPolicy: Never serviceAccount: check-backup-helper serviceAccountName: check-backup-helper volumes: - name: pod-tmp emptyDir: {} - name: mariadb-secrets secret: secretName: mariadb-secrets defaultMode: 0444 - name: mariadb-bin configMap: name: mariadb-bin defaultMode: 0555 - name: mysql-backup persistentVolumeClaim: claimName: mariadb-phy-backup-data
Apply the helper service account and pod resources:
kubectl -n kaas apply -f check_pod.yaml kubectl -n kaas get pods -l application=check-backup-helper
Example of a positive system response:
NAME READY STATUS RESTARTS AGE check-backup-helper 1/1 Running 0 27s
Verify the directories structure within the
/var/backupdirectory of the spawned pod:kubectl -n kaas exec -t check-backup-helper -- tree /var/backup
Example of a system response:
/var/backup |-- base | `-- 2021-09-09_11-35-48 | |-- backup.stream.gz | |-- backup.successful | |-- grastate.dat | |-- xtrabackup_checkpoints | `-- xtrabackup_info |-- incr | `-- 2021-09-09_11-35-48 | |-- 2021-09-10_01-02-36 | | |-- backup.stream.gz | | |-- backup.successful | | |-- grastate.dat | | |-- xtrabackup_checkpoints | | `-- xtrabackup_info | `-- 2021-09-11_01-02-02 | |-- backup.stream.gz | |-- backup.successful | |-- grastate.dat | |-- xtrabackup_checkpoints | `-- xtrabackup_info
The
basedirectory contains full backups. Each directory in theincrfolder contains incremental backups related to a certain full backup in thebasefolder. All incremental backups always have the base backup name as the parent folder.Delete the helper pod:
kubectl delete -f check_pod.yaml
Restore MariaDB databases
During the restore procedure, the MariaDB service will be unavailable because the MariaDB StatefulSet scales down to 0 replicas. Therefore, plan the maintenance window according to the database size. The restore speed depends on the following:
Network throughput
Storage performance where backups are kept
Local disks performance of nodes with MariaDB local volumes
To restore MariaDB databases:
Obtain an image of the MariaDB container:
kubectl -n kaas get pods mariadb-server-0 -o jsonpath='{.spec.containers[0].image}'
Create the
check_pod.yamlfile to create the helper pod required to view the backup volume content. For example:--- apiVersion: v1 kind: ServiceAccount metadata: name: check-backup-helper namespace: kaas --- apiVersion: v1 kind: Pod metadata: name: check-backup-helper namespace: kaas labels: application: check-backup-helper spec: containers: - name: helper securityContext: allowPrivilegeEscalation: false runAsUser: 0 readOnlyRootFilesystem: true command: - sleep - infinity image: <<insert_image_of_mariadb_container_here>> imagePullPolicy: IfNotPresent volumeMounts: - name: pod-tmp mountPath: /tmp - mountPath: /var/backup name: mysql-backup restartPolicy: Never serviceAccount: check-backup-helper serviceAccountName: check-backup-helper volumes: - name: pod-tmp emptyDir: {} - name: mariadb-secrets secret: secretName: mariadb-secrets defaultMode: 0444 - name: mariadb-bin configMap: name: mariadb-bin defaultMode: 0555 - name: mysql-backup persistentVolumeClaim: claimName: mariadb-phy-backup-data
Create the helper pod:
kubectl -n kaas apply -f check_pod.yaml
Obtain the name of the backup to restore:
kubectl -n kaas exec -t check-backup-helper -- tree /var/backup
Example of system response:
/var/backup |-- base | `-- 2021-09-09_11-35-48 | |-- backup.stream.gz | |-- backup.successful | |-- grastate.dat | |-- xtrabackup_checkpoints | `-- xtrabackup_info |-- incr | `-- 2021-09-09_11-35-48 | |-- 2021-09-10_01-02-36 | |-- 2021-09-11_01-02-02 | |-- 2021-09-12_01-01-54 | |-- 2021-09-13_01-01-55 | `-- 2021-09-14_01-01-55 `-- lost+found 10 directories, 5 files
If you want to restore the full backup, the name from the example above is
2021-09-09_11-35-48. To restore a specific incremental backup, the name from the example above is2021-09-09_11-35-48/2021-09-12_01-01-54.In the example above, the backups will be restored in the following strict order:
2021-09-09_11-35-48- full backup, path/var/backup/base/2021-09-09_11-35-482021-09-10_01-02-36- incremental backup, path/var/backup/incr/2021-09-09_11-35-48/2021-09-10_01-02-362021-09-11_01-02-02- incremental backup, path/var/backup/incr/2021-09-09_11-35-48/2021-09-11_01-02-022021-09-12_01-01-54- incremental backup, path/var/backup/incr/2021-09-09_11-35-48/2021-09-12_01-01-54
Delete the helper pod to prevent PVC multi-attach issues:
kubectl -n kaas delete -f check_pod.yaml
Verify that no other restore job exists on the cluster:
cd kaas-bootstrap kubectl -n kaas get jobs | grep restore kubectl -n kaas get po | grep check-backup-helper
Edit the
Clusterobject by configuring the MariaDB parameters. For example:spec: providerSpec: kaas: management: helmReleases: - name: iam values: keycloak: mariadb: manifests: job_mariadb_phy_restore: true conf: phy_restore: backup_name: "2021-09-09_11-35-48/2021-09-12_01-01-54" replica_restore_timeout: 7200
Parameter
Type
Default
Description
backup-nameString
-
Name of a folder with backup in
<baseBackup>or<baseBackup>/<incrementalBackup>.replica-restore-timeoutInteger
3600Timeout in seconds for 1 replica data to be restored to the
mysqldata directory. Also, includes time for spawning a rescue runner pod in Kubernetes and extracting data from a backup archive.Wait until the
mariadb-phy-restorejob succeeds:kubectl -n kaas get jobs mariadb-phy-restore -o jsonpath='{.status}'The
mariadb-phy-restorejob is an immutable object. Therefore, remove the job after each execution. To correctly remove the job, clean up all settings from theClusterobject that you have configured during step 7 of this procedure. This will remove all related pods as well.
Note
If you create a new user after creating the MariaDB backup file, such user obviously will not exist in the database after restoring MariaDB. But Keycloak may still contain cache about such user. Therefore, during an attempt of this user to log in, the Container Cloud web UI may start the authentication procedure that fails with the following error: Data loading failed: Failed to log in: Failed to get token. Reason: “User not found”. To clear cache in Keycloak, refer to the official Keycloak documentation.
See also
Change the storage node for MariaDB
The default storage class cannot be used on a management cluster, so a
specially created one is used for this purpose. For storage, this class uses
local volumes, which are managed by local-volume-provisioner.
Each node of a management cluster contains a local volume, and the volume bound with a PVC is selected when the backup gets created for the first time. This volume is used for all subsequent backups. Therefore, to ensure reliable backup storage, consider creating a regular backup copy of this volume in a separate location.
If the node that contains backup data must be redeployed, first move the MySQL backup data to another node and update the PVC binding along with the MariaDB backup job to use another node as described below.
Download and save the following script on the node where kubectl is installed and configured to use the Kubernetes API:
Make the script executable and execute it:
vim get_lv_info.sh chmod +x get_lv_info.sh ./get_lv_info.sh
The script outputs the following information:
Primary local volumeCurrent active local volume, which is bound to the PVC using the
backup_pvc_namefield and which is used to store backup data.Secondary local volumeUnused volumes of two remaining nodes of the management cluster.
Example of system response:
Primary local volume ==================== Volume: local-pv-a1c9425b Volume path: /mnt/local-volumes/iam/kaas-iam-backup/vol00 Data PVC: mysql-data-mariadb-server-1 Backup PVC: mariadb-phy-backup-data Node: kaas-node-788dba0a-f931-45ff-a66d-1b583851c3ba Machine: master-1 Internal IP: 10.100.91.50 Secondary local volume ---------------------- Volume: local-pv-8519d270 Volume path: /mnt/local-volumes/iam/kaas-iam-backup/vol00 Data PVC: mysql-data-mariadb-server-0 Node: kaas-node-2b83025a-d4d1-4ccc-a263-11b07150f302 Machine: master-0 Internal IP: 10.100.91.51 Secondary local volume ---------------------- Volume: local-pv-1bfef721 Volume path: /mnt/local-volumes/iam/kaas-iam-backup/vol00 Data PVC: mysql-data-mariadb-server-2 Node: kaas-node-f4742907-5fb0-41fb-ba6c-3ce467779754 Machine: master-2 Internal IP: 10.100.91.52
Note
The order of nodes that contain
Secondary local volumeis random.Capture details of the node containing the primary local volume for further usage. For example, you can use the
Internal IPvalue to SSH to the required node and copy the backup data located underVolume pathto a separate location.
Capture details of the local volume and node containing backups as described in Identify a node where backup data is stored. Also, capture details of
Secondary local volumethat you select to move backup data to.Using
Internal IPofPrimary local volume, SSH to the corresponding node and create a backup tarball:Note
In the command below, replace
<newVolumePath>with the value of theVolume pathfield of the selectedSecondary local volume.sudo tar -czPvf ~/mariadb-backup.tar.gz -C <newVolumePath>
Using
Internal IPofSecondary local volume, SSH to the corresponding node and copy the created backupmariadb-backup.tar.gzusing a dedicated utility such as scp, rsync, or other.Restore
mariadb-backup.tar.gzunder the selectedVolume path:sudo tar -xzPvf ~/mariadb-backup.tar.gz -C <newVolumePath>
Update the
CronJobobject to associate it with the new backup node:Download and save the following helper script on a node where kubectl is installed and configured to use Kubernetes API:
Make the script executable:
vim fix_cronjob_pvc.sh chmod +x fix_cronjob_pvc.sh
Using the
Data PVCvalue of the selectedSecondary local volume, run the script:./fix_cronjob_pvc.sh <secondaryDataPVCName>
Remove a management cluster
This section describes how to remove a management cluster. You can also use the following instruction to remove unsupported regional clusters, if any.
To remove a management or regional cluster:
Verify that you have successfully removed all managed clusters that run on top of the management or regional cluster to be removed. For details, see Delete a managed cluster.
If you enabled custom host names on an existing management or regional cluster as described in Configure host names for cluster machines, and the cluster contains hosts with non-custom names, manually delete such hosts to prevent cleanup failure.
Log in to a local machine where your management cluster
kubeconfigis located and wherekubectlis installed.Note
The management cluster
kubeconfigis created during the last stage of the management cluster bootstrap.Note
To remove a regional cluster, you also need access to the regional cluster
kubeconfigthat was created during the last stage of the regional cluster bootstrap.Verify that the bootstrap directory is updated.
Select from the following options:
For clusters deployed using Container Cloud 2.11.0 (Cluster releases 7.1.0 and 6.18.0) or later:
./container-cloud bootstrap download --management-kubeconfig <pathToMgmtKubeconfig> \ --target-dir <pathToBootstrapDirectory>
For clusters deployed using the Container Cloud release earlier than 2.11.0 (7.0.0, 6.16.0, or earlier), or if you deleted the
kaas-bootstrapfolder, download and run the Container Cloud bootstrap script:wget https://binary.mirantis.com/releases/get_container_cloud.sh chmod 0755 get_container_cloud.sh ./get_container_cloud.sh
If you are removing the regional cluster, run the following script. Otherwise, skip this step.
REGIONAL_CLUSTER_NAME=<regionalClusterName> \ REGIONAL_KUBECONFIG=<pathToRegionalClusterKubeconfig> \ KUBECONFIG=<mgmtClusterKubeconfig> \ bootstrap.sh destroy_regional
Remove the management cluster:
bootstrap.sh cleanup
Note
Removing a management or regional cluster using the Container Cloud web UI is not supported.
Warm up the Container Cloud cache
Available since MCC 2.24.0 (14.0.1 and 15.0.1) TechPreview
This section describes how to speed up deployment and update process of
managed clusters, which usually do not have access to the Internet and
consume artifacts from a management cluster using the mcc-cache service.
By default, after auto-upgrade of a management cluster,
before each managed cluster deployment or update, mcc-cache downloads the
required list of images, thus slowing down the process.
Using the CacheWarmupRequest resource, you can predownload (warm up)
a list of images included in a given set of Cluster releases into the
mcc-cache service only once per release for further usage on all managed
clusters.
After a successful cache warm-up, the object of the CacheWarmupRequest
resource is automatically deleted from the cluster and cache remains for
managed clusters deployment or update until next Container Cloud auto-upgrade
of the management cluster.
Caution
If the disk space for cache runs out, the cache for the oldest object is evicted. To avoid running out of space in the cache, verify and adjust its size before each cache warm-up.
Requirements
Cache warm-up requires a lot of disk storage, it may take up to 100% of disk
space. Therefore, make sure to have enough space for storing cached objects
on each node of the management cluster before creating the
CacheWarmupRequest resource. The following example contains minimal
required values for the cache size for the management cluster:
Cluster release |
Minimal value in GiB |
|---|---|
MOSK Cluster release with one OpenStack version |
50 |
MOSK Cluster release with an OpenStack version upgrade
from |
120 |
Increase cache size for mcc-cache
After you calculate the disk size for warming up cache depending on your
cluster settings and minimal cache warm-up requirements, configure the size of
cache in the Cluster object of your cluster.
In the spec:providerSpec:value:kaas:regionalHelmReleases: section of the
management Cluster object, add the following snippet to the mcc-cache
entry with the required size value in GiB:
nginx:
cacheSize: 100
kubectl --kubeconfig <pathToManagementClusterKubeconfig> edit cluster <clusterName>
Configuration example:
spec:
providerSpec:
value:
kaas:
regionalHelmReleases:
- name: mcc-cache
values:
nginx:
cacheSize: 100
Note
The cacheSize parameter is set in GiB.
Warm up cache using CLI
After you increase the size of cache on the cluster as described in
Increase cache size for mcc-cache, create the CacheWarmupRequest object in the
Kubernetes API.
Caution
Create CacheWarmupRequest objects only on the management
cluster.
To warm up cache using CLI:
Identify the latest available Cluster releases to use for deployment of new clusters and update of existing clusters:
kubectl --kubeconfig <pathToManagementClusterKubeconfig> get kaasreleases -l=kaas.mirantis.com/active="true" -o=json | jq -r '.items[].spec.supportedClusterReleases[] | select(.availableUpgrades | length == 0) | .name'
Example of system response:
mke-14-0-1-3-6-5 mosk-15-0-1
On the management cluster, create a
.yamlfile for theCacheWarmupRequestobject using the following example:apiVersion: kaas.mirantis.com/v1alpha1 kind: CacheWarmupRequest metadata: name: example-cluster-name namespace: default spec: clusterReleases: - mke-14-0-1 - mosk-15-0-1 openstackReleases: - yoga fetchRequestTimeout: 30m clientsPerEndpoint: 2 openstackOnly: false
In this example:
The
CacheWarmupRequestobject is created for a management cluster namedexample-cluster-name.The
CacheWarmupRequestobject is created in the only alloweddefaultContainer Cloud project.Two Cluster releases
mosk-15-0-1andmke-14-0-1will be predownloaded.For
mosk-15-0-1, only images related to the OpenStack versionYogawill be predownloaded.Maximum time-out for a single request to download a single artifact is 30 minutes.
Two parallel workers will fetch artifacts per each
mcc-cacheservice endpoint.All artifacts will be fetched, not only those related to OpenStack.
For details about the
CacheWarmupRequestobject, see CacheWarmupRequest resource.Apply the object to the cluster:
kubectl --kubeconfig <pathToManagementKubeconfig> apply -f <pathToFile>
Once done, during deployment and update of managed clusters, Container Cloud uses cached artifacts from the
mcc-cacheservice to facilitate and speed up the procedure.
When a new Container Cloud release becomes available and the management cluster auto-upgrades to a new Container Cloud release, repeat the above steps to predownload a new set of artifacts for managed clusters.
General operations
The section covers general operations required while managing a MOSK cluster.
Change a cluster configuration
After deploying a managed cluster, you can configure a few cluster settings using the Container Cloud web UI as described below.
To change a cluster configuration:
Log in to the Container Cloud web UI with the
m:kaas:namespace@operatororm:kaas:namespace@writerpermissions.Select the required project.
On the Clusters page, click the More action icon in the last column of the required cluster and select Configure cluster.
In the Configure cluster window:
In the General Settings tab, you can:
Add or update proxy for a cluster by selecting the name of previously created proxy settings from the Proxy drop-down menu.
Proxy configuration
In the Proxies tab, configure proxy:
Click Add Proxy.
In the Add New Proxy wizard, fill out the form with the following parameters:
Proxy configuration¶ Parameter
Description
Proxy Name
Name of the proxy server to use during MOSK cluster creation.
Region Removed in MCC 2.26.0 (16.1.0 and 17.1.0)
From the drop-down list, select the required region.
HTTP Proxy
Add the HTTP proxy server domain name in the following format:
http://proxy.example.com:port- for anonymous accesshttp://user:password@proxy.example.com:port- for restricted access
HTTPS Proxy
Add the HTTPS proxy server domain name in the same format as for HTTP Proxy.
No Proxy
Comma-separated list of IP addresses or domain names.
For implementation details, see Proxy support and cache of artifacts.
If your proxy requires a trusted CA certificate, select the CA Certificate check box and paste a CA certificate for a MITM proxy to the corresponding field or upload a certificate using Upload Certificate.
Note
The possibility to use a MITM proxy with a CA certificate is available since MOSK 23.1.
For the list of Mirantis resources and IP addresses to be accessible from MOSK clusters, see Reference Architecture: Requirements.
Using the SSH Keys drop-down menu, select the required previously created SSH key to add it to the running cluster. If required, you can add several keys or remove unused ones, if any.
Note
To delete an SSH key, use the SSH Keys tab of the main menu.
Applies since MCC 2.21.x (Cluster releases 12.5.0 and 11.5.0). Using the Container Registry drop-down menu, select the previously created Docker container registry name to add it to the running cluster.
Applies since MCC 2.25.0 (Cluster releases 17.0.0 and 16.0.0). Using the following options, define the maximum number of worker machines to be upgraded in parallel during cluster update:
- Parallel Upgrade Of Worker Machines
The maximum number of the worker nodes to update simultaneously. It serves as an upper limit on the number of machines that are drained at a given moment of time. Defaults to
1.- Parallel Preparation For Upgrade Of Worker Machines
The maximum number of worker nodes being prepared at a given moment of time, which includes downloading of new artifacts. It serves as a limit for the network load that can occur when downloading the files to the nodes. Defaults to
50.
In the Stacklight tab, select or deselect StackLight and configure its parameters if enabled.
You can also update the default log level severity for all StackLight components as well as set a custom log level severity for specific StackLight components. For details about severity levels, see Log verbosity.
Click Update to apply the changes.
Strongly recommended. Back up MKE as described in Mirantis Kubernetes Engine documentation: Back up MKE.
Since the procedure above modifies the cluster configuration, a fresh backup is required to restore the cluster in case further reconfigurations fail.
Enable cluster and machine maintenance mode
Before performing node maintenance operations that are not managed by MOSK, such as operating system configuration or node reboot, enable maintenance mode on the cluster and required machines using the Container Cloud web UI or CLI to prepare workloads for maintenance.
Enable maintenance mode on a cluster and machine using web UI
You can use the instructions below to enable maintenance mode on a cluster and machine using the Container Cloud web UI. To enable maintenance mode using the Container Cloud API, refer to Enable maintenance mode on a cluster and machine using CLI.
Caution
To enable maintenance mode on a machine, first enable maintenance mode on the related cluster.
To disable maintenance mode on a cluster, first disable maintenance mode on all machines of the cluster.
Warning
During cluster and machine maintenance:
Cluster upgrades and configuration changes (except of the SSH keys setting) are unavailable. Make sure you disable maintenance mode on the cluster after maintenance is complete.
Data load balancing is disabled while Ceph is in maintenance mode.
Workloads are not affected.
Log in to the Container Cloud web UI with the
m:kaas:namespace@operatororm:kaas:namespace@writerpermissions.Enable maintenance mode on the cluster:
In the Clusters tab, click the More action icon in the last column of the cluster you want to put into maintenance mode and select Enter maintenance. Confirm your selection.
Wait until the Status of the cluster switches to Maintenance.
Now, you can switch cluster machines to maintenance mode.
Caution
Due to the known issue 53886, you can only move controller machines into maintenance mode using the web UI. For worker nodes, use the API as described in Enable maintenance mode on a cluster and machine using CLI.
In the Clusters tab, click the required cluster name to open the list of machines running on it.
In the Maintenance column of the machine you want to put into maintenance mode, enable the toggle switch.
Wait until the machine Status switches to Maintenance.
Once done, the node of the selected machine is cordoned, drained, and prepared for maintenance operations.
Important
Proceed with the node maintenance only after the machine Status switches to Maintenance.
Log in to the Container Cloud web UI with the
m:kaas:namespace@operatororm:kaas:namespace@writerpermissions.In the Clusters tab, click the required cluster name to open its machines list.
In the Maintenance column of the machine you want to disable maintenance mode, disable the toggle switch.
Wait until the machine Status does not display Maintenance, Pending maintenance, or the progress indicator.
Repeat the above steps for all machines that are in maintenance mode.
Disable maintenance mode on the related cluster:
In the Clusters tab, click the More action icon in the last column of the cluster where you want to disable maintenance mode and select Exit maintenance.
Wait until the cluster Status does not display Maintenance, Pending maintenance, or the progress indicator.
Enable maintenance mode on a cluster and machine using CLI
You can use the instructions below to enable maintenance mode on a cluster and machine using the Container Cloud API. To enable maintenance mode using the Container Cloud web UI, refer to Enable maintenance mode on a cluster and machine using web UI.
Caution
To enable maintenance mode on a machine, first enable maintenance mode on the related cluster.
To disable maintenance mode on a cluster, first disable maintenance mode on all machines of the cluster.
Warning
During cluster and machine maintenance:
Cluster upgrades and configuration changes (except of the SSH keys setting) are unavailable. Make sure you disable maintenance mode on the cluster after maintenance is complete.
Data load balancing is disabled while Ceph is in maintenance mode.
Workloads are not affected.
Log in to the host where your management cluster
kubeconfigis located and where kubectl is installed.Enable maintenance mode on the cluster:
In the
valuesection ofproviderSpecof theClusterobject, setmaintenancetotrue:kubectl patch clusters.cluster.k8s.io -n <projectName> <clusterName> --type=merge -p '{"spec":{"providerSpec":{"value":{"maintenance":true}}}}'
Replace the parameters enclosed in angle brackets with the corresponding values.
Wait until the
maintenancestatus istrue:kubectl get clusters.cluster.k8s.io -n <projectName> <clusterName> -o jsonpath='{.status.providerStatus.maintenance}'
Enable maintenance mode on the required machine:
In the
valuesection ofproviderSpecof theMachineobject, setmaintenancetotrue:kubectl patch machines.cluster.k8s.io -n <projectName> <machineName> --type=merge -p '{"spec":{"providerSpec":{"value":{"maintenance":true}}}}'
Wait until the
maintenancestatus istrue:kubectl get machines.cluster.k8s.io -n <projectName> <machineName> -o jsonpath='{.status.providerStatus.maintenance}'
Once done, the node of the selected machine is cordoned, drained, and prepared for maintenance operations.
Log in to the host where your management cluster
kubeconfigis located and where kubectl is installed.Disable maintenance mode on the machine:
In the
valuesection ofproviderSpecof theClusterobject, setmaintenancetofalse:kubectl patch machines.cluster.k8s.io -n <projectName> <machineName> --type=merge -p '{"spec":{"providerSpec":{"value":{"maintenance":false}}}}'
Wait until the machine maintenance mode disables:
kubectl get machines.cluster.k8s.io -n <projectName> <machineName> -o jsonpath='{.status.providerStatus.maintenance}'
Verify that the system output is
falseor empty.
Repeat the above steps for all machines that are in maintenance mode.
Disable maintenance mode on the cluster:
In the
valuesection ofproviderSpecof theClusterobject, setmaintenancetofalse:kubectl patch clusters.cluster.k8s.io -n <projectName> <clusterName> --type=merge -p '{"spec":{"providerSpec":{"value":{"maintenance":false}}}}'
Wait until the cluster maintenance mode disables:
kubectl get clusters.cluster.k8s.io -n <projectName> <clusterName> -o jsonpath='{.status.providerStatus.maintenance}'
Verify that the system output is
falseor empty.
Disable a machine
Available since MCC 2.25.0 (17.0.0 and 16.0.0) for workers on managed clusters TechPreview
You can use the machine disabling API to seamlessly remove a worker machine from the LCM control of a managed cluster. This action isolates the affected node without impacting other machines in the cluster, effectively eliminating it from the Kubernetes cluster. This functionality proves invaluable in scenarios where a malfunctioning machine impedes cluster updates.
Note
The Technology Preview support of the machine disabling feature also applies during cluster update to the Cluster release 17.1.0 or 16.1.0.
Precautions for machine disablement
Before disabling a cluster machine, carefully read the following essential information for a successful machine disablement:
MOSK supports machine disablement of worker machines only.
If an issue occurs on the control plane, which is updated before worker machines, fix the issue or replace the affected control machine as soon as possible to prevent issues with workloads. For reference, see Troubleshooting Guide and Delete a cluster machine.
Disabling a machine can break high availability (HA) of components such as StackLight. Therefore, Mirantis recommends adding a new machine as soon as possible to provide sufficient node number for components HA.
Note
It is expected that the cluster status contains degraded replicas of some components during or after cluster update with a disabled machine. These replicas become available as soon as you replace the disabled machine.
When a machine is
disabled, some services may switch to theNodeReadystate and may require additional actions to unblock LCM tasks.A disabled machine is removed from the overall cluster status and is labeled as Disabled. The requested node number for the cluster remains the same, but an additional
disabledfield is displayed with the number of disabled nodes.A disabled machine is not taken into account for any calculations, for example, when the number of StackLight nodes is required for some restriction check.
MOSK removes the node running the disabled machine from the Kubernetes cluster.
Deletion of the disabled machine with the
gracefuldeletion policy is not allowed. Use theunsafedeletion policy instead. For details, see Delete a cluster machine.For a major cluster update, the Cluster release of a disabled machine must match the Cluster release of other cluster machines.
If a machine is disabled during the major Cluster release update, then the upgrade should be completed if all other requirements are met. However, cluster update to the next available major Cluster release will be blocked until you re-enable or replace the disabled machine.
Patch updates do not have such limitation on different patch Cluster releases. You can update a cluster with a disabled machine to several patch Cluster releases in the scope of one major Cluster release.
After enabling the machine, it will be updated to match the Cluster release of the corresponding cluster, including all related components.
For Ceph machines, you need to perform additional disablement steps.
Disable a machine using the Container Cloud web UI
Carefully read the precautions for machine disablement.
Power off the underlying host of a machine to be disabled.
Warning
If the underlying host of a machine is not powered off, the cluster may still contain the disabled machine in the list of available nodes with
kubeletattempting to start the corresponding containers on the disabled machine.Therefore, Mirantis strongly recommends powering off the underlying host to prevent manual removal of the related Kubernetes node from the Docker Swarm cluster using the MKE web UI.
In the Clusters tab, click the required cluster name to open the list of machines running on it.
Click the More action icon in the last column of the required machine and click Disable.
Wait until the machine Status switches to Disabled.
If the disabled machine contains StackLight or Ceph, migrate these services to a healthy machine:
Verify that the required disabled and healthy machines are not currently added to
GracefulRebootRequest:Note
Machine configuration changes, such as reassigning Ceph and StackLight labels from a disabled machine to a healthy one, which are described in the following steps, are not allowed during graceful reboot. For details, see Perform a graceful reboot of a cluster.
Verify that the More > Reboot machines option is not disabled. If the option is active, skip the following sub-step and proceed to the next step. If the option is disabled, proceed to the following sub-step.
Using the Container Cloud CLI, verify that the new machine, which you are going to use for StackLight or Ceph services migration, is not included in the list of the
GracefulRebootRequestresource. Otherwise, removeGracefulRebootRequestbefore proceeding. For details, see Disable a machine using the Container Cloud CLI.
Note
Since Container Cloud 2.27.0 (Cluster releases 17.2.0 and 16.2.0), reboot of the disabled machine is automatically skipped in
GracefulRebootRequest.If StackLight is deployed on the machine, unblock LCM tasks by moving the
stacklight=enabledlabel to another healthy machine with a sufficient amount of resources and manually remove StackLight Pods along with related local persistent volumes from the disabled machine. For details, see Deschedule StackLight Pods from a worker machine.If Ceph is deployed on the machine:
Disable a Ceph machine
Select one of the following options to open the Ceph cluster
spec:In the CephClusters tab, click the required Ceph cluster name to open its
spec.Open the
KaaSCephClusterobject for editing:kubectl edit kaascephcluster -n <managedClusterProjectName> <KaaSCephClusterName>
In
spec.node, find the machine to be disabled.Back up the machine configuration.
Verify the machine role:
For
mgr,rgw, ormds, move such role to another node located in thenodesection. Such node must meet resource requirements to run the corresponding daemon type and must not have the respective node assigned yet.For
mon, refer to Move a Ceph Monitor daemon to another node for further instructions. Mirantis recommends considering nodes with sufficient resources to run the moved monitor daemon.For
osd, proceed to the next step.
Remove the machine from
spec.
Enable machine using the Container Cloud web UI
In the Clusters tab, click the required cluster name to open the list of machines running on it.
Click the More action icon in the last column of the required machine and click Enable.
Wait until the machine Status switches to Ready.
If Ceph is deployed on the machine:
Enable a Ceph machine
Select one of the following options to open the Ceph cluster
spec:In the CephClusters tab, click the required Ceph cluster name to open its
spec.Open the
KaaSCephClusterobject for editing:kubectl edit kaascephcluster -n <managedClusterProjectName> <KaaSCephClusterName>
In
spec.node, add a new or backed-up configuration of the machine to be enabled.If the machine must have any role besides
osd, consider the following options to return a role back to the node:For
mgr,rgw, ormds, add the role to the enabled node in thenodesection.For
mon, refer to Move a Ceph Monitor daemon to another node for further instructions.
Disable a machine using the Container Cloud CLI
Carefully read the precautions for machine disablement.
Power off the underlying host of a machine to be disabled.
Warning
If the underlying host of a machine is not powered off, the cluster may still contain the disabled machine in the list of available nodes with
kubeletattempting to start the corresponding containers on the disabled machine.Therefore, Mirantis strongly recommends powering off the underlying host to prevent manual removal of the related Kubernetes node from the Docker Swarm cluster using the MKE web UI.
Open the required
Machineobject for editing.In the
providerSpec:valuesection, setdisabletotrue:kubectl patch machines.cluster.k8s.io -n <projectName> <machineName> --type=merge -p '{"spec":{"providerSpec":{"value":{"disable":true}}}}'
Wait until the machine status switches to
Disabled:kubectl get machines.cluster.k8s.io -n <projectName> <machineName> -o jsonpath='{.status.providerStatus.status}'
If the disabled machine contains StackLight or Ceph, migrate these services to a healthy machine:
Verify that the required disabled and healthy machines are not currently added to
GracefulRebootRequest:Note
Machine configuration changes, such as reassigning Ceph and StackLight labels from a disabled machine to a healthy one, which are described in the following steps, are not allowed during graceful reboot. For details, see Perform a graceful reboot of a cluster.
kubectl get gracefulrebootrequest -A kubectl -n <projectName> get gracefulrebootrequest <gracefulRebootRequestName> -o yaml
If the machine is listed in the object
specsection, remove theGracefulRebootRequestobject:kubectl -n <projectName> delete gracefulrebootrequest <gracefulRebootRequestName>
Note
Since Container Cloud 2.27.0 (Cluster releases 17.2.0 and 16.2.0), reboot of the disabled machine is automatically skipped in
GracefulRebootRequest.If StackLight is deployed on the machine, unblock LCM tasks by moving the
stacklight=enabledlabel to another healthy machine with a sufficient amount of resources and manually remove StackLight Pods along with related local persistent volumes from the disabled machine. For details, see Deschedule StackLight Pods from a worker machine.If Ceph is deployed on the machine:
Disable a Ceph machine
Select one of the following options to open the Ceph cluster
spec:In the CephClusters tab, click the required Ceph cluster name to open its
spec.Open the
KaaSCephClusterobject for editing:kubectl edit kaascephcluster -n <managedClusterProjectName> <KaaSCephClusterName>
In
spec.node, find the machine to be disabled.Back up the machine configuration.
Verify the machine role:
For
mgr,rgw, ormds, move such role to another node located in thenodesection. Such node must meet resource requirements to run the corresponding daemon type and must not have the respective node assigned yet.For
mon, refer to Move a Ceph Monitor daemon to another node for further instructions. Mirantis recommends considering nodes with sufficient resources to run the moved monitor daemon.For
osd, proceed to the next step.
Remove the machine from
spec.
Enable a machine using the Container Cloud CLI
Open the required
Machineobject for editing.In the
providerSpec:valuesection, setdisabletofalse:kubectl patch machines.cluster.k8s.io -n <projectName> <machineName> --type=merge -p '{"spec":{"providerSpec":{"value":{"disable":false}}}}'
Wait until the machine status switches to
Ready:kubectl get machines.cluster.k8s.io -n <projectName> <machineName> -o jsonpath='{.status.providerStatus.status}'
If Ceph is deployed on the machine:
Enable a Ceph machine
Select one of the following options to open the Ceph cluster
spec:In the CephClusters tab, click the required Ceph cluster name to open its
spec.Open the
KaaSCephClusterobject for editing:kubectl edit kaascephcluster -n <managedClusterProjectName> <KaaSCephClusterName>
In
spec.node, add a new or backed-up configuration of the machine to be enabled.If the machine must have any role besides
osd, consider the following options to return a role back to the node:For
mgr,rgw, ormds, add the role to the enabled node in thenodesection.For
mon, refer to Move a Ceph Monitor daemon to another node for further instructions.
See also
Release Notes: Known issue 40036 (fixed in 2.26.1: Cluster releases 17.1.1 and 16.1.1)
Perform a graceful reboot of a cluster
Available since MCC 2.23.x (Cluster releases 12.7.0 and 11.7.0)
You can perform a graceful reboot on a management or managed cluster. Use the below procedure to cordon, drain, and reboot the required cluster machines using a rolling reboot without workloads interruption. The procedure is also useful for a bulk reboot of machines, for example, on large clusters.
The reboot occurs in the order of cluster upgrade policy that you can change for managed clusters as described in Change the upgrade order of a machine.
Caution
The cluster and machines must have the Ready status to
perform a graceful reboot.
Perform a rolling reboot of a cluster using web UI
Available since MCC 2.24.x (Cluster release 14.0.1 and 15.0.1)
Log in to the Container Cloud web UI with the
m:kaas:namespace@operatororm:kaas:namespace@writerpermissions.Switch to the required project using the Switch Project action icon located on top of the main left-side navigation panel.
On the Clusters page, verify that the status of the required cluster is Ready. Otherwise, the Reboot machines option is disabled.
Click the More action icon in the last column of the required cluster and select Reboot machines. Confirm the selection.
Note
While a graceful reboot is in progress, the Reboot machines option is disabled.
To monitor the cluster readiness, see Verify cluster status.
Caution
Machine configuration changes are forbidden during graceful reboot. Therefore, either wait until reboot is completed or cancel it using CLI, as described in the following section.
Perform a rolling reboot of a cluster using CLI
Available since MCC 2.23.x (Cluster releases 12.7.0 and 11.7.0)
Create a
GracefulRebootRequestresource with a name that matches the name of the required cluster. For description of the resource fields, see GracefulRebootRequest resource.In
spec:machines, add the machine list or leave it empty to reboot all cluster machines.Wait until all specified machines are rebooted. You can monitor the reboot status of the cluster and machines using the
Conditions:GracefulRebootfields of the correspondingClusterandMachineobjects.The
GracefulRebootRequestobject is automatically deleted once the reboot on all target machines completes.To monitor the live machine status:
kubectl get machines <machineName> -o wide
Example of system response:
NAME READY LCMPHASE NODENAME UPGRADEINDEX REBOOTREQUIRED WARNINGS demo-0 true Ready kaas-node-c6aa8ad3 1 true
Caution
Machine configuration changes are forbidden during graceful reboot.
In emergency cases, for example, to migrate StackLight or Ceph services
from a disabled machine that fails during graceful reboot and blocks the
process, cancel the reboot by deleting the GracefulRebootRequest object:
kubectl -n <projectName> delete gracefulrebootrequest <gracefulRebootRequestName>
Once you migrate StackLight or Ceph services to another machine and disable it,
re-create the GracefulRebootRequest object for the remaining machines
that require reboot.
Note
To reboot a single node, for example, for maintenance purposes, refer to Enable cluster and machine maintenance mode.
See also
Delete a cluster machine
This section instructs you on how to scale down an existing management or managed cluster through the web UI or CLI.
Precautions for a cluster machine deletion
Before deleting a cluster machine, carefully read the following essential information for a successful machine deletion:
Mirantis recommends deleting cluster machines using the Container Cloud web UI or API instead of using the provider tools directly. Otherwise, the cluster deletion or detachment may hang and additional manual steps will be required to clean up machine resources.
An operational managed cluster must contain a minimum of 3 Kubernetes manager machines to meet the etcd quorum and 2 Kubernetes worker machines.
The deployment of the cluster does not start until the minimum number of machines is created.
A machine with the manager role is automatically deleted during the cluster deletion. Manual deletion of manager machines is allowed only for the purpose of node replacement or recovery.
Consider the following precautions before deleting manager machines:
Create a new manager machine to replace the deleted one as soon as possible. This is necessary because after machine removal, the cluster has limited capabilities to tolerate faults. Deletion of manager machines is intended only for replacement or recovery of failed nodes.
You can delete a manager machine only if your cluster has at least two manager machines in the
Readystate.Do not delete more than one manager machine at once to prevent cluster failure and data loss.
After deletion of a manager machine, proceed with additional manual steps described in Replace a failed controller node.
Before replacing a failed manager machine, make sure that all
Deploymentswith replicas configured to1are ready.Ensure that the machine to delete is not a Ceph Monitor. Otherwise, migrate the Ceph Monitor to keep the odd number quorum of Ceph Monitors after the machine deletion. For details, see Migrate a Ceph Monitor before machine replacement.
If StackLight in HA mode is enabled and you are going to delete a machine with the StackLight label:
Make sure that at least 3 machines with the StackLight label remain after the deletion. Otherwise, add an additional machine with such label before the deletion. After the deletion, perform the additional steps described in the deletion procedure, if required.
Do not delete more than 1 machine with the StackLight label. Since StackLight in HA mode uses local volumes bound to machines, the data from these volumes on the deleted machine will be purged but its replicas remain on other machines. Removal of more than 1 machine can cause data loss.
If you move the StackLight label to a new worker machine on an existing cluster, manually deschedule all StackLight components from the old worker machine, which you remove the StackLight label from. For details, see Operations Guide: Deschedule StackLight Pods from a worker machine.
If the machine being deleted has a prioritized upgrade index and you want to preserve the same upgrade order, manually set the required index to the new node that replaces the deleted one. Otherwise, the new node is automatically set the greatest upgrade index that is prioritized the last. To set the upgrade index, refer to Change the upgrade order of a machine.
Delete a cluster machine using web UI
This section instructs you on how to scale down an existing management or managed cluster through the Mirantis Container Cloud web UI.
To delete a machine from a cluster using web UI:
Carefully read the machine deletion precautions.
Ensure that the machine being deleted is not a Ceph Monitor. If it is, migrate the Ceph Monitor to keep the odd number quorum of Ceph Monitors after the machine deletion. For details, see Migrate a Ceph Monitor before machine replacement.
Log in to the Container Cloud web UI with the
m:kaas:namespace@operatororm:kaas:namespace@writerpermissions.Click the More action icon in the last column of the machine you want to delete and select Delete.
Select the machine deletion method:
- Graceful
Recommended. The machine will be prepared for deletion with all workloads safely evacuated. Using this option, you can cancel the deletion before the corresponding node is removed from Docker Swarm.
- Unsafe
Not recommended. The machine will be deleted without any preparation.
- Forced
Not recommended. The machine will be deleted with no guarantee of resources cleanup. Therefore, Mirantis recommends trying Graceful or Unsafe option first.
For deletion workflow of each method, see Overview of machine deletion policies.
Confirm the deletion.
If machine deletion fails, you can reduce the deletion policy restrictions and try another method but in the following order only: Graceful > Unsafe > Forced.
Strongly recommended. Back up MKE as described in Mirantis Kubernetes Engine documentation: Back up MKE.
Since the procedure above modifies the cluster configuration, a fresh backup is required to restore the cluster in case further reconfigurations fail.
See also
Delete a cluster machine using CLI
Available since MOSK 23.3
This section instructs you on how to scale down an existing management or managed cluster through the Container Cloud API. To delete a machine using the Container Cloud web UI, see Delete a cluster machine using web UI.
Using the Container Cloud API, you can delete a cluster machine using the following methods:
Recommended. Enable the
deletefield in theproviderSpecsection of the requiredMachineobject. It allows aborting graceful machine deletion before the node is removed from Docker Swarm.Not recommended. Apply the
deleterequest to theMachineobject.
You can control machine deletion steps by following a specific machine deletion policy.
The deletion policy of the Machine resource used in the Container Cloud
API defines specific steps occurring before a machine deletion.
The Container Cloud API contains the following types of deletion policies: graceful, unsafe, forced. By default, the graceful deletion policy is used.
You can change the deletion policy before the machine deletion. If the deletion process has already started, you can reduce the deletion policy restrictions in the following order only: graceful > unsafe > forced.
Recommended
During a graceful machine deletion, the provider and LCM controllers perform the following steps:
Cordon and drain the node being deleted.
Remove the node from Docker Swarm.
Send the
deleterequest to the correspondingMachineresource.Remove the provider resources such as the VM instance, network, volume, and so on. Remove the related Kubernetes resources.
Remove the finalizer from the
Machineresource. This step completes the machine deletion from Kubernetes resources.
Caution
You can abort a graceful machine deletion only before the corresponding node is removed from Docker Swarm.
During a graceful machine deletion, the Machine object status displays
prepareDeletionPhase with the following possible values:
startedProvider controller prepares a machine for deletion by cordoning, draining the machine, and so on.
completedLCM Controller starts removing the machine resources since the preparation for deletion is complete.
abortingProvider controller attempts to uncordon the node. If the attempt fails, the status changes to
failed.
failedError in the deletion workflow.
During an unsafe machine deletion, the provider and LCM controllers perform the following steps:
Send the
deleterequest to the correspondingMachineresource.Remove the provider resources such as the VM instance, network, volume, and so on. Remove the related Kubernetes resources.
Remove the finalizer from the
Machineresource. This step completes the machine deletion from Kubernetes resources.
During a forced machine deletion, the provider and LCM controllers perform the following steps:
Send the
deleterequest to the correspondingMachineresource.Remove the provider resources such as the VM instance, network, volume, and so on. Remove the related Kubernetes resources.
Remove the finalizer from the
Machineresource. This step completes the machine deletion from Kubernetes resources.
This policy type allows deleting a Machine resource even if the provider or
LCM controller gets stuck at some step. But this policy may require a manual
cleanup of machine resources in case of a controller failure. For details, see
Delete a machine from a cluster using CLI.
Caution
Consider the following precautions applied to the forced machine deletion policy:
Use the forced machine deletion only if either graceful or unsafe machine deletion fails.
If the forced machine deletion fails at any step, the LCM Controller removes the finalizer anyway.
Before starting the forced machine deletion, back up the related
Machineresource:kubectl get machine -n <projectName> <machineName> -o json > deleted_machine.json
Carefully read the machine deletion precautions.
Log in to the host where your management cluster
kubeconfigis located and where kubectl is installed.For the bare metal provider, ensure that the machine being deleted is not a Ceph Monitor. If it is, migrate the Ceph Monitor to keep the odd number quorum of Ceph Monitors after the machine deletion. For details, see Migrate a Ceph Monitor before machine replacement.
Select from the following options:
Recommended. In the
providerSpec.valuesection of theMachineobject, setdeletetotrue:kubectl patch machines.cluster.k8s.io -n <projectName> <machineName> --type=merge -p '{"spec":{"providerSpec":{"value":{"delete":true}}}}'
Replace the parameters enclosed in angle brackets with the corresponding values.
Delete the
Machineobject.kubectl delete machines.cluster.k8s.io -n <projectName> <machineName>
After a successful
unsafeorgracefulmachine deletion, the resources allocated to the machine are automatically freed up.If you applied the
forcedmachine deletion, verify that all machine resources are freed up. Otherwise, manually clean up resources:Delete the Kubernetes
Nodeobject related to the deletedMachineobject:Note
Since MOSK 23.1, skip this step as the system performs it automatically.
Log in to the host where your managed cluster
kubeconfigis located.Verify whether the
Nodeobject for the deletedMachineobject still exists:kubectl get node $(jq -r '.status.nodeRef.name' deleted_machine.json)
If the system response is positive:
Log in to the host where your management cluster
kubeconfigis located.Delete the
LcmMachineobject with same name and project name as the deletedMachineobject.kubectl delete lcmmachines.lcm.mirantis.com -n <projectName> <machineName>
Clean up the provider resources:
Log in to the host that contains the management cluster
kubeconfigand jq installed.If the deleted machine was located on the managed cluster, delete the Ceph node as described in High-level workflow of Ceph OSD or node removal.
Obtain the
BareMetalHostobject that relates to the deleted machine:BMH=$(jq -r '.metadata.annotations."metal3.io/BareMetalHost"| split("/") | .[1]' deleted_machine.json)
Delete the
BareMetalHostcredentials:kubectl delete secret -n <projectName> <machineName>-user-data
Deprovision the related bare metal host object:
Caution
While the Cluster release of the management cluster is 16.4.0,
BareMetalHostInventoryoperations are allowed tom:kaas@management-adminonly. This limitation is lifted once the management cluster is updated to the Cluster release 16.4.1 or later.kubectl patch baremetalhost -n <projectName> ${BMH} --type merge --patch '{"spec": {"image": null, "userData": null}}' kubectl patch baremetalhostinventories -n <projectName> ${BMH} --type merge --patch '{"spec": {"online":false}}' kubectl patch baremetalhost -n <projectName> ${BMH} --type merge --patch '{"spec": {"consumerRef": null}}'
kubectl patch baremetalhost -n <projectName> ${BMH} --type merge --patch '{"spec": {"image": null, "userData": null, "online":false}}' kubectl patch baremetalhost -n <projectName> ${BMH} --type merge --patch '{"spec": {"consumerRef": null}}'
Strongly recommended. Back up MKE as described in Mirantis Kubernetes Engine documentation: Back up MKE.
Since the procedure above modifies the cluster configuration, a fresh backup is required to restore the cluster in case further reconfigurations fail.
See also
Delete a managed cluster
Due to a development limitation in baremetal-operator,
deletion of a managed cluster requires preliminary deletion
of the worker machines running on the cluster.
Warning
Mirantis recommends deleting cluster machines using the Container Cloud web UI or API instead of using the provider tools directly. Otherwise, the cluster deletion or detachment may hang and additional manual steps will be required to clean up machine resources.
Using the Container Cloud web UI, first delete worker machines one by one until you hit the minimum of 2 workers for an operational cluster. After that, you can delete the cluster with the remaining workers and managers.
To delete a baremetal-based managed cluster:
Log in to the Container Cloud web UI with the
m:kaas:namespace@operatororm:kaas:namespace@writerpermissions.Switch to the required project using the Switch Project action icon located on top of the main left-side navigation panel.
In the Clusters tab, click the required cluster name to open the list of machines running on it.
Click the More action icon in the last column of the worker machine you want to delete and select Delete. Confirm the deletion.
Repeat the step above until you have 2 workers left.
In the Clusters tab, click the More action icon in the last column of the required cluster and select Delete.
Verify the list of machines to be removed. Confirm the deletion.
If the cluster deletion hangs and the Deleting status message does not disappear after a while, refer to Cluster deletion or detachment freezes to fix the issue.
Optional. Available since MOSK 23.2. If you do not plan to reuse the bare metal hosts of the deleted cluster, delete them:
In the Baremetal tab, click the kebab menu of the host inventory to be deleted.
Select Delete and confirm deletion.
Caution
Credentials associated with the deleted bare metal host, if any, are deleted automatically.
Optional. Applies before MOSK 23.2. If you do not need credentials associated with the bare metal hosts of the deleted cluster, delete them manually:
kubectl delete baremetalhostcredential <credentialName>
Deleting a cluster automatically frees up the resources allocated for this cluster, for example, instances, load balancers, networks, floating IPs, and so on.
Verify cluster status
This section instructs you on how to verify MOSK cluster status using the Container Cloud web UI during cluster deployment or day-2 operations such as cluster update, maintenance, and so on.
To monitor the cluster readiness, hover over the status icon of a specific cluster in the Status column of the Clusters page.
Once the orange blinking status icon becomes green and Ready, the cluster deployment or update is complete.
You can monitor live deployment status of the following cluster components:
Component |
Description |
|---|---|
Helm |
Installation or upgrade status of all Helm releases |
Kubelet |
Readiness of the node in a Kubernetes cluster, as reported by kubelet |
Kubernetes |
Readiness of all requested Kubernetes objects |
Nodes |
Equality of the requested nodes number in the cluster to the number
of nodes having the |
OIDC |
Readiness of the cluster OIDC configuration |
StackLight |
Health of all StackLight-related objects in a Kubernetes cluster |
Swarm |
Readiness of all nodes in a Docker Swarm cluster |
LoadBalancer |
Readiness of the Kubernetes API load balancer |
ProviderInstance |
Readiness of all machines in the underlying infrastructure |
Graceful Reboot |
Readiness of a cluster during a scheduled graceful reboot, available since Container Cloud 2.24.0 (Cluster releases 15.0.1 and 14.0.0). |
Infrastructure Status |
Available since Container Cloud 2.25.0 (Cluster releases 17.0.0 and 16.0.0).
Readiness of the |
LCM Operation |
Available since Container Cloud 2.26.0 (Cluster releases 17.1.0 and 16.1.0). Health of all LCM operations on the cluster and its machines. |
LCM Agent |
Available since Container Cloud 2.27.0 (Cluster releases 17.2.0 and 16.2.0). Health of all LCM agents on cluster machines and the status of LCM agents update to the version from the current Cluster release. |
For the history of a cluster deployment or update, refer to Inspect the history of a cluster and machine deployment or update.
Verify machine status
This section instructs you on how to verify machine status of a MOSK cluster using the Container Cloud web UI during cluster deployment or day-2 operations such as cluster update, maintenance, and so on.
Machine statuses
The machine creation starts with the Provision status. During provisioning, the machine is not expected to be accessible since its infrastructure (VM, network, and so on) is being created.
The following additional statuses are available for controlled provisioning workflows since Container Cloud 2.30.0 (Cluster releases 21.0.0 and 20.0.0):
AwaitsProvisioning - the machine has discovered hardware inventory and is waiting for an approval from an operator to start provisioning. This phase applies when
day1Provisioningis set tomanual.AwaitsDeployment - the machine has completed provisioning and is waiting for an approval from an operator to start deployment. This phase applies when
day1Deploymentis set tomanual.
Other machine statuses are the same as the LCMMachine object states:
Uninitialized - the machine is not yet assigned to an
LCMCluster.Pending - the agent reports a node IP address and host name.
Prepare - the machine executes
StateItemsthat correspond to thepreparephase. This phase usually involves downloading the necessary archives and packages.Deploy - the machine executes
StateItemsthat correspond to thedeployphase that is becoming a Mirantis Kubernetes Engine (MKE) node.Ready - the machine is being deployed.
Upgrade - the machine is being upgraded to the new MKE version.
Reconfigure - the machine executes
StateItemsthat correspond to thereconfigurephase. The machine configuration is being updated without affecting workloads running on the machine.
Once the status changes to Ready, the deployment of the cluster components on this machine is complete.
To monitor the deploy or update live status of the machine, use one of the following options:
- Quick status
On the Clusters page, in the Managers or Workers column. The green status icon indicates that the machine is Ready, the orange status icon indicates that the machine is Updating.
- Detailed status
In the Machines section of a particular cluster page, in the Status column. Hover over a particular machine status icon to verify the deploy or update status of a specific machine component.
Monitored components of a machine
You can monitor the status of the following machine components:
Component |
Description |
|---|---|
Kubelet |
Readiness of a node in a Kubernetes cluster. |
Swarm |
Health and readiness of a node in a Docker Swarm cluster. |
LCM |
LCM readiness status of a node. |
ProviderInstance |
Readiness of a node in the underlying bare metal infrastructure. |
Graceful Reboot |
Readiness of a machine during a scheduled graceful reboot of a cluster, available since Container Cloud 2.24.x (Cluster releases 15.0.1 and 14.0.0). |
Infrastructure Status |
Available since Container Cloud 2.25.0 (Cluster releases 17.0.0 and
16.0.0). Readiness of the |
LCM Operation |
Available since Container Cloud 2.26.0 (Cluster releases 17.1.0 and 16.1.0). Health of all LCM operations on the machine. |
LCM Agent |
Available since Container Cloud 2.27.0 (Cluster releases 17.2.0 and 16.2.0). Health of the LCM Agent on the machine and the status of the LCM Agent update to the version from the current Cluster release. |
Monitor live machine status using API
You can monitor the live status of a machine deployment of update using the kubectl get machines <machineName> -o wide command.
Example of system response for the above command since Container Cloud 2.23.0 (Cluster release 11.7.0):
NAME READY LCMPHASE NODENAME UPGRADEINDEX REBOOTREQUIRED WARNINGS
demo-0 true Ready kaas-node-c6aa8ad3 1 false
For the history of a machine deployment or update, refer to Inspect the history of a cluster and machine deployment or update.
Underlay Kubernetes operations
The section covers underlay Kubernetes operations of a Mirantis OpenStack for Kubernetes (MOSK) cluster.
Set the MTU size for Calico
Available since MCC 2.24.0 (14.0.0, 14.0.1, 15.0.1) TechPreview
You can set the maximum transmission unit (MTU) size for Calico in the
Cluster object using the calico.mtu parameter. By default, the MTU
size for Calico is 1450 bytes. You can change it regardless of the host
operating system.
For details on how to calculate the MTU size, see Calico documentation: Configure MTU to maximize network performance.
The following configuration example of the Cluster object covers a use
case where the interface MTU size of the workload network, which is the
smallest value across cluster nodes, is set to 9000 and the use of
WireGuard is not expected:
spec:
...
providerSpec:
value:
...
calico:
mtu: 8950
Note
Since Container Cloud 2.29.0 (Cluster releases 17.4.0 and 16.4.0), WireGuard is deprecated. If you still require the feature, contact Mirantis support for further information.
Caution
If you do not expect to use WireGuard encryption, ensure that the MTU size for Calico is at least 50 bytes smaller than the interface MTU size of the workload network. IPv4 VXLAN uses a 50-byte header.
Warning
Mirantis does not recommend changing this parameter on a running cluster. It leads to sequential draining of nodes and re-installation of packets, as during cluster upgrade.
Add or update a CA certificate for a MITM proxy using API
Note
For managed clusters, this feature is available since MOSK 23.1.
When you enable a man-in-the-middle (MITM) proxy access to a managed cluster,
your proxy requires a trusted CA certificate. This section describes how to
manually add the caCertificate field to the spec section
of the Proxy object. You can also use this instruction to update an
expired certificate on an existing cluster.
You can also add a CA certificate for a MITM proxy using the Container Cloud web UI through the Proxies tab. For details, refer to the cluster creation procedure as described in Create a managed bare metal cluster.
Warning
Any modification to the Proxy object, for example, changing
the proxy URL, NO_PROXY values, or certificate, leads to cordon-drain
and Docker restart on the cluster machines.
To add or update a CA certificate for a MITM proxy using API:
Encode your proxy CA certificate. For example:
cat ~/.mitmproxy/mitmproxy-ca-cert.cer | base64 -w0
Replace
~/.mitmproxy/mitmproxy-ca-cert.cerwith the path to your CA certificate file.Open the existing
Proxyobject for editing:Warning
The kubectl apply command automatically saves the applied data as plain text into the
kubectl.kubernetes.io/last-applied-configurationannotation of the corresponding object. This may result in revealing sensitive data in this annotation when creating or modifying the object.Therefore, do not use kubectl apply on this object. Use kubectl create, kubectl patch, or kubectl edit instead.
If you used kubectl apply on this object, you can remove the
kubectl.kubernetes.io/last-applied-configurationannotation from the object using kubectl edit.kubectl --kubeconfig <pathToManagementClusterKubeconfig> -n <projectName> edit proxy <proxyName>
In the system response, find the
specsection with the current proxy configuration. For example:spec: httpProxy: http://172.19.123.57:8080 httpsProxy: http://172.19.123.57:8080
In the
specsection, add or update thespec.caCertificatefield with the base64-encoded proxy CA certificate data. For example:spec: caCertificate: <BASE64_ENCODED_CA_CERTIFICATE> httpProxy: http://172.19.123.57:8080 httpsProxy: http://172.19.123.57:8080
Save the
Proxyobject and proceed with the managed cluster creation.If you update an expired certificate on an existing managed cluster, wait until the machines switch from the
ReconfiguretoReadystate to apply changes.Strongly recommended. Back up MKE as described in Mirantis Kubernetes Engine documentation: Back up MKE.
Since the procedure above modifies the cluster configuration, a fresh backup is required to restore the cluster in case further reconfigurations fail.
Configure TLS certificates for cluster applications
TechPreview
The Container Cloud web UI and StackLight endpoints are available through Transport Layer Security (TLS) with self-signed certificates generated by the Container Cloud provider.
Caution
The Container Cloud endpoints are available only through HTTPS.
Application name |
Cluster Type |
Comment |
|---|---|---|
Container Cloud web UI |
Management |
|
|
Management and managed |
Available since Container Cloud 2.22.0 (Cluster release 11.6.0). |
Keycloak |
Management |
|
|
Management |
Caution
The organization administrator must ensure that the application host name is resolvable within and outside the cluster.
Caution
Custom TLS certificates for Keycloak are supported for new and existing clusters originally deployed using MOS 21.3 or later.
Workflow of custom MKE certificates configuration
Available since 2.24.0 (Cluster releases 14.0.0, 14.0.1) Applies to management clusters only
When you add custom MKE certificates on a management cluster, the following workflow applies:
LCM agents are notified to connect to the management cluster using a different certificate.
After all agents confirm that they are ready to support both current and custom authentication, new MKE certificates apply.
LCM agents switch to the new configuration as soon as it gets valid.
The next cluster reconciliation reconfigures
helm-controllerfor each managed cluster created within the configured management cluster.If MKE certificates apply to the management cluster, the Container Cloud web UI reconfigures.
Caution
The Container Cloud web UI requires up to 10 minutes to update the MKE certificate configuration for communication with the management cluster. During this time, requests to the management cluster fail with the following example error:
Data loading failed
Failed to get projects list. Server response code: 502
This error is expected and disappears once new certificates apply.
Warning
During certificates application, LCM agents from every node must confirm that they have a new configuration prepared. If managed clusters contain a big number of nodes and some are stuck or orphaned, then the whole process gets stuck. Therefore, before applying new certificates, make sure that all nodes are ready.
Warning
If you apply MKE certificates to the management cluster with proxy enabled, all nodes and pods of this cluster and its managed clusters are triggered for reconfiguration and restart, which may cause the API and workload outage.
Prepare TLS certificates
Obtain your DNS server name. For example,
container-cloud-auth.example.com.Buy or generate a certificate from a certification authority (CA) that contains the following items:
A full CA bundle including the root and all intermediate CA certificates.
Your server certificate issued for the
container-cloud-auth.example.comDNS name.Your secret key that was used to sign the certificate signing request. For example,
cert.key.
Select the root CA certificate from your CA bundle and add it to
root_ca.crt.Combine all certificates including the root CA, intermediate CA from the CA bundle, and your server certificate into one file. For example,
full_chain_cert.crt.
Configure TLS certificates using the Container Cloud web UI
Available since MCC 2.24.0 (14.0.0, 14.0.1)
Log in to the Container Cloud web UI with the
m:kaas:namespace@operatororm:kaas:namespace@writerpermissions.Switch to the required project using the Switch Project action icon located on top of the main left-side navigation panel.
In the Clusters tab, click the More action icon in the last column of the required cluster and select Configure cluster.
In the Security > TLS Certificates section, click Add certificate.
In the wizard that opens, fill out and save the form:
Parameter
Description
Server name
Host name of the application.
Applications
Drop-down list of available applications for TLS certificates configuration.
Server certificate
Certificate to authenticate the identity of the server to a client. You can also add a valid certificate bundle. The server certificate must be on the top of the chain.
Private key
Private key for the server that must correspond to the public key used in the server certificate.
CA Certificate
CA certificate that issued the server certificate. Required when configuring Keycloak or
mcc-cache. Use the top-most intermediate certificate if the CA certificate is unavailable.The Security section displays the expiration date and the readiness status for every application with user-defined certificates.
Optional. Edit the certificate using the Edit action icon located to the right of the application status and edit the form filled out in the previous step.
Note
To revoke a certificate, use the Delete action icon located to the right of the application status.
Strongly recommended. Back up MKE as described in Mirantis Kubernetes Engine documentation: Back up MKE.
Since the procedure above modifies the cluster configuration, a fresh backup is required to restore the cluster in case further reconfigurations fail.
Configure TLS certificates using the Container Cloud API
For clusters originally deployed using MOS release earlier than 21.3, download the latest version of the bootstrap script on the management cluster:
wget https://binary.mirantis.com/releases/get_container_cloud.sh chmod 0755 get_container_cloud.sh ./get_container_cloud.sh
Change the directory to
kaas-boostrap.If you deleted this directory, restore it using the step 1 of the procedure described in Collect cluster logs.
Select from the following options:
Set a TLS certificate for the Container Cloud web UI:
./container-cloud set certificate \ --cert-file <fullPathToCertForUI> \ --key-file <pathToPrivateKeyForUI> \ --for ui \ --hostname <applicationHostName> \ --kubeconfig <mgmtClusterKubeconfig>
Since Container Cloud 2.22.0 (Cluster release 11.6.0), set a TLS certificate for
iam-proxy:./container-cloud set certificate \ --cert-file <fullPathToCertForIAMProxyEndpoint> \ --key-file <pathToPrivateKeyForIAMProxyEndpoint> \ --for <IAMProxyEndpoint> --hostname <IAMProxyEndpointHostName> \ --kubeconfig <mgmtClusterKubeconfig> \ --cluster-name <targetClusterName> \ --cluster-namespace <targetClusterNamespace>
Possible values for
IAMProxyEndpointare as follows:iam-proxy-alertaiam-proxy-alertmanageriam-proxy-grafanaiam-proxy-kibanaiam-proxy-prometheus
Set a TLS certificate for Keycloak:
./container-cloud set certificate \ --cacert-file <fullRootpathToCACertForKeycloak> \ --cert-file <fullPathToCertForKeycloak> \ --key-file <pathToPrivateKeyForKeycloak> \ --for keycloak --hostname <applicationHostName> \ --kubeconfig <mgmtClusterKubeconfig>
Set a TLS certificate for
mcc-cache:./container-cloud set certificate \ --cacert-file <fullRootpathToCACertForCache> \ --cert-file <fullPathToCertForCache> \ --key-file <pathToPrivateKeyForCache> \ --for cache --hostname <applicationHostName> \ --kubeconfig <mgmtClusterKubeconfig> \ --cluster-name <targetClusterName> \ --cluster-namespace <targetClusterProjectName>
Caution
All managed clusters must be updated to the latest available Cluster release.
Caution
The organization administrator must ensure that the
mcc-cachehost name is resolvable for all managed clusters.
In the commands above, replace the parameters enclosed in angle brackets with the corresponding values of your cluster.
Flag
Description
--cacert-fileMust contain only one PEM-encoded root CA certificate in the certificate chain of trust.
--cert-fileMust contain all certificates in the server certificate chain of trust including the PEM-encoded server certificate.
--key-filePrivate key used to generate the provided certificate.
--for<applicationName>or<IAMProxyEndpoint>Configures a certificate for a supported application. The list of possible values for application names includes:
cache,keycloak, orui.--hostnameDNS server host name.
--kubeconfigManagement cluster
kubeconfigthat is by default located in thekaas-bootstrapdirectory.--cluster-nameTarget cluster name.
--cluster-namespaceProject name of the target cluster.
Example command:
./container-cloud set certificate \ --cacert-file root_ca.crt \ --cert-file full_chain_cert.crt \ --key-file cert.key \ --for keycloak \ --hostname container-cloud-auth.example.com \ --kubeconfig kubeconfig
Strongly recommended. Back up MKE as described in Mirantis Kubernetes Engine documentation: Back up MKE.
Since the procedure above modifies the cluster configuration, a fresh backup is required to restore the cluster in case further reconfigurations fail.
The self-signed certificates generated and managed by the Container Cloud
provider are stored in *-tls-certs secrets in the kaas and
stacklight namespaces.
Renew expired TLS certificates
MOSK provides automatic renewal of certificates for internal Container Cloud services. Custom certificates require manual renewal.
If you have permissions to view the default project in the Container Cloud
web UI, you may see the Certificate Is Expiring Soon warning for
custom certificates. The warning appears on top of the Container Cloud web UI.
It displays the certificate with the least number of days before expiration.
Click See Details and get more information about other expiring
certificates. You can also find the details about the expiring certificates in
the Status column’s Certificate Issues tooltip on the
Clusters page.
The Certificate Issues status may include the following messages:
- Some certificates require manual renewal
A custom certificate is expiring in less than seven days. Renew the certificate manually using the same container-cloud binary as for the certificate configuration. For details, see Configure TLS certificates using the Container Cloud API.
- Some certificates were not renewed automatically
An automatic certificate renewal issue. Unexpected error, contact Mirantis support.
Caution
After certificate renewal, back up MKE as described in Mirantis Kubernetes Engine documentation: Back up MKE.
Define a custom CA certificate for a private Docker registry
This section instructs you on how to define a custom CA certificate for Docker registry connections on your management or managed cluster using the Container Cloud web UI or CLI.
Caution
A Docker registry that is being used by a cluster cannot be deleted.
Define a custom CA certificate for a Docker registry using CLI
Create a
ContainerRegistryresource(s) with the required registry domain and CA certificate. For details, see ContainerRegistry resource.In the
providerSpecsection of theClusterobject, set thecontainerRegistriesfield with the names list of createdContainerRegistryresource objects:kubectl patch cluster -n <clusterProjectName> <clusterName> --type merge -p '{"spec":{"providerSpec":{"value":{"containerRegistries":["<containerRegistryName>"]}}}}'
Strongly recommended. Back up MKE as described in Mirantis Kubernetes Engine documentation: Back up MKE.
Since the procedure above modifies the cluster configuration, a fresh backup is required to restore the cluster in case further reconfigurations fail.
Define a custom CA certificate for a Docker registry using web UI
Log in to the Container Cloud web UI with the
m:kaas:namespace@operatororm:kaas:namespace@writerpermissions.In the Container Registries tab, click Add Container Registry.
In the Add new Container Registry window, define the following parameters:
- Container Registry Name
Name of the Docker registry to select during cluster creation or post-deployment configuration.
- Domain
Host name and optional port of the registry. For example,
demohost:5000.
- CA Certificate
SSL CA certificate of the registry to upload or insert in plain text.
Click Create.
Strongly recommended. Back up MKE as described in Mirantis Kubernetes Engine documentation: Back up MKE.
Since the procedure above modifies the cluster configuration, a fresh backup is required to restore the cluster in case further reconfigurations fail.
You can add the created Docker registry configuration to a new or existing managed cluster as well as to an existing management cluster:
For a new managed cluster, in the Create new cluster wizard, select the required registry name from the drop-down menu of the Container Registry option. For details on a new cluster creation, see Create a managed bare metal cluster.
For an existing cluster of any type, in the More menu of the cluster, select the required registry name from the drop-down menu of the Configure cluster > General Settings > Container Registry option. For details on an existing managed cluster configuration, see Change a cluster configuration.
Increase memory limits for cluster components
When any MOSK component reaches the limit of memory resources usage, the affected pod may be killed by OOM killer to prevent memory leaks and further destabilization of resource distribution.
A periodic recreation of a pod killed by OOM killer is normal once a day or
week. But if the alerts frequency increases or pods cannot start and move to
the CrashLoopBack state, adjust the default memory limits to fit your
cluster needs and prevent critical workloads interruption.
When any MOSK component reaches the limit of CPU resources
usage, StackLight raises the CPUThrottlingHigh alerts. CPU limits for
MOSK components (except the StackLight ones) were removed in
Container Cloud 2.24.0 (Cluster releases 14.0.0, 14.0.1, and 15.0.1). For
earlier versions, use the resources:limits:cpu parameter located in the
same section as the resources:limits:memory parameter of the corresponding
component.
Note
For StackLight resources limits, refer to StackLight configuration parameters.
To increase memory limits on a MOSK cluster:
In the spec:providerSpec:value: section of cluster.yaml, add the
resources:limits parameters with the required values for necessary
MOSK components:
kubectl --kubeconfig <pathToManagementClusterKubeconfig> -n <projectName> edit cluster <clusterName>
The limits key location in the Cluster object can differ depending on
component. Different cluster types have different sets of components that
you can adjust limits for.
The following sections describe components that relate to a specific cluster
type with corresponding limits key location provided in configuration
examples. Limit values in the examples correspond to default values used since
Container Cloud 2.24.0 (Cluster releases 15.0.1, 14.0.1, and 14.0.0).
Note
For StackLight resources limits, refer to Resource limits.
Limits for common components of any cluster type
No limits are set for the following components:
storage-discovery
The memory limits for the following components can be increased on the management and managed clusters:
client-certificate-controllermetrics-servermetallb
Note
For
helm-controller, limits configuration is not supported.For
metallb, the limits key incluster.yamldiffers from other common components.
Component name |
Configuration example |
|---|---|
|
spec:
providerSpec:
value:
helmReleases:
- name: client-certificate-controller
values:
resources:
limits:
memory: 500Mi
|
|
spec:
providerSpec:
value:
helmReleases:
- name: metallb
values:
controller:
resources:
limits:
memory: 200Mi
# no CPU limit and 200Mi of memory limit since MCC 2.24.0 (15.0.1, 14.0.0)
# 200m CPU and 200Mi of memory limit since MCC 2.23.0 (11.7.0)
speaker:
resources:
limits:
memory: 500Mi
# no CPU limit and 500Mi of memory limit since MCC 2.24.0 (15.0.1, 14.0.0)
# 500m CPU and 500Mi of memory limit since MCC 2.23.0 (11.7.0)
|
Limits for management cluster components
No limits are set for the following components:
baremetal-operatorbaremetal-providercert-manager
The memory limits for the following components can be increased on a
management cluster in the
spec:providerSpec:value:kaas:management:helmReleases: section:
|
|
- 0
The
proxy-controllercomponent is replaced withsecret-controllerin MCC 2.27.0 (Cluster releases 17.2.0 and 16.2.0).
The memory limits for the following components can be increased on a management cluster in the following sections:
spec:providerSpec:value:kaas:regional:provider:baremetal:helmReleases:spec:providerSpec:value:kaas:regionalHelmReleases:
|
|
Component name |
Configuration example |
|---|---|
|
spec:
providerSpec:
value:
kaas:
management:
helmReleases:
- name: release-controller
values:
resources:
limits:
memory: 200Mi
|
|
spec:
providerSpec:
value:
kaas:
regional:
- provider: baremetal
helmReleases:
- name: baremetal-provider
values:
cluster_api_provider_baremetal:
resources:
requests:
cpu: 500m
memory: 500Mi
|
|
spec:
providerSpec:
value:
kaas:
regionalHelmReleases:
- name: lcm-controller
values:
resources:
limits:
memory: 1Gi
|
|
spec:
providerSpec:
value:
kaas:
regionalHelmReleases:
- name: mcc-cache
values:
nginx:
resources:
limits:
memory: 500Mi
registry:
resources:
limits:
memory: 500Mi
kproxy:
resources:
limits:
memory: 300Mi
|
|
spec:
providerSpec:
value:
kaas:
regional:
- provider: baremetal
helmReleases:
- name: squid-proxy
values:
resources:
limits:
memory: 1Gi
|
Increase storage quota for etcd
Available since MCC 2.24.4 (Cluster releases 15.0.3 and 14.0.3)
You may need to increase the default etcd storage quota that is 2 GB if etcd runs out of space and there is no other way to clean up the storage on your management or managed cluster.
To increase storage quota for etcd:
In the
spec:providerSpec:value:section ofcluster.yaml, edit theetcd:storageQuotavalue:kubectl --kubeconfig <pathToManagementClusterKubeconfig> -n <projectName> edit cluster <clusterName>
Configuration example:
apiVersion: cluster.k8s.io/v1alpha1 kind: Cluster metadata: name: mycluster labels: kaas.mirantis.com/provider: baremetal kaas.mirantis.com/region: region-one spec: providerSpec: value: apiVersion: baremetal.k8s.io/v1alpha1 kind: BaremetalClusterProviderSpec etcd: storageQuota: 4GB
Caution
You cannot decrease the
storageQuotaonce set.Note
The
kaas.mirantis.com/regionlabel is removed from all MOSK objects in 24.1. Therefore, do not add the label starting with this release. On existing clusters updated to this release, or if added manually, MOSK ignores this label.Applies only to the following Cluster releases:
15.0.3 (MOSK 23.2.2) or 14.0.3
15.0.4 (MOSK 23.2.3) or 14.0.4 if you scheduled a delayed management cluster upgrade
Before upgrading your management cluster to MCC 2.25.0 (Cluster release 16.0.0), configure
LCMMachineresources of the cluster controller nodes as described in Configure managed clusters with the etcd storage quota set.
Configure Kubernetes auditing and profiling
Available since MCC 2.24.3 (Cluster releases 15.0.2 and 14.0.2)
This section instructs you on how to enable and configure Kubernetes auditing
and profiling options for MKE using the Cluster object of your
MOSK managed or management cluster. These options enable
auditing and profiling of MKE performance with specialized debugging endpoints.
Note
You can also enable audit_log_configuration using the MKE API
with no MOSK overrides. However, if you enable the option
using the Cluster object, use the same object to disable the option.
Otherwise, if you disable the option using the MKE API, it will be
overridden by MOSK and enabled again.
References:
For MOSK overrides, see Reference Architecture: MKE options managed by Container Cloud
For configuration using the MKE API, see MKE documentation: Enable MKE audit logging
To enable Kubernetes auditing and profiling for MKE:
Open the
Clusterobject of your MOSK cluster for editing.In
spec:providerSpec:value:section:Add or configure the
auditconfiguration. For example:spec: ... providerSpec: value: ... audit: kubernetes: level: request includeInSupportDump: true apiServer: enabled: true maxAge: <uint> maxBackup: <uint> maxSize: <uint>
You can configure the following parameters that are also defined in the MKE configuration file:
Note
The names of the corresponding MKE options are marked with
[]in the below definitions.levelDefines the value of
[audit_log_configuration]level. Valid values arerequestandmetadata.Note
For management clusters, the
metadatavalue is set by default since Container Cloud 2.26.0 (Cluster release 16.1.0).
includeInSupportDumpDefines the value of
[audit_log_configuration]support_dump_include_audit_logs. Boolean.
apiServer:enabledDefines the value of
[cluster_config]kube_api_server_auditing. Boolean. If set totruebut with nolevelset, the[audit_log_configuration]levelMKE option is set tometadata.Note
For management clusters, this option is enabled by default since the Container Cloud 2.26.0 (Cluster release 16.1.0).
maxAgeAvailable since Container Cloud 2.27.0 (Cluster releases 17.2.0 and 16.2.0). Defines the value of
kube_api_server_audit_log_maxage. Integer. If not set, defaults to30.
maxBackupAvailable since Container Cloud 2.27.0 (Cluster releases 17.2.0 and 16.2.0). Defines the value of
kube_api_server_audit_log_maxbackup. Integer. If not set, defaults to10.
maxSizeAvailable since Container Cloud 2.27.0 (Cluster releases 17.2.0 and 16.2.0). Defines the value of
kube_api_server_audit_log_maxsize. Integer. If not set, defaults to10.
Enable profiling:
spec: ... providerSpec: value: ... profiling: enabled: true
Enabling profiling automatically enables the following MKE configuration options:
[cluster_config]kube_api_server_profiling_enabled [cluster_config]kube_controller_manager_profiling_enabled [cluster_config]kube_scheduler_profiling_enabled
Since Container Cloud 2.26.4 (Cluster releases 17.1.4 and 16.1.4), manually enable audit log rotation in the MKE configuration file:
Note
Since Container Cloud 2.27.0 (Cluster releases 17.2.0 and 16.2.0), the below parameters are automatically enabled with default values along with the auditing feature. Therefore, skip this step.
[cluster_config] kube_api_server_audit_log_maxage=30 kube_api_server_audit_log_maxbackup=10 kube_api_server_audit_log_maxsize=10
For the configuration procedure, see MKE documentation: Configure an existing MKE cluster.
While using this procedure, replace the command to upload the newly edited MKE configuration file with the following one:
curl --silent --insecure -X PUT -H "X-UCP-Allow-Restricted-API: i-solemnly-swear-i-am-up-to-no-good" -H "accept: application/toml" -H "Authorization: Bearer $AUTHTOKEN" --upload-file 'mke-config.toml' https://$MKE_HOST/api/ucp/config-toml
The value for the
MKE_HOSTvariable has the<loadBalancerHost>:6443format, whereloadBalancerHostis the corresponding field in the cluster status.The value for
MKE_PASSWORDis taken from theucp-admin-password-<clusterName>secret in the cluster namespace of the management cluster.The value for
MKE_USERNAMEis alwaysadmin.
See also
Limitations
The section covers the limitations of Mirantis OpenStack for Kubernetes (MOSK).
[3544] Due to a community issue,
Kubernetes pods may occasionally not be rescheduled on the nodes that are in
the NotReady state. As a workaround, manually reschedule the pods from
the node in the NotReady state using the
kubectl drain --ignore-daemonsets --force <node-uuid> command.
Troubleshooting Guide
This guide provides solutions to the issues that can occur while deploying and operating your MOSK management and managed clusters.
For the list of known issues that you may encounter in the cluster, refer to the Release Notes for the corresponding MOSK version.
Collect cluster logs
While operating your management or managed cluster, you may require collecting and inspecting the cluster logs to analyze cluster events or troubleshoot issues. For bootstrap logs, see Collect the bootstrap logs.
To collect cluster logs:
Verify that the bootstrap directory is updated.
Select from the following options:
For clusters deployed using Container Cloud 2.11.0 or later:
./container-cloud bootstrap download --management-kubeconfig <pathToMgmtKubeconfig> \ --target-dir <pathToBootstrapDirectory>
For clusters deployed using the Container Cloud release earlier than 2.11.0 or if you deleted the
kaas-bootstrapfolder, download and run the Container Cloud bootstrap script:wget https://binary.mirantis.com/releases/get_container_cloud.sh chmod 0755 get_container_cloud.sh ./get_container_cloud.sh
Obtain
kubeconfigof the required cluster. The management clusterkubeconfigfile is created during the last stage of the management cluster bootstrap. To obtain a managed clusterkubeconfig, see Connect to a MOSK cluster.Obtain the private SSH key of the required cluster:
For a managed cluster, this is an SSH key added in the Container Cloud web UI before the managed cluster creation.
For a management cluster,
ssh_keyis created in the same directory as the bootstrap script during cluster bootstrap.Note
If the initial version of your management cluster was earlier than 2.6.0,
ssh_keyis namedopenstack_tmpand is located at~/.ssh/.
Depending on the cluster type that you require logs from, run the corresponding command:
For a management cluster:
./container-cloud collect logs --management-kubeconfig <pathToMgmtClusterKubeconfig> \ --key-file <pathToMgmtClusterPrivateSshKey> \ --cluster-name <clusterName> --cluster-namespace <clusterProject>
For a managed cluster:
./container-cloud collect logs --management-kubeconfig <pathToMgmtClusterKubeconfig> \ --key-file <pathToManagedClusterSshKey> --kubeconfig <pathToManagedClusterKubeconfig> \ --cluster-name <clusterName> --cluster-namespace <clusterProject>
Substitute the parameters enclosed in angle brackets with the corresponding values of your cluster.
Optional flags:
--output-dirDirectory path to save logs. The default value is
logs/. For example,logs/<clusterName>/events.log.
--extendedOutput the extended version of logs that contains system and MKE logs, logs from LCM Ansible and LCM Agent along with cluster events and Kubernetes resources description and logs.
Without the
--extendedflag, the basic version of logs is collected, which is sufficient for most use cases. The basic version of logs contains all events, Kubernetes custom resources, and logs from all cluster components. This version does not require passing--key-file.
For the logs structure, see Collect the bootstrap logs.
If you require logs of a cluster update, inspect the following folders on the control plane nodes:
/objects/namespaced/<namespaceName>/core/pods/lcm-lcm-controller- <controllerID>/for thelcm-controllerlogs./objects/namespaced/<namespaceName>/core/pods/<providerName-ID>/for logs of the provider controller. For example,baremetal-provider-5b96fb4fd6-bhl7g./system/mke/<controllerMachineName>/(or/system/<controllerMachineName>/mke/) for the MKE support dump. Thedsinfo/dsinfo.txtfile contains Docker and system information of the MKE configuration set before and after update.events.logfor cluster events logs.
Technology Preview. Assess the Ironic pod logs:
Extract the content of the
'message'fields from every log message:kubectl -n kaas logs <ironicPodName> -c syslog | jq -rRM 'fromjson? | .message'
Extract the content of the
'message'fields from theironic_conductorsource log messages:kubectl -n kaas logs <ironicPodName> -c syslog | jq -rRM 'fromjson? | select(.source == "ironic_conductor") | .message'
The syslog container collects logs generated by Ansible during the node deployment and cleanup and outputs them in the JSON format.
Compress the collected log files and send the archive to the Mirantis support team.
Inspect the history of a cluster and machine deployment or update
Available since MCC 2.22.0 (11.6.0)
Using the ClusterDeploymentStatus, ClusterUpgradeStatus,
MachineDeploymentStatus, and MachineUpgradeStatus objects, you
can inspect historical data of cluster and machine deployment or update
stages, their time stamps, statuses, and failure messages, if any.
Caution
The order of cluster and machine update stages may not always be sorted by a time stamp but have an approximate logical order due to several components running simultaneously.
View the history using the web UI
Log in to the Container Cloud web UI with the
m:kaas:namespace@operatororm:kaas:namespace@writerpermissions.Switch to the required project using the Switch Project action icon on top of the main left-side navigation panel.
In the Clusters tab, click the More action icon in the last column of the required cluster area and select History to display details of the
ClusterDeploymentStatusorClusterUpgradeStatusobject, if any.In the window that opens, click the required object to display the object stages, their time stamps, and statuses.
Object names match the initial and/or target Cluster release versions and MKE versions of the cluster at a specific date and time. For example, 11.6.0+3.5.5 (initial version) or 11.5.0+3.5.5 -> 11.6.0+3.5.5.
If any stage fails, hover over the Failure status field to display the failure message.
Optional. Inspect the deployment and update status of the cluster machines:
In the Clusters tab, click the required cluster name. The cluster page with Machines list opens.
Click More action icon in the last column of the required machine area and select History.
View the history using the CLI
Log in to a local machine where your management cluster
kubeconfigis located and where kubectl is installed.Select from the following options:
Inspect the cluster or machine deployment history using the
ClusterDeploymentStatusorMachineDeploymentStatusobject:./bin/kubectl --kubeconfig <pathToClusterKubeconfig> get clusterdeploymentstatus ./bin/kubectl --kubeconfig <pathToClusterKubeconfig> get machinedeploymentstatus
Example extract from a ClusterDeploymentStatus objectkind: ClusterDeploymentStatus metadata: annotations: lcm.mirantis.com/new-history: "true" creationTimestamp: "2022-12-13T15:25:49Z" name: test-managed namespace: default ownerReferences: - apiVersion: cluster.k8s.io/v1alpha1 kind: Cluster name: test-managed release: 11.6.0+3.5.5 stages: - message: "" name: Network prepared status: Success success: true timestamp: "2022-12-13T15:27:19Z" - message: "" name: Load balancers created status: Success success: true timestamp: "2022-12-13T15:27:56Z" - message: "" name: IAM objects created status: Success success: true timestamp: "2022-12-13T15:27:21Z" - message: "" name: Kubernetes API started status: Success success: true timestamp: "2022-12-13T15:57:05Z" - message: "" name: Helm-controller deployed status: Success success: true timestamp: "2022-12-13T15:57:13Z" - message: "" name: HelmBundle created status: Success success: true timestamp: "2022-12-13T15:57:15Z" - message: "" name: Certificates configured status: Success success: true timestamp: "2022-12-13T15:58:29Z" - message: "" name: All machines of the cluster are ready status: Success success: true timestamp: "2022-12-13T16:04:49Z" - message: "" name: OIDC configured status: Success success: true timestamp: "2022-12-13T16:04:07Z" - message: "" name: Cluster is ready status: Success success: true timestamp: "2022-12-13T16:14:04Z"
Example extract from a MachineDeploymentStatus objectapiVersion: kaas.mirantis.com/v1alpha1 kind: MachineDeploymentStatus metadata: creationTimestamp: "2022-12-16T09:57:07Z" name: test-managed-2-master-cwtf8 namespace: default ownerReferences: - apiVersion: cluster.k8s.io/v1alpha1 kind: Machine name: test-managed-2-master-cwtf8 release: 11.6.0+3.5.5 stages: - message: "" name: Provider instance ready status: Success success: true timestamp: "2022-12-16T09:59:28Z" - message: "" name: Prepare phase done status: Success success: true timestamp: "2022-12-16T10:12:05Z" - message: "" name: Deploy phase done status: Success success: true timestamp: "2022-12-16T10:16:36Z" - message: "" name: Reconfigure phase done status: Success success: true timestamp: "2022-12-16T10:16:40Z"
Inspect the cluster or machine update history using the
ClusterUpgradeStatusandMachineUpgradeStatusobjects:./bin/kubectl --kubeconfig <pathToClusterKubeconfig> get clusterupgradestatus ./bin/kubectl --kubeconfig <pathToClusterKubeconfig> get machineupgradestatus
Example extract from a ClusterUpgradeStatus objectapiVersion: kaas.mirantis.com/v1alpha1 fromRelease: 11.5.0+3.5.5 kind: ClusterUpgradeStatus metadata: annotations: lcm.mirantis.com/new-history: "true" creationTimestamp: "2022-12-16T09:02:20Z" name: test-managed-11.6.0+3.5.5 namespace: default ownerReferences: - apiVersion: cluster.k8s.io/v1alpha1 kind: Cluster name: test-managed stages: - message: "" name: Requested cluster maintenance status: Success success: true timestamp: "2022-12-16T09:02:02Z" - message: "" name: Cluster workload locks are inactive status: Success success: true timestamp: "2022-12-16T09:02:02Z" - message: "" name: Worker nodes MKE upgraded status: Success success: true timestamp: "2022-12-16T09:47:48Z" - message: "" name: Control plane nodes MKE upgraded status: Success success: true timestamp: "2022-12-16T09:37:33Z" - message: "" name: Cluster maintenance request removed status: Success success: true timestamp: "2022-12-16T09:48:16Z" toRelease: 11.6.0+3.5.5
Example extract from a MachineUpgradeStatus object for a control plane machineapiVersion: kaas.mirantis.com/v1alpha1 fromRelease: 11.5.0+3.5.5 kind: MachineUpgradeStatus metadata: annotations: lcm.mirantis.com/new-history: "true" creationTimestamp: "2022-12-16T09:02:24Z" name: test-managed-master-j2vmj-11.6.0+3.5.5 namespace: default ownerReferences: - apiVersion: cluster.k8s.io/v1alpha1 kind: Machine name: test-managed-master-j2vmj stages: - message: "" name: Agent upgraded status: Success success: true timestamp: "2022-12-16T09:02:22Z" - message: "" name: Machine Upgraded status: Success success: true timestamp: "2022-12-16T09:37:14Z" toRelease: 11.6.0+3.5.5
Example extract from a MachineUpgradeStatus object for a worker machineapiVersion: kaas.mirantis.com/v1alpha1 fromRelease: 11.5.0+3.5.5 kind: MachineUpgradeStatus metadata: annotations: lcm.mirantis.com/new-history: "true" creationTimestamp: "2022-12-16T09:02:58Z" name: test-managed-node-ggzn2-11.6.0+3.5.5 namespace: default ownerReferences: - apiVersion: cluster.k8s.io/v1alpha1 kind: Machine name: test-managed-node-ggzn2 stages: - message: "" name: Agent upgraded status: Success success: true timestamp: "2022-12-16T09:02:56Z" - message: "" name: Previous machines are deployed status: Success success: true timestamp: "2022-12-16T09:42:20Z" - message: "" name: Node maintenance requested status: Success success: true timestamp: "2022-12-16T09:42:13Z" - message: "" name: Node workload locks inactive status: Success success: true timestamp: "2022-12-16T09:42:14Z" - message: "" name: Kubernetes drained status: Success success: true timestamp: "2022-12-16T09:42:14Z" - message: "" name: Deploy phase done status: Success success: true timestamp: "2022-12-16T09:43:33Z" - message: "" name: Reconfigure phase done status: Success success: true timestamp: "2022-12-16T09:43:36Z" - message: "" name: Machine Upgraded status: Success success: true timestamp: "2022-12-16T09:48:15Z" - message: "" name: Kubernetes uncordoned status: Success success: true timestamp: "2022-12-16T09:47:47Z" - message: "" name: Node maintenance request removed status: Success success: true timestamp: "2022-12-16T09:47:48Z" toRelease: 11.6.0+3.5.5
Object names match the initial and/or target Cluster release versions and MKE versions of the cluster. For example, 11.5.0+3.5.5 (initial version) or 11.5.0+3.5.5 -> 11.6.0+3.5.5. Each object displays the update stages, their time stamps, and statuses. If any stage fails, the
successfield contains a failure message.
Cluster deletion or detachment freezes
If you delete managed cluster nodes not using the Container Cloud web UI or API, the cluster deletion or detachment may hang with the Deleting message remaining in the cluster status.
To apply the issue resolution:
Expand the menu of the tab with your username.
Click
Download kubeconfigto downloadkubeconfigof your management cluster.Log in to any local machine with
kubectlinstalled.Copy the downloaded
kubeconfigto this machine.Run the following command:
kubectl --kubeconfig <mgmtClusterKubeconfigPath> edit -n <projectName> cluster <managedClusterName>
Edit the opened
kubeconfigby removing the following lines:finalizers: - cluster.cluster.k8s.ioManually clean up the resources of the nodes that you have previously deleted not using the Container Cloud web UI.
Keycloak admin console becomes inaccessible after changing the theme
Due to the upstream Keycloack issue, the Keycloak admin console becomes inaccessible after changing the theme to base using the Themes tab.
To apply the issue resolution:
Obtain the MySQL admin password:
kubectl get secret -n kaas mariadb-dbadmin-password -o yaml | awk '/MYSQL_DBADMIN_PASSWORD/ {print $2}' | base64 -d
Connect to the MariaDB server:
kubectl exec -it -n kaas mariadb-server-0 -- mysql -h localhost -u root -p
Update the Keycloak database for the following themes:
ADMIN_THEMEACCOUNT_THEMEEMAIL_THEMELOGIN_THEME
For example:
use keycloak; update REALM set ADMIN_THEME = REPLACE(ADMIN_THEME, 'base','keycloak');
Restart Keycloak:
kubectl scale sts -n kaas --replicas=0 iam-keycloak kubectl scale sts -n kaas --replicas=3 iam-keycloak
The ‘database space exceeded’ error on large clusters
Occasionally, cluster update may get stuck on large clusters running 500+ nodes along with 15k+ pods due to the etcd database overflow. The following error occurs every time when accessing the Kubernetes API server:
etcdserver: mvcc: database space exceeded
Normally, kube-apiserver actively compacts the etcd database. In rare cases, it is required to manually compact the etcd database as described below, for example, during rapid creation of numerous Kubernetes objects. Once done, Mirantis recommends that you identify the root cause of the issue and clean up unnecessary resources to prevent manual etcd compacting and defragmentation in future.
To apply the issue resolution:
Open an SSH connection to any controller node.
Execute the following script to compact and defragment the etcd database:
sudo -i compact_etcd.sh defrag_etcd.sh
Defragment the etcd database as described in MKE documentation: Apply etcd defragmentation.
The auditd events cause ‘backlog limit exceeded’ messages
If auditd generates a lot of events, some of them may be lost with the following numerous messages in dmesg or kernel logs:
auditd: backlog limit exceeded
You may also observe high or growing values of the lost counter in the
auditctl output. For example:
auditctl -s
...
lost 1351280
...
To resolve the issue, you may need to update the rules loaded to auditd and adjust the size of the backlog buffer.
Update the rules loaded to auditd
If auditd contains a lot of rules, it may generate a lot of events and overrun
the buffer. Therefore, verify and update your preset and custom rules. Preset
rules are defined as presetRules, custom rules are defined as follows:
customRulescustomRulesX32customRulesX64
To verify and update the rules:
In the
Clusterobject of the affected cluster, verify that thepresetRulesstring does not start with the!symbol.Verify all audit rules:
Log in through SSH or directly using the console to the node having the buffer overrun symptoms.
Run the following command:
auditctl -lIn the system response, identify the rules to exclude.
In
/etc/audit/rules.d, find the files containing the rules to exclude.If the file is named
60-custom.rules, remove the rules from any of the following parameters located in theClusterobject:customRulescustomRulesX32customRulesX64
If the file is named
50-<NAME>.rules, and you want to exclude all rules from that file, exclude the preset named<NAME>from the list of allowed presets defined underpresetRulesin theClusterobject.If the file is named
50-<NAME>.rules, and you want to exclude only several rules from that file:Copy the rules you want to keep to one of the following parameters located in the
Clusterobject:customRulescustomRulesX32customRulesX64
Exclude the preset named
<NAME>from the list of allowed presets.
Adjust the size of the backlog buffer
By default, the backlog buffer size is set to 8192, which is enough for most use cases. To prevent buffer overrun, you can adjust the default value to fit your needs. But keep in mind that increasing this value leads to higher memory requirements because the buffer uses RAM.
To estimate RAM requirements for the buffer, you can use the following calculation:
A buffer of 8192 audit records uses ~70 MiB of RAM
A buffer of 15000 audit records uses ~128 MiB of RAM
To change the backlog buffer size, adjust the backlogLimit value in the
Cluster object of the affected cluster.
You may also want to change the size directly on the system and verify
the result at once. But to change the size permanently, use the Cluster
object.
To adjust the size of the backlog buffer on a node:
Log in to the affected node through SSH or directly through the console.
If
enabledAtBootis enabled, adjust theaudit_backlog_limitvalue in kernel options:List grub configuration files where
GRUB_CMDLINE_LINUXis defined:grep -rn 'GRUB_CMDLINE_LINUX' /etc/default/grub /etc/default/grub.d/* \ | cut -d: -f1 | sort -u
In each file obtained in the previous step, edit the
GRUB_CMDLINE_LINUXstring by changing the integer value afteraudit_backlog_limit=to the desired value.
In
/etc/audit/rules.d/audit.rules, adjust the buffer size by editing the integer value after-b.Select from the following options:
If the auditd configuration is not immutable, restart the
auditdservice:systemctl restart auditd.service
If the auditd configuration is immutable, reboot the node. The auditd configuration is immutable if any of the following conditions are met:
In the auditctl -s output, the
enabledparameter is set to2The
-e 2flag is defined explicitly in parameters of any custom ruleThe
immutablepreset is defined explicitlyThe virtual preset
allis enabled and theimmutablepreset is not excluded explicitly
Caution
Arrange the time to reboot the node according to your maintenance schedule. For the exact reboot procedure, use your maintenance policies.
If the
backlog limit exceededmessage disappears, adjust the size permanently using thebacklogLimitvalue in theClusterobject.
Troubleshoot a management cluster bootstrap
This section provides solutions to the issues that may occur while deploying a management cluster with Bootstrap v2.
Troubleshoot the bootstrap node configuration
This section provides solutions to the issues that may occur while configuring the bootstrap node.
DNS settings
If you have issues related to the DNS settings, the following error message may occur:
curl: (6) Could not resolve host
The issue may occur if a VPN is used to connect to the cloud or a local DNS forwarder is set up.
To apply the issue resolution, change the default DNS settings for Docker:
Log in to your local machine.
Identify your internal or corporate DNS server address:
systemd-resolve --statusCreate or edit
/etc/docker/daemon.jsonby specifying your DNS address:{ "dns": ["<YOUR_DNS_ADDRESS>"] }
Restart the Docker daemon:
sudo systemctl restart docker
Default network addresses
If you have issues related to the default network address configuration, curl either hangs or the following error occurs:
curl: (7) Failed to connect to xxx.xxx.xxx.xxx port xxxx: Host is unreachable
The issue may occur because the default Docker network address
172.17.0.0/16 and/or the kind Docker network, which is used by
kind, overlap with your cloud address or other addresses of network
configuration.
To apply the issue resolution:
Log in to your local machine.
Verify routing to the IP addresses of the target cloud endpoints:
Obtain the IP address of your target cloud. For example:
nslookup auth.openstack.example.comExample of system response:
Name: auth.openstack.example.com Address: 172.17.246.119
Verify that this IP address is not routed through
docker0but through any other interface, for example,ens3:ip r get 172.17.246.119
Example of the system response if the routing is configured correctly:
172.17.246.119 via 172.18.194.1 dev ens3 src 172.18.1.1 uid 1000 cache
Example of the system response if the routing is configured incorrectly:
172.17.246.119 via 172.18.194.1 dev docker0 src 172.18.1.1 uid 1000 cache
If the routing is incorrect, change the IP address of the default Docker bridge:
Create or edit
/etc/docker/daemon.jsonby adding the"bip"option:{ "bip": "192.168.91.1/24" }
Restart the Docker daemon:
sudo systemctl restart docker
If required, customize addresses for your
kindDocker network or any other additional Docker networks:Remove the
kindnetwork:docker network rm 'kind'
Select one of the following options:
Configure
/etc/docker/daemon.json:Note
The following steps are applied to to customize addresses for the
kindDocker network. Use these steps as an example for any other additional Docker networks.Add the following section to
/etc/docker/daemon.json:{ "default-address-pools": [ {"base":"192.169.0.0/16","size":24} ] }
Restart the Docker daemon:
sudo systemctl restart docker
After Docker restart, the newly created local or global scope networks, including
'kind', will be dynamically assigned a subnet from the defined pool.
Recreate the
'kind'Docker network manually with a subnet that is not in use in your network. For example:docker network create -o com.docker.network.bridge.enable_ip_masquerade=true -d bridge --subnet 192.168.0.0/24 'kind'
Caution
Docker pruning removes the user defined networks, including
'kind'. Therefore, every time after running the Docker pruning commands, re-create the'kind'network again using the command above.
Troubleshoot the bootstrap region creation
If the BootstrapRegion object is in the Error state, find the error
type in the Status field of the object for the following components to
resolve the issue:
Field name |
Troubleshooting steps |
|---|---|
Helm |
If the bootstrap HelmBundle is not ready for a long time, for example, during 15 minutes in case of an average network bandwidth, verify statuses of non-ready releases and resolve the issue depending on the error message of a particular release: kubectl --kubeconfig <pathToKindKubeconfig> \
get helmbundle bootstrap -o json | \
jq '.status.releaseStatuses[] | select(.ready == false) | {name: .chart, message: .message}'
If fixing the issues with Helm releases does not help, collect the
Helm Controller logs and filter them by kubectl --kubeconfig <pathToKindKubeconfig> -n kube-sytem \
logs -lapp=helm-controller | grep "ERROR"
|
Deployments |
If some of deployments are not ready for a long time while the bootstrap HelmBundle is ready, restart the affected deployments: kubectl --kubeconfig <pathToKindKubeconfig> \
-n kaas rollout restart deploy <notReadyDeploymentName>
If restarting of the affected deployments does not help, collect and assess the logs of non-ready deployments: kubectl --kubeconfig <pathToKindKubeconfig> \
-n kaas logs -lapp.kubernetes.io/name=<notReadyDeploymentName>
|
Provider |
The status of this field becomes |
See also
Troubleshoot machine creation
If a Machine object is stuck in the same status for a long time,
identify the status phase of the affected machine and proceed as described
below.
To verify the status of the created Machine objects:
kubectl --kubeconfig <pathToKindKubeconfig> \
get machines -o jsonpath='{.items[*].status.phase}'
The deployment statuses of a Machine object are the same as the
LCMMachine object states:
Uninitialized - the machine is not yet assigned to an
LCMCluster.Pending - the agent reports a node IP address and host name.
Prepare - the machine executes
StateItemsthat correspond to thepreparephase. This phase usually involves downloading the necessary archives and packages.Deploy - the machine executes
StateItemsthat correspond to thedeployphase that is becoming a Mirantis Kubernetes Engine (MKE) node.Ready - the machine is being deployed.
Upgrade - the machine is being upgraded to the new MKE version.
Reconfigure - the machine executes
StateItemsthat correspond to thereconfigurephase. The machine configuration is being updated without affecting workloads running on the machine.
If the system response is empty, approve the BootstrapRegion object using
the Container Cloud CLI:
./container-cloud bootstrap approve all
If the system response is not empty and the status remains the same for a
while, the issue may relate to machine misconfiguration. Therefore, verify
and adjust the parameters of the affected Machine object.
Troubleshoot deployment stages
If the cluster deployment is stuck on the same stage for a long time, it may
be related to configuration issues in the Machine or other deployment
objects.
To troubleshoot cluster deployment:
Identify the current deployment stage that got stuck:
kubectl --kubeconfig <pathToKindKubeconfig> \ get cluster <cluster-name> -o jsonpath='{.status.bootstrapStatus}{"\n"}'
For the deployment stages description, see Overview of the deployment workflow.
Collect the
bootstrap-providerlogs and identify a repetitive error that relates to the stuck deployment stage:kubectl --kubeconfig <pathToKindKubeconfig> \ -n kaas logs -lapp.kubernetes.io/name=bootstrap-provider
Examples of repetitive errors¶ Error name
Solution
Cluster nodes are not yet readyVerify configuration of
Machineobjects .Starting pivotContact Mirantis support for further issue assessment.
Some objects in cluster are not readywith the samedeploymentnamesVerify the related
deploymentconfiguration.
See also
Collect the bootstrap logs
If the bootstrap process is stuck or fails, collect and inspect the bootstrap and management cluster logs.
To collect the bootstrap logs:
If the Cluster object is not created yet
List all available deployments:
kubectl --kubeconfig <pathToKindKubeconfig> \ -n kaas get deploy
Collect the logs of the required deployment:
kubectl --kubeconfig <pathToKindKubeconfig> \ -n kaas logs -lapp.kubernetes.io/name=<deploymentName>
If the Cluster object is created
Select from the following options:
If a management cluster is not deployed yet:
CLUSTER_NAME=<clusterName> ./bootstrap.sh collect_logs
If a management cluster is deployed or pivoting is done:
Obtain the cluster
kubeconfig:./container-cloud get cluster-kubeconfig \ --kubeconfig <pathToKindKubeconfig> \ --cluster-name <clusterName> \ --kubeconfig-output <pathToMgmtClusterKubeconfig>
Collect the logs:
CLUSTER_NAME=<cluster-name> \ KUBECONFIG=<pathToMgmtClusterKubeconfig> \ ./bootstrap.sh collect_logs
Technology Preview. Assess the Ironic pod logs:
Extract the content of the
'message'fields from every log message:kubectl -n kaas logs <ironicPodName> -c syslog | jq -rRM 'fromjson? | .message'
Extract the content of the
'message'fields from theironic_conductorsource log messages:kubectl -n kaas logs <ironicPodName> -c syslog | jq -rRM 'fromjson? | select(.source == "ironic_conductor") | .message'
The syslog container collects logs generated by Ansible during the node deployment and cleanup and outputs them in the JSON format.
Note
Add COLLECT_EXTENDED_LOGS=true before the
collect_logs command to output the extended version of logs
that contains system and MKE logs, logs from LCM Ansible and LCM Agent
along with cluster events and Kubernetes resources description and logs.
Without the --extended flag, the basic version of logs is collected, which
is sufficient for most use cases. The basic version of logs contains all
events, Kubernetes custom resources, and logs from all cluster components.
This version does not require passing --key-file.
The logs are collected in the directory where the bootstrap script is located.
Logs structure
The Container Cloud logs structure in <output_dir>/<cluster_name>/
is as follows:
/events.logHuman-readable table that contains information about the cluster events.
/systemSystem logs.
/system/mke(or/system/MachineName/mke)Mirantis Kuberntes Engine (MKE) logs.
/objects/clusterLogs of the non-namespaced Kubernetes objects.
/objects/namespacedLogs of the namespaced Kubernetes objects.
/objects/namespaced/<namespaceName>/core/podsLogs of the pods from a specific Kubernetes namespace. For example, logs of the pods from the
kaasnamespace contain logs of Container Cloud controllers, includingbootstrap-cluster-controllersince Container Cloud 2.25.0 (Cluster releases 17.0.0 and 16.0.0).
/objects/namespaced/<namespaceName>/core/pods/<containerName>.prev.logLogs of the pods from a specific Kubernetes namespace that were previously removed or failed.
/objects/namespaced/<namespaceName>/core/pods/<ironicPodName>/syslog.logTechnology Preview. Ironic pod logs.
Note
Logs collected by the syslog container during the bootstrap phase are not transferred to the management cluster during pivoting. These logs are located in
/volume/log/ironic/ansible_conductor.loginside the Ironic pod.
Each log entry of the management cluster logs contains a request ID that identifies chronology of actions performed on a cluster or machine. The format of the log entry is as follows:
<process ID>.[<subprocess ID>...<subprocess ID N>].req:<requestID>: <logMessage>
For example, bm.machine.req:28 contains information about the task 28
applied to a bare metal machine.
Since Container Cloud 2.22.0 (Cluster release 11.6.0), the logging format has
the following extended structure for the admission-controller,
storage-discovery, and all baremetal-provider services of a management
cluster:
level:<debug,info,warn,error,panic>,
ts:<YYYY-MM-DDTHH:mm:ssZ>,
logger:<processID>.<subProcessID(s)>.req:<requestID>,
caller:<lineOfCode>,
msg:<message>,
error:<errorMessage>,
stacktrace:<codeInfo>
Since Container Cloud 2.23.0 (Cluster release 11.6.0), this structure also
applies to the <name>-controller services of a management cluster.
Example of a log extract for baremetal-provider since Container
Cloud 2.22.0
{"level":"error","ts":"2022-11-14T21:37:18Z","logger":"bm.cluster.req:318","caller":"lcm/machine.go:808","msg":"","error":"could not determine machine demo-46880 host name”,”stacktrace”:”sigs.k8s.io/cluster-api-provider-baremetal/pkg/lcm.GetMachineConditions\n\t/go/src/sigs.k8s.io/cluster-api-provider-baremetal/pkg/lcm/machine.go:808\nsigs.k8s.io/cluster-api-provider-baremetal/pkg...."}
{"level":"info","ts":"2022-11-14T21:37:23Z","logger":"bm.machine.req:476","caller":"service/reconcile.go:128","msg":"request: default/demo-46880-2"}
{"level":"info","ts":"2022-11-14T21:37:23Z","logger":"bm.machine.req:476","caller":"machine/machine_controller.go:201","msg":"Reconciling Machine \"default/demo-46880-2\""}
{"level":"info","ts":"2022-11-14T21:37:23Z","logger":"bm.machine.req:476","caller":"machine/actuator.go:454","msg":"Checking if machine exists: \"default/demo-46880-2\" (cluster: \"default/demo-46880\")"}
{"level":"info","ts":"2022-11-14T21:37:23Z","logger":"bm.machine.req:476","caller":"machine/machine_controller.go:327","msg":"Reconciling machine \"default/demo-46880-2\" triggers idempotent update"}
{"level":"info","ts":"2022-11-14T21:37:23Z","logger":"bm.machine.req:476","caller":"machine/actuator.go:290","msg":"Updating machine: \"default/demo-46880-2\" (cluster: \"default/demo-46880\")"}
{"level":"info","ts":"2022-11-14T21:37:24Z","logger":"bm.machine.req:476","caller":"lcm/machine.go:73","msg":"Machine in LCM cluster, reconciling LCM objects"}
{"level":"info","ts":"2022-11-14T21:37:26Z","logger":"bm.machine.req:476","caller":"lcm/machine.go:902","msg":"Updating Machine default/demo-46880-2 conditions"}
levelInformational level. Possible values:
debug,info,warn,error,panic.
tsTime stamp in the
<YYYY-MM-DDTHH:mm:ssZ>format. For example:2022-11-14T21:37:23Z.
loggerDetails on the process ID being logged:
<processID>Primary process identifier. The list of possible values includes
bm,iam,license, andbootstrap.Note
The
iamandlicensevalues are available since Container Cloud 2.23.0 (Cluster release 11.7.0). Thebootstrapvalue is available since Container Cloud 2.25.0 (Cluster release 16.0.0).
<subProcessID(s)>One or more secondary process identifiers. The list of possible values includes
cluster,machine,controller, andcluster-ctrl.Note
The
controllervalue is available since Container Cloud 2.23.0 (Cluster release 11.7.0).The
cluster-ctrlvalue is available since Container Cloud 2.25.0 (Cluster release 16.0.0) for thebootstrapprocess identifier.
reqRequest ID number that increases when a service performs the following actions:
Receives a request from Kubernetes about creating, updating, or deleting an object
Receives an HTTP request
Runs a background process
The request ID allows combining all operations performed with an object within one request. For example, the result of a
Machineobject creation, update of its statuses, and so on has the same request ID.
callerCode line used to apply the corresponding action to an object.
msgDescription of a deployment or update phase. If empty, it contains the
"error"key with a message followed by the"stacktrace"key with stack trace details. For example:"msg"="" "error"="Cluster nodes are not yet ready" "stacktrace": "<stack-trace-info>"
The log format of the following Container Cloud components does not contain the
"stacktrace"key for easier log handling:baremetal-provider,bootstrap-provider, andhost-os-modules-controller.
Note
Logs may also include a number of informational key-value pairs
containing additional cluster details. For example,
"name": "object-name", "foobar": "baz".
Depending on the type of issue found in logs, apply the corresponding fixes.
For example, if you detect the LoadBalancer ERROR state errors
during the bootstrap of an OpenStack-based management cluster,
contact your system administrator to fix the issue.
See also
Troubleshoot bare metal
This section provides solutions to the issues that may occur while managing your bare metal infrastructure.
Log in to the IPA virtual console for hardware troubleshooting
Container Cloud uses kernel and initramfs files with the pre-installed Ironic Python Agent (IPA) for inspection of server hardware. The IPA image initramfs is based on Ubuntu Server.
If you need to troubleshoot hardware during inspection, you can use the IPA virtual console to assess hardware logs and image configuration.
To log in to the IPA virtual console of a bare metal host:
Create the bare metal host object for the required bare metal host as described in Add a bare metal host using CLI and wait for inspection to complete.
Caution
Meantime, do not create the
Machineobject for the bare metal host being inspected to prevent automatic provisioning.Using the pwgen utility, recover the dynamically calculated password of the IPA image:
kubectl --kubeconfig <pathToManagementClusterKubeconfig> \ -n kaas get secret ironic-ssh-key \ -o jsonpath="{.data.public}" | base64 -d > /tmp/ironic-ssh-key.pub pwgen -H /tmp/ironic-ssh-key.pub -1 -s 16 rm /tmp/ironic-ssh-key.pub
Remotely log in to the IPA console of the bare metal host using the
devuseruser name and the password obtained in the previous step. For example, use IPMItool, Integrated Lights-Out, or the iDRAC web UI.
Note
To assess the IPA logs, use the journalctl -u ironic-python-agent.service command.
Bare metal hosts in ‘provisioned registration error’ state after update
After update of a management or managed cluster created using the Container
Cloud release earlier than 2.6.0, a bare metal host state is
Provisioned in the Container Cloud web UI while having the error state
in logs with the following message:
status:
errorCount: 1
errorMessage: 'Host adoption failed: Error while attempting to adopt node 7a8d8aa7-e39d-48ec-98c1-ed05eacc354f:
Validation of image href http://10.10.10.10/images/stub_image.qcow2 failed,
reason: Got HTTP code 404 instead of 200 in response to HEAD request..'
errorType: provisioned registration error
The issue is caused by the image URL pointing to an unavailable resource due to the URI IP change during update. To apply the issue resolution, update URLs for the bare metal host status and spec with the correct values that use a stable DNS record as a host.
To apply the issue resolution:
Note
In the commands below, we update master-2 as an example.
Replace it with the corresponding value to fit your deployment.
Exit Lens.
In a new terminal, configure access to the affected cluster.
Start
kube-proxy:kubectl proxy &
Pause the reconcile:
kubectl patch bmh master-2 --type=merge --patch '{"metadata":{"annotations":{"baremetalhost.metal3.io/paused": "true"}}}'
Create the payload data with the following content:
For
status_payload.json:{ "status": { "errorCount": 0, "errorMessage": "", "provisioning": { "image": { "checksum": "http://httpd-http/images/stub_image.qcow2.md5sum", "url": "http://httpd-http/images/stub_image.qcow2" }, "state": "provisioned" } } }
For
status_payload.json:{ "spec": { "image": { "checksum": "http://httpd-http/images/stub_image.qcow2.md5sum", "url": "http://httpd-http/images/stub_image.qcow2" } } }
Verify that the payload data is valid:
cat status_payload.json | jq cat spec_payload.json | jq
The system response must contain the data added in the previous step.
Patch the bare metal host status with payload:
curl -k -v -XPATCH -H "Accept: application/json" -H "Content-Type: application/merge-patch+json" --data-binary "@status_payload.json" 127.0.0.1:8001/apis/metal3.io/v1alpha1/namespaces/default/baremetalhosts/master-2/status
Patch the bare metal host spec with payload:
kubectl patch bmh master-2 --type=merge --patch "$(cat spec_payload.json)"
Resume the reconcile:
kubectl patch bmh master-2 --type=merge --patch '{"metadata":{"annotations":{"baremetalhost.metal3.io/paused":null}}}'
Close the terminal to quit
kube-proxyand resume Lens.
Inspection error on bare metal hosts after dnsmasq restart
If the dnsmasq pod is restarted during the bootstrap of newly added
nodes, those nodes may fail to undergo inspection. That can result in
inspection error in the corresponding BareMetalHost objects.
The issue can occur when:
The
dnsmasqpod was moved to another node.DHCP subnets were changed, including addition or removal. In this case, the
dhcpdcontainer of thednsmasqpod is restarted.Caution
If changing or adding of DHCP subnets is required to bootstrap new nodes, wait after changing or adding DHCP subnets until the
dnsmasqpod becomes ready, then createBareMetalHostobjects.
To verify whether the nodes are affected:
Verify whether the
BareMetalHostobjects contain theinspection error:kubectl get bmh -n <managed-cluster-namespace-name>
Example of system response:
NAME STATE CONSUMER ONLINE ERROR AGE test-master-1 provisioned test-master-1 true 9d test-master-2 provisioned test-master-2 true 9d test-master-3 provisioned test-master-3 true 9d test-worker-1 provisioned test-worker-1 true 9d test-worker-2 provisioned test-worker-2 true 9d test-worker-3 inspecting true inspection error 19h
Verify whether the
dnsmasqpod was inReadystate when the inspection of the affected baremetal hosts (test-worker-3in the example above) was started:kubectl -n kaas get pod <dnsmasq-pod-name> -oyaml
Example of system response:
... status: conditions: - lastProbeTime: null lastTransitionTime: "2024-10-10T15:37:34Z" status: "True" type: Initialized - lastProbeTime: null lastTransitionTime: "2024-10-11T07:38:54Z" status: "True" type: Ready - lastProbeTime: null lastTransitionTime: "2024-10-11T07:38:54Z" status: "True" type: ContainersReady - lastProbeTime: null lastTransitionTime: "2024-10-10T15:37:34Z" status: "True" type: PodScheduled containerStatuses: - containerID: containerd://6dbcf2fc4b36ce4c549c9191ab01f72d0236c51d42947675302675e4bfaf4cdf image: docker-dev-kaas-virtual.artifactory-eu.mcp.mirantis.net/bm/baremetal-dnsmasq:base-2-28-alpine-20240812132650 imageID: docker-dev-kaas-virtual.artifactory-eu.mcp.mirantis.net/bm/baremetal-dnsmasq@sha256:3dad3e278add18e69b2608e462691c4823942641a0f0e25e6811e703e3c23b3b lastState: terminated: containerID: containerd://816fcf079cd544acd74e312065de5b5ed4dbf1dc6159fefffff4f644b5e45987 exitCode: 0 finishedAt: "2024-10-11T07:38:35Z" reason: Completed startedAt: "2024-10-10T15:37:45Z" name: dhcpd ready: true restartCount: 2 started: true state: running: startedAt: "2024-10-11T07:38:37Z" ...
In the system response above, the
dhcpdcontainer was not ready between"2024-10-11T07:38:35Z"and"2024-10-11T07:38:54Z".Verify the affected baremetal host. For example:
kubectl get bmh -n managed-ns test-worker-3 -oyaml
Example of system response:
... status: errorCount: 15 errorMessage: Introspection timeout errorType: inspection error ... operationHistory: deprovision: end: null start: null inspect: end: null start: "2024-10-11T07:38:19Z" provision: end: null start: null register: end: "2024-10-11T07:38:19Z" start: "2024-10-11T07:37:25Z"
In the system response above, inspection was started at
"2024-10-11T07:38:19Z", immediately before the period of thedhcpdcontainer downtime. Therefore, this node is most likely affected by the issue.
To apply the issue resolution:
Reboot the node using the IPMI reset or cycle command.
If the node fails to boot, remove the failed
BareMetalHostobject and create it again:Remove
BareMetalHostobject. For example:kubectl delete bmh -n managed-ns test-worker-3
Verify that the
BareMetalHostobject is removed:kubectl get bmh -n managed-ns test-worker-3
Create a
BareMetalHostobject from the template. For example:kubectl create -f bmhc-test-worker-3.yaml kubectl create -f bmh-test-worker-3.yaml
Troubleshoot an operating system upgrade with host restart
Mandatory host restart for the operating system (OS) upgrade is designed to be safe and takes certain precautions to protect the user data and the cluster integrity. However, sometimes it may result in a host-level failure and block the cluster update. Use this section to troubleshoot such issues.
Warning
The OS upgrade cannot be rolled back on a host or cluster level. If the OS upgrade fails, recover or remove the faulty host before you can complete the cluster upgrade.
Caution
Depending on the cluster configuration, applying security updates and host restart can increase the update time for each node to up to 1 hour.
Cluster nodes are updated one by one. Therefore, for large clusters, the update may take several days to complete.
Pre-upgrade workload lock issues
If the cluster upgrade does not start, verify whether the
ceph-clusterworkloadlock object is present in the Container Cloud
Management API:
kubectl get clusterworkloadlocks
Example of system response:
NAME AGE
ceph-clusterworkloadlock 7h37m
This object indicates that LCM operations that require hosts restart cannot
start on the cluster. The Ceph Controller verifies that Ceph services are
prepared for restart. Once the Ceph Controller completes verification, it
removes the ceph-clusterworkloadlock object and the cluster upgrade starts.
If this object is still present after the upgrade is initiated, assess the
logs of the ceph-controller pod to identify and fix errors:
kubectl -n ceph-lcm-mirantis logs deployments/ceph-controller
If a node upgrade does not start, verify whether the NodeWorkloadLock
object is present in the Container Cloud Management API:
kubectl get nodeworkloadlocks
If the object is present, assess the affected node logs to identify and fix errors.
Host restart issues
If the host cannot boot after upgrade, verify the following possible issues:
- Invalid boot order configuration in the host BIOS settings
Inspect the host settings using the IPMI console. If you see a message about an invalid boot device, verify and correct the boot order in the host BIOS settings. Set the first boot device to a network card and the second device to a local disk (legacy or UEFI).
- The host is stuck in the GRUB rescue mode
If you see the following message, you are likely affected by the Ubuntu known issue in the Ubuntu
grub-installer:Entering rescue mode... grub rescue>
In this case, redeploy the host with a correctly defined
BareMetalHostProfile. You will have to delete the correspondingMachineresource and create a newMachinewith the correspondingBareMetalHostProfile. For details, see Create MOSK host profiles.
Troubleshoot iPXE boot issues
Container Cloud relies on iPXE to remotely bootstrap bare metal machines before provisioning them to Kubernetes clusters. The remote bootstrap with iPXE depends on the state of the underlay network. Incorrect or suboptimal configuration of the underlay network can cause the process to fail.
The following error may mean that network configuration is incorrect:
iPXE 1.21.1+ (g74c5) - Open Source Network Boot Firmware - http://ipxe.org
Features: DNS HTTP iSCSI TFTP SRP AoE EFI Menu
net2: 3c:ec:ef:70:39:fe using 14e4-16D8 on 0000:ca:00.0 (Ethernet) [open]
[Link:up, TX:0 TXE:1 RX:0 RXE:0]
[TXE: 1 x "Network unreachable (http://ipxe.org/28086090)"]
Configuring (net2 3c:ec:ef:70:39:fe)...... No configuration methods
succeeded (http://ipxe.org/040ee186)
No more network devices
Network switch not forwarding packets for a prolonged period after the server brings up a link to a switch port may be the reason for this error. It may happen because the switch waits for the Spanning Tree Protocol (STP) configuration on the port.
To avoid this issue, configure the ports connecting the servers in STP portfast mode. See details in the vendor documentation for your particular network switch, for example:
Provisioning failure due to device naming issues in a bare metal host profile
During a bare metal host provisioning, transition to each stage implies the
host reboot. This may cause device name issues if a device is configured
using the by_name device identifier.
In Linux, assignment of device names, for example, /dev/sda,
to physical disks can change, especially in systems with multiple
disks or when hardware configuration changes. For example:
If you add or remove a hard drive or change the boot order, the device names can shift.
If the system uses hardware with additional disk array controllers, such as
RaidControllersin theJBODmode, device names can shift during reboot. This can lead to unintended consequences and potential data loss if your file systems are not mounted correctly.The
/dev/sdapartition on the first boot may become/dev/sdbon the second boot. Consequently, your file system may not be provisioned as expected, leading to errors during disk formatting and assembling.
Linux recommends using unique identifiers (UUIDs) or labels for device
identification in /etc/fstab. These identifiers are more stable and ensure
that the defined devices are mounted regardless of the naming changes.
Therefore, to prevent device naming issues during a bare metal host
provisioning, instead of the by_name identifier, Mirantis recommends using
the workBy parameter along with device labels or filters such as
minSize and maxSize. These device settings ensure a successful
bare metal host provisioning with /dev/disk/by-uuid/<UUID> or
/dev/disk/by-label/<label> in /etc/fstab. For details on workBy,
see BareMetalHostProfile spec.
Overview of the device naming logic in a bare metal host profile
To manage physical devices, the bare metal provider uses the following entities:
- The
BareMetalHostProfileobject Object created by an operator with description of the required file-system schema on a node. For details, see Create a custom bare metal host profile.
- The
- The
status.hardware.storagefields of theBareMetalHostobject Initial description of physical disks that is discovered only once during a bare metal host inspection.
- The
- The
status.hostInfo.storagefields of theLCMMachineobject Current state of physical disks during life cycle of
MachineandLCMMachineobjects.
- The
The default device naming workflow during management of BareMetalHost and
BareMetalHostProfile objects is as follows:
An operator creates the
BareMetalHostInventoryandBareMetalHostCredentialobjects.Note
Before update of the management cluster to Container Cloud 2.29.0 (Cluster release 16.4.0), instead of
BareMetalHostInventory, use theBareMetalHostobject. For details, see BareMetalHost resource.Caution
While the Cluster release of the management cluster is 16.4.0,
BareMetalHostInventoryoperations are allowed tom:kaas@management-adminonly. This limitation is lifted once the management cluster is updated to the Cluster release 16.4.1 or later.The
baremetal-operatorservice inspects the objects.The operator creates or reviews an existing
BareMetalHostProfileobject using thestatus.hardware.storagefields of theBareMetalHostobject associated with the createdBareMetalHostInventoryobject. For details, see Create a custom bare metal host profile.The operator creates a
Machineobject and maps it to the relatedBareMetalHostandBareMetalHostProfileobjects. For details, see Deploy a machine to a specific bare metal host.The
baremeral-providerservice starts processingBareMetalHostProfileand searching for suitable hardware disks to build the internalAnsibleExtraobject configuration. During the building process:The
bmh:hardware:storagelist is sorted using thehardwaredetails-storage-sort-termrule. For details, see Add a bare metal host using CLI and BareMetalHost metadata.The first suitable disk for an item in the
bmhp.spec.deviceslist is selected.
The cleanup and provisioning stage of
BareMetalHoststarts:During provisioning, the selection order described in
bmhp.workByapplies. For details, see Create MOSK host profiles.This logic ensures that an exact
by_idname is taken from the discovery stage, as opposed toby_namethat can be changed during transition from the inspection to provisioning stage.After provisioning finishes, the target system
/etc/fstabis generated usingUUIDs.
Note
For the /dev/disk/by-id mapping in Ceph, see
Addressing storage devices since MOSK 25.2.
Troubleshoot Ceph based on MiraCeph (since 25.2)
Warning
This procedure is valid for MOSK clusters that use the MiraCeph custom
resource (CR), which is available since MOSK 25.2 to replace the deprecated
KaaSCephCluster. For the equivalent procedure with the KaaSCephCluster
CR, refer to the following section:
This section provides solutions to the issues that may occur during Ceph usage.
Ceph disaster recovery
Warning
This procedure is valid for MOSK clusters that use the MiraCeph custom
resource (CR), which is available since MOSK 25.2 to replace the deprecated
KaaSCephCluster. For the equivalent procedure with the KaaSCephCluster
CR, refer to the following section:
This section describes how to recover a failed or accidentally removed Ceph cluster in the following cases:
If Ceph Controller underlying a running Rook Ceph cluster has failed and you want to install a new Ceph Controller Helm release and recover the failed Ceph cluster onto the new Ceph Controller.
To migrate the data of an existing Ceph cluster to a new deployment in case downtime can be tolerated.
Consider the common state of a failed or removed Ceph cluster:
The
rook-cephnamespace does not contain pods or they are in theTerminatingstate.The
rook-cephor/andceph-lcm-mirantisnamespaces are in theTerminatingstate.The
ceph-operatoris in theFAILEDstate:Management cluster: the state of the
ceph-operatorHelm release in the management HelmBundle, such asdefault/kaas-mgmt, has switched fromDEPLOYEDtoFAILED.MOSK cluster: the state of the
osh-system/ceph-operatorHelmBundle, or a related namespace, has switched fromDEPLOYEDtoFAILED.
The Rook
CephCluster,CephBlockPool,CephObjectStoreCRs in therook-cephnamespace cannot be found or have thedeletionTimestampparameter in themetadatasection.
Note
Prior to recovering the Ceph cluster, verify that your deployment meets the following prerequisites:
The Ceph cluster
fsidexists.The Ceph cluster Monitor keyrings exist.
The Ceph cluster devices exist and include the data previously handled by Ceph OSDs.
Ceph cluster recovery workflow
Create a backup of the remaining data and resources.
Clean up the failed or removed
ceph-operatorHelm release.Deploy a new
ceph-operatorHelm release with the previously usedMiraCephand one Ceph Monitor.Replace the
ceph-mondata with the old cluster data.Replace
fsidinsecrets/rook-ceph-monwith the old one.Fix the Monitor map in the
ceph-mondatabase.Fix the Ceph Monitor authentication key and disable authentication.
Start the restored cluster and inspect the recovery.
Fix the admin authentication key and enable authentication.
Restart the cluster.
Recover a failed or removed Ceph cluster
Back up the remaining resources. Skip the commands for the resources that have already been removed:
kubectl -n rook-ceph get cephcluster <clusterName> -o yaml > backup/cephcluster.yaml # perform this for each cephblockpool kubectl -n rook-ceph get cephblockpool <cephBlockPool-i> -o yaml > backup/<cephBlockPool-i>.yaml # perform this for each client kubectl -n rook-ceph get cephclient <cephclient-i> -o yaml > backup/<cephclient-i>.yaml kubectl -n rook-ceph get cephobjectstore <cephObjectStoreName> -o yaml > backup/<cephObjectStoreName>.yaml # perform this for each secret kubectl -n rook-ceph get secret <secret-i> -o yaml > backup/<secret-i>.yaml # perform this for each configMap kubectl -n rook-ceph get cm <cm-i> -o yaml > backup/<cm-i>.yaml
SSH to each node where the Ceph Monitors or Ceph OSDs were placed before the failure and back up the valuable data:
mv /var/lib/rook /var/lib/rook.backup mv /etc/ceph /etc/ceph.backup mv /etc/rook /etc/rook.backup
Once done, close the SSH connection.
Clean up the previous installation of
ceph-operator. For details, see Rook documentation: Cleaning up a cluster.Delete the
ceph-lcm-mirantis/ceph-controllerdeployment:kubectl -n ceph-lcm-mirantis delete deployment ceph-controller
Delete all deployments, DaemonSets, and jobs from the
rook-cephnamespace, if any:kubectl -n rook-ceph delete deployment --all kubectl -n rook-ceph delete daemonset --all kubectl -n rook-ceph delete job --all
Edit the
MiraCephandMiraCephHealthCRs of theceph-lcm-mirantisnamespace and remove thefinalizerparameter from themetadatasection:kubectl -n ceph-lcm-mirantis edit miraceph kubectl -n ceph-lcm-mirantis edit miracephhealth
Edit the
CephCluster,CephBlockPool,CephClient, andCephObjectStoreCRs of therook-cephnamespace and remove thefinalizerparameter from themetadatasection:kubectl -n rook-ceph edit cephclusters kubectl -n rook-ceph edit cephblockpools kubectl -n rook-ceph edit cephclients kubectl -n rook-ceph edit cephobjectstores kubectl -n rook-ceph edit cephobjectusers
Once you clean up every single resource related to the Ceph release, open the
ClusterCR for editing:kubectl -n <projectName> edit cluster <clusterName>
Substitute
<projectName>withdefaultfor the management cluster or with a related project name for the MOSK cluster.Remove the
ceph-controllerHelm release item from thespec.providerSpec.value.helmReleasesarray and save theClusterCR:- name: ceph-controller values: {}
Verify that
ceph-controllerhas disappeared from the corresponding HelmBundle:kubectl -n <projectName> get helmbundle -o yaml
Create the
MiraCephCR template and edit the roles of nodes. The entirenodesspec must contain only onemonrole. Save theMiraCephtemplate after editing:apiVersion: lcm.mirantis.com/v1alpha1 kind: MiraCeph metadata: name: rook-ceph namespace: ceph-lcm-mirantis spec: nodes: - name: <nodeName> roles: - mon
Substitute
<nodeName>with node name of the node where monitor is placed.Open the
ClusterCR for editing:kubectl -n <projectName> edit cluster <clusterName>
Substitute
<projectName>withdefaultfor the management cluster or with a related project name for the MOSK cluster.Add
ceph-controllertospec.providerSpec.value.helmReleasesto restore theceph-controllerHelm release. SaveClusterafter editing.- name: ceph-controller values: {}
Verify that the
ceph-controllerHelm release is deployed:Inspect the Rook Operator logs and wait until the orchestration has settled:
kubectl -n rook-ceph logs -l app=rook-ceph-operator
Verify that the pods in the
rook-cephnamespace haverook-ceph-mon-a,rook-ceph-mgr-a, and all the auxiliary pods are up and running, and norook-ceph-osd-ID-xxxxxxare running:kubectl -n rook-ceph get pod
Verify the Ceph state. The output must indicate that one
monand onemgrare running, all Ceph OSDs are down, and all PGs are in theUnknownstate.kubectl -n rook-ceph exec -it deploy/rook-ceph-tools -- ceph -s
Note
Rook should not start any Ceph OSD daemon because all devices belong to the old cluster that has a different
fsid. To verify the Ceph OSD daemons, inspect theosd-preparepods logs:kubectl -n rook-ceph logs -l app=rook-ceph-osd-prepare
Connect to the terminal of the
rook-ceph-mon-apod:kubectl -n rook-ceph exec -it deploy/rook-ceph-mon-a -- bash
Output the
keyringfile and save it for further usage:cat /etc/ceph/keyring-store/keyring exit
Obtain and save the
nodeNameofmon-afor further usage:kubectl -n rook-ceph get pod $(kubectl -n rook-ceph get pod \ -l app=rook-ceph-mon -o jsonpath='{.items[0].metadata.name}') -o jsonpath='{.spec.nodeName}'
Obtain and save the
cephImageused in the Ceph cluster for further usage:kubectl -n ceph-lcm-mirantis get cm ccsettings -o jsonpath='{.data.cephImage}'
Stop Rook Operator and scale the deployment replicas to
0:kubectl -n rook-ceph scale deploy rook-ceph-operator --replicas 0
Remove the Rook deployments generated with Rook Operator:
kubectl -n rook-ceph delete deploy -l app=rook-ceph-mon kubectl -n rook-ceph delete deploy -l app=rook-ceph-mgr kubectl -n rook-ceph delete deploy -l app=rook-ceph-osd kubectl -n rook-ceph delete deploy -l app=rook-ceph-crashcollector
Using the saved
nodeName, SSH to the host whererook-ceph-mon-ain the new Kubernetes cluster is placed and perform the following steps:Remove
/var/lib/rook/mon-aor copy it to another folder:mv /var/lib/rook/mon-a /var/lib/rook/mon-a.new
Pick a healthy
rook-ceph-mon-IDdirectory (/var/lib/rook.backup/mon-ID) in the previous backup, copy to/var/lib/rook/mon-a:cp -rp /var/lib/rook.backup/mon-<ID> /var/lib/rook/mon-a
Substitute
IDwith any healthymonnode ID of the old cluster.Replace
/var/lib/rook/mon-a/keyringwith the previously saved keyring, preserving only the[mon.]section. Remove the[client.admin]section.Run the
cephImageDocker container using the previously savedcephImageimage:docker run -it --rm -v /var/lib/rook:/var/lib/rook <cephImage> bash
Inside the container, create
/etc/ceph/ceph.conffor a stable operation ofceph-mon:touch /etc/ceph/ceph.confChange the directory to
/var/lib/rookand editmonmapby replacing the existingmonhosts with the newmon-aendpoints:cd /var/lib/rook rm /var/lib/rook/mon-a/data/store.db/LOCK # Make sure the quorum lock file does not exist ceph-mon --extract-monmap monmap --mon-data ./mon-a/data # Extract monmap from old ceph-mon db and save as monmap monmaptool --print monmap # Print the monmap content, which reflects the old cluster ceph-mon configuration. monmaptool --rm a monmap # Delete `a` from monmap. monmaptool --rm b monmap # Repeat and delete `b` from monmap. monmaptool --rm c monmap # Repeat this pattern until all the old ceph-mons are removed and monmap is empty monmaptool --addv a [v2:<nodeIP>:3300,v1:<nodeIP>:6789] monmap # Replace it with the rook-ceph-mon-a address you obtained from the previous command. ceph-mon --inject-monmap monmap --mon-data ./mon-a/data # Replace monmap in ceph-mon db with our modified version. rm monmap exit
Substitute
<nodeIP>with the IP address of the current<nodeName>node.Close the SSH connection.
Change
fsidto the original one to run Rook as an old cluster:kubectl -n rook-ceph edit secret/rook-ceph-mon
Note
The
fsidisbase64encoded and must not contain a trailing carriage return. For example:echo -n a811f99a-d865-46b7-8f2c-f94c064e4356 | base64 # Replace with the fsid from the old cluster.
Scale the
ceph-lcm-mirantis/ceph-controllerdeployment replicas to0:kubectl -n ceph-lcm-mirantis scale deployment ceph-controller --replicas 0
Disable authentication:
Open the
cm/rook-config-overrideConfigMap for editing:kubectl -n rook-ceph edit cm/rook-config-override
Add the following content:
data: config: | [global] ... auth cluster required = none auth service required = none auth client required = none auth supported = none
Start Rook Operator by scaling its deployment replicas to
1:kubectl -n rook-ceph scale deploy rook-ceph-operator --replicas 1
Inspect the Rook Operator logs and wait until the orchestration has settled:
kubectl -n rook-ceph logs -l app=rook-ceph-operator
Verify that the pods in the
rook-cephnamespace have therook-ceph-mon-a,rook-ceph-mgr-a, and all the auxiliary pods are up and running, and allrook-ceph-osd-ID-xxxxxxgreater than zero are running:kubectl -n rook-ceph get pod
Verify the Ceph state. The output must indicate that one
mon, onemgr, and all Ceph OSDs must be up and running and all PGs are either in theActiveorDegradedstate:kubectl -n rook-ceph exec -it deploy/rook-ceph-tools -- ceph -s
Enter the
ceph-toolspod and import the authentication key:kubectl -n rook-ceph exec -it deploy/rook-ceph-tools -- bash vi key [paste keyring content saved before, preserving only `[client admin]` section] ceph auth import -i key rm key exit
Stop Rook Operator by scaling the deployment to
0replicas:kubectl -n rook-ceph scale deploy rook-ceph-operator --replicas 0
Re-enable authentication:
Open the
cm/rook-config-overrideConfigMap for editing:kubectl -n rook-ceph edit cm/rook-config-override
Remove the following content:
data: config: | [global] ... auth cluster required = none auth service required = none auth client required = none auth supported = none
Remove all Rook deployments generated with Rook Operator:
kubectl -n rook-ceph delete deploy -l app=rook-ceph-mon kubectl -n rook-ceph delete deploy -l app=rook-ceph-mgr kubectl -n rook-ceph delete deploy -l app=rook-ceph-osd kubectl -n rook-ceph delete deploy -l app=rook-ceph-crashcollector
Start Ceph Controller by scaling its deployment replicas to
1:kubectl -n ceph-lcm-mirantis scale deployment ceph-controller --replicas 1
Start Rook Operator by scaling its deployment replicas to
1:kubectl -n rook-ceph scale deploy rook-ceph-operator --replicas 1
Inspect the Rook Operator logs and wait until the orchestration has settled:
kubectl -n rook-ceph logs -l app=rook-ceph-operator
Verify that the pods in the
rook-cephnamespace have therook-ceph-mon-a,rook-ceph-mgr-a, and all the auxiliary pods are up and running, and allrook-ceph-osd-ID-xxxxxxgreater than zero are running:kubectl -n rook-ceph get pod
Verify the Ceph state. The output must indicate that one
mon, onemgr, and all Ceph OSDs must be up and running and the overall stored data size equals to the old cluster data size.kubectl -n rook-ceph exec -it deploy/rook-ceph-tools -- ceph -s
Edit the
MiraCephCR and add two moremonandmgrroles to the corresponding nodes:kubectl -n ceph-lcm-mirantis edit miraceph
Inspect the Rook namespace and wait until all Ceph Monitors are in the
Runningstate:kubectl -n rook-ceph get pod -l app=rook-ceph-mon
Verify the Ceph state. The output must indicate that three
mon(three in quorum), onemgr, and all Ceph OSDs must be up and running and the overall stored data size equals to the old cluster data size.kubectl -n rook-ceph exec -it deploy/rook-ceph-tools -- ceph -s
Once done, the data from the failed or removed Ceph cluster is restored and ready to use.
Ceph Monitors recovery
Warning
This procedure is valid for MOSK clusters that use the MiraCeph custom
resource (CR), which is available since MOSK 25.2 to replace the deprecated
KaaSCephCluster. For the equivalent procedure with the KaaSCephCluster
CR, refer to the following section:
This section describes how to recover failed Ceph Monitors of an existing Ceph cluster in the following state:
The Ceph cluster contains failed Ceph Monitors that cannot start and hang in the
ErrororCrashLoopBackOffstate.The logs of the failed Ceph Monitor pods contain the following lines:
mon.g does not exist in monmap, will attempt to join an existing cluster ... mon.g@-1(???) e11 not in monmap and have been in a quorum before; must have been removed mon.g@-1(???) e11 commit suicide!
The Ceph cluster contains at least one
RunningCeph Monitor and the ceph -s command outputs one healthymonand one healthymgrinstance.
Perform the following steps for all failed Ceph Monitors at a time if not stated otherwise.
To recover failed Ceph Monitors:
Scale the
rook-ceph/rook-ceph-operatordeployment down to0replicas:kubectl -n rook-ceph scale deploy rook-ceph-operator --replicas 0
Delete all failed Ceph Monitor deployments:
Identify the Ceph Monitor pods in the
ErrororCrashLookBackOffstate:kubectl -n rook-ceph get pod -l 'app in (rook-ceph-mon,rook-ceph-mon-canary)'
Verify that the affected pods contain the failure logs described above:
kubectl -n rook-ceph logs <failedMonPodName>
Substitute
<failedMonPodName>with the Ceph Monitor pod name. For example,rook-ceph-mon-g-845d44b9c6-fjc5d.Save the identifying letters of failed Ceph Monitors for further usage. For example, f, e, and so on.
Delete all corresponding deployments of these pods:
Identify the affected Ceph Monitor pod deployments:
kubectl -n rook-ceph get deploy -l 'app in (rook-ceph-mon,rook-ceph-mon-canary)'
Delete the affected Ceph Monitor pod deployments. For example, if the Ceph cluster has the
rook-ceph-mon-c-845d44b9c6-fjc5dpod in theCrashLoopBackOffstate, remove the correspondingrook-ceph-mon-c:kubectl -n rook-ceph delete deploy rook-ceph-mon-c
Canary
mondeployments have the suffix-canary.
Remove all corresponding entries of Ceph Monitors from the MON map:
Enter the
ceph-toolspod:kubectl -n rook-ceph exec -it deploy/rook-ceph-tools -- bash
Inspect the current MON map and save the IP addresses of the failed Ceph monitors for further usage:
ceph mon dump
Remove all entries of failed Ceph Monitors using the previously saved letters:
ceph mon rm <monLetter>
Substitute
<monLetter>with the corresponding letter of a failed Ceph Monitor.Exit the
ceph-toolspod.
Remove all failed Ceph Monitors entries from the Rook
monendpoints ConfigMap:Open the
rook-ceph/rook-ceph-mon-endpointsConfigMap for editing:kubectl -n rook-ceph edit cm rook-ceph-mon-endpoints
Remove all entries of failed Ceph Monitors from the ConfigMap data and update the
maxMonIdvalue with the current number ofRunningCeph Monitors. For example,rook-ceph-mon-endpointshas the followingdata:data: csi-cluster-config-json: '[{"clusterID":"rook-ceph","monitors":["172.0.0.222:6789","172.0.0.223:6789","172.0.0.224:6789","172.16.52.217:6789","172.16.52.216:6789"]}]' data: a=172.0.0.222:6789,b=172.0.0.223:6789,c=172.0.0.224:6789,f=172.0.0.217:6789,e=172.0.0.216:6789 mapping: '{"node":{ "a":{"Name":"kaas-node-21465871-42d0-4d56-911f-7b5b95cb4d34","Hostname":"kaas-node-21465871-42d0-4d56-911f-7b5b95cb4d34","Address":"172.16.52.222"}, "b":{"Name":"kaas-node-43991b09-6dad-40cd-93e7-1f02ed821b9f","Hostname":"kaas-node-43991b09-6dad-40cd-93e7-1f02ed821b9f","Address":"172.16.52.223"}, "c":{"Name":"kaas-node-15225c81-3f7a-4eba-b3e4-a23fd86331bd","Hostname":"kaas-node-15225c81-3f7a-4eba-b3e4-a23fd86331bd","Address":"172.16.52.224"}, "e":{"Name":"kaas-node-ba3bfa17-77d2-467c-91eb-6291fb219a80","Hostname":"kaas-node-ba3bfa17-77d2-467c-91eb-6291fb219a80","Address":"172.16.52.216"}, "f":{"Name":"kaas-node-6f669490-f0c7-4d19-bf73-e51fbd6c7672","Hostname":"kaas-node-6f669490-f0c7-4d19-bf73-e51fbd6c7672","Address":"172.16.52.217"}} }' maxMonId: "5"
If
eandfare the letters of failed Ceph Monitors, the resulting ConfigMap data must be as follows:data: csi-cluster-config-json: '[{"clusterID":"rook-ceph","monitors":["172.0.0.222:6789","172.0.0.223:6789","172.0.0.224:6789"]}]' data: a=172.0.0.222:6789,b=172.0.0.223:6789,c=172.0.0.224:6789 mapping: '{"node":{ "a":{"Name":"kaas-node-21465871-42d0-4d56-911f-7b5b95cb4d34","Hostname":"kaas-node-21465871-42d0-4d56-911f-7b5b95cb4d34","Address":"172.16.52.222"}, "b":{"Name":"kaas-node-43991b09-6dad-40cd-93e7-1f02ed821b9f","Hostname":"kaas-node-43991b09-6dad-40cd-93e7-1f02ed821b9f","Address":"172.16.52.223"}, "c":{"Name":"kaas-node-15225c81-3f7a-4eba-b3e4-a23fd86331bd","Hostname":"kaas-node-15225c81-3f7a-4eba-b3e4-a23fd86331bd","Address":"172.16.52.224"}} }' maxMonId: "3"
Back up the data of the failed Ceph Monitors one by one:
SSH to the node of a failed Ceph Monitor using the previously saved IP address.
Move the Ceph Monitor data directory to another place:
mv /var/lib/rook/mon-<letter> /var/lib/rook/mon-<letter>.backup
Close the SSH connection.
Scale the
rook-ceph/rook-ceph-operatordeployment up to1replica:kubectl -n rook-ceph scale deploy rook-ceph-operator --replicas 1
Wait until all Ceph Monitors are in the
Runningstate:kubectl -n rook-ceph get pod -l app=rook-ceph-mon -w
Restore the data from the backup for each recovered Ceph Monitor one by one:
Enter a recovered Ceph Monitor pod:
kubectl -n rook-ceph exec -it <monPodName> bash
Substitute
<monPodName>with the recovered Ceph Monitor pod name. For example,rook-ceph-mon-g-845d44b9c6-fjc5d.Recover the
mondata backup for the current Ceph Monitor:ceph-monstore-tool /var/lib/rook/mon-<letter>.backup/data store-copy /var/lib/rook/mon-<letter>/data/
Substitute
<letter>with the current Ceph Monitor pod letter, for example,e.
Verify the Ceph state. The output must indicate the desired number of Ceph Monitors and all of them must be in quorum.
kubectl -n rook-ceph exec -it deploy/rook-ceph-tools -- ceph -s
CephOsdRemoveRequest failure with a timeout during rebalance
Warning
This procedure is valid for MOSK clusters that use the MiraCeph custom
resource (CR), which is available since MOSK 25.2 to replace the deprecated
KaaSCephCluster. For the equivalent procedure with the KaaSCephCluster
CR, refer to the following section:
KaaSCephOperationRequest failure with a timeout during rebalance
Ceph OSD removal procedure includes the Ceph OSD out action that starts
the Ceph PGs rebalancing process. The total time for rebalancing depends on a
cluster hardware configuration: network bandwidth, Ceph PGs placement, number
of Ceph OSDs, and so on. The default rebalance timeout is limited by 30
minutes, which applies to standard cluster configurations.
If the rebalance takes more than 30 minutes, the CephOsdRemoveRequest
resources created for removing Ceph OSDs or nodes fail with the following
example message:
status:
messages:
- Timeout (30m0s) reached for waiting pg rebalance for osd 2
To apply the issue resolution, increase the timeout for all future
CephOsdRemoveRequest resources:
On the management cluster, open the
Clusterresource of the affected MOSK cluster for editing:kubectl -n <moskClusterProjectName> edit cluster <moskClusterName>
Replace
<moskClusterProjectName>and<moskClusterName>with the corresponding values of the affected MOSK cluster.Add
pgRebalanceTimeoutMinto theceph-controllerHelm releasevaluessection in theClusterspec:spec: providerSpec: value: helmReleases: - name: ceph-controller values: controllers: cephRequest: parameters: pgRebalanceTimeoutMin: <rebalanceTimeout>
The
<rebalanceTimeout>value is a required rebalance timeout in minutes. Must be an integer greater than zero. For example,60.Save the edits and exit from the
Clusterresource.
If you have an existing CephOsdRemoveRequest resource with issues in
messages to process:
In the failed
CephOsdRemoveRequestresource, copy thespecsection.Create a new
CephOsdRemoveRequestwith a different name. For details, see Creating a Ceph OSD removal request.Paste the previously copied
specsection of the failedCephOsdRemoveRequestresource to the new one.Remove the failed
CephOsdRemoveRequestresource.
Ceph Monitors store.db size rapidly growing
Warning
This procedure is valid for MOSK clusters that use the MiraCeph custom
resource (CR), which is available since MOSK 25.2 to replace the deprecated
KaaSCephCluster. For the equivalent procedure with the KaaSCephCluster
CR, refer to the following section:
The MON_DISK_LOW Ceph Cluster health message indicates that the
store.db size of the Ceph Monitor is rapidly growing and the compaction
procedure is not working. In most cases, store.db starts storing a number
of logm keys that are buffered due to Ceph OSD shadow errors.
To verify whether the store.db size is rapidly growing:
Identify the Ceph Monitors
store.dbsize:for pod in $(kubectl get pods -n rook-ceph | grep mon | awk '{print $1}'); \ do printf "$pod:\n"; kubectl exec -n rook-ceph "$pod" -it -c mon -- \ du -cms /var/lib/ceph/mon/ ; done
Repeat the previous step two or three times within the interval of 5-15 seconds.
If between the command runs the total size increases by more than 10 MB, perform the steps described below to resolve the issue.
To apply the issue resolution:
Verify the original state of placement groups (PGs):
kubectl -n rook-ceph exec -it deploy/rook-ceph-tools -- ceph -s
Apply
clog_to_monitorswith thefalsevalue for all Ceph OSDs at runtime:kubectl -n rook-ceph exec -it deploy/rook-ceph-tools -- bash ceph tell osd.* config set clog_to_monitors false
Restart Ceph OSDs one by one:
Restart one of the Ceph OSDs:
for pod in $(kubectl get pods -n rook-ceph -l app=rook-ceph-osd | \ awk 'FNR>1{print $1}'); do printf "$pod:\n"; kubectl -n rook-ceph \ delete pod "$pod"; echo "Continue?"; read; done
Once prompted
Continue?, first verify that rebalancing has finished for the Ceph cluster, the Ceph OSD isupandin, and all PGs have returned to their original state:kubectl -n rook-ceph exec -it deploy/rook-ceph-tools -- ceph -s kubectl -n rook-ceph exec -it deploy/rook-ceph-tools -- ceph osd tree
Once you are confident that the Ceph OSD restart and recovery is over, press
ENTER.Restart the remaining Ceph OSDs.
Note
Periodically verify the Ceph Monitors
store.dbsize:for pod in $(kubectl get pods -n rook-ceph | grep mon | awk \ '{print $1}'); do printf "$pod:\n"; kubectl exec -n rook-ceph \ "$pod" -it -c mon -- du -cms /var/lib/ceph/mon/ ; done
After some of the affected Ceph OSDs restart, Ceph Monitors will start
decreasing the store.db size to the original 100-300 MB. However,
complete the restart of all Ceph OSDs.
The ceph-exporter pods are present in the Ceph crash list
Warning
This procedure is valid for MOSK clusters that use the MiraCeph custom
resource (CR), which is available since MOSK 25.2 to replace the deprecated
KaaSCephCluster. For the equivalent procedure with the KaaSCephCluster
CR, refer to the following section:
After a managed cluster update, the ceph-exporter pods may be present in
the ceph crash ls or ceph health detail list while
rook-ceph-exporter attempts to obtain the port that is still in use.
For example:
ceph health detail
HEALTH_WARN 1 daemons have recently crashed
[WRN] RECENT_CRASH: 1 daemons have recently crashed
client.ceph-exporter crashed on host kaas-node-b59f5e63-2bfd-43aa-bc80-42116d71188c at 2024-10-01T16:43:31.311563Z
The issue does not block the managed cluster update. Once the port becomes
available, rook-ceph-exporter obtains the port and the issue disappears.
To apply the issue resolution, run ceph crash archive-all to
remove ceph-exporter pods from the Ceph crash list.
Ceph health reports PG_DAMAGED after a failed disk or node replacement
After adding a new OSD node on a compact cluster, Ceph health may report
HEALTH_ERR with the ceph health detail command output containing
PG_DAMAGED and OSD_SCRUB_ERRORS messages. For example:
$ ceph -s
cluster:
id: 8bca9dfb-df99-4920-bba0-e5bca59876b4
health: HEALTH_ERR
1 scrub errors
Possible data damage: 1 pg inconsistent
services:
mon: 3 daemons, quorum a,b,c (age 3h)
mgr: a(active, since 3h), standbys: b
osd: 4 osds: 4 up (since 109m), 4 in (since 110m)
rgw: 2 daemons active (2 hosts, 1 zones)
$ ceph health detail
HEALTH_ERR 1 scrub errors; Possible data damage: 1 pg inconsistent
[ERR] OSD_SCRUB_ERRORS: 1 scrub errors
[ERR] PG_DAMAGED: Possible data damage: 1 pg inconsistent
pg 11.2a is active+clean+inconsistent, acting [3,1]
To fix the PG_DAMAGED health error:
Obtain the damaged placement group (PG) ID:
ceph health detail
Example of system response:
HEALTH_ERR 1 scrub errors; Possible data damage: 1 pg inconsistent [ERR] OSD_SCRUB_ERRORS: 1 scrub errors [ERR] PG_DAMAGED: Possible data damage: 1 pg inconsistent pg 11.2a is active+clean+inconsistent, acting [3,1]
In the example above,
11.2ais the required PG ID.Repair the damaged PG:
ceph pg repair <pgid>
Substitute
<pgid>with a damaged PG ID. For example:ceph pg repair 11.2a
Troubleshoot Ceph based on KaaSCephCluster (prior 25.2)
Warning
This procedure is valid for MOSK clusters that use the deprecated
KaaSCephCluster custom resource (CR) instead of the MiraCeph CR that is
available since MOSK 25.2 as a new Ceph configuration entrypoint. For the
equivalent procedure with the MiraCeph CR, refer to the following section:
This section provides solutions to the issues that may occur during Ceph usage.
Ceph disaster recovery
Warning
This procedure is valid for MOSK clusters that use the deprecated
KaaSCephCluster custom resource (CR) instead of the MiraCeph CR that is
available since MOSK 25.2 as a new Ceph configuration entrypoint. For the
equivalent procedure with the MiraCeph CR, refer to the following section:
This section describes how to recover a failed or accidentally removed Ceph cluster in the following cases:
If Ceph Controller underlying a running Rook Ceph cluster has failed and you want to install a new Ceph Controller Helm release and recover the failed Ceph cluster onto the new Ceph Controller.
To migrate the data of an existing Ceph cluster to a new deployment in case downtime can be tolerated.
Consider the common state of a failed or removed Ceph cluster:
The
rook-cephnamespace does not contain pods or they are in theTerminatingstate.The
rook-cephor/andceph-lcm-mirantisnamespaces are in theTerminatingstate.The
ceph-operatoris in theFAILEDstate:Management cluster: the state of the
ceph-operatorHelm release in the management HelmBundle, such asdefault/kaas-mgmt, has switched fromDEPLOYEDtoFAILED.Managed cluster: the state of the
osh-system/ceph-operatorHelmBundle, or a related namespace, has switched fromDEPLOYEDtoFAILED.
The Rook
CephCluster,CephBlockPool,CephObjectStoreCRs in therook-cephnamespace cannot be found or have thedeletionTimestampparameter in themetadatasection.
Note
Prior to recovering the Ceph cluster, verify that your deployment meets the following prerequisites:
The Ceph cluster
fsidexists.The Ceph cluster Monitor keyrings exist.
The Ceph cluster devices exist and include the data previously handled by Ceph OSDs.
Ceph cluster recovery workflow
Create a backup of the remaining data and resources.
Clean up the failed or removed
ceph-operatorHelm release.Deploy a new
ceph-operatorHelm release with the previously usedKaaSCephClusterand one Ceph Monitor.Replace the
ceph-mondata with the old cluster data.Replace
fsidinsecrets/rook-ceph-monwith the old one.Fix the Monitor map in the
ceph-mondatabase.Fix the Ceph Monitor authentication key and disable authentication.
Start the restored cluster and inspect the recovery.
Fix the admin authentication key and enable authentication.
Restart the cluster.
Recover a failed or removed Ceph cluster
Back up the remaining resources. Skip the commands for the resources that have already been removed:
kubectl -n rook-ceph get cephcluster <clusterName> -o yaml > backup/cephcluster.yaml # perform this for each cephblockpool kubectl -n rook-ceph get cephblockpool <cephBlockPool-i> -o yaml > backup/<cephBlockPool-i>.yaml # perform this for each client kubectl -n rook-ceph get cephclient <cephclient-i> -o yaml > backup/<cephclient-i>.yaml kubectl -n rook-ceph get cephobjectstore <cephObjectStoreName> -o yaml > backup/<cephObjectStoreName>.yaml # perform this for each secret kubectl -n rook-ceph get secret <secret-i> -o yaml > backup/<secret-i>.yaml # perform this for each configMap kubectl -n rook-ceph get cm <cm-i> -o yaml > backup/<cm-i>.yaml
SSH to each node where the Ceph Monitors or Ceph OSDs were placed before the failure and back up the valuable data:
mv /var/lib/rook /var/lib/rook.backup mv /etc/ceph /etc/ceph.backup mv /etc/rook /etc/rook.backup
Once done, close the SSH connection.
Clean up the previous installation of
ceph-operator. For details, see Rook documentation: Cleaning up a cluster.Delete the
ceph-lcm-mirantis/ceph-controllerdeployment:kubectl -n ceph-lcm-mirantis delete deployment ceph-controller
Delete all deployments, DaemonSets, and jobs from the
rook-cephnamespace, if any:kubectl -n rook-ceph delete deployment --all kubectl -n rook-ceph delete daemonset --all kubectl -n rook-ceph delete job --all
Edit the
MiraCephandMiraCephHealthCRs of theceph-lcm-mirantisnamespace and remove thefinalizerparameter from themetadatasection:kubectl -n ceph-lcm-mirantis edit miraceph kubectl -n ceph-lcm-mirantis edit miracephhealth
Note
Before MOSK 25.1, use
MiraCephLoginstead ofMiraCephHealthas the object name and in the command above.Edit the
CephCluster,CephBlockPool,CephClient, andCephObjectStoreCRs of therook-cephnamespace and remove thefinalizerparameter from themetadatasection:kubectl -n rook-ceph edit cephclusters kubectl -n rook-ceph edit cephblockpools kubectl -n rook-ceph edit cephclients kubectl -n rook-ceph edit cephobjectstores kubectl -n rook-ceph edit cephobjectusers
Once you clean up every single resource related to the Ceph release, open the
ClusterCR for editing:kubectl -n <projectName> edit cluster <clusterName>
Substitute
<projectName>withdefaultfor the management cluster or with a related project name for the managed cluster.Remove the
ceph-controllerHelm release item from thespec.providerSpec.value.helmReleasesarray and save theClusterCR:- name: ceph-controller values: {}
Verify that
ceph-controllerhas disappeared from the corresponding HelmBundle:kubectl -n <projectName> get helmbundle -o yaml
Open the
KaaSCephClusterCR of the related management or managed cluster for editing:kubectl -n <projectName> edit kaascephcluster
Substitute
<projectName>withdefaultfor the management cluster or with a related project name for the managed cluster.Edit the roles of nodes. The entire
nodesspec must contain only onemonrole. SaveKaaSCephClusterafter editing.Open the
ClusterCR for editing:kubectl -n <projectName> edit cluster <clusterName>
Substitute
<projectName>withdefaultfor the management cluster or with a related project name for the managed cluster.Add
ceph-controllertospec.providerSpec.value.helmReleasesto restore theceph-controllerHelm release. SaveClusterafter editing.- name: ceph-controller values: {}
Verify that the
ceph-controllerHelm release is deployed:Inspect the Rook Operator logs and wait until the orchestration has settled:
kubectl -n rook-ceph logs -l app=rook-ceph-operator
Verify that the pods in the
rook-cephnamespace haverook-ceph-mon-a,rook-ceph-mgr-a, and all the auxiliary pods ar up and running, and norook-ceph-osd-ID-xxxxxxare running:kubectl -n rook-ceph get pod
Verify the Ceph state. The output must indicate that one
monand onemgrare running, all Ceph OSDs are down, and all PGs are in theUnknownstate.kubectl -n rook-ceph exec -it $(kubectl -n rook-ceph get pod -l app=rook-ceph-tools -o jsonpath='{.items[0].metadata.name}') -- ceph -s
Note
Rook should not start any Ceph OSD daemon because all devices belong to the old cluster that has a different
fsid. To verify the Ceph OSD daemons, inspect theosd-preparepods logs:kubectl -n rook-ceph logs -l app=rook-ceph-osd-prepare
Connect to the terminal of the
rook-ceph-mon-apod:kubectl -n rook-ceph exec -it $(kubectl -n rook-ceph get pod \ -l app=rook-ceph-mon -o jsonpath='{.items[0].metadata.name}') bash
Output the
keyringfile and save it for further usage:cat /etc/ceph/keyring-store/keyring exit
Obtain and save the
nodeNameofmon-afor further usage:kubectl -n rook-ceph get pod $(kubectl -n rook-ceph get pod \ -l app=rook-ceph-mon -o jsonpath='{.items[0].metadata.name}') -o jsonpath='{.spec.nodeName}'
Obtain and save the
cephImageused in the Ceph cluster for further usage:kubectl -n ceph-lcm-mirantis get cm ccsettings -o jsonpath='{.data.cephImage}'
Stop Rook Operator and scale the deployment replicas to
0:kubectl -n rook-ceph scale deploy rook-ceph-operator --replicas 0
Remove the Rook deployments generated with Rook Operator:
kubectl -n rook-ceph delete deploy -l app=rook-ceph-mon kubectl -n rook-ceph delete deploy -l app=rook-ceph-mgr kubectl -n rook-ceph delete deploy -l app=rook-ceph-osd kubectl -n rook-ceph delete deploy -l app=rook-ceph-crashcollector
Using the saved
nodeName, SSH to the host whererook-ceph-mon-ain the new Kubernetes cluster is placed and perform the following steps:Remove
/var/lib/rook/mon-aor copy it to another folder:mv /var/lib/rook/mon-a /var/lib/rook/mon-a.new
Pick a healthy
rook-ceph-mon-IDdirectory (/var/lib/rook.backup/mon-ID) in the previous backup, copy to/var/lib/rook/mon-a:cp -rp /var/lib/rook.backup/mon-<ID> /var/lib/rook/mon-a
Substitute
IDwith any healthymonnode ID of the old cluster.Replace
/var/lib/rook/mon-a/keyringwith the previously saved keyring, preserving only the[mon.]section. Remove the[client.admin]section.Run the
cephImageDocker container using the previously savedcephImageimage:docker run -it --rm -v /var/lib/rook:/var/lib/rook <cephImage> bash
Inside the container, create
/etc/ceph/ceph.conffor a stable operation ofceph-mon:touch /etc/ceph/ceph.confChange the directory to
/var/lib/rookand editmonmapby replacing the existingmonhosts with the newmon-aendpoints:cd /var/lib/rook rm /var/lib/rook/mon-a/data/store.db/LOCK # make sure the quorum lock file does not exist ceph-mon --extract-monmap monmap --mon-data ./mon-a/data # Extract monmap from old ceph-mon db and save as monmap monmaptool --print monmap # Print the monmap content, which reflects the old cluster ceph-mon configuration. monmaptool --rm a monmap # Delete `a` from monmap. monmaptool --rm b monmap # Repeat, and delete `b` from monmap. monmaptool --rm c monmap # Repeat this pattern until all the old ceph-mons are removed and monmap won't be empty monmaptool --addv a [v2:<nodeIP>:3300,v1:<nodeIP>:6789] monmap # Replace it with the rook-ceph-mon-a address you got from previous command. ceph-mon --inject-monmap monmap --mon-data ./mon-a/data # Replace monmap in ceph-mon db with our modified version. rm monmap exit
Substitute
<nodeIP>with the IP address of the current<nodeName>node.Close the SSH connection.
Change
fsidto the original one to run Rook as an old cluster:kubectl -n rook-ceph edit secret/rook-ceph-mon
Note
The
fsidisbase64encoded and must not contain a trailing carriage return. For example:echo -n a811f99a-d865-46b7-8f2c-f94c064e4356 | base64 # Replace with the fsid from the old cluster.
Scale the
ceph-lcm-mirantis/ceph-controllerdeployment replicas to0:kubectl -n ceph-lcm-mirantis scale deployment ceph-controller --replicas 0
Disable authentication:
Open the
cm/rook-config-overrideConfigMap for editing:kubectl -n rook-ceph edit cm/rook-config-override
Add the following content:
data: config: | [global] ... auth cluster required = none auth service required = none auth client required = none auth supported = none
Start Rook Operator by scaling its deployment replicas to
1:kubectl -n rook-ceph scale deploy rook-ceph-operator --replicas 1
Inspect the Rook Operator logs and wait until the orchestration has settled:
kubectl -n rook-ceph logs -l app=rook-ceph-operator
Verify that the pods in the
rook-cephnamespace have therook-ceph-mon-a,rook-ceph-mgr-a, and all the auxiliary pods are up and running, and allrook-ceph-osd-ID-xxxxxxgreater than zero are running:kubectl -n rook-ceph get pod
Verify the Ceph state. The output must indicate that one
mon, onemgr, and all Ceph OSDs are up and running and all PGs are either in theActiveorDegradedstate:kubectl -n rook-ceph exec -it $(kubectl -n rook-ceph get pod \ -l app=rook-ceph-tools -o jsonpath='{.items[0].metadata.name}') -- ceph -s
Enter the
ceph-toolspod and import the authentication key:kubectl -n rook-ceph exec -it $(kubectl -n rook-ceph get pod \ -l app=rook-ceph-tools -o jsonpath='{.items[0].metadata.name}') bash vi key [paste keyring content saved before, preserving only `[client admin]` section] ceph auth import -i key rm key exit
Stop Rook Operator by scaling the deployment to
0replicas:kubectl -n rook-ceph scale deploy rook-ceph-operator --replicas 0
Re-enable authentication:
Open the
cm/rook-config-overrideConfigMap for editing:kubectl -n rook-ceph edit cm/rook-config-override
Remove the following content:
data: config: | [global] ... auth cluster required = none auth service required = none auth client required = none auth supported = none
Remove all Rook deployments generated with Rook Operator:
kubectl -n rook-ceph delete deploy -l app=rook-ceph-mon kubectl -n rook-ceph delete deploy -l app=rook-ceph-mgr kubectl -n rook-ceph delete deploy -l app=rook-ceph-osd kubectl -n rook-ceph delete deploy -l app=rook-ceph-crashcollector
Start Ceph Controller by scaling its deployment replicas to
1:kubectl -n ceph-lcm-mirantis scale deployment ceph-controller --replicas 1
Start Rook Operator by scaling its deployment replicas to
1:kubectl -n rook-ceph scale deploy rook-ceph-operator --replicas 1
Inspect the Rook Operator logs and wait until the orchestration has settled:
kubectl -n rook-ceph logs -l app=rook-ceph-operator
Verify that the pods in the
rook-cephnamespace have therook-ceph-mon-a,rook-ceph-mgr-a, and all the auxiliary pods are up and running, and allrook-ceph-osd-ID-xxxxxxgreater than zero are running:kubectl -n rook-ceph get pod
Verify the Ceph state. The output must indicate that one
mon, onemgr, and all Ceph OSDs are up and running and the overall stored data size equals to the old cluster data size.kubectl -n rook-ceph exec -it $(kubectl -n rook-ceph get pod -l app=rook-ceph-tools -o jsonpath='{.items[0].metadata.name}') -- ceph -s
Edit the
MiraCephCR and add two moremonandmgrroles to the corresponding nodes:kubectl -n ceph-lcm-mirantis edit miraceph
Inspect the Rook namespace and wait until all Ceph Monitors are in the
Runningstate:kubectl -n rook-ceph get pod -l app=rook-ceph-mon
Verify the Ceph state. The output must indicate that three
mon(three in quorum), onemgr, and all Ceph OSDs are up and running and the overall stored data size equals to the old cluster data size.kubectl -n rook-ceph exec -it $(kubectl -n rook-ceph get pod -l app=rook-ceph-tools -o jsonpath='{.items[0].metadata.name}') -- ceph -s
Once done, the data from the failed or removed Ceph cluster is restored and ready to use.
Ceph Monitors recovery
Warning
This procedure is valid for MOSK clusters that use the deprecated
KaaSCephCluster custom resource (CR) instead of the MiraCeph CR that is
available since MOSK 25.2 as a new Ceph configuration entrypoint. For the
equivalent procedure with the MiraCeph CR, refer to the following section:
This section describes how to recover failed Ceph Monitors of an existing Ceph cluster in the following state:
The Ceph cluster contains failed Ceph Monitors that cannot start and hang in the
ErrororCrashLoopBackOffstate.The logs of the failed Ceph Monitor pods contain the following lines:
mon.g does not exist in monmap, will attempt to join an existing cluster ... mon.g@-1(???) e11 not in monmap and have been in a quorum before; must have been removed mon.g@-1(???) e11 commit suicide!
The Ceph cluster contains at least one
RunningCeph Monitor and theceph -scommand outputs one healthymonand one healthymgrinstance.
Perform the following steps for all failed Ceph Monitors at a time if not stated otherwise.
To recover failed Ceph Monitors:
Obtain and export the
kubeconfigof the affected cluster.Scale the
rook-ceph/rook-ceph-operatordeployment down to0replicas:kubectl -n rook-ceph scale deploy rook-ceph-operator --replicas 0
Delete all failed Ceph Monitor deployments:
Identify the Ceph Monitor pods in the
ErrororCrashLookBackOffstate:kubectl -n rook-ceph get pod -l 'app in (rook-ceph-mon,rook-ceph-mon-canary)'
Verify that the affected pods contain the failure logs described above:
kubectl -n rook-ceph logs <failedMonPodName>
Substitute
<failedMonPodName>with the Ceph Monitor pod name. For example,rook-ceph-mon-g-845d44b9c6-fjc5d.Save the identifying letters of failed Ceph Monitors for further usage. For example,
f,e, and so on.Delete all corresponding deployments of these pods:
Identify the affected Ceph Monitor pod deployments:
kubectl -n rook-ceph get deploy -l 'app in (rook-ceph-mon,rook-ceph-mon-canary)'
Delete the affected Ceph Monitor pod deployments. For example, if the Ceph cluster has the
rook-ceph-mon-c-845d44b9c6-fjc5dpod in theCrashLoopBackOffstate, remove the correspondingrook-ceph-mon-c:kubectl -n rook-ceph delete deploy rook-ceph-mon-c
Canary
mondeployments have the suffix-canary.
Remove all corresponding entries of Ceph Monitors from the MON map:
Enter the
ceph-toolspod:kubectl -n rook-ceph exec -it $(kubectl -n rook-ceph get pod -l \ app=rook-ceph-tools -o jsonpath='{.items[0].metadata.name}') bash
Inspect the current MON map and save the IP addresses of the failed Ceph monitors for further usage:
ceph mon dump
Remove all entries of failed Ceph Monitors using the previously saved letters:
ceph mon rm <monLetter>
Substitute
<monLetter>with the corresponding letter of a failed Ceph Monitor.Exit the
ceph-toolspod.
Remove all failed Ceph Monitors entries from the Rook
monendpoints ConfigMap:Open the
rook-ceph/rook-ceph-mon-endpointsConfigMap for editing:kubectl -n rook-ceph edit cm rook-ceph-mon-endpoints
Remove all entries of failed Ceph Monitors from the ConfigMap data and update the
maxMonIdvalue with the current number ofRunningCeph Monitors. For example,rook-ceph-mon-endpointshas the followingdata:data: csi-cluster-config-json: '[{"clusterID":"rook-ceph","monitors":["172.0.0.222:6789","172.0.0.223:6789","172.0.0.224:6789","172.16.52.217:6789","172.16.52.216:6789"]}]' data: a=172.0.0.222:6789,b=172.0.0.223:6789,c=172.0.0.224:6789,f=172.0.0.217:6789,e=172.0.0.216:6789 mapping: '{"node":{ "a":{"Name":"kaas-node-21465871-42d0-4d56-911f-7b5b95cb4d34","Hostname":"kaas-node-21465871-42d0-4d56-911f-7b5b95cb4d34","Address":"172.16.52.222"}, "b":{"Name":"kaas-node-43991b09-6dad-40cd-93e7-1f02ed821b9f","Hostname":"kaas-node-43991b09-6dad-40cd-93e7-1f02ed821b9f","Address":"172.16.52.223"}, "c":{"Name":"kaas-node-15225c81-3f7a-4eba-b3e4-a23fd86331bd","Hostname":"kaas-node-15225c81-3f7a-4eba-b3e4-a23fd86331bd","Address":"172.16.52.224"}, "e":{"Name":"kaas-node-ba3bfa17-77d2-467c-91eb-6291fb219a80","Hostname":"kaas-node-ba3bfa17-77d2-467c-91eb-6291fb219a80","Address":"172.16.52.216"}, "f":{"Name":"kaas-node-6f669490-f0c7-4d19-bf73-e51fbd6c7672","Hostname":"kaas-node-6f669490-f0c7-4d19-bf73-e51fbd6c7672","Address":"172.16.52.217"}} }' maxMonId: "5"
If
eandfare the letters of failed Ceph Monitors, the resulting ConfigMap data must be as follows:data: csi-cluster-config-json: '[{"clusterID":"rook-ceph","monitors":["172.0.0.222:6789","172.0.0.223:6789","172.0.0.224:6789"]}]' data: a=172.0.0.222:6789,b=172.0.0.223:6789,c=172.0.0.224:6789 mapping: '{"node":{ "a":{"Name":"kaas-node-21465871-42d0-4d56-911f-7b5b95cb4d34","Hostname":"kaas-node-21465871-42d0-4d56-911f-7b5b95cb4d34","Address":"172.16.52.222"}, "b":{"Name":"kaas-node-43991b09-6dad-40cd-93e7-1f02ed821b9f","Hostname":"kaas-node-43991b09-6dad-40cd-93e7-1f02ed821b9f","Address":"172.16.52.223"}, "c":{"Name":"kaas-node-15225c81-3f7a-4eba-b3e4-a23fd86331bd","Hostname":"kaas-node-15225c81-3f7a-4eba-b3e4-a23fd86331bd","Address":"172.16.52.224"}} }' maxMonId: "3"
Back up the data of the failed Ceph Monitors one by one:
SSH to the node of a failed Ceph Monitor using the previously saved IP address.
Move the Ceph Monitor data directory to another place:
mv /var/lib/rook/mon-<letter> /var/lib/rook/mon-<letter>.backup
Close the SSH connection.
Scale the
rook-ceph/rook-ceph-operatordeployment up to1replica:kubectl -n rook-ceph scale deploy rook-ceph-operator --replicas 1
Wait until all Ceph Monitors are in the
Runningstate:kubectl -n rook-ceph get pod -l app=rook-ceph-mon -w
Restore the data from the backup for each recovered Ceph Monitor one by one:
Enter a recovered Ceph Monitor pod:
kubectl -n rook-ceph exec -it <monPodName> bash
Substitute
<monPodName>with the recovered Ceph Monitor pod name. For example,rook-ceph-mon-g-845d44b9c6-fjc5d.Recover the
mondata backup for the current Ceph Monitor:ceph-monstore-tool /var/lib/rook/mon-<letter>.backup/data store-copy /var/lib/rook/mon-<letter>/data/
Substitute
<letter>with the current Ceph Monitor pod letter, for example,e.
Verify the Ceph state. The output must indicate the desired number of Ceph Monitors and all of them must be in quorum.
kubectl -n rook-ceph exec -it $(kubectl -n rook-ceph get pod -l app=rook-ceph-tools -o jsonpath='{.items[0].metadata.name}') -- ceph -s
KaaSCephOperationRequest failure with a timeout during rebalance
Warning
This procedure is valid for MOSK clusters that use the deprecated
KaaSCephCluster custom resource (CR) instead of the MiraCeph CR that is
available since MOSK 25.2 as a new Ceph configuration entrypoint. For the
equivalent procedure with the MiraCeph CR, refer to the following section:
CephOsdRemoveRequest failure with a timeout during rebalance
Ceph OSD removal procedure includes the Ceph OSD out action that starts
the Ceph PGs rebalancing process. The total time for rebalancing depends on a
cluster hardware configuration: network bandwidth, Ceph PGs placement, number
of Ceph OSDs, and so on. The default rebalance timeout is limited by 30
minutes, which applies to standard cluster configurations.
If the rebalance takes more than 30 minutes, the KaaSCephOperationRequest
resources created for removing Ceph OSDs or nodes fail with the following
example message:
status:
removeStatus:
osdRemoveStatus:
errorReason: Timeout (30m0s) reached for waiting pg rebalance for osd 2
status: Failed
To apply the issue resolution, increase the timeout for all future
KaaSCephOperationRequest resources:
On the management cluster, open the
Clusterresource of the affected managed cluster for editing:kubectl -n <managedClusterProjectName> edit cluster <managedClusterName>
Replace
<managedClusterProjectName>and<managedClusterName>with the corresponding values of the affected managed cluster.Add
pgRebalanceTimeoutMinto theceph-controllerHelm release values section in theClusterspec:spec: providerSpec: value: helmReleases: - name: ceph-controller values: controllers: cephRequest: parameters: pgRebalanceTimeoutMin: <rebalanceTimeout>
The
<rebalanceTimeout>value is a required rebalance timeout in minutes. Must be an integer greater than zero. For example,60.Save the edits and exit from the
Clusterresource.
If you have an existing KaaSCephOperationRequest resource with
errorReason to process:
Copy the
specsection in the failedKaaSCephOperationRequestresource.Create a new
KaaSCephOperationRequestwith a different name. For details, see Creating a Ceph OSD removal request.Paste the previously copied
specsection of the failedKaaSCephOperationRequestresource to the new one.Remove the failed
KaaSCephOperationRequestresource.
Ceph Monitors store.db size rapidly growing
Warning
This procedure is valid for MOSK clusters that use the deprecated
KaaSCephCluster custom resource (CR) instead of the MiraCeph CR that is
available since MOSK 25.2 as a new Ceph configuration entrypoint. For the
equivalent procedure with the MiraCeph CR, refer to the following section:
The MON_DISK_LOW Ceph Cluster health message indicates that the
store.db size of the Ceph Monitor is rapidly growing and the compaction
procedure is not working. In most cases, store.db starts storing a
number of logm keys that are buffered due to Ceph OSD shadow errors.
To verify if store.db size is rapidly growing:
Identify the Ceph Monitors
store.dbsize:for pod in $(kubectl get pods -n rook-ceph | grep mon | awk '{print $1}'); \ do printf "$pod:\n"; kubectl exec -n rook-ceph "$pod" -it -c mon -- \ du -cms /var/lib/ceph/mon/ ; done
Repeat the previous step two or three times within the interval of 5-15 seconds.
If between the command runs the total size increases by more than 10 MB, perform the steps described below to resolve the issue.
To apply the issue resolution:
Verify the original state of placement groups (PGs):
kubectl -n rook-ceph exec -it deploy/rook-ceph-tools -- ceph -s
Apply
clog_to_monitorswith thefalsevalue for all Ceph OSDs at runtime:kubectl -n rook-ceph exec -it deploy/rook-ceph-tools -- bash ceph tell osd.* config set clog_to_monitors false
Restart Ceph OSDs one by one:
Restart one of the Ceph OSDs:
for pod in $(kubectl get pods -n rook-ceph -l app=rook-ceph-osd | \ awk 'FNR>1{print $1}'); do printf "$pod:\n"; kubectl -n rook-ceph \ delete pod "$pod"; echo "Continue?"; read; done
Once prompted
Continue?, first verify that rebalancing has finished for the Ceph cluster, the Ceph OSD isupandin, and all PGs have returned to their original state:kubectl -n rook-ceph exec -it deploy/rook-ceph-tools -- ceph -s kubectl -n rook-ceph exec -it deploy/rook-ceph-tools -- ceph osd tree
Once you are confident that the Ceph OSD restart and recovery is over, press
ENTER.Restart the remaining Ceph OSDs.
Note
Periodically verify the Ceph Monitors
store.dbsize:for pod in $(kubectl get pods -n rook-ceph | grep mon | awk \ '{print $1}'); do printf "$pod:\n"; kubectl exec -n rook-ceph \ "$pod" -it -c mon -- du -cms /var/lib/ceph/mon/ ; done
After some of the affected Ceph OSDs restart, Ceph Monitors will start
decreasing the store.db size to the original 100-300 MB. However,
complete the restart of all Ceph OSDs.
The ceph-exporter pods are present in the Ceph crash list
Warning
This procedure is valid for MOSK clusters that use the deprecated
KaaSCephCluster custom resource (CR) instead of the MiraCeph CR that is
available since MOSK 25.2 as a new Ceph configuration entrypoint. For the
equivalent procedure with the MiraCeph CR, refer to the following section:
After a managed cluster update, the ceph-exporter pods may be present in
the ceph crash ls or ceph health detail list while
rook-ceph-exporter attempts to obtain the port that is still in use.
For example:
ceph health detail
HEALTH_WARN 1 daemons have recently crashed
[WRN] RECENT_CRASH: 1 daemons have recently crashed
client.ceph-exporter crashed on host kaas-node-b59f5e63-2bfd-43aa-bc80-42116d71188c at 2024-10-01T16:43:31.311563Z
The issue does not block the managed cluster update. Once the port becomes
available, rook-ceph-exporter obtains the port and the issue disappears.
To apply the issue resolution, run ceph crash archive-all to
remove ceph-exporter pods from the Ceph crash list.
Ceph health reports PG_DAMAGED after a failed disk or node replacement
After adding a new OSD node on a compact cluster, Ceph health may report
HEALTH_ERR with the ceph health detail command output containing
PG_DAMAGED and OSD_SCRUB_ERRORS messages. For example:
$ ceph -s
cluster:
id: 8bca9dfb-df99-4920-bba0-e5bca59876b4
health: HEALTH_ERR
1 scrub errors
Possible data damage: 1 pg inconsistent
services:
mon: 3 daemons, quorum a,b,c (age 3h)
mgr: a(active, since 3h), standbys: b
osd: 4 osds: 4 up (since 109m), 4 in (since 110m)
rgw: 2 daemons active (2 hosts, 1 zones)
$ ceph health detail
HEALTH_ERR 1 scrub errors; Possible data damage: 1 pg inconsistent
[ERR] OSD_SCRUB_ERRORS: 1 scrub errors
[ERR] PG_DAMAGED: Possible data damage: 1 pg inconsistent
pg 11.2a is active+clean+inconsistent, acting [3,1]
To fix the PG_DAMAGED health error:
Obtain the damaged placement group (PG) ID:
ceph health detail
Example of system response:
HEALTH_ERR 1 scrub errors; Possible data damage: 1 pg inconsistent [ERR] OSD_SCRUB_ERRORS: 1 scrub errors [ERR] PG_DAMAGED: Possible data damage: 1 pg inconsistent pg 11.2a is active+clean+inconsistent, acting [3,1]
In the example above,
11.2ais the required PG ID.Repair the damaged PG:
ceph pg repair <pgid>
Substitute
<pgid>with a damaged PG ID. For example:ceph pg repair 11.2a
Troubleshoot StackLight
This section provides solutions to the issues that may occur during StackLight usage. To troubleshoot StackLight alerts, refer to Troubleshoot alerts.
Patroni replication lag
PostgreSQL replication in a Patroni cluster is based on the Write-Ahead Log (WAL) syncing between the cluster leader and replica. Occasionally, this mechanism may lag due to networking issues, missing WAL segments (on rotation or recycle), increased Patroni Pods CPU usage, or due to a hardware failure.
In StackLight, the PostgresqlReplicationSlowWalDownload alert indicates
that the Patroni cluster Replica is out of sync. This alert has the
Warning severity because under such conditions Patroni cluster is still
operational and the issue may disappear without intervention. However, a
persisting replication lag may impact the cluster availability if another Pod
in the cluster fails, leaving the leader alone to serve requests. In this case,
the Patroni leader will become read-only and unable to serve write requests,
which can cause outage of Alerta backed by Patroni. Grafana, which also uses
Patroni, will still be operational but any dashboard changes will not be saved.
Therefore, if PostgresqlReplicationSlowWalDownload fires, observe the
cluster and fix it if the issue persists or if the lag grows.
To apply the issue resolution:
Enter the Patroni cluster Pod:
kubectl exec -it -n stacklight patroni-13-2 patroni -- bash
Verify the current cluster state:
patronictl -c postgres.yml list
In the
Lag in MBcolumn of the output table, the replica Pod will indicate a non-zero value.Enter the leader Pod if it is not the current one.
From the leader Pod, resync the replica Pod:
patronictl -c postgres.yml reinit patroni-13 <REPLICA-MEMBER-NAME>
In the Alertmanager or Alerta web UI, verify that no new alerts are firing for Patroni. The
PostgresqlInsufficientWorkingMemoryalert may become pending during the operation but should not fire.Verify that the replication is in sync:
patronictl -c postgres.yml list
Example of a positive system response:
+ Cluster: patroni-13 (6974829572195451235)---+---------+-----+-----------+ | Member | Host | Role | State | TL | Lag in MB | +--------------+---------------+--------------+---------+-----+-----------+ | patroni-13-0 | 10.233.96.11 | Replica | running | 875 | 0 | | patroni-13-1 | 10.233.108.39 | Leader | running | 875 | | | patroni-13-2 | 10.233.64.113 | Sync Standby | running | 875 | 0 | +--------------+---------------+--------------+---------+-----+-----------+
Alertmanager does not send resolve notifications for custom alerts
Due to the Alertmanager issue, Alertmanager loses the in-memory alerts during restart. As a result, StackLight does not send notifications for custom alerts in the following case:
Adding a custom alert.
Then removing the custom alert and at the same time changing the Alertmanager configuration such as adding or removing a receiver.
For a removed custom alert, Alertmanager does not send a resolve notification
to any of the configured receivers. Therefore, until after the time set in
repeat_interval (3 hours by default), the alert will be visible in all
receivers but not in the Prometheus and Alertmanager web UIs.
When the alert is re-added, Alertmanager does not send a firing notification
for it until after the time set in repeat_interval, but the alert will be
visible in the Prometheus and Alertmanager web UIs.
Troubleshoot alerts
This section describes the root causes, investigation, and mitigation steps for the available predefined StackLight alerts.
Note
The list of alerts in this section is not full and will be expanded.
Troubleshoot cAdvisor alerts
This section describes the investigation and troubleshooting steps for the cAdvisor service.
Root cause |
The alert is based on the metric |
|---|---|
Investigation |
The alert usually fires when a Pod starts, often during brief intervals. It may solve automatically once the Pod CPU usage stabilizes. If the issue persists:
|
Mitigation |
As a possible solution, increase Pod limits. |
Troubleshoot Helm Controller alerts
This section describes the investigation and troubleshooting steps for the Helm Controller service and the HelmBundle custom resources.
Root cause |
Helm Controller release status differs from |
|---|---|
Investigation |
|
Mitigation |
If the chart artifact is not accessible from your cluster, investigate the network-related alerts, if any, and verify that the file is available in the repository. |
See also
Root cause |
Helm Controller failed to reconcile the HelmBundle spec. |
|---|---|
Investigation and mitigation |
Refer to HelmBundleReleaseNotDeployed. |
Root cause |
Prometheus fails in at least 10% of Helm Controller metrics scrapes. The following two components can cause the alert to fire:
|
|---|---|
Investigation and mitigation |
|
Troubleshoot Host Operating System Modules Controller alerts
This section describes the investigation and troubleshooting steps for the Host Operating System Modules Controller alerts.
Root cause |
Prometheus failed to scrape the |
|---|---|
Investigation |
For further steps, see the Investigation section of the KubePodsCrashLooping alert. |
Mitigation |
Refer to the Mitigation section of the KubePodsCrashLooping alert. |
Root cause |
One or more HostOSConfiguration objects contain configuration for one or more deprecated modules. |
|---|---|
Investigation |
|
Mitigation |
Use up-to-date versions of modules during configuration. |
Troubleshoot Ubuntu kernel alerts
This section describes the investigation and troubleshooting steps for the Ubuntu kernel alerts.
Available MCC since 2.27.0 (Cluster releases 17.2.0 and 16.2.0)
Root cause |
Kernel logs generated IO error logs, potentially indicating disk issues. IO errors may occur due to various reasons and are often unpredictable. |
|---|---|
Investigation |
Inspect kernel logs on affected nodes for If the issue is not related to a faulty disk, further inspect errors in logs to identify the root cause. |
Mitigation |
Mitigation steps depend on the identified issue. If the issue is caused by a faulty disk, replace the affected disk. Additionally, consider the following measures to prevent such issues in the future:
|
Troubleshoot Kubernetes applications alerts
This section describes the investigation and troubleshooting steps for the Kubernetes applications alerts.
Related inhibited alert: KubePodsRegularLongTermRestarts.
Root cause |
Termination of containers in Pods having |
|---|---|
Investigation |
Note Verify if there are more alerts firing in the MOSK cluster to obtain more information on the cluster state and simplify issue investigation and mitigation. Also examine the relation of the affected application with other applications (dependencies) and Kubernetes resources it relies on. During investigation, the affected Pod will likely be in the
|
Mitigation |
Fixes typically fall into one of the following categories:
|
Removed in 17.0.0 and 16.0.0
Root cause |
The Pod could not start successfully for the last 15 minutes, meaning that its status phase is one of the following:
|
|---|---|
Investigation |
Note Verify if there are more alerts firing in the MOSK cluster to obtain more information on the cluster state and simplify issue investigation and mitigation. Also examine the relation of the affected application with other applications (dependencies) and Kubernetes resources it relies on.
|
Mitigation |
|
See also
Related inhibiting alert: KubePodsCrashLooping.
Root cause |
It is a long-term version of the |
|---|---|
Investigation |
While investigating, the affected Pod will likely be in the
|
Mitigation |
Refer to the KubePodsCrashLooping Mitigation section. Fixing this issue may require more effort than simple application tuning. You may need to upgrade the application, upgrade its dependency libraries, or apply a fix in the application code. |
Root cause |
Deployment generation, or
When the Deployment controller fails to observe a new Deployment version, these 2 fields differ. The mismatch lasting for more than 15 minutes triggers the alert. |
|---|---|
Investigation and mitigation |
The alert indicates failure of a Kubernetes built-in Deployment controller and requires debugging on the control plane level. See Troubleshooting Guide for details on collecting cluster state and mitigating known issues. |
Root cause |
The number of available Deployment replicas did not match the desired
state set in the |
|---|---|
Investigation and mitigation |
Refer to KubePodsCrashLooping. |
Related inhibited alert: KubeDeploymentReplicasMismatch.
Root cause |
All Deployment replicas are unavailable for the last 10 minutes, meaning that the application is likely down. |
|---|---|
Investigation |
|
Mitigation |
Refer to KubePodsCrashLooping. |
Root cause |
The number of running StatefulSet replicas did not match the desired
state set in the |
|---|---|
Investigation and mitigation |
Refer to KubePodsCrashLooping. |
Root cause |
StatefulSet generation, or
When the StatefulSet controller fails to observe a new StatefulSet version, these 2 fields differ. The mismatch lasting for more than 15 minutes triggers the alert. |
|---|---|
Investigation and mitigation |
The alert indicates failure of a Kubernetes built-in StatefulSet controller and requires debugging on the control plane level. See Troubleshooting Guide for details on collecting cluster state and mitigating known issues. |
Related inhibited alerts: KubeStatefulSetReplicasMismatch and
KubeStatefulSetUpdateNotRolledOut.
Root cause |
StatefulSet workloads are typically distributed across Kubernetes nodes. Therefore, losing more than one replica indicates either a serious application failure or issues on the Kubernetes cluster level. The application likely experiences severe performance degradation and availability issues. |
|---|---|
Investigation |
|
Mitigation |
Refer to KubePodsCrashLooping. If after fixing the root cause
on the Pod level the affected Pods are still non- |
Root cause |
The StatefulSet update did not finish in 30 minutes, which was
detected in the mismatch of the |
|---|---|
Investigation |
|
Mitigation |
Refer to KubePodsCrashLooping. If after fixing the root cause on the Pod level the affected Pods are
still non- |
Related inhibiting alert: KubeDaemonSetOutage.
Root cause |
For the last 30 minutes, DaemonSet has at least one Pod (not necessarily the same one), which is not ready after being correctly scheduled. It may be caused by missing Pod requirements on the node or unexpected Pod termination. |
|---|---|
Investigation |
|
Mitigation |
See KubePodsCrashLooping. |
See also
Can relate to: KubeCPUOvercommitPods, KubeMemOvercommitPods.
Root cause |
At least one Pod of the DaemonSet was not scheduled to a target node. This may happen if resource requests for the Pod cannot be satisfied by the node or if the node lacks other resources that the Pod requires, such as PV of a specific storage class. |
|---|---|
Investigation |
|
Mitigation |
Removed in MCC 2.27.0 (17.2.0 and 16.2.0)
Root cause |
At least one node where the DaemonSet Pods were deployed got a
|
|---|---|
Investigation |
|
Mitigation |
|
Related inhibiting alert: KubeDaemonSetRolloutStuck.
Root cause |
Although the DaemonSet was not scaled down to zero, there are zero healthy Pods. As each DaemonSet Pod is deployed to a separate Kubernetes node, such situation is rare and typically caused by a broken configuration (ConfigMaps or Secrets) or wrongly tuned resource limits. |
|---|---|
Investigation |
|
Mitigation |
See KubePodsCrashLooping. |
See also
Related alert: ClockSkewDetected.
Root cause |
A CronJob Pod fails to start in 15 minutes from the configured schedule due to the following possible root causes:
|
|---|---|
Investigation |
|
Mitigation |
|
Related inhibited alert: KubePodsNotReady.
Root cause |
At least one container of a Pod started by the Job exited with a non-zero status or was terminated by the Kubernetes or Linux system. |
|---|---|
Investigation |
See KubePodsCrashLooping. |
Mitigation |
|
See also
Troubleshoot Kubernetes resources alerts
This section describes the investigation and troubleshooting steps for the Kubernetes resources alerts.
Root cause |
The sum of Kubernetes Pods CPU requests is higher than the average capacity of the cluster without one node or 80% of total nodes CPU capacity, depending on what is higher. It is a common issue of a cluster with too many resources deployed. |
|---|---|
Investigation |
Select one of the following options to verify nodes CPU requests:
|
Mitigation |
Increase the node(s) CPU capacity or add a worker node(s). |
Root cause |
The sum of Kubernetes Pods RAM requests is higher than the average capacity of the cluster without one node or 80% of total nodes RAM capacity, depending on what is higher. It is a common issue of a cluster with too many resources deployed. |
|---|---|
Investigation |
Select one of the following options to verify nodes RAM requests:
|
Mitigation |
Increase the node(s) CPU capacity or add a worker node(s). |
Troubleshoot Kubernetes storage alerts
This section describes the investigation and troubleshooting steps for the Kubernetes storage alerts.
Related inhibited alert: KubePersistentVolumeFullInFourDays.
Root cause |
Persistent volume (PV) has less than 3% of free space. Applications that rely on writing to the disk will crash without space available. |
|---|---|
Investigation and mitigation |
Refer to KubePersistentVolumeFullInFourDays. |
Root cause |
The PV has less than 15% of total space available. Based on the
|
|---|---|
Investigation |
|
Mitigation |
Select from the following options:
|
Root cause |
Some PVs are in the |
|---|---|
Investigation |
|
Mitigation |
|
Troubleshoot Kubernetes system alerts
This section describes the investigation and troubleshooting steps for the Kubernetes system alerts.
Root cause |
A node has entered the
|
|---|---|
Investigation |
|
Mitigation |
Contact Mirantis support for a detailed procedure on dealing with each of the root causes. |
Root cause |
The number of Pods reached 90% of Kubernetes node capacity. |
|---|---|
Investigation |
|
Mitigation |
|
Root cause |
Prometheus scraping of the Related alert: |
|---|---|
Investigation |
In the Prometheus web UI, search for firing alerts that relate to networking issues in the Container Cloud cluster and fix them. If the cluster network is healthy, refer to the
Investigation section of the
|
Mitigation |
Based on the investigation results, select from the following options:
If the issue still persists, collect the investigation output and contact Mirantis support for further information. |
Root cause |
The Prometheus Blackbox Exporter target probing Related alert: |
|---|---|
Investigation |
In the Prometheus web UI, search for firing alerts that relate to networking issues in the Container Cloud cluster and fix them. If the cluster network is healthy, refer to the
Investigation section of the
|
Mitigation |
Based on the investigation results, select from the following options:
If the issue still persists, collect the investigation output and contact Mirantis support for further information. |
Troubleshoot Mirantis Container Cloud Exporter alerts
This section describes the investigation and troubleshooting steps for the Mirantis Container Cloud Exporter (MCC Exporter) service alerts.
Root cause |
Prometheus failed to scrape MCC Exporter metrics because of the
|
|---|---|
Investigation |
For further steps, see the Investigation section of the KubePodsCrashLooping alert. |
Mitigation |
Refer to KubePodsCrashLooping. |
Root cause |
The Container Cloud update may be blocked due to one of the following reasons:
|
|---|---|
Investigation and mitigation |
|
Troubleshoot Mirantis Kubernetes Engine alerts
This section describes the investigation and troubleshooting steps for the Mirantis Kubernetes Engine (MKE) cluster alerts.
Root cause |
MKE cluster root certificate authority (CA) expires in less than 10 days. |
|---|---|
Investigation |
|
Mitigation |
Contact Mirantis support for a detailed procedure on certificate rotation. |
Root cause |
MKE cluster root CA expires in less than 30 days. |
|---|---|
Investigation and mitigation |
Refer to MKEAPICertExpirationHigh. |
Troubleshoot OpenSearch alerts
Available since MCC 2.26.0 (17.1.0 and 16.1.0)
This section describes the investigation and troubleshooting steps for the OpenSearch alerts.
Root cause |
The OpenSearch volume has reached the default |
|---|---|
Investigation and mitigation |
|
Root cause |
The OpenSearch volume has reached the default value for the high disk allocation watermark of 90% disk usage. At this point, OpenSearch attempts to reassign shards to other nodes if these nodes are still under 90% of used disk space. |
|---|---|
Investigation and mitigation |
|
Troubleshoot Release Controller alerts
This section describes the investigation and troubleshooting steps for the Mirantis Container Cloud Release Controller service.
Root cause |
There are no Release Controller replicas scheduled in the cluster. By default, 3 replicas should be scheduled. The controller was either deleted or downscaled to 0. |
|---|---|
Investigation |
|
Mitigation |
If the Release Controller deployment has been downscaled to 0, set the
replicas back to 3 in the kubectl edit deployment -n kaas release-controller-release-controller
|
Troubleshoot Ceph alerts
This section describes the investigation and troubleshooting steps for Ceph services.
Root cause |
Network issues slow down Ceph OSD heartbeats. |
|---|---|
Investigation |
|
Mitigation |
|
Reference |
Root cause |
Network issues slow down Ceph OSD heartbeats. |
|---|---|
Investigation and mitigation |
Refer to Investigation and Mitigation sections of the CephOSDSlowClusterNetwork alert. |
Troubleshoot Telemeter client alerts
This section describes the investigation and troubleshooting steps for the Mirantis Container Cloud Telemeter client service.
Root cause |
The Telemeter client fails to federate data from Prometheus or to send
data to the Telemeter server due to a very long incoming data sample.
The |
|---|---|
Investigation |
|
Mitigation |
|
OpenSearchPVCMismatch alert raises due to the OpenSearch PVC size mismatch
Caution
The below issue resolution applies since Container Cloud 2.22.0 (Cluster release 11.6.0) to existing clusters with insufficient resources. Before Container Cloud 2.22.0 (Cluster release 11.6.0), use the workaround described in the StackLight known issue 27732-1. New clusters deployed on top of Container Cloud 2.22.0 are not affected.
The OpenSearch elasticsearch.persistentVolumeClaimSize custom setting can
be overwritten by logging.persistentVolumeClaimSize during deployment of a
Container Cloud cluster of any type and is set to the default 30Gi. This
issue raises the OpenSearchPVCMismatch alert. Since
elasticsearch.persistentVolumeClaim is immutable, you cannot update
the value by editing of the Cluster object.
Note
This issue does not affect cluster operability if the current volume capacity is enough for the cluster needs.
To apply the issue resolution, select from the following use cases:
StackLight with an expandable StorageClass for OpenSearch PVCs
Verify that the StorageClass provisioner has enough space to satisfy the new size:
kubectl get helmbundle stacklight-bundle -n stacklight -o json | jq '.spec.releases[] | select(.name == "opensearch") | .values.volumeClaimTemplate.resources.requests.storage'
The system response contains the value of the
elasticsearch.persistentVolumeClaimSizeparameter.Scale down the
opensearch-masterStatefulSet with dependent resources to 0 and disable theelasticsearch-curatorCronJob:kubectl -n stacklight scale --replicas 0 deployment opensearch-dashboards \ && kubectl -n stacklight get pods -l app=opensearch-dashboards | awk '{if (NR!=1) {print $1}}' | \ xargs -r kubectl -n stacklight wait --for=delete --timeout=10m pod kubectl -n stacklight scale --replicas 0 deployment metricbeat \ && kubectl -n stacklight get pods -l app=metricbeat | awk '{if (NR!=1) {print $1}}' | \ xargs -r kubectl -n stacklight wait --for=delete --timeout=10m pod kubectl -n stacklight patch cronjobs elasticsearch-curator -p '{"spec": {"suspend": true}}' kubectl -n stacklight scale --replicas 0 statefulset opensearch-master \ && kubectl -n stacklight get pods -l app=opensearch-master | awk '{if (NR!=1) {print $1}}' | \ xargs -r kubectl -n stacklight wait --for=delete --timeout=30m pod
Patch the PVC with the correct value for
elasticsearch.persistentVolumeClaimSize:pvc_size=$(kubectl -n stacklight get statefulset -l 'app=opensearch-master' \ -o json | jq -r '.items[] | select(.spec.volumeClaimTemplates[].metadata.name // "" | startswith("opensearch-master")).spec.volumeClaimTemplates[].spec.resources.requests.storage') kubectl -n stacklight patch pvc opensearch-master-opensearch-master-0 \ -p '{ "spec": { "resources": { "requests": { "storage": "'"${pvc_size}"'" }}}}'
Scale up the
opensearch-masterStatefulSet with dependent resources to1and enable theelasticsearch-curatorCronJob:replicas=$(kubectl get helmbundle stacklight-bundle -n stacklight \ -o json | jq '.spec.releases[] | select(.name == "opensearch") | .values.replicas') kubectl -n stacklight scale --replicas ${replicas} statefulset opensearch-master \ && kubectl -n stacklight wait --for=condition=Ready --timeout=30m pod -l app=opensearch-master kubectl -n stacklight scale --replicas 1 deployment opensearch-dashboards \ && kubectl -n stacklight wait --for=condition=Ready --timeout=10m pod -l app=opensearch-dashboards kubectl -n stacklight scale --replicas 1 deployment metricbeat \ && kubectl -n stacklight wait --for=condition=Ready --timeout=10m pod -l app=metricbeat kubectl -n stacklight patch cronjobs elasticsearch-curator -p '{"spec": {"suspend": false}}'
StackLight with a non-expandable StorageClass for OpenSearch PVCs
If StackLight is operating in HA mode, the local volume provisioner (LVP) has a non-expandable StorageClass used for OpenSearch PVCs provisioning. Thus, the affected PV nodes have insufficient disk space.
If StackLight is operating in non-HA mode, the default non-expandable storage provisioner is used.
Warning
After applying this issue resolution, the existing OpenSearch data will be lost. If data loss is acceptable, proceed with the steps below.
Move the existing log data to a new PV if required.
Verify that the provisioner has enough space to satisfy the new size:
kubectl get helmbundle stacklight-bundle -n stacklight -o json | jq '.spec.releases[] | select(.name == "opensearch") | .values.volumeClaimTemplate.resources.requests.storage'
The system response contains the value of the
elasticsearch.persistentVolumeClaimSizeparameter.To satisfy the required size:
For LVP, increase the disk size
For non-LVP, make sure that the default StorageClass provisioner has enough space
Scale down the
opensearch-masterStatefulSet with dependent resources to0and disable theelasticsearch-curatorCronJob:kubectl -n stacklight scale --replicas 0 deployment opensearch-dashboards \ && kubectl -n stacklight get pods -l app=opensearch-dashboards | awk '{if (NR!=1) {print $1}}' | \ xargs -r kubectl -n stacklight wait --for=delete --timeout=10m pod kubectl -n stacklight scale --replicas 0 deployment metricbeat \ && kubectl -n stacklight get pods -l app=metricbeat | awk '{if (NR!=1) {print $1}}' | \ xargs -r kubectl -n stacklight wait --for=delete --timeout=10m pod kubectl -n stacklight patch cronjobs elasticsearch-curator -p '{"spec": {"suspend": true}}' kubectl -n stacklight scale --replicas 0 statefulset opensearch-master \ && kubectl -n stacklight get pods -l app=opensearch-master | awk '{if (NR!=1) {print $1}}' | \ xargs -r kubectl -n stacklight wait --for=delete --timeout=30m pod
Delete existing PVCs:
kubectl delete pvc -l 'app=opensearch-master' -n stacklight
Warning
This command removes all existing logs data from PVCs.
Scale up the
opensearch-masterStatefulSet with dependent resources and enable theelasticsearch-curatorCronJob:replicas=$(kubectl get helmbundle stacklight-bundle -n stacklight \ -o json | jq '.spec.releases[] | select(.name == "opensearch") | .values.replicas') kubectl -n stacklight scale --replicas ${replicas} statefulset opensearch-master \ && kubectl -n stacklight wait --for=condition=Ready --timeout=30m pod -l app=opensearch-master kubectl -n stacklight scale --replicas 1 deployment opensearch-dashboards \ && kubectl -n stacklight wait --for=condition=Ready --timeout=10m pod -l app=opensearch-dashboards kubectl -n stacklight scale --replicas 1 deployment metricbeat \ && kubectl -n stacklight wait --for=condition=Ready --timeout=10m pod -l app=metricbeat kubectl -n stacklight patch cronjobs elasticsearch-curator -p '{"spec": {"suspend": false}}'
Tip
To verify whether a StorageClass is expandable:
kubectl get pvc -l 'app=opensearch-master' -n stacklight \
-Ao jsonpath='{range .items[*]}{.spec.storageClassName}{"\n"}{end}' | \
xargs -I{} bash -c "echo -n 'StorageClass: {}, expandable: ' \
&& kubectl get storageclass {} -Ao jsonpath='{.allowVolumeExpansion}' && echo ''"
Example of a system response for an expandable StorageClass:
StorageClass: csi-sc-cinderplugin, expandable: true
Example of a system response for a non-expandable StorageClass:
StorageClass: stacklight-elasticsearch-data, expandable:
StorageClass: stacklight-elasticsearch-data, expandable:
StorageClass: stacklight-elasticsearch-data, expandable:
OpenSearch cluster deadlock due to the corrupted index
Due to instability issues in a cluster, for example, after disaster recovery,
networking issues, or low resources, some OpenSearch master pods may remain
in the PostStartHookError due to the corrupted .opendistro-ism-config
index.
To verify that the cluster is affected:
The cluster is affected only when both conditions are met:
One or two
opensearch-masterpods are stuck in thePostStartHookErrorstate.The following example contains two failed pods:
kubectl get pod -n stacklight | grep opensearch-master opensearch-master-0 1/1 Running 0 41d opensearch-master-1 0/1 PostStartHookError 1659 (2m12s ago) 41d opensearch-master-2 0/1 PostStartHookError 1660 (6m6s ago) 41d
In the logs of the
opensearchcontainer of the affected pods, the followingWARNmessage is present:kubectl logs opensearch-master-1 -n stacklight -c opensearch ... [2024-06-05T08:30:26,241][WARN ][r.suppressed ] [opensearch-master-1] path: /_plugins/_ism/policies/audit_rollover_policy, params: {policyID=audit_rollover_policy, if_seq_no=30554, if_primary_term=3} org.opensearch.action.support.replication.ReplicationOperation$RetryOnPrimaryException: shard is not in primary mode ...
The message itself can differ, but the following two parts of this message indicate that the cluster is affected:
The
/_plugins/_ismprefix in the pathThe
shard is not in primary modeexception
To apply the issue resolution:
Decrease the number of replica shards from
1to0for the.opendistro-ism-configinternal index:Log in to the pod that is not affected by this issue, for example,
opensearch-master-0:kubectl exec -it pod/opensearch-master-0 -n stacklight -c opensearch -- bash
Verify that the
.opendistro-ism-configindex number of replicas is"1":curl "http://localhost:9200/.opendistro-ism-config/_settings" | jq '.".opendistro-ism-config".settings.index.number_of_replicas'
Example of system response:
"1"Decrease replicas from
1to0:curl -X PUT -H 'Content-Type: application/json' "http://localhost:9200/.opendistro-ism-config/_settings" -d '{"index.number_of_replicas": 0 }'
Verify that the
.opendistro-ism-configindex number of replicas is"0".Wait around 30 minutes and verify whether the affected pods started normally or are still failing in the
PostStartHookErrorloop.If the pods started, increase the number of replicas for the
.opendistro-ism-configindex back to1again.If the pods did not start, proceed to the following step.
Remove the internal
.opendistro-ism-configindex to recreate it again:Remove the index:
curl -X DELETE "http://localhost:9200/.opendistro-ism-config"
Wait until all shards of this index are removed, which usually takes up to 10-15 seconds:
curl localhost:9200/_cat/shards | grep opendistro-ism-config
The system response must be empty.
This internal index will be recreated on the next
PostStartHookexecution of any affected replica.Wait up to 30 minutes, assuming that during this time at least one attempt of
PostStartHookexecution occurs, and verify that the internal index was recreated:curl localhost:9200/_cat/shards | grep opendistro-ism-config
The system response must contain two shards in the output, for example:
.opendistro-ism-config 0 p STARTED 10.233.118.238 opensearch-master-2 .opendistro-ism-config 0 r STARTED 10.233.113.58 opensearch-master-1
Wait up to 30 minutes and verify whether the affected pods started normally.
Before 2.27.0 (Cluster releases 17.2.0 and 16.2.0), verify that the cluster is not affected by the issue 40020. If it is affected, proceed to the corresponding workaround.
Failure of shard relocation in the OpenSearch cluster
On large managed clusters, shard relocation may fail in the OpenSearch cluster
with the yellow or red status of the OpenSearch cluster.
The characteristic symptom of the issue is that in the stacklight
namespace, the statefulset.apps/opensearch-master containers are
experiencing throttling with the KubeContainersCPUThrottlingHigh alert
firing for the following set of labels:
{created_by_kind="StatefulSet",created_by_name="opensearch-master",namespace="stacklight"}
Caution
The throttling that OpenSearch is experiencing may be a temporary situation, which may be related, for example, to a peaky load and the ongoing shards initialization as part of disaster recovery or after node restart. In this case, Mirantis recommends waiting until initialization of all shards is finished. After that, verify the cluster state and whether throttling still exists. And only if throttling does not disappear, apply the workaround below.
To verify that the initialization of shards is ongoing:
kubectl exec -it pod/opensearch-master-0 -n stacklight -c opensearch -- bash
curl "http://localhost:9200/_cat/shards" | grep INITIALIZING
Example of system response:
.ds-system-000072 2 r INITIALIZING 10.232.182.135 opensearch-master-1
.ds-system-000073 1 r INITIALIZING 10.232.7.145 opensearch-master-2
.ds-system-000073 2 r INITIALIZING 10.232.182.135 opensearch-master-1
.ds-audit-000001 2 r INITIALIZING 10.232.7.145 opensearch-master-2
The system response above indicates that shards from the
.ds-system-000072, .ds-system-000073, and .ds-audit-000001
indicies are in the INITIALIZING state. In this case, Mirantis
recommends waiting until this process is finished, and only then consider
changing the limit.
You can additionally analyze the exact level of throttling and the current CPU usage on the Kubernetes Containers dashboard in Grafana.
To apply the issue resolution:
Verify the currently configured CPU requests and limits for the
opensearchcontainers:kubectl -n stacklight get statefulset.apps/opensearch-master -o jsonpath="{.spec.template.spec.containers[?(@.name=='opensearch')].resources}"
Example of system response:
{"limits":{"cpu":"600m","memory":"8Gi"},"requests":{"cpu":"500m","memory":"6Gi"}}
In the example above, the CPU request is
500mand the CPU limit is600m.Increase the CPU limit to a reasonably high number.
For example, the default CPU limit for the clusters with the
clusterSize:largeparameter set was increased from8000mto12000mfor StackLight in Container Cloud 2.27.0 (Cluster releases 17.2.0 and 16.2.0).Note
For details, on the
clusterSizeparameter, see Operations Guide: StackLight configuration parameters - Cluster size.If the defaults are already overridden on the affected cluster using the
resourcesPerClusterSizeorresourcesparameters as described in Operations Guide: StackLight configuration parameters - Resource limits, then the exact recommended number depends on the currently set limit.Mirantis recommends increasing the limit by 50%. If it does not resolve the issue, another increase iteration will be required.
When you select the required CPU limit, increase it as described in Operations Guide: StackLight configuration parameters - Resource limits.
If the CPU limit for the
opensearchcomponent is already set, increase it in theClusterobject for theopensearchparameter. Otherwise, the default StackLight limit is used. In this case, increase the CPU limit for theopensearchcomponent using theresourcesparameter.Wait until all
opensearch-masterpods are recreated with the new CPU limits and becomerunningandready.To verify the current CPU limit for every
opensearchcontainer in everyopensearch-masterpod separately:kubectl -n stacklight get pod/opensearch-master-<podSuffixNumber> -o jsonpath="{.spec.containers[?(@.name=='opensearch')].resources}"
In the command above, replace
<podSuffixNumber>with the name of the pod suffix. For example,pod/opensearch-master-0orpod/opensearch-master-2.Example of system response:
{"limits":{"cpu":"900m","memory":"8Gi"},"requests":{"cpu":"500m","memory":"6Gi"}}
The waiting time may take up to 20 minutes depending on the cluster size.
If the issue is fixed, the KubeContainersCPUThrottlingHigh alert stops
firing immediately, while OpenSearchClusterStatusWarning or
OpenSearchClusterStatusCritical can still be firing for some time during
shard relocation.
If the KubeContainersCPUThrottlingHigh alert is still firing, proceed with
another iteration of the CPU limit increase.
StackLight pods get stuck with the ‘NodeAffinity failed’ error
On a managed cluster, the StackLight Pods may get stuck with the
Pod predicate NodeAffinity failed error in the Pod status. The issue may
occur if the StackLight node label was added to one machine and
then removed from another one.
The issue does not affect the StackLight services, all required StackLight Pods migrate successfully except extra Pods that are created and stuck during Pod migration.
To apply the issue resolution, remove the stuck Pods:
kubectl --kubeconfig <managedClusterKubeconfig> -n stacklight delete pod <stuckPodName>
No logs are forwarded to Splunk
After enabling log forwarding to Splunk as described in Enable log forwarding to external destinations, you may see no specific errors but logs are not being sent to Splunk. In this case, debug the issue using the procedure below.
To debug the issue:
Temporary set the
debuglogging level for the syslog output plugin:logging: externalOutputs: splunk_syslog_output: plugin_log_level: debug type: remote_syslog host: remote-splunk-syslog.svc port: 514 protocol: tcp tls: true ca_file: /etc/ssl/certs/splunk-syslog.pem verify_mode: 0 buffer: chunk_limit: 16MB total_limit: 128MB externalOutputSecretMounts: - secretName: syslog-pem mountPath: /etc/ssl/certs/splunk-syslog.pem
When the
fluentd-logspods are updated, grep any pod bysplunk_syslog_output:kubectl logs -n stacklight -f <fluentd-logs-pod-name>| grep 'splunk_syslog_output'
In the following example output, the error indicates that the specified Splunk host name cannot be resolved. Therefore, verify and update the host name accordingly.
Example output
2023-07-25 09:57:29 +0000 [info]: adding match in @splunk_syslog_output-external pattern="**" type="remote_syslog" @label @splunk_syslog_output-external <label @splunk_syslog_output-external> @id splunk_syslog_output-external path "/var/log/fluentd-buffers/splunk_syslog_output-external.system.buffer" path "/var/log/fluentd-buffers/splunk_syslog_output-external.system.buffer" path "/var/log/fluentd-buffers/splunk_syslog_output-external.system.buffer" 2023-07-25 09:57:30 +0000 [debug]: [splunk_syslog_output-external] restoring buffer file: path = /var/log/fluentd-buffers/splunk_syslog_output-external.system.buffer/buffer.q6014c3643b68e68c03c6217052e1af55.log 2023-07-25 09:57:30 +0000 [debug]: [splunk_syslog_output-external] restoring buffer file: path = /var/log/fluentd-buffers/splunk_syslog_output-external.system.buffer/buffer.q6014c36877047570ab3b892f6bd5afe8.log 2023-07-25 09:57:30 +0000 [debug]: [splunk_syslog_output-external] restoring buffer file: path = /var/log/fluentd-buffers/splunk_syslog_output-external.system.buffer/buffer.b6014c36d40fcc16ea630fa86c9315638.log 2023-07-25 09:57:30 +0000 [debug]: [splunk_syslog_output-external] buffer started instance=61140 stage_size=17628134 queue_size=5026605 2023-07-25 09:57:30 +0000 [debug]: [splunk_syslog_output-external] flush_thread actually running 2023-07-25 09:57:30 +0000 [debug]: [splunk_syslog_output-external] enqueue_thread actually running 2023-07-25 09:57:33 +0000 [debug]: [splunk_syslog_output-external] taking back chunk for errors. chunk="6014c3643b68e68c03c6217052e1af55" 2023-07-25 09:57:33 +0000 [warn]: [splunk_syslog_output-external] failed to flush the buffer. retry_times=0 next_retry_time=2023-07-25 09:57:35 +0000 chunk="6014c3643b68e68c03c6217052e1af55" error_class=SocketError error="getaddrinfo: Name or service not known"
API Reference
Mirantis OpenStack for Kubernetes (MOSK) provides a cloud operator with a declarative interface to describe the desired configuration of the cloud.
The program modules responsible for life cycle management of MOSK components extend the API of the underlying Kubernetes cluster with Custom Resources (CRs). These data structures define the services the cloud will provide and specifics of its behavior.
CRs used in MOSK contain dozens of tunable parameters, and the number is constantly growing with every new release as new capabilities get added to the product. Also, each parameter value must be in a specific format and within a range of valid values.
The purpose of the reference documents below is to provide cloud operators with an up-to-date and comprehensive definition of the language they need to use to communicate with MOSK.
Caution
The below documents are intended only for advanced infrastructure operators who are familiar with Kubernetes Cluster API.
Management resources
This section provides descriptions of custom resources for management of a MOSK cluster.
General resources
This section contains descriptions and examples of general custom resources for MOSK.
PublicKey resource
This section describes the PublicKey resource used in
MOSK to provide SSH access to every machine of a cluster.
The Container Cloud PublicKey CR contains the following fields:
apiVersionAPI version of the object that is
kaas.mirantis.com/v1alpha1.
kindObject type that is
PublicKey.
metadataThe
metadataobject field of thePublicKeyresource contains the following fields:nameName of the public key.
namespaceProject where the public key is created.
specThe
specobject field of thePublicKeyresource contains thepublicKeyfield that is an SSH public key value.
The PublicKey resource example:
apiVersion: kaas.mirantis.com/v1alpha1
kind: PublicKey
metadata:
name: demokey
namespace: test
spec:
publicKey: |
ssh-rsa AAAAB3NzaC1yc2EAAAA…
License resource
This section describes the License custom resource (CR)
MOSK to maintain the MOSK license data.
Warning
The kubectl apply command automatically saves the
applied data as plain text into the
kubectl.kubernetes.io/last-applied-configuration annotation of the
corresponding object. This may result in revealing sensitive data in this
annotation when creating or modifying the object.
Therefore, do not use kubectl apply on this object. Use kubectl create, kubectl patch, or kubectl edit instead.
If you used kubectl apply on this object, you
can remove the kubectl.kubernetes.io/last-applied-configuration
annotation from the object using kubectl edit.
The Container Cloud License CR contains the following fields:
apiVersionThe API version of the object that is
kaas.mirantis.com/v1alpha1.
kindThe object type that is
License.
metadataThe
metadataobject field of theLicenseresource contains the following fields:nameThe name of the
Licenseobject, must belicense.
specThe
specobject field of theLicenseresource contains the Secret reference where license data is stored.licensesecretThe Secret reference where the license data is stored.
keyThe name of a key in the license Secret
datafield under which the license data is stored.
nameThe name of the Secret where the license data is stored.
valueThe value of the updated license. If you need to update the license, place it under this field. The new license data will be placed to the Secret and
valuewill be cleaned.
statuscustomerIDThe unique ID of a customer generated during the license issuance.
instanceThe unique ID of the current MOSK instance.
devThe license is for development.
openstackThe license limits for MOSK clusters:
clustersThe maximum number of MOSK clusters to be deployed. If the field is absent, the number of deployments is unlimited.
workersPerClusterThe maximum number of workers per MOSK cluster to be created. If the field is absent, the number of workers is unlimited.
expirationTimeThe license expiration time in the ISO 8601 format.
expiredThe license expiration state. If the value is
true, the license has expired. If the field is absent, the license is valid.
Configuration example of the status fields:
status:
customerID: "auth0|5dd501e54138450d337bc356"
instance: 7589b5c3-57c5-4e64-96a0-30467189ae2b
dev: true
limits:
clusters: 3
workersPerCluster: 5
expirationTime: 2028-11-28T23:00:00Z
TLSConfig resource
This section describes the TLSConfig resource used in
MOSK to configure TLS certificates for cluster
applications.
Warning
The kubectl apply command automatically saves the
applied data as plain text into the
kubectl.kubernetes.io/last-applied-configuration annotation of the
corresponding object. This may result in revealing sensitive data in this
annotation when creating or modifying the object.
Therefore, do not use kubectl apply on this object. Use kubectl create, kubectl patch, or kubectl edit instead.
If you used kubectl apply on this object, you
can remove the kubectl.kubernetes.io/last-applied-configuration
annotation from the object using kubectl edit.
The TLSConfig CR contains the following fields:
apiVersionAPI version of the object that is
kaas.mirantis.com/v1alpha1.
kindObject type that is
TLSConfig.
metadataThe
metadataobject field of theTLSConfigresource contains the following fields:nameName of the public key.
namespaceProject where the TLS certificate is created.
specThe
specobject field contains the configuration to apply for an application. It contains the following fields:serverNameHost name of a server.
serverCertificateCertificate to authenticate server’s identity to a client. A valid certificate bundle can be passed. The server certificate must be on the top of the chain.
privateKeyReference to the
Secretobject that contains a private key. A private key is a key for the server. It must correspond to the public key used in the server certificate.keyKey name in the secret.
nameSecret name.
caCertificateCertificate that issued the server certificate. The top-most intermediate certificate should be used if a CA certificate is unavailable.
Configuration example:
apiVersion: kaas.mirantis.com/v1alpha1
kind: TLSConfig
metadata:
namespace: default
name: keycloak
spec:
caCertificate: LS0tLS1CRUdJTiBDRVJUSUZJQ0FURS0tLS0...
privateKey:
secret:
key: value
name: keycloak-s7mcj
serverCertificate: LS0tLS1CRUdJTiBDRVJUSUZJQ0FURS0tLS0...
serverName: keycloak.mirantis.com
ContainerRegistry resource
This section describes the ContainerRegistry custom resource (CR) used in
MOSK to configure CA certificates on machines to access
private Docker registries.
The ContainerRegistry CR contains the following fields:
apiVersionAPI version of the object that is
kaas.mirantis.com/v1alpha1
kindObject type that is
ContainerRegistry
metadataThe
metadataobject field of theContainerRegistryCR contains the following fields:nameName of the container registry
namespaceProject where the container registry is created
specThe
specobject field of theContainerRegistryCR contains the following fields:domainHost name and optional port of the registry
CACertCA certificate of the registry in the base64-encoded format
Caution
Only one ContainerRegistry resource can exist per domain.
To configure multiple CA certificates for the same domain, combine them into
one certificate.
The ContainerRegistry resource example:
apiVersion: kaas.mirantis.com/v1alpha1
kind: ContainerRegistry
metadata:
name: demoregistry
namespace: test
spec:
domain: demohost:5000
CACert: LS0tLS1CRUdJTiBDRVJUSUZJQ0FURS0tLS0...
MCCUpgrade resource
This section describes the MCCUpgrade resource used in
MOSK to configure a schedule for the management cluster
update.
The MCCUpgrade CR contains the following fields:
apiVersionAPI version of the object that is
kaas.mirantis.com/v1alpha1.
kindObject type that is
MCCUpgrade.
metadataThe
metadataobject field of theMCCUpgraderesource contains the following fields:nameThe name of
MCCUpgradeobject, must bemcc-upgrade.
specThe
specobject field of theMCCUpgraderesource contains the schedule when management cluster update is allowed or blocked. This field contains the following fields:blockUntilDeprecated since Container Cloud 2.28.0 (Cluster release 16.3.0). Use
autoDelayinstead.Time stamp in the ISO 8601 format, for example,
2021-12-31T12:30:00-05:00. Updates will be disabled until this time. You cannot set this field to more than 7 days in the future and more than 30 days after the latest Container Cloud release.
autoDelayAvailable since Container Cloud 2.28.0 (Cluster release 16.3.0).
Flag that enables delay of the management cluster auto-update to a new Container Cloud release and ensures that auto-update is not started immediately on the release date. Boolean,
falseby default.The delay period is minimum 20 days for each newly discovered release and depends on specifics of each release cycle and on optional configuration of week days and hours selected for update. You can verify the exact date of a scheduled auto-update in the
statussection of theMCCUpgradeobject.Note
Modifying the delay period is not supported.
timeZoneName of a time zone in the IANA Time Zone Database. This time zone will be used for all schedule calculations. For example:
Europe/Samara,CET,America/Los_Angeles.
scheduleList of schedule items that allow an update at specific hours or weekdays. The update process can proceed if at least one of these items allows it. Schedule items allow update when both
hoursandweekdaysconditions are met. When this list is empty or absent, update is allowed at any hour of any day. Every schedule item contains the following fields:hoursObject with 2 fields:
fromandto. Both must be non-negative integers not greater than 24. Thetofield must be greater than thefromone. Update is allowed if the current hour in the time zone specified bytimeZoneis greater or equals tofromand is less thanto. Ifhoursis absent, update is allowed at any hour.
weekdaysObject with boolean fields with these names:
mondaytuesdaywednesdaythursdayfridaysaturdaysunday
Update is allowed only on weekdays that have the corresponding field set to
true. If all fields arefalseor absent, orweekdaysis empty or absent, update is allowed on all weekdays.
Full
specexample:spec: autoDelay: true timeZone: CET schedule: - hours: from: 10 to: 17 weekdays: monday: true tuesday: true - hours: from: 7 to: 10 weekdays: monday: true friday: true
In this example, all schedule calculations are done in the CET timezone and upgrades are allowed only:
From 7:00 to 17:00 on Mondays
From 10:00 to 17:00 on Tuesdays
From 7:00 to 10:00 on Fridays
statusThe
statusobject field of theMCCUpgraderesource contains information about the next planned management cluster update, if available. This field contains the following fields:nextAttemptDeprecated since 2.28.0 (Cluster release 16.3.0)Time stamp in the ISO 8601 format indicating the time when the Release Controller will attempt to discover and install a new Container Cloud release. Set to the next allowed time according to the schedule configured in
specor one minute in the future if the schedule currently allows update.
messageDeprecated since 2.28.0 (Cluster release 16.3.0)Message from the last update step or attempt.
nextReleaseObject describing the next release that the management cluster will be updated to. Absent if no new releases have been discovered. Contains the following fields:
versionSemver-compatible version of the next Container Cloud release, for example,
2.22.0.
dateTime stamp in the ISO 8601 format of the Container Cloud release defined in
version:Since 2.28.0 (Cluster release 16.3.0), the field indicates the publish time stamp of a new release.
Before 2.28.0 (Cluster release 16.2.x or earlier), the field indicates the discovery time stamp of a new release.
scheduledAvailable since Container Cloud 2.28.0 (Cluster release 16.3.0). Time window that the pending Container Cloud release update is scheduled for:
startTimeTime stamp in the ISO 8601 format indicating the start time of the update for the pending Container Cloud release.
endTimeTime stamp in the ISO 8601 format indicating the end time of the update for the pending Container Cloud release.
lastUpgradeTime stamps of the latest Container Cloud update:
startedAtTime stamp in the ISO 8601 format indicating the time when the last Container Cloud update started.
finishedAtTime stamp in the ISO 8601 format indicating the time when the last Container Cloud update finished.
conditionsAvailable since Container Cloud 2.28.0 (Cluster release 16.3.0). List of status conditions describing the status of the
MCCUpgraderesource. Each condition has the following format:typeCondition type representing a particular aspect of the
MCCUpgradeobject. Currently, the only supported condition type isReadythat defines readiness to process a new release.If the
statusfield of theReadycondition type isFalse, the Release Controller blocks the start of update operations.
statusCondition status. Possible values:
True,False,Unknown.
reasonMachine-readable explanation of the condition.
lastTransitionTimeTime of the latest condition transition.
messageHuman-readable description of the condition.
Example of MCCUpgrade status:
status:
conditions:
- lastTransitionTime: "2024-09-16T13:22:27Z"
message: New release scheduled for upgrade
reason: ReleaseScheduled
status: "True"
type: Ready
lastUpgrade: {}
message: ''
nextAttempt: "2024-09-16T13:23:27Z"
nextRelease:
date: "2024-08-25T21:05:46Z"
scheduled:
endTime: "2024-09-17T00:00:00Z"
startTime: "2024-09-16T00:00:00Z"
version: 2.28.0
CacheWarmupRequest resource
TechPreview Available since Container Cloud 2.24.0 (Cluster release 14.0.0)
This section describes the CacheWarmupRequest custom resource (CR) used in
MOSK for for management clusters to predownload images and
store them in the mcc-cache service.
The CacheWarmupRequest CR contains the following fields:
apiVersionAPI version of the object that is
kaas.mirantis.com/v1alpha1.
kindObject type that is
CacheWarmupRequest.
metadataThe
metadataobject field of theCacheWarmupRequestresource contains the following fields:nameName of the
CacheWarmupRequestobject that must match the existing management cluster name to which the warm-up operation applies.
namespaceProject in which the cluster is created. Always set to
defaultas the only available project for management clusters creation.
specThe
specobject field of theCacheWarmupRequestresource contains the settings for artifacts fetching and artifacts filtering through Cluster releases. This field contains the following fields:clusterReleasesArray of strings. Defines a set of Cluster release names to warm up in the
mcc-cacheservice.
openstackReleasesOptional. Array of strings. Defines a set of OpenStack releases to warm up in
mcc-cache. Applicable only if theClusterReleasesfield containsmoskreleases.If you plan to upgrade an OpenStack version, define the current and the target versions including the intermediate versions, if any. For example, to upgrade OpenStack from Victoria to Yoga:
openstackReleases: - victoria - wallaby - xena - yoga
fetchRequestTimeoutOptional. String. Time for a single request to download a single artifact. Defaults to
30m. For example,1h2m3s.
clientsPerEndpointOptional. Integer. Number of clients to use for fetching artifacts per each
mcc-cacheservice endpoint. Defaults to2.
openstackOnlyOptional. Boolean. Enables fetching of the OpenStack-related artifacts for MOSK. Defaults to
false. Applicable only if theClusterReleasesfield containsmoskreleases. Useful when you need to upgrade only an OpenStack version.
Example configuration:
apiVersion: kaas.mirantis.com/v1alpha1
kind: CacheWarmupRequest
metadata:
name: example-cluster-name
namespace: default
spec:
clusterReleases:
- mke-14-0-1
- mosk-15-0-1
openstackReleases:
- yoga
fetchRequestTimeout: 30m
clientsPerEndpoint: 2
openstackOnly: false
In this example:
The
CacheWarmupRequestobject is created for a management cluster namedexample-cluster-name.The
CacheWarmupRequestobject is created in the only alloweddefaultContainer Cloud project.Two Cluster releases
mosk-15-0-1andmke-14-0-1will be predownloaded.For
mosk-15-0-1, only images related to the OpenStack versionYogawill be predownloaded.Maximum time-out for a single request to download a single artifact is 30 minutes.
Two parallel workers will fetch artifacts per each
mcc-cacheservice endpoint.All artifacts will be fetched, not only those related to OpenStack.
See also
IAM resources
This section contains descriptions and examples of the IAM custom resources for MOSK. For management details, see Manage user roles through Container Cloud API.
IAMUser resource
IAMUser is the Cluster (non-namespaced) object. Its objects are synced
from Keycloak that is they are created upon user creation in Keycloak and
deleted user upon deletion in Keycloak. The IAMUser is exposed as read-only
to all users. It contains the following fields:
apiVersionAPI version of the object that is
iam.mirantis.com/v1alpha1
kindObject type that is
IAMUser
metadataObject metadata that contains the following field:
nameSanitized user name without special characters with first 8 symbols of the user UUID appended to the end
displayNameName of the user as defined in the Keycloak database
externalIDID of the user as defined in the Keycloak database
Configuration example:
apiVersion: iam.mirantis.com/v1alpha1
kind: IAMUser
metadata:
name: userone-f150d839
displayName: userone
externalID: f150d839-d03a-47c4-8a15-4886b7349791
IAMRole resource
IAMRole is the read-only cluster-level object that can have global,
namespace, or cluster scope. It contains the following fields:
apiVersionAPI version of the object that is
iam.mirantis.com/v1alpha1.
kindObject type that is
IAMRole.
metadataObject metadata that contains the following field:
nameRole name. Possible values are:
global-admin,cluster-admin,operator,bm-pool-operator,user,member,stacklight-admin,management-admin.For details on user role assignment, see Manage user roles through Container Cloud API.
Note
The
management-adminrole is available since Container Cloud 2.25.0 (Cluster releases 17.0.0, 16.0.0, 14.1.0).
descriptionRole description.
scopeRole scope.
Configuration example:
apiVersion: iam.mirantis.com/v1alpha1
kind: IAMRole
metadata:
name: global-admin
description: Gives permission to manage IAM role bindings in the Container Cloud deployment.
scope: global
IAMGlobalRoleBinding resource
IAMGlobalRoleBinding is the Cluster (non-namespaced) object that
should be used for global role bindings in all namespaces. This object is
accessible to users with the global-admin IAMRole assigned through the
IAMGlobalRoleBinding object. The object contains the following fields:
apiVersionAPI version of the object that is
iam.mirantis.com/v1alpha1.
kindObject type that is
IAMGlobalRoleBinding.
metadataObject metadata that contains the following field:
nameRole binding name. If the role binding is user-created, user can set any unique name. If a name relates to a binding that is synced by
user-controllerfrom Keycloak, the naming convention is<username>-<rolename>.
roleObject role that contains the following field:
nameRole name.
userObject name that contains the following field:
nameName of the
iamuserobject that the defined role is provided to. Not equal to the user name in Keycloak.
legacyDefines whether the role binding is legacy. Possible values are
trueorfalse.
legacyRoleApplicable when the
legacyfield value istrue. Defines the legacy role name in Keycloak.
externalDefines whether the role is assigned through Keycloak and is synced by
user-controllerwith the MOSK API as theIAMGlobalRoleBindingobject. Possible values aretrueorfalse.
Caution
If you create the IAM*RoleBinding, do not set or modify
the legacy, legacyRole, and external fields unless absolutely
necessary and you understand all implications.
Configuration example:
apiVersion: iam.mirantis.com/v1alpha1
kind: IAMGlobalRoleBinding
metadata:
name: userone-global-admin
role:
name: global-admin
user:
name: userone-f150d839
external: false
legacy: false
legacyRole: “”
IAMRoleBinding resource
IAMRoleBinding is the namespaced object that represents a grant of one
role to one user in all clusters of the namespace. It is accessible to users
that have either of the following bindings assigned to them:
IAMGlobalRoleBindingthat binds them with theglobal-admin,operator, oruseriamRole. Foruser, the bindings are read-only.IAMRoleBindingthat binds them with theoperatororuseriamRolein a particular namespace. Foruser, the bindings are read-only.
The IAMRoleBinding resource contains the following fields:
apiVersionAPI version of the object that is
iam.mirantis.com/v1alpha1.
kindObject type that is
IAMRoleBinding.
metadataObject metadata that contains the following fields:
namespaceNamespace that the defined binding belongs to.
nameRole binding name. If the role is user-created, user can set any unique name. If a name relates to a binding that is synced from Keycloak, the naming convention is
<userName>-<roleName>.
legacyDefines whether the role binding is legacy. Possible values are
trueorfalse.
legacyRoleApplicable when the
legacyfield value istrue. Defines the legacy role name in Keycloak.
externalDefines whether the role is assigned through Keycloak and is synced by
user-controllerwith the MOSK API as theIAMGlobalRoleBindingobject. Possible values aretrueorfalse.
Caution
If you create the IAM*RoleBinding, do not set or modify
the legacy, legacyRole, and external fields unless absolutely
necessary and you understand all implications.
roleObject role that contains the following field:
nameRole name.
userObject user that contains the following field:
nameName of the
iamuserobject that the defined role is granted to. Not equal to the user name in Keycloak.
Configuration example:
apiVersion: iam.mirantis.com/v1alpha1
kind: IAMRoleBinding
metadata:
namespace: nsone
name: userone-operator
external: false
legacy: false
legacyRole: “”
role:
name: operator
user:
name: userone-f150d839
IAMClusterRoleBinding resource
IAMClusterRoleBinding is the namespaced object that represents a grant
of one role to one user on one cluster in the namespace. This object is
accessible to users that have either of the following bindings assigned to
them:
IAMGlobalRoleBindingthat binds them with theglobal-admin,operator, oruseriamRole. Foruser, the bindings are read-only.IAMRoleBindingthat binds them with theoperatororuseriamRolein a particular namespace. Foruser, the bindings are read-only.
The IAMClusterRoleBinding object contains the following fields:
apiVersionAPI version of the object that is
iam.mirantis.com/v1alpha1.
kindObject type that is
IAMClusterRoleBinding.
metadataObject metadata that contains the following fields:
namespaceNamespace of the cluster that the defined binding belongs to.
nameRole binding name. If the role is user-created, user can set any unique name. If a name relates to a binding that is synced from Keycloak, the naming convention is
<userName>-<roleName>-<clusterName>.
roleObject role that contains the following field:
nameRole name.
userObject user that contains the following field:
nameName of the
iamuserobject that the defined role is granted to. Not equal to the user name in Keycloak.
clusterObject cluster that contains the following field:
nameName of the cluster on which the defined role is granted.
legacyDefines whether the role binding is legacy. Possible values are
trueorfalse.
legacyRoleApplicable when the
legacyfield value istrue. Defines the legacy role name in Keycloak.
externalDefines whether the role is assigned through Keycloak and is synced by
user-controllerwith the MOSK API as theIAMGlobalRoleBindingobject. Possible values aretrueorfalse.
Caution
If you create the IAM*RoleBinding, do not set or modify
the legacy, legacyRole, and external fields unless absolutely
necessary and you understand all implications.
Configuration example:
apiVersion: iam.mirantis.com/v1alpha1
kind: IAMClusterRoleBinding
metadata:
namespace: nsone
name: userone-clusterone-admin
role:
name: cluster-admin
user:
name: userone-f150d839
cluster:
name: clusterone
legacy: false
legacyRole: “”
external: false
Cluster resources
This section contains descriptions and examples of cluster resources for MOSK.
BareMetalHost resource
Private API since Container Cloud 2.29.0 (Cluster release 16.4.0)
Warning
Since Container Cloud 2.29.0 (Cluster release 16.4.0), use the
BareMetalHostInventory resource resource instead of BareMetalHost for adding and modifying
configuration of a bare metal server. Any change in the BareMetalHost
object will be overwitten by BareMetalHostInventory.
For any existing BareMetalHost object, a BareMetalHostInventory
object is created automatically during management cluster update to the
Cluster release 16.4.0.
This section describes the BareMetalHost resource used in
MOSK. The BareMetalHost object is being created for each
Machine and contains all information about machine hardware configuration.
BareMetalHost objects are used to monitor and manage the state of a bare
metal server. This includes inspecting the host hardware, firmware, operating
system provisioning, power control, server deprovision. When a machine is
created, the bare metal provider assigns a BareMetalHost to that machine
using labels and the BareMetalHostProfile configuration.
For demonstration purposes, the Container Cloud BareMetalHost custom
resource (CR) can be split into the following major sections:
The Container Cloud BareMetalHost CR contains the following fields:
apiVersionAPI version of the object that is
metal3.io/v1alpha1.
kindObject type that is
BareMetalHost.
metadataThe metadata field contains the following subfields:
nameName of the
BareMetalHostobject.
namespaceProject in which the
BareMetalHostobject was created.
annotationsKey-value pairs to attach additional metadata to the object:
kaas.mirantis.com/baremetalhost-credentials-nameKey that connects the
BareMetalHostobject with a previously createdBareMetalHostCredentialobject. The value of this key must match theBareMetalHostCredentialobject name.
host.dnsmasqs.metal3.io/addressAvailable since Container Cloud 2.25.0 (Cluster releases 17.0.0 and 16.0.0). Key that assigns a particular IP address to a bare metal host during PXE provisioning.
baremetalhost.metal3.io/detachedAvailable since Container Cloud 2.25.0 (Cluster releases 17.0.0 and 16.0.0). Key that pauses host management by the bare metal operator for a manual IP address assignment.
Note
If the host provisioning has already started or completed, addition of this annotation deletes the information about the host from Ironic without triggering deprovisioning. The bare metal Operator recreates the host in Ironic once you remove the annotation. For details, see Metal3 documentation.
inspect.metal3.io/hardwaredetails-storage-sort-termAvailable since Container Cloud 2.25.0 (Cluster releases 17.0.0 and 16.0.0). Optional. Key that defines sorting of the
bmh:status:storage[]list during inspection of a bare metal host. Accepts multiple tags separated by a comma or semi-column with theASC/DESCsuffix for sorting direction. Example terms:sizeBytes DESC,hctl ASC,type ASC,name DESC.Since Container Cloud 2.26.0 (Cluster releases 17.1.0 and 16.1.0), the following default value applies:
hctl ASC, wwn ASC, by_id ASC, name ASC.
labelsLabels used by the bare metal provider to find a matching
BareMetalHostobject to deploy a machine:hostlabel.bm.kaas.mirantis.com/controlplanehostlabel.bm.kaas.mirantis.com/workerhostlabel.bm.kaas.mirantis.com/storage
Each
BareMetalHostobject added using the Container Cloud web UI will be assigned one of these labels. If theBareMetalHostandMachineobjects are created using API, any label may be used to match these objects for a bare metal host to deploy a machine.
Warning
Labels and annotations that are not documented in this API Reference are generated automatically. Do not modify them using the API.
Configuration example:
apiVersion: metal3.io/v1alpha1
kind: BareMetalHost
metadata:
name: master-0
namespace: default
labels:
kaas.mirantis.com/baremetalhost-id: hw-master-0
kaas.mirantis.com/baremetalhost-id: <bareMetalHostHardwareNodeUniqueId>
annotations:
kaas.mirantis.com/baremetalhost-credentials-name: hw-master-0-credentials
The spec section for the BareMetalHost object defines the desired state
of BareMetalHost. It contains the following fields:
bmcDetails for communication with the Baseboard Management Controller (
bmc) module on a host. Contains the following subfields:addressURL for communicating with the BMC. URLs vary depending on the communication protocol and the BMC type, for example:
- IPMI
Default BMC type in the
ipmi://<host>:<port>format. You can also use a plain<host>:<port>format. A port is optional if using the default port 623.You can change the IPMI privilege level from the default
ADMINISTRATORtoOPERATORwith an optional URL parameterprivilegelevel:ipmi://<host>:<port>?privilegelevel=OPERATOR.
- Redfish
BMC type in the
redfish://format. To disable TLS, you can use theredfish+http://format. A host name or IP address and a path to the system ID are required for both formats. For example,redfish://myhost.example/redfish/v1/Systems/System.Embedded.1orredfish://myhost.example/redfish/v1/Systems/1.
credentialsNameName of the secret containing the
BareMetalHostobject credentials.Since Container Cloud 2.21.0 (Cluster release 11.5.0), this field is updated automatically during cluster deployment. For details, see BareMetalHostCredential resource.
Before Container Cloud 2.21.0 (Cluster release 11.4.0 or earlier), the secret requires the
usernameandpasswordkeys in the Base64 encoding.
disableCertificateVerificationBoolean to skip certificate validation when
true.
bootMACAddressMAC address for booting.
bootModeBoot mode:
UEFIif UEFI is enabled andlegacyif disabled.
onlineDefines whether the server must be online after provisioning is done. Boolean.
Warning
Setting
online: falseto more than one bare metal host in a management cluster at a time can make the cluster non-operational.
Configuration example:
metadata:
name: node-1-name
annotations:
kaas.mirantis.com/baremetalhost-credentials-name: node-1-credentials
spec:
bmc:
address: 192.168.33.106:623
credentialsName: ''
bootMACAddress: 0c:c4:7a:a8:d3:44
bootMode: legacy
online: true
The status field of the BareMetalHost object defines the current
state of BareMetalHost. It contains the following fields:
errorMessageLatest error message reported by the provisioning subsystem.
goodCredentialsLatest credentials that were validated.
hardwareHardware discovered on the host. Contains information about the storage, CPU, host name, firmware, and so on.
operationalStatusStatus of the host:
OKHost is configured correctly and is manageable.
discoveredHost is only partially configured. For example, the
bmcaddress is discovered but not the login credentials.
errorHost has any sort of error.
poweredOnHost availability status: powered on (
true) or powered off (false).
provisioningState information tracked by the provisioner:
stateCurrent action being done with the host by the provisioner.
idUUID of a machine.
triedCredentialsDetails of the last credentials sent to the provisioning backend.
Configuration example:
status:
errorMessage: ""
goodCredentials:
credentials:
name: master-0-bmc-secret
namespace: default
credentialsVersion: "13404"
hardware:
cpu:
arch: x86_64
clockMegahertz: 3000
count: 32
flags:
- 3dnowprefetch
- abm
...
model: Intel(R) Xeon(R) CPU E5-2620 v4 @ 2.10GHz
firmware:
bios:
date: ""
vendor: ""
version: ""
hostname: ipa-fcab7472-892f-473c-85a4-35d64e96c78f
nics:
- ip: ""
mac: 0c:c4:7a:a8:d3:45
model: 0x8086 0x1521
name: enp8s0f1
pxe: false
speedGbps: 0
vlanId: 0
...
ramMebibytes: 262144
storage:
- by_path: /dev/disk/by-path/pci-0000:00:1f.2-ata-1
hctl: "4:0:0:0"
model: Micron_5200_MTFD
name: /dev/sda
rotational: false
serialNumber: 18381E8DC148
sizeBytes: 1920383410176
vendor: ATA
wwn: "0x500a07511e8dc148"
wwnWithExtension: "0x500a07511e8dc148"
...
systemVendor:
manufacturer: Supermicro
productName: SYS-6018R-TDW (To be filled by O.E.M.)
serialNumber: E16865116300188
operationalStatus: OK
poweredOn: true
provisioning:
state: provisioned
triedCredentials:
credentials:
name: master-0-bmc-secret
namespace: default
credentialsVersion: "13404"
BareMetalHostCredential resource
This section describes the BareMetalHostCredential custom resource (CR)
used in the management API for MOSK. The
BareMetalHostCredential object is created for each
BareMetalHostInventory and contains all information about the Baseboard
Management Controller (bmc) credentials.
Note
Before update of the management cluster to Container Cloud 2.29.0
(Cluster release 16.4.0), instead of BareMetalHostInventory, use the
BareMetalHost object. For details, see BareMetalHost resource.
Caution
While the Cluster release of the management cluster is 16.4.0,
BareMetalHostInventory operations are allowed to
m:kaas@management-admin only. This limitation is lifted once the
management cluster is updated to the Cluster release 16.4.1 or later.
Warning
The kubectl apply command automatically saves the
applied data as plain text into the
kubectl.kubernetes.io/last-applied-configuration annotation of the
corresponding object. This may result in revealing sensitive data in this
annotation when creating or modifying the object.
Therefore, do not use kubectl apply on this object. Use kubectl create, kubectl patch, or kubectl edit instead.
If you used kubectl apply on this object, you
can remove the kubectl.kubernetes.io/last-applied-configuration
annotation from the object using kubectl edit.
For demonstration purposes, the BareMetalHostCredential CR can be split
into the following sections:
The BareMetalHostCredential metadata contains the following fields:
apiVersionAPI version of the object that is
kaas.mirantis.com/v1alpha1
kindObject type that is
BareMetalHostCredential
metadataThe metadata field contains the following subfields:
nameName of the
BareMetalHostCredentialobject
namespaceProject in which the related
BareMetalHostInventoryobject is created
labelsLabels used by the bare metal provider:
kaas.mirantis.com/regionRegion name
Note
The
kaas.mirantis.com/regionlabel is removed from all MOSK objects in 24.1. Therefore, do not add the label starting with this release. On existing clusters updated to this release, or if added manually, MOSK ignores this label.
The spec section for the BareMetalHostCredential object contains
sensitive information that is moved to a separate Secret object during
cluster deployment:
usernameUser name of the
bmcaccount with administrator privileges to control the power state and boot source of the bare metal host
passwordDetails on the user password of the
bmcaccount with administrator privileges:valuePassword that will be automatically removed once saved in a separate
Secretobject
nameName of the
Secretobject where credentials are saved
The BareMetalHostCredential object creation triggers the following
automatic actions:
Create an underlying
Secretobject containing data aboutusernameandpasswordof thebmcaccount of the relatedBareMetalHostCredentialobject.Erase sensitive
passworddata of thebmcaccount from theBareMetalHostCredentialobject.Add the created
Secretobject name to thespec.password.namesection of the relatedBareMetalHostCredentialobject.Update
BareMetalHostInventory.spec.bmc.bmhCredentialsNamewith theBareMetalHostCredentialobject name.Note
Before Container Cloud 2.29.0 (Cluster releases 17.4.0 and 16.4.0),
BareMetalHost.spec.bmc.credentialsNamewas updated with theBareMetalHostCredentialobject name.
Note
When you delete a BareMetalHostInventory object, the related
BareMetalHostCredential object is deleted automatically.
Note
On existing clusters, a BareMetalHostCredential object is
automatically created for each BareMetalHostInventory object during a
cluster update.
Example of BareMetalHostCredential before the cluster deployment starts:
apiVersion: kaas.mirantis.com/v1alpha1
kind: BareMetalHostCredential
metadata:
name: hw-master-0-credetnials
namespace: default
spec:
username: admin
password:
value: superpassword
Example of BareMetalHostCredential created during cluster deployment:
apiVersion: kaas.mirantis.com/v1alpha1
kind: BareMetalHostCredential
metadata:
name: hw-master-0-credetnials
namespace: default
spec:
username: admin
password:
name: secret-cv98n7c0vb9
BareMetalHostInventory resource
Available since Container Cloud 2.29.0 (Cluster release 16.4.0)
Note
Before update of the management cluster to Container Cloud 2.29.0
(Cluster release 16.4.0), instead of BareMetalHostInventory, use the
BareMetalHost object. For details, see BareMetalHost resource.
Caution
While the Cluster release of the management cluster is 16.4.0,
BareMetalHostInventory operations are allowed to
m:kaas@management-admin only. This limitation is lifted once the
management cluster is updated to the Cluster release 16.4.1 or later.
This section describes the BareMetalHostInventory resource used in
MOSK to monitor and manage the state of a bare metal
server. This includes inspecting the host hardware, firmware, operating system
provisioning, power control, and server deprovision.
The BareMetalHostInventory object is created for each Machine and
contains all information about machine hardware configuration.
Each BareMetalHostInventory object is synchronized with an automatically
created BareMetalHost object, which is used for internal purposes of the
private API.
Use the BareMetalHostInventory object instead of BareMetalHost resource for adding and
modifying configuration of a bare metal server.
Caution
Any change in the BareMetalHost object will be overwitten by
BareMetalHostInventory.
For any existing BareMetalHost object, a BareMetalHostInventory
object is created automatically during management cluster update to
Container Cloud 2.29.0 (Cluster release 16.4.0).
For demonstration purposes, the Container Cloud BareMetalHostInventory
custom resource (CR) can be split into the following major sections:
The BareMetalHostInventory CR contains the following fields:
apiVersionAPI version of the object that is
kaas.mirantis.com/v1alpha1.
kindObject type that is
BareMetalHostInventory.
metadataThe metadata field contains the following subfields:
nameName of the
BareMetalHostInventoryobject.
namespaceProject in which the
BareMetalHostInventoryobject was created.
annotationshost.dnsmasqs.metal3.io/addressKey that assigns a particular IP address to a bare metal host during PXE provisioning. For details, see Manually allocate IP addresses for bare metal hosts.
baremetalhost.metal3.io/detachedKey that pauses host management by the bare metal Operator for a manual IP address assignment.
Note
If the host provisioning has already started or completed, addition of this annotation deletes the information about the host from Ironic without triggering deprovisioning. The bare metal Operator recreates the host in Ironic once you remove the annotation. For details, see Metal3 documentation.
inspect.metal3.io/hardwaredetails-storage-sort-termOptional. Key that defines sorting of the
bmh:status:storage[]list during inspection of a bare metal host. Accepts multiple tags separated by a comma or semi-column with theASC/DESCsuffix for sorting direction. Example terms:sizeBytes DESC,hctl ASC,type ASC,name DESC.The default value is
hctl ASC, wwn ASC, by_id ASC, name ASC.
labelsLabels used by the bare metal provider to find a matching
BareMetalHostInventoryobject for machine deployment. For example:hostlabel.bm.kaas.mirantis.com/controlplanehostlabel.bm.kaas.mirantis.com/workerhostlabel.bm.kaas.mirantis.com/storage
Warning
Labels and annotations that are not documented in this API Reference are generated automatically. Do not modify them using the API.
Configuration example:
apiVersion: kaas.mirantis.com/v1alpha1
kind: BareMetalHostInventory
metadata:
name: master-0
namespace: default
labels:
kaas.mirantis.com/baremetalhost-id: hw-master-0
annotations:
inspect.metal3.io/hardwaredetails-storage-sort-term: hctl ASC, wwn ASC, by_id ASC, name ASC
The spec section for the BareMetalHostInventory object defines the
required state of BareMetalHostInventory. It contains the following fields:
bmcDetails for communication with the Baseboard Management Controller (
bmc) module on a host. Contains the following subfields:addressURL for communicating with the BMC. URLs vary depending on the communication protocol and the BMC type. For example:
- IPMI
Default BMC type in the
ipmi://<host>:<port>format. You can also use a plain<host>:<port>format. A port is optional if using the default port 623.You can change the IPMI privilege level from the default
ADMINISTRATORtoOPERATORwith an optional URL parameterprivilegelevel:ipmi://<host>:<port>?privilegelevel=OPERATOR.
- Redfish
BMC type in the
redfish://format. To disable TLS, you can use theredfish+http://format. A host name or IP address and a path to the system ID are required for both formats. For example,redfish://myhost.example/redfish/v1/Systems/System.Embedded.1orredfish://myhost.example/redfish/v1/Systems/1.
bmhCredentialsNameName of the
BareMetalHostCredentialsobject.
disableCertificateVerificationKey that disables certificate validation. Boolean,
falseby default. Whentrue, the validation is skipped.
bootMACAddressMAC address for booting.
bootModeBoot mode:
UEFIif UEFI is enabled andlegacyif disabled.
onlineDefines whether the server must be online after provisioning is done.
Warning
Setting
online: falseto more than one bare metal host in a management cluster at a time can make the cluster non-operational.
Configuration example:
metadata:
name: master-0
spec:
bmc:
address: 192.168.33.106:623
bmhCredentialsName: 'master-0-bmc-credentials'
bootMACAddress: 0c:c4:7a:a8:d3:44
bootMode: legacy
online: true
The status field of the BareMetalHostInventory object defines the
current state of BareMetalHostInventory. It contains the following fields:
errorMessageLatest error message reported by the provisioning subsystem.
errorCountNumber of errors that the host has encountered since the last successful operation.
operationalStatusStatus of the host:
OKHost is configured correctly and is manageable.
discoveredHost is only partially configured. For example, the
bmcaddress is discovered but the login credentials are not.
errorHost has any type of error.
poweredOnHost availability status that is powered on (
true) or powered off (false).
operationHistoryKey that contains information about performed operations.
Status example:
status:
errorCount: 0
errorMessage: ""
operationHistory:
deprovision:
end: null
start: null
inspect:
end: "2025-01-01T00:00:00Z"
start: "2025-01-01T00:00:00Z"
provision:
end: "2025-01-01T00:00:00Z"
start: "2025-01-01T00:00:00Z"
register:
end: "2025-01-01T00:00:00Z"
start: "2025-01-01T00:00:00Z"
operationalStatus: OK
poweredOn: true
BareMetalHostProfile resource
This section describes the BareMetalHostProfile resource used in
MOSK to define how the storage devices and operating system
are provisioned and configured.
For demonstration purposes, the BareMetalHostProfile custom resource (CR)
is split into the following major sections:
The BareMetalHostProfile CR contains the following fields:
apiVersionAPI version of the object that is
metal3.io/v1alpha1.
kindObject type that is
BareMetalHostProfile.
metadataThe
metadatafield contains the following subfields:nameName of the bare metal host profile.
namespaceProject in which the bare metal host profile was created.
Configuration example:
apiVersion: metal3.io/v1alpha1
kind: BareMetalHostProfile
metadata:
name: default
namespace: default
The spec field of BareMetalHostProfile object contains the fields to
customize your hardware configuration:
Warning
All data will be wiped during cluster deployment on devices
defined directly or indirectly in the fileSystems list of
BareMetalHostProfile. For example:
A raw device partition with a file system on it
A device partition in a volume group with a logical volume that has a file system on it
An mdadm RAID device with a file system on it
An LVM RAID device with a file system on it
The wipe field is always considered true for these devices.
The false value is ignored.
Therefore, to prevent data loss, move the necessary data from these file systems to another server beforehand, if required.
devicesList of definitions of the physical storage devices. To configure more than three storage devices per host, add additional devices to this list. Each
devicein the list can have one or morepartitionsdefined by the list in thepartitionsfield.Each
devicein the list must have the following fields in thepropertiessection for device handling:workBy(recommended, string)Defines how the device should be identified. Accepts a comma-separated string with the following recommended value (in order of priority):
by_id,by_path,by_wwn,by_name. Since Container Cloud 2.25.1 (Cluster releases 17.0.1 and 16.0.1) , this value is set by default.
wipeDevice(recommended, object)Available since Container Cloud 2.26.0 (Cluster releases 17.1.0 and 16.1.0). Enables and configures cleanup of a device or its metadata before cluster deployment. Contains the following fields:
eraseMetadata(dictionary)Enables metadata cleanup of a device. Contains the following field:
enabled(boolean)Enables the
eraseMetadataoption.Falseby default.
eraseDevice(dictionary)Configures a complete cleanup of a device. Contains the following fields:
blkdiscard(object)Executes the blkdiscard command on the target device to discard all data blocks. Contains the following fields:
enabled(boolean)Enables the
blkdiscardoption.Falseby default.
zeroout(string)Configures writing of zeroes to each block during device erasure. Contains the following options:
fallback- default, blkdiscard attempts to write zeroes only if the device does not support the block discard feature. In this case, the blkdiscard command is re-executed with an additional--zerooutflag.always- always write zeroes.never- never write zeroes.
userDefined(object)Enables execution of a custom command or shell script to erase the target device. Contains the following fields:
enabled(boolean)Enables the
userDefinedoption.Falseby default.
command(string)Defines a command to erase the target device. Empty by default. Mutually exclusive with
script. For the command execution, theansible.builtin.commandmodule is called.
script(string)Defines a plain-text script allowing pipelines (
|) to erase the target device. Empty by default. Mutually exclusive withcommand. For the script execution, theansible.builtin.shellmodule is called.
When executing a command or a script, you can use the following environment variables:
DEVICE_KNAME(always defined by Ansible)Device kernel path, for example,
/dev/sda
DEVICE_BY_NAME(optional)Link from
/dev/disk/by-name/if it was added by udev
DEVICE_BY_ID(optional)Link from
/dev/disk/by-id/if it was added by udev
DEVICE_BY_PATH(optional)Link from
/dev/disk/by-path/if it was added by udev
DEVICE_BY_WWN(optional)Link from
/dev/disk/by-wwn/if it was added by udev
For configuration details, see Wipe a device or partition.
wipe(boolean, deprecated)Defines whether the device must be wiped of the data before being used.
This field is deprecated since Container Cloud 2.26.0 (Cluster releases 17.1.0 and 16.1.0) for the sake of
wipeDeviceand will be removed in one of the following releases.For backward compatibility, any existing
wipe: trueoption is automatically converted to the following structure:wipeDevice: eraseMetadata: enabled: True
Before Container Cloud 2.26.0, the
wipefield is mandatory.
Each
devicein the list can have the following fields in its properties section that affect the selection of the specific device when the profile is applied to a host:type(optional, string)The device type. Possible values:
hdd,ssd,nvme. This property is used to filter selected devices by type.
partflags(optional, string)Extra partition flags to be applied on a partition. For example,
bios_grub.
minSize,maxSize(optional, string)The lower and upper limit of the selected device size in the
<sizeNumber><sizeUnit>format. Only the devices matching these criteria are considered for allocation. Omitted parameter means no upper or lower limit.You can use flexible
sizeunits throughout bare metal host profiles:Ki,Mi,Gi, and so on. For example,size: 100Miorsize: 1.5Githat will be serialized as1536Mi. The size without units is counted in bytes. For example,size: 120means 120 bytes.Warning
minSizeGiBandmaxSizeGiBare deprecated since Container Cloud 2.26.0 (Cluster releases 17.1.0 and 16.1.0) and removed after the MOSK management cluster update to the Cluster release 20.0.0 (Container Cloud 2.30.0). In prior releases, migrate the syntax manually. Otherwise, the values will be lost andBaremetalHostProfilewill become invalid.
byName(optional, string)Forbidden in new profiles since Container Cloud 2.27.0 (Cluster releases 17.2.0 and 16.2.0). The specific device name to be selected during provisioning, such as
dev/sda.Warning
With NVME devices and certain hardware disk controllers, you cannot reliably select such device by the system name. Therefore, use a more specific
byPath,serialNumber, orwwnselector.Caution
Since Container Cloud 2.26.0 (Cluster releases 17.1.0 and 16.1.0),
byNameis deprecated. Since Container Cloud 2.27.0 (Cluster releases 17.2.0 and 16.2.0),byNameis blocked byadmission-controllerin newBareMetalHostProfileobjects. As a replacement, use a more specific selector, such asbyPath,serialNumber, orwwn.
byPath(optional, string) Since 2.26.0 (17.1.0, 16.1.0)The specific device name with its path to be selected during provisioning, such as
/dev/disk/by-path/pci-0000:00:07.0.
serialNumber(optional, string) Since 2.26.0 (17.1.0, 16.1.0)The specific serial number of a physical disk to be selected during provisioning, such as
S2RBNXAH116186E.
wwn(optional, string) Since 2.26.0 (17.1.0, 16.1.0)The specific World Wide Name number of a physical disk to be selected during provisioning, such as
0x5002538d409aeeb4.Warning
When using strict filters, such as
byPath,serialNumber, orwwn, Mirantis strongly recommends not combining them with a soft filter, such asminSize/maxSize. Use only one approach.
softRaidDevicesTech PreviewList of definitions of a software-based Redundant Array of Independent Disks (RAID) created by mdadm. Use the following fields to describe an mdadm RAID device:
name(mandatory, string)Name of a RAID device. Supports the following formats:
devpath, for example,/dev/md0.simple name, for example,
raid-namethat will be created as/dev/md/raid-nameon the target OS.
devices(mandatory, list)List of partitions from the
deviceslist. Expand the resulting list of devices into at least two partitions.
level(optional, string)Level of a RAID device, defaults to
raid1. Possible values:raid1,raid0,raid10.
metadata(optional, string)Metadata version of RAID, defaults to
1.0. Possible values:1.0,1.1,1.2. For details about the differences in metadata, see man 8 mdadm.Warning
The EFI system partition
partflags: ['esp']must be a physical partition in the main partition table of the disk, not under LVM or mdadm software RAID.
fileSystemsList of file systems. Each file system can be created on top of either device, partition, or logical volume. If more file systems are required for additional devices, define them in this field. Each
fileSystemsin the list has the following fields:fileSystem(mandatory, string)Type of a file system to create on a partition. For example,
ext4,vfat.
mountOpts(optional, string)Comma-separated string of mount options. For example,
rw,noatime,nodiratime,lazytime,nobarrier,commit=240,data=ordered.
mountPoint(optional, string)Target mount point for a file system. For example,
/mnt/local-volumes/.
partition(optional, string)Partition name to be selected for creation from the list in the
devicessection. For example,uefi.
logicalVolume(optional, string)LVM logical volume name if the file system is supposed to be created on an LVM volume defined in the
logicalVolumessection. For example,lvp.
logicalVolumesList of LVM logical volumes. Every logical volume belongs to a volume group from the
volumeGroupslist and has thesizeattribute for a size in the corresponding units.You can also add a software-based RAID
raid1created by LVM using the following fields:name(mandatory, string)Name of a logical volume.
vg(mandatory, string)Name of a volume group that must be a name from the
volumeGroupslist.
size(mandatory, string)Size of a logical volume in gigabytes. When set to
0, all available space on the corresponding volume group will be used. The0value equals-l 100%FREEin the lvcreate command.Warning
sizeGiBis deprecated since Container Cloud 2.26.0 (Cluster releases 17.1.0 and 16.1.0) and removed after the MOSK management cluster update to the Cluster release 20.0.0 (Container Cloud 2.30.0). In prior releases, migrate the syntax manually. Otherwise, the values will be lost andBaremetalHostProfilewill become invalid.
type(optional, string)Type of a logical volume. If you require a usual logical volume, you can omit this field.
Possible values:
linearDefault. A usual logical volume. This value is implied for bare metal host profiles created using the Container Cloud release earlier than 2.12.0 (Cluster releases 7.1.0, 6.18.0, or earlier) where the
typefield is unavailable.
raid1Tech PreviewServes to build the
raid1type of LVM. Equals to the lvcreate --type raid1... command. For details, see man 8 lvcreate and man 7 lvmraid.
You can use flexible
sizeunits throughout bare metal host profiles:Ki,Mi,Gi, and so on. For example,size: 100Miorsize: 1.5Githat will be serialized as1536Mi. The size without units is counted in bytes. For example,size: 120means 120 bytes.
volumeGroupsList of definitions of LVM volume groups. Each volume group contains one or more devices or partitions from the
deviceslist. Contains the following field:devices(mandatory, list)List of partitions to be used in a volume group. For example:
- partition: lvm_root_part1 - partition: lvm_root_part2
Must contain the following field:
name(mandatory, string)Name of a volume group to be created. For example:
lvm_root.
preDeployScript(optional, string)Shell script that executes on a host before provisioning the target operating system inside the
ramfssystem.
postDeployScript(optional, string)Shell script that executes on a host after deploying the operating system inside the
ramfssystem that is chrooted to the target operating system. To use a specific default gateway (for example, to have Internet access) on this stage, refer to Configure multiple DHCP address ranges.
grubConfig(optional, object)Set of options for the Linux GRUB bootloader on the target operating system. Contains the following field:
defaultGrubOptions(optional, array)Set of options passed to the Linux GRUB bootloader. Each string in the list defines one parameter. For example:
defaultGrubOptions: - GRUB_DISABLE_RECOVERY="true" - GRUB_PRELOAD_MODULES=lvm - GRUB_TIMEOUT=20
kernelParameters:sysctl(optional, object)List of kernel sysctl options passed to
/etc/sysctl.d/999-baremetal.confduring abmhprovisioning. For example:kernelParameters: sysctl: fs.aio-max-nr: "1048576" fs.file-max: "9223372036854775807"
For the list of options prohibited to change, refer to MKE documentation: Set up kernel default protections.
Note
If asymmetric traffic is expected on some of the managed cluster nodes, enable the loose mode for the corresponding interfaces on those nodes by setting the
net.ipv4.conf.<interface-name>.rp_filterparameter to"2"in thekernelParameters.sysctlsection. For example:kernelParameters: sysctl: net.ipv4.conf.k8s-lcm.rp_filter: "2"
kernelParameters:modules(optional, object)List of options for kernel modules to be passed to
/etc/modprobe.d/{filename}during a bare metal host provisioning. For example:kernelParameters: modules: - content: | options kvm_intel nested=1 filename: kvm_intel.conf
Configuration example with strict filtering for device -
applies since 2.26.0 (17.1.0 and 16.1.0)
spec:
devices:
- device:
wipe: true
workBy: by_wwn,by_path,by_id,by_name
wwn: "0x5002538d409aeeb4"
partitions:
- name: bios_grub
partflags:
- bios_grub
size: 4Mi
wipe: true
- name: uefi
partflags:
- esp
size: 200Mi
wipe: true
- name: config-2
size: 64Mi
wipe: true
- name: lvm_root_part
size: 0
wipe: true
- device:
byPath: /dev/disk/by-path/pci-0000:00:1f.2-ata-1
minSize: 30Gi
wipe: true
workBy: by_id,by_path,by_wwn,by_name
partitions:
- name: lvm_lvp_part1
size: 0
wipe: true
- device:
byPath: /dev/disk/by-path/pci-0000:00:1f.2-ata-3
minSize: 30Gi
wipe: true
workBy: by_id,by_path,by_wwn,by_name
partitions:
- name: lvm_lvp_part2
size: 0
wipe: true
- device:
serialNumber: 'Z1X69DG6'
wipe: true
workBy: by_id,by_path,by_wwn,by_name
fileSystems:
- fileSystem: vfat
partition: config-2
- fileSystem: vfat
mountPoint: /boot/efi
partition: uefi
- fileSystem: ext4
logicalVolume: root
mountPoint: /
- fileSystem: ext4
logicalVolume: lvp
mountPoint: /mnt/local-volumes/
grubConfig:
defaultGrubOptions:
- GRUB_DISABLE_RECOVERY="true"
- GRUB_PRELOAD_MODULES=lvm
- GRUB_TIMEOUT=5
...
logicalVolumes:
- name: root
size: 0
type: linear
vg: lvm_root
- name: lvp
size: 0
type: linear
vg: lvm_lvp
...
volumeGroups:
- devices:
- partition: lvm_root_part
name: lvm_root
- devices:
- partition: lvm_lvp_part1
- partition: lvm_lvp_part2
name: lvm_lvp
General configuration example with the wipeDevice option
for devices - applies since 2.26.0 (17.1.0 and 16.1.0)
spec:
devices:
- device:
wipeDevice:
eraseMetadata:
enabled: true
workBy: by_wwn,by_path,by_id,by_name
partitions:
- name: bios_grub
partflags:
- bios_grub
size: 4Mi
- name: uefi
partflags:
- esp
size: 200Mi
- name: config-2
size: 64Mi
- name: lvm_root_part
size: 0
- device:
minSize: 30Gi
wipeDevice:
eraseMetadata:
enabled: true
workBy: by_id,by_path,by_wwn,by_name
partitions:
- name: lvm_lvp_part1
size: 0
wipe: true
- device:
minSize: 30Gi
wipeDevice:
eraseMetadata:
enabled: true
workBy: by_id,by_path,by_wwn,by_name
partitions:
- name: lvm_lvp_part2
size: 0
- device:
wipeDevice:
eraseMetadata:
enabled: true
workBy: by_id,by_path,by_wwn,by_name
fileSystems:
- fileSystem: vfat
partition: config-2
- fileSystem: vfat
mountPoint: /boot/efi
partition: uefi
- fileSystem: ext4
logicalVolume: root
mountPoint: /
- fileSystem: ext4
logicalVolume: lvp
mountPoint: /mnt/local-volumes/
grubConfig:
defaultGrubOptions:
- GRUB_DISABLE_RECOVERY="true"
- GRUB_PRELOAD_MODULES=lvm
- GRUB_TIMEOUT=5
...
logicalVolumes:
- name: root
size: 0
type: linear
vg: lvm_root
- name: lvp
size: 0
type: linear
vg: lvm_lvp
...
volumeGroups:
- devices:
- partition: lvm_root_part
name: lvm_root
- devices:
- partition: lvm_lvp_part1
- partition: lvm_lvp_part2
name: lvm_lvp
General configuration example with the deprecated wipe
option for devices - applies before 2.26.0 (17.1.0 and 16.1.0)
spec:
devices:
- device:
#byName: /dev/sda
minSize: 61GiB
wipe: true
workBy: by_wwn,by_path,by_id,by_name
partitions:
- name: bios_grub
partflags:
- bios_grub
size: 4Mi
wipe: true
- name: uefi
partflags: ['esp']
size: 200Mi
wipe: true
- name: config-2
# limited to 64Mb
size: 64Mi
wipe: true
- name: md_root_part1
wipe: true
partflags: ['raid']
size: 60Gi
- name: lvm_lvp_part1
wipe: true
partflags: ['raid']
# 0 Means, all left space
size: 0
- device:
#byName: /dev/sdb
minSize: 61GiB
wipe: true
workBy: by_wwn,by_path,by_id,by_name
partitions:
- name: md_root_part2
wipe: true
partflags: ['raid']
size: 60Gi
- name: lvm_lvp_part2
wipe: true
# 0 Means, all left space
size: 0
- device:
#byName: /dev/sdc
minSize: 30Gib
wipe: true
workBy: by_wwn,by_path,by_id,by_name
softRaidDevices:
- name: md_root
metadata: "1.2"
devices:
- partition: md_root_part1
- partition: md_root_part2
volumeGroups:
- name: lvm_lvp
devices:
- partition: lvm_lvp_part1
- partition: lvm_lvp_part2
logicalVolumes:
- name: lvp
vg: lvm_lvp
# Means, all left space
sizeGiB: 0
postDeployScript: |
#!/bin/bash -ex
echo $(date) 'post_deploy_script done' >> /root/post_deploy_done
preDeployScript: |
#!/bin/bash -ex
echo 'ACTION=="add|change", KERNEL=="sd[a-z]", ATTR{queue/rotational}=="0", ATTR{queue/scheduler}="deadline"' > /etc/udev/rules.d/60-ssd-scheduler.rules
echo $(date) 'pre_deploy_script done' >> /root/pre_deploy_done
fileSystems:
- fileSystem: vfat
partition: config-2
- fileSystem: vfat
partition: uefi
mountPoint: /boot/efi/
- fileSystem: ext4
softRaidDevice: md_root
mountPoint: /
- fileSystem: ext4
logicalVolume: lvp
mountPoint: /mnt/local-volumes/
grubConfig:
defaultGrubOptions:
- GRUB_DISABLE_RECOVERY="true"
- GRUB_PRELOAD_MODULES=lvm
- GRUB_TIMEOUT=20
kernelParameters:
sysctl:
# For the list of options prohibited to change, refer to
# https://docs.mirantis.com/mke/3.7/install/predeployment/set-up-kernel-default-protections.html
kernel.dmesg_restrict: "1"
kernel.core_uses_pid: "1"
fs.file-max: "9223372036854775807"
fs.aio-max-nr: "1048576"
fs.inotify.max_user_instances: "4096"
vm.max_map_count: "262144"
modules:
- filename: kvm_intel.conf
content: |
options kvm_intel nested=1
During volume mounts, Mirantis strongly advises against mounting the entire
/var directory to a separate disk or partition. Otherwise, the
cloud-init service may fail to configure the target host system during
the first boot.
This recommendation allows preventing the following cloud-init issue related to asynchronous mount in systemd with ignoring dependency:
System boots the
/mounts.The
cloud-initservice starts and processes data in/var/lib/cloud-init, which currently references[/]var/lib/cloud-init.The
systemdservice mounts/var/lib/cloud-initand breaks thecloud-initservice logic.
Recommended configuration example for /var/lib/nova
spec:
devices:
...
- device:
serialNumber: BTWA516305VE480FGN
type: ssd
wipeDevice:
eraseMetadata:
enabled: true
partitions:
- name: var_lib_nova_part
size: 0
fileSystems:
....
- fileSystem: ext4
partition: var_lib_nova_part
mountPoint: '/var/lib/nova'
mountOpts: 'rw,noatime,nodiratime,lazytime'
Not recommended configuration example for /var
spec:
devices:
...
- device:
serialNumber: BTWA516305VE480FGN
type: ssd
wipeDevice:
eraseMetadata:
enabled: true
partitions:
- name: var_part
size: 0
fileSystems:
....
- fileSystem: ext4
partition: var_part
mountPoint: '/var' # NOT RECOMMENDED
mountOpts: 'rw,noatime,nodiratime,lazytime'
Cluster resource
This section outlines the Cluster resource used the in
MOSK that describes the cluster-level parameters.
For demonstration purposes, the Cluster custom resource (CR) is split into
the following major sections:
Warning
The fields of the Cluster resource that are located under the
status section including providerStatus are available for viewing
only. They are automatically generated by the bare metal cloud provider
and must not be modified using API.
The Cluster CR contains the following fields:
apiVersionAPI version of the object that is
cluster.k8s.io/v1alpha1.
kindObject type that is
Cluster.
The metadata object field of the Cluster resource
contains the following fields:
nameName of a cluster. A MOSK cluster name is specified under the
Cluster Namefield in the Create Cluster wizard of the Container Cloud web UI. A management cluster name is configurable in the bootstrap script.
namespaceProject in which the cluster object was created. The management cluster is always created in the
defaultproject. The MOSK cluster project equals to the selected project name.
labelsKey-value pairs attached to the object:
kaas.mirantis.com/providerProvider type that is
baremetal.
kaas.mirantis.com/regionRegion name. The default region name for the management cluster is
region-one.Note
The
kaas.mirantis.com/regionlabel is removed from all MOSK objects in 24.1. Therefore, do not add the label starting with this release. On existing clusters updated to this release, or if added manually, MOSK ignores this label.
Warning
Labels and annotations that are not documented in this API Reference are generated automatically. Do not modify them using the API.
Configuration example:
apiVersion: cluster.k8s.io/v1alpha1
kind: Cluster
metadata:
name: demo
namespace: test
labels:
kaas.mirantis.com/provider: baremetal
The spec object field of the Cluster object represents the
BaremetalClusterProviderSpec subresource that contains a complete
description of the desired bare metal cluster state and all details to create
the cluster-level resources. It also contains the fields required for LCM
deployment and integration of MOSK components.
The providerSpec object field contains the following generic fields:
apiVersionAPI version of the object that is
baremetal.k8s.io/v1alpha1
kindObject type that is
BaremetalClusterProviderSpec
Configuration example:
spec:
...
providerSpec:
value:
apiVersion: baremetal.k8s.io/v1alpha1
kind: BaremetalClusterProviderSpec
The common providerSpec object field of the Cluster resource contains
the following fields:
credentialsField reserved for other cloud providers, has an empty value. Disregard this field.
releaseName of the
ClusterReleaseobject to install on a cluster.
helmReleasesList of enabled Helm releases from the
Releaseobject that run on a cluster.
proxyName of the
Proxyobject.
tlsTLS configuration for endpoints of a cluster.
keycloakKeyCloak endpoint.
tlsConfigRefReference to the
TLSConfigobject.
uiWeb UI endpoint.
tlsConfigRefReference to the
TLSConfigobject.
For more details, see TLSConfig resource.
maintenanceMaintenance mode of a cluster. Prepares a cluster for maintenance and enables the possibility to switch machines into maintenance mode.
containerRegistriesList of the
ContainerRegistriesresources names.
ntpEnabledNTP server mode. Boolean, enabled by default.
Since Container Cloud 2.23.0 (Cluster release 11.7.0), you can optionally disable NTP to disable the management of
chronyconfiguration by MOSK and use your own system forchronymanagement. Otherwise, configure the regional NTP server parameters to be applied to all machines of MOSK clusters.Before Container Cloud 2.23.0 (Cluster releases 12.5.0, 11.6.0, or earlier), you can optionally configure NTP parameters if servers from the Ubuntu NTP pool (
*.ubuntu.pool.ntp.org) are accessible from the node where a management cluster is being provisioned. Otherwise, this configuration is mandatory.To configure NTP during management cluster bootstrap, see Configure optional settings.
auditOptional. Technology preview. Available since Container Cloud 2.24.0 (Cluster release 14.0.0). Auditing tools enabled on the cluster. Contains the
auditdfield that enables the Linux Audit daemon auditd to monitor activity of cluster processes and prevent potential malicious activity.Configuration for auditd
In the
Clusterobject orcluster.yaml.template, add the auditd parameters:spec: providerSpec: value: audit: auditd: enabled: <bool> enabledAtBoot: <bool> backlogLimit: <int> maxLogFile: <int> maxLogFileAction: <string> maxLogFileKeep: <int> mayHaltSystem: <bool> presetRules: <string> customRules: <string> customRulesX32: <text> customRulesX64: <text>
Configuration parameters for auditd:
enabledBoolean, default -
false. Enables theauditdrole to install the auditd packages and configure rules. CIS rules: 4.1.1.1, 4.1.1.2.enabledAtBootBoolean, default -
false. Configures grub to audit processes that can be audited even if they start up prior to auditd startup. CIS rule: 4.1.1.3.backlogLimitInteger, default - none. Configures the backlog to hold records. If during boot
audit=1is configured, the backlog holds 64 records. If more than 64 records are created during boot, auditd records will be lost with a potential malicious activity being undetected. CIS rule: 4.1.1.4.maxLogFileInteger, default - none. Configures the maximum size of the audit log file. Once the log reaches the maximum size, it is rotated and a new log file is created. CIS rule: 4.1.2.1.
maxLogFileActionString, default - none. Defines handling of the audit log file reaching the maximum file size. Allowed values:
keep_logs- rotate logs but never delete themrotate- add a cron job to compress rotated log files and keep maximum 5 compressed files.compress- compress log files and keep them under the/var/log/auditd/directory. Requiresauditd_max_log_file_keepto be enabled.
CIS rule: 4.1.2.2.
maxLogFileKeepInteger, default -
5. Defines the number of compressed log files to keep under the/var/log/auditd/directory. Requiresauditd_max_log_file_action=compress. CIS rules - none.mayHaltSystemBoolean, default -
false. Halts the system when the audit logs are full. Applies the following configuration:space_left_action = emailaction_mail_acct = rootadmin_space_left_action = halt
CIS rule: 4.1.2.3.
customRulesString, default - none. Base64-encoded content of the
60-custom.rulesfile for any architecture. CIS rules - none.customRulesX32String, default - none. Base64-encoded content of the
60-custom.rulesfile for thei386architecture. CIS rules - none.customRulesX64String, default - none. Base64-encoded content of the
60-custom.rulesfile for thex86_64architecture. CIS rules - none.presetRulesString, default - none. Comma-separated list of the following built-in preset rules:
accessactionsdeletedocker
identityimmutableloginsmac-policy
modulesmountsperm-modprivileged
scopesessionsystem-localetime-change
Since Container Cloud 2.28.0 (Cluster releases 17.3.0 and 16.3.0) in the Technology Preview scope, you can collect some of the preset rules indicated above as groups and use them in
presetRules:ubuntu-cis-rules- this group contains rules to comply with the Ubuntu CIS Benchmark recommendations, including the following CIS Ubuntu 20.04 v2.0.1 rules:scope- 5.2.3.1actions- same as 5.2.3.2time-change- 5.2.3.4system-locale- 5.2.3.5privileged- 5.2.3.6access- 5.2.3.7identity- 5.2.3.8
perm-mod- 5.2.3.9mounts- 5.2.3.10session- 5.2.3.11logins- 5.2.3.12delete- 5.2.3.13mac-policy- 5.2.3.14modules- 5.2.3.19
docker-cis-rules- this group contains rules to comply with Docker CIS Benchmark recommendations, including thedockerDocker CIS v1.6.0 rules 1.1.3 - 1.1.18.
You can also use two additional keywords inside
presetRules:none- select no built-in rules.all- select all built-in rules. When using this keyword, you can add the!prefix to a rule name to exclude some rules. You can use the!prefix for rules only if you add theallkeyword as the first rule. Place a rule with the!prefix only after theallkeyword.
Example configurations:
presetRules: none- disable all preset rulespresetRules: docker- enable only thedockerrulespresetRules: access,actions,logins- enable only theaccess,actions, andloginsrulespresetRules: ubuntu-cis-rules- enable all rules from theubuntu-cis-rulesgrouppresetRules: docker-cis-rules,actions- enable all rules from thedocker-cis-rulesgroup and theactionsrulepresetRules: all- enable all preset rulespresetRules: all,!immutable,!sessions- enable all preset rules exceptimmutableandsessions
CIS controls
4.1.3 (time-change)4.1.4 (identity)4.1.5 (system-locale)4.1.6 (mac-policy)4.1.7 (logins)4.1.8 (session)4.1.9 (perm-mod)4.1.10 (access)4.1.11 (privileged)4.1.12 (mounts)4.1.13 (delete)4.1.14 (scope)4.1.15 (actions)4.1.16 (modules)4.1.17 (immutable)Docker CIS controls
1.1.41.1.81.1.101.1.121.1.131.1.151.1.161.1.171.1.181.2.31.2.41.2.51.2.61.2.71.2.101.2.11
secureOverlayOptional. Technology Preview. Deprecated since Container Cloud 2.29.0 (Cluster releases 17.4.0 and 16.4.0). Available since Container Cloud 2.24.0 (Cluster release 14.0.0). Enables WireGuard for traffic encryption on the Kubernetes workloads network. Boolean. Disabled by default.
Caution
Before enabling WireGuard, ensure that the Calico MTU size is at least 60 bytes smaller than the interface MTU size of the workload network. IPv4 WireGuard uses a 60-byte header. For details, see Set the MTU size for Calico.
Caution
Changing this parameter on a running cluster causes a downtime that can vary depending on the cluster size.
For more details about WireGuard, see Calico documentation: Encrypt in-cluster pod traffic.
useBGPAnnouncementOptional. Technology preview. Available since Container Cloud 2.24.4 (Cluster releases 15.0.3 and 14.0.3). To enable the use of BGP announcement for the cluster API LB address, set to
true. See Configure BGP announcement for cluster API LB address for details.
Configuration example:
spec:
...
providerSpec:
value:
credentials: ""
publicKeys:
- name: bootstrap-key
release: ucp-5-7-0-3-3-3-tp11
helmReleases:
- name: metallb
values: {}
...
- name: stacklight
...
tls:
keycloak:
certificate:
name: keycloak
hostname: container-cloud-auth.example.com
ui:
certificate:
name: ui
hostname: container-cloud-ui.example.com
containerRegistries:
- demoregistry
ntpEnabled: false
...
This section represents MOSK components that are enabled on a cluster. It contains the following fields:
managementConfiguration for the management cluster components:
enabledManagement cluster enabled (
true) or disabled (false).
helmReleasesList of the management cluster Helm releases that will be installed on the cluster. A Helm release includes the
nameandvaluesfields. The specified values will be merged with relevant Helm release values of the management cluster in theReleaseobject.
regionalList of regional cluster components for the provider:
providerProvider type that is
baremetal.
helmReleasesList of the regional Helm releases that will be installed on the cluster. A Helm release includes the
nameandvaluesfields. The specified values will be merged with relevant regional Helm release values in theReleaseobject.
releaseName of the Container Cloud
Releaseobject.
Configuration example:
spec:
...
providerSpec:
value:
kaas:
management:
enabled: true
helmReleases:
- name: kaas-ui
values:
serviceConfig:
server: https://10.0.0.117
regional:
- helmReleases:
- name: baremetal-provider
values: {}
provider: baremetal
...
release: kaas-2-0-0
Must not be modified using API
The common providerStatus object field of the Cluster resource contains
the following fields:
apiVersionAPI version of the object that is
baremetal.k8s.io/v1alpha1.
kindObject type that is
BaremetalClusterProviderStatus.
loadBalancerHostLoad balancer IP or host name of the cluster.
apiServerCertificateServer certificate of Kubernetes API.
ucpDashboardURL of the Mirantis Kubernetes Engine (MKE) Dashboard.
maintenanceMaintenance mode of a cluster. Prepares a cluster for maintenance and enables the possibility to switch machines into maintenance mode.
Configuration example:
status:
providerStatus:
apiVersion: baremetal.k8s.io/v1alpha1
kind: BaremetalClusterProviderStatus
loadBalancerHost: 10.0.0.100
apiServerCertificate: LS0tLS1CRUdJTiBDRVJUSUZJQ0FURS…
ucpDashboard: https://10.0.0.100:6443
Must not be modified using API
The providerStatus object field of the Cluster resource that reflects
the cluster readiness contains the following fields:
persistentVolumesProviderProvisionedStatus of the persistent volumes provisioning. Prevents the Helm releases that require persistent volumes from being installed until some default
StorageClassis added to theClusterobject.
helmDetails about the deployed Helm releases:
readyStatus of the deployed Helm releases. The
truevalue indicates that all Helm releases are deployed successfully.
releasesList of the enabled Helm releases that run on the cluster:
releaseStatusesList of the deployed Helm releases. The
success: truefield indicates that the release is deployed successfully.
stacklightStatus of the StackLight deployment. Contains URLs of all StackLight components. The
success: truefield indicates that StackLight is deployed successfully.
nodesDetails about the cluster nodes:
readyNumber of nodes that completed the deployment or update.
requestedTotal number of nodes. If the number of
readynodes does not match the number ofrequestednodes, it means that a cluster is being currently deployed or updated.
notReadyObjectsThe list of the
services,deployments, andstatefulsetsKubernetes objects that are not in theReadystate yet. Aserviceis not ready if its external address has not been provisioned yet. Adeploymentorstatefulsetis not ready if the number of ready replicas is not equal to the number of desired replicas. Both objects contain the name and namespace of the object and the number of ready and desired replicas (for controllers). If all objects are ready, thenotReadyObjectslist is empty.
Configuration example:
status:
providerStatus:
persistentVolumesProviderProvisioned: true
helm:
ready: true
releases:
releaseStatuses:
iam:
success: true
...
stacklight:
alerta:
url: http://10.0.0.106
alertmanager:
url: http://10.0.0.107
grafana:
url: http://10.0.0.108
kibana:
url: http://10.0.0.109
prometheus:
url: http://10.0.0.110
success: true
nodes:
ready: 3
requested: 3
notReadyObjects:
services:
- name: testservice
namespace: default
deployments:
- name: baremetal-provider
namespace: kaas
replicas: 3
readyReplicas: 2
statefulsets: {}
Must not be modified using API
The oidc section of the providerStatus object field in the Cluster
resource reflects the Open ID Connect configuration details. It contains the
required details to obtain a token for a MOSK cluster and
consists of the following fields:
certificateBase64-encoded OIDC certificate.
clientIdClient ID for OIDC requests.
groupsClaimName of an OIDC groups claim.
issuerUrlIssuer URL to obtain the representation of the realm.
readyOIDC status relevance. If
true, the status corresponds to theLCMClusterOIDC configuration.
Configuration example:
status:
providerStatus:
oidc:
certificate: LS0tLS1CRUdJTiBDRVJUSUZJQ0FURS0tLS0tCk1JSUREekNDQWZ...
clientId: kaas
groupsClaim: iam_roles
issuerUrl: https://10.0.0.117/auth/realms/iam
ready: true
Must not be modified using API
The releaseRefs section of the providerStatus object field in the
Cluster resource provides the current Cluster release version as well as
the one available for upgrade. It contains the following fields:
currentDetails of the currently installed Cluster release:
lcmTypeType of the Cluster release (
ucp).
nameName of the Cluster release resource.
versionVersion of the Cluster release.
unsupportedSinceKaaSVersionIndicates that a Container Cloud release newer than the current one exists and that it does not support the current Cluster release.
availableList of the releases available for upgrade. Contains the
nameandversionfields.
Configuration example:
status:
providerStatus:
releaseRefs:
available:
- name: ucp-5-5-0-3-4-0-dev
version: 5.5.0+3.4.0-dev
current:
lcmType: ucp
name: ucp-5-4-0-3-3-0-beta1
version: 5.4.0+3.3.0-beta1
Machine resource
This section outlines the Machine resource used in MOSK
to describe the machine-level parameters.
For demonstration purposes, the Machine custom resource (CR) is split into
the following major sections:
The Machine CR contains the following fields:
apiVersionAPI version of the object that is
cluster.k8s.io/v1alpha1.
kindObject type that is
Machine.
The metadata object field of the Machine resource contains the
following fields:
nameName of the
Machineobject.
namespaceProject in which the
Machineobject is created.
annotationsKey-value pair to attach arbitrary metadata to the object:
metal3.io/BareMetalHostAnnotation attached to the
Machineobject to reference the correspondingBareMetalHostInventoryobject in the<BareMetalHostProjectName/BareMetalHostName>format.Note
Before update of the management cluster to Container Cloud 2.29.0 (Cluster release 16.4.0), instead of
BareMetalHostInventory, use theBareMetalHostobject. For details, see BareMetalHost resource.Caution
While the Cluster release of the management cluster is 16.4.0,
BareMetalHostInventoryoperations are allowed tom:kaas@management-adminonly. This limitation is lifted once the management cluster is updated to the Cluster release 16.4.1 or later.
labelsKey-value pairs that are attached to the object:
kaas.mirantis.com/providerProvider type that matches the provider type in the
Clusterobject and must bebaremetal.
kaas.mirantis.com/regionRegion name that matches the region name in the
Clusterobject.Note
The
kaas.mirantis.com/regionlabel is removed from all MOSK objects in 24.1. Therefore, do not add the label starting with this release. On existing clusters updated to this release, or if added manually, MOSK ignores this label.
cluster.sigs.k8s.io/cluster-nameCluster name that the
Machineobject is linked to.
cluster.sigs.k8s.io/control-planeFor the control plane role of a machine, this label contains any value, for example,
"true". For the worker role, this label is absent.
Warning
Labels and annotations that are not documented in this API Reference are generated automatically. Do not modify them using the API.
Configuration example:
apiVersion: cluster.k8s.io/v1alpha1
kind: Machine
metadata:
name: example-control-plane
namespace: example-ns
annotations:
metal3.io/BareMetalHost: default/master-0
labels:
kaas.mirantis.com/provider: baremetal
cluster.sigs.k8s.io/cluster-name: example-cluster
cluster.sigs.k8s.io/control-plane: "true" # remove for worker
The spec object field of the Machine object represents
the BareMetalMachineProviderSpec subresource with all required
details to create a bare metal instance. It contains the following fields:
apiVersionAPI version of the object that is
baremetal.k8s.io/v1alpha1.
kindObject type that is
BareMetalMachineProviderSpec.
bareMetalHostProfileConfiguration profile of a bare metal host:
nameName of a bare metal host profile
namespaceProject in which the bare metal host profile is created.
l2TemplateIfMappingOverrideIf specified, overrides the interface mapping value for the corresponding
L2Templateobject.
l2TemplateSelectorOptional. Contains the
name(first priority) orlabelof the L2 template that will be applied during machine creation. Thel2TemplateSelectorfield is copied fromproviderSpecof theMachineobject to theIpamHostobject only once, during machine creation. To modifyl2TemplateSelectorafter creation of theMachineobject, edit theIpamHostobject.
hostSelectorSpecifies the matching criteria for labels on the bare metal hosts. Limits the set of the
BareMetalHostInventoryobjects considered for claiming for theMachineobject. The following selector labels can be added when creating a machine using the Container Cloud web UI:hostlabel.bm.kaas.mirantis.com/controlplanehostlabel.bm.kaas.mirantis.com/workerhostlabel.bm.kaas.mirantis.com/storage
Any custom label that is assigned to one or more bare metal hosts using API can be used as a host selector. If the
BareMetalHostInventoryobjects with the specified label are missing, theMachineobject will not be deployed until at least one bare metal host with the specified label is available.Note
Before update of the management cluster to Container Cloud 2.29.0 (Cluster release 16.4.0), instead of
BareMetalHostInventory, use theBareMetalHostobject. For details, see BareMetalHost resource.Caution
While the Cluster release of the management cluster is 16.4.0,
BareMetalHostInventoryoperations are allowed tom:kaas@management-adminonly. This limitation is lifted once the management cluster is updated to the Cluster release 16.4.1 or later.
nodeLabelsThis field contains the list of node labels to be attached to a node for the user to run certain components on separate cluster nodes. The list of allowed node labels is located in the
Clusterobject statusproviderStatus.releaseRef.current.allowedNodeLabelsfield.If the
valuefield is not defined inallowedNodeLabels, a label can have any value. For example:allowedNodeLabels: - displayName: Stacklight key: stacklight
Before or after a machine deployment, add the required label from the allowed node labels list with the corresponding value to
spec.providerSpec.value.nodeLabelsinmachine.yaml. For example:nodeLabels: - key: stacklight value: enabled
Adding of a node label that is not available in the list of allowed node labels is restricted.
distributionMandatorySpecifies an operating system (OS) distribution ID that is present in the current
ClusterReleaseobject under theAllowedDistributionslist. When specified, theBareMetalHostInventoryobject linked to thisMachineobject will be provisioned using the selected OS distribution instead of the default one.By default,
ubuntu/jammyis installed on greenfield MOSK clusters since MOSK 24.3. The default distribution is marked with the boolean flagdefaultinside one of the elements under theAllowedDistributionslist.The
ubuntu/focaldistribution was deprecated in MOSK 24.3 and only supported for existing MOSK clusters. MOSK 24.3.x release series is the last one to support Ubuntu 20.04 as the host operating system for MOSK clusters.Caution
The outdated
ubuntu/bionicdistribution, which is removed in MOSK 23.3, is only supported for existing clusters based on Ubuntu 18.04.Warning
During the course of the Container Cloud 2.28.x series, Mirantis highly recommends upgrading an operating system on any nodes of all your MOSK cluster machines to Ubuntu 22.04 before the next major Cluster release becomes available.
It is not mandatory to upgrade all machines at once. You can upgrade them one by one or in small batches, for example, if the maintenance window is limited in time.
Otherwise, the Cluster release update of the Ubuntu 20.04-based MOSK clusters will become impossible as of Container Cloud 2.29.0 with Ubuntu 22.04 as the only supported version.
Management cluster update to Container Cloud 2.29.1 will be blocked if at least one node of any related MOSK cluster is running Ubuntu 20.04.
In Container Cloud 2.30.0 (Cluster releases 21.0.0 and 20.0.0), the management cluster is automatically upgraded from Ubuntu 22.04 to 24.04. Upgrade of MOSK clusters to Ubuntu 24.04 will become available in one of the following releases.
maintenanceMaintenance mode of a machine. If enabled, the node of the selected machine is drained, cordoned, and prepared for maintenance operations.
upgradeIndex(optional)Positive numeral value that determines the order of machines upgrade. The first machine to upgrade is always one of the control plane machines with the lowest
upgradeIndex. Other control plane machines are upgraded one by one according to their upgrade indexes.If the
ClusterspecdedicatedControlPlanefield isfalse, worker machines are upgraded only after the upgrade of all control plane machines finishes. Otherwise, they are upgraded after the first control plane machine, concurrently with other control plane machines.If two or more machines have the same value of
upgradeIndex, these machines are equally prioritized during upgrade.
day1Provisioning(optional)Available since Container Cloud 2.30.0 (Cluster releases 21.0.0 and 20.0.0). Controls the workflow during initial machine provisioning. This field allows operators to manually control the start of baremetal host provisioning, enabling hardware verification before deployment. Possible values:
manualDefault. Requires explicit approval before proceeding with provisioning. The machine enters the
AwaitsProvisioningstate and waits for an operator to change this field toautoto start provisioning.
autoEnables provisioning workflow that occurs either automatically from the start or manually after inspection and approval by an operator.
For details on the controlled provisioning workflow, see Controlled bare metal provisioning workflows.
day1Deployment(optional)Available since Container Cloud 2.30.0 (Cluster releases 21.0.0 and 20.0.0). Controls the workflow of initial machine deployment after provisioning completes. This field allows operators to verify disk layout and other system configuration before proceeding with component deployment. Possible values:
manualDefault. Requires an explicit approval before proceeding with deployment. The machine enters the
AwaitsDeploymentstate after provisioning completes and waits for an operator to change this field toautoto start deployment.
autoEnables deployment workflow that occurs either automatically from the start or manually after inspection and approval by an operator.
For details on the controlled deployment workflow, see Controlled bare metal provisioning workflows.
deletionPolicyGenerally available since Container Cloud 2.25.0 (Cluster releases 17.0.0 and 16.0.0). Policy used to identify steps required during a
Machineobject deletion. Supported policies are as follows:gracefulPrepares a machine for deletion by cordoning, draining, and removing from Docker Swarm of the related node. Then deletes Kubernetes objects and associated resources. Can be aborted only before a node is removed from Docker Swarm.
unsafeDefault. Deletes Kubernetes objects and associated resources without any preparations.
forcedDeletes Kubernetes objects and associated resources without any preparations. Removes the
Machineobject even if the cloud provider or LCM Controller gets stuck at some step. May require a manual cleanup of machine resources in case of the controller failure.
For details on the workflow of machine deletion policies, see Overview of machine deletion policies.
Configuration example:
spec:
...
providerSpec:
value:
apiVersion: baremetal.k8s.io/v1alpha1
kind: BareMetalMachineProviderSpec
bareMetalHostProfile:
name: default
namespace: default
l2TemplateIfMappingOverride:
- eno1
- enp0s0
l2TemplateSelector:
label: l2-template1-label-1
hostSelector:
matchLabels:
kaas.mirantis.com/baremetalhost-id: hw-master-0
kind: BareMetalMachineProviderSpec
nodeLabels:
- key: stacklight
value: enabled
distribution: ubuntu/jammy
day1Provisioning: manual # since MCC 2.30 (Cluster releases 21.0.0 and 20.0.0)
day1Deployment: manual # since MCC 2.30 (Cluster releases 21.0.0 and 20.0.0)
delete: false
deletionPolicy: graceful
The status object field of the Machine object represents the
BareMetalMachineProviderStatus subresource that describes the current
bare metal instance state and contains the following fields:
apiVersionAPI version of the object that is
cluster.k8s.io/v1alpha1.
kindObject type that is
BareMetalMachineProviderStatus.
hardwareProvides a machine hardware information:
cpuNumber of CPUs.
ramRAM capacity in GB.
storageList of hard drives mounted on the machine. Contains the disk name and size in GB.
statusRepresents the current status of a machine:
ProvisionA machine is yet to obtain a status
AwaitsProvisioningAvailable since Container Cloud 2.30.0 (Cluster releases 21.0.0 and 20.0.0). A machine has completed bare metal host inspection and is waiting for an approval from an operator to start provisioning. Applies when
day1Provisioningis set tomanualor unset.
UninitializedA machine is yet to obtain the node IP address and host name
PendingA machine is yet to receive the deployment instructions and it is either not booted yet or waits for the LCM controller to be deployed
PrepareA machine is running the
Preparephase during which Docker images and packages are being predownloaded
DeployA machine is processing the LCM Controller instructions
AwaitsDeploymentAvailable since Container Cloud 2.30.0 (Cluster releases 21.0.0 and 20.0.0). A machine has completed provisioning and is waiting for an approval from an operator to start deployment. Applies when
day1Deploymentis set tomanualor unset.
ReconfigureA machine is being updated with a configuration without affecting workloads running on the machine
ReadyA machine is deployed and the supported Mirantis Kubernetes Engine (MKE) version is set
MaintenanceA machine host is cordoned, drained, and prepared for maintenance operations
currentDistributionGenerally available since Container Cloud 2.24.2 (Cluster releases 15.0.1 and 14.0.1). Distribution ID of the current operating system installed on the machine. For example,
ubuntu/jammy.
maintenanceMaintenance mode of a machine. If enabled, the node of the selected machine is drained, cordoned, and prepared for maintenance operations.
rebootAvailable since Container Cloud 2.22.0 (Cluster release 11.6.0). Indicator of a host reboot to complete the Ubuntu operating system updates, if any.
requiredSpecifies whether a host reboot is required. Boolean. If
true, a manual host reboot is required.
reasonSpecifies the package name(s) to apply during a host reboot.
upgradeIndexPositive numeral value that determines the order of machines upgrade. If
upgradeIndexin theMachineobject spec is set, this status value equals the one in the spec. Otherwise, this value displays the automatically generated order of upgrade.
deleteGenerally available since Container Cloud 2.25.0 (Cluster releases 17.0.0 and 16.0.0). Start of a machine deletion or a successful abortion. Boolean.
prepareDeletionPhaseGenerally available since Container Cloud 2.25.0 (Cluster releases 17.0.0 and 16.0.0). Preparation phase for a graceful machine deletion. Possible values are as follows:
startedThe provider controller prepares a machine for deletion by cordoning, draining the machine, and so on.
completedLCM Controller starts removing the machine resources since the preparation for deletion is complete.
abortingThe provider controller attempts to uncordon the node. If the attempt fails, the status changes to
failed.
failedError in the deletion workflow.
For the workflow description of a graceful deletion, see Overview of machine deletion policies.
Configuration example:
status:
providerStatus:
apiVersion: baremetal.k8s.io/v1alpha1
kind: BareMetalMachineProviderStatus
hardware:
cpu: 11
ram: 16
storage:
- name: /dev/vda
size: 61
- name: /dev/vdb
size: 32
- name: /dev/vdc
size: 32
reboot:
required: true
reason: |
linux-image-5.13.0-51-generic
linux-base
status: Ready
upgradeIndex: 1
Cluster lifecycle resources
This section contains descriptions and examples of cluster lifecycle resources for MOSK.
Diagnostic resource
Available since MCC 2.28.0 (Cluster releases 17.3.0 and 16.3.0)
This section describes the Diagnostic custom resource (CR) used in the
management API to trigger self-diagnostics for management or
MOSK clusters.
The Diagnostic CR contains the following fields:
apiVersionAPI version of the object that is
diagnostic.mirantis.com/v1alpha1.
kindObject type that is
Diagnostic.
metadataObject metadata that contains the following fields:
nameName of the
Diagnosticobject.
namespaceNamespace used to create the
Diagnosticobject. Must be equal to the namespace of the target cluster.
specResource specification that contains the following fields:
clusterName of the target cluster to run diagnostics on.
checksReserved for internal usage, any override will be discarded.
statusfinishedAtCompletion timestamp of diagnostics. If the Diagnostic Controller version is outdated, this field is not set and the corresponding error message is displayed in the
errorfield.
errorError that occurs during diagnostics or if the Diagnostic Controller version is outdated. Omitted if empty.
controllerVersionVersion of the controller that launched diagnostics.
resultMap of check statuses where the key is the check name and the value is the result of the corresponding diagnostic check:
descriptionDescription of the check in plain text.
resultResult of diagnostics. Possible values are
PASS,ERROR,FAIL,WARNING,INFO.
messageOptional. Explanation of the check results. It may optionally contain a reference to the documentation describing a known issue related to the check results, including the existing workaround for the issue.
successSuccess status of the check. Boolean.
ticketInfoOptional. Information about the ticket to track the resolution progress of the known issue related to the check results. For example,
FIELD-12345.
The Diagnostic resource example:
apiVersion: diagnostic.mirantis.com/v1alpha1
kind: Diagnostic
metadata:
name: test-diagnostic
namespace: test-namespace
spec:
cluster: test-cluster
status:
finishedAt: 2024-07-01T11:27:14Z
error: ""
controllerVersion: v1.40.11
result:
bm_address_capacity:
description: Baremetal addresses capacity
message: LCM Subnet 'default/k8s-lcm-nics' has 8 allocatable addresses (threshold
is 5) - OK; PXE-NIC Subnet 'default/k8s-pxe-nics' has 7 allocatable addresses
(threshold is 5) - OK; Auto-assignable address pool 'default' from MetallbConfig
'default/kaas-mgmt-metallb' has left 21 available IP addresses (threshold
is 10) - OK
result: INFO
success: true
bm_artifacts_overrides:
description: Baremetal overrides check
message: BM operator has no undesired overrides
result: PASS
success: true
See also
GracefulRebootRequest resource
Available since Container Cloud 2.23.0 (Cluster release 11.7.0)
This section describes the GracefulRebootRequest custom resource (CR) used
in the management API for a rolling reboot of several or all cluster machines
without workloads interruption. The resource is also useful for a bulk reboot
of machines, for example, on large clusters.
The GracefulRebootRequest CR contains the following fields:
apiVersionAPI version of the object that is
kaas.mirantis.com/v1alpha1.
kindObject type that is
GracefulRebootRequest.
metadataMetadata of the
GracefulRebootRequestCR that contains the following fields:nameName of the
GracefulRebootRequestobject. The object name must match the name of the cluster on which you want to reboot machines.
namespaceProject where the
GracefulRebootRequestis created.
specSpecification of the
GracefulRebootRequestCR that contains the following fields:machinesList of machines for a rolling reboot. Each machine of the list is cordoned, drained, rebooted, and uncordoned in the order of cluster upgrade policy. For details about the upgrade order, see Change the upgrade order of a machine.
Leave this field empty to reboot all cluster machines.
Caution
The cluster and machines must have the
Readystatus to perform a graceful reboot.
Configuration example:
apiVersion: kaas.mirantis.com/v1alpha1
kind: GracefulRebootRequest
metadata:
name: demo-cluster
namespace: demo-project
spec:
machines:
- demo-worker-machine-1
- demo-worker-machine-3
ClusterUpdatePlan resource
TechPreview since 24.2 GA since management cluster update to MCC 2.30.0 (20.0.0)
This section describes the ClusterUpdatePlan custom resource (CR) used in
the management API to granularly control update process of a
MOSK cluster by stopping the update after each step.
The ClusterUpdatePlan CR contains the following fields:
apiVersionAPI version of the object that is
kaas.mirantis.com/v1alpha1.
kindObject type that is
ClusterUpdatePlan.
metadataMetadata of the
ClusterUpdatePlanCR that contains the following fields:nameName of the
ClusterUpdatePlanobject.
namespaceProject name of the cluster that relates to
ClusterUpdatePlan.
specSpecification of the
ClusterUpdatePlanCR that contains the following fields:sourceSource name of the Cluster release from which the cluster is updated.
targetTarget name of the Cluster release to which the cluster is updated.
clusterName of the cluster for which
ClusterUpdatePlanis created.
releaseNotesAvailable since Container Cloud 2.29.0 (Cluster release 17.4.0). Link to MOSK release notes of the
targetrelease.
stepsList of update steps, where each step contains the following fields:
idAvailable since Container Cloud 2.28.0 (Cluster release 17.3.0). Step ID.
nameStep name.
descriptionStep description.
constraintsDescription of constraints applied during the step execution.
impactImpact of the step on the cluster functionality and workloads. Contains the following fields:
usersImpact on the user operations. Possible values:
none,major, orminor.
workloadsImpact on workloads. Possible values:
none,major, orminor.
infoAdditional details on impact, if any.
durationDetails about duration of the step execution. Contains the following fields:
estimatedEstimated time to complete the update step.
Note
Before Container Cloud 2.29.0 (Cluster release 17.4.0), this field was named
eta.
infoAdditional details on update duration, if any.
granularityInformation on the current step granularity. Indicates whether the current step is applied to each machine individually or to the entire cluster at once. Possible values are
clusterormachine.
commenceFlag that allows controlling the step execution. Boolean,
falseby default. If set totrue, the step starts execution after all previous steps are completed.Caution
Cancelling an already started update step is unsupported.
statusStatus of the
ClusterUpdatePlanCR that contains the following fields:startedAtTime when
ClusterUpdatePlanhas started.
completedAtAvailable since Container Cloud 2.29.0 (Cluster release 17.4.0). Time of update completion.
statusOverall object status.
stepsList of step statuses in the same order as defined in
spec. Each step status contains the following fields:idAvailable since Container Cloud 2.28.0 (Cluster release 17.3.0). Step ID.
nameStep name.
statusStep status. Possible values are:
NotStartedStep has not started yet.
ScheduledAvailable since Container Cloud 2.28.0 (Cluster release 17.3.0). Step is already triggered but its execution has not started yet.
InProgressStep is currently in progress.
AutoPausedAvailable since Container Cloud 2.29.0 (Cluster release 17.4.0) as Technology Preview. Update is automatically paused by the trigger from a firing alert defined in the
UpdateAutoPauseconfiguration. For details, see UpdateAutoPause resource.
StuckStep execution contains an issue, which also indicates that the step does not fit into the estimate defined in the
durationfield for this step inspec.
CompletedStep has been completed.
messageMessage describing status details of the current update step.
durationCurrent duration of the step execution.
startedAtStart time of the step execution.
Example of a ClusterUpdatePlan object:
apiVersion: kaas.mirantis.com/v1alpha1
kind: ClusterUpdatePlan
metadata:
creationTimestamp: "2025-02-06T16:53:51Z"
generation: 11
name: mosk-17.4.0
namespace: child
resourceVersion: "6072567"
uid: 82c072be-1dc5-43dd-b8cf-bc643206d563
spec:
cluster: mosk
releaseNotes: https://docs.mirantis.com/mosk/latest/25.1-series.html
source: mosk-17-3-0-24-3
steps:
- commence: true
description:
- install new version of OpenStack and Tungsten Fabric life cycle management
modules
- OpenStack and Tungsten Fabric container images pre-cached
- OpenStack and Tungsten Fabric control plane components restarted in parallel
duration:
estimated: 1h30m0s
info:
- 15 minutes to cache the images and update the life cycle management modules
- 1h to restart the components
granularity: cluster
id: openstack
impact:
info:
- some of the running cloud operations may fail due to restart of API services
and schedulers
- DNS might be affected
users: minor
workloads: minor
name: Update OpenStack and Tungsten Fabric
- commence: true
description:
- Ceph version update
- restart Ceph monitor, manager, object gateway (radosgw), and metadata services
- restart OSD services node-by-node, or rack-by-rack depending on the cluster
configuration
duration:
estimated: 8m30s
info:
- 15 minutes for the Ceph version update
- around 40 minutes to update Ceph cluster of 30 nodes
granularity: cluster
id: ceph
impact:
info:
- 'minor unavailability of object storage APIs: S3/Swift'
- workloads may experience IO performance degradation for the virtual storage
devices backed by Ceph
users: minor
workloads: minor
name: Update Ceph
- commence: true
description:
- new host OS kernel and packages get installed
- host OS configuration re-applied
- container runtime version gets bumped
- new versions of Kubernetes components installed
duration:
estimated: 1h40m0s
info:
- about 20 minutes to update host OS per a Kubernetes controller, nodes updated
one-by-one
- Kubernetes components update takes about 40 minutes, all nodes in parallel
granularity: cluster
id: k8s-controllers
impact:
users: none
workloads: none
name: Update host OS and Kubernetes components on master nodes
- commence: true
description:
- new host OS kernel and packages get installed
- host OS configuration re-applied
- container runtime version gets bumped
- new versions of Kubernetes components installed
- data plane components (Open vSwitch and Neutron L3 agents, TF agents and vrouter)
restarted on gateway and compute nodes
- storage nodes put to “no-out” mode to prevent rebalancing
- by default, nodes are updated one-by-one, a node group can be configured to
update several nodes in parallel
duration:
estimated: 8h0m0s
info:
- host OS update - up to 15 minutes per node (not including host OS configuration
modules)
- Kubernetes components update - up to 15 minutes per node
- OpenStack controllers and gateways updated one-by-one
- nodes hosting Ceph OSD, monitor, manager, metadata, object gateway (radosgw)
services updated one-by-one
granularity: machine
id: k8s-workers-vdrok-child-default
impact:
info:
- 'OpenStack controller nodes: some running OpenStack operations might not
complete due to restart of components'
- 'OpenStack compute nodes: minor loss of the East-West connectivity with
the Open vSwitch networking back end that causes approximately 5 min of
downtime'
- 'OpenStack gateway nodes: minor loss of the North-South connectivity with
the Open vSwitch networking back end: a non-distributed HA virtual router
needs up to 1 minute to fail over; a non-distributed and non-HA virtual
router failover time depends on many factors and may take up to 10 minutes'
users: major
workloads: major
name: Update host OS and Kubernetes components on worker nodes, group vdrok-child-default
- commence: true
description:
- restart of StackLight, MetalLB services
- restart of auxiliary controllers and charts
duration:
estimated: 1h30m0s
granularity: cluster
id: mcc-components
impact:
info:
- minor cloud API downtime due restart of MetalLB components
users: minor
workloads: none
name: Auxiliary components update
target: mosk-17-4-0-25-1
status:
completedAt: "2025-02-07T19:24:51Z"
startedAt: "2025-02-07T17:07:02Z"
status: Completed
steps:
- duration: 26m36.355605528s
id: openstack
message: Ready
name: Update OpenStack and Tungsten Fabric
startedAt: "2025-02-07T17:07:02Z"
status: Completed
- duration: 6m1.124356485s
id: ceph
message: Ready
name: Update Ceph
startedAt: "2025-02-07T17:33:38Z"
status: Completed
- duration: 24m3.151554465s
id: k8s-controllers
message: Ready
name: Update host OS and Kubernetes components on master nodes
startedAt: "2025-02-07T17:39:39Z"
status: Completed
- duration: 1h19m9.359184228s
id: k8s-workers-vdrok-child-default
message: Ready
name: Update host OS and Kubernetes components on worker nodes, group vdrok-child-default
startedAt: "2025-02-07T18:03:42Z"
status: Completed
- duration: 2m0.772243006s
id: mcc-components
message: Ready
name: Auxiliary components update
startedAt: "2025-02-07T19:22:51Z"
status: Completed
UpdateGroup resource
Available since Container Cloud 2.27.0 (17.2.0 and 16.2.0)
This section describes the UpdateGroup custom resource (CR) used in the
management API to configure update concurrency for specific sets of machines or
machine pools within a cluster. This resource enhances the update process by
allowing a more granular control over the concurrency of machine updates. This
resource also provides a way to control the reboot behavior of machines during
a Cluster release update.
The UpdateGroup CR contains the following fields:
apiVersionAPI version of the object that is
kaas.mirantis.com/v1alpha1.
kindObject type that is
UpdateGroup.
metadataMetadata of the
UpdateGroupCR that contains the following fields. All of them are required.nameName of the
UpdateGroupobject.
namespaceProject where the
UpdateGroupis created.
labelsLabel to associate the
UpdateGroupwith a specific cluster in thecluster.sigs.k8s.io/cluster-name: <cluster-name>format.
specSpecification of the
UpdateGroupCR that contains the following fields:indexIndex to determine the processing order of the
UpdateGroupobject. Groups with the same index are processed concurrently.The update order of a machine within the same group is determined by the upgrade index of a specific machine. For details, see Change the upgrade order of a machine.
concurrentUpdatesNumber of machines to update concurrently within
UpdateGroup.
rebootIfUpdateRequiresTechnology Preview. Available since Container Cloud 2.28.0 (17.3.0 and 16.3.0). Automatic reboot of controller or worker machines of an update group if a Cluster release update involves node reboot, for example, when kernel version update is available in new Cluster release. You can set this parameter for management or MOSK clusters.
Boolean. By default,
trueon management clusters andfalseon MOSK clusters. On MOSK clusters:If set to
true, related machines are rebooted as part of a Cluster release update that requires a reboot.If set to
false, machines are not rebooted even if a Cluster release update requires a reboot.
Caution
During a distribution upgrade, machines are always rebooted, overriding
rebootIfUpdateRequires: false.
Configuration example:
apiVersion: kaas.mirantis.com/v1alpha1
kind: UpdateGroup
metadata:
name: update-group-example
namespace: my-cluster-ns
labels:
cluster.sigs.k8s.io/cluster-name: my-cluster
spec:
index: 10
concurrentUpdates: 2
rebootIfUpdateRequires: false
UpdateAutoPause resource
Available since Container Cloud 2.29.0 (Cluster release 17.4.0) TechPreview
This section describes the UpdateAutoPause custom resource (CR) used in the
management API to configure automatic pausing of cluster release updates in a
MOSK cluster using StackLight alerts.
The UpdateAutoPause CR contains the following fields:
apiVersionAPI version of the object that is
kaas.mirantis.com/v1alpha1.
kindObject type that is
UpdateAutoPause.
metadataMetadata of the
UpdateAutoPauseCR that contains the following fields:nameName of the
UpdateAutoPauseobject. Must match the cluster name.
namespaceProject where the
UpdateAutoPauseis created. Must match the cluster namespace.
specSpecification of the
UpdateAutoPauseCR that contains the following field:alertsList of alert names. The occurrence of any alert from this list triggers auto-pause of the cluster release update.
statusStatus of the
UpdateAutoPauseCR that contains the following fields:firingAlertsList of currently firing alerts from the specified set.
errorError message, if any, encountered during object processing.
Configuration example:
apiVersion: kaas.mirantis.com/v1alpha1
kind: UpdateAutoPause
metadata:
name: example-cluster
namespace: example-ns
spec:
alerts:
- KubernetesNodeNotReady
- KubernetesContainerOOMKilled
status:
firingAlerts:
- KubernetesNodeNotReady
error: ""
See also
Networking resources
This section contains descriptions and examples of networking custom resources for MOSK.
IPaddr
This section describes the IPaddr resource used in the management API. The
IPAddr object describes an IP address and contains all information about
the associated MAC address.
For demonstration purposes, the IPaddr custom resource (CR) is split into
the following major sections:
The IPaddr CR metadata contains the following fields:
apiVersionAPI version of the object that is
ipam.mirantis.com/v1alpha1.
kindObject type that is
IPaddr.
metadataThe
metadatafield contains the following subfields:nameName of the
IPaddrobject in theauto-XX-XX-XX-XX-XX-XXformat where XX-XX-XX-XX-XX-XX is the associated MAC address.
namespaceProject in which the
IPaddrobject was created.
labelsKey-value pairs that are attached to the object:
ipam/IPIPv4 address
ipam/IpamHostIDUnique ID of the associated
IpamHostobject
ipam/MACMAC address
ipam/SubnetIDUnique ID of the
Subnetobject
ipam/UIDUnique ID of the
IPAddrobject
Warning
Labels and annotations that are not documented in this API Reference are generated automatically. Do not modify them using the API.
Configuration example:
apiVersion: ipam.mirantis.com/v1alpha1
kind: IPaddr
metadata:
name: auto-0c-c4-7a-a8-b8-18
namespace: default
labels:
ipam/IP: 172.16.48.201
ipam/IpamHostID: 848b59cf-f804-11ea-88c8-0242c0a85b02
ipam/MAC: 0C-C4-7A-A8-B8-18
ipam/SubnetID: 572b38de-f803-11ea-88c8-0242c0a85b02
ipam/UID: 84925cac-f804-11ea-88c8-0242c0a85b02
The spec object field of the IPAddr resource contains the associated
MAC address and the reference to the Subnet object:
macMAC address in the
XX:XX:XX:XX:XX:XXformat
subnetRefReference to the
Subnetresource in the<subnetProjectName>/<subnetName>format
Configuration example:
spec:
mac: 0C:C4:7A:A8:B8:18
subnetRef: default/kaas-mgmt
The status object field of the IPAddr resource reflects the actual
state of the IPAddr object. In contains the following fields:
addressIP address.
cidrIPv4 CIDR for the
Subnet.
gatewayGateway address for the
Subnet.
macMAC address in the
XX:XX:XX:XX:XX:XXformat.
nameserversList of the IP addresses of name servers of the
Subnet. Each element of the list is a single address, for example, 172.18.176.6.
stateSince MCC 2.23.0 (11.7.0)Message that reflects the current status of the resource. The list of possible values includes the following:
OK- object is operational.ERR- object is non-operational. This status has a detailed description in themessageslist.TERM- object was deleted and is terminating.
messagesSince MCC 2.23.0 (11.7.0)List of error or warning messages if the object state is
ERR.
objCreatedDate, time, and IPAM version of the resource creation.
objStatusUpdatedDate, time, and IPAM version of the last update of the
statusfield in the resource.
objUpdatedDate, time, and IPAM version of the last resource update.
phaseDeprecated since Container Cloud 2.23.0 (Cluster release 11.7.0) and will be removed in one of the following releases in favor of
state. Possible values:Active,Failed, orTerminating.
Configuration example:
status:
address: 172.16.48.201
cidr: 172.16.48.201/24
gateway: 172.16.48.1
objCreated: 2021-10-21T19:09:32Z by v5.1.0-20210930-121522-f5b2af8
objStatusUpdated: 2021-10-21T19:14:18.748114886Z by v5.1.0-20210930-121522-f5b2af8
objUpdated: 2021-10-21T19:09:32.606968024Z by v5.1.0-20210930-121522-f5b2af8
mac: 0C:C4:7A:A8:B8:18
nameservers:
- 172.18.176.6
state: OK
phase: Active
IpamHost
This section describes the IpamHost resource used in the management API for
MOSK.
The kaas-ipam controller monitors the current state of the bare metal
Machine, verifies whether BareMetalHost is successfully created and
inspection is completed.
Then the kaas-ipam controller fetches the information about the network
interface configuration, creates the IpamHost object, and requests the IP
addresses.
The IpamHost object is created for each Machine and contains
configuration of the host network interfaces and IP address. It also contains
information about associated MAC addresses, BareMetalHost and
Machine objects.
Note
Before update of the management cluster to Container Cloud 2.29.0
(Cluster release 16.4.0), instead of BareMetalHostInventory, use the
BareMetalHost object. For details, see BareMetalHost resource.
Caution
While the Cluster release of the management cluster is 16.4.0,
BareMetalHostInventory operations are allowed to
m:kaas@management-admin only. This limitation is lifted once the
management cluster is updated to the Cluster release 16.4.1 or later.
For demonstration purposes, the IpamHost custom resource (CR) is split into
the following major sections:
The IpamHost CR contains the following fields:
apiVersionAPI version of the object that is
ipam.mirantis.com/v1alpha1
kindObject type that is
IpamHost
metadataThe
metadatafield contains the following subfields:nameName of the
IpamHostobject
namespaceProject in which the
IpamHostobject has been created
labelsKey-value pairs that are attached to the object:
cluster.sigs.k8s.io/cluster-nameReferences the
Clusterobject name thatIpamHostis assigned to
ipam/BMHostIDUnique ID of the associated
BareMetalHostobject
ipam/MAC-XX-XX-XX-XX-XX-XX: "1"Number of NICs of the host that the corresponding MAC address is assigned to
ipam/MachineIDUnique ID of the associated
Machineobject
ipam/UIDUnique ID of the
IpamHostobject
Warning
Labels and annotations that are not documented in this API Reference are generated automatically. Do not modify them using the API.
Configuration example:
apiVersion: ipam.mirantis.com/v1alpha1
kind: IpamHost
metadata:
name: master-0
namespace: default
labels:
cluster.sigs.k8s.io/cluster-name: kaas-mgmt
ipam/BMHostID: 57250885-f803-11ea-88c8-0242c0a85b02
ipam/MAC-0C-C4-7A-1E-A9-5C: "1"
ipam/MAC-0C-C4-7A-1E-A9-5D: "1"
ipam/MachineID: 573386ab-f803-11ea-88c8-0242c0a85b02
ipam/UID: 834a2fc0-f804-11ea-88c8-0242c0a85b02
The spec field of the IpamHost resource describes the required state of
the object. It contains the following fields:
nicMACmapRepresents an unordered list of all NICs of the host obtained during the bare metal host inspection. Each NIC entry contains such fields as
name,mac,ip, and so on. Theprimaryfield defines which NIC was used for PXE booting. Only one NIC can be primary. The IP address is not configurable and is provided only for debug purposes.
l2TemplateSelectorOptional. Contains the
name(first priority) orlabelof the L2 template that will be applied during machine creation. Thel2TemplateSelectorfield is copied fromproviderSpecof theMachineobject to theIpamHostobject only once, during machine creation. To modifyl2TemplateSelectorafter creation of theMachineobject, edit theIpamHostobject.
netconfigUpdateModeTechPreviewUpdate mode of network configuration. Possible values:
MANUALDefault, recommended. An operator manually applies new network configuration.
AUTO-UNSAFEUnsafe, not recommended. If new network configuration is rendered by
kaas-ipamsuccessfully, it is applied automatically with no manual approval.
MANUAL-GRACEPERIODInitial value set during the
IpamHostobject creation. If new network configuration is rendered bykaas-ipamsuccessfully, it is applied automatically with no manual approval. This value is implemented for automatic changes in theIpamHostobject during the host provisioning and deployment. The value is changed automatically toMANUALin three hours after theIpamHostobject creation.
netconfigUpdateAllowTechPreviewManual approval of network changes. Possible values:
trueorfalse. Set totrueto approve the Netplan configuration file candidate (stored innetconfigCandidate) and copy its contents to the effective Netplan configuration file list (stored innetconfigFiles). After that, its value is automatically switched back tofalse.Note
This value has effect only if
netconfigUpdateModeis set toMANUAL.Set to
trueonly ifstatus.netconfigCandidateStateof network configuration candidate isOK.Caution
The following fields of the
ipamHoststatus are renamed since MOSK 23.1 in the scope of theL2TemplateandIpamHostobjects refactoring:netconfigV2tonetconfigCandidatenetconfigV2statetonetconfigCandidateStatenetconfigFilesStatetonetconfigFilesStates(per file)
No user actions are required after renaming.
The format of
netconfigFilesStatechanged after renaming. ThenetconfigFilesStatesfield contains a dictionary of statuses of network configuration files stored innetconfigFiles. The dictionary contains the keys that are file paths and values that have the same meaning for each file thatnetconfigFilesStatehad:For a successfully rendered configuration file:
OK: <timestamp> <sha256-hash-of-rendered-file>, where a timestamp is in the RFC 3339 format.For a failed rendering:
ERR: <error-message>.
Configuration example:
spec:
nicMACmap:
- mac: 0c:c4:7a:1e:a9:5c
name: ens11f0
- ip: 172.16.48.157
mac: 0c:c4:7a:1e:a9:5d
name: ens11f1
primary: true
l2TemplateSelector:
label:xxx
netconfigUpdateMode: manual
netconfigUpdateAllow: false
Caution
The following fields of the ipamHost status are renamed since
MOSK 23.1 in the scope of the L2Template and IpamHost objects
refactoring:
netconfigV2tonetconfigCandidatenetconfigV2statetonetconfigCandidateStatenetconfigFilesStatetonetconfigFilesStates(per file)
No user actions are required after renaming.
The format of netconfigFilesState changed after renaming. The
netconfigFilesStates field contains a dictionary of statuses of network
configuration files stored in netconfigFiles. The dictionary contains
the keys that are file paths and values that have the same meaning for each
file that netconfigFilesState had:
For a successfully rendered configuration file:
OK: <timestamp> <sha256-hash-of-rendered-file>, where a timestamp is in the RFC 3339 format.For a failed rendering:
ERR: <error-message>.
The status field of the IpamHost resource describes the current state
of the object. It contains the following fields:
netconfigCandidateCandidate of the Netplan configuration file in human readable format that is rendered using the corresponding
L2Template. This field contains valid data ifl2RenderResultandnetconfigCandidateStateretain theOKresult.
l2RenderResultDeprecatedStatus of a rendered Netplan configuration candidate stored in
netconfigCandidate. Possible values:For a successful L2 template rendering:
OK: timestamp sha256-hash-of-rendered-netplan, where timestamp is in the RFC 3339 formatFor a failed rendering:
ERR: <error-message>
This field is deprecated and will be removed in one of the following releases. Use
netconfigCandidateStateinstead.
netconfigCandidateStateTechPreviewStatus of a rendered Netplan configuration candidate stored in
netconfigCandidate. Possible values:For a successful L2 template rendering:
OK: timestamp sha256-hash-of-rendered-netplan, where timestamp is in the RFC 3339 formatFor a failed rendering:
ERR: <error-message>
netconfigFilesList of Netplan configuration files rendered using the corresponding
L2Template. It is used to configure host networking during bare metal host provisioning and during Kubernetes node deployment. For details, refer to Workflow of the netplan configuration using an L2 template.Its contents are changed only if rendering of Netplan configuration was successful. So, it always retains the last successfully rendered Netplan configuration. To apply changes in contents, the infrastructure operator approval is required. For details, see Modify network configuration on an existing machine.
Every item in this list contains:
contentThe
base64-encoded Netplan configuration file that was rendered using the correspondingL2Template.
pathThe file path for the Netplan configuration file on the target host.
netconfigFilesStatesStatus of Netplan configuration files stored in
netconfigFiles. Possible values:For a successful L2 template rendering:
OK: timestamp sha256-hash-of-rendered-netplan, where timestamp is in the RFC 3339 formatFor a failed rendering:
ERR: <error-message>
serviceMapDictionary of services and their endpoints (IP address and optional interface name) that have the
ipam/SVC-<serviceName>label. These addresses are added to theServiceMapdictionary during rendering of an L2 template for a givenIpamHost. For details, see Service labels and their life cycle.
stateSince MCC 2.23.0 (11.7.0)Message that reflects the current status of the resource. The list of possible values includes the following:
OK- object is operational.ERR- object is non-operational. This status has a detailed description in themessageslist.TERM- object was deleted and is terminating.
messagesSince MCC 2.23.0 (11.7.0)List of error or warning messages if the object state is
ERR.
objCreatedDate, time, and IPAM version of the resource creation.
objStatusUpdatedDate, time, and IPAM version of the last update of the
statusfield in the resource.
objUpdatedDate, time, and IPAM version of the last resource update.
Configuration example:
status:
l2RenderResult: OK
l2TemplateRef: namespace_name/l2-template-name/1/2589/88865f94-04f0-4226-886b-2640af95a8ab
netconfigFiles:
- content: ...<base64-encoded Netplan configuration file>...
path: /etc/netplan/60-kaas-lcm-netplan.yaml
netconfigFilesStates: /etc/netplan/60-kaas-lcm-netplan.yaml: 'OK: 2023-01-23T09:27:22.71802Z ece7b73808999b540e32ca1720c6b7a6e54c544cc82fa40d7f6b2beadeca0f53'
netconfigCandidate:
...
<Netplan configuration file in plain text, rendered from L2Template>
...
netconfigCandidateState: OK: 2022-06-08T03:18:08.49590Z a4a128bc6069638a37e604f05a5f8345cf6b40e62bce8a96350b5a29bc8bccde\
serviceMap:
ipam/SVC-ceph-cluster:
- ifName: ceph-br2
ipAddress: 10.0.10.11
- ifName: ceph-br1
ipAddress: 10.0.12.22
ipam/SVC-ceph-public:
- ifName: ceph-public
ipAddress: 10.1.1.15
ipam/SVC-k8s-lcm:
- ifName: k8s-lcm
ipAddress: 10.0.1.52
phase: Active
state: OK
objCreated: 2021-10-21T19:09:32Z by v5.1.0-20210930-121522-f5b2af8
objStatusUpdated: 2021-10-21T19:14:18.748114886Z by v5.1.0-20210930-121522-f5b2af8
objUpdated: 2021-10-21T19:09:32.606968024Z by v5.1.0-20210930-121522-f5b2af8
L2Template
This section describes the L2Template resource used in the management API.
By default, MOSK configures a single interface on cluster
nodes, leaving all other physical interfaces intact. With L2Template, you
can create advanced host networking configurations for your clusters. For
example, you can create bond interfaces on top of physical interfaces on the
host.
For demonstration purposes, the L2Template custom resource (CR) is split
into the following major sections:
The metadata section of the L2Template CR contains the following
fields:
apiVersionAPI version of the object that is
ipam.mirantis.com/v1alpha1.
kindObject type that is
L2Template.
metadataThe
metadatafield contains the following subfields:nameName of the
L2Templateobject.
namespaceProject in which the
L2Templateobject was created.
labelsKey-value pairs that are attached to the object:
Caution
All
ipam/*labels, exceptipam/DefaultForCluster, are set automatically and must not be configured manually.cluster.sigs.k8s.io/cluster-nameMandatory for newly created
L2Templatesince Container Cloud 2.25.0 (Cluster releases 17.0.0 and 16.0.0). Reference to theClusterobject name that this template is applied to.The process of selecting the
L2Templateobject for a specific cluster is as follows:The
kaas-ipamcontroller monitors theL2Templateobjects with thecluster.sigs.k8s.io/cluster-name: <clusterName>label.The
L2Templateobject with thecluster.sigs.k8s.io/cluster-name: <clusterName>label is assigned to a cluster withName: <clusterName>, if available.
ipam/PreInstalledL2Template: "1"Is automatically added during a management cluster deployment. Indicates that the current
L2Templateobject was preinstalled. Represents L2 templates that are automatically copied to a project once it is created. Once the L2 templates are copied, theipam/PreInstalledL2Templatelabel is removed.Note
Preinstalled L2 templates are removed in Container Cloud 2.26.0 (Cluster releases 17.1.0 and 16.1.0) along with the
ipam/PreInstalledL2Templatelabel. During cluster update to the mentioned releases, existing preinstalled templates are automatically removed.
ipam/DefaultForClusterThis label is unique per cluster. When you use several L2 templates per cluster, only the first template is automatically labeled as the default one. All consequent templates must be referenced in the configuration files of machines using
L2templateSelector. You can manually configure this label if required.
ipam/UIDUnique ID of an object.
kaas.mirantis.com/providerProvider type.
kaas.mirantis.com/regionRegion name.
Note
The
kaas.mirantis.com/regionlabel is removed from all MOSK objects in 24.1. Therefore, do not add the label starting with this release. On existing clusters updated to this release, or if added manually, MOSK ignores this label.
Warning
Labels and annotations that are not documented in this API Reference are generated automatically. Do not modify them using the API.
Configuration example:
apiVersion: ipam.mirantis.com/v1alpha1
kind: L2Template
metadata:
name: l2template-test
namespace: default
labels:
ipam/DefaultForCluster: "1"
cluster.sigs.k8s.io/cluster-name: test-cluster
kaas.mirantis.com/provider: baremetal
L2 template requirements
An L2 template must have the same project (Kubernetes namespace) as the referenced cluster.
A cluster can be associated with many L2 templates. Only one of them can have the
ipam/DefaultForClusterlabel. Every L2 template that does not have theipam/DefaultForClusterlabel can be later assigned to a particular machine usingl2TemplateSelector.The following rules apply to the default L2 template of a namespace:
Since Container Cloud 2.25.0 (Cluster releases 17.0.0 and 16.0.0), creation of the default L2 template for a namespace is disabled. On existing clusters, the
Spec.clusterRef: defaultparameter of such an L2 template is automatically removed during the migration process. Subsequently, this parameter is not substituted with thecluster.sigs.k8s.io/cluster-namelabel, ensuring the application of the L2 template across the entire Kubernetes namespace. Therefore, you can continue using existing default namespaced L2 templates.Before Container Cloud 2.25.0 (Cluster releases 15.x, 14.x, or earlier), the default
L2Templateobject of a namespace must have theSpec.clusterRef: defaultparameter that is deprecated since 2.25.0.
The spec field of the L2Template resource describes the desired
state of the object. It contains the following fields:
ifMappingList of interface names for the template. The interface mapping is defined globally for all
Machineobjects linked to the template but can be overridden at the host level, if required, by editing theIpamHostobject for a particular host. TheifMappingparameter is mutually exclusive withautoIfMappingPrio.
autoIfMappingPrioList of prefixes, such as
eno,ens, and so on, to match the interfaces to automatically create a list for the template. If you are not aware of any specific ordering of interfaces on the nodes, use the default ordering from Predictable Network Interfaces Names specification for systemd.You can also override the default NIC list per host using the
IfMappingOverrideparameter of the correspondingIpamHost. Theprovisionvalue corresponds to the network interface that was used to provision a node. Usually, it is the first NIC found on a particular node. It is defined explicitly to ensure that this interface will not be reconfigured accidentally.The
autoIfMappingPrioparameter is mutually exclusive withifMapping.
l3LayoutSubnets to be used in the
npTemplatesection. The field contains a list of subnet definitions with parameters used by template macros.subnetNameDefines the alias name of the subnet that can be used to reference this subnet from the template macros. This parameter is mandatory for every entry in the
l3Layoutlist.
subnetPoolUnsupported since 2.28.0 (17.3.0 and 16.3.0)Optional. Default: none. Defines a name of the parent
SubnetPoolobject that will be used to create aSubnetobject with a givensubnetNameandscope. For deprecation details, see SubnetPool resource management.If a corresponding
Subnetobject already exists, nothing will be created and the existing object will be used. If noSubnetPoolis provided, no newSubnetobject will be created.
scopeLogical scope of the
Subnetobject with a correspondingsubnetName. Possible values:global- theSubnetobject is accessible globally, for any project and cluster, for example, the PXE subnet.namespace- theSubnetobject is accessible within the same project where the L2 template is defined.cluster- unsupported since Container Cloud 2.28.0 (Cluster releases 17.3.0 and 16.3.0). TheSubnetobject uses the namespace where the referenced cluster is located. A subnet is only accessible to the cluster thatL2Template.metadata.labels:cluster.sigs.k8s.io/cluster-name(mandatory since MOSK 23.3) orL2Template.spec.clusterRef(deprecated in MOSK 23.3) refers to. TheSubnetobjects with theclusterscope will be created for every new cluster.
Note
Every subnet referenced in an L2 template can have either a global or namespaced scope. In the latter case, the subnet must exist in the same project where the corresponding cluster and L2 template are located.
labelSelectorContains a dictionary of labels and their respective values that will be used to find the matching
Subnetobject. If thelabelSelectorfield is omitted, theSubnetobject will be selected by name, specified by thesubnetNameparameter.Caution
The labels and their values in this section must match the ones added for the corresponding
Subnetobject.
Caution
The
l3Layoutsection is mandatory for eachL2Templatecustom resource.
npTemplateA netplan-compatible configuration with special lookup functions that defines the networking settings for the cluster hosts, where physical NIC names and details are parameterized. This configuration will be processed using Go templates. Instead of specifying IP and MAC addresses, interface names, and other network details specific to a particular host, the template supports use of special lookup functions. These lookup functions, such as
nic,mac,ip, and so on, return host-specific network information when the template is rendered for a particular host.Caution
All rules and restrictions of the netplan configuration also apply to L2 templates. For details, see official netplan documentation.
Caution
Mirantis strongly recommends following the below conventions on network interface naming:
A physical NIC name set by an L2 template must not exceed 15 symbols. Otherwise, an L2 template creation fails. This limit is set by the Linux kernel.
Names of virtual network interfaces such as VLANs, bridges, bonds, veth, and so on must not exceed 15 symbols.
Mirantis recommends setting interfaces names that do not exceed 13 symbols for both physical and virtual interfaces to avoid corner cases and issues in netplan rendering.
The following table describes the main lookup functions for an L2 template.
Lookup function
Description
{{nic N}}Name of a NIC number N. NIC numbers correspond to the interface mapping list. This macro can be used as a key for the elements of the
ethernetsmap, or as the value of thenameandset-nameparameters of a NIC. It is also used to reference the physical NIC from definitions of virtual interfaces (vlan,bridge).{{mac N}}MAC address of a NIC number N registered during a host hardware inspection.
{{ip “N:subnet-a”}}IP address and mask for a NIC number N. The address will be auto-allocated from the given subnet if the address does not exist yet.
{{ip “br0:subnet-x”}}IP address and mask for a virtual interface,
“br0”in this example. The address will be auto-allocated from the given subnet if the address does not exist yet.For virtual interfaces names, an IP address placeholder must contain a human-readable ID that is unique within the L2 template and must have the following format:
{{ip "<shortUniqueHumanReadableID>:<subnetNameFromL3Layout>"}}The
<shortUniqueHumanReadableID>is made equal to a virtual interface name throughout this document and Container Cloud bootstrap templates.{{cidr_from_subnet “subnet-a”}}IPv4 CIDR address from the given subnet.
{{gateway_from_subnet “subnet-a”}}IPv4 default gateway address from the given subnet.
{{nameservers_from_subnet “subnet-a”}}List of the IP addresses of name servers from the given subnet.
{{cluster_api_lb_ip}}Technology Preview since Container Cloud 2.24.4 (Cluster releases 15.0.3 and 14.0.3). IP address for a cluster API load balancer.
clusterRefCaution
Deprecated since Container Cloud 2.25.0 (Cluster releases 17.0.0 and 16.0.0) in favor of the mandatory
cluster.sigs.k8s.io/cluster-namelabel. Will be removed in one of the following releases.On existing clusters, this parameter is automatically migrated to the
cluster.sigs.k8s.io/cluster-namelabel since 2.25.0.If an existing cluster has
clusterRef: defaultset, the migration process involves removing this parameter. Subsequently, it is not substituted with thecluster.sigs.k8s.io/cluster-namelabel, ensuring the application of the L2 template across the entire Kubernetes namespace.The
Clusterobject name that this template is applied to. Thedefaultvalue is used to apply the given template to all clusters within a particular project, unless an L2 template that references a specific cluster name exists. TheclusterReffield has priority over thecluster.sigs.k8s.io/cluster-namelabel:When
clusterRefis set to a non-defaultvalue, thecluster.sigs.k8s.io/cluster-namelabel will be added or updated with that value.When
clusterRefis set todefault, thecluster.sigs.k8s.io/cluster-namelabel will be absent or removed.
Configuration example:
spec:
autoIfMappingPrio:
- provision
- eno
- ens
- enp
l3Layout:
- subnetName: kaas-mgmt
scope: global
labelSelector:
kaas-mgmt-subnet: ""
- subnetName: demo-pods
scope: namespace
- subnetName: demo-ext
scope: namespace
- subnetName: demo-ceph-cluster
scope: namespace
- subnetName: demo-ceph-replication
scope: namespace
npTemplate: |
version: 2
ethernets:
{{nic 1}}:
dhcp4: false
dhcp6: false
addresses:
- {{ip "1:kaas-mgmt"}}
gateway4: {{gateway_from_subnet "kaas-mgmt"}}
nameservers:
addresses: {{nameservers_from_subnet "kaas-mgmt"}}
match:
macaddress: {{mac 1}}
set-name: {{nic 1}}
The status field of the L2Template resource reflects the actual state
of the L2Template object and contains the following fields:
stateSince MCC 2.23.0 (11.7.0)Message that reflects the current status of the resource. The list of possible values includes the following:
OK- object is operational.ERR- object is non-operational. This status has a detailed description in themessageslist.TERM- object was deleted and is terminating.
messagesSince MCC 2.23.0 (11.7.0)List of error or warning messages if the object state is
ERR.
objCreatedDate, time, and IPAM version of the resource creation.
objStatusUpdatedDate, time, and IPAM version of the last update of the
statusfield in the resource.
objUpdatedDate, time, and IPAM version of the last resource update.
phaseDeprecated since Container Cloud 2.23.0 (Cluster release 11.7.0) and will be removed in one of the following releases in favor of
state. Possible values:Active,Failed, orTerminating.
reasonDeprecated since Container Cloud 2.23.0 (Cluster release 11.7.0) and will be removed in one of the following releases in favor of
messages. For the field description, seemessages.
Configuration example:
status:
phase: Failed
state: ERR
messages:
- "ERR: The kaas-mgmt subnet in the terminating state."
objCreated: 2021-10-21T19:09:32Z by v5.1.0-20210930-121522-f5b2af8
objStatusUpdated: 2021-10-21T19:14:18.748114886Z by v5.1.0-20210930-121522-f5b2af8
objUpdated: 2021-10-21T19:09:32.606968024Z by v5.1.0-20210930-121522-f5b2af8
MetalLBConfig
GA since MCC 2.24.0 (14.0.0) for management clusters GA and mandatory for any cluster type after a management cluster upgrade to MCC 2.25.0 (16.0.0)
This section describes the MetalLBConfig custom resource used in the
management API that contains the MetalLB configuration objects for a particular
cluster.
For demonstration purposes, the MetalLBConfig custom resource description
is split into the following major sections:
The management API also uses the third-party open-source MetalLB API. For details, see MetalLB objects.
The MetalLBConfig CR contains the following general fields:
apiVersionAPI version of the object that is
kaas.mirantis.com/v1alpha1.
kindObject type that is
MetalLBConfig.
The metadata object field of the MetalLBConfig resource
contains the following fields:
nameName of the
MetalLBConfigobject.
namespaceProject in which the object was created. Must match the project name of the target cluster.
labelsKey-value pairs attached to the object. Mandatory labels:
kaas.mirantis.com/providerProvider type that is
baremetal.
kaas.mirantis.com/regionRegion name that matches the region name of the target cluster.
Note
The
kaas.mirantis.com/regionlabel is removed from all MOSK objects in 24.1. Therefore, do not add the label starting with this release. On existing clusters updated to this release, or if added manually, MOSK ignores this label.
cluster.sigs.k8s.io/cluster-nameName of the cluster that the MetalLB configuration must apply to.
Warning
Labels and annotations that are not documented in this API Reference are generated automatically. Do not modify them using the API.
Configuration example:
apiVersion: kaas.mirantis.com/v1alpha1
kind: MetalLBConfig
metadata:
name: metallb-demo
namespace: test-ns
labels:
kaas.mirantis.com/provider: baremetal
cluster.sigs.k8s.io/cluster-name: test-cluster
The spec field of the MetalLBConfig object represents the
MetalLBConfigSpec subresource that contains the description of MetalLB
configuration objects.
These objects are created in the target cluster during its deployment.
The spec field contains the following optional fields:
addressPoolsRemoved in Container Cloud 2.27.0 (Cluster releases 17.2.0 and 16.2.0), deprecated in 2.26.0 (Cluster releases 17.2.0 and 16.2.0).
List of
MetalLBAddressPoolobjects to create MetalLBAddressPoolobjects.
bfdProfilesList of
MetalLBBFDProfileobjects to create MetalLBBFDProfileobjects.
bgpAdvertisementsList of
MetalLBBGPAdvertisementobjects to create MetalLBBGPAdvertisementobjects.
bgpPeersList of
MetalLBBGPPeerobjects to create MetalLBBGPPeerobjects.
communitiesList of
MetalLBCommunityobjects to create MetalLBCommunityobjects.
ipAddressPoolsList of
MetalLBIPAddressPoolobjects to create MetalLBIPAddressPoolobjects.
l2AdvertisementsList of
MetalLBL2Advertisementobjects to create MetalLBL2Advertisementobjects.The
l2Advertisementsobject allows defining interfaces to optimize the announcement. When you use theinterfacesselector, LB addresses are announced only on selected host interfaces.Mirantis recommends using the
interfacesselector if nodes use separate host networks for different types of traffic. The pros of such configuration are as follows: less spam on other interfaces and networks and limited chances to reach IP addresses of load-balanced services from irrelevant interfaces and networks.Caution
Interface names in the
interfaceslist must match those on the corresponding nodes.
templateNameUnsupported since Container Cloud 2.28.0 (17.3.0 and 16.3.0). For details, see Deprecation notes.
Name of the
MetalLBConfigTemplateobject used as a source of MetalLB configuration objects. Mutually exclusive with the fields listed below that will be part of theMetalLBConfigTemplateobject. For details, see MetalLBConfigTemplate.Before Cluster releases 17.2.0 and 16.2.0,
MetalLBConfigTemplateis the default configuration method for MetalLB. Since Cluster releases 17.2.0 and 16.2.0, use theMetalLBConfigobject instead.
The objects listed in the spec field of the MetalLBConfig object, such
as MetalLBIPAddressPool, MetalLBL2Advertisement, and so on, are used as
templates for the MetalLB objects that will be created in the target cluster.
Each of these objects has the following structure:
labelsOptional. Key-value pairs attached to the
metallb.io/<objectName>object asmetadata.labels.
nameName of the
metallb.io/<objectName>object.
specContents of the
specsection of themetallb.io/<objectName>object. Thespecfield has themetallb.io/<objectName>Spectype. For details, see MetalLB objects.
For example, MetalLBIPAddressPool is a template for the
metallb.io/IPAddressPool object and has the following structure:
labelsOptional. Key-value pairs attached to the
metallb.io/IPAddressPoolobject asmetadata.labels.
nameName of the
metallb.io/IPAddressPoolobject.
specContents of the
specsection of themetallb.io/IPAddressPoolobject. Thespechas themetallb.io/IPAddressPoolSpectype.
MOSK supports the following MetalLB object types of the
metallb.io API group:
|
|
As of v1beta1 and v1beta2 API versions, metadata of MetalLB objects
has a standard format with no specific fields or labels defined for any
particular object:
apiVersionAPI version of the object that can be
metallb.io/v1beta1ormetallb.io/v1beta2.
kindObject type that is one of the
metallb.iotypes listed above. For example,IPAddressPool.
metadataObject metadata that contains the following subfields:
nameName of the object.
namespaceNamespace where the MetalLB components are located. It matches
metallb-systemin MOSK.
labelsOptional. Key-value pairs that are attached to the object. It can be an arbitrary set of labels. No special labels are defined as of
v1beta1andv1beta2API versions.
The MetalLBConfig object contains spec sections of the
metallb.io/<objectName> objects that have the
metallb.io/<objectName>Spec type. For metallb.io/<objectName> and
metallb.io/<objectName>Spec types definitions, refer to the official
MetalLB documentation:
Note
Before Container Cloud 2.27.0 (Cluster releases 17.2.0 and 16.2.0),
metallb.io/<objectName> objects v0.13.9 are supported.
The l2Advertisements object allows defining interfaces to optimize
the announcement. When you use the interfaces selector, LB addresses
are announced only on selected host interfaces. Mirantis recommends this
configuration if nodes use separate host networks for different types
of traffic. The pros of such configuration are as follows: less spam on
other interfaces and networks, limited chances to reach services
LB addresses from irrelevant interfaces and networks.
Configuration example:
l2Advertisements: |
- name: management-lcm
spec:
ipAddressPools:
- default
interfaces:
# LB addresses from the "default" address pool will be announced
# on the "k8s-lcm" interface
- k8s-lcm
Caution
Interface names in the interfaces list must match those
on the corresponding nodes.
Available since MCC 2.24.0 (14.0.0) for management clusters
Caution
For MOSK clusters, this field is generally available since 23.3.
The status field describes the actual state of the object.иIt contains
the following fields:
bootstrapModeOnly in MCC 2.24.0Field that appears only during a management cluster bootstrap as
trueand is used internally for bootstrap. Once deployment completes, the value is moved tofalseand is excluded from thestatusoutput.
objectsDescription of MetalLB objects that is used to create MetalLB native objects in the target cluster.
The format of underlying objects is the same as for those in the
specfield, excepttemplateName, which is obsolete since Container Cloud 2.28.0 (Cluster releases 17.3.0 and 16.3.0) and which is not present in this field. Theobjectscontents are rendered from the following locations, with possible modifications for the bootstrap cluster:Since Container Cloud 2.28.0 (Cluster releases 17.3.0 and 16.3.0):
MetalLBConfig.specBefore Container Cloud 2.28.0 (Cluster releases 17.2.0, 16.2.0, or earlier):
MetalLBConfigTemplate.statusof the corresponding template ifMetalLBConfig.spec.templateNameis definedMetalLBConfig.specifMetalLBConfig.spec.templateNameis not defined
propagateResultResult of objects propagation. During objects propagation, native MetalLB objects of the target cluster are created and updated according to the description of the objects present in the
status.objectsfield.This field contains the following information:
messageText message that describes the result of the last attempt of objects propagation. Contains an error message if the last attempt was unsuccessful.
successResult of the last attempt of objects propagation. Boolean.
timeTimestamp of the last attempt of objects propagation. For example,
2023-07-04T00:30:36Z.
If the objects propagation was successful, the MetalLB objects of the target cluster match the ones present in the
status.objectsfield.
updateResultStatus of the MetalLB objects update. Has the same format of subfields that in
propagateResultdescribed above.During objects update, the
status.objectscontents are rendered as described in theobjectsfield definition above.If the objects update was successful, the MetalLB objects description present in
status.objectsis rendered successfully and up to date. This description is used to update MetalLB objects in the target cluster. If the objects update was not successful, MetalLB objects will not be propagated to the target cluster.
Example of configuration template for using L2 announcements:
apiVersion: kaas.mirantis.com/v1alpha1
kind: MetalLBConfig
metadata:
labels:
cluster.sigs.k8s.io/cluster-name: demo-cluster
kaas.mirantis.com/provider: baremetal
name: demo-cluster-l2
namespace: demo-ns
spec:
ipAddressPools:
- name: services
spec:
addresses:
- 10.100.91.151-10.100.91.170
autoAssign: true
avoidBuggyIPs: false
l2Advertisements:
- name: services
spec:
ipAddressPools:
- services
Example of configuration extract for using the interfaces selector, which
enables announcement of LB addresses only on selected host interfaces:
l2Advertisements:
- name: services
spec:
ipAddressPools:
- default
interfaces:
- k8s-lcm
Caution
Interface names in the interfaces list must match the ones
on the corresponding nodes.
After the object is created and processed by the MetalLB Controller, the
status field is added. For example:
status:
objects:
ipAddressPools:
- name: services
spec:
addresses:
- 10.100.100.151-10.100.100.170
autoAssign: true
avoidBuggyIPs: false
l2Advertisements:
- name: services
spec:
ipAddressPools:
- services
propagateResult:
message: Objects were successfully updated
success: true
time: "2023-07-04T14:31:40Z"
updateResult:
message: Objects were successfully read from MetalLB configuration specification
success: true
time: "2023-07-04T14:31:39Z"
Example of native MetalLB objects to be created in the demo-ns/demo-cluster
cluster during deployment:
apiVersion: metallb.io/v1beta1
kind: IPAddressPool
metadata:
name: services
namespace: metallb-system
spec:
addresses:
- 10.100.91.151-10.100.91.170
autoAssign: true
avoidBuggyIPs: false
apiVersion: metallb.io/v1beta1
kind: L2Advertisement
metadata:
name: services
namespace: metallb-system
spec:
ipAddressPools:
- services
Example of configuration template for using BGP announcements:
apiVersion: kaas.mirantis.com/v1alpha1
kind: MetalLBConfig
metadata:
labels:
cluster.sigs.k8s.io/cluster-name: demo-cluster
kaas.mirantis.com/provider: baremetal
name: demo-cluster-bgp
namespace: demo-ns
spec:
bgpPeers:
- name: bgp-peer-rack1
spec:
peerAddress: 10.0.41.1
peerASN: 65013
myASN: 65099
nodeSelectors:
- matchLabels:
rack-id: rack1
- name: bgp-peer-rack2
spec:
peerAddress: 10.0.42.1
peerASN: 65023
myASN: 65099
nodeSelectors:
- matchLabels:
rack-id: rack2
- name: bgp-peer-rack3
spec:
peerAddress: 10.0.43.1
peerASN: 65033
myASN: 65099
nodeSelectors:
- matchLabels:
rack-id: rack3
ipAddressPools:
- name: services
spec:
addresses:
- 10.100.191.151-10.100.191.170
autoAssign: true
avoidBuggyIPs: false
bgpAdvertisements:
- name: services
spec:
ipAddressPools:
- services
MetalLBConfigTemplate
Unsupported since MCC 2.28.0 (17.3.0 and 16.3.0)
Warning
The MetalLBConfigTemplate object may not work as expected
due to its deprecation. For details, see MetalLBConfigTemplate resource management.
Support status of MetalLBConfigTemplate
Container Cloud release |
Cluster release |
Support status |
|---|---|---|
2.29.0 |
17.4.0 and 16.4.0 |
Admission Controller blocks creation of the object |
2.28.0 |
17.3.0 and 16.3.0 |
Unsupported for any cluster type |
2.27.0 |
17.2.0 and 16.2.0 |
Deprecated for any cluster type |
2.25.0 |
17.0.0 and 16.0.0 |
Generally available for MOSK clusters |
2.24.2 |
15.0.1, 14.0.1, 14.0.0 |
Technology Preview for MOSK clusters |
2.24.0 |
14.0.0 |
Generally available for management clusters |
This section describes the MetalLBConfigTemplate custom resource used in
the management API that contains the template for MetalLB configuration for a
particular cluster.
Before Container Cloud 2.27.0 (Cluster releases 17.1.0, 16.1.0, or earlier),
MetalLBConfigTemplate is the default configuration method for MetalLB on
bare metal deployments. This method allows the use of Subnet objects to
define MetalLB IP address pools the same way as they were used before
introducing the MetalLBConfig and MetalLBConfigTemplate objects. Since
Container Cloud 2.27.0 (Cluster releases 17.2.0 and 16.2.0), use the
MetalLBConfig object for this purpose instead.
For demonstration purposes, the MetalLBConfigTemplate custom resource
description is split into the following major sections:
The Container Cloud MetalLBConfigTemplate CR contains the following fields:
apiVersionAPI version of the object that is
ipam.mirantis.com/v1alpha1.
kindObject type that is
MetalLBConfigTemplate.
The metadata object field of the MetalLBConfigTemplate resource
contains the following fields:
nameName of the
MetalLBConfigTemplateobject.
namespaceProject in which the object was created. Must match the project name of the target cluster.
labelsKey-value pairs attached to the object. Mandatory labels:
kaas.mirantis.com/providerProvider type that is
baremetal.
kaas.mirantis.com/regionRegion name that matches the region name of the target cluster.
Note
The
kaas.mirantis.com/regionlabel is removed from all MOSK objects in 24.1. Therefore, do not add the label starting with this release. On existing clusters updated to this release, or if added manually, MOSK ignores this label.
cluster.sigs.k8s.io/cluster-nameName of the cluster that the MetalLB configuration applies to.
Warning
Labels and annotations that are not documented in this API Reference are generated automatically. Do not modify them using the API.
Configuration example:
apiVersion: ipam.mirantis.com/v1alpha1
kind: MetalLBConfigTemplate
metadata:
name: metallb-demo
namespace: test-ns
labels:
kaas.mirantis.com/provider: baremetal
cluster.sigs.k8s.io/cluster-name: test-cluster
The spec field of the MetalLBConfigTemplate object contains the
templates of MetalLB configuration objects and optional auxiliary variables.
MOSK uses these templates to create MetalLB configuration
objects during the cluster deployment.
The spec field contains the following optional fields:
machinesKey-value dictionary to select
IpamHostobjects corresponding to nodes of the target cluster. Keys contain machine aliases used inspec.templates. Values contain theNameLabelsSelectoritems that selectIpamHostby name or by labels. For example:machines: control1: name: mosk-control-uefi-0 worker1: labels: uid: kaas-node-4003a5f6-2667-40e3-aa64-ebe713a8a7ba
This field is required if some IP addresses of nodes are used in
spec.templates.
varsKey-value dictionary of arbitrary user-defined variables that are used in
spec.templates. For example:vars: localPort: 4561
templatesList of templates for MetalLB configuration objects that are used to render MetalLB configuration definitions and create MetalLB objects in the target cluster. Contains the following optional fields:
bfdProfilesTemplate for the
MetalLBBFDProfileobject list to create MetalLBBFDProfileobjects.
bgpAdvertisementsTemplate for the
MetalLBBGPAdvertisementobject list to create MetalLBBGPAdvertisementobjects.
bgpPeersTemplate for the
MetalLBBGPPeerobject list to create MetalLBBGPPeerobjects.
communitiesTemplate for the
MetalLBCommunityobject list to create MetalLBCommunityobjects.
ipAddressPoolsTemplate for the
MetalLBIPAddressPoolobject list to create MetalLBIPAddressPoolobjects.
l2AdvertisementsTemplate for the
MetalLBL2Advertisementobject list to create MetalLBL2Advertisementobjects.
Each template is a string and has the same structure as the list of the corresponding objects described in MetalLBConfig spec such as
MetalLBIPAddressPoolandMetalLBL2Advertisement, but you can use additional functions and variables inside these templates.Note
When using the
MetalLBConfigTemplateobject, you can define MetalLB IP address pools using bothSubnetobjects andspec.ipAddressPoolstemplates. IP address pools rendered from these sources will be concatenated and then written tostatus.renderedObjects.ipAddressPools.You can use the following functions in templates:
ipAddressPoolNamesSelects all IP address pools of the given announcement type found for the target cluster. Possible types:
layer2,bgp,any.The
anytype includes all IP address pools found for the target cluster. The announcement types of IP address pools are verified using themetallb/address-pool-protocollabels of the correspondingSubnetobject.The
ipAddressPoolstemplates have no types as native MetalLBIPAddressPoolobjects have no announcement type.The
l2Advertisementstemplate can refer to IP address pools of thelayer2oranytype.The
bgpAdvertisementstemplate can refer to IP address pools of thebgporanytype.IP address pools are searched in the
templates.ipAddressPoolsfield and in theSubnetobjects of the target cluster. For example:l2Advertisements: | - name: l2services spec: ipAddressPools: {{ipAddressPoolNames "layer2"}} bgpAdvertisements: | - name: l3services spec: ipAddressPools: {{ipAddressPoolNames "bgp"}} l2Advertisements: | - name: any spec: ipAddressPools: {{ipAddressPoolNames "any"}} bgpAdvertisements: | - name: any spec: ipAddressPools: {{ipAddressPoolNames "any"}}
The
l2Advertisementsobject allows defining interfaces to optimize the announcement. When you use theinterfacesselector, LB addresses are announced only on selected host interfaces. Mirantis recommends this configuration if nodes use separate host networks for different types of traffic. The pros of such configuration are as follows: less spam on other interfaces and networks, limited chances to reach services LB addresses from irrelevant interfaces and networks.Configuration example:
l2Advertisements: | - name: management-lcm spec: ipAddressPools: - default interfaces: # LB addresses from the "default" address pool will be announced # on the "k8s-lcm" interface - k8s-lcm
Caution
Interface names in the
interfaceslist must match those on the corresponding nodes.
The status field describes the actual state of the object. It contains the
following fields:
renderedObjectsMetalLB objects description rendered from
spec.templatesin the same format as they are defined in the MetalLBConfig spec field.All underlying objects are optional. The following objects can be present:
bfdProfiles,bgpAdvertisements,bgpPeers,communities,ipAddressPools,l2Advertisements.
stateSince MCC 2.23.0 (11.7.0)Message that reflects the current status of the resource. The list of possible values includes the following:
OK- object is operational.ERR- object is non-operational. This status has a detailed description in themessageslist.TERM- object was deleted and is terminating.
messagesSince MCC 2.23.0 (11.7.0)List of error or warning messages if the object state is
ERR.
objCreatedDate, time, and IPAM version of the resource creation.
objStatusUpdatedDate, time, and IPAM version of the last update of the
statusfield in the resource.
objUpdatedDate, time, and IPAM version of the last resource update.
The following examples contain configuration templates that include
MetalLBConfigTemplate.
Configuration example for MetalLBConfig
apiVersion: kaas.mirantis.com/v1alpha1
kind: MetalLBConfig
metadata:
labels:
cluster.sigs.k8s.io/cluster-name: kaas-mgmt
kaas.mirantis.com/provider: baremetal
name: mgmt-l2
namespace: default
spec:
templateName: mgmt-metallb-template
Configuration example for MetalLBConfigTemplate
apiVersion: ipam.mirantis.com/v1alpha1
kind: MetalLBConfigTemplate
metadata:
labels:
cluster.sigs.k8s.io/cluster-name: kaas-mgmt
kaas.mirantis.com/provider: baremetal
name: mgmt-metallb-template
namespace: default
spec:
templates:
l2Advertisements: |
- name: management-lcm
spec:
ipAddressPools:
- default
interfaces:
# IPs from the "default" address pool will be announced on the "k8s-lcm" interface
- k8s-lcm
- name: provision-pxe
spec:
ipAddressPools:
- services-pxe
interfaces:
# IPs from the "services-pxe" address pool will be announced on the "k8s-pxe" interface
- k8s-pxe
Configuration example for Subnet of the default pool
apiVersion: ipam.mirantis.com/v1alpha1
kind: Subnet
metadata:
labels:
cluster.sigs.k8s.io/cluster-name: kaas-mgmt
ipam/SVC-MetalLB: ""
kaas.mirantis.com/provider: baremetal
metallb/address-pool-auto-assign: "true"
metallb/address-pool-name: default
metallb/address-pool-protocol: layer2
name: master-lb-default
namespace: default
spec:
cidr: 10.0.34.0/24
includeRanges:
- 10.0.34.101-10.0.34.120
Configuration example for Subnet of the services-pxe
pool
apiVersion: ipam.mirantis.com/v1alpha1
kind: Subnet
metadata:
labels:
cluster.sigs.k8s.io/cluster-name: kaas-mgmt
ipam/SVC-MetalLB: ""
kaas.mirantis.com/provider: baremetal
metallb/address-pool-auto-assign: "false"
metallb/address-pool-name: services-pxe
metallb/address-pool-protocol: layer2
name: master-lb-pxe
namespace: default
spec:
cidr: 10.0.24.0/24
includeRanges:
- 10.0.24.221-10.0.24.230
After the objects are created and processed by the kaas-ipam Controller,
the status field displays for MetalLBConfigTemplate:
Configuration example of the status field for
MetalLBConfigTemplate
status:
checksums:
annotations: sha256:38e0b9de817f645c4bec37c0d4a3e58baecccb040f5718dc069a72c7385a0bed
labels: sha256:380337902278e8985e816978c349910a4f7ed98169c361eb8777411ac427e6ba
spec: sha256:0860790fc94217598e0775ab2961a02acc4fba820ae17c737b94bb5d55390dbe
messages:
- Template for BFDProfiles is undefined
- Template for BGPAdvertisements is undefined
- Template for BGPPeers is undefined
- Template for Communities is undefined
objCreated: 2023-06-30T21:22:56.00000Z by v6.5.999-20230627-072014-ba8d918
objStatusUpdated: 2023-07-04T00:30:35.82023Z by v6.5.999-20230627-072014-ba8d918
objUpdated: 2023-06-30T22:10:51.73822Z by v6.5.999-20230627-072014-ba8d918
renderedObjects:
ipAddressPools:
- name: default
spec:
addresses:
- 10.0.34.101-10.0.34.120
autoAssign: true
- name: services-pxe
spec:
addresses:
- 10.0.24.221-10.0.24.230
autoAssign: false
l2Advertisements:
- name: management-lcm
spec:
interfaces:
- k8s-lcm
ipAddressPools:
- default
- name: provision-pxe
spec:
interfaces:
- k8s-pxe
ipAddressPools:
- services-pxe
state: OK
The following example illustrates contents of the status field that
displays for MetalLBConfig after the objects are processed
by the MetalLB Controller.
Configuration example of the status field for
MetalLBConfig
status:
objects:
ipAddressPools:
- name: default
spec:
addresses:
- 10.0.34.101-10.0.34.120
autoAssign: true
avoidBuggyIPs: false
- name: services-pxe
spec:
addresses:
- 10.0.24.221-10.0.24.230
autoAssign: false
avoidBuggyIPs: false
l2Advertisements:
- name: management-lcm
spec:
interfaces:
- k8s-lcm
ipAddressPools:
- default
- name: provision-pxe
spec:
interfaces:
- k8s-pxe
ipAddressPools:
- services-pxe
propagateResult:
message: Objects were successfully updated
success: true
time: "2023-07-05T03:10:23Z"
updateResult:
message: Objects were successfully read from MetalLB configuration specification
success: true
time: "2023-07-05T03:10:23Z"
Using the objects described above, several native MetalLB objects are created
in the kaas-mgmt cluster during deployment.
Configuration example of MetalLB objects created during cluster
deployment
apiVersion: metallb.io/v1beta1
kind: L2Advertisement
metadata:
name: management-lcm
namespace: metallb-system
spec:
interfaces:
- k8s-lcm
ipAddressPools:
- default
apiVersion: metallb.io/v1beta1
kind: L2Advertisement
metadata:
name: provision-pxe
namespace: metallb-system
spec:
interfaces:
- k8s-pxe
ipAddressPools:
- services-pxe
apiVersion: metallb.io/v1beta1
kind: IPAddressPool
metadata:
name: default
namespace: metallb-system
spec:
addresses:
- 10.0.34.101-10.0.34.120
autoAssign: true
avoidBuggyIPs: false
apiVersion: metallb.io/v1beta1
kind: IPAddressPool
metadata:
name: services-pxe
namespace: metallb-system
spec:
addresses:
- 10.0.24.221-10.0.24.230
autoAssign: false
avoidBuggyIPs: false
In the following configuration example, MetalLB is configured to use BGP for announcement of external addresses of Kubernetes load-balanced services for the MOSK cluster from master nodes. Each master node is located in its own rack without the L2 layer extension between racks.
This section contains only examples of the objects required to illustrate
the MetalLB configuration. For Rack, MultiRackCluster, L2Template
and other objects required to configure BGP announcement of the cluster API
load balancer address for this scenario, refer to Multiple rack configuration example.
Configuration example for MetalLBConfig
apiVersion: kaas.mirantis.com/v1alpha1
kind: MetalLBConfig
metadata:
labels:
cluster.sigs.k8s.io/cluster-name: test-cluster
kaas.mirantis.com/provider: baremetal
name: test-cluster-metallb-bgp
namespace: test-cluster-ns
spec:
templateName: test-cluster-metallb-bgp-template
Configuration example for MetalLBConfigTemplate
apiVersion: ipam.mirantis.com/v1alpha1
kind: MetalLBConfigTemplate
metadata:
labels:
cluster.sigs.k8s.io/cluster-name: test-cluster
kaas.mirantis.com/provider: baremetal
name: test-cluster-metallb-bgp-template
namespace: test-cluster-ns
spec:
templates:
bgpAdvertisements: |
- name: services
spec:
ipAddressPools:
- services
peers: # "peers" can be omitted if all defined peers
- svc-peer-rack1 # are used in a particular "bgpAdvertisement"
- svc-peer-rack2
- svc-peer-rack3
bgpPeers: |
- name: svc-peer-rack1
spec:
peerAddress: 10.77.41.1 # peer address is in the external subnet #1
peerASN: 65100
myASN: 65101
nodeSelectors:
- matchLabels:
rack-id: rack-master-1 # references the node corresponding
# to the "test-cluster-master-1" Machine
- name: svc-peer-rack2
spec:
peerAddress: 10.77.42.1 # peer address is in the external subnet #2
peerASN: 65100
myASN: 65101
nodeSelectors:
- matchLabels:
rack-id: rack-master-2 # references the node corresponding
# to the "test-cluster-master-2" Machine
- name: svc-peer-rack3
spec:
peerAddress: 10.77.43.1 # peer address is in the external subnet #3
peerASN: 65100
myASN: 65101
nodeSelectors:
- matchLabels:
rack-id: rack-master-3 # references the node corresponding
# to the "test-cluster-master-3" Machine
Configuration example for Subnet
apiVersion: ipam.mirantis.com/v1alpha1
kind: Subnet
metadata:
labels:
cluster.sigs.k8s.io/cluster-name: test-cluster
ipam/SVC-MetalLB: ""
kaas.mirantis.com/provider: baremetal
metallb/address-pool-auto-assign: "true"
metallb/address-pool-name: services
metallb/address-pool-protocol: bgp
name: test-cluster-lb
namespace: test-cluster-ns
spec:
cidr: 134.33.24.0/24
includeRanges:
- 134.33.24.221-134.33.24.240
The following objects illustrate configuration for three subnets that are used to configure external network in three racks. Each master node uses its own external L2/L3 network segment.
Configuration example for the Subnet ext-rack-control-1
apiVersion: ipam.mirantis.com/v1alpha1
kind: Subnet
metadata:
labels:
cluster.sigs.k8s.io/cluster-name: test-cluster
kaas.mirantis.com/provider: baremetal
name: ext-rack-control-1
namespace: test-cluster-ns
spec:
cidr: 10.77.41.0/28
gateway: 10.77.41.1
includeRanges:
- 10.77.41.3-10.77.41.13
nameservers:
- 1.2.3.4
Configuration example for the Subnet ext-rack-control-2
apiVersion: ipam.mirantis.com/v1alpha1
kind: Subnet
metadata:
labels:
cluster.sigs.k8s.io/cluster-name: test-cluster
kaas.mirantis.com/provider: baremetal
name: ext-rack-control-2
namespace: test-cluster-ns
spec:
cidr: 10.77.42.0/28
gateway: 10.77.42.1
includeRanges:
- 10.77.42.3-10.77.42.13
nameservers:
- 1.2.3.4
Configuration example for the Subnet ext-rack-control-3
apiVersion: ipam.mirantis.com/v1alpha1
kind: Subnet
metadata:
labels:
cluster.sigs.k8s.io/cluster-name: test-cluster
kaas.mirantis.com/provider: baremetal
name: ext-rack-control-3
namespace: test-cluster-ns
spec:
cidr: 10.77.43.0/28
gateway: 10.77.43.1
includeRanges:
- 10.77.43.3-10.77.43.13
nameservers:
- 1.2.3.4
Rack objects and ipam/RackRef labels in Machine objects are not
required for MetalLB configuration. But in this example, rack objects
are implied to be used for configuration of BGP announcement of the cluster
API load balancer address. Rack objects are not present in this example.
Machine objects select different L2 templates because each master node uses
different L2/L3 network segments for LCM, external, and other networks.
Configuration example for the Machine
test-cluster-master-1
apiVersion: cluster.k8s.io/v1alpha1
kind: Machine
metadata:
name: test-cluster-master-1
namespace: test-cluster-ns
annotations:
metal3.io/BareMetalHost: test-cluster-ns/test-cluster-master-1
labels:
cluster.sigs.k8s.io/cluster-name: test-cluster
cluster.sigs.k8s.io/control-plane: controlplane
hostlabel.bm.kaas.mirantis.com/controlplane: controlplane
ipam/RackRef: rack-master-1
kaas.mirantis.com/provider: baremetal
spec:
providerSpec:
value:
kind: BareMetalMachineProviderSpec
apiVersion: baremetal.k8s.io/v1alpha1
hostSelector:
matchLabels:
kaas.mirantis.com/baremetalhost-id: test-cluster-master-1
l2TemplateSelector:
name: test-cluster-master-1
nodeLabels:
- key: rack-id # it is used in "nodeSelectors"
value: rack-master-1 # of "bgpPeer" MetalLB objects
Configuration example for the Machine
test-cluster-master-2
apiVersion: cluster.k8s.io/v1alpha1
kind: Machine
metadata:
name: test-cluster-master-2
namespace: test-cluster-ns
annotations:
metal3.io/BareMetalHost: test-cluster-ns/test-cluster-master-2
labels:
cluster.sigs.k8s.io/cluster-name: test-cluster
cluster.sigs.k8s.io/control-plane: controlplane
hostlabel.bm.kaas.mirantis.com/controlplane: controlplane
ipam/RackRef: rack-master-2
kaas.mirantis.com/provider: baremetal
spec:
providerSpec:
value:
kind: BareMetalMachineProviderSpec
apiVersion: baremetal.k8s.io/v1alpha1
hostSelector:
matchLabels:
kaas.mirantis.com/baremetalhost-id: test-cluster-master-2
l2TemplateSelector:
name: test-cluster-master-2
nodeLabels:
- key: rack-id # it is used in "nodeSelectors"
value: rack-master-1 # of "bgpPeer" MetalLB objects
Configuration example for the Machine
test-cluster-master-2
apiVersion: cluster.k8s.io/v1alpha1
kind: Machine
metadata:
name: test-cluster-master-3
namespace: test-cluster-ns
annotations:
metal3.io/BareMetalHost: test-cluster-ns/test-cluster-master-3
labels:
cluster.sigs.k8s.io/cluster-name: test-cluster
cluster.sigs.k8s.io/control-plane: controlplane
hostlabel.bm.kaas.mirantis.com/controlplane: controlplane
ipam/RackRef: rack-master-3
kaas.mirantis.com/provider: baremetal
spec:
providerSpec:
value:
kind: BareMetalMachineProviderSpec
apiVersion: baremetal.k8s.io/v1alpha1
hostSelector:
matchLabels:
kaas.mirantis.com/baremetalhost-id: test-cluster-master-3
l2TemplateSelector:
name: test-cluster-master-3
nodeLabels:
- key: rack-id # it is used in "nodeSelectors"
value: rack-master-3 # of "bgpPeer" MetalLB objects
MultiRackCluster
TechPreview Available since MCC 2.24.4 (15.0.3 and 14.0.3)
This section describes the MultiRackCluster resource used in the management
API.
When you create a cluster with a multi-rack topology, where Kubernetes masters
are distributed across multiple racks without L2 layer extension between them,
the MultiRackCluster resource allows you to set cluster-wide parameters for
configuration of the BGP announcement of the cluster API load balancer address.
In this scenario, the MultiRackCluster object must be bound to the
Cluster object.
The MultiRackCluster object is generally used for a particular cluster
in conjunction with Rack objects described in Rack.
For demonstration purposes, we split the MultiRackCluster custom resource
(CR) description into the following major sections:
The Container Cloud MultiRackCluster CR metadata contains the following
fields:
apiVersionAPI version of the object that is
ipam.mirantis.com/v1alpha1.
kindObject type that is
MultiRackCluster.
metadataThe
metadatafield contains the following subfields:nameName of the
MultiRackClusterobject.
namespaceContainer Cloud project (Kubernetes namespace) in which the object was created.
labelsKey-value pairs that are attached to the object:
cluster.sigs.k8s.io/cluster-nameClusterobject name that thisMultiRackClusterobject is applied to. To enable the use of BGP announcement for the cluster API LB address, set theuseBGPAnnouncementparameter in theClusterobject totrue:spec: providerSpec: value: useBGPAnnouncement: true
kaas.mirantis.com/providerProvider name that is
baremetal.
kaas.mirantis.com/regionRegion name.
Note
The
kaas.mirantis.com/regionlabel is removed from all MOSK objects in 24.1. Therefore, do not add the label starting with this release. On existing clusters updated to this release, or if added manually, MOSK ignores this label.
Warning
Labels and annotations that are not documented in this API Reference are generated automatically. Do not modify them using the API.
The MultiRackCluster metadata configuration example:
apiVersion: ipam.mirantis.com/v1alpha1
kind: MultiRackCluster
metadata:
name: multirack-test-cluster
namespace: test-ns
labels:
cluster.sigs.k8s.io/cluster-name: test-cluster
kaas.mirantis.com/provider: baremetal
The spec field of the MultiRackCluster resource describes the desired
state of the object. It contains the following fields:
bgpdConfigFileNameName of the configuration file for the BGP daemon (bird). Recommended value is
bird.conf.
bgpdConfigFilePathPath to the directory where the configuration file for the BGP daemon (bird) is added. The recommended value is
/etc/bird.
bgpdConfigTemplateOptional. Configuration text file template for the BGP daemon (bird) configuration file where you can use
gotemplate constructs and the following variables:RouterID,LocalIPLocal IP on the given network, which is a key in the
Rack.spec.peeringMapdictionary, for a given node. You can use it, for example, in therouter id {{$.RouterID}};instruction.
LocalASNLocal AS number.
NeighborASNNeighbor AS number.
NeighborIPNeighbor IP address. Its values are taken from
Rack.spec.peeringMap, it can be used only inside therangeiteration through theNeighborslist.
NeighborsList of peers in the given network and node. It can be iterated through the
rangestatement in thegotemplate.
Values for
LocalASNandNeighborASNare taken from:MultiRackCluster.defaultPeer- if not used as a field inside therangeiteration through theNeighborslist.Corresponding values of
Rack.spec.peeringMap- if used as a field inside therangeiteration through theNeighborslist.
This template can be overridden using the
Rackobjects. For details, see Rack spec.
defaultPeerConfiguration parameters for the default BGP peer. These parameters will be used in rendering of the configuration file for BGP daemon from the template if they are not overridden for a particular rack or network using
Rackobjects. For details, see Rack spec.localASNMandatory. Local AS number.
neighborASNMandatory. Neighbor AS number.
neighborIPReserved. Neighbor IP address. Leave it as an empty string.
passwordOptional. Neighbor password. If not set, you can hardcode it in
bgpdConfigTemplate. It is required for MD5 authentication between BGP peers.
Configuration examples:
Since MCC 2.26.0 (17.1.0 and 16.1.0) for bird v2.x
spec:
bgpdConfigFileName: bird.conf
bgpdConfigFilePath: /etc/bird
bgpdConfigTemplate: |
protocol device {
}
#
protocol direct {
interface "lo";
ipv4;
}
#
protocol kernel {
ipv4 {
export all;
};
}
#
{{range $i, $peer := .Neighbors}}
protocol bgp 'bgp_peer_{{$i}}' {
local port 1179 as {{.LocalASN}};
neighbor {{.NeighborIP}} as {{.NeighborASN}};
ipv4 {
import none;
export filter {
if dest = RTD_UNREACHABLE then {
reject;
}
accept;
};
};
}
{{end}}
defaultPeer:
localASN: 65101
neighborASN: 65100
neighborIP: ""
Before MCC 2.26.0 (17.0.0, 16.0.0, or earlier) for bird v1.x
spec:
bgpdConfigFileName: bird.conf
bgpdConfigFilePath: /etc/bird
bgpdConfigTemplate: |
listen bgp port 1179;
protocol device {
}
#
protocol direct {
interface "lo";
}
#
protocol kernel {
export all;
}
#
{{range $i, $peer := .Neighbors}}
protocol bgp 'bgp_peer_{{$i}}' {
local as {{.LocalASN}};
neighbor {{.NeighborIP}} as {{.NeighborASN}};
import all;
export filter {
if dest = RTD_UNREACHABLE then {
reject;
}
accept;
};
}
{{end}}
defaultPeer:
localASN: 65101
neighborASN: 65100
neighborIP: ""
The status field of the MultiRackCluster resource reflects the actual
state of the MultiRackCluster object and contains the following fields:
stateSince MCC 2.23.0 (11.7.0)Message that reflects the current status of the resource. The list of possible values includes the following:
OK- object is operational.ERR- object is non-operational. This status has a detailed description in themessageslist.TERM- object was deleted and is terminating.
messagesSince MCC 2.23.0 (11.7.0)List of error or warning messages if the object state is
ERR.
objCreatedDate, time, and IPAM version of the resource creation.
objStatusUpdatedDate, time, and IPAM version of the last update of the
statusfield in the resource.
objUpdatedDate, time, and IPAM version of the last resource update.
Configuration example:
status:
checksums:
annotations: sha256:38e0b9de817f645c4bec37c0d4a3e58baecccb040f5718dc069a72c7385a0bed
labels: sha256:d8f8eacf487d57c22ca0ace29bd156c66941a373b5e707d671dc151959a64ce7
spec: sha256:66b5d28215bdd36723fe6230359977fbede828906c6ae96b5129a972f1fa51e9
objCreated: 2023-08-11T12:25:21.00000Z by v6.5.999-20230810-155553-2497818
objStatusUpdated: 2023-08-11T12:32:58.11966Z by v6.5.999-20230810-155553-2497818
objUpdated: 2023-08-11T12:32:57.32036Z by v6.5.999-20230810-155553-2497818
state: OK
The following configuration examples of several bare metal objects illustrate how to configure BGP announcement of the load balancer address used to expose the cluster API.
In the following example, all master nodes are in a single rack. One Rack
object is required in this case for master nodes. Some worker nodes can
coexist in the same rack with master nodes or occupy separate racks. It is
implied that the useBGPAnnouncement parameter is set to true in the
corresponding Cluster object.
Configuration example for MultiRackCluster
Since MCC 2.26.0 (Cluster releases 17.1.0 and 16.1.0) bird v2.x:
apiVersion: ipam.mirantis.com/v1alpha1
kind: MultiRackCluster
metadata:
name: multirack-test-cluster
namespace: test-ns
labels:
cluster.sigs.k8s.io/cluster-name: test-cluster
kaas.mirantis.com/provider: baremetal
spec:
bgpdConfigFileName: bird.conf
bgpdConfigFilePath: /etc/bird
bgpdConfigTemplate: |
protocol device {
}
#
protocol direct {
interface "lo";
ipv4;
}
#
protocol kernel {
ipv4 {
export all;
};
}
#
{{range $i, $peer := .Neighbors}}
protocol bgp 'bgp_peer_{{$i}}' {
local port 1179 as {{.LocalASN}};
neighbor {{.NeighborIP}} as {{.NeighborASN}};
ipv4 {
import none;
export filter {
if dest = RTD_UNREACHABLE then {
reject;
}
accept;
};
};
}
{{end}}
defaultPeer:
localASN: 65101
neighborASN: 65100
neighborIP: ""
Before MCC 2.26.0 (Cluster releases 17.0.0, 16.0.0, or earlier) bird
v1.x:
apiVersion: ipam.mirantis.com/v1alpha1
kind: MultiRackCluster
metadata:
name: multirack-test-cluster
namespace: test-ns
labels:
cluster.sigs.k8s.io/cluster-name: test-cluster
kaas.mirantis.com/provider: baremetal
spec:
bgpdConfigFileName: bird.conf
bgpdConfigFilePath: /etc/bird
bgpdConfigTemplate: |
listen bgp port 1179;
protocol device {
}
#
protocol direct {
interface "lo";
}
#
protocol kernel {
export all;
}
#
{{range $i, $peer := .Neighbors}}
protocol bgp 'bgp_peer_{{$i}}' {
local as {{.LocalASN}};
neighbor {{.NeighborIP}} as {{.NeighborASN}};
import all;
export filter {
if dest = RTD_UNREACHABLE then {
reject;
}
accept;
};
}
{{end}}
defaultPeer:
localASN: 65101
neighborASN: 65100
neighborIP: ""
Configuration example for Rack
apiVersion: ipam.mirantis.com/v1alpha1
kind: Rack
metadata:
name: rack-master
namespace: test-ns
labels:
cluster.sigs.k8s.io/cluster-name: test-cluster
kaas.mirantis.com/provider: baremetal
spec:
peeringMap:
lcm-rack-control:
peers:
- neighborIP: 10.77.31.1 # "localASN" and "neighborASN" are taken from
- neighborIP: 10.77.37.1 # "MultiRackCluster.spec.defaultPeer"
# if not set here
Configuration example for Machine
# "Machine" templates for "test-cluster-master-2" and "test-cluster-master-3"
# differ only in BMH selectors in this example.
apiVersion: cluster.k8s.io/v1alpha1
kind: Machine
metadata:
name: test-cluster-master-1
namespace: test-ns
annotations:
metal3.io/BareMetalHost: test-ns/test-cluster-master-1
labels:
cluster.sigs.k8s.io/cluster-name: test-cluster
cluster.sigs.k8s.io/control-plane: controlplane
hostlabel.bm.kaas.mirantis.com/controlplane: controlplane
ipam/RackRef: rack-master # used to connect "IpamHost" to "Rack" objects, so that
# BGP parameters can be obtained from "Rack" to
# render BGP configuration for the given "IpamHost" object
kaas.mirantis.com/provider: baremetal
spec:
providerSpec:
value:
kind: BareMetalMachineProviderSpec
apiVersion: baremetal.k8s.io/v1alpha1
hostSelector:
matchLabels:
kaas.mirantis.com/baremetalhost-id: test-cluster-master-1
l2TemplateSelector:
name: test-cluster-master
Note
Before update of the management cluster to Container Cloud 2.29.0
(Cluster release 16.4.0), instead of BareMetalHostInventory, use the
BareMetalHost object. For details, see BareMetalHost resource.
Caution
While the Cluster release of the management cluster is 16.4.0,
BareMetalHostInventory operations are allowed to
m:kaas@management-admin only. This limitation is lifted once the
management cluster is updated to the Cluster release 16.4.1 or later.
Configuration example for L2Template
apiVersion: ipam.mirantis.com/v1alpha1
kind: L2Template
metadata:
labels:
cluster.sigs.k8s.io/cluster-name: test-cluster
kaas.mirantis.com/provider: baremetal
name: test-cluster-master
namespace: test-ns
spec:
...
l3Layout:
- subnetName: lcm-rack-control # this network is referenced in "rack-master" Rack
scope: namespace
...
npTemplate: |
...
ethernets:
lo:
addresses:
- {{ cluster_api_lb_ip }} # function for cluster API LB IP
dhcp4: false
dhcp6: false
...
After the objects are created and nodes are provisioned, the IpamHost
objects will have BGP daemon configuration files in their status fields.
For example:
Configuration example for IpamHost
apiVersion: ipam.mirantis.com/v1alpha1
kind: IpamHost
...
status:
...
netconfigFiles:
- content: bGlzdGVuIGJncCBwb3J0IDExNzk7CnByb3RvY29sIGRldmljZSB7Cn0KIwpwcm90b2NvbCBkaXJlY3QgewogIGludGVyZmFjZSAibG8iOwp9CiMKcHJvdG9jb2wga2VybmVsIHsKICBleHBvcnQgYWxsOwp9CiMKCnByb3RvY29sIGJncCAnYmdwX3BlZXJfMCcgewogIGxvY2FsIGFzIDY1MTAxOwogIG5laWdoYm9yIDEwLjc3LjMxLjEgYXMgNjUxMDA7CiAgaW1wb3J0IGFsbDsKICBleHBvcnQgZmlsdGVyIHsKICAgIGlmIGRlc3QgPSBSVERfVU5SRUFDSEFCTEUgdGhlbiB7CiAgICAgIHJlamVjdDsKICAgIH0KICAgIGFjY2VwdDsKICB9Owp9Cgpwcm90b2NvbCBiZ3AgJ2JncF9wZWVyXzEnIHsKICBsb2NhbCBhcyA2NTEwMTsKICBuZWlnaGJvciAxMC43Ny4zNy4xIGFzIDY1MTAwOwogIGltcG9ydCBhbGw7CiAgZXhwb3J0IGZpbHRlciB7CiAgICBpZiBkZXN0ID0gUlREX1VOUkVBQ0hBQkxFIHRoZW4gewogICAgICByZWplY3Q7CiAgICB9CiAgICBhY2NlcHQ7CiAgfTsKfQoK
path: /etc/bird/bird.conf
- content: ...
path: /etc/netplan/60-kaas-lcm-netplan.yaml
netconfigFilesStates:
/etc/bird/bird.conf: 'OK: 2023-08-17T08:00:58.96140Z 25cde040e898fd5bf5b28aacb12f046b4adb510570ecf7d7fa5a8467fa4724ec'
/etc/netplan/60-kaas-lcm-netplan.yaml: 'OK: 2023-08-11T12:33:24.54439Z 37ac6e9fe13e5969f35c20c615d96b4ed156341c25e410e95831794128601e01'
...
You can decode /etc/bird/bird.conf contents and verify the configuration:
echo "<<base64-string>>" | base64 -d
The following system output applies to the above configuration examples:
Configuration example for the decoded bird.conf
Since MCC 2.26.0 (Cluster releases 17.1.0 and 16.1.0) bird v2.x:
protocol device {
}
#
protocol direct {
interface "lo";
ipv4;
}
#
protocol kernel {
ipv4 {
export all;
};
}
#
protocol bgp 'bgp_peer_0' {
local port 1179 as 65101;
neighbor 10.77.31.1 as 65100;
ipv4 {
import none;
export filter {
if dest = RTD_UNREACHABLE then {
reject;
}
accept;
};
};
}
protocol bgp 'bgp_peer_1' {
local port 1179 as 65101;
neighbor 10.77.37.1 as 65100;
ipv4 {
import none;
export filter {
if dest = RTD_UNREACHABLE then {
reject;
}
accept;
};
};
}
Before MCC 2.26.0 (Cluster releases 17.0.0, 16.0.0, or earlier) bird
v1.x:
listen bgp port 1179;
protocol device {
}
#
protocol direct {
interface "lo";
}
#
protocol kernel {
export all;
}
#
protocol bgp 'bgp_peer_0' {
local as 65101;
neighbor 10.77.31.1 as 65100;
import all;
export filter {
if dest = RTD_UNREACHABLE then {
reject;
}
accept;
};
}
protocol bgp 'bgp_peer_1' {
local as 65101;
neighbor 10.77.37.1 as 65100;
import all;
export filter {
if dest = RTD_UNREACHABLE then {
reject;
}
accept;
};
}
BGP daemon configuration files are copied from IpamHost.status
to the corresponding LCMMachine object the same way as it is done for
netplan configuration files. Then, the configuration files are written to the
corresponding node by the LCM-Agent.
In the following configuration example, each master node is located in its own
rack. Three Rack objects are required in this case for master nodes.
Some worker nodes can coexist in the same racks with master nodes or occupy
separate racks.
Only objects that are required to show configuration for BGP announcement
of the cluster API load balancer address are provided here.
For the description of Rack, MetalLBConfig,
and other objects that are required for MetalLB configuration in this scenario,
refer to Configuration example for using BGP announcement.
It is implied that the useBGPAnnouncement parameter is set to true
in the corresponding Cluster object.
Configuration example for MultiRackCluster
Since MCC 2.26.0 (Cluster releases 17.1.0 and 16.1.0) bird v2.x:
# It is the same object as in the single rack example.
apiVersion: ipam.mirantis.com/v1alpha1
kind: MultiRackCluster
metadata:
name: multirack-test-cluster
namespace: test-ns
labels:
cluster.sigs.k8s.io/cluster-name: test-cluster
kaas.mirantis.com/provider: baremetal
spec:
bgpdConfigFileName: bird.conf
bgpdConfigFilePath: /etc/bird
bgpdConfigTemplate: |
protocol device {
}
#
protocol direct {
interface "lo";
ipv4;
}
#
protocol kernel {
ipv4 {
export all;
};
}
#
{{range $i, $peer := .Neighbors}}
protocol bgp 'bgp_peer_{{$i}}' {
local port 1179 as {{.LocalASN}};
neighbor {{.NeighborIP}} as {{.NeighborASN}};
ipv4 {
import none;
export filter {
if dest = RTD_UNREACHABLE then {
reject;
}
accept;
};
};
}
{{end}}
defaultPeer:
localASN: 65101
neighborASN: 65100
neighborIP: ""
Before MCC 2.26.0 (Cluster releases 17.0.0, 16.0.0, or earlier) bird
v1.x:
# It is the same object as in the single rack example.
apiVersion: ipam.mirantis.com/v1alpha1
kind: MultiRackCluster
metadata:
name: multirack-test-cluster
namespace: test-ns
labels:
cluster.sigs.k8s.io/cluster-name: test-cluster
kaas.mirantis.com/provider: baremetal
spec:
bgpdConfigFileName: bird.conf
bgpdConfigFilePath: /etc/bird
bgpdConfigTemplate: |
listen bgp port 1179;
protocol device {
}
#
protocol direct {
interface "lo";
}
#
protocol kernel {
export all;
}
#
{{range $i, $peer := .Neighbors}}
protocol bgp 'bgp_peer_{{$i}}' {
local as {{.LocalASN}};
neighbor {{.NeighborIP}} as {{.NeighborASN}};
import all;
export filter {
if dest = RTD_UNREACHABLE then {
reject;
}
accept;
};
}
{{end}}
defaultPeer:
localASN: 65101
neighborASN: 65100
neighborIP: ""
The following Rack objects differ in neighbor IP addresses and in the
network (L3 subnet) used for BGP connection to announce the cluster API LB IP
and for cluster API traffic.
Configuration example for Rack 1
apiVersion: ipam.mirantis.com/v1alpha1
kind: Rack
metadata:
name: rack-master-1
namespace: test-ns
labels:
cluster.sigs.k8s.io/cluster-name: test-cluster
kaas.mirantis.com/provider: baremetal
spec:
peeringMap:
lcm-rack-control-1:
peers:
- neighborIP: 10.77.31.2 # "localASN" and "neighborASN" are taken from
- neighborIP: 10.77.31.3 # "MultiRackCluster.spec.defaultPeer" if
# not set here
Configuration example for Rack 2
apiVersion: ipam.mirantis.com/v1alpha1
kind: Rack
metadata:
name: rack-master-2
namespace: test-ns
labels:
cluster.sigs.k8s.io/cluster-name: test-cluster
kaas.mirantis.com/provider: baremetal
spec:
peeringMap:
lcm-rack-control-2:
peers:
- neighborIP: 10.77.32.2 # "localASN" and "neighborASN" are taken from
- neighborIP: 10.77.32.3 # "MultiRackCluster.spec.defaultPeer" if
# not set here
Configuration example for Rack 3
apiVersion: ipam.mirantis.com/v1alpha1
kind: Rack
metadata:
name: rack-master-3
namespace: test-ns
labels:
cluster.sigs.k8s.io/cluster-name: test-cluster
kaas.mirantis.com/provider: baremetal
spec:
peeringMap:
lcm-rack-control-3:
peers:
- neighborIP: 10.77.33.2 # "localASN" and "neighborASN" are taken from
- neighborIP: 10.77.33.3 # "MultiRackCluster.spec.defaultPeer" if
# not set here
As compared to single rack examples, the following Machine objects differ
in:
BMH selectors
L2Template selectors
Rack selectors (the
ipam/RackReflabel)The
rack-idnode labelsThe labels on master nodes are required for MetalLB node selectors if MetalLB is used to announce LB IP addresses on master nodes. In this scenario, the L2 (ARP) announcement mode cannot be used for MetalLB because master nodes are in different L2 segments. So, the BGP announcement mode must be used for MetalLB. Node selectors are required to properly configure BGP connections from each master node.
Note
Before update of the management cluster to Container Cloud 2.29.0
(Cluster release 16.4.0), instead of BareMetalHostInventory, use the
BareMetalHost object. For details, see BareMetalHost resource.
Caution
While the Cluster release of the management cluster is 16.4.0,
BareMetalHostInventory operations are allowed to
m:kaas@management-admin only. This limitation is lifted once the
management cluster is updated to the Cluster release 16.4.1 or later.
Configuration example for Machine 1
apiVersion: cluster.k8s.io/v1alpha1
kind: Machine
metadata:
name: test-cluster-master-1
namespace: test-ns
annotations:
metal3.io/BareMetalHost: test-ns/test-cluster-master-1
labels:
cluster.sigs.k8s.io/cluster-name: test-cluster
cluster.sigs.k8s.io/control-plane: controlplane
hostlabel.bm.kaas.mirantis.com/controlplane: controlplane
ipam/RackRef: rack-master-1
kaas.mirantis.com/provider: baremetal
spec:
providerSpec:
value:
kind: BareMetalMachineProviderSpec
apiVersion: baremetal.k8s.io/v1alpha1
hostSelector:
matchLabels:
kaas.mirantis.com/baremetalhost-id: test-cluster-master-1
l2TemplateSelector:
name: test-cluster-master-1
nodeLabels: # not used for BGP announcement of the
- key: rack-id # cluster API LB IP but can be used for
value: rack-master-1 # MetalLB if "nodeSelectors" are required
Configuration example for Machine 2
apiVersion: cluster.k8s.io/v1alpha1
kind: Machine
metadata:
name: test-cluster-master-2
namespace: test-ns
annotations:
metal3.io/BareMetalHost: test-ns/test-cluster-master-2
labels:
cluster.sigs.k8s.io/cluster-name: test-cluster
cluster.sigs.k8s.io/control-plane: controlplane
hostlabel.bm.kaas.mirantis.com/controlplane: controlplane
ipam/RackRef: rack-master-2
kaas.mirantis.com/provider: baremetal
spec:
providerSpec:
value:
kind: BareMetalMachineProviderSpec
apiVersion: baremetal.k8s.io/v1alpha1
hostSelector:
matchLabels:
kaas.mirantis.com/baremetalhost-id: test-cluster-master-2
l2TemplateSelector:
name: test-cluster-master-2
nodeLabels: # not used for BGP announcement of the
- key: rack-id # cluster API LB IP but can be used for
value: rack-master-2 # MetalLB if "nodeSelectors" are required
Configuration example for Machine 3
apiVersion: cluster.k8s.io/v1alpha1
kind: Machine
metadata:
name: test-cluster-master-3
namespace: test-ns
annotations:
metal3.io/BareMetalHost: test-ns/test-cluster-master-3
labels:
cluster.sigs.k8s.io/cluster-name: test-cluster
cluster.sigs.k8s.io/control-plane: controlplane
hostlabel.bm.kaas.mirantis.com/controlplane: controlplane
ipam/RackRef: rack-master-3
kaas.mirantis.com/provider: baremetal
spec:
providerSpec:
value:
kind: BareMetalMachineProviderSpec
apiVersion: baremetal.k8s.io/v1alpha1
hostSelector:
matchLabels:
kaas.mirantis.com/baremetalhost-id: test-cluster-master-3
l2TemplateSelector:
name: test-cluster-master-3
nodeLabels: # optional. not used for BGP announcement of
- key: rack-id # the cluster API LB IP but can be used for
value: rack-master-3 # MetalLB if "nodeSelectors" are required
Configuration example for Subnet defining the cluster API
LB IP address
apiVersion: ipam.mirantis.com/v1alpha1
kind: Subnet
metadata:
name: test-cluster-api-lb
namespace: test-ns
labels:
kaas.mirantis.com/provider: baremetal
ipam/SVC-LBhost: "1"
cluster.sigs.k8s.io/cluster-name: test-cluster
spec:
cidr: 134.33.24.201/32
useWholeCidr: true
Configuration example for Subnet of the LCM network in the
rack-master-1 rack
apiVersion: ipam.mirantis.com/v1alpha1
kind: Subnet
metadata:
labels:
cluster.sigs.k8s.io/cluster-name: test-cluster
kaas.mirantis.com/provider: baremetal
name: lcm-rack-control-1
namespace: test-ns
spec:
cidr: 10.77.31.0/28
gateway: 10.77.31.1
includeRanges:
- 10.77.31.4-10.77.31.13
nameservers:
- 1.2.3.4
Configuration example for Subnet of the LCM network in the
rack-master-2 rack
apiVersion: ipam.mirantis.com/v1alpha1
kind: Subnet
metadata:
labels:
cluster.sigs.k8s.io/cluster-name: test-cluster
kaas.mirantis.com/provider: baremetal
name: lcm-rack-control-2
namespace: test-ns
spec:
cidr: 10.77.32.0/28
gateway: 10.77.32.1
includeRanges:
- 10.77.32.4-10.77.32.13
nameservers:
- 1.2.3.4
Configuration example for Subnet of the LCM network in the
rack-master-3 rack
apiVersion: ipam.mirantis.com/v1alpha1
kind: Subnet
metadata:
labels:
cluster.sigs.k8s.io/cluster-name: test-cluster
kaas.mirantis.com/provider: baremetal
name: lcm-rack-control-3
namespace: test-ns
spec:
cidr: 10.77.33.0/28
gateway: 10.77.33.1
includeRanges:
- 10.77.33.4-10.77.33.13
nameservers:
- 1.2.3.4
The following L2Template objects differ in LCM and external subnets that
each master node uses.
Configuration example for L2Template 1
apiVersion: ipam.mirantis.com/v1alpha1
kind: L2Template
metadata:
labels:
cluster.sigs.k8s.io/cluster-name: test-cluster
kaas.mirantis.com/provider: baremetal
name: test-cluster-master-1
namespace: test-ns
spec:
...
l3Layout:
- subnetName: lcm-rack-control-1 # this network is referenced
scope: namespace # in the "rack-master-1" Rack
- subnetName: ext-rack-control-1 # this optional network is used for
scope: namespace # Kubernetes services traffic and
# MetalLB BGP connections
...
npTemplate: |
...
ethernets:
lo:
addresses:
- {{ cluster_api_lb_ip }} # function for cluster API LB IP
dhcp4: false
dhcp6: false
...
Configuration example for L2Template 2
apiVersion: ipam.mirantis.com/v1alpha1
kind: L2Template
metadata:
labels:
cluster.sigs.k8s.io/cluster-name: test-cluster
kaas.mirantis.com/provider: baremetal
name: test-cluster-master-2
namespace: test-ns
spec:
...
l3Layout:
- subnetName: lcm-rack-control-2 # this network is referenced
scope: namespace # in "rack-master-2" Rack
- subnetName: ext-rack-control-2 # this network is used for Kubernetes services
scope: namespace # traffic and MetalLB BGP connections
...
npTemplate: |
...
ethernets:
lo:
addresses:
- {{ cluster_api_lb_ip }} # function for cluster API LB IP
dhcp4: false
dhcp6: false
...
Configuration example for L2Template 3
apiVersion: ipam.mirantis.com/v1alpha1
kind: L2Template
metadata:
labels:
cluster.sigs.k8s.io/cluster-name: test-cluster
kaas.mirantis.com/provider: baremetal
name: test-cluster-master-3
namespace: test-ns
spec:
...
l3Layout:
- subnetName: lcm-rack-control-3 # this network is referenced
scope: namespace # in "rack-master-3" Rack
- subnetName: ext-rack-control-3 # this network is used for Kubernetes services
scope: namespace # traffic and MetalLB BGP connections
...
npTemplate: |
...
ethernets:
lo:
addresses:
- {{ cluster_api_lb_ip }} # function for cluster API LB IP
dhcp4: false
dhcp6: false
...
The following MetalLBConfig example illustrates how node labels are used in
nodeSelectors of bgpPeers. Each of bgpPeers corresponds to one of
master nodes.
Configuration example for MetalLBConfig
apiVersion: ipam.mirantis.com/v1alpha1
kind: MetalLBConfig
metadata:
labels:
cluster.sigs.k8s.io/cluster-name: test-cluster
kaas.mirantis.com/provider: baremetal
name: test-cluster-metallb-config
namespace: test-ns
spec:
...
bgpPeers:
- name: svc-peer-rack1
spec:
holdTime: 0s
keepaliveTime: 0s
peerAddress: 10.77.41.1 # peer address is in external subnet
# instead of LCM subnet used for BGP
# connection to announce cluster API LB IP
peerASN: 65100 # the same as for BGP connection used to announce
# cluster API LB IP
myASN: 65101 # the same as for BGP connection used to announce
# cluster API LB IP
nodeSelectors:
- matchLabels:
rack-id: rack-master-1 # references the node corresponding
# to "test-cluster-master-1" Machine
- name: svc-peer-rack2
spec:
holdTime: 0s
keepaliveTime: 0s
peerAddress: 10.77.42.1
peerASN: 65100
myASN: 65101
nodeSelectors:
- matchLabels:
rack-id: rack-master-1
- name: svc-peer-rack3
spec:
holdTime: 0s
keepaliveTime: 0s
peerAddress: 10.77.43.1
peerASN: 65100
myASN: 65101
nodeSelectors:
- matchLabels:
rack-id: rack-master-1
...
After the objects are created and nodes are provisioned, the IpamHost
objects will have BGP daemon configuration files in their status fields.
Refer to Single rack configuration example on how to verify the BGP configuration
files.
Rack
TechPreview Available since MCC 2.24.4 (Cluster releases 15.0.3 and 14.0.3)
This section describes the Rack resource used in the management API.
When you create a MOSK cluster with a multi-rack topology,
where Kubernetes masters are distributed across multiple racks
without L2 layer extension between them, the Rack resource allows you
to configure BGP announcement of the cluster API load balancer address from
each rack.
In this scenario, Rack objects must be bound to Machine objects
corresponding to master nodes of the cluster. Each Rack object describes
the configuration of the BGP daemon (bird) used to announce the cluster API LB
address from a particular master node (or from several nodes in the same rack).
Rack objects are used for a particular cluster only in conjunction with
the MultiRackCluster object described in MultiRackCluster.
For demonstration purposes, we split the Rack custom resource (CR)
description into the following major sections:
For configuration examples, see MultiRackCluster and Rack usage examples.
The Rack CR metadata contains the following fields:
apiVersionAPI version of the object that is
ipam.mirantis.com/v1alpha1.
kindObject type that is
Rack.
metadataThe
metadatafield contains the following subfields:nameName of the
Rackobject. CorrespondingMachineobjects must have theiripam/RackReflabel value set to the name of theRackobject. This label is required only forMachineobjects of the master nodes that announce the cluster API LB address.
namespaceProject (Kubernetes namespace) where the object was created.
labelsKey-value pairs that are attached to the object:
cluster.sigs.k8s.io/cluster-nameClusterobject name that thisRackobject is applied to.
kaas.mirantis.com/providerProvider name that is
baremetal.
kaas.mirantis.com/regionRegion name.
Note
The
kaas.mirantis.com/regionlabel is removed from all MOSK objects in 24.1. Therefore, do not add the label starting with this release. On existing clusters updated to this release, or if added manually, MOSK ignores this label.
Warning
Labels and annotations that are not documented in this API Reference are generated automatically. Do not modify them using the API.
Rack metadata example:
apiVersion: ipam.mirantis.com/v1alpha1
kind: Rack
metadata:
name: rack-1
namespace: test-ns
labels:
cluster.sigs.k8s.io/cluster-name: test-cluster
kaas.mirantis.com/provider: baremetal
Corresponding Machine metadata example:
apiVersion: cluster.k8s.io/v1alpha1
kind: Machine
metadata:
labels:
cluster.sigs.k8s.io/cluster-name: test-cluster
cluster.sigs.k8s.io/control-plane: controlplane
hostlabel.bm.kaas.mirantis.com/controlplane: controlplane
ipam/RackRef: rack-1
kaas.mirantis.com/provider: baremetal
name: test-master-1-control-efi-6tg52
namespace: test-ns
The spec field of the Rack resource describes the desired
state of the object. It contains the following fields:
bgpdConfigTemplateOptional. Configuration file template that will be used to create configuration file for a BGP daemon on nodes in this rack. If not set, the configuration file template from the corresponding
MultiRackClusterobject is used.
peeringMapStructure that describes general parameters of BGP peers to be used in the configuration file for a BGP daemon for each network where BGP announcement is used. Also, you can define a separate configuration file template for the BGP daemon for each of those networks. The
peeringMapstructure is as follows:peeringMap: <network-name-a>: peers: - localASN: <localASN-1> neighborASN: <neighborASN-1> neighborIP: <neighborIP-1> password: <password-1> - localASN: <localASN-2> neighborASN: <neighborASN-2> neighborIP: <neighborIP-2> password: <password-2> bgpdConfigTemplate: | <configuration file template for a BGP daemon> ...
<network-name-a>Name of the network where a BGP daemon should connect to the neighbor BGP peers. By default, it is implied that the same network is used on the node to make connection to the neighbor BGP peers as well as to receive and respond to the traffic directed to the IP address being advertised. In our scenario, the advertised IP address is the cluster API LB IP address.
This network name must be the same as the subnet name used in the L2 template (
l3Layoutsection) for the corresponding master node(s).
peersOptional. List of dictionaries where each dictionary defines configuration parameters for a particular BGP peer. Peer parameters are as follows:
localASNOptional. Local AS number. If not set, it can be taken from
MultiRackCluster.spec.defaultPeeror can be hardcoded inbgpdConfigTemplate.
neighborASNOptional. Neighbor AS number. If not set, it can be taken from
MultiRackCluster.spec.defaultPeeror can be hardcoded inbgpdConfigTemplate.
neighborIPMandatory. Neighbor IP address.
passwordOptional. Neighbor password. If not set, it can be taken from
MultiRackCluster.spec.defaultPeeror can be hardcoded inbgpdConfigTemplate. It is required when MD5 authentication between BGP peers is used.
bgpdConfigTemplateOptional. Configuration file template that will be used to create the configuration file for the BGP daemon of the
network-name-anetwork on a particular node. If not set,Rack.spec.bgpdConfigTemplateis used.
Configuration example:
Since MCC 2.26.0 (Cluster releases 17.1.0 and 16.1.0) bird
v2.x
spec:
bgpdConfigTemplate: |
protocol device {
}
#
protocol direct {
interface "lo";
ipv4;
}
#
protocol kernel {
ipv4 {
export all;
};
}
#
protocol bgp bgp_lcm {
local port 1179 as {{.LocalASN}};
neighbor {{.NeighborIP}} as {{.NeighborASN}};
ipv4 {
import none;
export filter {
if dest = RTD_UNREACHABLE then {
reject;
}
accept;
};
};
}
peeringMap:
lcm-rack1:
peers:
- localASN: 65050
neighborASN: 65011
neighborIP: 10.77.31.1
Before MCC 2.26.0 (Cluster releases 17.0.0, 16.0.0, or earlier)
bird v1.x
spec:
bgpdConfigTemplate: |
listen bgp port 1179;
protocol device {
}
#
protocol direct {
interface "lo";
}
#
protocol kernel {
export all;
}
#
protocol bgp bgp_lcm {
local as {{.LocalASN}};
neighbor {{.NeighborIP}} as {{.NeighborASN}};
import all;
export filter {
if dest = RTD_UNREACHABLE then {
reject;
}
accept;
};
}
peeringMap:
lcm-rack1:
peers:
- localASN: 65050
neighborASN: 65011
neighborIP: 10.77.31.1
The status field of the Rack resource reflects the actual state of the
Rack object and contains the following fields:
stateSince MCC 2.23.0 (11.7.0)Message that reflects the current status of the resource. The list of possible values includes the following:
OK- object is operational.ERR- object is non-operational. This status has a detailed description in themessageslist.TERM- object was deleted and is terminating.
messagesSince MCC 2.23.0 (11.7.0)List of error or warning messages if the object state is
ERR.
objCreatedDate, time, and IPAM version of the resource creation.
objStatusUpdatedDate, time, and IPAM version of the last update of the
statusfield in the resource.
objUpdatedDate, time, and IPAM version of the last resource update.
Configuration example:
status:
checksums:
annotations: sha256:cd4b751d9773eacbfd5493712db0cbebd6df0762156aefa502d65a9d5e8af31d
labels: sha256:fc2612d12253443955e1bf929f437245d304b483974ff02a165bc5c78363f739
spec: sha256:8f0223b1eefb6a9cd583905a25822fd83ac544e62e1dfef26ee798834ef4c0c1
objCreated: 2023-08-11T12:25:21.00000Z by v6.5.999-20230810-155553-2497818
objStatusUpdated: 2023-08-11T12:33:00.92163Z by v6.5.999-20230810-155553-2497818
objUpdated: 2023-08-11T12:32:59.11951Z by v6.5.999-20230810-155553-2497818
state: OK
Subnet
This section describes the Subnet resource used in the management API to
allocate IP addresses for cluster nodes.
For demonstration purposes, we split the Subnet custom resource (CR) into
the following major sections:
The Subnet CR metadata contains the following fields:
apiVersionAPI version of the object that is
ipam.mirantis.com/v1alpha1.
kindObject type that is
Subnet
metadataThis field contains the following subfields:
nameName of the
Subnetobject.
namespaceProject in which the
Subnetobject was created.
labelsKey-value pairs that are attached to the object:
ipam/DefaultSubnet: "1"Deprecated since MCC 2.14.0 (5.21.0)Indicates that this subnet was automatically created for the PXE network.
ipam/UIDUnique ID of a subnet.
kaas.mirantis.com/providerProvider type.
kaas.mirantis.com/regionRegion name.
Note
The
kaas.mirantis.com/regionlabel is removed from all MOSK objects in 24.1. Therefore, do not add the label starting with this release. On existing clusters updated to this release, or if added manually, MOSK ignores this label.
Warning
Labels and annotations that are not documented in this API Reference are generated automatically. Do not modify them using the API.
Configuration example:
apiVersion: ipam.mirantis.com/v1alpha1
kind: Subnet
metadata:
name: kaas-mgmt
namespace: default
labels:
ipam/UID: 1bae269c-c507-4404-b534-2c135edaebf5
kaas.mirantis.com/provider: baremetal
The spec field of the Subnet resource describes the desired state of
a subnet. It contains the following fields:
cidrA valid IPv4 CIDR, for example,
10.11.0.0/24.
gatewayA valid gateway address, for example,
10.11.0.9.
includeRangesA comma-separated list of IP address ranges within the given CIDR that should be used in the allocation of IPs for nodes. The gateway, network, broadcast, and DNSaddresses will be excluded (protected) automatically if they intersect with one of the range. The IPs outside the given ranges will not be used in the allocation. Each element of the list can be either an interval
10.11.0.5-10.11.0.70or a single address10.11.0.77.Warning
Do not use values that are out of the given CIDR.
excludeRangesA comma-separated list of IP address ranges within the given CIDR that should not be used in the allocation of IPs for nodes. The IPs within the given CIDR but outside the given ranges will be used in the allocation. The gateway, network, broadcast, and DNS addresses will be excluded (protected) automatically if they are included in the CIDR. Each element of the list can be either an interval
10.11.0.5-10.11.0.70or a single address10.11.0.77.Warning
Do not use values that are out of the given CIDR.
useWholeCidrIf set to
false(by default), the subnet address and broadcast address will be excluded from the address allocation. If set totrue, the subnet address and the broadcast address are included into the address allocation for nodes.
nameserversThe list of IP addresses of name servers. Each element of the list is a single address, for example,
172.18.176.6.
Configuration example:
spec:
cidr: 172.16.48.0/24
excludeRanges:
- 172.16.48.99
- 172.16.48.101-172.16.48.145
gateway: 172.16.48.1
nameservers:
- 172.18.176.6
The status field of the Subnet resource describes the actual state of
a subnet. It contains the following fields:
allocatableThe number of IP addresses that are available for allocation.
allocatedIPsThe list of allocated IP addresses in the
IP:<IPAddr object UID>format.
capacityThe total number of IP addresses to be allocated, including the sum of allocatable and already allocated IP addresses.
cidrThe IPv4 CIDR for a subnet.
gatewayThe gateway address for a subnet.
nameserversThe list of IP addresses of name servers.
rangesThe list of IP address ranges within the given CIDR that are used in the allocation of IPs for nodes.
statusMessageDeprecated since Container Cloud 2.23.0 (Cluster release 11.7.0) and will be removed in one of the following releases in favor of
stateandmessages. Since Container Cloud 2.24.0 (Cluster release 14.0.0), this field is not set for subnets of newly created clusters. For the field description, seestate.
stateSince MCC 2.23.0 (11.7.0)Message that reflects the current status of the resource. The list of possible values includes the following:
OK- object is operational.ERR- object is non-operational. This status has a detailed description in themessageslist.TERM- object was deleted and is terminating.
messagesSince MCC 2.23.0 (11.7.0)List of error or warning messages if the object state is
ERR.
objCreatedDate, time, and IPAM version of the resource creation.
objStatusUpdatedDate, time, and IPAM version of the last update of the
statusfield in the resource.
objUpdatedDate, time, and IPAM version of the last resource update.
Configuration example:
status:
allocatable: 51
allocatedIPs:
- 172.16.48.200:24e94698-f726-11ea-a717-0242c0a85b02
- 172.16.48.201:2bb62373-f726-11ea-a717-0242c0a85b02
- 172.16.48.202:37806659-f726-11ea-a717-0242c0a85b02
capacity: 54
cidr: 172.16.48.0/24
gateway: 172.16.48.1
nameservers:
- 172.18.176.6
ranges:
- 172.16.48.200-172.16.48.253
objCreated: 2021-10-21T19:09:32Z by v5.1.0-20210930-121522-f5b2af8
objStatusUpdated: 2021-10-21T19:14:18.748114886Z by v5.1.0-20210930-121522-f5b2af8
objUpdated: 2021-10-21T19:09:32.606968024Z by v5.1.0-20210930-121522-f5b2af8
state: OK
SubnetPool
Unsupported since MCC 2.28.0 (17.3.0 and 16.3.0)
Warning
The SubnetPool object is unsupported since Container Cloud
2.28.0 (Cluster releases 17.3.0 and 16.3.0). For details, see
Deprecation Notes: SubnetPool resource management.
This section describes the SubnetPool resource used in the management API
to manage a pool of addresses from which subnets can be allocated.
For demonstration purposes, the SubnetPool custom resource (CR) can be
split into the following major sections:
The Container Cloud SubnetPool CR contains the following fields:
apiVersionAPI version of the object that is
ipam.mirantis.com/v1alpha1.
kindObject type that is
SubnetPool.
metadataThe
metadatafield contains the following subfields:nameName of the
SubnetPoolobject.
namespaceProject in which the
SubnetPoolobject was created.
labelsKey-value pairs that are attached to the object:
kaas.mirantis.com/providerProvider type that is
baremetal.
kaas.mirantis.com/regionRegion name.
Note
The
kaas.mirantis.com/regionlabel is removed from all MOSK objects in 24.1. Therefore, do not add the label starting with this release. On existing clusters updated to this release, or if added manually, MOSK ignores this label.
Warning
Labels and annotations that are not documented in this API Reference are generated automatically. Do not modify them using the API.
Configuration example:
apiVersion: ipam.mirantis.com/v1alpha1
kind: SubnetPool
metadata:
name: kaas-mgmt
namespace: default
labels:
kaas.mirantis.com/provider: baremetal
The spec field of the SubnetPool resource describes the desired state
of a subnet pool. It contains the following fields:
cidrValid IPv4 CIDR. For example, 10.10.0.0/16.
blockSizeIP address block size to use when assigning an IP address block to every new managed
Subnetobject. For example, if you set/25, every new managedSubnetwill have 128 IPs to allocate. Possible values are from/29to thecidrsize. Immutable.
nameserversOptional. List of IP addresses of name servers to use for every new managed
Subnetobject. Each element of the list is a single address, for example, 172.18.176.6. Default: empty.
gatewayPolicyOptional. Method of assigning a gateway address to new managed
Subnetobjects. Default:none. Possible values are:first- first IP of the IP address block assigned to a managedSubnet, for example, 10.11.10.1.last- last IP of the IP address block assigned to a managedSubnet, for example, 10.11.10.254.none- no gateway address.
Configuration example:
spec:
cidr: 10.10.0.0/16
blockSize: /25
nameservers:
- 172.18.176.6
gatewayPolicy: first
The status field of the SubnetPool resource describes the actual state
of a subnet pool. It contains the following fields:
allocatedSubnetsList of allocated subnets. Each subnet has the
<CIDR>:<SUBNET_UID>format.
blockSizeBlock size to use for IP address assignments from the defined pool.
capacityTotal number of IP addresses to be allocated. Includes the number of allocatable and already allocated IP addresses.
allocatableNumber of subnets with the
blockSizesize that are available for allocation.
stateSince MCC 2.23.0 (11.7.0)Message that reflects the current status of the resource. The list of possible values includes the following:
OK- object is operational.ERR- object is non-operational. This status has a detailed description in themessageslist.TERM- object was deleted and is terminating.
messagesSince MCC 2.23.0 (11.7.0)List of error or warning messages if the object state is
ERR.
objCreatedDate, time, and IPAM version of the resource creation.
objStatusUpdatedDate, time, and IPAM version of the last update of the
statusfield in the resource.
objUpdatedDate, time, and IPAM version of the last resource update.
Example:
status:
allocatedSubnets:
- 10.10.0.0/24:0272bfa9-19de-11eb-b591-0242ac110002
blockSize: /24
capacity: 54
allocatable: 51
objCreated: 2021-10-21T19:09:32Z by v5.1.0-20210930-121522-f5b2af8
objStatusUpdated: 2021-10-21T19:14:18.748114886Z by v5.1.0-20210930-121522-f5b2af8
objUpdated: 2021-10-21T19:09:32.606968024Z by v5.1.0-20210930-121522-f5b2af8
state: OK
Network infrastructure monitoring resources
Available since MCC 2.30.0 (21.0.0 and 20.0.0)
This section contains descriptions and examples of network infrastructure monitoring custom resources for MOSK.
InfraConnectivityMonitor
Available since MCC 2.30.0 (21.0.0 and 20.0.0)
This section describes the InfraConnectivityMonitor custom resource (CR)
used in the management API. It contains all necessary information to enable
network connectivity monitoring for the target cluster.
Note
This object must be created and managed on the management cluster.
For demonstration purposes, the InfraConnectivityMonitor CR is split into
the following sections:
The InfraConnectivityMonitor CR metadata contains the following fields:
apiVersionAPI version of the object that is
kaas.mirantis.com/v1alpha1.
kindObject type that is
InfraConnectivityMonitor.
metadataObject metadata that contains the following subfields:
nameObject name.
namespaceProject in which the
InfraConnectivityMonitorobject is created.
Metadata example:
apiVersion: kaas.mirantis.com/v1alpha1
kind: InfraConnectivityMonitor
metadata:
name: icm-sample
namespace: default
The spec object field contains configuration for a
InfraConnectivityMonitor object and has the following fields:
targetClusterRequired. Name of the cluster on which network connectivity monitoring must be enabled. By default, connectivity monitoring is enabled for all cluster machines.
machineSelectorOptional. A set of
Machineobjects to include for connectivity monitoring. Machines that do not match this selector will be excluded.
InfraConnectivityMonitor configuration example:
spec:
machineSelector:
matchLabels:
label-name: "label-value"
targetCluster: managed-cluster
The status field of the InfraConnectivityMonitor object contains the
current state of the object:
inventoryConfigStatusStatus of the
CheckerInventoryConfigobject from the target cluster. For object description, see CheckerInventoryConfig. This status is periodically synced by the NetChecker controller.nodesList of nodes with a detailed inventory status for each node. Contains the following fields:
errorDescription of the node issues, if any. Otherwise, the field is omitted.
machineNameName of the target machine.
nodeNameName of the corresponding Kubernetes node.
statusNode status:
ok- node does not have any issues.error- node has issues described in theerrorfield. May also contain description of the reason why the node is excluded from connectivity monitoring.
statusMsgOverall status message of the
CheckerInventoryConfigobject.
targetsConfigStatusStatus of the
NetCheckerTargetsConfigobject from the target cluster. For object description, see NetCheckerTargetsConfig. This status is periodically synced bynetchecker-controller. Contains the following fields:nodesList of nodes with detailed status of targets for each node. Contains the following fields:
errorDescription of the node issues, if any. Otherwise, the field is omitted.
machineNameName of the target machine.
nodeNameCorresponding name of the Kubernetes node.
statusNode status:
ok- node does not have any issues.error- node has issues described in theerrorfield.
targetsCountAmount of targets (nodes and subnets) for a particular node.
statusMsgOverall status message of the
NetCheckerTargetsConfigobject.
InfraConnectivityMonitor status example:
status:
inventoryConfigStatus:
nodes:
- machineName: master-0
nodeName: master-0
status: ok
- machineName: master-1
nodeName: master-1
status: ok
- machineName: master-2
nodeName: master-2
status: ok
statusMsg: ok
targetsConfigStatus:
nodes:
- machineName: master-0
nodeName: master-0
status: ok
targetsCount: "4"
- machineName: master-1
nodeName: master-1
status: ok
targetsCount: "4"
- machineName: master-2
nodeName: master-2
status: ok
targetsCount: "4"
statusMsg: ok
CheckerInventoryConfig
Available since MCC 2.30.0 (21.0.0 and 20.0.0)
This section describes the CheckerInventoryConfig custom resource (CR) used
in the network connectivity monitoring API on a target cluster. The
CheckerInventoryConfig object is automatically created and managed by
netchecker-controller on the target cluster in the netchecker
namespace. The name of the object is hardcoded to
mcc-netchecker-inventory-config.
Warning
Do not manually create or delete the
CheckerInventoryConfig object to prevent overwriting by
netchecker-controller. You can only reconfigure the existing object if
you enable manual configuration as described in Manual configuration of network infrastructure monitoring.
The purpose of the CheckerInventoryConfig object is to include information
about cluster nodes and that subnets are present on these nodes. The object
status provides information about IP addresses related to each subnet detected
on the node including error messages, if any. For more details, see Infrastructure connectivity monitoring.
For demonstration purposes, the CheckerInventoryConfig CR is split into the
following sections:
The CheckerInventoryConfig CR metadata contains the following fields:
apiVersionAPI version of the object that is
cnnc.mirantis.com/v1alpha1.
kindObject type that is
CheckerInventoryConfig.
metadataObject metadata that contains the following subfields:
nameObject name.
namespaceProject in which the
CheckerInventoryConfigobject is created.
Metadata example:
apiVersion: cnnc.mirantis.com/v1alpha1
kind: CheckerInventoryConfig
metadata:
name: cic-sample
namespace: default
The spec object field contains configuration for a
CheckerInventoryConfig object and has the following fields:
subnetsConfigList of subnets with their ranges that are part of network connectivity monitoring. Contains the following fields:
nameSubnet name or namespaced name.
tagOptional subnet tag to be set by the operator. By default, equals to the subnet name.
rangeList of subnet ranges.
nodesConfigList of nodes with expected subnets containing IP addresses to be present on each node. Contains the following fields:
nodeNameName of the node.
nodeSelectorSelector for the cluster nodes.
expectedSubnetTagsList of subnets containing IP addresses to be present on the node.
CheckerInventoryConfig configuration example:
spec:
nodesConfig:
- expectedSubnetTags:
- default/k8s-lcm-nics
- default/k8s-pxe-nics
nodeName: master-0
- expectedSubnetTags:
- default/k8s-lcm-nics
- default/k8s-pxe-nics
nodeName: master-1
- expectedSubnetTags:
- default/k8s-lcm-nics
- default/k8s-pxe-nics
nodeName: master-2
subnetsConfig:
- name: default/k8s-lcm-nics
ranges:
- 192.168.9.101-192.168.9.120
tag: default/k8s-lcm-nics
- name: default/k8s-pxe-nics
ranges:
- 10.0.1.41-10.0.1.50
tag: default/k8s-pxe-nics
The status field of the CheckerInventoryConfig object contains the
current state of the object:
nodesList of statuses per node. Contains the following fields:
nameNode name.
foundByIndicator of the node discovery: by name or by node selector.
IPAddressesList of per-subnet data found on the node. Contains the following fields:
subnetTagTag or name of the subnet.
IPAddressIP address detected on the node for the related subnet.
interfaceInterface name where the IP address is detected.
mtuMTU size configured on the interface.
errorError message in case the IP address is not detected on the node. Otherwise, this field is omitted.
updatedAtInternal. Last time when status for the defined node has been updated to ensure that Netchecker inventory agents are functional.
errorSummary of per-node errors.
overallStatusSummary of per-node statuses.
CheckerInventoryConfig status example:
status:
nodes:
- foundBy: name
ipAddresses:
- interface: k8s-lcm
ipAddress: 192.168.9.102/24
mtu: 9050
subnetTag: default/k8s-lcm-nics
- interface: k8s-pxe
ipAddress: 10.0.1.42/24
mtu: 9050
subnetTag: default/k8s-pxe-nics
name: master-0
status: ok
updatedAt: "2025-07-18T14:48:19Z"
- foundBy: name
ipAddresses:
- interface: k8s-lcm
ipAddress: 192.168.9.101/24
mtu: 9050
subnetTag: default/k8s-lcm-nics
- interface: k8s-pxe
ipAddress: 10.0.1.41/24
mtu: 9050
subnetTag: default/k8s-pxe-nics
name: master-1
status: ok
updatedAt: "2025-07-18T14:48:19Z"
- foundBy: name
ipAddresses:
- interface: k8s-lcm
ipAddress: 192.168.9.103/24
mtu: 9050
subnetTag: default/k8s-lcm-nics
- interface: k8s-pxe
ipAddress: 10.0.1.43/24
mtu: 9050
subnetTag: default/k8s-pxe-nics
name: master-2
status: ok
updatedAt: "2025-07-18T14:48:19Z"
overallStatus: ok
NetCheckerTargetsConfig
Available since MCC 2.30.0 (21.0.0 and 20.0.0)
This section describes the NetCheckerTargetsConfig custom resource (CR)
used in the network connectivity monitoring API for target clusters. The
NetCheckerTargetsConfig object is automatically created and managed by
netchecker-controller on the target cluster in the netchecker
namespace. The name of the object is hardcoded to
mcc-netchecker-targets-config.
Warning
Do not manually create or delete the
NetCheckerTargetsConfig object to prevent overwriting by
netchecker-controller. You can only reconfigure the existing object if
you enable manual configuration as described in Manual configuration of network infrastructure monitoring.
The NetCheckerTargetsConfig object includes information of per-node targets
(other nodes) to be checked by a specific node and using the defined list of
subnets. For more details, see Infrastructure connectivity monitoring.
For demonstration purposes, the NetCheckerTargetsConfig CR is split into
the following sections:
The NetCheckerTargetsConfig CR metadata contains the following fields:
apiVersionAPI version of the object that is
cnnc.mirantis.com/v1alpha1.
kindObject type that is
NetCheckerTargetsConfig.
metadataObject metadata that contains the following subfields:
nameObject name.
namespaceProject in which the
NetCheckerTargetsConfigobject is created.
Metadata example:
apiVersion: cnnc.mirantis.com/v1alpha1
kind: NetCheckerTargetsConfig
metadata:
name: nctc-sample
namespace: default
The spec object field contains configuration for a
NetCheckerTargetsConfig object and has the following fields:
nodesConfigList of per-node configuration. Contains the following fields:
nodeNameNode name.
nodeSelectorSelector for cluster nodes. If a group of nodes has the same targets, these targets may be grouped by the node selector.
targetsList of target nodes with subnets selected for connectivity monitoring. Contains the following fields:
nodeNameName of the target node.
nodeSelectorNode selector to group target nodes.
subnetTagsList of subnet tags to be used for connectivity monitoring. IP addresses from these subnets will be used as targets for ping checks.
NetCheckerTargetsConfig configuration example:
spec:
nodesConfig:
- nodeName: master-0
targets:
- nodeName: master-1
subnetTags:
- default/k8s-lcm-nics
- default/k8s-pxe-nics
- nodeName: master-2
subnetTags:
- default/k8s-lcm-nics
- default/k8s-pxe-nics
- nodeName: master-1
targets:
- nodeName: master-0
subnetTags:
- default/k8s-lcm-nics
- default/k8s-pxe-nics
- nodeName: master-2
subnetTags:
- default/k8s-lcm-nics
- default/k8s-pxe-nics
- nodeName: master-2
targets:
- nodeName: master-0
subnetTags:
- default/k8s-lcm-nics
- default/k8s-pxe-nics
- nodeName: master-1
subnetTags:
- default/k8s-lcm-nics
- default/k8s-pxe-nics
The status field of the NetCheckerTargetsConfig object contains the
current state of the object:
nodesList of per-node statuses. Contains the following fields:
nameNode name.
errorError message in case of issues with obtaining node information. Otherwise, this field is omitted.
targetsCountAmount of targets (nodes and subnets) for a particular node.
objectHelperInfoInformation on how to obtain the Netchecker agent configuration for a particular node.
errorSummary of per-node errors, if any.
NetCheckerTargetsConfig status example:
status:
nodes:
- name: master-0
objectHelperInfo: kubectl -n netchecker get cm -o yaml net-checker-agent-config-master-0
targetsCount: "4"
- name: master-1
objectHelperInfo: kubectl -n netchecker get cm -o yaml net-checker-agent-config-master-1
targetsCount: "4"
- name: master-2
objectHelperInfo: kubectl -n netchecker get cm -o yaml net-checker-agent-config-master-2
targetsCount: "4"
Host OS configuration resources
This section contains descriptions and examples of host operating system configuration custom resources for MOSK.
HostOSConfiguration
TechPreview since MCC 2.26.0 (17.1.0 and 16.1.0)
Warning
For security reasons and to ensure safe and reliable cluster operability, test this configuration on a staging environment before applying it to production. For any questions, contact Mirantis support.
Caution
As long as the feature is still on the development stage,
Mirantis highly recommends deleting all HostOSConfiguration objects,
if any, before automatic upgrade of the management cluster to Container Cloud
2.27.0 (Cluster release 16.2.0). After the upgrade, you can recreate the
required objects using the updated parameters.
This precautionary step prevents re-processing and re-applying of existing
configuration, which is defined in HostOSConfiguration objects, during
management cluster upgrade to 2.27.0. Such behavior is caused by changes in
the HostOSConfiguration API introduced in 2.27.0.
This section describes the HostOSConfiguration custom resource (CR) used in
the management API. It contains all necessary information to introduce and load
modules for further configuration of the host operating system of the related
Machine object.
Note
This object must be created and managed on the management cluster.
For demonstration purposes, we split the HostOSConfiguration CR into the
following sections:
The HostOSConfiguration custom resource (CR) metadata contains the
following fields:
apiVersionAPI version of the object that is
ipam.mirantis.com/v1alpha1.
kindObject type that is
HostOSConfiguration.
metadataObject metadata that contains the following subfields:
nameObject name.
namespaceProject in which the
HostOSConfigurationobject is created.
Configuration example:
apiVersion: kaas.mirantis.com/v1alpha1
kind: HostOSConfiguration
metadata:
name: host-os-configuration-sample
namespace: default
The spec object field contains configuration for a
HostOSConfiguration object and has the following fields:
machineSelectorRequired for production deployments. A set of
Machineobjects to apply theHostOSConfigurationobject to. Has the format of the Kubernetes label selector.
configsRequired. List of configurations to apply to
Machineobjects defined inmachineSelector. Each entry has the following fields:moduleRequired. Name of the module that refers to an existing module in one of the HostOSConfigurationModules objects.
moduleVersionRequired. Version of the module in use in the SemVer format.
descriptionOptional. Description and purpose of the configuration.
orderOptional. Positive integer between
1and1024that indicates the order of applying the module configuration. A configuration with the lowest order value is applied first. If theorderfield is not set:Since MCC 2.27.0 (Cluster releases 17.2.0 and 16.2.0), the configuration is applied in the order of appearance in the list after all configurations with the value are applied.
In MCC 2.26.0 (Cluster releases 17.1.0 and 16.1.0), the following rules apply to the ordering when comparing each pair of entries:
Ordering by alphabet based on the
modulevalues unless they are equal.Ordering by version based on the
moduleVersionvalues, with preference given to the lesser value.
valuesOptional if
secretValuesis set. Module configuration in the format of key-value pairs.
secretValuesOptional if
valuesis set. Reference to aSecretobject that contains the configuration values for the module:namespaceProject name of the
Secretobject.
nameName of the
Secretobject.
Note
You can use both
valuesandsecretValuestogether. But if the values are duplicated, thesecretValuesdata rewrites duplicated keys of thevaluesdata.Warning
The referenced
Secretobject must contain only primitive non-nested values. Otherwise, the values will not be applied correctly.
phaseOptional. LCM phase, in which a module configuration must be executed. The only supported and default value is
reconfigure. Hence, you may omit this field.
orderRemoved in Container Cloud 2.27.0 (Cluster releases 17.2.0 and 16.2.0). Optional. Positive integer between
1and1024that indicates the order of applyingHostOSConfigurationobjects on newly added or newly assigned machines. An object with the lowest order value is applied first. If the value is not set, the object is applied last in the order.If no
orderfield is set for allHostOSConfigurationobjects, the objects are sorted by name.Note
If a user changes the
HostOSConfigurationobject that was already applied on some machines, then only the changed items from thespec.configssection of theHostOSConfigurationobject are applied to those machines, and the execution order applies only to the changed items.The configuration changes are applied on corresponding
LCMMachineobjects almost immediately afterhost-os-modules-controllerverifies the changes.
Configuration example:
spec:
machineSelector:
matchLabels:
label-name: "label-value"
configs:
- description: Brief description of the configuration
module: container-cloud-provided-module-name
moduleVersion: 1.0.0
order: 1
# the 'phase' field is provided for illustration purposes. it is redundant
# because the only supported value is "reconfigure".
phase: "reconfigure"
values:
foo: 1
bar: "baz"
secretValues:
name: values-from-secret
namespace: default
The status field of the HostOSConfiguration object contains the
current state of the object:
controllerUpdateReserved. Available since Container Cloud 2.27.0 (Cluster releases 17.2.0 and 16.2.0). Indicates whether the status updates are initiated by
host-os-modules-controller.
isValidAvailable since Container Cloud 2.27.0 (Cluster releases 17.2.0 and 16.2.0). Indicates whether all given configurations have been validated successfully and are ready to be applied on machines. An invalid object is discarded from processing.
specUpdatedAtAvailable since Container Cloud 2.27.0 (Cluster releases 17.2.0 and 16.2.0). Defines the time of the last change in the object
specobserved byhost-os-modules-controller.
containsDeprecatedModulesAvailable since Container Cloud 2.28.0 (Cluster releases 17.3.0 and 16.3.0). Indicates whether the object uses one or several deprecated modules. Boolean.
machinesStatesAvailable since Container Cloud 2.27.0 (Cluster releases 17.2.0 and 16.2.0). Specifies the per-machine state observed by
baremetal-provider. The keys are machines names, and each entry has the following fields:observedGenerationRead-only. Specifies the sequence number representing the quantity of changes in the object since its creation. For example, during object creation, the value is
1.
selectedIndicates whether the machine satisfied the selector of the object. Non-selected machines are not defined in
machinesStates. Boolean.
secretValuesChangedIndicates whether the secret values have been changed and the corresponding
stateItemshave to be updated. Boolean.The value is set to
truebyhost-os-modules-controllerif changes in the secret data are detected. The value is set tofalsebybaremetal-providerafter processing.
configStateItemsStatusesSpecifies key-value pairs with statuses of
StateItemsthat are applied to the machine. Each key contains thenameandversionof the configuration module. Each key value has the following format:Key: name of a configuration
StateItemValue: simplified status of the configuration
StateItemthat has the following fields:hashValue of the hash sum from the status of the corresponding
StateItemin theLCMMachineobject. Appears when the status switches toSuccess.
stateActual state of the corresponding
StateItemfrom theLCMMachineobject. Possible values:Not Started,Running,Success,Failed.
configsList of configurations statuses, indicating results of application of each configuration. Every entry has the following fields:
moduleNameExisting module name from the list defined in the
spec:modulessection of the related HostOSConfigurationModules object.
moduleVersionExisting module version defined in the
spec:modulessection of the relatedHostOSConfigurationModulesobject.
modulesReferenceName of the
HostOSConfigurationModulesobject that contains the related module configuration.
modulePlaybookName of the Ansible playbook of the module. The value is taken from the related
HostOSConfigurationModulesobject where this module is defined.
moduleURLURL to the module package in the FQDN format. The value is taken from the related
HostOSConfigurationModulesobject where this module is defined.
moduleHashsumHash sum of the module. The value is taken from the related
HostOSConfigurationModulesobject where this module is defined.
lastDesignatedConfigurationRemoved in Container Cloud 2.27.0 (Cluster releases 17.2.0 and 16.2.0). Key-value pairs representing the latest designated configuration data for modules. Each key corresponds to a machine name, while the associated value contains the configuration data encoded in the
gzip+base64format.
lastValidatedSpecRemoved in Container Cloud 2.27.0 (Cluster releases 17.2.0 and 16.2.0). Last validated module configuration encoded in the
gzip+base64format.
valuesValidRemoved in Container Cloud 2.27.0 (Cluster releases 17.2.0 and 16.2.0). Validation state of the configuration and secret values defined in the object
specagainst the modulevaluesValidationSchema. AlwaystruewhenvaluesValidationSchemais empty.
errorDetails of an error, if any, that occurs during the object processing by
host-os-modules-controller.
secretObjectVersionAvailable since Container Cloud 2.27.0 (Cluster releases 17.2.0 and 16.2.0). Resource version of the corresponding
Secretobject observed byhost-os-modules-controller. Is present only ifsecretValuesis set.
moduleDeprecatedByAvailable since Container Cloud 2.28.0 (Cluster releases 17.3.0 and 16.3.0). List of modules that deprecate the currently configured module. Contains the
nameandversionfields specifying one or more modules that deprecate the current module.
supportedDistributionsAvailable since Container Cloud 2.28.0 (Cluster releases 17.3.0 and 16.3.0). List of operating system distributions that are supported by the current module. An empty list means support of any distribution by the current module.
HostOSConfiguration status example:
status:
configs:
- moduleHashsum: bc5fafd15666cb73379d2e63571a0de96fff96ac28e5bce603498cc1f34de299
moduleName: module-name
modulePlaybook: main.yaml
moduleURL: <url-to-module-archive.tgz>
moduleVersion: 1.1.0
modulesReference: mcc-modules
moduleDeprecatedBy:
- name: another-module-name
version: 1.0.0
- moduleHashsum: 53ec71760dd6c00c6ca668f961b94d4c162eef520a1f6cb7346a3289ac5d24cd
moduleName: another-module-name
modulePlaybook: main.yaml
moduleURL: <url-to-another-module-archive.tgz>
moduleVersion: 1.1.0
modulesReference: mcc-modules
secretObjectVersion: "14234794"
containsDeprecatedModules: true
isValid: true
machinesStates:
default/master-0:
configStateItemsStatuses:
# moduleName-moduleVersion
module-name-1.1.0:
# corresponding state item
host-os-download-<object-name>-module-name-1.1.0-reconfigure:
hash: 0e5c4a849153d3278846a8ed681f4822fb721f6d005021c4509e7126164f428d
state: Success
host-os-<object-name>-module-name-1.1.0-reconfigure:
state: Not Started
another-module-name-1.1.0:
host-os-download-<object-name>-another-module-name-1.1.0-reconfigure:
state: Not Started
host-os-<object-name>-another-module-name-1.1.0-reconfigure:
state: Not Started
observedGeneration: 1
selected: true
updatedAt: "2024-04-23T14:10:28Z"
HostOSConfigurationModules
TechPreview since MCC 2.26.0 (17.1.0 and 16.1.0)
Warning
For security reasons and to ensure safe and reliable cluster operability, test this configuration on a staging environment before applying it to production. For any questions, contact Mirantis support.
This section describes the HostOSConfigurationModules custom resource (CR)
used in the management API. It contains all necessary information to introduce
and load modules for further configuration of the host operating system of the
related Machine object. For description of module format, schemas, and
rules, see Format and structure of a module package.
Note
This object must be created and managed on the management cluster.
For demonstration purposes, we split the HostOSConfigurationModules CR into
the following sections:
The HostOSConfigurationModules custom resource (CR) metadata contains the
following fields:
apiVersionAPI version of the object that is
ipam.mirantis.com/v1alpha1.
kindObject type that is
HostOSConfigurationModules.
metadataObject metadata that contains the following subfield:
nameObject name.
Configuration example:
apiVersion: kaas.mirantis.com/v1alpha1
kind: HostOSConfigurationModules
metadata:
name: host-os-configuration-modules-sample
The spec object field contains configuration for a
HostOSConfigurationModules object and has the following fields:
modulesList of available modules to use as a configuration. Each entry has the following fields:
nameRequired. Module name that must equal the corresponding custom module name defined in the
metadatasection of the corresponding module. For reference, see Metadata file format.
urlRequired for custom modules. URL to the archive containing the module package in the FQDN format. If omitted, the module is considered as the one provided and validated by MOSK.
versionRequired. Module version in SemVer format that must equal the corresponding custom module version defined in the
metadatasection of the corresponding module. For reference, see Metadata file format.
sha256sumRequired. Hash sum computed using the SHA-256 algorithm. The hash sum is automatically validated upon fetching the module package, the module does not load if the hash sum is invalid.
deprecatesSince MCC 2.28.0 (17.3.0 and 16.3.0)Reserved. List of modules that will be deprecated by the module. This field is overriden by the same field, if any, of the module
metadatasection.Contains the
nameandversionfields specifying one or more modules to be deprecated. Ifnameis omitted, it inherits the name of the current module.
Configuration example:
spec:
modules:
- name: mirantis-provided-module-name
sha256sum: ff3c426d5a2663b544acea74e583d91cc2e292913fc8ac464c7d52a3182ec146
version: 1.0.0
- name: custom-module-name
url: https://fully.qualified.domain.name/to/module/archive/module-name-1.0.0.tgz
sha256sum: 258ccafac1570de7b7829bde108fa9ee71b469358dbbdd0215a081f8acbb63ba
version: 1.0.0
The status field of the HostOSConfigurationModules object contains the
current state of the object:
modulesList of module statuses, indicating the loading results of each module. Each entry has the following fields:
nameName of the loaded module.
versionVersion of the loaded module.
urlURL to the archive containing the loaded module package in the FQDN format.
docURLURL to the loaded module documentation if it was initially present in the module package.
descriptionDescription of the loaded module if it was initially present in the module package.
sha256sumActual SHA-256 hash sum of the loaded module.
valuesValidationSchemaJSON schema used against the module configuration values if it was initially present in the module package. The value is encoded in the
gzip+base64format.
stateActual availability state of the module. Possible values are:
availableorerror.
errorError, if any, that occurred during the module fetching and verification.
playbookNameName of the module package playbook.
deprecatesSince MCC 2.28.0 (17.3.0 and 16.3.0)List of modules that are deprecated by the module. Contains the
nameandversionfields specifying one or more modules deprecated by the current module.
deprecatedBySince MCC 2.28.0 (17.3.0 and 16.3.0)List of modules that deprecate the current module. Contains the
nameandversionfields specifying one or more modules that deprecate the current module.
supportedDistributionsSince 2.28.0 (17.3.0 and 16.3.0)List of operating system distributions that are supported by the current module. An empty list means support of any distribution by the current module.
HostOSConfigurationModules status example:
status:
modules:
- description: Brief description of the module
docURL: https://docs.mirantis.com
name: mirantis-provided-module-name
playbookName: directory/main.yaml
sha256sum: ff3c426d5a2663b544acea74e583d91cc2e292913fc8ac464c7d52a3182ec146
state: available
url: https://example.mirantis.com/path/to/module-name-1.0.0.tgz
valuesValidationSchema: <gzip+base64 encoded data>
version: 1.0.0
deprecates:
- name: custom-module-name
version: 1.0.0
- description: Brief description of the module
docURL: https://example.documentation.page/module-name
name: custom-module-name
playbookName: directory/main.yaml
sha256sum: 258ccafac1570de7b7829bde108fa9ee71b469358dbbdd0215a081f8acbb63ba
state: available
url: https://fully.qualified.domain.name/to/module/archive/module-name-1.0.0.tgz
version: 1.0.0
deprecatedBy:
- name: mirantis-provided-module-name
version: 1.0.0
supportedDistributions:
- ubuntu/jammy
OpenStack Operator resources
The purpose of the reference documents below is to provide cloud operators with an up-to-date and comprehensive definition of the language they need to use to communicate with OpenStack:
MOSK 24.1 series:
MOSK 23.3 series:
MOSK 23.2 series:
Tungsten Fabric Operator resources
The purpose of the reference documents below is to provide cloud operators with an up-to-date and comprehensive definition of the language they need to use to communicate with Tungsten Fabric:
MOSK 24.2 series:
MOSK 24.1 series:
Ceph resources
For descriptions of available Ceph custom resources for a MOSK cluster, refer to Ceph configuration options since 25.2 or before 25.2.
StackLight resources
For descriptions of available StackLight custom resources for a MOSK cluster, refer to StackLight configuration parameters.
User Guide
This guide provides the usage instructions for a Mirantis OpenStack for Kubernetes (MOSK) environment and is intended for the cloud end user to successfully perform the OpenStack lifecycle management.
Use the Instance HA service
The section provides instructions on how to verify whether the Masakari service has been correctly configured by the cloud operator and will recover an instance from the process and compute node failures.
Verify recovery from a VM process failure
Create an instance:
openstack server create --image Cirros-5.1 --flavor m1.tiny --network DemoNetwork DemoInstance01
If required, mark it with the
HA_Enabledtag:Note
Depending on the Masakari service configuration, you may need to mark instances with the
HA_Enabledtag. For more information about service configuration, refer to Configure high availability with Masakari.openstack server set --property HA_Enabled=True DemoInstance01
Identify the compute host with the instance:
openstack server show DemoInstance01 |grep host | OS-EXT-SRV-ATTR:host | vs-ps-vyvsrkrdpusv-1-w2mtagbeyhel-server-cgpejthzbztt |
Log in to the compute host and obtain the instance PID:
ps xafu |grep qemu nova 5231 34.3 1.1 5459452 184712 ? Sl 07:39 0:18 | \_ /usr/bin/qemu-system-x86_64 -name guest=instance-00000002....
Simulate the failure by killing the process:
kill -9 5231
Verify notifications:
openstack notification list +--------------------------------------+----------------------------+---------+------+--------------------------------------+-----------------------------------------------------------------------------------------------------------------------+ | notification_uuid | generated_time | status | type | source_host_uuid | payload | +--------------------------------------+----------------------------+---------+------+--------------------------------------+-----------------------------------------------------------------------------------------------------------------------+ | 2fb82a5c-9a8b-4cef-a06e-a737e1b565a0 | 2021-07-06T07:40:40.000000 | running | VM | 6f1bd5aa-0c21-446a-b6dd-c1b4d09759be | {'event': 'LIFECYCLE', 'instance_uuid': '165cdfaf-b9e5-42b2-bbb9-af9283a789ae', 'vir_domain_event': 'STOPPED_FAILED'} | +--------------------------------------+----------------------------+---------+------+--------------------------------------+-----------------------------------------------------------------------------------------------------------------------+ openstack notification list +--------------------------------------+----------------------------+----------+------+--------------------------------------+-----------------------------------------------------------------------------------------------------------------------+ | notification_uuid | generated_time | status | type | source_host_uuid | payload | +--------------------------------------+----------------------------+----------+------+--------------------------------------+-----------------------------------------------------------------------------------------------------------------------+ | 2fb82a5c-9a8b-4cef-a06e-a737e1b565a0 | 2021-07-06T07:40:40.000000 | finished | VM | 6f1bd5aa-0c21-446a-b6dd-c1b4d09759be | {'event': 'LIFECYCLE', 'instance_uuid': '165cdfaf-b9e5-42b2-bbb9-af9283a789ae', 'vir_domain_event': 'STOPPED_FAILED'} | +--------------------------------------+----------------------------+----------+------+--------------------------------------+-----------------------------------------------------------------------------------------------------------------------+
Verify that the instance process has been recovered:
ps xafu |grep qemu root 8800 0.0 0.0 11488 1104 pts/1 S+ 07:41 0:00 | | \_ grep --color=auto qemu nova 8323 104 0.7 1262628 128936 ? Sl 07:40 0:09 | \_ /usr/bin/qemu-system-x86_64 -name guest=instance-00000002
Verify recovery from a node failure
Create an instance:
openstack server create --image Cirros-5.1 --flavor m1.tiny --network DemoNetwork DemoInstance01
If required, mark it with the
HA_Enabledtag:Note
Depending on the Masakari service configuration, you may need to mark instances with the
HA_Enabledtag. For more information about service configuration, refer to Configure high availability with Masakari.openstack server set --property HA_Enabled=True DemoInstance01
Identify the compute host with the instance:
openstack server show DemoInstance01 |grep host | OS-EXT-SRV-ATTR:host | vs-ps-vyvsrkrdpusv-1-w2mtagbeyhel-server-cgpejthzbztt |
Log in to the compute host and power it off.
After a while, verify that the instance has been evacuated:
openstack server show DemoInstance01 |grep host | OS-EXT-SRV-ATTR:host | vs-ps-vyvsrkrdpusv-0-ukqbpy2pkcuq-server-s4u2thvgxdfi |
Configure the introspective instance monitor
Available since MOSK 25.1 TechPreview
This section explains how to set up the introspective instance monitor to enhance the reliability of virtual machines in your OpenStack environment.
To configure the introspective instance monitoring:
Verify that the introspective instance monitor is enabled in the
OpenStackDeploymentcustom resource as described in Enabling introspective instance monitor.Create a high availability (HA) segment to group relevant compute hosts that will participate in monitoring and recovery as described in Group compute nodes into segments.
Ensure the virtual machine image supports the QEMU Guest Agent for monitoring by updating the image with the
hw_qemu_guest_agent=yesproperty:openstack image set --property hw_qemu_guest_agent=yes <IMAGE_NAME>
When creating a virtual machine, specify the
HA_Enabled=Trueproperty to include it in monitoring and recovery:openstack server create --flavor <FLAVOR> \ --image <IMAGE> \ --network <NETWORK> \ --property HA_Enabled=True <SERVER_NAME>
Install the QEMU Guest Agent to enable communication between the host and guest operating systems and ensure precise monitoring of the instance health.
Install the QEMU Guest Agent using the system package manager. For example:
sudo apt install qemu-guest-agent
Verify that the agent is up and running:
systemctl status qemu-guest-agent
Note
This procedure uses a generic approach to adding drivers to Windows. The exact steps may vary depending on the Windows version. Refer to the installation documentation specific to your Windows version for detailed instructions.
Download the VirtIO driver ISO file (
virtio-win.iso).Install the VirtIO Serial Driver:
Attach
virtio-win.isoto your Windows virtual machine.Log in to the virtual machine.
Open the Windows Device Manager.
Locate PCI Simple Communications Controller in the device list.
Right-click on it and select Update Driver.
Browse to the mounted ISO directory
DRIVE:\vioserial\<OSVERSION>\, where<OSVERSION>corresponds to the Windows version of your Windows virtual machine.Click Next to install the driver.
Reboot the virtual machine to complete the driver installation.
Install the QEMU Guest Agent:
Log in to the virtual machine.
Use the File Explorer to navigate to the
guest-agentdirectory in thevirtio-winCD drive.Run the installer:
qemu-ga-x86_64.msi (64-bit)orqemu-ga-i386.msi (32-bit).Verify that the
qemu-guest-agentis up and running. For example, in the PowerShell:Get-Service QEMU-GAExpected system response:
Status Name DisplayName ------ ---- ----------- Running QEMU-GA QEMU Guest Agent
Manage application credentials
Application credentials is a mechanism in the MOSK Identity service (Keystone) that enables application automation tools, such as shell scripts, Terraform modules, Python programs, and others, to securely perform various actions in the cloud API in order to deploy and manage application components.
Historically, dedicated technical user accounts were created to be used by application automation tools. The application credentials mechanism has significant advantages over the legacy approach in terms of the following:
Self-service: Cloud users manage application credential objects completely on their own, without having to reach out to cloud operators.
Note
Application credentials are owned by the cloud user who created them, not the project, domain, or system that they have access to. Non-admin users only have access to application credentials that they have created themselves.
Security: Cloud users creating application credentials have control over the actions that automation tools will be allowed to perform on their behalf by the following:
Specifying the cloud API endpoints the tool may access.
Delegating to the tool just a subset of the owner’s roles.
Restricting the tool from creating new application credential objects or trusts.
Defining the validity period for a credential.
Simplicity: In case a credential is compromised, the automation tools using it can be easily switched to a new object.
See also
Usage limitations
For security reasons, a cloud user who logs in to the cloud through the Mirantis Container Cloud IAM or an external identity provider cannot use the application credentials mechanism by default. To enable the functionality, contact your cloud operator.
MOSK Object Storage service does not support application credentials authentication to access S3 API. To authenticate in S3 API, use the EC2 credentials mechanism.
MOSK Object Storage service has limited support for application credentials when accessing Swift API. The service does not accept application credentials with restrictions to allowed API endpoints.
Create an application credential using CLI
You can create an application credential using OpenStack CLI or Horizon. To create an application credential using CLI, use the openstack application credential create command.
If you do not provide the application credential secret, one will be generated automatically.
Warning
The application credential secret displays only once upon creation. It cannot be recovered from the Identity service. Therefore, capture the secret string from the command output and keep it in a safe place for future usage.
When creating application credentials, you can limit their capabilities depending on the security requirements of your deployment:
Define expiration time.
Limit the roles of an application credential to only a subset of roles that the user creating the credential has.
Pass a list of allowed API paths and actions, aka access rules, that the application credential will have access to. For the comprehensive list of possible options when creating credentials, consult the upstream OpenStack documentation.
Restrict an application credential from creating another application credential or a trust.
Note
This is the default behavior, but depending on what the application credential is used for, you may need to loosen this restriction.
An application credential will be created with access to the scope of your current session. For example, if your current credential is scoped to a specific project, domain, or system, the created application credential will have access to the same scope.
Create an application credential through Horizon
In the Identity panel, select Application Credentials.
In this view, you can list, create, and delete application credentials as well as display details of a specific application credential.
Click Create Application Credential.
In the wizard that opens, fill in the required fields and download
clouds.yamlor an RC file to authenticate with the created application credential.
Authenticate with an application credential
To authenticate in a MOSK cloud using an application credential, you need to know the ID and secret of the application credential.
When using the human-readable name of an application credential instead of its ID, you also have to supply the user ID or the user name with the user domain ID or name. These details are required for the Identity service (Keystone) to resolve your application credential, since different users may have application credentials with the same name.
The following example illustrates a snippet from an RC file with required environment variables using the application credential name:
export OS_AUTH_URL="https://keystone.it.just.works/v3"
export OS_AUTH_TYPE=v3applicationcredential
export OS_APPLICATION_CREDENTIAL_NAME=myappcreds
export OS_APPLICATION_CREDENTIAL_SECRET=supersecret
export OS_USERNAME=demo
export OS_USER_DOMAIN_NAME=Default
The following example illustrates a snippet of an entry in clouds.yaml
using the application credential ID:
clouds:
my-app:
auth_type: v3applicationcredential
auth:
auth_url: https://keystone.it.just.works/v3
application_credential_id: 21dced0fd20347869b93710d2b98aae0
application_credential_secret: supersecret
Using OpenStack CLI explicit arguments
Use the following openstackclient explicit arguments while authenticating
with an application credential:
openstack --os-auth-type v3applicationcredential \
--os-auth-url https://keystone.it.just.works/v3 \
--os-application-credential-name my-appcreds \
--os-application-credential-secret supersecret \
--os-username demo \
--os-user-domain-name Default \
<ANY OSC COMMAND>
Using shell scripting
The following example curl command outputs the OpenStack keystone token
using the application_credential authentication method:
curl -X POST https://keystone.it.just.works/v3/auth/tokens \
-i -H "Content-Type: application/json" \
-d '{"auth":{"identity":{"methods":["application_credential"],"application_credential":{"id": "21dced0fd20347869b93710d2b98aae0","secret": "supersecret"}}}}'
The token is located in the x-subject-token header of the response, and
the response body contains information about the user, scope, effective roles,
and the service catalog.
Rotate an application credential
In case an application credential becomes invalid due to the expiry or the owner-user leaving the team, or compromised if its secret gets exposed, Mirantis recommends rotating the credential immediately as follows:
Create a new application credential with the same permissions.
Adjust the automation tooling configuration to use the new object.
Delete the old object. This can be performed by the owner-user or cloud operator.
Authenticate in OpenStack API as a federated OIDC user
This section offers an example workflow of federated user authentication in OpenStack using an external identity provider and OpenID Connect (OIDC) protocol. The example illustrates a typical HTTP-based interchange of authentication data happening underneath between the client software, identity provider, and MOSK Identity service (OpenStack Keystone) when a cloud user logs in to a cloud using their corporate or social ID, depending on cloud configuration.
The instructions below can be handy for cloud operators who want to delve into how federated authentication operates in OpenStack and troubleshoot any related issues, as well as advanced cloud users keen on crafting their own basic automation tools for cloud interactions.
The instructions are provided for educational purposes. Mirantis encourages
the majority of cloud users to rely on existing mature tools and libraries,
such as openstacksdk, keystoneauth, python-openstackclient,
or gophercloud to communicate with OpenStack APIs in a programmable
manner.
Warning
Mirantis advises cloud users not to rely on federated authentication when managing their cloud resources using command line and cloud automation tool. Instead, consider using OpenStack built-in application credentials mechanism to ensure secure and reliable access to OpenStack APIs of your MOSK cloud. See Manage application credentials for details.
Verify cloud configuration with the cloud administrator
For cloud users to be able to log in to an OpenStack cloud using their federated identity, the cloud administrator should configure the cloud to integrate with an external OIDC-compatible identity provider, such as Mirantis Container Cloud IAM (Keycloak) with all the necessary resources pre-created in the OpenStack Keystone API.
To authenticate in OpenStack using your federated identity, an
OIDC-compatible identity provider protocol, and the v3oidcpassword
authentication method, get yourself acquainted with the authentication
parameters listed below. You can extract the required information from the
OpenStack RC file that is available for download from OpenStack Dashboard
(Horizon) once you log in to it with your federated identity, or the
clouds.yaml file.
Parameter |
Description |
|---|---|
|
The URL pointing to the OpenStack Keystone API. |
|
The URL pointing to the OIDC discovery document served by the identity provider,
usually ends with |
|
The identifier of the OIDC client to use. |
|
The secret for the OIDC client. Many OIDC providers require this parameter. Some providers, including Mirantis Container Cloud IAM (Keycloak), allow so-called public clients, where secrets are not used and can be any string. |
|
The scope requested when using OIDC authentication. This is at least
|
|
The name of the corresponding identity provider object as created in the Keystone API. |
|
The name of the protocol object as created in the Keystone API. |
|
Your user name. |
|
Your password in the identity provider, such as Mirantis Container Cloud IAM (Keycloak). |
Note
Additionally, to obtain a scoped token, you need information about
the target scope, such as, OS_PROJECT_DOMAIN_NAME and
OS_PROJECT_NAME.
Below is an example of RC file to set environment variables used in the further code examples for the project scope authentication:
export OS_AUTH_URL=https://keystone.it.just.works
export OS_DISCOVERY_ENDPOINT=https://keycloak.it.just.works/auth/realms/iam/.well-known/openid-configuration
export OS_CLIENT_ID=os
export OS_CLIENT_SECRET=someRandomClientSecretMightBeNull
export OS_USERNAME=writer
export OS_PASSWORD=password
export OS_IDENTITY_PROVIDER=keycloak
export OS_PROTOCOL=mapped
export OS_OPENID_SCOPE=openid
export OS_PROJECT_DOMAIN_NAME=Default
export OS_PROJECT_NAME=admin
Obtain the OIDC access token
Obtain the token endpoint of the identity provider by extracting it from the OIDC discovery document:
token_endpoint=$(curl -sk -X GET $OS_DISCOVERY_ENDPOINT | jq -r .token_endpoint)
Obtain the access token from the identity provider by sending the POST request to the token endpoint that will return the access token in exchange to the login credentials:
access_token=$(curl -sk \ -X POST $token_endpoint \ -u $OS_CLIENT_ID:$OS_CLIENT_SECRET \ -d "username=${OS_USERNAME}&password=${OS_PASSWORD}&scope=${OS_OPENID_SCOPE}&grant_type=password" \ -H "Content-Type: application/x-www-form-urlencoded" \ | jq -r .access_token)
Note
As per OpenID Connect RFC, the request to the endpoint must use the Form serialization.
Now, you can exchange the OIDC access token for an unscoped token from OpenStack Keystone.
Obtain the unscoped token from OpenStack Keystone
The Keystone token is included in the response header. However, the response
body in the JSON format often contains additional data that may prove useful
for certain applications. The following example excludes the body by using
the -I flag:
unscoped_token=$(curl -sik \
-I \
-X POST $OS_AUTH_URL/OS-FEDERATION/identity_providers/${OS_IDENTITY_PROVIDER}/protocols/${OS_PROTOCOL}/auth \
-H "Authorization: Bearer $access_token" \
| grep x-subject-token \
| awk '{print $2}' \
| tr -d '\r')
Note
The tr -d '\r' line trims the carriage return characters from
grep and awk outputs so that the extracted data
can be properly inserted into the JSON authentication request later.
Now, you can generate a scoped token from OpenStack Keystone using the unscoped token and specifying the project scope.
Optional. Discover available scopes
In case you do not know beforehand the OpenStack authorization scope you want to log in to, use the unscoped token to get a list of the available scopes:
curl -sk $OS_AUTH_URL/auth/projects \
-H "X-Auth-Token: $unscoped_token" | jq .projects
Obtain the scoped token from OpenStack Keystone
Create a JSON-formatted authentication request using the following script. For example, for the project scope:
token_request=$(mktemp) cat > $token_request << EOJSON { "auth": { "identity": { "methods": [ "token" ], "token": { "id": "$unscoped_token" } }, "scope": { "project": { "domain": { "name": "$OS_PROJECT_DOMAIN_NAME" }, "name": "$OS_PROJECT_NAME" } } } } EOJSON
Send the authentication request to OpenStack Keystone to obtain a scoped token:
scoped_token=$(curl -sik \ -X POST $OS_AUTH_URL/auth/tokens \ -d "@$token_request" -H "Content-Type: application/json" \ | grep x-subject-token \ | awk '{print $2}' \ | tr -d '\r')
Remove the temporary file used to store the authentication request:
rm $token_request
Use the scoped token to access OpenStack services APIs
To verify that you can access the OpenStack services APIs, for example, obtain the list of available images:
curl -sk -H "X-Auth-Token: $scoped_token" \
-X GET https://glance.it.just.works/v2/images
Replace https://glance.it.just.works with the endpoint of the
MOSK Image service (OpenStack Glance) that you can obtain
from the Access & Security dashboard of OpenStack Horizon.
Deploy your first cloud application using automation
This section aims to help you build your first cloud application and onboard it to a MOSK cloud. It will guide you through the process of deploying and managing a sample application using automation, and showcase the powerful capabilities of OpenStack.
Sample application
The sample application offered by Mirantis is a typical web-based application consisting of a front end that provides a RESTful API situated behind the cloud load balancer (OpenStack Octavia) and a backend database that stores data in the cloud block storage (OpenStack Cinder volumes).
You can extend the sample application to make use of advanced features offered by MOSK, for example:
An HTTPS-terminating load balancer that stores its certificate in the Key Manager service (OpenStack Barbican)
A public endpoint accessible by the domain name with the help of the DNS service (OpenStack Designate)
Deployment automation tools
The sample application intends to showcase how deployment automation can enable the DevOps engineers to streamline the process of installing, updating, and managing their workloads in the cloud providing an efficient and scalable approach to building and running cloud-based applications.
The sample application offers example templates for the most common tools that include:
OpenStack Heat, an OpenStack service used to orchestrate composite cloud applications with a declarative template format through the OpenStack-native REST API
Terraform, an Infrastructure-as-code tool from HashiCorp, designed to build, change, and version cloud and on-prem resources using a declarative configuration language
You can easily customize and extend the templates for similar workloads.
Note
The sample source code and automation templates reside in the OpenStack RefApp GitHub repository.
Environment
The sample cloud application deployment has been verified in the following environment:
OpenStack command-line client v5.8.1
Terraform v1.3.x
OpenStack Yoga
Ubuntu 18.04 LTS (Bionic Beaver) as guest operating system
Obtain the access credentials to the cloud
Log in to the cloud web UI (OpenStack Horizon).
Navigate to the project where you want to deploy the application.
Use the top-right user menu to download the
OpenStack RC Fileto your local machine.
Note
As an example, you will be using your own user credential to deploy the sample application. However, in the future, Mirantis strongly recommends creating dedicated application credentials for your workloads.
Deploy sample application with OpenStack Heat
Prepare for the Heat stack creation:
Load the previously downloaded
openrcfile into the environment to configure the OpenStack client with the access credentials:source <YOUR_PROJECT>-openrc.sh
Verify that a Heat stack with the target name does not exist:
STACK_NAME=sampleapp openstack stack check $STACK_NAME
Generate an SSH keypair to access front-end and database instances:
cd <OPENSTACK_REFAPP>/heat-templates ssh-keygen -m PEM -N '' -C '' -f .openstack
Verify the default deployment configuration in the
top.yamltemplate. Modify parameters as required. For example, you may want to change the image, flavor, or network parameters.Create the stack using the provided template with the public key generated above:
PUBLIC_KEY=$(<.openstack.pub) openstack stack create -t top.yaml --parameter "cluster_public_key=${PUBLIC_KEY}" $STACK_NAME
Verify that the Heat stack has been created successfully and the application instances are running:
openstack stack event list $STACK_NAME openstack stack resource list $STACK_NAME openstack stack show $STACK_NAME
Obtain the URL of application public endpoint:
openstack stack output show $STACK_NAME app_url
Deploy sample application with Terraform
Download and install the Terraform binary on your local machine, for example:
wget -O- https://releases.hashicorp.com/terraform/1.3.9/terraform_1.3.9_linux_amd64.zip | funzip > /usr/bin/terraform chmod +x /usr/bin/terraform
Generate an SSH keypair to be used to log in to the application instances:
cd <OPENSTACK_REFAPP>/terraform/templates ssh-keygen -m PEM -N '' -C '' -f .openstack
Load the previously downloaded
openrcfile into the environment to configure Terraform with the cloud access credentials:source <YOUR_PROJECT>-openrc.sh
Verify that all required Terraform providers are properly installed and configured:
terraform initGenerate a speculative execution plan that outlines the actions required to implement the current configuration and apply the Terraform state:
terraform plan terraform apply -auto-approve
Note
If
HTTPS_PROXYis set, also setNO_PROXYbefore running terraform plan:export NO_PROXY="it.just.works"
Obtain the URL of the application public endpoint:
terraform output app_url
Verify application functioning
Run the curl tool against the URL of the application public end point to make sure that all components of the application have been deployed correctly and it is responding to user requests:
$ curl http://<APP_URL>/
{"host": "host name of API instance that replied","app": "openstack-refapp"}
The sample application provides a RESTful API, which you can use for advanced database queries.
See also
Deploy your first cloud application using cloud web UI
This section aims to help you build your first cloud application and onboard it to a MOSK cloud. It will guide you through the process of deploying a simple application using the cloud web UI (OpenStack Horizon).
The section will also introduce you into the fundamental OpenStack primitives that are commonly used to create virtual infrastructures for cloud applications.
Sample application
The sample application in the context of this tutorial is a typical web-based application consisting of Wordpress, a popular web content management system, and a database that stores Wordpress data in the cloud block storage (OpenStack Cinder volume).
You can extend the sample application to make use of advanced features offered by MOSK, for example:
Add an HTTPS-terminating load balancer that stores its certificate in the Key Manager service (OpenStack Barbican)
Make the public endpoint accessible by the domain name with the help of the DNS service (OpenStack Designate)
Prerequisites
You can run the sample application on any OpenStack cloud. It can be a private MOSK cluster of your company, a public OpenStack cloud, or even your own tiny TryMOSK instance spinned up in an AWS tenant as described in the Try Mirantis OpenStack for Kubernetes on AWS article.
To deploy the sample application, you need:
Access to your cloud web UI with the credentails obtained from your cloud administator:
The URL of the cloud web UI (OpenStack Horizon)
The login, password, and, optionally, authentication method that you need to use to log in to the MOSK cloud
The name of the OpenStack project with enough resources available
Connectivity from the MOSK cluster to the Internet to be able to download the components of the sample application. If needed, consult with your cloud administrator.
A local machine with the SSH client installed and connectivity to the cloud public address (floating IP) space.
Environment
The sample cloud application deployment has been verified in the following environment:
OpenStack Yoga
Ubuntu 18.04 LTS (Bionic Beaver) as guest operating system
Deploy sample application using the web UI
Log in to the cloud web UI:
Open your favorite web browser and navigate to the URL of the cloud web UI.
Use the access credentials to log in.
Select the appropriate project from the drop-down menu at the top left.
Create a dedicated private network for your application:
Note
Virtual networks in OpenStack are used for isolated communication between instances (virtual machines) within the cloud. Instances get plugged into networks to communicate with any virtual networking entities, such as virtual routers and load balancers as well as the outside world.
Navigate to Network > Networks.
Click Create Network. The Create Network dialog box opens.
In the Network tab, specify a name for the new network. Select the Enable Admin State and Create Subnet check boxes.
In the Subnet tab, specify a name for the subnet and network address, for example,
192.168.1.0/24.In the Subnet Details tab, keep the preset configuration.
Click Create.
Create and connect a network router.
Note
A virtual router, just like its physical counterpart, is used to pass the layer 3 network traffic between two or more networks. Also, a router performs the network address translation (NAT) for instances to be able to communicate with the outside world through the external networks.
To create the network router:
Navigate to Network > Routers.
Click Create Router. The Create Router dialog box opens.
Specify a meaningful name for the new router and select the external network it needs to be plugged in. If you do not know which external network to select, consult your cloud administator.
Now, when the router is up and running, you need to plug it into the application private network, so it can forward the packets between your local machine and the instance, which you will create later.
To connect the network router:
Navigate to Network > Routers.
Find the router you have just created and click on its name.
Open the Interfaces tab and click Add Interface. The Add Interface dialog box opens.
Select the subnetwork that you provided in the first step.
Click Add Interface.
Create an instance:
Note
A virtual machine, or an instance in the OpenStack terminology, is the machine where your application processes will be effectively running.
Navigate to Compute > Instances.
Click Launch Instance. The Launch Instance dialog box opens.
In the Details tab, specify a meaningful name for the new instance, so that you can easily identify it among others later.
In the Source tab, select the Image boot source. MOSK comes with a few prebuilt images, we will be using the one with the Ubuntu Bionic Server image for the sample application.
In the Flavor tab, pick the m1.small size for the instance, which provides just enough resources for the application to run.
In the Networks tab, select the previously created private network to plug the instance into.
In the Security Groups tab, verify that the default security group is selected and it allows the ingress HTTP, HTTPs, and SSH traffic.
In the Key Pair tab, create or import a new key pair to be able to log in to the instance securily through the SSH protocol. Make sure to have a copy of the private key on your local machine to pass to the SSH client.
Now all the needed settings have been made, click Launch Instance.
Wait for the new instance to get shown in the Active state in the Instances dashboard.
Attach a volume to the instance.
Note
Volumes in OpenStack provide persistent storage for applications, allowing the data, which is placed on them, to exist independently from the instances, as opposed to the data written to ephemeral storage, which automatically gets terminated together with its instance.
To create the volume:
Navigate to Volumes > Volumes.
Click Create Volume. The Create Volume dialog box opens.
Specify a meaningful name for the new volume.
Leave all fields with the default values. A 1 GiB volume will be enough for the sample application.
Once the volume is allocated, it shows up in the same Volumes dashboard. Now, you can attach the new volume to your running instance:
In the Volumes dashboard, select the volume to add to the instance.
Click Manage Attachments. The Manage Volume Attachments dialog box opens.
Select the required instance.
Click Attach Volume.
Now, the Attached To column in the Volumes dashboard will display your volume device name as the volume attached to your instance. Also, you can view the status of a volume that can be either Available or In-Use.
Expose the instance outside:
Note
A floating IP address in OpenStack is an abstraction over a publicly routable IP address that allows an instance to be accessed from outside the cloud. Floating IPv4 addresses are typically scarce and expensive resources and, so they need to be explicitly allocated and assigned to selected instances.
Navigate to Compute > Instances.
From the Actions drop-down list next to your instance, select Associate Floating IP. The Manage Floating IP Associations dialog box opens.
Allocate a new floating IP address using the + button.
The Port to be associated should be already filled in with the instance private port.
Click Associate.
The Compute > Instances dashboard will display the instance floating IP address along with the private one. Write down the floating IP address as you will need it in the next step.
Access the instance through SSH.
On your local machine use the SSH client to log in to the instance by its floating IP address. Ensure the
0600permission on the private key file.ssh -i <path-to-your-private-key> ubuntu@<floating-IP>
All operations on the instance listed below must be performed by the superuser, as
root:sudo su -
Initialize persistent storage for the application data.
A newly created volume is always an empty block device that needs to be provisioned before the application can write or read any data.
Use the device name under which the volume got attached to the instance to create a file system on the block device:
mkfs.ext4 <volume-device-name> -q
Create a mount point and mount the newly provisioned block device into the guest operating system:
mkdir /mnt/data && mount <volume-device-name> /mnt/data
Start the application components.
We will run the application components as Docker containers to simplify their provisioning and configuration and isolate them from each other.
The common Ubuntu cloud image does not have Docker engine preinstalled, so you need to install it manually:
sudo apt-get update && sudo apt-get install -y docker.io
Our sample application consists of two Docker containers:
MySQL database server
Wordpress instance
First, we create a new Docker network so that both containers can communicate with each other:
docker network create samplenet
Now, let’s spin up the MySQL database. We will place all its data in a separate directory on the mounted volume. You can find more information about the parameters of MySQL image on its DockerHub page.
mkdir /mnt/data/db docker run -d --name db --network samplenet --volume /mnt/data/db:/var/lib/mysql -e MYSQL_DATABASE=exampledb -e MYSQL_USER=exampleuser -e MYSQL_PASSWORD=examplepass -e MYSQL_RANDOM_ROOT_PASSWORD=1 mysql:5.7
It is time to start the Wordpress Docker container. Its data will be also hosted on the volume.
mkdir /mnt/data/wordpress docker run -d --name wordpress --network samplenet --publish 80:80 --volume /mnt/data/wordpress:/var/www/html -e WORDPRESS_DB_HOST=db -e WORDPRESS_DB_USER=exampleuser -e WORDPRESS_DB_PASSWORD=examplepass -e WORDPRESS_DB_NAME=exampledb wordpress
Now, the sample application is up and running.
Verify application functioning
Use the web browser on you local machine to navigate to the application
endpoint http://<instance-floating-IP-address>. If you have followed
all the steps accurately, your browser should now display the Wordpress
Getting Started dialog.
Feel free to provide the necessary parameters and proceed with the initialization. Once it finishes, you proceed with building your own cloud-hosted website and start serving the users. Congratulations!
Use Heat to create and manage Tungsten Fabric objects
Utilizing OpenStack Heat templates is a common practice to orchestrate Tungsten Fabric resources. Heat allows for the definition of templates, which can depict the relationships between resources such as networks, and enforce policies accordingly. Through these templates, OpenStack REST APIs are invoked to create the necessary infrastructure in the correct order required to launch applications.
Managing Tungsten Fabric resources through OpenStack Heat represents a structured and automated approach as compared to using of Tungsten Fabric UI or API directly. The Heat templates provide a declarative mechanism to define and manage infrastructure, ensuring repeatability and consistency across deployments. This contrasts with the manual and potentially error-prone process of managing resources through the Tungsten Fabric UI and API.
To orchestrate Tungsten Fabric objects through a Heat template:
Define the template with the Tungsten Fabric objects as required.
Note
You can view the full list of Heat resources available in your environment from either OpenStack Horizon dashboard, the Project > Orchestration > Resource Types page, or the OpenStack CLI:
openstack orchestration resource type list
Also, you can obtain the specification of the Tungsten Fabric configuration API by accessing
http://TF_API_ADDRESS:8082/documentation/contrail_openapi.htmlon your environment.Below is an example template showcasing a Heat topology that illustrates the creation sequence of the following Tungsten Fabric resources: instance, port, network, router, and external network.
Example Heat topology with Tungsten Fabric resources
heat_template_version: 2015-04-30 description: HOT template to create a Instance connected to external network parameters: stack_prefix: type: string description: Prefix name for stack resources. default: "net-logical-router" project: type: string description: project for the Server public_network_id: type: string floating_ip_pool: type: string subnet_ip_prefix: type: string default: '192.168.96.0' subnet_ip_prefix_len: type: string default: '24' server_image: type: string description: Name of image to use for server. default: 'Cirros-6.0' availability_zone: type: string default: 'nova' resources: ipam: type: OS::ContrailV2::NetworkIpam properties: name: { list_join: [ '_', [ get_param: stack_prefix, "ipam" ] ] } project: { get_param: project } private_network: type: OS::ContrailV2::VirtualNetwork properties: name: { list_join: [ '_', [ get_param: stack_prefix, "network" ] ] } project: { get_param: project } network_ipam_refs: [{ get_resource: ipam }] network_ipam_refs_data: [ { network_ipam_refs_data_ipam_subnets: [ { network_ipam_refs_data_ipam_subnets_subnet_name: { list_join: [ '_', [ get_param: stack_prefix, "subnet" ] ] }, network_ipam_refs_data_ipam_subnets_subnet: { network_ipam_refs_data_ipam_subnets_subnet_ip_prefix: '192.168.96.0', network_ipam_refs_data_ipam_subnets_subnet_ip_prefix_len: '24', }, network_ipam_refs_data_ipam_subnets_allocation_pools: [ { network_ipam_refs_data_ipam_subnets_allocation_pools_start: '192.168.96.10', network_ipam_refs_data_ipam_subnets_allocation_pools_end: '192.168.96.100' } ], network_ipam_refs_data_ipam_subnets_default_gateway: '192.168.96.1', network_ipam_refs_data_ipam_subnets_enable_dhcp: 'true', } ] } ] private_network_interface: type: OS::ContrailV2::VirtualMachineInterface properties: name: { list_join: [ '_', [ get_param: stack_prefix, "interface" ] ] } project: { get_param: project } virtual_machine_interface_device_owner: 'network:router_interface' virtual_machine_interface_bindings: { virtual_machine_interface_bindings_key_value_pair: [ { virtual_machine_interface_bindings_key_value_pair_key: 'vnic_type', virtual_machine_interface_bindings_key_value_pair_value: 'normal' } ] } virtual_network_refs: [{ get_resource: private_network }] instance_ip: type: OS::ContrailV2::InstanceIp properties: name: { list_join: [ '_', [ get_param: stack_prefix, "instance_ip" ] ] } fq_name: { list_join: [ '_', [ "fq_name", get_param: stack_prefix ] ] } virtual_network_refs: [{ get_resource: private_network }] virtual_machine_interface_refs: [{ get_resource: private_network_interface }] router: type: OS::ContrailV2::LogicalRouter properties: name: { list_join: [ '_', [ get_param: stack_prefix, "router" ] ] } project: { get_param: project } virtual_machine_interface_refs: [{ get_resource: private_network_interface }] virtual_network_refs: [{ get_param: public_network_id }] virtual_network_refs_data: [ { virtual_network_refs_data_logical_router_virtual_network_type: 'ExternalGateway' }, ] security_group: type: OS::ContrailV2::SecurityGroup properties: # description: SG with allowed ssh/icmp traffic name: { list_join: [ '_', [ get_param: stack_prefix, "sg" ] ] } project: { get_param: project } security_group_entries: { security_group_entries_policy_rule: [ { security_group_entries_policy_rule_direction: '>', security_group_entries_policy_rule_protocol: 'any', security_group_entries_policy_rule_ethertype: 'IPv4', security_group_entries_policy_rule_src_addresses: [ { security_group_entries_policy_rule_src_addresses_security_group: 'local', } ], security_group_entries_policy_rule_dst_addresses: [ { security_group_entries_policy_rule_dst_addresses_subnet: { security_group_entries_policy_rule_dst_addresses_subnet_ip_prefix: '0.0.0.0', security_group_entries_policy_rule_dst_addresses_subnet_ip_prefix_len: '0', }, } ] }, { security_group_entries_policy_rule_direction: '>', security_group_entries_policy_rule_protocol: 'any', security_group_entries_policy_rule_ethertype: 'IPv6', security_group_entries_policy_rule_src_addresses: [ { security_group_entries_policy_rule_src_addresses_security_group: 'local', } ], security_group_entries_policy_rule_dst_addresses: [ { security_group_entries_policy_rule_dst_addresses_subnet: { security_group_entries_policy_rule_dst_addresses_subnet_ip_prefix: '::', security_group_entries_policy_rule_dst_addresses_subnet_ip_prefix_len: '0', }, } ] }, { security_group_entries_policy_rule_direction: '>', security_group_entries_policy_rule_protocol: 'icmp', security_group_entries_policy_rule_ethertype: 'IPv4', security_group_entries_policy_rule_src_addresses: [ { security_group_entries_policy_rule_src_addresses_subnet: { security_group_entries_policy_rule_src_addresses_subnet_ip_prefix: '0.0.0.0', security_group_entries_policy_rule_src_addresses_subnet_ip_prefix_len: '0', }, } ], security_group_entries_policy_rule_dst_addresses: [ { security_group_entries_policy_rule_dst_addresses_security_group: 'local', } ] }, { security_group_entries_policy_rule_direction: '>', security_group_entries_policy_rule_protocol: 'tcp', security_group_entries_policy_rule_ethertype: 'IPv4', security_group_entries_policy_rule_src_addresses: [ { security_group_entries_policy_rule_src_addresses_subnet: { security_group_entries_policy_rule_src_addresses_subnet_ip_prefix: '0.0.0.0', security_group_entries_policy_rule_src_addresses_subnet_ip_prefix_len: '0', } } ], security_group_entries_policy_rule_dst_addresses: [ { security_group_entries_policy_rule_dst_addresses_security_group: 'local', } ], security_group_entries_policy_rule_dst_ports: [ { security_group_entries_policy_rule_dst_ports_start_port: '22', security_group_entries_policy_rule_dst_ports_end_port: '22', } ] } ] } flavor: type: OS::Nova::Flavor properties: disk: 3 name: { list_join: [ '_', [ get_param: stack_prefix, "flavor" ] ] } ram: 1024 vcpus: 2 server_port: type: OS::Neutron::Port properties: network_id: { get_resource: private_network } binding:vnic_type: 'normal' security_groups: [ { get_resource: security_group } ] server: type: OS::Nova::Server properties: name: { list_join: [ '_', [ get_param: stack_prefix, "server" ] ] } image: { get_param: server_image } flavor: { get_resource: flavor } availability_zone: { get_param: availability_zone } networks: - port: { get_resource: server_port } server_fip: type: OS::ContrailV2::FloatingIp properties: floating_ip_pool: { get_param: floating_ip_pool } virtual_machine_interface_refs: [{ get_resource: server_port }] outputs: server_fip: description: Floating IP address of server in public network value: { get_attr: [ server_fip, floating_ip_address ] }
Create an environment file to define values to put in the variables in the template file:
parameters: stack_prefix: <STACK_NAME> project: <PROJECT> public_network_id: <PUBLIC_NETWORK_ID> floating_ip_pool: <FLOATING_IP_POOL_UUID> server_image: <SERVER_IMAGE>
Use the OpenStack CLI or other client libraries to deploy the defined template:
openstack stack create -e <ENV_FILE_NAME> -t <TEMPLATE_FILE_NAME> <STACK_NAME>
As a result of this procedure, you create and configure the Tungsten Fabric resources as specified in the template.
Use S3 API for MOSK Object Storage
In this section, discover how to harness the S3 API functionality within the OpenStack Object Storage environment.
Prerequisites
Before you start using the S3 API, ensure you have the necessary prerequisites in place. This includes having access to an OpenStack deployment with the Object Storage service enabled and authenticated credentials.
Object Storage service enabled
Verify the presence of the object-store service within the OpenStack
Identity service catalog. If the service is present, the following command
returns endpoints related to the object-store service:
openstack catalog show object-store
If the object-store service is not present in the OpenStack Identity
service catalog, consult your cloud operator to confirm that the Object
Store service is enabled in the kind: OpenStackDeployment resource
controlling your OpenStack installation. The following element must be
present in the configuration:
kind: OpenStackDeployment
spec:
features:
services:
- object-storage
Obtaining the S3 endpoint
When using the Object Storage service endpoint, exclude the final
/swift/v1/... section.
To obtain the endpoint:
openstack versions show --service object-store --status CURRENT \
--interface public --region <desired region> \
-c Endpoint -f value | sed 's/\/swift\/.*$//'
Example output:
https://openstack-store.it.just.works
S3-specific tools configuration
To interact seamlessly with OpenStack Object Storage through the S3 API, familiarize yourself with essential S3-specific tools, such as s3cmd, the AWS Command Line Interface (CLI), and Boto3 SDK for Python.
This section provides concise yet comprehensive configuration examples for utilizing these S3-specific tools allowing users to interact with the Amazon S3 and other cloud storage providers employing the S3 protocol.
s3cmd
S3cmd is a free command-line client designed for uploading, retrieving, and managing data across various cloud storage service providers that utilize the S3 protocol, including Amazon S3.
Example of a minimal s3cfg configuration:
[default]
# use 'access' value from "openstack ec2 credentials create"
access_key = a354a74e0fa3434e8039d0425f7a0b59
# use 'secret' value from "openstack ec2 credentials create"
secret_key = d7c2ca9488dd4c8ab3cff2f1aad1c683
# use hostname of the "openstack-store" service, without protocol
host_base = openstack-store.it.just.works
# important, leave empty
host_bucket =
When configured, you can use s3cmd as usual:
s3cmd -c s3cfg ls # list buckets
s3cmd -c s3cfg mb s3://my-bucket # create a bucket
s3cmd -c s3cfg put myfile.txt s3://my-bucket # upload file to bucket
s3cmd -c s3cfg get s3://my-bucket/myfile.txt myfile2.txt # download file
s3cmd -c s3cfg rm s3://my-bucket/myfile.txt # delete file from bucket
s3cmd -c s3cfg rb s3://my-bucket # delete bucket
AWS CLI
The AWS CLI stands as the official and powerful command-line interface provided by Amazon Web Services (AWS). It serves as a versatile tool that enables users to interact with AWS services directly from the command line. Offering a wide range of functionalities, the AWS CLI facilitates diverse operations, including but not limited to resource provisioning, configuration management, deployment, and monitoring across various AWS services.
To start using the AWS CLI:
Set the authorization values as shell variables:
# use "access" field from created ec2 credentials export AWS_ACCESS_KEY_ID=a354a74e0fa3434e8039d0425f7a0b59 # use "secret" field from created ec2 credentials export AWS_SECRET_ACCESS_KEY=a354a74e0fa3434e8039d0425f7a0b59
Explicitly provide the
--endpoint-urlset to the endpoint of theopenstack-storeservice to every aws CLI command:export S3_API_URL=https://openstack-store.it.just.works aws --endpoint-url $S3_API_URL s3 mb s3://my-bucket aws --endpoint-url $S3_API_URL s3 cp myfile.txt s3://my-bucket aws --endpoint-url $S3_API_URL s3 ls s3://my-bucket aws --endpoint-url $S3_API_URL s3 rm s3://my-bucket/myfile.txt aws --endpoint-url $S3_API_URL s3 rm s3://my-bucket
boto
Boto3 is the official Python3 SDK (Software Development Kit) specifically designed for Amazon Web Services (AWS), providing comprehensive support for various AWS services, including the S3 API for object storage. It offers extensive functionality and tools for developers to interact programmatically with AWS services, facilitating tasks such as managing, accessing, and manipulating data stored in Amazon S3 buckets.
Presuming that you have configured the environment with the same environment variables as in the example for AWS CLI, you can create an S3 client in Python as follows:
import boto3, os
# high level "resource" interface
s3 = boto3.resources("s3", endpoint_url=os.getenv("S3_API_URL"))
for bucket in s3.buckets.all(): # returns rich objects
print(bucket.name)
# low level "client" interface
s3 = boto3.client("s3", endpoint_url=os.getenv("S3_API_URL"))
buckets = s3.list_buckets() # returns raw JSON-like dictionaries
Run Windows guests
Available since MOSK 24.1 TechPreview
MOSK enables users to configure and run Windows guests on OpenStack, which allows for optimization of cloud infrastructure for diverse workloads. This section delves into the nuances of achieving seamless integration between the Windows operating system and MOSK clouds.
Supported Windows versions
The list of the supported Windows versions includes:
Windows 10 22H2
Windows 11 23H2
Note
While Windows operating system of other versions may function, their compatibility is unverified.
Configuring Windows images or flavors
You can configure Windows guests through the image metadata properties
os_distro and os_type or through the flavor extra specs
os:distro and os:type.
Configuration example using image metadata properties:
$ openstack image set $WINDOWS_IMAGE \
--property os_distro=windows \
--property os_type=windows
Also, you have the option to set up Windows guests in a way that supports UEFI Secure Boot and includes an emulated virtual Trusted Platform Module (TPM). This configuration enhances security features for your Windows virtual machines within the OpenStack environment.
Note
Windows 11 imposes a security system requirement, necessitating the activation of UEFI Secure Boot and ensuring that TPM version 2.0 is enabled.
Configuration example for the image with Windows 11:
$ openstack image set $WINDOWS_IMAGE \
--property os_distro=windows \
--property os_type=windows \
--property hw_firmware_type=uefi \
--property hw_machine_type=q35 \
--property os_secure_boot=required \
--property hw_tpm_model=tpm-tis \
--property hw_tpm_version=2.0
Enabling UEFI Secure Boot
To confirm support for the UEFI Secure Boot feature, examine the traits associated with the compute node resource provider:
$ COMPUTE_UUID=$(openstack resource provider list --name $HOST -f value -c uuid)
$ openstack resource provider trait list $COMPUTE_UUID | grep COMPUTE_SECURITY_UEFI_SECURE_BOOT
| COMPUTE_SECURITY_UEFI_SECURE_BOOT |
You can configure the UEFI Secure Boot support through flavor extra specs or
image metadata properties. For x86_64 hosts, enabling secure boot also
necessitates configuring the use of the Q35 machine type.
MOSK enables you to configure this on a per-guest basis
using the hw_machine_type image metadata property.
Configuration example for the image that meets both requirements:
$ openstack image set $IMAGE \
--property hw_firmware_type=uefi \
--property hw_machine_type=q35 \
--property os_secure_boot=required
Enabling vTPM
Caution
MOSK does not support the live migration operation for instances with virtual Trusted Platform Module (vTPM) enabled.
To confirm support for the vTPM feature, examine the traits associated with the compute node resource provider:
$ COMPUTE_UUID=$(openstack resource provider list --name $HOST -f value -c uuid)
$ openstack resource provider trait list $COMPUTE_UUID | grep SECURITY_TPM
| COMPUTE_SECURITY_TPM_1_2 |
| COMPUTE_SECURITY_TPM_2_0 |
A vTPM can be requested for a server through either flavor extra specs or image metadata properties. There are two supported TPM versions: 1.2 and 2.0, along with two models: TPM Interface Specification (TIS) and Command-Response Buffer (CRB). Notably, the CRB model is only supported with version 2.0.
TPM version |
1.2 |
2.0 |
|---|---|---|
TPM Interface Specification (TIS) model |
||
Command-Response Buffer (CRB) model |
Configuration example for a flavor to use the TPM 2.0 with the TIS model:
$ openstack flavor set $FLAVOR \
--property hw:tpm_version=2.0 \
--property hw:tpm_model=tpm-tis
Use the Dynamic Resource Balancer service
Available since MOSK 24.2 TechPreview
The Dynamic Resource Balancer (DRB) service automatically moves OpenStack instances around to achieve more optimal resource usage in a MOSK cluster.
Consult your cloud administrator to determine if this service is enabled in your cloud and which mode is used. The DRB service relies on the OpenStack live migration mechanism to ensure that instances can be seamlessly moved to another hypervisor of its choice.
Note
The live migration mode supports local block storage. The live migration mechanism automatically determines whether Nova should migrate using a local block storage or a shared storage.
Depending on the nature of your workload and configuration of the MOSK cluster, you can explicitly configure the DRB service in two ways:
Opt out of automatic instance migration if your instances are sensitive to live migration. For example, if the instances rely on special local resources such as SR-IOV-based virtual NICs or cannot tolerate CPU throttling.
Opt in to optimize your instance placement at any time. In this case, if the DRB service is configured not to move instances by default, this allows your applications to relocate away from noisy neighbors that are consuming excessive shared resources on a hypervisor.
Prohibit DRB from migrating an instance
If the DRB service in your MOSK cluster is configured to auto-migrate all instances by default, you, as the owner of the instance, can opt out of such automated migrations.
To achieve this, tag your instances with lcm.mirantis.com:no-drb.
For example, using the openstack CLI:
openstack --os-compute-api-version 2.26 server set <server-name-or-id> \
--tag lcm.mirantis.com:no-drb
Successfull execution of the command above produces no output. To revert to the default behavior, use the openstack server unset command in a similar way.
Note
OpenStack instance tags are distinct from metadata (key-value pairs). Therefore, use instance tagging explicitly for this purpose.
Allow DRB to migrate an instance at any time
If the DRB service in your MOSK cloud is configured to
move only specific instances, in order for the placement of your instances
to get automatically optimized, you need to explicitly tag each instance with
lcm.mirantis.com:drb. For example, using the openstack CLI:
openstack --os-compute-api-version 2.26 server set <server-name-or-id> \
--tag lcm.mirantis.com:drb
Successfull execution of the command above produces no output. To revert to the default behavior, use the openstack server unset command in a similar way.
Note
OpenStack instance tags are distinct from metadata (key-value pairs). Therefore, use instance tagging explicitly for this purpose.
Migrate instances
Available since MOSK 24.3
MOSK provides the capability to perform instance migrations for the non-administrative users of the OpenStack cloud.
Consult your cloud administrator to ensure this functionality is available to you. If it is, you may have access to cold migration, live migration, or both. Refer to Instance migration to learn more about these migration types in MOSK.
If migration is available to you as a non-administrative user, it is, by default, a completely scheduler-controlled type of migration. As a user, you do not have the option to select the target host for your instance. Instead, the Compute service scheduler automatically selects the best-suited target host, if one is available.
To perform migrations, you can use any preferred method, including direct API interactions, CLI tools (the openstack client), or the OpenStack Dashboard service.
Configure network trunking in projects
Available since MOSK 25.1 TechPreview
This tutorial provides step-by-step instructions on how to use the Neutron Trunk extension in your project infrastructure. By following this guide, you will learn how to configure trunk ports in OpenStack Neutron, enabling efficient network segmentation and traffic management.
Overview
The Neutron Trunk extension allows a single virtual machine (VM) to connect to multiple networks using a single port. This is achieved by designating one port as the parent port, which handles untagged IP packets, while additional subports receive tagged packets through the IEEE 802.1Q VLAN protocol.
Note
Since MOSK 25.2, configuration of trunk ports is available for Ironic instances as well. To check compatibility with your hardware, contact Mirantis support.
The Neutron Trunk extension is enabled by default.
Environment description
This tutorial uses a predefined environment setup, illustrated in the following diagram:
In this environment, we have three virtual machines (VMs) and two networks with one subnet in each. These subnets have different address pools:
VM1 is connected to
net_Athroughport_A(standard port, no trunking)VM2 is connected to
net_Bthroughport_B(standard port, no trunking)VM3 is connected to both
net_Aandnet_Busing a trunk port:The primary port is attached to
net_AA subport is attached to
net_Bwith VLAN ID100.
All VMs have public network access through floating IP addresses, allowing remote management through SSH.
Preconfigure the environment
Before running the setup commands, ensure that your OpenStack project has
a keypair named test_key available.
To quickly set up the environment, use the following commands:
openstack network create mgmt_net
openstack subnet create mgmt_subnet --network mgmt_net --subnet-range 192.0.2.0/24 --allocation-pool start=192.0.2.2,end=192.0.2.20
openstack router create mgmt_router
openstack router set mgmt_router --external-gateway public
openstack router add subnet mgmt_router mgmt_subnet
openstack security group create test_sg
openstack security group rule create test_sg --remote-ip 0.0.0.0/0
for i in {1..3}; do \
openstack port create --network mgmt_net --fixed-ip subnet=mgmt_subnet,ip-address=192.0.2.2${i} --security-group test_sg mgmt_port${i}; \
openstack floating ip create --port mgmt_port${i} public; \
openstack server create --image Ubuntu-18.04 --flavor m1.tiny_test --key-name test_key --port mgmt_port${i} vm${i}; \
done
openstack network create net_A
openstack subnet create subnet_A --network net_A --subnet-range 192.10.0.0/24 --allocation-pool start=192.10.0.2,end=192.10.0.20
openstack network create net_B
openstack subnet create subnet_B --network net_B --subnet-range 10.0.10.0/24 --allocation-pool start=10.0.10.2,end=10.0.10.20
openstack port create --network net_A --fixed-ip subnet=subnet_A,ip-address=192.10.0.100 --security-group test_sg port_A
openstack port create --network net_B --fixed-ip subnet=subnet_B,ip-address=10.0.10.100 --security-group test_sg port_B
openstack server add port vm1 port_A
openstack server add port vm2 port_B
Now, let’s create trunk ports and test how it works.
Configure Neutron trunk ports
Create ports for the trunk:
openstack port create \ --network net_A \ --fixed-ip subnet=subnet_A,ip-address=192.10.0.120 \ trunk_port port_mac=$(openstack port show trunk_port -c mac_address -f value) openstack port create \ --network net_B \ --mac-address ${port_mac} \ --fixed-ip subnet=subnet_B,ip-address=10.0.10.120 \ trunk_subport
Example of a positive system response:
+-------------------------+-------------------------------------------------------------------------------------------------------+ | Field | Value | +-------------------------+-------------------------------------------------------------------------------------------------------+ | admin_state_up | UP | | binding_vif_type | unbound | | binding_vnic_type | normal | | fixed_ips | ip_address='192.10.0.120', subnet_id='aefc3ce5-8b53-41b0-a97a-887e9f78832b' | | id | 224fc881-e897-4d75-8b9f-0e02544fe3a0 | | mac_address | fa:16:3e:40:09:af | | name | trunk_port | | network_id | 02108a2b-7cf2-4ef4-88f6-d8a101e4d688 | | revision_number | 1 | | status | DOWN | | trunk_details | None | +-------------------------+-------------------------------------------------------------------------------------------------------+ +-------------------------+----------------------------------------------------------------------------------------------------+ | Field | Value | +-------------------------+----------------------------------------------------------------------------------------------------+ | admin_state_up | UP | | binding_vif_type | unbound | | binding_vnic_type | normal | | fixed_ips | ip_address='10.0.10.120', subnet_id='161e3165-e411-4675-921f-875b4004ba0f' | | id | 6dc57f5e-4448-4a9d-ba13-64d96951caaa | | mac_address | fa:16:3e:40:09:af | | name | trunk_subport | | network_id | 66e13174-bead-4560-bf22-620c6df59eef | | revision_number | 1 | | status | DOWN | | trunk_details | None | +-------------------------+----------------------------------------------------------------------------------------------------+
Note
We create
trunk_subportusing the same MAC address as its parenttrunk_port. Neutron developers recommend this approach to avoid issues with ARP spoof protection and the native OVS firewall driver.Create the trunk:
openstack network trunk create \ --parent-port trunk_port \ --subport port=trunk_subport,segmentation-type=vlan,segmentation-id=100 \ trunk_test
Example of a positive system response:
+-------------------+-------------------------------------------------------------------------------------------------+ | Field | Value | +-------------------+-------------------------------------------------------------------------------------------------+ | id | d98b39e6-44a9-4885-a99f-e0bfd346e4cb | | is_admin_state_up | True | | name | trunk_test | | port_id | 224fc881-e897-4d75-8b9f-0e02544fe3a0 | | revision_number | 0 | | status | DOWN | | sub_ports | port_id='6dc57f5e-4448-4a9d-ba13-64d96951caaa', segmentation_id='100', segmentation_type='vlan' | | tags | [] | +-------------------+-------------------------------------------------------------------------------------------------+
Add
trunk_portto the VM3. You can use thetrunk_portname or ID oftrunk_testas a port value when you add it to the VM:openstack server add port vm3 trunk_port
Verify the status of the ports:
openstack port list --network net_A openstack port list --network net_B
Example of a positive system response:
+--------------------------------------+------------+-------------------+-----------------------------------------------------------------------------+--------+ | ID | Name | MAC Address | Fixed IP Addresses | Status | +--------------------------------------+------------+-------------------+-----------------------------------------------------------------------------+--------+ | 224fc881-e897-4d75-8b9f-0e02544fe3a0 | trunk_port | fa:16:3e:40:09:af | ip_address='192.10.0.120', subnet_id='aefc3ce5-8b53-41b0-a97a-887e9f78832b' | ACTIVE | | 94a4133d-1ee9-4e66-b7c8-0fbf45f71670 | port_A | fa:16:3e:60:dc:5f | ip_address='192.10.0.100', subnet_id='aefc3ce5-8b53-41b0-a97a-887e9f78832b' | ACTIVE | +--------------------------------------+------------+-------------------+-----------------------------------------------------------------------------+--------+ +--------------------------------------+---------------+-------------------+----------------------------------------------------------------------------+--------+ | ID | Name | MAC Address | Fixed IP Addresses | Status | +--------------------------------------+---------------+-------------------+----------------------------------------------------------------------------+--------+ | 6dc57f5e-4448-4a9d-ba13-64d96951caaa | trunk_subport | fa:16:3e:40:09:af | ip_address='10.0.10.120', subnet_id='161e3165-e411-4675-921f-875b4004ba0f' | ACTIVE | | bc19ce85-387a-4f30-bf01-3c8251c9c8c9 | port_B | fa:16:3e:62:27:66 | ip_address='10.0.10.100', subnet_id='161e3165-e411-4675-921f-875b4004ba0f' | ACTIVE | +--------------------------------------+---------------+-------------------+----------------------------------------------------------------------------+--------+
Verify the trunk status:
openstack network trunk show trunk_test
Example of a positive system response:
+-------------------+-------------------------------------------------------------------------------------------------+ | Field | Value | +-------------------+-------------------------------------------------------------------------------------------------+ | id | d98b39e6-44a9-4885-a99f-e0bfd346e4cb | | is_admin_state_up | True | | name | trunk_test | | port_id | 224fc881-e897-4d75-8b9f-0e02544fe3a0 | | project_id | 86ff0f08f36d46a592f6273ba417ea54 | | revision_number | 2 | | status | ACTIVE | | sub_ports | port_id='6dc57f5e-4448-4a9d-ba13-64d96951caaa', segmentation_id='100', segmentation_type='vlan' | | tags | [] | +-------------------+-------------------------------------------------------------------------------------------------+
Verify the VM status:
openstack server list
Example of a positive system response:
+--------------------------------------+------+--------+-------------------------------------------------------+--------------+--------------+ | ID | Name | Status | Networks | Image | Flavor | +--------------------------------------+------+--------+-------------------------------------------------------+--------------+--------------+ | 604ebbb1-8c2c-4087-b231-528df7ba5d33 | vm3 | ACTIVE | mgmt_net=10.11.12.134, 192.0.2.23; net_A=192.10.0.120 | Ubuntu-18.04 | m1.tiny_test | | 3de1061b-18aa-4bf7-806f-28c4309de592 | vm2 | ACTIVE | mgmt_net=10.11.12.118, 192.0.2.22; net_B=10.0.10.100 | Ubuntu-18.04 | m1.tiny_test | | a94fe384-9de4-4d75-8b39-2b22d6855f8f | vm1 | ACTIVE | mgmt_net=10.11.12.100, 192.0.2.21; net_A=192.10.0.100 | Ubuntu-18.04 | m1.tiny_test | +--------------------------------------+------+--------+-------------------------------------------------------+--------------+--------------+
Configure IP addresses for new interfaces on the VMs:
On VM1:
ip link ip addr add 192.10.0.100/24 dev ens8 ip link set ens8 up
On VM2:
ip link ip addr add 10.0.10.100/24 dev ens8 ip link set ens8 up
For VM3 we also need to create the VLAN device to receive packets from
trunk_subport. In this example, the configured interface is namedens8:ip link ip link add link ens8 name ens8.100 type vlan id 100 ip addr add 192.10.0.120/24 dev ens8 ip addr add 10.0.10.120/24 dev ens8.100 ip link set ens8 up
Note
In our setup, VMs are running on Ubuntu. If you use another operating system, set the IP addresses correspondingly.
Verify that VM3 can ping VM1 and VM2 through its trunk port:
root@vm3:~# ping -w1 -c1 192.10.0.100 PING 192.10.0.100 (192.10.0.100) 56(84) bytes of data. 64 bytes from 192.10.0.100: icmp_seq=1 ttl=64 time=2.69 ms --- 192.10.0.100 ping statistics --- 1 packets transmitted, 1 received, 0% packet loss, time 0ms rtt min/avg/max/mdev = 2.696/2.696/2.696/0.000 ms root@vm3:~# ping -w1 -c1 10.0.10.100 PING 10.0.10.100 (10.0.10.100) 56(84) bytes of data. 64 bytes from 10.0.10.100: icmp_seq=1 ttl=64 time=5.46 ms --- 10.0.10.100 ping statistics --- 1 packets transmitted, 1 received, 0% packet loss, time 0ms rtt min/avg/max/mdev = 5.465/5.465/5.465/0.000 ms
By following this tutorial, you have successfully configured a trunk port in
OpenStack Neutron. VM3 can now communicate with both net_A and net_B
through a single interface using VLAN segmentation. This setup enables
efficient network management and reduces the number of required ports,
simplifying your infrastructure.
For further customization, refer to the official OpenStack Neutron documentation on trunk port configurations.
Configure per-instance migration mode
Available since MOSK 25.1 TechPreview
MOSK enables cloud users to mark their instances for LCM to handle them individually during host maintenance operations, such as host reboots or data plane restarts. This can be useful if some instances in your environment are sensitive to live migration, allowing you, as a cloud user, to communicate your requirements effectively to the cloud operator and streamline cluster maintenance.
To mark the instances that require individual handling during host
maintenance, assign the
openstack.lcm.mirantis.com:maintenance_action=<ACTION-TAG>
tag to them using the Nova API:
openstack --os-compute-api-version 2.26 server set <SERVER-ID> \
--tag openstack.lcm.mirantis.com:maintenance_action=<ACTION-TAG>
Below is the table that describes the supported tag values.
Tag value |
Description |
|---|---|
|
The instance can be gracefully powered off during a host reboot.
This is equivalent to the |
|
The instance can be live-migrated during maintenance.
This is equivalent to the |
|
The user must be explicitly notified about planned host maintenance.
This is equivalent to the |
Access the bare metal node console
Available since MOSK 25.2 TechPreview
This section explains how to access bare metal nodes through the remote serial console. Login is available from both the web UI and CLI, allowing for simplified operations and reduced manual overhead compared to previous bare metal procedures.
The serial console uses the socat library and is supported by the
ipmi hardware type.
In the MOSK Compute service (OpenStack Nova), the remote serial console is activated automatically for all bare metal nodes. Before you, as the end user, can access the console, the cloud administrator must explicitly enable it for the bare metal node.
Note
The serial console is resource-intensive. Administrators should avoid enabling it for many nodes at the same time.
For example, to enable and verify the console:
openstack baremetal console enable <node-UUID>
openstack baremetal console show <node-UUID>
After the cloud administrator enables the console, the Ironic Conductor service
starts a socat proxy for the node.
Once the cloud administrator has enabled the remote serial console for the bare metal node, you can use it to access this node through either web UI or CLI:
Open the Dashboard and log in to your account.
Navigate to Compute → Instances and select the instance corresponding to the bare metal node you want to access.
Click the Console tab.
This opens the remote serial console session in the browser, allowing you to interact with the bare metal node.
Retrieve the console connection details:
openstack console url show <node-UUID> --serial
Example of system response:
+--------+-----------------------------------------------------------------+ | Type | Url | +--------+-----------------------------------------------------------------+ | serial | ws://127.0.0.1:6083/?token=5f7854b7-bf3a-41eb-857a-43fc33f0b1ec | +--------+-----------------------------------------------------------------+
Use the URL from the output to access the console. For example, using websocat:
websocat ws://127.0.0.1:6083/?token=5f7854b7-bf3a-41eb-857a-43fc33f0b1ec
This opens a terminal-like session directly to the serial console, allowing you to interact with the bare metal node.
Security Guide
This guide provides recommendations on how to effectively use product capabilities to harden the security of a Mirantis OpenStack for Kubernetes (MOSK) deployment.
Note
The guide is being under development and will be updated with new sections in future releases of the product documentation.
CADF audit notifications in OpenStack services
MOSK services can emit notifications in the Cloud Auditing Data Federation (CADF) format, which is a standardized format for event data. The information contained in such notifications describes every action users perform in the cloud and is commonly used by organizations to perform security audits and intrusion detection.
Currently, the following MOSK services support the emission of CADF notifications:
Compute service (OpenStack Nova)
Block Storage service (OpenStack Cinder)
Images service (OpenStack Glance)
Networking service (OpenStack Neutron)
Orchestration service (OpenStack Heat)
DNS service (OpenStack Designate)
Bare Metal service (OpenStack Ironic)
Load Balancing service (OpenStack Octavia)
CADF notifications are enabled in the features:logging:cadf section of
the OpenStackDeployment custom resource. For example:
spec:
features:
logging:
cadf:
enabled: true
The way the notification messages get delivered to the consumers is controlled by the notification driver setting. The following options are supported:
messagingv2- DefaultMessages get posted to the
notifications.infoqueue in the MOSK message bus, which is RabbitMQ
logMessages get posted to a standard log output and then collected by Mirantis StackLight
Configuration example:
spec:
features:
logging:
cadf:
enabled: true
driver: log
Rotation of credentials in OpenStack
MOSK generates all credentials used internally, including two types of credentials generated during the OpenStack deployment:
Credentials for admin users provide unlimited access and enable the initial configuration of cloud entities. Three sets of such credentials are generated for accessing the following services:
OpenStack database
OpenStack APIs (OpenStack admin identity account)
OpenStack messaging
Credentials for OpenStack service users are generated for each deployed OpenStack service. To operate successfully, OpenStack services require three sets of credentials for accessing the following services:
OpenStack database
OpenStack APIs (OpenStack service identity account)
OpenStack messaging
To enhance the information security level, Mirantis recommends changing the passwords of internally used credentials periodically. We suggest changing the credentials every month. MOSK includes an automated routine for changing credentials, which must be triggered manually.
Restarting OpenStack services is necessary to apply new credentials. Therefore, it is crucial to have a smooth transition period to minimize the downtime for the OpenStack control plane. To achieve this, perform the credential rotation as described in Rotate OpenStack credentials.
Firewall configuration
This section includes the details about ports and protocols used in a MOSK deployment.
Container Cloud
Component |
Network |
Protocol |
Port |
Consumers |
|---|---|---|---|---|
Web UI, cache, Kubernetes API, and others |
LCM API/Mgmt |
TCP |
|
External clients |
SSH |
LCM API/Mgmt |
TCP |
22 |
External clients |
Chrony |
LCM_API/Mgmt |
TCP |
323 |
All nodes in management and managed clusters |
NTP |
LCM_API/Mgmt |
UDP |
123 |
All nodes in management and managed clusters |
LDAP |
LCM API/Mgmt |
UDP |
389 |
|
LDAPs |
LCM API/Mgmt |
TCP/UDP |
686 |
Component |
Network |
Protocol |
Port |
|---|---|---|---|
Ironic |
LCM 0 |
TCP/UDP |
|
Ironic syslog |
PXE |
TCP/UDP |
|
Ironic image repo |
PXE |
TCP |
80 |
MKE/Kubernetes API |
LCM 0 |
TCP/UDP |
|
BOOTP |
PXE |
UDP |
68 |
DHCP server |
PXE |
UDP |
67 |
IPMI |
PXE/LCM 0 |
TCP/UDP |
|
SSH |
PXE/LCM |
TCP |
22 |
DNS |
LCM 0 |
TCP/UDP |
53 |
NTP |
LCM 0 |
TCP/UDP |
123 |
TFTP |
PXE |
UDP |
69 |
LDAP |
LCM 0 |
TCP |
636 |
HTTPS |
LCM 0 |
TCP |
443, 6443 |
StackLight |
LCM 0 |
TCP |
|
NetChecker Since MCC 2.30.0 (21.0.0 and 20.0.0) |
All networks 2 |
ICMP |
n/a |
Mirantis Kubernetes Engine
For available Mirantis Kubernetes Engine (MKE) ports, refer to MKE Documentation: Open ports to incoming traffic.
StackLight
The tables below contain the details about ports and protocols used by different StackLight components.
Warning
This section does not describe communications within the cluster network.
User interfaces
Component |
Network |
Direction |
Port/Protocol |
Consumer |
Comments |
|---|---|---|---|---|---|
Alerta UI |
External network (LB service) |
Inbound |
443/TCP/HTTPS |
Cluster users |
Add the assigned external IP to the |
Alertmanager UI |
External network (LB service) |
Inbound |
443/TCP/HTTPS |
Cluster users |
Add the assigned external IP to the |
Grafana UI |
External network (LB service) |
Inbound |
443/TCP/HTTPS |
Cluster users |
Add the assigned external IP to the |
OpenSearch Dashboards UI |
External network (LB service) |
Inbound |
443/TCP/HTTPS |
Cluster users |
Only when the StackLight logging stack
is enabled. Add the assigned external IP to the |
Prometheus UI |
External network (LB service) |
Inbound |
443/TCP/HTTPS |
Cluster users |
Add the assigned external IP to the |
Alertmanager notifications receivers
Component |
Network |
Direction |
Port/Protocol |
Destination |
Comments |
|---|---|---|---|---|---|
Alertmanager Email notifications integration |
Cluster network |
Outbound |
TCP/SMTP |
Depends on the configuration, see the comment. |
Only when email notifications
are enabled. Add an SMTP host URL to the |
Alertmanager Microsoft Teams notifications integration |
Cluster network |
Outbound |
TCP/HTTPS |
Depends on the configuration, see the comment. |
Only when Microsoft Teams notifications
are enabled. Add a webhook URL to the |
Alertmanager Salesforce notifications integration |
Cluster network |
Outbound |
TCP/HTTPS |
For Mirantis support mirantis.my.salesforce.com and login.salesforce.com. Depends on the configuration, see the comment. |
Only when Salesforce notifications
are enabled. Add an SF instance URL and an SF login URL to the |
Alertmanager ServiceNow notifications integration |
Cluster network |
Outbound |
TCP/HTTPS |
Depends on the configuration, see the comment. |
Only when notifications to ServiceNow
are enabled. Add a configured ServiceNow URL to the |
Alertmanager Slack notifications integration |
Cluster network |
Outbound |
TCP/HTTPS |
Depends on the configuration, see the comment. |
Only when notifications to Slack
are enabled. Add a configured Slack URL to the |
Notification integration of Alertmanager generic receivers |
Cluster network |
Outbound |
Customizable, see the comment |
Depends on the configuration, see the comment. |
Only when any custom Alertmanager integrations
is enabled. Depending on the integration type, add the corresponding URL to the |
External integrations
Component |
Network |
Direction |
Port/Protocol |
Destination |
Comments |
|---|---|---|---|---|---|
Salesforce reporter |
Cluster network |
Outbound |
TCP/HTTPS |
For Mirantis support mirantis.my.salesforce.com and login.salesforce.com. Depends on the configuration, see the comment. |
Only when the Salesforce reporter
is enabled. Add a SF instance URL and SF login URL to the |
Prometheus Remote Write |
Cluster network |
Outbound |
TCP |
Depends on the configuration, see the comment. |
Only when the Prometheus Remote Write
feature is enabled. Add a configured remote write destination URL to the |
Prometheus custom scrapes |
Cluster network |
Outbound |
TCP |
Depends on the configuration, see the comment. |
Only when the Custom Prometheus scrapes
feature is enabled. Add configured scrape targets to the |
Fluentd remote syslog output |
Cluster network |
Outbound |
TCP or UDP (protocol and port are configurable) |
Depends on the configuration, see the comment. |
Only when the Logging to remote Syslog
feature is enabled. Add a configured remote syslog URL to the |
Metric Collector |
Cluster network |
Outbound |
9093/TCP or 443/TCP |
Applicable to management clusters only. Add a specific URL from Microsoft Azure to the 9093/TCP applies if proxy is disabled. 443/TCP applies if proxy is enabled. |
|
External Endpoint monitoring |
Cluster network |
Outbound |
TCP/HTTP(S) |
Depends on the configuration, see the comment. |
Only when the External endpoint monitoring
feature is enabled. Add configured monitored URLs to the |
SSL certificate monitoring |
Cluster network |
Outbound |
TCP/HTTP(S) |
Depends on the configuration, see the comment. |
Only when SSL certificates monitoring feature is enabled.
Add configured monitored URLs to the |
Metrics exporters
Component |
Network |
Direction |
Port/Protocol |
Consumer |
Comments |
|---|---|---|---|---|---|
Prometheus Node Exporter |
Host network |
Inbound (from cluster network) |
|
Prometheus from the |
Prometheus from Cluster network scrape metrics from all nodes. |
Fluentd (Prometheus metrics endpoint) |
Host network |
Inbound (from cluster network) |
24231/TCP |
Prometheus from the |
Only when the StackLight logging stack is enabled. Prometheus from the cluster network scrapes metrics from all nodes. |
Calico node |
Host network |
Inbound (from cluster network) |
9091/TCP |
Prometheus from the |
Prometheus from cluster network scrape metrics from all nodes. |
Telegraf SMART plugin |
Host network |
Inbound (from cluster network) |
9126/TCP |
Prometheus from the |
Prometheus from cluster network scrapes metrics from all nodes. |
MKE Manager API |
Host network |
Inbound (from cluster network) |
4443/TCP |
Blackbox exporter from the |
Applicable to Master node only. Blackbox exporter from cluster network probes all master nodes. |
MKE Metrics Engine |
Host network |
Inbound (from cluster network) |
12376/TCP |
Prometheus from the |
Prometheus from cluster network scrape metrics from all nodes. |
Kubernetes Master API |
Host network |
Inbound (from cluster network) |
5443/TCP |
Blackbox exporter from the |
Applicable to Master node only. Blackbox exporter from cluster network probes all master nodes. |
Libvirt Exporter |
Host network |
Inbound (from cluster network) |
9177/TCP |
Blackbox exporter from the |
Prometheus from cluster network scrapes metrics from all compute nodes. |
TF Controller Exporter |
Host network |
Inbound (from cluster network) |
9779/TCP |
Blackbox exporter from the |
Applicable to MOSK with Tungsten Fabric deployments only. Prometheus from Cluster network scrapes metrics from all Tungsten Fabric control nodes. |
TF vRouter Exporter |
Host network |
Inbound (from cluster network) |
9779/TCP |
Blackbox exporter from the |
Applicable to MOSK with Tungsten Fabric deployment only. Prometheus from Cluster network scrapes metrics from all compute nodes. |
Container Cloud telemetry
Component |
Network |
Direction |
Port/Protocol |
Consumer |
Destination |
Comments |
|---|---|---|---|---|---|---|
Telemeter client |
Cluster network |
Outbound (to management cluster External LB) |
443/TCP |
n/a |
Telemeter server on a management cluster ( |
The Telemeter client on the MOSK cluster pushes
metrics to the |
Telemeter server |
External network (LB service) |
Inbound (from managed cluster network) |
443/TCP |
Telemeter client on managed clusters |
n/a |
Applicable to management clusters only. The Telemeter client on the managed cluster pushes metrics to the Telemeter server on the management cluster. |
Ceph
Ceph monitors use their node host networks to interact with Ceph daemons. Ceph daemons communicate with each other over a specified cluster network and provide endpoints over the public network.
The messenger V2 (msgr2) or earlier V1 (msgr) protocols are used for
communication between Ceph daemons.
Ceph daemon |
Network |
Protocol |
Port |
Description |
Consumers |
|---|---|---|---|---|---|
Manager ( |
Cluster network |
msgr/msgr2 |
6800,
9283
|
Listens on the first available port of the 6800-7300 range.
Uses 9283 port for exporting metrics.
|
csi-rbdplugin,csi-rbdprovisioner,rook-ceph-mon |
Metadata server ( |
Cluster network |
msgr/msgr2 |
6800 |
Listens on the first available port of the 6800-7300 range |
csi-cephfsplugin,csi-cephfsprovisioner |
Monitor ( |
LCM host network |
msgr/msgr2 |
msgr:3300,
msgr2:6789
|
Monitor has separate ports for |
Ceph clients
rook-ceph-osd,rook-ceph-rgw |
Ceph OSD ( |
Cluster network |
msgr/msgr2 |
6800-7300 |
Binds to the first available port from the 6800-7300 range |
rook-ceph-mon,rook-ceph-mgr,rook-ceph-mds |
Ceph network policies
Available since MOSK 24.1
Ceph Controller uses the NetworkPolicy objects for each Ceph daemon.
Each NetworkPolicy is applied to a pod with defined labels in the
rook-ceph namespace. It only allows the use of the ports specified in the
NetworkPolicy spec. Any other port is prohibited.
Ceph daemon |
Pod label |
Allowed ports |
|---|---|---|
Manager ( |
|
6800-7300,
9283
|
Monitor ( |
|
3300,
6789
|
Ceph OSD ( |
|
6800-7300 |
Metadata server ( |
|
6800-7300 |
Ceph Object Storage ( |
|
Values of the following fields in the Ceph cluster CR
spec:objectStorage.rgw.gateway.portobjectStorage.rgw.gateway.securePort |
MOSK
Communications between Mirantis OpenStack for Kubernetes (MOSK) components are provided by the Calico networking. All internal communications occur through the Calico tunnel through the VXLAN or WireGuard protocols.
Note
Since Container Cloud 2.29.0 (Cluster releases 17.4.0 and 16.4.0), WireGuard is deprecated. If you still require the feature, contact Mirantis support for further information.
Caution
These ports are only used for in-cluster communications. Open them only to a trusted network and never at a perimeter firewall.
Component |
Protocol |
Port |
Description |
|---|---|---|---|
Calico VXLAN |
UDP |
4792 |
Calico networking with VXLAN enabled |
Calico WireGuard |
UPD |
51820 |
Calico networking with IPv4 Wireguard enabled |
In-cluster communications between MetalLB speaker components are done using the LCM network. MetalLB components also provide metrics to be collected by StackLight.
Caution
These ports are only used for in-cluster communications. Open them only to a trusted network and never at a perimeter firewall.
Component |
Protocol |
Port |
Description |
|---|---|---|---|
MetalLB MemberList |
TCP/UDP |
7947 |
MetalLB speaker communications using MemberList |
MetalLB metrics |
TCP |
7472 |
MetalLB controller & speaker metrics |
OpenStack
The table below describes OpenStack internal protocols and ports used outside the Calico networking.
Component |
Network |
Protocol |
Port |
Description |
Consumers |
|---|---|---|---|---|---|
Nova |
Live migration network |
TCP |
8022 |
SSH transport for migration |
|
Libvirt |
Live migration network |
TCP |
16509 |
Libvirt |
|
Libvirt |
Live migration network |
TCP |
5900-6923 |
VNC ports accessed from noVNC Proxy |
nova-novncproxy,nova-spiceproxy |
Neutron |
Tunnel network |
UDP |
4790 |
Neutron tenant networks |
|
Neutron/IPsec |
Tunnel network |
UDP |
500 |
IKE/ISAKMP |
|
Neutron/IPsec |
Tunnel network |
ESP (50) |
|
||
Neutron/IPsec |
Tunnel network |
AH (51) |
|
||
Ironic |
OpenStack bare metal network |
TCP |
8080 |
NGINX HTTP storage |
Bare metal nodes |
Ironic |
OpenStack bare metal network |
UDP |
69 |
TFTP |
Bare metal nodes |
Component |
Network |
Protocol |
Port |
Description |
|---|---|---|---|---|
Ingress |
MetalLB |
TCP |
80, 443 |
Public OpenStack endpoints |
Designate/PowerDNS |
MetalLB |
UDP/UDP |
53 |
PowerDNS backend |
Tungsten Fabric
The table below describes Tungsten Fabric internal protocols and ports used outside the Calico networking.
Component |
Network |
Protocol |
Port |
Description |
Consumers |
|---|---|---|---|---|---|
TF vRouter |
MPLSoUDP Tunnel networks |
UDP |
6635, 51234 |
Tenant networks |
TF vRouter |
TF vRouter |
VxLAN Tunnel Networks |
UDP |
4789 |
Tenant networks |
TF vRouter |
Introspect |
Management network |
TCP |
8085, 8083 |
All TF services |
|
BGP peering |
Management or data network |
TCP |
1179 |
TF controller |
|
XMPP peering |
Management or data network |
TCP |
5269 |
Component |
Network |
Protocol |
Port |
Description |
|---|---|---|---|---|
Ingress |
MetalLB |
TCP |
80,443 |
Public TF endpoints including API and web UI |
TF DNS |
MetalLB |
UDP/UDP |
53 |
DNS backend |
OpenStack API access policies
OpenStack provides operators with fine-grained control over access to API endpoints and actions through access policies. These policies allow cloud administrators to restrict or grant access based on roles and the current request context, such as the project, domain, or system.
OpenStack services come with a set of default policy rules that are generally sufficient for most users. However, for specific use cases, these policies may need to be modified.
MOSK enables you to define custom policies through
the OpenStackDeployment custom resource. For configuration details,
refer to features:policies.
New and legacy defaults
Since the Victoria release, OpenStack has effectively maintained two sets of default policies for each of its services.
Legacy default policies
With the legacy default policies, only the admin role has a dedicated
meaning. Granting this role to a user in any context provides global
administrative access to the service APIs.
Any other role within the project grants the user standard access, enabling them to create resources as well.
New default policies
The new default policies are based on the enhanced capabilities of updated
OpenStack Keystone. They incorporate the hierarchical default roles, such
as reader, member, and admin, as well as system scope.
How both sets of default policies work together
If a policy rule is explicitly defined by the deployment or by the cloud
operator through the OpenStackDeployment custom resoruce, only that
rule is enforced.
If no explicit API access rule is set, MOSK applies both
the legacy and new policy sets simultaneously. Each API access request is
checked by both sets, and access is granted if either of the policy sets
allows it. This behavior is controlled by the
[oslo_policy] enforce_new_defaults configuration option, which is set
individually for each OpenStack service. Setting this option to True
ensures that API access to this service is evaluated only against
the new default policies.
Caution
Mirantis does not recommend enforcing the new default policies.
Our test results indicate that these policies are not yet consistently reliable across all services. Additionally, as of the OpenStack Antelope release, the new default policies have not undergone extensive testing in the upstream development.
Enforcing or using the new default policies may lead to unexpected consequences potentially affecting LCM operations such as running Tempest tests, performing automatic live migrations during node maintenance, and so on.
Changes to upstream default policies in MOSK
MOSK deploys OpenStack with certain upstream policies customized and additional fine-grained policies that are not present in upstream. The following list provides details on these policies.
Barbican
A user with this role can decode any Barbican secret in any project.
This role is specifically granted to the service user performing automatic instance live migrations during node maintenance. Granting this role to the service user enables them to live migrate instances that use encrypted volumes.
By default, upstream policies restrict secret decryption to either user who created the secret or the administrator of the corresponding project.
Available since MOSK 23.1
A user can automatically clean up orders, preventing them from accumulating and causing the Barbican database to grow uncontrollably.
By default, upstream policies allow a user with the creator role to create
orders. However, they restrict order deletion to the project administrator.
Nova
Available since MOSK 24.3
Refer to Instance migration for details.
By default, upstream policies restrict cold migrations to administrative users only.
Available since MOSK 24.3
Refer to Instance migration for details.
By default, upstream policies restrict live migration to administrative users only, without the ability to distinguish between different types of live migration.
Available since MOSK 25.1
A cloud operator can define flexible rules to control assignment and removal of specific server tags to and from OpenStack instances. These rules allow the operator to restrict tag assignment and removal based on their value.
Per-tag server tag policies include the following:
os_compute_api:os-server-tags:update:{tag_name}Restricts access to the APIs for creating instances, adding tags, and replacing tags
os_compute_api:os-server-tags:delete:{tag_name}Restricts access to the APIs for deleting a single tag, deleting all tags, and replacing existing tags
For example, to ensure that only administrators can exclude specific instances from migration by the DRB service, the operator can configure the following policies through the
OpenStackDeploymentcustom resource:kind: OpenStackDeployment spec: features: policies: nova: os_compute_api:os-server-tags:update:lcm.mirantis.com:no-drb: rule:admin_api os_compute_api:os-server-tags:delete:lcm.mirantis.com:no-drb: rule:admin_api
Data protection
MOSK offers various mechanisms to ensure data integrity and confidentiality. This section provides an overview of the data protection capabilities available in MOSK.
Data encryption capabilities
This section provides an overview of the data protection capabilities available in MOSK, focusing primarily on data encryption. You will gain insights into different data encryption features of MOSK, understand the type of data they protect, where encryption occurs concerning cloud boundaries, and whether these mechanisms are available by default or require explicit enablement by the cloud operator or cloud user.
Data protection capability |
Data category |
Data |
Protection type |
Protection boundaries |
Availability |
|---|---|---|---|---|---|
User, system |
Cloud control plane traffic |
In-flight |
Cloud control plane including all the nodes |
Disabled by default.
Enabled by the cloud operator.
|
|
User |
Instance VNC console access traffic |
In-flight |
Cloud user - Compute hypervisor |
Disabled by default.
Enabled by the cloud operator.
|
|
Application |
Instance network traffic |
In-flight |
Private network |
Disabled by default.
Enabled by the cloud operator.
|
|
Application |
Volumes |
In-flight and at-rest |
Compute hypervisor - storage cluster |
Disabled by default.
Enabled by the cloud operator.
Activated by the cloud user per each volume.
|
|
Ephemeral storage encryption |
Application |
Instances ephemeral storage |
At-rest |
Compute hypervisor |
Disabled by default.
Enabled by the cloud operator per compute node.
|
Object storage server-side encryption |
Application |
Object data |
In-flight and at-rest |
Cloud API - Storage cluster |
Enabled by default.
Activated by the cloud user per object bucket.
|
Application |
Inside memory and ephemeral storage |
In-flight |
Source hypervisor - Target hypervisor |
Disabled by default.
Enabled by the cloud operator.
|
|
API communications encryption |
User |
User communication with the cloud API |
In-flight |
Cloud user - Cloud API |
Always enabled. |
Application |
Application secrets |
At-rest |
HashiCorp Vault service 0 |
Disabled by default.
Enabled by the cloud operator.
|
|
System |
OpenStack configuration secrets |
At-rest |
MOSK underlay Kubernetes cluster |
Always enabled.
Activated by the cloud operator per configuration secret.
|
|
Application |
OpenStack database data |
In-flight |
OpenStack controller |
Disabled by default.
Enabled by the cloud operator.
|
- 0
Communication between HashiCort Vault and Key Manager is protected with TLS/SSL
Encryption of live migration data
Available since MOSK 23.2
Live migration enables the seamless movement of a running instance to another node within the cluster, ensuring uninterrupted access to the virtual workload.
In MOSK, the native TLS encryption feature is available for QEMU and libvirt, securing all data transports, including disks not on shared storage. Additionally, the libvirt daemon exclusively listens to TLS connections.
To establish a TLS environment, encompassing CA, server, and client certificates, the relevant compute nodes automatically generate these components. By default, these certificates are encrypted with a 2048-bit RSA private key and are valid for 3650 days.
You can easily enable live migration over TLS by configuring the
features:nova:libvirt:tls parameter in the OpenStackDeployment custom
resource. For reference, see Configuring live migration.
Caution
Instances started before enabling secure live migration will not support live migration.
The issue arises due to the SSL certificates for live migration with QEMU native TLS being generated during the service update. Thus, these certificates do not exist in the libvirt container when existing instances were started. Consequently, QEMU processes of those instances lack the required SSL certificate information, leading to migration failures with an internal error:
internal error: unable to execute QEMU command ‘object-add’: Unable to access credentials /etc/pki/qemu/ca-cert.pem: No such file or directory
As a workaround, stop and then start the instances that failed to live migrate. This process will create new QEMU processes within the libvirt container, ensuring the availability of TLS certificate details.
Encryption of cloud control plane communications
Deprecated since MOSK 25.1
In a cloud infrastructure, the components comprising the cloud control plane exchange messages that may contain sensitive information, such as cloud configuration details, application and cloud user credentials, and other essential data that an attacker can use to highjack the cloud. Encrypting the control plane traffic is crucial for data confidentiality and overall security of the cloud.
MOSK offers the ability to encrypt its control plane communication by means of encapsulating the in-cluster traffic of the underlying Kubernetes into a WireGuard mesh network built across its nodes.
Note
Since Container Cloud 2.29.0 (Cluster releases 17.4.0 and 16.4.0), WireGuard is deprecated. If you still require the feature, contact Mirantis support for further information.
Benefits of the WireGuard encryption
When an attacker is able to intercept the traffic between the nodes of a MOSK cluster but does not have access to the nodes themselves, WireGuard ensures the following:
- Data confidentiality
Any intercepted traffic remains unreadable, especially the traffic of those components of the MOSK control plane that do not enable SSL/TLS encryption on the application level and rather rely on the underlying networking layer.
- Data integrity
Alterations in traffic are detectable, ensuring that no tampering has occurred during transit.
- Authentication
Only machines with valid cryptographic credentials can join the network and exchange data.
Communications protected by WireGuard encryption
The following control plane components can have their communications protected with the WireGuard encryption:
OpenStack database (MariaDB)
OpenStack message bus (RabbitMQ)
OpenStack internal API
OpenStack services interacting with auxiliary components, such as memcached, RedisDB, and PowerDNS
Interaction between StackLight internal components, including collection of metrics from OpenStack, Ceph, and other subsystems
Tungsten Fabric auxiliary components that include ZooKeeper, Kafka, Cassandra database, Redis database, and RabbitMQ
Communications not protected by WireGuard encryption
All components of the cloud control plane that require explicit firewall rules configuration as per MOSK firewall configuration guide utilize the Kubernetes host network mode for their pods, and, therefore, cannot be protected by WireGuard.
Enabling the WireGuard encryption
By default, the WireGuard encryption of the control plane communications is not enabled in MOSK. However, it is possible to enable the encryption upon initial deployment or later.
For the configuration details and possible downtime for the cloud control plane, read about the Enable WireGuard parameter in Create a managed bare metal cluster.
When enabling WireGuard, make sure to configure the Calico MTU size correctly. It must be at least 60 bytes smaller than the interface MTU size of the workload network.
How the WireGuard encryption works
Protocols and ports:
WireGuard operates on UDP and uses a single port for all traffic. Usually it is port
51820. Therefore, ensure that this port is open in your firewall.See also
Key generation, distribution, and rotation:
WireGuard uses public-private ECDH key pairs for secure handshake between the nodes of the cluster. Each node obtains its unique pair, with the public key shared across other nodes. A key pair persists indefinitely unless the node is reprovisioned and re-added to the cluster.
The handshake procedure establishes symmetric keys used for traffic encryption and automatically re-occurs every few minutes to ensure data security.
WireGuard encryption characteristics
Characteristic |
Details |
|---|---|
Handshake |
WireGuard uses the Noise_IK handshake from Noise framework, building on the work of CurveCP, NaCL, KEA+, SIGMA, FHMQV, and HOMQV |
Cipher |
WireGuard uses the ChaCha20 cipher for symmetric encryption, authenticated with Poly1305 |
Key length |
The symmetric encryption key length is 256 bits |
Impact on cloud performance
While WireGuard is designed for efficiency, enabling encryption introduces some overhead.
Caution
The impact can vary depending on the cloud scale and usage profile.
You may experience the following:
A slight increase in CPU utilization on the MOSK cluster nodes.
Less than 30% loss of network throughput, which, given the cluster is designed according to Mirantis recommendations, does not impact control plane communications of an average cloud.
Compliance
This section provides insights into the standards and regulatory requirements that MOSK adheres to, ensuring a secure and compliant environment that you can trust.
Federal Information Processing Standards (FIPS)
This section describes enabling and maintaining FIPS compliance in Mirantis OpenStack for Kubernetes (MOSK). It covers the concepts of FIPS compliance and certification, the importance of compliance, and how the latter applies to the host operating system, container runtime and Kubernetes components, and OpenStack and supporting infrastructure services.
What is FIPS?
The Federal Information Processing Standards (FIPS) are a set of publicly announced standards developed by the U.S. National Institute of Standards and Technology (NIST). They define security and interoperability requirements for cryptographic modules, data protection, and system integrity.
One of the most widely recognized is FIPS 140-3, which specifies security requirements for cryptographic modules used to protect sensitive information. It ensures that encryption algorithms, key management processes, and cryptographic implementations meet rigorous testing and validation standards.
FIPS compliance vs. FIPS certification
FIPS compliance requires that a system is configured to use only FIPS-approved algorithms and FIPS-certified cryptographic modules. Compliance is typically self-declared by the organization.
FIPS certification indicates that a cryptographic module has been formally tested and validated by NIST under the Cryptographic Module Validation Program (CMVP) and appears on the official NIST list.
To sum up, certification applies to cryptographic modules, while compliance applies to how you configure and use them.
Why FIPS compliance is important
FIPS compliance is mandatory for U.S. federal agencies and many organizations in regulated sectors, including healthcare, finance, and defense. It helps reduce security risks, ensures the use of validated cryptography, and demonstrates alignment with recognized government standards.
FIPS compliance is also a foundational prerequisite for higher-level certifications, such as the Federal Risk and Authorization Management Program (FedRAMP) — a U.S. government program that standardizes security assessment, authorization, and continuous monitoring for cloud services used by federal agencies.
Achieving FedRAMP certification:
Confirms adherence to stringent, prescriptive security controls
Simplifies procurement by federal agencies
Enables service operation in highly regulated markets
For MOSK, enabling FIPS compliance is a critical first step toward meeting FedRAMP and similar high-assurance security requirements. FedRAMP certification can significantly expand the value proposition for cloud providers by opening access to U.S. federal customers and other highly regulated industries and markets where verified security assurances are essential.
FIPS compliance in MOSK clouds
Enabling FIPS compliance in a MOSK deployment ensures that all cryptographic operations across control, data, and management planes use FIPS-certified modules and FIPS-approved algorithms.
Because MOSK integrates multiple software components, including Kubernetes, OpenStack services, and supporting infrastructure, FIPS readiness must be addressed holistically, covering the host operating system, container runtime, Kubernetes components, and OpenStack services. In addition, since MOSK is a highly flexible solution that supports diverse architectures and offers extensive customization capabilities in the field, achieving FIPS compliance requires a case-by-case approach that accounts for the specific characteristics of each MOSK deployment. However, major common building blocks apply broadly, and this section outlines the primary areas and approaches to achieving compliance:
Host operating system
All MOSK nodes (control, compute, and infrastructure) must run in the FIPS mode at the host operating system level. This ensures that system cryptographic libraries (for example, OpenSSL, libgcrypt) are FIPS-certified and non-approved algorithms are disabled.
Container runtime and Kubernetes components
Container runtimes, such as containerd and Docker, must be configured to leverage FIPS-certified libraries.
Kubernetes components, which include API server, controller manager, scheduler, and kubelet, must perform TLS and other cryptographic operations using FIPS-certified libraries.
OpenStack and supporting infrastructure services
All MOSK services, such as Identity (OpenStack Keystone), Images (OpenStack Glance), Block Storage (OpenStack Cinder), and Compute (OpenStack Nova), must use FIPS-approved ciphers for API endpoints and internal communication.
Python and Java components must rely on FIPS-validated cryptographic providers.
Databases, message queues, load balancers, and storage systems must use FIPS-approved cryptographic algorithms for encryption in transit and at rest.
Host operating system
MOSK relies on Ubuntu as the host operating system. Canonical provides FIPS 140-certified Linux kernels and cryptographic libraries, including OpenSSL, libgcrypt, and GnuTLS, through the Ubuntu Pro subscription (formerly known as Ubuntu Advantage). NIST-accredited labs validate these packages, and subscribers can use them in environments that require official FIPS compliance.
FIPS certification of the Linux kernel and cryptographic libraries often lags behind the release of a new Ubuntu LTS version and its introduction into MOSK. The certification process under the NIST Cryptographic Module Validation Program (CMVP) can take several months. As a result, organizations deploying FIPS-certified environments may need to use slightly older certified kernel versions instead of the latest LTS kernels. This trade-off guarantees compliance but may limit access to newer kernel features, performance improvements, and expanded hardware support.
To enable FIPS mode on Ubuntu hosts in MOSK clusters,
you need an Ubuntu Pro subscription. Canonical provides certified Linux
kernels and cryptographic libraries through dedicated FIPS repository channels,
such as fips-updates (recommended), fips, and fips-preview.
Canonical documents the procedures for attaching a subscription, enabling the appropriate repository, and installing FIPS-certified packages. Operators should follow the official guidance published in the Canonical FIPS documentation.
After completing the steps described there, reboot hosts and validate compliance.
You can manage Ubuntu Pro FIPS settings manually on each host through the CLI or centrally through configuration management systems. In MOSK, this process is best automated through the built-in host operating system configuration subsystem. Use the package module to manage installation of the FIPS kernel and cryptographic libraries. This ensures consistent deployment across all nodes, simplifies lifecycle management of FIPS packages, and integrates seamlessly with MOSK declarative configuration model.
Upgrading Ubuntu hosts running in FIPS mode follows the same process as non-FIPS hosts but requires careful attention to compliance. Not every kernel in standard Ubuntu repositories is FIPS-certified. Attempting to use an uncertified kernel will break compliance.
Always upgrade using the fips-updates channel to ensure certified
modules continue to receive security patches. After each host operating
system upgrade, validate compliance by checking that FIPS is still enabled
on the kernel and verifying package versions against Canonical
certification documentation. If inconsistencies appear, re-enable Ubuntu Pro.
Test upgrades in a staging environment first to confirm both functionality and compliance before deploying to production.
Container runtime and Kubernetes components
MOSK relies on Mirantis Container Runtime (MCR) and Mirantis Kubernetes Engine (MKE) to provide a secure, production-grade Kubernetes underlay. To ensure FIPS compliance at this layer, both the container runtime and the Kubernetes control plane must perform all cryptographic operations through FIPS-certified libraries.
On the runtime side, MCR provides a FIPS 140-2 certified variant available through a dedicated update channel. Operators deploying MOSK in regulated environments should ensure that the FIPS-enabled build of MCR is installed, as documented in the MCR FIPS documentation. Environments using containerd instead of Docker also retain compliance, as containerd inherits its cryptographic functions from the same validated libraries when the FIPS-enabled variant of MCR is in place.
At the orchestration layer, MKE works seamlessly with MCR in FIPS mode. Mirantis has held FIPS 140-2 validation for MCR, MKE, and k0s since 2021, providing an integrated FIPS-capable solution across the container runtime and Kubernetes control plane. For details, see Businesswire Announcement.
For details on enabling and verifying FIPS mode in MKE, refer to MKE security documentation.
For MOSK operators, ensuring FIPS compliance at the container and orchestration layers primarily involves aligning the host operating system with FIPS requirements, deploying the certified MCR variant, and following the official guidance from Mirantis for runtime and Kubernetes configuration.
OpenStack and infrastructure services
Beyond the host operating system and Kubernetes base, FIPS compliance in a MOSK cloud also applies to the OpenStack control plane and the supporting services such as databases, message queues, load balancers, storage, and networking. To stay compliant, all these services must handle encryption, secure communication (TLS), and key management using FIPS-approved libraries.
Most OpenStack services rely on system-level cryptography through Python or OpenSSL. When MOSK runs on FIPS-enabled hosts, these services automatically use FIPS-validated cryptography. For more information, see OpenStack Technical Committee FIPS goal, which outlines the community-wide effort to run OpenStack services in FIPS mode by default and ensure that cryptographic operations across the stack comply with FIPS 140 standards.
Supporting services, such as MariaDB, RabbitMQ, Memcached, and Ceph, must also comply with FIPS rules. These programs typically inherit cryptographic behavior from the host operating system.
Networking in MOSK can be provided by Tungsten Fabric/OpenSDN as an option. Components such as virtual routers and control plane services rely on the same cryptographic libraries as the host. On FIPS-enabled hosts, these networking systems automatically use validated libraries for encryption, authentication, and secure communication between agents, controllers, and analytics services.
Available since MOSK 23.3
TLS encryption for OpenStack APIs, networking, and any other services that expose endpoints through the Kubernetes ingress has been enhanced with a built-in SSL/TLS proxy. This proxy is part of MOSK ingress networking and performs user-to-cloud encryption with a FIPS-validated cryptographic module to ensure that external API traffic always complies with FIPS 140-2 requirements.
Center for Internet Security (CIS) benchmarks for host OS
The Center of Internet Security (CIS) benchmarks for Ubuntu provide prescriptive operating system (OS) hardening guidance aligned with common regulatory frameworks and help reduce host-level risk. CIS-aligned hardening reduces the cluster attack surface and establishes a uniform baseline across nodes, minimizing configuration drift and operational risk.
Running a Ubuntu host OS that is CIS-compliant out of the box delivers a secure, audit-ready baseline on day one: nodes are hardened by default, reducing attack surface and configuration drift across management and workload clusters. Because the baseline is pre-codified, it makes upgrades, reprovisioning, and compliance measurement in the field predictable and low-effort.
CIS-Ubuntu compliance in MOSK
MOSK relies on Ubuntu as the host OS for all bare-metal servers comprising management and MOSK clusters. The benchmark results below reflect the default, out-of-the-box state of the provisioned host. Scores in field clusters may differ based on cluster-specific customizations, for example, enabled services, network settings, or documented exceptions.
The summary of the latest validation results for Ubuntu CIS benchmark is as follows:
Benchmark |
Tenable CIS Ubuntu Linux 22.04 LTS Server L1 v2.0.0, revision 1.10 |
|---|---|
Pass Rate |
87% |
MOSK release |
25.2 |
Operating system |
Ubuntu 22.04 |
Scanner Tool |
Nessus version 10.9.0, build R20004 |
Note
For clusters that are based on Ubuntu 24.04, the validation is ongoing and the results will be published in one of the following releases.
The controls below did not pass this benchmark and are documented exceptions - either not applicable to the MOSK architecture or pending for further analysis. In field deployments, these items can be mitigated on a per-cluster basis, taking into account the specifics of the environment.
Caution
Compliance results can vary across different environments depending on configuration tests, such as server disk partitioning.
Control |
Description |
Comment |
|---|---|---|
1.1.1.8 |
Ensure usb-storage kernel module is not available |
Cluster-specific. The module can be safely disabled in the field. Further investigation is pending to get it removed out of the box. |
1.1.2.1.1 |
Ensure |
Cluster-specific. Disk partitioning is configured at the time of cluster deployment. |
1.1.2.2.4 |
Ensure |
Potentially disruptive to the normal functioning of the product. Further investigation is pending. |
1.2.2.1 |
Ensure updates, patches, and additional security software are installed |
Environment-specific. Cloud operators schedule cluster upgrades in line with the MOSK release cadence along with local policy and regulatory needs. The update cadence of product component versions balances currency and stability. |
1.3.1.2 |
Ensure AppArmor is enabled in the bootloader configuration |
By default, AppArmor is enabled on the host OS level. The bootloader configuration is not yet enforced by the product, but can be customized in the field. |
1.4.1 |
Ensure bootloader password is set |
Bootloader password management is not yet supported by the product, but can be manually performed in the field. |
2.1.18 |
Ensure web server services are not in use |
Exception. Local NGINX is deployed as a part of MOSK and as a proxy to download container images and other artifacts. |
3.3.1 |
Ensure IP forwarding is disabled |
Exception. IP forwarding is required by Kubernetes to operate. |
3.3.2 |
Ensure packet redirect sending is disabled |
Potentially disruptive to the product. Further investigation is pending. |
3.3.5 |
Ensure |
Potentially disruptive to the product. Further investigation is pending. |
3.3.6 |
Ensure secure |
Potentially disruptive to the product. Further investigation is pending. |
3.3.7 |
Ensure reverse path filtering is enabled |
Potentially disruptive to the product. Further investigation is pending. |
3.3.9 |
Ensure suspicious packets are logged |
Not applicable. The control explicitly requires Uncomplicated Firewall (UFW), which is not compatible with Docker and Kubernetes. In MOSK, suspicious packets are logged through other means. |
4.1.3 |
Ensure |
Not applicable. Uncomplicated Firewall (UFW) has compatibility issues with Docker and Kubernetes. |
4.1.4 |
Ensure |
The control explicitly requires Uncomplicated Firewall (UFW), which is not compatible with Docker and Kubernetes. Any alternative solution is potentially disruptive to the product. Further investigation is pending. |
4.1.6 |
Ensure |
The control explicitly requires Uncomplicated Firewall (UFW), which is not compatible with Docker and Kubernetes. Further investigation is pending. |
4.1.7 |
Ensure |
The control explicitly requires Uncomplicated Firewall (UFW), which is not compatible with Docker and Kubernetes. Further investigation is pending. |
5.4.1.5 |
Ensure inactive password lock is configured |
Further investigation is pending. |
5.4.2.4 |
Ensure root password is set |
Environment-specific. Managing root passwords is not yet part of MOSK architecture and needs to be enforced manually. |
5.4.3.2 |
Ensure default user shell timeout is configured |
Potentially disruptive to the product. Further investigation is pending. |
5.4.3.3 |
Ensure default user umask is configured |
Further investigation is pending. |
6.1.1 |
Ensure AIDE is installed |
Impacts the storage IO performance. Further investigation for an alternative is pending. |
6.1.2 |
Ensure filesystem integrity is regularly checked |
Depends on the control 6.1.1 (above). Further investigation is pending. |
6.2.1.2.2 |
Ensure |
Not applicable. MOSK logging is handled by StackLight. |
6.2.1.2.3 |
Ensure |
Not applicable. MOSK logging is handled by StackLight. |
6.2.2.1 |
Ensure access to all logfiles has been configured |
Further investigation is pending. |
7.1.11 |
Ensure world writable files and directories are secured |
MOSK components require specific file access rules inside containers. Further investigation is pending. |
7.1.12 |
Ensure no files or directories without an owner and a group exist |
MOSK components require specific file access rules inside containers. Further investigation is pending. |
Note
The control IDs may differ depending on the scanning tool.
If you require a detailed report of analyzed and fixed compliance checks, contact Mirantis support.
Container images signing and validation
Available since MOSK 24.1 TechPreview
Container Cloud uses policy-controller for signature validation of
pod images. It verifies that images used by the Container Cloud and
Mirantis OpenStack for Kubernetes (MOSK) controllers are signed by a
trusted authority. The policy-controller inspects defined image policies
that list image registries and authorities for signature validation.
The policy-controller validates only pods with image references from
the Container Cloud content delivery network (CDN). Other registries are
ignored by the controller.
The policy-controller supports two modes of image policy validation for
Container Cloud and MOSK images:
warnDefault. Allows controllers to use untrusted images, but a warning message is logged in the
policy-controllerlogs and sent as an admission response.
enforceExperimental. Blocks pod creating and updating operations if a pod image does not have a valid Mirantis signature. If a pod creation or update is blocked in the
enforcemode, send the untrusted artifact to Mirantis support for further inspection. To unblock pod operations, switch to thewarnmode.Warning
The
enforcemode is still under development and is available as an experimental option. Mirantis does not recommend enabling this option for production deployments. The full support for this option will be announced separately in one of the following Container Cloud releases.
In case of unstable connections from the policy-controller to Container
Cloud CDN that disrupt pod creation and update operations, you can disable
the controller by setting enabled: false in the configuration.
The policy-controller configuration is located in the Cluster object:
spec:
...
providerSpec:
value:
...
helmReleases:
...
- name: policy-controller
enabled: [true|false]
values:
policy:
mode: [enforce|warn]
LBaaS certificate
MOSK automatically generates the TLS certificate used by
Octavia Amphora load balancers.
This certificate is stored in the octavia-amphora-tls-certs Kubernetes
secret in the openstack namespace.
It is generated automatically during the initial OpenStack deployment and
is renewed through the automated certificate rotation procedure.
Monitoring certificate expiration
MOSK exports LBaaS certificate expiration information
to StackLight through the osdpl_certificate_expiry metric with the label
octavia-amphora-tls-certs.
The alert is triggered when the certificate is nearing its expiration date
and indicates that a rotation should be scheduled.
Triggering certificate rotation
For detailed instructions on how to perform the automated LBaaS certificate rotation, see Rotate Octavia Amphora (LBaaS) certificates.
FAQ
This section provides answers to common questions about MOSK, and it is designed to help you quickly find the information you need. We have included answers to the most common questions and uncertainties that our users encounter, along with helpful tips and references to step-by-step instructions where required.
The questions with answers in this section are organized by topic. If you cannot find the information you are looking for in this section, search in the whole documentation set. Also, do not hesitate to contact us through the Feedback button. We are always available to answer your questions and provide you with the assistance you need to use our product effectively.
Major and patch releases: updating your cluster
What is the difference between patch and major release versions?
Both major and patch release versions incorporate solutions for security vulnerabilities and known product issues. The primary distinction between these two release types lies in the fact that major release versions introduce new functionalities, whereas patch release versions predominantly offer minor product enhancements.
Patch releases strive to considerably reduce the timeframe for delivering CVE resolutions in images to your deployments, aiding in the mitigation of cyber threats and data breaches.
Content |
Major release |
Patch release |
|---|---|---|
Version update and upgrade of the major product components including but not limited to OpenStack, Tungsten Fabric, Kubernetes, Ceph, and Stacklight 0 |
||
Container runtime changes including Mirantis Container Runtime and containerd updates |
||
Changes in public API |
||
Changes in the Container Cloud and MOSK lifecycle management including but not limited to machines, clusters, Ceph OSDs |
||
Host machine changes including host operating system and kernel updates |
||
Patch version bumps of MKE and Kubernetes |
||
Fixes for Common Vulnerabilities and Exposures (CVE) in images |
||
Fixes for known product issues |
- 0
StackLight subcomponents may be updated during patch releases
Learn more about product releases in MOSK major and patch releases.
What is a product release series?
A product release series is a series of consecutive releases that starts with a major release and includes a number of patch releases built on top of the major release.
For example, the 23.1 series includes the 23.1 major release and 23.1.1, 23.1.2, 23.1.3, and 23.1.4 patch releases.
What is the difference between the new and old update schemes
Starting from MOSK 24.1.5, Mirantis introduces a new update scheme allowing for the update path flexibility. For details, see Update schemes comparison and Release notes: Cluster update scheme.
Is updating to patch release versions mandatory?
No.
Apply patch updates only if you want to receive security fixes as soon as they become available and you are prepared to update your cluster often, approximately once in three weeks.
Otherwise, you can skip patch releases and update only between major releases. Each subsequent major release includes patch release updates of the previous major release.
When planning the update path for your cluster, take into account the release support status included in Compatibility Matrix.
Can I skip patch releases within a single series since 24.1 series?
Yes.
Can I skip patch releases within a single series before 24.1 series?
Yes.
Additonally, before MOSK 24.1 series, it is technically not possible to update to any intermediate release version if the newer patch version has been released. You can update only to the latest available patch version in the series, which contains the updates from all the preceding versions. For example, if your cluster is running MOSK 23.1 and the latest available patch version is MOSK 23.1.2, you must update to 23.1.2 receiving the product updates from 23.1.1 and 23.1.2 at one go.
Moreover, if between the two major releases you apply at least one patch version belonging to the N series, you have to obtain the last patch release in the series to be able to update to the N+1 major release version.
How do I update to a patch version within the same series?
When updating between the patches of the same series, follow the Update to a patch version procedure.
How do I update between major series?
When updating between the series, follow the Cluster update procedure.
How do I update to the next major version if I started receiving patches of the previous series?
Caution
This answer applies only to MOSK 24.1 series. Starting from MOSK 24.1.5, Mirantis introduces a new update scheme allowing for the update path flexibility.
For details, refer to MOSK major and patch releases.
Firstly, if you started receiving patch updates from the previous release series, update your cluster to the latest patch release in that series as described the Update to a patch version procedure.
After, follow the Cluster update procedure to update from the latest patch release in the series to the next major release. It is technically impossible to receive a major release while on any patch release in the previous series other than the last one.
Release Notes
This document provides a high-level overview of new features, known issues, and bug fixes as per MOSK release. It also includes lists of release artifacts and fixed Common Vulnerabilities and Exposures (CVEs). The content is intended to help product users, operators, and administrators stay informed about key changes and improvements to the platform. In addition to release highlights, the document includes update notes to ensure a smooth and informed cluster update process by outlining the update impact, critical pre- and post-update steps, and other relevant information.
The table below shows correlation between the latest supported versions of the management and MOSK clusters.
Note
The management cluster updates automatically whenever a new version becomes available until the update is blocked due to an unsupported MOSK cluster version still running. Therefore, keep in mind that your management cluster can be running newer version while the MOSK cluster remains on an older one. For the full version support matrix, refer to Cluster versions compatibility.
MOSK |
MOSK status 0 |
MOSK management |
MOSK management cluster |
Release date |
|---|---|---|---|---|
Supported |
2.30.0 |
20.0.0 |
2025-09-23 |
|
Deprecated |
2.29.6 |
16.4.6 |
2025-08-11 |
|
Deprecated |
2.29.0 |
16.4.0 |
2025-03-11 |
Release notes for all MOSK versions:
25.2 series
25.2
Release date |
September 23, 2025 |
|---|---|
Name |
MOSK 25.2 |
Cluster release |
21.0.0 |
MOSK management release |
2.30.0 |
MOSK management Cluster release |
20.0.0 |
New features
This section highlights the newly introduced and enhanced capabilities in this release. Each feature includes a brief description and links to related documentation where applicable, so you can quickly explore how to configure and use them.
Implemented full support for OpenStack Epoxy with Open vSwitch (OVS), Tungsten Fabric/OpenSDN, and Open Virtual Network (OVN) networking backends for greenfield deployments and for an upgrade from OpenStack Caracal. To upgrade an existing cloud to Epoxy, follow the Upgrade OpenStack procedure.
For the OpenStack support cycle in MOSK, refer to OpenStack support cycle.
To view the full list of OpenStack Epoxy features from upstream, refer to OpenStack Epoxy upstream documentation: Release notes and source code.
Introduced support for OpenSDN 24.1, successor to Tungsten Fabric, enabling compatibility with latest features, APIs, and enhancements provided by the platform. You can now deploy, configure, and operate your MOSK environment with OpenSDN 24.1 to take advantage of its performance improvements and extended capabilities.
MOSK automatically upgrades Tungsten Fabric 21.4 to OpenSDN 24.1 during the cluster update from the MOSK 25.1 series to the 25.2 release. No extra maintenance window required.
Implemented automatic in-place upgrade of an operating system distribution from Ubuntu 22.04 LTS with kernel 5.15.0-143-generic to 24.04 with kernel 6.8.0-79-generic on management clusters. The distribution upgrade occurs as part of management cluster update that requires reboot of machines.
The feature support for MOSK clusters will be announced separately in one of the following releases.
Switched to a custom version of Mirantis Kubernetes Engine (MKE) with Kubernetes 1.30 and Calico 3.29.3 for both management and MOSK clusters. This MKE release is available exclusively for MOSK. For further details, contact Mirantis support.
Introduced support for Mirantis Container Runtime (MCR) 25.0.12. On existing MOSK clusters, MCR is automatically updated to this version during cluster update.
Learn more
Upgraded Ceph major version from Reef 18.2 to Squid 19.2 with an automatic upgrade of Ceph components on existing MOSK clusters during the Cluster release update.
Ceph Squid also delivers new versions of the following components:
Rook - 1.17
cephcsi- 3.14csi-provisioner- 5.2.0
Upgraded the Keycloak major version from 25.0.6 to 26.2.5. For the list of new features and enhancements, see Keycloak Release Notes.
The upgrade path is fully automated. No data migration or custom LCM changes are required.
Updated the following OpenStack infrastructure components to their latest stable versions:
Major update:
MariaDB 11.4.5/26.4.21
RabbitMQ 4.0.6
Open vSwitch (OVS) 3.3
Open Virtual Network (OVN) 24.03.2
Minor update:
PowerDNS 4.9
Redis 7.4.2
Descheduler 0.32.2
Ingress-controller 1.12.1
Patch update:
Memcached 1.6.38
NGINX 1.27.4
Strongswan 5.9.14
Learn more
Upgraded Alertmanager to version 0.28.1 that supports Alertmanager API v2. To unblock Alertmanager upgrade to this version, removed the deprecated Alertmanager API v1 that is not supported by Alertmanager 0.28.1.
If you rely on the Alertmanager API, ensure that all integrations and configurations are updated to use API v2, which is now the only supported version. Ongoing use of API v1 endpoints will result in errors or broken functionality after this upgrade.
Implemented an automated procedure for rotating TLS certificates of Octavia Amphora load balancers, ensuring certificates are renewed without manual reconfiguration. This reduces operational effort, minimizes downtime, and improves certificate management reliability. Operators can trigger the rotation using the osctl utility.
Expanded support for Open Virtual Network (OVN) as a networking backend for OpenStack to include not only MOSK greenfield deployments but also existing clusters using Open vSwitch (OVS) for networking. The migration tooling and procedure enable in-place migration from OVS with minimal downtime for user workloads.
Introduced the capability to access bare metal nodes through the remote serial console. Login is available from both the web UI and CLI, allowing for simplified operations and reduced manual overhead compared to previous bare metal procedures.
Implemented support for the port trunking capability for Ironic instances
through the networking-generic-switch Neutron driver allowing for a
single NIC/port on a bare metal server to carry traffic for multiple VLANs
simultaneously.
Learn more
Implemented the capability to configure synchronization of the Tungsten Fabric database backups with a remote S3 storage. This feature keeps backups off the control plane nodes for easier disaster recovery and improved data durability, and ensures that the backup data is protected by encryption both in flight and at rest.
Removed Tungsten Fabric analytics that has been unsupported since
MOSK 24.2. On existing clusters, all Tungsten Fabric
analytics services are automatically removed and the
spec.services.analytics section is reset in the TFOperator custom
resource during MOSK cluster update to 25.2.
Added the default graceful_shutdown kubelet profile to all node types. This
profile sets --shutdown-grace-period and
--shutdown-grace-period-critical-pods kubelet flags to 5 minutes and 30
seconds respectively before a planned or unexpected node shutdown. This feature
allows the system to properly prepare itself for maintenance.
On existing clusters, these flags are automatically set after MOSK cluster update to MOSK 25.2.
The corresponding functionality already exists in Kubernetes and MKE. Also, you can gracefully shut down instances running on compute nodes during maintenance reboots.
Introduced general availability support for ClusterUpdatePlan as the only
supported way to update MOSK clusters. This method allows
controlling cluster update by manually launching each update stage. Between
update stages, a cluster remains functional from the perspective of cloud users
and workloads. The feature is available using the management console and API.
Updating a cluster using the cluster.spec.providerSpec.value.release field
is now rejected by admission-controller.
Deprecated the KaaSCephCluster resource of management clusters and moved it
to the following Ceph cluster management resources of MOSK
clusters: MiraCeph, MiraCephHealth, MiraCephSecret, and
MiraCephMaintenance. Also deprecated the management
KaaSCephOperationRequest CR and replaced it by CephOsdRemoveRequest of
a MOSK cluster.
In MOSK 25.2, migration of custom resources from management to MOSK clusters is optional. Although, to prepare for future migration, you can manually test it as described in Migrate KaaSCephCluster from a management to MOSK cluster.
Since MOSK 26.1, this migration will occur automatically.
On existing clusters, after Ceph resources migration, any interaction
with the Ceph cluster will be processed inside MiraCeph,
MiraCephHealth, and MiraCephSecret resources. For comparison between a
management cluster Ceph resource and a MOSK cluster Ceph
resources, see Comparison of KaaSCephCluster and MiraCeph-related specifications.
Introduced support for deviceFilter and devicePathFilter that allow
specifying regexp by a name or path of a device to use for Ceph OSD deployment.
You can add these parameters as deviceLabels for nodeGroups where you
can define N templates of regexp for the whole cluster with device names or
device by-id that you can use in each nodeGroup.
Increased the severity level from warning to critical for
CephOSDSlowClusterNetwork and CephOSDSlowPublicNetwork StackLight
alerts as both can signalize that performance of VM volumes is affected.
Also, updated MOSK Troubleshooting Guide with troubleshooting steps for the networking issues that these alerts signal about.
Added the NovaDataDirectoryMountedRO alert that is triggered when a device
is mounted on the /var/lib/nova directory in read-only mode instead of
read-write one. Such behaviour may indicate potential disk failures. The alert
enables operators to promptly investigate disk health and start evacuating
workloads before the affected device fails completely.
Learn more
Implemented the SystemUptimeCritical and SystemUptimeWarning alerts to
monitor uptime of Kubernetes nodes and prevent unexpected node restarts due to
the known issue AMD erratum 1474
in AMD EPYC™ CPUs of the second generation that may stop responding after 1044
days.
Also, in the scope of this implementation, the cpu.info Node Exporter
collector was enabled by default and the node_cpu_info metric was added to
the prometheus-node-exporter scrape job.
Introduced Keycloak monitoring that allows the operator to monitor internally
available Keycloak endpoints, the status of statefulSets and pods, along
with the status of 4xx and 5xx HTTP responses. The implementation includes the
dedicated set of alerts, the Keycloak Grafana dashboard, as well as
the keycloak_user_events_total and http_server_requests_seconds_count
metrics that are collected by the keycloak scrape job.
Reworked the Node Exporter configuration to optimize operational user experience by providing the following changes:
Added the following
nodeExporterparameters to enable configuration of extra collectors:extraArgsextraVolumesextraVolumeMounts
Added the
NodeExporterCollectorFailurealert that is based on thenode_scrape_collector_successmetricRemoved
conntrackfrom the list of collectors enabled by default, which collects only a subset of supported metrics and fails due to unsupported onesAdded the
bondInterfaceMonitoringparameter to enable the possibility to disable monitoring of bond interfaces
As the final part of the RabbitMQ monitoring rework, implemented the following changes:
Removed the deprecated
prometheus-rabbitmq-exporterscrape job. Instead, use therabbitmq-prometheus-pluginjob, which is based on the native RabbitMQ Prometheus plugin ensuring reliable and direct metric collection.Removed the deprecated RabbitMQ [Deprecated] Grafana dashboard. Instead, use the RabbitMQ Overview and RabbitMQ Erlang dashboards.
Removed the deprecated
RabbitMQDownandRabbitMQExporterTargetDownalerts.
Warning
If you use deprecated RabbitMQ metrics in customizations such as alerts and dashboards, switch to the new metrics and dashboards before updating to MOSK 25.2 to prevent issues once the deprecated metrics and dashboard will be removed.
Implemented alerts for the openstack-cinder-volume service to monitor its
health and signal the user when the service is disabled, when more than 50% of
volume services with same backend are down, or when at least one volume is
down.
Learn more
Added support for configuring the Telegraf S.M.A.R.T input plugin that allows
collecting S.M.A.R.T data for storage devices. Also, added the nodeSelector
support for telegraf-ds-smart.
Introduced the capability to monitor network connectivity between management or MOSK cluster nodes using ping checks. Monitoring the cluster underlay networking allows the operator to:
Reduce the time spent to diagnose outages and restore services
Correlate major software stack issues with the underlying infrastructure outages and visualize this data
Identify the weakest points in the software stack and improve product resilience
Caution
ICMP protocol for ping checks must be allowed within the whole network infrastructure including all baremetal hosts, switches, and routers in-between racks, if any.
On the StackLight side, the following features are available:
CnncAgentDownandCnncNodeDownalerts with corresponding alert dependenciesInfra - Cross Node Connectivity Grafana dashboard
Refactored management of IPAM objects for configuring address allocation for
cluster API endpoints by moving the cluster:spec:loadBalancerHost field
logic into the load-balancer Subnet resource with the ipam/SVC-LBhost
label. This subnet is now mandatory during creation of subnets for a new
cluster.
On existing clusters, the cluster:spec:loadBalancerHost field is
automatically migrated during cluster update to a newly created Subnet
object with the ipam/SVC-LBhost label.
Improved the mechanism of bare metal machines provisioning and deployment by introducing additional stages for management and MOSK cluster deployment as well as for adding a new machine to an existing cluster.
The feature allows for a manual approval of machine provisioning and deployment stages, which drastically decreases the time spent on adjusting configuration of bare metal hosts and machines to fit hardware settings.
Added support for full L3 networking topology in management clusters. The feature enables deployment of management cluster nodes in dedicated racks without the need for L2 layer extension between them.
Analyzed and reached 87% of pass rate in the CIS Benchmark compliance checks executed by the Nessus scanner for Ubuntu Linux 22.04 LTS Server L1 v2.0.0, revision 1.10. Moving forward, results of the latest CIS Benchmark validation will be published as required in the CIS-Ubuntu compliance in MOSK section of the Security Guide.
Caution
For clusters that are based on Ubuntu 24.04, the validation is ongoing and the results will be published in one of the following releases.
Implemented support for deployment of air-gapped clusters that are useful in financial and other security-concerned areas. Such clusters exist in isolated environments that have no Internet connection, neither direct nor proxied. Such an isolated environment provides all required network services, such as NTP, DNS, file resources, image registries, and so on. If required, you can also migrate an existing non-airgapped cluster to an air-gapped one.
Learn more
Finalized integration of the Mirantis Container Cloud (MCC) documentation into the Mirantis OpenStack for Kubernetes (MOSK) documentation set. Now, the MOSK documentation covers all product layers, including MOSK management (formerly MCC). This means everything you need is in one place.
The separate MCC documentation site will be retired soon, so please update your bookmarks for continued easy access to the latest content.
Added documentation explaining how to use the spec:services section
of the OpenStackDeployment custom resource.
Warning
Modifying spec:services may result in the OpenStack
deployment becoming unstable or entering an inconsistent state. This
capability is intended solely for operators with expert-level knowledge
of configuration parameters and their implications, and only in cases
the spec:features section does not offer the required level of
control. Mirantis assumes no responsibility for any issues arising
from the use of the spec:services mechanism.
Known issues
This section describes the MOSK known issues with available workarounds.
During MariaDB operations on a management cluster, Pods may get stuck in continuous restarts with the following example error:
[ERROR] WSREP: Corrupt buffer header: \
addr: 0x7faec6f8e518, \
seqno: 3185219421952815104, \
size: 909455917, \
ctx: 0x557094f65038, \
flags: 11577. store: 49, \
type: 49
Workaround:
Create a backup of the
/var/lib/mysqldirectory on themariadb-serverPod.Verify that other replicas are up and ready.
Remove the
galera.cachefile for the affectedmariadb-serverPod.Remove the affected
mariadb-serverPod or wait until it is automatically restarted.
After Kubernetes restarts the Pod, the Pod clones the database in 1-2 minutes and restores the quorum.
Due to the MetalLB upstream issue, a load balancer service may not obtain the external IP address.
The issue occurs when two services share the same external IP address and have
the same externalTrafficPolicy value. Initially, the services have the
external IP address assigned and are accessible. After modifying the
externalTrafficPolicy value for both services from Cluster to
Local, the first service that has been changed remains with no external IP
address assigned. Though, the second service, which was changed later, has the
external IP assigned as expected.
To work around the issue, make a dummy change to the service object where
external IP is <pending>:
Identify the service that is stuck:
kubectl get svc -A | grep pending
Example of system response:
stacklight iam-proxy-prometheus LoadBalancer 10.233.28.196 <pending> 443:30430/TCP
Add an arbitrary label to the service that is stuck. For example:
kubectl label svc -n stacklight iam-proxy-prometheus reconcile=1
Example of system response:
service/iam-proxy-prometheus labeledVerify that the external IP was allocated to the service:
kubectl get svc -n stacklight iam-proxy-prometheus
Example of system response:
NAME TYPE CLUSTER-IP EXTERNAL-IP PORT(S) AGE iam-proxy-prometheus LoadBalancer 10.233.28.196 10.0.34.108 443:30430/TCP 12d
After a node replacement, a new OVN database cluster is created instead of the replaced node rejoining the existing cluster, causing pod initialization issues.
If you encounter the issue, please contact Mirantis support for the workaround.
Occasionally, the password rotation procedure for admin or service
credentials may incorrectly report success without actually initiating
the rotation process. This can result in unchanged credentials despite
the procedure indicating completion.
To work around the issue, restart the rotation procedure and verify that the credentials have been successfully updated.
After cluster update is completed, the OpenStackDeployment state is stuck
with the APPLYING status.
As a workaround, restart the rockoon pod.
When sending large messages, the following error might appear in logs:
oslo_messaging.exceptions.MessageDeliveryFailure: Unable to connect to AMQP server on openstack-neutron-rabbitmq-rabbitmq-0.rabbitmq-neutron.openstack.svc.cluster.local:5672 after inf tries: Basic.publish: (406) PRECONDITION_FAILED - message size 40744975 is larger than configured max size 16777216
This error occurs because the message size (for example, 40744975 bytes) exceeds the configured RabbitMQ maximum message size (for example, 16777216 bytes), potentially causing discruption of the services relying on the AMQP message.
To work around the issue, increase the max_message_size setting
in the OpenStackDeployment custom rsource before updating to MOSK
25.2:
services:
networking:
rabbitmq:
values:
conf:
rabbitmq:
max_message_size: "67108864"
After node reboot, the rfs-openstack-redis pod may get stuck in the
Completed state blocking synchronization of the Redis cluster.
As a workaround, delete the rfs-openstack-redis pod that remains in the
Completed state:
kubectl -n openstack-redis delete <pod-name>
Rebooting all Cassandra cluster TFConfig or TFAnalytics nodes, maintenance, or other circumstances that cause the Cassandra pods to start simultaneously may cause a broken Cassandra TFConfig and/or TFAnalytics cluster. In this case, Cassandra nodes do not join the ring and do not update the IPs of the neighbor nodes. As a result, the TF services cannot operate Cassandra cluster(s).
To verify that a Cassandra cluster is affected:
Run the nodetool status command specifying the config or
analytics cluster and the replica number:
kubectl -n tf exec -it tf-cassandra-<config/analytics>-dc1-rack1-<replica number> -c cassandra -- nodetool status
Example of system response with outdated IP addresses:
Datacenter: DC1
===============
Status=Up/Down
|/ State=Normal/Leaving/Joining/Moving
-- Address Load Tokens Owns (effective) Host ID Rack
DN <outdated ip> ? 256 64.9% a58343d0-1e3f-4d54-bcdf-9b9b949ca873 r1
DN <outdated ip> ? 256 69.8% 67f1d07c-8b13-4482-a2f1-77fa34e90d48 r1
Datacenter: dc1
===============
Status=Up/Down
|/ State=Normal/Leaving/Joining/Moving
-- Address Load Tokens Owns (effective) Host ID Rack
UN <actual ip> 3.84 GiB 256 65.2% 7324ebc4-577a-425f-b3de-96faac95a331 rack1
Workaround:
Manually delete the Cassandra pod from the failed config or analytics
cluster to re-initiate the bootstrap process for one of the Cassandra nodes:
kubectl -n tf delete pod tf-cassandra-<config/analytics>-dc1-rack1-<replica_num>
Occasionally, RabbitMQ instances in tf-rabbitmq pods fail to enable
the tracking_records_in_ets during the initialization process.
To work around the problem, restart the affected pods manually.
After replacing a failed Tungsten Fabric controller node as described in Replace a failed TF controller node, the first restart of the Cassandra pod on this node may cause an issue if the Cassandra node with the outdated IP address has not been removed from the cluster. Subsequent Cassandra pod restarts should not trigger this problem.
To verify if your Cassandra cluster is affected, run the nodetool status command specifying the config or analytics cluster and the replica number:
kubectl -n tf exec -it tf-cassandra-<CONFIG-OR-ANALYTICS>-dc1-rack1-<REPLICA-NUM> -c cassandra -- nodetool status
Example of the system response with outdated IP addresses:
Datacenter: dc1
===============
Status=Up/Down
|/ State=Normal/Leaving/Joining/Moving
-- Address Load Tokens Owns Host ID Rack
UN 192.168.201.144 509.43 KiB 256 ? 7e760a99-fae5-4921-b0c5-d9e6e1eca1c5 rack1
UN 192.168.50.146 534.18 KiB 256 ? 2248ea35-85d4-4887-820b-1fac4733021f rack1
UN 192.168.145.147 484.19 KiB 256 ? d988aaaa-44ae-4fec-a617-0b0a253e736d rack1
DN 192.168.145.144 481.53 KiB 256 ? c23703a1-6854-47a7-a4a2-af649d63af0c rack1
An extra node will appear in the cluster with an outdated IP address
(the IP of the terminated Cassandra pod) in the Down state.
To work around the issue, after replacing the Tungsten Fabric controller node, delete the Cassandra pod on the replaced node and remove the outdated node from the Cassandra cluster using nodetool:
kubectl -n tf exec -it tf-cassandra-<CONFIG-OR-ANALYTICS>-dc1-rack1-<REPLICA-NUM> -c cassandra -- nodetool removenode <HOST-ID>
On MOSK clusters with the MiraCeph-based Ceph, after restoring the Ceph
cluster health, the MOSK cluster status may display outdated information
that was valid some time ago, with baremetal-provider not reconciling the
MOSK cluster. As a workaround, restart the baremetal-provider pod or
add any annotation or label to the Cluster object, for example:
kubectl annotate cluster <NAME> -n <NAMESPACE> foo=bar
During MOSK cluster deployment, the following false-positive example alert for Ceph may raise:
Failed to configure Ceph cluster: ceph cluster verification is failed:
[BLUESTORE_SLOW_OP_ALERT: 3 OSD(s) experiencing slow operations in BlueStore]
The issue occurs due to the following upstream Ceph issues:
To verify whether the cluster is affected:
Enter the
ceph-toolspod:Verify the Ceph cluster status:
Verify Ceph health:
ceph -sExample of a positive system response in the affected cluster:
cluster: id: 6ae41eb3-262e-4da9-8847-25efed2fcaa2 health: HEALTH_WARN 2 OSD(s) experiencing slow operations in BlueStore services: mon: 3 daemons, quorum a,b,c (age 9h) mgr: a(active, since 9h), standbys: b osd: 4 osds: 4 up (since 9h), 4 in (since 9h) rgw: 2 daemons active (2 hosts, 1 zones) data: pools: 15 pools, 409 pgs objects: 1.67k objects, 4.6 GiB usage: 11 GiB used, 2.1 TiB / 2.1 TiB avail pgs: 409 active+clean io: client: 85 B/s rd, 500 KiB/s wr, 0 op/s rd, 27 op/s wr
Verify Ceph health details:
ceph health detail
Example of a positive system response in the affected cluster:
HEALTH_WARN 2 OSD(s) experiencing slow operations in BlueStore [WRN] BLUESTORE_SLOW_OP_ALERT: 2 OSD(s) experiencing slow operations in BlueStore osd.2 observed slow operation indications in BlueStore osd.3 observed slow operation indications in BlueStore
Exit the
ceph-toolspod.
Workaround:
Configure the bluestore_slow_ops_warn options as follows:
kubectl -n ceph-lcm-mirantis edit miraceph
kubectl -n <moskClusterProject> edit kcc
spec:
cephClusterSpec:
rookConfig:
osd|bluestore_slow_ops_warn_lifetime: "600"
osd|bluestore_slow_ops_warn_threshold: "10"
Wait for up to five minutes for the change to apply and the alert to disappear during cluster deployment.
This configuration triggers the alert only if at least 10 BlueStore slow operations occur during last 10 minutes. If triggered, it indicates a potential hardware disk issue on the BlueStore host that must be verified and reconfigured accordingly.
During update of a management or MOSK cluster with StackLight enabled in HA
mode, the OpenSearchClusterStatusCritical alert may trigger when the next
OpenSearch node restarts before shards from the previous node finish assigning.
This can push some indices to red temporarily, making them unavailable for
reads and writes, possibly causing some new logs being lost.
The issue does not affect the cluster during the update, no workaround is needed, and you can safely ignore it.
Management cluster update to 2.30.0 may get stuck during the execution of Ansible scripts for the host operating system upgrade from Ubuntu 22.04 (Jammy) to Ubuntu 24.04 (Noble).
This issue can occur on hosts where new /usr directories scheme has
not been applied. For details on /usr directories, see
UsrMerge.
In a valid scheme, the /{bin,sbin,lib}/ directories are symbolic links
to their counterparts under /usr/{bin,sbin,lib}/.
Symptoms:
Verify if the machine got stuck in the
Deploystage:kubectl get machine master-0 -o wide NAME READY LCMPHASE NODENAME UPGRADEINDEX REBOOTREQUIRED WARNINGS master-0 false Deploy master-0 1 false LCM Status of the machine is Deploy. kubectl get lcmmachine -o wide NAME CLUSTERNAME TYPE STATE INTERNALIP HOSTNAME AGENTVERSION REBOOTREQUIRED master-0 kaas-mgmt control Deploy 192.168.9.101 master-0 1.43.5
SSH into that machine.
In
/var/log/lcm/runners/<nodeName>/deploy/, verify whether the latest Ansible deployment logs contain the following errors indicating that the machine is affected:dpkg-divert: error: cannot divert directories Use --help for help about diverting files. dpkg: error processing archive /tmp/apt-dpkg-install-pky7pH/6-libc6_2.39-0ubuntu8.5_amd64.deb (--unpack): new libc6:amd64 package pre-installation script subprocess returned error exit status 2 Errors were encountered while processing: /tmp/apt-dpkg-install-pky7pH/6-libc6_2.39-0ubuntu8.5_amd64.deb
Verify the directories structure under
/. If/{bin,sbin,lib}/are directories and not symbolic links to/usr/{bin,sbin,lib}/, the cluster is affected.ls -la / drwxr-xr-x 2 root root 4096 Sep 30 12:14 bin ... drwxr-xr-x 20 root root 4096 Sep 30 2024 lib drwxr-xr-x 2 root root 4096 Sep 30 10:20 lib64 ... drwxr-xr-x 2 root root 12288 Sep 30 10:20 sbin
Related Ubuntu issues:
Workaround:
SSH into the affected machine.
Download and install the usrmerge package:
dpkg -i usrmerge.deb
Fix broken packages:
apt-get install -f
Validate the directories structure under
/. The/{bin,sbin,lib}/directories must become symbolic links to/usr/{bin,sbin,lib}/.lrwxrwxrwx 1 root root 7 Sep 30 12:42 bin -> usr/bin ... lrwxrwxrwx 1 root root 7 Sep 30 12:42 lib -> usr/lib lrwxrwxrwx 1 root root 9 Sep 30 12:42 lib32 -> usr/lib32 lrwxrwxrwx 1 root root 9 Sep 30 12:42 lib64 -> usr/lib64 lrwxrwxrwx 1 root root 10 Sep 30 12:42 libx32 -> usr/libx32 ... lrwxrwxrwx 1 root root 8 Sep 30 12:42 sbin -> usr/sbin
Verify remaining management cluster nodes. If the directories structure under
/is invalid, apply the same workaround.
Once done, the machine update will continue.
On clusters with enabled network infrastructure monitoring, the status of the
InfraConnectivityMonitor object may display the false-positive ok
status for readiness of all cluster machines while some of them are not yet
processed by the related controller, so the amount of machines in the
InfraConnectivityMonitor status is not equal to the amount of actual
cluster machines that are part of infrastructure connectivity monitoring.
As a workaround, wait for some time until the number of machines in
targetsConfigStatus of the InfraConnectivityMonitor object becomes
equal to inventoryConfigStatus.
On clusters that were originally deployed using MOSK management releases
earlier than 2.26.0 (Cluster release 17.0.x or earlier), on which the
deprecated fields minSizeGiB, maxSizeGiB, or sizeGiB were not
migrated to minSize, maxSize, and size accordingly, the management
cluster update to 2.30.0 may get stuck after the lcm-agent upgrade. For
details on the deprecated fields, see Bare metal deprecation notes.
Symptoms:
LCM Agent is upgraded on the management cluster nodes to version
1.43.5.The update is stuck and nodes are not moving to
prepareanddeployphases.In the
baremetal-providerlogs, the following error message is present:{"level":"error","ts":"...","logger":"bm.manager","caller":"..." "msg":"Reconciler error","controller":"machine-controller","object":"default/master-0" "namespace":"default","name":"master-0","reconcileID":"..." "error":"failed to build AnsibleExtra Spec for Machine 'default/master-0' from BareMetalHost 'default/master-0' HardwareDetails matching BareMetalHostProfile 'default/region-one-default': invalid BareMetalHostProfile Spec: zero partition size is allowed for the last partition only. dev:...}
Workaround:
If you use gitops for cluster management, migrate the deprecated parameters
using historical Git data. Otherwise, contact Mirantis support for
instructions.
A newly created project does not display all available tabs and contains different access denied errors during first five minutes after creation.
To work around the issue, refresh the browser in five minutes after the project creation.
During cluster update, the rolling reboot fails on the Tungsten Fabric cluster. To work around the issue, restart the RabbitMQ pods in the Tungsten Fabric cluster.
After cluster update is completed, the OpenStackDeployment state is stuck
with the APPLYING status.
As a workaround, restart the rockoon pod.
Release artifacts
This section lists the components artifacts of the MOSK 25.2 release that includes binaries, Docker images, and Helm charts.
This section lists per-component artifacts of the MOSK 25.2
release provided for a MOSK cluster. The drop-down tables
include binaries, Docker images, and Helm charts for ClusterRelease 21.0.0.
The components that are newly added, updated, deprecated, or removed as
compared to the previous release, are marked with a corresponding superscript,
for example, helm-controller Updated.
OpenStack Helm charts
Component |
Path |
License information for main executable programs |
|---|---|---|
rockoon |
https://binary.mirantis.com/openstack/helm/rockoon/rockoon-1.1.13.tgz |
Apache License 2.0 (no License file in Helm chart) |
OpenStack Epoxy binaries and Docker images
Component |
Path |
License information for main executable programs |
|---|---|---|
Binaries |
||
octavia-amphora |
https://binary.mirantis.com/openstack/bin/octavia/amphora-x64-haproxy-epoxy-20250905113646.qcow2 |
Mirantis Proprietary License |
mirantis |
https://binary.mirantis.com/openstack/bin/horizon/mirantis-epoxy-98953cb-20250419120248.tar.gz |
Mirantis Proprietary License |
kernel |
https://binary.mirantis.com/openstack/bin/ironic/tinyipa/tinyipa-stable-epoxy-20250531065011.vmlinuz |
GPL-2.0 |
initramfs |
https://binary.mirantis.com/openstack/bin/ironic/tinyipa/tinyipa-stable-epoxy-20250531065011.gz |
GPL-2.0 |
service-image |
https://binary.mirantis.com/openstack/bin/manila/manila-service-image-20241024092252.qcow2 |
Mirantis Proprietary License |
Docker images |
||
keystone |
mirantis.azurecr.io/openstack/keystone:epoxy-noble-20250905110850 |
Apache License 2.0 |
heat |
mirantis.azurecr.io/openstack/heat:epoxy-noble-20250905110850 |
Apache License 2.0 |
glance |
mirantis.azurecr.io/openstack/glance:epoxy-noble-20250905110850 |
Apache License 2.0 |
cinder |
mirantis.azurecr.io/openstack/cinder:epoxy-noble-20250905110850 |
Apache License 2.0 |
osprober |
mirantis.azurecr.io/openstack/osprober:0.0.1-55e4c83 |
Apache License 2.0 |
logrotate |
mirantis.azurecr.io/openstack/extra/logrotate:3.21.0-alpine-20250710120933 |
Apache License 2.0 |
neutron |
mirantis.azurecr.io/openstack/neutron:epoxy-noble-20250905110850 |
Apache License 2.0 |
nova |
mirantis.azurecr.io/openstack/nova:epoxy-noble-20250905110850 |
Apache License 2.0 |
horizon |
mirantis.azurecr.io/openstack/horizon:epoxy-noble-20250905110850 |
Apache License 2.0 |
tempest |
mirantis.azurecr.io/openstack/tempest:caracal-jammy-20250827101142 |
Apache License 2.0 |
octavia |
mirantis.azurecr.io/openstack/octavia:epoxy-noble-20250905110850 |
Apache License 2.0 |
designate |
mirantis.azurecr.io/openstack/designate:epoxy-noble-20250905110850 |
Apache License 2.0 |
ironic |
mirantis.azurecr.io/openstack/ironic:epoxy-noble-20250905110850 |
Apache License 2.0 |
barbican |
mirantis.azurecr.io/openstack/barbican:epoxy-noble-20250905110850 |
Apache License 2.0 |
libvirt |
mirantis.azurecr.io/general/libvirt:10.0.x-noble-20250822072218 |
LGPL-2.1 License |
pause |
mirantis.azurecr.io/general/external/pause:3.1 |
Apache License 2.0 |
openvswitch |
mirantis.azurecr.io/general/openvswitch:3.3-noble-src-20250523053641 |
Apache License 2.0 |
openvswitch-dpdk |
mirantis.azurecr.io/general/openvswitch-dpdk:3.3-noble-src-20250523053530 |
Apache License 2.0 |
openstack-tools |
mirantis.azurecr.io/openstack/openstack-tools:antelope-jammy-20250827101141 |
Apache License 2.0 |
rabbitmq |
mirantis.azurecr.io/openstack/extra/rabbitmq:4.0.6-jammy-20250217164053 |
Mozilla Public License 2.0 |
rabbitmq-management |
mirantis.azurecr.io/openstack/extra/rabbitmq-management:4.0.6-jammy-20250217164053 |
Mozilla Public License 2.0 |
kubernetes-entrypoint |
mirantis.azurecr.io/openstack/extra/kubernetes-entrypoint:v1.0.1-94cbbf5-20250227101657 |
Apache License 2.0 |
memcached |
mirantis.azurecr.io/general/memcached:v1.6.38-alpine-20250328111424 |
BSD 3-Clause “New” or “Revised” License |
etcd |
mirantis.azurecr.io/openstack/extra/etcd:v3.5.21-alpine-20250421162920 |
Apache License 2.0 |
powerdns |
mirantis.azurecr.io/openstack/extra/powerdns:4.9-alpine-20250822120729 |
GPL-2.0 License |
nginx-ingress-controller |
mirantis.azurecr.io/openstack/extra/nginx-ingress-controller:1.12.1-alpine-20250728093304 |
Apache License 2.0 |
tls-proxy |
mirantis.azurecr.io/openstack/tls-proxy:jammy-fipster-1.0.0.dev2 |
Mirantis Proprietary License |
defaultbackend |
mirantis.azurecr.io/openstack/extra/defaultbackend:v1.19.2-77af1ef-20240910090142 |
Apache License 2.0 |
mariadb |
mirantis.azurecr.io/general/mariadb:11.4.5-jammy-20250326082513 |
GPLv2, LGPLv2.1 (client libraries) |
rabbitmq-exporter |
mirantis.azurecr.io/stacklight/rabbitmq-exporter:1.0.0 |
MIT License |
memcached-exporter |
mirantis.azurecr.io/stacklight/memcached-exporter:v0.15.0 |
Apache License 2.0 |
prometheus-mysql-exporter |
mirantis.azurecr.io/stacklight/mysqld-exporter:v0.16.0 |
Apache License 2.0 |
aodh |
mirantis.azurecr.io/openstack/aodh:epoxy-noble-20250905110850 |
Apache License 2.0 |
ceilometer |
mirantis.azurecr.io/openstack/ceilometer:epoxy-noble-20250905110850 |
Apache License 2.0 |
gnocchi |
mirantis.azurecr.io/openstack/gnocchi:epoxy-noble-20250905110850 |
Apache License 2.0 |
redis |
mirantis.azurecr.io/openstack/extra/redis:7.4.x-alpine-20250421164532 |
BSD 3-Clause “New” or “Revised” License |
redis-operator |
mirantis.azurecr.io/openstack/extra/redis-operator:v1.2.4-20250624100054 |
Apache License 2.0 |
frr |
mirantis.azurecr.io/general/external/docker.io/frrouting/frr:v9.1.2-20250410070732 |
GPL-2.0 and LGPL-2.1 |
strongswan |
mirantis.azurecr.io/openstack/extra/strongswan:alpine-5.9.14-20250731072941 |
GPL-2.0 |
rsyslog |
mirantis.azurecr.io/openstack/extra/rsyslog:v8.2001.0-20240829110216 |
GNU General Public License v3 |
descheduler |
mirantis.azurecr.io/openstack/extra/descheduler-20250422051959:v0.32.2-amd64-20250418101136 |
Apache License 2.0 |
nginx |
mirantis.azurecr.io/openstack/extra/nginx:1.27.4-20250624093033 |
Apache License 2.0 |
requirements |
mirantis.azurecr.io/openstack/requirements:epoxy-noble-20250905110850 |
Apache License 2.0 |
drb-controller |
mirantis.azurecr.io/openstack/extra/drb-controller:0.1.0-20250819110932 |
Mirantis Proprietary License |
stepler |
mirantis.azurecr.io/openstack/stepler:epoxy-noble-20250828115539 |
Apache License 2.0 |
placement |
mirantis.azurecr.io/openstack/placement:epoxy-noble-20250905110850 |
Apache License 2.0 |
masakari |
mirantis.azurecr.io/openstack/masakari:epoxy-noble-20250905110850 |
Apache License 2.0 |
masakari-monitors |
mirantis.azurecr.io/openstack/masakari-monitors:epoxy-noble-20250905110850 |
Apache License 2.0 |
ironic-inspector |
mirantis.azurecr.io/openstack/ironic-inspector:epoxy-noble-20250905110850 |
Apache License 2.0 |
manila |
mirantis.azurecr.io/openstack/manila:epoxy-noble-20250905110850 |
Apache License 2.0 |
OpenStack Caracal binaries and Docker images
Component |
Path |
License information for main executable programs |
|---|---|---|
Binaries |
||
octavia-amphora |
https://binary.mirantis.com/openstack/bin/octavia/amphora-x64-haproxy-caracal-20250827104054.qcow2 |
Mirantis Proprietary License |
mirantis |
https://binary.mirantis.com/openstack/bin/horizon/mirantis-caracal-1f6ade2-20240408162450.tar.gz |
Mirantis Proprietary License |
kernel |
GPL-2.0 |
|
initramfs |
https://binary.mirantis.com/openstack/bin/ironic/tinyipa/tinyipa-stable-caracal-20250306065210.gz |
GPL-2.0 |
service-image |
https://binary.mirantis.com/openstack/bin/manila/manila-service-image-20241024092252.qcow2 |
Mirantis Proprietary License |
Docker images |
||
keystone |
mirantis.azurecr.io/openstack/keystone:caracal-jammy-20250901071050 |
Apache License 2.0 |
heat |
mirantis.azurecr.io/openstack/heat:caracal-jammy-20250901071050 |
Apache License 2.0 |
glance |
mirantis.azurecr.io/openstack/glance:caracal-jammy-20250901071050 |
Apache License 2.0 |
cinder |
mirantis.azurecr.io/openstack/cinder:caracal-jammy-20250901071050 |
Apache License 2.0 |
osprober |
mirantis.azurecr.io/openstack/osprober:0.0.1-55e4c83 |
Apache License 2.0 |
logrotate |
mirantis.azurecr.io/openstack/extra/logrotate:3.21.0-alpine-20250710120933 |
Apache License 2.0 |
neutron |
mirantis.azurecr.io/openstack/neutron:caracal-jammy-20250901071050 |
Apache License 2.0 |
nova |
mirantis.azurecr.io/openstack/nova:caracal-jammy-20250901071050 |
Apache License 2.0 |
horizon |
mirantis.azurecr.io/openstack/horizon:caracal-jammy-20250901071050 |
Apache License 2.0 |
tempest |
mirantis.azurecr.io/openstack/tempest:caracal-jammy-20250901071050 |
Apache License 2.0 |
octavia |
mirantis.azurecr.io/openstack/octavia:caracal-jammy-20250901071050 |
Apache License 2.0 |
designate |
mirantis.azurecr.io/openstack/designate:caracal-jammy-20250901071050 |
Apache License 2.0 |
ironic |
mirantis.azurecr.io/openstack/ironic:caracal-jammy-20250901071050 |
Apache License 2.0 |
barbican |
mirantis.azurecr.io/openstack/barbican:caracal-jammy-20250901071050 |
Apache License 2.0 |
libvirt |
mirantis.azurecr.io/general/libvirt:8.0.x-jammy-reef-20250729115649 |
LGPL-2.1 License |
pause |
mirantis.azurecr.io/general/external/pause:3.1 |
Apache License 2.0 |
openvswitch |
mirantis.azurecr.io/general/openvswitch:3.3-noble-src-20250523053641 |
Apache License 2.0 |
openvswitch-dpdk |
mirantis.azurecr.io/general/openvswitch-dpdk:3.3-noble-src-20250523053530 |
Apache License 2.0 |
openstack-tools |
mirantis.azurecr.io/openstack/openstack-tools:antelope-jammy-20250827101141 |
Apache License 2.0 |
rabbitmq |
mirantis.azurecr.io/openstack/extra/rabbitmq:4.0.6-jammy-20250217164053 |
Mozilla Public License 2.0 |
rabbitmq-management |
mirantis.azurecr.io/openstack/extra/rabbitmq-management:4.0.6-jammy-20250217164053 |
Mozilla Public License 2.0 |
kubernetes-entrypoint |
mirantis.azurecr.io/openstack/extra/kubernetes-entrypoint:v1.0.1-94cbbf5-20250227101657 |
Apache License 2.0 |
memcached |
mirantis.azurecr.io/general/memcached:v1.6.38-alpine-20250328111424 |
BSD 3-Clause “New” or “Revised” License |
etcd |
mirantis.azurecr.io/openstack/extra/etcd:v3.5.21-alpine-20250421162920 |
Apache License 2.0 |
powerdns |
mirantis.azurecr.io/openstack/extra/powerdns:4.9-alpine-20250822120729 |
GPL-2.0 License |
nginx-ingress-controller |
mirantis.azurecr.io/openstack/extra/nginx-ingress-controller:1.12.1-alpine-20250728093304 |
Apache License 2.0 |
tls-proxy |
mirantis.azurecr.io/openstack/tls-proxy:jammy-fipster-1.0.0.dev2 |
Mirantis Proprietary License |
defaultbackend |
mirantis.azurecr.io/openstack/extra/defaultbackend:v1.19.2-77af1ef-20240910090142 |
Apache License 2.0 |
mariadb |
mirantis.azurecr.io/general/mariadb:11.4.5-jammy-20250326082513 |
GPLv2, LGPLv2.1 (client libraries) |
rabbitmq-exporter |
mirantis.azurecr.io/stacklight/rabbitmq-exporter:1.0.0 |
MIT License |
memcached-exporter |
mirantis.azurecr.io/stacklight/memcached-exporter:v0.15.0 |
Apache License 2.0 |
prometheus-mysql-exporter |
mirantis.azurecr.io/stacklight/mysqld-exporter:v0.16.0 |
Apache License 2.0 |
aodh |
mirantis.azurecr.io/openstack/aodh:caracal-jammy-20250901071050 |
Apache License 2.0 |
ceilometer |
mirantis.azurecr.io/openstack/ceilometer:caracal-jammy-20250901071050 |
Apache License 2.0 |
gnocchi |
mirantis.azurecr.io/openstack/gnocchi:caracal-jammy-20250901071050 |
Apache License 2.0 |
redis |
mirantis.azurecr.io/openstack/extra/redis:7.4.x-alpine-20250421164532 |
BSD 3-Clause “New” or “Revised” License |
redis-operator |
mirantis.azurecr.io/openstack/extra/redis-operator:v1.2.4-20250624100054 |
Apache License 2.0 |
frr |
mirantis.azurecr.io/general/external/docker.io/frrouting/frr:v9.1.2-20250410070732 |
GPL-2.0 and LGPL-2.1 |
strongswan |
mirantis.azurecr.io/openstack/extra/strongswan:alpine-5.9.14-20250731072941 |
GPL-2.0 |
rsyslog |
mirantis.azurecr.io/openstack/extra/rsyslog:v8.2001.0-20240829110216 |
GNU General Public License v3 |
descheduler |
mirantis.azurecr.io/openstack/extra/descheduler-20250422051959:v0.32.2-amd64-20250418101136 |
Apache License 2.0 |
nginx |
mirantis.azurecr.io/openstack/extra/nginx:1.27.4-20250624093033 |
Apache License 2.0 |
requirements |
mirantis.azurecr.io/openstack/requirements:caracal-jammy-20250901071050 |
Apache License 2.0 |
drb-controller |
mirantis.azurecr.io/openstack/extra/drb-controller:0.1.0-20250819110932 |
Mirantis Proprietary License |
stepler |
mirantis.azurecr.io/openstack/stepler:caracal-jammy-20250828125045 |
Apache License 2.0 |
placement |
mirantis.azurecr.io/openstack/placement:caracal-jammy-20250901071050 |
Apache License 2.0 |
masakari |
mirantis.azurecr.io/openstack/masakari:caracal-jammy-20250901071050 |
Apache License 2.0 |
masakari-monitors |
mirantis.azurecr.io/openstack/masakari-monitors:caracal-jammy-20250901071050 |
Apache License 2.0 |
ironic-inspector |
mirantis.azurecr.io/openstack/ironic-inspector:caracal-jammy-20250901071050 |
Apache License 2.0 |
manila |
mirantis.azurecr.io/openstack/manila:caracal-jammy-20250901071050 |
Apache License 2.0 |
OpenSDN 24.1 artifacts
Component |
Path |
License information for main executable programs |
|---|---|---|
Helm charts |
||
tungstenfabric-operator |
https://binary.mirantis.com/tungsten/helm/tungstenfabric-operator-0.18.3.tgz |
Mirantis Proprietary License |
Docker images |
||
tungstenfabric-operator |
mirantis.azurecr.io/tungsten-operator/tungstenfabric-operator:0.18.3 |
Mirantis Proprietary License |
tungsten-pytest |
mirantis.azurecr.io/tungsten/tungsten-pytest:0.1-20250805105523 |
MIT License |
casskop |
mirantis.azurecr.io/tungsten-operator/casskop:2.3.1. |
Apache License 2.0 |
cassandra-bootstrap |
mirantis.azurecr.io/tungsten/cassandra-bootstrap:0.1.23-20250815 |
Apache License 2.0 |
cassandra |
mirantis.azurecr.io/tungsten/cassandra:3.11.19 |
Apache License 2.0 |
cassandra-config-builder |
mirantis.azurecr.io/tungsten/cass-config-builder:v2-20250822095735 |
Apache License 2.0 |
rabbitmq-operator |
mirantis.azurecr.io/tungsten-operator/rabbitmq-operator:0.5.2-1-0405719 |
Mirantis Proprietary License |
rabbitmq |
mirantis.azurecr.io/tungsten/rabbitmq:4.0.9-alpine |
Mozilla Public License 2.0 |
zookeeper-operator |
mirantis.azurecr.io/tungsten-operator/zookeeper-operator:0.2.27-mcp |
Apache License 2.0 |
zookeeper |
mirantis.azurecr.io/tungsten/zookeeper:3.9.3-20250320 |
Apache License 2.0 |
redis-operator |
mirantis.azurecr.io/tungsten-operator/redis-operator:0.5.1 |
Apache License 2.0 |
redis |
mirantis.azurecr.io/tungsten/redis:7.4.2-alpine3.21 |
BSD 3-Clause “New” or “Revised” License |
redis-exporter |
mirantis.azurecr.io/stacklight/redis_exporter:v1.66.0 |
BSD 3-Clause “New” or “Revised” License |
tf-cli |
mirantis.azurecr.io/tungsten/tf-cli:0.1-20250822080333 |
MIT License |
kubernetes-entrypoint |
mirantis.azurecr.io/openstack/extra/kubernetes-entrypoint:v1.0.1-94cbbf5-20250227101657 |
Apache License 2.0 |
pause |
mirantis.azurecr.io/general/external/pause:3.1 |
Apache License 2.0 |
tf-nodeinfo |
mirantis.azurecr.io/tungsten/tf-nodeinfo:0.1-20250616180810 |
MIT License |
contrail-controller-config-api |
mirantis.azurecr.io/tungsten/contrail-controller-config-api:24.1.20250821083019 |
Apache License 2.0 |
contrail-controller-config-schema |
mirantis.azurecr.io/tungsten/contrail-controller-config-schema:24.1.20250821083019 |
Apache License 2.0 |
contrail-controller-config-svcmonitor |
mirantis.azurecr.io/tungsten/contrail-controller-config-svcmonitor:24.1.20250821083019 |
Apache License 2.0 |
contrail-controller-control-control |
mirantis.azurecr.io/tungsten/contrail-controller-control-control:24.1.20250821083019 |
Apache License 2.0 |
contrail-controller-control-dns |
mirantis.azurecr.io/tungsten/contrail-controller-control-dns:24.1.20250821083019 |
Apache License 2.0 |
contrail-controller-control-named |
mirantis.azurecr.io/tungsten/contrail-controller-control-named:24.1.20250821083019 |
Apache License 2.0 |
contrail-controller-webui-job |
mirantis.azurecr.io/tungsten/contrail-controller-webui-job:24.1.20250821083019 |
Apache License 2.0 |
contrail-controller-webui-web |
mirantis.azurecr.io/tungsten/contrail-controller-webui-web:24.1.20250821083019 |
Apache License 2.0 |
contrail-node-init |
mirantis.azurecr.io/tungsten/contrail-node-init:24.1.20250821083019 |
Apache License 2.0 |
contrail-provisioner |
mirantis.azurecr.io/tungsten/contrail-provisioner:24.1.20250821083019 |
Apache License 2.0 |
contrail-tools |
mirantis.azurecr.io/tungsten/contrail-tools:24.1.20250821083019 |
Apache License 2.0 |
contrail-vrouter-agent |
mirantis.azurecr.io/tungsten/contrail-vrouter-agent:24.1.20250821083019 |
Apache License 2.0 |
contrail-vrouter-kernel-build-init |
mirantis.azurecr.io/tungsten/contrail-vrouter-kernel-build-init:24.1.20250821083019 |
Apache License 2.0 |
Bare metal artifacts
Artifact |
Component |
Path |
|---|---|---|
Helm charts Updated |
local-volume-provisioner |
https://binary.mirantis.com/core/helm/local-volume-provisioner-1.43.5.tgz |
metallb |
||
Docker images |
ironic Updated |
mirantis.azurecr.io/openstack/ironic:caracal-jammy-20250717205933 |
metallb-controller |
mirantis.azurecr.io/bm/metallb/controller:v0.14.5-6716f869-amd64 |
|
metallb-speaker |
mirantis.azurecr.io/bm/metallb/speaker:v0.14.5-6716f869-amd64 |
Ceph artifacts
Artifact |
Component |
Path |
|---|---|---|
Helm charts Updated |
ceph-controller |
https://binary.mirantis.com/ceph/helm/ceph-operator-1.0.0-mcc-2.30.0-9.tgz |
Docker images Updated |
ceph |
mirantis.azurecr.io/mirantis/ceph:v19.2.3-4.cve |
ceph-controller |
mirantis.azurecr.io/ceph/mcp/ceph-controller:2.30.0-8 |
|
cephcsi |
mirantis.azurecr.io/mirantis/cephcsi:v3.14.0-4.cve |
|
cephcsi-attacher |
mirantis.azurecr.io/mirantis/cephcsi-attacher:v4.8.0-2.cve |
|
cephcsi-provisioner |
mirantis.azurecr.io/mirantis/cephcsi-provisioner:v5.2.0-2.cve |
|
cephcsi-registrar |
mirantis.azurecr.io/mirantis/cephcsi-registrar:v2.13.0-2.cve |
|
cephcsi-resizer |
mirantis.azurecr.io/mirantis/cephcsi-resizer:v1.13.2-2.cve |
|
cephcsi-snapshotter |
mirantis.azurecr.io/mirantis/cephcsi-snapshotter:v8.2.0-2.cve |
|
rook |
mirantis.azurecr.io/ceph/rook:v1.17.4-21 |
|
snapshot-controller |
mirantis.azurecr.io/mirantis/snapshot-controller:v8.2.0-2.cve |
Core artifacts
Artifact |
Component |
Path |
|---|---|---|
Helm charts |
cinder-csi-plugin Updated |
https://binary.mirantis.com/core/helm/cinder-csi-plugin-1.43.5.tgz |
client-certificate-controller Updated |
https://binary.mirantis.com/core/helm/client-certificate-controller-1.43.5.tgz |
|
cnnc-agent New |
||
cnnc-controller New |
https://binary.mirantis.com/core/helm/cnnc-controller-1.43.5.tgz |
|
cnnc-crds New |
||
metrics-server Updated |
https://binary.mirantis.com/core/helm/metrics-server-1.43.5.tgz |
|
openstack-cloud-controller-manager Deprecated |
https://binary.mirantis.com/core/helm/openstack-cloud-controller-manager-1.43.5.tgz |
|
pause-update-controller Updated |
https://binary.mirantis.com/core/helm/pause-update-controller-1.43.5.tgz |
|
policy-controller Updated |
https://binary.mirantis.com/core/helm/policy-controller-1.43.5.tgz |
|
Docker images |
cinder-csi-plugin Updated |
mirantis.azurecr.io/lcm/kubernetes/cinder-csi-plugin:v1.27.2-27 |
client-certificate-controller Updated |
mirantis.azurecr.io/core/client-certificate-controller:1.43.5 |
|
cloudprober New |
mirantis.azurecr.io/bm/cloudprober:base-alpine-20250805144731 |
|
cnnc-inventory-agent New |
mirantis.azurecr.io/core/cnnc-inventory-agent:1.43.5 |
|
cnnc-inventory-controller New |
mirantis.azurecr.io/core/cnnc-inventory-controller:1.43.5 |
|
cnnc-netchecker-controller New |
mirantis.azurecr.io/core/cnnc-netchecker-controller:1.43.5 |
|
cnnc-prober-config-manager New |
mirantis.azurecr.io/core/cnnc-prober-config-manager:1.43.5 |
|
csi-attacher Deprecated |
mirantis.azurecr.io/lcm/k8scsi/csi-attacher:v4.2.0-10 |
|
csi-node-driver-registrar Deprecated |
mirantis.azurecr.io/lcm/k8scsi/csi-node-driver-registrar:v2.7.0-9 |
|
csi-provisioner Deprecated |
mirantis.azurecr.io/lcm/k8scsi/csi-provisioner:v3.4.1-10 |
|
csi-resizer Deprecated |
mirantis.azurecr.io/lcm/k8scsi/csi-resizer:v1.7.0-10 |
|
csi-snapshotter Deprecated |
mirantis.azurecr.io/lcm/k8scsi/csi-snapshotter:v6.2.1-mcc-9 |
|
livenessprobe Deprecated |
mirantis.azurecr.io/lcm/k8scsi/livenessprobe:v2.9.0-9 |
|
metrics-server |
mirantis.azurecr.io/lcm/metrics-server-amd64:v0.6.3-13 |
|
openstack-cloud-controller-manager Deprecated |
mirantis.azurecr.io/lcm/kubernetes/openstack-cloud-controller-manager:v1.27.2-27 |
|
pause-update-controller Updated |
mirantis.azurecr.io/core/pause-update-controller:1.43.5 |
|
policy-controller Updated |
mirantis.azurecr.io/core/policy-controller:1.43.5 |
LCM artifacts
Artifact |
Component |
Path |
|---|---|---|
Binaries Updated |
lcm-agent |
mirantis.azurecr.io/core/bin/lcm-agent-1.43.5 |
lcm-ansible |
mirantis.azurecr.io/lcm/bin/lcm-ansible/0.29.0-29-031f70dd/lcm-ansible.tar.gz |
|
Helm charts Updated |
helm-controller |
https://binary.mirantis.com/core/helm/helm-controller-1.43.5.tgz |
managed-lcm-api |
https://binary.mirantis.com/core/helm/managed-lcm-api-1.43.5.tgz |
|
Docker images Updated |
helm-controller |
mirantis.azurecr.io/core/helm-controller:1.43.5 |
mcc-haproxy |
mirantis.azurecr.io/lcm/mcc-haproxy:0.29.0-29-031f70dd |
|
mcc-keepalived |
mirantis.azurecr.io/lcm/mcc-keepalived:0.29.0-29-031f70dd |
StackLight artifacts
Artifact |
Component |
Path |
|---|---|---|
Helm charts |
alerta |
https://binary.mirantis.com/stacklight/helm/alerta-0.1.0-mcp-33.tgz |
alertmanager-webhook-servicenow |
https://binary.mirantis.com/stacklight/helm/alertmanager-webhook-servicenow-0.2.0-mcp-8.tgz |
|
cadvisor |
https://binary.mirantis.com/stacklight/helm/cadvisor-0.1.0-mcp-7.tgz |
|
elasticsearch-curator |
https://binary.mirantis.com/stacklight/helm/elasticsearch-curator-1.5.0-mcp-15.tgz |
|
elasticsearch-exporter |
https://binary.mirantis.com/stacklight/helm/elasticsearch-exporter-1.2.0-mcp-10.tgz |
|
fluentd Updated |
https://binary.mirantis.com/stacklight/helm/fluentd-2.0.3-mcp-53.tgz |
|
fluentd-logs Updated |
https://binary.mirantis.com/stacklight/helm/fluentd-logs-0.1.0-mcp-254.tgz |
|
grafana Updated |
https://binary.mirantis.com/stacklight/helm/grafana-3.3.10-mcp-375.tgz |
|
iam-proxy |
||
metric-collector Updated |
https://binary.mirantis.com/stacklight/helm/metric-collector-0.3.0-mcp-20.tgz |
|
metricbeat |
https://binary.mirantis.com/stacklight/helm/metricbeat-1.7.1-mcp-25.tgz |
|
opensearch Updated |
https://binary.mirantis.com/stacklight/helm/opensearch-0.1.0-mcp-92.tgz |
|
opensearch-dashboards Updated |
https://binary.mirantis.com/stacklight/helm/opensearch-dashboards-0.1.0-mcp-58.tgz |
|
patroni Updated |
https://binary.mirantis.com/stacklight/helm/patroni-0.15.1-mcp-63.tgz |
|
prometheus Updated |
https://binary.mirantis.com/stacklight/helm/prometheus-8.11.4-mcp-265.tgz |
|
prometheus-blackbox-exporter Updated |
https://binary.mirantis.com/stacklight/helm/prometheus-blackbox-exporter-0.3.0-mcp-20.tgz |
|
prometheus-es-exporter Updated |
https://binary.mirantis.com/stacklight/helm/prometheus-es-exporter-1.0.0-mcp-19.tgz |
|
prometheus-libvirt-exporter Updated |
https://binary.mirantis.com/stacklight/helm/prometheus-libvirt-exporter-0.2.0-mcp-8.tgz |
|
prometheus-msteams |
https://binary.mirantis.com/stacklight/helm/prometheus-msteams-0.1.0-mcp-12.tgz |
|
prometheus-tungstenfabric-exporter Updated |
https://binary.mirantis.com/stacklight/helm/prometheus-tungstenfabric-exporter-0.2.0-mcp-8.tgz |
|
sf-notifier |
https://binary.mirantis.com/stacklight/helm/sf-notifier-0.2.0-mcp-10.tgz |
|
sf-reporter |
https://binary.mirantis.com/stacklight/helm/sf-reporter-0.2.0-mcp-10.tgz |
|
stacklight Updated |
https://binary.mirantis.com/stacklight/helm/stacklight-0.18.5.tgz |
|
telegraf-ds Updated |
https://binary.mirantis.com/stacklight/helm/telegraf-ds-1.1.5-mcp-45.tgz |
|
telegraf-s Updated |
https://binary.mirantis.com/stacklight/helm/telegraf-s-1.1.5-mcp-45.tgz |
|
telemeter-client Updated |
https://binary.mirantis.com/stacklight/helm/telemeter-client-0.2.0-mcp-16.tgz |
|
telemeter-server Updated |
https://binary.mirantis.com/stacklight/helm/telemeter-server-0.2.0-mcp-16.tgz |
|
Docker images |
alerta-web Updated |
mirantis.azurecr.io/stacklight/alerta-web:9-20250908010016 |
alertmanager Updated |
mirantis.azurecr.io/stacklight/alertmanager:v0-20250908010016 |
|
alertmanager-webhook-servicenow |
mirantis.azurecr.io/stacklight/alertmanager-webhook-servicenow:v0.1-20250411082209 |
|
alpine-utils Updated |
mirantis.azurecr.io/stacklight/alpine-utils:1-20250908010019 |
|
blackbox-exporter |
mirantis.azurecr.io/stacklight/blackbox-exporter:0-20250305095821 |
|
cadvisor Updated |
mirantis.azurecr.io/stacklight/cadvisor:v0.49.1-20250908010016 |
|
configmap-reload |
mirantis.azurecr.io/stacklight/configmap-reload:v0.14.0 |
|
curator |
mirantis.azurecr.io/stacklight/curator:5.7.6-20230404082402 |
|
elasticsearch-exporter |
mirantis.azurecr.io/stacklight/elasticsearch-exporter:v1.8.0 |
|
fluentd Updated |
mirantis.azurecr.io/stacklight/fluentd:1.19-20250908010016 |
|
grafana |
mirantis.azurecr.io/stacklight/grafana:11.2.9 |
|
k8s-sidecar |
mirantis.azurecr.io/stacklight/k8s-sidecar:1-20250801064311 |
|
kube-state-metrics Updated |
mirantis.azurecr.io/stacklight/kube-state-metrics:v2.15.0 |
|
metric-collector Updated |
mirantis.azurecr.io/stacklight/metric-collector:v0.1-20250908010017 |
|
metricbeat Updated |
mirantis.azurecr.io/stacklight/metricbeat:7.12.1-20250908010017 |
|
node-exporter |
mirantis.azurecr.io/stacklight/node-exporter:v1.8.2 |
|
oauth2-proxy |
mirantis.azurecr.io/iam/oauth2-proxy:v7.1.3-15 |
|
opensearch Updated |
mirantis.azurecr.io/stacklight/opensearch:2.19-20250908010017 |
|
opensearch-dashboards Updated |
mirantis.azurecr.io/stacklight/opensearch-dashboards:2.19-20250908010016 |
|
prometheus |
mirantis.azurecr.io/stacklight/prometheus:v3.2.1 |
|
prometheus-es-exporter Updated |
mirantis.azurecr.io/stacklight/prometheus-es-exporter:v0.14-20250908010017 |
|
prometheus-libvirt-exporter Updated |
mirantis.azurecr.io/stacklight/prometheus-libvirt-exporter:v0.2-20250908010017 |
|
prometheus-msteams Updated |
mirantis.azurecr.io/stacklight/prometheus-msteams:v1.5-20250908010016 |
|
prometheus-patroni-exporter Updated |
mirantis.azurecr.io/stacklight/prometheus-patroni-exporter:0.0.1-20250908010017 |
|
prometheus-postgres-exporter |
mirantis.azurecr.io/stacklight/prometheus-postgres-exporter:v0.16.0 |
|
prometheus-relay Updated |
mirantis.azurecr.io/stacklight/prometheus-relay:v0.4-20250814114829 |
|
sf-notifier Updated |
mirantis.azurecr.io/stacklight/sf-notifier:v0.4-20250908010016 |
|
sf-reporter |
mirantis.azurecr.io/stacklight/sf-reporter:v0.1-20250411082229 |
|
spilo Updated |
mirantis.azurecr.io/stacklight/spilo:13-3.3-p2-20250908010016 |
|
telegraf |
mirantis.azurecr.io/stacklight/telegraf:1-20250411114904 |
|
telemeter Updated |
mirantis.azurecr.io/stacklight/telemeter:4.4-20250908010017 |
|
telemeter-token-auth Updated |
mirantis.azurecr.io/stacklight/telemeter-token-auth:v0.1-20250908010017 |
|
tungstenfabric-prometheus-exporter |
mirantis.azurecr.io/stacklight/tungstenfabric-prometheus-exporter:0.1-20250205153914 |
System and MCR artifacts
Artifact |
Component |
Path |
|---|---|---|
Configuration management |
Ansible |
|
Debian repositories |
System packages |
|
https://mirror.mirantis.com/kaas/ubuntu-2025-09-01-003901/ Updated |
||
https://mirror.mirantis.com/kaas/ubuntu-2025-09-01-003901.target.txt Updated |
||
MCR repositories |
MCR |
https://repos.mirantis.com/ubuntu/dists/jammy/pool/stable-25.0/ |
Target ubuntu system |
Ubuntu |
https://binary.mirantis.com/bm/bin/efi/ubuntu/tgz-jammy-20250901110400 Updated |
This section lists per-component artifacts of the MOSK
25.2 release provided for a management cluster. The drop-down tables include
binaries, Docker images, and Helm charts for KaasRelease 2.30.0 and
ClusterRelease 20.0.0.
The components that are newly added, updated, deprecated, or removed as
compared to the previous release, are marked with a corresponding superscript,
for example, helm-controller Updated.
Bare metal artifacts
Artifact |
Component |
Path |
|---|---|---|
Binaries Updated |
ironic-python-agent.initramfs |
https://binary.mirantis.com/bm/bin/ironic/ipa/ubuntu/initramfs-caracal-noble-debug-20250901112633 |
ironic-python-agent.kernel |
https://binary.mirantis.com/bm/bin/ironic/ipa/ubuntu/kernel-caracal-noble-debug-20250901112633 |
|
provisioning_ansible |
https://binary.mirantis.com/bm/bin/ansible/provisioning_ansible-0.1.1-170-254a00b.tgz |
|
Helm charts Updated |
baremetal-api |
https://binary.mirantis.com/core/helm/baremetal-api-1.43.5.tgz |
baremetal-operator |
https://binary.mirantis.com/core/helm/baremetal-operator-1.43.5.tgz |
|
baremetal-provider |
https://binary.mirantis.com/core/helm/baremetal-provider-1.43.5.tgz |
|
baremetal-public-api |
https://binary.mirantis.com/core/helm/baremetal-public-api-1.43.5.tgz |
|
kaas-ipam |
||
Docker images |
ambassador Updated |
mirantis.azurecr.io/core/external/nginx:1.43.5 |
baremetal-dnsmasq Updated |
mirantis.azurecr.io/bm/baremetal-dnsmasq:base-alpine-20250728113347 |
|
baremetal-operator Updated |
mirantis.azurecr.io/bm/baremetal-operator:base-alpine-20250728112923 |
|
bm-collective Removed |
n/a |
|
bm-dnsmasq-controller New |
mirantis.azurecr.io/core/bm-dnsmasq-controller:1.43.5 |
|
bm-dnsmasq-operator New |
mirantis.azurecr.io/core/bm-dnsmasq-operator:1.43.5 |
|
bm-dynamic-ipxe New |
mirantis.azurecr.io/core/bm-dynamic-ipxe:1.43.5 |
|
bm-resource-controller New |
mirantis.azurecr.io/core/bm-resource-controller:1.43.5 |
|
bm-service-watcher New |
mirantis.azurecr.io/core/bm-service-watcher:1.43.5 |
|
bm-ssh-key-k8s-secret New |
mirantis.azurecr.io/core/bm-ssh-key-k8s-secret:1.43.5 |
|
cluster-api-provider-baremetal Updated |
mirantis.azurecr.io/core/cluster-api-provider-baremetal:1.43.5 |
|
ironic Updated |
mirantis.azurecr.io/openstack/ironic:caracal-jammy-20250725183433 |
|
ironic-inspector Updated |
mirantis.azurecr.io/openstack/ironic-inspector:caracal-jammy-20250725183433 |
|
ironic-prometheus-exporter |
mirantis.azurecr.io/stacklight/ironic-prometheus-exporter:0.1-20240913123302 |
|
kaas-ipam Updated |
mirantis.azurecr.io/core/kaas-ipam:1.43.5 |
|
kubernetes-entrypoint |
mirantis.azurecr.io/openstack/extra/kubernetes-entrypoint:v1.0.1-202a68c-20250203183923 |
|
mariadb |
mirantis.azurecr.io/general/mariadb:10.6.20-jammy-20241104184039 |
|
syslog-ng |
mirantis.azurecr.io/bm/syslog-ng:base-alpine-20250217103755 |
Core artifacts
Artifact |
Component |
Path |
|---|---|---|
Bootstrap tarball Updated |
bootstrap-darwin |
https://binary.mirantis.com/core/bin/bootstrap-darwin-1.43.5.tgz |
bootstrap-linux |
https://binary.mirantis.com/core/bin/bootstrap-linux-1.43.5.tgz |
|
Helm charts |
admission-controller Updated |
https://binary.mirantis.com/core/helm/admission-controller-1.43.5.tgz |
agent-controller Updated |
https://binary.mirantis.com/core/helm/agent-controller-1.43.5.tgz |
|
ceph-kcc-controller Updated |
https://binary.mirantis.com/core/helm/ceph-kcc-controller-1.43.5.tgz |
|
cert-manager Updated |
https://binary.mirantis.com/core/helm/cert-manager-1.43.5.tgz |
|
configuration-collector Updated |
https://binary.mirantis.com/core/helm/configuration-collector-1.43.5.tgz |
|
credentials-controller Deprecated |
https://binary.mirantis.com/core/helm/credentials-controller-1.43.5.tgz |
|
event-controller Updated |
https://binary.mirantis.com/core/helm/event-controller-1.43.5.tgz |
|
host-os-modules-controller Updated |
https://binary.mirantis.com/core/helm/host-os-modules-controller-1.43.5.tgz |
|
iam-controller Updated |
https://binary.mirantis.com/core/helm/iam-controller-1.43.5.tgz |
|
kaas-exporter Updated |
https://binary.mirantis.com/core/helm/kaas-exporter-1.43.5.tgz |
|
kaas-public-api Updated |
https://binary.mirantis.com/core/helm/kaas-public-api-1.43.5.tgz |
|
kaas-ui Updated |
||
lcm-controller Updated |
https://binary.mirantis.com/core/helm/lcm-controller-1.43.5.tgz |
|
license-controller Updated |
https://binary.mirantis.com/core/helm/license-controller-1.43.5.tgz |
|
machinepool-controller Updated |
https://binary.mirantis.com/core/helm/machinepool-controller-1.43.5.tgz |
|
mcc-cache Updated |
||
mcc-cache-warmup Updated |
https://binary.mirantis.com/core/helm/mcc-cache-warmup-1.43.5.tgz |
|
netchecker-controller New |
https://binary.mirantis.com/core/helm/netchecker-controller-1.43.5.tgz |
|
openstack-provider Deprecated |
https://binary.mirantis.com/core/helm/openstack-provider-1.43.5.tgz |
|
portforward-controller Updated |
https://binary.mirantis.com/core/helm/portforward-controller-1.43.5.tgz |
|
rbac-controller Updated |
https://binary.mirantis.com/core/helm/rbac-controller-1.43.5.tgz |
|
release-controller Updated |
https://binary.mirantis.com/core/helm/release-controller-1.43.5.tgz |
|
scope-controller Updated |
https://binary.mirantis.com/core/helm/scope-controller-1.43.5.tgz |
|
secret-controller Updated |
https://binary.mirantis.com/core/helm/secret-controller-1.43.5.tgz |
|
user-controller Updated |
https://binary.mirantis.com/core/helm/user-controller-1.43.5.tgz |
|
Docker images |
admission-controller Updated |
mirantis.azurecr.io/core/admission-controller:1.43.5 |
agent-controller Updated |
mirantis.azurecr.io/core/agent-controller:1.43.5 |
|
ceph-kcc-controller Updated |
mirantis.azurecr.io/core/ceph-kcc-controller:1.43.5 |
|
cert-manager-controller |
mirantis.azurecr.io/core/external/cert-manager-controller:v1.11.0-13 |
|
configuration-collector Updated |
mirantis.azurecr.io/core/configuration-collector:1.43.5 |
|
credentials-controller Deprecated |
mirantis.azurecr.io/core/credentials-controller:1.43.5 |
|
event-controller Updated |
mirantis.azurecr.io/core/event-controller:1.43.5 |
|
frontend Updated |
mirantis.azurecr.io/core/frontend:1.43.5 |
|
host-os-modules-controller Updated |
mirantis.azurecr.io/core/host-os-modules-controller:1.43.5 |
|
iam-controller Updated |
mirantis.azurecr.io/core/iam-controller:1.43.5 |
|
kaas-exporter Updated |
mirantis.azurecr.io/core/kaas-exporter:1.43.5 |
|
kproxy Updated |
mirantis.azurecr.io/core/kproxy:1.43.5 |
|
lcm-controller Updated |
mirantis.azurecr.io/core/lcm-controller:1.43.5 |
|
license-controller Updated |
mirantis.azurecr.io/core/license-controller:1.43.5 |
|
machinepool-controller Updated |
mirantis.azurecr.io/core/machinepool-controller:1.43.5 |
|
mcc-cache-warmup Updated |
mirantis.azurecr.io/core/mcc-cache-warmup:1.43.5 |
|
netchecker-controller New |
mirantis.azurecr.io/core/netchecker-controller:1.43.5 |
|
nginx Updated |
mirantis.azurecr.io/core/external/nginx:1.43.5 |
|
openstack-cluster-api-controller Deprecated |
mirantis.azurecr.io/core/openstack-cluster-api-controller:1.43.5 |
|
portforward-controller Updated |
mirantis.azurecr.io/core/portforward-controller:1.43.5 |
|
rbac-controller Updated |
mirantis.azurecr.io/core/rbac-controller:1.43.5 |
|
registry |
mirantis.azurecr.io/lcm/registry:v2.8.1-16 |
|
release-controller Updated |
mirantis.azurecr.io/core/release-controller:1.43.5 |
|
scope-controller Updated |
mirantis.azurecr.io/core/scope-controller:1.43.5 |
|
secret-controller Updated |
mirantis.azurecr.io/core/secret-controller:1.43.5 |
|
user-controller Updated |
mirantis.azurecr.io/core/user-controller:1.43.5 |
IAM artifacts
Artifact |
Component |
Path |
|---|---|---|
Binaries |
hash-generate-darwin |
http://binary.mirantis.com/iam/bin/hash-generate-0.0.1-268-3cf7f17-darwin |
hash-generate-linux |
http://binary.mirantis.com/iam/bin/hash-generate-0.0.1-268-3cf7f17-linux |
|
Helm charts Updated |
iam |
|
Docker images |
kubectl |
mirantis.azurecr.io/general/kubectl:20250307094924 |
kubernetes-entrypoint |
mirantis.azurecr.io/openstack/extra/kubernetes-entrypoint:v1.0.1-d06c869-20250204085201 |
|
mariadb |
mirantis.azurecr.io/general/mariadb:10.6.20-jammy-20250218081722 |
|
mcc-keycloak Updated |
mirantis.azurecr.io/iam/mcc-keycloak:26.3.2-20250730110046 |
Bare metal artifacts
Artifact |
Component |
Path |
|---|---|---|
Helm charts Updated |
local-volume-provisioner |
https://binary.mirantis.com/core/helm/local-volume-provisioner-1.43.5.tgz |
metallb |
||
Docker images |
ironic Updated |
mirantis.azurecr.io/openstack/ironic:caracal-jammy-20250717205933 |
metallb-controller |
mirantis.azurecr.io/bm/metallb/controller:v0.14.5-6716f869-amd64 |
|
metallb-speaker |
mirantis.azurecr.io/bm/metallb/speaker:v0.14.5-6716f869-amd64 |
Ceph artifacts
Artifact |
Component |
Path |
|---|---|---|
Helm charts Updated |
ceph-controller |
https://binary.mirantis.com/ceph/helm/ceph-operator-1.0.0-mcc-2.30.0-9.tgz |
Docker images Updated |
ceph |
mirantis.azurecr.io/mirantis/ceph:v19.2.3-4.cve |
ceph-controller |
mirantis.azurecr.io/ceph/mcp/ceph-controller:2.30.0-8 |
|
cephcsi |
mirantis.azurecr.io/mirantis/cephcsi:v3.14.0-4.cve |
|
cephcsi-attacher |
mirantis.azurecr.io/mirantis/cephcsi-attacher:v4.8.0-2.cve |
|
cephcsi-provisioner |
mirantis.azurecr.io/mirantis/cephcsi-provisioner:v5.2.0-2.cve |
|
cephcsi-registrar |
mirantis.azurecr.io/mirantis/cephcsi-registrar:v2.13.0-2.cve |
|
cephcsi-resizer |
mirantis.azurecr.io/mirantis/cephcsi-resizer:v1.13.2-2.cve |
|
cephcsi-snapshotter |
mirantis.azurecr.io/mirantis/cephcsi-snapshotter:v8.2.0-2.cve |
|
rook |
mirantis.azurecr.io/ceph/rook:v1.17.4-21 |
|
snapshot-controller |
mirantis.azurecr.io/mirantis/snapshot-controller:v8.2.0-2.cve |
Core artifacts
Artifact |
Component |
Path |
|---|---|---|
Helm charts |
cinder-csi-plugin Updated |
https://binary.mirantis.com/core/helm/cinder-csi-plugin-1.43.5.tgz |
client-certificate-controller Updated |
https://binary.mirantis.com/core/helm/client-certificate-controller-1.43.5.tgz |
|
cnnc-agent New |
||
cnnc-controller New |
https://binary.mirantis.com/core/helm/cnnc-controller-1.43.5.tgz |
|
cnnc-crds New |
||
metrics-server Updated |
https://binary.mirantis.com/core/helm/metrics-server-1.43.5.tgz |
|
openstack-cloud-controller-manager Deprecated |
https://binary.mirantis.com/core/helm/openstack-cloud-controller-manager-1.43.5.tgz |
|
pause-update-controller Updated |
https://binary.mirantis.com/core/helm/pause-update-controller-1.43.5.tgz |
|
policy-controller Updated |
https://binary.mirantis.com/core/helm/policy-controller-1.43.5.tgz |
|
Docker images |
cinder-csi-plugin Updated |
mirantis.azurecr.io/lcm/kubernetes/cinder-csi-plugin:v1.27.2-27 |
client-certificate-controller Updated |
mirantis.azurecr.io/core/client-certificate-controller:1.43.5 |
|
cloudprober New |
mirantis.azurecr.io/bm/cloudprober:base-alpine-20250805144731 |
|
cnnc-inventory-agent New |
mirantis.azurecr.io/core/cnnc-inventory-agent:1.43.5 |
|
cnnc-inventory-controller New |
mirantis.azurecr.io/core/cnnc-inventory-controller:1.43.5 |
|
cnnc-netchecker-controller New |
mirantis.azurecr.io/core/cnnc-netchecker-controller:1.43.5 |
|
cnnc-prober-config-manager New |
mirantis.azurecr.io/core/cnnc-prober-config-manager:1.43.5 |
|
csi-attacher Deprecated |
mirantis.azurecr.io/lcm/k8scsi/csi-attacher:v4.2.0-10 |
|
csi-node-driver-registrar Deprecated |
mirantis.azurecr.io/lcm/k8scsi/csi-node-driver-registrar:v2.7.0-9 |
|
csi-provisioner Deprecated |
mirantis.azurecr.io/lcm/k8scsi/csi-provisioner:v3.4.1-10 |
|
csi-resizer Deprecated |
mirantis.azurecr.io/lcm/k8scsi/csi-resizer:v1.7.0-10 |
|
csi-snapshotter Deprecated |
mirantis.azurecr.io/lcm/k8scsi/csi-snapshotter:v6.2.1-mcc-9 |
|
livenessprobe Deprecated |
mirantis.azurecr.io/lcm/k8scsi/livenessprobe:v2.9.0-9 |
|
metrics-server |
mirantis.azurecr.io/lcm/metrics-server-amd64:v0.6.3-13 |
|
openstack-cloud-controller-manager Deprecated |
mirantis.azurecr.io/lcm/kubernetes/openstack-cloud-controller-manager:v1.27.2-27 |
|
pause-update-controller Updated |
mirantis.azurecr.io/core/pause-update-controller:1.43.5 |
|
policy-controller Updated |
mirantis.azurecr.io/core/policy-controller:1.43.5 |
LCM artifacts
Artifact |
Component |
Path |
|---|---|---|
Binaries Updated |
lcm-agent |
mirantis.azurecr.io/core/bin/lcm-agent-1.43.5 |
lcm-ansible |
mirantis.azurecr.io/lcm/bin/lcm-ansible/0.29.0-29-031f70dd/lcm-ansible.tar.gz |
|
Helm charts Updated |
helm-controller |
https://binary.mirantis.com/core/helm/helm-controller-1.43.5.tgz |
managed-lcm-api |
https://binary.mirantis.com/core/helm/managed-lcm-api-1.43.5.tgz |
|
Docker images Updated |
helm-controller |
mirantis.azurecr.io/core/helm-controller:1.43.5 |
mcc-haproxy |
mirantis.azurecr.io/lcm/mcc-haproxy:0.29.0-29-031f70dd |
|
mcc-keepalived |
mirantis.azurecr.io/lcm/mcc-keepalived:0.29.0-29-031f70dd |
StackLight artifacts
Artifact |
Component |
Path |
|---|---|---|
Helm charts |
alerta |
https://binary.mirantis.com/stacklight/helm/alerta-0.1.0-mcp-33.tgz |
alertmanager-webhook-servicenow |
https://binary.mirantis.com/stacklight/helm/alertmanager-webhook-servicenow-0.2.0-mcp-8.tgz |
|
cadvisor |
https://binary.mirantis.com/stacklight/helm/cadvisor-0.1.0-mcp-7.tgz |
|
elasticsearch-curator |
https://binary.mirantis.com/stacklight/helm/elasticsearch-curator-1.5.0-mcp-15.tgz |
|
elasticsearch-exporter |
https://binary.mirantis.com/stacklight/helm/elasticsearch-exporter-1.2.0-mcp-10.tgz |
|
fluentd-logs Updated |
https://binary.mirantis.com/stacklight/helm/fluentd-logs-0.1.0-mcp-254.tgz |
|
grafana Updated |
https://binary.mirantis.com/stacklight/helm/grafana-3.3.10-mcp-375.tgz |
|
iam-proxy |
||
metric-collector Updated |
https://binary.mirantis.com/stacklight/helm/metric-collector-0.3.0-mcp-20.tgz |
|
metricbeat |
https://binary.mirantis.com/stacklight/helm/metricbeat-1.7.1-mcp-25.tgz |
|
opensearch Updated |
https://binary.mirantis.com/stacklight/helm/opensearch-0.1.0-mcp-92.tgz |
|
opensearch-dashboards Updated |
https://binary.mirantis.com/stacklight/helm/opensearch-dashboards-0.1.0-mcp-58.tgz |
|
patroni Updated |
https://binary.mirantis.com/stacklight/helm/patroni-0.15.1-mcp-63.tgz |
|
prometheus Updated |
https://binary.mirantis.com/stacklight/helm/prometheus-8.11.4-mcp-265.tgz |
|
prometheus-blackbox-exporter Updated |
https://binary.mirantis.com/stacklight/helm/prometheus-blackbox-exporter-0.3.0-mcp-20.tgz |
|
prometheus-es-exporter Updated |
https://binary.mirantis.com/stacklight/helm/prometheus-es-exporter-1.0.0-mcp-19.tgz |
|
prometheus-msteams |
https://binary.mirantis.com/stacklight/helm/prometheus-msteams-0.1.0-mcp-12.tgz |
|
sf-notifier |
https://binary.mirantis.com/stacklight/helm/sf-notifier-0.2.0-mcp-10.tgz |
|
sf-reporter |
https://binary.mirantis.com/stacklight/helm/sf-reporter-0.2.0-mcp-10.tgz |
|
stacklight Updated |
https://binary.mirantis.com/stacklight/helm/stacklight-0.18.5.tgz |
|
telegraf-ds Updated |
https://binary.mirantis.com/stacklight/helm/telegraf-ds-1.1.5-mcp-45.tgz |
|
telegraf-s Updated |
https://binary.mirantis.com/stacklight/helm/telegraf-s-1.1.5-mcp-45.tgz |
|
telemeter-client Updated |
https://binary.mirantis.com/stacklight/helm/telemeter-client-0.2.0-mcp-16.tgz |
|
telemeter-server Updated |
https://binary.mirantis.com/stacklight/helm/telemeter-server-0.2.0-mcp-16.tgz |
|
Docker images |
alerta-web Updated |
mirantis.azurecr.io/stacklight/alerta-web:9-20250908010016 |
alertmanager Updated |
mirantis.azurecr.io/stacklight/alertmanager:v0-20250908010016 |
|
alertmanager-webhook-servicenow |
mirantis.azurecr.io/stacklight/alertmanager-webhook-servicenow:v0.1-20250411082209 |
|
alpine-utils Updated |
mirantis.azurecr.io/stacklight/alpine-utils:1-20250908010019 |
|
blackbox-exporter |
mirantis.azurecr.io/stacklight/blackbox-exporter:0-20250305095821 |
|
cadvisor Updated |
mirantis.azurecr.io/stacklight/cadvisor:v0.49.1-20250908010016 |
|
configmap-reload |
mirantis.azurecr.io/stacklight/configmap-reload:v0.14.0 |
|
curator |
mirantis.azurecr.io/stacklight/curator:5.7.6-20230404082402 |
|
elasticsearch-exporter |
mirantis.azurecr.io/stacklight/elasticsearch-exporter:v1.8.0 |
|
fluentd Updated |
mirantis.azurecr.io/stacklight/fluentd:1.19-20250908010016 |
|
grafana |
mirantis.azurecr.io/stacklight/grafana:11.2.9 |
|
k8s-sidecar |
mirantis.azurecr.io/stacklight/k8s-sidecar:1-20250801064311 |
|
kube-state-metrics Updated |
mirantis.azurecr.io/stacklight/kube-state-metrics:v2.15.0 |
|
metric-collector Updated |
mirantis.azurecr.io/stacklight/metric-collector:v0.1-20250908010017 |
|
metricbeat Updated |
mirantis.azurecr.io/stacklight/metricbeat:7.12.1-20250908010017 |
|
node-exporter |
mirantis.azurecr.io/stacklight/node-exporter:v1.8.2 |
|
oauth2-proxy |
mirantis.azurecr.io/iam/oauth2-proxy:v7.1.3-15 |
|
opensearch Updated |
mirantis.azurecr.io/stacklight/opensearch:2.19-20250908010017 |
|
opensearch-dashboards Updated |
mirantis.azurecr.io/stacklight/opensearch-dashboards:2.19-20250908010016 |
|
prometheus |
mirantis.azurecr.io/stacklight/prometheus:v3.2.1 |
|
prometheus-es-exporter Updated |
mirantis.azurecr.io/stacklight/prometheus-es-exporter:v0.14-20250908010017 |
|
prometheus-msteams Updated |
mirantis.azurecr.io/stacklight/prometheus-msteams:v1.5-20250908010016 |
|
prometheus-patroni-exporter Updated |
mirantis.azurecr.io/stacklight/prometheus-patroni-exporter:0.0.1-20250908010017 |
|
prometheus-postgres-exporter |
mirantis.azurecr.io/stacklight/prometheus-postgres-exporter:v0.16.0 |
|
prometheus-relay Updated |
mirantis.azurecr.io/stacklight/prometheus-relay:v0.4-20250814114829 |
|
sf-notifier Updated |
mirantis.azurecr.io/stacklight/sf-notifier:v0.4-20250908010016 |
|
sf-reporter |
mirantis.azurecr.io/stacklight/sf-reporter:v0.1-20250411082229 |
|
spilo Updated |
mirantis.azurecr.io/stacklight/spilo:13-3.3-p2-20250908010016 |
|
telegraf |
mirantis.azurecr.io/stacklight/telegraf:1-20250411114904 |
|
telemeter Updated |
mirantis.azurecr.io/stacklight/telemeter:4.4-20250908010017 |
|
telemeter-token-auth Updated |
mirantis.azurecr.io/stacklight/telemeter-token-auth:v0.1-20250908010017 |
System and MCR artifacts
Artifact |
Component |
Path |
|---|---|---|
Configuration management |
Ansible |
|
Debian repositories |
System packages |
|
https://mirror.mirantis.com/kaas/ubuntu-2025-09-01-003901/ Updated |
||
https://mirror.mirantis.com/kaas/ubuntu-2025-09-01-003901.target.txt Updated |
||
MCR repositories |
MCR |
https://repos.mirantis.com/ubuntu/dists/noble/pool/stable-25.0/ New |
Target ubuntu system |
Ubuntu |
https://binary.mirantis.com/bm/bin/efi/ubuntu/tgz-noble-20250901110440 New |
Addressed issues
The following issues have been addressed in the MOSK 25.2 release:
[OpenStack] [53249] Fixed an issue that caused Horizon to fail to start when resolving Memcached in the event of the controller failure.
[TF] [53831] Addressed the issue that caused critical components such as
tf-configandtf-config-dbto repeatedly crash after restoration of Tungsten Fabric database from a backup in clusters that have undergone at least one major or patch cluster update.[Core] [50622] Addressed the issue that prevented any user except
m:kaas@management-adminto access or modifyBareMetalHostInventoryobjects.[Bare metal] [50287] Addressed the issue that prevented a
BareMetalHostobject with a Redfish Baseboard Management Controller address to pass the registering phase.[LCM] [50819,51134] Addressed the issue that prevented clusters from entering or exiting maintenance mode if a granular update was started using the
ClusterUpdatePlanobject.[LCM] [50768] Addressed the issue that prevented successful editing of the
MCCUpgradeobject, which contained the Internal error failed to call webhook: the server could not find the requested resource when trying to save changes in the object.[LCM] [50636] Addressed the issue that caused the
nfs-commonpackage to be deleted during MOSK cluster update. This package is no longer automatically removed from cluster nodes if a MOSK cluster is deployed with the MariaDB backup hosted on an external NFS backend.[LCM] [50561] Addressed the issue that caused the
local-volume-provisionerpod to switch to theCrashLoopBackOffstate on a machine that was disabled and consequently re-enabled.[Cluster update] [51339] Addressed the issue that caused cluster update to be blocked if at least one node of any cluster was not rebooted while applying the update.
[StackLight] [53802, 52253] Addressed the issue that resulted in the
telegraf-ds-smartpod constantly restarting with OOM kill messages on every compute node whilesmartctlwas trying to scan all attached iSCSI volumes.[StackLight] [51145] Addressed the issue that caused the
PrometheusTargetScrapesDuplicatealert to permanently fire on a management cluster that hassf-notifierenabled.[Ceph] [50637] Addressed the issue that caused Ceph to create a second
miracephnodedisableobject if some node was disabled at the same time with theceph-maintenance-controllerrestart.[Ceph] [50566] Addressed the issue that caused Ceph upgrade to run very slow during patch or major cluster update due to the upstream Ceph issue 66717.
[Web UI] [50181] Addressed the issue that prevented deployment of a compact MOSK cluster through the Container Cloud web UI due to inability to add any label to the control plane machines along with inability to change
dedicatedControlPlane: false.[Web UI] [50140] Addressed the issue that prevented the Clusters page for the bare metal provider to display information about the Ceph cluster in the Ceph Clusters tab.
Update notes
This section describes the specific actions you as a Cloud Operator need to complete to accurately plan and successfully perform your Mirantis OpenStack for Kubernetes (MOSK) cluster update to the version 25.2. Consider this information as a supplement to the generic update procedure published in Operations Guide: Update a MOSK cluster.
Migration of container runtime for the underlying Kubernetes cluster from Docker to containerd became mandatory in the scope of MOSK 25.1.x on existing deployments. Otherwise, the management cluster update to Container Cloud 2.30.0 is blocked.
Therefore, before updating to MOSK 25.2, switch the container runtime to containerd that allows for better Kubernetes performance and component update without pod restart when applying fixes for CVEs.
Caution
Cluster update is not allowed during migration to prevent machines from running different container runtimes.
Important
Container runtime migration involves machine cordoning and draining.
Verify that deprecated minSizeGiB and maxSizeGiB parameters for the
devices specification and the sizeGiB parameter for the partitions
specification for devices, softRaidDevices, volumeGroups, and
logicalVolumes sections are not used in the BareMetalHostProfile
object.
If these parameters are specified, migrate them to the minSize,
maxSize, and size parameters accordingly. Instead of floats that
defined sizes in GiB for the *GiB parameters, use the
<sizeNumber><unit> text notation, for example 512Ki, 128Mi,
or 4Gi.
Caution
If the parameters are not migrated, they will be automatically
removed from all BaremetalHostProfile objects for both management and
managed clusters, which may cause those objects to become invalid.
MOSK introduces support for OpenSDN 24.1, successor to Tungsten Fabric, and automatically upgrades Tungsten Fabric 21.4 to OpenSDN 24.1 during the cluster update from the MOSK 25.1 series to the 25.2 release.
To ensure smooth upgrade, verify that tfVersion is not explicitly specified
in the TFOperator custom resource.
Note
This step applies if you use the Alertmanager API v1 in your integrations and configurations. Otherwise, skip this step.
The deprecated Alertmanager API v1 is removed in MOSK 25.2 and Container Cloud 2.30.0 to unblock Alertmanager upgrade to version 0.28.1, which supports only API v2. For details, see Deprecation Notes.
Therefore, if you use API v1, before updating to MOSK 25.2, update your integrations and configurations to use the API v2 ensuring compatibility with new versions of Alertmanager. Ongoing use of API v1 endpoints will result in errors or broken functionality after this upgrade.
Following the upstream deprecation in Prometheus, removed the
deprecated prometheus-rabbitmq-exporter scrape job,
RabbitMQ [Deprecated] Grafana dashboard, along with
RabbitMQDown and RabbitMQExporterTargetDown alerts. For details, see
RabbitMQ monitoring rework.
Therefore, if you use deprecated RabbitMQ metrics in customizations such as alerts and dashboards, switch to the new metrics and dashboards before updating to MOSK 25.2 to prevent issues when the deprecated metrics and dashboard are removed.
max_message_size setting¶Due to a known issue [54430] AMQP message delivery fails when message size exceeds RabbitMQ limit, increase the max_message_size
setting in the OpenStackDeployment custom rsource before updating to
MOSK 25.2:
services:
networking:
rabbitmq:
values:
conf:
rabbitmq:
max_message_size: "67108864"
Since MOSK 25.2, the management cluster resources
KaaSCephCluster and KaaSCephOperationRequest are deprecated
and can be optionally migrated to the following Ceph resources of the
corresponding MOSK cluster: MiraCeph,
MiraCephHealth, MiraCephSecret, MiraCephMaintenance, and
CephOsdRemoveRequest.
Mirantis recommends that you manually migrate KaaSCephCluster and
KaaSCephOperationRequest resources from non-production management clusters
to the corresponding MiraCeph resources of MOSK clusters
to better prepare before automatic migration in one of the following releases.
Although keep in mind that this migration is irreversible.
To manually test the migration on non-production clusters, set the following
annotation in the metadata section of KaaSCephCluster on the management
cluster:
apiVersion: kaas.mirantis.com/v1alpha1
kind: KaaSCephCluster
metadata:
...
annotations:
manual-get-rid-of-kaascephcluster: "true"
After setting this annotation, KaaSCephCluster will be automatically and
safely removed from the management cluster and all Ceph management will be
moved to the corresponding Ceph CRs of a MOSK cluster.
Security notes
In total, since MOSK 25.1 and MOSK management 2.29.0 major release, in 25.2 and 2.30.0, 1254 Common Vulnerabilities and Exposures (CVE) have been fixed: 87 of critical and 1167 of high severity.
The table below includes the total number of addressed unique and common CVEs by MOSK-specific component since MOSK 25.1.1 and MOSK management 2.29.6 patch. The common CVEs are issues addressed across several images.
Product component |
CVE type |
Critical |
High |
Total |
|---|---|---|---|---|
OpenStack |
Unique |
0 |
7 |
7 |
Common |
0 |
24 |
24 |
|
Tungsten Fabric |
Unique |
5 |
63 |
68 |
Common |
12 |
83 |
95 |
|
Kaas core |
Unique |
0 |
16 |
16 |
Common |
0 |
16 |
16 |
|
Ceph |
Unique |
0 |
9 |
9 |
Common |
0 |
62 |
62 |
|
StackLight |
Unique |
1 |
22 |
23 |
Common |
1 |
37 |
38 |
Mirantis Security Portal
For the detailed list of fixed and present CVEs across the Mirantis Container Cloud and MOSK products, refer to Mirantis Security Portal.
MOSK cluster release notes for older releases
This document provides a high-level overview of new features, known issues, and bug fixes included in the latest MOSK release. It also includes lists of release artifacts and fixed Common Vulnerabilities and Exposures (CVEs). The content is intended to help product users, operators, and administrators stay informed about key changes and improvements to the platform.
In addition to release highlights, the document includes update notes for each MOSK release. These notes support a smooth and informed cluster update process by outlining the update impact, critical pre- and post-update steps, and other relevant information.
25.1 series
25.1
Release date |
March 11, 2025 |
|---|---|
Name |
MOSK 25.1 |
Cluster release |
17.4.0 |
Highlights |
|
Component |
Support scope |
Feature |
|---|---|---|
OpenStack |
Full |
|
Full |
||
TechPreview |
Synchronization of local MariaDB backups with remote S3 storage |
|
TechPreview |
CephFS driver for the Shared Filesystems service (OpenStack Manila) |
|
TechPreview |
||
Full |
||
TechPreview |
||
Full |
||
Full |
||
TechPreview |
||
TechPreview |
||
Full |
||
Tungsten Fabric |
TechPreview |
|
Full |
||
StackLight |
Full |
|
Full |
||
Ceph |
Full |
|
Full |
||
Bare metal |
Full |
|
Cluster update |
TechPreview |
|
Container Cloud web UI |
Full |
|
Container runtime |
Full |
Introduced support for Open Virtual Network as a networking backend for OpenStack on greenfield deployments.
Introduced the IP address capacity monitoring, enabling cloud operators to better manage routable IP addresses. By providing insights into capacity usage, this monitoring capability helps predict future cloud needs, prevent service disruptions, and optimize the allocation of external IP address pools.
TechPreview
Implemented the capability to synchronize local MariaDB backups with a remote S3 storage ensuring data safety through secure authentication and server-side encryption for stored archives.
TechPreview
Implemented support for introspective instance monitor in the Instance High Availability (HA) service to improve the reliability and availability of OpenStack environments by continuously monitoring virtual machines for critical failure events. These include operating system crashes, kernel panics, unresponsive states, and so on.
Implemented the capability that enables cloud operators to define flexible rules to control assignment and removal of specific tags to and from OpenStack instances. The per-tag server tag policies allow the operator to restrict tag assignment and removal based on tag values.
Learn more
TechPreview
Implemented the capability that enables the cloud users to mark instances that should be handled individually during host maintenance operations, such as host reboots or data plane restarts. This provides greater flexibility during cluster updates, especially for workloads that are sensitive to live migration.
To mark the instances that require individual handling during host
maintenance, one of the following values for the
openstack.lcm.mirantis.com:maintenance_action=<ACTION-TAG> server tag
can be used: poweroff, live_migrate, or notify.
Enabled cloud operators to configure Message of the Day (MOTD) in the MOSK Dashboard (OpenStack Horizon). This feature allows cloud operators to communicate critical information, such as infrastructure issues, scheduled maintenance, and other important events, directly to users.
Added the capability for cloud users to specify the type of the volume to be created when launching instances using Image (with Create New Volume selected) as a boot source through the MOSK Dashboard (OpenStack Horizon). The default selection is the default volume type as returned by the Cinder API.
This enhancement provides greater control and an improved user experience for instance configuration through the web UI.
TechPreview
Enabled Neutron Trunk extension by default for all MOSK deployments to streamline the configuration of network port trunking in projects.
Enhanced cloud security by providing the capability to enable encryption
of OpenStack database backups, both local and remote, using the OpenSSL
aes-256-cbc encryption through the OpenStackDeployment custom
resource.
Learn more
The OpenStack Controller, which is the central component of MOSK and is responsible for the life cycle management of OpenStack services running in Kubernetes containers, has been open-sourced under the new name Rockoon and will be maintained as an independent open-source project going forward.
As part of this transition, all openstack-controller pods are now
named rockoon across the MOSK documentation and
deployments. This change does not affect functionality, but users should
update any references to the previous pod names accordingly.
TechPreview
Implemented the technical preview support for OpenSDN 24.1, successor to Tungsten Fabric, for greenfield deployments.
To start experimenting with the new functionality, set tfVersion to
24.1 in the TFOperator custom resource during the cloud deployment.
Introduced automatic Cassandra database repairs for Tungsten Fabric through
the tf-dbrepair-job CronJob. This enhancement allows users to enable
scheduled repairs, ensuring the health and consistency of their Cassandra
clusters with minimal manual intervention.
Reworked the following agent-related and service-related alerts from the cluster-wide to the host-wide scope, including the corresponding changes in the inhibition rules:
CinderServiceDownNeutronAgentDownNovaServiceDown
This enhancement allows the operator to better operate environments on a large scale.
Reworked monitoring of RabbitMQ by implementing the following changes:
Switched from the obsolete
prometheus-rabbitmq-exporterjob to therabbitmq-prometheus-pluginone, which is based on the native RabbitMQ Prometheus plugin ensuring reliable and direct metric colletion.Introduced the RabbitMQ Overview Grafana dashboard and reworked all alert rules to utilize metrics from the RabbitMQ Prometheus plugin. This dashboard replaces the deprecated RabbitMQ dashboard, which will be removed in one of the following releases.
Introduced the RabbitMQ Erlang Grafana dashboard to further enhance RabbitMQ monitoring capabilities.
Reworked RabbitMQ alerts:
Added the
RabbitMQTargetDownalert.Renamed
RabbitMQNetworkPartitionsDetectedtoRabbitMQUnreachablePeersDetected.Deprecated
RabbitMQDownandRabbitMQExporterTargetDown. They will be removed in one of the following releases.
Warning
If you use deprecated RabbitMQ metrics in customizations such as alerts and dashboards, switch to the new metrics and dashboards within the course of the MOSK 25.1 series to prevent issues once the deprecated metrics and dashboard will be removed.
Introduced the ability to securely store ingress Transport Layer Security (TLS)
certificates for Ceph Object Gateway public endpoints in a secret object. This
feature leverages the tlsSecretRefName field in the Ceph cluster spec,
enhancing security by preventing the exposure of sensitive data associated with
Ceph public endpoints.
On existing clusters, Mirantis recommends updating the Ceph cluster spec
by replacing fields containing TLS certificates with tlsSecretRefName as
described in Hide sensitive ingress data for Ceph public endpoints.
Note
Since MOSK 25.1, the ingress field of the
Ceph cluster spec is automatically replaced with the ingressConfig
field.
Added support for Rook 1.14.10 along with support for Ceph CSI v3.11.0. The updated Rook version contains the following brand new features included into the Ceph Controller API:
Introduced the ability to define custom monitor endpoint using the
monitorIPfield located in thenodessection of theKaasCephClusterCR. This field allows defining the monitor IP address from the Ceph public network range. For example:roles: ["mon", "mgr"] monitorIP: "196.168.13.1"
Added support for balancer mode for the Ceph Manager
balancermodule using thesettings.balancerModefield in theKaasCephClusterCR. For example:mgr: mgrModules: - name: balancer enabled: true settings: balancerMode: upmap
Upgrading to a new version of Rook and Ceph CSI occurs automatically during cluster upgrade.
To allow the operator use the gitops approach, implemented the
BareMetalHostInventory resource that must be used instead of
BareMetalHost for adding and modifying configuration of bare metal servers.
The BareMetalHostInventory resource monitors and manages the state of a
bare metal server and is created for each Machine with all information
about machine hardware configuration.
Each BareMetalHostInventory object is synchronized with an automatically
created BareMetalHost object, which is now used for internal purposes of
the Container Cloud private API.
Caution
Any change in the BareMetalHost object will be overwitten by
BareMetalHostInventory.
For any existing BareMetalHost object, a BareMetalHostInventory object
is created automatically during cluster update.
Caution
While the Cluster release of the management cluster is 16.4.0,
BareMetalHostInventory operations are allowed to
m:kaas@management-admin only. This limitation is lifted once the
management cluster is updated to the Cluster release 16.4.1 or later.
TechPreview
Introduced automatic pausing of a MOSK cluster update using
the UpdateAutoPause object. The operator can now define specific StackLight
alerts that trigger auto-pause of an update phase execution. The feature
enhances update management of MOSK clusters by preventing
harmful changes to be propagated across the entire cloud.
Implemented the ability to granularly update a MOSK cluster
in the Container Cloud web UI using the ClusterUpdatePlan object. The
feature introduces a convenient way to perform and control every step of a
MOSK cluster update.
MOSK 25.1 introduces switching of the default container runtime for the underlying Kubernetes cluster from Docker to containerd on greenfield deployments. The use of containerd allows for better Kubernetes performance and component update without pod restart when applying fixes for CVEs.
On existing deployments, perform the mandatory migration from Docker to containerd in the scope of MOSK 25.1.x. Otherwise, the management cluster update to Container Cloud 2.30.0 will be blocked.
Important
Container runtime migration involves machine cordoning and draining.
This section describes the MOSK known issues with available workarounds. For the known issues in the related MOSK management release, refer to Release Notes 2.29.0.
During MariaDB operations on a management cluster, Pods may get stuck in continuous restarts with the following example error:
[ERROR] WSREP: Corrupt buffer header: \
addr: 0x7faec6f8e518, \
seqno: 3185219421952815104, \
size: 909455917, \
ctx: 0x557094f65038, \
flags: 11577. store: 49, \
type: 49
Workaround:
Create a backup of the
/var/lib/mysqldirectory on themariadb-serverPod.Verify that other replicas are up and ready.
Remove the
galera.cachefile for the affectedmariadb-serverPod.Remove the affected
mariadb-serverPod or wait until it is automatically restarted.
After Kubernetes restarts the Pod, the Pod clones the database in 1-2 minutes and restores the quorum.
Due to the MetalLB upstream issue, a load balancer service may not obtain the external IP address.
The issue occurs when two services share the same external IP address and have
the same externalTrafficPolicy value. Initially, the services have the
external IP address assigned and are accessible. After modifying the
externalTrafficPolicy value for both services from Cluster to
Local, the first service that has been changed remains with no external IP
address assigned. Though, the second service, which was changed later, has the
external IP assigned as expected.
To work around the issue, make a dummy change to the service object where
external IP is <pending>:
Identify the service that is stuck:
kubectl get svc -A | grep pending
Example of system response:
stacklight iam-proxy-prometheus LoadBalancer 10.233.28.196 <pending> 443:30430/TCP
Add an arbitrary label to the service that is stuck. For example:
kubectl label svc -n stacklight iam-proxy-prometheus reconcile=1
Example of system response:
service/iam-proxy-prometheus labeledVerify that the external IP was allocated to the service:
kubectl get svc -n stacklight iam-proxy-prometheus
Example of system response:
NAME TYPE CLUSTER-IP EXTERNAL-IP PORT(S) AGE iam-proxy-prometheus LoadBalancer 10.233.28.196 10.0.34.108 443:30430/TCP 12d
Fixed in MOSK 24.3.6 Fixed in MOSK 25.1.1
Due to the issue in the OpenStack Cinder online data migration code, the
migration does not process soft-deleted rows. As a result, in the presence
of non-processed soft-deleted rows, the cinder-db-sync job may fail
during upgrade from Antelope to Caracal with the error in the pod logs
similar to the following:
2024-10-24 18:55:06.678 1 ERROR cinder pymysql.err.DataError: (1265, "Data truncated for column 'use_quota' at row 24")
The issue can occur if your MOSK cluster was initially deployed with OpenStack Wallaby or earlier release, such as Victoria, Ussuri, and so on, and you do not perform the standard periodic OpenStack database cleanup procedure. As a result, unprocessed soft-deleted database rows for volumes and snapshots created before the Xena release may still be present in the database, causing the failure of the database migration.
To verify if your cluster is affected:
Use the following SQL query against the OpenStack database:
SELECT COUNT(*) FROM cinder.volumes WHERE use_quota IS NULL; SELECT COUNT(*) FROM cinder.snapshots WHERE use_quota IS NULL;
If both queries return a zero count, your cluster is not affected.
If either query returns a non-zero count, your cluster is affected.
Verify that all the affected rows are soft-deleted:
SELECT COUNT(*) FROM cinder.volumes WHERE use_quota IS NULL AND deleted=0; SELECT COUNT(*) FROM cinder.snapshots WHERE use_quota IS NULL AND deleted=0;
If either query returns a non-zero count, stop and request Mirantis support.
If both queries return zero count, proceed with the workaround.
Workaround:
Manually change the value of the use_quota field to 1, where its
value is NULL using the following SQL query:
UPDATE cinder.volumes SET use_quota=1 WHERE deleted=1 AND use_quota IS NULL;
UPDATE cinder.snapshots SET use_quota=1 WHERE deleted=1 AND use_quota IS NULL;
This action is generally harmless as it only modifies rows that are already soft-deleted, and would eventually be removed by the database cleanup.
If you have already encountered the issue and your OpenStack upgrade is stuck,
perform the database modification as described above, then re-run the
cinder-db-sync job. Once completed, the upgrade should continue as
expected.
During major update of a MOSK cluster with Tungsten Fabric enabled, the
rockoon pod is continuously restarting and remaining in the APPLYING
state with the OpenStackDeployment did not transition to APPLYING state within
60 seconds error in logs.
To work around the issue, before launching the update, add the following
snippet in the spec:features:octavia section of the OpenStackDeployment
object:
...
octavia:
lb_network:
name: lb-mgmt-net
...
Rebooting all Cassandra cluster TFConfig or TFAnalytics nodes, maintenance, or other circumstances that cause the Cassandra pods to start simultaneously may cause a broken Cassandra TFConfig and/or TFAnalytics cluster. In this case, Cassandra nodes do not join the ring and do not update the IPs of the neighbor nodes. As a result, the TF services cannot operate Cassandra cluster(s).
To verify that a Cassandra cluster is affected:
Run the nodetool status command specifying the config or
analytics cluster and the replica number:
kubectl -n tf exec -it tf-cassandra-<config/analytics>-dc1-rack1-<replica number> -c cassandra -- nodetool status
Example of system response with outdated IP addresses:
Datacenter: DC1
===============
Status=Up/Down
|/ State=Normal/Leaving/Joining/Moving
-- Address Load Tokens Owns (effective) Host ID Rack
DN <outdated ip> ? 256 64.9% a58343d0-1e3f-4d54-bcdf-9b9b949ca873 r1
DN <outdated ip> ? 256 69.8% 67f1d07c-8b13-4482-a2f1-77fa34e90d48 r1
Datacenter: dc1
===============
Status=Up/Down
|/ State=Normal/Leaving/Joining/Moving
-- Address Load Tokens Owns (effective) Host ID Rack
UN <actual ip> 3.84 GiB 256 65.2% 7324ebc4-577a-425f-b3de-96faac95a331 rack1
Workaround:
Manually delete the Cassandra pod from the failed config or analytics
cluster to re-initiate the bootstrap process for one of the Cassandra nodes:
kubectl -n tf delete pod tf-cassandra-<config/analytics>-dc1-rack1-<replica_num>
Occasionally, RabbitMQ instances in tf-rabbitmq pods fail to enable
the tracking_records_in_ets during the initialization process.
To work around the problem, restart the affected pods manually.
After replacing a failed Tungsten Fabric controller node as described in Replace a failed TF controller node, the first restart of the Cassandra pod on this node may cause an issue if the Cassandra node with the outdated IP address has not been removed from the cluster. Subsequent Cassandra pod restarts should not trigger this problem.
To verify if your Cassandra cluster is affected, run the nodetool status command specifying the config or analytics cluster and the replica number:
kubectl -n tf exec -it tf-cassandra-<CONFIG-OR-ANALYTICS>-dc1-rack1-<REPLICA-NUM> -c cassandra -- nodetool status
Example of the system response with outdated IP addresses:
Datacenter: dc1
===============
Status=Up/Down
|/ State=Normal/Leaving/Joining/Moving
-- Address Load Tokens Owns Host ID Rack
UN 192.168.201.144 509.43 KiB 256 ? 7e760a99-fae5-4921-b0c5-d9e6e1eca1c5 rack1
UN 192.168.50.146 534.18 KiB 256 ? 2248ea35-85d4-4887-820b-1fac4733021f rack1
UN 192.168.145.147 484.19 KiB 256 ? d988aaaa-44ae-4fec-a617-0b0a253e736d rack1
DN 192.168.145.144 481.53 KiB 256 ? c23703a1-6854-47a7-a4a2-af649d63af0c rack1
An extra node will appear in the cluster with an outdated IP address
(the IP of the terminated Cassandra pod) in the Down state.
To work around the issue, after replacing the Tungsten Fabric controller node, delete the Cassandra pod on the replaced node and remove the outdated node from the Cassandra cluster using nodetool:
kubectl -n tf exec -it tf-cassandra-<CONFIG-OR-ANALYTICS>-dc1-rack1-<REPLICA-NUM> -c cassandra -- nodetool removenode <HOST-ID>
The issue occurs during HA operations such as hard node reboot and force node
shutdown, when tf-api is under load.
To work around the issue, manually trigger garbage collection and compaction as follows:
Reduce the garbage collection grace period:
ALTER TABLE config_db_uuid.obj_uuid_table WITH gc_grace_seconds = 10;
After some time (10+ seconds), run the following commands to force deletion of tombstones and compact the database:
nodetool garbagecollect -g CELL nodetool compact -s
Restore default
gc_grace_seconds = 864000to avoid potential performance issues.
During major or patch update of a MOSK cluster with StackLight enabled in
non-HA mode, the KubePodsCrashLooping alert may be firing for the Grafana
ReplicaSet.
Grafana relies on PostgreSQL for persistent data. In non-HA StackLight setup,
PostgreSQL becomes temporarily unavailable during updates. If Grafana loses its
database connection or fails to establish one during startup, Grafana fails
with an error. This may cause the Grafana pod to enter the CrashLoopBackOff
state. Such behavior is expected in non-HA StackLight setups. The Grafana pod
will resume normal operation after PostgreSQL is restored.
To prevent the issue, deploy StackLight in HA mode.
Custom Grafana panels and dashboards may be corrupted after automatic migration of deprecated Angular-based plugins to the React-based ones. For details, see Deprecation Notes: Angular plugins in Grafana dashboards and the post-update step Back up custom Grafana dashboards in MOSK 24.3 update notes.
To work around the issue, manually adjust the affected dashboards to restore their custom appearance.
During update of a management or MOSK cluster with StackLight enabled in HA
mode, the OpenSearchClusterStatusCritical alert may trigger when the next
OpenSearch node restarts before shards from the previous node finish assigning.
This can push some indices to red temporarily, making them unavailable for
reads and writes, possibly causing some new logs being lost.
The issue does not affect the cluster during the update, no workaround is needed, and you can safely ignore it.
The incompatibility between the newly implemented session refresh in the
upstream simple-salesforce with the MOSK implementation of session refresh
in sf-notifier results in the uncontrolled growth of new logins and lack
of session reuse. The issue applies to both MOSK and management clusters.
Workaround:
The workaround to the issue is to change the sf-notifier image tag directly
in the Deployment object. This change is not persistent as this direct change
in the Deployment object will be reverted or overridden by:
Container Cloud version update (for management clusters)
Cluster release version update (for MOSK cluster)
Any
sf-notifier-related operation (for all clusters):Disable and enable
Credentials change
IDs change
Any configuration change for resources, node selector, tolerations, and log level
Once applied, this workaround must be re-applied whenever one of the above operations is performed in the cluster.
Print the currently used image:
kubectl get deployment sf-notifier -n stacklight -o jsonpath="{.spec.template.spec.containers[0].image}"
Possible results:
mirantis.azurecr.io/stacklight/sf-notifier:v0.4-20250113023013or
127.0.0.1:44301/stacklight/sf-notifier:v0.4-20250113023013Compare the
sf-notifierimage tag with the list of affected tags. If the image is affected, it has to be replaced. Otherwise, your cluster is not affected.Affected tags:
v0.4-20241021023015 v0.4-20241028023015 v0.4-20241118023015 v0.4-20241216023012 v0.4-20250113023013 v0.4-20250217023014 v0.4-20250317092322 v0.4-20250414023016
In the resulting string, replace only the tag of the affected image with the desired
v0.4-20240828023015tag. Keep the registry the same as in the original Deployment object.Resulting images from examples:
mirantis.azurecr.io/stacklight/sf-notifier:v0.4-20240828023015
or
127.0.0.1:44301/stacklight/sf-notifier:v0.4-20240828023015
Update the
sf-notifierDeployment with the new image:kubectl set image deployment/sf-notifier sf-notifier=<new image> -n stacklight
For example:
kubectl set image deployment/sf-notifier sf-notifier=mirantis.azurecr.io/stacklight/sf-notifier:v0.4-20240828023015 -n stacklight
or
kubectl set image deployment/sf-notifier sf-notifier=127.0.0.1:44301/stacklight/sf-notifier:v0.4-20240828023015 -n stacklight
Wait until the pod with the updated image is created, and check the logs. Verify that there are no errors in the logs:
kubectl logs pod/<sf-notifier pod> -n stacklight
As this change is not persistent and can be reverted by the cluster update
operation or any operation related to sf-notifier, periodically check all
clusters and if the change has been reverted, re-apply the workaround.
Optionally, you can add a custom alert that will monitor the current tag of
the sf-notifier image and will fire the alert if the tag is present in
the list of affected tags. For the custom alert configuration details,
refer to Alert configuration.
Example of a custom alert to monitor the current tag of the sf-notifier
image:
- name: stacklight
values:
...
prometheusServer:
...
customAlerts:
...
- alert: SFnotifierImageVersion
annotations:
description: "sf-notifier image has a buggy tag, please revert deployment image back to sf-notifier:v0.4-20240828023015. This should be fixed in MCC 2.29.3 / MOSK 24.3.5, remove the alert after this release upgrade."
summary: "This image might be causing too many API logins and exceeding our monthly API budget, please act immediately"
expr: >-
avg(kube_pod_container_info{container="sf-notifier",image_spec=~".*v0.4-(20241021023015|20241028023015|20241118023015|20241216023012|20250113023013|20250217023014|20250317092322|20250414023016)"})
for: 5m
labels:
service: alertmanager
severity: critical
Fixed in 2.30.0 (21.0.0 and 20.0.0)
When telegraf-ds-smart is deployed on all nodes of a large cluster with
iSCSI volumes attached, the telegraf-ds-smart pod constantly restarts with
OOM kill messages on every compute node while smartctl is trying to scan
all attached iSCSI volumes.
To work around the issue, disable telegraf-ds-smart by minimizing its
CPU and memory limits:
resources:
telegrafDsSmart:
limits:
cpu: 2m
memory: 2Mi
requests:
cpu: 1m
memory: 1Mi
For configuration details, see StackLight configuration parameters: Resource limits and Increase memory limits for cluster components.
After moving a cluster into maintenance mode using the MOSK management console, an attempt to move a worker machine into maintenance mode fails with the Only undefined workers can be in maintainance mode at the same time.
As a workaround, move worker machines into maintenance mode using CLI as described in Enable maintenance mode on a cluster and machine using CLI.
Fixed in 2.30.0 (21.0.0 and 20.0.0)
A compact MOSK cluster fails to be deployed through the Container Cloud web UI
due to inability to add any label to the control plane machines along with
inability to change dedicatedControlPlane: false using the web UI.
To work around the issue, manually add the required labels using CLI. Once done, the cluster deployment resumes.
A newly created project does not display all available tabs and contains different access denied errors during first five minutes after creation.
To work around the issue, refresh the browser in five minutes after the project creation.
During cluster update, the rolling reboot fails on the Tungsten Fabric cluster. To work around the issue, restart the RabbitMQ pods in the Tungsten Fabric cluster.
Fixed in MOSK 25.1 Fixed in MOSK 25.1.1
When updating to the MOSK 24.3 series, tf-config pods from the Tungsten
Fabric namespace may enter the CrashLoopBackOff state. For example:
tf-config-cs8zr 2/5 CrashLoopBackOff 676 (19s ago) 15h
tf-config-db-6zxgg 1/1 Running 44 (25m ago) 15h
tf-config-db-7k5sz 1/1 Running 43 (23m ago) 15h
tf-config-db-dlwdv 1/1 Running 43 (25m ago) 15h
tf-config-nw4tr 3/5 CrashLoopBackOff 665 (43s ago) 15h
tf-config-wzf6c 1/5 CrashLoopBackOff 680 (10s ago) 15h
tf-control-c6bnn 3/4 Running 41 (23m ago) 13h
tf-control-gsnnp 3/4 Running 42 (23m ago) 13h
tf-control-sj6fd 3/4 Running 41 (23m ago) 13h
To troubleshoot the issue, check the logs inside the tf-config API
container and the tf-cassandra pods. The following example logs
indicate that Cassandra services failed to peer with each other and
are operating independently:
Logs from the
tf-configAPI container:NoHostAvailable: ('Unable to complete the operation against any hosts', {<Host: 192.168.200.23:9042 dc1>: Unavailable('Error from server: code=1000 [Unavailable exception] message="Cannot achieve consistency level QUORUM" info={\'required_replicas\': 2, \'alive_replicas\': 1, \'consistency\': \'QUORUM\'}',)})Logs from the
tf-cassandrapods:INFO [OptionalTasks:1] 2024-09-09 08:59:36,231 CassandraRoleManager.java:419 - Setup task failed with error, rescheduling WARN [OptionalTasks:1] 2024-09-09 08:59:46,231 CassandraRoleManager.java:379 - CassandraRoleManager skipped default role setup: some nodes were not ready
To work around the issue, restart the Cassandra services in the Tungsten Fabric namespace by deleting the affected pods sequentially to establish the connection between them:
kubectl -n tf delete pod tf-cassandra-config-dc1-rack1-0
kubectl -n tf delete pod tf-cassandra-config-dc1-rack1-1
kubectl -n tf delete pod tf-cassandra-config-dc1-rack1-2
Now, all other services in the Tungsten Fabric namespace should be in
the Active state.
During a MOSK cluster update, the tf-vrouter-agent-dpdk pods may become
unhealthy due to a failed LivenessProbe, causing the update process to get
stuck. The issue may only affect major updates when the cluster dataplane
components are restarted.
To work around the issue, manually remove the tf-vrouter-agent-dpdk
pods.
This section lists the components artifacts of the MOSK 25.1 release that includes binaries, Docker images, and Helm charts.
MOSK 25.1 OpenStack Helm charts
Component |
Path |
License information for main executable programs |
|---|---|---|
rockoon |
https://binary.mirantis.com/openstack/helm/rockoon/rockoon-1.0.7.tgz |
Mirantis Proprietary License |
MOSK 25.1 OpenStack Caracal binaries and Docker images
Component |
Path |
License information for main executable programs |
|---|---|---|
Binaries |
||
octavia-amphora |
https://binary.mirantis.com/openstack/bin/octavia/amphora-x64-haproxy-caracal-20250217113725.qcow2 |
Mirantis Proprietary License |
mirantis |
https://binary.mirantis.com/openstack/bin/horizon/mirantis-caracal-1f6ade2-20240408162450.tar.gz |
Mirantis Proprietary License |
kernel |
GPL-2.0 |
|
initramfs |
https://binary.mirantis.com/openstack/bin/ironic/tinyipa/tinyipa-stable-caracal-20250208065210.gz |
GPL-2.0 |
service-image |
https://binary.mirantis.com/openstack/bin/manila/manila-service-image-20241024092252.qcow2 |
Mirantis Proprietary License |
Docker images |
||
keystone |
mirantis.azurecr.io/openstack/keystone:caracal-jammy-20250217105151 |
Apache License 2.0 |
heat |
mirantis.azurecr.io/openstack/heat:caracal-jammy-20250217105151 |
Apache License 2.0 |
glance |
mirantis.azurecr.io/openstack/glance:caracal-jammy-20250217105151 |
Apache License 2.0 |
cinder |
mirantis.azurecr.io/openstack/cinder:caracal-jammy-20250217105151 |
Apache License 2.0 |
osprober |
mirantis.azurecr.io/openstack/osprober:0.0.1-a7dd070 |
Apache License 2.0 |
neutron |
mirantis.azurecr.io/openstack/neutron:caracal-jammy-20250217105151 |
Apache License 2.0 |
nova |
mirantis.azurecr.io/openstack/nova:caracal-jammy-20250217105151 |
Apache License 2.0 |
horizon |
mirantis.azurecr.io/openstack/horizon:caracal-jammy-20250217105151 |
Apache License 2.0 |
tempest |
mirantis.azurecr.io/openstack/tempest:caracal-jammy-20250217105151 |
Apache License 2.0 |
octavia |
mirantis.azurecr.io/openstack/octavia:caracal-jammy-20250217105151 |
Apache License 2.0 |
designate |
mirantis.azurecr.io/openstack/designate:caracal-jammy-20250217105151 |
Apache License 2.0 |
ironic |
mirantis.azurecr.io/openstack/ironic:caracal-jammy-20250217105151 |
Apache License 2.0 |
barbican |
mirantis.azurecr.io/openstack/barbican:caracal-jammy-20250217105151 |
Apache License 2.0 |
libvirt |
mirantis.azurecr.io/general/libvirt:8.0.x-jammy-reef-20241115095845 |
LGPL-2.1 License |
pause |
mirantis.azurecr.io/general/external/pause:3.1 |
Apache License 2.0 |
openvswitch |
mirantis.azurecr.io/general/openvswitch:2.17-jammy-20240827065304 |
Apache License 2.0 |
openvswitch-dpdk |
mirantis.azurecr.io/general/openvswitch-dpdk:2.17-jammy-20240827065304 |
Apache License 2.0 |
openstack-tools |
mirantis.azurecr.io/openstack/openstack-tools:antelope-jammy-20250210060030 |
Apache License 2.0 |
rabbitmq |
mirantis.azurecr.io/openstack/extra/rabbitmq:3.12.12-jammy-20240829072728 |
Mozilla Public License 2.0 |
rabbitmq-management |
mirantis.azurecr.io/openstack/extra/rabbitmq-management:3.12.12-jammy-20240829072728 |
Mozilla Public License 2.0 |
kubernetes-entrypoint |
mirantis.azurecr.io/openstack/extra/kubernetes-entrypoint:v1.0.1-d06c869-20250204085201 |
Apache License 2.0 |
memcached |
mirantis.azurecr.io/general/memcached:v1.6.32-alpine-20250213123431 |
BSD 3-Clause “New” or “Revised” License |
etcd |
mirantis.azurecr.io/openstack/extra/etcd:v3.5.18-alpine-20250213142511 |
Apache License 2.0 |
powerdns |
mirantis.azurecr.io/openstack/extra/powerdns:4.8-alpine-20241120110423 |
GPL-2.0 License |
nginx-ingress-controller |
mirantis.azurecr.io/openstack/extra/nginx-ingress-controller:1.11.3-alpine-20250213135405 |
Apache License 2.0 |
tls-proxy |
mirantis.azurecr.io/openstack/tls-proxy:jammy-fipster-1.0.0.dev2 |
Mirantis Proprietary License |
defaultbackend |
mirantis.azurecr.io/openstack/extra/defaultbackend:v1.19.2-77af1ef-20240910090142 |
Apache License 2.0 |
mariadb |
mirantis.azurecr.io/general/mariadb:10.6.20-jammy-20241104184039 |
GPLv2, LGPLv2.1 (client libraries) |
rabbitmq-exporter |
mirantis.azurecr.io/stacklight/rabbitmq-exporter:1.0.0 |
MIT License |
memcached-exporter |
mirantis.azurecr.io/stacklight/memcached-exporter:v0.15.0 |
Apache License 2.0 |
prometheus-mysql-exporter |
mirantis.azurecr.io/stacklight/mysqld-exporter:v0.16.0 |
Apache License 2.0 |
aodh |
mirantis.azurecr.io/openstack/aodh:caracal-jammy-20250217105151 |
Apache License 2.0 |
ceilometer |
mirantis.azurecr.io/openstack/ceilometer:caracal-jammy-20250217105151 |
Apache License 2.0 |
gnocchi |
mirantis.azurecr.io/openstack/gnocchi:caracal-jammy-20250217105151 |
Apache License 2.0 |
redis |
mirantis.azurecr.io/openstack/extra/redis:7.2.x-alpine-20250213163602 |
BSD 3-Clause “New” or “Revised” License |
redis-operator |
mirantis.azurecr.io/openstack/extra/redis-operator:v1.2.4-20241024111938 |
Apache License 2.0 |
frr |
mirantis.azurecr.io/general/external/docker.io/frrouting/frr:v9.1.2-20241111080549 |
GPL-2.0 and LGPL-2.1 |
strongswan |
mirantis.azurecr.io/openstack/extra/strongswan:alpine-5.9.12-20241024065424 |
GPL-2.0 |
rsyslog |
mirantis.azurecr.io/openstack/extra/rsyslog:v8.2001.0-20240829110216 |
GNU General Public License v3 |
descheduler |
mirantis.azurecr.io/openstack/extra/descheduler-20240910121701:v0.30.1-amd64-20240910114244 |
Apache License 2.0 |
nginx |
mirantis.azurecr.io/openstack/extra/nginx:1.27.2-20250213141444 |
Apache License 2.0 |
requirements |
mirantis.azurecr.io/openstack/requirements:caracal-jammy-20250217105151 |
Apache License 2.0 |
drb-controller |
mirantis.azurecr.io/openstack/extra/drb-controller:0.1.0-20240701093549 |
Mirantis Proprietary License |
stepler |
mirantis.azurecr.io/openstack/stepler:caracal-jammy-20250213105718 |
Apache License 2.0 |
placement |
mirantis.azurecr.io/openstack/placement:caracal-jammy-20250217105151 |
Apache License 2.0 |
masakari |
mirantis.azurecr.io/openstack/masakari:caracal-jammy-20250217105151 |
Apache License 2.0 |
masakari-monitors |
mirantis.azurecr.io/openstack/masakari-monitors:caracal-jammy-20250217105151 |
Apache License 2.0 |
ironic-inspector |
mirantis.azurecr.io/openstack/ironic-inspector:caracal-jammy-20250217105151 |
Apache License 2.0 |
manila |
mirantis.azurecr.io/openstack/manila:caracal-jammy-20250217105151 |
Apache License 2.0 |
MOSK 25.1 OpenStack Antelope binaries and Docker images Deprecated
Component |
Path |
License information for main executable programs |
|---|---|---|
Binaries |
||
octavia-amphora |
https://binary.mirantis.com/openstack/bin/octavia/amphora-x64-haproxy-antelope-20250217114015.qcow2 |
Mirantis Proprietary License |
mirantis |
https://binary.mirantis.com/openstack/bin/horizon/mirantis-antelope-18a1377-20230817112356.tar.gz |
Mirantis Proprietary License |
kernel |
GPL-2.0 |
|
initramfs |
https://binary.mirantis.com/openstack/bin/ironic/tinyipa/tinyipa-stable-antelope-20241015060810.gz |
GPL-2.0 |
service-image |
https://binary.mirantis.com/openstack/bin/manila/manila-service-image-20241024092252.qcow2 |
Mirantis Proprietary License |
Docker images |
||
keystone |
mirantis.azurecr.io/openstack/keystone:antelope-jammy-20250217105151 |
Apache License 2.0 |
heat |
mirantis.azurecr.io/openstack/heat:antelope-jammy-20250217105151 |
Apache License 2.0 |
glance |
mirantis.azurecr.io/openstack/glance:antelope-jammy-20250217105151 |
Apache License 2.0 |
cinder |
mirantis.azurecr.io/openstack/cinder:antelope-jammy-20250217105151 |
Apache License 2.0 |
osprober |
mirantis.azurecr.io/openstack/osprober:0.0.1-a7dd070 |
Apache License 2.0 |
neutron |
mirantis.azurecr.io/openstack/neutron:antelope-jammy-20250217105151 |
Apache License 2.0 |
nova |
mirantis.azurecr.io/openstack/nova:antelope-jammy-20250217105151 |
Apache License 2.0 |
horizon |
mirantis.azurecr.io/openstack/horizon:antelope-jammy-20250217105151 |
Apache License 2.0 |
tempest |
mirantis.azurecr.io/openstack/tempest:antelope-jammy-20250217105151 |
Apache License 2.0 |
octavia |
mirantis.azurecr.io/openstack/octavia:antelope-jammy-20250217105151 |
Apache License 2.0 |
designate |
mirantis.azurecr.io/openstack/designate:antelope-jammy-20250217105151 |
Apache License 2.0 |
ironic |
mirantis.azurecr.io/openstack/ironic:antelope-jammy-20250217105151 |
Apache License 2.0 |
barbican |
mirantis.azurecr.io/openstack/barbican:antelope-jammy-20250217105151 |
Apache License 2.0 |
libvirt |
mirantis.azurecr.io/general/libvirt:8.0.x-jammy-reef-20241115095845 |
LGPL-2.1 License |
pause |
mirantis.azurecr.io/general/external/pause:3.1 |
Apache License 2.0 |
openvswitch |
mirantis.azurecr.io/general/openvswitch:2.17-jammy-20240827065304 |
Apache License 2.0 |
openvswitch-dpdk |
mirantis.azurecr.io/general/openvswitch-dpdk:2.17-jammy-20240827065304 |
Apache License 2.0 |
openstack-tools |
mirantis.azurecr.io/openstack/openstack-tools:antelope-jammy-20250217105151 |
Apache License 2.0 |
rabbitmq |
mirantis.azurecr.io/openstack/extra/rabbitmq:3.12.12-jammy-20240829072728 |
Mozilla Public License 2.0 |
rabbitmq-management |
mirantis.azurecr.io/openstack/extra/rabbitmq-management:3.12.12-jammy-20240829072728 |
Mozilla Public License 2.0 |
kubernetes-entrypoint |
mirantis.azurecr.io/openstack/extra/kubernetes-entrypoint:v1.0.1-d06c869-20250204085201 |
Apache License 2.0 |
memcached |
mirantis.azurecr.io/general/memcached:v1.6.32-alpine-20250213123431 |
BSD 3-Clause “New” or “Revised” License |
etcd |
mirantis.azurecr.io/openstack/extra/etcd:v3.5.18-alpine-20250213142511 |
Apache License 2.0 |
powerdns |
mirantis.azurecr.io/openstack/extra/powerdns:4.8-alpine-20241120110423 |
GPL-2.0 License |
nginx-ingress-controller |
mirantis.azurecr.io/openstack/extra/nginx-ingress-controller:1.11.3-alpine-20250213135405 |
Apache License 2.0 |
tls-proxy |
mirantis.azurecr.io/openstack/tls-proxy:jammy-fipster-1.0.0.dev2 |
Mirantis Proprietary License |
defaultbackend |
mirantis.azurecr.io/openstack/extra/defaultbackend:v1.19.2-77af1ef-20240910090142 |
Apache License 2.0 |
mariadb |
mirantis.azurecr.io/general/mariadb:10.6.20-jammy-20241104184039 |
GPLv2, LGPLv2.1 (client libraries) |
rabbitmq-exporter |
mirantis.azurecr.io/stacklight/rabbitmq-exporter:1.0.0 |
MIT License |
memcached-exporter |
mirantis.azurecr.io/stacklight/memcached-exporter:v0.15.0 |
Apache License 2.0 |
prometheus-mysql-exporter |
mirantis.azurecr.io/stacklight/mysqld-exporter:v0.16.0 |
Apache License 2.0 |
aodh |
mirantis.azurecr.io/openstack/aodh:antelope-jammy-20250217105151 |
Apache License 2.0 |
ceilometer |
mirantis.azurecr.io/openstack/ceilometer:antelope-jammy-20250217105151 |
Apache License 2.0 |
gnocchi |
mirantis.azurecr.io/openstack/gnocchi:antelope-jammy-20250217105151 |
Apache License 2.0 |
redis |
mirantis.azurecr.io/openstack/extra/redis:7.2.x-alpine-20250213163602 |
BSD 3-Clause “New” or “Revised” License |
redis-operator |
mirantis.azurecr.io/openstack/extra/redis-operator:v1.2.4-20241024111938 |
Apache License 2.0 |
frr |
mirantis.azurecr.io/general/external/docker.io/frrouting/frr:v9.1.2-20241111080549 |
GPL-2.0 and LGPL-2.1 |
strongswan |
mirantis.azurecr.io/openstack/extra/strongswan:alpine-5.9.12-20241024065424 |
GPL-2.0 |
rsyslog |
mirantis.azurecr.io/openstack/extra/rsyslog:v8.2001.0-20240829110216 |
GNU General Public License v3 |
descheduler |
mirantis.azurecr.io/openstack/extra/descheduler-20240910121701:v0.30.1-amd64-20240910114244 |
Apache License 2.0 |
nginx |
mirantis.azurecr.io/openstack/extra/nginx:1.27.2-20250213141444 |
Apache License 2.0 |
requirements |
mirantis.azurecr.io/openstack/requirements:antelope-jammy-20250217105151 |
Apache License 2.0 |
drb-controller |
mirantis.azurecr.io/openstack/extra/drb-controller:0.1.0-20240701093549 |
Mirantis Proprietary License |
stepler |
mirantis.azurecr.io/openstack/stepler:antelope-jammy-20250213143220 |
Apache License 2.0 |
placement |
mirantis.azurecr.io/openstack/placement:antelope-jammy-20250217105151 |
Apache License 2.0 |
masakari |
mirantis.azurecr.io/openstack/masakari:antelope-jammy-20250217105151 |
Apache License 2.0 |
masakari-monitors |
mirantis.azurecr.io/openstack/masakari-monitors:antelope-jammy-20250217105151 |
Apache License 2.0 |
ironic-inspector |
mirantis.azurecr.io/openstack/ironic-inspector:antelope-jammy-20250217105151 |
Apache License 2.0 |
manila |
mirantis.azurecr.io/openstack/manila:antelope-jammy-20250217105151 |
Apache License 2.0 |
MOSK 25.1 Tungsten Fabric 21.4 artifacts
Component |
Path |
License information for main executable programs |
|---|---|---|
Helm charts |
||
tungstenfabric-operator |
https://binary.mirantis.com/tungsten/helm/tungstenfabric-operator-0.17.2.tgz |
Mirantis Proprietary License |
Docker images |
||
tungstenfabric-operator |
mirantis.azurecr.io/tungsten-operator/tungstenfabric-operator:0.17.2 |
Mirantis Proprietary License |
tungsten-pytest |
mirantis.azurecr.io/tungsten/tungsten-pytest:0.1-20250120150530 |
MIT License |
casskop |
mirantis.azurecr.io/tungsten-operator/casskop:2.2.8-mira |
Apache License 2.0 |
cassandra-bootstrap |
mirantis.azurecr.io/tungsten/cassandra-bootstrap:0.1.21 |
Apache License 2.0 |
cassandra |
mirantis.azurecr.io/tungsten/cassandra:3.11.17 |
Apache License 2.0 |
cassandra-config-builder |
mirantis.azurecr.io/tungsten/cass-config-builder:v2-20241122155019 |
Apache License 2.0 |
rabbitmq-operator |
mirantis.azurecr.io/tungsten-operator/rabbitmq-operator:0.4.8 |
Mirantis Proprietary License |
rabbitmq |
mirantis.azurecr.io/tungsten/rabbitmq:3.12.14-alpine |
Mozilla Public License 2.0 |
rabbitmq-exporter |
mirantis.azurecr.io/stacklight/rabbitmq-exporter:1.0.0 |
MIT License |
zookeeper-operator |
mirantis.azurecr.io/tungsten-operator/zookeeper-operator:0.2.25-mcp |
Apache License 2.0 |
zookeeper |
mirantis.azurecr.io/tungsten/zookeeper:3.8.4-20240813 |
Apache License 2.0 |
redis-operator |
mirantis.azurecr.io/tungsten-operator/redis-operator:0.4.8 |
Apache License 2.0 |
redis |
mirantis.azurecr.io/tungsten/redis:7.4.1-alpine |
BSD 3-Clause “New” or “Revised” License |
redis-exporter |
mirantis.azurecr.io/stacklight/redis_exporter:v1.66.0 |
BSD 3-Clause “New” or “Revised” License |
tf-cli |
mirantis.azurecr.io/tungsten/tf-cli:0.1-20250110161142 |
MIT License |
kubernetes-entrypoint |
mirantis.azurecr.io/openstack/extra/kubernetes-entrypoint:v1.0.1-202a68c-20250203183923 |
Apache License 2.0 |
pause |
mirantis.azurecr.io/general/external/pause:3.1 |
Apache License 2.0 |
tf-nodeinfo |
mirantis.azurecr.io/tungsten/tf-nodeinfo:0.1-20250203200404 |
MIT License |
contrail-controller-config-api |
mirantis.azurecr.io/tungsten/contrail-controller-config-api:21.4.20250203000000 |
Apache License 2.0 |
contrail-controller-config-devicemgr |
mirantis.azurecr.io/tungsten/contrail-controller-config-devicemgr:21.4.20250203000000 |
Apache License 2.0 |
contrail-controller-config-dnsmasq |
mirantis.azurecr.io/tungsten/contrail-controller-config-dnsmasq:21.4.20250203000000 |
Apache License 2.0 |
contrail-controller-config-schema |
mirantis.azurecr.io/tungsten/contrail-controller-config-schema:21.4.20250203000000 |
Apache License 2.0 |
contrail-controller-config-svcmonitor |
mirantis.azurecr.io/tungsten/contrail-controller-config-svcmonitor:21.4.20250203000000 |
Apache License 2.0 |
contrail-controller-control-control |
mirantis.azurecr.io/tungsten/contrail-controller-control-control:21.4.20250203000000 |
Apache License 2.0 |
contrail-controller-control-dns |
mirantis.azurecr.io/tungsten/contrail-controller-control-dns:21.4.20250203000000 |
Apache License 2.0 |
contrail-controller-control-named |
mirantis.azurecr.io/tungsten/contrail-controller-control-named:21.4.20250203000000 |
Apache License 2.0 |
contrail-controller-webui-job |
mirantis.azurecr.io/tungsten/contrail-controller-webui-job:21.4.20250203000000 |
Apache License 2.0 |
contrail-controller-webui-web |
mirantis.azurecr.io/tungsten/contrail-controller-webui-web:21.4.20250203000000 |
Apache License 2.0 |
contrail-node-init |
mirantis.azurecr.io/tungsten/contrail-node-init:21.4.20250203000000 |
Apache License 2.0 |
contrail-provisioner |
mirantis.azurecr.io/tungsten/contrail-provisioner:21.4.20250203000000 |
Apache License 2.0 |
contrail-tools |
mirantis.azurecr.io/tungsten/contrail-tools:21.4.20250203000000 |
Apache License 2.0 |
contrail-vrouter-agent |
mirantis.azurecr.io/tungsten/contrail-vrouter-agent:21.4.20250203000000 |
Apache License 2.0 |
contrail-vrouter-agent-dpdk |
mirantis.azurecr.io/tungsten/contrail-vrouter-agent-dpdk:21.4.20250203000000 |
Apache License 2.0 |
contrail-vrouter-kernel-build-init |
mirantis.azurecr.io/tungsten/contrail-vrouter-kernel-build-init:21.4.20250203000000 |
Apache License 2.0 |
MOSK 25.1 StackLight artifacts
Component |
Path |
License information for main executable programs |
|---|---|---|
Docker images |
||
prometheus-libvirt-exporter |
mirantis.azurecr.io/stacklight/prometheus-libvirt-exporter:v0.2-20250217023014 |
Mirantis Proprietary License |
tungstenfabric-prometheus-exporter |
mirantis.azurecr.io/stacklight/tungstenfabric-prometheus-exporter:0.1-20250205153914 |
Mirantis Proprietary License |
Helm charts |
||
fluentd |
https://binary.mirantis.com/stacklight/helm/fluentd-2.0.3-mcp-52.tgz |
Mirantis Proprietary License |
prometheus-libvirt-exporter |
https://binary.mirantis.com/stacklight/helm/prometheus-libvirt-exporter-0.2.0-mcp-7.tgz |
Mirantis Proprietary License |
prometheus-tungstenfabric-exporter |
https://binary.mirantis.com/stacklight/helm/prometheus-tungstenfabric-exporter-0.2.0-mcp-7.tgz |
Mirantis Proprietary License |
The following issues have been addressed in the MOSK 25.1 release:
[43058] Resolved the issue with the Cronjob for MariaDB that prevented it from transitioning to the
APPLYINGstate after changing theOpenStackDeploymentcustom resource.[47269] Resolved the issue that prevented instances from live-migrating.
[48890] Resolved the issue that caused an extremely high load on the gateway nodes.
[49678] Resolved the issue that caused the flapping status (
Configure→Ready→Configure→Ready) of machines where anyHostOSConfigurationobject was targeted and migration to containerd was applied.
[49078] Resolved the issue that caused migration to containerd to get stuck due to orphaned Docker containers.
[49340] Resolved the issue that caused failure of tag-based log filtering using the
tag_includeparameter forlogging.externalOutputswhenoutput_kind: auditis selected.[45215] Resolved the performance issue in the OpenStack PortProber Grafana dashboard when handling large amounts of metrics that caused time ranges to exceed one hour.
Implemented recording rules and updated the dashboard to leverage them, resulting in significant performance improvements. But be aware that the updated dashboard will only display data collected after cluster update.
To access older data, use the OpenStack PortProber [Deprecated] dashboard that will be removed in one of the following releases due to being unreliable when querying extended time ranges in high-load clusters.
[42660] Resolved the issue that caused the Nova - Hypervisor Overview Grafana dashboard to display the load average (per vCPU), allocated memory, and allocated disk (allocated by VMs) instead of real CPU, memory, and disk utilization with data collected from
node-exporterand OpenStack Nova.[39368] Resolved the issue that caused the
DockerSwarmNodeFlappingto be firing during cluster update.It is expected to see the
DockerSwarmNodeFlappingandDockerSwarmServiceReplicasFlappingalerts firing during cluster update to Container Cloud 2.29.0 but only before the StackLight component is updated.[39077] Resolved the issue that caused the
TelegrafGatherErrorsfortelegraf-docker-swarmto be firing during cluster update.Reworked the
TelegrafGatherErrorsalert and replaced it withTelegrafSMARTGatherErrorsandTelegrafDockerSwarmGatherErrorsalerts.It is expected to see the
TelegrafGatherErrorsalert firing during cluster update to Container Cloud 2.29.0 but only before the StackLight component is updated.
This section describes the specific actions you as a Cloud Operator need to complete to accurately plan and successfully perform your Mirantis OpenStack for Kubernetes (MOSK) cluster update to the version 25.1. Consider this information as a supplement to the generic update procedure published in Operations Guide: Update a MOSK cluster.
There is a possibility to update to the 25.1 version from the following cluster versions:
24.3 (released on October 16, 2024)
24.3.2 (released on February 03, 2025)
Important
Be advised that updating to version 25.1 will not be possible from at least the upcoming 24.3.3 and 24.3.4 patches. For the detailed cluster update schema, refer to MOSK cluster update schema.
The following table provides details on the update impact on a MOSK cluster.
Updated component |
Impact on cloud users |
Impact on cloud workloads |
|---|---|---|
OpenStack and Tungsten Fabric |
|
Open vSwitch networking - interruption of the North-South connectivity, depending on the type of virtual routers used by a workload:
Tungsten Fabric networking - no impact |
Ceph |
~1% of read operations on object storage API may fail |
IO performance degradation for Ceph-backed virtual storage devices. Pay special attention to the known issue 50566 that may affect the maintenance window. |
Host OS components |
No impact |
Instance network connectivity interruption up to 5 minutes |
Host OS kernel |
No impact |
Restart of instances due to the hypervisor reboot 0 |
- 0
Host operating system needs to be rebooted for the kernel update to be applied. Configure live-migration of workloads to avoid the impact on the instances running on a host.
Before updating the cluster, be sure to review the potential issues that may arise during the process and the recommended solutions to address them, as outlined in Update known issues.
Since Ubuntu 20.04 reaches end-of-life in April 2025, MOSK 25.1 does not support the Cluster release update of the Ubuntu 20.04-based clusters, and Ubuntu 22.04 becomes the only supported version of the host operating system.
Therefore, ensure that all your MOSK clusters are running Ubuntu 22.04 to unblock update of the management cluster to the Cluster release 16.4.1. For the Ubuntu upgrade procedure, refer to Upgrade an operating system distribution.
Caution
Usage of third-party software, which is not part of Mirantis-supported configurations, for example, the use of custom DPDK modules, may block upgrade of an operating system distribution. Users are fully responsible for ensuring the compatibility of such custom components with the latest supported Ubuntu version.
Note
This step only applies to the Tungsten Fabric based MOSK deployments.
To mitigate the known issue 51887 during update of a
MOSK cluster with Tungsten Fabric enabled, add the following
snippet in the spec:features:octavia section of the OpenStackDeployment
object before launching cluster update:
...
octavia:
lb_network:
name: lb-mgmt-net
...
In MOSK 25.1 and Container Cloud 2.29.0, Grafana is updated to version 11 where the following deprecated Angular-based plugins are automatically migrated to the React-based ones:
Graph (old) -> Time Series
Singlestat -> Stat
Stat (old) -> Stat
Table (old) -> Table
Worldmap -> Geomap
This migration may corrupt custom Grafana dashboards that have Angular-based panels. Therefore, if you have such dashboards, back them up and manually upgrade Angular-based panels before updating to MOSK 25.1 to prevent custom appearance issues after plugin migration.
Note
All Grafana dashboards provided by StackLight are also migrated to React automatically. For the list of default dashboards, see View Grafana dashboards.
Warning
For management clusters that are updated automatically, it is important to prepare the backup before Container Cloud 2.29.0 is released. Otherwise, custom dashboards using Angular-based plugins may be corrupted.
For managed clusters, you can perform the backup after the Container Cloud 2.29.0 release date but before updating them to MOSK 25.1.
Since MOSK 25.1, you can hide ingress TLS certificates for
Ceph Object Gateway public endpoint in a secret object and use
tlsSecretRefName in the Ceph cluster spec. This configuration prevents
exposing sensitive data of Ceph public endpoints.
On existing clusters, Mirantis recommends updating the Ceph cluster spec
by replacing fields containing TLS certificates with tlsSecretRefName:
Obtain ingress details. For example:
kubectl get ingress -n rook-ceph
Example of system response:
NAME CLASS HOSTS ADDRESS PORTS AGE rook-ceph-rgw-<rgw-store-name>-ingress <none> <rgw-store-name>.<rgw-public-domain> 10.10.0.134,10.10.0.148,10.10.0.203,10.10.0.210,10.10.0.222,10.10.0.232,10.10.0.27,10.10.0.67,10.10.0.82 80, 443 70d
Obtain the TLS secret name:
kubectl get ingress -n rook-ceph rook-ceph-rgw-<rgw-store-name>-ingress -o jsonpath='{.spec.tls[0].secretName}'
On the management cluster, update the
kaascephclusterspec:Note
Since MOSK 25.1, the
ingressfield of the Ceph clusterspecis automatically replaced with theingressConfigfield.Remove the
cacert,tlsCert, andtlsKeyfields:spec: cephClusterSpec: ingressConfig: tlsConfig: publicDomain: public.domain.name cacert: | -----BEGIN CERTIFICATE----- ... -----END CERTIFICATE----- tlsCert: | -----BEGIN CERTIFICATE----- ... -----END CERTIFICATE----- tlsKey: | -----BEGIN RSA PRIVATE KEY----- ... -----END RSA PRIVATE KEY----- controllerClassName: <ingress-controller-class-name> ...
Add
tlsSecretRefNamewith the previously obtained TLS secret name where TLS certificates are stored:spec: cephClusterSpec: ingressConfig: tlsConfig: publicDomain: public.domain.name tlsSecretRefName: <secret-name> controllerClassName: <ingress-controller-class-name> ...
Caution
If you update the ingress certificate, the new secret must be base64-encoded and have the same format as in the previous secret.
Note
This step applies if you use the Alertmanager API v1 in your integrations and configurations. Otherwise, skip this step.
In MOSK 25.1 and Container Cloud 2.29.0, the Alertmanager API v1 is deprecated and will be removed in one of the upcomping MOSK and Container Cloud releases. For details, see Deprecation Notes.
Therefore, if you use API v1, update your integrations and configurations to use the API v2 ensuring compatibility with new versions of Alertmanager.
Note
This step applies if log forwarding to external destinations is enabled. Otherwise, skip this step.
In the following major MOSK and Container Cloud releases,
the Fluentd plugin out_elasticsearch will be updated to the version that
no longer supports external output to opensearch.
Therefore, if you use opensearch as an external destination for logging and
used the elasticsearch value for the logging.externalOutputs[].type
parameter, change it to opensearch in the scope of Container Cloud 2.29.x
and MOSK 25.1.x release series. For the configuration
procedure, see Enable log forwarding to external destinations.
MOSK 25.1 introduces several enhancements for monitoring of RabbitMQ by StackLight, which include deprecation of some RabbitMQ metrics, alerts, and dashboard. For details, see RabbitMQ monitoring rework.
If you use deprecated RabbitMQ metrics in customizations such as alerts and dashboards, switch to the new metrics and dashboards within the course of the MOSK 25.1 series to prevent issues once the deprecated metrics and dashboard will be removed.
MOSK 25.1 introduces the BareMetalHostInventory resource
that must be used instead of BareMetalHost for adding and modifying
configuration of bare metal servers. Therefore, if you need to modify an
existing or create a new configuration of a bare metal host, use
BareMetalHostInventory.
Each BareMetalHostInventory object is synchronized with an automatically
created BareMetalHost object, which is now used for internal purposes of
the Container Cloud private API.
Caution
Any change in the BareMetalHost object will be overwitten by
BareMetalHostInventory.
For any existing BareMetalHost object, a BareMetalHostInventory object
is created automatically during cluster update.
Caution
While the Cluster release of the management cluster is 16.4.0,
BareMetalHostInventory operations are allowed to
m:kaas@management-admin only. This limitation is lifted once the
management cluster is updated to the Cluster release 16.4.1 or later.
MOSK 25.1 introduces switching of the default container runtime for the underlying Kubernetes cluster from Docker to containerd on greenfield deployments.
On existing deployments, perform the mandatory migration from Docker to containerd in the scope of MOSK 25.1.x. Otherwise, the management cluster update to Container Cloud 2.30.0 will be blocked.
Important
Container runtime migration involves machine cordoning and draining.
In total, since MOSK 24.3 major release, in 25.1, 285 Common Vulnerabilities and Exposures (CVE) have been fixed: 10 of critical and 275 of high severity.
The table below includes the total number of addressed unique and common CVEs by MOSK-specific component since MOSK 24.3.2 patch. The common CVEs are issues addressed across several images.
Product component |
CVE type |
Critical |
High |
Total |
|---|---|---|---|---|
OpenStack |
Unique |
1 |
9 |
10 |
Common |
2 |
59 |
61 |
|
Tungsten Fabric |
Unique |
4 |
67 |
71 |
Common |
5 |
106 |
111 |
Mirantis Security Portal
For the detailed list of fixed and present CVEs across the Mirantis Container Cloud and MOSK products, refer to Mirantis Security Portal.
Mirantis Container Cloud CVEs
For the number of fixed CVEs in the Mirantis Container Cloud-related components including kaas core, bare metal, Ceph, and StackLight, refer to Container Cloud 2.29.0: Security notes.
25.1.1 patch
The MOSK 25.1.1 patch includes the following updates:
Linux Kernel 5.15.0-143-generic
Mirantis Kubernetes Engine 3.7.24
Mandatory migration of container runtime from Docker to containerd
Security fixes for CVEs in images
Resolved product issues
Learn more about the release content and update specifics:
This section lists the components artifacts of the MOSK 25.1.1 release that includes binaries, Docker images, and Helm charts.
MOSK 25.1.1 OpenStack Helm charts
Component |
Path |
License information for main executable programs |
|---|---|---|
rockoon |
https://binary.mirantis.com/openstack/helm/rockoon/rockoon-1.0.12.tgz |
Apache License 2.0 (no License file in Helm chart) |
MOSK 25.1.1 OpenStack Caracal binaries and Docker images
Component |
Path |
License information for main executable programs |
|---|---|---|
Binaries |
||
octavia-amphora |
https://binary.mirantis.com/openstack/bin/octavia/amphora-x64-haproxy-caracal-20250728062733.qcow2 |
Mirantis Proprietary License |
mirantis |
https://binary.mirantis.com/openstack/bin/horizon/mirantis-caracal-1f6ade2-20240408162450.tar.gz |
Mirantis Proprietary License |
kernel |
GPL-2.0 |
|
initramfs |
https://binary.mirantis.com/openstack/bin/ironic/tinyipa/tinyipa-stable-caracal-20250306065210.gz |
GPL-2.0 |
service-image |
https://binary.mirantis.com/openstack/bin/manila/manila-service-image-20241024092252.qcow2 |
Mirantis Proprietary License |
Docker images |
||
keystone |
mirantis.azurecr.io/openstack/keystone:caracal-jammy-20250725183433 |
Apache License 2.0 |
heat |
mirantis.azurecr.io/openstack/heat:caracal-jammy-20250725183433 |
Apache License 2.0 |
glance |
mirantis.azurecr.io/openstack/glance:caracal-jammy-20250725183433 |
Apache License 2.0 |
cinder |
mirantis.azurecr.io/openstack/cinder:caracal-jammy-20250725183433 |
Apache License 2.0 |
osprober |
mirantis.azurecr.io/openstack/osprober:0.0.1-55e4c83 |
Apache License 2.0 |
neutron |
mirantis.azurecr.io/openstack/neutron:caracal-jammy-20250725183433 |
Apache License 2.0 |
nova |
mirantis.azurecr.io/openstack/nova:caracal-jammy-20250725183433 |
Apache License 2.0 |
horizon |
mirantis.azurecr.io/openstack/horizon:caracal-jammy-20250725183433 |
Apache License 2.0 |
tempest |
mirantis.azurecr.io/openstack/tempest:caracal-jammy-20250725183433 |
Apache License 2.0 |
octavia |
mirantis.azurecr.io/openstack/octavia:caracal-jammy-20250725183433 |
Apache License 2.0 |
designate |
mirantis.azurecr.io/openstack/designate:caracal-jammy-20250725183433 |
Apache License 2.0 |
ironic |
mirantis.azurecr.io/openstack/ironic:caracal-jammy-20250725183433 |
Apache License 2.0 |
barbican |
mirantis.azurecr.io/openstack/barbican:caracal-jammy-20250725183433 |
Apache License 2.0 |
libvirt |
mirantis.azurecr.io/general/libvirt:8.0.x-jammy-reef-20250729115649 |
LGPL-2.1 License |
pause |
mirantis.azurecr.io/general/external/pause:3.1 |
Apache License 2.0 |
openvswitch |
mirantis.azurecr.io/general/openvswitch:2.17-jammy-20250408072712 |
Apache License 2.0 |
openvswitch-dpdk |
mirantis.azurecr.io/general/openvswitch-dpdk:2.17-jammy-20250408072712 |
Apache License 2.0 |
openstack-tools |
mirantis.azurecr.io/openstack/openstack-tools:antelope-jammy-20250725183432 |
Apache License 2.0 |
rabbitmq |
mirantis.azurecr.io/openstack/extra/rabbitmq:3.12.12-jammy-20240829072728 |
Mozilla Public License 2.0 |
rabbitmq-management |
mirantis.azurecr.io/openstack/extra/rabbitmq-management:3.12.12-jammy-20240829072728 |
Mozilla Public License 2.0 |
kubernetes-entrypoint |
mirantis.azurecr.io/openstack/extra/kubernetes-entrypoint:v1.0.1-94cbbf5-20250227101657 |
Apache License 2.0 |
memcached |
mirantis.azurecr.io/general/memcached:v1.6.38-alpine-20250328111424 |
BSD 3-Clause “New” or “Revised” License |
etcd |
mirantis.azurecr.io/openstack/extra/etcd:v3.5.21-alpine-20250421162920 |
Apache License 2.0 |
powerdns |
mirantis.azurecr.io/openstack/extra/powerdns:4.8-alpine-20250422152737 |
GPL-2.0 License |
nginx-ingress-controller |
mirantis.azurecr.io/openstack/extra/nginx-ingress-controller:1.11.5-alpine-20250711084242 |
Apache License 2.0 |
tls-proxy |
mirantis.azurecr.io/openstack/tls-proxy:jammy-fipster-1.0.0.dev2 |
Mirantis Proprietary License |
defaultbackend |
mirantis.azurecr.io/openstack/extra/defaultbackend:v1.19.2-77af1ef-20240910090142 |
Apache License 2.0 |
mariadb |
mirantis.azurecr.io/general/mariadb:10.6.20-jammy-20250218081722 |
GPLv2, LGPLv2.1 (client libraries) |
rabbitmq-exporter |
mirantis.azurecr.io/stacklight/rabbitmq-exporter:1.0.0 |
MIT License |
memcached-exporter |
mirantis.azurecr.io/stacklight/memcached-exporter:v0.15.0 |
Apache License 2.0 |
prometheus-mysql-exporter |
mirantis.azurecr.io/stacklight/mysqld-exporter:v0.16.0 |
Apache License 2.0 |
aodh |
mirantis.azurecr.io/openstack/aodh:caracal-jammy-20250725183433 |
Apache License 2.0 |
ceilometer |
mirantis.azurecr.io/openstack/ceilometer:caracal-jammy-20250725183433 |
Apache License 2.0 |
gnocchi |
mirantis.azurecr.io/openstack/gnocchi:caracal-jammy-20250725183433 |
Apache License 2.0 |
redis |
mirantis.azurecr.io/openstack/extra/redis:7.2.x-alpine-20250624100054 |
BSD 3-Clause “New” or “Revised” License |
redis-operator |
mirantis.azurecr.io/openstack/extra/redis-operator:v1.2.4-20250624100054 |
Apache License 2.0 |
frr |
mirantis.azurecr.io/general/external/docker.io/frrouting/frr:v9.1.2-20250410070732 |
GPL-2.0 and LGPL-2.1 |
strongswan |
mirantis.azurecr.io/openstack/extra/strongswan:alpine-5.9.14-20250731072941 |
GPL-2.0 |
rsyslog |
mirantis.azurecr.io/openstack/extra/rsyslog:v8.2001.0-20240829110216 |
GNU General Public License v3 |
descheduler |
mirantis.azurecr.io/openstack/extra/descheduler-20250422051959:v0.32.2-amd64-20250418101136 |
Apache License 2.0 |
nginx |
mirantis.azurecr.io/openstack/extra/nginx:1.27.4-20250624093033 |
Apache License 2.0 |
requirements |
mirantis.azurecr.io/openstack/requirements:caracal-jammy-20250725183433 |
Apache License 2.0 |
drb-controller |
mirantis.azurecr.io/openstack/extra/drb-controller:0.1.0-20250709105323 |
Mirantis Proprietary License |
stepler |
mirantis.azurecr.io/openstack/stepler:caracal-jammy-20250624193837 |
Apache License 2.0 |
placement |
mirantis.azurecr.io/openstack/placement:caracal-jammy-20250725183433 |
Apache License 2.0 |
masakari |
mirantis.azurecr.io/openstack/masakari:caracal-jammy-20250725183433 |
Apache License 2.0 |
masakari-monitors |
mirantis.azurecr.io/openstack/masakari-monitors:caracal-jammy-20250725183433 |
Apache License 2.0 |
ironic-inspector |
mirantis.azurecr.io/openstack/ironic-inspector:caracal-jammy-20250725183433 |
Apache License 2.0 |
manila |
mirantis.azurecr.io/openstack/manila:caracal-jammy-20250725183433 |
Apache License 2.0 |
MOSK 25.1.1 OpenStack Antelope binaries and Docker images Deprecated
Component |
Path |
License information for main executable programs |
|---|---|---|
Binaries |
||
octavia-amphora |
https://binary.mirantis.com/openstack/bin/octavia/amphora-x64-haproxy-antelope-20250716080133.qcow2 |
Mirantis Proprietary License |
mirantis |
https://binary.mirantis.com/openstack/bin/horizon/mirantis-antelope-18a1377-20230817112356.tar.gz |
Mirantis Proprietary License |
kernel |
GPL-2.0 |
|
initramfs |
https://binary.mirantis.com/openstack/bin/ironic/tinyipa/tinyipa-stable-antelope-20241015060810.gz |
GPL-2.0 |
service-image |
https://binary.mirantis.com/openstack/bin/manila/manila-service-image-20241024092252.qcow2 |
Mirantis Proprietary License |
Docker images |
||
keystone |
mirantis.azurecr.io/openstack/keystone:antelope-jammy-20250725183432 |
Apache License 2.0 |
heat |
mirantis.azurecr.io/openstack/heat:antelope-jammy-20250725183432 |
Apache License 2.0 |
glance |
mirantis.azurecr.io/openstack/glance:antelope-jammy-20250725183432 |
Apache License 2.0 |
cinder |
mirantis.azurecr.io/openstack/cinder:antelope-jammy-20250725183432 |
Apache License 2.0 |
osprober |
mirantis.azurecr.io/openstack/osprober:0.0.1-55e4c83 |
Apache License 2.0 |
neutron |
mirantis.azurecr.io/openstack/neutron:antelope-jammy-20250725183432 |
Apache License 2.0 |
nova |
mirantis.azurecr.io/openstack/nova:antelope-jammy-20250725183432 |
Apache License 2.0 |
horizon |
mirantis.azurecr.io/openstack/horizon:antelope-jammy-20250725183432 |
Apache License 2.0 |
tempest |
mirantis.azurecr.io/openstack/tempest:antelope-jammy-20250725183432 |
Apache License 2.0 |
octavia |
mirantis.azurecr.io/openstack/octavia:antelope-jammy-20250725183432 |
Apache License 2.0 |
designate |
mirantis.azurecr.io/openstack/designate:antelope-jammy-20250725183432 |
Apache License 2.0 |
ironic |
mirantis.azurecr.io/openstack/ironic:antelope-jammy-20250725183432 |
Apache License 2.0 |
barbican |
mirantis.azurecr.io/openstack/barbican:antelope-jammy-20250725183432 |
Apache License 2.0 |
libvirt |
mirantis.azurecr.io/general/libvirt:8.0.x-jammy-reef-20250729115649 |
LGPL-2.1 License |
pause |
mirantis.azurecr.io/general/external/pause:3.1 |
Apache License 2.0 |
openvswitch |
mirantis.azurecr.io/general/openvswitch:2.17-jammy-20250408072712 |
Apache License 2.0 |
openvswitch-dpdk |
mirantis.azurecr.io/general/openvswitch-dpdk:2.17-jammy-20250408072712 |
Apache License 2.0 |
openstack-tools |
mirantis.azurecr.io/openstack/openstack-tools:antelope-jammy-20250725183432 |
Apache License 2.0 |
rabbitmq |
mirantis.azurecr.io/openstack/extra/rabbitmq:3.12.12-jammy-20240829072728 |
Mozilla Public License 2.0 |
rabbitmq-management |
mirantis.azurecr.io/openstack/extra/rabbitmq-management:3.12.12-jammy-20240829072728 |
Mozilla Public License 2.0 |
kubernetes-entrypoint |
mirantis.azurecr.io/openstack/extra/kubernetes-entrypoint:v1.0.1-94cbbf5-20250227101657 |
Apache License 2.0 |
memcached |
mirantis.azurecr.io/general/memcached:v1.6.38-alpine-20250328111424 |
BSD 3-Clause “New” or “Revised” License |
etcd |
mirantis.azurecr.io/openstack/extra/etcd:v3.5.21-alpine-20250421162920 |
Apache License 2.0 |
powerdns |
mirantis.azurecr.io/openstack/extra/powerdns:4.8-alpine-20250422152737 |
GPL-2.0 License |
nginx-ingress-controller |
mirantis.azurecr.io/openstack/extra/nginx-ingress-controller:1.11.5-alpine-20250711084242 |
Apache License 2.0 |
tls-proxy |
mirantis.azurecr.io/openstack/tls-proxy:jammy-fipster-1.0.0.dev2 |
Mirantis Proprietary License |
defaultbackend |
mirantis.azurecr.io/openstack/extra/defaultbackend:v1.19.2-77af1ef-20240910090142 |
Apache License 2.0 |
mariadb |
mirantis.azurecr.io/general/mariadb:10.6.20-jammy-20250218081722 |
GPLv2, LGPLv2.1 (client libraries) |
rabbitmq-exporter |
mirantis.azurecr.io/stacklight/rabbitmq-exporter:1.0.0 |
MIT License |
memcached-exporter |
mirantis.azurecr.io/stacklight/memcached-exporter:v0.15.0 |
Apache License 2.0 |
prometheus-mysql-exporter |
mirantis.azurecr.io/stacklight/mysqld-exporter:v0.16.0 |
Apache License 2.0 |
aodh |
mirantis.azurecr.io/openstack/aodh:antelope-jammy-20250725183432 |
Apache License 2.0 |
ceilometer |
mirantis.azurecr.io/openstack/ceilometer:antelope-jammy-20250725183432 |
Apache License 2.0 |
gnocchi |
mirantis.azurecr.io/openstack/gnocchi:antelope-jammy-20250725183432 |
Apache License 2.0 |
redis |
mirantis.azurecr.io/openstack/extra/redis:7.2.x-alpine-20250624100054 |
BSD 3-Clause “New” or “Revised” License |
redis-operator |
mirantis.azurecr.io/openstack/extra/redis-operator:v1.2.4-20250624100054 |
Apache License 2.0 |
frr |
mirantis.azurecr.io/general/external/docker.io/frrouting/frr:v9.1.2-20250410070732 |
GPL-2.0 and LGPL-2.1 |
strongswan |
mirantis.azurecr.io/openstack/extra/strongswan:alpine-5.9.14-20250731072941 |
GPL-2.0 |
rsyslog |
mirantis.azurecr.io/openstack/extra/rsyslog:v8.2001.0-20240829110216 |
GNU General Public License v3 |
descheduler |
mirantis.azurecr.io/openstack/extra/descheduler-20250422051959:v0.32.2-amd64-20250418101136 |
Apache License 2.0 |
nginx |
mirantis.azurecr.io/openstack/extra/nginx:1.27.4-20250624093033 |
Apache License 2.0 |
requirements |
mirantis.azurecr.io/openstack/requirements:antelope-jammy-20250725183432 |
Apache License 2.0 |
drb-controller |
mirantis.azurecr.io/openstack/extra/drb-controller:0.1.0-20250709105323 |
Mirantis Proprietary License |
stepler |
mirantis.azurecr.io/openstack/stepler:antelope-jammy-20250415171202 |
Apache License 2.0 |
placement |
mirantis.azurecr.io/openstack/placement:antelope-jammy-20250725183432 |
Apache License 2.0 |
masakari |
mirantis.azurecr.io/openstack/masakari:antelope-jammy-20250725183432 |
Apache License 2.0 |
masakari-monitors |
mirantis.azurecr.io/openstack/masakari-monitors:antelope-jammy-20250725183432 |
Apache License 2.0 |
ironic-inspector |
mirantis.azurecr.io/openstack/ironic-inspector:antelope-jammy-20250725183432 |
Apache License 2.0 |
manila |
mirantis.azurecr.io/openstack/manila:antelope-jammy-20250725183432 |
Apache License 2.0 |
MOSK 25.1.1 Tungsten Fabric 21.4 artifacts
Component |
Path |
License information for main executable programs |
|---|---|---|
Helm charts |
||
tungstenfabric-operator |
https://binary.mirantis.com/tungsten/helm/tungstenfabric-operator-0.17.6.tgz |
Mirantis Proprietary License |
Docker images |
||
tungstenfabric-operator |
mirantis.azurecr.io/tungsten-operator/tungstenfabric-operator:0.17.6 |
Mirantis Proprietary License |
tungsten-pytest |
mirantis.azurecr.io/tungsten/tungsten-pytest:0.1-20250710102929 |
MIT License |
casskop |
mirantis.azurecr.io/tungsten-operator/casskop:2.2.8-mira |
Apache License 2.0 |
cassandra-bootstrap |
mirantis.azurecr.io/tungsten/cassandra-bootstrap:0.1.23 |
Apache License 2.0 |
cassandra |
mirantis.azurecr.io/tungsten/cassandra:3.11.19 |
Apache License 2.0 |
cassandra-config-builder |
mirantis.azurecr.io/tungsten/cass-config-builder:v2-20250721172418 |
Apache License 2.0 |
rabbitmq-operator |
mirantis.azurecr.io/tungsten-operator/rabbitmq-operator:0.4.9 |
Mirantis Proprietary License |
rabbitmq |
mirantis.azurecr.io/tungsten/rabbitmq:3.12.14. |
Mozilla Public License 2.0 |
rabbitmq-exporter |
mirantis.azurecr.io/stacklight/rabbitmq-exporter:1.0.0 |
MIT License |
zookeeper-operator |
mirantis.azurecr.io/tungsten-operator/zookeeper-operator:0.2.26-mcp |
Apache License 2.0 |
zookeeper |
mirantis.azurecr.io/tungsten/zookeeper:3.9.3-20250320. |
Apache License 2.0 |
redis-operator |
mirantis.azurecr.io/tungsten-operator/redis-operator:0.4.9 |
Apache License 2.0 |
redis |
mirantis.azurecr.io/tungsten/redis:7.4.2-alpine3.21 |
BSD 3-Clause “New” or “Revised” License |
redis-exporter |
mirantis.azurecr.io/stacklight/redis_exporter:v1.66.0 |
BSD 3-Clause “New” or “Revised” License |
tf-cli |
mirantis.azurecr.io/tungsten/tf-cli:0.1-20250723164215 |
MIT License |
kubernetes-entrypoint |
mirantis.azurecr.io/openstack/extra/kubernetes-entrypoint:v1.0.1-94cbbf5-20250227101657 |
Apache License 2.0 |
pause |
mirantis.azurecr.io/general/external/pause:3.1 |
Apache License 2.0 |
tf-nodeinfo |
mirantis.azurecr.io/tungsten/tf-nodeinfo:0.1-20250616180810 |
MIT License |
contrail-controller-config-api |
mirantis.azurecr.io/tungsten/contrail-controller-config-api:25.1-r21.4.20250715135047 |
Apache License 2.0 |
contrail-controller-config-schema |
mirantis.azurecr.io/tungsten/contrail-controller-config-schema:25.1-r21.4.20250715135047 |
Apache License 2.0 |
contrail-controller-config-svcmonitor |
mirantis.azurecr.io/tungsten/contrail-controller-config-svcmonitor:25.1-r21.4.20250715135047 |
Apache License 2.0 |
contrail-controller-control-control |
mirantis.azurecr.io/tungsten/contrail-controller-control-control:25.1-r21.4.20250715135047 |
Apache License 2.0 |
contrail-controller-control-dns |
mirantis.azurecr.io/tungsten/contrail-controller-control-dns:25.1-r21.4.20250715135047 |
Apache License 2.0 |
contrail-controller-control-named |
mirantis.azurecr.io/tungsten/contrail-controller-control-named:25.1-r21.4.20250715135047 |
Apache License 2.0 |
contrail-controller-webui-job |
mirantis.azurecr.io/tungsten/contrail-controller-webui-job:25.1-r21.4.20250715135047 |
Apache License 2.0 |
contrail-controller-webui-web |
mirantis.azurecr.io/tungsten/contrail-controller-webui-web:25.1-r21.4.20250715135047 |
Apache License 2.0 |
contrail-node-init |
mirantis.azurecr.io/tungsten/contrail-node-init:25.1-r21.4.20250715135047 |
Apache License 2.0 |
contrail-provisioner |
mirantis.azurecr.io/tungsten/contrail-provisioner:25.1-r21.4.20250715135047 |
Apache License 2.0 |
contrail-tools |
mirantis.azurecr.io/tungsten/contrail-tools:25.1-r21.4.20250715135047 |
Apache License 2.0 |
contrail-vrouter-agent |
mirantis.azurecr.io/tungsten/contrail-vrouter-agent:25.1-r21.4.20250715135047 |
Apache License 2.0 |
contrail-vrouter-kernel-build-init |
mirantis.azurecr.io/tungsten/contrail-vrouter-kernel-build-init:25.1-r21.4.20250715135047 |
Apache License 2.0 |
MOSK 25.1.1 StackLight artifacts
Component |
Path |
License information for main executable programs |
|---|---|---|
Docker images |
||
prometheus-libvirt-exporter |
mirantis.azurecr.io/stacklight/prometheus-libvirt-exporter:v0.2-20250804010013 |
Mirantis Proprietary License |
tungstenfabric-prometheus-exporter |
mirantis.azurecr.io/stacklight/tungstenfabric-prometheus-exporter:0.1-20250205153914 |
Mirantis Proprietary License |
Helm charts |
||
fluentd |
https://binary.mirantis.com/stacklight/helm/fluentd-2.0.3-mcp-52.tgz |
Mirantis Proprietary License |
prometheus-libvirt-exporter |
https://binary.mirantis.com/stacklight/helm/prometheus-libvirt-exporter-0.2.0-mcp-7.tgz |
Mirantis Proprietary License |
prometheus-tungstenfabric-exporter |
https://binary.mirantis.com/stacklight/helm/prometheus-tungstenfabric-exporter-0.2.0-mcp-7.tgz |
Mirantis Proprietary License |
The table below contains the total number of addressed unique and common CVEs by MOSK-specific component compared to the previous release version. The common CVEs are issues addressed across several images.
Product component |
CVE type |
Critical |
High |
Total |
|---|---|---|---|---|
OpenStack |
Unique |
1 |
5 |
6 |
Common |
1 |
6 |
7 |
|
Tungsten Fabric |
Unique |
1 |
56 |
57 |
Common |
2 |
93 |
95 |
Mirantis Security Portal
For the detailed list of fixed and present CVEs across the Mirantis Container Cloud and MOSK products, refer to Mirantis Security Portal.
Mirantis Container Cloud CVEs
For the number of fixed CVEs in the Mirantis Container Cloud-related components including kaas core, bare metal, Ceph, and StackLight, refer to Release Notes 2.29.6: Security notes.
The following issues have been addressed in the MOSK 25.1.1 release:
[46671] Resolved the issue that caused the cluster update failure with the
tf-configpods crashed.[49078] Resolved the issue that caused migration to containerd to get stuck due to orphaned Docker containers.
[51887] Resolved the issue that caused continuous restart of the Rockoon controller pod.
[52414] Resolved the issue that resulted in the missing status in the
nodeworkloadlockobjects for OpenStack.
[47695] Resolved the issue encountered during an OpenStack upgrade to Caracal, where the Block Storage service failed due to database migration issues with the
use_quotacolumn in volumes.[50218] Resolved the issue when Octavia health manager remained stuck in initialization after a node replacement.
[50630] Resolved the issue that caused the
ironic-conductorpod to fail to start after powering a node off and then on again.[53764] Resolved the issue that prevented the
openstack-novachart from application after adding node overrides to theOpenStackDeploymentcustom resource.[53813] Resolved the issue in the
os-brickin the Antelope release that prevented updating the volume size if the volume was resized without detaching and multipath was enabled.
[52259] [Tungsten Fabric] Resolved the issue that prevented adjusting the Kubernetes resources causing OOM on the Tungsten Fabric control nodes.
[52410] [OVS] Resolved the issue that caused the unexpected restart of Open vSwitch pods during external proxy removal.
[49340] Resolved the issue that caused failure of tag-based log filtering using the
tag_includeparameter forlogging.externalOutputswhenoutput_kind: auditwas selected.
[49678] Resolved the issue that caused the flapping status (
Configure→Ready→Configure→Ready) of machines where anyHostOSConfigurationobject was targeted and migration to containerd was applied.
This section lists MOSK known issues with workarounds for the MOSK release 25.1.1. For the known issues in the related MOSK management release, refer to Release Notes 2.29.6.
During cluster update, the rolling reboot fails on the Tungsten Fabric cluster. To work around the issue, restart the RabbitMQ pods in the Tungsten Fabric cluster.
During a MOSK cluster update, the tf-vrouter-agent-dpdk pods may become
unhealthy due to a failed LivenessProbe, causing the update process to get
stuck. The issue may only affect major updates when the cluster dataplane
components are restarted.
To work around the issue, manually remove the tf-vrouter-agent-dpdk
pods.
During MariaDB operations on a management cluster, Pods may get stuck in continuous restarts with the following example error:
[ERROR] WSREP: Corrupt buffer header: \
addr: 0x7faec6f8e518, \
seqno: 3185219421952815104, \
size: 909455917, \
ctx: 0x557094f65038, \
flags: 11577. store: 49, \
type: 49
Workaround:
Create a backup of the
/var/lib/mysqldirectory on themariadb-serverPod.Verify that other replicas are up and ready.
Remove the
galera.cachefile for the affectedmariadb-serverPod.Remove the affected
mariadb-serverPod or wait until it is automatically restarted.
After Kubernetes restarts the Pod, the Pod clones the database in 1-2 minutes and restores the quorum.
Due to the MetalLB upstream issue, a load balancer service may not obtain the external IP address.
The issue occurs when two services share the same external IP address and have
the same externalTrafficPolicy value. Initially, the services have the
external IP address assigned and are accessible. After modifying the
externalTrafficPolicy value for both services from Cluster to
Local, the first service that has been changed remains with no external IP
address assigned. Though, the second service, which was changed later, has the
external IP assigned as expected.
To work around the issue, make a dummy change to the service object where
external IP is <pending>:
Identify the service that is stuck:
kubectl get svc -A | grep pending
Example of system response:
stacklight iam-proxy-prometheus LoadBalancer 10.233.28.196 <pending> 443:30430/TCP
Add an arbitrary label to the service that is stuck. For example:
kubectl label svc -n stacklight iam-proxy-prometheus reconcile=1
Example of system response:
service/iam-proxy-prometheus labeledVerify that the external IP was allocated to the service:
kubectl get svc -n stacklight iam-proxy-prometheus
Example of system response:
NAME TYPE CLUSTER-IP EXTERNAL-IP PORT(S) AGE iam-proxy-prometheus LoadBalancer 10.233.28.196 10.0.34.108 443:30430/TCP 12d
Occasionally, the password rotation procedure for admin or service
credentials may incorrectly report success without actually initiating
the rotation process. This can result in unchanged credentials despite
the procedure indicating completion.
To work around the issue, restart the rotation procedure and verify that the credentials have been successfully updated.
Rebooting all Cassandra cluster TFConfig or TFAnalytics nodes, maintenance, or other circumstances that cause the Cassandra pods to start simultaneously may cause a broken Cassandra TFConfig and/or TFAnalytics cluster. In this case, Cassandra nodes do not join the ring and do not update the IPs of the neighbor nodes. As a result, the TF services cannot operate Cassandra cluster(s).
To verify that a Cassandra cluster is affected:
Run the nodetool status command specifying the config or
analytics cluster and the replica number:
kubectl -n tf exec -it tf-cassandra-<config/analytics>-dc1-rack1-<replica number> -c cassandra -- nodetool status
Example of system response with outdated IP addresses:
Datacenter: DC1
===============
Status=Up/Down
|/ State=Normal/Leaving/Joining/Moving
-- Address Load Tokens Owns (effective) Host ID Rack
DN <outdated ip> ? 256 64.9% a58343d0-1e3f-4d54-bcdf-9b9b949ca873 r1
DN <outdated ip> ? 256 69.8% 67f1d07c-8b13-4482-a2f1-77fa34e90d48 r1
Datacenter: dc1
===============
Status=Up/Down
|/ State=Normal/Leaving/Joining/Moving
-- Address Load Tokens Owns (effective) Host ID Rack
UN <actual ip> 3.84 GiB 256 65.2% 7324ebc4-577a-425f-b3de-96faac95a331 rack1
Workaround:
Manually delete the Cassandra pod from the failed config or analytics
cluster to re-initiate the bootstrap process for one of the Cassandra nodes:
kubectl -n tf delete pod tf-cassandra-<config/analytics>-dc1-rack1-<replica_num>
Occasionally, RabbitMQ instances in tf-rabbitmq pods fail to enable
the tracking_records_in_ets during the initialization process.
To work around the problem, restart the affected pods manually.
After replacing a failed Tungsten Fabric controller node as described in Replace a failed TF controller node, the first restart of the Cassandra pod on this node may cause an issue if the Cassandra node with the outdated IP address has not been removed from the cluster. Subsequent Cassandra pod restarts should not trigger this problem.
To verify if your Cassandra cluster is affected, run the nodetool status command specifying the config or analytics cluster and the replica number:
kubectl -n tf exec -it tf-cassandra-<CONFIG-OR-ANALYTICS>-dc1-rack1-<REPLICA-NUM> -c cassandra -- nodetool status
Example of the system response with outdated IP addresses:
Datacenter: dc1
===============
Status=Up/Down
|/ State=Normal/Leaving/Joining/Moving
-- Address Load Tokens Owns Host ID Rack
UN 192.168.201.144 509.43 KiB 256 ? 7e760a99-fae5-4921-b0c5-d9e6e1eca1c5 rack1
UN 192.168.50.146 534.18 KiB 256 ? 2248ea35-85d4-4887-820b-1fac4733021f rack1
UN 192.168.145.147 484.19 KiB 256 ? d988aaaa-44ae-4fec-a617-0b0a253e736d rack1
DN 192.168.145.144 481.53 KiB 256 ? c23703a1-6854-47a7-a4a2-af649d63af0c rack1
An extra node will appear in the cluster with an outdated IP address
(the IP of the terminated Cassandra pod) in the Down state.
To work around the issue, after replacing the Tungsten Fabric controller node, delete the Cassandra pod on the replaced node and remove the outdated node from the Cassandra cluster using nodetool:
kubectl -n tf exec -it tf-cassandra-<CONFIG-OR-ANALYTICS>-dc1-rack1-<REPLICA-NUM> -c cassandra -- nodetool removenode <HOST-ID>
During major or patch update of a MOSK cluster with StackLight enabled in
non-HA mode, the KubePodsCrashLooping alert may be firing for the Grafana
ReplicaSet.
Grafana relies on PostgreSQL for persistent data. In non-HA StackLight setup,
PostgreSQL becomes temporarily unavailable during updates. If Grafana loses its
database connection or fails to establish one during startup, Grafana fails
with an error. This may cause the Grafana pod to enter the CrashLoopBackOff
state. Such behavior is expected in non-HA StackLight setups. The Grafana pod
will resume normal operation after PostgreSQL is restored.
To prevent the issue, deploy StackLight in HA mode.
During update of a management or MOSK cluster with StackLight enabled in HA
mode, the OpenSearchClusterStatusCritical alert may trigger when the next
OpenSearch node restarts before shards from the previous node finish assigning.
This can push some indices to red temporarily, making them unavailable for
reads and writes, possibly causing some new logs being lost.
The issue does not affect the cluster during the update, no workaround is needed, and you can safely ignore it.
Fixed in 2.30.0 (21.0.0 and 20.0.0)
When telegraf-ds-smart is deployed on all nodes of a large cluster with
iSCSI volumes attached, the telegraf-ds-smart pod constantly restarts with
OOM kill messages on every compute node while smartctl is trying to scan
all attached iSCSI volumes.
To work around the issue, disable telegraf-ds-smart by minimizing its
CPU and memory limits:
resources:
telegrafDsSmart:
limits:
cpu: 2m
memory: 2Mi
requests:
cpu: 1m
memory: 1Mi
For configuration details, see StackLight configuration parameters: Resource limits and Increase memory limits for cluster components.
After moving a cluster into maintenance mode using the MOSK management console, an attempt to move a worker machine into maintenance mode fails with the Only undefined workers can be in maintainance mode at the same time.
As a workaround, move worker machines into maintenance mode using CLI as described in Enable maintenance mode on a cluster and machine using CLI.
A newly created project does not display all available tabs and contains different access denied errors during first five minutes after creation.
To work around the issue, refresh the browser in five minutes after the project creation.
Fixed in 2.30.0 (21.0.0 and 20.0.0)
A compact MOSK cluster fails to be deployed through the Container Cloud web UI
due to inability to add any label to the control plane machines along with
inability to change dedicatedControlPlane: false using the web UI.
To work around the issue, manually add the required labels using CLI. Once done, the cluster deployment resumes.
This section describes the specific actions you need to complete to accurately plan and successfully perform the update. Consider this information as a supplement to the generic update procedures published in Operations Guide: Cluster update.
You can update to the 25.1.1 version from the following cluster versions:
Patch update: 25.1 (2025-03-11)
Major update: 24.3.7 (2025-07-14)
Caution
The next major MOSK 25.2 version will be released in September. If your cluster is running 25.1, Mirantis recommends waiting for the 25.2 release and updating directly to it instead of applying the 25.1.1 patch.
For the detailed cluster update schema, refer to MOSK cluster update schema.
The following table provides details on the impact of a MOSK cluster update to a patch release within the 25.1 series.
Note
For the detailed workflow of update to a patch release, refer to Update to a patch version.
Updated component |
Impact on cloud users |
Impact on cloud workloads |
|---|---|---|
OpenStack and Tungsten Fabric |
|
Open vSwitch networking - interruption of North-South connectivity, depending on the type of virtual routers used by a workload:
Tungsten Fabric networking - no impact |
Ceph |
~1% of read operations on object storage API may fail |
IO performance degradation for Ceph-backed virtual storage devices. Pay special attention to the known issue 50566 that may affect the maintenance window. |
Host OS components |
No impact |
No impact |
- 0(1,2)
You can bypass updating components of the cloud data plane to avoid the network downtime during Update to a patch version. By using this technique, you accept the risk that some security fixes may not be applied.
The following table provides details on the impact of a MOSK cluster update to a major release.
Updated component |
Impact on cloud users |
Impact on cloud workloads |
|---|---|---|
OpenStack and Tungsten Fabric |
|
Open vSwitch networking - interruption of the North-South connectivity, depending on the type of virtual routers used by a workload:
Tungsten Fabric networking - no impact |
Ceph |
~1% of read operations on object storage API may fail |
IO performance degradation for Ceph-backed virtual storage devices |
Host OS components |
No impact |
Instance network connectivity interruption up to 5 minutes |
Host OS kernel |
No impact |
Restart of instances due to the hypervisor reboot 1 |
- 1
Host operating system needs to be rebooted for the kernel update to be applied. Configure live-migration of workloads to avoid the impact on the instances running on a host.
Before updating the cluster, be sure to review the potential issues that may arise during the process and the recommended solutions to address them, as outlined in Update known issues.
Migration of container runtime from Docker to containerd, which is implemented for existing management and managed clusters, becomes mandatory in the scope of Container Cloud 2.29.x. Otherwise, the management cluster update to 2.30.0 will be blocked.
The use of containerd allows for better Kubernetes performance and component update without pod restart when applying fixes for CVEs. For the migration procedure, refer to Migrate container runtime from Docker to containerd.
Important
Container runtime migration involves machine cordoning and draining.
24.3 series
24.3
Release date |
October 16, 2024 |
|---|---|
Name |
MOSK 24.3 |
Cluster release |
17.3.0 |
Highlights |
|
Component |
Support scope |
Feature |
|---|---|---|
Major component updates |
Full |
|
Full |
||
OpenStack |
Full |
|
TechPreview |
||
TechPreview |
||
Full |
||
Full |
||
TechPreview |
||
Full |
||
Tungsten Fabric |
Full |
|
Full |
||
StackLight |
Full |
|
Full |
Implemented full support for OpenStack Caracal with Open vSwitch and Tungsten Fabric networking backends for greenfield deployments and for an upgrade from OpenStack Antelope. To upgrade an existing cloud from OpenStack Antelope to Caracal, follow the Upgrade OpenStack procedure.
For the OpenStack support cycle in MOSK, refer to OpenStack support cycle.
Highlights from upstream OpenStack supported by MOSK deployed on Caracal
Horizon:
Horizon added TOTP authentication support, allowing users to enhance their security by authenticating with Time-based One-Time Passwords.
Manila:
Manila shares and access rules can now be locked against deletion. A generic resource locks framework has been introduced to facilitate this. Users can also hide sensitive fields of access rules with this feature.
Neutron:
Limit the rate at which instances can query the metadata service in order to protect the OpenStack deployment from DoS or misbehaved instances.
New API which allows to define a set of security group rules to be used automatically in every new default and/or custom security group created for any project.
Nova:
It is now possible to define different authorization policies for migration with and without a target host.
To view the full list of OpenStack Caracal features, including those not supported by MOSK, refer to OpenStack Caracal upstream documentation: Release notes and source code.
Tungsten Fabric Horizon plugin removal
Since the OpenStack Caracal release, the Tungsten Fabric Horizon plugin has been deprecated and removed. This change impacts the Networking panel in OpenStack Horizon, which previously allowed for managing Network IPAMs and Network policies. With the removal of this plugin, Horizon no longer supports these features.
As a result, cloud operators may encounter Tungsten Fabric service networks
with snat-si in their names. These networks will be visible in
the network tabs and during the creation of ports or instances. Mirantis
advises cloud operators not to interact with these networks, as doing so
may cause system malfunctions.
Implemented full support for Ubuntu 22.04 LTS (Jammy Jellyfish) as the default host operating system in MOSK clusters, including greenfield deployments and update from Ubuntu 20.04 to 22.04 on existing clusters.
Ubuntu 20.04 is unsupported for greenfield deployments and is considered deprecated during the MOSK 24.3 release cycle for existing clusters.
Note
Since Container Cloud 2.27.0 (Cluster release 16.2.0), existing MOSK management clusters were automatically updated to Ubuntu 22.04 during cluster upgrade. Greenfield deployments of management clusters are also based on Ubuntu 22.04.
Required action
Implemented the capability for non-administrative OpenStack users to migrate instances, including both live and cold migrations. This functionality is useful when performing different maintenance tasks including cloud updates, handling noisy neighbors, and other operational needs.
TechPreview
Implemented the capability to connect external OpenID Connect (OIDC)
identity providers to MOSK Identity service (OpenStack
Keystone) directly through the OpenStackDeployment custom resource.
Learn more
TechPreview
Introduced the ability to configure custom volume backends for
MOSK Block Storage service (OpenStack Cinder), enhancing
flexibility in storage management. Users can now define and deploy their own
backend configurations through the OpenStackDeployment custom resource.
Learn more
Implemented the capability to automatically power off the guest instances during the compute node shutdown or reboot through the ACPI power event. This ensures the integrity of disk filesystems and prevents damage to running applications during cluster updates.
TechPreview
Implemented the Diagnostic Controller that performs cluster self-diagnostics to help the operator to easily understand, troubleshoot, and resolve potential issues against the major cluster components, including OpenStack, Tungsten Fabric, Ceph, and StackLight.
Running self-diagnostics is essential to ensure the overall health and optimal performance of a cluster. Mirantis recommends running self-diagnostics before cluster update, node replacement, or any other significant changes in the cluster to prevent potential issues and optimize the maintenance window.
Implemented etcd as a backend for TaskFlow within Octavia, offering a scalable, consistent, and fault-tolerant solution for persisting and managing task states. This ensures that Octavia reliably handles distributed load balancing tasks in a Kubernetes cluster.
Separated the vRouter provisioner from other Tungsten Fabric components.
Now, the vRouter provisioner is deployed as a separate DaemonSet
tf-vrouter-provisioner to allow for better control over
the vRouter components.
Implemented the automatic conversion of the Tungsten Fabric cluster
configuration API (TFOperator) v1alpha1 to the v2 version during update
to MOSK 24.3.
Since MOSK 24.3, the v2 TFOperator custom resource
should be used for any updates. The v1alpha1 TFOperator custom resource
will remain in the cluster but will no longer be reconciled and will be
automatically removed with the next cluster update.
Implemented monitoring of orphaned allocations in the MOSK Compute service (OpenStack Nova). This feature simplifies the detection and troubleshooting of orphaned resource allocations, ensuring that resources are correctly assigned and utilized within the cloud infrastructure.
Implemented health monitoring of the PowerDNS backend for MOSK DNS service (OpenStack Designate) using StackLight that allows detecting and preventing PowerDNS issues. Started scraping a set of metrics to monitor PowerDNS networking and detect server errors, failures, and outages. Based on these metrics, added the dedicated OpenStack PowerDNS Grafana dashboard and several alerts to notify the operator of any detected issues.
Mirantis has tested MOSK against a very specific configuration and can guarantee a predictable behavior of the product only in the exact same environments. The table below includes the major MOSK components with the exact versions against which testing has been performed.
Component |
Version |
|---|---|
Cluster release |
17.3.0 (Cluster release notes) |
OpenStack |
Caracal, Antelope |
OpenStack Operator |
0.17.8 |
Tungsten Fabric |
21.4 |
Tungsten Fabric Operator |
0.16.6 |
See also
For the supported versions of operating system, Ceph, and other components, refer to Compatibility Matrix.
This section describes the MOSK known issues with available workarounds. For the known issues in the related Container Cloud release, refer to Release Notes 2.28.0.
During MariaDB operations on a management cluster, Pods may get stuck in continuous restarts with the following example error:
[ERROR] WSREP: Corrupt buffer header: \
addr: 0x7faec6f8e518, \
seqno: 3185219421952815104, \
size: 909455917, \
ctx: 0x557094f65038, \
flags: 11577. store: 49, \
type: 49
Workaround:
Create a backup of the
/var/lib/mysqldirectory on themariadb-serverPod.Verify that other replicas are up and ready.
Remove the
galera.cachefile for the affectedmariadb-serverPod.Remove the affected
mariadb-serverPod or wait until it is automatically restarted.
After Kubernetes restarts the Pod, the Pod clones the database in 1-2 minutes and restores the quorum.
Due to the MetalLB upstream issue, a load balancer service may not obtain the external IP address.
The issue occurs when two services share the same external IP address and have
the same externalTrafficPolicy value. Initially, the services have the
external IP address assigned and are accessible. After modifying the
externalTrafficPolicy value for both services from Cluster to
Local, the first service that has been changed remains with no external IP
address assigned. Though, the second service, which was changed later, has the
external IP assigned as expected.
To work around the issue, make a dummy change to the service object where
external IP is <pending>:
Identify the service that is stuck:
kubectl get svc -A | grep pending
Example of system response:
stacklight iam-proxy-prometheus LoadBalancer 10.233.28.196 <pending> 443:30430/TCP
Add an arbitrary label to the service that is stuck. For example:
kubectl label svc -n stacklight iam-proxy-prometheus reconcile=1
Example of system response:
service/iam-proxy-prometheus labeledVerify that the external IP was allocated to the service:
kubectl get svc -n stacklight iam-proxy-prometheus
Example of system response:
NAME TYPE CLUSTER-IP EXTERNAL-IP PORT(S) AGE iam-proxy-prometheus LoadBalancer 10.233.28.196 10.0.34.108 443:30430/TCP 12d
Sometimes, after changing the OpenStackDeployment custom resource,
it does not transition to the APPLYING state as expected.
To work around the issue, restart the rockoon` pod in the osh-system
namespace.
During the upgrade to OpenStack Caracal, the masakari-db-sync Kubernetes
Job is failing preventing the Masakari API pods from initializing. The failure
is caused during migration of the Masakari database from legacy SQLAlchemy
Migrate to Alembic due to misconfigured alembic_table.
Workaround:
Before upgrading to Caracal, pin the
masakari_db_syncimage to the updated Caracal image by adding the following content to theOpenStackDeploymentcustom resource:spec: services: instance-ha: masakari: values: images: tags: masakari_db_sync: docker-dev-kaas-local.docker.mirantis.net/openstack/masakari:caracal-jammy-20241028141054
The database migration will be performed, but the actual database schema and data remain unchanged, only the migration metadata is updated.
Verify that Masakari in Antelope can now operate with the database schema from Caracal without issues:
exec masakari-manage db sync
Example of a positive system response:
2024-10-31 10:22:02.438 1 INFO masakari.db.sqlalchemy.migration [-] Applying migration(s) 2024-10-31 10:22:02.466 1 INFO masakari.db.sqlalchemy.migration [-] The database is still under sqlalchemy-migrate control; fake applying the initial alembic migration 2024-10-31 10:22:02.493 1 INFO masakari.engine.driver [-] Loading masakari notification driver 'taskflow_driver' 2024-10-31 10:22:03.819 1 INFO masakari.db.sqlalchemy.migration [-] Migration(s) applied
Perform upgrade to Caracal as instructed in Upgrade OpenStack.
Remove the image pin from the
OpenStackDeploymentcustom resource.
Fixed in MOSK 24.3.6 Fixed in MOSK 25.1.1
Due to the issue in the OpenStack Cinder online data migration code, the
migration does not process soft-deleted rows. As a result, in the presence
of non-processed soft-deleted rows, the cinder-db-sync job may fail
during upgrade from Antelope to Caracal with the error in the pod logs
similar to the following:
2024-10-24 18:55:06.678 1 ERROR cinder pymysql.err.DataError: (1265, "Data truncated for column 'use_quota' at row 24")
The issue can occur if your MOSK cluster was initially deployed with OpenStack Wallaby or earlier release, such as Victoria, Ussuri, and so on, and you do not perform the standard periodic OpenStack database cleanup procedure. As a result, unprocessed soft-deleted database rows for volumes and snapshots created before the Xena release may still be present in the database, causing the failure of the database migration.
To verify if your cluster is affected:
Use the following SQL query against the OpenStack database:
SELECT COUNT(*) FROM cinder.volumes WHERE use_quota IS NULL; SELECT COUNT(*) FROM cinder.snapshots WHERE use_quota IS NULL;
If both queries return a zero count, your cluster is not affected.
If either query returns a non-zero count, your cluster is affected.
Verify that all the affected rows are soft-deleted:
SELECT COUNT(*) FROM cinder.volumes WHERE use_quota IS NULL AND deleted=0; SELECT COUNT(*) FROM cinder.snapshots WHERE use_quota IS NULL AND deleted=0;
If either query returns a non-zero count, stop and request Mirantis support.
If both queries return zero count, proceed with the workaround.
Workaround:
Manually change the value of the use_quota field to 1, where its
value is NULL using the following SQL query:
UPDATE cinder.volumes SET use_quota=1 WHERE deleted=1 AND use_quota IS NULL;
UPDATE cinder.snapshots SET use_quota=1 WHERE deleted=1 AND use_quota IS NULL;
This action is generally harmless as it only modifies rows that are already soft-deleted, and would eventually be removed by the database cleanup.
If you have already encountered the issue and your OpenStack upgrade is stuck,
perform the database modification as described above, then re-run the
cinder-db-sync job. Once completed, the upgrade should continue as
expected.
Note
For the Tungsten Fabric limitations, refer to Tungsten Fabric known limitations.
Rebooting all Cassandra cluster TFConfig or TFAnalytics nodes, maintenance, or other circumstances that cause the Cassandra pods to start simultaneously may cause a broken Cassandra TFConfig and/or TFAnalytics cluster. In this case, Cassandra nodes do not join the ring and do not update the IPs of the neighbor nodes. As a result, the TF services cannot operate Cassandra cluster(s).
To verify that a Cassandra cluster is affected:
Run the nodetool status command specifying the config or
analytics cluster and the replica number:
kubectl -n tf exec -it tf-cassandra-<config/analytics>-dc1-rack1-<replica number> -c cassandra -- nodetool status
Example of system response with outdated IP addresses:
Datacenter: DC1
===============
Status=Up/Down
|/ State=Normal/Leaving/Joining/Moving
-- Address Load Tokens Owns (effective) Host ID Rack
DN <outdated ip> ? 256 64.9% a58343d0-1e3f-4d54-bcdf-9b9b949ca873 r1
DN <outdated ip> ? 256 69.8% 67f1d07c-8b13-4482-a2f1-77fa34e90d48 r1
Datacenter: dc1
===============
Status=Up/Down
|/ State=Normal/Leaving/Joining/Moving
-- Address Load Tokens Owns (effective) Host ID Rack
UN <actual ip> 3.84 GiB 256 65.2% 7324ebc4-577a-425f-b3de-96faac95a331 rack1
Workaround:
Manually delete the Cassandra pod from the failed config or analytics
cluster to re-initiate the bootstrap process for one of the Cassandra nodes:
kubectl -n tf delete pod tf-cassandra-<config/analytics>-dc1-rack1-<replica_num>
Occasionally, RabbitMQ instances in tf-rabbitmq pods fail to enable
the tracking_records_in_ets during the initialization process.
To work around the problem, restart the affected pods manually.
After replacing a failed Tungsten Fabric controller node as described in Replace a failed TF controller node, the first restart of the Cassandra pod on this node may cause an issue if the Cassandra node with the outdated IP address has not been removed from the cluster. Subsequent Cassandra pod restarts should not trigger this problem.
To verify if your Cassandra cluster is affected, run the nodetool status command specifying the config or analytics cluster and the replica number:
kubectl -n tf exec -it tf-cassandra-<CONFIG-OR-ANALYTICS>-dc1-rack1-<REPLICA-NUM> -c cassandra -- nodetool status
Example of the system response with outdated IP addresses:
Datacenter: dc1
===============
Status=Up/Down
|/ State=Normal/Leaving/Joining/Moving
-- Address Load Tokens Owns Host ID Rack
UN 192.168.201.144 509.43 KiB 256 ? 7e760a99-fae5-4921-b0c5-d9e6e1eca1c5 rack1
UN 192.168.50.146 534.18 KiB 256 ? 2248ea35-85d4-4887-820b-1fac4733021f rack1
UN 192.168.145.147 484.19 KiB 256 ? d988aaaa-44ae-4fec-a617-0b0a253e736d rack1
DN 192.168.145.144 481.53 KiB 256 ? c23703a1-6854-47a7-a4a2-af649d63af0c rack1
An extra node will appear in the cluster with an outdated IP address
(the IP of the terminated Cassandra pod) in the Down state.
To work around the issue, after replacing the Tungsten Fabric controller node, delete the Cassandra pod on the replaced node and remove the outdated node from the Cassandra cluster using nodetool:
kubectl -n tf exec -it tf-cassandra-<CONFIG-OR-ANALYTICS>-dc1-rack1-<REPLICA-NUM> -c cassandra -- nodetool removenode <HOST-ID>
During major or patch update of a MOSK cluster with StackLight enabled in
non-HA mode, the KubePodsCrashLooping alert may be firing for the Grafana
ReplicaSet.
Grafana relies on PostgreSQL for persistent data. In non-HA StackLight setup,
PostgreSQL becomes temporarily unavailable during updates. If Grafana loses its
database connection or fails to establish one during startup, Grafana fails
with an error. This may cause the Grafana pod to enter the CrashLoopBackOff
state. Such behavior is expected in non-HA StackLight setups. The Grafana pod
will resume normal operation after PostgreSQL is restored.
To prevent the issue, deploy StackLight in HA mode.
During update of a management or MOSK cluster with StackLight enabled in HA
mode, the OpenSearchClusterStatusCritical alert may trigger when the next
OpenSearch node restarts before shards from the previous node finish assigning.
This can push some indices to red temporarily, making them unavailable for
reads and writes, possibly causing some new logs being lost.
The issue does not affect the cluster during the update, no workaround is needed, and you can safely ignore it.
Fixed in MOSK 25.1 Fixed in MOSK 25.1.1
Tag-based filtering of logs using the tag_include parameter does not work
for the logging.externalOutputs feature when output_kind: audit is
selected.
For example, if the user wants to send only logs from the sudo
program and sets tag_include: sudo, none of the logs will be sent to an
external destination.
To work around the issue, allow forwarding of all audit logs in addition to
sudo, which include logs from sshd,
systemd-logind, and su. Instead of tag_include: sudo,
specify tag_include: '{sudo,systemd-audit}'.
When the fix applies in MOSK 25.1, filtering starts working automatically.
Fixed in 2.30.0 (21.0.0 and 20.0.0)
When telegraf-ds-smart is deployed on all nodes of a large cluster with
iSCSI volumes attached, the telegraf-ds-smart pod constantly restarts with
OOM kill messages on every compute node while smartctl is trying to scan
all attached iSCSI volumes.
To work around the issue, disable telegraf-ds-smart by minimizing its
CPU and memory limits:
resources:
telegrafDsSmart:
limits:
cpu: 2m
memory: 2Mi
requests:
cpu: 1m
memory: 1Mi
For configuration details, see StackLight configuration parameters: Resource limits and Increase memory limits for cluster components.
During cluster update, the rolling reboot fails on the Tungsten Fabric cluster. To work around the issue, restart the RabbitMQ pods in the Tungsten Fabric cluster.
Fixed in MOSK 25.1 Fixed in MOSK 25.1.1
When updating to the MOSK 24.3 series, tf-config pods from the Tungsten
Fabric namespace may enter the CrashLoopBackOff state. For example:
tf-config-cs8zr 2/5 CrashLoopBackOff 676 (19s ago) 15h
tf-config-db-6zxgg 1/1 Running 44 (25m ago) 15h
tf-config-db-7k5sz 1/1 Running 43 (23m ago) 15h
tf-config-db-dlwdv 1/1 Running 43 (25m ago) 15h
tf-config-nw4tr 3/5 CrashLoopBackOff 665 (43s ago) 15h
tf-config-wzf6c 1/5 CrashLoopBackOff 680 (10s ago) 15h
tf-control-c6bnn 3/4 Running 41 (23m ago) 13h
tf-control-gsnnp 3/4 Running 42 (23m ago) 13h
tf-control-sj6fd 3/4 Running 41 (23m ago) 13h
To troubleshoot the issue, check the logs inside the tf-config API
container and the tf-cassandra pods. The following example logs
indicate that Cassandra services failed to peer with each other and
are operating independently:
Logs from the
tf-configAPI container:NoHostAvailable: ('Unable to complete the operation against any hosts', {<Host: 192.168.200.23:9042 dc1>: Unavailable('Error from server: code=1000 [Unavailable exception] message="Cannot achieve consistency level QUORUM" info={\'required_replicas\': 2, \'alive_replicas\': 1, \'consistency\': \'QUORUM\'}',)})Logs from the
tf-cassandrapods:INFO [OptionalTasks:1] 2024-09-09 08:59:36,231 CassandraRoleManager.java:419 - Setup task failed with error, rescheduling WARN [OptionalTasks:1] 2024-09-09 08:59:46,231 CassandraRoleManager.java:379 - CassandraRoleManager skipped default role setup: some nodes were not ready
To work around the issue, restart the Cassandra services in the Tungsten Fabric namespace by deleting the affected pods sequentially to establish the connection between them:
kubectl -n tf delete pod tf-cassandra-config-dc1-rack1-0
kubectl -n tf delete pod tf-cassandra-config-dc1-rack1-1
kubectl -n tf delete pod tf-cassandra-config-dc1-rack1-2
Now, all other services in the Tungsten Fabric namespace should be in
the Active state.
The designate-zone-setup Kubernetes job in the openstack namespace
fails during update to MOSK 24.3 with the following error present in the
logs of the job pod:
openstack.exceptions.BadRequestException: BadRequestException: 400:
Client Error for url: http://designate-api.openstack.svc.cluster.local:9001/v2/zones,
Invalid TLD
The issue occurs when the DNS service (OpenStack Designate) has any TLDs
created, but test is not among them. Since DNS service monitoring
was added to MOSK 24.3, it attempts to create a test zone test-zone.test
in the Designate service, which fails if the test TLD is missing.
To work around the issue, verify that there are created TLDs present in the DNS service:
openstack tld list -f value -c name
If there are TLDs present and test is not one of them, create it:
Warning
Do not create the test TLD if no TLDs were present
in the DNS service initially. In this case, the issue is caused by
a different factor, and creating the test TLD when none existed
before may disrupt users of both the DNS and Networking services.
openstack tld create --name test
Example output:
+-------------+--------------------------------------+
| Field | Value |
+-------------+--------------------------------------+
| created_at | 2024-10-22T19:22:15.000000 |
| description | None |
| id | 930fed8b-1e91-4c8c-a00f-7abf68b944d0 |
| name | test |
| updated_at | None |
+-------------+--------------------------------------+
During a MOSK cluster update, the tf-vrouter-agent-dpdk pods may become
unhealthy due to a failed LivenessProbe, causing the update process to get
stuck. The issue may only affect major updates when the cluster dataplane
components are restarted.
To work around the issue, manually remove the tf-vrouter-agent-dpdk
pods.
After moving a cluster into maintenance mode using the MOSK management console, an attempt to move a worker machine into maintenance mode fails with the Only undefined workers can be in maintainance mode at the same time.
As a workaround, move worker machines into maintenance mode using CLI as described in Enable maintenance mode on a cluster and machine using CLI.
Fixed in 2.30.0 (21.0.0 and 20.0.0)
A compact MOSK cluster fails to be deployed through the Container Cloud web UI
due to inability to add any label to the control plane machines along with
inability to change dedicatedControlPlane: false using the web UI.
To work around the issue, manually add the required labels using CLI. Once done, the cluster deployment resumes.
A newly created project does not display all available tabs and contains different access denied errors during first five minutes after creation.
To work around the issue, refresh the browser in five minutes after the project creation.
This section lists the components artifacts of the MOSK 24.3 release that includes binaries, Docker images, and Helm charts.
MOSK 24.3 OpenStack Caracal binaries and Docker images
Component |
Path |
License information for main executable programs |
|---|---|---|
Binaries |
||
octavia-amphora |
https://binary.mirantis.com/openstack/bin/octavia/amphora-x64-haproxy-caracal-20240917163046.qcow2 |
Mirantis Proprietary License |
mirantis |
https://binary.mirantis.com/openstack/bin/horizon/mirantis-caracal-1f6ade2-20240408162450.tar.gz |
Mirantis Proprietary License |
kernel |
GPL-2.0 |
|
initramfs |
https://binary.mirantis.com/openstack/bin/ironic/tinyipa/tinyipa-stable-caracal-20240523065213.gz |
GPL-2.0 |
service-image |
https://binary.mirantis.com/openstack/bin/manila/manila-service-image-20240318125453.qcow2 |
Mirantis Proprietary License |
Docker images |
||
keystone |
mirantis.azurecr.io/openstack/keystone:caracal-jammy-20240917152114 |
Apache License 2.0 |
heat |
mirantis.azurecr.io/openstack/heat:caracal-jammy-20240917152114 |
Apache License 2.0 |
glance |
mirantis.azurecr.io/openstack/glance:caracal-jammy-20240917152114 |
Apache License 2.0 |
cinder |
mirantis.azurecr.io/openstack/cinder:caracal-jammy-20240917152114 |
Apache License 2.0 |
osprober |
mirantis.azurecr.io/openstack/osprober:0.0.1-eae04fb |
Apache License 2.0 |
neutron |
mirantis.azurecr.io/openstack/neutron:caracal-jammy-20240917152114 |
Apache License 2.0 |
nova |
mirantis.azurecr.io/openstack/nova:caracal-jammy-20240917152114 |
Apache License 2.0 |
horizon |
mirantis.azurecr.io/openstack/horizon:caracal-jammy-20240917152114 |
Apache License 2.0 |
tempest |
mirantis.azurecr.io/openstack/tempest:antelope-jammy-20240917152117 |
Apache License 2.0 |
octavia |
mirantis.azurecr.io/openstack/octavia:caracal-jammy-20240917152114 |
Apache License 2.0 |
designate |
mirantis.azurecr.io/openstack/designate:caracal-jammy-20240917152114 |
Apache License 2.0 |
ironic |
mirantis.azurecr.io/openstack/ironic:caracal-jammy-20240917152114 |
Apache License 2.0 |
barbican |
mirantis.azurecr.io/openstack/barbican:caracal-jammy-20240917152114 |
Apache License 2.0 |
libvirt |
mirantis.azurecr.io/general/libvirt:8.0.x-jammy-reef-20240822074257 |
LGPL-2.1 License |
pause |
mirantis.azurecr.io/general/external/pause:3.1 |
Apache License 2.0 |
openvswitch |
mirantis.azurecr.io/general/openvswitch:2.17-jammy-20240827065304 |
Apache License 2.0 |
openvswitch-dpdk |
mirantis.azurecr.io/general/openvswitch-dpdk:2.17-jammy-20240827065304 |
Apache License 2.0 |
openstack-tools |
mirantis.azurecr.io/openstack/openstack-tools:yoga-jammy-20240819060021 |
Apache License 2.0 |
rabbitmq |
mirantis.azurecr.io/openstack/extra/rabbitmq:3.12.12-jammy-20240829072728 |
Mozilla Public License 2.0 |
rabbitmq-management |
mirantis.azurecr.io/openstack/extra/rabbitmq-management:3.12.12-jammy-20240829072728 |
Mozilla Public License 2.0 |
kubernetes-entrypoint |
mirantis.azurecr.io/openstack/extra/kubernetes-entrypoint:v1.0.1-34a4f54-20240910081335 |
Apache License 2.0 |
memcached |
mirantis.azurecr.io/general/memcached:v1.6.23-alpine-20240905100031 |
BSD 3-Clause “New” or “Revised” License |
etcd |
mirantis.azurecr.io/openstack/extra/etcd:v3.5.16-alpine-20240911082430 |
Apache License 2.0 |
powerdns |
mirantis.azurecr.io/openstack/extra/powerdns:4.8-alpine-20240905182339 |
GPL-2.0 License |
nginx-ingress-controller |
mirantis.azurecr.io/openstack/extra/nginx-ingress-controller:1.11.2-alpine-20240913100326 |
Apache License 2.0 |
tls-proxy |
mirantis.azurecr.io/openstack/tls-proxy:jammy-fipster-1.0.0 |
Mirantis Proprietary License |
defaultbackend |
mirantis.azurecr.io/openstack/extra/defaultbackend:v1.19.2-77af1ef-20240910090142 |
Apache License 2.0 |
mariadb |
mirantis.azurecr.io/general/mariadb:10.6.17-focal-20240909113408 |
GPLv2, LGPLv2.1 (client libraries) |
rabbitmq-exporter |
mirantis.azurecr.io/stacklight/rabbitmq-exporter:1.0.0 |
MIT License |
memcached-exporter |
mirantis.azurecr.io/stacklight/memcached-exporter:v0.14.4 |
Apache License 2.0 |
prometheus-mysql-exporter |
mirantis.azurecr.io/stacklight/mysqld-exporter:v0.11.0 |
Apache License 2.0 |
aodh |
mirantis.azurecr.io/openstack/aodh:caracal-jammy-20240917152114 |
Apache License 2.0 |
ceilometer |
mirantis.azurecr.io/openstack/ceilometer:caracal-jammy-20240917152114 |
Apache License 2.0 |
gnocchi |
mirantis.azurecr.io/openstack/gnocchi:caracal-jammy-20240917152114 |
Apache License 2.0 |
redis |
mirantis.azurecr.io/openstack/extra/redis:7.2.x-alpine-20240905134302 |
BSD 3-Clause “New” or “Revised” License |
redis-operator |
mirantis.azurecr.io/openstack/extra/redis-operator:v1.2.4-20240909123821 |
Apache License 2.0 |
frr |
mirantis.azurecr.io/general/external/docker.io/frrouting/frr:v9.1.2-20240918073840 |
GPL-2.0 and LGPL-2.1 |
strongswan |
mirantis.azurecr.io/openstack/extra/strongswan:alpine-5.9.12-20240905114128 |
GPL-2.0 |
rsyslog |
mirantis.azurecr.io/openstack/extra/rsyslog:v8.2001.0-20240829110216 |
GNU General Public License v3 |
descheduler |
mirantis.azurecr.io/openstack/extra/descheduler-20240910121701:v0.30.1-amd64-20240910114244 |
Apache License 2.0 |
nginx |
mirantis.azurecr.io/openstack/extra/nginx:1.25.3-20240905140249 |
Apache License 2.0 |
requirements |
mirantis.azurecr.io/openstack/requirements:caracal-jammy-20240917152114 |
Apache License 2.0 |
drb-controller |
mirantis.azurecr.io/openstack/extra/drb-controller:0.1.0-20240701093549 |
Mirantis Proprietary License |
stepler |
mirantis.azurecr.io/openstack/stepler:caracal-jammy-20240919161246 |
Apache License 2.0 |
placement |
mirantis.azurecr.io/openstack/placement:caracal-jammy-20240917152114 |
Apache License 2.0 |
masakari |
mirantis.azurecr.io/openstack/masakari:caracal-jammy-20240917152114 |
Apache License 2.0 |
masakari-monitors |
mirantis.azurecr.io/openstack/masakari-monitors:caracal-jammy-20240917152114 |
Apache License 2.0 |
ironic-inspector |
mirantis.azurecr.io/openstack/ironic-inspector:caracal-jammy-20240917152114 |
Apache License 2.0 |
manila |
mirantis.azurecr.io/openstack/manila:caracal-jammy-20240917152114 |
Apache License 2.0 |
MOSK 24.3 OpenStack Antelope binaries and Docker images
Component |
Path |
License information for main executable programs |
|---|---|---|
Binaries |
||
octavia-amphora |
https://binary.mirantis.com/openstack/bin/octavia/amphora-x64-haproxy-antelope-20240917163055.qcow2 |
Mirantis Proprietary License |
mirantis |
https://binary.mirantis.com/openstack/bin/horizon/mirantis-antelope-18a1377-20230817112356.tar.gz |
Mirantis Proprietary License |
kernel |
GPL-2.0 |
|
initramfs |
https://binary.mirantis.com/openstack/bin/ironic/tinyipa/tinyipa-stable-antelope-20240213233421.gz |
GPL-2.0 |
service-image |
https://binary.mirantis.com/openstack/bin/manila/manila-service-image-20240318125453.qcow2 |
Mirantis Proprietary License |
Docker images |
||
keystone |
mirantis.azurecr.io/openstack/keystone:antelope-jammy-20240917152117 |
Apache License 2.0 |
heat |
mirantis.azurecr.io/openstack/heat:antelope-jammy-20240917152117 |
Apache License 2.0 |
glance |
mirantis.azurecr.io/openstack/glance:antelope-jammy-20240917152117 |
Apache License 2.0 |
cinder |
mirantis.azurecr.io/openstack/cinder:antelope-jammy-20240917152117 |
Apache License 2.0 |
osprober |
mirantis.azurecr.io/openstack/osprober:0.0.1-eae04fb |
Apache License 2.0 |
neutron |
mirantis.azurecr.io/openstack/neutron:antelope-jammy-20240917152117 |
Apache License 2.0 |
nova |
mirantis.azurecr.io/openstack/nova:antelope-jammy-20240917152117 |
Apache License 2.0 |
horizon |
mirantis.azurecr.io/openstack/horizon:antelope-jammy-20240917152117 |
Apache License 2.0 |
tempest |
mirantis.azurecr.io/openstack/tempest:antelope-jammy-20240917152117 |
Apache License 2.0 |
octavia |
mirantis.azurecr.io/openstack/octavia:antelope-jammy-20240917152117 |
Apache License 2.0 |
designate |
mirantis.azurecr.io/openstack/designate:antelope-jammy-20240917152117 |
Apache License 2.0 |
ironic |
mirantis.azurecr.io/openstack/ironic:antelope-jammy-20240917152117 |
Apache License 2.0 |
barbican |
mirantis.azurecr.io/openstack/barbican:antelope-jammy-20240917152117 |
Apache License 2.0 |
libvirt |
mirantis.azurecr.io/general/libvirt:8.0.x-jammy-reef-20240822074257 |
LGPL-2.1 License |
pause |
mirantis.azurecr.io/general/external/pause:3.1 |
Apache License 2.0 |
openvswitch |
mirantis.azurecr.io/general/openvswitch:2.17-jammy-20240827065304 |
Apache License 2.0 |
openvswitch-dpdk |
mirantis.azurecr.io/general/openvswitch-dpdk:2.17-jammy-20240827065304 |
Apache License 2.0 |
openstack-tools |
mirantis.azurecr.io/openstack/openstack-tools:yoga-jammy-20240819060021 |
Apache License 2.0 |
rabbitmq |
mirantis.azurecr.io/openstack/extra/rabbitmq:3.12.12-jammy-20240829072728 |
Mozilla Public License 2.0 |
rabbitmq-management |
mirantis.azurecr.io/openstack/extra/rabbitmq-management:3.12.12-jammy-20240829072728 |
Mozilla Public License 2.0 |
kubernetes-entrypoint |
mirantis.azurecr.io/openstack/extra/kubernetes-entrypoint:v1.0.1-34a4f54-20240910081335 |
Apache License 2.0 |
memcached |
mirantis.azurecr.io/general/memcached:v1.6.23-alpine-20240905100031 |
BSD 3-Clause “New” or “Revised” License |
etcd |
mirantis.azurecr.io/openstack/extra/etcd:v3.5.16-alpine-20240911082430 |
Apache License 2.0 |
powerdns |
mirantis.azurecr.io/openstack/extra/powerdns:4.8-alpine-20240905182339 |
GPL-2.0 License |
nginx-ingress-controller |
mirantis.azurecr.io/openstack/extra/nginx-ingress-controller:1.11.2-alpine-20240913100326 |
Apache License 2.0 |
tls-proxy |
mirantis.azurecr.io/openstack/tls-proxy:jammy-fipster-1.0.0 |
Mirantis Proprietary License |
defaultbackend |
mirantis.azurecr.io/openstack/extra/defaultbackend:v1.19.2-77af1ef-20240910090142 |
Apache License 2.0 |
mariadb |
mirantis.azurecr.io/general/mariadb:10.6.17-focal-20240909113408 |
GPLv2, LGPLv2.1 (client libraries) |
rabbitmq-exporter |
mirantis.azurecr.io/stacklight/rabbitmq-exporter:1.0.0 |
MIT License |
memcached-exporter |
mirantis.azurecr.io/stacklight/memcached-exporter:v0.14.4 |
Apache License 2.0 |
prometheus-mysql-exporter |
mirantis.azurecr.io/stacklight/mysqld-exporter:v0.11.0 |
Apache License 2.0 |
aodh |
mirantis.azurecr.io/openstack/aodh:antelope-jammy-20240917152117 |
Apache License 2.0 |
ceilometer |
mirantis.azurecr.io/openstack/ceilometer:antelope-jammy-20240917152117 |
Apache License 2.0 |
gnocchi |
mirantis.azurecr.io/openstack/gnocchi:antelope-jammy-20240917152117 |
Apache License 2.0 |
redis |
mirantis.azurecr.io/openstack/extra/redis:7.2.x-alpine-20240905134302 |
BSD 3-Clause “New” or “Revised” License |
redis-operator |
mirantis.azurecr.io/openstack/extra/redis-operator:v1.2.4-20240909123821 |
Apache License 2.0 |
frr |
mirantis.azurecr.io/general/external/docker.io/frrouting/frr:v9.1.2-20240918073840 |
GPL-2.0 and LGPL-2.1 |
strongswan |
mirantis.azurecr.io/openstack/extra/strongswan:alpine-5.9.12-20240905114128 |
GPL-2.0 |
rsyslog |
mirantis.azurecr.io/openstack/extra/rsyslog:v8.2001.0-20240829110216 |
GNU General Public License v3 |
descheduler |
mirantis.azurecr.io/openstack/extra/descheduler-20240910121701:v0.30.1-amd64-20240910114244 |
Apache License 2.0 |
nginx |
mirantis.azurecr.io/openstack/extra/nginx:1.25.3-20240905140249 |
Apache License 2.0 |
requirements |
mirantis.azurecr.io/openstack/requirements:antelope-jammy-20240917152117 |
Apache License 2.0 |
drb-controller |
mirantis.azurecr.io/openstack/extra/drb-controller:0.1.0-20240701093549 |
Mirantis Proprietary License |
stepler |
mirantis.azurecr.io/openstack/stepler:antelope-jammy-20240916150923 |
Apache License 2.0 |
placement |
mirantis.azurecr.io/openstack/placement:antelope-jammy-20240917152117 |
Apache License 2.0 |
masakari |
mirantis.azurecr.io/openstack/masakari:antelope-jammy-20240917152117 |
Apache License 2.0 |
masakari-monitors |
mirantis.azurecr.io/openstack/masakari-monitors:antelope-jammy-20240917152117 |
Apache License 2.0 |
ironic-inspector |
mirantis.azurecr.io/openstack/ironic-inspector:antelope-jammy-20240917152117 |
Apache License 2.0 |
manila |
mirantis.azurecr.io/openstack/manila:antelope-jammy-20240917152117 |
Apache License 2.0 |
MOSK 24.2 OpenStack Helm charts
MOSK 24.3 Tungsten Fabric 21.4 artifacts
Component |
Path |
License information for main executable programs |
|---|---|---|
Helm charts |
||
tungstenfabric-operator |
https://binary.mirantis.com/tungsten/helm/tungstenfabric-operator-0.16.6.tgz |
Mirantis Proprietary License |
Docker images |
||
tungstenfabric-operator |
mirantis.azurecr.io/tungsten-operator/tungstenfabric-operator:0.16.6 |
Mirantis Proprietary License |
tungsten-pytest |
mirantis.azurecr.io/tungsten/tungsten-pytest:0.1-20240920135701 |
MIT License |
casskop |
mirantis.azurecr.io/tungsten-operator/casskop:2.2.6 |
Apache License 2.0 |
cassandra-bootstrap |
mirantis.azurecr.io/tungsten/cassandra-bootstrap:0.1.18 |
Apache License 2.0 |
cassandra |
mirantis.azurecr.io/tungsten/cassandra:3.11.17 |
Apache License 2.0 |
cassandra-config-builder |
mirantis.azurecr.io/tungsten/cass-config-builder:v2-20240812125407 |
Apache License 2.0 |
rabbitmq-operator |
mirantis.azurecr.io/tungsten-operator/rabbitmq-operator:0.4.5 |
Mirantis Proprietary License |
rabbitmq |
mirantis.azurecr.io/tungsten/rabbitmq:3.11.16 |
Mozilla Public License 2.0 |
rabbitmq-exporter |
mirantis.azurecr.io/stacklight/rabbitmq-exporter:1.0.0 |
MIT License |
zookeeper-operator |
mirantis.azurecr.io/tungsten-operator/zookeeper-operator:0.2.22-mcp |
Apache License 2.0 |
zookeeper |
mirantis.azurecr.io/tungsten/zookeeper:3.8.4-20240813 |
Apache License 2.0 |
redis-operator |
mirantis.azurecr.io/tungsten-operator/redis-operator:0.4.5 |
Apache License 2.0 |
redis |
mirantis.azurecr.io/tungsten/redis:7.4.0-alpine3.20 |
BSD 3-Clause “New” or “Revised” License |
redis-exporter |
mirantis.azurecr.io/stacklight/redis_exporter:v1.62.0 |
BSD 3-Clause “New” or “Revised” License |
tf-cli |
mirantis.azurecr.io/tungsten/tf-cli:0.1-20240820113128 |
MIT License |
kubernetes-entrypoint |
mirantis.azurecr.io/openstack/extra/kubernetes-entrypoint:v1.0.1-34a4f54-20240910081335 |
Apache License 2.0 |
pause |
mirantis.azurecr.io/general/external/pause:3.1 |
Apache License 2.0 |
tf-nodeinfo |
mirantis.azurecr.io/tungsten/tf-nodeinfo:0.1-20240919130057 |
MIT License |
contrail-controller-config-api |
mirantis.azurecr.io/tungsten/contrail-controller-config-api:21.4.20240906000000 |
Apache License 2.0 |
contrail-controller-config-devicemgr |
mirantis.azurecr.io/tungsten/contrail-controller-config-devicemgr:21.4.20240906000000 |
Apache License 2.0 |
contrail-controller-config-dnsmasq |
mirantis.azurecr.io/tungsten/contrail-controller-config-dnsmasq:21.4.20240906000000 |
Apache License 2.0 |
contrail-controller-config-schema |
mirantis.azurecr.io/tungsten/contrail-controller-config-schema:21.4.20240906000000 |
Apache License 2.0 |
contrail-controller-config-svcmonitor |
mirantis.azurecr.io/tungsten/contrail-controller-config-svcmonitor:21.4.20240906000000 |
Apache License 2.0 |
contrail-controller-control-control |
mirantis.azurecr.io/tungsten/contrail-controller-control-control:21.4.20240906000000 |
Apache License 2.0 |
contrail-controller-control-dns |
mirantis.azurecr.io/tungsten/contrail-controller-control-dns:21.4.20240906000000 |
Apache License 2.0 |
contrail-controller-control-named |
mirantis.azurecr.io/tungsten/contrail-controller-control-named:21.4.20240906000000 |
Apache License 2.0 |
contrail-controller-webui-job |
mirantis.azurecr.io/tungsten/contrail-controller-webui-job:21.4.20240906000000 |
Apache License 2.0 |
contrail-controller-webui-web |
mirantis.azurecr.io/tungsten/contrail-controller-webui-web:21.4.20240906000000 |
Apache License 2.0 |
contrail-node-init |
mirantis.azurecr.io/tungsten/contrail-node-init:21.4.20240906000000 |
Apache License 2.0 |
contrail-provisioner |
mirantis.azurecr.io/tungsten/contrail-provisioner:21.4.20240906000000 |
Apache License 2.0 |
contrail-tools |
mirantis.azurecr.io/tungsten/contrail-tools:21.4.20240906000000 |
Apache License 2.0 |
contrail-vrouter-agent |
mirantis.azurecr.io/tungsten/contrail-vrouter-agent:21.4.20240906000000 |
Apache License 2.0 |
contrail-vrouter-agent-dpdk |
mirantis.azurecr.io/tungsten/contrail-vrouter-agent-dpdk:21.4.20240906000000 |
Apache License 2.0 |
contrail-vrouter-kernel-build-init |
mirantis.azurecr.io/tungsten/contrail-vrouter-kernel-build-init:21.4.20240906000000 |
Apache License 2.0 |
MOSK 24.3 StackLight artifacts
Component |
Path |
License information for main executable programs |
|---|---|---|
Docker images |
||
prometheus-libvirt-exporter |
mirantis.azurecr.io/stacklight/prometheus-libvirt-exporter:v0.2-20240828023010 |
Mirantis Proprietary License |
tungstenfabric-prometheus-exporter |
mirantis.azurecr.io/stacklight/tungstenfabric-prometheus-exporter:0.1-20240119124301 |
Mirantis Proprietary License |
Helm charts |
||
fluentd |
https://binary.mirantis.com/stacklight/helm/fluentd-2.0.3-mcp-52.tgz |
Mirantis Proprietary License |
prometheus-libvirt-exporter |
https://binary.mirantis.com/stacklight/helm/prometheus-libvirt-exporter-0.2.0-mcp-7.tgz |
Mirantis Proprietary License |
prometheus-tungstenfabric-exporter |
https://binary.mirantis.com/stacklight/helm/prometheus-tungstenfabric-exporter-0.2.0-mcp-7.tgz |
Mirantis Proprietary License |
The following issues have been addressed in the MOSK 24.3 release:
[43966] [Antelope] Improved parallel image downloading when Glance is configured with Cinder backend.
[44813] [Antelope] Resolved the issue that caused disruption on trunk ports.
[40900] [Tungsten Fabric] Resolved the issue that caused Cassandra database to enter an infinite table creation or changing state.
[46220] [Tungsten Fabric] Resolved the issue that caused subsequent cluster maintenance requests to get stuck on clusters running Tungsten Fabric with API v2, after updating from MOSK 24.2 to 24.2.1.
This section describes the specific actions you as a Cloud Operator need to complete to accurately plan and successfully perform your Mirantis OpenStack for Kubernetes (MOSK) cluster update to the version 24.3. Consider this information as a supplement to the generic update procedure published in Operations Guide: Update a MOSK cluster.
According to the new cluster update schema introduced in the product in the MOSK 24.2 series, you can update to the 24.3 version from the following cluster versions:
24.2 (released on July 02, 2024)
24.2.2 (released on September 16, 2024)
For the detailed cluster update schema, refer to MOSK cluster update schema.
The MOSK cluster will obtain the newly implemented capabilities automatically with no significant impact on the update procedure.
See also
The following table provides details on the update impact on a MOSK cluster.
Updated component |
Impact on cloud users |
Impact on cloud workloads |
|---|---|---|
OpenStack and Tungsten Fabric |
|
Open vSwitch networking - interruption of the North-South connectivity, depending on the type of virtual routers used by a workload:
Tungsten Fabric networking - no impact |
Ceph |
~1% of read operations on object storage API may fail |
IO performance degradation for Ceph-backed virtual storage devices. Pay special attention to the known issue 50566 that may affect the maintenance window. |
Host OS components |
No impact |
Instance network connectivity interruption up to 5 minutes |
Host OS kernel |
No impact |
Restart of instances due to the hypervisor reboot 0 |
- 0
Host operating system needs to be rebooted for the kernel update to be applied. Configure live-migration of workloads to avoid the impact on the instances running on a host.
To properly plan the update maintenance window, use the following documentation:
Before updating the cluster, be sure to review the potential issues that may arise during the process and the recommended solutions to address them, as outlined in Update known issues.
Pay special attention to [47602] Failed designate-zone-setup job blocks cluster update. Before performing the cluster
update, verify the DNS service (OpenStack Designate) for any created Top-Level
Domains (TLDs). If TLDs are present but the test TLD is missing, create
test according to the known issue description.
Before updating to MOSK 24.3, if the BGP_ASN parameter
is defined for tf-config in the TFOperator custom resource, ensure
that the ENABLE_4BYTE_AS parameter is also set to prevent issues when
starting the Tungsten Fabric operator with the TFOperator v2 custom
resource:
controllers:
tf-config:
provisioner:
containers:
- env:
- name: BGP_ASN
value: "64515"
- name: ENABLE_4BYTE_AS
value: "false"
name: provisioner
MOSK 24.3 release series is the last one to support Ubuntu 20.04 as the host operating system. Ubuntu 20.04 reaches end-of-life in April 2025. Therefore, Mirantis encourages all MOSK users to upgrade their clusters to Ubuntu 22.04 as soon as possible after getting to MOSK 24.3.
A host operating system upgrade requires reboot of the servers and can be performed in small batches. For the detailed procedure of the Ubuntu upgrade, refer to Upgrade an operating system distribution.
Warning
Update of management or MOSK clusters running Ubuntu 20.04 will not be possible in the following major product version.
Caution
Usage of third-party software, which is not part of Mirantis-supported configurations, for example, the use of custom DPDK modules, may block upgrade of an operating system distribution. Users are fully responsible for ensuring the compatibility of such custom components with the latest supported Ubuntu version.
Since MOSK 24.3, the v2 TFOperator custom resource
becomes the default and the only way to manage the configuration of
Tungsten Fabric cluster. During update to MOSK 24.3,
the old v1alpha1 TFOperator custom resource will get automatically
converted to version v2.
Note
The v1alpha1 TFOperator custom resource remains in the cluster
but is no longer reconciled and will be automatically removed with
the next major cluster update.
In MOSK 25.1 and Container Cloud 2.29.0, Grafana will be updated to version 11 where the following deprecated Angular-based plugins will be automatically migrated to the React-based ones:
Graph (old) -> Time Series
Singlestat -> Stat
Stat (old) -> Stat
Table (old) -> Table
Worldmap -> Geomap
This migration may corrupt custom Grafana dashboards that have Angular-based panels. Therefore, if you have such dashboards, back them up and manually upgrade Angular-based panels during the course of MOSK 24.3 and Container Cloud 2.28.x (Cluster releases 17.3.x and 16.3.x) to prevent custom appearance issues after plugin migration in Container Cloud 2.29.0 and MOSK 25.1.
Note
All Grafana dashboards provided by StackLight are also migrated to React automatically. For the list of default dashboards, see View Grafana dashboards.
Warning
For management clusters that are updated automatically, it is important to prepare the backup before Container Cloud 2.29.0 is released. Otherwise, custom dashboards using Angular-based plugins may be corrupted.
For managed clusters, you can perform the backup after the Container Cloud 2.29.0 release date but before updating them to MOSK 25.1.
In total, since MOSK 24.2 major release, in 24.3, 1071 Common Vulnerabilities and Exposures (CVE) have been fixed: 79 of critical and 992 of high severity.
The table below includes the total number of addressed unique and common CVEs by MOSK-specific component since MOSK 24.2.2 patch. The common CVEs are issues addressed across several images.
Product component |
CVE type |
Critical |
High |
Total |
|---|---|---|---|---|
OpenStack |
Unique |
8 |
62 |
70 |
Common |
30 |
360 |
390 |
|
Tungsten Fabric |
Unique |
8 |
167 |
175 |
Common |
13 |
313 |
326 |
Mirantis Security Portal
For the detailed list of fixed and present CVEs across the Mirantis Container Cloud and MOSK products, refer to Mirantis Security Portal.
Mirantis Container Cloud CVEs
For the number of fixed CVEs in the Mirantis Container Cloud-related components including kaas core, bare metal, Ceph, and StackLight, refer to Release notes 2.28.0: Security notes.
24.3.1 patch
The MOSK 24.3.1 patch includes the following updates:
Update of Mirantis Kubernetes Engine (MKE) to 3.7.17.
Update of Mirantis Container Runtime (MCR) to 23.0.15 (with containerd 1.6.36).
Important
As a result of the MCR version update, downtimes during cluster updates are expected to be similar to those experienced during a major version update. To accurately plan the cluster update, refer to Update notes.
Optional transition of container runtime from Docker to containerd. Refer to Optional migration of container runtime from Docker to containerd for details.
Update of minor kernel version to
5.15.0-126-generic.Security fixes for CVEs in images.
Resolved product issues.
Learn more about the release content and update specifics:
This section lists the components artifacts of the MOSK 24.3.1 release that includes binaries, Docker images, and Helm charts.
MOSK 24.3.1 OpenStack Helm charts
Component |
Path |
License information for main executable programs |
|---|---|---|
openstack-operator |
https://binary.mirantis.com/openstack/helm/openstack-controller/openstack-operator-0.17.10.tgz |
Mirantis Proprietary License |
MOSK 24.3.1 OpenStack Antelope binaries and Docker images
Component |
Path |
License information for main executable programs |
|---|---|---|
Binaries |
||
octavia-amphora |
https://binary.mirantis.com/openstack/bin/octavia/amphora-x64-haproxy-antelope-20241212120546.qcow2 |
Mirantis Proprietary License |
mirantis |
https://binary.mirantis.com/openstack/bin/horizon/mirantis-antelope-18a1377-20230817112356.tar.gz |
Mirantis Proprietary License |
kernel |
GPL-2.0 |
|
initramfs |
https://binary.mirantis.com/openstack/bin/ironic/tinyipa/tinyipa-stable-antelope-20240213233421.gz |
GPL-2.0 |
service-image |
https://binary.mirantis.com/openstack/bin/manila/manila-service-image-20241024092252.qcow2 |
Mirantis Proprietary License |
Docker images |
||
keystone |
mirantis.azurecr.io/openstack/keystone:antelope-jammy-20241212111317 |
Apache License 2.0 |
heat |
mirantis.azurecr.io/openstack/heat:antelope-jammy-20241212111317 |
Apache License 2.0 |
glance |
mirantis.azurecr.io/openstack/glance:antelope-jammy-20241212111317 |
Apache License 2.0 |
cinder |
mirantis.azurecr.io/openstack/cinder:antelope-jammy-20241212111317 |
Apache License 2.0 |
osprober |
mirantis.azurecr.io/openstack/osprober:0.0.1-d0f3d7b |
Apache License 2.0 |
neutron |
mirantis.azurecr.io/openstack/neutron:antelope-jammy-20241212111317 |
Apache License 2.0 |
nova |
mirantis.azurecr.io/openstack/nova:antelope-jammy-20241212111317 |
Apache License 2.0 |
horizon |
mirantis.azurecr.io/openstack/horizon:antelope-jammy-20241212111317 |
Apache License 2.0 |
tempest |
mirantis.azurecr.io/openstack/tempest:antelope-jammy-20241212111317 |
Apache License 2.0 |
octavia |
mirantis.azurecr.io/openstack/octavia:antelope-jammy-20241212111317 |
Apache License 2.0 |
designate |
mirantis.azurecr.io/openstack/designate:antelope-jammy-20241212111317 |
Apache License 2.0 |
ironic |
mirantis.azurecr.io/openstack/ironic:antelope-jammy-20241212111317 |
Apache License 2.0 |
barbican |
mirantis.azurecr.io/openstack/barbican:antelope-jammy-20241212111317 |
Apache License 2.0 |
libvirt |
mirantis.azurecr.io/general/libvirt:8.0.x-jammy-reef-20241115095845 |
LGPL-2.1 License |
pause |
mirantis.azurecr.io/general/external/pause:3.1 |
Apache License 2.0 |
openvswitch |
mirantis.azurecr.io/general/openvswitch:2.17-jammy-20240827065304 |
Apache License 2.0 |
openvswitch-dpdk |
mirantis.azurecr.io/general/openvswitch-dpdk:2.17-jammy-20240827065304 |
Apache License 2.0 |
openstack-tools |
mirantis.azurecr.io/openstack/openstack-tools:yoga-jammy-20241120070553 |
Apache License 2.0 |
rabbitmq |
mirantis.azurecr.io/openstack/extra/rabbitmq:3.12.12-jammy-20240829072728 |
Mozilla Public License 2.0 |
rabbitmq-management |
mirantis.azurecr.io/openstack/extra/rabbitmq-management:3.12.12-jammy-20240829072728 |
Mozilla Public License 2.0 |
kubernetes-entrypoint |
mirantis.azurecr.io/openstack/extra/kubernetes-entrypoint:v1.0.1-34a4f54-20240910081335 |
Apache License 2.0 |
memcached |
mirantis.azurecr.io/general/memcached:v1.6.32-alpine-20241024070356 |
BSD 3-Clause “New” or “Revised” License |
etcd |
mirantis.azurecr.io/openstack/extra/etcd:v3.5.16-alpine-20241024070202 |
Apache License 2.0 |
powerdns |
mirantis.azurecr.io/openstack/extra/powerdns:4.8-alpine-20241120110423 |
GPL-2.0 License |
nginx-ingress-controller |
mirantis.azurecr.io/openstack/extra/nginx-ingress-controller:1.11.3-alpine-20241024075118 |
Apache License 2.0 |
tls-proxy |
mirantis.azurecr.io/openstack/tls-proxy:jammy-fipster-1.0.0.dev2 |
Mirantis Proprietary License |
defaultbackend |
mirantis.azurecr.io/openstack/extra/defaultbackend:v1.19.2-77af1ef-20240910090142 |
Apache License 2.0 |
mariadb |
mirantis.azurecr.io/general/mariadb:10.6.20-jammy-20241104184039 |
GPLv2, LGPLv2.1 (client libraries) |
rabbitmq-exporter |
mirantis.azurecr.io/stacklight/rabbitmq-exporter:1.0.0 |
MIT License |
memcached-exporter |
mirantis.azurecr.io/stacklight/memcached-exporter:v0.14.4 |
Apache License 2.0 |
prometheus-mysql-exporter |
mirantis.azurecr.io/stacklight/mysqld-exporter:v0.11.0 |
Apache License 2.0 |
aodh |
mirantis.azurecr.io/openstack/aodh:antelope-jammy-20241212111317 |
Apache License 2.0 |
ceilometer |
mirantis.azurecr.io/openstack/ceilometer:antelope-jammy-20241212111317 |
Apache License 2.0 |
gnocchi |
mirantis.azurecr.io/openstack/gnocchi:antelope-jammy-20241212111317 |
Apache License 2.0 |
redis |
mirantis.azurecr.io/openstack/extra/redis:7.2.x-alpine-20241024111938 |
BSD 3-Clause “New” or “Revised” License |
redis-operator |
mirantis.azurecr.io/openstack/extra/redis-operator:v1.2.4-20241024111938 |
Apache License 2.0 |
frr |
mirantis.azurecr.io/general/external/docker.io/frrouting/frr:v9.1.2-20241111080549 |
GPL-2.0 and LGPL-2.1 |
strongswan |
mirantis.azurecr.io/openstack/extra/strongswan:alpine-5.9.12-20241024065424 |
GPL-2.0 |
rsyslog |
mirantis.azurecr.io/openstack/extra/rsyslog:v8.2001.0-20240829110216 |
GNU General Public License v3 |
descheduler |
mirantis.azurecr.io/openstack/extra/descheduler-20240910121701:v0.30.1-amd64-20240910114244 |
Apache License 2.0 |
nginx |
mirantis.azurecr.io/openstack/extra/nginx:1.27.2-20241024065919 |
Apache License 2.0 |
requirements |
mirantis.azurecr.io/openstack/requirements:antelope-jammy-20241212111317 |
Apache License 2.0 |
drb-controller |
mirantis.azurecr.io/openstack/extra/drb-controller:0.1.0-20240701093549 |
Mirantis Proprietary License |
stepler |
mirantis.azurecr.io/openstack/stepler:antelope-jammy-20241120224419 |
Apache License 2.0 |
placement |
mirantis.azurecr.io/openstack/placement:antelope-jammy-20241212111317 |
Apache License 2.0 |
masakari |
mirantis.azurecr.io/openstack/masakari:antelope-jammy-20241212111317 |
Apache License 2.0 |
masakari-monitors |
mirantis.azurecr.io/openstack/masakari-monitors:antelope-jammy-20241212111317 |
Apache License 2.0 |
ironic-inspector |
mirantis.azurecr.io/openstack/ironic-inspector:antelope-jammy-20241212111317 |
Apache License 2.0 |
manila |
mirantis.azurecr.io/openstack/manila:antelope-jammy-20241212111317 |
Apache License 2.0 |
MOSK 24.3.1 OpenStack Caracal binaries and Docker images
Component |
Path |
License information for main executable programs |
|---|---|---|
Binaries |
||
octavia-amphora |
https://binary.mirantis.com/openstack/bin/octavia/amphora-x64-haproxy-caracal-20241212115724.qcow2 |
Mirantis Proprietary License |
mirantis |
https://binary.mirantis.com/openstack/bin/horizon/mirantis-caracal-1f6ade2-20240408162450.tar.gz |
Mirantis Proprietary License |
kernel |
GPL-2.0 |
|
initramfs |
https://binary.mirantis.com/openstack/bin/ironic/tinyipa/tinyipa-stable-caracal-20240523065213.gz |
GPL-2.0 |
service-image |
https://binary.mirantis.com/openstack/bin/manila/manila-service-image-20241024092252.qcow2 |
Mirantis Proprietary License |
Docker images |
||
keystone |
mirantis.azurecr.io/openstack/keystone:caracal-jammy-20241212111317 |
Apache License 2.0 |
heat |
mirantis.azurecr.io/openstack/heat:caracal-jammy-20241212111317 |
Apache License 2.0 |
glance |
mirantis.azurecr.io/openstack/glance:caracal-jammy-20241212111317 |
Apache License 2.0 |
cinder |
mirantis.azurecr.io/openstack/cinder:caracal-jammy-20241212111317 |
Apache License 2.0 |
osprober |
mirantis.azurecr.io/openstack/osprober:0.0.1-d0f3d7b |
Apache License 2.0 |
neutron |
mirantis.azurecr.io/openstack/neutron:caracal-jammy-20241212111317 |
Apache License 2.0 |
nova |
mirantis.azurecr.io/openstack/nova:caracal-jammy-20241212111317 |
Apache License 2.0 |
horizon |
mirantis.azurecr.io/openstack/horizon:caracal-jammy-20241212111317 |
Apache License 2.0 |
tempest |
mirantis.azurecr.io/openstack/tempest:antelope-jammy-20241212111317 |
Apache License 2.0 |
octavia |
mirantis.azurecr.io/openstack/octavia:caracal-jammy-20241212111317 |
Apache License 2.0 |
designate |
mirantis.azurecr.io/openstack/designate:caracal-jammy-20241212111317 |
Apache License 2.0 |
ironic |
mirantis.azurecr.io/openstack/ironic:caracal-jammy-20241212111317 |
Apache License 2.0 |
barbican |
mirantis.azurecr.io/openstack/barbican:caracal-jammy-20241212111317 |
Apache License 2.0 |
libvirt |
mirantis.azurecr.io/general/libvirt:8.0.x-jammy-reef-20241115095845 |
LGPL-2.1 License |
pause |
mirantis.azurecr.io/general/external/pause:3.1 |
Apache License 2.0 |
openvswitch |
mirantis.azurecr.io/general/openvswitch:2.17-jammy-20240827065304 |
Apache License 2.0 |
openvswitch-dpdk |
mirantis.azurecr.io/general/openvswitch-dpdk:2.17-jammy-20240827065304 |
Apache License 2.0 |
openstack-tools |
mirantis.azurecr.io/openstack/openstack-tools:yoga-jammy-20241120070553 |
Apache License 2.0 |
rabbitmq |
mirantis.azurecr.io/openstack/extra/rabbitmq:3.12.12-jammy-20240829072728 |
Mozilla Public License 2.0 |
rabbitmq-management |
mirantis.azurecr.io/openstack/extra/rabbitmq-management:3.12.12-jammy-20240829072728 |
Mozilla Public License 2.0 |
kubernetes-entrypoint |
mirantis.azurecr.io/openstack/extra/kubernetes-entrypoint:v1.0.1-34a4f54-20240910081335 |
Apache License 2.0 |
memcached |
mirantis.azurecr.io/general/memcached:v1.6.32-alpine-20241024070356 |
BSD 3-Clause “New” or “Revised” License |
etcd |
mirantis.azurecr.io/openstack/extra/etcd:v3.5.16-alpine-20241024070202 |
Apache License 2.0 |
powerdns |
mirantis.azurecr.io/openstack/extra/powerdns:4.8-alpine-20241120110423 |
GPL-2.0 License |
nginx-ingress-controller |
mirantis.azurecr.io/openstack/extra/nginx-ingress-controller:1.11.3-alpine-20241024075118 |
Apache License 2.0 |
tls-proxy |
mirantis.azurecr.io/openstack/tls-proxy:jammy-fipster-1.0.0.dev2 |
Mirantis Proprietary License |
defaultbackend |
mirantis.azurecr.io/openstack/extra/defaultbackend:v1.19.2-77af1ef-20240910090142 |
Apache License 2.0 |
mariadb |
mirantis.azurecr.io/general/mariadb:10.6.20-jammy-20241104184039 |
GPLv2, LGPLv2.1 (client libraries) |
rabbitmq-exporter |
mirantis.azurecr.io/stacklight/rabbitmq-exporter:1.0.0 |
MIT License |
memcached-exporter |
mirantis.azurecr.io/stacklight/memcached-exporter:v0.14.4 |
Apache License 2.0 |
prometheus-mysql-exporter |
mirantis.azurecr.io/stacklight/mysqld-exporter:v0.11.0 |
Apache License 2.0 |
aodh |
mirantis.azurecr.io/openstack/aodh:caracal-jammy-20241212111317 |
Apache License 2.0 |
ceilometer |
mirantis.azurecr.io/openstack/ceilometer:caracal-jammy-20241212111317 |
Apache License 2.0 |
gnocchi |
mirantis.azurecr.io/openstack/gnocchi:caracal-jammy-20241212111317 |
Apache License 2.0 |
redis |
mirantis.azurecr.io/openstack/extra/redis:7.2.x-alpine-20241024111938 |
BSD 3-Clause “New” or “Revised” License |
redis-operator |
mirantis.azurecr.io/openstack/extra/redis-operator:v1.2.4-20241024111938 |
Apache License 2.0 |
frr |
mirantis.azurecr.io/general/external/docker.io/frrouting/frr:v9.1.2-20241111080549 |
GPL-2.0 and LGPL-2.1 |
strongswan |
mirantis.azurecr.io/openstack/extra/strongswan:alpine-5.9.12-20241024065424 |
GPL-2.0 |
rsyslog |
mirantis.azurecr.io/openstack/extra/rsyslog:v8.2001.0-20240829110216 |
GNU General Public License v3 |
descheduler |
mirantis.azurecr.io/openstack/extra/descheduler-20240910121701:v0.30.1-amd64-20240910114244 |
Apache License 2.0 |
nginx |
mirantis.azurecr.io/openstack/extra/nginx:1.27.2-20241024065919 |
Apache License 2.0 |
requirements |
mirantis.azurecr.io/openstack/requirements:caracal-jammy-20241212111317 |
Apache License 2.0 |
drb-controller |
mirantis.azurecr.io/openstack/extra/drb-controller:0.1.0-20240701093549 |
Mirantis Proprietary License |
stepler |
mirantis.azurecr.io/openstack/stepler:caracal-jammy-20241205185155 |
Apache License 2.0 |
placement |
mirantis.azurecr.io/openstack/placement:caracal-jammy-20241212111317 |
Apache License 2.0 |
masakari |
mirantis.azurecr.io/openstack/masakari:caracal-jammy-20241212111317 |
Apache License 2.0 |
masakari-monitors |
mirantis.azurecr.io/openstack/masakari-monitors:caracal-jammy-20241212111317 |
Apache License 2.0 |
ironic-inspector |
mirantis.azurecr.io/openstack/ironic-inspector:caracal-jammy-20241212111317 |
Apache License 2.0 |
manila |
mirantis.azurecr.io/openstack/manila:caracal-jammy-20241212111317 |
Apache License 2.0 |
MOSK 24.3.1 Tungsten Fabric 21.4 artifacts
Component |
Path |
License information for main executable programs |
|---|---|---|
Helm charts |
||
tungstenfabric-operator |
https://binary.mirantis.com/tungsten/helm/tungstenfabric-operator-0.16.7.tgz |
Mirantis Proprietary License |
Docker images |
||
tungstenfabric-operator |
mirantis.azurecr.io/tungsten-operator/tungstenfabric-operator:0.16.7 |
Mirantis Proprietary License |
tungsten-pytest |
mirantis.azurecr.io/tungsten/tungsten-pytest:0.1-20241209122102 |
MIT License |
casskop |
mirantis.azurecr.io/tungsten-operator/casskop:2.2.6 |
Apache License 2.0 |
cassandra-bootstrap |
mirantis.azurecr.io/tungsten/cassandra-bootstrap:0.1.21 |
Apache License 2.0 |
cassandra |
mirantis.azurecr.io/tungsten/cassandra:3.11.17 |
Apache License 2.0 |
cassandra-config-builder |
mirantis.azurecr.io/tungsten/cass-config-builder:v2-20240812125407 |
Apache License 2.0 |
rabbitmq-operator |
mirantis.azurecr.io/tungsten-operator/rabbitmq-operator:0.4.5 |
Mirantis Proprietary License |
rabbitmq |
mirantis.azurecr.io/tungsten/rabbitmq:3.11.16 |
Mozilla Public License 2.0 |
rabbitmq-exporter |
mirantis.azurecr.io/stacklight/rabbitmq-exporter:1.0.0 |
MIT License |
zookeeper-operator |
mirantis.azurecr.io/tungsten-operator/zookeeper-operator:0.2.22-mcp |
Apache License 2.0 |
zookeeper |
mirantis.azurecr.io/tungsten/zookeeper:3.8.4-20240813 |
Apache License 2.0 |
redis-operator |
mirantis.azurecr.io/tungsten-operator/redis-operator:0.4.5 |
Apache License 2.0 |
redis |
mirantis.azurecr.io/tungsten/redis:7.4.1-alpine |
BSD 3-Clause “New” or “Revised” License |
redis-exporter |
mirantis.azurecr.io/stacklight/redis_exporter:v1.62.0 |
BSD 3-Clause “New” or “Revised” License |
tf-cli |
mirantis.azurecr.io/tungsten/tf-cli:0.1-20241119115912 |
MIT License |
kubernetes-entrypoint |
mirantis.azurecr.io/openstack/extra/kubernetes-entrypoint:v1.0.1-34a4f54-20240910081335 |
Apache License 2.0 |
pause |
mirantis.azurecr.io/general/external/pause:3.1 |
Apache License 2.0 |
tf-nodeinfo |
mirantis.azurecr.io/tungsten/tf-nodeinfo:0.1-20240919130057 |
MIT License |
contrail-controller-config-api |
mirantis.azurecr.io/tungsten/contrail-controller-config-api:24.3-r21.4.20241206144908 |
Apache License 2.0 |
contrail-controller-config-devicemgr |
mirantis.azurecr.io/tungsten/contrail-controller-config-devicemgr:24.3-r21.4.20241206144908 |
Apache License 2.0 |
contrail-controller-config-dnsmasq |
mirantis.azurecr.io/tungsten/contrail-controller-config-dnsmasq:24.3-r21.4.20241206144908 |
Apache License 2.0 |
contrail-controller-config-schema |
mirantis.azurecr.io/tungsten/contrail-controller-config-schema:24.3-r21.4.20241206144908 |
Apache License 2.0 |
contrail-controller-config-svcmonitor |
mirantis.azurecr.io/tungsten/contrail-controller-config-svcmonitor:24.3-r21.4.20241206144908 |
Apache License 2.0 |
contrail-controller-control-control |
mirantis.azurecr.io/tungsten/contrail-controller-control-control:24.3-r21.4.20241206144908 |
Apache License 2.0 |
contrail-controller-control-dns |
mirantis.azurecr.io/tungsten/contrail-controller-control-dns:24.3-r21.4.20241206144908 |
Apache License 2.0 |
contrail-controller-control-named |
mirantis.azurecr.io/tungsten/contrail-controller-control-named:24.3-r21.4.20241206144908 |
Apache License 2.0 |
contrail-controller-webui-job |
mirantis.azurecr.io/tungsten/contrail-controller-webui-job:24.3-r21.4.20241206144908 |
Apache License 2.0 |
contrail-controller-webui-web |
mirantis.azurecr.io/tungsten/contrail-controller-webui-web:24.3-r21.4.20241206144908 |
Apache License 2.0 |
contrail-node-init |
mirantis.azurecr.io/tungsten/contrail-node-init:21.4.20240906000000 |
Apache License 2.0 |
contrail-provisioner |
mirantis.azurecr.io/tungsten/contrail-provisioner:24.3-r21.4.20241206144908 |
Apache License 2.0 |
contrail-tools |
mirantis.azurecr.io/tungsten/contrail-tools:24.3-r21.4.20241206144908 |
Apache License 2.0 |
contrail-vrouter-agent |
mirantis.azurecr.io/tungsten/contrail-vrouter-agent:21.4.20240906000000 |
Apache License 2.0 |
contrail-vrouter-agent-dpdk |
mirantis.azurecr.io/tungsten/contrail-vrouter-agent-dpdk:21.4.20240906000000 |
Apache License 2.0 |
contrail-vrouter-kernel-build-init |
mirantis.azurecr.io/tungsten/contrail-vrouter-kernel-build-init:21.4.20240906000000 |
Apache License 2.0 |
MOSK 24.3.1 StackLight artifacts
Component |
Path |
License information for main executable programs |
|---|---|---|
Docker images |
||
prometheus-libvirt-exporter |
mirantis.azurecr.io/stacklight/prometheus-libvirt-exporter:v0.2-20241216023012 |
Mirantis Proprietary License |
tungstenfabric-prometheus-exporter |
mirantis.azurecr.io/stacklight/tungstenfabric-prometheus-exporter:0.1-20241021123242 |
Mirantis Proprietary License |
Helm charts |
||
fluentd |
https://binary.mirantis.com/stacklight/helm/fluentd-2.0.3-mcp-52.tgz |
Mirantis Proprietary License |
prometheus-libvirt-exporter |
https://binary.mirantis.com/stacklight/helm/prometheus-libvirt-exporter-0.2.0-mcp-7.tgz |
Mirantis Proprietary License |
prometheus-tungstenfabric-exporter |
https://binary.mirantis.com/stacklight/helm/prometheus-tungstenfabric-exporter-0.2.0-mcp-7.tgz |
Mirantis Proprietary License |
The table below contains the total number of addressed unique and common CVEs by MOSK-specific component compared to the previous release version. The common CVEs are issues addressed across several images.
Product component |
CVE type |
Critical |
High |
Total |
|---|---|---|---|---|
OpenStack |
Unique |
1 |
20 |
21 |
Common |
1 |
63 |
64 |
|
Tungsten Fabric |
Unique |
2 |
14 |
16 |
Common |
2 |
24 |
26 |
Mirantis Security Portal
For the detailed list of fixed and present CVEs across the Mirantis Container Cloud and MOSK products, refer to Mirantis Security Portal.
Mirantis Container Cloud CVEs
For the number of fixed CVEs in the Mirantis Container Cloud-related components including kaas core, bare metal, Ceph, and StackLight, refer to Release notes 2.28.4: Security notes.
The following issues have been addressed in the MOSK 24.3.1 release:
[47602] [Update] Resolved the issue with the
designate-zone-setupjob that blocked cluster update.[47603] [OpenStack] Resolved the issue that caused Masakari failure during the OpenStack upgrade to Caracal.
[48160] [OpenStack] Resolved the issue that caused instances to fail booting when using a VFAT-formatted config drive.
[47174] [Tungsten Fabric] Adjusted generation of affinity rules for Redis for the clusters where analytics services are disabled.
[47717] [Tungsten Fabric] Resolved the issue with the invalid
BgpAsnsetting intungstenfabric-operator.[48153] [Tungsten Fabric] Resolved the issue with OpenStack generating duplicate floating IP addresses for Tungsten Fabric within the same floating IP network, assigning them different IDs.
This section lists MOSK known issues with workarounds for the MOSK release 24.3.1. For the known issues in the related Container Cloud release, refer to Release Notes 2.28.4.
During MariaDB operations on a management cluster, Pods may get stuck in continuous restarts with the following example error:
[ERROR] WSREP: Corrupt buffer header: \
addr: 0x7faec6f8e518, \
seqno: 3185219421952815104, \
size: 909455917, \
ctx: 0x557094f65038, \
flags: 11577. store: 49, \
type: 49
Workaround:
Create a backup of the
/var/lib/mysqldirectory on themariadb-serverPod.Verify that other replicas are up and ready.
Remove the
galera.cachefile for the affectedmariadb-serverPod.Remove the affected
mariadb-serverPod or wait until it is automatically restarted.
After Kubernetes restarts the Pod, the Pod clones the database in 1-2 minutes and restores the quorum.
Due to the MetalLB upstream issue, a load balancer service may not obtain the external IP address.
The issue occurs when two services share the same external IP address and have
the same externalTrafficPolicy value. Initially, the services have the
external IP address assigned and are accessible. After modifying the
externalTrafficPolicy value for both services from Cluster to
Local, the first service that has been changed remains with no external IP
address assigned. Though, the second service, which was changed later, has the
external IP assigned as expected.
To work around the issue, make a dummy change to the service object where
external IP is <pending>:
Identify the service that is stuck:
kubectl get svc -A | grep pending
Example of system response:
stacklight iam-proxy-prometheus LoadBalancer 10.233.28.196 <pending> 443:30430/TCP
Add an arbitrary label to the service that is stuck. For example:
kubectl label svc -n stacklight iam-proxy-prometheus reconcile=1
Example of system response:
service/iam-proxy-prometheus labeledVerify that the external IP was allocated to the service:
kubectl get svc -n stacklight iam-proxy-prometheus
Example of system response:
NAME TYPE CLUSTER-IP EXTERNAL-IP PORT(S) AGE iam-proxy-prometheus LoadBalancer 10.233.28.196 10.0.34.108 443:30430/TCP 12d
Sometimes, after changing the OpenStackDeployment custom resource,
it does not transition to the APPLYING state as expected.
To work around the issue, restart the rockoon` pod in the osh-system
namespace.
Fixed in MOSK 24.3.6 Fixed in MOSK 25.1.1
Due to the issue in the OpenStack Cinder online data migration code, the
migration does not process soft-deleted rows. As a result, in the presence
of non-processed soft-deleted rows, the cinder-db-sync job may fail
during upgrade from Antelope to Caracal with the error in the pod logs
similar to the following:
2024-10-24 18:55:06.678 1 ERROR cinder pymysql.err.DataError: (1265, "Data truncated for column 'use_quota' at row 24")
The issue can occur if your MOSK cluster was initially deployed with OpenStack Wallaby or earlier release, such as Victoria, Ussuri, and so on, and you do not perform the standard periodic OpenStack database cleanup procedure. As a result, unprocessed soft-deleted database rows for volumes and snapshots created before the Xena release may still be present in the database, causing the failure of the database migration.
To verify if your cluster is affected:
Use the following SQL query against the OpenStack database:
SELECT COUNT(*) FROM cinder.volumes WHERE use_quota IS NULL; SELECT COUNT(*) FROM cinder.snapshots WHERE use_quota IS NULL;
If both queries return a zero count, your cluster is not affected.
If either query returns a non-zero count, your cluster is affected.
Verify that all the affected rows are soft-deleted:
SELECT COUNT(*) FROM cinder.volumes WHERE use_quota IS NULL AND deleted=0; SELECT COUNT(*) FROM cinder.snapshots WHERE use_quota IS NULL AND deleted=0;
If either query returns a non-zero count, stop and request Mirantis support.
If both queries return zero count, proceed with the workaround.
Workaround:
Manually change the value of the use_quota field to 1, where its
value is NULL using the following SQL query:
UPDATE cinder.volumes SET use_quota=1 WHERE deleted=1 AND use_quota IS NULL;
UPDATE cinder.snapshots SET use_quota=1 WHERE deleted=1 AND use_quota IS NULL;
This action is generally harmless as it only modifies rows that are already soft-deleted, and would eventually be removed by the database cleanup.
If you have already encountered the issue and your OpenStack upgrade is stuck,
perform the database modification as described above, then re-run the
cinder-db-sync job. Once completed, the upgrade should continue as
expected.
Rebooting all Cassandra cluster TFConfig or TFAnalytics nodes, maintenance, or other circumstances that cause the Cassandra pods to start simultaneously may cause a broken Cassandra TFConfig and/or TFAnalytics cluster. In this case, Cassandra nodes do not join the ring and do not update the IPs of the neighbor nodes. As a result, the TF services cannot operate Cassandra cluster(s).
To verify that a Cassandra cluster is affected:
Run the nodetool status command specifying the config or
analytics cluster and the replica number:
kubectl -n tf exec -it tf-cassandra-<config/analytics>-dc1-rack1-<replica number> -c cassandra -- nodetool status
Example of system response with outdated IP addresses:
Datacenter: DC1
===============
Status=Up/Down
|/ State=Normal/Leaving/Joining/Moving
-- Address Load Tokens Owns (effective) Host ID Rack
DN <outdated ip> ? 256 64.9% a58343d0-1e3f-4d54-bcdf-9b9b949ca873 r1
DN <outdated ip> ? 256 69.8% 67f1d07c-8b13-4482-a2f1-77fa34e90d48 r1
Datacenter: dc1
===============
Status=Up/Down
|/ State=Normal/Leaving/Joining/Moving
-- Address Load Tokens Owns (effective) Host ID Rack
UN <actual ip> 3.84 GiB 256 65.2% 7324ebc4-577a-425f-b3de-96faac95a331 rack1
Workaround:
Manually delete the Cassandra pod from the failed config or analytics
cluster to re-initiate the bootstrap process for one of the Cassandra nodes:
kubectl -n tf delete pod tf-cassandra-<config/analytics>-dc1-rack1-<replica_num>
Occasionally, RabbitMQ instances in tf-rabbitmq pods fail to enable
the tracking_records_in_ets during the initialization process.
To work around the problem, restart the affected pods manually.
After replacing a failed Tungsten Fabric controller node as described in Replace a failed TF controller node, the first restart of the Cassandra pod on this node may cause an issue if the Cassandra node with the outdated IP address has not been removed from the cluster. Subsequent Cassandra pod restarts should not trigger this problem.
To verify if your Cassandra cluster is affected, run the nodetool status command specifying the config or analytics cluster and the replica number:
kubectl -n tf exec -it tf-cassandra-<CONFIG-OR-ANALYTICS>-dc1-rack1-<REPLICA-NUM> -c cassandra -- nodetool status
Example of the system response with outdated IP addresses:
Datacenter: dc1
===============
Status=Up/Down
|/ State=Normal/Leaving/Joining/Moving
-- Address Load Tokens Owns Host ID Rack
UN 192.168.201.144 509.43 KiB 256 ? 7e760a99-fae5-4921-b0c5-d9e6e1eca1c5 rack1
UN 192.168.50.146 534.18 KiB 256 ? 2248ea35-85d4-4887-820b-1fac4733021f rack1
UN 192.168.145.147 484.19 KiB 256 ? d988aaaa-44ae-4fec-a617-0b0a253e736d rack1
DN 192.168.145.144 481.53 KiB 256 ? c23703a1-6854-47a7-a4a2-af649d63af0c rack1
An extra node will appear in the cluster with an outdated IP address
(the IP of the terminated Cassandra pod) in the Down state.
To work around the issue, after replacing the Tungsten Fabric controller node, delete the Cassandra pod on the replaced node and remove the outdated node from the Cassandra cluster using nodetool:
kubectl -n tf exec -it tf-cassandra-<CONFIG-OR-ANALYTICS>-dc1-rack1-<REPLICA-NUM> -c cassandra -- nodetool removenode <HOST-ID>
During major or patch update of a MOSK cluster with StackLight enabled in
non-HA mode, the KubePodsCrashLooping alert may be firing for the Grafana
ReplicaSet.
Grafana relies on PostgreSQL for persistent data. In non-HA StackLight setup,
PostgreSQL becomes temporarily unavailable during updates. If Grafana loses its
database connection or fails to establish one during startup, Grafana fails
with an error. This may cause the Grafana pod to enter the CrashLoopBackOff
state. Such behavior is expected in non-HA StackLight setups. The Grafana pod
will resume normal operation after PostgreSQL is restored.
To prevent the issue, deploy StackLight in HA mode.
During update of a management or MOSK cluster with StackLight enabled in HA
mode, the OpenSearchClusterStatusCritical alert may trigger when the next
OpenSearch node restarts before shards from the previous node finish assigning.
This can push some indices to red temporarily, making them unavailable for
reads and writes, possibly causing some new logs being lost.
The issue does not affect the cluster during the update, no workaround is needed, and you can safely ignore it.
Fixed in MOSK 25.1 Fixed in MOSK 25.1.1
Tag-based filtering of logs using the tag_include parameter does not work
for the logging.externalOutputs feature when output_kind: audit is
selected.
For example, if the user wants to send only logs from the sudo
program and sets tag_include: sudo, none of the logs will be sent to an
external destination.
To work around the issue, allow forwarding of all audit logs in addition to
sudo, which include logs from sshd,
systemd-logind, and su. Instead of tag_include: sudo,
specify tag_include: '{sudo,systemd-audit}'.
When the fix applies in MOSK 25.1, filtering starts working automatically.
The incompatibility between the newly implemented session refresh in the
upstream simple-salesforce with the MOSK implementation of session refresh
in sf-notifier results in the uncontrolled growth of new logins and lack
of session reuse. The issue applies to both MOSK and management clusters.
Workaround:
The workaround to the issue is to change the sf-notifier image tag directly
in the Deployment object. This change is not persistent as this direct change
in the Deployment object will be reverted or overridden by:
Container Cloud version update (for management clusters)
Cluster release version update (for MOSK cluster)
Any
sf-notifier-related operation (for all clusters):Disable and enable
Credentials change
IDs change
Any configuration change for resources, node selector, tolerations, and log level
Once applied, this workaround must be re-applied whenever one of the above operations is performed in the cluster.
Print the currently used image:
kubectl get deployment sf-notifier -n stacklight -o jsonpath="{.spec.template.spec.containers[0].image}"
Possible results:
mirantis.azurecr.io/stacklight/sf-notifier:v0.4-20250113023013or
127.0.0.1:44301/stacklight/sf-notifier:v0.4-20250113023013Compare the
sf-notifierimage tag with the list of affected tags. If the image is affected, it has to be replaced. Otherwise, your cluster is not affected.Affected tags:
v0.4-20241021023015 v0.4-20241028023015 v0.4-20241118023015 v0.4-20241216023012 v0.4-20250113023013 v0.4-20250217023014 v0.4-20250317092322 v0.4-20250414023016
In the resulting string, replace only the tag of the affected image with the desired
v0.4-20240828023015tag. Keep the registry the same as in the original Deployment object.Resulting images from examples:
mirantis.azurecr.io/stacklight/sf-notifier:v0.4-20240828023015
or
127.0.0.1:44301/stacklight/sf-notifier:v0.4-20240828023015
Update the
sf-notifierDeployment with the new image:kubectl set image deployment/sf-notifier sf-notifier=<new image> -n stacklight
For example:
kubectl set image deployment/sf-notifier sf-notifier=mirantis.azurecr.io/stacklight/sf-notifier:v0.4-20240828023015 -n stacklight
or
kubectl set image deployment/sf-notifier sf-notifier=127.0.0.1:44301/stacklight/sf-notifier:v0.4-20240828023015 -n stacklight
Wait until the pod with the updated image is created, and check the logs. Verify that there are no errors in the logs:
kubectl logs pod/<sf-notifier pod> -n stacklight
As this change is not persistent and can be reverted by the cluster update
operation or any operation related to sf-notifier, periodically check all
clusters and if the change has been reverted, re-apply the workaround.
Optionally, you can add a custom alert that will monitor the current tag of
the sf-notifier image and will fire the alert if the tag is present in
the list of affected tags. For the custom alert configuration details,
refer to Alert configuration.
Example of a custom alert to monitor the current tag of the sf-notifier
image:
- name: stacklight
values:
...
prometheusServer:
...
customAlerts:
...
- alert: SFnotifierImageVersion
annotations:
description: "sf-notifier image has a buggy tag, please revert deployment image back to sf-notifier:v0.4-20240828023015. This should be fixed in MCC 2.29.3 / MOSK 24.3.5, remove the alert after this release upgrade."
summary: "This image might be causing too many API logins and exceeding our monthly API budget, please act immediately"
expr: >-
avg(kube_pod_container_info{container="sf-notifier",image_spec=~".*v0.4-(20241021023015|20241028023015|20241118023015|20241216023012|20250113023013|20250217023014|20250317092322|20250414023016)"})
for: 5m
labels:
service: alertmanager
severity: critical
Fixed in 2.30.0 (21.0.0 and 20.0.0)
When telegraf-ds-smart is deployed on all nodes of a large cluster with
iSCSI volumes attached, the telegraf-ds-smart pod constantly restarts with
OOM kill messages on every compute node while smartctl is trying to scan
all attached iSCSI volumes.
To work around the issue, disable telegraf-ds-smart by minimizing its
CPU and memory limits:
resources:
telegrafDsSmart:
limits:
cpu: 2m
memory: 2Mi
requests:
cpu: 1m
memory: 1Mi
For configuration details, see StackLight configuration parameters: Resource limits and Increase memory limits for cluster components.
During cluster update, the rolling reboot fails on the Tungsten Fabric cluster. To work around the issue, restart the RabbitMQ pods in the Tungsten Fabric cluster.
Fixed in MOSK 25.1 Fixed in MOSK 25.1.1
When updating to the MOSK 24.3 series, tf-config pods from the Tungsten
Fabric namespace may enter the CrashLoopBackOff state. For example:
tf-config-cs8zr 2/5 CrashLoopBackOff 676 (19s ago) 15h
tf-config-db-6zxgg 1/1 Running 44 (25m ago) 15h
tf-config-db-7k5sz 1/1 Running 43 (23m ago) 15h
tf-config-db-dlwdv 1/1 Running 43 (25m ago) 15h
tf-config-nw4tr 3/5 CrashLoopBackOff 665 (43s ago) 15h
tf-config-wzf6c 1/5 CrashLoopBackOff 680 (10s ago) 15h
tf-control-c6bnn 3/4 Running 41 (23m ago) 13h
tf-control-gsnnp 3/4 Running 42 (23m ago) 13h
tf-control-sj6fd 3/4 Running 41 (23m ago) 13h
To troubleshoot the issue, check the logs inside the tf-config API
container and the tf-cassandra pods. The following example logs
indicate that Cassandra services failed to peer with each other and
are operating independently:
Logs from the
tf-configAPI container:NoHostAvailable: ('Unable to complete the operation against any hosts', {<Host: 192.168.200.23:9042 dc1>: Unavailable('Error from server: code=1000 [Unavailable exception] message="Cannot achieve consistency level QUORUM" info={\'required_replicas\': 2, \'alive_replicas\': 1, \'consistency\': \'QUORUM\'}',)})Logs from the
tf-cassandrapods:INFO [OptionalTasks:1] 2024-09-09 08:59:36,231 CassandraRoleManager.java:419 - Setup task failed with error, rescheduling WARN [OptionalTasks:1] 2024-09-09 08:59:46,231 CassandraRoleManager.java:379 - CassandraRoleManager skipped default role setup: some nodes were not ready
To work around the issue, restart the Cassandra services in the Tungsten Fabric namespace by deleting the affected pods sequentially to establish the connection between them:
kubectl -n tf delete pod tf-cassandra-config-dc1-rack1-0
kubectl -n tf delete pod tf-cassandra-config-dc1-rack1-1
kubectl -n tf delete pod tf-cassandra-config-dc1-rack1-2
Now, all other services in the Tungsten Fabric namespace should be in
the Active state.
Fixed in MOSK 25.1 Fixed in MOSK 25.1.1
During migration of container runtime from Docker to containerd, some nodes may get stuck with the following error in LCM logs:
Orphaned Docker containers found after migration. Unable to proceed, please
check the node manually: exit status 2
The cluster is affected if orphaned containers with the k8s_ prefix are
present on the affected nodes:
docker ps -a --format '{{ .Names }}' | grep '^k8s_'
Workaround:
Inspect recent Ansible logs at
/var/log/lcm/*and make sure that the only failed task during migration isDelete running pods. If so, proceed to the next step. Otherwise, contact Mirantis support for further information.Stop and remove orphaned containers with the
k8s_prefix.Note
This action has no impact on the cluster because the nodes are already cordoned and drained as part of the maintenance window.
Fixed in MOSK 25.1 Fixed in MOSK 25.1.1
On cluster machines where any HostOSConfiguration object is targeted and
migration to containerd is applied, the machine status may be flapping
(Configure → Ready → Configure → Ready) with the
HostOSConfiguration-related Ansible tasks constantly restarting. This
occurs due to the HostOSConfiguration object state items being constantly
added and then removed from related LCMMachine objects.
To work around the issue, temporarily disable all HostOSConfiguration
objects until the issue is resolved. The expected Container Cloud release with
the issue resolution is targeted to Container Cloud 2.29.0, after the
management cluster update to the Cluster release 16.4.0.
To disable HostOSConfiguration objects:
In the
machineSelector:matchLabelssection of everyHostOSConfigurationobject, remove the corresponding label selectors for cluster machines.Wait for each
HostOSConfigurationobject status to be updated and themachinesStatesfield to be absent:kubectl -n <namespace> get hoc <hoc-name> -o jsonpath='{.status.machinesStates}'
The system response must be empty.
Once the issue is resolved in the target release, re-enable all objects using the same procedure.
After moving a cluster into maintenance mode using the MOSK management console, an attempt to move a worker machine into maintenance mode fails with the Only undefined workers can be in maintainance mode at the same time.
As a workaround, move worker machines into maintenance mode using CLI as described in Enable maintenance mode on a cluster and machine using CLI.
Fixed in 2.30.0 (21.0.0 and 20.0.0)
A compact MOSK cluster fails to be deployed through the Container Cloud web UI
due to inability to add any label to the control plane machines along with
inability to change dedicatedControlPlane: false using the web UI.
To work around the issue, manually add the required labels using CLI. Once done, the cluster deployment resumes.
A newly created project does not display all available tabs and contains different access denied errors during first five minutes after creation.
To work around the issue, refresh the browser in five minutes after the project creation.
Although MOSK 24.3.1 is classified as a patch release, as a cloud operator, you will be performing a major update regardless of the upgrade path: whether you are upgrading from patch 24.2.5 or major version 24.3. This is because of the Mirantis Container Runtime update to 23.0.15.
This section describes the specific actions you need to complete to accurately plan and successfully perform the update. Consider this information as a supplement to the generic update procedure published in Operations Guide: Update a MOSK cluster.
You can update to the 24.3.1 version from the following cluster versions:
24.3 (released on October 16, 2024)
24.2.5 (released on December 09, 2024)
For the detailed cluster update schema, refer to MOSK cluster update schema.
MOSK 24.3.1 enables optional migration of container runtime from Docker to containerd. Usage of containerd introduces a major enhancement for cloud workloads running on top of MOSK, as it helps minimize the network connectivity downtime caused by underlying infrastructure updates.
To minimize the number of required maintenance windows, Mirantis recommends that cloud operators switch to the containerd runtime on the nodes simultaneously with their upgrade to Ubuntu 22.04 if the Ubuntu upgrade has not been completed before.
Note
Migration from Docker to containerd will become mandatory in MOSK 25.1.
Required action
The following table provides details on the update impact on a MOSK cluster.
Updated component |
Impact on cloud users |
Impact on cloud workloads |
|---|---|---|
OpenStack and Tungsten Fabric |
|
Open vSwitch networking - interruption of the North-South connectivity, depending on the type of virtual routers used by a workload:
Tungsten Fabric networking - no impact |
Ceph |
~1% of read operations on object storage API may fail |
IO performance degradation for Ceph-backed virtual storage devices. Pay special attention to the known issue 50566 that may affect the maintenance window. |
Host OS components |
No impact |
Instance network connectivity interruption up to 5 minutes |
Host OS kernel |
No impact |
Restart of instances due to the hypervisor reboot 0 |
- 0
Host operating system needs to be rebooted for the kernel update to be applied. Configure live-migration of workloads to avoid the impact on the instances running on a host.
To properly plan the update maintenance window, use the following documentation:
Before updating the cluster, be sure to review the potential issues that may arise during the process and the recommended solutions to address them, as outlined in Update known issues.
MOSK 24.3 release series is the last release series to support Ubuntu 20.04 as the host operating system. Ubuntu 20.04 reaches end-of-life in April 2025. Therefore, Mirantis encourages all MOSK users to upgrade their clusters to Ubuntu 22.04 as soon as possible after getting to the 24.3 series. A host operating system upgrade requires reboot of the nodes and can be performed in small batches.
Also, MOSK 24.3.1 introduces the new container runtime for the underlying Kubernetes cluster - containerd. The migration from Docker to containerd in 24.3.1 is optional and requires node cordoning and draining. Therefore, if you decide to start using containerd and have not yet upgraded to Ubuntu 22.04, Mirantis highly recommends that these two changes be applied simultaneously to every node to minimize downtime for cloud workloads and users:
Note
In MOSK 24.3.x, the default container runtime remains Docker for greenfield deployments. Support for greenfield deployments based on containerd will be announced in one of the following releases.
Warning
Update of management or MOSK clusters running Ubuntu 20.04 or Docker runtime will not be possible in the following product series.
Caution
Usage of third-party software, which is not part of Mirantis-supported configurations, for example, the use of custom DPDK modules, may block upgrade of an operating system distribution. Users are fully responsible for ensuring the compatibility of such custom components with the latest supported Ubuntu version.
In MOSK 25.1 and Container Cloud 2.29.0, Grafana will be updated to version 11 where the following deprecated Angular-based plugins will be automatically migrated to the React-based ones:
Graph (old) -> Time Series
Singlestat -> Stat
Stat (old) -> Stat
Table (old) -> Table
Worldmap -> Geomap
This migration may corrupt custom Grafana dashboards that have Angular-based panels. Therefore, if you have such dashboards, back them up and manually upgrade Angular-based panels during the course of MOSK 24.3 and Container Cloud 2.28.x (Cluster releases 17.3.x and 16.3.x) to prevent custom appearance issues after plugin migration in Container Cloud 2.29.0 and MOSK 25.1.
Note
All Grafana dashboards provided by StackLight are also migrated to React automatically. For the list of default dashboards, see View Grafana dashboards.
Warning
For management clusters that are updated automatically, it is important to prepare the backup before Container Cloud 2.29.0 is released. Otherwise, custom dashboards using Angular-based plugins may be corrupted.
For managed clusters, you can perform the backup after the Container Cloud 2.29.0 release date but before updating them to MOSK 25.1.
24.3.2 patch
The MOSK 24.3.2 patch includes the following updates:
Update of Mirantis Kubernetes Engine (MKE) to 3.7.18
Mirantis Container Runtime (MCR) to 23.0.15 (with containerd 1.6.36)
Optional transition of container runtime from Docker to containerd
Update of minor kernel version to
5.15.0-130-genericSecurity fixes for CVEs in images
Resolved product issues
Learn more about the release content and update specifics:
This section lists the components artifacts of the MOSK 24.3.2 release that includes binaries, Docker images, and Helm charts.
MOSK 24.3.2 OpenStack Helm charts
Component |
Path |
License information for main executable programs |
|---|---|---|
openstack-operator |
https://binary.mirantis.com/openstack/helm/openstack-controller/openstack-operator-0.17.15.tgz |
Mirantis Proprietary License |
MOSK 24.3.2 OpenStack Antelope binaries and Docker images
Component |
Path |
License information for main executable programs |
|---|---|---|
Binaries |
||
octavia-amphora |
https://binary.mirantis.com/openstack/bin/octavia/amphora-x64-haproxy-antelope-20250124133227.qcow2 |
Mirantis Proprietary License |
mirantis |
https://binary.mirantis.com/openstack/bin/horizon/mirantis-antelope-18a1377-20230817112356.tar.gz |
Mirantis Proprietary License |
kernel |
GPL-2.0 |
|
initramfs |
https://binary.mirantis.com/openstack/bin/ironic/tinyipa/tinyipa-stable-antelope-20240213233421.gz |
GPL-2.0 |
service-image |
https://binary.mirantis.com/openstack/bin/manila/manila-service-image-20241024092252.qcow2 |
Mirantis Proprietary License |
Docker images |
||
keystone |
mirantis.azurecr.io/openstack/keystone:antelope-jammy-20250124130157 |
Apache License 2.0 |
heat |
mirantis.azurecr.io/openstack/heat:antelope-jammy-20250124130157 |
Apache License 2.0 |
glance |
mirantis.azurecr.io/openstack/glance:antelope-jammy-20250124130157 |
Apache License 2.0 |
cinder |
mirantis.azurecr.io/openstack/cinder:antelope-jammy-20250124130157 |
Apache License 2.0 |
osprober |
mirantis.azurecr.io/openstack/osprober:0.0.1-d0f3d7b |
Apache License 2.0 |
neutron |
mirantis.azurecr.io/openstack/neutron:antelope-jammy-20250124130157 |
Apache License 2.0 |
nova |
mirantis.azurecr.io/openstack/nova:antelope-jammy-20250124130157 |
Apache License 2.0 |
horizon |
mirantis.azurecr.io/openstack/horizon:antelope-jammy-20250124130157 |
Apache License 2.0 |
tempest |
mirantis.azurecr.io/openstack/tempest:antelope-jammy-20250124130157 |
Apache License 2.0 |
octavia |
mirantis.azurecr.io/openstack/octavia:antelope-jammy-20250124130157 |
Apache License 2.0 |
designate |
mirantis.azurecr.io/openstack/designate:antelope-jammy-20250124130157 |
Apache License 2.0 |
ironic |
mirantis.azurecr.io/openstack/ironic:antelope-jammy-20250124130157 |
Apache License 2.0 |
barbican |
mirantis.azurecr.io/openstack/barbican:antelope-jammy-20250124130157 |
Apache License 2.0 |
libvirt |
mirantis.azurecr.io/general/libvirt:8.0.x-jammy-reef-20241115095845 |
LGPL-2.1 License |
pause |
mirantis.azurecr.io/general/external/pause:3.1 |
Apache License 2.0 |
openvswitch |
mirantis.azurecr.io/general/openvswitch:2.17-jammy-20240827065304 |
Apache License 2.0 |
openvswitch-dpdk |
mirantis.azurecr.io/general/openvswitch-dpdk:2.17-jammy-20240827065304 |
Apache License 2.0 |
openstack-tools |
mirantis.azurecr.io/openstack/openstack-tools:yoga-jammy-20241120070553 |
Apache License 2.0 |
rabbitmq |
mirantis.azurecr.io/openstack/extra/rabbitmq:3.12.12-jammy-20240829072728 |
Mozilla Public License 2.0 |
rabbitmq-management |
mirantis.azurecr.io/openstack/extra/rabbitmq-management:3.12.12-jammy-20240829072728 |
Mozilla Public License 2.0 |
kubernetes-entrypoint |
mirantis.azurecr.io/openstack/extra/kubernetes-entrypoint:v1.0.1-34a4f54-20240910081335 |
Apache License 2.0 |
memcached |
mirantis.azurecr.io/general/memcached:v1.6.32-alpine-20241024070356 |
BSD 3-Clause “New” or “Revised” License |
etcd |
mirantis.azurecr.io/openstack/extra/etcd:v3.5.16-alpine-20241024070202 |
Apache License 2.0 |
powerdns |
mirantis.azurecr.io/openstack/extra/powerdns:4.8-alpine-20241120110423 |
GPL-2.0 License |
nginx-ingress-controller |
mirantis.azurecr.io/openstack/extra/nginx-ingress-controller:1.11.3-alpine-20241024075118 |
Apache License 2.0 |
tls-proxy |
mirantis.azurecr.io/openstack/tls-proxy:jammy-fipster-1.0.0.dev2 |
Mirantis Proprietary License |
defaultbackend |
mirantis.azurecr.io/openstack/extra/defaultbackend:v1.19.2-77af1ef-20240910090142 |
Apache License 2.0 |
mariadb |
mirantis.azurecr.io/general/mariadb:10.6.20-jammy-20241104184039 |
GPLv2, LGPLv2.1 (client libraries) |
rabbitmq-exporter |
mirantis.azurecr.io/stacklight/rabbitmq-exporter:1.0.0 |
MIT License |
memcached-exporter |
mirantis.azurecr.io/stacklight/memcached-exporter:v0.15.0 |
Apache License 2.0 |
prometheus-mysql-exporter |
mirantis.azurecr.io/stacklight/mysqld-exporter:v0.16.0 |
Apache License 2.0 |
aodh |
mirantis.azurecr.io/openstack/aodh:antelope-jammy-20250124130157 |
Apache License 2.0 |
ceilometer |
mirantis.azurecr.io/openstack/ceilometer:antelope-jammy-20250124130157 |
Apache License 2.0 |
gnocchi |
mirantis.azurecr.io/openstack/gnocchi:antelope-jammy-20250124130157 |
Apache License 2.0 |
redis |
mirantis.azurecr.io/openstack/extra/redis:7.2.x-alpine-20241024111938 |
BSD 3-Clause “New” or “Revised” License |
redis-operator |
mirantis.azurecr.io/openstack/extra/redis-operator:v1.2.4-20241024111938 |
Apache License 2.0 |
frr |
mirantis.azurecr.io/general/external/docker.io/frrouting/frr:v9.1.2-20241111080549 |
GPL-2.0 and LGPL-2.1 |
strongswan |
mirantis.azurecr.io/openstack/extra/strongswan:alpine-5.9.12-20241024065424 |
GPL-2.0 |
rsyslog |
mirantis.azurecr.io/openstack/extra/rsyslog:v8.2001.0-20240829110216 |
GNU General Public License v3 |
descheduler |
mirantis.azurecr.io/openstack/extra/descheduler-20240910121701:v0.30.1-amd64-20240910114244 |
Apache License 2.0 |
nginx |
mirantis.azurecr.io/openstack/extra/nginx:1.27.2-20241024065919 |
Apache License 2.0 |
requirements |
mirantis.azurecr.io/openstack/requirements:antelope-jammy-20250124130157 |
Apache License 2.0 |
drb-controller |
mirantis.azurecr.io/openstack/extra/drb-controller:0.1.0-20240701093549 |
Mirantis Proprietary License |
stepler |
mirantis.azurecr.io/openstack/stepler:antelope-jammy-20241120224419 |
Apache License 2.0 |
placement |
mirantis.azurecr.io/openstack/placement:antelope-jammy-20250124130157 |
Apache License 2.0 |
masakari |
mirantis.azurecr.io/openstack/masakari:antelope-jammy-20250124130157 |
Apache License 2.0 |
masakari-monitors |
mirantis.azurecr.io/openstack/masakari-monitors:antelope-jammy-20250124130157 |
Apache License 2.0 |
ironic-inspector |
mirantis.azurecr.io/openstack/ironic-inspector:antelope-jammy-20250124130157 |
Apache License 2.0 |
manila |
mirantis.azurecr.io/openstack/manila:antelope-jammy-20250124130157 |
Apache License 2.0 |
MOSK 24.3.2 OpenStack Caracal binaries and Docker images
Component |
Path |
License information for main executable programs |
|---|---|---|
Binaries |
||
octavia-amphora |
https://binary.mirantis.com/openstack/bin/octavia/amphora-x64-haproxy-caracal-20250124133409.qcow2 |
Mirantis Proprietary License |
mirantis |
https://binary.mirantis.com/openstack/bin/horizon/mirantis-caracal-1f6ade2-20240408162450.tar.gz |
Mirantis Proprietary License |
kernel |
GPL-2.0 |
|
initramfs |
https://binary.mirantis.com/openstack/bin/ironic/tinyipa/tinyipa-stable-caracal-20240523065213.gz |
GPL-2.0 |
service-image |
https://binary.mirantis.com/openstack/bin/manila/manila-service-image-20241024092252.qcow2 |
Mirantis Proprietary License |
Docker images |
||
keystone |
mirantis.azurecr.io/openstack/keystone:caracal-jammy-20250124130157 |
Apache License 2.0 |
heat |
mirantis.azurecr.io/openstack/heat:caracal-jammy-20250124130157 |
Apache License 2.0 |
glance |
mirantis.azurecr.io/openstack/glance:caracal-jammy-20250124130157 |
Apache License 2.0 |
cinder |
mirantis.azurecr.io/openstack/cinder:caracal-jammy-20250124130157 |
Apache License 2.0 |
osprober |
mirantis.azurecr.io/openstack/osprober:0.0.1-d0f3d7b |
Apache License 2.0 |
neutron |
mirantis.azurecr.io/openstack/neutron:caracal-jammy-20250124130157 |
Apache License 2.0 |
nova |
mirantis.azurecr.io/openstack/nova:caracal-jammy-20250124130157 |
Apache License 2.0 |
horizon |
mirantis.azurecr.io/openstack/horizon:caracal-jammy-20250124130157 |
Apache License 2.0 |
tempest |
mirantis.azurecr.io/openstack/tempest:antelope-jammy-20250124130157 |
Apache License 2.0 |
octavia |
mirantis.azurecr.io/openstack/octavia:caracal-jammy-20250124130157 |
Apache License 2.0 |
designate |
mirantis.azurecr.io/openstack/designate:caracal-jammy-20250124130157 |
Apache License 2.0 |
ironic |
mirantis.azurecr.io/openstack/ironic:caracal-jammy-20250124130157 |
Apache License 2.0 |
barbican |
mirantis.azurecr.io/openstack/barbican:caracal-jammy-20250124130157 |
Apache License 2.0 |
libvirt |
mirantis.azurecr.io/general/libvirt:8.0.x-jammy-reef-20241115095845 |
LGPL-2.1 License |
pause |
mirantis.azurecr.io/general/external/pause:3.1 |
Apache License 2.0 |
openvswitch |
mirantis.azurecr.io/general/openvswitch:2.17-jammy-20240827065304 |
Apache License 2.0 |
openvswitch-dpdk |
mirantis.azurecr.io/general/openvswitch-dpdk:2.17-jammy-20240827065304 |
Apache License 2.0 |
openstack-tools |
mirantis.azurecr.io/openstack/openstack-tools:yoga-jammy-20241120070553 |
Apache License 2.0 |
rabbitmq |
mirantis.azurecr.io/openstack/extra/rabbitmq:3.12.12-jammy-20240829072728 |
Mozilla Public License 2.0 |
rabbitmq-management |
mirantis.azurecr.io/openstack/extra/rabbitmq-management:3.12.12-jammy-20240829072728 |
Mozilla Public License 2.0 |
kubernetes-entrypoint |
mirantis.azurecr.io/openstack/extra/kubernetes-entrypoint:v1.0.1-34a4f54-20240910081335 |
Apache License 2.0 |
memcached |
mirantis.azurecr.io/general/memcached:v1.6.32-alpine-20241024070356 |
BSD 3-Clause “New” or “Revised” License |
etcd |
mirantis.azurecr.io/openstack/extra/etcd:v3.5.16-alpine-20241024070202 |
Apache License 2.0 |
powerdns |
mirantis.azurecr.io/openstack/extra/powerdns:4.8-alpine-20241120110423 |
GPL-2.0 License |
nginx-ingress-controller |
mirantis.azurecr.io/openstack/extra/nginx-ingress-controller:1.11.3-alpine-20241024075118 |
Apache License 2.0 |
tls-proxy |
mirantis.azurecr.io/openstack/tls-proxy:jammy-fipster-1.0.0.dev2 |
Mirantis Proprietary License |
defaultbackend |
mirantis.azurecr.io/openstack/extra/defaultbackend:v1.19.2-77af1ef-20240910090142 |
Apache License 2.0 |
mariadb |
mirantis.azurecr.io/general/mariadb:10.6.20-jammy-20241104184039 |
GPLv2, LGPLv2.1 (client libraries) |
rabbitmq-exporter |
mirantis.azurecr.io/stacklight/rabbitmq-exporter:1.0.0 |
MIT License |
memcached-exporter |
mirantis.azurecr.io/stacklight/memcached-exporter:v0.15.0 |
Apache License 2.0 |
prometheus-mysql-exporter |
mirantis.azurecr.io/stacklight/mysqld-exporter:v0.16.0 |
Apache License 2.0 |
aodh |
mirantis.azurecr.io/openstack/aodh:caracal-jammy-20250124130157 |
Apache License 2.0 |
ceilometer |
mirantis.azurecr.io/openstack/ceilometer:caracal-jammy-20250124130157 |
Apache License 2.0 |
gnocchi |
mirantis.azurecr.io/openstack/gnocchi:caracal-jammy-20250124130157 |
Apache License 2.0 |
redis |
mirantis.azurecr.io/openstack/extra/redis:7.2.x-alpine-20241024111938 |
BSD 3-Clause “New” or “Revised” License |
redis-operator |
mirantis.azurecr.io/openstack/extra/redis-operator:v1.2.4-20241024111938 |
Apache License 2.0 |
frr |
mirantis.azurecr.io/general/external/docker.io/frrouting/frr:v9.1.2-20241111080549 |
GPL-2.0 and LGPL-2.1 |
strongswan |
mirantis.azurecr.io/openstack/extra/strongswan:alpine-5.9.12-20241024065424 |
GPL-2.0 |
rsyslog |
mirantis.azurecr.io/openstack/extra/rsyslog:v8.2001.0-20240829110216 |
GNU General Public License v3 |
descheduler |
mirantis.azurecr.io/openstack/extra/descheduler-20240910121701:v0.30.1-amd64-20240910114244 |
Apache License 2.0 |
nginx |
mirantis.azurecr.io/openstack/extra/nginx:1.27.2-20241024065919 |
Apache License 2.0 |
requirements |
mirantis.azurecr.io/openstack/requirements:caracal-jammy-20250124130157 |
Apache License 2.0 |
drb-controller |
mirantis.azurecr.io/openstack/extra/drb-controller:0.1.0-20240701093549 |
Mirantis Proprietary License |
stepler |
mirantis.azurecr.io/openstack/stepler:caracal-jammy-20250106125618 |
Apache License 2.0 |
placement |
mirantis.azurecr.io/openstack/placement:caracal-jammy-20250124130157 |
Apache License 2.0 |
masakari |
mirantis.azurecr.io/openstack/masakari:caracal-jammy-20250124130157 |
Apache License 2.0 |
masakari-monitors |
mirantis.azurecr.io/openstack/masakari-monitors:caracal-jammy-20250124130157 |
Apache License 2.0 |
ironic-inspector |
mirantis.azurecr.io/openstack/ironic-inspector:caracal-jammy-20250124130157 |
Apache License 2.0 |
manila |
mirantis.azurecr.io/openstack/manila:caracal-jammy-20250124130157 |
Apache License 2.0 |
MOSK 24.3.2 Tungsten Fabric 21.4 artifacts
Component |
Path |
License information for main executable programs |
|---|---|---|
Helm charts |
||
tungstenfabric-operator |
https://binary.mirantis.com/tungsten/helm/tungstenfabric-operator-0.16.8.tgz |
Mirantis Proprietary License |
Docker images |
||
tungstenfabric-operator |
mirantis.azurecr.io/tungsten-operator/tungstenfabric-operator:0.16.8 |
Mirantis Proprietary License |
tungsten-pytest |
mirantis.azurecr.io/tungsten/tungsten-pytest:0.1-20241209122102 |
MIT License |
casskop |
mirantis.azurecr.io/tungsten-operator/casskop:2.2.7 |
Apache License 2.0 |
cassandra-bootstrap |
mirantis.azurecr.io/tungsten/cassandra-bootstrap:0.1.21 |
Apache License 2.0 |
cassandra |
mirantis.azurecr.io/tungsten/cassandra:3.11.17 |
Apache License 2.0 |
cassandra-config-builder |
mirantis.azurecr.io/tungsten/cass-config-builder:v2-20240812125407 |
Apache License 2.0 |
rabbitmq-operator |
mirantis.azurecr.io/tungsten-operator/rabbitmq-operator:0.4.5 |
Mirantis Proprietary License |
rabbitmq |
mirantis.azurecr.io/tungsten/rabbitmq:3.11.16 |
Mozilla Public License 2.0 |
rabbitmq-exporter |
mirantis.azurecr.io/stacklight/rabbitmq-exporter:1.0.0 |
MIT License |
zookeeper-operator |
mirantis.azurecr.io/tungsten-operator/zookeeper-operator:0.2.22-mcp |
Apache License 2.0 |
zookeeper |
mirantis.azurecr.io/tungsten/zookeeper:3.8.4-20240813 |
Apache License 2.0 |
redis-operator |
mirantis.azurecr.io/tungsten-operator/redis-operator:0.4.7 |
Apache License 2.0 |
redis |
mirantis.azurecr.io/tungsten/redis:7.4.1-alpine |
BSD 3-Clause “New” or “Revised” License |
redis-exporter |
mirantis.azurecr.io/stacklight/redis_exporter:v1.66.0 |
BSD 3-Clause “New” or “Revised” License |
tf-cli |
mirantis.azurecr.io/tungsten/tf-cli:0.1-20250110161142 |
MIT License |
kubernetes-entrypoint |
mirantis.azurecr.io/openstack/extra/kubernetes-entrypoint:v1.0.1-34a4f54-20240910081335 |
Apache License 2.0 |
pause |
mirantis.azurecr.io/general/external/pause:3.1 |
Apache License 2.0 |
tf-nodeinfo |
mirantis.azurecr.io/tungsten/tf-nodeinfo:0.1-20240919130057 |
MIT License |
contrail-controller-config-api |
mirantis.azurecr.io/tungsten/contrail-controller-config-api:24.3-r21.4.20241206144908 |
Apache License 2.0 |
contrail-controller-config-devicemgr |
mirantis.azurecr.io/tungsten/contrail-controller-config-devicemgr:24.3-r21.4.20241206144908 |
Apache License 2.0 |
contrail-controller-config-dnsmasq |
mirantis.azurecr.io/tungsten/contrail-controller-config-dnsmasq:24.3-r21.4.20241206144908 |
Apache License 2.0 |
contrail-controller-config-schema |
mirantis.azurecr.io/tungsten/contrail-controller-config-schema:24.3-r21.4.20241206144908 |
Apache License 2.0 |
contrail-controller-config-svcmonitor |
mirantis.azurecr.io/tungsten/contrail-controller-config-svcmonitor:24.3-r21.4.20241206144908 |
Apache License 2.0 |
contrail-controller-control-control |
mirantis.azurecr.io/tungsten/contrail-controller-control-control:24.3-r21.4.20241206144908 |
Apache License 2.0 |
contrail-controller-control-dns |
mirantis.azurecr.io/tungsten/contrail-controller-control-dns:24.3-r21.4.20241206144908 |
Apache License 2.0 |
contrail-controller-control-named |
mirantis.azurecr.io/tungsten/contrail-controller-control-named:24.3-r21.4.20241206144908 |
Apache License 2.0 |
contrail-controller-webui-job |
mirantis.azurecr.io/tungsten/contrail-controller-webui-job:24.3-r21.4.20241206144908 |
Apache License 2.0 |
contrail-controller-webui-web |
mirantis.azurecr.io/tungsten/contrail-controller-webui-web:24.3-r21.4.20241206144908 |
Apache License 2.0 |
contrail-node-init |
mirantis.azurecr.io/tungsten/contrail-node-init:21.4.20240906000000 |
Apache License 2.0 |
contrail-provisioner |
mirantis.azurecr.io/tungsten/contrail-provisioner:24.3-r21.4.20241206144908 |
Apache License 2.0 |
contrail-tools |
mirantis.azurecr.io/tungsten/contrail-tools:24.3-r21.4.20241206144908 |
Apache License 2.0 |
contrail-vrouter-agent |
mirantis.azurecr.io/tungsten/contrail-vrouter-agent:21.4.20240906000000 |
Apache License 2.0 |
contrail-vrouter-agent-dpdk |
mirantis.azurecr.io/tungsten/contrail-vrouter-agent-dpdk:21.4.20240906000000 |
Apache License 2.0 |
contrail-vrouter-kernel-build-init |
mirantis.azurecr.io/tungsten/contrail-vrouter-kernel-build-init:21.4.20240906000000 |
Apache License 2.0 |
MOSK 24.3.2 StackLight artifacts
Component |
Path |
License information for main executable programs |
|---|---|---|
Docker images |
||
prometheus-libvirt-exporter |
mirantis.azurecr.io/stacklight/prometheus-libvirt-exporter:v0.2-20250113023013 |
Mirantis Proprietary License |
tungstenfabric-prometheus-exporter |
mirantis.azurecr.io/stacklight/tungstenfabric-prometheus-exporter:0.1-20241021123242 |
Mirantis Proprietary License |
Helm charts |
||
fluentd |
https://binary.mirantis.com/stacklight/helm/fluentd-2.0.3-mcp-52.tgz |
Mirantis Proprietary License |
prometheus-libvirt-exporter |
https://binary.mirantis.com/stacklight/helm/prometheus-libvirt-exporter-0.2.0-mcp-7.tgz |
Mirantis Proprietary License |
prometheus-tungstenfabric-exporter |
https://binary.mirantis.com/stacklight/helm/prometheus-tungstenfabric-exporter-0.2.0-mcp-7.tgz |
Mirantis Proprietary License |
The table below contains the total number of addressed unique and common CVEs by MOSK-specific component compared to the previous release version. The common CVEs are issues addressed across several images.
Product component |
CVE type |
Critical |
High |
Total |
|---|---|---|---|---|
OpenStack |
Unique |
0 |
8 |
8 |
Common |
0 |
48 |
48 |
|
Tungsten Fabric |
Unique |
1 |
9 |
10 |
Common |
1 |
15 |
16 |
Mirantis Security Portal
For the detailed list of fixed and present CVEs across the Mirantis Container Cloud and MOSK products, refer to Mirantis Security Portal.
Mirantis Container Cloud CVEs
For the number of fixed CVEs in the Mirantis Container Cloud-related components including kaas core, bare metal, Ceph, and StackLight, refer to Release notes 2.28.5: Security notes.
The following issues have been addressed in the MOSK 24.3.2 release:
[47115] [OpenStack] Resolved the issue that prevented the virtual machine with a floating IP address assigned to it from reaching the gateway node located on the same hypervisor.
[48274] [OpenStack] Resolved the issue that caused the failure of live migrations if multiple networks existed on an instance.
[48571] [OpenStack] Resolved the issue that caused Keystone and DNS downtimes during the OpenStack controller replacement.
[48614] [OpenStack] Resolved the issue that prevented the PXE boot from downloading the iPXE file due to restrictive permissions on the
tftpbootdirectory.
This section lists MOSK known issues with workarounds for the MOSK release 24.3.2. For the known issues in the related Container Cloud release, refer to Release Notes 2.28.5.
During MariaDB operations on a management cluster, Pods may get stuck in continuous restarts with the following example error:
[ERROR] WSREP: Corrupt buffer header: \
addr: 0x7faec6f8e518, \
seqno: 3185219421952815104, \
size: 909455917, \
ctx: 0x557094f65038, \
flags: 11577. store: 49, \
type: 49
Workaround:
Create a backup of the
/var/lib/mysqldirectory on themariadb-serverPod.Verify that other replicas are up and ready.
Remove the
galera.cachefile for the affectedmariadb-serverPod.Remove the affected
mariadb-serverPod or wait until it is automatically restarted.
After Kubernetes restarts the Pod, the Pod clones the database in 1-2 minutes and restores the quorum.
Due to the MetalLB upstream issue, a load balancer service may not obtain the external IP address.
The issue occurs when two services share the same external IP address and have
the same externalTrafficPolicy value. Initially, the services have the
external IP address assigned and are accessible. After modifying the
externalTrafficPolicy value for both services from Cluster to
Local, the first service that has been changed remains with no external IP
address assigned. Though, the second service, which was changed later, has the
external IP assigned as expected.
To work around the issue, make a dummy change to the service object where
external IP is <pending>:
Identify the service that is stuck:
kubectl get svc -A | grep pending
Example of system response:
stacklight iam-proxy-prometheus LoadBalancer 10.233.28.196 <pending> 443:30430/TCP
Add an arbitrary label to the service that is stuck. For example:
kubectl label svc -n stacklight iam-proxy-prometheus reconcile=1
Example of system response:
service/iam-proxy-prometheus labeledVerify that the external IP was allocated to the service:
kubectl get svc -n stacklight iam-proxy-prometheus
Example of system response:
NAME TYPE CLUSTER-IP EXTERNAL-IP PORT(S) AGE iam-proxy-prometheus LoadBalancer 10.233.28.196 10.0.34.108 443:30430/TCP 12d
Sometimes, after changing the OpenStackDeployment custom resource,
it does not transition to the APPLYING state as expected.
To work around the issue, restart the rockoon` pod in the osh-system
namespace.
Fixed in MOSK 24.3.6 Fixed in MOSK 25.1.1
Due to the issue in the OpenStack Cinder online data migration code, the
migration does not process soft-deleted rows. As a result, in the presence
of non-processed soft-deleted rows, the cinder-db-sync job may fail
during upgrade from Antelope to Caracal with the error in the pod logs
similar to the following:
2024-10-24 18:55:06.678 1 ERROR cinder pymysql.err.DataError: (1265, "Data truncated for column 'use_quota' at row 24")
The issue can occur if your MOSK cluster was initially deployed with OpenStack Wallaby or earlier release, such as Victoria, Ussuri, and so on, and you do not perform the standard periodic OpenStack database cleanup procedure. As a result, unprocessed soft-deleted database rows for volumes and snapshots created before the Xena release may still be present in the database, causing the failure of the database migration.
To verify if your cluster is affected:
Use the following SQL query against the OpenStack database:
SELECT COUNT(*) FROM cinder.volumes WHERE use_quota IS NULL; SELECT COUNT(*) FROM cinder.snapshots WHERE use_quota IS NULL;
If both queries return a zero count, your cluster is not affected.
If either query returns a non-zero count, your cluster is affected.
Verify that all the affected rows are soft-deleted:
SELECT COUNT(*) FROM cinder.volumes WHERE use_quota IS NULL AND deleted=0; SELECT COUNT(*) FROM cinder.snapshots WHERE use_quota IS NULL AND deleted=0;
If either query returns a non-zero count, stop and request Mirantis support.
If both queries return zero count, proceed with the workaround.
Workaround:
Manually change the value of the use_quota field to 1, where its
value is NULL using the following SQL query:
UPDATE cinder.volumes SET use_quota=1 WHERE deleted=1 AND use_quota IS NULL;
UPDATE cinder.snapshots SET use_quota=1 WHERE deleted=1 AND use_quota IS NULL;
This action is generally harmless as it only modifies rows that are already soft-deleted, and would eventually be removed by the database cleanup.
If you have already encountered the issue and your OpenStack upgrade is stuck,
perform the database modification as described above, then re-run the
cinder-db-sync job. Once completed, the upgrade should continue as
expected.
Rebooting all Cassandra cluster TFConfig or TFAnalytics nodes, maintenance, or other circumstances that cause the Cassandra pods to start simultaneously may cause a broken Cassandra TFConfig and/or TFAnalytics cluster. In this case, Cassandra nodes do not join the ring and do not update the IPs of the neighbor nodes. As a result, the TF services cannot operate Cassandra cluster(s).
To verify that a Cassandra cluster is affected:
Run the nodetool status command specifying the config or
analytics cluster and the replica number:
kubectl -n tf exec -it tf-cassandra-<config/analytics>-dc1-rack1-<replica number> -c cassandra -- nodetool status
Example of system response with outdated IP addresses:
Datacenter: DC1
===============
Status=Up/Down
|/ State=Normal/Leaving/Joining/Moving
-- Address Load Tokens Owns (effective) Host ID Rack
DN <outdated ip> ? 256 64.9% a58343d0-1e3f-4d54-bcdf-9b9b949ca873 r1
DN <outdated ip> ? 256 69.8% 67f1d07c-8b13-4482-a2f1-77fa34e90d48 r1
Datacenter: dc1
===============
Status=Up/Down
|/ State=Normal/Leaving/Joining/Moving
-- Address Load Tokens Owns (effective) Host ID Rack
UN <actual ip> 3.84 GiB 256 65.2% 7324ebc4-577a-425f-b3de-96faac95a331 rack1
Workaround:
Manually delete the Cassandra pod from the failed config or analytics
cluster to re-initiate the bootstrap process for one of the Cassandra nodes:
kubectl -n tf delete pod tf-cassandra-<config/analytics>-dc1-rack1-<replica_num>
Occasionally, RabbitMQ instances in tf-rabbitmq pods fail to enable
the tracking_records_in_ets during the initialization process.
To work around the problem, restart the affected pods manually.
After replacing a failed Tungsten Fabric controller node as described in Replace a failed TF controller node, the first restart of the Cassandra pod on this node may cause an issue if the Cassandra node with the outdated IP address has not been removed from the cluster. Subsequent Cassandra pod restarts should not trigger this problem.
To verify if your Cassandra cluster is affected, run the nodetool status command specifying the config or analytics cluster and the replica number:
kubectl -n tf exec -it tf-cassandra-<CONFIG-OR-ANALYTICS>-dc1-rack1-<REPLICA-NUM> -c cassandra -- nodetool status
Example of the system response with outdated IP addresses:
Datacenter: dc1
===============
Status=Up/Down
|/ State=Normal/Leaving/Joining/Moving
-- Address Load Tokens Owns Host ID Rack
UN 192.168.201.144 509.43 KiB 256 ? 7e760a99-fae5-4921-b0c5-d9e6e1eca1c5 rack1
UN 192.168.50.146 534.18 KiB 256 ? 2248ea35-85d4-4887-820b-1fac4733021f rack1
UN 192.168.145.147 484.19 KiB 256 ? d988aaaa-44ae-4fec-a617-0b0a253e736d rack1
DN 192.168.145.144 481.53 KiB 256 ? c23703a1-6854-47a7-a4a2-af649d63af0c rack1
An extra node will appear in the cluster with an outdated IP address
(the IP of the terminated Cassandra pod) in the Down state.
To work around the issue, after replacing the Tungsten Fabric controller node, delete the Cassandra pod on the replaced node and remove the outdated node from the Cassandra cluster using nodetool:
kubectl -n tf exec -it tf-cassandra-<CONFIG-OR-ANALYTICS>-dc1-rack1-<REPLICA-NUM> -c cassandra -- nodetool removenode <HOST-ID>
During major or patch update of a MOSK cluster with StackLight enabled in
non-HA mode, the KubePodsCrashLooping alert may be firing for the Grafana
ReplicaSet.
Grafana relies on PostgreSQL for persistent data. In non-HA StackLight setup,
PostgreSQL becomes temporarily unavailable during updates. If Grafana loses its
database connection or fails to establish one during startup, Grafana fails
with an error. This may cause the Grafana pod to enter the CrashLoopBackOff
state. Such behavior is expected in non-HA StackLight setups. The Grafana pod
will resume normal operation after PostgreSQL is restored.
To prevent the issue, deploy StackLight in HA mode.
During update of a management or MOSK cluster with StackLight enabled in HA
mode, the OpenSearchClusterStatusCritical alert may trigger when the next
OpenSearch node restarts before shards from the previous node finish assigning.
This can push some indices to red temporarily, making them unavailable for
reads and writes, possibly causing some new logs being lost.
The issue does not affect the cluster during the update, no workaround is needed, and you can safely ignore it.
Fixed in MOSK 25.1 Fixed in MOSK 25.1.1
Tag-based filtering of logs using the tag_include parameter does not work
for the logging.externalOutputs feature when output_kind: audit is
selected.
For example, if the user wants to send only logs from the sudo
program and sets tag_include: sudo, none of the logs will be sent to an
external destination.
To work around the issue, allow forwarding of all audit logs in addition to
sudo, which include logs from sshd,
systemd-logind, and su. Instead of tag_include: sudo,
specify tag_include: '{sudo,systemd-audit}'.
When the fix applies in MOSK 25.1, filtering starts working automatically.
The incompatibility between the newly implemented session refresh in the
upstream simple-salesforce with the MOSK implementation of session refresh
in sf-notifier results in the uncontrolled growth of new logins and lack
of session reuse. The issue applies to both MOSK and management clusters.
Workaround:
The workaround to the issue is to change the sf-notifier image tag directly
in the Deployment object. This change is not persistent as this direct change
in the Deployment object will be reverted or overridden by:
Container Cloud version update (for management clusters)
Cluster release version update (for MOSK cluster)
Any
sf-notifier-related operation (for all clusters):Disable and enable
Credentials change
IDs change
Any configuration change for resources, node selector, tolerations, and log level
Once applied, this workaround must be re-applied whenever one of the above operations is performed in the cluster.
Print the currently used image:
kubectl get deployment sf-notifier -n stacklight -o jsonpath="{.spec.template.spec.containers[0].image}"
Possible results:
mirantis.azurecr.io/stacklight/sf-notifier:v0.4-20250113023013or
127.0.0.1:44301/stacklight/sf-notifier:v0.4-20250113023013Compare the
sf-notifierimage tag with the list of affected tags. If the image is affected, it has to be replaced. Otherwise, your cluster is not affected.Affected tags:
v0.4-20241021023015 v0.4-20241028023015 v0.4-20241118023015 v0.4-20241216023012 v0.4-20250113023013 v0.4-20250217023014 v0.4-20250317092322 v0.4-20250414023016
In the resulting string, replace only the tag of the affected image with the desired
v0.4-20240828023015tag. Keep the registry the same as in the original Deployment object.Resulting images from examples:
mirantis.azurecr.io/stacklight/sf-notifier:v0.4-20240828023015
or
127.0.0.1:44301/stacklight/sf-notifier:v0.4-20240828023015
Update the
sf-notifierDeployment with the new image:kubectl set image deployment/sf-notifier sf-notifier=<new image> -n stacklight
For example:
kubectl set image deployment/sf-notifier sf-notifier=mirantis.azurecr.io/stacklight/sf-notifier:v0.4-20240828023015 -n stacklight
or
kubectl set image deployment/sf-notifier sf-notifier=127.0.0.1:44301/stacklight/sf-notifier:v0.4-20240828023015 -n stacklight
Wait until the pod with the updated image is created, and check the logs. Verify that there are no errors in the logs:
kubectl logs pod/<sf-notifier pod> -n stacklight
As this change is not persistent and can be reverted by the cluster update
operation or any operation related to sf-notifier, periodically check all
clusters and if the change has been reverted, re-apply the workaround.
Optionally, you can add a custom alert that will monitor the current tag of
the sf-notifier image and will fire the alert if the tag is present in
the list of affected tags. For the custom alert configuration details,
refer to Alert configuration.
Example of a custom alert to monitor the current tag of the sf-notifier
image:
- name: stacklight
values:
...
prometheusServer:
...
customAlerts:
...
- alert: SFnotifierImageVersion
annotations:
description: "sf-notifier image has a buggy tag, please revert deployment image back to sf-notifier:v0.4-20240828023015. This should be fixed in MCC 2.29.3 / MOSK 24.3.5, remove the alert after this release upgrade."
summary: "This image might be causing too many API logins and exceeding our monthly API budget, please act immediately"
expr: >-
avg(kube_pod_container_info{container="sf-notifier",image_spec=~".*v0.4-(20241021023015|20241028023015|20241118023015|20241216023012|20250113023013|20250217023014|20250317092322|20250414023016)"})
for: 5m
labels:
service: alertmanager
severity: critical
Fixed in 2.30.0 (21.0.0 and 20.0.0)
When telegraf-ds-smart is deployed on all nodes of a large cluster with
iSCSI volumes attached, the telegraf-ds-smart pod constantly restarts with
OOM kill messages on every compute node while smartctl is trying to scan
all attached iSCSI volumes.
To work around the issue, disable telegraf-ds-smart by minimizing its
CPU and memory limits:
resources:
telegrafDsSmart:
limits:
cpu: 2m
memory: 2Mi
requests:
cpu: 1m
memory: 1Mi
For configuration details, see StackLight configuration parameters: Resource limits and Increase memory limits for cluster components.
During cluster update, the rolling reboot fails on the Tungsten Fabric cluster. To work around the issue, restart the RabbitMQ pods in the Tungsten Fabric cluster.
Fixed in MOSK 25.1 Fixed in MOSK 25.1.1
When updating to the MOSK 24.3 series, tf-config pods from the Tungsten
Fabric namespace may enter the CrashLoopBackOff state. For example:
tf-config-cs8zr 2/5 CrashLoopBackOff 676 (19s ago) 15h
tf-config-db-6zxgg 1/1 Running 44 (25m ago) 15h
tf-config-db-7k5sz 1/1 Running 43 (23m ago) 15h
tf-config-db-dlwdv 1/1 Running 43 (25m ago) 15h
tf-config-nw4tr 3/5 CrashLoopBackOff 665 (43s ago) 15h
tf-config-wzf6c 1/5 CrashLoopBackOff 680 (10s ago) 15h
tf-control-c6bnn 3/4 Running 41 (23m ago) 13h
tf-control-gsnnp 3/4 Running 42 (23m ago) 13h
tf-control-sj6fd 3/4 Running 41 (23m ago) 13h
To troubleshoot the issue, check the logs inside the tf-config API
container and the tf-cassandra pods. The following example logs
indicate that Cassandra services failed to peer with each other and
are operating independently:
Logs from the
tf-configAPI container:NoHostAvailable: ('Unable to complete the operation against any hosts', {<Host: 192.168.200.23:9042 dc1>: Unavailable('Error from server: code=1000 [Unavailable exception] message="Cannot achieve consistency level QUORUM" info={\'required_replicas\': 2, \'alive_replicas\': 1, \'consistency\': \'QUORUM\'}',)})Logs from the
tf-cassandrapods:INFO [OptionalTasks:1] 2024-09-09 08:59:36,231 CassandraRoleManager.java:419 - Setup task failed with error, rescheduling WARN [OptionalTasks:1] 2024-09-09 08:59:46,231 CassandraRoleManager.java:379 - CassandraRoleManager skipped default role setup: some nodes were not ready
To work around the issue, restart the Cassandra services in the Tungsten Fabric namespace by deleting the affected pods sequentially to establish the connection between them:
kubectl -n tf delete pod tf-cassandra-config-dc1-rack1-0
kubectl -n tf delete pod tf-cassandra-config-dc1-rack1-1
kubectl -n tf delete pod tf-cassandra-config-dc1-rack1-2
Now, all other services in the Tungsten Fabric namespace should be in
the Active state.
Fixed in MOSK 25.1 Fixed in MOSK 25.1.1
During migration of container runtime from Docker to containerd, some nodes may get stuck with the following error in LCM logs:
Orphaned Docker containers found after migration. Unable to proceed, please
check the node manually: exit status 2
The cluster is affected if orphaned containers with the k8s_ prefix are
present on the affected nodes:
docker ps -a --format '{{ .Names }}' | grep '^k8s_'
Workaround:
Inspect recent Ansible logs at
/var/log/lcm/*and make sure that the only failed task during migration isDelete running pods. If so, proceed to the next step. Otherwise, contact Mirantis support for further information.Stop and remove orphaned containers with the
k8s_prefix.Note
This action has no impact on the cluster because the nodes are already cordoned and drained as part of the maintenance window.
Fixed in MOSK 25.1 Fixed in MOSK 25.1.1
On cluster machines where any HostOSConfiguration object is targeted and
migration to containerd is applied, the machine status may be flapping
(Configure → Ready → Configure → Ready) with the
HostOSConfiguration-related Ansible tasks constantly restarting. This
occurs due to the HostOSConfiguration object state items being constantly
added and then removed from related LCMMachine objects.
To work around the issue, temporarily disable all HostOSConfiguration
objects until the issue is resolved. The expected Container Cloud release with
the issue resolution is targeted to Container Cloud 2.29.0, after the
management cluster update to the Cluster release 16.4.0.
To disable HostOSConfiguration objects:
In the
machineSelector:matchLabelssection of everyHostOSConfigurationobject, remove the corresponding label selectors for cluster machines.Wait for each
HostOSConfigurationobject status to be updated and themachinesStatesfield to be absent:kubectl -n <namespace> get hoc <hoc-name> -o jsonpath='{.status.machinesStates}'
The system response must be empty.
Once the issue is resolved in the target release, re-enable all objects using the same procedure.
During a MOSK cluster update, the tf-vrouter-agent-dpdk pods may become
unhealthy due to a failed LivenessProbe, causing the update process to get
stuck. The issue may only affect major updates when the cluster dataplane
components are restarted.
To work around the issue, manually remove the tf-vrouter-agent-dpdk
pods.
After moving a cluster into maintenance mode using the MOSK management console, an attempt to move a worker machine into maintenance mode fails with the Only undefined workers can be in maintainance mode at the same time.
As a workaround, move worker machines into maintenance mode using CLI as described in Enable maintenance mode on a cluster and machine using CLI.
Fixed in 2.30.0 (21.0.0 and 20.0.0)
A compact MOSK cluster fails to be deployed through the Container Cloud web UI
due to inability to add any label to the control plane machines along with
inability to change dedicatedControlPlane: false using the web UI.
To work around the issue, manually add the required labels using CLI. Once done, the cluster deployment resumes.
A newly created project does not display all available tabs and contains different access denied errors during first five minutes after creation.
To work around the issue, refresh the browser in five minutes after the project creation.
This section describes the specific actions you need to complete to accurately plan and successfully perform the update. Consider this information as a supplement to the generic update procedures published in Operations Guide: Cluster update.
You can update to the 24.3.2 version from the following cluster versions:
Patch update: 24.3.1 (January 06, 2025)
Major update: 24.3 (October 16, 2024)
For the detailed cluster update schema, refer to MOSK cluster update schema.
The following table provides details on the impact of a MOSK cluster update to a patch release within the 24.3 series.
Note
For the detailed workflow of update to a patch release, refer to Update to a patch version.
Updated component |
Impact on cloud users |
Impact on cloud workloads |
|---|---|---|
OpenStack and Tungsten Fabric |
|
Open vSwitch networking - interruption of North-South connectivity, depending on the type of virtual routers used by a workload:
Tungsten Fabric networking - no impact |
Ceph |
~1% of read operations on object storage API may fail |
IO performance degradation for Ceph-backed virtual storage devices. Pay special attention to the known issue 50566 that may affect the maintenance window. |
Host OS components |
No impact |
No impact |
- 0(1,2)
You can bypass updating components of the cloud data plane to avoid the network downtime during Update to a patch version. By using this technique, you accept the risk that some security fixes may not be applied.
The following table provides details on the update impact on a MOSK cluster.
Updated component |
Impact on cloud users |
Impact on cloud workloads |
|---|---|---|
OpenStack and Tungsten Fabric |
|
Open vSwitch networking - interruption of the North-South connectivity, depending on the type of virtual routers used by a workload:
Tungsten Fabric networking - no impact |
Ceph |
~1% of read operations on object storage API may fail |
IO performance degradation for Ceph-backed virtual storage devices |
Host OS components |
No impact |
Instance network connectivity interruption up to 5 minutes |
Host OS kernel |
No impact |
Restart of instances due to the hypervisor reboot 1 |
- 1
Host operating system needs to be rebooted for the kernel update to be applied. Configure live-migration of workloads to avoid the impact on the instances running on a host.
To properly plan the update maintenance window, use the following documentation:
Before updating the cluster, be sure to review the potential issues that may arise during the process and the recommended solutions to address them, as outlined in Update known issues.
MOSK 24.3 release series is the last release series to support Ubuntu 20.04 as the host operating system. Ubuntu 20.04 reaches end-of-life in April 2025. Therefore, Mirantis encourages all MOSK users to upgrade their clusters to Ubuntu 22.04 as soon as possible after getting to the 24.3 series. A host operating system upgrade requires reboot of the nodes and can be performed in small batches.
Also, MOSK 24.3.1 introduces the new container runtime for the underlying Kubernetes cluster - containerd. The migration from Docker to containerd in 24.3.2 is still optional and requires node cordoning and draining. Therefore, if you decide to start using containerd and have not yet upgraded to Ubuntu 22.04, Mirantis highly recommends that these two changes be applied simultaneously to every node to minimize downtime for cloud workloads and users:
Note
In MOSK 24.3.x, the default container runtime remains Docker for greenfield deployments. Support for greenfield deployments based on containerd will be announced in one of the following releases.
Warning
Update of management or MOSK clusters running Ubuntu 20.04 or Docker runtime will not be possible in the following product series.
Usage of third-party software, which is not part of Mirantis-supported configurations, for example, the use of custom DPDK modules, may block upgrade of an operating system distribution. Users are ully responsible for ensuring the compatibility of such custom components with the latest supported Ubuntu version.
If you have not upgraded the operating system distribution on your machines to 22.04 yet, Mirantis recommends migrating machines from Docker to containerd on managed clusters together with distribution upgrade to minimize the maintenance window. In this case, ensure that all cluster machines are updated at once during the same maintenance window to prevent machines from running different container runtimes.
In MOSK 25.1 and Container Cloud 2.29.0, Grafana will be updated to version 11 where the following deprecated Angular-based plugins will be automatically migrated to the React-based ones:
Graph (old) -> Time Series
Singlestat -> Stat
Stat (old) -> Stat
Table (old) -> Table
Worldmap -> Geomap
This migration may corrupt custom Grafana dashboards that have Angular-based panels. Therefore, if you have such dashboards, back them up and manually upgrade Angular-based panels during the course of MOSK 24.3 and Container Cloud 2.28.x (Cluster releases 17.3.x and 16.3.x) to prevent custom appearance issues after plugin migration in Container Cloud 2.29.0 and MOSK 25.1.
Note
All Grafana dashboards provided by StackLight are also migrated to React automatically. For the list of default dashboards, see View Grafana dashboards.
Warning
For management clusters that are updated automatically, it is important to prepare the backup before Container Cloud 2.29.0 is released. Otherwise, custom dashboards using Angular-based plugins may be corrupted.
For managed clusters, you can perform the backup after the Container Cloud 2.29.0 release date but before updating them to MOSK 25.1.
24.3.3 patch
The MOSK 24.3.3 patch includes the following updates:
Update of Mirantis Kubernetes Engine (MKE) to 3.7.20
Mirantis Container Runtime 23.0.15 with
docker-ee-cliupdated to 23.0.17Update of minor kernel version to
5.15.0-134-genericSecurity fixes for CVEs in images
Learn more about the release content and update specifics:
This section lists the components artifacts of the MOSK 24.3.3 release that includes binaries, Docker images, and Helm charts.
MOSK 24.3.3 OpenStack Helm charts
Component |
Path |
License information for main executable programs |
|---|---|---|
openstack-operator |
https://binary.mirantis.com/openstack/helm/openstack-controller/openstack-operator-0.17.22.tgz |
Mirantis Proprietary License |
MOSK 24.3.3 OpenStack Antelope binaries and Docker images
Component |
Path |
License information for main executable programs |
|---|---|---|
Binaries |
||
octavia-amphora |
https://binary.mirantis.com/openstack/bin/octavia/amphora-x64-haproxy-antelope-20250314202650.qcow2 |
Mirantis Proprietary License |
mirantis |
https://binary.mirantis.com/openstack/bin/horizon/mirantis-antelope-18a1377-20230817112356.tar.gz |
Mirantis Proprietary License |
kernel |
GPL-2.0 |
|
initramfs |
https://binary.mirantis.com/openstack/bin/ironic/tinyipa/tinyipa-stable-antelope-20240213233421.gz |
GPL-2.0 |
service-image |
https://binary.mirantis.com/openstack/bin/manila/manila-service-image-20241024092252.qcow2 |
Mirantis Proprietary License |
Docker images |
||
keystone |
mirantis.azurecr.io/openstack/keystone:antelope-jammy-20250314195424 |
Apache License 2.0 |
heat |
mirantis.azurecr.io/openstack/heat:antelope-jammy-20250314195424 |
Apache License 2.0 |
glance |
mirantis.azurecr.io/openstack/glance:antelope-jammy-20250314195424 |
Apache License 2.0 |
cinder |
mirantis.azurecr.io/openstack/cinder:antelope-jammy-20250314195424 |
Apache License 2.0 |
osprober |
mirantis.azurecr.io/openstack/osprober:0.0.1-8748745 |
Apache License 2.0 |
neutron |
mirantis.azurecr.io/openstack/neutron:antelope-jammy-20250314195424 |
Apache License 2.0 |
nova |
mirantis.azurecr.io/openstack/nova:antelope-jammy-20250314195424 |
Apache License 2.0 |
horizon |
mirantis.azurecr.io/openstack/horizon:antelope-jammy-20250314195424 |
Apache License 2.0 |
tempest |
mirantis.azurecr.io/openstack/tempest:antelope-jammy-20250314195424 |
Apache License 2.0 |
octavia |
mirantis.azurecr.io/openstack/octavia:antelope-jammy-20250314195424 |
Apache License 2.0 |
designate |
mirantis.azurecr.io/openstack/designate:antelope-jammy-20250314195424 |
Apache License 2.0 |
ironic |
mirantis.azurecr.io/openstack/ironic:antelope-jammy-20250314195424 |
Apache License 2.0 |
barbican |
mirantis.azurecr.io/openstack/barbican:antelope-jammy-20250314195424 |
Apache License 2.0 |
libvirt |
mirantis.azurecr.io/general/libvirt:8.0.x-jammy-reef-20250306085321 |
LGPL-2.1 License |
pause |
mirantis.azurecr.io/general/external/pause:3.1 |
Apache License 2.0 |
openvswitch |
mirantis.azurecr.io/general/openvswitch:2.17-jammy-20250218074818 |
Apache License 2.0 |
openvswitch-dpdk |
mirantis.azurecr.io/general/openvswitch-dpdk:2.17-jammy-20250218074818 |
Apache License 2.0 |
openstack-tools |
mirantis.azurecr.io/openstack/openstack-tools:antelope-jammy-20250310060023 |
Apache License 2.0 |
rabbitmq |
mirantis.azurecr.io/openstack/extra/rabbitmq:3.12.12-jammy-20240829072728 |
Mozilla Public License 2.0 |
rabbitmq-management |
mirantis.azurecr.io/openstack/extra/rabbitmq-management:3.12.12-jammy-20240829072728 |
Mozilla Public License 2.0 |
kubernetes-entrypoint |
mirantis.azurecr.io/openstack/extra/kubernetes-entrypoint:v1.0.1-94cbbf5-20250227101657 |
Apache License 2.0 |
memcached |
mirantis.azurecr.io/general/memcached:v1.6.32-alpine-20250213123431 |
BSD 3-Clause “New” or “Revised” License |
etcd |
mirantis.azurecr.io/openstack/extra/etcd:v3.5.18-alpine-20250213142511 |
Apache License 2.0 |
powerdns |
mirantis.azurecr.io/openstack/extra/powerdns:4.8-alpine-20250225092111 |
GPL-2.0 License |
nginx-ingress-controller |
mirantis.azurecr.io/openstack/extra/nginx-ingress-controller:1.11.3-alpine-20250312074328 |
Apache License 2.0 |
tls-proxy |
mirantis.azurecr.io/openstack/tls-proxy:jammy-fipster-1.0.0.dev2 |
Mirantis Proprietary License |
defaultbackend |
mirantis.azurecr.io/openstack/extra/defaultbackend:v1.19.2-77af1ef-20240910090142 |
Apache License 2.0 |
mariadb |
mirantis.azurecr.io/general/mariadb:10.6.20-jammy-20250218081722 |
GPLv2, LGPLv2.1 (client libraries) |
rabbitmq-exporter |
mirantis.azurecr.io/stacklight/rabbitmq-exporter:1.0.0 |
MIT License |
memcached-exporter |
mirantis.azurecr.io/stacklight/memcached-exporter:v0.15.0 |
Apache License 2.0 |
prometheus-mysql-exporter |
mirantis.azurecr.io/stacklight/mysqld-exporter:v0.16.0 |
Apache License 2.0 |
aodh |
mirantis.azurecr.io/openstack/aodh:antelope-jammy-20250314195424 |
Apache License 2.0 |
ceilometer |
mirantis.azurecr.io/openstack/ceilometer:antelope-jammy-20250314195424 |
Apache License 2.0 |
gnocchi |
mirantis.azurecr.io/openstack/gnocchi:antelope-jammy-20250314195424 |
Apache License 2.0 |
redis |
mirantis.azurecr.io/openstack/extra/redis:7.2.x-alpine-20250213163602 |
BSD 3-Clause “New” or “Revised” License |
redis-operator |
mirantis.azurecr.io/openstack/extra/redis-operator:v1.2.4-20241024111938 |
Apache License 2.0 |
frr |
mirantis.azurecr.io/general/external/docker.io/frrouting/frr:v9.1.2-20250318060007 |
GPL-2.0 and LGPL-2.1 |
strongswan |
mirantis.azurecr.io/openstack/extra/strongswan:alpine-5.9.14-20250226152200 |
GPL-2.0 |
rsyslog |
mirantis.azurecr.io/openstack/extra/rsyslog:v8.2001.0-20240829110216 |
GNU General Public License v3 |
descheduler |
mirantis.azurecr.io/openstack/extra/descheduler-20240910121701:v0.30.1-amd64-20240910114244 |
Apache License 2.0 |
nginx |
mirantis.azurecr.io/openstack/extra/nginx:1.27.2-20250213141444 |
Apache License 2.0 |
requirements |
mirantis.azurecr.io/openstack/requirements:antelope-jammy-20250314195424 |
Apache License 2.0 |
drb-controller |
mirantis.azurecr.io/openstack/extra/drb-controller:0.1.0-20250216082520 |
Mirantis Proprietary License |
stepler |
mirantis.azurecr.io/openstack/stepler:antelope-jammy-20250304152010 |
Apache License 2.0 |
placement |
mirantis.azurecr.io/openstack/placement:antelope-jammy-20250314195424 |
Apache License 2.0 |
masakari |
mirantis.azurecr.io/openstack/masakari:antelope-jammy-20250314195424 |
Apache License 2.0 |
masakari-monitors |
mirantis.azurecr.io/openstack/masakari-monitors:antelope-jammy-20250314195424 |
Apache License 2.0 |
ironic-inspector |
mirantis.azurecr.io/openstack/ironic-inspector:antelope-jammy-20250314195424 |
Apache License 2.0 |
manila |
mirantis.azurecr.io/openstack/manila:antelope-jammy-20250314195424 |
Apache License 2.0 |
MOSK 24.3.3 OpenStack Caracal binaries and Docker images
Component |
Path |
License information for main executable programs |
|---|---|---|
Binaries |
||
octavia-amphora |
https://binary.mirantis.com/openstack/bin/octavia/amphora-x64-haproxy-caracal-20250314202953.qcow2 |
Mirantis Proprietary License |
mirantis |
https://binary.mirantis.com/openstack/bin/horizon/mirantis-caracal-1f6ade2-20240408162450.tar.gz |
Mirantis Proprietary License |
kernel |
GPL-2.0 |
|
initramfs |
https://binary.mirantis.com/openstack/bin/ironic/tinyipa/tinyipa-stable-caracal-20240523065213.gz |
GPL-2.0 |
service-image |
https://binary.mirantis.com/openstack/bin/manila/manila-service-image-20241024092252.qcow2 |
Mirantis Proprietary License |
Docker images |
||
keystone |
mirantis.azurecr.io/openstack/keystone:caracal-jammy-20250314195424 |
Apache License 2.0 |
heat |
mirantis.azurecr.io/openstack/heat:caracal-jammy-20250314195424 |
Apache License 2.0 |
glance |
mirantis.azurecr.io/openstack/glance:caracal-jammy-20250314195424 |
Apache License 2.0 |
cinder |
mirantis.azurecr.io/openstack/cinder:caracal-jammy-20250314195424 |
Apache License 2.0 |
osprober |
mirantis.azurecr.io/openstack/osprober:0.0.1-8748745 |
Apache License 2.0 |
neutron |
mirantis.azurecr.io/openstack/neutron:caracal-jammy-20250314195424 |
Apache License 2.0 |
nova |
mirantis.azurecr.io/openstack/nova:caracal-jammy-20250314195424 |
Apache License 2.0 |
horizon |
mirantis.azurecr.io/openstack/horizon:caracal-jammy-20250314195424 |
Apache License 2.0 |
tempest |
mirantis.azurecr.io/openstack/tempest:antelope-jammy-20250314195424 |
Apache License 2.0 |
octavia |
mirantis.azurecr.io/openstack/octavia:caracal-jammy-20250314195424 |
Apache License 2.0 |
designate |
mirantis.azurecr.io/openstack/designate:caracal-jammy-20250314195424 |
Apache License 2.0 |
ironic |
mirantis.azurecr.io/openstack/ironic:caracal-jammy-20250314195424 |
Apache License 2.0 |
barbican |
mirantis.azurecr.io/openstack/barbican:caracal-jammy-20250314195424 |
Apache License 2.0 |
libvirt |
mirantis.azurecr.io/general/libvirt:8.0.x-jammy-reef-20250306085321 |
LGPL-2.1 License |
pause |
mirantis.azurecr.io/general/external/pause:3.1 |
Apache License 2.0 |
openvswitch |
mirantis.azurecr.io/general/openvswitch:2.17-jammy-20250218074818 |
Apache License 2.0 |
openvswitch-dpdk |
mirantis.azurecr.io/general/openvswitch-dpdk:2.17-jammy-20250218074818 |
Apache License 2.0 |
openstack-tools |
mirantis.azurecr.io/openstack/openstack-tools:antelope-jammy-20250310060023 |
Apache License 2.0 |
rabbitmq |
mirantis.azurecr.io/openstack/extra/rabbitmq:3.12.12-jammy-20240829072728 |
Mozilla Public License 2.0 |
rabbitmq-management |
mirantis.azurecr.io/openstack/extra/rabbitmq-management:3.12.12-jammy-20240829072728 |
Mozilla Public License 2.0 |
kubernetes-entrypoint |
mirantis.azurecr.io/openstack/extra/kubernetes-entrypoint:v1.0.1-94cbbf5-20250227101657 |
Apache License 2.0 |
memcached |
mirantis.azurecr.io/general/memcached:v1.6.32-alpine-20250213123431 |
BSD 3-Clause “New” or “Revised” License |
etcd |
mirantis.azurecr.io/openstack/extra/etcd:v3.5.18-alpine-20250213142511 |
Apache License 2.0 |
powerdns |
mirantis.azurecr.io/openstack/extra/powerdns:4.8-alpine-20250225092111 |
GPL-2.0 License |
nginx-ingress-controller |
mirantis.azurecr.io/openstack/extra/nginx-ingress-controller:1.11.3-alpine-20250312074328 |
Apache License 2.0 |
tls-proxy |
mirantis.azurecr.io/openstack/tls-proxy:jammy-fipster-1.0.0.dev2 |
Mirantis Proprietary License |
defaultbackend |
mirantis.azurecr.io/openstack/extra/defaultbackend:v1.19.2-77af1ef-20240910090142 |
Apache License 2.0 |
mariadb |
mirantis.azurecr.io/general/mariadb:10.6.20-jammy-20250218081722 |
GPLv2, LGPLv2.1 (client libraries) |
rabbitmq-exporter |
mirantis.azurecr.io/stacklight/rabbitmq-exporter:1.0.0 |
MIT License |
memcached-exporter |
mirantis.azurecr.io/stacklight/memcached-exporter:v0.15.0 |
Apache License 2.0 |
prometheus-mysql-exporter |
mirantis.azurecr.io/stacklight/mysqld-exporter:v0.16.0 |
Apache License 2.0 |
aodh |
mirantis.azurecr.io/openstack/aodh:caracal-jammy-20250314195424 |
Apache License 2.0 |
ceilometer |
mirantis.azurecr.io/openstack/ceilometer:caracal-jammy-20250314195424 |
Apache License 2.0 |
gnocchi |
mirantis.azurecr.io/openstack/gnocchi:caracal-jammy-20250314195424 |
Apache License 2.0 |
redis |
mirantis.azurecr.io/openstack/extra/redis:7.2.x-alpine-20250213163602 |
BSD 3-Clause “New” or “Revised” License |
redis-operator |
mirantis.azurecr.io/openstack/extra/redis-operator:v1.2.4-20241024111938 |
Apache License 2.0 |
frr |
mirantis.azurecr.io/general/external/docker.io/frrouting/frr:v9.1.2-20250318060007 |
GPL-2.0 and LGPL-2.1 |
strongswan |
mirantis.azurecr.io/openstack/extra/strongswan:alpine-5.9.14-20250226152200 |
GPL-2.0 |
rsyslog |
mirantis.azurecr.io/openstack/extra/rsyslog:v8.2001.0-20240829110216 |
GNU General Public License v3 |
descheduler |
mirantis.azurecr.io/openstack/extra/descheduler-20240910121701:v0.30.1-amd64-20240910114244 |
Apache License 2.0 |
nginx |
mirantis.azurecr.io/openstack/extra/nginx:1.27.2-20250213141444 |
Apache License 2.0 |
requirements |
mirantis.azurecr.io/openstack/requirements:caracal-jammy-20250314195424 |
Apache License 2.0 |
drb-controller |
mirantis.azurecr.io/openstack/extra/drb-controller:0.1.0-20250216082520 |
Mirantis Proprietary License |
stepler |
mirantis.azurecr.io/openstack/stepler:caracal-jammy-20250303131743 |
Apache License 2.0 |
placement |
mirantis.azurecr.io/openstack/placement:caracal-jammy-20250314195424 |
Apache License 2.0 |
masakari |
mirantis.azurecr.io/openstack/masakari:caracal-jammy-20250314195424 |
Apache License 2.0 |
masakari-monitors |
mirantis.azurecr.io/openstack/masakari-monitors:caracal-jammy-20250314195424 |
Apache License 2.0 |
ironic-inspector |
mirantis.azurecr.io/openstack/ironic-inspector:caracal-jammy-20250314195424 |
Apache License 2.0 |
manila |
mirantis.azurecr.io/openstack/manila:caracal-jammy-20250314195424 |
Apache License 2.0 |
MOSK 24.3.3 Tungsten Fabric 21.4 artifacts
Component |
Path |
License information for main executable programs |
|---|---|---|
Helm charts |
||
tungstenfabric-operator |
https://binary.mirantis.com/tungsten/helm/tungstenfabric-operator-0.16.10.tgz |
Mirantis Proprietary License |
Docker images |
||
tungstenfabric-operator |
mirantis.azurecr.io/tungsten-operator/tungstenfabric-operator:0.16.10 |
Mirantis Proprietary License |
tungsten-pytest |
mirantis.azurecr.io/tungsten/tungsten-pytest:0.1-20250227124904 |
MIT License |
casskop |
mirantis.azurecr.io/tungsten-operator/casskop:2.2.8-mira |
Apache License 2.0 |
cassandra-bootstrap |
mirantis.azurecr.io/tungsten/cassandra-bootstrap:0.1.21 |
Apache License 2.0 |
cassandra |
mirantis.azurecr.io/tungsten/cassandra:3.11.17 |
Apache License 2.0 |
cassandra-config-builder |
mirantis.azurecr.io/tungsten/cass-config-builder:v2-20250317171052 |
Apache License 2.0 |
rabbitmq-operator |
mirantis.azurecr.io/tungsten-operator/rabbitmq-operator:0.4.9 |
Mirantis Proprietary License |
rabbitmq |
mirantis.azurecr.io/tungsten/rabbitmq:3.11.16 |
Mozilla Public License 2.0 |
rabbitmq-exporter |
mirantis.azurecr.io/stacklight/rabbitmq-exporter:1.0.0 |
MIT License |
zookeeper-operator |
mirantis.azurecr.io/tungsten-operator/zookeeper-operator:0.2.26-mcp |
Apache License 2.0 |
zookeeper |
mirantis.azurecr.io/tungsten/zookeeper:3.8.4-20240813 |
Apache License 2.0 |
redis-operator |
mirantis.azurecr.io/tungsten-operator/redis-operator:0.4.9 |
Apache License 2.0 |
redis |
mirantis.azurecr.io/tungsten/redis:7.4.2-alpine3.21 |
BSD 3-Clause “New” or “Revised” License |
redis-exporter |
mirantis.azurecr.io/stacklight/redis_exporter:v1.66.0 |
BSD 3-Clause “New” or “Revised” License |
tf-cli |
mirantis.azurecr.io/tungsten/tf-cli:0.1-20250318125939 |
MIT License |
kubernetes-entrypoint |
mirantis.azurecr.io/openstack/extra/kubernetes-entrypoint:v1.0.1-94cbbf5-20250227101657 |
Apache License 2.0 |
pause |
mirantis.azurecr.io/general/external/pause:3.1 |
Apache License 2.0 |
tf-nodeinfo |
mirantis.azurecr.io/tungsten/tf-nodeinfo:0.1-20250317121025 |
MIT License |
contrail-controller-config-api |
mirantis.azurecr.io/tungsten/contrail-controller-config-api:24.3-r21.4.20241206144908 |
Apache License 2.0 |
contrail-controller-config-devicemgr |
mirantis.azurecr.io/tungsten/contrail-controller-config-devicemgr:24.3-r21.4.20241206144908 |
Apache License 2.0 |
contrail-controller-config-dnsmasq |
mirantis.azurecr.io/tungsten/contrail-controller-config-dnsmasq:24.3-r21.4.20241206144908 |
Apache License 2.0 |
contrail-controller-config-schema |
mirantis.azurecr.io/tungsten/contrail-controller-config-schema:24.3-r21.4.20241206144908 |
Apache License 2.0 |
contrail-controller-config-svcmonitor |
mirantis.azurecr.io/tungsten/contrail-controller-config-svcmonitor:24.3-r21.4.20241206144908 |
Apache License 2.0 |
contrail-controller-control-control |
mirantis.azurecr.io/tungsten/contrail-controller-control-control:24.3-r21.4.20241206144908 |
Apache License 2.0 |
contrail-controller-control-dns |
mirantis.azurecr.io/tungsten/contrail-controller-control-dns:24.3-r21.4.20241206144908 |
Apache License 2.0 |
contrail-controller-control-named |
mirantis.azurecr.io/tungsten/contrail-controller-control-named:24.3-r21.4.20241206144908 |
Apache License 2.0 |
contrail-controller-webui-job |
mirantis.azurecr.io/tungsten/contrail-controller-webui-job:24.3-r21.4.20241206144908 |
Apache License 2.0 |
contrail-controller-webui-web |
mirantis.azurecr.io/tungsten/contrail-controller-webui-web:24.3-r21.4.20241206144908 |
Apache License 2.0 |
contrail-node-init |
mirantis.azurecr.io/tungsten/contrail-node-init:21.4.20240906000000 |
Apache License 2.0 |
contrail-provisioner |
mirantis.azurecr.io/tungsten/contrail-provisioner:24.3-r21.4.20241206144908 |
Apache License 2.0 |
contrail-tools |
mirantis.azurecr.io/tungsten/contrail-tools:24.3-r21.4.20241206144908 |
Apache License 2.0 |
contrail-vrouter-agent |
mirantis.azurecr.io/tungsten/contrail-vrouter-agent:21.4.20240906000000 |
Apache License 2.0 |
contrail-vrouter-agent-dpdk |
mirantis.azurecr.io/tungsten/contrail-vrouter-agent-dpdk:21.4.20240906000000 |
Apache License 2.0 |
contrail-vrouter-kernel-build-init |
mirantis.azurecr.io/tungsten/contrail-vrouter-kernel-build-init:21.4.20240906000000 |
Apache License 2.0 |
MOSK 24.3.3 StackLight artifacts
Component |
Path |
License information for main executable programs |
|---|---|---|
Docker images |
||
prometheus-libvirt-exporter |
mirantis.azurecr.io/stacklight/prometheus-libvirt-exporter:v0.2-20250317023016 |
Mirantis Proprietary License |
tungstenfabric-prometheus-exporter |
mirantis.azurecr.io/stacklight/tungstenfabric-prometheus-exporter:0.1-20250205153914 |
Mirantis Proprietary License |
Helm charts |
||
fluentd |
https://binary.mirantis.com/stacklight/helm/fluentd-2.0.3-mcp-52.tgz |
Mirantis Proprietary License |
prometheus-libvirt-exporter |
https://binary.mirantis.com/stacklight/helm/prometheus-libvirt-exporter-0.2.0-mcp-7.tgz |
Mirantis Proprietary License |
prometheus-tungstenfabric-exporter |
https://binary.mirantis.com/stacklight/helm/prometheus-tungstenfabric-exporter-0.2.0-mcp-7.tgz |
Mirantis Proprietary License |
The table below contains the total number of addressed unique and common CVEs by MOSK-specific component compared to the previous release version. The common CVEs are issues addressed across several images.
Product component |
CVE type |
Critical |
High |
Total |
|---|---|---|---|---|
OpenStack |
Unique |
3 |
23 |
26 |
Common |
12 |
88 |
100 |
|
Tungsten Fabric |
Unique |
2 |
18 |
20 |
Common |
6 |
79 |
85 |
Mirantis Security Portal
For the detailed list of fixed and present CVEs across the Mirantis Container Cloud and MOSK products, refer to Mirantis Security Portal.
Mirantis Container Cloud CVEs
For the number of fixed CVEs in the Mirantis Container Cloud-related components including kaas core, bare metal, Ceph, and StackLight, refer to Release notes 2.29.1: Security notes.
This section lists MOSK known issues with workarounds for the MOSK release 24.3.3. For the known issues in the related Container Cloud release, refer to Release Notes 2.29.1.
During cluster update, the rolling reboot fails on the Tungsten Fabric cluster. To work around the issue, restart the RabbitMQ pods in the Tungsten Fabric cluster.
Fixed in MOSK 25.1 Fixed in MOSK 25.1.1
When updating to the MOSK 24.3 series, tf-config pods from the Tungsten
Fabric namespace may enter the CrashLoopBackOff state. For example:
tf-config-cs8zr 2/5 CrashLoopBackOff 676 (19s ago) 15h
tf-config-db-6zxgg 1/1 Running 44 (25m ago) 15h
tf-config-db-7k5sz 1/1 Running 43 (23m ago) 15h
tf-config-db-dlwdv 1/1 Running 43 (25m ago) 15h
tf-config-nw4tr 3/5 CrashLoopBackOff 665 (43s ago) 15h
tf-config-wzf6c 1/5 CrashLoopBackOff 680 (10s ago) 15h
tf-control-c6bnn 3/4 Running 41 (23m ago) 13h
tf-control-gsnnp 3/4 Running 42 (23m ago) 13h
tf-control-sj6fd 3/4 Running 41 (23m ago) 13h
To troubleshoot the issue, check the logs inside the tf-config API
container and the tf-cassandra pods. The following example logs
indicate that Cassandra services failed to peer with each other and
are operating independently:
Logs from the
tf-configAPI container:NoHostAvailable: ('Unable to complete the operation against any hosts', {<Host: 192.168.200.23:9042 dc1>: Unavailable('Error from server: code=1000 [Unavailable exception] message="Cannot achieve consistency level QUORUM" info={\'required_replicas\': 2, \'alive_replicas\': 1, \'consistency\': \'QUORUM\'}',)})Logs from the
tf-cassandrapods:INFO [OptionalTasks:1] 2024-09-09 08:59:36,231 CassandraRoleManager.java:419 - Setup task failed with error, rescheduling WARN [OptionalTasks:1] 2024-09-09 08:59:46,231 CassandraRoleManager.java:379 - CassandraRoleManager skipped default role setup: some nodes were not ready
To work around the issue, restart the Cassandra services in the Tungsten Fabric namespace by deleting the affected pods sequentially to establish the connection between them:
kubectl -n tf delete pod tf-cassandra-config-dc1-rack1-0
kubectl -n tf delete pod tf-cassandra-config-dc1-rack1-1
kubectl -n tf delete pod tf-cassandra-config-dc1-rack1-2
Now, all other services in the Tungsten Fabric namespace should be in
the Active state.
Fixed in MOSK 25.1 Fixed in MOSK 25.1.1
During migration of container runtime from Docker to containerd, some nodes may get stuck with the following error in LCM logs:
Orphaned Docker containers found after migration. Unable to proceed, please
check the node manually: exit status 2
The cluster is affected if orphaned containers with the k8s_ prefix are
present on the affected nodes:
docker ps -a --format '{{ .Names }}' | grep '^k8s_'
Workaround:
Inspect recent Ansible logs at
/var/log/lcm/*and make sure that the only failed task during migration isDelete running pods. If so, proceed to the next step. Otherwise, contact Mirantis support for further information.Stop and remove orphaned containers with the
k8s_prefix.Note
This action has no impact on the cluster because the nodes are already cordoned and drained as part of the maintenance window.
Fixed in MOSK 25.1 Fixed in MOSK 25.1.1
On cluster machines where any HostOSConfiguration object is targeted and
migration to containerd is applied, the machine status may be flapping
(Configure → Ready → Configure → Ready) with the
HostOSConfiguration-related Ansible tasks constantly restarting. This
occurs due to the HostOSConfiguration object state items being constantly
added and then removed from related LCMMachine objects.
To work around the issue, temporarily disable all HostOSConfiguration
objects until the issue is resolved. The expected Container Cloud release with
the issue resolution is targeted to Container Cloud 2.29.0, after the
management cluster update to the Cluster release 16.4.0.
To disable HostOSConfiguration objects:
In the
machineSelector:matchLabelssection of everyHostOSConfigurationobject, remove the corresponding label selectors for cluster machines.Wait for each
HostOSConfigurationobject status to be updated and themachinesStatesfield to be absent:kubectl -n <namespace> get hoc <hoc-name> -o jsonpath='{.status.machinesStates}'
The system response must be empty.
Once the issue is resolved in the target release, re-enable all objects using the same procedure.
During MariaDB operations on a management cluster, Pods may get stuck in continuous restarts with the following example error:
[ERROR] WSREP: Corrupt buffer header: \
addr: 0x7faec6f8e518, \
seqno: 3185219421952815104, \
size: 909455917, \
ctx: 0x557094f65038, \
flags: 11577. store: 49, \
type: 49
Workaround:
Create a backup of the
/var/lib/mysqldirectory on themariadb-serverPod.Verify that other replicas are up and ready.
Remove the
galera.cachefile for the affectedmariadb-serverPod.Remove the affected
mariadb-serverPod or wait until it is automatically restarted.
After Kubernetes restarts the Pod, the Pod clones the database in 1-2 minutes and restores the quorum.
Due to the MetalLB upstream issue, a load balancer service may not obtain the external IP address.
The issue occurs when two services share the same external IP address and have
the same externalTrafficPolicy value. Initially, the services have the
external IP address assigned and are accessible. After modifying the
externalTrafficPolicy value for both services from Cluster to
Local, the first service that has been changed remains with no external IP
address assigned. Though, the second service, which was changed later, has the
external IP assigned as expected.
To work around the issue, make a dummy change to the service object where
external IP is <pending>:
Identify the service that is stuck:
kubectl get svc -A | grep pending
Example of system response:
stacklight iam-proxy-prometheus LoadBalancer 10.233.28.196 <pending> 443:30430/TCP
Add an arbitrary label to the service that is stuck. For example:
kubectl label svc -n stacklight iam-proxy-prometheus reconcile=1
Example of system response:
service/iam-proxy-prometheus labeledVerify that the external IP was allocated to the service:
kubectl get svc -n stacklight iam-proxy-prometheus
Example of system response:
NAME TYPE CLUSTER-IP EXTERNAL-IP PORT(S) AGE iam-proxy-prometheus LoadBalancer 10.233.28.196 10.0.34.108 443:30430/TCP 12d
Sometimes, after changing the OpenStackDeployment custom resource,
it does not transition to the APPLYING state as expected.
To work around the issue, restart the rockoon` pod in the osh-system
namespace.
Fixed in MOSK 24.3.6 Fixed in MOSK 25.1.1
Due to the issue in the OpenStack Cinder online data migration code, the
migration does not process soft-deleted rows. As a result, in the presence
of non-processed soft-deleted rows, the cinder-db-sync job may fail
during upgrade from Antelope to Caracal with the error in the pod logs
similar to the following:
2024-10-24 18:55:06.678 1 ERROR cinder pymysql.err.DataError: (1265, "Data truncated for column 'use_quota' at row 24")
The issue can occur if your MOSK cluster was initially deployed with OpenStack Wallaby or earlier release, such as Victoria, Ussuri, and so on, and you do not perform the standard periodic OpenStack database cleanup procedure. As a result, unprocessed soft-deleted database rows for volumes and snapshots created before the Xena release may still be present in the database, causing the failure of the database migration.
To verify if your cluster is affected:
Use the following SQL query against the OpenStack database:
SELECT COUNT(*) FROM cinder.volumes WHERE use_quota IS NULL; SELECT COUNT(*) FROM cinder.snapshots WHERE use_quota IS NULL;
If both queries return a zero count, your cluster is not affected.
If either query returns a non-zero count, your cluster is affected.
Verify that all the affected rows are soft-deleted:
SELECT COUNT(*) FROM cinder.volumes WHERE use_quota IS NULL AND deleted=0; SELECT COUNT(*) FROM cinder.snapshots WHERE use_quota IS NULL AND deleted=0;
If either query returns a non-zero count, stop and request Mirantis support.
If both queries return zero count, proceed with the workaround.
Workaround:
Manually change the value of the use_quota field to 1, where its
value is NULL using the following SQL query:
UPDATE cinder.volumes SET use_quota=1 WHERE deleted=1 AND use_quota IS NULL;
UPDATE cinder.snapshots SET use_quota=1 WHERE deleted=1 AND use_quota IS NULL;
This action is generally harmless as it only modifies rows that are already soft-deleted, and would eventually be removed by the database cleanup.
If you have already encountered the issue and your OpenStack upgrade is stuck,
perform the database modification as described above, then re-run the
cinder-db-sync job. Once completed, the upgrade should continue as
expected.
Rebooting all Cassandra cluster TFConfig or TFAnalytics nodes, maintenance, or other circumstances that cause the Cassandra pods to start simultaneously may cause a broken Cassandra TFConfig and/or TFAnalytics cluster. In this case, Cassandra nodes do not join the ring and do not update the IPs of the neighbor nodes. As a result, the TF services cannot operate Cassandra cluster(s).
To verify that a Cassandra cluster is affected:
Run the nodetool status command specifying the config or
analytics cluster and the replica number:
kubectl -n tf exec -it tf-cassandra-<config/analytics>-dc1-rack1-<replica number> -c cassandra -- nodetool status
Example of system response with outdated IP addresses:
Datacenter: DC1
===============
Status=Up/Down
|/ State=Normal/Leaving/Joining/Moving
-- Address Load Tokens Owns (effective) Host ID Rack
DN <outdated ip> ? 256 64.9% a58343d0-1e3f-4d54-bcdf-9b9b949ca873 r1
DN <outdated ip> ? 256 69.8% 67f1d07c-8b13-4482-a2f1-77fa34e90d48 r1
Datacenter: dc1
===============
Status=Up/Down
|/ State=Normal/Leaving/Joining/Moving
-- Address Load Tokens Owns (effective) Host ID Rack
UN <actual ip> 3.84 GiB 256 65.2% 7324ebc4-577a-425f-b3de-96faac95a331 rack1
Workaround:
Manually delete the Cassandra pod from the failed config or analytics
cluster to re-initiate the bootstrap process for one of the Cassandra nodes:
kubectl -n tf delete pod tf-cassandra-<config/analytics>-dc1-rack1-<replica_num>
Occasionally, RabbitMQ instances in tf-rabbitmq pods fail to enable
the tracking_records_in_ets during the initialization process.
To work around the problem, restart the affected pods manually.
After replacing a failed Tungsten Fabric controller node as described in Replace a failed TF controller node, the first restart of the Cassandra pod on this node may cause an issue if the Cassandra node with the outdated IP address has not been removed from the cluster. Subsequent Cassandra pod restarts should not trigger this problem.
To verify if your Cassandra cluster is affected, run the nodetool status command specifying the config or analytics cluster and the replica number:
kubectl -n tf exec -it tf-cassandra-<CONFIG-OR-ANALYTICS>-dc1-rack1-<REPLICA-NUM> -c cassandra -- nodetool status
Example of the system response with outdated IP addresses:
Datacenter: dc1
===============
Status=Up/Down
|/ State=Normal/Leaving/Joining/Moving
-- Address Load Tokens Owns Host ID Rack
UN 192.168.201.144 509.43 KiB 256 ? 7e760a99-fae5-4921-b0c5-d9e6e1eca1c5 rack1
UN 192.168.50.146 534.18 KiB 256 ? 2248ea35-85d4-4887-820b-1fac4733021f rack1
UN 192.168.145.147 484.19 KiB 256 ? d988aaaa-44ae-4fec-a617-0b0a253e736d rack1
DN 192.168.145.144 481.53 KiB 256 ? c23703a1-6854-47a7-a4a2-af649d63af0c rack1
An extra node will appear in the cluster with an outdated IP address
(the IP of the terminated Cassandra pod) in the Down state.
To work around the issue, after replacing the Tungsten Fabric controller node, delete the Cassandra pod on the replaced node and remove the outdated node from the Cassandra cluster using nodetool:
kubectl -n tf exec -it tf-cassandra-<CONFIG-OR-ANALYTICS>-dc1-rack1-<REPLICA-NUM> -c cassandra -- nodetool removenode <HOST-ID>
During major or patch update of a MOSK cluster with StackLight enabled in
non-HA mode, the KubePodsCrashLooping alert may be firing for the Grafana
ReplicaSet.
Grafana relies on PostgreSQL for persistent data. In non-HA StackLight setup,
PostgreSQL becomes temporarily unavailable during updates. If Grafana loses its
database connection or fails to establish one during startup, Grafana fails
with an error. This may cause the Grafana pod to enter the CrashLoopBackOff
state. Such behavior is expected in non-HA StackLight setups. The Grafana pod
will resume normal operation after PostgreSQL is restored.
To prevent the issue, deploy StackLight in HA mode.
During update of a management or MOSK cluster with StackLight enabled in HA
mode, the OpenSearchClusterStatusCritical alert may trigger when the next
OpenSearch node restarts before shards from the previous node finish assigning.
This can push some indices to red temporarily, making them unavailable for
reads and writes, possibly causing some new logs being lost.
The issue does not affect the cluster during the update, no workaround is needed, and you can safely ignore it.
Fixed in MOSK 25.1 Fixed in MOSK 25.1.1
Tag-based filtering of logs using the tag_include parameter does not work
for the logging.externalOutputs feature when output_kind: audit is
selected.
For example, if the user wants to send only logs from the sudo
program and sets tag_include: sudo, none of the logs will be sent to an
external destination.
To work around the issue, allow forwarding of all audit logs in addition to
sudo, which include logs from sshd,
systemd-logind, and su. Instead of tag_include: sudo,
specify tag_include: '{sudo,systemd-audit}'.
When the fix applies in MOSK 25.1, filtering starts working automatically.
The incompatibility between the newly implemented session refresh in the
upstream simple-salesforce with the MOSK implementation of session refresh
in sf-notifier results in the uncontrolled growth of new logins and lack
of session reuse. The issue applies to both MOSK and management clusters.
Workaround:
The workaround to the issue is to change the sf-notifier image tag directly
in the Deployment object. This change is not persistent as this direct change
in the Deployment object will be reverted or overridden by:
Container Cloud version update (for management clusters)
Cluster release version update (for MOSK cluster)
Any
sf-notifier-related operation (for all clusters):Disable and enable
Credentials change
IDs change
Any configuration change for resources, node selector, tolerations, and log level
Once applied, this workaround must be re-applied whenever one of the above operations is performed in the cluster.
Print the currently used image:
kubectl get deployment sf-notifier -n stacklight -o jsonpath="{.spec.template.spec.containers[0].image}"
Possible results:
mirantis.azurecr.io/stacklight/sf-notifier:v0.4-20250113023013or
127.0.0.1:44301/stacklight/sf-notifier:v0.4-20250113023013Compare the
sf-notifierimage tag with the list of affected tags. If the image is affected, it has to be replaced. Otherwise, your cluster is not affected.Affected tags:
v0.4-20241021023015 v0.4-20241028023015 v0.4-20241118023015 v0.4-20241216023012 v0.4-20250113023013 v0.4-20250217023014 v0.4-20250317092322 v0.4-20250414023016
In the resulting string, replace only the tag of the affected image with the desired
v0.4-20240828023015tag. Keep the registry the same as in the original Deployment object.Resulting images from examples:
mirantis.azurecr.io/stacklight/sf-notifier:v0.4-20240828023015
or
127.0.0.1:44301/stacklight/sf-notifier:v0.4-20240828023015
Update the
sf-notifierDeployment with the new image:kubectl set image deployment/sf-notifier sf-notifier=<new image> -n stacklight
For example:
kubectl set image deployment/sf-notifier sf-notifier=mirantis.azurecr.io/stacklight/sf-notifier:v0.4-20240828023015 -n stacklight
or
kubectl set image deployment/sf-notifier sf-notifier=127.0.0.1:44301/stacklight/sf-notifier:v0.4-20240828023015 -n stacklight
Wait until the pod with the updated image is created, and check the logs. Verify that there are no errors in the logs:
kubectl logs pod/<sf-notifier pod> -n stacklight
As this change is not persistent and can be reverted by the cluster update
operation or any operation related to sf-notifier, periodically check all
clusters and if the change has been reverted, re-apply the workaround.
Optionally, you can add a custom alert that will monitor the current tag of
the sf-notifier image and will fire the alert if the tag is present in
the list of affected tags. For the custom alert configuration details,
refer to Alert configuration.
Example of a custom alert to monitor the current tag of the sf-notifier
image:
- name: stacklight
values:
...
prometheusServer:
...
customAlerts:
...
- alert: SFnotifierImageVersion
annotations:
description: "sf-notifier image has a buggy tag, please revert deployment image back to sf-notifier:v0.4-20240828023015. This should be fixed in MCC 2.29.3 / MOSK 24.3.5, remove the alert after this release upgrade."
summary: "This image might be causing too many API logins and exceeding our monthly API budget, please act immediately"
expr: >-
avg(kube_pod_container_info{container="sf-notifier",image_spec=~".*v0.4-(20241021023015|20241028023015|20241118023015|20241216023012|20250113023013|20250217023014|20250317092322|20250414023016)"})
for: 5m
labels:
service: alertmanager
severity: critical
Fixed in 2.30.0 (21.0.0 and 20.0.0)
When telegraf-ds-smart is deployed on all nodes of a large cluster with
iSCSI volumes attached, the telegraf-ds-smart pod constantly restarts with
OOM kill messages on every compute node while smartctl is trying to scan
all attached iSCSI volumes.
To work around the issue, disable telegraf-ds-smart by minimizing its
CPU and memory limits:
resources:
telegrafDsSmart:
limits:
cpu: 2m
memory: 2Mi
requests:
cpu: 1m
memory: 1Mi
For configuration details, see StackLight configuration parameters: Resource limits and Increase memory limits for cluster components.
After moving a cluster into maintenance mode using the MOSK management console, an attempt to move a worker machine into maintenance mode fails with the Only undefined workers can be in maintainance mode at the same time.
As a workaround, move worker machines into maintenance mode using CLI as described in Enable maintenance mode on a cluster and machine using CLI.
A newly created project does not display all available tabs and contains different access denied errors during first five minutes after creation.
To work around the issue, refresh the browser in five minutes after the project creation.
Fixed in 2.30.0 (21.0.0 and 20.0.0)
A compact MOSK cluster fails to be deployed through the Container Cloud web UI
due to inability to add any label to the control plane machines along with
inability to change dedicatedControlPlane: false using the web UI.
To work around the issue, manually add the required labels using CLI. Once done, the cluster deployment resumes.
This section describes the specific actions you need to complete to accurately plan and successfully perform the update. Consider this information as a supplement to the generic update procedures published in Operations Guide: Cluster update.
You can update to the 24.3.3 version from the following cluster versions:
Patch update: 24.3.1 (January 06, 2025) or 24.3.2 (February 03, 2025)
Major update: 24.3 (October 16, 2024)
For the detailed cluster update schema, refer to MOSK cluster update schema.
The following table provides details on the impact of a MOSK cluster update to a patch release within the 24.3 series.
Note
For the detailed workflow of update to a patch release, refer to Update to a patch version.
Updated component |
Impact on cloud users |
Impact on cloud workloads |
|---|---|---|
OpenStack and Tungsten Fabric |
|
Open vSwitch networking - interruption of North-South connectivity, depending on the type of virtual routers used by a workload:
Tungsten Fabric networking - no impact |
Ceph |
~1% of read operations on object storage API may fail |
IO performance degradation for Ceph-backed virtual storage devices. Pay special attention to the known issue 50566 that may affect the maintenance window. |
Host OS components |
No impact |
No impact |
- 0(1,2)
You can bypass updating components of the cloud data plane to avoid the network downtime during Update to a patch version. By using this technique, you accept the risk that some security fixes may not be applied.
The following table provides details on the update impact on a MOSK cluster.
Updated component |
Impact on cloud users |
Impact on cloud workloads |
|---|---|---|
OpenStack and Tungsten Fabric |
|
Open vSwitch networking - interruption of the North-South connectivity, depending on the type of virtual routers used by a workload:
Tungsten Fabric networking - no impact |
Ceph |
~1% of read operations on object storage API may fail |
IO performance degradation for Ceph-backed virtual storage devices |
Host OS components |
No impact |
Instance network connectivity interruption up to 5 minutes |
Host OS kernel |
No impact |
Restart of instances due to the hypervisor reboot 1 |
- 1
Host operating system needs to be rebooted for the kernel update to be applied. Configure live-migration of workloads to avoid the impact on the instances running on a host.
Before updating the cluster, be sure to review the potential issues that may arise during the process and the recommended solutions to address them, as outlined in Update known issues.
Management cluster update to Container Cloud 2.29.1 will be blocked if at least one node of any related MOSK cluster is running Ubuntu 20.04.
Therefore, ensure that every node of your MOSK clusters are running Ubuntu 22.04 to unblock management cluster update to Container Cloud 2.29.1 and MOSK cluster update to 24.3.3.
For the update procedure, refer to Upgrade an operating system distribution.
Caution
Usage of third-party software, which is not part of Mirantis-supported configurations, for example, the use of custom DPDK modules, may block upgrade of an operating system distribution. Users are fully responsible for ensuring the compatibility of such custom components with the latest supported Ubuntu version.
Since 24.3.1, MOSK introduces the new container runtime for the underlying Kubernetes cluster - containerd. The migration from Docker to containerd in 24.3.3 is still optional and requires node cordoning and draining.
If you decide to start using containerd and have not yet upgraded to Ubuntu 22.04, Mirantis highly recommends that these two changes be applied simultaneously to every node to minimize downtime for cloud workloads and users. In this case, ensure that all cluster machines are updated at once during the same maintenance window to prevent machines from running different container runtimes.
For the migration procedure, refer to Migrate container runtime from Docker to containerd.
Note
In MOSK 24.3.x, the default container runtime remains Docker for greenfield deployments. Support for greenfield deployments based on containerd is added in Container Cloud 2.29.0 (Cluster release 16.4.0) for management clusters and in MOSK 25.1 for MOSK clusters.
In MOSK 25.1 and Container Cloud 2.29.0, Grafana will be updated to version 11 where the following deprecated Angular-based plugins will be automatically migrated to the React-based ones:
Graph (old) -> Time Series
Singlestat -> Stat
Stat (old) -> Stat
Table (old) -> Table
Worldmap -> Geomap
This migration may corrupt custom Grafana dashboards that have Angular-based panels. Therefore, if you have such dashboards, back them up and manually upgrade Angular-based panels during the course of MOSK 24.3 and Container Cloud 2.28.x (Cluster releases 17.3.x and 16.3.x) to prevent custom appearance issues after plugin migration in Container Cloud 2.29.0 and MOSK 25.1.
Note
All Grafana dashboards provided by StackLight are also migrated to React automatically. For the list of default dashboards, see View Grafana dashboards.
Warning
For management clusters that are updated automatically, it is important to prepare the backup before Container Cloud 2.29.0 is released. Otherwise, custom dashboards using Angular-based plugins may be corrupted.
For MOSK clusters, you can perform the backup after the Container Cloud 2.29.0 release date but before updating them to MOSK 25.1.
24.3.4 patch
The MOSK 24.3.4 patch includes the following updates:
Update of minor kernel version to
5.15.0-135-genericSecurity fixes for CVEs in images
Resolved product issues
Learn more about the release content and update specifics:
This section lists the components artifacts of the MOSK 24.3.4 release that includes binaries, Docker images, and Helm charts.
MOSK 24.3.4 OpenStack Helm charts
Component |
Path |
License information for main executable programs |
|---|---|---|
openstack-operator |
https://binary.mirantis.com/openstack/helm/openstack-controller/openstack-operator-0.17.24.tgz |
Mirantis Proprietary License |
MOSK 24.3.4 OpenStack Antelope binaries and Docker images
Component |
Path |
License information for main executable programs |
|---|---|---|
Binaries |
||
octavia-amphora |
https://binary.mirantis.com/openstack/bin/octavia/amphora-x64-haproxy-antelope-20250404071524.qcow2 |
Mirantis Proprietary License |
mirantis |
https://binary.mirantis.com/openstack/bin/horizon/mirantis-antelope-18a1377-20230817112356.tar.gz |
Mirantis Proprietary License |
kernel |
GPL-2.0 |
|
initramfs |
https://binary.mirantis.com/openstack/bin/ironic/tinyipa/tinyipa-stable-antelope-20240213233421.gz |
GPL-2.0 |
service-image |
https://binary.mirantis.com/openstack/bin/manila/manila-service-image-20241024092252.qcow2 |
Mirantis Proprietary License |
Docker images |
||
keystone |
mirantis.azurecr.io/openstack/keystone:antelope-jammy-20250404064445 |
Apache License 2.0 |
heat |
mirantis.azurecr.io/openstack/heat:antelope-jammy-20250404064445 |
Apache License 2.0 |
glance |
mirantis.azurecr.io/openstack/glance:antelope-jammy-20250404064445 |
Apache License 2.0 |
cinder |
mirantis.azurecr.io/openstack/cinder:antelope-jammy-20250404064445 |
Apache License 2.0 |
osprober |
mirantis.azurecr.io/openstack/osprober:0.0.1-8748745 |
Unknown |
neutron |
mirantis.azurecr.io/openstack/neutron:antelope-jammy-20250404064445 |
Apache License 2.0 |
nova |
mirantis.azurecr.io/openstack/nova:antelope-jammy-20250404064445 |
Apache License 2.0 |
horizon |
mirantis.azurecr.io/openstack/horizon:antelope-jammy-20250404064445 |
Apache License 2.0 |
tempest |
mirantis.azurecr.io/openstack/tempest:antelope-jammy-20250404064445 |
Apache License 2.0 |
octavia |
mirantis.azurecr.io/openstack/octavia:antelope-jammy-20250404064445 |
Apache License 2.0 |
designate |
mirantis.azurecr.io/openstack/designate:antelope-jammy-20250404064445 |
Apache License 2.0 |
ironic |
mirantis.azurecr.io/openstack/ironic:antelope-jammy-20250404064445 |
Apache License 2.0 |
barbican |
mirantis.azurecr.io/openstack/barbican:antelope-jammy-20250404064445 |
Apache License 2.0 |
libvirt |
mirantis.azurecr.io/general/libvirt:8.0.x-jammy-reef-20250306085321 |
LGPL-2.1 License |
pause |
mirantis.azurecr.io/general/external/pause:3.1 |
Apache License 2.0 |
openvswitch |
mirantis.azurecr.io/general/openvswitch:2.17-jammy-20250408072712 |
Apache License 2.0 |
openvswitch-dpdk |
mirantis.azurecr.io/general/openvswitch-dpdk:2.17-jammy-20250408072712 |
Apache License 2.0 |
openstack-tools |
mirantis.azurecr.io/openstack/openstack-tools:antelope-jammy-20250407060024 |
Apache License 2.0 |
rabbitmq |
mirantis.azurecr.io/openstack/extra/rabbitmq:3.12.12-jammy-20240829072728 |
Mozilla Public License 2.0 |
rabbitmq-management |
mirantis.azurecr.io/openstack/extra/rabbitmq-management:3.12.12-jammy-20240829072728 |
Mozilla Public License 2.0 |
kubernetes-entrypoint |
mirantis.azurecr.io/openstack/extra/kubernetes-entrypoint:v1.0.1-94cbbf5-20250227101657 |
Apache License 2.0 |
memcached |
mirantis.azurecr.io/general/memcached:v1.6.38-alpine-20250328111424 |
BSD 3-Clause “New” or “Revised” License |
etcd |
mirantis.azurecr.io/openstack/extra/etcd:v3.5.21-alpine-20250409093259 |
Apache License 2.0 |
powerdns |
mirantis.azurecr.io/openstack/extra/powerdns:4.8-alpine-20250225092111 |
GPL-2.0 License |
nginx-ingress-controller |
mirantis.azurecr.io/openstack/extra/nginx-ingress-controller:1.11.5-alpine-20250411051037 |
Apache License 2.0 |
tls-proxy |
mirantis.azurecr.io/openstack/tls-proxy:jammy-fipster-1.0.0.dev2 |
Mirantis Proprietary License |
defaultbackend |
mirantis.azurecr.io/openstack/extra/defaultbackend:v1.19.2-77af1ef-20240910090142 |
Apache License 2.0 |
mariadb |
mirantis.azurecr.io/general/mariadb:10.6.20-jammy-20250218081722 |
GPLv2, LGPLv2.1 (client libraries) |
rabbitmq-exporter |
mirantis.azurecr.io/stacklight/rabbitmq-exporter:1.0.0 |
MIT License |
memcached-exporter |
mirantis.azurecr.io/stacklight/memcached-exporter:v0.15.0 |
Apache License 2.0 |
prometheus-mysql-exporter |
mirantis.azurecr.io/stacklight/mysqld-exporter:v0.16.0 |
Apache License 2.0 |
aodh |
mirantis.azurecr.io/openstack/aodh:antelope-jammy-20250404064445 |
Apache License 2.0 |
ceilometer |
mirantis.azurecr.io/openstack/ceilometer:antelope-jammy-20250404064445 |
Apache License 2.0 |
gnocchi |
mirantis.azurecr.io/openstack/gnocchi:antelope-jammy-20250404064445 |
Apache License 2.0 |
redis |
mirantis.azurecr.io/openstack/extra/redis:7.2.x-alpine-20250213163602 |
BSD 3-Clause “New” or “Revised” License |
redis-operator |
mirantis.azurecr.io/openstack/extra/redis-operator:v1.2.4-20241024111938 |
Unknown |
frr |
mirantis.azurecr.io/general/external/docker.io/frrouting/frr:v9.1.2-20250410070732 |
GPL-2.0 and LGPL-2.1 |
strongswan |
mirantis.azurecr.io/openstack/extra/strongswan:alpine-5.9.14-20250411050643 |
GPL-2.0 |
rsyslog |
mirantis.azurecr.io/openstack/extra/rsyslog:v8.2001.0-20240829110216 |
GNU General Public License v3 |
descheduler |
mirantis.azurecr.io/openstack/extra/descheduler-20240910121701:v0.30.1-amd64-20240910114244 |
Apache License 2.0 |
nginx |
mirantis.azurecr.io/openstack/extra/nginx:1.27.2-20250213141444 |
Apache License 2.0 |
requirements |
mirantis.azurecr.io/openstack/requirements:antelope-jammy-20250404064445 |
Apache License 2.0 |
drb-controller |
mirantis.azurecr.io/openstack/extra/drb-controller:0.1.0-20250216082520 |
Mirantis Proprietary License |
stepler |
mirantis.azurecr.io/openstack/stepler:antelope-jammy-20250304152010 |
Apache License 2.0 |
placement |
mirantis.azurecr.io/openstack/placement:antelope-jammy-20250404064445 |
Apache License 2.0 |
masakari |
mirantis.azurecr.io/openstack/masakari:antelope-jammy-20250404064445 |
Apache License 2.0 |
masakari-monitors |
mirantis.azurecr.io/openstack/masakari-monitors:antelope-jammy-20250404064445 |
Apache License 2.0 |
ironic-inspector |
mirantis.azurecr.io/openstack/ironic-inspector:antelope-jammy-20250404064445 |
Apache License 2.0 |
manila |
mirantis.azurecr.io/openstack/manila:antelope-jammy-20250404064445 |
Apache License 2.0 |
MOSK 24.3.4 OpenStack Caracal binaries and Docker images
Component |
Path |
License information for main executable programs |
|---|---|---|
Binaries |
||
octavia-amphora |
https://binary.mirantis.com/openstack/bin/octavia/amphora-x64-haproxy-caracal-20250404071609.qcow2 |
Mirantis Proprietary License |
mirantis |
https://binary.mirantis.com/openstack/bin/horizon/mirantis-caracal-1f6ade2-20240408162450.tar.gz |
Mirantis Proprietary License |
kernel |
GPL-2.0 |
|
initramfs |
https://binary.mirantis.com/openstack/bin/ironic/tinyipa/tinyipa-stable-caracal-20240523065213.gz |
GPL-2.0 |
service-image |
https://binary.mirantis.com/openstack/bin/manila/manila-service-image-20241024092252.qcow2 |
Mirantis Proprietary License |
Docker images |
||
keystone |
mirantis.azurecr.io/openstack/keystone:caracal-jammy-20250404064445 |
Apache License 2.0 |
heat |
mirantis.azurecr.io/openstack/heat:caracal-jammy-20250404064445 |
Apache License 2.0 |
glance |
mirantis.azurecr.io/openstack/glance:caracal-jammy-20250404064445 |
Apache License 2.0 |
cinder |
mirantis.azurecr.io/openstack/cinder:caracal-jammy-20250404064445 |
Apache License 2.0 |
osprober |
mirantis.azurecr.io/openstack/osprober:0.0.1-8748745 |
Unknown |
neutron |
mirantis.azurecr.io/openstack/neutron:caracal-jammy-20250404064445 |
Apache License 2.0 |
nova |
mirantis.azurecr.io/openstack/nova:caracal-jammy-20250404064445 |
Apache License 2.0 |
horizon |
mirantis.azurecr.io/openstack/horizon:caracal-jammy-20250404064445 |
Apache License 2.0 |
tempest |
mirantis.azurecr.io/openstack/tempest:antelope-jammy-20250404064445 |
Apache License 2.0 |
octavia |
mirantis.azurecr.io/openstack/octavia:caracal-jammy-20250404064445 |
Apache License 2.0 |
designate |
mirantis.azurecr.io/openstack/designate:caracal-jammy-20250404064445 |
Apache License 2.0 |
ironic |
mirantis.azurecr.io/openstack/ironic:caracal-jammy-20250404064445 |
Apache License 2.0 |
barbican |
mirantis.azurecr.io/openstack/barbican:caracal-jammy-20250404064445 |
Apache License 2.0 |
libvirt |
mirantis.azurecr.io/general/libvirt:8.0.x-jammy-reef-20250306085321 |
LGPL-2.1 License |
pause |
mirantis.azurecr.io/general/external/pause:3.1 |
Apache License 2.0 |
openvswitch |
mirantis.azurecr.io/general/openvswitch:2.17-jammy-20250408072712 |
Apache License 2.0 |
openvswitch-dpdk |
mirantis.azurecr.io/general/openvswitch-dpdk:2.17-jammy-20250408072712 |
Apache License 2.0 |
openstack-tools |
mirantis.azurecr.io/openstack/openstack-tools:antelope-jammy-20250407060024 |
Apache License 2.0 |
rabbitmq |
mirantis.azurecr.io/openstack/extra/rabbitmq:3.12.12-jammy-20240829072728 |
Mozilla Public License 2.0 |
rabbitmq-management |
mirantis.azurecr.io/openstack/extra/rabbitmq-management:3.12.12-jammy-20240829072728 |
Mozilla Public License 2.0 |
kubernetes-entrypoint |
mirantis.azurecr.io/openstack/extra/kubernetes-entrypoint:v1.0.1-94cbbf5-20250227101657 |
Apache License 2.0 |
memcached |
mirantis.azurecr.io/general/memcached:v1.6.38-alpine-20250328111424 |
BSD 3-Clause “New” or “Revised” License |
etcd |
mirantis.azurecr.io/openstack/extra/etcd:v3.5.21-alpine-20250409093259 |
Apache License 2.0 |
powerdns |
mirantis.azurecr.io/openstack/extra/powerdns:4.8-alpine-20250225092111 |
GPL-2.0 License |
nginx-ingress-controller |
mirantis.azurecr.io/openstack/extra/nginx-ingress-controller:1.11.5-alpine-20250411051037 |
Apache License 2.0 |
tls-proxy |
mirantis.azurecr.io/openstack/tls-proxy:jammy-fipster-1.0.0.dev2 |
Mirantis Proprietary License |
defaultbackend |
mirantis.azurecr.io/openstack/extra/defaultbackend:v1.19.2-77af1ef-20240910090142 |
Apache License 2.0 |
mariadb |
mirantis.azurecr.io/general/mariadb:10.6.20-jammy-20250218081722 |
GPLv2, LGPLv2.1 (client libraries) |
rabbitmq-exporter |
mirantis.azurecr.io/stacklight/rabbitmq-exporter:1.0.0 |
MIT License |
memcached-exporter |
mirantis.azurecr.io/stacklight/memcached-exporter:v0.15.0 |
Apache License 2.0 |
prometheus-mysql-exporter |
mirantis.azurecr.io/stacklight/mysqld-exporter:v0.16.0 |
Apache License 2.0 |
aodh |
mirantis.azurecr.io/openstack/aodh:caracal-jammy-20250404064445 |
Apache License 2.0 |
ceilometer |
mirantis.azurecr.io/openstack/ceilometer:caracal-jammy-20250404064445 |
Apache License 2.0 |
gnocchi |
mirantis.azurecr.io/openstack/gnocchi:caracal-jammy-20250404064445 |
Apache License 2.0 |
redis |
mirantis.azurecr.io/openstack/extra/redis:7.2.x-alpine-20250213163602 |
BSD 3-Clause “New” or “Revised” License |
redis-operator |
mirantis.azurecr.io/openstack/extra/redis-operator:v1.2.4-20241024111938 |
Unknown |
frr |
mirantis.azurecr.io/general/external/docker.io/frrouting/frr:v9.1.2-20250410070732 |
GPL-2.0 and LGPL-2.1 |
strongswan |
mirantis.azurecr.io/openstack/extra/strongswan:alpine-5.9.14-20250411050643 |
GPL-2.0 |
rsyslog |
mirantis.azurecr.io/openstack/extra/rsyslog:v8.2001.0-20240829110216 |
GNU General Public License v3 |
descheduler |
mirantis.azurecr.io/openstack/extra/descheduler-20240910121701:v0.30.1-amd64-20240910114244 |
Apache License 2.0 |
nginx |
mirantis.azurecr.io/openstack/extra/nginx:1.27.2-20250213141444 |
Apache License 2.0 |
requirements |
mirantis.azurecr.io/openstack/requirements:caracal-jammy-20250404064445 |
Apache License 2.0 |
drb-controller |
mirantis.azurecr.io/openstack/extra/drb-controller:0.1.0-20250216082520 |
Mirantis Proprietary License |
stepler |
mirantis.azurecr.io/openstack/stepler:caracal-jammy-20250410080758 |
Apache License 2.0 |
placement |
mirantis.azurecr.io/openstack/placement:caracal-jammy-20250404064445 |
Apache License 2.0 |
masakari |
mirantis.azurecr.io/openstack/masakari:caracal-jammy-20250404064445 |
Apache License 2.0 |
masakari-monitors |
mirantis.azurecr.io/openstack/masakari-monitors:caracal-jammy-20250404064445 |
Apache License 2.0 |
ironic-inspector |
mirantis.azurecr.io/openstack/ironic-inspector:caracal-jammy-20250404064445 |
Apache License 2.0 |
manila |
mirantis.azurecr.io/openstack/manila:caracal-jammy-20250404064445 |
Apache License 2.0 |
MOSK 24.3.4 Tungsten Fabric 21.4 artifacts
Component |
Path |
License information for main executable programs |
|---|---|---|
Helm charts |
||
tungstenfabric-operator |
https://binary.mirantis.com/tungsten/helm/tungstenfabric-operator-0.16.12.tgz |
Mirantis Proprietary License |
Docker images |
||
tungstenfabric-operator |
mirantis.azurecr.io/tungsten-operator/tungstenfabric-operator:0.16.12 |
Mirantis Proprietary License |
tungsten-pytest |
mirantis.azurecr.io/tungsten/tungsten-pytest:0.1-20250324105307 |
MIT License |
casskop |
mirantis.azurecr.io/tungsten-operator/casskop:2.2.8-mira |
Apache License 2.0 |
cassandra-bootstrap |
mirantis.azurecr.io/tungsten/cassandra-bootstrap:0.1.21 |
Apache License 2.0 |
cassandra |
mirantis.azurecr.io/tungsten/cassandra:3.11.17 |
Apache License 2.0 |
cassandra-config-builder |
mirantis.azurecr.io/tungsten/cass-config-builder:v2-20250317171052 |
Apache License 2.0 |
rabbitmq-operator |
mirantis.azurecr.io/tungsten-operator/rabbitmq-operator:0.4.9 |
Mirantis Proprietary License |
rabbitmq |
mirantis.azurecr.io/tungsten/rabbitmq:3.11.16 |
Mozilla Public License 2.0 |
rabbitmq-exporter |
mirantis.azurecr.io/stacklight/rabbitmq-exporter:1.0.0 |
MIT License |
zookeeper-operator |
mirantis.azurecr.io/tungsten-operator/zookeeper-operator:0.2.26-mcp |
Apache License 2.0 |
zookeeper |
mirantis.azurecr.io/tungsten/zookeeper:3.8.4-20240813 |
Apache License 2.0 |
redis-operator |
mirantis.azurecr.io/tungsten-operator/redis-operator:0.4.9 |
Apache License 2.0 |
redis |
mirantis.azurecr.io/tungsten/redis:7.4.2-alpine3.21 |
BSD 3-Clause “New” or “Revised” License |
redis-exporter |
mirantis.azurecr.io/stacklight/redis_exporter:v1.66.0 |
BSD 3-Clause “New” or “Revised” License |
tf-cli |
mirantis.azurecr.io/tungsten/tf-cli:0.1-20250318125939 |
MIT License |
kubernetes-entrypoint |
mirantis.azurecr.io/openstack/extra/kubernetes-entrypoint:v1.0.1-94cbbf5-20250227101657 |
Apache License 2.0 |
pause |
mirantis.azurecr.io/general/external/pause:3.1 |
Apache License 2.0 |
tf-nodeinfo |
mirantis.azurecr.io/tungsten/tf-nodeinfo:0.1-20250317121025 |
MIT License |
contrail-controller-config-api |
mirantis.azurecr.io/tungsten/contrail-controller-config-api:24.3-r21.4.20250403150542 |
Apache License 2.0 |
contrail-controller-config-devicemgr |
mirantis.azurecr.io/tungsten/contrail-controller-config-devicemgr:24.3-r21.4.20250403150542 |
Apache License 2.0 |
contrail-controller-config-dnsmasq |
mirantis.azurecr.io/tungsten/contrail-controller-config-dnsmasq:24.3-r21.4.20250403150542 |
Apache License 2.0 |
contrail-controller-config-schema |
mirantis.azurecr.io/tungsten/contrail-controller-config-schema:24.3-r21.4.20250403150542 |
Apache License 2.0 |
contrail-controller-config-svcmonitor |
mirantis.azurecr.io/tungsten/contrail-controller-config-svcmonitor:24.3-r21.4.20250403150542 |
Apache License 2.0 |
contrail-controller-control-control |
mirantis.azurecr.io/tungsten/contrail-controller-control-control:24.3-r21.4.20250403150542 |
Apache License 2.0 |
contrail-controller-control-dns |
mirantis.azurecr.io/tungsten/contrail-controller-control-dns:24.3-r21.4.20250403150542 |
Apache License 2.0 |
contrail-controller-control-named |
mirantis.azurecr.io/tungsten/contrail-controller-control-named:24.3-r21.4.20250403150542 |
Apache License 2.0 |
contrail-controller-webui-job |
mirantis.azurecr.io/tungsten/contrail-controller-webui-job:24.3-r21.4.20250403150542 |
Apache License 2.0 |
contrail-controller-webui-web |
mirantis.azurecr.io/tungsten/contrail-controller-webui-web:24.3-r21.4.20250403150542 |
Apache License 2.0 |
contrail-node-init |
mirantis.azurecr.io/tungsten/contrail-node-init:21.4.20240906000000 |
Apache License 2.0 |
contrail-provisioner |
mirantis.azurecr.io/tungsten/contrail-provisioner:24.3-r21.4.20250403150542 |
Apache License 2.0 |
contrail-tools |
mirantis.azurecr.io/tungsten/contrail-tools:24.3-r21.4.20250403150542 |
Apache License 2.0 |
contrail-vrouter-agent |
mirantis.azurecr.io/tungsten/contrail-vrouter-agent:21.4.20240906000000 |
Apache License 2.0 |
contrail-vrouter-agent-dpdk |
mirantis.azurecr.io/tungsten/contrail-vrouter-agent-dpdk:21.4.20240906000000 |
Apache License 2.0 |
contrail-vrouter-kernel-build-init |
mirantis.azurecr.io/tungsten/contrail-vrouter-kernel-build-init:21.4.20240906000000 |
Apache License 2.0 |
MOSK 24.3.4 StackLight artifacts
Component |
Path |
License information for main executable programs |
|---|---|---|
Docker images |
||
prometheus-libvirt-exporter |
mirantis.azurecr.io/stacklight/prometheus-libvirt-exporter:v0.2-20250414023016 |
Mirantis Proprietary License |
tungstenfabric-prometheus-exporter |
mirantis.azurecr.io/stacklight/tungstenfabric-prometheus-exporter:0.1-20250205153914 |
Mirantis Proprietary License |
Helm charts |
||
fluentd |
https://binary.mirantis.com/stacklight/helm/fluentd-2.0.3-mcp-52.tgz |
Mirantis Proprietary License |
prometheus-libvirt-exporter |
https://binary.mirantis.com/stacklight/helm/prometheus-libvirt-exporter-0.2.0-mcp-7.tgz |
Mirantis Proprietary License |
prometheus-tungstenfabric-exporter |
https://binary.mirantis.com/stacklight/helm/prometheus-tungstenfabric-exporter-0.2.0-mcp-7.tgz |
Mirantis Proprietary License |
The table below contains the total number of addressed unique and common CVEs by MOSK-specific component compared to the previous release version. The common CVEs are issues addressed across several images.
Product component |
CVE type |
Critical |
High |
Total |
|---|---|---|---|---|
OpenStack |
Unique |
1 |
19 |
20 |
Common |
4 |
31 |
35 |
|
Tungsten Fabric |
Unique |
0 |
4 |
4 |
Common |
0 |
5 |
5 |
Mirantis Security Portal
For the detailed list of fixed and present CVEs across the Mirantis Container Cloud and MOSK products, refer to Mirantis Security Portal.
Mirantis Container Cloud CVEs
For the number of fixed CVEs in the Mirantis Container Cloud-related components including kaas core, bare metal, Ceph, and StackLight, refer to Release notes 2.29.2: Security notes.
The following issues have been addressed in the MOSK 24.3.4 release:
[50138] [OpenStack] Resolved the issue where virtual machines could restart unexpectedly during live migration operations
This section lists MOSK known issues with workarounds for the MOSK release 24.3.4. For the known issues in the related Container Cloud release, refer to Release Notes 2.29.2.
During cluster update, the rolling reboot fails on the Tungsten Fabric cluster. To work around the issue, restart the RabbitMQ pods in the Tungsten Fabric cluster.
Fixed in MOSK 25.1 Fixed in MOSK 25.1.1
When updating to the MOSK 24.3 series, tf-config pods from the Tungsten
Fabric namespace may enter the CrashLoopBackOff state. For example:
tf-config-cs8zr 2/5 CrashLoopBackOff 676 (19s ago) 15h
tf-config-db-6zxgg 1/1 Running 44 (25m ago) 15h
tf-config-db-7k5sz 1/1 Running 43 (23m ago) 15h
tf-config-db-dlwdv 1/1 Running 43 (25m ago) 15h
tf-config-nw4tr 3/5 CrashLoopBackOff 665 (43s ago) 15h
tf-config-wzf6c 1/5 CrashLoopBackOff 680 (10s ago) 15h
tf-control-c6bnn 3/4 Running 41 (23m ago) 13h
tf-control-gsnnp 3/4 Running 42 (23m ago) 13h
tf-control-sj6fd 3/4 Running 41 (23m ago) 13h
To troubleshoot the issue, check the logs inside the tf-config API
container and the tf-cassandra pods. The following example logs
indicate that Cassandra services failed to peer with each other and
are operating independently:
Logs from the
tf-configAPI container:NoHostAvailable: ('Unable to complete the operation against any hosts', {<Host: 192.168.200.23:9042 dc1>: Unavailable('Error from server: code=1000 [Unavailable exception] message="Cannot achieve consistency level QUORUM" info={\'required_replicas\': 2, \'alive_replicas\': 1, \'consistency\': \'QUORUM\'}',)})Logs from the
tf-cassandrapods:INFO [OptionalTasks:1] 2024-09-09 08:59:36,231 CassandraRoleManager.java:419 - Setup task failed with error, rescheduling WARN [OptionalTasks:1] 2024-09-09 08:59:46,231 CassandraRoleManager.java:379 - CassandraRoleManager skipped default role setup: some nodes were not ready
To work around the issue, restart the Cassandra services in the Tungsten Fabric namespace by deleting the affected pods sequentially to establish the connection between them:
kubectl -n tf delete pod tf-cassandra-config-dc1-rack1-0
kubectl -n tf delete pod tf-cassandra-config-dc1-rack1-1
kubectl -n tf delete pod tf-cassandra-config-dc1-rack1-2
Now, all other services in the Tungsten Fabric namespace should be in
the Active state.
Fixed in MOSK 25.1 Fixed in MOSK 25.1.1
During migration of container runtime from Docker to containerd, some nodes may get stuck with the following error in LCM logs:
Orphaned Docker containers found after migration. Unable to proceed, please
check the node manually: exit status 2
The cluster is affected if orphaned containers with the k8s_ prefix are
present on the affected nodes:
docker ps -a --format '{{ .Names }}' | grep '^k8s_'
Workaround:
Inspect recent Ansible logs at
/var/log/lcm/*and make sure that the only failed task during migration isDelete running pods. If so, proceed to the next step. Otherwise, contact Mirantis support for further information.Stop and remove orphaned containers with the
k8s_prefix.Note
This action has no impact on the cluster because the nodes are already cordoned and drained as part of the maintenance window.
Fixed in MOSK 25.1 Fixed in MOSK 25.1.1
On cluster machines where any HostOSConfiguration object is targeted and
migration to containerd is applied, the machine status may be flapping
(Configure → Ready → Configure → Ready) with the
HostOSConfiguration-related Ansible tasks constantly restarting. This
occurs due to the HostOSConfiguration object state items being constantly
added and then removed from related LCMMachine objects.
To work around the issue, temporarily disable all HostOSConfiguration
objects until the issue is resolved. The expected Container Cloud release with
the issue resolution is targeted to Container Cloud 2.29.0, after the
management cluster update to the Cluster release 16.4.0.
To disable HostOSConfiguration objects:
In the
machineSelector:matchLabelssection of everyHostOSConfigurationobject, remove the corresponding label selectors for cluster machines.Wait for each
HostOSConfigurationobject status to be updated and themachinesStatesfield to be absent:kubectl -n <namespace> get hoc <hoc-name> -o jsonpath='{.status.machinesStates}'
The system response must be empty.
Once the issue is resolved in the target release, re-enable all objects using the same procedure.
During MariaDB operations on a management cluster, Pods may get stuck in continuous restarts with the following example error:
[ERROR] WSREP: Corrupt buffer header: \
addr: 0x7faec6f8e518, \
seqno: 3185219421952815104, \
size: 909455917, \
ctx: 0x557094f65038, \
flags: 11577. store: 49, \
type: 49
Workaround:
Create a backup of the
/var/lib/mysqldirectory on themariadb-serverPod.Verify that other replicas are up and ready.
Remove the
galera.cachefile for the affectedmariadb-serverPod.Remove the affected
mariadb-serverPod or wait until it is automatically restarted.
After Kubernetes restarts the Pod, the Pod clones the database in 1-2 minutes and restores the quorum.
Due to the MetalLB upstream issue, a load balancer service may not obtain the external IP address.
The issue occurs when two services share the same external IP address and have
the same externalTrafficPolicy value. Initially, the services have the
external IP address assigned and are accessible. After modifying the
externalTrafficPolicy value for both services from Cluster to
Local, the first service that has been changed remains with no external IP
address assigned. Though, the second service, which was changed later, has the
external IP assigned as expected.
To work around the issue, make a dummy change to the service object where
external IP is <pending>:
Identify the service that is stuck:
kubectl get svc -A | grep pending
Example of system response:
stacklight iam-proxy-prometheus LoadBalancer 10.233.28.196 <pending> 443:30430/TCP
Add an arbitrary label to the service that is stuck. For example:
kubectl label svc -n stacklight iam-proxy-prometheus reconcile=1
Example of system response:
service/iam-proxy-prometheus labeledVerify that the external IP was allocated to the service:
kubectl get svc -n stacklight iam-proxy-prometheus
Example of system response:
NAME TYPE CLUSTER-IP EXTERNAL-IP PORT(S) AGE iam-proxy-prometheus LoadBalancer 10.233.28.196 10.0.34.108 443:30430/TCP 12d
Sometimes, after changing the OpenStackDeployment custom resource,
it does not transition to the APPLYING state as expected.
To work around the issue, restart the rockoon` pod in the osh-system
namespace.
Fixed in MOSK 24.3.6 Fixed in MOSK 25.1.1
Due to the issue in the OpenStack Cinder online data migration code, the
migration does not process soft-deleted rows. As a result, in the presence
of non-processed soft-deleted rows, the cinder-db-sync job may fail
during upgrade from Antelope to Caracal with the error in the pod logs
similar to the following:
2024-10-24 18:55:06.678 1 ERROR cinder pymysql.err.DataError: (1265, "Data truncated for column 'use_quota' at row 24")
The issue can occur if your MOSK cluster was initially deployed with OpenStack Wallaby or earlier release, such as Victoria, Ussuri, and so on, and you do not perform the standard periodic OpenStack database cleanup procedure. As a result, unprocessed soft-deleted database rows for volumes and snapshots created before the Xena release may still be present in the database, causing the failure of the database migration.
To verify if your cluster is affected:
Use the following SQL query against the OpenStack database:
SELECT COUNT(*) FROM cinder.volumes WHERE use_quota IS NULL; SELECT COUNT(*) FROM cinder.snapshots WHERE use_quota IS NULL;
If both queries return a zero count, your cluster is not affected.
If either query returns a non-zero count, your cluster is affected.
Verify that all the affected rows are soft-deleted:
SELECT COUNT(*) FROM cinder.volumes WHERE use_quota IS NULL AND deleted=0; SELECT COUNT(*) FROM cinder.snapshots WHERE use_quota IS NULL AND deleted=0;
If either query returns a non-zero count, stop and request Mirantis support.
If both queries return zero count, proceed with the workaround.
Workaround:
Manually change the value of the use_quota field to 1, where its
value is NULL using the following SQL query:
UPDATE cinder.volumes SET use_quota=1 WHERE deleted=1 AND use_quota IS NULL;
UPDATE cinder.snapshots SET use_quota=1 WHERE deleted=1 AND use_quota IS NULL;
This action is generally harmless as it only modifies rows that are already soft-deleted, and would eventually be removed by the database cleanup.
If you have already encountered the issue and your OpenStack upgrade is stuck,
perform the database modification as described above, then re-run the
cinder-db-sync job. Once completed, the upgrade should continue as
expected.
Rebooting all Cassandra cluster TFConfig or TFAnalytics nodes, maintenance, or other circumstances that cause the Cassandra pods to start simultaneously may cause a broken Cassandra TFConfig and/or TFAnalytics cluster. In this case, Cassandra nodes do not join the ring and do not update the IPs of the neighbor nodes. As a result, the TF services cannot operate Cassandra cluster(s).
To verify that a Cassandra cluster is affected:
Run the nodetool status command specifying the config or
analytics cluster and the replica number:
kubectl -n tf exec -it tf-cassandra-<config/analytics>-dc1-rack1-<replica number> -c cassandra -- nodetool status
Example of system response with outdated IP addresses:
Datacenter: DC1
===============
Status=Up/Down
|/ State=Normal/Leaving/Joining/Moving
-- Address Load Tokens Owns (effective) Host ID Rack
DN <outdated ip> ? 256 64.9% a58343d0-1e3f-4d54-bcdf-9b9b949ca873 r1
DN <outdated ip> ? 256 69.8% 67f1d07c-8b13-4482-a2f1-77fa34e90d48 r1
Datacenter: dc1
===============
Status=Up/Down
|/ State=Normal/Leaving/Joining/Moving
-- Address Load Tokens Owns (effective) Host ID Rack
UN <actual ip> 3.84 GiB 256 65.2% 7324ebc4-577a-425f-b3de-96faac95a331 rack1
Workaround:
Manually delete the Cassandra pod from the failed config or analytics
cluster to re-initiate the bootstrap process for one of the Cassandra nodes:
kubectl -n tf delete pod tf-cassandra-<config/analytics>-dc1-rack1-<replica_num>
Occasionally, RabbitMQ instances in tf-rabbitmq pods fail to enable
the tracking_records_in_ets during the initialization process.
To work around the problem, restart the affected pods manually.
After replacing a failed Tungsten Fabric controller node as described in Replace a failed TF controller node, the first restart of the Cassandra pod on this node may cause an issue if the Cassandra node with the outdated IP address has not been removed from the cluster. Subsequent Cassandra pod restarts should not trigger this problem.
To verify if your Cassandra cluster is affected, run the nodetool status command specifying the config or analytics cluster and the replica number:
kubectl -n tf exec -it tf-cassandra-<CONFIG-OR-ANALYTICS>-dc1-rack1-<REPLICA-NUM> -c cassandra -- nodetool status
Example of the system response with outdated IP addresses:
Datacenter: dc1
===============
Status=Up/Down
|/ State=Normal/Leaving/Joining/Moving
-- Address Load Tokens Owns Host ID Rack
UN 192.168.201.144 509.43 KiB 256 ? 7e760a99-fae5-4921-b0c5-d9e6e1eca1c5 rack1
UN 192.168.50.146 534.18 KiB 256 ? 2248ea35-85d4-4887-820b-1fac4733021f rack1
UN 192.168.145.147 484.19 KiB 256 ? d988aaaa-44ae-4fec-a617-0b0a253e736d rack1
DN 192.168.145.144 481.53 KiB 256 ? c23703a1-6854-47a7-a4a2-af649d63af0c rack1
An extra node will appear in the cluster with an outdated IP address
(the IP of the terminated Cassandra pod) in the Down state.
To work around the issue, after replacing the Tungsten Fabric controller node, delete the Cassandra pod on the replaced node and remove the outdated node from the Cassandra cluster using nodetool:
kubectl -n tf exec -it tf-cassandra-<CONFIG-OR-ANALYTICS>-dc1-rack1-<REPLICA-NUM> -c cassandra -- nodetool removenode <HOST-ID>
During major or patch update of a MOSK cluster with StackLight enabled in
non-HA mode, the KubePodsCrashLooping alert may be firing for the Grafana
ReplicaSet.
Grafana relies on PostgreSQL for persistent data. In non-HA StackLight setup,
PostgreSQL becomes temporarily unavailable during updates. If Grafana loses its
database connection or fails to establish one during startup, Grafana fails
with an error. This may cause the Grafana pod to enter the CrashLoopBackOff
state. Such behavior is expected in non-HA StackLight setups. The Grafana pod
will resume normal operation after PostgreSQL is restored.
To prevent the issue, deploy StackLight in HA mode.
During update of a management or MOSK cluster with StackLight enabled in HA
mode, the OpenSearchClusterStatusCritical alert may trigger when the next
OpenSearch node restarts before shards from the previous node finish assigning.
This can push some indices to red temporarily, making them unavailable for
reads and writes, possibly causing some new logs being lost.
The issue does not affect the cluster during the update, no workaround is needed, and you can safely ignore it.
Fixed in MOSK 25.1 Fixed in MOSK 25.1.1
Tag-based filtering of logs using the tag_include parameter does not work
for the logging.externalOutputs feature when output_kind: audit is
selected.
For example, if the user wants to send only logs from the sudo
program and sets tag_include: sudo, none of the logs will be sent to an
external destination.
To work around the issue, allow forwarding of all audit logs in addition to
sudo, which include logs from sshd,
systemd-logind, and su. Instead of tag_include: sudo,
specify tag_include: '{sudo,systemd-audit}'.
When the fix applies in MOSK 25.1, filtering starts working automatically.
The incompatibility between the newly implemented session refresh in the
upstream simple-salesforce with the MOSK implementation of session refresh
in sf-notifier results in the uncontrolled growth of new logins and lack
of session reuse. The issue applies to both MOSK and management clusters.
Workaround:
The workaround to the issue is to change the sf-notifier image tag directly
in the Deployment object. This change is not persistent as this direct change
in the Deployment object will be reverted or overridden by:
Container Cloud version update (for management clusters)
Cluster release version update (for MOSK cluster)
Any
sf-notifier-related operation (for all clusters):Disable and enable
Credentials change
IDs change
Any configuration change for resources, node selector, tolerations, and log level
Once applied, this workaround must be re-applied whenever one of the above operations is performed in the cluster.
Print the currently used image:
kubectl get deployment sf-notifier -n stacklight -o jsonpath="{.spec.template.spec.containers[0].image}"
Possible results:
mirantis.azurecr.io/stacklight/sf-notifier:v0.4-20250113023013or
127.0.0.1:44301/stacklight/sf-notifier:v0.4-20250113023013Compare the
sf-notifierimage tag with the list of affected tags. If the image is affected, it has to be replaced. Otherwise, your cluster is not affected.Affected tags:
v0.4-20241021023015 v0.4-20241028023015 v0.4-20241118023015 v0.4-20241216023012 v0.4-20250113023013 v0.4-20250217023014 v0.4-20250317092322 v0.4-20250414023016
In the resulting string, replace only the tag of the affected image with the desired
v0.4-20240828023015tag. Keep the registry the same as in the original Deployment object.Resulting images from examples:
mirantis.azurecr.io/stacklight/sf-notifier:v0.4-20240828023015
or
127.0.0.1:44301/stacklight/sf-notifier:v0.4-20240828023015
Update the
sf-notifierDeployment with the new image:kubectl set image deployment/sf-notifier sf-notifier=<new image> -n stacklight
For example:
kubectl set image deployment/sf-notifier sf-notifier=mirantis.azurecr.io/stacklight/sf-notifier:v0.4-20240828023015 -n stacklight
or
kubectl set image deployment/sf-notifier sf-notifier=127.0.0.1:44301/stacklight/sf-notifier:v0.4-20240828023015 -n stacklight
Wait until the pod with the updated image is created, and check the logs. Verify that there are no errors in the logs:
kubectl logs pod/<sf-notifier pod> -n stacklight
As this change is not persistent and can be reverted by the cluster update
operation or any operation related to sf-notifier, periodically check all
clusters and if the change has been reverted, re-apply the workaround.
Optionally, you can add a custom alert that will monitor the current tag of
the sf-notifier image and will fire the alert if the tag is present in
the list of affected tags. For the custom alert configuration details,
refer to Alert configuration.
Example of a custom alert to monitor the current tag of the sf-notifier
image:
- name: stacklight
values:
...
prometheusServer:
...
customAlerts:
...
- alert: SFnotifierImageVersion
annotations:
description: "sf-notifier image has a buggy tag, please revert deployment image back to sf-notifier:v0.4-20240828023015. This should be fixed in MCC 2.29.3 / MOSK 24.3.5, remove the alert after this release upgrade."
summary: "This image might be causing too many API logins and exceeding our monthly API budget, please act immediately"
expr: >-
avg(kube_pod_container_info{container="sf-notifier",image_spec=~".*v0.4-(20241021023015|20241028023015|20241118023015|20241216023012|20250113023013|20250217023014|20250317092322|20250414023016)"})
for: 5m
labels:
service: alertmanager
severity: critical
Fixed in 2.30.0 (21.0.0 and 20.0.0)
When telegraf-ds-smart is deployed on all nodes of a large cluster with
iSCSI volumes attached, the telegraf-ds-smart pod constantly restarts with
OOM kill messages on every compute node while smartctl is trying to scan
all attached iSCSI volumes.
To work around the issue, disable telegraf-ds-smart by minimizing its
CPU and memory limits:
resources:
telegrafDsSmart:
limits:
cpu: 2m
memory: 2Mi
requests:
cpu: 1m
memory: 1Mi
For configuration details, see StackLight configuration parameters: Resource limits and Increase memory limits for cluster components.
After moving a cluster into maintenance mode using the MOSK management console, an attempt to move a worker machine into maintenance mode fails with the Only undefined workers can be in maintainance mode at the same time.
As a workaround, move worker machines into maintenance mode using CLI as described in Enable maintenance mode on a cluster and machine using CLI.
A newly created project does not display all available tabs and contains different access denied errors during first five minutes after creation.
To work around the issue, refresh the browser in five minutes after the project creation.
Fixed in 2.30.0 (21.0.0 and 20.0.0)
A compact MOSK cluster fails to be deployed through the Container Cloud web UI
due to inability to add any label to the control plane machines along with
inability to change dedicatedControlPlane: false using the web UI.
To work around the issue, manually add the required labels using CLI. Once done, the cluster deployment resumes.
This section describes the specific actions you need to complete to accurately plan and successfully perform the update. Consider this information as a supplement to the generic update procedures published in Operations Guide: Cluster update.
You can update to the 24.3.4 version from the following cluster versions:
Patch update: 24.3.3 (March 26, 2025), 24.3.2 (February 03, 2025), or 24.3.1 (January 06, 2025)
Major update: 24.3 (October 16, 2024)
For the detailed cluster update schema, refer to MOSK cluster update schema.
The following table provides details on the impact of a MOSK cluster update to a patch release within the 24.3 series.
Note
For the detailed workflow of update to a patch release, refer to Update to a patch version.
Updated component |
Impact on cloud users |
Impact on cloud workloads |
|---|---|---|
OpenStack and Tungsten Fabric |
|
Open vSwitch networking - interruption of North-South connectivity, depending on the type of virtual routers used by a workload:
Tungsten Fabric networking - no impact |
Ceph |
~1% of read operations on object storage API may fail |
IO performance degradation for Ceph-backed virtual storage devices. Pay special attention to the known issue 50566 that may affect the maintenance window. |
Host OS components |
No impact |
No impact |
- 0(1,2)
You can bypass updating components of the cloud data plane to avoid the network downtime during Update to a patch version. By using this technique, you accept the risk that some security fixes may not be applied.
The following table provides details on the update impact on a MOSK cluster.
Updated component |
Impact on cloud users |
Impact on cloud workloads |
|---|---|---|
OpenStack and Tungsten Fabric |
|
Open vSwitch networking - interruption of the North-South connectivity, depending on the type of virtual routers used by a workload:
Tungsten Fabric networking - no impact |
Ceph |
~1% of read operations on object storage API may fail |
IO performance degradation for Ceph-backed virtual storage devices |
Host OS components |
No impact |
Instance network connectivity interruption up to 5 minutes |
Host OS kernel |
No impact |
Restart of instances due to the hypervisor reboot 1 |
- 1
Host operating system needs to be rebooted for the kernel update to be applied. Configure live-migration of workloads to avoid the impact on the instances running on a host.
Before updating the cluster, be sure to review the potential issues that may arise during the process and the recommended solutions to address them, as outlined in Update known issues.
Migration of container runtime from Docker to containerd, which is implemented for existing management and managed clusters, becomes mandatory in the scope of Container Cloud 2.29.x. Otherwise, the management cluster update to 2.30.0 will be blocked.
The use of containerd allows for better Kubernetes performance and component update without pod restart when applying fixes for CVEs. For the migration procedure, refer to Migrate container runtime from Docker to containerd.
Important
Container runtime migration involves machine cordoning and draining.
24.3.5 patch
The MOSK 24.3.5 patch includes the following updates:
MKE 3.7.22
MCR 23.0.15 with
docker-ee-cliupdated to 23.0.18Security fixes for CVEs in images
Resolved product issues
Learn more about the release content and update specifics:
This section lists the components artifacts of the MOSK 24.3.5 release that includes binaries, Docker images, and Helm charts.
MOSK 24.3.5 OpenStack Helm charts
Component |
Path |
License information for main executable programs |
|---|---|---|
openstack-operator |
https://binary.mirantis.com/openstack/helm/openstack-controller/openstack-operator-0.17.27.tgz |
Mirantis Proprietary License |
MOSK 24.3.5 OpenStack Antelope binaries and Docker images
Component |
Path |
License information for main executable programs |
|---|---|---|
Binaries |
||
octavia-amphora |
https://binary.mirantis.com/openstack/bin/octavia/amphora-x64-haproxy-antelope-20250510093810.qcow2 |
Mirantis Proprietary License |
mirantis |
https://binary.mirantis.com/openstack/bin/horizon/mirantis-antelope-18a1377-20230817112356.tar.gz |
Mirantis Proprietary License |
kernel |
GPL-2.0 |
|
initramfs |
https://binary.mirantis.com/openstack/bin/ironic/tinyipa/tinyipa-stable-antelope-20240213233421.gz |
GPL-2.0 |
service-image |
https://binary.mirantis.com/openstack/bin/manila/manila-service-image-20241024092252.qcow2 |
Mirantis Proprietary License |
Docker images |
||
keystone |
mirantis.azurecr.io/openstack/keystone:antelope-jammy-20250510090605 |
Apache License 2.0 |
heat |
mirantis.azurecr.io/openstack/heat:antelope-jammy-20250510090605 |
Apache License 2.0 |
glance |
mirantis.azurecr.io/openstack/glance:antelope-jammy-20250510090605 |
Apache License 2.0 |
cinder |
mirantis.azurecr.io/openstack/cinder:antelope-jammy-20250510090605 |
Apache License 2.0 |
osprober |
mirantis.azurecr.io/openstack/osprober:0.0.1-8748745 |
Apache License 2.0 |
neutron |
mirantis.azurecr.io/openstack/neutron:antelope-jammy-20250510090605 |
Apache License 2.0 |
nova |
mirantis.azurecr.io/openstack/nova:antelope-jammy-20250510090605 |
Apache License 2.0 |
horizon |
mirantis.azurecr.io/openstack/horizon:antelope-jammy-20250510090605 |
Apache License 2.0 |
tempest |
mirantis.azurecr.io/openstack/tempest:antelope-jammy-20250510090605 |
Apache License 2.0 |
octavia |
mirantis.azurecr.io/openstack/octavia:antelope-jammy-20250510090605 |
Apache License 2.0 |
designate |
mirantis.azurecr.io/openstack/designate:antelope-jammy-20250510090605 |
Apache License 2.0 |
ironic |
mirantis.azurecr.io/openstack/ironic:antelope-jammy-20250510090605 |
Apache License 2.0 |
barbican |
mirantis.azurecr.io/openstack/barbican:antelope-jammy-20250510090605 |
Apache License 2.0 |
libvirt |
mirantis.azurecr.io/general/libvirt:8.0.x-jammy-reef-20250419095835 |
LGPL-2.1 License |
pause |
mirantis.azurecr.io/general/external/pause:3.1 |
Apache License 2.0 |
openvswitch |
mirantis.azurecr.io/general/openvswitch:2.17-jammy-20250408072712 |
Apache License 2.0 |
openvswitch-dpdk |
mirantis.azurecr.io/general/openvswitch-dpdk:2.17-jammy-20250408072712 |
Apache License 2.0 |
openstack-tools |
mirantis.azurecr.io/openstack/openstack-tools:antelope-jammy-20250510090605 |
Apache License 2.0 |
rabbitmq |
mirantis.azurecr.io/openstack/extra/rabbitmq:3.12.12-jammy-20240829072728 |
Mozilla Public License 2.0 |
rabbitmq-management |
mirantis.azurecr.io/openstack/extra/rabbitmq-management:3.12.12-jammy-20240829072728 |
Mozilla Public License 2.0 |
kubernetes-entrypoint |
mirantis.azurecr.io/openstack/extra/kubernetes-entrypoint:v1.0.1-94cbbf5-20250227101657 |
Apache License 2.0 |
memcached |
mirantis.azurecr.io/general/memcached:v1.6.38-alpine-20250328111424 |
BSD 3-Clause “New” or “Revised” License |
etcd |
mirantis.azurecr.io/openstack/extra/etcd:v3.5.21-alpine-20250421162920 |
Apache License 2.0 |
powerdns |
mirantis.azurecr.io/openstack/extra/powerdns:4.8-alpine-20250422152737 |
GPL-2.0 License |
nginx-ingress-controller |
mirantis.azurecr.io/openstack/extra/nginx-ingress-controller:1.11.5-alpine-20250411051037 |
Apache License 2.0 |
tls-proxy |
mirantis.azurecr.io/openstack/tls-proxy:jammy-fipster-1.0.0.dev2 |
Mirantis Proprietary License |
defaultbackend |
mirantis.azurecr.io/openstack/extra/defaultbackend:v1.19.2-77af1ef-20240910090142 |
Apache License 2.0 |
mariadb |
mirantis.azurecr.io/general/mariadb:10.6.20-jammy-20250218081722 |
GPLv2, LGPLv2.1 (client libraries) |
rabbitmq-exporter |
mirantis.azurecr.io/stacklight/rabbitmq-exporter:1.0.0 |
MIT License |
memcached-exporter |
mirantis.azurecr.io/stacklight/memcached-exporter:v0.15.0 |
Apache License 2.0 |
prometheus-mysql-exporter |
mirantis.azurecr.io/stacklight/mysqld-exporter:v0.16.0 |
Apache License 2.0 |
aodh |
mirantis.azurecr.io/openstack/aodh:antelope-jammy-20250510090605 |
Apache License 2.0 |
ceilometer |
mirantis.azurecr.io/openstack/ceilometer:antelope-jammy-20250510090605 |
Apache License 2.0 |
gnocchi |
mirantis.azurecr.io/openstack/gnocchi:antelope-jammy-20250510090605 |
Apache License 2.0 |
redis |
mirantis.azurecr.io/openstack/extra/redis:7.2.x-alpine-20250213163602 |
BSD 3-Clause “New” or “Revised” License |
redis-operator |
mirantis.azurecr.io/openstack/extra/redis-operator:v1.2.4-20241024111938 |
Apache License 2.0 |
frr |
mirantis.azurecr.io/general/external/docker.io/frrouting/frr:v9.1.2-20250410070732 |
GPL-2.0 and LGPL-2.1 |
strongswan |
mirantis.azurecr.io/openstack/extra/strongswan:alpine-5.9.14-20250421162917 |
GPL-2.0 |
rsyslog |
mirantis.azurecr.io/openstack/extra/rsyslog:v8.2001.0-20240829110216 |
GNU General Public License v3 |
descheduler |
mirantis.azurecr.io/openstack/extra/descheduler-20250422051959:v0.32.2-amd64-20250418101136 |
Apache License 2.0 |
nginx |
mirantis.azurecr.io/openstack/extra/nginx:1.27.2-20250213141444 |
Apache License 2.0 |
requirements |
mirantis.azurecr.io/openstack/requirements:antelope-jammy-20250510090605 |
Apache License 2.0 |
drb-controller |
mirantis.azurecr.io/openstack/extra/drb-controller:0.1.0-20250216082520 |
Mirantis Proprietary License |
stepler |
mirantis.azurecr.io/openstack/stepler:antelope-jammy-20250415171202 |
Apache License 2.0 |
placement |
mirantis.azurecr.io/openstack/placement:antelope-jammy-20250510090605 |
Apache License 2.0 |
masakari |
mirantis.azurecr.io/openstack/masakari:antelope-jammy-20250510090605 |
Apache License 2.0 |
masakari-monitors |
mirantis.azurecr.io/openstack/masakari-monitors:antelope-jammy-20250510090605 |
Apache License 2.0 |
ironic-inspector |
mirantis.azurecr.io/openstack/ironic-inspector:antelope-jammy-20250510090605 |
Apache License 2.0 |
manila |
mirantis.azurecr.io/openstack/manila:antelope-jammy-20250510090605 |
Apache License 2.0 |
MOSK 24.3.5 OpenStack Caracal binaries and Docker images
Component |
Path |
License information for main executable programs |
|---|---|---|
Binaries |
||
octavia-amphora |
https://binary.mirantis.com/openstack/bin/octavia/amphora-x64-haproxy-caracal-20250510093025.qcow2 |
Mirantis Proprietary License |
mirantis |
https://binary.mirantis.com/openstack/bin/horizon/mirantis-caracal-1f6ade2-20240408162450.tar.gz |
Mirantis Proprietary License |
kernel |
GPL-2.0 |
|
initramfs |
https://binary.mirantis.com/openstack/bin/ironic/tinyipa/tinyipa-stable-caracal-20240523065213.gz |
GPL-2.0 |
service-image |
https://binary.mirantis.com/openstack/bin/manila/manila-service-image-20241024092252.qcow2 |
Mirantis Proprietary License |
Docker images |
||
keystone |
mirantis.azurecr.io/openstack/keystone:caracal-jammy-20250510090605 |
Apache License 2.0 |
heat |
mirantis.azurecr.io/openstack/heat:caracal-jammy-20250510090605 |
Apache License 2.0 |
glance |
mirantis.azurecr.io/openstack/glance:caracal-jammy-20250510090605 |
Apache License 2.0 |
cinder |
mirantis.azurecr.io/openstack/cinder:caracal-jammy-20250510090605 |
Apache License 2.0 |
osprober |
mirantis.azurecr.io/openstack/osprober:0.0.1-8748745 |
Apache License 2.0 |
neutron |
mirantis.azurecr.io/openstack/neutron:caracal-jammy-20250510090605 |
Apache License 2.0 |
nova |
mirantis.azurecr.io/openstack/nova:caracal-jammy-20250510090605 |
Apache License 2.0 |
horizon |
mirantis.azurecr.io/openstack/horizon:caracal-jammy-20250510090605 |
Apache License 2.0 |
tempest |
mirantis.azurecr.io/openstack/tempest:antelope-jammy-20250510090605 |
Apache License 2.0 |
octavia |
mirantis.azurecr.io/openstack/octavia:caracal-jammy-20250510090605 |
Apache License 2.0 |
designate |
mirantis.azurecr.io/openstack/designate:caracal-jammy-20250510090605 |
Apache License 2.0 |
ironic |
mirantis.azurecr.io/openstack/ironic:caracal-jammy-20250510090605 |
Apache License 2.0 |
barbican |
mirantis.azurecr.io/openstack/barbican:caracal-jammy-20250510090605 |
Apache License 2.0 |
libvirt |
mirantis.azurecr.io/general/libvirt:8.0.x-jammy-reef-20250419095835 |
LGPL-2.1 License |
pause |
mirantis.azurecr.io/general/external/pause:3.1 |
Apache License 2.0 |
openvswitch |
mirantis.azurecr.io/general/openvswitch:2.17-jammy-20250408072712 |
Apache License 2.0 |
openvswitch-dpdk |
mirantis.azurecr.io/general/openvswitch-dpdk:2.17-jammy-20250408072712 |
Apache License 2.0 |
openstack-tools |
mirantis.azurecr.io/openstack/openstack-tools:antelope-jammy-20250415072626 |
Apache License 2.0 |
rabbitmq |
mirantis.azurecr.io/openstack/extra/rabbitmq:3.12.12-jammy-20240829072728 |
Mozilla Public License 2.0 |
rabbitmq-management |
mirantis.azurecr.io/openstack/extra/rabbitmq-management:3.12.12-jammy-20240829072728 |
Mozilla Public License 2.0 |
kubernetes-entrypoint |
mirantis.azurecr.io/openstack/extra/kubernetes-entrypoint:v1.0.1-94cbbf5-20250227101657 |
Apache License 2.0 |
memcached |
mirantis.azurecr.io/general/memcached:v1.6.38-alpine-20250328111424 |
BSD 3-Clause “New” or “Revised” License |
etcd |
mirantis.azurecr.io/openstack/extra/etcd:v3.5.21-alpine-20250421162920 |
Apache License 2.0 |
powerdns |
mirantis.azurecr.io/openstack/extra/powerdns:4.8-alpine-20250422152737 |
GPL-2.0 License |
nginx-ingress-controller |
mirantis.azurecr.io/openstack/extra/nginx-ingress-controller:1.11.5-alpine-20250411051037 |
Apache License 2.0 |
tls-proxy |
mirantis.azurecr.io/openstack/tls-proxy:jammy-fipster-1.0.0.dev2 |
Mirantis Proprietary License |
defaultbackend |
mirantis.azurecr.io/openstack/extra/defaultbackend:v1.19.2-77af1ef-20240910090142 |
Apache License 2.0 |
mariadb |
mirantis.azurecr.io/general/mariadb:10.6.20-jammy-20250218081722 |
GPLv2, LGPLv2.1 (client libraries) |
rabbitmq-exporter |
mirantis.azurecr.io/stacklight/rabbitmq-exporter:1.0.0 |
MIT License |
memcached-exporter |
mirantis.azurecr.io/stacklight/memcached-exporter:v0.15.0 |
Apache License 2.0 |
prometheus-mysql-exporter |
mirantis.azurecr.io/stacklight/mysqld-exporter:v0.16.0 |
Apache License 2.0 |
aodh |
mirantis.azurecr.io/openstack/aodh:caracal-jammy-20250510090605 |
Apache License 2.0 |
ceilometer |
mirantis.azurecr.io/openstack/ceilometer:caracal-jammy-20250510090605 |
Apache License 2.0 |
gnocchi |
mirantis.azurecr.io/openstack/gnocchi:caracal-jammy-20250510090605 |
Apache License 2.0 |
redis |
mirantis.azurecr.io/openstack/extra/redis:7.2.x-alpine-20250213163602 |
BSD 3-Clause “New” or “Revised” License |
redis-operator |
mirantis.azurecr.io/openstack/extra/redis-operator:v1.2.4-20241024111938 |
Apache License 2.0 |
frr |
mirantis.azurecr.io/general/external/docker.io/frrouting/frr:v9.1.2-20250410070732 |
GPL-2.0 and LGPL-2.1 |
strongswan |
mirantis.azurecr.io/openstack/extra/strongswan:alpine-5.9.14-20250421162917 |
GPL-2.0 |
rsyslog |
mirantis.azurecr.io/openstack/extra/rsyslog:v8.2001.0-20240829110216 |
GNU General Public License v3 |
descheduler |
mirantis.azurecr.io/openstack/extra/descheduler-20250422051959:v0.32.2-amd64-20250418101136 |
Apache License 2.0 |
nginx |
mirantis.azurecr.io/openstack/extra/nginx:1.27.2-20250213141444 |
Apache License 2.0 |
requirements |
mirantis.azurecr.io/openstack/requirements:caracal-jammy-20250510090605 |
Apache License 2.0 |
drb-controller |
mirantis.azurecr.io/openstack/extra/drb-controller:0.1.0-20250216082520 |
Mirantis Proprietary License |
stepler |
mirantis.azurecr.io/openstack/stepler:caracal-jammy-20250418201240 |
Apache License 2.0 |
placement |
mirantis.azurecr.io/openstack/placement:caracal-jammy-20250510090605 |
Apache License 2.0 |
masakari |
mirantis.azurecr.io/openstack/masakari:caracal-jammy-20250510090605 |
Apache License 2.0 |
masakari-monitors |
mirantis.azurecr.io/openstack/masakari-monitors:caracal-jammy-20250510090605 |
Apache License 2.0 |
ironic-inspector |
mirantis.azurecr.io/openstack/ironic-inspector:caracal-jammy-20250510090605 |
Apache License 2.0 |
manila |
mirantis.azurecr.io/openstack/manila:caracal-jammy-20250510090605 |
Apache License 2.0 |
MOSK 24.3.5 Tungsten Fabric 21.4 artifacts
Component |
Path |
License information for main executable programs |
|---|---|---|
Helm charts |
||
tungstenfabric-operator |
https://binary.mirantis.com/tungsten/helm/tungstenfabric-operator-0.16.12.tgz |
Mirantis Proprietary License |
Docker images |
||
tungstenfabric-operator |
mirantis.azurecr.io/tungsten-operator/tungstenfabric-operator:0.16.12 |
Mirantis Proprietary License |
tungsten-pytest |
mirantis.azurecr.io/tungsten/tungsten-pytest:0.1-20250324105307 |
MIT License |
casskop |
mirantis.azurecr.io/tungsten-operator/casskop:2.2.8-mira |
Apache License 2.0 |
cassandra-bootstrap |
mirantis.azurecr.io/tungsten/cassandra-bootstrap:0.1.21 |
Apache License 2.0 |
cassandra |
mirantis.azurecr.io/tungsten/cassandra:3.11.17 |
Apache License 2.0 |
cassandra-config-builder |
mirantis.azurecr.io/tungsten/cass-config-builder:v2-20250317171052 |
Apache License 2.0 |
rabbitmq-operator |
mirantis.azurecr.io/tungsten-operator/rabbitmq-operator:0.4.9 |
Mirantis Proprietary License |
rabbitmq |
mirantis.azurecr.io/tungsten/rabbitmq:3.11.16 |
Mozilla Public License 2.0 |
rabbitmq-exporter |
mirantis.azurecr.io/stacklight/rabbitmq-exporter:1.0.0 |
MIT License |
zookeeper-operator |
mirantis.azurecr.io/tungsten-operator/zookeeper-operator:0.2.26-mcp |
Apache License 2.0 |
zookeeper |
mirantis.azurecr.io/tungsten/zookeeper:3.8.4-20240813 |
Apache License 2.0 |
redis-operator |
mirantis.azurecr.io/tungsten-operator/redis-operator:0.4.9 |
Apache License 2.0 |
redis |
mirantis.azurecr.io/tungsten/redis:7.4.2-alpine3.21 |
BSD 3-Clause “New” or “Revised” License |
redis-exporter |
mirantis.azurecr.io/stacklight/redis_exporter:v1.66.0 |
BSD 3-Clause “New” or “Revised” License |
tf-cli |
mirantis.azurecr.io/tungsten/tf-cli:0.1-20250318125939 |
MIT License |
kubernetes-entrypoint |
mirantis.azurecr.io/openstack/extra/kubernetes-entrypoint:v1.0.1-94cbbf5-20250227101657 |
Apache License 2.0 |
pause |
mirantis.azurecr.io/general/external/pause:3.1 |
Apache License 2.0 |
tf-nodeinfo |
mirantis.azurecr.io/tungsten/tf-nodeinfo:0.1-20250317121025 |
MIT License |
contrail-controller-config-api |
mirantis.azurecr.io/tungsten/contrail-controller-config-api:24.3-r21.4.20250403150542 |
Apache License 2.0 |
contrail-controller-config-devicemgr |
mirantis.azurecr.io/tungsten/contrail-controller-config-devicemgr:24.3-r21.4.20250403150542 |
Apache License 2.0 |
contrail-controller-config-dnsmasq |
mirantis.azurecr.io/tungsten/contrail-controller-config-dnsmasq:24.3-r21.4.20250403150542 |
Apache License 2.0 |
contrail-controller-config-schema |
mirantis.azurecr.io/tungsten/contrail-controller-config-schema:24.3-r21.4.20250403150542 |
Apache License 2.0 |
contrail-controller-config-svcmonitor |
mirantis.azurecr.io/tungsten/contrail-controller-config-svcmonitor:24.3-r21.4.20250403150542 |
Apache License 2.0 |
contrail-controller-control-control |
mirantis.azurecr.io/tungsten/contrail-controller-control-control:24.3-r21.4.20250403150542 |
Apache License 2.0 |
contrail-controller-control-dns |
mirantis.azurecr.io/tungsten/contrail-controller-control-dns:24.3-r21.4.20250403150542 |
Apache License 2.0 |
contrail-controller-control-named |
mirantis.azurecr.io/tungsten/contrail-controller-control-named:24.3-r21.4.20250403150542 |
Apache License 2.0 |
contrail-controller-webui-job |
mirantis.azurecr.io/tungsten/contrail-controller-webui-job:24.3-r21.4.20250403150542 |
Apache License 2.0 |
contrail-controller-webui-web |
mirantis.azurecr.io/tungsten/contrail-controller-webui-web:24.3-r21.4.20250403150542 |
Apache License 2.0 |
contrail-node-init |
mirantis.azurecr.io/tungsten/contrail-node-init:21.4.20240906000000 |
Apache License 2.0 |
contrail-provisioner |
mirantis.azurecr.io/tungsten/contrail-provisioner:24.3-r21.4.20250403150542 |
Apache License 2.0 |
contrail-tools |
mirantis.azurecr.io/tungsten/contrail-tools:24.3-r21.4.20250403150542 |
Apache License 2.0 |
contrail-vrouter-agent |
mirantis.azurecr.io/tungsten/contrail-vrouter-agent:21.4.20240906000000 |
Apache License 2.0 |
contrail-vrouter-agent-dpdk |
mirantis.azurecr.io/tungsten/contrail-vrouter-agent-dpdk:21.4.20240906000000 |
Apache License 2.0 |
contrail-vrouter-kernel-build-init |
mirantis.azurecr.io/tungsten/contrail-vrouter-kernel-build-init:21.4.20240906000000 |
Apache License 2.0 |
MOSK 24.3.5 StackLight artifacts
Component |
Path |
License information for main executable programs |
|---|---|---|
Docker images |
||
prometheus-libvirt-exporter |
mirantis.azurecr.io/stacklight/prometheus-libvirt-exporter:v0.2-20250512023015 |
Mirantis Proprietary License |
tungstenfabric-prometheus-exporter |
mirantis.azurecr.io/stacklight/tungstenfabric-prometheus-exporter:0.1-20250205153914 |
Mirantis Proprietary License |
Helm charts |
||
fluentd |
https://binary.mirantis.com/stacklight/helm/fluentd-2.0.3-mcp-52.tgz |
Mirantis Proprietary License |
prometheus-libvirt-exporter |
https://binary.mirantis.com/stacklight/helm/prometheus-libvirt-exporter-0.2.0-mcp-7.tgz |
Mirantis Proprietary License |
prometheus-tungstenfabric-exporter |
https://binary.mirantis.com/stacklight/helm/prometheus-tungstenfabric-exporter-0.2.0-mcp-7.tgz |
Mirantis Proprietary License |
The table below contains the total number of addressed unique and common CVEs by MOSK-specific component compared to the previous release version. The common CVEs are issues addressed across several images.
Product component |
CVE type |
Critical |
High |
Total |
|---|---|---|---|---|
OpenStack |
Unique |
1 |
9 |
10 |
Common |
1 |
10 |
11 |
Mirantis Security Portal
For the detailed list of fixed and present CVEs across the Mirantis Container Cloud and MOSK products, refer to Mirantis Security Portal.
Mirantis Container Cloud CVEs
For the number of fixed CVEs in the Mirantis Container Cloud-related components including kaas core, bare metal, Ceph, and StackLight, refer to Release notes 2.29.3: Security notes.
The following issues have been addressed in the MOSK 24.3.5 release:
[51849] [OpenStack] Resolved the issue that caused the restart of the Open vSwitch, even with the pinned images.
[51932] [OpenStack] Resolved the issue that caused the failure of the readiness probe for Nova, Neutron, and some other OpenStack services.
[51524] [StackLight] Resolved the issue that caused
sf-notifierto create big amount of relogins to Salesforce.
This section lists MOSK known issues with workarounds for the MOSK release 24.3.5. For the known issues in the related Container Cloud release, refer to Known issues.
During cluster update, the rolling reboot fails on the Tungsten Fabric cluster. To work around the issue, restart the RabbitMQ pods in the Tungsten Fabric cluster.
Fixed in MOSK 25.1 Fixed in MOSK 25.1.1
When updating to the MOSK 24.3 series, tf-config pods from the Tungsten
Fabric namespace may enter the CrashLoopBackOff state. For example:
tf-config-cs8zr 2/5 CrashLoopBackOff 676 (19s ago) 15h
tf-config-db-6zxgg 1/1 Running 44 (25m ago) 15h
tf-config-db-7k5sz 1/1 Running 43 (23m ago) 15h
tf-config-db-dlwdv 1/1 Running 43 (25m ago) 15h
tf-config-nw4tr 3/5 CrashLoopBackOff 665 (43s ago) 15h
tf-config-wzf6c 1/5 CrashLoopBackOff 680 (10s ago) 15h
tf-control-c6bnn 3/4 Running 41 (23m ago) 13h
tf-control-gsnnp 3/4 Running 42 (23m ago) 13h
tf-control-sj6fd 3/4 Running 41 (23m ago) 13h
To troubleshoot the issue, check the logs inside the tf-config API
container and the tf-cassandra pods. The following example logs
indicate that Cassandra services failed to peer with each other and
are operating independently:
Logs from the
tf-configAPI container:NoHostAvailable: ('Unable to complete the operation against any hosts', {<Host: 192.168.200.23:9042 dc1>: Unavailable('Error from server: code=1000 [Unavailable exception] message="Cannot achieve consistency level QUORUM" info={\'required_replicas\': 2, \'alive_replicas\': 1, \'consistency\': \'QUORUM\'}',)})Logs from the
tf-cassandrapods:INFO [OptionalTasks:1] 2024-09-09 08:59:36,231 CassandraRoleManager.java:419 - Setup task failed with error, rescheduling WARN [OptionalTasks:1] 2024-09-09 08:59:46,231 CassandraRoleManager.java:379 - CassandraRoleManager skipped default role setup: some nodes were not ready
To work around the issue, restart the Cassandra services in the Tungsten Fabric namespace by deleting the affected pods sequentially to establish the connection between them:
kubectl -n tf delete pod tf-cassandra-config-dc1-rack1-0
kubectl -n tf delete pod tf-cassandra-config-dc1-rack1-1
kubectl -n tf delete pod tf-cassandra-config-dc1-rack1-2
Now, all other services in the Tungsten Fabric namespace should be in
the Active state.
Fixed in MOSK 25.1 Fixed in MOSK 25.1.1
During migration of container runtime from Docker to containerd, some nodes may get stuck with the following error in LCM logs:
Orphaned Docker containers found after migration. Unable to proceed, please
check the node manually: exit status 2
The cluster is affected if orphaned containers with the k8s_ prefix are
present on the affected nodes:
docker ps -a --format '{{ .Names }}' | grep '^k8s_'
Workaround:
Inspect recent Ansible logs at
/var/log/lcm/*and make sure that the only failed task during migration isDelete running pods. If so, proceed to the next step. Otherwise, contact Mirantis support for further information.Stop and remove orphaned containers with the
k8s_prefix.Note
This action has no impact on the cluster because the nodes are already cordoned and drained as part of the maintenance window.
Fixed in MOSK 25.1 Fixed in MOSK 25.1.1
On cluster machines where any HostOSConfiguration object is targeted and
migration to containerd is applied, the machine status may be flapping
(Configure → Ready → Configure → Ready) with the
HostOSConfiguration-related Ansible tasks constantly restarting. This
occurs due to the HostOSConfiguration object state items being constantly
added and then removed from related LCMMachine objects.
To work around the issue, temporarily disable all HostOSConfiguration
objects until the issue is resolved. The expected Container Cloud release with
the issue resolution is targeted to Container Cloud 2.29.0, after the
management cluster update to the Cluster release 16.4.0.
To disable HostOSConfiguration objects:
In the
machineSelector:matchLabelssection of everyHostOSConfigurationobject, remove the corresponding label selectors for cluster machines.Wait for each
HostOSConfigurationobject status to be updated and themachinesStatesfield to be absent:kubectl -n <namespace> get hoc <hoc-name> -o jsonpath='{.status.machinesStates}'
The system response must be empty.
Once the issue is resolved in the target release, re-enable all objects using the same procedure.
During MariaDB operations on a management cluster, Pods may get stuck in continuous restarts with the following example error:
[ERROR] WSREP: Corrupt buffer header: \
addr: 0x7faec6f8e518, \
seqno: 3185219421952815104, \
size: 909455917, \
ctx: 0x557094f65038, \
flags: 11577. store: 49, \
type: 49
Workaround:
Create a backup of the
/var/lib/mysqldirectory on themariadb-serverPod.Verify that other replicas are up and ready.
Remove the
galera.cachefile for the affectedmariadb-serverPod.Remove the affected
mariadb-serverPod or wait until it is automatically restarted.
After Kubernetes restarts the Pod, the Pod clones the database in 1-2 minutes and restores the quorum.
Due to the MetalLB upstream issue, a load balancer service may not obtain the external IP address.
The issue occurs when two services share the same external IP address and have
the same externalTrafficPolicy value. Initially, the services have the
external IP address assigned and are accessible. After modifying the
externalTrafficPolicy value for both services from Cluster to
Local, the first service that has been changed remains with no external IP
address assigned. Though, the second service, which was changed later, has the
external IP assigned as expected.
To work around the issue, make a dummy change to the service object where
external IP is <pending>:
Identify the service that is stuck:
kubectl get svc -A | grep pending
Example of system response:
stacklight iam-proxy-prometheus LoadBalancer 10.233.28.196 <pending> 443:30430/TCP
Add an arbitrary label to the service that is stuck. For example:
kubectl label svc -n stacklight iam-proxy-prometheus reconcile=1
Example of system response:
service/iam-proxy-prometheus labeledVerify that the external IP was allocated to the service:
kubectl get svc -n stacklight iam-proxy-prometheus
Example of system response:
NAME TYPE CLUSTER-IP EXTERNAL-IP PORT(S) AGE iam-proxy-prometheus LoadBalancer 10.233.28.196 10.0.34.108 443:30430/TCP 12d
Sometimes, after changing the OpenStackDeployment custom resource,
it does not transition to the APPLYING state as expected.
To work around the issue, restart the rockoon` pod in the osh-system
namespace.
Fixed in MOSK 24.3.6 Fixed in MOSK 25.1.1
Due to the issue in the OpenStack Cinder online data migration code, the
migration does not process soft-deleted rows. As a result, in the presence
of non-processed soft-deleted rows, the cinder-db-sync job may fail
during upgrade from Antelope to Caracal with the error in the pod logs
similar to the following:
2024-10-24 18:55:06.678 1 ERROR cinder pymysql.err.DataError: (1265, "Data truncated for column 'use_quota' at row 24")
The issue can occur if your MOSK cluster was initially deployed with OpenStack Wallaby or earlier release, such as Victoria, Ussuri, and so on, and you do not perform the standard periodic OpenStack database cleanup procedure. As a result, unprocessed soft-deleted database rows for volumes and snapshots created before the Xena release may still be present in the database, causing the failure of the database migration.
To verify if your cluster is affected:
Use the following SQL query against the OpenStack database:
SELECT COUNT(*) FROM cinder.volumes WHERE use_quota IS NULL; SELECT COUNT(*) FROM cinder.snapshots WHERE use_quota IS NULL;
If both queries return a zero count, your cluster is not affected.
If either query returns a non-zero count, your cluster is affected.
Verify that all the affected rows are soft-deleted:
SELECT COUNT(*) FROM cinder.volumes WHERE use_quota IS NULL AND deleted=0; SELECT COUNT(*) FROM cinder.snapshots WHERE use_quota IS NULL AND deleted=0;
If either query returns a non-zero count, stop and request Mirantis support.
If both queries return zero count, proceed with the workaround.
Workaround:
Manually change the value of the use_quota field to 1, where its
value is NULL using the following SQL query:
UPDATE cinder.volumes SET use_quota=1 WHERE deleted=1 AND use_quota IS NULL;
UPDATE cinder.snapshots SET use_quota=1 WHERE deleted=1 AND use_quota IS NULL;
This action is generally harmless as it only modifies rows that are already soft-deleted, and would eventually be removed by the database cleanup.
If you have already encountered the issue and your OpenStack upgrade is stuck,
perform the database modification as described above, then re-run the
cinder-db-sync job. Once completed, the upgrade should continue as
expected.
Rebooting all Cassandra cluster TFConfig or TFAnalytics nodes, maintenance, or other circumstances that cause the Cassandra pods to start simultaneously may cause a broken Cassandra TFConfig and/or TFAnalytics cluster. In this case, Cassandra nodes do not join the ring and do not update the IPs of the neighbor nodes. As a result, the TF services cannot operate Cassandra cluster(s).
To verify that a Cassandra cluster is affected:
Run the nodetool status command specifying the config or
analytics cluster and the replica number:
kubectl -n tf exec -it tf-cassandra-<config/analytics>-dc1-rack1-<replica number> -c cassandra -- nodetool status
Example of system response with outdated IP addresses:
Datacenter: DC1
===============
Status=Up/Down
|/ State=Normal/Leaving/Joining/Moving
-- Address Load Tokens Owns (effective) Host ID Rack
DN <outdated ip> ? 256 64.9% a58343d0-1e3f-4d54-bcdf-9b9b949ca873 r1
DN <outdated ip> ? 256 69.8% 67f1d07c-8b13-4482-a2f1-77fa34e90d48 r1
Datacenter: dc1
===============
Status=Up/Down
|/ State=Normal/Leaving/Joining/Moving
-- Address Load Tokens Owns (effective) Host ID Rack
UN <actual ip> 3.84 GiB 256 65.2% 7324ebc4-577a-425f-b3de-96faac95a331 rack1
Workaround:
Manually delete the Cassandra pod from the failed config or analytics
cluster to re-initiate the bootstrap process for one of the Cassandra nodes:
kubectl -n tf delete pod tf-cassandra-<config/analytics>-dc1-rack1-<replica_num>
Occasionally, RabbitMQ instances in tf-rabbitmq pods fail to enable
the tracking_records_in_ets during the initialization process.
To work around the problem, restart the affected pods manually.
After replacing a failed Tungsten Fabric controller node as described in Replace a failed TF controller node, the first restart of the Cassandra pod on this node may cause an issue if the Cassandra node with the outdated IP address has not been removed from the cluster. Subsequent Cassandra pod restarts should not trigger this problem.
To verify if your Cassandra cluster is affected, run the nodetool status command specifying the config or analytics cluster and the replica number:
kubectl -n tf exec -it tf-cassandra-<CONFIG-OR-ANALYTICS>-dc1-rack1-<REPLICA-NUM> -c cassandra -- nodetool status
Example of the system response with outdated IP addresses:
Datacenter: dc1
===============
Status=Up/Down
|/ State=Normal/Leaving/Joining/Moving
-- Address Load Tokens Owns Host ID Rack
UN 192.168.201.144 509.43 KiB 256 ? 7e760a99-fae5-4921-b0c5-d9e6e1eca1c5 rack1
UN 192.168.50.146 534.18 KiB 256 ? 2248ea35-85d4-4887-820b-1fac4733021f rack1
UN 192.168.145.147 484.19 KiB 256 ? d988aaaa-44ae-4fec-a617-0b0a253e736d rack1
DN 192.168.145.144 481.53 KiB 256 ? c23703a1-6854-47a7-a4a2-af649d63af0c rack1
An extra node will appear in the cluster with an outdated IP address
(the IP of the terminated Cassandra pod) in the Down state.
To work around the issue, after replacing the Tungsten Fabric controller node, delete the Cassandra pod on the replaced node and remove the outdated node from the Cassandra cluster using nodetool:
kubectl -n tf exec -it tf-cassandra-<CONFIG-OR-ANALYTICS>-dc1-rack1-<REPLICA-NUM> -c cassandra -- nodetool removenode <HOST-ID>
During major or patch update of a MOSK cluster with StackLight enabled in
non-HA mode, the KubePodsCrashLooping alert may be firing for the Grafana
ReplicaSet.
Grafana relies on PostgreSQL for persistent data. In non-HA StackLight setup,
PostgreSQL becomes temporarily unavailable during updates. If Grafana loses its
database connection or fails to establish one during startup, Grafana fails
with an error. This may cause the Grafana pod to enter the CrashLoopBackOff
state. Such behavior is expected in non-HA StackLight setups. The Grafana pod
will resume normal operation after PostgreSQL is restored.
To prevent the issue, deploy StackLight in HA mode.
During update of a management or MOSK cluster with StackLight enabled in HA
mode, the OpenSearchClusterStatusCritical alert may trigger when the next
OpenSearch node restarts before shards from the previous node finish assigning.
This can push some indices to red temporarily, making them unavailable for
reads and writes, possibly causing some new logs being lost.
The issue does not affect the cluster during the update, no workaround is needed, and you can safely ignore it.
Fixed in MOSK 25.1 Fixed in MOSK 25.1.1
Tag-based filtering of logs using the tag_include parameter does not work
for the logging.externalOutputs feature when output_kind: audit is
selected.
For example, if the user wants to send only logs from the sudo
program and sets tag_include: sudo, none of the logs will be sent to an
external destination.
To work around the issue, allow forwarding of all audit logs in addition to
sudo, which include logs from sshd,
systemd-logind, and su. Instead of tag_include: sudo,
specify tag_include: '{sudo,systemd-audit}'.
When the fix applies in MOSK 25.1, filtering starts working automatically.
Fixed in 2.30.0 (21.0.0 and 20.0.0)
When telegraf-ds-smart is deployed on all nodes of a large cluster with
iSCSI volumes attached, the telegraf-ds-smart pod constantly restarts with
OOM kill messages on every compute node while smartctl is trying to scan
all attached iSCSI volumes.
To work around the issue, disable telegraf-ds-smart by minimizing its
CPU and memory limits:
resources:
telegrafDsSmart:
limits:
cpu: 2m
memory: 2Mi
requests:
cpu: 1m
memory: 1Mi
For configuration details, see StackLight configuration parameters: Resource limits and Increase memory limits for cluster components.
After moving a cluster into maintenance mode using the MOSK management console, an attempt to move a worker machine into maintenance mode fails with the Only undefined workers can be in maintainance mode at the same time.
As a workaround, move worker machines into maintenance mode using CLI as described in Enable maintenance mode on a cluster and machine using CLI.
A newly created project does not display all available tabs and contains different access denied errors during first five minutes after creation.
To work around the issue, refresh the browser in five minutes after the project creation.
Fixed in 2.30.0 (21.0.0 and 20.0.0)
A compact MOSK cluster fails to be deployed through the Container Cloud web UI
due to inability to add any label to the control plane machines along with
inability to change dedicatedControlPlane: false using the web UI.
To work around the issue, manually add the required labels using CLI. Once done, the cluster deployment resumes.
This section describes the specific actions you need to complete to accurately plan and successfully perform the update. Consider this information as a supplement to the generic update procedures published in Operations Guide: Cluster update.
You can update to the 24.3.5 version from the following cluster versions:
Patch update: 24.3.4 (April 22, 2025), 24.3.3 (March 26, 2025), 24.3.2 (February 03, 2025), or 24.3.1 (January 06, 2025)
Major update: 24.3 (October 16, 2024)
For the detailed cluster update schema, refer to MOSK cluster update schema.
The following table provides details on the impact of a MOSK cluster update to a patch release within the 24.3 series.
Note
For the detailed workflow of update to a patch release, refer to Update to a patch version.
Updated component |
Impact on cloud users |
Impact on cloud workloads |
|---|---|---|
OpenStack and Tungsten Fabric |
|
Open vSwitch networking - interruption of North-South connectivity, depending on the type of virtual routers used by a workload:
Tungsten Fabric networking - no impact |
Ceph |
~1% of read operations on object storage API may fail |
IO performance degradation for Ceph-backed virtual storage devices. Pay special attention to the known issue 50566 that may affect the maintenance window. |
Host OS components |
No impact |
No impact |
- 0(1,2)
You can bypass updating components of the cloud data plane to avoid the network downtime during Update to a patch version. By using this technique, you accept the risk that some security fixes may not be applied.
The following table provides details on the impact of a MOSK cluster update to a major release.
Updated component |
Impact on cloud users |
Impact on cloud workloads |
|---|---|---|
OpenStack and Tungsten Fabric |
|
Open vSwitch networking - interruption of the North-South connectivity, depending on the type of virtual routers used by a workload:
Tungsten Fabric networking - no impact |
Ceph |
~1% of read operations on object storage API may fail |
IO performance degradation for Ceph-backed virtual storage devices |
Host OS components |
No impact |
Instance network connectivity interruption up to 5 minutes |
Host OS kernel |
No impact |
Restart of instances due to the hypervisor reboot 1 |
- 1
Host operating system needs to be rebooted for the kernel update to be applied. Configure live-migration of workloads to avoid the impact on the instances running on a host.
Before updating the cluster, be sure to review the potential issues that may arise during the process and the recommended solutions to address them, as outlined in Update known issues.
Migration of container runtime from Docker to containerd, which is implemented for existing management and managed clusters, becomes mandatory in the scope of Container Cloud 2.29.x. Otherwise, the management cluster update to 2.30.0 will be blocked.
The use of containerd allows for better Kubernetes performance and component update without pod restart when applying fixes for CVEs. For the migration procedure, refer to Migrate container runtime from Docker to containerd.
Important
Container runtime migration involves machine cordoning and draining.
24.3.6 patch
The MOSK 24.3.6 patch includes the following updates:
MKE 3.7.23
Kernel 5.15.0-140-generic
Ceph 18.2.7-2.cve
Security fixes for CVEs in images
Resolved product issues
Learn more about the release content and update specifics:
This section lists the components artifacts of the MOSK 24.3.6 release that includes binaries, Docker images, and Helm charts.
MOSK 24.3.6 OpenStack Helm charts
Component |
Path |
License information for main executable programs |
|---|---|---|
openstack-operator |
https://binary.mirantis.com/openstack/helm/openstack-controller/openstack-operator-0.17.30.tgz |
Mirantis Proprietary License |
MOSK 24.3.6 OpenStack Antelope binaries and Docker images
Component |
Path |
License information for main executable programs |
|---|---|---|
Binaries |
||
octavia-amphora |
https://binary.mirantis.com/openstack/bin/octavia/amphora-x64-haproxy-antelope-20250609101026.qcow2 |
Mirantis Proprietary License |
mirantis |
https://binary.mirantis.com/openstack/bin/horizon/mirantis-antelope-18a1377-20230817112356.tar.gz |
Mirantis Proprietary License |
kernel |
GPL-2.0 |
|
initramfs |
https://binary.mirantis.com/openstack/bin/ironic/tinyipa/tinyipa-stable-antelope-20240213233421.gz |
GPL-2.0 |
service-image |
https://binary.mirantis.com/openstack/bin/manila/manila-service-image-20241024092252.qcow2 |
Mirantis Proprietary License |
Docker images |
||
keystone |
mirantis.azurecr.io/openstack/keystone:antelope-jammy-20250609092426 |
Apache License 2.0 |
heat |
mirantis.azurecr.io/openstack/heat:antelope-jammy-20250609092426 |
Apache License 2.0 |
glance |
mirantis.azurecr.io/openstack/glance:antelope-jammy-20250609092426 |
Apache License 2.0 |
cinder |
mirantis.azurecr.io/openstack/cinder:antelope-jammy-20250609092426 |
Apache License 2.0 |
osprober |
mirantis.azurecr.io/openstack/osprober:0.0.1-8748745 |
Apache License 2.0 |
neutron |
mirantis.azurecr.io/openstack/neutron:antelope-jammy-20250609092426 |
Apache License 2.0 |
nova |
mirantis.azurecr.io/openstack/nova:antelope-jammy-20250609092426 |
Apache License 2.0 |
horizon |
mirantis.azurecr.io/openstack/horizon:antelope-jammy-20250609092426 |
Apache License 2.0 |
tempest |
mirantis.azurecr.io/openstack/tempest:antelope-jammy-20250609092426 |
Apache License 2.0 |
octavia |
mirantis.azurecr.io/openstack/octavia:antelope-jammy-20250609092426 |
Apache License 2.0 |
designate |
mirantis.azurecr.io/openstack/designate:antelope-jammy-20250609092426 |
Apache License 2.0 |
ironic |
mirantis.azurecr.io/openstack/ironic:antelope-jammy-20250609092426 |
Apache License 2.0 |
barbican |
mirantis.azurecr.io/openstack/barbican:antelope-jammy-20250609092426 |
Apache License 2.0 |
libvirt |
mirantis.azurecr.io/general/libvirt:8.0.x-jammy-reef-20250514041009 |
LGPL-2.1 License |
pause |
mirantis.azurecr.io/general/external/pause:3.1 |
Apache License 2.0 |
openvswitch |
mirantis.azurecr.io/general/openvswitch:2.17-jammy-20250408072712 |
Apache License 2.0 |
openvswitch-dpdk |
mirantis.azurecr.io/general/openvswitch-dpdk:2.17-jammy-20250408072712 |
Apache License 2.0 |
openstack-tools |
mirantis.azurecr.io/openstack/openstack-tools:antelope-jammy-20250609092426 |
Apache License 2.0 |
rabbitmq |
mirantis.azurecr.io/openstack/extra/rabbitmq:3.12.12-jammy-20240829072728 |
Mozilla Public License 2.0 |
rabbitmq-management |
mirantis.azurecr.io/openstack/extra/rabbitmq-management:3.12.12-jammy-20240829072728 |
Mozilla Public License 2.0 |
kubernetes-entrypoint |
mirantis.azurecr.io/openstack/extra/kubernetes-entrypoint:v1.0.1-94cbbf5-20250227101657 |
Apache License 2.0 |
memcached |
mirantis.azurecr.io/general/memcached:v1.6.38-alpine-20250328111424 |
BSD 3-Clause “New” or “Revised” License |
etcd |
mirantis.azurecr.io/openstack/extra/etcd:v3.5.21-alpine-20250421162920 |
Apache License 2.0 |
powerdns |
mirantis.azurecr.io/openstack/extra/powerdns:4.8-alpine-20250422152737 |
GPL-2.0 License |
nginx-ingress-controller |
mirantis.azurecr.io/openstack/extra/nginx-ingress-controller:1.11.5-alpine-20250521065429 |
Apache License 2.0 |
tls-proxy |
mirantis.azurecr.io/openstack/tls-proxy:jammy-fipster-1.0.0.dev2 |
Mirantis Proprietary License |
defaultbackend |
mirantis.azurecr.io/openstack/extra/defaultbackend:v1.19.2-77af1ef-20240910090142 |
Apache License 2.0 |
mariadb |
mirantis.azurecr.io/general/mariadb:10.6.20-jammy-20250218081722 |
GPLv2, LGPLv2.1 (client libraries) |
rabbitmq-exporter |
mirantis.azurecr.io/stacklight/rabbitmq-exporter:1.0.0 |
MIT License |
memcached-exporter |
mirantis.azurecr.io/stacklight/memcached-exporter:v0.15.0 |
Apache License 2.0 |
prometheus-mysql-exporter |
mirantis.azurecr.io/stacklight/mysqld-exporter:v0.16.0 |
Apache License 2.0 |
aodh |
mirantis.azurecr.io/openstack/aodh:antelope-jammy-20250609092426 |
Apache License 2.0 |
ceilometer |
mirantis.azurecr.io/openstack/ceilometer:antelope-jammy-20250609092426 |
Apache License 2.0 |
gnocchi |
mirantis.azurecr.io/openstack/gnocchi:antelope-jammy-20250609092426 |
Apache License 2.0 |
redis |
mirantis.azurecr.io/openstack/extra/redis:7.2.x-alpine-20250213163602 |
BSD 3-Clause “New” or “Revised” License |
redis-operator |
mirantis.azurecr.io/openstack/extra/redis-operator:v1.2.4-20241024111938 |
Apache License 2.0 |
frr |
mirantis.azurecr.io/general/external/docker.io/frrouting/frr:v9.1.2-20250410070732 |
GPL-2.0 and LGPL-2.1 |
strongswan |
mirantis.azurecr.io/openstack/extra/strongswan:alpine-5.9.14-20250421162917 |
GPL-2.0 |
rsyslog |
mirantis.azurecr.io/openstack/extra/rsyslog:v8.2001.0-20240829110216 |
GNU General Public License v3 |
descheduler |
mirantis.azurecr.io/openstack/extra/descheduler-20250422051959:v0.32.2-amd64-20250418101136 |
Apache License 2.0 |
nginx |
mirantis.azurecr.io/openstack/extra/nginx:1.27.2-20250213141444 |
Apache License 2.0 |
requirements |
mirantis.azurecr.io/openstack/requirements:antelope-jammy-20250609092426 |
Apache License 2.0 |
drb-controller |
mirantis.azurecr.io/openstack/extra/drb-controller:0.1.0-20250216082520 |
Mirantis Proprietary License |
stepler |
mirantis.azurecr.io/openstack/stepler:antelope-jammy-20250415171202 |
Apache License 2.0 |
placement |
mirantis.azurecr.io/openstack/placement:antelope-jammy-20250609092426 |
Apache License 2.0 |
masakari |
mirantis.azurecr.io/openstack/masakari:antelope-jammy-20250609092426 |
Apache License 2.0 |
masakari-monitors |
mirantis.azurecr.io/openstack/masakari-monitors:antelope-jammy-20250609092426 |
Apache License 2.0 |
ironic-inspector |
mirantis.azurecr.io/openstack/ironic-inspector:antelope-jammy-20250609092426 |
Apache License 2.0 |
manila |
mirantis.azurecr.io/openstack/manila:antelope-jammy-20250609092426 |
Apache License 2.0 |
MOSK 24.3.6 OpenStack Caracal binaries and Docker images
Component |
Path |
License information for main executable programs |
|---|---|---|
Binaries |
||
octavia-amphora |
https://binary.mirantis.com/openstack/bin/octavia/amphora-x64-haproxy-caracal-20250609121711.qcow2 |
Mirantis Proprietary License |
mirantis |
https://binary.mirantis.com/openstack/bin/horizon/mirantis-caracal-1f6ade2-20240408162450.tar.gz |
Mirantis Proprietary License |
kernel |
GPL-2.0 |
|
initramfs |
https://binary.mirantis.com/openstack/bin/ironic/tinyipa/tinyipa-stable-caracal-20240523065213.gz |
GPL-2.0 |
service-image |
https://binary.mirantis.com/openstack/bin/manila/manila-service-image-20241024092252.qcow2 |
Mirantis Proprietary License |
Docker images |
||
keystone |
mirantis.azurecr.io/openstack/keystone:caracal-jammy-20250609115514 |
Apache License 2.0 |
heat |
mirantis.azurecr.io/openstack/heat:caracal-jammy-20250609115514 |
Apache License 2.0 |
glance |
mirantis.azurecr.io/openstack/glance:caracal-jammy-20250609115514 |
Apache License 2.0 |
cinder |
mirantis.azurecr.io/openstack/cinder:caracal-jammy-20250609115514 |
Apache License 2.0 |
osprober |
mirantis.azurecr.io/openstack/osprober:0.0.1-8748745 |
Apache License 2.0 |
neutron |
mirantis.azurecr.io/openstack/neutron:caracal-jammy-20250609115514 |
Apache License 2.0 |
nova |
mirantis.azurecr.io/openstack/nova:caracal-jammy-20250609115514 |
Apache License 2.0 |
horizon |
mirantis.azurecr.io/openstack/horizon:caracal-jammy-20250609115514 |
Apache License 2.0 |
tempest |
mirantis.azurecr.io/openstack/tempest:antelope-jammy-20250609092426 |
Apache License 2.0 |
octavia |
mirantis.azurecr.io/openstack/octavia:caracal-jammy-20250609115514 |
Apache License 2.0 |
designate |
mirantis.azurecr.io/openstack/designate:caracal-jammy-20250609115514 |
Apache License 2.0 |
ironic |
mirantis.azurecr.io/openstack/ironic:caracal-jammy-20250609115514 |
Apache License 2.0 |
barbican |
mirantis.azurecr.io/openstack/barbican:caracal-jammy-20250609115514 |
Apache License 2.0 |
libvirt |
mirantis.azurecr.io/general/libvirt:8.0.x-jammy-reef-20250514041009 |
LGPL-2.1 License |
pause |
mirantis.azurecr.io/general/external/pause:3.1 |
Apache License 2.0 |
openvswitch |
mirantis.azurecr.io/general/openvswitch:2.17-jammy-20250408072712 |
Apache License 2.0 |
openvswitch-dpdk |
mirantis.azurecr.io/general/openvswitch-dpdk:2.17-jammy-20250408072712 |
Apache License 2.0 |
openstack-tools |
mirantis.azurecr.io/openstack/openstack-tools:antelope-jammy-20250415072626 |
Apache License 2.0 |
rabbitmq |
mirantis.azurecr.io/openstack/extra/rabbitmq:3.12.12-jammy-20240829072728 |
Mozilla Public License 2.0 |
rabbitmq-management |
mirantis.azurecr.io/openstack/extra/rabbitmq-management:3.12.12-jammy-20240829072728 |
Mozilla Public License 2.0 |
kubernetes-entrypoint |
mirantis.azurecr.io/openstack/extra/kubernetes-entrypoint:v1.0.1-94cbbf5-20250227101657 |
Apache License 2.0 |
memcached |
mirantis.azurecr.io/general/memcached:v1.6.38-alpine-20250328111424 |
BSD 3-Clause “New” or “Revised” License |
etcd |
mirantis.azurecr.io/openstack/extra/etcd:v3.5.21-alpine-20250421162920 |
Apache License 2.0 |
powerdns |
mirantis.azurecr.io/openstack/extra/powerdns:4.8-alpine-20250422152737 |
GPL-2.0 License |
nginx-ingress-controller |
mirantis.azurecr.io/openstack/extra/nginx-ingress-controller:1.11.5-alpine-20250521065429 |
Apache License 2.0 |
tls-proxy |
mirantis.azurecr.io/openstack/tls-proxy:jammy-fipster-1.0.0.dev2 |
Mirantis Proprietary License |
defaultbackend |
mirantis.azurecr.io/openstack/extra/defaultbackend:v1.19.2-77af1ef-20240910090142 |
Apache License 2.0 |
mariadb |
mirantis.azurecr.io/general/mariadb:10.6.20-jammy-20250218081722 |
GPLv2, LGPLv2.1 (client libraries) |
rabbitmq-exporter |
mirantis.azurecr.io/stacklight/rabbitmq-exporter:1.0.0 |
MIT License |
memcached-exporter |
mirantis.azurecr.io/stacklight/memcached-exporter:v0.15.0 |
Apache License 2.0 |
prometheus-mysql-exporter |
mirantis.azurecr.io/stacklight/mysqld-exporter:v0.16.0 |
Apache License 2.0 |
aodh |
mirantis.azurecr.io/openstack/aodh:caracal-jammy-20250609115514 |
Apache License 2.0 |
ceilometer |
mirantis.azurecr.io/openstack/ceilometer:caracal-jammy-20250609115514 |
Apache License 2.0 |
gnocchi |
mirantis.azurecr.io/openstack/gnocchi:caracal-jammy-20250609115514 |
Apache License 2.0 |
redis |
mirantis.azurecr.io/openstack/extra/redis:7.2.x-alpine-20250213163602 |
BSD 3-Clause “New” or “Revised” License |
redis-operator |
mirantis.azurecr.io/openstack/extra/redis-operator:v1.2.4-20241024111938 |
Apache License 2.0 |
frr |
mirantis.azurecr.io/general/external/docker.io/frrouting/frr:v9.1.2-20250410070732 |
GPL-2.0 and LGPL-2.1 |
strongswan |
mirantis.azurecr.io/openstack/extra/strongswan:alpine-5.9.14-20250421162917 |
GPL-2.0 |
rsyslog |
mirantis.azurecr.io/openstack/extra/rsyslog:v8.2001.0-20240829110216 |
GNU General Public License v3 |
descheduler |
mirantis.azurecr.io/openstack/extra/descheduler-20250422051959:v0.32.2-amd64-20250418101136 |
Apache License 2.0 |
nginx |
mirantis.azurecr.io/openstack/extra/nginx:1.27.2-20250213141444 |
Apache License 2.0 |
requirements |
mirantis.azurecr.io/openstack/requirements:caracal-jammy-20250609115514 |
Apache License 2.0 |
drb-controller |
mirantis.azurecr.io/openstack/extra/drb-controller:0.1.0-20250216082520 |
Mirantis Proprietary License |
stepler |
mirantis.azurecr.io/openstack/stepler:caracal-jammy-20250418201240 |
Apache License 2.0 |
placement |
mirantis.azurecr.io/openstack/placement:caracal-jammy-20250609115514 |
Apache License 2.0 |
masakari |
mirantis.azurecr.io/openstack/masakari:caracal-jammy-20250609115514 |
Apache License 2.0 |
masakari-monitors |
mirantis.azurecr.io/openstack/masakari-monitors:caracal-jammy-20250609115514 |
Apache License 2.0 |
ironic-inspector |
mirantis.azurecr.io/openstack/ironic-inspector:caracal-jammy-20250609115514 |
Apache License 2.0 |
manila |
mirantis.azurecr.io/openstack/manila:caracal-jammy-20250609115514 |
Apache License 2.0 |
MOSK 24.3.6 Tungsten Fabric 21.4 artifacts
Component |
Path |
License information for main executable programs |
|---|---|---|
Helm charts |
||
tungstenfabric-operator |
https://binary.mirantis.com/tungsten/helm/tungstenfabric-operator-0.16.14.tgz |
Mirantis Proprietary License |
Docker images |
||
tungstenfabric-operator |
mirantis.azurecr.io/tungsten-operator/tungstenfabric-operator:0.16.14 |
Mirantis Proprietary License |
tungsten-pytest |
mirantis.azurecr.io/tungsten/tungsten-pytest:0.1-20250429122611 |
MIT License |
casskop |
mirantis.azurecr.io/tungsten-operator/casskop:2.2.8-mira |
Apache License 2.0 |
cassandra-bootstrap |
mirantis.azurecr.io/tungsten/cassandra-bootstrap:0.1.22 |
Apache License 2.0 |
cassandra |
mirantis.azurecr.io/tungsten/cassandra:3.11.17 |
Apache License 2.0 |
cassandra-config-builder |
mirantis.azurecr.io/tungsten/cass-config-builder:v2-20250505091631 |
Apache License 2.0 |
rabbitmq-operator |
mirantis.azurecr.io/tungsten-operator/rabbitmq-operator:0.4.9 |
Mirantis Proprietary License |
rabbitmq |
mirantis.azurecr.io/tungsten/rabbitmq:3.11.16 |
Mozilla Public License 2.0 |
rabbitmq-exporter |
mirantis.azurecr.io/stacklight/rabbitmq-exporter:1.0.0 |
MIT License |
zookeeper-operator |
mirantis.azurecr.io/tungsten-operator/zookeeper-operator:0.2.26-mcp |
Apache License 2.0 |
zookeeper |
mirantis.azurecr.io/tungsten/zookeeper:3.8.4-20240813 |
Apache License 2.0 |
redis-operator |
mirantis.azurecr.io/tungsten-operator/redis-operator:0.4.9 |
Apache License 2.0 |
redis |
mirantis.azurecr.io/tungsten/redis:7.4.2-alpine3.21 |
BSD 3-Clause “New” or “Revised” License |
redis-exporter |
mirantis.azurecr.io/stacklight/redis_exporter:v1.66.0 |
BSD 3-Clause “New” or “Revised” License |
tf-cli |
mirantis.azurecr.io/tungsten/tf-cli:0.1-20250522085705 |
MIT License |
kubernetes-entrypoint |
mirantis.azurecr.io/openstack/extra/kubernetes-entrypoint:v1.0.1-94cbbf5-20250227101657 |
Apache License 2.0 |
pause |
mirantis.azurecr.io/general/external/pause:3.1 |
Apache License 2.0 |
tf-nodeinfo |
mirantis.azurecr.io/tungsten/tf-nodeinfo:0.1-20250317121025 |
MIT License |
contrail-controller-config-api |
mirantis.azurecr.io/tungsten/contrail-controller-config-api:24.3-r21.4.20250403150542 |
Apache License 2.0 |
contrail-controller-config-devicemgr |
mirantis.azurecr.io/tungsten/contrail-controller-config-devicemgr:24.3-r21.4.20250403150542 |
Apache License 2.0 |
contrail-controller-config-dnsmasq |
mirantis.azurecr.io/tungsten/contrail-controller-config-dnsmasq:24.3-r21.4.20250403150542 |
Apache License 2.0 |
contrail-controller-config-schema |
mirantis.azurecr.io/tungsten/contrail-controller-config-schema:24.3-r21.4.20250403150542 |
Apache License 2.0 |
contrail-controller-config-svcmonitor |
mirantis.azurecr.io/tungsten/contrail-controller-config-svcmonitor:24.3-r21.4.20250403150542 |
Apache License 2.0 |
contrail-controller-control-control |
mirantis.azurecr.io/tungsten/contrail-controller-control-control:24.3-r21.4.20250403150542 |
Apache License 2.0 |
contrail-controller-control-dns |
mirantis.azurecr.io/tungsten/contrail-controller-control-dns:24.3-r21.4.20250403150542 |
Apache License 2.0 |
contrail-controller-control-named |
mirantis.azurecr.io/tungsten/contrail-controller-control-named:24.3-r21.4.20250403150542 |
Apache License 2.0 |
contrail-controller-webui-job |
mirantis.azurecr.io/tungsten/contrail-controller-webui-job:24.3-r21.4.20250403150542 |
Apache License 2.0 |
contrail-controller-webui-web |
mirantis.azurecr.io/tungsten/contrail-controller-webui-web:24.3-r21.4.20250403150542 |
Apache License 2.0 |
contrail-node-init |
mirantis.azurecr.io/tungsten/contrail-node-init:21.4.20240906000000 |
Apache License 2.0 |
contrail-provisioner |
mirantis.azurecr.io/tungsten/contrail-provisioner:24.3-r21.4.20250403150542 |
Apache License 2.0 |
contrail-tools |
mirantis.azurecr.io/tungsten/contrail-tools:24.3-r21.4.20250403150542 |
Apache License 2.0 |
contrail-vrouter-agent |
mirantis.azurecr.io/tungsten/contrail-vrouter-agent:21.4.20240906000000 |
Apache License 2.0 |
contrail-vrouter-agent-dpdk |
mirantis.azurecr.io/tungsten/contrail-vrouter-agent-dpdk:21.4.20240906000000 |
Apache License 2.0 |
contrail-vrouter-kernel-build-init |
mirantis.azurecr.io/tungsten/contrail-vrouter-kernel-build-init:21.4.20240906000000 |
Apache License 2.0 |
MOSK 24.3.6 StackLight artifacts
Component |
Path |
License information for main executable programs |
|---|---|---|
Docker images |
||
prometheus-libvirt-exporter |
mirantis.azurecr.io/stacklight/prometheus-libvirt-exporter:v0.2-20250526023013 |
Mirantis Proprietary License |
tungstenfabric-prometheus-exporter |
mirantis.azurecr.io/stacklight/tungstenfabric-prometheus-exporter:0.1-20250205153914 |
Mirantis Proprietary License |
Helm charts |
||
fluentd |
https://binary.mirantis.com/stacklight/helm/fluentd-2.0.3-mcp-52.tgz |
Mirantis Proprietary License |
prometheus-libvirt-exporter |
https://binary.mirantis.com/stacklight/helm/prometheus-libvirt-exporter-0.2.0-mcp-7.tgz |
Mirantis Proprietary License |
prometheus-tungstenfabric-exporter |
https://binary.mirantis.com/stacklight/helm/prometheus-tungstenfabric-exporter-0.2.0-mcp-7.tgz |
Mirantis Proprietary License |
The table below contains the total number of addressed unique and common CVEs by MOSK-specific component compared to the previous release version. The common CVEs are issues addressed across several images.
Product component |
CVE type |
Critical |
High |
Total |
|---|---|---|---|---|
OpenStack |
Unique |
0 |
8 |
8 |
Common |
0 |
8 |
8 |
|
Tungsten Fabric |
Unique |
2 |
5 |
7 |
Common |
2 |
6 |
8 |
Mirantis Security Portal
For the detailed list of fixed and present CVEs across the Mirantis Container Cloud and MOSK products, refer to Mirantis Security Portal.
Mirantis Container Cloud CVEs
For the number of fixed CVEs in the Mirantis Container Cloud-related components including kaas core, bare metal, Ceph, and StackLight, refer to Release notes 2.29.4: Security notes.
The following issues have been addressed in the MOSK 24.3.6 release:
[47695] [OpenStack] Resolved the issue that caused the failure of the Cinder database sync job during upgrade of OpenStack Antelope to Caracal.
[51949] [Tungsten Fabric] Resolved the issue that caused the TF Operator to fail during conversion.
This section lists MOSK known issues with workarounds for the MOSK release 24.3.6. For the known issues in the related Container Cloud release, refer to Release Notes 2.29.4.
During cluster update, the rolling reboot fails on the Tungsten Fabric cluster. To work around the issue, restart the RabbitMQ pods in the Tungsten Fabric cluster.
Fixed in MOSK 25.1 Fixed in MOSK 25.1.1
When updating to the MOSK 24.3 series, tf-config pods from the Tungsten
Fabric namespace may enter the CrashLoopBackOff state. For example:
tf-config-cs8zr 2/5 CrashLoopBackOff 676 (19s ago) 15h
tf-config-db-6zxgg 1/1 Running 44 (25m ago) 15h
tf-config-db-7k5sz 1/1 Running 43 (23m ago) 15h
tf-config-db-dlwdv 1/1 Running 43 (25m ago) 15h
tf-config-nw4tr 3/5 CrashLoopBackOff 665 (43s ago) 15h
tf-config-wzf6c 1/5 CrashLoopBackOff 680 (10s ago) 15h
tf-control-c6bnn 3/4 Running 41 (23m ago) 13h
tf-control-gsnnp 3/4 Running 42 (23m ago) 13h
tf-control-sj6fd 3/4 Running 41 (23m ago) 13h
To troubleshoot the issue, check the logs inside the tf-config API
container and the tf-cassandra pods. The following example logs
indicate that Cassandra services failed to peer with each other and
are operating independently:
Logs from the
tf-configAPI container:NoHostAvailable: ('Unable to complete the operation against any hosts', {<Host: 192.168.200.23:9042 dc1>: Unavailable('Error from server: code=1000 [Unavailable exception] message="Cannot achieve consistency level QUORUM" info={\'required_replicas\': 2, \'alive_replicas\': 1, \'consistency\': \'QUORUM\'}',)})Logs from the
tf-cassandrapods:INFO [OptionalTasks:1] 2024-09-09 08:59:36,231 CassandraRoleManager.java:419 - Setup task failed with error, rescheduling WARN [OptionalTasks:1] 2024-09-09 08:59:46,231 CassandraRoleManager.java:379 - CassandraRoleManager skipped default role setup: some nodes were not ready
To work around the issue, restart the Cassandra services in the Tungsten Fabric namespace by deleting the affected pods sequentially to establish the connection between them:
kubectl -n tf delete pod tf-cassandra-config-dc1-rack1-0
kubectl -n tf delete pod tf-cassandra-config-dc1-rack1-1
kubectl -n tf delete pod tf-cassandra-config-dc1-rack1-2
Now, all other services in the Tungsten Fabric namespace should be in
the Active state.
Fixed in MOSK 25.1 Fixed in MOSK 25.1.1
During migration of container runtime from Docker to containerd, some nodes may get stuck with the following error in LCM logs:
Orphaned Docker containers found after migration. Unable to proceed, please
check the node manually: exit status 2
The cluster is affected if orphaned containers with the k8s_ prefix are
present on the affected nodes:
docker ps -a --format '{{ .Names }}' | grep '^k8s_'
Workaround:
Inspect recent Ansible logs at
/var/log/lcm/*and make sure that the only failed task during migration isDelete running pods. If so, proceed to the next step. Otherwise, contact Mirantis support for further information.Stop and remove orphaned containers with the
k8s_prefix.Note
This action has no impact on the cluster because the nodes are already cordoned and drained as part of the maintenance window.
Fixed in MOSK 25.1 Fixed in MOSK 25.1.1
On cluster machines where any HostOSConfiguration object is targeted and
migration to containerd is applied, the machine status may be flapping
(Configure → Ready → Configure → Ready) with the
HostOSConfiguration-related Ansible tasks constantly restarting. This
occurs due to the HostOSConfiguration object state items being constantly
added and then removed from related LCMMachine objects.
To work around the issue, temporarily disable all HostOSConfiguration
objects until the issue is resolved. The expected Container Cloud release with
the issue resolution is targeted to Container Cloud 2.29.0, after the
management cluster update to the Cluster release 16.4.0.
To disable HostOSConfiguration objects:
In the
machineSelector:matchLabelssection of everyHostOSConfigurationobject, remove the corresponding label selectors for cluster machines.Wait for each
HostOSConfigurationobject status to be updated and themachinesStatesfield to be absent:kubectl -n <namespace> get hoc <hoc-name> -o jsonpath='{.status.machinesStates}'
The system response must be empty.
Once the issue is resolved in the target release, re-enable all objects using the same procedure.
During MariaDB operations on a management cluster, Pods may get stuck in continuous restarts with the following example error:
[ERROR] WSREP: Corrupt buffer header: \
addr: 0x7faec6f8e518, \
seqno: 3185219421952815104, \
size: 909455917, \
ctx: 0x557094f65038, \
flags: 11577. store: 49, \
type: 49
Workaround:
Create a backup of the
/var/lib/mysqldirectory on themariadb-serverPod.Verify that other replicas are up and ready.
Remove the
galera.cachefile for the affectedmariadb-serverPod.Remove the affected
mariadb-serverPod or wait until it is automatically restarted.
After Kubernetes restarts the Pod, the Pod clones the database in 1-2 minutes and restores the quorum.
Due to the MetalLB upstream issue, a load balancer service may not obtain the external IP address.
The issue occurs when two services share the same external IP address and have
the same externalTrafficPolicy value. Initially, the services have the
external IP address assigned and are accessible. After modifying the
externalTrafficPolicy value for both services from Cluster to
Local, the first service that has been changed remains with no external IP
address assigned. Though, the second service, which was changed later, has the
external IP assigned as expected.
To work around the issue, make a dummy change to the service object where
external IP is <pending>:
Identify the service that is stuck:
kubectl get svc -A | grep pending
Example of system response:
stacklight iam-proxy-prometheus LoadBalancer 10.233.28.196 <pending> 443:30430/TCP
Add an arbitrary label to the service that is stuck. For example:
kubectl label svc -n stacklight iam-proxy-prometheus reconcile=1
Example of system response:
service/iam-proxy-prometheus labeledVerify that the external IP was allocated to the service:
kubectl get svc -n stacklight iam-proxy-prometheus
Example of system response:
NAME TYPE CLUSTER-IP EXTERNAL-IP PORT(S) AGE iam-proxy-prometheus LoadBalancer 10.233.28.196 10.0.34.108 443:30430/TCP 12d
Sometimes, after changing the OpenStackDeployment custom resource,
it does not transition to the APPLYING state as expected.
To work around the issue, restart the rockoon` pod in the osh-system
namespace.
Rebooting all Cassandra cluster TFConfig or TFAnalytics nodes, maintenance, or other circumstances that cause the Cassandra pods to start simultaneously may cause a broken Cassandra TFConfig and/or TFAnalytics cluster. In this case, Cassandra nodes do not join the ring and do not update the IPs of the neighbor nodes. As a result, the TF services cannot operate Cassandra cluster(s).
To verify that a Cassandra cluster is affected:
Run the nodetool status command specifying the config or
analytics cluster and the replica number:
kubectl -n tf exec -it tf-cassandra-<config/analytics>-dc1-rack1-<replica number> -c cassandra -- nodetool status
Example of system response with outdated IP addresses:
Datacenter: DC1
===============
Status=Up/Down
|/ State=Normal/Leaving/Joining/Moving
-- Address Load Tokens Owns (effective) Host ID Rack
DN <outdated ip> ? 256 64.9% a58343d0-1e3f-4d54-bcdf-9b9b949ca873 r1
DN <outdated ip> ? 256 69.8% 67f1d07c-8b13-4482-a2f1-77fa34e90d48 r1
Datacenter: dc1
===============
Status=Up/Down
|/ State=Normal/Leaving/Joining/Moving
-- Address Load Tokens Owns (effective) Host ID Rack
UN <actual ip> 3.84 GiB 256 65.2% 7324ebc4-577a-425f-b3de-96faac95a331 rack1
Workaround:
Manually delete the Cassandra pod from the failed config or analytics
cluster to re-initiate the bootstrap process for one of the Cassandra nodes:
kubectl -n tf delete pod tf-cassandra-<config/analytics>-dc1-rack1-<replica_num>
Occasionally, RabbitMQ instances in tf-rabbitmq pods fail to enable
the tracking_records_in_ets during the initialization process.
To work around the problem, restart the affected pods manually.
After replacing a failed Tungsten Fabric controller node as described in Replace a failed TF controller node, the first restart of the Cassandra pod on this node may cause an issue if the Cassandra node with the outdated IP address has not been removed from the cluster. Subsequent Cassandra pod restarts should not trigger this problem.
To verify if your Cassandra cluster is affected, run the nodetool status command specifying the config or analytics cluster and the replica number:
kubectl -n tf exec -it tf-cassandra-<CONFIG-OR-ANALYTICS>-dc1-rack1-<REPLICA-NUM> -c cassandra -- nodetool status
Example of the system response with outdated IP addresses:
Datacenter: dc1
===============
Status=Up/Down
|/ State=Normal/Leaving/Joining/Moving
-- Address Load Tokens Owns Host ID Rack
UN 192.168.201.144 509.43 KiB 256 ? 7e760a99-fae5-4921-b0c5-d9e6e1eca1c5 rack1
UN 192.168.50.146 534.18 KiB 256 ? 2248ea35-85d4-4887-820b-1fac4733021f rack1
UN 192.168.145.147 484.19 KiB 256 ? d988aaaa-44ae-4fec-a617-0b0a253e736d rack1
DN 192.168.145.144 481.53 KiB 256 ? c23703a1-6854-47a7-a4a2-af649d63af0c rack1
An extra node will appear in the cluster with an outdated IP address
(the IP of the terminated Cassandra pod) in the Down state.
To work around the issue, after replacing the Tungsten Fabric controller node, delete the Cassandra pod on the replaced node and remove the outdated node from the Cassandra cluster using nodetool:
kubectl -n tf exec -it tf-cassandra-<CONFIG-OR-ANALYTICS>-dc1-rack1-<REPLICA-NUM> -c cassandra -- nodetool removenode <HOST-ID>
During major or patch update of a MOSK cluster with StackLight enabled in
non-HA mode, the KubePodsCrashLooping alert may be firing for the Grafana
ReplicaSet.
Grafana relies on PostgreSQL for persistent data. In non-HA StackLight setup,
PostgreSQL becomes temporarily unavailable during updates. If Grafana loses its
database connection or fails to establish one during startup, Grafana fails
with an error. This may cause the Grafana pod to enter the CrashLoopBackOff
state. Such behavior is expected in non-HA StackLight setups. The Grafana pod
will resume normal operation after PostgreSQL is restored.
To prevent the issue, deploy StackLight in HA mode.
During update of a management or MOSK cluster with StackLight enabled in HA
mode, the OpenSearchClusterStatusCritical alert may trigger when the next
OpenSearch node restarts before shards from the previous node finish assigning.
This can push some indices to red temporarily, making them unavailable for
reads and writes, possibly causing some new logs being lost.
The issue does not affect the cluster during the update, no workaround is needed, and you can safely ignore it.
Fixed in MOSK 25.1 Fixed in MOSK 25.1.1
Tag-based filtering of logs using the tag_include parameter does not work
for the logging.externalOutputs feature when output_kind: audit is
selected.
For example, if the user wants to send only logs from the sudo
program and sets tag_include: sudo, none of the logs will be sent to an
external destination.
To work around the issue, allow forwarding of all audit logs in addition to
sudo, which include logs from sshd,
systemd-logind, and su. Instead of tag_include: sudo,
specify tag_include: '{sudo,systemd-audit}'.
When the fix applies in MOSK 25.1, filtering starts working automatically.
Fixed in 2.30.0 (21.0.0 and 20.0.0)
When telegraf-ds-smart is deployed on all nodes of a large cluster with
iSCSI volumes attached, the telegraf-ds-smart pod constantly restarts with
OOM kill messages on every compute node while smartctl is trying to scan
all attached iSCSI volumes.
To work around the issue, disable telegraf-ds-smart by minimizing its
CPU and memory limits:
resources:
telegrafDsSmart:
limits:
cpu: 2m
memory: 2Mi
requests:
cpu: 1m
memory: 1Mi
For configuration details, see StackLight configuration parameters: Resource limits and Increase memory limits for cluster components.
After moving a cluster into maintenance mode using the MOSK management console, an attempt to move a worker machine into maintenance mode fails with the Only undefined workers can be in maintainance mode at the same time.
As a workaround, move worker machines into maintenance mode using CLI as described in Enable maintenance mode on a cluster and machine using CLI.
A newly created project does not display all available tabs and contains different access denied errors during first five minutes after creation.
To work around the issue, refresh the browser in five minutes after the project creation.
Fixed in 2.30.0 (21.0.0 and 20.0.0)
A compact MOSK cluster fails to be deployed through the Container Cloud web UI
due to inability to add any label to the control plane machines along with
inability to change dedicatedControlPlane: false using the web UI.
To work around the issue, manually add the required labels using CLI. Once done, the cluster deployment resumes.
This section describes the specific actions you need to complete to accurately plan and successfully perform the update. Consider this information as a supplement to the generic update procedures published in Operations Guide: Cluster update.
You can update to the 24.3.6 version from the following cluster versions:
Patch update: 24.3.5 (May 20, 2025), 24.3.4 (April 22, 2025), 24.3.3 (March 26, 2025), 24.3.2 (February 03, 2025), or 24.3.1 (January 06, 2025)
Major update: 24.3 (October 16, 2024)
Note
The next patch 24.3.7 will be the last patch release in the 24.3. series. From 24.3.7, there will be a possibility to update to 25.1.1.
For the detailed cluster update schema, refer to MOSK cluster update schema.
The following table provides details on the impact of a MOSK cluster update to a patch release within the 24.3 series.
Note
For the detailed workflow of update to a patch release, refer to Update to a patch version.
Updated component |
Impact on cloud users |
Impact on cloud workloads |
|---|---|---|
OpenStack and Tungsten Fabric |
|
Open vSwitch networking - interruption of North-South connectivity, depending on the type of virtual routers used by a workload:
Tungsten Fabric networking - no impact |
Ceph |
~1% of read operations on object storage API may fail |
IO performance degradation for Ceph-backed virtual storage devices. Pay special attention to the known issue 50566 that may affect the maintenance window. |
Host OS components |
No impact |
No impact |
- 0(1,2)
You can bypass updating components of the cloud data plane to avoid the network downtime during Update to a patch version. By using this technique, you accept the risk that some security fixes may not be applied.
The following table provides details on the impact of a MOSK cluster update to a major release.
Updated component |
Impact on cloud users |
Impact on cloud workloads |
|---|---|---|
OpenStack and Tungsten Fabric |
|
Open vSwitch networking - interruption of the North-South connectivity, depending on the type of virtual routers used by a workload:
Tungsten Fabric networking - no impact |
Ceph |
~1% of read operations on object storage API may fail |
IO performance degradation for Ceph-backed virtual storage devices |
Host OS components |
No impact |
Instance network connectivity interruption up to 5 minutes |
Host OS kernel |
No impact |
Restart of instances due to the hypervisor reboot 1 |
- 1
Host operating system needs to be rebooted for the kernel update to be applied. Configure live-migration of workloads to avoid the impact on the instances running on a host.
Before updating the cluster, be sure to review the potential issues that may arise during the process and the recommended solutions to address them, as outlined in Update known issues.
Migration of container runtime from Docker to containerd, which is implemented for existing management and managed clusters, becomes mandatory in the scope of Container Cloud 2.29.x. Otherwise, the management cluster update to 2.30.0 will be blocked.
The use of containerd allows for better Kubernetes performance and component update without pod restart when applying fixes for CVEs. For the migration procedure, refer to Migrate container runtime from Docker to containerd.
Important
Container runtime migration involves machine cordoning and draining.
24.3.7 patch
The MOSK 24.3.7 patch includes the following updates:
Ubuntu Kernel 5.15.0-142-generic
Security fixes for CVEs in images
Resolved product issues
Learn more about the release content and update specifics:
This section lists the components artifacts of the MOSK 24.3.7 release that includes binaries, Docker images, and Helm charts.
MOSK 24.3.7 OpenStack Helm charts
Component |
Path |
License information for main executable programs |
|---|---|---|
openstack-operator |
https://binary.mirantis.com/openstack/helm/openstack-controller/openstack-operator-0.17.35.tgz |
Mirantis Proprietary License |
MOSK 24.3.7 OpenStack Antelope binaries and Docker images
Component |
Path |
License information for main executable programs |
|---|---|---|
Binaries |
||
octavia-amphora |
https://binary.mirantis.com/openstack/bin/octavia/amphora-x64-haproxy-antelope-20250707015824.qcow2 |
Mirantis Proprietary License |
mirantis |
https://binary.mirantis.com/openstack/bin/horizon/mirantis-antelope-18a1377-20230817112356.tar.gz |
Mirantis Proprietary License |
kernel |
GPL-2.0 |
|
initramfs |
https://binary.mirantis.com/openstack/bin/ironic/tinyipa/tinyipa-stable-antelope-20240213233421.gz |
GPL-2.0 |
service-image |
https://binary.mirantis.com/openstack/bin/manila/manila-service-image-20241024092252.qcow2 |
Mirantis Proprietary License |
Docker images |
||
keystone |
mirantis.azurecr.io/openstack/keystone:antelope-jammy-20250707013559 |
Apache License 2.0 |
heat |
mirantis.azurecr.io/openstack/heat:antelope-jammy-20250707013559 |
Apache License 2.0 |
glance |
mirantis.azurecr.io/openstack/glance:antelope-jammy-20250707013559 |
Apache License 2.0 |
cinder |
mirantis.azurecr.io/openstack/cinder:antelope-jammy-20250707013559 |
Apache License 2.0 |
osprober |
mirantis.azurecr.io/openstack/osprober:0.0.1-55e4c83 |
Unknown |
neutron |
mirantis.azurecr.io/openstack/neutron:antelope-jammy-20250707013559 |
Apache License 2.0 |
nova |
mirantis.azurecr.io/openstack/nova:antelope-jammy-20250707013559 |
Apache License 2.0 |
horizon |
mirantis.azurecr.io/openstack/horizon:antelope-jammy-20250707013559 |
Apache License 2.0 |
tempest |
mirantis.azurecr.io/openstack/tempest:antelope-jammy-20250707013559 |
Apache License 2.0 |
octavia |
mirantis.azurecr.io/openstack/octavia:antelope-jammy-20250707013559 |
Apache License 2.0 |
designate |
mirantis.azurecr.io/openstack/designate:antelope-jammy-20250707013559 |
Apache License 2.0 |
ironic |
mirantis.azurecr.io/openstack/ironic:antelope-jammy-20250707013559 |
Apache License 2.0 |
barbican |
mirantis.azurecr.io/openstack/barbican:antelope-jammy-20250707013559 |
Apache License 2.0 |
libvirt |
mirantis.azurecr.io/general/libvirt:8.0.x-jammy-reef-20250514041009 |
LGPL-2.1 License |
pause |
mirantis.azurecr.io/general/external/pause:3.1 |
Apache License 2.0 |
openvswitch |
mirantis.azurecr.io/general/openvswitch:2.17-jammy-20250408072712 |
Apache License 2.0 |
openvswitch-dpdk |
mirantis.azurecr.io/general/openvswitch-dpdk:2.17-jammy-20250408072712 |
Apache License 2.0 |
openstack-tools |
mirantis.azurecr.io/openstack/openstack-tools:antelope-jammy-20250707013559 |
Apache License 2.0 |
rabbitmq |
mirantis.azurecr.io/openstack/extra/rabbitmq:3.12.12-jammy-20240829072728 |
Mozilla Public License 2.0 |
rabbitmq-management |
mirantis.azurecr.io/openstack/extra/rabbitmq-management:3.12.12-jammy-20240829072728 |
Mozilla Public License 2.0 |
kubernetes-entrypoint |
mirantis.azurecr.io/openstack/extra/kubernetes-entrypoint:v1.0.1-94cbbf5-20250227101657 |
Apache License 2.0 |
memcached |
mirantis.azurecr.io/general/memcached:v1.6.38-alpine-20250328111424 |
BSD 3-Clause “New” or “Revised” License |
etcd |
mirantis.azurecr.io/openstack/extra/etcd:v3.5.21-alpine-20250421162920 |
Apache License 2.0 |
powerdns |
mirantis.azurecr.io/openstack/extra/powerdns:4.8-alpine-20250422152737 |
GPL-2.0 License |
nginx-ingress-controller |
mirantis.azurecr.io/openstack/extra/nginx-ingress-controller:1.11.5-alpine-20250521065429 |
Apache License 2.0 |
tls-proxy |
mirantis.azurecr.io/openstack/tls-proxy:jammy-fipster-1.0.0.dev2 |
Mirantis Proprietary License |
defaultbackend |
mirantis.azurecr.io/openstack/extra/defaultbackend:v1.19.2-77af1ef-20240910090142 |
Apache License 2.0 |
mariadb |
mirantis.azurecr.io/general/mariadb:10.6.20-jammy-20250218081722 |
GPLv2, LGPLv2.1 (client libraries) |
rabbitmq-exporter |
mirantis.azurecr.io/stacklight/rabbitmq-exporter:1.0.0 |
MIT License |
memcached-exporter |
mirantis.azurecr.io/stacklight/memcached-exporter:v0.15.0 |
Apache License 2.0 |
prometheus-mysql-exporter |
mirantis.azurecr.io/stacklight/mysqld-exporter:v0.16.0 |
Apache License 2.0 |
aodh |
mirantis.azurecr.io/openstack/aodh:antelope-jammy-20250707013559 |
Apache License 2.0 |
ceilometer |
mirantis.azurecr.io/openstack/ceilometer:antelope-jammy-20250707013559 |
Apache License 2.0 |
gnocchi |
mirantis.azurecr.io/openstack/gnocchi:antelope-jammy-20250707013559 |
Apache License 2.0 |
redis |
mirantis.azurecr.io/openstack/extra/redis:7.2.x-alpine-20250624100054 |
BSD 3-Clause “New” or “Revised” License |
redis-operator |
mirantis.azurecr.io/openstack/extra/redis-operator:v1.2.4-20241024111938 |
Unknown |
frr |
mirantis.azurecr.io/general/external/docker.io/frrouting/frr:v9.1.2-20250410070732 |
GPL-2.0 and LGPL-2.1 |
strongswan |
mirantis.azurecr.io/openstack/extra/strongswan:alpine-5.9.14-20250421162917 |
GPL-2.0 |
rsyslog |
mirantis.azurecr.io/openstack/extra/rsyslog:v8.2001.0-20240829110216 |
GNU General Public License v3 |
descheduler |
mirantis.azurecr.io/openstack/extra/descheduler-20250422051959:v0.32.2-amd64-20250418101136 |
Apache License 2.0 |
nginx |
mirantis.azurecr.io/openstack/extra/nginx:1.27.4-20250624093033 |
Apache License 2.0 |
requirements |
mirantis.azurecr.io/openstack/requirements:antelope-jammy-20250707013559 |
Apache License 2.0 |
drb-controller |
mirantis.azurecr.io/openstack/extra/drb-controller:0.1.0-20250624110441 |
Mirantis Proprietary License |
stepler |
mirantis.azurecr.io/openstack/stepler:antelope-jammy-20250415171202 |
Apache License 2.0 |
placement |
mirantis.azurecr.io/openstack/placement:antelope-jammy-20250707013559 |
Apache License 2.0 |
masakari |
mirantis.azurecr.io/openstack/masakari:antelope-jammy-20250707013559 |
Apache License 2.0 |
masakari-monitors |
mirantis.azurecr.io/openstack/masakari-monitors:antelope-jammy-20250707013559 |
Apache License 2.0 |
ironic-inspector |
mirantis.azurecr.io/openstack/ironic-inspector:antelope-jammy-20250707013559 |
Apache License 2.0 |
manila |
mirantis.azurecr.io/openstack/manila:antelope-jammy-20250707013559 |
Apache License 2.0 |
MOSK 24.3.7 OpenStack Caracal binaries and Docker images
Component |
Path |
License information for main executable programs |
|---|---|---|
Binaries |
||
octavia-amphora |
https://binary.mirantis.com/openstack/bin/octavia/amphora-x64-haproxy-caracal-20250704143551.qcow2 |
Mirantis Proprietary License |
mirantis |
https://binary.mirantis.com/openstack/bin/horizon/mirantis-caracal-1f6ade2-20240408162450.tar.gz |
Mirantis Proprietary License |
kernel |
GPL-2.0 |
|
initramfs |
https://binary.mirantis.com/openstack/bin/ironic/tinyipa/tinyipa-stable-caracal-20240523065213.gz |
GPL-2.0 |
service-image |
https://binary.mirantis.com/openstack/bin/manila/manila-service-image-20241024092252.qcow2 |
Mirantis Proprietary License |
Docker images |
||
keystone |
mirantis.azurecr.io/openstack/keystone:caracal-jammy-20250704140944 |
Apache License 2.0 |
heat |
mirantis.azurecr.io/openstack/heat:caracal-jammy-20250704140944 |
Apache License 2.0 |
glance |
mirantis.azurecr.io/openstack/glance:caracal-jammy-20250704140944 |
Apache License 2.0 |
cinder |
mirantis.azurecr.io/openstack/cinder:caracal-jammy-20250704140944 |
Apache License 2.0 |
osprober |
mirantis.azurecr.io/openstack/osprober:0.0.1-55e4c83 |
Unknown |
neutron |
mirantis.azurecr.io/openstack/neutron:caracal-jammy-20250704140944 |
Apache License 2.0 |
nova |
mirantis.azurecr.io/openstack/nova:caracal-jammy-20250704140944 |
Apache License 2.0 |
horizon |
mirantis.azurecr.io/openstack/horizon:caracal-jammy-20250704140944 |
Apache License 2.0 |
tempest |
mirantis.azurecr.io/openstack/tempest:antelope-jammy-20250707013559 |
Apache License 2.0 |
octavia |
mirantis.azurecr.io/openstack/octavia:caracal-jammy-20250704140944 |
Apache License 2.0 |
designate |
mirantis.azurecr.io/openstack/designate:caracal-jammy-20250704140944 |
Apache License 2.0 |
ironic |
mirantis.azurecr.io/openstack/ironic:caracal-jammy-20250704140944 |
Apache License 2.0 |
barbican |
mirantis.azurecr.io/openstack/barbican:caracal-jammy-20250704140944 |
Apache License 2.0 |
libvirt |
mirantis.azurecr.io/general/libvirt:8.0.x-jammy-reef-20250514041009 |
LGPL-2.1 License |
pause |
mirantis.azurecr.io/general/external/pause:3.1 |
Apache License 2.0 |
openvswitch |
mirantis.azurecr.io/general/openvswitch:2.17-jammy-20250408072712 |
Apache License 2.0 |
openvswitch-dpdk |
mirantis.azurecr.io/general/openvswitch-dpdk:2.17-jammy-20250408072712 |
Apache License 2.0 |
openstack-tools |
mirantis.azurecr.io/openstack/openstack-tools:antelope-jammy-20250707013559 |
Apache License 2.0 |
rabbitmq |
mirantis.azurecr.io/openstack/extra/rabbitmq:3.12.12-jammy-20240829072728 |
Mozilla Public License 2.0 |
rabbitmq-management |
mirantis.azurecr.io/openstack/extra/rabbitmq-management:3.12.12-jammy-20240829072728 |
Mozilla Public License 2.0 |
kubernetes-entrypoint |
mirantis.azurecr.io/openstack/extra/kubernetes-entrypoint:v1.0.1-94cbbf5-20250227101657 |
Apache License 2.0 |
memcached |
mirantis.azurecr.io/general/memcached:v1.6.38-alpine-20250328111424 |
BSD 3-Clause “New” or “Revised” License |
etcd |
mirantis.azurecr.io/openstack/extra/etcd:v3.5.21-alpine-20250421162920 |
Apache License 2.0 |
powerdns |
mirantis.azurecr.io/openstack/extra/powerdns:4.8-alpine-20250422152737 |
GPL-2.0 License |
nginx-ingress-controller |
mirantis.azurecr.io/openstack/extra/nginx-ingress-controller:1.11.5-alpine-20250521065429 |
Apache License 2.0 |
tls-proxy |
mirantis.azurecr.io/openstack/tls-proxy:jammy-fipster-1.0.0.dev2 |
Mirantis Proprietary License |
defaultbackend |
mirantis.azurecr.io/openstack/extra/defaultbackend:v1.19.2-77af1ef-20240910090142 |
Apache License 2.0 |
mariadb |
mirantis.azurecr.io/general/mariadb:10.6.20-jammy-20250218081722 |
GPLv2, LGPLv2.1 (client libraries) |
rabbitmq-exporter |
mirantis.azurecr.io/stacklight/rabbitmq-exporter:1.0.0 |
MIT License |
memcached-exporter |
mirantis.azurecr.io/stacklight/memcached-exporter:v0.15.0 |
Apache License 2.0 |
prometheus-mysql-exporter |
mirantis.azurecr.io/stacklight/mysqld-exporter:v0.16.0 |
Apache License 2.0 |
aodh |
mirantis.azurecr.io/openstack/aodh:caracal-jammy-20250704140944 |
Apache License 2.0 |
ceilometer |
mirantis.azurecr.io/openstack/ceilometer:caracal-jammy-20250704140944 |
Apache License 2.0 |
gnocchi |
mirantis.azurecr.io/openstack/gnocchi:caracal-jammy-20250704140944 |
Apache License 2.0 |
redis |
mirantis.azurecr.io/openstack/extra/redis:7.2.x-alpine-20250624100054 |
BSD 3-Clause “New” or “Revised” License |
redis-operator |
mirantis.azurecr.io/openstack/extra/redis-operator:v1.2.4-20250624100054 |
Unknown |
frr |
mirantis.azurecr.io/general/external/docker.io/frrouting/frr:v9.1.2-20250410070732 |
GPL-2.0 and LGPL-2.1 |
strongswan |
mirantis.azurecr.io/openstack/extra/strongswan:alpine-5.9.14-20250421162917 |
GPL-2.0 |
rsyslog |
mirantis.azurecr.io/openstack/extra/rsyslog:v8.2001.0-20240829110216 |
GNU General Public License v3 |
descheduler |
mirantis.azurecr.io/openstack/extra/descheduler-20250422051959:v0.32.2-amd64-20250418101136 |
Apache License 2.0 |
nginx |
mirantis.azurecr.io/openstack/extra/nginx:1.27.4-20250624093033 |
Apache License 2.0 |
requirements |
mirantis.azurecr.io/openstack/requirements:caracal-jammy-20250704140944 |
Apache License 2.0 |
drb-controller |
mirantis.azurecr.io/openstack/extra/drb-controller:0.1.0-20250624110441 |
Mirantis Proprietary License |
stepler |
mirantis.azurecr.io/openstack/stepler:caracal-jammy-20250624193837 |
Apache License 2.0 |
placement |
mirantis.azurecr.io/openstack/placement:caracal-jammy-20250704140944 |
Apache License 2.0 |
masakari |
mirantis.azurecr.io/openstack/masakari:caracal-jammy-20250704140944 |
Apache License 2.0 |
masakari-monitors |
mirantis.azurecr.io/openstack/masakari-monitors:caracal-jammy-20250704140944 |
Apache License 2.0 |
ironic-inspector |
mirantis.azurecr.io/openstack/ironic-inspector:caracal-jammy-20250704140944 |
Apache License 2.0 |
manila |
mirantis.azurecr.io/openstack/manila:caracal-jammy-20250704140944 |
Apache License 2.0 |
MOSK 24.3.7 Tungsten Fabric 21.4 artifacts
Component |
Path |
License information for main executable programs |
|---|---|---|
Helm charts |
||
tungstenfabric-operator |
https://binary.mirantis.com/tungsten/helm/tungstenfabric-operator-0.16.15.tgz |
Mirantis Proprietary License |
Docker images |
||
tungstenfabric-operator |
mirantis.azurecr.io/tungsten-operator/tungstenfabric-operator:0.16.15 |
Mirantis Proprietary License |
tungsten-pytest |
mirantis.azurecr.io/tungsten/tungsten-pytest:0.1-20250429122611 |
MIT License |
casskop |
mirantis.azurecr.io/tungsten-operator/casskop:2.2.8-mira |
Apache License 2.0 |
cassandra-bootstrap |
mirantis.azurecr.io/tungsten/cassandra-bootstrap:0.1.23 |
Apache License 2.0 |
cassandra |
mirantis.azurecr.io/tungsten/cassandra:3.11.17 |
Apache License 2.0 |
cassandra-config-builder |
mirantis.azurecr.io/tungsten/cass-config-builder:v2-20250624132518 |
Apache License 2.0 |
rabbitmq-operator |
mirantis.azurecr.io/tungsten-operator/rabbitmq-operator:0.4.9 |
Mirantis Proprietary License |
rabbitmq |
mirantis.azurecr.io/tungsten/rabbitmq:3.11.16 |
Mozilla Public License 2.0 |
rabbitmq-exporter |
mirantis.azurecr.io/stacklight/rabbitmq-exporter:1.0.0 |
MIT License |
zookeeper-operator |
mirantis.azurecr.io/tungsten-operator/zookeeper-operator:0.2.26-mcp |
Apache License 2.0 |
zookeeper |
mirantis.azurecr.io/tungsten/zookeeper:3.9.3-20250320 |
Apache License 2.0 |
redis-operator |
mirantis.azurecr.io/tungsten-operator/redis-operator:0.4.9 |
Apache License 2.0 |
redis |
mirantis.azurecr.io/tungsten/redis:7.4.2-alpine3.21 |
BSD 3-Clause “New” or “Revised” License |
redis-exporter |
mirantis.azurecr.io/stacklight/redis_exporter:v1.66.0 |
BSD 3-Clause “New” or “Revised” License |
tf-cli |
mirantis.azurecr.io/tungsten/tf-cli:0.1-20250624125704 |
MIT License |
kubernetes-entrypoint |
mirantis.azurecr.io/openstack/extra/kubernetes-entrypoint:v1.0.1-94cbbf5-20250227101657 |
Apache License 2.0 |
pause |
mirantis.azurecr.io/general/external/pause:3.1 |
Apache License 2.0 |
tf-nodeinfo |
mirantis.azurecr.io/tungsten/tf-nodeinfo:0.1-20250616180810 |
MIT License |
contrail-controller-config-api |
mirantis.azurecr.io/tungsten/contrail-controller-config-api:24.3-r21.4.20250620184755 |
Apache License 2.0 |
contrail-controller-config-devicemgr |
mirantis.azurecr.io/tungsten/contrail-controller-config-devicemgr:24.3-r21.4.20250620184755 |
Apache License 2.0 |
contrail-controller-config-schema |
mirantis.azurecr.io/tungsten/contrail-controller-config-schema:24.3-r21.4.20250620184755 |
Apache License 2.0 |
contrail-controller-config-svcmonitor |
mirantis.azurecr.io/tungsten/contrail-controller-config-svcmonitor:24.3-r21.4.20250620184755 |
Apache License 2.0 |
contrail-controller-control-control |
mirantis.azurecr.io/tungsten/contrail-controller-control-control:24.3-r21.4.20250620184755 |
Apache License 2.0 |
contrail-controller-control-dns |
mirantis.azurecr.io/tungsten/contrail-controller-control-dns:24.3-r21.4.20250620184755 |
Apache License 2.0 |
contrail-controller-control-named |
mirantis.azurecr.io/tungsten/contrail-controller-control-named:24.3-r21.4.20250620184755 |
Apache License 2.0 |
contrail-controller-webui-job |
mirantis.azurecr.io/tungsten/contrail-controller-webui-job:24.3-r21.4.20250620184755 |
Apache License 2.0 |
contrail-controller-webui-web |
mirantis.azurecr.io/tungsten/contrail-controller-webui-web:24.3-r21.4.20250620184755 |
Apache License 2.0 |
contrail-node-init |
mirantis.azurecr.io/tungsten/contrail-node-init:24.3-r21.4.20250620184755 |
Apache License 2.0 |
contrail-provisioner |
mirantis.azurecr.io/tungsten/contrail-provisioner:24.3-r21.4.20250620184755 |
Apache License 2.0 |
contrail-tools |
mirantis.azurecr.io/tungsten/contrail-tools:24.3-r21.4.20250620184755 |
Apache License 2.0 |
contrail-vrouter-agent |
mirantis.azurecr.io/tungsten/contrail-vrouter-agent:24.3-r21.4.20250620184755 |
Apache License 2.0 |
contrail-vrouter-agent-dpdk |
mirantis.azurecr.io/tungsten/contrail-vrouter-agent-dpdk:24.3-r21.4.20250620184755 |
Apache License 2.0 |
contrail-vrouter-kernel-build-init |
mirantis.azurecr.io/tungsten/contrail-vrouter-kernel-build-init:24.3-r21.4.20250620184755 |
Apache License 2.0 |
MOSK 24.3.7 StackLight artifacts
Component |
Path |
License information for main executable programs |
|---|---|---|
Docker images |
||
prometheus-libvirt-exporter |
mirantis.azurecr.io/stacklight/prometheus-libvirt-exporter:v0.2-20250707023018 |
Mirantis Proprietary License |
tungstenfabric-prometheus-exporter |
mirantis.azurecr.io/stacklight/tungstenfabric-prometheus-exporter:0.1-20250205153914 |
Mirantis Proprietary License |
Helm charts |
||
fluentd |
https://binary.mirantis.com/stacklight/helm/fluentd-2.0.3-mcp-52.tgz |
Mirantis Proprietary License |
prometheus-libvirt-exporter |
https://binary.mirantis.com/stacklight/helm/prometheus-libvirt-exporter-0.2.0-mcp-7.tgz |
Mirantis Proprietary License |
prometheus-tungstenfabric-exporter |
https://binary.mirantis.com/stacklight/helm/prometheus-tungstenfabric-exporter-0.2.0-mcp-7.tgz |
Mirantis Proprietary License |
The table below contains the total number of addressed unique and common CVEs by MOSK-specific component compared to the previous release version. The common CVEs are issues addressed across several images.
Product component |
CVE type |
Critical |
High |
Total |
|---|---|---|---|---|
OpenStack |
Unique |
2 |
4 |
6 |
Common |
7 |
25 |
32 |
|
Tungsten Fabric |
Unique |
4 |
85 |
89 |
Common |
4 |
96 |
100 |
Mirantis Security Portal
For the detailed list of fixed and present CVEs across the Mirantis Container Cloud and MOSK products, refer to Mirantis Security Portal.
Mirantis Container Cloud CVEs
For the number of fixed CVEs in the Mirantis Container Cloud-related components including kaas core, bare metal, Ceph, and StackLight, refer to Release notes 2.29.5: Security notes.
The following issues have been addressed in the MOSK 24.3.7 release:
[52414] Fixed the issue that resulted in the missing status in the
nodeworkloadlockobjects for OpenStack.[52410] Fixed the issue that caused the unexpected restart of Open vSwitch pods during external proxy removal.
[52259] Fixed the issue that prevented adjusting the Kubernetes resources causing OOM on the Tungsten Fabric control nodes.
This section lists MOSK known issues with workarounds for the MOSK release 24.3.7. For the known issues in the related Container Cloud release, refer to Release Notes 2.29.5.
During cluster update, the rolling reboot fails on the Tungsten Fabric cluster. To work around the issue, restart the RabbitMQ pods in the Tungsten Fabric cluster.
Fixed in MOSK 25.1 Fixed in MOSK 25.1.1
When updating to the MOSK 24.3 series, tf-config pods from the Tungsten
Fabric namespace may enter the CrashLoopBackOff state. For example:
tf-config-cs8zr 2/5 CrashLoopBackOff 676 (19s ago) 15h
tf-config-db-6zxgg 1/1 Running 44 (25m ago) 15h
tf-config-db-7k5sz 1/1 Running 43 (23m ago) 15h
tf-config-db-dlwdv 1/1 Running 43 (25m ago) 15h
tf-config-nw4tr 3/5 CrashLoopBackOff 665 (43s ago) 15h
tf-config-wzf6c 1/5 CrashLoopBackOff 680 (10s ago) 15h
tf-control-c6bnn 3/4 Running 41 (23m ago) 13h
tf-control-gsnnp 3/4 Running 42 (23m ago) 13h
tf-control-sj6fd 3/4 Running 41 (23m ago) 13h
To troubleshoot the issue, check the logs inside the tf-config API
container and the tf-cassandra pods. The following example logs
indicate that Cassandra services failed to peer with each other and
are operating independently:
Logs from the
tf-configAPI container:NoHostAvailable: ('Unable to complete the operation against any hosts', {<Host: 192.168.200.23:9042 dc1>: Unavailable('Error from server: code=1000 [Unavailable exception] message="Cannot achieve consistency level QUORUM" info={\'required_replicas\': 2, \'alive_replicas\': 1, \'consistency\': \'QUORUM\'}',)})Logs from the
tf-cassandrapods:INFO [OptionalTasks:1] 2024-09-09 08:59:36,231 CassandraRoleManager.java:419 - Setup task failed with error, rescheduling WARN [OptionalTasks:1] 2024-09-09 08:59:46,231 CassandraRoleManager.java:379 - CassandraRoleManager skipped default role setup: some nodes were not ready
To work around the issue, restart the Cassandra services in the Tungsten Fabric namespace by deleting the affected pods sequentially to establish the connection between them:
kubectl -n tf delete pod tf-cassandra-config-dc1-rack1-0
kubectl -n tf delete pod tf-cassandra-config-dc1-rack1-1
kubectl -n tf delete pod tf-cassandra-config-dc1-rack1-2
Now, all other services in the Tungsten Fabric namespace should be in
the Active state.
Fixed in MOSK 25.1 Fixed in MOSK 25.1.1
During migration of container runtime from Docker to containerd, some nodes may get stuck with the following error in LCM logs:
Orphaned Docker containers found after migration. Unable to proceed, please
check the node manually: exit status 2
The cluster is affected if orphaned containers with the k8s_ prefix are
present on the affected nodes:
docker ps -a --format '{{ .Names }}' | grep '^k8s_'
Workaround:
Inspect recent Ansible logs at
/var/log/lcm/*and make sure that the only failed task during migration isDelete running pods. If so, proceed to the next step. Otherwise, contact Mirantis support for further information.Stop and remove orphaned containers with the
k8s_prefix.Note
This action has no impact on the cluster because the nodes are already cordoned and drained as part of the maintenance window.
Fixed in MOSK 25.1 Fixed in MOSK 25.1.1
On cluster machines where any HostOSConfiguration object is targeted and
migration to containerd is applied, the machine status may be flapping
(Configure → Ready → Configure → Ready) with the
HostOSConfiguration-related Ansible tasks constantly restarting. This
occurs due to the HostOSConfiguration object state items being constantly
added and then removed from related LCMMachine objects.
To work around the issue, temporarily disable all HostOSConfiguration
objects until the issue is resolved. The expected Container Cloud release with
the issue resolution is targeted to Container Cloud 2.29.0, after the
management cluster update to the Cluster release 16.4.0.
To disable HostOSConfiguration objects:
In the
machineSelector:matchLabelssection of everyHostOSConfigurationobject, remove the corresponding label selectors for cluster machines.Wait for each
HostOSConfigurationobject status to be updated and themachinesStatesfield to be absent:kubectl -n <namespace> get hoc <hoc-name> -o jsonpath='{.status.machinesStates}'
The system response must be empty.
Once the issue is resolved in the target release, re-enable all objects using the same procedure.
During MariaDB operations on a management cluster, Pods may get stuck in continuous restarts with the following example error:
[ERROR] WSREP: Corrupt buffer header: \
addr: 0x7faec6f8e518, \
seqno: 3185219421952815104, \
size: 909455917, \
ctx: 0x557094f65038, \
flags: 11577. store: 49, \
type: 49
Workaround:
Create a backup of the
/var/lib/mysqldirectory on themariadb-serverPod.Verify that other replicas are up and ready.
Remove the
galera.cachefile for the affectedmariadb-serverPod.Remove the affected
mariadb-serverPod or wait until it is automatically restarted.
After Kubernetes restarts the Pod, the Pod clones the database in 1-2 minutes and restores the quorum.
Due to the MetalLB upstream issue, a load balancer service may not obtain the external IP address.
The issue occurs when two services share the same external IP address and have
the same externalTrafficPolicy value. Initially, the services have the
external IP address assigned and are accessible. After modifying the
externalTrafficPolicy value for both services from Cluster to
Local, the first service that has been changed remains with no external IP
address assigned. Though, the second service, which was changed later, has the
external IP assigned as expected.
To work around the issue, make a dummy change to the service object where
external IP is <pending>:
Identify the service that is stuck:
kubectl get svc -A | grep pending
Example of system response:
stacklight iam-proxy-prometheus LoadBalancer 10.233.28.196 <pending> 443:30430/TCP
Add an arbitrary label to the service that is stuck. For example:
kubectl label svc -n stacklight iam-proxy-prometheus reconcile=1
Example of system response:
service/iam-proxy-prometheus labeledVerify that the external IP was allocated to the service:
kubectl get svc -n stacklight iam-proxy-prometheus
Example of system response:
NAME TYPE CLUSTER-IP EXTERNAL-IP PORT(S) AGE iam-proxy-prometheus LoadBalancer 10.233.28.196 10.0.34.108 443:30430/TCP 12d
Sometimes, after changing the OpenStackDeployment custom resource,
it does not transition to the APPLYING state as expected.
To work around the issue, restart the rockoon` pod in the osh-system
namespace.
Occasionally, the password rotation procedure for admin or service
credentials may incorrectly report success without actually initiating
the rotation process. This can result in unchanged credentials despite
the procedure indicating completion.
To work around the issue, restart the rotation procedure and verify that the credentials have been successfully updated.
Rebooting all Cassandra cluster TFConfig or TFAnalytics nodes, maintenance, or other circumstances that cause the Cassandra pods to start simultaneously may cause a broken Cassandra TFConfig and/or TFAnalytics cluster. In this case, Cassandra nodes do not join the ring and do not update the IPs of the neighbor nodes. As a result, the TF services cannot operate Cassandra cluster(s).
To verify that a Cassandra cluster is affected:
Run the nodetool status command specifying the config or
analytics cluster and the replica number:
kubectl -n tf exec -it tf-cassandra-<config/analytics>-dc1-rack1-<replica number> -c cassandra -- nodetool status
Example of system response with outdated IP addresses:
Datacenter: DC1
===============
Status=Up/Down
|/ State=Normal/Leaving/Joining/Moving
-- Address Load Tokens Owns (effective) Host ID Rack
DN <outdated ip> ? 256 64.9% a58343d0-1e3f-4d54-bcdf-9b9b949ca873 r1
DN <outdated ip> ? 256 69.8% 67f1d07c-8b13-4482-a2f1-77fa34e90d48 r1
Datacenter: dc1
===============
Status=Up/Down
|/ State=Normal/Leaving/Joining/Moving
-- Address Load Tokens Owns (effective) Host ID Rack
UN <actual ip> 3.84 GiB 256 65.2% 7324ebc4-577a-425f-b3de-96faac95a331 rack1
Workaround:
Manually delete the Cassandra pod from the failed config or analytics
cluster to re-initiate the bootstrap process for one of the Cassandra nodes:
kubectl -n tf delete pod tf-cassandra-<config/analytics>-dc1-rack1-<replica_num>
Occasionally, RabbitMQ instances in tf-rabbitmq pods fail to enable
the tracking_records_in_ets during the initialization process.
To work around the problem, restart the affected pods manually.
After replacing a failed Tungsten Fabric controller node as described in Replace a failed TF controller node, the first restart of the Cassandra pod on this node may cause an issue if the Cassandra node with the outdated IP address has not been removed from the cluster. Subsequent Cassandra pod restarts should not trigger this problem.
To verify if your Cassandra cluster is affected, run the nodetool status command specifying the config or analytics cluster and the replica number:
kubectl -n tf exec -it tf-cassandra-<CONFIG-OR-ANALYTICS>-dc1-rack1-<REPLICA-NUM> -c cassandra -- nodetool status
Example of the system response with outdated IP addresses:
Datacenter: dc1
===============
Status=Up/Down
|/ State=Normal/Leaving/Joining/Moving
-- Address Load Tokens Owns Host ID Rack
UN 192.168.201.144 509.43 KiB 256 ? 7e760a99-fae5-4921-b0c5-d9e6e1eca1c5 rack1
UN 192.168.50.146 534.18 KiB 256 ? 2248ea35-85d4-4887-820b-1fac4733021f rack1
UN 192.168.145.147 484.19 KiB 256 ? d988aaaa-44ae-4fec-a617-0b0a253e736d rack1
DN 192.168.145.144 481.53 KiB 256 ? c23703a1-6854-47a7-a4a2-af649d63af0c rack1
An extra node will appear in the cluster with an outdated IP address
(the IP of the terminated Cassandra pod) in the Down state.
To work around the issue, after replacing the Tungsten Fabric controller node, delete the Cassandra pod on the replaced node and remove the outdated node from the Cassandra cluster using nodetool:
kubectl -n tf exec -it tf-cassandra-<CONFIG-OR-ANALYTICS>-dc1-rack1-<REPLICA-NUM> -c cassandra -- nodetool removenode <HOST-ID>
During major or patch update of a MOSK cluster with StackLight enabled in
non-HA mode, the KubePodsCrashLooping alert may be firing for the Grafana
ReplicaSet.
Grafana relies on PostgreSQL for persistent data. In non-HA StackLight setup,
PostgreSQL becomes temporarily unavailable during updates. If Grafana loses its
database connection or fails to establish one during startup, Grafana fails
with an error. This may cause the Grafana pod to enter the CrashLoopBackOff
state. Such behavior is expected in non-HA StackLight setups. The Grafana pod
will resume normal operation after PostgreSQL is restored.
To prevent the issue, deploy StackLight in HA mode.
During update of a management or MOSK cluster with StackLight enabled in HA
mode, the OpenSearchClusterStatusCritical alert may trigger when the next
OpenSearch node restarts before shards from the previous node finish assigning.
This can push some indices to red temporarily, making them unavailable for
reads and writes, possibly causing some new logs being lost.
The issue does not affect the cluster during the update, no workaround is needed, and you can safely ignore it.
Fixed in MOSK 25.1 Fixed in MOSK 25.1.1
Tag-based filtering of logs using the tag_include parameter does not work
for the logging.externalOutputs feature when output_kind: audit is
selected.
For example, if the user wants to send only logs from the sudo
program and sets tag_include: sudo, none of the logs will be sent to an
external destination.
To work around the issue, allow forwarding of all audit logs in addition to
sudo, which include logs from sshd,
systemd-logind, and su. Instead of tag_include: sudo,
specify tag_include: '{sudo,systemd-audit}'.
When the fix applies in MOSK 25.1, filtering starts working automatically.
Fixed in 2.30.0 (21.0.0 and 20.0.0)
When telegraf-ds-smart is deployed on all nodes of a large cluster with
iSCSI volumes attached, the telegraf-ds-smart pod constantly restarts with
OOM kill messages on every compute node while smartctl is trying to scan
all attached iSCSI volumes.
To work around the issue, disable telegraf-ds-smart by minimizing its
CPU and memory limits:
resources:
telegrafDsSmart:
limits:
cpu: 2m
memory: 2Mi
requests:
cpu: 1m
memory: 1Mi
For configuration details, see StackLight configuration parameters: Resource limits and Increase memory limits for cluster components.
After moving a cluster into maintenance mode using the MOSK management console, an attempt to move a worker machine into maintenance mode fails with the Only undefined workers can be in maintainance mode at the same time.
As a workaround, move worker machines into maintenance mode using CLI as described in Enable maintenance mode on a cluster and machine using CLI.
A newly created project does not display all available tabs and contains different access denied errors during first five minutes after creation.
To work around the issue, refresh the browser in five minutes after the project creation.
Fixed in 2.30.0 (21.0.0 and 20.0.0)
A compact MOSK cluster fails to be deployed through the Container Cloud web UI
due to inability to add any label to the control plane machines along with
inability to change dedicatedControlPlane: false using the web UI.
To work around the issue, manually add the required labels using CLI. Once done, the cluster deployment resumes.
This section describes the specific actions you need to complete to accurately plan and successfully perform the update. Consider this information as a supplement to the generic update procedures published in Operations Guide: Cluster update.
The 24.3.7 patch is the last patch release in the 24.3 series. From 24.3.7, there will be a possibility to update to 25.1.1, when it is released.
You can update to the 24.3.7 version from the following cluster versions:
Patch update:
24.3.6 (June 16, 2025)
24.3.5 (May 20, 2025)
24.3.4 (April 22, 2025)
24.3.3 (March 26, 2025)
24.3.2 (February 03, 2025)
24.3.1 (January 06, 2025)
Major update: 24.3 (October 16, 2024). As long as 24.3.7 is the last patch of the 24.3 series, Mirantis recommends avoiding this update path. Instead, consider updating to 25.1 that will soon open the update path to 25.2.
For the detailed cluster update schema, refer to MOSK cluster update schema.
The following table provides details on the impact of a MOSK cluster update to a patch release within the 24.3 series.
Note
For the detailed workflow of update to a patch release, refer to Update to a patch version.
Updated component |
Impact on cloud users |
Impact on cloud workloads |
|---|---|---|
OpenStack and Tungsten Fabric |
|
Open vSwitch networking - interruption of North-South connectivity, depending on the type of virtual routers used by a workload:
Tungsten Fabric networking - no impact |
Ceph |
~1% of read operations on object storage API may fail |
IO performance degradation for Ceph-backed virtual storage devices. Pay special attention to the known issue 50566 that may affect the maintenance window. |
Host OS components |
No impact |
No impact |
- 0(1,2)
You can bypass updating components of the cloud data plane to avoid the network downtime during Update to a patch version. By using this technique, you accept the risk that some security fixes may not be applied.
The following table provides details on the impact of a MOSK cluster update to a major release.
Updated component |
Impact on cloud users |
Impact on cloud workloads |
|---|---|---|
OpenStack and Tungsten Fabric |
|
Open vSwitch networking - interruption of the North-South connectivity, depending on the type of virtual routers used by a workload:
Tungsten Fabric networking - no impact |
Ceph |
~1% of read operations on object storage API may fail |
IO performance degradation for Ceph-backed virtual storage devices |
Host OS components |
No impact |
Instance network connectivity interruption up to 5 minutes |
Host OS kernel |
No impact |
Restart of instances due to the hypervisor reboot 1 |
- 1
Host operating system needs to be rebooted for the kernel update to be applied. Configure live-migration of workloads to avoid the impact on the instances running on a host.
Before updating the cluster, be sure to review the potential issues that may arise during the process and the recommended solutions to address them, as outlined in Update known issues.
Migration of container runtime from Docker to containerd, which is implemented for existing management and managed clusters, becomes mandatory in the scope of Container Cloud 2.29.x. Otherwise, the management cluster update to 2.30.0 will be blocked.
The use of containerd allows for better Kubernetes performance and component update without pod restart when applying fixes for CVEs. For the migration procedure, refer to Migrate container runtime from Docker to containerd.
Important
Container runtime migration involves machine cordoning and draining.
24.2 series
24.2
Release date |
July 02, 2024 |
|---|---|
Name |
MOSK 24.2 |
Cluster release |
17.2.0 |
Highlights |
|
Component |
Support scope |
Feature |
|---|---|---|
OpenStack |
TechPreview |
|
TechPreview |
||
n/a |
||
Full |
||
TechPreview |
||
TechPreview |
||
Tungsten Fabric |
Full |
|
TechPreview |
||
Full |
||
Full |
||
Major version changes |
Full |
|
Full |
TechPreview
Implemented the technical preview support for OpenStack Caracal for greenfield deployments.
To start experimenting with the new functionality, set openstack_version to
caracal in the OpenStackDeployment custom resource during the cloud
deployment.
TechPreview
Implemented the technical preview support for Open Virtual Network as a networking backend for OpenStack.
Completely removed the OpenStackDeploymentSecret custom resource, which was
previously used to aggregate cloud confidential settings.
Sensitive information within the OpenStackDeployment object can be hidden
using the value_from directive. This enhancement was introduced in
MOSK 23.1 and allows for better management of confidential
data without the need for a separate custom resource.
Implemented the possibility to specify the raw option for the image storage
backend through the spec.features section of the OpenStackDeployment
custom resource.
TechPreview
Added support for the network port availability monitoring service (Portprober). The service is implemented as an extension to the OpenStack Neutron service and gets enabled automatically together with the floating IP address availability monitoring service (Cloudprober). Portprober is available for the MOSK clusters running OpenStack Antelope or newer version and using the Neutron OVS backend for networking.
TechPreview
Implemented the technical preview support for Dynamic Resource Balancer (DRB) service that enables cloud operators to continuously ensure optimal placement of their workloads.
Introduced full support for Tungsten Fabric Operator API v2. All greenfield
deployments now deploy v2 by default. After updating, all existing deployments
include the ability to convert existing v1alpha1 TFOperator to v2.
This new API version aligns with the OpenStack Controller API and provides better interface for advanced configurations. The configuration documentation for Tungsten Fabric provides configuration examples for both API v1alpha1 and API v2.
TechPreview
Implemented the capability to disable spoof checking on the SR-IOV enabled ports of some virtual network functions. This enhancement streamlines the control over SR-IOV spoof check within Tungsten Fabric, offering cloud operators a more seamless experience.
Enhanced the connectivity between the Tungsten Fabric services and Cassandra database clusters through the Cassandra Query Language (CQL) protocol.
Implemented the capability to specify the target nodes for hosting Tungsten Fabric SNAT and load balancer namespaces. This feature helps preserve resources on compute nodes running highly sensitive workloads.
Upgraded Ceph major version from Quincy 17.2.7 to Reef 18.2.3 with an automatic upgrade of Ceph components during the Cluster version update.
Ceph Reef delivers new version of RocksDB which provides better IO performance. Also, this version supports RGW multisite re-sharding and contains overall security improvements.
Learn more
Major update: FRR 9.0.2
Minor update:
RabbitMQ 3.12.12
Ingress 1.10.1
Descheduler 0.29.0
PowerDNS 4.8.4
Patch update:
Galera 26.4.16
MariaDB 10.6.17
Patch update: Cassandra 3.11.17
Mirantis has tested MOSK against a very specific configuration and can guarantee a predictable behavior of the product only in the exact same environments. The table below includes the major MOSK components with the exact versions against which testing has been performed.
Component |
Version |
|---|---|
Cluster release |
17.2.0 (Cluster release notes) |
OpenStack |
Caracal TechPreview,
Antelope, Yoga
|
OpenStack Operator |
0.16.5 |
Tungsten Fabric |
21.4 |
Tungsten Fabric Operator |
0.15.4 |
See also
For the supported versions of operating system, Ceph, and other components, refer to Compatibility Matrix.
This section describes the MOSK known issues with available workarounds. For the known issues in the related version of Mirantis Container Cloud, refer to Mirantis Container Cloud: Release Notes.
This section lists the OpenStack known issues with workarounds for the Mirantis OpenStack for Kubernetes release 24.2.
During MariaDB operations on a management cluster, Pods may get stuck in continuous restarts with the following example error:
[ERROR] WSREP: Corrupt buffer header: \
addr: 0x7faec6f8e518, \
seqno: 3185219421952815104, \
size: 909455917, \
ctx: 0x557094f65038, \
flags: 11577. store: 49, \
type: 49
Workaround:
Create a backup of the
/var/lib/mysqldirectory on themariadb-serverPod.Verify that other replicas are up and ready.
Remove the
galera.cachefile for the affectedmariadb-serverPod.Remove the affected
mariadb-serverPod or wait until it is automatically restarted.
After Kubernetes restarts the Pod, the Pod clones the database in 1-2 minutes and restores the quorum.
Due to the MetalLB upstream issue, a load balancer service may not obtain the external IP address.
The issue occurs when two services share the same external IP address and have
the same externalTrafficPolicy value. Initially, the services have the
external IP address assigned and are accessible. After modifying the
externalTrafficPolicy value for both services from Cluster to
Local, the first service that has been changed remains with no external IP
address assigned. Though, the second service, which was changed later, has the
external IP assigned as expected.
To work around the issue, make a dummy change to the service object where
external IP is <pending>:
Identify the service that is stuck:
kubectl get svc -A | grep pending
Example of system response:
stacklight iam-proxy-prometheus LoadBalancer 10.233.28.196 <pending> 443:30430/TCP
Add an arbitrary label to the service that is stuck. For example:
kubectl label svc -n stacklight iam-proxy-prometheus reconcile=1
Example of system response:
service/iam-proxy-prometheus labeledVerify that the external IP was allocated to the service:
kubectl get svc -n stacklight iam-proxy-prometheus
Example of system response:
NAME TYPE CLUSTER-IP EXTERNAL-IP PORT(S) AGE iam-proxy-prometheus LoadBalancer 10.233.28.196 10.0.34.108 443:30430/TCP 12d
Ocassionally, after the credential rotation, OpenStack Controller Exporter
fails to scrub the metrics. To work around the issue, restart the pod
with openstack-controller-exporter.
Sometimes, after changing the OpenStackDeployment custom resource,
it does not transition to the APPLYING state as expected.
To work around the issue, restart the rockoon` pod in the osh-system
namespace.
Fixed in MOSK 24.2.1 Fixed in MOSK 24.3
After upgrading to OpenStack Antelope, clusters with configured trunk ports experience traffic flow disruptions that block the cluster updates.
To work around the issue, pin the MOSK Networking service (OpenStack Neutron) container image by adding the following content to the OpenStackDeployment custom resource:
spec:
services:
networking:
neutron:
values:
images:
tags:
neutron_openvswitch_agent: mirantis.azurecr.io/openstack/neutron:antelope-jammy-20240816113600
Caution
Remove the pinning after updating to MOSK 24.2.1 or later patch or major release.
After upgrade to OpenStack Antelope, the virtual machines experience connectivity disruptions when sending data over the virtual networks. Network packets with full MTU are dropped.
The issue affects the MOSK clusters with Open vSwitch as the networking backend and with the following specific MTU settings:
The MTU configured on the tunnel interface of compute nodes is equal to the value of the
spec:services:networking:neutron:values:conf:neutron:DEFAULT:global_physnet_mtuparameter of theOpenStackDeploymentcustom resource (if not specified, default is1500bytes).If the MTU of the tunnel interface is higher by at least 4 bytes, the cluster is not affected by the issue.
The cluster contains virtual machines that have the MTU of the network interfaces of the guest operating system larger than the MTU of the value of the
global_physnet_mtuparameter above minus 50 bytes.
To work around the issue, pin the MOSK Networking
service (OpenStack Neutron) container image by adding the following content
to the OpenStackDeployment custom resource:
spec:
services:
networking:
neutron:
values:
images:
tags:
neutron_openvswitch_agent: mirantis.azurecr.io/openstack/neutron:antelope-jammy-20240816113600
Caution
Remove the pinning after updating to MOSK 24.2.1 or later patch or major release.
This section lists the Tungsten Fabric known issues with workarounds for the Mirantis OpenStack for Kubernetes release 24.2.
Note
For the Tungsten Fabric limitations, refer to Tungsten Fabric known limitations.
Rebooting all Cassandra cluster TFConfig or TFAnalytics nodes, maintenance, or other circumstances that cause the Cassandra pods to start simultaneously may cause a broken Cassandra TFConfig and/or TFAnalytics cluster. In this case, Cassandra nodes do not join the ring and do not update the IPs of the neighbor nodes. As a result, the TF services cannot operate Cassandra cluster(s).
To verify that a Cassandra cluster is affected:
Run the nodetool status command specifying the config or
analytics cluster and the replica number:
kubectl -n tf exec -it tf-cassandra-<config/analytics>-dc1-rack1-<replica number> -c cassandra -- nodetool status
Example of system response with outdated IP addresses:
Datacenter: DC1
===============
Status=Up/Down
|/ State=Normal/Leaving/Joining/Moving
-- Address Load Tokens Owns (effective) Host ID Rack
DN <outdated ip> ? 256 64.9% a58343d0-1e3f-4d54-bcdf-9b9b949ca873 r1
DN <outdated ip> ? 256 69.8% 67f1d07c-8b13-4482-a2f1-77fa34e90d48 r1
Datacenter: dc1
===============
Status=Up/Down
|/ State=Normal/Leaving/Joining/Moving
-- Address Load Tokens Owns (effective) Host ID Rack
UN <actual ip> 3.84 GiB 256 65.2% 7324ebc4-577a-425f-b3de-96faac95a331 rack1
Workaround:
Manually delete the Cassandra pod from the failed config or analytics
cluster to re-initiate the bootstrap process for one of the Cassandra nodes:
kubectl -n tf delete pod tf-cassandra-<config/analytics>-dc1-rack1-<replica_num>
Occasionally, RabbitMQ instances in tf-rabbitmq pods fail to enable
the tracking_records_in_ets during the initialization process.
To work around the problem, restart the affected pods manually.
Fixed in MOSK 24.2.1 Fixed in MOSK 24.3
During initial deployment of a Tungsten Fabric cluster, there is a known issue
where the Cassandra database may enter an infinite table creation or changing
state. This results in the Tungsten Fabric configuration pods failing to reach
the Ready state.
The root cause of this issue is a schema mismatch within Cassandra.
To verify whether the cluster is affected:
The symptoms of this issue can be observed by verifying the Tungsten Fabric configuration pods:
kubectl describe pod <TF_CONFIG_POD_NAME> -n tf
The following events might be observed:
Events:
Type Reason Age From Message
---- ------ ---- ---- -------
Warning Unhealthy 35m (x64 over 78m) kubelet Readiness probe failed: contrail-svc-monitor: initializing (Database:Cassandra[] connection down)
Warning BackOff 30m (x128 over 63m) kubelet Back-off restarting failed container svc-monitor in pod tf-config-mfkfc_tf(fc77e6b6-d7b9-4680-bffc-618796a754af)
Warning BackOff 25m (x42 over 44m) kubelet Back-off restarting failed container api in pod tf-config-mfkfc_tf(fc77e6b6-d7b9-4680-bffc-618796a754af)
Normal Started 20m (x18 over 80m) kubelet Started container svc-monitor
Warning Unhealthy 14m (x90 over 70m) kubelet (combined from similar events): Readiness probe errored: rpc error: code = Unknown desc = container not running (38fc8f52b45a0918363e5617c0d0181d72a01435a6c1ec4021301e2a0e75805e)
The events above indicate that the configuration services remain in the initializing state after deployment due to inability to connect to the database. As a result, liveness and readiness probes fail, and the pods continuously restart.
Additionally, each node of Cassandra configuration database logs similar errors:
INFO [MigrationStage:1] 2024-05-29 23:13:23,089 MigrationCoordinator.java:531 - Sending schema pull request to /192.168.159.144 at 1717024403089 with timeout 10000
ERROR [InternalResponseStage:123] 2024-05-29 23:13:24,792 MigrationCoordinator.java:491 - Unable to merge schema from /192.168.159.144
org.apache.cassandra.exceptions.ConfigurationException: Column family ID mismatch (found a1de4100-1e02-11ef-8797-b7bb8876c3bc; expected a22ef910-1e02-11ef-a135-a747d50b5bce)
at org.apache.cassandra.config.CFMetaData.validateCompatibility(CFMetaData.java:1000)
at org.apache.cassandra.config.CFMetaData.apply(CFMetaData.java:953)
at org.apache.cassandra.config.Schema.updateTable(Schema.java:687)
at org.apache.cassandra.schema.SchemaKeyspace.updateKeyspace(SchemaKeyspace.java:1495)
at org.apache.cassandra.schema.SchemaKeyspace.mergeSchema(SchemaKeyspace.java:1451)
at org.apache.cassandra.schema.SchemaKeyspace.mergeSchema(SchemaKeyspace.java:1413)
at org.apache.cassandra.schema.SchemaKeyspace.mergeSchemaAndAnnounceVersion(SchemaKeyspace.java:1390)
at org.apache.cassandra.service.MigrationCoordinator.mergeSchemaFrom(MigrationCoordinator.java:449)
at org.apache.cassandra.service.MigrationCoordinator$Callback.response(MigrationCoordinator.java:487)
at org.apache.cassandra.service.MigrationCoordinator$Callback.response(MigrationCoordinator.java:475)
at org.apache.cassandra.net.ResponseVerbHandler.doVerb(ResponseVerbHandler.java:53)
at org.apache.cassandra.net.MessageDeliveryTask.run(MessageDeliveryTask.java:69)
at java.util.concurrent.Executors$RunnableAdapter.call(Executors.java:511)
at java.util.concurrent.FutureTask.run(FutureTask.java:266)
at java.util.concurrent.ThreadPoolExecutor.runWorker(ThreadPoolExecutor.java:1149)
at java.util.concurrent.ThreadPoolExecutor$Worker.run(ThreadPoolExecutor.java:624)
at org.apache.cassandra.concurrent.NamedThreadFactory.lambda$threadLocalDeallocator$0(NamedThreadFactory.java:84)
at java.lang.Thread.run(Thread.java:750)
Workaround:
To resolve this issue temporarily, restart the affected Cassandra pod:
kubectl delete pod <TF_CASSANDRA_CONFIG_POD_NAME> -n tf
After the pod is restarted, monitor the status of other Tungsten Fabric pods.
If they become Ready within two minutes, the issue is resolved. Otherwise,
inspect the latest Cassandra logs in other pods and restart any other pods
exhibiting the same pattern of errors:
kubectl delete pod <ANOTHER_TF_CASSANDRA_CONFIG_POD_NAME> -n tf
Repeat the process until all affected pods become Ready.
After replacing a failed Tungsten Fabric controller node as described in Replace a failed TF controller node, the first restart of the Cassandra pod on this node may cause an issue if the Cassandra node with the outdated IP address has not been removed from the cluster. Subsequent Cassandra pod restarts should not trigger this problem.
To verify if your Cassandra cluster is affected, run the nodetool status command specifying the config or analytics cluster and the replica number:
kubectl -n tf exec -it tf-cassandra-<CONFIG-OR-ANALYTICS>-dc1-rack1-<REPLICA-NUM> -c cassandra -- nodetool status
Example of the system response with outdated IP addresses:
Datacenter: dc1
===============
Status=Up/Down
|/ State=Normal/Leaving/Joining/Moving
-- Address Load Tokens Owns Host ID Rack
UN 192.168.201.144 509.43 KiB 256 ? 7e760a99-fae5-4921-b0c5-d9e6e1eca1c5 rack1
UN 192.168.50.146 534.18 KiB 256 ? 2248ea35-85d4-4887-820b-1fac4733021f rack1
UN 192.168.145.147 484.19 KiB 256 ? d988aaaa-44ae-4fec-a617-0b0a253e736d rack1
DN 192.168.145.144 481.53 KiB 256 ? c23703a1-6854-47a7-a4a2-af649d63af0c rack1
An extra node will appear in the cluster with an outdated IP address
(the IP of the terminated Cassandra pod) in the Down state.
To work around the issue, after replacing the Tungsten Fabric controller node, delete the Cassandra pod on the replaced node and remove the outdated node from the Cassandra cluster using nodetool:
kubectl -n tf exec -it tf-cassandra-<CONFIG-OR-ANALYTICS>-dc1-rack1-<REPLICA-NUM> -c cassandra -- nodetool removenode <HOST-ID>
This section lists the update known issues with workarounds for the MOSK release 24.2.
During cluster update, the rolling reboot fails on the Tungsten Fabric cluster. To work around the issue, restart the RabbitMQ pods in the Tungsten Fabric cluster.
During major or patch update of a MOSK cluster with StackLight enabled in
non-HA mode, the KubePodsCrashLooping alert may be firing for the Grafana
ReplicaSet.
Grafana relies on PostgreSQL for persistent data. In non-HA StackLight setup,
PostgreSQL becomes temporarily unavailable during updates. If Grafana loses its
database connection or fails to establish one during startup, Grafana fails
with an error. This may cause the Grafana pod to enter the CrashLoopBackOff
state. Such behavior is expected in non-HA StackLight setups. The Grafana pod
will resume normal operation after PostgreSQL is restored.
To prevent the issue, deploy StackLight in HA mode.
Fixed in MOSK 25.1 Fixed in MOSK 25.1.1
When updating to the MOSK 24.3 series, tf-config pods from the Tungsten
Fabric namespace may enter the CrashLoopBackOff state. For example:
tf-config-cs8zr 2/5 CrashLoopBackOff 676 (19s ago) 15h
tf-config-db-6zxgg 1/1 Running 44 (25m ago) 15h
tf-config-db-7k5sz 1/1 Running 43 (23m ago) 15h
tf-config-db-dlwdv 1/1 Running 43 (25m ago) 15h
tf-config-nw4tr 3/5 CrashLoopBackOff 665 (43s ago) 15h
tf-config-wzf6c 1/5 CrashLoopBackOff 680 (10s ago) 15h
tf-control-c6bnn 3/4 Running 41 (23m ago) 13h
tf-control-gsnnp 3/4 Running 42 (23m ago) 13h
tf-control-sj6fd 3/4 Running 41 (23m ago) 13h
To troubleshoot the issue, check the logs inside the tf-config API
container and the tf-cassandra pods. The following example logs
indicate that Cassandra services failed to peer with each other and
are operating independently:
Logs from the
tf-configAPI container:NoHostAvailable: ('Unable to complete the operation against any hosts', {<Host: 192.168.200.23:9042 dc1>: Unavailable('Error from server: code=1000 [Unavailable exception] message="Cannot achieve consistency level QUORUM" info={\'required_replicas\': 2, \'alive_replicas\': 1, \'consistency\': \'QUORUM\'}',)})Logs from the
tf-cassandrapods:INFO [OptionalTasks:1] 2024-09-09 08:59:36,231 CassandraRoleManager.java:419 - Setup task failed with error, rescheduling WARN [OptionalTasks:1] 2024-09-09 08:59:46,231 CassandraRoleManager.java:379 - CassandraRoleManager skipped default role setup: some nodes were not ready
To work around the issue, restart the Cassandra services in the Tungsten Fabric namespace by deleting the affected pods sequentially to establish the connection between them:
kubectl -n tf delete pod tf-cassandra-config-dc1-rack1-0
kubectl -n tf delete pod tf-cassandra-config-dc1-rack1-1
kubectl -n tf delete pod tf-cassandra-config-dc1-rack1-2
Now, all other services in the Tungsten Fabric namespace should be in
the Active state.
This section lists the Container Cloud web UI known issues with workarounds for the MOSK release 24.2.
Fixed in 2.30.0 (21.0.0 and 20.0.0)
A compact MOSK cluster fails to be deployed through the Container Cloud web UI
due to inability to add any label to the control plane machines along with
inability to change dedicatedControlPlane: false using the web UI.
To work around the issue, manually add the required labels using CLI. Once done, the cluster deployment resumes.
A newly created project does not display all available tabs and contains different access denied errors during first five minutes after creation.
To work around the issue, refresh the browser in five minutes after the project creation.
This section lists the components artifacts of the MOSK 24.2 release that includes binaries, Docker images, and Helm charts.
MOSK 24.2 OpenStack Antelope binaries and Docker images
Component |
Path |
License information for main executable programs |
|---|---|---|
Binaries |
||
octavia-amphora |
https://binary.mirantis.com/openstack/bin/octavia/amphora-x64-haproxy-antelope-20240524061520.qcow2 |
Mirantis Proprietary License |
mirantis |
https://binary.mirantis.com/openstack/bin/horizon/mirantis-antelope-18a1377-20230817112356.tar.gz |
Mirantis Proprietary License |
kernel |
GPL-2.0 |
|
initramfs |
https://binary.mirantis.com/openstack/bin/ironic/tinyipa/tinyipa-stable-antelope-20240213233421.gz |
GPL-2.0 |
service-image |
https://binary.mirantis.com/openstack/bin/manila/manila-service-image-20240318125453.qcow2 |
Mirantis Proprietary License |
Docker images |
||
keystone |
mirantis.azurecr.io/openstack/keystone:antelope-jammy-20240522134129 |
Apache License 2.0 |
heat |
mirantis.azurecr.io/openstack/heat:antelope-jammy-20240522134129 |
Apache License 2.0 |
glance |
mirantis.azurecr.io/openstack/glance:antelope-jammy-20240522134129 |
Apache License 2.0 |
cinder |
mirantis.azurecr.io/openstack/cinder:antelope-jammy-20240522134129 |
Apache License 2.0 |
osprober |
mirantis.azurecr.io/openstack/osprober:0.0.1-dae2abb |
Apache License 2.0 |
neutron |
mirantis.azurecr.io/openstack/neutron:antelope-jammy-20240522134129 |
Apache License 2.0 |
nova |
mirantis.azurecr.io/openstack/nova:antelope-jammy-20240522134129 |
Apache License 2.0 |
horizon |
mirantis.azurecr.io/openstack/horizon:antelope-jammy-20240522134129 |
Apache License 2.0 |
tempest |
mirantis.azurecr.io/openstack/tempest:antelope-jammy-20240524080520 |
Apache License 2.0 |
octavia |
mirantis.azurecr.io/openstack/octavia:antelope-jammy-20240522134129 |
Apache License 2.0 |
designate |
mirantis.azurecr.io/openstack/designate:antelope-jammy-20240522134129 |
Apache License 2.0 |
ironic |
mirantis.azurecr.io/openstack/ironic:antelope-jammy-20240522134129 |
Apache License 2.0 |
barbican |
mirantis.azurecr.io/openstack/barbican:antelope-jammy-20240522134129 |
Apache License 2.0 |
libvirt |
mirantis.azurecr.io/general/libvirt:8.0.x-jammy-reef-20240507155140 |
LGPL-2.1 License |
pause |
mirantis.azurecr.io/general/external/pause:3.1 |
Apache License 2.0 |
openvswitch |
mirantis.azurecr.io/general/openvswitch:2.17-jammy-20231018050930 |
Apache License 2.0 |
openvswitch-dpdk |
mirantis.azurecr.io/general/openvswitch-dpdk:2.17-jammy-20231018050930 |
Apache License 2.0 |
openstack-tools |
mirantis.azurecr.io/openstack/openstack-tools:yoga-jammy-20240522134129 |
Apache License 2.0 |
rabbitmq |
mirantis.azurecr.io/openstack/extra/rabbitmq:3.12.12-jammy-20240209104455 |
Mozilla Public License 2.0 |
rabbitmq-management |
mirantis.azurecr.io/openstack/extra/rabbitmq-management:3.12.12-jammy-20240209104455 |
Mozilla Public License 2.0 |
kubernetes-entrypoint |
mirantis.azurecr.io/openstack/extra/kubernetes-entrypoint:v1.0.1-ba8ada4-20240405150338 |
Apache License 2.0 |
memcached |
mirantis.azurecr.io/general/memcached:v1.6.23-alpine-20240131134844 |
BSD 3-Clause “New” or “Revised” License |
etcd |
mirantis.azurecr.io/openstack/extra/etcd:v3.5.11-alpine-20240131112547 |
Apache License 2.0 |
powerdns |
mirantis.azurecr.io/openstack/extra/powerdns:4.8-alpine-20240308161357 |
GPL-2.0 License |
nginx-ingress-controller |
mirantis.azurecr.io/openstack/extra/nginx-ingress-controller:1.10.1-alpine-20240424084259 |
Apache License 2.0 |
tls-proxy |
mirantis.azurecr.io/openstack/tls-proxy:focal-fipster-20230725114156 |
Mirantis Proprietary License |
defaultbackend |
mirantis.azurecr.io/openstack/extra/defaultbackend:v1.19.2-77af1ef-20220823043839 |
Apache License 2.0 |
mariadb |
mirantis.azurecr.io/general/mariadb:10.6.17-focal-20240523075821 |
GPLv2, LGPLv2.1 (client libraries) |
rabbitmq-exporter |
mirantis.azurecr.io/stacklight/rabbitmq-exporter:1.0.0-RC19 |
MIT License |
memcached-exporter |
mirantis.azurecr.io/stacklight/memcached-exporter:0-20231208095208 |
Apache License 2.0 |
prometheus-mysql-exporter |
mirantis.azurecr.io/stacklight/mysqld-exporter:v0.11.0 |
Apache License 2.0 |
aodh |
mirantis.azurecr.io/openstack/aodh:antelope-jammy-20240522134129 |
Apache License 2.0 |
ceilometer |
mirantis.azurecr.io/openstack/ceilometer:antelope-jammy-20240522134129 |
Apache License 2.0 |
gnocchi |
mirantis.azurecr.io/openstack/gnocchi:antelope-jammy-20240522134129 |
Apache License 2.0 |
redis |
mirantis.azurecr.io/openstack/extra/redis:7.2.4-alpine3.19-1 |
BSD 3-Clause “New” or “Revised” License |
redis-operator |
mirantis.azurecr.io/openstack/extra/redis-operator:v1.2.4-20240427152750 |
Apache License 2.0 |
frr |
mirantis.azurecr.io/general/external/docker.io/frrouting/frr:v9.0.2-20240318063427 |
GPL-2.0 and LGPL-2.1 |
strongswan |
mirantis.azurecr.io/openstack/extra/strongswan:alpine-5.9.12-20240129155309 |
GPL-2.0 |
rsyslog |
mirantis.azurecr.io/openstack/extra/rsyslog:v8.2001.0-20231018050930 |
GNU General Public License v3 |
descheduler |
mirantis.azurecr.io/openstack/extra/descheduler:v0.29.0 |
Apache License 2.0 |
nginx |
mirantis.azurecr.io/openstack/extra/nginx:1.25.3-20240131112557 |
Apache License 2.0 |
requirements |
mirantis.azurecr.io/openstack/requirements:antelope-jammy-20240522134129 |
Apache License 2.0 |
drb-controller |
mirantis.azurecr.io/openstack/extra/drb-controller:0.1.0-20240522142810 |
Mirantis Proprietary License |
stepler |
mirantis.azurecr.io/openstack/stepler:antelope-jammy-20240523101039 |
Apache License 2.0 |
placement |
mirantis.azurecr.io/openstack/placement:antelope-jammy-20240522134129 |
Apache License 2.0 |
masakari |
mirantis.azurecr.io/openstack/masakari:antelope-jammy-20240522134129 |
Apache License 2.0 |
masakari-monitors |
mirantis.azurecr.io/openstack/masakari-monitors:antelope-jammy-20240522134129 |
Apache License 2.0 |
ironic-inspector |
mirantis.azurecr.io/openstack/ironic-inspector:antelope-jammy-20240522134129 |
Apache License 2.0 |
manila |
mirantis.azurecr.io/openstack/manila:antelope-jammy-20240522134129 |
Apache License 2.0 |
MOSK 24.2 OpenStack Yoga binaries and Docker images
Component |
Path |
License information for main executable programs |
|---|---|---|
Binaries |
||
octavia-amphora |
https://binary.mirantis.com/openstack/bin/octavia/amphora-x64-haproxy-yoga-20240522141440.qcow2 |
Mirantis Proprietary License |
mirantis |
https://binary.mirantis.com/openstack/bin/horizon/mirantis-yoga-186584b-20230817112411.tar.gz |
Mirantis Proprietary License |
kernel |
https://binary.mirantis.com/openstack/bin/ironic/tinyipa/tinyipa-stable-yoga-20231004061110.vmlinuz |
GPL-2.0 |
initramfs |
https://binary.mirantis.com/openstack/bin/ironic/tinyipa/tinyipa-stable-yoga-20231004061110.gz |
GPL-2.0 |
service-image |
https://binary.mirantis.com/openstack/bin/manila/manila-service-image-20240318125453.qcow2 |
Mirantis Proprietary License |
Docker images |
||
keystone |
mirantis.azurecr.io/openstack/keystone:yoga-jammy-20240522134129 |
Apache License 2.0 |
heat |
mirantis.azurecr.io/openstack/heat:yoga-jammy-20240522134129 |
Apache License 2.0 |
glance |
mirantis.azurecr.io/openstack/glance:yoga-jammy-20240522134129 |
Apache License 2.0 |
cinder |
mirantis.azurecr.io/openstack/cinder:yoga-jammy-20240522134129 |
Apache License 2.0 |
osprober |
mirantis.azurecr.io/openstack/osprober:0.0.1-dae2abb |
Apache License 2.0 |
neutron |
mirantis.azurecr.io/openstack/neutron:yoga-jammy-20240522134129 |
Apache License 2.0 |
nova |
mirantis.azurecr.io/openstack/nova:yoga-jammy-20240522134129 |
Apache License 2.0 |
horizon |
mirantis.azurecr.io/openstack/horizon:yoga-jammy-20240522134129 |
Apache License 2.0 |
tempest |
mirantis.azurecr.io/openstack/tempest:yoga-jammy-20240524080520 |
Apache License 2.0 |
octavia |
mirantis.azurecr.io/openstack/octavia:yoga-jammy-20240522134129 |
Apache License 2.0 |
designate |
mirantis.azurecr.io/openstack/designate:yoga-jammy-20240522134129 |
Apache License 2.0 |
ironic |
mirantis.azurecr.io/openstack/ironic:yoga-jammy-20240522134129 |
Apache License 2.0 |
barbican |
mirantis.azurecr.io/openstack/barbican:yoga-jammy-20240522134129 |
Apache License 2.0 |
libvirt |
mirantis.azurecr.io/general/libvirt:8.0.x-jammy-reef-20240507155140 |
LGPL-2.1 License |
pause |
mirantis.azurecr.io/general/external/pause:3.1 |
Apache License 2.0 |
openvswitch |
mirantis.azurecr.io/general/openvswitch:2.17-jammy-20231018050930 |
Apache License 2.0 |
openvswitch-dpdk |
mirantis.azurecr.io/general/openvswitch-dpdk:2.17-jammy-20231018050930 |
Apache License 2.0 |
openstack-tools |
mirantis.azurecr.io/openstack/openstack-tools:yoga-jammy-20240522134129 |
Apache License 2.0 |
rabbitmq |
mirantis.azurecr.io/openstack/extra/rabbitmq:3.12.12-jammy-20240209104455 |
Mozilla Public License 2.0 |
rabbitmq-management |
mirantis.azurecr.io/openstack/extra/rabbitmq-management:3.12.12-jammy-20240209104455 |
Mozilla Public License 2.0 |
kubernetes-entrypoint |
mirantis.azurecr.io/openstack/extra/kubernetes-entrypoint:v1.0.1-ba8ada4-20240405150338 |
Apache License 2.0 |
memcached |
mirantis.azurecr.io/general/memcached:v1.6.23-alpine-20240131134844 |
BSD 3-Clause “New” or “Revised” License |
etcd |
mirantis.azurecr.io/openstack/extra/etcd:v3.5.11-alpine-20240131112547 |
Apache License 2.0 |
powerdns |
mirantis.azurecr.io/openstack/extra/powerdns:4.8-alpine-20240308161357 |
GPL-2.0 License |
nginx-ingress-controller |
mirantis.azurecr.io/openstack/extra/nginx-ingress-controller:1.10.1-alpine-20240424084259 |
Apache License 2.0 |
tls-proxy |
mirantis.azurecr.io/openstack/tls-proxy:focal-fipster-20230725114156 |
Mirantis Proprietary License |
defaultbackend |
mirantis.azurecr.io/openstack/extra/defaultbackend:v1.19.2-77af1ef-20220823043839 |
Apache License 2.0 |
mariadb |
mirantis.azurecr.io/general/mariadb:10.6.17-focal-20240523075821 |
GPLv2, LGPLv2.1 (client libraries) |
rabbitmq-exporter |
mirantis.azurecr.io/stacklight/rabbitmq-exporter:1.0.0-RC19 |
MIT License |
memcached-exporter |
mirantis.azurecr.io/stacklight/memcached-exporter:0-20231208095208 |
Apache License 2.0 |
prometheus-mysql-exporter |
mirantis.azurecr.io/stacklight/mysqld-exporter:v0.11.0 |
Apache License 2.0 |
aodh |
mirantis.azurecr.io/openstack/aodh:yoga-jammy-20240522134129 |
Apache License 2.0 |
ceilometer |
mirantis.azurecr.io/openstack/ceilometer:yoga-jammy-20240522134129 |
Apache License 2.0 |
gnocchi |
mirantis.azurecr.io/openstack/gnocchi:yoga-jammy-20240522134129 |
Apache License 2.0 |
redis |
mirantis.azurecr.io/openstack/extra/redis:7.2.4-alpine3.19-1 |
BSD 3-Clause “New” or “Revised” License |
redis-operator |
mirantis.azurecr.io/openstack/extra/redis-operator:v1.2.4-20240427152750 |
Apache License 2.0 |
frr |
mirantis.azurecr.io/general/external/docker.io/frrouting/frr:v9.0.2-20240318063427 |
GPL-2.0 and LGPL-2.1 |
strongswan |
mirantis.azurecr.io/openstack/extra/strongswan:alpine-5.9.12-20240129155309 |
GPL-2.0 |
rsyslog |
mirantis.azurecr.io/openstack/extra/rsyslog:v8.2001.0-20231018050930 |
GNU General Public License v3 |
descheduler |
mirantis.azurecr.io/openstack/extra/descheduler:v0.29.0 |
Apache License 2.0 |
nginx |
mirantis.azurecr.io/openstack/extra/nginx:1.25.3-20240131112557 |
Apache License 2.0 |
requirements |
mirantis.azurecr.io/openstack/requirements:yoga-jammy-20240522134129 |
Apache License 2.0 |
drb-controller |
mirantis.azurecr.io/openstack/extra/drb-controller:0.1.0-20240522142810 |
Mirantis Proprietary License |
stepler |
mirantis.azurecr.io/openstack/stepler:yoga-focal-20240419160325 |
Apache License 2.0 |
placement |
mirantis.azurecr.io/openstack/placement:yoga-jammy-20240522134129 |
Apache License 2.0 |
masakari |
mirantis.azurecr.io/openstack/masakari:yoga-jammy-20240522134129 |
Apache License 2.0 |
masakari-monitors |
mirantis.azurecr.io/openstack/masakari-monitors:yoga-jammy-20240522134129 |
Apache License 2.0 |
ironic-inspector |
mirantis.azurecr.io/openstack/ironic-inspector:yoga-jammy-20240522134129 |
Apache License 2.0 |
manila |
mirantis.azurecr.io/openstack/manila:yoga-jammy-20240522134129 |
Apache License 2.0 |
MOSK 24.2 OpenStack Helm charts
MOSK 24.2 Tungsten Fabric 21.4 artifacts
Component |
Path |
License information for main executable programs |
|---|---|---|
Helm charts |
||
Tungsten Fabric Operator |
https://binary.mirantis.com/tungsten/helm/tungstenfabric-operator-0.15.4.tgz |
Mirantis Proprietary License |
Docker images |
||
tungstenfabric-operator |
mirantis.azurecr.io/tungsten-operator/tungstenfabric-operator:0.15.4 |
Mirantis Proprietary License |
tungsten-pytest |
mirantis.azurecr.io/tungsten/tungsten-pytest:0.1-20240524142031 |
MIT License |
casskop |
mirantis.azurecr.io/tungsten-operator/casskop:2.2.5 |
Apache License 2.0 |
cassandra-bootstrap |
mirantis.azurecr.io/tungsten/cassandra-bootstrap:0.1.15 |
Apache License 2.0 |
cassandra |
mirantis.azurecr.io/tungsten/cassandra:3.11.17 |
Apache License 2.0 |
cassandra-config-builder |
mirantis.azurecr.io/tungsten/cass-config-builder:v2-20240527095401 |
Apache License 2.0 |
rabbitmq-operator |
mirantis.azurecr.io/tungsten-operator/rabbitmq-operator:0.4.3 |
Mirantis Proprietary License |
rabbitmq |
mirantis.azurecr.io/tungsten/rabbitmq:3.11.16 |
Mozilla Public License 2.0 |
rabbitmq-exporter |
mirantis.azurecr.io/stacklight/rabbitmq-exporter:1.0.0-RC19 |
MIT License |
zookeeper-operator |
mirantis.azurecr.io/tungsten-operator/zookeeper-operator:0.2.21-mcp |
Apache License 2.0 |
zookeeper |
mirantis.azurecr.io/tungsten/zookeeper:3.8.4-20240315 |
Apache License 2.0 |
redis-operator |
mirantis.azurecr.io/tungsten-operator/redis-operator:0.4.3 |
Apache License 2.0 |
redis |
mirantis.azurecr.io/tungsten/redis:7.2.4-alpine3.19 |
BSD 3-Clause “New” or “Revised” License |
redis-exporter |
mirantis.azurecr.io/stacklight/redis_exporter:v1.45.0 |
BSD 3-Clause “New” or “Revised” License |
tf-cli |
mirantis.azurecr.io/tungsten/tf-cli:0.1-20240524142131 |
MIT License |
kubernetes-entrypoint |
mirantis.azurecr.io/openstack/extra/kubernetes-entrypoint:v1.0.1-ba8ada4-20240405150338 |
Apache License 2.0 |
pause |
mirantis.azurecr.io/general/external/pause:3.1 |
Apache License 2.0 |
tf-nodeinfo |
mirantis.azurecr.io/tungsten/tf-nodeinfo:0.1-20240415104417 |
MIT License |
contrail-controller-config-api |
mirantis.azurecr.io/tungsten/contrail-controller-config-api:21.4.20240530000000 |
Apache License 2.0 |
contrail-controller-config-devicemgr |
mirantis.azurecr.io/tungsten/contrail-controller-config-devicemgr:21.4.20240530000000 |
Apache License 2.0 |
contrail-controller-config-dnsmasq |
mirantis.azurecr.io/tungsten/contrail-controller-config-dnsmasq:21.4.20240530000000 |
Apache License 2.0 |
contrail-controller-config-schema |
mirantis.azurecr.io/tungsten/contrail-controller-config-schema:21.4.20240530000000 |
Apache License 2.0 |
contrail-controller-config-svcmonitor |
mirantis.azurecr.io/tungsten/contrail-controller-config-svcmonitor:21.4.20240530000000 |
Apache License 2.0 |
contrail-controller-control-control |
mirantis.azurecr.io/tungsten/contrail-controller-control-control:21.4.20240530000000 |
Apache License 2.0 |
contrail-controller-control-dns |
mirantis.azurecr.io/tungsten/contrail-controller-control-dns:21.4.20240530000000 |
Apache License 2.0 |
contrail-controller-control-named |
mirantis.azurecr.io/tungsten/contrail-controller-control-named:21.4.20240530000000 |
Apache License 2.0 |
contrail-controller-webui-job |
mirantis.azurecr.io/tungsten/contrail-controller-webui-job:21.4.20240530000000 |
Apache License 2.0 |
contrail-controller-webui-web |
mirantis.azurecr.io/tungsten/contrail-controller-webui-web:21.4.20240530000000 |
Apache License 2.0 |
contrail-node-init |
mirantis.azurecr.io/tungsten/contrail-node-init:21.4.20240530000000 |
Apache License 2.0 |
contrail-nodemgr |
mirantis.azurecr.io/tungsten/contrail-nodemgr:21.4.20240530000000 |
Apache License 2.0 |
contrail-provisioner |
mirantis.azurecr.io/tungsten/contrail-provisioner:21.4.20240530000000 |
Apache License 2.0 |
contrail-tools |
mirantis.azurecr.io/tungsten/contrail-tools:21.4.20240530000000 |
Apache License 2.0 |
contrail-vrouter-agent |
mirantis.azurecr.io/tungsten/contrail-vrouter-agent:21.4.20240530000000 |
Apache License 2.0 |
contrail-vrouter-agent-dpdk |
mirantis.azurecr.io/tungsten/contrail-vrouter-agent-dpdk:21.4.20240530000000 |
Apache License 2.0 |
contrail-vrouter-kernel-build-init |
mirantis.azurecr.io/tungsten/contrail-vrouter-kernel-build-init:21.4.20240530000000 |
Apache License 2.0 |
MOSK 24.2 StackLight artifacts
Component |
Path |
License information for main executable programs |
|---|---|---|
Docker images |
||
prometheus-libvirt-exporter |
mirantis.azurecr.io/stacklight/prometheus-libvirt-exporter:v0.2-20240515023010 |
Mirantis Proprietary License |
tungstenfabric-prometheus-exporter |
mirantis.azurecr.io/stacklight/tungstenfabric-prometheus-exporter:0.1-20240119124301 |
Mirantis Proprietary License |
Helm charts |
||
fluentd |
https://binary.mirantis.com/stacklight/helm/fluentd-2.0.3-mcp-52.tgz |
Mirantis Proprietary License |
prometheus-libvirt-exporter |
https://binary.mirantis.com/stacklight/helm/prometheus-libvirt-exporter-0.2.0-mcp-7.tgz |
Mirantis Proprietary License |
prometheus-tungstenfabric-exporter |
https://binary.mirantis.com/stacklight/helm/prometheus-tungstenfabric-exporter-0.2.0-mcp-7.tgz |
Mirantis Proprietary License |
The following issues have been addressed in the MOSK 24.2 release:
[OpenStack] [36524] Resolved the issue causing
etcdto enter a panic state after replacement of the controller node.[OpenStack] [39768] Resolved the issue that caused the OpenStack controller exporter to fail to initialize within the default timeout on large (500+ compute nodes) clusters.
[OpenStack] [42390] Resolved the issue that caused the absence of caching for PowerDNS.
[Ceph] [42903] Resolved the issue that prevented
ceph-controllerfrom correct handling of missing pools.[Update] [41810] Resolved the cluster update issue caused by the OpenStack controller flooding.
This section describes the specific actions you as a Cloud Operator need to complete to accurately plan and successfully perform your Mirantis OpenStack for Kubernetes (MOSK) cluster update to the version 24.2. Consider this information as a supplement to the generic update procedure published in Operations Guide: Update a MOSK cluster.
Starting from MOSK 24.1.5, Mirantis introduces a new update scheme allowing for the update path flexibility.
If you started receiving the patches of the MOSK 24.1 series, there are two ways to update to the MOSK 24.2 series:
24.1.5 (released on June 18, 2024) to 24.2
24.1.7 (released on August 05, 2024) to 24.2.1 (released on August 27, 2024)
For details, refer to Cluster update scheme.
For those clusters that update between only major versions, the update scheme remains unchaged.
The MOSK cluster will obtain the newly implemented capabilities automatically with no significant impact on the update procedure.
See also
The following table provides details on the update impact on a MOSK cluster.
Updated component |
Impact on cloud users |
Impact on cloud workloads |
|---|---|---|
OpenStack and Tungsten Fabric |
|
Open vSwitch networking - interruption of the North-South connectivity, depending on the type of virtual routers used by a workload:
Tungsten Fabric networking - no impact |
Ceph |
~1% of read operations on object storage API may fail |
IO performance degradation for Ceph-backed virtual storage devices. Pay special attention to the known issue 50566 that may affect the maintenance window. |
Host OS components |
No impact |
Instance network connectivity interruption up to 5 minutes |
Host OS kernel |
No impact |
Restart of instances due to the hypervisor reboot 0 |
- 0
Host operating system needs to be rebooted for the kernel update to be applied. Configure live-migration of workloads to avoid the impact on the instances running on a host.
To properly plan the update maintenance window, use the following documentation:
Before updating the cluster, be sure to review the potential issues that may arise during the process and the recommended solutions to address them, as outlined in Known issues.
The OpenStackDeploymentSecret custom resource has been removed in
MOSK 24.2. Therefore, verify that sensitive information
has been removed from cluster configuration as described in
MOSK 23.1 update notes: Remove sensitive
information from cluster configuration.
MOSK 24.2 includes the updated patch version of the Cassandra database. With the cluster update, Cassandra is updated from 3.11.10 to 3.11.17.
Additionally, the connectivity method between the Tungsten Fabric services and Cassandra database clusters changes from Thrift to Cassandra Query Language (CQL) protocol.
Therefore, Mirantis highly recommends backing up your Cassandra database before updating a MOSK cluster with Tungsten Fabric to 24.2. For the procedure, refer to Back up TF databases.
In MOSK 24.2, the Tungsten Fabric API v2 becomes default
for new deployments and includes the ability to convert existing v1alpha1
TFOperator to v2.
Conversion of TFOperator causes recreation of the Tungsten Fabric service
pods. Therefore, Mirantis recommends performing the conversion within a
maintenance window during or after the update. The conversion is optional
in MOSK 24.2.
For the detailed procedure, refer to Convert v1alpha1 TFOperator custom resource to v2.
If your cluster runs Tungsten Fabric analytics services and you want to obtain a more lightweight setup, you can disable these services through the custom resource of the Tungsten Fabric Operator. For the details, refer to the Tungsten Fabric analytics services deprecation notice.
With the MOSK 24.2 series, the OpenStack Yoga version is being deprecated. Therefore, Mirantis encourages you to upgrade to Antelope to start benefitting from the enhanced functionality and new features of the newer OpenStack release.
MOSK allows for direct upgrade from Yoga to Antelope, without the need to upgrade to the intermediate Zed release. To upgrade the cloud, complete the Upgrade OpenStack procedure.
Important
There are several known issue affecting MOSK clusters running OpenStack Antelope that can disrupt the network connectivity of the cloud workloads.
If your cluster is still running OpenStack Yoga, update to the MOSK 24.2.1 patch release first and only then upgrade to OpenStack Antelope. If you have not been applying patch releases previously and would prefer to switch back to major releases-only mode, you will be able to do this when MOSK 24.3 is released.
If you have updated your cluster to OpenStack Antelope, apply the workarounds described in Release notes: OpenStack known issues for the following issues:
[45879] [Antelope] Incorrect packet handling between instance and its gateway
[44813] Traffic disruption observed on trunk ports
In total, since MOSK 24.1 major release, in 24.2, 771 Common Vulnerabilities and Exposures (CVE) have been fixed: 39 of critical and 732 of high severity.
The table below includes the total number of addressed unique and common CVEs by MOSK-specific component since MOSK 24.1.5 patch. The common CVEs are issues addressed across several images.
Product component |
CVE type |
Critical |
High |
Total |
|---|---|---|---|---|
OpenStack |
Unique |
0 |
4 |
4 |
Common |
0 |
5 |
5 |
|
Tungsten Fabric |
Unique |
5 |
54 |
59 |
Common |
6 |
207 |
213 |
Mirantis Security Portal
For the detailed list of fixed and present CVEs across the Mirantis Container Cloud and MOSK products, refer to Mirantis Security Portal.
Mirantis Container Cloud CVEs
For the number of fixed CVEs in the Mirantis Container Cloud-related components including kaas core, bare metal, Ceph, and StackLight, refer to Container Cloud 2.27.0: Security notes.
24.2.1 patch
The patch release notes contain the description of product enhancements, the list of updated artifacts and Common Vulnerabilities and Exposures (CVE) fixes as well as description of the addressed product issues for the MOSK 24.2.1 patch:
Release date |
August 27, 2024 |
|---|---|
Scope |
Patch |
Cluster release |
17.2.3 |
OpenStack Operator |
0.16.11 |
Tungsten Fabric Operator |
0.15.5 |
The MOSK 24.2.1 patch provides the following updates:
Support for MKE 3.7.12
Update of minor kernel version to
5.15.0-117-genericSecurity fixes for CVEs in images
Resolved product issues
For the list of enhancements and bug fixes that relate to Mirantis Container Cloud, refer to the Mirantis Container Cloud Release notes.
Learn more about the release cadence
This section lists the components artifacts of the MOSK 24.2.1 release that includes binaries, Docker images, and Helm charts.
MOSK 24.2.1 OpenStack Antelope binaries and Docker images
Component |
Path |
License information for main executable programs |
|---|---|---|
Binaries |
||
octavia-amphora |
https://binary.mirantis.com/openstack/bin/octavia/amphora-x64-haproxy-antelope-20240816121729.qcow2 |
Mirantis Proprietary License |
mirantis |
https://binary.mirantis.com/openstack/bin/horizon/mirantis-antelope-18a1377-20230817112356.tar.gz |
Mirantis Proprietary License |
kernel |
GPL-2.0 |
|
initramfs |
https://binary.mirantis.com/openstack/bin/ironic/tinyipa/tinyipa-stable-antelope-20240213233421.gz |
GPL-2.0 |
service-image |
https://binary.mirantis.com/openstack/bin/manila/manila-service-image-20240318125453.qcow2 |
Mirantis Proprietary License |
Docker images |
||
keystone |
mirantis.azurecr.io/openstack/keystone:antelope-jammy-20240816113600 |
Apache License 2.0 |
heat |
mirantis.azurecr.io/openstack/heat:antelope-jammy-20240816113600 |
Apache License 2.0 |
glance |
mirantis.azurecr.io/openstack/glance:antelope-jammy-20240816113600 |
Apache License 2.0 |
cinder |
mirantis.azurecr.io/openstack/cinder:antelope-jammy-20240816113600 |
Apache License 2.0 |
osprober |
mirantis.azurecr.io/openstack/osprober:0.0.1-dae2abb |
Apache License 2.0 |
neutron |
mirantis.azurecr.io/openstack/neutron:antelope-jammy-20240816113600 |
Apache License 2.0 |
nova |
mirantis.azurecr.io/openstack/nova:antelope-jammy-20240816113600 |
Apache License 2.0 |
horizon |
mirantis.azurecr.io/openstack/horizon:antelope-jammy-20240816113600 |
Apache License 2.0 |
tempest |
mirantis.azurecr.io/openstack/tempest:antelope-jammy-20240816113600 |
Apache License 2.0 |
octavia |
mirantis.azurecr.io/openstack/octavia:antelope-jammy-20240816113600 |
Apache License 2.0 |
designate |
mirantis.azurecr.io/openstack/designate:antelope-jammy-20240816113600 |
Apache License 2.0 |
ironic |
mirantis.azurecr.io/openstack/ironic:antelope-jammy-20240816113600 |
Apache License 2.0 |
barbican |
mirantis.azurecr.io/openstack/barbican:antelope-jammy-20240816113600 |
Apache License 2.0 |
libvirt |
mirantis.azurecr.io/general/libvirt:8.0.x-jammy-reef-20240705072041 |
LGPL-2.1 License |
pause |
mirantis.azurecr.io/general/external/pause:3.1 |
Apache License 2.0 |
openvswitch |
mirantis.azurecr.io/general/openvswitch:2.17-jammy-20231018050930 |
Apache License 2.0 |
openvswitch-dpdk |
mirantis.azurecr.io/general/openvswitch-dpdk:2.17-jammy-20231018050930 |
Apache License 2.0 |
openstack-tools |
mirantis.azurecr.io/openstack/openstack-tools:yoga-jammy-20240722060024 |
Apache License 2.0 |
rabbitmq |
mirantis.azurecr.io/openstack/extra/rabbitmq:3.12.12-jammy-20240209104455 |
Mozilla Public License 2.0 |
rabbitmq-management |
mirantis.azurecr.io/openstack/extra/rabbitmq-management:3.12.12-jammy-20240209104455 |
Mozilla Public License 2.0 |
kubernetes-entrypoint |
mirantis.azurecr.io/openstack/extra/kubernetes-entrypoint:v1.0.1-7a2867f-20240717092051 |
Apache License 2.0 |
memcached |
mirantis.azurecr.io/general/memcached:v1.6.23-alpine-20240131134844 |
BSD 3-Clause “New” or “Revised” License |
etcd |
mirantis.azurecr.io/openstack/extra/etcd:v3.5.11-alpine-20240131112547 |
Apache License 2.0 |
powerdns |
mirantis.azurecr.io/openstack/extra/powerdns:4.8-alpine-20240308161357 |
GPL-2.0 License |
nginx-ingress-controller |
mirantis.azurecr.io/openstack/extra/nginx-ingress-controller:1.10.3-alpine-20240729113916 |
Apache License 2.0 |
tls-proxy |
mirantis.azurecr.io/openstack/tls-proxy:focal-fipster-20230725114156 |
Mirantis Proprietary License |
defaultbackend |
mirantis.azurecr.io/openstack/extra/defaultbackend:v1.19.2-77af1ef-20220823043839 |
Apache License 2.0 |
mariadb |
mirantis.azurecr.io/general/mariadb:10.6.17-focal-20240523075821 |
GPLv2, LGPLv2.1 (client libraries) |
rabbitmq-exporter |
mirantis.azurecr.io/stacklight/rabbitmq-exporter:1.0.0-RC19 |
MIT License |
memcached-exporter |
mirantis.azurecr.io/stacklight/memcached-exporter:0-20231208095208 |
Apache License 2.0 |
prometheus-mysql-exporter |
mirantis.azurecr.io/stacklight/mysqld-exporter:v0.11.0 |
Apache License 2.0 |
aodh |
mirantis.azurecr.io/openstack/aodh:antelope-jammy-20240816113600 |
Apache License 2.0 |
ceilometer |
mirantis.azurecr.io/openstack/ceilometer:antelope-jammy-20240816113600 |
Apache License 2.0 |
gnocchi |
mirantis.azurecr.io/openstack/gnocchi:antelope-jammy-20240816113600 |
Apache License 2.0 |
redis |
mirantis.azurecr.io/openstack/extra/redis:7.2.4-alpine3.19-1 |
BSD 3-Clause “New” or “Revised” License |
redis-operator |
mirantis.azurecr.io/openstack/extra/redis-operator:v1.2.4-20240427152750 |
Apache License 2.0 |
frr |
mirantis.azurecr.io/general/external/docker.io/frrouting/frr:v9.0.2-20240318063427 |
GPL-2.0 and LGPL-2.1 |
strongswan |
mirantis.azurecr.io/openstack/extra/strongswan:alpine-5.9.12-20240129155309 |
GPL-2.0 |
rsyslog |
mirantis.azurecr.io/openstack/extra/rsyslog:v8.2001.0-20231018050930 |
GNU General Public License v3 |
descheduler |
mirantis.azurecr.io/openstack/extra/descheduler:v0.29.0 |
Apache License 2.0 |
nginx |
mirantis.azurecr.io/openstack/extra/nginx:1.25.3-20240131112557 |
Apache License 2.0 |
requirements |
mirantis.azurecr.io/openstack/requirements:antelope-jammy-20240816113600 |
Apache License 2.0 |
drb-controller |
mirantis.azurecr.io/openstack/extra/drb-controller:0.1.0-20240701093549 |
Mirantis Proprietary License |
stepler |
mirantis.azurecr.io/openstack/stepler:antelope-jammy-20240808091352 |
Apache License 2.0 |
placement |
mirantis.azurecr.io/openstack/placement:antelope-jammy-20240816113600 |
Apache License 2.0 |
masakari |
mirantis.azurecr.io/openstack/masakari:antelope-jammy-20240816113600 |
Apache License 2.0 |
masakari-monitors |
mirantis.azurecr.io/openstack/masakari-monitors:antelope-jammy-20240816113600 |
Apache License 2.0 |
ironic-inspector |
mirantis.azurecr.io/openstack/ironic-inspector:antelope-jammy-20240816113600 |
Apache License 2.0 |
manila |
mirantis.azurecr.io/openstack/manila:antelope-jammy-20240816113600 |
Apache License 2.0 |
MOSK 24.2.1 OpenStack Yoga binaries and Docker images
Component |
Path |
License information for main executable programs |
|---|---|---|
Binaries |
||
octavia-amphora |
https://binary.mirantis.com/openstack/bin/octavia/amphora-x64-haproxy-yoga-20240812093232.qcow2 |
Mirantis Proprietary License |
mirantis |
https://binary.mirantis.com/openstack/bin/horizon/mirantis-yoga-186584b-20230817112411.tar.gz |
Mirantis Proprietary License |
kernel |
https://binary.mirantis.com/openstack/bin/ironic/tinyipa/tinyipa-stable-yoga-20231004061110.vmlinuz |
GPL-2.0 |
initramfs |
https://binary.mirantis.com/openstack/bin/ironic/tinyipa/tinyipa-stable-yoga-20231004061110.gz |
GPL-2.0 |
service-image |
https://binary.mirantis.com/openstack/bin/manila/manila-service-image-20240318125453.qcow2 |
Mirantis Proprietary License |
Docker images |
||
keystone |
mirantis.azurecr.io/openstack/keystone:yoga-jammy-20240812085256 |
Apache License 2.0 |
heat |
mirantis.azurecr.io/openstack/heat:yoga-jammy-20240812085256 |
Apache License 2.0 |
glance |
mirantis.azurecr.io/openstack/glance:yoga-jammy-20240812085256 |
Apache License 2.0 |
cinder |
mirantis.azurecr.io/openstack/cinder:yoga-jammy-20240812085256 |
Apache License 2.0 |
osprober |
mirantis.azurecr.io/openstack/osprober:0.0.1-dae2abb |
Apache License 2.0 |
neutron |
mirantis.azurecr.io/openstack/neutron:yoga-jammy-20240812085256 |
Apache License 2.0 |
nova |
mirantis.azurecr.io/openstack/nova:yoga-jammy-20240812085256 |
Apache License 2.0 |
horizon |
mirantis.azurecr.io/openstack/horizon:yoga-jammy-20240812085256 |
Apache License 2.0 |
tempest |
mirantis.azurecr.io/openstack/tempest:yoga-jammy-20240812085256 |
Apache License 2.0 |
octavia |
mirantis.azurecr.io/openstack/octavia:yoga-jammy-20240812085256 |
Apache License 2.0 |
designate |
mirantis.azurecr.io/openstack/designate:yoga-jammy-20240812085256 |
Apache License 2.0 |
ironic |
mirantis.azurecr.io/openstack/ironic:yoga-jammy-20240812085256 |
Apache License 2.0 |
barbican |
mirantis.azurecr.io/openstack/barbican:yoga-jammy-20240812085256 |
Apache License 2.0 |
libvirt |
mirantis.azurecr.io/general/libvirt:8.0.x-jammy-reef-20240705072041 |
LGPL-2.1 License |
pause |
mirantis.azurecr.io/general/external/pause:3.1 |
Apache License 2.0 |
openvswitch |
mirantis.azurecr.io/general/openvswitch:2.17-jammy-20231018050930 |
Apache License 2.0 |
openvswitch-dpdk |
mirantis.azurecr.io/general/openvswitch-dpdk:2.17-jammy-20231018050930 |
Apache License 2.0 |
openstack-tools |
mirantis.azurecr.io/openstack/openstack-tools:yoga-jammy-20240812085256 |
Apache License 2.0 |
rabbitmq |
mirantis.azurecr.io/openstack/extra/rabbitmq:3.12.12-jammy-20240209104455 |
Mozilla Public License 2.0 |
rabbitmq-management |
mirantis.azurecr.io/openstack/extra/rabbitmq-management:3.12.12-jammy-20240209104455 |
Mozilla Public License 2.0 |
kubernetes-entrypoint |
mirantis.azurecr.io/openstack/extra/kubernetes-entrypoint:v1.0.1-7a2867f-20240717092051 |
Apache License 2.0 |
memcached |
mirantis.azurecr.io/general/memcached:v1.6.23-alpine-20240131134844 |
BSD 3-Clause “New” or “Revised” License |
etcd |
mirantis.azurecr.io/openstack/extra/etcd:v3.5.11-alpine-20240131112547 |
Apache License 2.0 |
powerdns |
mirantis.azurecr.io/openstack/extra/powerdns:4.8-alpine-20240308161357 |
GPL-2.0 License |
nginx-ingress-controller |
mirantis.azurecr.io/openstack/extra/nginx-ingress-controller:1.10.3-alpine-20240729113916 |
Apache License 2.0 |
tls-proxy |
mirantis.azurecr.io/openstack/tls-proxy:focal-fipster-20230725114156 |
Mirantis Proprietary License |
defaultbackend |
mirantis.azurecr.io/openstack/extra/defaultbackend:v1.19.2-77af1ef-20220823043839 |
Apache License 2.0 |
mariadb |
mirantis.azurecr.io/general/mariadb:10.6.17-focal-20240523075821 |
GPLv2, LGPLv2.1 (client libraries) |
rabbitmq-exporter |
mirantis.azurecr.io/stacklight/rabbitmq-exporter:1.0.0-RC19 |
MIT License |
memcached-exporter |
mirantis.azurecr.io/stacklight/memcached-exporter:0-20231208095208 |
Apache License 2.0 |
prometheus-mysql-exporter |
mirantis.azurecr.io/stacklight/mysqld-exporter:v0.11.0 |
Apache License 2.0 |
aodh |
mirantis.azurecr.io/openstack/aodh:yoga-jammy-20240812085256 |
Apache License 2.0 |
ceilometer |
mirantis.azurecr.io/openstack/ceilometer:yoga-jammy-20240812085256 |
Apache License 2.0 |
gnocchi |
mirantis.azurecr.io/openstack/gnocchi:yoga-jammy-20240812085256 |
Apache License 2.0 |
redis |
mirantis.azurecr.io/openstack/extra/redis:7.2.4-alpine3.19-1 |
BSD 3-Clause “New” or “Revised” License |
redis-operator |
mirantis.azurecr.io/openstack/extra/redis-operator:v1.2.4-20240427152750 |
Apache License 2.0 |
frr |
mirantis.azurecr.io/general/external/docker.io/frrouting/frr:v9.0.2-20240318063427 |
GPL-2.0 and LGPL-2.1 |
strongswan |
mirantis.azurecr.io/openstack/extra/strongswan:alpine-5.9.12-20240129155309 |
GPL-2.0 |
rsyslog |
mirantis.azurecr.io/openstack/extra/rsyslog:v8.2001.0-20231018050930 |
GNU General Public License v3 |
descheduler |
mirantis.azurecr.io/openstack/extra/descheduler:v0.29.0 |
Apache License 2.0 |
nginx |
mirantis.azurecr.io/openstack/extra/nginx:1.25.3-20240131112557 |
Apache License 2.0 |
requirements |
mirantis.azurecr.io/openstack/requirements:yoga-jammy-20240812085256 |
Apache License 2.0 |
drb-controller |
mirantis.azurecr.io/openstack/extra/drb-controller:0.1.0-20240701093549 |
Mirantis Proprietary License |
stepler |
mirantis.azurecr.io/openstack/stepler:yoga-focal-20240610161716 |
Apache License 2.0 |
placement |
mirantis.azurecr.io/openstack/placement:yoga-jammy-20240812085256 |
Apache License 2.0 |
masakari |
mirantis.azurecr.io/openstack/masakari:yoga-jammy-20240812085256 |
Apache License 2.0 |
masakari-monitors |
mirantis.azurecr.io/openstack/masakari-monitors:yoga-jammy-20240812085256 |
Apache License 2.0 |
ironic-inspector |
mirantis.azurecr.io/openstack/ironic-inspector:yoga-jammy-20240812085256 |
Apache License 2.0 |
manila |
mirantis.azurecr.io/openstack/manila:yoga-jammy-20240812085256 |
Apache License 2.0 |
MOSK 24.2.1 OpenStack Helm charts
MOSK 24.2.1 Tungsten Fabric 21.4 artifacts
Component |
Path |
License information for main executable programs |
|---|---|---|
Helm charts |
||
tungstenfabric-operator |
https://binary.mirantis.com/tungsten/helm/tungstenfabric-operator-0.15.5.tgz |
Mirantis Proprietary License |
Docker images |
||
tungstenfabric-operator |
mirantis.azurecr.io/tungsten-operator/tungstenfabric-operator:0.15.5 |
Mirantis Proprietary License |
tungsten-pytest |
mirantis.azurecr.io/tungsten/tungsten-pytest:0.1-20240806152951 |
MIT License |
casskop |
mirantis.azurecr.io/tungsten-operator/casskop:2.2.6 |
Apache License 2.0 |
cassandra-bootstrap |
mirantis.azurecr.io/tungsten/cassandra-bootstrap:0.1.18 |
Apache License 2.0 |
cassandra |
mirantis.azurecr.io/tungsten/cassandra:3.11.17 |
Apache License 2.0 |
cassandra-config-builder |
mirantis.azurecr.io/tungsten/cass-config-builder:v2-20240715193519 |
Apache License 2.0 |
rabbitmq-operator |
mirantis.azurecr.io/tungsten-operator/rabbitmq-operator:0.4.3 |
Mirantis Proprietary License |
rabbitmq |
mirantis.azurecr.io/tungsten/rabbitmq:3.11.16 |
Mozilla Public License 2.0 |
rabbitmq-exporter |
mirantis.azurecr.io/stacklight/rabbitmq-exporter:1.0.0-RC19 |
MIT License |
zookeeper-operator |
mirantis.azurecr.io/tungsten-operator/zookeeper-operator:0.2.21-mcp |
Apache License 2.0 |
zookeeper |
mirantis.azurecr.io/tungsten/zookeeper:3.8.4-20240315 |
Apache License 2.0 |
redis-operator |
mirantis.azurecr.io/tungsten-operator/redis-operator:0.4.3 |
Apache License 2.0 |
redis |
mirantis.azurecr.io/tungsten/redis:7.2.4-alpine3.19 |
BSD 3-Clause “New” or “Revised” License |
redis-exporter |
mirantis.azurecr.io/stacklight/redis_exporter:v1.45.0 |
BSD 3-Clause “New” or “Revised” License |
tf-cli |
mirantis.azurecr.io/tungsten/tf-cli:0.1-20240715193039 |
MIT License |
kubernetes-entrypoint |
mirantis.azurecr.io/openstack/extra/kubernetes-entrypoint:v1.0.1-7a2867f-20240717092051 |
Apache License 2.0 |
pause |
mirantis.azurecr.io/general/external/pause:3.1 |
Apache License 2.0 |
tf-nodeinfo |
mirantis.azurecr.io/tungsten/tf-nodeinfo:0.1-20240415104417 |
MIT License |
contrail-controller-config-api |
mirantis.azurecr.io/tungsten/contrail-controller-config-api:24.2-r21.4.20240806114743 |
Apache License 2.0 |
contrail-controller-config-devicemgr |
mirantis.azurecr.io/tungsten/contrail-controller-config-devicemgr:24.2-r21.4.20240806114743 |
Apache License 2.0 |
contrail-controller-config-dnsmasq |
mirantis.azurecr.io/tungsten/contrail-controller-config-dnsmasq:24.2-r21.4.20240806114743 |
Apache License 2.0 |
contrail-controller-config-schema |
mirantis.azurecr.io/tungsten/contrail-controller-config-schema:24.2-r21.4.20240806114743 |
Apache License 2.0 |
contrail-controller-config-svcmonitor |
mirantis.azurecr.io/tungsten/contrail-controller-config-svcmonitor:24.2-r21.4.20240806114743 |
Apache License 2.0 |
contrail-controller-control-control |
mirantis.azurecr.io/tungsten/contrail-controller-control-control:24.2-r21.4.20240806114743 |
Apache License 2.0 |
contrail-controller-control-dns |
mirantis.azurecr.io/tungsten/contrail-controller-control-dns:24.2-r21.4.20240806114743 |
Apache License 2.0 |
contrail-controller-control-named |
mirantis.azurecr.io/tungsten/contrail-controller-control-named:24.2-r21.4.20240806114743 |
Apache License 2.0 |
contrail-controller-webui-job |
mirantis.azurecr.io/tungsten/contrail-controller-webui-job:24.2-r21.4.20240806114743 |
Apache License 2.0 |
contrail-controller-webui-web |
mirantis.azurecr.io/tungsten/contrail-controller-webui-web:24.2-r21.4.20240806114743 |
Apache License 2.0 |
contrail-node-init |
mirantis.azurecr.io/tungsten/contrail-node-init:21.4.20240530000000 |
Apache License 2.0 |
contrail-nodemgr |
mirantis.azurecr.io/tungsten/contrail-nodemgr:24.2-r21.4.20240806114743 |
Apache License 2.0 |
contrail-provisioner |
mirantis.azurecr.io/tungsten/contrail-provisioner:24.2-r21.4.20240806114743 |
Apache License 2.0 |
contrail-tools |
mirantis.azurecr.io/tungsten/contrail-tools:24.2-r21.4.20240806114743 |
Apache License 2.0 |
contrail-vrouter-agent |
mirantis.azurecr.io/tungsten/contrail-vrouter-agent:21.4.20240530000000 |
Apache License 2.0 |
contrail-vrouter-agent-dpdk |
mirantis.azurecr.io/tungsten/contrail-vrouter-agent-dpdk:21.4.20240530000000 |
Apache License 2.0 |
contrail-vrouter-kernel-build-init |
mirantis.azurecr.io/tungsten/contrail-vrouter-kernel-build-init:21.4.20240530000000 |
Apache License 2.0 |
MOSK 24.2.1 StackLight artifacts
Component |
Path |
License information for main executable programs |
|---|---|---|
Docker images |
||
prometheus-libvirt-exporter |
mirantis.azurecr.io/stacklight/prometheus-libvirt-exporter:v0.2-20240807023011 |
Mirantis Proprietary License |
tungstenfabric-prometheus-exporter |
mirantis.azurecr.io/stacklight/tungstenfabric-prometheus-exporter:0.1-20240119124301 |
Mirantis Proprietary License |
Helm charts |
||
fluentd |
https://binary.mirantis.com/stacklight/helm/fluentd-2.0.3-mcp-52.tgz |
Mirantis Proprietary License |
prometheus-libvirt-exporter |
https://binary.mirantis.com/stacklight/helm/prometheus-libvirt-exporter-0.2.0-mcp-7.tgz |
Mirantis Proprietary License |
prometheus-tungstenfabric-exporter |
https://binary.mirantis.com/stacklight/helm/prometheus-tungstenfabric-exporter-0.2.0-mcp-7.tgz |
Mirantis Proprietary License |
The table below contains the total number of addressed unique and common CVEs by MOSK-specific component compared to the previous patch release version. The common CVEs are issues addressed across several images.
Product component |
CVE type |
Critical |
High |
Total |
|---|---|---|---|---|
OpenStack |
Unique |
1 |
17 |
18 |
Common |
4 |
38 |
42 |
|
Tungsten Fabric |
Unique |
4 |
39 |
43 |
Common |
6 |
51 |
57 |
Mirantis Security Portal
For the detailed list of fixed and present CVEs across the Mirantis Container Cloud and MOSK products, refer to Mirantis Security Portal.
Mirantis Container Cloud CVEs
For the number of fixed CVEs in the Mirantis Container Cloud-related components including kaas core, bare metal, Ceph, and StackLight, refer to Container Cloud 2.27.3: Security notes.
The following issues have been addressed in the MOSK 24.2.1 release:
[40900] [Tungsten Fabric] Resolved the issue that caused Cassandra database to enter an infinite table creation or changing state.
[44813] [Antelope] Resolved the issue that caused disruption on trunk ports.
[45879] [Antelope] Resolved the issue that caused the incorrect packet handling between instance and its gateway.
[38847] [Antelope] Resolved the issue that prevented ISO images from booting.
This section lists MOSK known issues with workarounds for the MOSK release 24.2.1.
During MariaDB operations on a management cluster, Pods may get stuck in continuous restarts with the following example error:
[ERROR] WSREP: Corrupt buffer header: \
addr: 0x7faec6f8e518, \
seqno: 3185219421952815104, \
size: 909455917, \
ctx: 0x557094f65038, \
flags: 11577. store: 49, \
type: 49
Workaround:
Create a backup of the
/var/lib/mysqldirectory on themariadb-serverPod.Verify that other replicas are up and ready.
Remove the
galera.cachefile for the affectedmariadb-serverPod.Remove the affected
mariadb-serverPod or wait until it is automatically restarted.
After Kubernetes restarts the Pod, the Pod clones the database in 1-2 minutes and restores the quorum.
Due to the MetalLB upstream issue, a load balancer service may not obtain the external IP address.
The issue occurs when two services share the same external IP address and have
the same externalTrafficPolicy value. Initially, the services have the
external IP address assigned and are accessible. After modifying the
externalTrafficPolicy value for both services from Cluster to
Local, the first service that has been changed remains with no external IP
address assigned. Though, the second service, which was changed later, has the
external IP assigned as expected.
To work around the issue, make a dummy change to the service object where
external IP is <pending>:
Identify the service that is stuck:
kubectl get svc -A | grep pending
Example of system response:
stacklight iam-proxy-prometheus LoadBalancer 10.233.28.196 <pending> 443:30430/TCP
Add an arbitrary label to the service that is stuck. For example:
kubectl label svc -n stacklight iam-proxy-prometheus reconcile=1
Example of system response:
service/iam-proxy-prometheus labeledVerify that the external IP was allocated to the service:
kubectl get svc -n stacklight iam-proxy-prometheus
Example of system response:
NAME TYPE CLUSTER-IP EXTERNAL-IP PORT(S) AGE iam-proxy-prometheus LoadBalancer 10.233.28.196 10.0.34.108 443:30430/TCP 12d
Sometimes, after changing the OpenStackDeployment custom resource,
it does not transition to the APPLYING state as expected.
To work around the issue, restart the rockoon` pod in the osh-system
namespace.
Rebooting all Cassandra cluster TFConfig or TFAnalytics nodes, maintenance, or other circumstances that cause the Cassandra pods to start simultaneously may cause a broken Cassandra TFConfig and/or TFAnalytics cluster. In this case, Cassandra nodes do not join the ring and do not update the IPs of the neighbor nodes. As a result, the TF services cannot operate Cassandra cluster(s).
To verify that a Cassandra cluster is affected:
Run the nodetool status command specifying the config or
analytics cluster and the replica number:
kubectl -n tf exec -it tf-cassandra-<config/analytics>-dc1-rack1-<replica number> -c cassandra -- nodetool status
Example of system response with outdated IP addresses:
Datacenter: DC1
===============
Status=Up/Down
|/ State=Normal/Leaving/Joining/Moving
-- Address Load Tokens Owns (effective) Host ID Rack
DN <outdated ip> ? 256 64.9% a58343d0-1e3f-4d54-bcdf-9b9b949ca873 r1
DN <outdated ip> ? 256 69.8% 67f1d07c-8b13-4482-a2f1-77fa34e90d48 r1
Datacenter: dc1
===============
Status=Up/Down
|/ State=Normal/Leaving/Joining/Moving
-- Address Load Tokens Owns (effective) Host ID Rack
UN <actual ip> 3.84 GiB 256 65.2% 7324ebc4-577a-425f-b3de-96faac95a331 rack1
Workaround:
Manually delete the Cassandra pod from the failed config or analytics
cluster to re-initiate the bootstrap process for one of the Cassandra nodes:
kubectl -n tf delete pod tf-cassandra-<config/analytics>-dc1-rack1-<replica_num>
Occasionally, RabbitMQ instances in tf-rabbitmq pods fail to enable
the tracking_records_in_ets during the initialization process.
To work around the problem, restart the affected pods manually.
After replacing a failed Tungsten Fabric controller node as described in Replace a failed TF controller node, the first restart of the Cassandra pod on this node may cause an issue if the Cassandra node with the outdated IP address has not been removed from the cluster. Subsequent Cassandra pod restarts should not trigger this problem.
To verify if your Cassandra cluster is affected, run the nodetool status command specifying the config or analytics cluster and the replica number:
kubectl -n tf exec -it tf-cassandra-<CONFIG-OR-ANALYTICS>-dc1-rack1-<REPLICA-NUM> -c cassandra -- nodetool status
Example of the system response with outdated IP addresses:
Datacenter: dc1
===============
Status=Up/Down
|/ State=Normal/Leaving/Joining/Moving
-- Address Load Tokens Owns Host ID Rack
UN 192.168.201.144 509.43 KiB 256 ? 7e760a99-fae5-4921-b0c5-d9e6e1eca1c5 rack1
UN 192.168.50.146 534.18 KiB 256 ? 2248ea35-85d4-4887-820b-1fac4733021f rack1
UN 192.168.145.147 484.19 KiB 256 ? d988aaaa-44ae-4fec-a617-0b0a253e736d rack1
DN 192.168.145.144 481.53 KiB 256 ? c23703a1-6854-47a7-a4a2-af649d63af0c rack1
An extra node will appear in the cluster with an outdated IP address
(the IP of the terminated Cassandra pod) in the Down state.
To work around the issue, after replacing the Tungsten Fabric controller node, delete the Cassandra pod on the replaced node and remove the outdated node from the Cassandra cluster using nodetool:
kubectl -n tf exec -it tf-cassandra-<CONFIG-OR-ANALYTICS>-dc1-rack1-<REPLICA-NUM> -c cassandra -- nodetool removenode <HOST-ID>
On clusters running Tungsten Fabric with API v2, after updating from MOSK 24.2 to 24.2.1, subsequent cluster maintenance requests may stuck. The root cause of the issue is a version mismatch within the internal structures of the Tungsten Fabric Operator.
To identify if your cluster is affected, run:
kubectl get clusterworkloadlock tf-openstack-tf -o yaml
The output similar to the one below, indicates that the Tungsten Fabric
ClusterWorkloadLock remains in the active state indefinitely preventing
further LCM operations with other components:
apiVersion: lcm.mirantis.com/v1alpha1
kind: ClusterWorkloadLock
metadata:
creationTimestamp: "2024-08-30T13:50:33Z"
generation: 1
name: tf-openstack-tf
resourceVersion: "4414649"
uid: 582fc558-c343-4e96-a445-a2d1818dcdb2
spec:
controllerName: tungstenfabric
status:
errorMessage: cluster is not in ready state
release: 17.2.4+24.2.2
state: active
Additionally, the LCM controller logs may contain errors similar to:
{"level":"info","ts":"2024-09-02T16:22:16Z","logger":"entrypoint.lcmcluster-controller.req:5520","caller":"lcmcluster/maintenance.go:178","msg":"ClusterWorkloadLock is inactive cwl {{ClusterWorkloadLock lcm.mirantis.com/v1alpha1} {ceph-clusterworkloadlock a45eca91-cd7b-4d68-9a8e-4d656b4308af 3383288 1 2024-08-30 13:15:14 +0000 UTC <nil> <nil> map[] map[miraceph-ready:true] [{v1 Namespace ceph-lcm-mirantis 43853f67-9058-44ed-8287-f650dbeac5d7 <nil> <nil>}]
[] [{ceph-controller Update lcm.mirantis.com/v1alpha1 2024-08-30 13:25:53 +0000 UTC FieldsV1 {\"f:metadata\":{\"f:annotations\":{\".\":{},\"f:miraceph-ready\":{}},\"f:ownerReferences\":{\".\":{},\"k:{\\\"uid\\\":\\\"43853f67-9058-44ed-8287-f650dbeac5d7\\\"}\":{}}},\"f:spec\":{\".\":{},\"f:controllerName\":{}}} } {ceph-controller Update lcm.mirantis.com/v1alpha1 2024-09-02 10:48:27 +0000 UTC FieldsV1 {\"f:status\":{\".\":{},\"f:release\":{},\"f:state\":{}}} status}]} {ceph} {inactive 17.2.4+24.2.2}}","ns":"child-ns-tf","name":"child-cl"}
{"level":"info","ts":"2024-09-02T16:22:16Z","logger":"entrypoint.lcmcluster-controller.req:5520","caller":"lcmcluster/maintenance.go:178","msg":"ClusterWorkloadLock is inactive cwl {{ClusterWorkloadLock lcm.mirantis.com/v1alpha1} {openstack-osh-dev 7de2b86f-d247-4cee-be8d-dcbcf5e1e11b 3382535 1 2024-08-30 13:50:54 +0000 UTC <nil> <nil> map[] map[] [] [] [{pykube-ng Update lcm.mirantis.com/v1alpha1 2024-08-30 13:50:54 +0000 UTC FieldsV1 {\"f:spec\":{\".\":{},\"f:controllerName\":{}}} } {pykube-ng Update lcm.mirantis.com/v1alpha1 2024-09-02 10:47:29 +0000 UTC FieldsV1 {\"f:status\":{\".\":{},\"f:release\":{},\"f:state\":{}}} status}]} {openstack} {inactive 17.2.4+24.2.2}}","ns":"child-ns-tf","name":"child-cl"}
{"level":"info","ts":"2024-09-02T16:22:16Z","logger":"entrypoint.lcmcluster-controller.req:5520","caller":"lcmcluster/maintenance.go:173","msg":"ClusterWorkloadLock is still active cwl {{ClusterWorkloadLock lcm.mirantis.com/v1alpha1} {tf-openstack-tf 582fc558-c343-4e96-a445-a2d1818dcdb2 3382495 1 2024-08-30 13:50:33 +0000 UTC <nil> <nil> map[] map[] [] [] [{maintenance-ctl Update lcm.mirantis.com/v1alpha1 2024-08-30 13:50:33 +0000 UTC FieldsV1 {\"f:spec\":{\".\":{},\"f:controllerName\":{}}} } {maintenance-ctl Update lcm.mirantis.com/v1alpha1 2024-09-02 10:47:25 +0000 UTC FieldsV1 {\"f:status\":{\".\":{},\"f:errorMessage\":{},\"f:release\":{},\"f:state\":{}}} status}]} {tungstenfabric} {active cluster is not in ready state 17.2.4+24.2.2}}","ns":"child-ns-tf","name":"child-cl"}
{"level":"error","ts":"2024-09-02T16:22:16Z","logger":"entrypoint.lcmcluster-controller.req:5520","caller":"lcmcluster/lcmcluster_controller.go:388","msg":"","ns":"child-ns-tf","name":"child-cl","error":"following ClusterWorkloadLocks in cluster child-ns-tf/child-cl are still active - tf-openstack-tf: InProgress not all ClusterWorkloadLocks are inactive yet","stacktrace":"sigs.k8s.io/cluster-api-provider-openstack/pkg/lcm/controller/lcmcluster.(*ReconcileLCMCluster).updateCluster\n\t/go/src/sigs.k8s.io/cluster-api-provider-openstack/pkg/lcm/controller/lcmcluster/lcmcluster_controller.go:388\nsigs.k8s.io/cluster-api-provider-openstack/pkg/lcm/controller/lcmcluster.(*ReconcileLCMCluster).Reconcile\n\t/go/src/sigs.k8s.io/cluster-api-provider-openstack/pkg/lcm/controller/lcmcluster/lcmcluster_controller.go:223\nsigs.k8s.io/cluster-api-provider-openstack/pkg/service.(*reconcilePanicCatcher).Reconcile\n\t/go/src/sigs.k8s.io/cluster-api-provider-openstack/pkg/service/reconcile.go:98\nsigs.k8s.io/cluster-api-provider-openstack/pkg/service.(*reconcileContextEnricher).Reconcile\n\t/go/src/sigs.k8s.io/cluster-api-provider-openstack/pkg/service/reconcile.go:78\nsigs.k8s.io/cluster-api-provider-openstack/pkg/service.(*reconcileMetrics).Reconcile\n\t/go/src/sigs.k8s.io/cluster-api-provider-openstack/pkg/service/reconcile.go:136\nsigs.k8s.io/controller-runtime/pkg/internal/controller.(*Controller).Reconcile\n\t/go/pkg/mod/sigs.k8s.io/controller-runtime@v0.15.3/pkg/internal/controller/controller.go:118\nsigs.k8s.io/controller-runtime/pkg/internal/controller.(*Controller).reconcileHandler\n\t/go/pkg/mod/sigs.k8s.io/controller-runtime@v0.15.3/pkg/internal/controller/controller.go:31:
To work around the issue, set the actual version of
Tungsten Fabric Operator in the TFOperator custom resource:
For MOSK 24.2.1:
kubectl -n tf patch tfoperators.tf.mirantis.com openstack-tf --type=merge --subresource status --patch 'status: {operatorVersion: <0.15.5>}'
For MOSK 24.2.2:
kubectl -n tf patch tfoperators.tf.mirantis.com openstack-tf --type=merge --subresource status --patch 'status: {operatorVersion: <0.15.6>}'
During major or patch update of a MOSK cluster with StackLight enabled in
non-HA mode, the KubePodsCrashLooping alert may be firing for the Grafana
ReplicaSet.
Grafana relies on PostgreSQL for persistent data. In non-HA StackLight setup,
PostgreSQL becomes temporarily unavailable during updates. If Grafana loses its
database connection or fails to establish one during startup, Grafana fails
with an error. This may cause the Grafana pod to enter the CrashLoopBackOff
state. Such behavior is expected in non-HA StackLight setups. The Grafana pod
will resume normal operation after PostgreSQL is restored.
To prevent the issue, deploy StackLight in HA mode.
During cluster update, the rolling reboot fails on the Tungsten Fabric cluster. To work around the issue, restart the RabbitMQ pods in the Tungsten Fabric cluster.
Fixed in 2.30.0 (21.0.0 and 20.0.0)
A compact MOSK cluster fails to be deployed through the Container Cloud web UI
due to inability to add any label to the control plane machines along with
inability to change dedicatedControlPlane: false using the web UI.
To work around the issue, manually add the required labels using CLI. Once done, the cluster deployment resumes.
A newly created project does not display all available tabs and contains different access denied errors during first five minutes after creation.
To work around the issue, refresh the browser in five minutes after the project creation.
To improve user update experience and make the update path more flexible, MOSK is introducing a new scheme of updating between cluster releases. For the details and possible update paths, refer to 24.1.5 update notes: Cluster update scheme.
You can update to 24.2.1 either from 24.1.7 (major update) or 24.2 (patch update).
Update from 24.1.7 version is a major update between the series. Therefore, the expected impact and maintenance window for the major update to 24.2 series applies. For details, refer to 24.2 update notes
The following table provides details on the impact of a MOSK cluster update to a patch release within the 24.2 series.
Note
For the detailed workflow of update to a patch release, refer to Update to a patch version.
Updated component |
Impact on cloud users |
Impact on cloud workloads |
|---|---|---|
OpenStack and Tungsten Fabric |
|
Open vSwitch networking - interruption of North-South connectivity, depending on the type of virtual routers used by a workload:
Tungsten Fabric networking - no impact |
Ceph |
~1% of read operations on object storage API may fail |
IO performance degradation for Ceph-backed virtual storage devices. Pay special attention to the known issue 50566 that may affect the maintenance window. |
Host OS components |
No impact |
No impact |
- 0(1,2)
You can bypass updating components of the cloud data plane to avoid the network downtime during Update to a patch version. By using this technique, you accept the risk that some security fixes may not be applied.
24.2.2 patch
The patch release notes contain the description of product enhancements, the list of updated artifacts and Common Vulnerabilities and Exposures (CVE) fixes as well as description of the addressed product issues for the MOSK 24.2.2 patch.
Release date |
September 16, 2024 |
|---|---|
Scope |
Patch |
Cluster release |
17.2.4 |
OpenStack Operator |
0.16.12 |
Tungsten Fabric Operator |
0.15.6 |
The MOSK 24.2.2 patch provides the following updates:
Update of minor kernel version to
5.15.0-118-genericSecurity fixes for CVEs in images
For the list of enhancements and bug fixes that relate to Mirantis Container Cloud, refer to the Mirantis Container Cloud Release notes.
Learn more about the release cadence
This section lists the components artifacts of the MOSK 24.2.2 release that includes binaries, Docker images, and Helm charts.
MOSK 24.2.2 OpenStack Antelope binaries and Docker images
Component |
Path |
License information for main executable programs |
|---|---|---|
Binaries |
||
octavia-amphora |
https://binary.mirantis.com/openstack/bin/octavia/amphora-x64-haproxy-antelope-20240816121729.qcow2 |
Mirantis Proprietary License |
mirantis |
https://binary.mirantis.com/openstack/bin/horizon/mirantis-antelope-18a1377-20230817112356.tar.gz |
Mirantis Proprietary License |
kernel |
GPL-2.0 |
|
initramfs |
https://binary.mirantis.com/openstack/bin/ironic/tinyipa/tinyipa-stable-antelope-20240213233421.gz |
GPL-2.0 |
service-image |
https://binary.mirantis.com/openstack/bin/manila/manila-service-image-20240318125453.qcow2 |
Mirantis Proprietary License |
Docker images |
||
keystone |
mirantis.azurecr.io/openstack/keystone:antelope-jammy-20240816113600 |
Apache License 2.0 |
heat |
mirantis.azurecr.io/openstack/heat:antelope-jammy-20240816113600 |
Apache License 2.0 |
glance |
mirantis.azurecr.io/openstack/glance:antelope-jammy-20240816113600 |
Apache License 2.0 |
cinder |
mirantis.azurecr.io/openstack/cinder:antelope-jammy-20240816113600 |
Apache License 2.0 |
osprober |
mirantis.azurecr.io/openstack/osprober:0.0.1-b8aa7cb |
Unknown |
neutron |
mirantis.azurecr.io/openstack/neutron:antelope-jammy-20240816113600 |
Apache License 2.0 |
nova |
mirantis.azurecr.io/openstack/nova:antelope-jammy-20240816113600 |
Apache License 2.0 |
horizon |
mirantis.azurecr.io/openstack/horizon:antelope-jammy-20240816113600 |
Apache License 2.0 |
tempest |
mirantis.azurecr.io/openstack/tempest:antelope-jammy-20240816113600 |
Apache License 2.0 |
octavia |
mirantis.azurecr.io/openstack/octavia:antelope-jammy-20240816113600 |
Apache License 2.0 |
designate |
mirantis.azurecr.io/openstack/designate:antelope-jammy-20240816113600 |
Apache License 2.0 |
ironic |
mirantis.azurecr.io/openstack/ironic:antelope-jammy-20240816113600 |
Apache License 2.0 |
barbican |
mirantis.azurecr.io/openstack/barbican:antelope-jammy-20240816113600 |
Apache License 2.0 |
libvirt |
mirantis.azurecr.io/general/libvirt:8.0.x-jammy-reef-20240801131834 |
LGPL-2.1 License |
pause |
mirantis.azurecr.io/general/external/pause:3.1 |
Apache License 2.0 |
openvswitch |
mirantis.azurecr.io/general/openvswitch:2.17-jammy-20231018050930 |
Apache License 2.0 |
openvswitch-dpdk |
mirantis.azurecr.io/general/openvswitch-dpdk:2.17-jammy-20231018050930 |
Apache License 2.0 |
openstack-tools |
mirantis.azurecr.io/openstack/openstack-tools:yoga-jammy-20240811190753 |
Apache License 2.0 |
rabbitmq |
mirantis.azurecr.io/openstack/extra/rabbitmq:3.12.12-jammy-20240209104455 |
Mozilla Public License 2.0 |
rabbitmq-management |
mirantis.azurecr.io/openstack/extra/rabbitmq-management:3.12.12-jammy-20240209104455 |
Mozilla Public License 2.0 |
kubernetes-entrypoint |
mirantis.azurecr.io/openstack/extra/kubernetes-entrypoint:v1.0.1-4e381cb-20240813170642 |
Apache License 2.0 |
memcached |
mirantis.azurecr.io/general/memcached:v1.6.23-alpine-20240131134844 |
BSD 3-Clause “New” or “Revised” License |
etcd |
mirantis.azurecr.io/openstack/extra/etcd:v3.5.11-alpine-20240131112547 |
Apache License 2.0 |
powerdns |
mirantis.azurecr.io/openstack/extra/powerdns:4.8-alpine-20240308161357 |
GPL-2.0 License |
nginx-ingress-controller |
mirantis.azurecr.io/openstack/extra/nginx-ingress-controller:1.10.3-alpine-20240729113916 |
Apache License 2.0 |
tls-proxy |
mirantis.azurecr.io/openstack/tls-proxy:focal-fipster-20230725114156 |
Mirantis Proprietary License |
defaultbackend |
mirantis.azurecr.io/openstack/extra/defaultbackend:v1.19.2-77af1ef-20220823043839 |
Apache License 2.0 |
mariadb |
mirantis.azurecr.io/general/mariadb:10.6.17-focal-20240523075821 |
GPLv2, LGPLv2.1 (client libraries) |
rabbitmq-exporter |
mirantis.azurecr.io/stacklight/rabbitmq-exporter:1.0.0 |
MIT License |
memcached-exporter |
mirantis.azurecr.io/stacklight/memcached-exporter:v0.14.4 |
Apache License 2.0 |
prometheus-mysql-exporter |
mirantis.azurecr.io/stacklight/mysqld-exporter:v0.11.0 |
Apache License 2.0 |
aodh |
mirantis.azurecr.io/openstack/aodh:antelope-jammy-20240816113600 |
Apache License 2.0 |
ceilometer |
mirantis.azurecr.io/openstack/ceilometer:antelope-jammy-20240816113600 |
Apache License 2.0 |
gnocchi |
mirantis.azurecr.io/openstack/gnocchi:antelope-jammy-20240816113600 |
Apache License 2.0 |
redis |
mirantis.azurecr.io/openstack/extra/redis:7.2.4-alpine3.19-1 |
BSD 3-Clause “New” or “Revised” License |
redis-operator |
mirantis.azurecr.io/openstack/extra/redis-operator:v1.2.4-20240427152750 |
Unknown |
frr |
mirantis.azurecr.io/general/external/docker.io/frrouting/frr:v9.0.2-20240318063427 |
GPL-2.0 and LGPL-2.1 |
strongswan |
mirantis.azurecr.io/openstack/extra/strongswan:alpine-5.9.12-20240129155309 |
GPL-2.0 |
rsyslog |
mirantis.azurecr.io/openstack/extra/rsyslog:v8.2001.0-20231018050930 |
GNU General Public License v3 |
descheduler |
mirantis.azurecr.io/openstack/extra/descheduler:v0.29.0 |
Apache License 2.0 |
nginx |
mirantis.azurecr.io/openstack/extra/nginx:1.25.3-20240131112557 |
Apache License 2.0 |
requirements |
mirantis.azurecr.io/openstack/requirements:antelope-jammy-20240816113600 |
Apache License 2.0 |
drb-controller |
mirantis.azurecr.io/openstack/extra/drb-controller:0.1.0-20240701093549 |
Mirantis Proprietary License |
stepler |
mirantis.azurecr.io/openstack/stepler:antelope-jammy-20240820091923 |
Apache License 2.0 |
placement |
mirantis.azurecr.io/openstack/placement:antelope-jammy-20240816113600 |
Apache License 2.0 |
masakari |
mirantis.azurecr.io/openstack/masakari:antelope-jammy-20240816113600 |
Apache License 2.0 |
masakari-monitors |
mirantis.azurecr.io/openstack/masakari-monitors:antelope-jammy-20240816113600 |
Apache License 2.0 |
ironic-inspector |
mirantis.azurecr.io/openstack/ironic-inspector:antelope-jammy-20240816113600 |
Apache License 2.0 |
manila |
mirantis.azurecr.io/openstack/manila:antelope-jammy-20240816113600 |
Apache License 2.0 |
MOSK 24.2.2 OpenStack Yoga binaries and Docker images
Component |
Path |
License information for main executable programs |
|---|---|---|
Binaries |
||
octavia-amphora |
https://binary.mirantis.com/openstack/bin/octavia/amphora-x64-haproxy-yoga-20240816121612.qcow2 |
Mirantis Proprietary License |
mirantis |
https://binary.mirantis.com/openstack/bin/horizon/mirantis-yoga-186584b-20230817112411.tar.gz |
Mirantis Proprietary License |
kernel |
https://binary.mirantis.com/openstack/bin/ironic/tinyipa/tinyipa-stable-yoga-20231004061110.vmlinuz |
GPL-2.0 |
initramfs |
https://binary.mirantis.com/openstack/bin/ironic/tinyipa/tinyipa-stable-yoga-20231004061110.gz |
GPL-2.0 |
service-image |
https://binary.mirantis.com/openstack/bin/manila/manila-service-image-20240318125453.qcow2 |
Mirantis Proprietary License |
Docker images |
||
keystone |
mirantis.azurecr.io/openstack/keystone:yoga-jammy-20240816113602 |
Apache License 2.0 |
heat |
mirantis.azurecr.io/openstack/heat:yoga-jammy-20240816113602 |
Apache License 2.0 |
glance |
mirantis.azurecr.io/openstack/glance:yoga-jammy-20240816113602 |
Apache License 2.0 |
cinder |
mirantis.azurecr.io/openstack/cinder:yoga-jammy-20240816113602 |
Apache License 2.0 |
osprober |
mirantis.azurecr.io/openstack/osprober:0.0.1-b8aa7cb |
Unknown |
neutron |
mirantis.azurecr.io/openstack/neutron:yoga-jammy-20240816113602 |
Apache License 2.0 |
nova |
mirantis.azurecr.io/openstack/nova:yoga-jammy-20240816113602 |
Apache License 2.0 |
horizon |
mirantis.azurecr.io/openstack/horizon:yoga-jammy-20240816113602 |
Apache License 2.0 |
tempest |
mirantis.azurecr.io/openstack/tempest:yoga-jammy-20240816113602 |
Apache License 2.0 |
octavia |
mirantis.azurecr.io/openstack/octavia:yoga-jammy-20240816113602 |
Apache License 2.0 |
designate |
mirantis.azurecr.io/openstack/designate:yoga-jammy-20240816113602 |
Apache License 2.0 |
ironic |
mirantis.azurecr.io/openstack/ironic:yoga-jammy-20240816113602 |
Apache License 2.0 |
barbican |
mirantis.azurecr.io/openstack/barbican:yoga-jammy-20240816113602 |
Apache License 2.0 |
libvirt |
mirantis.azurecr.io/general/libvirt:8.0.x-jammy-reef-20240801131834 |
LGPL-2.1 License |
pause |
mirantis.azurecr.io/general/external/pause:3.1 |
Apache License 2.0 |
openvswitch |
mirantis.azurecr.io/general/openvswitch:2.17-jammy-20231018050930 |
Apache License 2.0 |
openvswitch-dpdk |
mirantis.azurecr.io/general/openvswitch-dpdk:2.17-jammy-20231018050930 |
Apache License 2.0 |
openstack-tools |
mirantis.azurecr.io/openstack/openstack-tools:yoga-jammy-20240816113602 |
Apache License 2.0 |
rabbitmq |
mirantis.azurecr.io/openstack/extra/rabbitmq:3.12.12-jammy-20240209104455 |
Mozilla Public License 2.0 |
rabbitmq-management |
mirantis.azurecr.io/openstack/extra/rabbitmq-management:3.12.12-jammy-20240209104455 |
Mozilla Public License 2.0 |
kubernetes-entrypoint |
mirantis.azurecr.io/openstack/extra/kubernetes-entrypoint:v1.0.1-4e381cb-20240813170642 |
Apache License 2.0 |
memcached |
mirantis.azurecr.io/general/memcached:v1.6.23-alpine-20240131134844 |
BSD 3-Clause “New” or “Revised” License |
etcd |
mirantis.azurecr.io/openstack/extra/etcd:v3.5.11-alpine-20240131112547 |
Apache License 2.0 |
powerdns |
mirantis.azurecr.io/openstack/extra/powerdns:4.8-alpine-20240308161357 |
GPL-2.0 License |
nginx-ingress-controller |
mirantis.azurecr.io/openstack/extra/nginx-ingress-controller:1.10.3-alpine-20240729113916 |
Apache License 2.0 |
tls-proxy |
mirantis.azurecr.io/openstack/tls-proxy:focal-fipster-20230725114156 |
Mirantis Proprietary License |
defaultbackend |
mirantis.azurecr.io/openstack/extra/defaultbackend:v1.19.2-77af1ef-20220823043839 |
Apache License 2.0 |
mariadb |
mirantis.azurecr.io/general/mariadb:10.6.17-focal-20240523075821 |
GPLv2, LGPLv2.1 (client libraries) |
rabbitmq-exporter |
mirantis.azurecr.io/stacklight/rabbitmq-exporter:1.0.0 |
MIT License |
memcached-exporter |
mirantis.azurecr.io/stacklight/memcached-exporter:v0.14.4 |
Apache License 2.0 |
prometheus-mysql-exporter |
mirantis.azurecr.io/stacklight/mysqld-exporter:v0.11.0 |
Apache License 2.0 |
aodh |
mirantis.azurecr.io/openstack/aodh:yoga-jammy-20240816113602 |
Apache License 2.0 |
ceilometer |
mirantis.azurecr.io/openstack/ceilometer:yoga-jammy-20240816113602 |
Apache License 2.0 |
gnocchi |
mirantis.azurecr.io/openstack/gnocchi:yoga-jammy-20240816113602 |
Apache License 2.0 |
redis |
mirantis.azurecr.io/openstack/extra/redis:7.2.4-alpine3.19-1 |
BSD 3-Clause “New” or “Revised” License |
redis-operator |
mirantis.azurecr.io/openstack/extra/redis-operator:v1.2.4-20240427152750 |
Unknown |
frr |
mirantis.azurecr.io/general/external/docker.io/frrouting/frr:v9.0.2-20240318063427 |
GPL-2.0 and LGPL-2.1 |
strongswan |
mirantis.azurecr.io/openstack/extra/strongswan:alpine-5.9.12-20240129155309 |
GPL-2.0 |
rsyslog |
mirantis.azurecr.io/openstack/extra/rsyslog:v8.2001.0-20231018050930 |
GNU General Public License v3 |
descheduler |
mirantis.azurecr.io/openstack/extra/descheduler:v0.29.0 |
Apache License 2.0 |
nginx |
mirantis.azurecr.io/openstack/extra/nginx:1.25.3-20240131112557 |
Apache License 2.0 |
requirements |
mirantis.azurecr.io/openstack/requirements:yoga-jammy-20240816113602 |
Apache License 2.0 |
drb-controller |
mirantis.azurecr.io/openstack/extra/drb-controller:0.1.0-20240701093549 |
Mirantis Proprietary License |
stepler |
mirantis.azurecr.io/openstack/stepler:yoga-focal-20240610161716 |
Apache License 2.0 |
placement |
mirantis.azurecr.io/openstack/placement:yoga-jammy-20240816113602 |
Apache License 2.0 |
masakari |
mirantis.azurecr.io/openstack/masakari:yoga-jammy-20240816113602 |
Apache License 2.0 |
masakari-monitors |
mirantis.azurecr.io/openstack/masakari-monitors:yoga-jammy-20240816113602 |
Apache License 2.0 |
ironic-inspector |
mirantis.azurecr.io/openstack/ironic-inspector:yoga-jammy-20240816113602 |
Apache License 2.0 |
manila |
mirantis.azurecr.io/openstack/manila:yoga-jammy-20240816113602 |
Apache License 2.0 |
MOSK 24.2.2 OpenStack Helm charts
MOSK 24.2.2 Tungsten Fabric 21.4 artifacts
Component |
Path |
License information for main executable programs |
|---|---|---|
Helm charts |
||
tungstenfabric-operator |
https://binary.mirantis.com/tungsten/helm/tungstenfabric-operator-0.15.6.tgz |
Mirantis Proprietary License |
Docker images |
||
tungstenfabric-operator |
mirantis.azurecr.io/tungsten-operator/tungstenfabric-operator:0.15.6 |
Mirantis Proprietary License |
tungsten-pytest |
mirantis.azurecr.io/tungsten/tungsten-pytest:0.1-20240806152951 |
MIT License |
casskop |
mirantis.azurecr.io/tungsten-operator/casskop:2.2.6 |
Apache License 2.0 |
cassandra-bootstrap |
mirantis.azurecr.io/tungsten/cassandra-bootstrap:0.1.18 |
Apache License 2.0 |
cassandra |
mirantis.azurecr.io/tungsten/cassandra:3.11.17 |
Apache License 2.0 |
cassandra-config-builder |
mirantis.azurecr.io/tungsten/cass-config-builder:v2-20240812125407 |
Apache License 2.0 |
rabbitmq-operator |
mirantis.azurecr.io/tungsten-operator/rabbitmq-operator:0.4.5 |
Mirantis Proprietary License |
rabbitmq |
mirantis.azurecr.io/tungsten/rabbitmq:3.11.16 |
Mozilla Public License 2.0 |
rabbitmq-exporter |
mirantis.azurecr.io/stacklight/rabbitmq-exporter:1.0.0 |
MIT License |
zookeeper-operator |
mirantis.azurecr.io/tungsten-operator/zookeeper-operator:0.2.21-mcp |
Apache License 2.0 |
zookeeper |
mirantis.azurecr.io/tungsten/zookeeper:3.8.4-20240813 |
Apache License 2.0 |
redis-operator |
mirantis.azurecr.io/tungsten-operator/redis-operator:0.4.5 |
Apache License 2.0 |
redis |
mirantis.azurecr.io/tungsten/redis:7.2.4-alpine3.19 |
BSD 3-Clause “New” or “Revised” License |
redis-exporter |
mirantis.azurecr.io/stacklight/redis_exporter:v1.62.0 |
BSD 3-Clause “New” or “Revised” License |
tf-cli |
mirantis.azurecr.io/tungsten/tf-cli:0.1-20240820113128 |
MIT License |
kubernetes-entrypoint |
mirantis.azurecr.io/openstack/extra/kubernetes-entrypoint:v1.0.1-4e381cb-20240813170642 |
Apache License 2.0 |
pause |
mirantis.azurecr.io/general/external/pause:3.1 |
Apache License 2.0 |
tf-nodeinfo |
mirantis.azurecr.io/tungsten/tf-nodeinfo:0.1-20240812125441 |
MIT License |
contrail-controller-config-api |
mirantis.azurecr.io/tungsten/contrail-controller-config-api:24.2-r21.4.20240819135158 |
Apache License 2.0 |
contrail-controller-config-devicemgr |
mirantis.azurecr.io/tungsten/contrail-controller-config-devicemgr:24.2-r21.4.20240819135158 |
Apache License 2.0 |
contrail-controller-config-dnsmasq |
mirantis.azurecr.io/tungsten/contrail-controller-config-dnsmasq:24.2-r21.4.20240819135158 |
Apache License 2.0 |
contrail-controller-config-schema |
mirantis.azurecr.io/tungsten/contrail-controller-config-schema:24.2-r21.4.20240819135158 |
Apache License 2.0 |
contrail-controller-config-svcmonitor |
mirantis.azurecr.io/tungsten/contrail-controller-config-svcmonitor:24.2-r21.4.20240819135158 |
Apache License 2.0 |
contrail-controller-control-control |
mirantis.azurecr.io/tungsten/contrail-controller-control-control:24.2-r21.4.20240819135158 |
Apache License 2.0 |
contrail-controller-control-dns |
mirantis.azurecr.io/tungsten/contrail-controller-control-dns:24.2-r21.4.20240819135158 |
Apache License 2.0 |
contrail-controller-control-named |
mirantis.azurecr.io/tungsten/contrail-controller-control-named:24.2-r21.4.20240819135158 |
Apache License 2.0 |
contrail-controller-webui-job |
mirantis.azurecr.io/tungsten/contrail-controller-webui-job:24.2-r21.4.20240819135158 |
Apache License 2.0 |
contrail-controller-webui-web |
mirantis.azurecr.io/tungsten/contrail-controller-webui-web:24.2-r21.4.20240819135158 |
Apache License 2.0 |
contrail-node-init |
mirantis.azurecr.io/tungsten/contrail-node-init:21.4.20240530000000 |
Apache License 2.0 |
contrail-nodemgr |
mirantis.azurecr.io/tungsten/contrail-nodemgr:24.2-r21.4.20240819135158 |
Apache License 2.0 |
contrail-provisioner |
mirantis.azurecr.io/tungsten/contrail-provisioner:24.2-r21.4.20240819135158 |
Apache License 2.0 |
contrail-tools |
mirantis.azurecr.io/tungsten/contrail-tools:24.2-r21.4.20240819135158 |
Apache License 2.0 |
contrail-vrouter-agent |
mirantis.azurecr.io/tungsten/contrail-vrouter-agent:21.4.20240530000000 |
Apache License 2.0 |
contrail-vrouter-agent-dpdk |
mirantis.azurecr.io/tungsten/contrail-vrouter-agent-dpdk:21.4.20240530000000 |
Apache License 2.0 |
contrail-vrouter-kernel-build-init |
mirantis.azurecr.io/tungsten/contrail-vrouter-kernel-build-init:21.4.20240530000000 |
Apache License 2.0 |
MOSK 24.2.2 StackLight artifacts
Component |
Path |
License information for main executable programs |
|---|---|---|
Docker images |
||
prometheus-libvirt-exporter |
mirantis.azurecr.io/stacklight/prometheus-libvirt-exporter:v0.2-20240821023010 |
Mirantis Proprietary License |
tungstenfabric-prometheus-exporter |
mirantis.azurecr.io/stacklight/tungstenfabric-prometheus-exporter:0.1-20240119124301 |
Mirantis Proprietary License |
Helm charts |
||
fluentd |
https://binary.mirantis.com/stacklight/helm/fluentd-2.0.3-mcp-52.tgz |
Mirantis Proprietary License |
prometheus-libvirt-exporter |
https://binary.mirantis.com/stacklight/helm/prometheus-libvirt-exporter-0.2.0-mcp-7.tgz |
Mirantis Proprietary License |
prometheus-tungstenfabric-exporter |
https://binary.mirantis.com/stacklight/helm/prometheus-tungstenfabric-exporter-0.2.0-mcp-7.tgz |
Mirantis Proprietary License |
The table below contains the total number of addressed unique and common CVEs by MOSK-specific component compared to the previous patch release version. The common CVEs are issues addressed across several images.
Product component |
CVE type |
Critical |
High |
Total |
|---|---|---|---|---|
OpenStack |
Unique |
3 |
29 |
32 |
Common |
7 |
59 |
66 |
|
Tungsten Fabric |
Unique |
4 |
55 |
59 |
Common |
44 |
483 |
527 |
Mirantis Security Portal
For the detailed list of fixed and present CVEs across the Mirantis Container Cloud and MOSK products, refer to Mirantis Security Portal.
Mirantis Container Cloud CVEs
For the number of fixed CVEs in the Mirantis Container Cloud-related components including kaas core, bare metal, Ceph, and StackLight, refer to Container Cloud 2.27.4: Security notes.
This section lists MOSK known issues with workarounds for the MOSK release 24.2.2:
During MariaDB operations on a management cluster, Pods may get stuck in continuous restarts with the following example error:
[ERROR] WSREP: Corrupt buffer header: \
addr: 0x7faec6f8e518, \
seqno: 3185219421952815104, \
size: 909455917, \
ctx: 0x557094f65038, \
flags: 11577. store: 49, \
type: 49
Workaround:
Create a backup of the
/var/lib/mysqldirectory on themariadb-serverPod.Verify that other replicas are up and ready.
Remove the
galera.cachefile for the affectedmariadb-serverPod.Remove the affected
mariadb-serverPod or wait until it is automatically restarted.
After Kubernetes restarts the Pod, the Pod clones the database in 1-2 minutes and restores the quorum.
Due to the MetalLB upstream issue, a load balancer service may not obtain the external IP address.
The issue occurs when two services share the same external IP address and have
the same externalTrafficPolicy value. Initially, the services have the
external IP address assigned and are accessible. After modifying the
externalTrafficPolicy value for both services from Cluster to
Local, the first service that has been changed remains with no external IP
address assigned. Though, the second service, which was changed later, has the
external IP assigned as expected.
To work around the issue, make a dummy change to the service object where
external IP is <pending>:
Identify the service that is stuck:
kubectl get svc -A | grep pending
Example of system response:
stacklight iam-proxy-prometheus LoadBalancer 10.233.28.196 <pending> 443:30430/TCP
Add an arbitrary label to the service that is stuck. For example:
kubectl label svc -n stacklight iam-proxy-prometheus reconcile=1
Example of system response:
service/iam-proxy-prometheus labeledVerify that the external IP was allocated to the service:
kubectl get svc -n stacklight iam-proxy-prometheus
Example of system response:
NAME TYPE CLUSTER-IP EXTERNAL-IP PORT(S) AGE iam-proxy-prometheus LoadBalancer 10.233.28.196 10.0.34.108 443:30430/TCP 12d
Sometimes, after changing the OpenStackDeployment custom resource,
it does not transition to the APPLYING state as expected.
To work around the issue, restart the rockoon` pod in the osh-system
namespace.
Rebooting all Cassandra cluster TFConfig or TFAnalytics nodes, maintenance, or other circumstances that cause the Cassandra pods to start simultaneously may cause a broken Cassandra TFConfig and/or TFAnalytics cluster. In this case, Cassandra nodes do not join the ring and do not update the IPs of the neighbor nodes. As a result, the TF services cannot operate Cassandra cluster(s).
To verify that a Cassandra cluster is affected:
Run the nodetool status command specifying the config or
analytics cluster and the replica number:
kubectl -n tf exec -it tf-cassandra-<config/analytics>-dc1-rack1-<replica number> -c cassandra -- nodetool status
Example of system response with outdated IP addresses:
Datacenter: DC1
===============
Status=Up/Down
|/ State=Normal/Leaving/Joining/Moving
-- Address Load Tokens Owns (effective) Host ID Rack
DN <outdated ip> ? 256 64.9% a58343d0-1e3f-4d54-bcdf-9b9b949ca873 r1
DN <outdated ip> ? 256 69.8% 67f1d07c-8b13-4482-a2f1-77fa34e90d48 r1
Datacenter: dc1
===============
Status=Up/Down
|/ State=Normal/Leaving/Joining/Moving
-- Address Load Tokens Owns (effective) Host ID Rack
UN <actual ip> 3.84 GiB 256 65.2% 7324ebc4-577a-425f-b3de-96faac95a331 rack1
Workaround:
Manually delete the Cassandra pod from the failed config or analytics
cluster to re-initiate the bootstrap process for one of the Cassandra nodes:
kubectl -n tf delete pod tf-cassandra-<config/analytics>-dc1-rack1-<replica_num>
Occasionally, RabbitMQ instances in tf-rabbitmq pods fail to enable
the tracking_records_in_ets during the initialization process.
To work around the problem, restart the affected pods manually.
After replacing a failed Tungsten Fabric controller node as described in Replace a failed TF controller node, the first restart of the Cassandra pod on this node may cause an issue if the Cassandra node with the outdated IP address has not been removed from the cluster. Subsequent Cassandra pod restarts should not trigger this problem.
To verify if your Cassandra cluster is affected, run the nodetool status command specifying the config or analytics cluster and the replica number:
kubectl -n tf exec -it tf-cassandra-<CONFIG-OR-ANALYTICS>-dc1-rack1-<REPLICA-NUM> -c cassandra -- nodetool status
Example of the system response with outdated IP addresses:
Datacenter: dc1
===============
Status=Up/Down
|/ State=Normal/Leaving/Joining/Moving
-- Address Load Tokens Owns Host ID Rack
UN 192.168.201.144 509.43 KiB 256 ? 7e760a99-fae5-4921-b0c5-d9e6e1eca1c5 rack1
UN 192.168.50.146 534.18 KiB 256 ? 2248ea35-85d4-4887-820b-1fac4733021f rack1
UN 192.168.145.147 484.19 KiB 256 ? d988aaaa-44ae-4fec-a617-0b0a253e736d rack1
DN 192.168.145.144 481.53 KiB 256 ? c23703a1-6854-47a7-a4a2-af649d63af0c rack1
An extra node will appear in the cluster with an outdated IP address
(the IP of the terminated Cassandra pod) in the Down state.
To work around the issue, after replacing the Tungsten Fabric controller node, delete the Cassandra pod on the replaced node and remove the outdated node from the Cassandra cluster using nodetool:
kubectl -n tf exec -it tf-cassandra-<CONFIG-OR-ANALYTICS>-dc1-rack1-<REPLICA-NUM> -c cassandra -- nodetool removenode <HOST-ID>
On clusters running Tungsten Fabric with API v2, after updating from MOSK 24.2 to 24.2.1, subsequent cluster maintenance requests may stuck. The root cause of the issue is a version mismatch within the internal structures of the Tungsten Fabric Operator.
To identify if your cluster is affected, run:
kubectl get clusterworkloadlock tf-openstack-tf -o yaml
The output similar to the one below, indicates that the Tungsten Fabric
ClusterWorkloadLock remains in the active state indefinitely preventing
further LCM operations with other components:
apiVersion: lcm.mirantis.com/v1alpha1
kind: ClusterWorkloadLock
metadata:
creationTimestamp: "2024-08-30T13:50:33Z"
generation: 1
name: tf-openstack-tf
resourceVersion: "4414649"
uid: 582fc558-c343-4e96-a445-a2d1818dcdb2
spec:
controllerName: tungstenfabric
status:
errorMessage: cluster is not in ready state
release: 17.2.4+24.2.2
state: active
Additionally, the LCM controller logs may contain errors similar to:
{"level":"info","ts":"2024-09-02T16:22:16Z","logger":"entrypoint.lcmcluster-controller.req:5520","caller":"lcmcluster/maintenance.go:178","msg":"ClusterWorkloadLock is inactive cwl {{ClusterWorkloadLock lcm.mirantis.com/v1alpha1} {ceph-clusterworkloadlock a45eca91-cd7b-4d68-9a8e-4d656b4308af 3383288 1 2024-08-30 13:15:14 +0000 UTC <nil> <nil> map[] map[miraceph-ready:true] [{v1 Namespace ceph-lcm-mirantis 43853f67-9058-44ed-8287-f650dbeac5d7 <nil> <nil>}]
[] [{ceph-controller Update lcm.mirantis.com/v1alpha1 2024-08-30 13:25:53 +0000 UTC FieldsV1 {\"f:metadata\":{\"f:annotations\":{\".\":{},\"f:miraceph-ready\":{}},\"f:ownerReferences\":{\".\":{},\"k:{\\\"uid\\\":\\\"43853f67-9058-44ed-8287-f650dbeac5d7\\\"}\":{}}},\"f:spec\":{\".\":{},\"f:controllerName\":{}}} } {ceph-controller Update lcm.mirantis.com/v1alpha1 2024-09-02 10:48:27 +0000 UTC FieldsV1 {\"f:status\":{\".\":{},\"f:release\":{},\"f:state\":{}}} status}]} {ceph} {inactive 17.2.4+24.2.2}}","ns":"child-ns-tf","name":"child-cl"}
{"level":"info","ts":"2024-09-02T16:22:16Z","logger":"entrypoint.lcmcluster-controller.req:5520","caller":"lcmcluster/maintenance.go:178","msg":"ClusterWorkloadLock is inactive cwl {{ClusterWorkloadLock lcm.mirantis.com/v1alpha1} {openstack-osh-dev 7de2b86f-d247-4cee-be8d-dcbcf5e1e11b 3382535 1 2024-08-30 13:50:54 +0000 UTC <nil> <nil> map[] map[] [] [] [{pykube-ng Update lcm.mirantis.com/v1alpha1 2024-08-30 13:50:54 +0000 UTC FieldsV1 {\"f:spec\":{\".\":{},\"f:controllerName\":{}}} } {pykube-ng Update lcm.mirantis.com/v1alpha1 2024-09-02 10:47:29 +0000 UTC FieldsV1 {\"f:status\":{\".\":{},\"f:release\":{},\"f:state\":{}}} status}]} {openstack} {inactive 17.2.4+24.2.2}}","ns":"child-ns-tf","name":"child-cl"}
{"level":"info","ts":"2024-09-02T16:22:16Z","logger":"entrypoint.lcmcluster-controller.req:5520","caller":"lcmcluster/maintenance.go:173","msg":"ClusterWorkloadLock is still active cwl {{ClusterWorkloadLock lcm.mirantis.com/v1alpha1} {tf-openstack-tf 582fc558-c343-4e96-a445-a2d1818dcdb2 3382495 1 2024-08-30 13:50:33 +0000 UTC <nil> <nil> map[] map[] [] [] [{maintenance-ctl Update lcm.mirantis.com/v1alpha1 2024-08-30 13:50:33 +0000 UTC FieldsV1 {\"f:spec\":{\".\":{},\"f:controllerName\":{}}} } {maintenance-ctl Update lcm.mirantis.com/v1alpha1 2024-09-02 10:47:25 +0000 UTC FieldsV1 {\"f:status\":{\".\":{},\"f:errorMessage\":{},\"f:release\":{},\"f:state\":{}}} status}]} {tungstenfabric} {active cluster is not in ready state 17.2.4+24.2.2}}","ns":"child-ns-tf","name":"child-cl"}
{"level":"error","ts":"2024-09-02T16:22:16Z","logger":"entrypoint.lcmcluster-controller.req:5520","caller":"lcmcluster/lcmcluster_controller.go:388","msg":"","ns":"child-ns-tf","name":"child-cl","error":"following ClusterWorkloadLocks in cluster child-ns-tf/child-cl are still active - tf-openstack-tf: InProgress not all ClusterWorkloadLocks are inactive yet","stacktrace":"sigs.k8s.io/cluster-api-provider-openstack/pkg/lcm/controller/lcmcluster.(*ReconcileLCMCluster).updateCluster\n\t/go/src/sigs.k8s.io/cluster-api-provider-openstack/pkg/lcm/controller/lcmcluster/lcmcluster_controller.go:388\nsigs.k8s.io/cluster-api-provider-openstack/pkg/lcm/controller/lcmcluster.(*ReconcileLCMCluster).Reconcile\n\t/go/src/sigs.k8s.io/cluster-api-provider-openstack/pkg/lcm/controller/lcmcluster/lcmcluster_controller.go:223\nsigs.k8s.io/cluster-api-provider-openstack/pkg/service.(*reconcilePanicCatcher).Reconcile\n\t/go/src/sigs.k8s.io/cluster-api-provider-openstack/pkg/service/reconcile.go:98\nsigs.k8s.io/cluster-api-provider-openstack/pkg/service.(*reconcileContextEnricher).Reconcile\n\t/go/src/sigs.k8s.io/cluster-api-provider-openstack/pkg/service/reconcile.go:78\nsigs.k8s.io/cluster-api-provider-openstack/pkg/service.(*reconcileMetrics).Reconcile\n\t/go/src/sigs.k8s.io/cluster-api-provider-openstack/pkg/service/reconcile.go:136\nsigs.k8s.io/controller-runtime/pkg/internal/controller.(*Controller).Reconcile\n\t/go/pkg/mod/sigs.k8s.io/controller-runtime@v0.15.3/pkg/internal/controller/controller.go:118\nsigs.k8s.io/controller-runtime/pkg/internal/controller.(*Controller).reconcileHandler\n\t/go/pkg/mod/sigs.k8s.io/controller-runtime@v0.15.3/pkg/internal/controller/controller.go:31:
To work around the issue, set the actual version of
Tungsten Fabric Operator in the TFOperator custom resource:
For MOSK 24.2.1:
kubectl -n tf patch tfoperators.tf.mirantis.com openstack-tf --type=merge --subresource status --patch 'status: {operatorVersion: <0.15.5>}'
For MOSK 24.2.2:
kubectl -n tf patch tfoperators.tf.mirantis.com openstack-tf --type=merge --subresource status --patch 'status: {operatorVersion: <0.15.6>}'
During major or patch update of a MOSK cluster with StackLight enabled in
non-HA mode, the KubePodsCrashLooping alert may be firing for the Grafana
ReplicaSet.
Grafana relies on PostgreSQL for persistent data. In non-HA StackLight setup,
PostgreSQL becomes temporarily unavailable during updates. If Grafana loses its
database connection or fails to establish one during startup, Grafana fails
with an error. This may cause the Grafana pod to enter the CrashLoopBackOff
state. Such behavior is expected in non-HA StackLight setups. The Grafana pod
will resume normal operation after PostgreSQL is restored.
To prevent the issue, deploy StackLight in HA mode.
Custom Grafana panels and dashboards may be corrupted after automatic migration of deprecated Angular-based plugins to the React-based ones. For details, see Deprecation Notes: Angular plugins in Grafana dashboards and the post-update step Back up custom Grafana dashboards in MOSK 24.3 update notes.
To work around the issue, manually adjust the affected dashboards to restore their custom appearance.
Fixed in MOSK 25.1 Fixed in MOSK 25.1.1
When updating to the MOSK 24.3 series, tf-config pods from the Tungsten
Fabric namespace may enter the CrashLoopBackOff state. For example:
tf-config-cs8zr 2/5 CrashLoopBackOff 676 (19s ago) 15h
tf-config-db-6zxgg 1/1 Running 44 (25m ago) 15h
tf-config-db-7k5sz 1/1 Running 43 (23m ago) 15h
tf-config-db-dlwdv 1/1 Running 43 (25m ago) 15h
tf-config-nw4tr 3/5 CrashLoopBackOff 665 (43s ago) 15h
tf-config-wzf6c 1/5 CrashLoopBackOff 680 (10s ago) 15h
tf-control-c6bnn 3/4 Running 41 (23m ago) 13h
tf-control-gsnnp 3/4 Running 42 (23m ago) 13h
tf-control-sj6fd 3/4 Running 41 (23m ago) 13h
To troubleshoot the issue, check the logs inside the tf-config API
container and the tf-cassandra pods. The following example logs
indicate that Cassandra services failed to peer with each other and
are operating independently:
Logs from the
tf-configAPI container:NoHostAvailable: ('Unable to complete the operation against any hosts', {<Host: 192.168.200.23:9042 dc1>: Unavailable('Error from server: code=1000 [Unavailable exception] message="Cannot achieve consistency level QUORUM" info={\'required_replicas\': 2, \'alive_replicas\': 1, \'consistency\': \'QUORUM\'}',)})Logs from the
tf-cassandrapods:INFO [OptionalTasks:1] 2024-09-09 08:59:36,231 CassandraRoleManager.java:419 - Setup task failed with error, rescheduling WARN [OptionalTasks:1] 2024-09-09 08:59:46,231 CassandraRoleManager.java:379 - CassandraRoleManager skipped default role setup: some nodes were not ready
To work around the issue, restart the Cassandra services in the Tungsten Fabric namespace by deleting the affected pods sequentially to establish the connection between them:
kubectl -n tf delete pod tf-cassandra-config-dc1-rack1-0
kubectl -n tf delete pod tf-cassandra-config-dc1-rack1-1
kubectl -n tf delete pod tf-cassandra-config-dc1-rack1-2
Now, all other services in the Tungsten Fabric namespace should be in
the Active state.
Fixed in 2.30.0 (21.0.0 and 20.0.0)
A compact MOSK cluster fails to be deployed through the Container Cloud web UI
due to inability to add any label to the control plane machines along with
inability to change dedicatedControlPlane: false using the web UI.
To work around the issue, manually add the required labels using CLI. Once done, the cluster deployment resumes.
A newly created project does not display all available tabs and contains different access denied errors during first five minutes after creation.
To work around the issue, refresh the browser in five minutes after the project creation.
To improve user update experience and make the update path more flexible, MOSK is introducing a new scheme of updating between cluster releases. For the details and possible update paths, refer to 24.1.5 update notes: Cluster update scheme.
The following table provides details on the impact of a MOSK cluster update to a patch release within the 24.2 series.
Note
For the detailed workflow of update to a patch release, refer to Update to a patch version.
Updated component |
Impact on cloud users |
Impact on cloud workloads |
|---|---|---|
OpenStack and Tungsten Fabric |
|
Open vSwitch networking - interruption of North-South connectivity, depending on the type of virtual routers used by a workload:
Tungsten Fabric networking - no impact |
Ceph |
~1% of read operations on object storage API may fail |
IO performance degradation for Ceph-backed virtual storage devices. Pay special attention to the known issue 50566 that may affect the maintenance window. |
Host OS components |
No impact |
No impact |
- 0(1,2)
You can bypass updating components of the cloud data plane to avoid the network downtime during Update to a patch version. By using this technique, you accept the risk that some security fixes may not be applied.
24.2.3 patch
The patch release notes contain the description of product enhancements, the list of updated artifacts and Common Vulnerabilities and Exposures (CVE) fixes as well as description of the addressed product issues for the MOSK 24.2.3 patch, if any.
Release date |
October 30, 2024 |
|---|---|
Scope |
Patch |
Cluster release |
17.2.5 |
OpenStack Operator |
0.16.15 |
Tungsten Fabric Operator |
0.15.7 |
The MOSK 24.2.3 patch provides the following updates:
Support for MKE 3.7.15
Update of minor kernel version to
5.15.0-122-genericSecurity fixes for CVEs in images
Resolved product issues
For the list of enhancements and bug fixes that relate to Mirantis Container Cloud, refer to the Mirantis Container Cloud Release notes.
Learn more about the release cadence
This section lists the components artifacts of the MOSK 24.2.3 release that includes binaries, Docker images, and Helm charts.
MOSK 24.2.3 OpenStack Helm charts
Component |
Path |
License information for main executable programs |
|---|---|---|
openstack-operator |
https://binary.mirantis.com/openstack/helm/openstack-controller/openstack-operator-0.16.15.tgz |
Mirantis Proprietary License |
MOSK 24.2.3 OpenStack Antelope binaries and Docker images
Component |
Path |
License information for main executable programs |
|---|---|---|
Binaries |
||
octavia-amphora |
https://binary.mirantis.com/openstack/bin/octavia/amphora-x64-haproxy-antelope-20240927174140.qcow2 |
Mirantis Proprietary License |
mirantis |
https://binary.mirantis.com/openstack/bin/horizon/mirantis-antelope-18a1377-20230817112356.tar.gz |
Mirantis Proprietary License |
kernel |
GPL-2.0 |
|
initramfs |
https://binary.mirantis.com/openstack/bin/ironic/tinyipa/tinyipa-stable-antelope-20240213233421.gz |
GPL-2.0 |
service-image |
https://binary.mirantis.com/openstack/bin/manila/manila-service-image-20240318125453.qcow2 |
Mirantis Proprietary License |
Docker images |
||
keystone |
mirantis.azurecr.io/openstack/keystone:antelope-jammy-20240927160001 |
Apache License 2.0 |
heat |
mirantis.azurecr.io/openstack/heat:antelope-jammy-20240927160001 |
Apache License 2.0 |
glance |
mirantis.azurecr.io/openstack/glance:antelope-jammy-20240927160001 |
Apache License 2.0 |
cinder |
mirantis.azurecr.io/openstack/cinder:antelope-jammy-20240927160001 |
Apache License 2.0 |
osprober |
mirantis.azurecr.io/openstack/osprober:0.0.1-eae04fb |
Apache License 2.0 |
neutron |
mirantis.azurecr.io/openstack/neutron:antelope-jammy-20240927160001 |
Apache License 2.0 |
nova |
mirantis.azurecr.io/openstack/nova:antelope-jammy-20240927160001 |
Apache License 2.0 |
horizon |
mirantis.azurecr.io/openstack/horizon:antelope-jammy-20240927160001 |
Apache License 2.0 |
tempest |
mirantis.azurecr.io/openstack/tempest:antelope-jammy-20240927160001 |
Apache License 2.0 |
octavia |
mirantis.azurecr.io/openstack/octavia:antelope-jammy-20240927160001 |
Apache License 2.0 |
designate |
mirantis.azurecr.io/openstack/designate:antelope-jammy-20240927160001 |
Apache License 2.0 |
ironic |
mirantis.azurecr.io/openstack/ironic:antelope-jammy-20240927160001 |
Apache License 2.0 |
barbican |
mirantis.azurecr.io/openstack/barbican:antelope-jammy-20240927160001 |
Apache License 2.0 |
libvirt |
mirantis.azurecr.io/general/libvirt:8.0.x-jammy-reef-20240822074257 |
LGPL-2.1 License |
pause |
mirantis.azurecr.io/general/external/pause:3.1 |
Apache License 2.0 |
openvswitch |
mirantis.azurecr.io/general/openvswitch:2.17-jammy-20240827065304 |
Apache License 2.0 |
openvswitch-dpdk |
mirantis.azurecr.io/general/openvswitch-dpdk:2.17-jammy-20240827065304 |
Apache License 2.0 |
openstack-tools |
mirantis.azurecr.io/openstack/openstack-tools:yoga-jammy-20240819060021 |
Apache License 2.0 |
rabbitmq |
mirantis.azurecr.io/openstack/extra/rabbitmq:3.12.12-jammy-20240829072728 |
Mozilla Public License 2.0 |
rabbitmq-management |
mirantis.azurecr.io/openstack/extra/rabbitmq-management:3.12.12-jammy-20240829072728 |
Mozilla Public License 2.0 |
kubernetes-entrypoint |
mirantis.azurecr.io/openstack/extra/kubernetes-entrypoint:v1.0.1-34a4f54-20240910081335 |
Apache License 2.0 |
memcached |
mirantis.azurecr.io/general/memcached:v1.6.23-alpine-20240905100031 |
BSD 3-Clause “New” or “Revised” License |
etcd |
mirantis.azurecr.io/openstack/extra/etcd:v3.5.16-alpine-20240911082430 |
Apache License 2.0 |
powerdns |
mirantis.azurecr.io/openstack/extra/powerdns:4.8-alpine-20240923091141 |
GPL-2.0 License |
nginx-ingress-controller |
mirantis.azurecr.io/openstack/extra/nginx-ingress-controller:1.11.2-alpine-20240913100326 |
Apache License 2.0 |
tls-proxy |
mirantis.azurecr.io/openstack/tls-proxy:jammy-fipster-1.0.0.dev2 |
Mirantis Proprietary License |
defaultbackend |
mirantis.azurecr.io/openstack/extra/defaultbackend:v1.19.2-77af1ef-20240910090142 |
Apache License 2.0 |
mariadb |
mirantis.azurecr.io/general/mariadb:10.6.17-jammy-20240927170336 |
GPLv2, LGPLv2.1 (client libraries) |
rabbitmq-exporter |
mirantis.azurecr.io/stacklight/rabbitmq-exporter:1.0.0 |
MIT License |
memcached-exporter |
mirantis.azurecr.io/stacklight/memcached-exporter:v0.14.4 |
Apache License 2.0 |
prometheus-mysql-exporter |
mirantis.azurecr.io/stacklight/mysqld-exporter:v0.11.0 |
Apache License 2.0 |
aodh |
mirantis.azurecr.io/openstack/aodh:antelope-jammy-20240927160001 |
Apache License 2.0 |
ceilometer |
mirantis.azurecr.io/openstack/ceilometer:antelope-jammy-20240927160001 |
Apache License 2.0 |
gnocchi |
mirantis.azurecr.io/openstack/gnocchi:antelope-jammy-20240927160001 |
Apache License 2.0 |
redis |
mirantis.azurecr.io/openstack/extra/redis:7.2.x-alpine-20240905134302 |
BSD 3-Clause “New” or “Revised” License |
redis-operator |
mirantis.azurecr.io/openstack/extra/redis-operator:v1.2.4-20240909123821 |
Apache License 2.0 |
frr |
mirantis.azurecr.io/general/external/docker.io/frrouting/frr:v9.1.2-20240918073840 |
GPL-2.0 and LGPL-2.1 |
strongswan |
mirantis.azurecr.io/openstack/extra/strongswan:alpine-5.9.12-20240905114128 |
GPL-2.0 |
rsyslog |
mirantis.azurecr.io/openstack/extra/rsyslog:v8.2001.0-20240829110216 |
GNU General Public License v3 |
descheduler |
mirantis.azurecr.io/openstack/extra/descheduler-20240910121701:v0.30.1-amd64-20240910114244 |
Apache License 2.0 |
nginx |
mirantis.azurecr.io/openstack/extra/nginx:1.25.3-20240905140249 |
Apache License 2.0 |
requirements |
mirantis.azurecr.io/openstack/requirements:antelope-jammy-20240927160001 |
Apache License 2.0 |
drb-controller |
mirantis.azurecr.io/openstack/extra/drb-controller:0.1.0-20240701093549 |
Mirantis Proprietary License |
stepler |
mirantis.azurecr.io/openstack/stepler:antelope-jammy-20240926184743 |
Apache License 2.0 |
placement |
mirantis.azurecr.io/openstack/placement:antelope-jammy-20240927160001 |
Apache License 2.0 |
masakari |
mirantis.azurecr.io/openstack/masakari:antelope-jammy-20240927160001 |
Apache License 2.0 |
masakari-monitors |
mirantis.azurecr.io/openstack/masakari-monitors:antelope-jammy-20240927160001 |
Apache License 2.0 |
ironic-inspector |
mirantis.azurecr.io/openstack/ironic-inspector:antelope-jammy-20240927160001 |
Apache License 2.0 |
manila |
mirantis.azurecr.io/openstack/manila:antelope-jammy-20240927160001 |
Apache License 2.0 |
MOSK 24.2.3 OpenStack Yoga binaries and Docker images
Component |
Path |
License information for main executable programs |
|---|---|---|
Binaries |
||
octavia-amphora |
https://binary.mirantis.com/openstack/bin/octavia/amphora-x64-haproxy-yoga-20240927170837.qcow2 |
Mirantis Proprietary License |
mirantis |
https://binary.mirantis.com/openstack/bin/horizon/mirantis-yoga-186584b-20230817112411.tar.gz |
Mirantis Proprietary License |
kernel |
https://binary.mirantis.com/openstack/bin/ironic/tinyipa/tinyipa-stable-yoga-20231004061110.vmlinuz |
GPL-2.0 |
initramfs |
https://binary.mirantis.com/openstack/bin/ironic/tinyipa/tinyipa-stable-yoga-20231004061110.gz |
GPL-2.0 |
service-image |
https://binary.mirantis.com/openstack/bin/manila/manila-service-image-20240318125453.qcow2 |
Mirantis Proprietary License |
Docker images |
||
keystone |
mirantis.azurecr.io/openstack/keystone:yoga-jammy-20240927160001 |
Apache License 2.0 |
heat |
mirantis.azurecr.io/openstack/heat:yoga-jammy-20240927160001 |
Apache License 2.0 |
glance |
mirantis.azurecr.io/openstack/glance:yoga-jammy-20240927160001 |
Apache License 2.0 |
cinder |
mirantis.azurecr.io/openstack/cinder:yoga-jammy-20240927160001 |
Apache License 2.0 |
osprober |
mirantis.azurecr.io/openstack/osprober:0.0.1-eae04fb |
Apache License 2.0 |
neutron |
mirantis.azurecr.io/openstack/neutron:yoga-jammy-20240927160001 |
Apache License 2.0 |
nova |
mirantis.azurecr.io/openstack/nova:yoga-jammy-20240927160001 |
Apache License 2.0 |
horizon |
mirantis.azurecr.io/openstack/horizon:yoga-jammy-20240927160001 |
Apache License 2.0 |
tempest |
mirantis.azurecr.io/openstack/tempest:yoga-jammy-20240927160001 |
Apache License 2.0 |
octavia |
mirantis.azurecr.io/openstack/octavia:yoga-jammy-20240927160001 |
Apache License 2.0 |
designate |
mirantis.azurecr.io/openstack/designate:yoga-jammy-20240927160001 |
Apache License 2.0 |
ironic |
mirantis.azurecr.io/openstack/ironic:yoga-jammy-20240927160001 |
Apache License 2.0 |
barbican |
mirantis.azurecr.io/openstack/barbican:yoga-jammy-20240927160001 |
Apache License 2.0 |
libvirt |
mirantis.azurecr.io/general/libvirt:8.0.x-jammy-reef-20240822074257 |
LGPL-2.1 License |
pause |
mirantis.azurecr.io/general/external/pause:3.1 |
Apache License 2.0 |
openvswitch |
mirantis.azurecr.io/general/openvswitch:2.17-jammy-20240827065304 |
Apache License 2.0 |
openvswitch-dpdk |
mirantis.azurecr.io/general/openvswitch-dpdk:2.17-jammy-20240827065304 |
Apache License 2.0 |
openstack-tools |
mirantis.azurecr.io/openstack/openstack-tools:yoga-jammy-20240927160001 |
Apache License 2.0 |
rabbitmq |
mirantis.azurecr.io/openstack/extra/rabbitmq:3.12.12-jammy-20240829072728 |
Mozilla Public License 2.0 |
rabbitmq-management |
mirantis.azurecr.io/openstack/extra/rabbitmq-management:3.12.12-jammy-20240829072728 |
Mozilla Public License 2.0 |
kubernetes-entrypoint |
mirantis.azurecr.io/openstack/extra/kubernetes-entrypoint:v1.0.1-34a4f54-20240910081335 |
Apache License 2.0 |
memcached |
mirantis.azurecr.io/general/memcached:v1.6.23-alpine-20240905100031 |
BSD 3-Clause “New” or “Revised” License |
etcd |
mirantis.azurecr.io/openstack/extra/etcd:v3.5.16-alpine-20240911082430 |
Apache License 2.0 |
powerdns |
mirantis.azurecr.io/openstack/extra/powerdns:4.8-alpine-20240923091141 |
GPL-2.0 License |
nginx-ingress-controller |
mirantis.azurecr.io/openstack/extra/nginx-ingress-controller:1.11.2-alpine-20240913100326 |
Apache License 2.0 |
tls-proxy |
mirantis.azurecr.io/openstack/tls-proxy:jammy-fipster-1.0.0.dev2 |
Mirantis Proprietary License |
defaultbackend |
mirantis.azurecr.io/openstack/extra/defaultbackend:v1.19.2-77af1ef-20240910090142 |
Apache License 2.0 |
mariadb |
mirantis.azurecr.io/general/mariadb:10.6.17-jammy-20240927170336 |
GPLv2, LGPLv2.1 (client libraries) |
rabbitmq-exporter |
mirantis.azurecr.io/stacklight/rabbitmq-exporter:1.0.0 |
MIT License |
memcached-exporter |
mirantis.azurecr.io/stacklight/memcached-exporter:v0.14.4 |
Apache License 2.0 |
prometheus-mysql-exporter |
mirantis.azurecr.io/stacklight/mysqld-exporter:v0.11.0 |
Apache License 2.0 |
aodh |
mirantis.azurecr.io/openstack/aodh:yoga-jammy-20240927160001 |
Apache License 2.0 |
ceilometer |
mirantis.azurecr.io/openstack/ceilometer:yoga-jammy-20240927160001 |
Apache License 2.0 |
gnocchi |
mirantis.azurecr.io/openstack/gnocchi:yoga-jammy-20240927160001 |
Apache License 2.0 |
redis |
mirantis.azurecr.io/openstack/extra/redis:7.2.x-alpine-20240905134302 |
BSD 3-Clause “New” or “Revised” License |
redis-operator |
mirantis.azurecr.io/openstack/extra/redis-operator:v1.2.4-20240909123821 |
Apache License 2.0 |
frr |
mirantis.azurecr.io/general/external/docker.io/frrouting/frr:v9.1.2-20240918073840 |
GPL-2.0 and LGPL-2.1 |
strongswan |
mirantis.azurecr.io/openstack/extra/strongswan:alpine-5.9.12-20240905114128 |
GPL-2.0 |
rsyslog |
mirantis.azurecr.io/openstack/extra/rsyslog:v8.2001.0-20240829110216 |
GNU General Public License v3 |
descheduler |
mirantis.azurecr.io/openstack/extra/descheduler-20240910121701:v0.30.1-amd64-20240910114244 |
Apache License 2.0 |
nginx |
mirantis.azurecr.io/openstack/extra/nginx:1.25.3-20240905140249 |
Apache License 2.0 |
requirements |
mirantis.azurecr.io/openstack/requirements:yoga-jammy-20240927160001 |
Apache License 2.0 |
drb-controller |
mirantis.azurecr.io/openstack/extra/drb-controller:0.1.0-20240701093549 |
Mirantis Proprietary License |
stepler |
mirantis.azurecr.io/openstack/stepler:yoga-focal-20240610161716 |
Apache License 2.0 |
placement |
mirantis.azurecr.io/openstack/placement:yoga-jammy-20240927160001 |
Apache License 2.0 |
masakari |
mirantis.azurecr.io/openstack/masakari:yoga-jammy-20240927160001 |
Apache License 2.0 |
masakari-monitors |
mirantis.azurecr.io/openstack/masakari-monitors:yoga-jammy-20240927160001 |
Apache License 2.0 |
ironic-inspector |
mirantis.azurecr.io/openstack/ironic-inspector:yoga-jammy-20240927160001 |
Apache License 2.0 |
manila |
mirantis.azurecr.io/openstack/manila:yoga-jammy-20240927160001 |
Apache License 2.0 |
MOSK 24.2.3 Tungsten Fabric 21.4 artifacts
Component |
Path |
License information for main executable programs |
|---|---|---|
Helm charts |
||
tungstenfabric-operator |
https://binary.mirantis.com/tungsten/helm/tungstenfabric-operator-0.15.7.tgz |
Mirantis Proprietary License |
Docker images |
||
tungstenfabric-operator |
mirantis.azurecr.io/tungsten-operator/tungstenfabric-operator:0.15.7 |
Mirantis Proprietary License |
tungsten-pytest |
mirantis.azurecr.io/tungsten/tungsten-pytest:0.1-20240920135651 |
MIT License |
casskop |
mirantis.azurecr.io/tungsten-operator/casskop:2.2.6 |
Apache License 2.0 |
cassandra-bootstrap |
mirantis.azurecr.io/tungsten/cassandra-bootstrap:0.1.18 |
Apache License 2.0 |
cassandra |
mirantis.azurecr.io/tungsten/cassandra:3.11.17 |
Apache License 2.0 |
cassandra-config-builder |
mirantis.azurecr.io/tungsten/cass-config-builder:v2-20240812125407 |
Apache License 2.0 |
rabbitmq-operator |
mirantis.azurecr.io/tungsten-operator/rabbitmq-operator:0.4.6 |
Mirantis Proprietary License |
rabbitmq |
mirantis.azurecr.io/tungsten/rabbitmq:3.11.16 |
Mozilla Public License 2.0 |
rabbitmq-exporter |
mirantis.azurecr.io/stacklight/rabbitmq-exporter:1.0.0 |
MIT License |
zookeeper-operator |
mirantis.azurecr.io/tungsten-operator/zookeeper-operator:0.2.24-mcp |
Apache License 2.0 |
zookeeper |
mirantis.azurecr.io/tungsten/zookeeper:3.8.4-20240813 |
Apache License 2.0 |
redis-operator |
mirantis.azurecr.io/tungsten-operator/redis-operator:0.4.6 |
Apache License 2.0 |
redis |
mirantis.azurecr.io/tungsten/redis:7.2.4-alpine3.19 |
BSD 3-Clause “New” or “Revised” License |
redis-exporter |
mirantis.azurecr.io/stacklight/redis_exporter:v1.62.0 |
BSD 3-Clause “New” or “Revised” License |
tf-cli |
mirantis.azurecr.io/tungsten/tf-cli:0.1-20240930105454 |
MIT License |
kubernetes-entrypoint |
mirantis.azurecr.io/openstack/extra/kubernetes-entrypoint:v1.0.1-34a4f54-20240910081335 |
Apache License 2.0 |
pause |
mirantis.azurecr.io/general/external/pause:3.1 |
Apache License 2.0 |
tf-nodeinfo |
mirantis.azurecr.io/tungsten/tf-nodeinfo:0.1-20240919130057 |
MIT License |
contrail-controller-config-api |
mirantis.azurecr.io/tungsten/contrail-controller-config-api:24.2-r21.4.20240819135158 |
Apache License 2.0 |
contrail-controller-config-devicemgr |
mirantis.azurecr.io/tungsten/contrail-controller-config-devicemgr:24.2-r21.4.20240819135158 |
Apache License 2.0 |
contrail-controller-config-dnsmasq |
mirantis.azurecr.io/tungsten/contrail-controller-config-dnsmasq:24.2-r21.4.20240819135158 |
Apache License 2.0 |
contrail-controller-config-schema |
mirantis.azurecr.io/tungsten/contrail-controller-config-schema:24.2-r21.4.20240819135158 |
Apache License 2.0 |
contrail-controller-config-svcmonitor |
mirantis.azurecr.io/tungsten/contrail-controller-config-svcmonitor:24.2-r21.4.20240819135158 |
Apache License 2.0 |
contrail-controller-control-control |
mirantis.azurecr.io/tungsten/contrail-controller-control-control:24.2-r21.4.20240819135158 |
Apache License 2.0 |
contrail-controller-control-dns |
mirantis.azurecr.io/tungsten/contrail-controller-control-dns:24.2-r21.4.20240819135158 |
Apache License 2.0 |
contrail-controller-control-named |
mirantis.azurecr.io/tungsten/contrail-controller-control-named:24.2-r21.4.20240819135158 |
Apache License 2.0 |
contrail-controller-webui-job |
mirantis.azurecr.io/tungsten/contrail-controller-webui-job:24.2-r21.4.20240819135158 |
Apache License 2.0 |
contrail-controller-webui-web |
mirantis.azurecr.io/tungsten/contrail-controller-webui-web:24.2-r21.4.20240819135158 |
Apache License 2.0 |
contrail-node-init |
mirantis.azurecr.io/tungsten/contrail-node-init:21.4.20240530000000 |
Apache License 2.0 |
contrail-nodemgr |
mirantis.azurecr.io/tungsten/contrail-nodemgr:24.2-r21.4.20240819135158 |
Apache License 2.0 |
contrail-provisioner |
mirantis.azurecr.io/tungsten/contrail-provisioner:24.2-r21.4.20240819135158 |
Apache License 2.0 |
contrail-tools |
mirantis.azurecr.io/tungsten/contrail-tools:24.2-r21.4.20240819135158 |
Apache License 2.0 |
contrail-vrouter-agent |
mirantis.azurecr.io/tungsten/contrail-vrouter-agent:21.4.20240530000000 |
Apache License 2.0 |
contrail-vrouter-agent-dpdk |
mirantis.azurecr.io/tungsten/contrail-vrouter-agent-dpdk:21.4.20240530000000 |
Apache License 2.0 |
contrail-vrouter-kernel-build-init |
mirantis.azurecr.io/tungsten/contrail-vrouter-kernel-build-init:21.4.20240530000000 |
Apache License 2.0 |
MOSK 24.2.3 StackLight artifacts
Component |
Path |
License information for main executable programs |
|---|---|---|
Docker images |
||
prometheus-libvirt-exporter |
mirantis.azurecr.io/stacklight/prometheus-libvirt-exporter:v0.2-20241021023014 |
|
tungstenfabric-prometheus-exporter |
mirantis.azurecr.io/stacklight/tungstenfabric-prometheus-exporter:0.1-20241021123242 |
|
Helm charts |
||
fluentd |
https://binary.mirantis.com/stacklight/helm/fluentd-2.0.3-mcp-52.tgz |
|
prometheus-libvirt-exporter |
https://binary.mirantis.com/stacklight/helm/prometheus-libvirt-exporter-0.2.0-mcp-7.tgz |
|
prometheus-tungstenfabric-exporter |
https://binary.mirantis.com/stacklight/helm/prometheus-tungstenfabric-exporter-0.2.0-mcp-7.tgz |
The table below contains the total number of addressed unique and common CVEs by MOSK-specific component compared to the previous patch release version. The common CVEs are issues addressed across several images.
Product component |
CVE type |
Critical |
High |
Total |
|---|---|---|---|---|
OpenStack |
Unique |
7 |
64 |
71 |
Common |
29 |
365 |
394 |
|
Tungsten Fabric |
Unique |
7 |
199 |
206 |
Common |
7 |
230 |
237 |
Mirantis Security Portal
For the detailed list of fixed and present CVEs across the Mirantis Container Cloud and MOSK products, refer to Mirantis Security Portal.
Mirantis Container Cloud CVEs
For the number of fixed CVEs in the Mirantis Container Cloud-related components including kaas core, bare metal, Ceph, and StackLight, refer to Container Cloud 2.28.1: Security notes.
The following issues have been addressed in the MOSK 24.2.3 release:
[46220] [Tungsten Fabric] Resolved the issue that caused subsequent cluster maintenance requests to get stuck on clusters running Tungsten Fabric with API v2, after updating from MOSK 24.2 to 24.2.1.
This section lists MOSK known issues with workarounds for the MOSK release 24.2.3:
During MariaDB operations on a management cluster, Pods may get stuck in continuous restarts with the following example error:
[ERROR] WSREP: Corrupt buffer header: \
addr: 0x7faec6f8e518, \
seqno: 3185219421952815104, \
size: 909455917, \
ctx: 0x557094f65038, \
flags: 11577. store: 49, \
type: 49
Workaround:
Create a backup of the
/var/lib/mysqldirectory on themariadb-serverPod.Verify that other replicas are up and ready.
Remove the
galera.cachefile for the affectedmariadb-serverPod.Remove the affected
mariadb-serverPod or wait until it is automatically restarted.
After Kubernetes restarts the Pod, the Pod clones the database in 1-2 minutes and restores the quorum.
Due to the MetalLB upstream issue, a load balancer service may not obtain the external IP address.
The issue occurs when two services share the same external IP address and have
the same externalTrafficPolicy value. Initially, the services have the
external IP address assigned and are accessible. After modifying the
externalTrafficPolicy value for both services from Cluster to
Local, the first service that has been changed remains with no external IP
address assigned. Though, the second service, which was changed later, has the
external IP assigned as expected.
To work around the issue, make a dummy change to the service object where
external IP is <pending>:
Identify the service that is stuck:
kubectl get svc -A | grep pending
Example of system response:
stacklight iam-proxy-prometheus LoadBalancer 10.233.28.196 <pending> 443:30430/TCP
Add an arbitrary label to the service that is stuck. For example:
kubectl label svc -n stacklight iam-proxy-prometheus reconcile=1
Example of system response:
service/iam-proxy-prometheus labeledVerify that the external IP was allocated to the service:
kubectl get svc -n stacklight iam-proxy-prometheus
Example of system response:
NAME TYPE CLUSTER-IP EXTERNAL-IP PORT(S) AGE iam-proxy-prometheus LoadBalancer 10.233.28.196 10.0.34.108 443:30430/TCP 12d
Sometimes, after changing the OpenStackDeployment custom resource,
it does not transition to the APPLYING state as expected.
To work around the issue, restart the rockoon` pod in the osh-system
namespace.
Rebooting all Cassandra cluster TFConfig or TFAnalytics nodes, maintenance, or other circumstances that cause the Cassandra pods to start simultaneously may cause a broken Cassandra TFConfig and/or TFAnalytics cluster. In this case, Cassandra nodes do not join the ring and do not update the IPs of the neighbor nodes. As a result, the TF services cannot operate Cassandra cluster(s).
To verify that a Cassandra cluster is affected:
Run the nodetool status command specifying the config or
analytics cluster and the replica number:
kubectl -n tf exec -it tf-cassandra-<config/analytics>-dc1-rack1-<replica number> -c cassandra -- nodetool status
Example of system response with outdated IP addresses:
Datacenter: DC1
===============
Status=Up/Down
|/ State=Normal/Leaving/Joining/Moving
-- Address Load Tokens Owns (effective) Host ID Rack
DN <outdated ip> ? 256 64.9% a58343d0-1e3f-4d54-bcdf-9b9b949ca873 r1
DN <outdated ip> ? 256 69.8% 67f1d07c-8b13-4482-a2f1-77fa34e90d48 r1
Datacenter: dc1
===============
Status=Up/Down
|/ State=Normal/Leaving/Joining/Moving
-- Address Load Tokens Owns (effective) Host ID Rack
UN <actual ip> 3.84 GiB 256 65.2% 7324ebc4-577a-425f-b3de-96faac95a331 rack1
Workaround:
Manually delete the Cassandra pod from the failed config or analytics
cluster to re-initiate the bootstrap process for one of the Cassandra nodes:
kubectl -n tf delete pod tf-cassandra-<config/analytics>-dc1-rack1-<replica_num>
Occasionally, RabbitMQ instances in tf-rabbitmq pods fail to enable
the tracking_records_in_ets during the initialization process.
To work around the problem, restart the affected pods manually.
After replacing a failed Tungsten Fabric controller node as described in Replace a failed TF controller node, the first restart of the Cassandra pod on this node may cause an issue if the Cassandra node with the outdated IP address has not been removed from the cluster. Subsequent Cassandra pod restarts should not trigger this problem.
To verify if your Cassandra cluster is affected, run the nodetool status command specifying the config or analytics cluster and the replica number:
kubectl -n tf exec -it tf-cassandra-<CONFIG-OR-ANALYTICS>-dc1-rack1-<REPLICA-NUM> -c cassandra -- nodetool status
Example of the system response with outdated IP addresses:
Datacenter: dc1
===============
Status=Up/Down
|/ State=Normal/Leaving/Joining/Moving
-- Address Load Tokens Owns Host ID Rack
UN 192.168.201.144 509.43 KiB 256 ? 7e760a99-fae5-4921-b0c5-d9e6e1eca1c5 rack1
UN 192.168.50.146 534.18 KiB 256 ? 2248ea35-85d4-4887-820b-1fac4733021f rack1
UN 192.168.145.147 484.19 KiB 256 ? d988aaaa-44ae-4fec-a617-0b0a253e736d rack1
DN 192.168.145.144 481.53 KiB 256 ? c23703a1-6854-47a7-a4a2-af649d63af0c rack1
An extra node will appear in the cluster with an outdated IP address
(the IP of the terminated Cassandra pod) in the Down state.
To work around the issue, after replacing the Tungsten Fabric controller node, delete the Cassandra pod on the replaced node and remove the outdated node from the Cassandra cluster using nodetool:
kubectl -n tf exec -it tf-cassandra-<CONFIG-OR-ANALYTICS>-dc1-rack1-<REPLICA-NUM> -c cassandra -- nodetool removenode <HOST-ID>
During cluster update, the rolling reboot fails on the Tungsten Fabric cluster. To work around the issue, restart the RabbitMQ pods in the Tungsten Fabric cluster.
Fixed in MOSK 25.1 Fixed in MOSK 25.1.1
When updating to the MOSK 24.3 series, tf-config pods from the Tungsten
Fabric namespace may enter the CrashLoopBackOff state. For example:
tf-config-cs8zr 2/5 CrashLoopBackOff 676 (19s ago) 15h
tf-config-db-6zxgg 1/1 Running 44 (25m ago) 15h
tf-config-db-7k5sz 1/1 Running 43 (23m ago) 15h
tf-config-db-dlwdv 1/1 Running 43 (25m ago) 15h
tf-config-nw4tr 3/5 CrashLoopBackOff 665 (43s ago) 15h
tf-config-wzf6c 1/5 CrashLoopBackOff 680 (10s ago) 15h
tf-control-c6bnn 3/4 Running 41 (23m ago) 13h
tf-control-gsnnp 3/4 Running 42 (23m ago) 13h
tf-control-sj6fd 3/4 Running 41 (23m ago) 13h
To troubleshoot the issue, check the logs inside the tf-config API
container and the tf-cassandra pods. The following example logs
indicate that Cassandra services failed to peer with each other and
are operating independently:
Logs from the
tf-configAPI container:NoHostAvailable: ('Unable to complete the operation against any hosts', {<Host: 192.168.200.23:9042 dc1>: Unavailable('Error from server: code=1000 [Unavailable exception] message="Cannot achieve consistency level QUORUM" info={\'required_replicas\': 2, \'alive_replicas\': 1, \'consistency\': \'QUORUM\'}',)})Logs from the
tf-cassandrapods:INFO [OptionalTasks:1] 2024-09-09 08:59:36,231 CassandraRoleManager.java:419 - Setup task failed with error, rescheduling WARN [OptionalTasks:1] 2024-09-09 08:59:46,231 CassandraRoleManager.java:379 - CassandraRoleManager skipped default role setup: some nodes were not ready
To work around the issue, restart the Cassandra services in the Tungsten Fabric namespace by deleting the affected pods sequentially to establish the connection between them:
kubectl -n tf delete pod tf-cassandra-config-dc1-rack1-0
kubectl -n tf delete pod tf-cassandra-config-dc1-rack1-1
kubectl -n tf delete pod tf-cassandra-config-dc1-rack1-2
Now, all other services in the Tungsten Fabric namespace should be in
the Active state.
The designate-zone-setup Kubernetes job in the openstack namespace
fails during update to MOSK 24.3 with the following error present in the
logs of the job pod:
openstack.exceptions.BadRequestException: BadRequestException: 400:
Client Error for url: http://designate-api.openstack.svc.cluster.local:9001/v2/zones,
Invalid TLD
The issue occurs when the DNS service (OpenStack Designate) has any TLDs
created, but test is not among them. Since DNS service monitoring
was added to MOSK 24.3, it attempts to create a test zone test-zone.test
in the Designate service, which fails if the test TLD is missing.
To work around the issue, verify that there are created TLDs present in the DNS service:
openstack tld list -f value -c name
If there are TLDs present and test is not one of them, create it:
Warning
Do not create the test TLD if no TLDs were present
in the DNS service initially. In this case, the issue is caused by
a different factor, and creating the test TLD when none existed
before may disrupt users of both the DNS and Networking services.
openstack tld create --name test
Example output:
+-------------+--------------------------------------+
| Field | Value |
+-------------+--------------------------------------+
| created_at | 2024-10-22T19:22:15.000000 |
| description | None |
| id | 930fed8b-1e91-4c8c-a00f-7abf68b944d0 |
| name | test |
| updated_at | None |
+-------------+--------------------------------------+
During major or patch update of a MOSK cluster with StackLight enabled in
non-HA mode, the KubePodsCrashLooping alert may be firing for the Grafana
ReplicaSet.
Grafana relies on PostgreSQL for persistent data. In non-HA StackLight setup,
PostgreSQL becomes temporarily unavailable during updates. If Grafana loses its
database connection or fails to establish one during startup, Grafana fails
with an error. This may cause the Grafana pod to enter the CrashLoopBackOff
state. Such behavior is expected in non-HA StackLight setups. The Grafana pod
will resume normal operation after PostgreSQL is restored.
To prevent the issue, deploy StackLight in HA mode.
The incompatibility between the newly implemented session refresh in the
upstream simple-salesforce with the MOSK implementation of session refresh
in sf-notifier results in the uncontrolled growth of new logins and lack
of session reuse. The issue applies to both MOSK and management clusters.
Workaround:
The workaround to the issue is to change the sf-notifier image tag directly
in the Deployment object. This change is not persistent as this direct change
in the Deployment object will be reverted or overridden by:
Container Cloud version update (for management clusters)
Cluster release version update (for MOSK cluster)
Any
sf-notifier-related operation (for all clusters):Disable and enable
Credentials change
IDs change
Any configuration change for resources, node selector, tolerations, and log level
Once applied, this workaround must be re-applied whenever one of the above operations is performed in the cluster.
Print the currently used image:
kubectl get deployment sf-notifier -n stacklight -o jsonpath="{.spec.template.spec.containers[0].image}"
Possible results:
mirantis.azurecr.io/stacklight/sf-notifier:v0.4-20250113023013or
127.0.0.1:44301/stacklight/sf-notifier:v0.4-20250113023013Compare the
sf-notifierimage tag with the list of affected tags. If the image is affected, it has to be replaced. Otherwise, your cluster is not affected.Affected tags:
v0.4-20241021023015 v0.4-20241028023015 v0.4-20241118023015 v0.4-20241216023012 v0.4-20250113023013 v0.4-20250217023014 v0.4-20250317092322 v0.4-20250414023016
In the resulting string, replace only the tag of the affected image with the desired
v0.4-20240828023015tag. Keep the registry the same as in the original Deployment object.Resulting images from examples:
mirantis.azurecr.io/stacklight/sf-notifier:v0.4-20240828023015
or
127.0.0.1:44301/stacklight/sf-notifier:v0.4-20240828023015
Update the
sf-notifierDeployment with the new image:kubectl set image deployment/sf-notifier sf-notifier=<new image> -n stacklight
For example:
kubectl set image deployment/sf-notifier sf-notifier=mirantis.azurecr.io/stacklight/sf-notifier:v0.4-20240828023015 -n stacklight
or
kubectl set image deployment/sf-notifier sf-notifier=127.0.0.1:44301/stacklight/sf-notifier:v0.4-20240828023015 -n stacklight
Wait until the pod with the updated image is created, and check the logs. Verify that there are no errors in the logs:
kubectl logs pod/<sf-notifier pod> -n stacklight
As this change is not persistent and can be reverted by the cluster update
operation or any operation related to sf-notifier, periodically check all
clusters and if the change has been reverted, re-apply the workaround.
Optionally, you can add a custom alert that will monitor the current tag of
the sf-notifier image and will fire the alert if the tag is present in
the list of affected tags. For the custom alert configuration details,
refer to Alert configuration.
Example of a custom alert to monitor the current tag of the sf-notifier
image:
- name: stacklight
values:
...
prometheusServer:
...
customAlerts:
...
- alert: SFnotifierImageVersion
annotations:
description: "sf-notifier image has a buggy tag, please revert deployment image back to sf-notifier:v0.4-20240828023015. This should be fixed in MCC 2.29.3 / MOSK 24.3.5, remove the alert after this release upgrade."
summary: "This image might be causing too many API logins and exceeding our monthly API budget, please act immediately"
expr: >-
avg(kube_pod_container_info{container="sf-notifier",image_spec=~".*v0.4-(20241021023015|20241028023015|20241118023015|20241216023012|20250113023013|20250217023014|20250317092322|20250414023016)"})
for: 5m
labels:
service: alertmanager
severity: critical
Fixed in 2.30.0 (21.0.0 and 20.0.0)
A compact MOSK cluster fails to be deployed through the Container Cloud web UI
due to inability to add any label to the control plane machines along with
inability to change dedicatedControlPlane: false using the web UI.
To work around the issue, manually add the required labels using CLI. Once done, the cluster deployment resumes.
A newly created project does not display all available tabs and contains different access denied errors during first five minutes after creation.
To work around the issue, refresh the browser in five minutes after the project creation.
The following table provides details on the impact of a MOSK cluster update to a patch release within the 24.2 series.
Note
For the detailed workflow of update to a patch release, refer to Update to a patch version.
Updated component |
Impact on cloud users |
Impact on cloud workloads |
|---|---|---|
OpenStack and Tungsten Fabric |
|
Open vSwitch networking - interruption of North-South connectivity, depending on the type of virtual routers used by a workload:
Tungsten Fabric networking - no impact |
Ceph |
~1% of read operations on object storage API may fail |
IO performance degradation for Ceph-backed virtual storage devices. Pay special attention to the known issue 50566 that may affect the maintenance window. |
Host OS components |
No impact |
No impact |
- 0(1,2)
You can bypass updating components of the cloud data plane to avoid the network downtime during Update to a patch version. By using this technique, you accept the risk that some security fixes may not be applied.
24.2.4 patch
The patch release notes contain the description of product enhancements, the list of updated artifacts and Common Vulnerabilities and Exposures (CVE) fixes as well as description of the addressed product issues for the MOSK 24.2.4 patch, if any.
Release date |
November 18, 2024 |
|---|---|
Scope |
Patch |
Cluster release |
17.2.6 |
OpenStack Operator |
0.16.19 |
Tungsten Fabric Operator |
0.15.9 |
The MOSK 24.2.4 patch provides the following updates:
Support for MKE 3.7.16
Update of minor kernel version to
5.15.0-124-genericSecurity fixes for CVEs in images
Resolved product issues
For the list of enhancements and bug fixes that relate to Mirantis Container Cloud, refer to the Mirantis Container Cloud Release notes.
Learn more about the release cadence
This section lists the components artifacts of the MOSK 24.2.4 release that includes binaries, Docker images, and Helm charts.
MOSK 24.2.4 OpenStack Helm charts
Component |
Path |
License information for main executable programs |
|---|---|---|
openstack-operator |
https://binary.mirantis.com/openstack/helm/openstack-controller/openstack-operator-0.16.19.tgz |
Mirantis Proprietary License |
MOSK 24.2.4 OpenStack Antelope binaries and Docker images
Component |
Path |
License information for main executable programs |
|---|---|---|
Binaries |
||
octavia-amphora |
https://binary.mirantis.com/openstack/bin/octavia/amphora-x64-haproxy-antelope-20241028145520.qcow2 |
Mirantis Proprietary License |
mirantis |
https://binary.mirantis.com/openstack/bin/horizon/mirantis-antelope-18a1377-20230817112356.tar.gz |
Mirantis Proprietary License |
kernel |
GPL-2.0 |
|
initramfs |
https://binary.mirantis.com/openstack/bin/ironic/tinyipa/tinyipa-stable-antelope-20240213233421.gz |
GPL-2.0 |
service-image |
https://binary.mirantis.com/openstack/bin/manila/manila-service-image-20241024092252.qcow2 |
Mirantis Proprietary License |
Docker images |
||
keystone |
mirantis.azurecr.io/openstack/keystone:antelope-jammy-20241028141054 |
Apache License 2.0 |
heat |
mirantis.azurecr.io/openstack/heat:antelope-jammy-20241028141054 |
Apache License 2.0 |
glance |
mirantis.azurecr.io/openstack/glance:antelope-jammy-20241028141054 |
Apache License 2.0 |
cinder |
mirantis.azurecr.io/openstack/cinder:antelope-jammy-20241028141054 |
Apache License 2.0 |
osprober |
mirantis.azurecr.io/openstack/osprober:0.0.1-d0f3d7b |
Apache License 2.0 |
neutron |
mirantis.azurecr.io/openstack/neutron:antelope-jammy-20241028141054 |
Apache License 2.0 |
nova |
mirantis.azurecr.io/openstack/nova:antelope-jammy-20241028141054 |
Apache License 2.0 |
horizon |
mirantis.azurecr.io/openstack/horizon:antelope-jammy-20241028141054 |
Apache License 2.0 |
tempest |
mirantis.azurecr.io/openstack/tempest:antelope-jammy-20241028141054 |
Apache License 2.0 |
octavia |
mirantis.azurecr.io/openstack/octavia:antelope-jammy-20241028141054 |
Apache License 2.0 |
designate |
mirantis.azurecr.io/openstack/designate:antelope-jammy-20241028141054 |
Apache License 2.0 |
ironic |
mirantis.azurecr.io/openstack/ironic:antelope-jammy-20241028141054 |
Apache License 2.0 |
barbican |
mirantis.azurecr.io/openstack/barbican:antelope-jammy-20241028141054 |
Apache License 2.0 |
libvirt |
mirantis.azurecr.io/general/libvirt:8.0.x-jammy-reef-20240822074257 |
LGPL-2.1 License |
pause |
mirantis.azurecr.io/general/external/pause:3.1 |
Apache License 2.0 |
openvswitch |
mirantis.azurecr.io/general/openvswitch:2.17-jammy-20240827065304 |
Apache License 2.0 |
openvswitch-dpdk |
mirantis.azurecr.io/general/openvswitch-dpdk:2.17-jammy-20240827065304 |
Apache License 2.0 |
openstack-tools |
mirantis.azurecr.io/openstack/openstack-tools:yoga-jammy-20240819060021 |
Apache License 2.0 |
rabbitmq |
mirantis.azurecr.io/openstack/extra/rabbitmq:3.12.12-jammy-20240829072728 |
Mozilla Public License 2.0 |
rabbitmq-management |
mirantis.azurecr.io/openstack/extra/rabbitmq-management:3.12.12-jammy-20240829072728 |
Mozilla Public License 2.0 |
kubernetes-entrypoint |
mirantis.azurecr.io/openstack/extra/kubernetes-entrypoint:v1.0.1-34a4f54-20240910081335 |
Apache License 2.0 |
memcached |
mirantis.azurecr.io/general/memcached:v1.6.32-alpine-20241024070356 |
BSD 3-Clause “New” or “Revised” License |
etcd |
mirantis.azurecr.io/openstack/extra/etcd:v3.5.16-alpine-20241024070202 |
Apache License 2.0 |
powerdns |
mirantis.azurecr.io/openstack/extra/powerdns:4.8-alpine-20241024073159 |
GPL-2.0 License |
nginx-ingress-controller |
mirantis.azurecr.io/openstack/extra/nginx-ingress-controller:1.11.3-alpine-20241024075118 |
Apache License 2.0 |
tls-proxy |
mirantis.azurecr.io/openstack/tls-proxy:jammy-fipster-1.0.0.dev2 |
Mirantis Proprietary License |
defaultbackend |
mirantis.azurecr.io/openstack/extra/defaultbackend:v1.19.2-77af1ef-20240910090142 |
Apache License 2.0 |
mariadb |
mirantis.azurecr.io/general/mariadb:10.6.17-jammy-20240927170336 |
GPLv2, LGPLv2.1 (client libraries) |
rabbitmq-exporter |
mirantis.azurecr.io/stacklight/rabbitmq-exporter:1.0.0 |
MIT License |
memcached-exporter |
mirantis.azurecr.io/stacklight/memcached-exporter:v0.14.4 |
Apache License 2.0 |
prometheus-mysql-exporter |
mirantis.azurecr.io/stacklight/mysqld-exporter:v0.11.0 |
Apache License 2.0 |
aodh |
mirantis.azurecr.io/openstack/aodh:antelope-jammy-20241028141054 |
Apache License 2.0 |
ceilometer |
mirantis.azurecr.io/openstack/ceilometer:antelope-jammy-20241028141054 |
Apache License 2.0 |
gnocchi |
mirantis.azurecr.io/openstack/gnocchi:antelope-jammy-20241028141054 |
Apache License 2.0 |
redis |
mirantis.azurecr.io/openstack/extra/redis:7.2.x-alpine-20241024111938 |
BSD 3-Clause “New” or “Revised” License |
redis-operator |
mirantis.azurecr.io/openstack/extra/redis-operator:v1.2.4-20241024111938 |
Apache License 2.0 |
frr |
mirantis.azurecr.io/general/external/docker.io/frrouting/frr:v9.1.2-20241024070624 |
GPL-2.0 and LGPL-2.1 |
strongswan |
mirantis.azurecr.io/openstack/extra/strongswan:alpine-5.9.12-20241024065424 |
GPL-2.0 |
rsyslog |
mirantis.azurecr.io/openstack/extra/rsyslog:v8.2001.0-20240829110216 |
GNU General Public License v3 |
descheduler |
mirantis.azurecr.io/openstack/extra/descheduler-20240910121701:v0.30.1-amd64-20240910114244 |
Apache License 2.0 |
nginx |
mirantis.azurecr.io/openstack/extra/nginx:1.27.2-20241024065919 |
Apache License 2.0 |
requirements |
mirantis.azurecr.io/openstack/requirements:antelope-jammy-20241028141054 |
Apache License 2.0 |
drb-controller |
mirantis.azurecr.io/openstack/extra/drb-controller:0.1.0-20240701093549 |
Mirantis Proprietary License |
stepler |
mirantis.azurecr.io/openstack/stepler:antelope-jammy-20241018143901 |
Apache License 2.0 |
placement |
mirantis.azurecr.io/openstack/placement:antelope-jammy-20241028141054 |
Apache License 2.0 |
masakari |
mirantis.azurecr.io/openstack/masakari:antelope-jammy-20241028141054 |
Apache License 2.0 |
masakari-monitors |
mirantis.azurecr.io/openstack/masakari-monitors:antelope-jammy-20241028141054 |
Apache License 2.0 |
ironic-inspector |
mirantis.azurecr.io/openstack/ironic-inspector:antelope-jammy-20241028141054 |
Apache License 2.0 |
manila |
mirantis.azurecr.io/openstack/manila:antelope-jammy-20241028141054 |
Apache License 2.0 |
MOSK 24.2.4 OpenStack Yoga binaries and Docker images
Component |
Path |
License information for main executable programs |
|---|---|---|
Binaries |
||
octavia-amphora |
https://binary.mirantis.com/openstack/bin/octavia/amphora-x64-haproxy-yoga-20241028145440.qcow2 |
Mirantis Proprietary License |
mirantis |
https://binary.mirantis.com/openstack/bin/horizon/mirantis-yoga-186584b-20230817112411.tar.gz |
Mirantis Proprietary License |
kernel |
https://binary.mirantis.com/openstack/bin/ironic/tinyipa/tinyipa-stable-yoga-20231004061110.vmlinuz |
GPL-2.0 |
initramfs |
https://binary.mirantis.com/openstack/bin/ironic/tinyipa/tinyipa-stable-yoga-20231004061110.gz |
GPL-2.0 |
service-image |
https://binary.mirantis.com/openstack/bin/manila/manila-service-image-20241024092252.qcow2 |
Mirantis Proprietary License |
Docker images |
||
keystone |
mirantis.azurecr.io/openstack/keystone:yoga-jammy-20241028141054 |
Apache License 2.0 |
heat |
mirantis.azurecr.io/openstack/heat:yoga-jammy-20241028141054 |
Apache License 2.0 |
glance |
mirantis.azurecr.io/openstack/glance:yoga-jammy-20241028141054 |
Apache License 2.0 |
cinder |
mirantis.azurecr.io/openstack/cinder:yoga-jammy-20241028141054 |
Apache License 2.0 |
osprober |
mirantis.azurecr.io/openstack/osprober:0.0.1-d0f3d7b |
Apache License 2.0 |
neutron |
mirantis.azurecr.io/openstack/neutron:yoga-jammy-20241028141054 |
Apache License 2.0 |
nova |
mirantis.azurecr.io/openstack/nova:yoga-jammy-20241028141054 |
Apache License 2.0 |
horizon |
mirantis.azurecr.io/openstack/horizon:yoga-jammy-20241028141054 |
Apache License 2.0 |
tempest |
mirantis.azurecr.io/openstack/tempest:yoga-jammy-20241028141054 |
Apache License 2.0 |
octavia |
mirantis.azurecr.io/openstack/octavia:yoga-jammy-20241028141054 |
Apache License 2.0 |
designate |
mirantis.azurecr.io/openstack/designate:yoga-jammy-20241028141054 |
Apache License 2.0 |
ironic |
mirantis.azurecr.io/openstack/ironic:yoga-jammy-20241028141054 |
Apache License 2.0 |
barbican |
mirantis.azurecr.io/openstack/barbican:yoga-jammy-20241028141054 |
Apache License 2.0 |
libvirt |
mirantis.azurecr.io/general/libvirt:8.0.x-jammy-reef-20240822074257 |
LGPL-2.1 License |
pause |
mirantis.azurecr.io/general/external/pause:3.1 |
Apache License 2.0 |
openvswitch |
mirantis.azurecr.io/general/openvswitch:2.17-jammy-20240827065304 |
Apache License 2.0 |
openvswitch-dpdk |
mirantis.azurecr.io/general/openvswitch-dpdk:2.17-jammy-20240827065304 |
Apache License 2.0 |
openstack-tools |
mirantis.azurecr.io/openstack/openstack-tools:yoga-jammy-20241028141054 |
Apache License 2.0 |
rabbitmq |
mirantis.azurecr.io/openstack/extra/rabbitmq:3.12.12-jammy-20240829072728 |
Mozilla Public License 2.0 |
rabbitmq-management |
mirantis.azurecr.io/openstack/extra/rabbitmq-management:3.12.12-jammy-20240829072728 |
Mozilla Public License 2.0 |
kubernetes-entrypoint |
mirantis.azurecr.io/openstack/extra/kubernetes-entrypoint:v1.0.1-34a4f54-20240910081335 |
Apache License 2.0 |
memcached |
mirantis.azurecr.io/general/memcached:v1.6.32-alpine-20241024070356 |
BSD 3-Clause “New” or “Revised” License |
etcd |
mirantis.azurecr.io/openstack/extra/etcd:v3.5.16-alpine-20241024070202 |
Apache License 2.0 |
powerdns |
mirantis.azurecr.io/openstack/extra/powerdns:4.8-alpine-20241024073159 |
GPL-2.0 License |
nginx-ingress-controller |
mirantis.azurecr.io/openstack/extra/nginx-ingress-controller:1.11.3-alpine-20241024075118 |
Apache License 2.0 |
tls-proxy |
mirantis.azurecr.io/openstack/tls-proxy:jammy-fipster-1.0.0.dev2 |
Mirantis Proprietary License |
defaultbackend |
mirantis.azurecr.io/openstack/extra/defaultbackend:v1.19.2-77af1ef-20240910090142 |
Apache License 2.0 |
mariadb |
mirantis.azurecr.io/general/mariadb:10.6.17-jammy-20240927170336 |
GPLv2, LGPLv2.1 (client libraries) |
rabbitmq-exporter |
mirantis.azurecr.io/stacklight/rabbitmq-exporter:1.0.0 |
MIT License |
memcached-exporter |
mirantis.azurecr.io/stacklight/memcached-exporter:v0.14.4 |
Apache License 2.0 |
prometheus-mysql-exporter |
mirantis.azurecr.io/stacklight/mysqld-exporter:v0.11.0 |
Apache License 2.0 |
aodh |
mirantis.azurecr.io/openstack/aodh:yoga-jammy-20241028141054 |
Apache License 2.0 |
ceilometer |
mirantis.azurecr.io/openstack/ceilometer:yoga-jammy-20241028141054 |
Apache License 2.0 |
gnocchi |
mirantis.azurecr.io/openstack/gnocchi:yoga-jammy-20241028141054 |
Apache License 2.0 |
redis |
mirantis.azurecr.io/openstack/extra/redis:7.2.x-alpine-20241024111938 |
BSD 3-Clause “New” or “Revised” License |
redis-operator |
mirantis.azurecr.io/openstack/extra/redis-operator:v1.2.4-20241024111938 |
Apache License 2.0 |
frr |
mirantis.azurecr.io/general/external/docker.io/frrouting/frr:v9.1.2-20241024070624 |
GPL-2.0 and LGPL-2.1 |
strongswan |
mirantis.azurecr.io/openstack/extra/strongswan:alpine-5.9.12-20241024065424 |
GPL-2.0 |
rsyslog |
mirantis.azurecr.io/openstack/extra/rsyslog:v8.2001.0-20240829110216 |
GNU General Public License v3 |
descheduler |
mirantis.azurecr.io/openstack/extra/descheduler-20240910121701:v0.30.1-amd64-20240910114244 |
Apache License 2.0 |
nginx |
mirantis.azurecr.io/openstack/extra/nginx:1.27.2-20241024065919 |
Apache License 2.0 |
requirements |
mirantis.azurecr.io/openstack/requirements:yoga-jammy-20241028141054 |
Apache License 2.0 |
drb-controller |
mirantis.azurecr.io/openstack/extra/drb-controller:0.1.0-20240701093549 |
Mirantis Proprietary License |
stepler |
mirantis.azurecr.io/openstack/stepler:yoga-focal-20241027073834 |
Apache License 2.0 |
placement |
mirantis.azurecr.io/openstack/placement:yoga-jammy-20241028141054 |
Apache License 2.0 |
masakari |
mirantis.azurecr.io/openstack/masakari:yoga-jammy-20241028141054 |
Apache License 2.0 |
masakari-monitors |
mirantis.azurecr.io/openstack/masakari-monitors:yoga-jammy-20241028141054 |
Apache License 2.0 |
ironic-inspector |
mirantis.azurecr.io/openstack/ironic-inspector:yoga-jammy-20241028141054 |
Apache License 2.0 |
manila |
mirantis.azurecr.io/openstack/manila:yoga-jammy-20241028141054 |
Apache License 2.0 |
MOSK 24.2.4 Tungsten Fabric 21.4 artifacts
Component |
Path |
License information for main executable programs |
|---|---|---|
Helm charts |
||
tungstenfabric-operator |
https://binary.mirantis.com/tungsten/helm/tungstenfabric-operator-0.15.9.tgz |
Mirantis Proprietary License |
Docker images |
||
tungstenfabric-operator |
mirantis.azurecr.io/tungsten-operator/tungstenfabric-operator:0.15.9 |
Mirantis Proprietary License |
tungsten-pytest |
mirantis.azurecr.io/tungsten/tungsten-pytest:0.1-20240920135651 |
MIT License |
casskop |
mirantis.azurecr.io/tungsten-operator/casskop:2.2.6 |
Apache License 2.0 |
cassandra-bootstrap |
mirantis.azurecr.io/tungsten/cassandra-bootstrap:0.1.20 |
Apache License 2.0 |
cassandra |
mirantis.azurecr.io/tungsten/cassandra:3.11.17 |
Apache License 2.0 |
cassandra-config-builder |
mirantis.azurecr.io/tungsten/cass-config-builder:v2-20240812125407 |
Apache License 2.0 |
rabbitmq-operator |
mirantis.azurecr.io/tungsten-operator/rabbitmq-operator:0.4.6 |
Mirantis Proprietary License |
rabbitmq |
mirantis.azurecr.io/tungsten/rabbitmq:3.11.16 |
Mozilla Public License 2.0 |
rabbitmq-exporter |
mirantis.azurecr.io/stacklight/rabbitmq-exporter:1.0.0 |
MIT License |
zookeeper-operator |
mirantis.azurecr.io/tungsten-operator/zookeeper-operator:0.2.24-mcp |
Apache License 2.0 |
zookeeper |
mirantis.azurecr.io/tungsten/zookeeper:3.8.4-20240813 |
Apache License 2.0 |
redis-operator |
mirantis.azurecr.io/tungsten-operator/redis-operator:0.4.6 |
Apache License 2.0 |
redis |
mirantis.azurecr.io/tungsten/redis:7.2.4-alpine3.19 |
BSD 3-Clause “New” or “Revised” License |
redis-exporter |
mirantis.azurecr.io/stacklight/redis_exporter:v1.62.0 |
BSD 3-Clause “New” or “Revised” License |
tf-cli |
mirantis.azurecr.io/tungsten/tf-cli:0.1-20240930105454 |
MIT License |
kubernetes-entrypoint |
mirantis.azurecr.io/openstack/extra/kubernetes-entrypoint:v1.0.1-34a4f54-20240910081335 |
Apache License 2.0 |
pause |
mirantis.azurecr.io/general/external/pause:3.1 |
Apache License 2.0 |
tf-nodeinfo |
mirantis.azurecr.io/tungsten/tf-nodeinfo:0.1-20240919130057 |
MIT License |
contrail-controller-config-api |
mirantis.azurecr.io/tungsten/contrail-controller-config-api:24.2-r21.4.20240819135158 |
Apache License 2.0 |
contrail-controller-config-devicemgr |
mirantis.azurecr.io/tungsten/contrail-controller-config-devicemgr:24.2-r21.4.20240819135158 |
Apache License 2.0 |
contrail-controller-config-dnsmasq |
mirantis.azurecr.io/tungsten/contrail-controller-config-dnsmasq:24.2-r21.4.20240819135158 |
Apache License 2.0 |
contrail-controller-config-schema |
mirantis.azurecr.io/tungsten/contrail-controller-config-schema:24.2-r21.4.20240819135158 |
Apache License 2.0 |
contrail-controller-config-svcmonitor |
mirantis.azurecr.io/tungsten/contrail-controller-config-svcmonitor:24.2-r21.4.20240819135158 |
Apache License 2.0 |
contrail-controller-control-control |
mirantis.azurecr.io/tungsten/contrail-controller-control-control:24.2-r21.4.20240819135158 |
Apache License 2.0 |
contrail-controller-control-dns |
mirantis.azurecr.io/tungsten/contrail-controller-control-dns:24.2-r21.4.20240819135158 |
Apache License 2.0 |
contrail-controller-control-named |
mirantis.azurecr.io/tungsten/contrail-controller-control-named:24.2-r21.4.20240819135158 |
Apache License 2.0 |
contrail-controller-webui-job |
mirantis.azurecr.io/tungsten/contrail-controller-webui-job:24.2-r21.4.20240819135158 |
Apache License 2.0 |
contrail-controller-webui-web |
mirantis.azurecr.io/tungsten/contrail-controller-webui-web:24.2-r21.4.20240819135158 |
Apache License 2.0 |
contrail-node-init |
mirantis.azurecr.io/tungsten/contrail-node-init:21.4.20240530000000 |
Apache License 2.0 |
contrail-nodemgr |
mirantis.azurecr.io/tungsten/contrail-nodemgr:24.2-r21.4.20240819135158 |
Apache License 2.0 |
contrail-provisioner |
mirantis.azurecr.io/tungsten/contrail-provisioner:24.2-r21.4.20240819135158 |
Apache License 2.0 |
contrail-tools |
mirantis.azurecr.io/tungsten/contrail-tools:24.2-r21.4.20240819135158 |
Apache License 2.0 |
contrail-vrouter-agent |
mirantis.azurecr.io/tungsten/contrail-vrouter-agent:21.4.20240530000000 |
Apache License 2.0 |
contrail-vrouter-agent-dpdk |
mirantis.azurecr.io/tungsten/contrail-vrouter-agent-dpdk:21.4.20240530000000 |
Apache License 2.0 |
contrail-vrouter-kernel-build-init |
mirantis.azurecr.io/tungsten/contrail-vrouter-kernel-build-init:21.4.20240530000000 |
Apache License 2.0 |
MOSK 24.2.4 StackLight artifacts
Component |
Path |
License information for main executable programs |
|---|---|---|
Docker images |
||
prometheus-libvirt-exporter |
mirantis.azurecr.io/stacklight/prometheus-libvirt-exporter:v0.2-20241028023014 |
Mirantis Proprietary License |
tungstenfabric-prometheus-exporter |
mirantis.azurecr.io/stacklight/tungstenfabric-prometheus-exporter:0.1-20241021123242 |
Mirantis Proprietary License |
Helm charts |
||
fluentd |
https://binary.mirantis.com/stacklight/helm/fluentd-2.0.3-mcp-52.tgz |
Mirantis Proprietary License |
prometheus-libvirt-exporter |
https://binary.mirantis.com/stacklight/helm/prometheus-libvirt-exporter-0.2.0-mcp-7.tgz |
Mirantis Proprietary License |
prometheus-tungstenfabric-exporter |
https://binary.mirantis.com/stacklight/helm/prometheus-tungstenfabric-exporter-0.2.0-mcp-7.tgz |
Mirantis Proprietary License |
The table below contains the total number of addressed unique and common CVEs by MOSK-specific component compared to the previous patch release version. The common CVEs are issues addressed across several images.
Product component |
CVE type |
Critical |
High |
Total |
|---|---|---|---|---|
OpenStack |
Unique |
0 |
6 |
6 |
Common |
0 |
33 |
33 |
|
Tungsten Fabric |
Unique |
1 |
5 |
6 |
Common |
1 |
7 |
8 |
Mirantis Security Portal
For the detailed list of fixed and present CVEs across the Mirantis Container Cloud and MOSK products, refer to Mirantis Security Portal.
Mirantis Container Cloud CVEs
For the number of fixed CVEs in the Mirantis Container Cloud-related components including kaas core, bare metal, Ceph, and StackLight, refer to Container Cloud 2.28.2: Security notes.
The following issues have been addressed in the MOSK 24.2.4 release:
[47196] [OpenStack] Resolved the issue that caused the Network QoS policy to be absent after creation.
[47743] [OpenStack] Resolved the issue that prevented
openstack-controller-exporterfrom collecting PCPUs.[47717] [Tungsten Fabric] Resolved the issue with the invalid
BgpAsnsetting intungstenfabric-operator.
This section lists MOSK known issues with workarounds for the MOSK release 24.2.4:
During MariaDB operations on a management cluster, Pods may get stuck in continuous restarts with the following example error:
[ERROR] WSREP: Corrupt buffer header: \
addr: 0x7faec6f8e518, \
seqno: 3185219421952815104, \
size: 909455917, \
ctx: 0x557094f65038, \
flags: 11577. store: 49, \
type: 49
Workaround:
Create a backup of the
/var/lib/mysqldirectory on themariadb-serverPod.Verify that other replicas are up and ready.
Remove the
galera.cachefile for the affectedmariadb-serverPod.Remove the affected
mariadb-serverPod or wait until it is automatically restarted.
After Kubernetes restarts the Pod, the Pod clones the database in 1-2 minutes and restores the quorum.
Due to the MetalLB upstream issue, a load balancer service may not obtain the external IP address.
The issue occurs when two services share the same external IP address and have
the same externalTrafficPolicy value. Initially, the services have the
external IP address assigned and are accessible. After modifying the
externalTrafficPolicy value for both services from Cluster to
Local, the first service that has been changed remains with no external IP
address assigned. Though, the second service, which was changed later, has the
external IP assigned as expected.
To work around the issue, make a dummy change to the service object where
external IP is <pending>:
Identify the service that is stuck:
kubectl get svc -A | grep pending
Example of system response:
stacklight iam-proxy-prometheus LoadBalancer 10.233.28.196 <pending> 443:30430/TCP
Add an arbitrary label to the service that is stuck. For example:
kubectl label svc -n stacklight iam-proxy-prometheus reconcile=1
Example of system response:
service/iam-proxy-prometheus labeledVerify that the external IP was allocated to the service:
kubectl get svc -n stacklight iam-proxy-prometheus
Example of system response:
NAME TYPE CLUSTER-IP EXTERNAL-IP PORT(S) AGE iam-proxy-prometheus LoadBalancer 10.233.28.196 10.0.34.108 443:30430/TCP 12d
Sometimes, after changing the OpenStackDeployment custom resource,
it does not transition to the APPLYING state as expected.
To work around the issue, restart the rockoon` pod in the osh-system
namespace.
Rebooting all Cassandra cluster TFConfig or TFAnalytics nodes, maintenance, or other circumstances that cause the Cassandra pods to start simultaneously may cause a broken Cassandra TFConfig and/or TFAnalytics cluster. In this case, Cassandra nodes do not join the ring and do not update the IPs of the neighbor nodes. As a result, the TF services cannot operate Cassandra cluster(s).
To verify that a Cassandra cluster is affected:
Run the nodetool status command specifying the config or
analytics cluster and the replica number:
kubectl -n tf exec -it tf-cassandra-<config/analytics>-dc1-rack1-<replica number> -c cassandra -- nodetool status
Example of system response with outdated IP addresses:
Datacenter: DC1
===============
Status=Up/Down
|/ State=Normal/Leaving/Joining/Moving
-- Address Load Tokens Owns (effective) Host ID Rack
DN <outdated ip> ? 256 64.9% a58343d0-1e3f-4d54-bcdf-9b9b949ca873 r1
DN <outdated ip> ? 256 69.8% 67f1d07c-8b13-4482-a2f1-77fa34e90d48 r1
Datacenter: dc1
===============
Status=Up/Down
|/ State=Normal/Leaving/Joining/Moving
-- Address Load Tokens Owns (effective) Host ID Rack
UN <actual ip> 3.84 GiB 256 65.2% 7324ebc4-577a-425f-b3de-96faac95a331 rack1
Workaround:
Manually delete the Cassandra pod from the failed config or analytics
cluster to re-initiate the bootstrap process for one of the Cassandra nodes:
kubectl -n tf delete pod tf-cassandra-<config/analytics>-dc1-rack1-<replica_num>
Occasionally, RabbitMQ instances in tf-rabbitmq pods fail to enable
the tracking_records_in_ets during the initialization process.
To work around the problem, restart the affected pods manually.
After replacing a failed Tungsten Fabric controller node as described in Replace a failed TF controller node, the first restart of the Cassandra pod on this node may cause an issue if the Cassandra node with the outdated IP address has not been removed from the cluster. Subsequent Cassandra pod restarts should not trigger this problem.
To verify if your Cassandra cluster is affected, run the nodetool status command specifying the config or analytics cluster and the replica number:
kubectl -n tf exec -it tf-cassandra-<CONFIG-OR-ANALYTICS>-dc1-rack1-<REPLICA-NUM> -c cassandra -- nodetool status
Example of the system response with outdated IP addresses:
Datacenter: dc1
===============
Status=Up/Down
|/ State=Normal/Leaving/Joining/Moving
-- Address Load Tokens Owns Host ID Rack
UN 192.168.201.144 509.43 KiB 256 ? 7e760a99-fae5-4921-b0c5-d9e6e1eca1c5 rack1
UN 192.168.50.146 534.18 KiB 256 ? 2248ea35-85d4-4887-820b-1fac4733021f rack1
UN 192.168.145.147 484.19 KiB 256 ? d988aaaa-44ae-4fec-a617-0b0a253e736d rack1
DN 192.168.145.144 481.53 KiB 256 ? c23703a1-6854-47a7-a4a2-af649d63af0c rack1
An extra node will appear in the cluster with an outdated IP address
(the IP of the terminated Cassandra pod) in the Down state.
To work around the issue, after replacing the Tungsten Fabric controller node, delete the Cassandra pod on the replaced node and remove the outdated node from the Cassandra cluster using nodetool:
kubectl -n tf exec -it tf-cassandra-<CONFIG-OR-ANALYTICS>-dc1-rack1-<REPLICA-NUM> -c cassandra -- nodetool removenode <HOST-ID>
During cluster update, the rolling reboot fails on the Tungsten Fabric cluster. To work around the issue, restart the RabbitMQ pods in the Tungsten Fabric cluster.
Fixed in MOSK 25.1 Fixed in MOSK 25.1.1
When updating to the MOSK 24.3 series, tf-config pods from the Tungsten
Fabric namespace may enter the CrashLoopBackOff state. For example:
tf-config-cs8zr 2/5 CrashLoopBackOff 676 (19s ago) 15h
tf-config-db-6zxgg 1/1 Running 44 (25m ago) 15h
tf-config-db-7k5sz 1/1 Running 43 (23m ago) 15h
tf-config-db-dlwdv 1/1 Running 43 (25m ago) 15h
tf-config-nw4tr 3/5 CrashLoopBackOff 665 (43s ago) 15h
tf-config-wzf6c 1/5 CrashLoopBackOff 680 (10s ago) 15h
tf-control-c6bnn 3/4 Running 41 (23m ago) 13h
tf-control-gsnnp 3/4 Running 42 (23m ago) 13h
tf-control-sj6fd 3/4 Running 41 (23m ago) 13h
To troubleshoot the issue, check the logs inside the tf-config API
container and the tf-cassandra pods. The following example logs
indicate that Cassandra services failed to peer with each other and
are operating independently:
Logs from the
tf-configAPI container:NoHostAvailable: ('Unable to complete the operation against any hosts', {<Host: 192.168.200.23:9042 dc1>: Unavailable('Error from server: code=1000 [Unavailable exception] message="Cannot achieve consistency level QUORUM" info={\'required_replicas\': 2, \'alive_replicas\': 1, \'consistency\': \'QUORUM\'}',)})Logs from the
tf-cassandrapods:INFO [OptionalTasks:1] 2024-09-09 08:59:36,231 CassandraRoleManager.java:419 - Setup task failed with error, rescheduling WARN [OptionalTasks:1] 2024-09-09 08:59:46,231 CassandraRoleManager.java:379 - CassandraRoleManager skipped default role setup: some nodes were not ready
To work around the issue, restart the Cassandra services in the Tungsten Fabric namespace by deleting the affected pods sequentially to establish the connection between them:
kubectl -n tf delete pod tf-cassandra-config-dc1-rack1-0
kubectl -n tf delete pod tf-cassandra-config-dc1-rack1-1
kubectl -n tf delete pod tf-cassandra-config-dc1-rack1-2
Now, all other services in the Tungsten Fabric namespace should be in
the Active state.
The designate-zone-setup Kubernetes job in the openstack namespace
fails during update to MOSK 24.3 with the following error present in the
logs of the job pod:
openstack.exceptions.BadRequestException: BadRequestException: 400:
Client Error for url: http://designate-api.openstack.svc.cluster.local:9001/v2/zones,
Invalid TLD
The issue occurs when the DNS service (OpenStack Designate) has any TLDs
created, but test is not among them. Since DNS service monitoring
was added to MOSK 24.3, it attempts to create a test zone test-zone.test
in the Designate service, which fails if the test TLD is missing.
To work around the issue, verify that there are created TLDs present in the DNS service:
openstack tld list -f value -c name
If there are TLDs present and test is not one of them, create it:
Warning
Do not create the test TLD if no TLDs were present
in the DNS service initially. In this case, the issue is caused by
a different factor, and creating the test TLD when none existed
before may disrupt users of both the DNS and Networking services.
openstack tld create --name test
Example output:
+-------------+--------------------------------------+
| Field | Value |
+-------------+--------------------------------------+
| created_at | 2024-10-22T19:22:15.000000 |
| description | None |
| id | 930fed8b-1e91-4c8c-a00f-7abf68b944d0 |
| name | test |
| updated_at | None |
+-------------+--------------------------------------+
During major or patch update of a MOSK cluster with StackLight enabled in
non-HA mode, the KubePodsCrashLooping alert may be firing for the Grafana
ReplicaSet.
Grafana relies on PostgreSQL for persistent data. In non-HA StackLight setup,
PostgreSQL becomes temporarily unavailable during updates. If Grafana loses its
database connection or fails to establish one during startup, Grafana fails
with an error. This may cause the Grafana pod to enter the CrashLoopBackOff
state. Such behavior is expected in non-HA StackLight setups. The Grafana pod
will resume normal operation after PostgreSQL is restored.
To prevent the issue, deploy StackLight in HA mode.
The incompatibility between the newly implemented session refresh in the
upstream simple-salesforce with the MOSK implementation of session refresh
in sf-notifier results in the uncontrolled growth of new logins and lack
of session reuse. The issue applies to both MOSK and management clusters.
Workaround:
The workaround to the issue is to change the sf-notifier image tag directly
in the Deployment object. This change is not persistent as this direct change
in the Deployment object will be reverted or overridden by:
Container Cloud version update (for management clusters)
Cluster release version update (for MOSK cluster)
Any
sf-notifier-related operation (for all clusters):Disable and enable
Credentials change
IDs change
Any configuration change for resources, node selector, tolerations, and log level
Once applied, this workaround must be re-applied whenever one of the above operations is performed in the cluster.
Print the currently used image:
kubectl get deployment sf-notifier -n stacklight -o jsonpath="{.spec.template.spec.containers[0].image}"
Possible results:
mirantis.azurecr.io/stacklight/sf-notifier:v0.4-20250113023013or
127.0.0.1:44301/stacklight/sf-notifier:v0.4-20250113023013Compare the
sf-notifierimage tag with the list of affected tags. If the image is affected, it has to be replaced. Otherwise, your cluster is not affected.Affected tags:
v0.4-20241021023015 v0.4-20241028023015 v0.4-20241118023015 v0.4-20241216023012 v0.4-20250113023013 v0.4-20250217023014 v0.4-20250317092322 v0.4-20250414023016
In the resulting string, replace only the tag of the affected image with the desired
v0.4-20240828023015tag. Keep the registry the same as in the original Deployment object.Resulting images from examples:
mirantis.azurecr.io/stacklight/sf-notifier:v0.4-20240828023015
or
127.0.0.1:44301/stacklight/sf-notifier:v0.4-20240828023015
Update the
sf-notifierDeployment with the new image:kubectl set image deployment/sf-notifier sf-notifier=<new image> -n stacklight
For example:
kubectl set image deployment/sf-notifier sf-notifier=mirantis.azurecr.io/stacklight/sf-notifier:v0.4-20240828023015 -n stacklight
or
kubectl set image deployment/sf-notifier sf-notifier=127.0.0.1:44301/stacklight/sf-notifier:v0.4-20240828023015 -n stacklight
Wait until the pod with the updated image is created, and check the logs. Verify that there are no errors in the logs:
kubectl logs pod/<sf-notifier pod> -n stacklight
As this change is not persistent and can be reverted by the cluster update
operation or any operation related to sf-notifier, periodically check all
clusters and if the change has been reverted, re-apply the workaround.
Optionally, you can add a custom alert that will monitor the current tag of
the sf-notifier image and will fire the alert if the tag is present in
the list of affected tags. For the custom alert configuration details,
refer to Alert configuration.
Example of a custom alert to monitor the current tag of the sf-notifier
image:
- name: stacklight
values:
...
prometheusServer:
...
customAlerts:
...
- alert: SFnotifierImageVersion
annotations:
description: "sf-notifier image has a buggy tag, please revert deployment image back to sf-notifier:v0.4-20240828023015. This should be fixed in MCC 2.29.3 / MOSK 24.3.5, remove the alert after this release upgrade."
summary: "This image might be causing too many API logins and exceeding our monthly API budget, please act immediately"
expr: >-
avg(kube_pod_container_info{container="sf-notifier",image_spec=~".*v0.4-(20241021023015|20241028023015|20241118023015|20241216023012|20250113023013|20250217023014|20250317092322|20250414023016)"})
for: 5m
labels:
service: alertmanager
severity: critical
Fixed in 2.30.0 (21.0.0 and 20.0.0)
A compact MOSK cluster fails to be deployed through the Container Cloud web UI
due to inability to add any label to the control plane machines along with
inability to change dedicatedControlPlane: false using the web UI.
To work around the issue, manually add the required labels using CLI. Once done, the cluster deployment resumes.
A newly created project does not display all available tabs and contains different access denied errors during first five minutes after creation.
To work around the issue, refresh the browser in five minutes after the project creation.
The following table provides details on the impact of a MOSK cluster update to a patch release within the 24.2 series.
Note
For the detailed workflow of update to a patch release, refer to Update to a patch version.
Updated component |
Impact on cloud users |
Impact on cloud workloads |
|---|---|---|
OpenStack and Tungsten Fabric |
|
Open vSwitch networking - interruption of North-South connectivity, depending on the type of virtual routers used by a workload:
Tungsten Fabric networking - no impact |
Ceph |
~1% of read operations on object storage API may fail |
IO performance degradation for Ceph-backed virtual storage devices. Pay special attention to the known issue 50566 that may affect the maintenance window. |
Host OS components |
No impact |
No impact |
- 0(1,2)
You can bypass updating components of the cloud data plane to avoid the network downtime during Update to a patch version. By using this technique, you accept the risk that some security fixes may not be applied.
24.2.5 patch
The patch release notes contain the description of product enhancements, the list of updated artifacts and Common Vulnerabilities and Exposures (CVE) fixes as well as description of the addressed product issues for the MOSK 24.2.5 patch, if any.
Release date |
December 09, 2024 |
|---|---|
Scope |
Patch |
Cluster release |
17.2.7 |
OpenStack Operator |
0.16.22 |
Tungsten Fabric Operator |
0.15.10 |
The MOSK 24.2.5 patch provides the following updates:
Update of minor kernel version to
5.15.0-125-genericSecurity fixes for CVEs in images
Resolved product issues
For the list of enhancements and bug fixes that relate to Mirantis Container Cloud, refer to the Mirantis Container Cloud Release notes.
Learn more about the release cadence
This section lists the components artifacts of the MOSK 24.2.5 release that includes binaries, Docker images, and Helm charts.
MOSK 24.2.5 OpenStack Helm charts
Component |
Path |
License information for main executable programs |
|---|---|---|
openstack-operator |
https://binary.mirantis.com/openstack/helm/openstack-controller/openstack-operator-0.16.22.tgz |
Mirantis Proprietary License |
MOSK 24.2.5 OpenStack Antelope binaries and Docker images
Component |
Path |
License information for main executable programs |
|---|---|---|
Binaries |
||
octavia-amphora |
https://binary.mirantis.com/openstack/bin/octavia/amphora-x64-haproxy-antelope-20241128103344.qcow2 |
Mirantis Proprietary License |
mirantis |
https://binary.mirantis.com/openstack/bin/horizon/mirantis-antelope-18a1377-20230817112356.tar.gz |
Mirantis Proprietary License |
kernel |
GPL-2.0 |
|
initramfs |
https://binary.mirantis.com/openstack/bin/ironic/tinyipa/tinyipa-stable-antelope-20240213233421.gz |
GPL-2.0 |
service-image |
https://binary.mirantis.com/openstack/bin/manila/manila-service-image-20241024092252.qcow2 |
Mirantis Proprietary License |
Docker images |
||
keystone |
mirantis.azurecr.io/openstack/keystone:antelope-jammy-20241128095555 |
Apache License 2.0 |
heat |
mirantis.azurecr.io/openstack/heat:antelope-jammy-20241128095555 |
Apache License 2.0 |
glance |
mirantis.azurecr.io/openstack/glance:antelope-jammy-20241128095555 |
Apache License 2.0 |
cinder |
mirantis.azurecr.io/openstack/cinder:antelope-jammy-20241128095555 |
Apache License 2.0 |
osprober |
mirantis.azurecr.io/openstack/osprober:0.0.1-d0f3d7b |
Apache License 2.0 |
neutron |
mirantis.azurecr.io/openstack/neutron:antelope-jammy-20241128095555 |
Apache License 2.0 |
nova |
mirantis.azurecr.io/openstack/nova:antelope-jammy-20241128095555 |
Apache License 2.0 |
horizon |
mirantis.azurecr.io/openstack/horizon:antelope-jammy-20241128095555 |
Apache License 2.0 |
tempest |
mirantis.azurecr.io/openstack/tempest:antelope-jammy-20241128095555 |
Apache License 2.0 |
octavia |
mirantis.azurecr.io/openstack/octavia:antelope-jammy-20241128095555 |
Apache License 2.0 |
designate |
mirantis.azurecr.io/openstack/designate:antelope-jammy-20241128095555 |
Apache License 2.0 |
ironic |
mirantis.azurecr.io/openstack/ironic:antelope-jammy-20241128095555 |
Apache License 2.0 |
barbican |
mirantis.azurecr.io/openstack/barbican:antelope-jammy-20241128095555 |
Apache License 2.0 |
libvirt |
mirantis.azurecr.io/general/libvirt:8.0.x-jammy-reef-20241115095845 |
LGPL-2.1 License |
pause |
mirantis.azurecr.io/general/external/pause:3.1 |
Apache License 2.0 |
openvswitch |
mirantis.azurecr.io/general/openvswitch:2.17-jammy-20240827065304 |
Apache License 2.0 |
openvswitch-dpdk |
mirantis.azurecr.io/general/openvswitch-dpdk:2.17-jammy-20240827065304 |
Apache License 2.0 |
openstack-tools |
mirantis.azurecr.io/openstack/openstack-tools:yoga-jammy-20241120070553 |
Apache License 2.0 |
rabbitmq |
mirantis.azurecr.io/openstack/extra/rabbitmq:3.12.12-jammy-20240829072728 |
Mozilla Public License 2.0 |
rabbitmq-management |
mirantis.azurecr.io/openstack/extra/rabbitmq-management:3.12.12-jammy-20240829072728 |
Mozilla Public License 2.0 |
kubernetes-entrypoint |
mirantis.azurecr.io/openstack/extra/kubernetes-entrypoint:v1.0.1-34a4f54-20240910081335 |
Apache License 2.0 |
memcached |
mirantis.azurecr.io/general/memcached:v1.6.32-alpine-20241024070356 |
BSD 3-Clause “New” or “Revised” License |
etcd |
mirantis.azurecr.io/openstack/extra/etcd:v3.5.16-alpine-20241024070202 |
Apache License 2.0 |
powerdns |
mirantis.azurecr.io/openstack/extra/powerdns:4.8-alpine-20241120110423 |
GPL-2.0 License |
nginx-ingress-controller |
mirantis.azurecr.io/openstack/extra/nginx-ingress-controller:1.11.3-alpine-20241024075118 |
Apache License 2.0 |
tls-proxy |
mirantis.azurecr.io/openstack/tls-proxy:jammy-fipster-1.0.0.dev2 |
Mirantis Proprietary License |
defaultbackend |
mirantis.azurecr.io/openstack/extra/defaultbackend:v1.19.2-77af1ef-20240910090142 |
Apache License 2.0 |
mariadb |
mirantis.azurecr.io/general/mariadb:10.6.20-jammy-20241104184039 |
GPLv2, LGPLv2.1 (client libraries) |
rabbitmq-exporter |
mirantis.azurecr.io/stacklight/rabbitmq-exporter:1.0.0 |
MIT License |
memcached-exporter |
mirantis.azurecr.io/stacklight/memcached-exporter:v0.14.4 |
Apache License 2.0 |
prometheus-mysql-exporter |
mirantis.azurecr.io/stacklight/mysqld-exporter:v0.11.0 |
Apache License 2.0 |
aodh |
mirantis.azurecr.io/openstack/aodh:antelope-jammy-20241128095555 |
Apache License 2.0 |
ceilometer |
mirantis.azurecr.io/openstack/ceilometer:antelope-jammy-20241128095555 |
Apache License 2.0 |
gnocchi |
mirantis.azurecr.io/openstack/gnocchi:antelope-jammy-20241128095555 |
Apache License 2.0 |
redis |
mirantis.azurecr.io/openstack/extra/redis:7.2.x-alpine-20241024111938 |
BSD 3-Clause “New” or “Revised” License |
redis-operator |
mirantis.azurecr.io/openstack/extra/redis-operator:v1.2.4-20241024111938 |
Apache License 2.0 |
frr |
mirantis.azurecr.io/general/external/docker.io/frrouting/frr:v9.1.2-20241111080549 |
GPL-2.0 and LGPL-2.1 |
strongswan |
mirantis.azurecr.io/openstack/extra/strongswan:alpine-5.9.12-20241024065424 |
GPL-2.0 |
rsyslog |
mirantis.azurecr.io/openstack/extra/rsyslog:v8.2001.0-20240829110216 |
GNU General Public License v3 |
descheduler |
mirantis.azurecr.io/openstack/extra/descheduler-20240910121701:v0.30.1-amd64-20240910114244 |
Apache License 2.0 |
nginx |
mirantis.azurecr.io/openstack/extra/nginx:1.27.2-20241024065919 |
Apache License 2.0 |
requirements |
mirantis.azurecr.io/openstack/requirements:antelope-jammy-20241128095555 |
Apache License 2.0 |
drb-controller |
mirantis.azurecr.io/openstack/extra/drb-controller:0.1.0-20240701093549 |
Mirantis Proprietary License |
stepler |
mirantis.azurecr.io/openstack/stepler:antelope-jammy-20241120224419 |
Apache License 2.0 |
placement |
mirantis.azurecr.io/openstack/placement:antelope-jammy-20241128095555 |
Apache License 2.0 |
masakari |
mirantis.azurecr.io/openstack/masakari:antelope-jammy-20241128095555 |
Apache License 2.0 |
masakari-monitors |
mirantis.azurecr.io/openstack/masakari-monitors:antelope-jammy-20241128095555 |
Apache License 2.0 |
ironic-inspector |
mirantis.azurecr.io/openstack/ironic-inspector:antelope-jammy-20241128095555 |
Apache License 2.0 |
manila |
mirantis.azurecr.io/openstack/manila:antelope-jammy-20241128095555 |
Apache License 2.0 |
MOSK 24.2.5 OpenStack Yoga binaries and Docker images
Component |
Path |
License information for main executable programs |
|---|---|---|
Binaries |
||
octavia-amphora |
https://binary.mirantis.com/openstack/bin/octavia/amphora-x64-haproxy-yoga-20241128103502.qcow2 |
Mirantis Proprietary License |
mirantis |
https://binary.mirantis.com/openstack/bin/horizon/mirantis-yoga-186584b-20230817112411.tar.gz |
Mirantis Proprietary License |
kernel |
https://binary.mirantis.com/openstack/bin/ironic/tinyipa/tinyipa-stable-yoga-20231004061110.vmlinuz |
GPL-2.0 |
initramfs |
https://binary.mirantis.com/openstack/bin/ironic/tinyipa/tinyipa-stable-yoga-20231004061110.gz |
GPL-2.0 |
service-image |
https://binary.mirantis.com/openstack/bin/manila/manila-service-image-20241024092252.qcow2 |
Mirantis Proprietary License |
Docker images |
||
keystone |
mirantis.azurecr.io/openstack/keystone:yoga-jammy-20241128095555 |
Apache License 2.0 |
heat |
mirantis.azurecr.io/openstack/heat:yoga-jammy-20241128095555 |
Apache License 2.0 |
glance |
mirantis.azurecr.io/openstack/glance:yoga-jammy-20241128095555 |
Apache License 2.0 |
cinder |
mirantis.azurecr.io/openstack/cinder:yoga-jammy-20241128095555 |
Apache License 2.0 |
osprober |
mirantis.azurecr.io/openstack/osprober:0.0.1-d0f3d7b |
Apache License 2.0 |
neutron |
mirantis.azurecr.io/openstack/neutron:yoga-jammy-20241128095555 |
Apache License 2.0 |
nova |
mirantis.azurecr.io/openstack/nova:yoga-jammy-20241128095555 |
Apache License 2.0 |
horizon |
mirantis.azurecr.io/openstack/horizon:yoga-jammy-20241128095555 |
Apache License 2.0 |
tempest |
mirantis.azurecr.io/openstack/tempest:yoga-jammy-20241128095555 |
Apache License 2.0 |
octavia |
mirantis.azurecr.io/openstack/octavia:yoga-jammy-20241128095555 |
Apache License 2.0 |
designate |
mirantis.azurecr.io/openstack/designate:yoga-jammy-20241128095555 |
Apache License 2.0 |
ironic |
mirantis.azurecr.io/openstack/ironic:yoga-jammy-20241128095555 |
Apache License 2.0 |
barbican |
mirantis.azurecr.io/openstack/barbican:yoga-jammy-20241128095555 |
Apache License 2.0 |
libvirt |
mirantis.azurecr.io/general/libvirt:8.0.x-jammy-reef-20241115095845 |
LGPL-2.1 License |
pause |
mirantis.azurecr.io/general/external/pause:3.1 |
Apache License 2.0 |
openvswitch |
mirantis.azurecr.io/general/openvswitch:2.17-jammy-20240827065304 |
Apache License 2.0 |
openvswitch-dpdk |
mirantis.azurecr.io/general/openvswitch-dpdk:2.17-jammy-20240827065304 |
Apache License 2.0 |
openstack-tools |
mirantis.azurecr.io/openstack/openstack-tools:yoga-jammy-20241128095555 |
Apache License 2.0 |
rabbitmq |
mirantis.azurecr.io/openstack/extra/rabbitmq:3.12.12-jammy-20240829072728 |
Mozilla Public License 2.0 |
rabbitmq-management |
mirantis.azurecr.io/openstack/extra/rabbitmq-management:3.12.12-jammy-20240829072728 |
Mozilla Public License 2.0 |
kubernetes-entrypoint |
mirantis.azurecr.io/openstack/extra/kubernetes-entrypoint:v1.0.1-34a4f54-20240910081335 |
Apache License 2.0 |
memcached |
mirantis.azurecr.io/general/memcached:v1.6.32-alpine-20241024070356 |
BSD 3-Clause “New” or “Revised” License |
etcd |
mirantis.azurecr.io/openstack/extra/etcd:v3.5.16-alpine-20241024070202 |
Apache License 2.0 |
powerdns |
mirantis.azurecr.io/openstack/extra/powerdns:4.8-alpine-20241120110423 |
GPL-2.0 License |
nginx-ingress-controller |
mirantis.azurecr.io/openstack/extra/nginx-ingress-controller:1.11.3-alpine-20241024075118 |
Apache License 2.0 |
tls-proxy |
mirantis.azurecr.io/openstack/tls-proxy:jammy-fipster-1.0.0.dev2 |
Mirantis Proprietary License |
defaultbackend |
mirantis.azurecr.io/openstack/extra/defaultbackend:v1.19.2-77af1ef-20240910090142 |
Apache License 2.0 |
mariadb |
mirantis.azurecr.io/general/mariadb:10.6.20-jammy-20241104184039 |
GPLv2, LGPLv2.1 (client libraries) |
rabbitmq-exporter |
mirantis.azurecr.io/stacklight/rabbitmq-exporter:1.0.0 |
MIT License |
memcached-exporter |
mirantis.azurecr.io/stacklight/memcached-exporter:v0.14.4 |
Apache License 2.0 |
prometheus-mysql-exporter |
mirantis.azurecr.io/stacklight/mysqld-exporter:v0.11.0 |
Apache License 2.0 |
aodh |
mirantis.azurecr.io/openstack/aodh:yoga-jammy-20241128095555 |
Apache License 2.0 |
ceilometer |
mirantis.azurecr.io/openstack/ceilometer:yoga-jammy-20241128095555 |
Apache License 2.0 |
gnocchi |
mirantis.azurecr.io/openstack/gnocchi:yoga-jammy-20241128095555 |
Apache License 2.0 |
redis |
mirantis.azurecr.io/openstack/extra/redis:7.2.x-alpine-20241024111938 |
BSD 3-Clause “New” or “Revised” License |
redis-operator |
mirantis.azurecr.io/openstack/extra/redis-operator:v1.2.4-20241024111938 |
Apache License 2.0 |
frr |
mirantis.azurecr.io/general/external/docker.io/frrouting/frr:v9.1.2-20241111080549 |
GPL-2.0 and LGPL-2.1 |
strongswan |
mirantis.azurecr.io/openstack/extra/strongswan:alpine-5.9.12-20241024065424 |
GPL-2.0 |
rsyslog |
mirantis.azurecr.io/openstack/extra/rsyslog:v8.2001.0-20240829110216 |
GNU General Public License v3 |
descheduler |
mirantis.azurecr.io/openstack/extra/descheduler-20240910121701:v0.30.1-amd64-20240910114244 |
Apache License 2.0 |
nginx |
mirantis.azurecr.io/openstack/extra/nginx:1.27.2-20241024065919 |
Apache License 2.0 |
requirements |
mirantis.azurecr.io/openstack/requirements:yoga-jammy-20241128095555 |
Apache License 2.0 |
drb-controller |
mirantis.azurecr.io/openstack/extra/drb-controller:0.1.0-20240701093549 |
Mirantis Proprietary License |
stepler |
mirantis.azurecr.io/openstack/stepler:yoga-focal-20241107122432 |
Apache License 2.0 |
placement |
mirantis.azurecr.io/openstack/placement:yoga-jammy-20241128095555 |
Apache License 2.0 |
masakari |
mirantis.azurecr.io/openstack/masakari:yoga-jammy-20241128095555 |
Apache License 2.0 |
masakari-monitors |
mirantis.azurecr.io/openstack/masakari-monitors:yoga-jammy-20241128095555 |
Apache License 2.0 |
ironic-inspector |
mirantis.azurecr.io/openstack/ironic-inspector:yoga-jammy-20241128095555 |
Apache License 2.0 |
manila |
mirantis.azurecr.io/openstack/manila:yoga-jammy-20241128095555 |
Apache License 2.0 |
MOSK 24.2.5 Tungsten Fabric 21.4 artifacts
Component |
Path |
License information for main executable programs |
|---|---|---|
Helm charts |
||
tungstenfabric-operator |
https://binary.mirantis.com/tungsten/helm/tungstenfabric-operator-0.15.10.tgz |
Mirantis Proprietary License |
Docker images |
||
tungstenfabric-operator |
mirantis.azurecr.io/tungsten-operator/tungstenfabric-operator:0.15.10 |
Mirantis Proprietary License |
tungsten-pytest |
mirantis.azurecr.io/tungsten/tungsten-pytest:0.1-20241118202346 |
MIT License |
casskop |
mirantis.azurecr.io/tungsten-operator/casskop:2.2.6 |
Apache License 2.0 |
cassandra-bootstrap |
mirantis.azurecr.io/tungsten/cassandra-bootstrap:0.1.20 |
Apache License 2.0 |
cassandra |
mirantis.azurecr.io/tungsten/cassandra:3.11.17 |
Apache License 2.0 |
cassandra-config-builder |
mirantis.azurecr.io/tungsten/cass-config-builder:v2-20240812125407 |
Apache License 2.0 |
rabbitmq-operator |
mirantis.azurecr.io/tungsten-operator/rabbitmq-operator:0.4.6 |
Mirantis Proprietary License |
rabbitmq |
mirantis.azurecr.io/tungsten/rabbitmq:3.11.16 |
Mozilla Public License 2.0 |
rabbitmq-exporter |
mirantis.azurecr.io/stacklight/rabbitmq-exporter:1.0.0 |
MIT License |
zookeeper-operator |
mirantis.azurecr.io/tungsten-operator/zookeeper-operator:0.2.24-mcp |
Apache License 2.0 |
zookeeper |
mirantis.azurecr.io/tungsten/zookeeper:3.8.4-20240813 |
Apache License 2.0 |
redis-operator |
mirantis.azurecr.io/tungsten-operator/redis-operator:0.4.6 |
Apache License 2.0 |
redis |
mirantis.azurecr.io/tungsten/redis:7.2.4-alpine3.19 |
BSD 3-Clause “New” or “Revised” License |
redis-exporter |
mirantis.azurecr.io/stacklight/redis_exporter:v1.62.0 |
BSD 3-Clause “New” or “Revised” License |
tf-cli |
mirantis.azurecr.io/tungsten/tf-cli:0.1-20241119115912 |
MIT License |
kubernetes-entrypoint |
mirantis.azurecr.io/openstack/extra/kubernetes-entrypoint:v1.0.1-34a4f54-20240910081335 |
Apache License 2.0 |
pause |
mirantis.azurecr.io/general/external/pause:3.1 |
Apache License 2.0 |
tf-nodeinfo |
mirantis.azurecr.io/tungsten/tf-nodeinfo:0.1-20240919130057 |
MIT License |
contrail-controller-config-api |
mirantis.azurecr.io/tungsten/contrail-controller-config-api:24.2-r21.4.20240819135158 |
Apache License 2.0 |
contrail-controller-config-devicemgr |
mirantis.azurecr.io/tungsten/contrail-controller-config-devicemgr:24.2-r21.4.20240819135158 |
Apache License 2.0 |
contrail-controller-config-dnsmasq |
mirantis.azurecr.io/tungsten/contrail-controller-config-dnsmasq:24.2-r21.4.20240819135158 |
Apache License 2.0 |
contrail-controller-config-schema |
mirantis.azurecr.io/tungsten/contrail-controller-config-schema:24.2-r21.4.20240819135158 |
Apache License 2.0 |
contrail-controller-config-svcmonitor |
mirantis.azurecr.io/tungsten/contrail-controller-config-svcmonitor:24.2-r21.4.20240819135158 |
Apache License 2.0 |
contrail-controller-control-control |
mirantis.azurecr.io/tungsten/contrail-controller-control-control:24.2-r21.4.20240819135158 |
Apache License 2.0 |
contrail-controller-control-dns |
mirantis.azurecr.io/tungsten/contrail-controller-control-dns:24.2-r21.4.20240819135158 |
Apache License 2.0 |
contrail-controller-control-named |
mirantis.azurecr.io/tungsten/contrail-controller-control-named:24.2-r21.4.20240819135158 |
Apache License 2.0 |
contrail-controller-webui-job |
mirantis.azurecr.io/tungsten/contrail-controller-webui-job:24.2-r21.4.20240819135158 |
Apache License 2.0 |
contrail-controller-webui-web |
mirantis.azurecr.io/tungsten/contrail-controller-webui-web:24.2-r21.4.20240819135158 |
Apache License 2.0 |
contrail-node-init |
mirantis.azurecr.io/tungsten/contrail-node-init:21.4.20240530000000 |
Apache License 2.0 |
contrail-nodemgr |
mirantis.azurecr.io/tungsten/contrail-nodemgr:24.2-r21.4.20240819135158 |
Apache License 2.0 |
contrail-provisioner |
mirantis.azurecr.io/tungsten/contrail-provisioner:24.2-r21.4.20240819135158 |
Apache License 2.0 |
contrail-tools |
mirantis.azurecr.io/tungsten/contrail-tools:24.2-r21.4.20240819135158 |
Apache License 2.0 |
contrail-vrouter-agent |
mirantis.azurecr.io/tungsten/contrail-vrouter-agent:21.4.20240530000000 |
Apache License 2.0 |
contrail-vrouter-agent-dpdk |
mirantis.azurecr.io/tungsten/contrail-vrouter-agent-dpdk:21.4.20240530000000 |
Apache License 2.0 |
contrail-vrouter-kernel-build-init |
mirantis.azurecr.io/tungsten/contrail-vrouter-kernel-build-init:21.4.20240530000000 |
Apache License 2.0 |
MOSK 24.2.5 StackLight artifacts
Component |
Path |
License information for main executable programs |
|---|---|---|
Docker images |
||
prometheus-libvirt-exporter |
mirantis.azurecr.io/stacklight/prometheus-libvirt-exporter:v0.2-20241118023015 |
Mirantis Proprietary License |
tungstenfabric-prometheus-exporter |
mirantis.azurecr.io/stacklight/tungstenfabric-prometheus-exporter:0.1-20241021123242 |
Mirantis Proprietary License |
Helm charts |
||
fluentd |
https://binary.mirantis.com/stacklight/helm/fluentd-2.0.3-mcp-52.tgz |
Mirantis Proprietary License |
prometheus-libvirt-exporter |
https://binary.mirantis.com/stacklight/helm/prometheus-libvirt-exporter-0.2.0-mcp-7.tgz |
Mirantis Proprietary License |
prometheus-tungstenfabric-exporter |
https://binary.mirantis.com/stacklight/helm/prometheus-tungstenfabric-exporter-0.2.0-mcp-7.tgz |
Mirantis Proprietary License |
The table below contains the total number of addressed unique and common CVEs by MOSK-specific component compared to the previous patch release version. The common CVEs are issues addressed across several images.
Product component |
CVE type |
Critical |
High |
Total |
|---|---|---|---|---|
OpenStack |
Unique |
0 |
5 |
5 |
Common |
0 |
8 |
8 |
|
Tungsten Fabric |
Unique |
1 |
8 |
9 |
Common |
2 |
11 |
13 |
Mirantis Security Portal
For the detailed list of fixed and present CVEs across the Mirantis Container Cloud and MOSK products, refer to Mirantis Security Portal.
Mirantis Container Cloud CVEs
For the number of fixed CVEs in the Mirantis Container Cloud-related components including kaas core, bare metal, Ceph, and StackLight, refer to Container Cloud 2.28.3: Security notes.
The following issues have been addressed in the MOSK 24.2.5 release:
[48160] [OpenStack] Resolved the issue that caused instances to fail booting when using a VFAT-formatted config drive.
This section lists MOSK known issues with workarounds for the MOSK release 24.2.5:
During MariaDB operations on a management cluster, Pods may get stuck in continuous restarts with the following example error:
[ERROR] WSREP: Corrupt buffer header: \
addr: 0x7faec6f8e518, \
seqno: 3185219421952815104, \
size: 909455917, \
ctx: 0x557094f65038, \
flags: 11577. store: 49, \
type: 49
Workaround:
Create a backup of the
/var/lib/mysqldirectory on themariadb-serverPod.Verify that other replicas are up and ready.
Remove the
galera.cachefile for the affectedmariadb-serverPod.Remove the affected
mariadb-serverPod or wait until it is automatically restarted.
After Kubernetes restarts the Pod, the Pod clones the database in 1-2 minutes and restores the quorum.
Due to the MetalLB upstream issue, a load balancer service may not obtain the external IP address.
The issue occurs when two services share the same external IP address and have
the same externalTrafficPolicy value. Initially, the services have the
external IP address assigned and are accessible. After modifying the
externalTrafficPolicy value for both services from Cluster to
Local, the first service that has been changed remains with no external IP
address assigned. Though, the second service, which was changed later, has the
external IP assigned as expected.
To work around the issue, make a dummy change to the service object where
external IP is <pending>:
Identify the service that is stuck:
kubectl get svc -A | grep pending
Example of system response:
stacklight iam-proxy-prometheus LoadBalancer 10.233.28.196 <pending> 443:30430/TCP
Add an arbitrary label to the service that is stuck. For example:
kubectl label svc -n stacklight iam-proxy-prometheus reconcile=1
Example of system response:
service/iam-proxy-prometheus labeledVerify that the external IP was allocated to the service:
kubectl get svc -n stacklight iam-proxy-prometheus
Example of system response:
NAME TYPE CLUSTER-IP EXTERNAL-IP PORT(S) AGE iam-proxy-prometheus LoadBalancer 10.233.28.196 10.0.34.108 443:30430/TCP 12d
Sometimes, after changing the OpenStackDeployment custom resource,
it does not transition to the APPLYING state as expected.
To work around the issue, restart the rockoon` pod in the osh-system
namespace.
Rebooting all Cassandra cluster TFConfig or TFAnalytics nodes, maintenance, or other circumstances that cause the Cassandra pods to start simultaneously may cause a broken Cassandra TFConfig and/or TFAnalytics cluster. In this case, Cassandra nodes do not join the ring and do not update the IPs of the neighbor nodes. As a result, the TF services cannot operate Cassandra cluster(s).
To verify that a Cassandra cluster is affected:
Run the nodetool status command specifying the config or
analytics cluster and the replica number:
kubectl -n tf exec -it tf-cassandra-<config/analytics>-dc1-rack1-<replica number> -c cassandra -- nodetool status
Example of system response with outdated IP addresses:
Datacenter: DC1
===============
Status=Up/Down
|/ State=Normal/Leaving/Joining/Moving
-- Address Load Tokens Owns (effective) Host ID Rack
DN <outdated ip> ? 256 64.9% a58343d0-1e3f-4d54-bcdf-9b9b949ca873 r1
DN <outdated ip> ? 256 69.8% 67f1d07c-8b13-4482-a2f1-77fa34e90d48 r1
Datacenter: dc1
===============
Status=Up/Down
|/ State=Normal/Leaving/Joining/Moving
-- Address Load Tokens Owns (effective) Host ID Rack
UN <actual ip> 3.84 GiB 256 65.2% 7324ebc4-577a-425f-b3de-96faac95a331 rack1
Workaround:
Manually delete the Cassandra pod from the failed config or analytics
cluster to re-initiate the bootstrap process for one of the Cassandra nodes:
kubectl -n tf delete pod tf-cassandra-<config/analytics>-dc1-rack1-<replica_num>
Occasionally, RabbitMQ instances in tf-rabbitmq pods fail to enable
the tracking_records_in_ets during the initialization process.
To work around the problem, restart the affected pods manually.
After replacing a failed Tungsten Fabric controller node as described in Replace a failed TF controller node, the first restart of the Cassandra pod on this node may cause an issue if the Cassandra node with the outdated IP address has not been removed from the cluster. Subsequent Cassandra pod restarts should not trigger this problem.
To verify if your Cassandra cluster is affected, run the nodetool status command specifying the config or analytics cluster and the replica number:
kubectl -n tf exec -it tf-cassandra-<CONFIG-OR-ANALYTICS>-dc1-rack1-<REPLICA-NUM> -c cassandra -- nodetool status
Example of the system response with outdated IP addresses:
Datacenter: dc1
===============
Status=Up/Down
|/ State=Normal/Leaving/Joining/Moving
-- Address Load Tokens Owns Host ID Rack
UN 192.168.201.144 509.43 KiB 256 ? 7e760a99-fae5-4921-b0c5-d9e6e1eca1c5 rack1
UN 192.168.50.146 534.18 KiB 256 ? 2248ea35-85d4-4887-820b-1fac4733021f rack1
UN 192.168.145.147 484.19 KiB 256 ? d988aaaa-44ae-4fec-a617-0b0a253e736d rack1
DN 192.168.145.144 481.53 KiB 256 ? c23703a1-6854-47a7-a4a2-af649d63af0c rack1
An extra node will appear in the cluster with an outdated IP address
(the IP of the terminated Cassandra pod) in the Down state.
To work around the issue, after replacing the Tungsten Fabric controller node, delete the Cassandra pod on the replaced node and remove the outdated node from the Cassandra cluster using nodetool:
kubectl -n tf exec -it tf-cassandra-<CONFIG-OR-ANALYTICS>-dc1-rack1-<REPLICA-NUM> -c cassandra -- nodetool removenode <HOST-ID>
During cluster update, the rolling reboot fails on the Tungsten Fabric cluster. To work around the issue, restart the RabbitMQ pods in the Tungsten Fabric cluster.
Fixed in MOSK 25.1 Fixed in MOSK 25.1.1
When updating to the MOSK 24.3 series, tf-config pods from the Tungsten
Fabric namespace may enter the CrashLoopBackOff state. For example:
tf-config-cs8zr 2/5 CrashLoopBackOff 676 (19s ago) 15h
tf-config-db-6zxgg 1/1 Running 44 (25m ago) 15h
tf-config-db-7k5sz 1/1 Running 43 (23m ago) 15h
tf-config-db-dlwdv 1/1 Running 43 (25m ago) 15h
tf-config-nw4tr 3/5 CrashLoopBackOff 665 (43s ago) 15h
tf-config-wzf6c 1/5 CrashLoopBackOff 680 (10s ago) 15h
tf-control-c6bnn 3/4 Running 41 (23m ago) 13h
tf-control-gsnnp 3/4 Running 42 (23m ago) 13h
tf-control-sj6fd 3/4 Running 41 (23m ago) 13h
To troubleshoot the issue, check the logs inside the tf-config API
container and the tf-cassandra pods. The following example logs
indicate that Cassandra services failed to peer with each other and
are operating independently:
Logs from the
tf-configAPI container:NoHostAvailable: ('Unable to complete the operation against any hosts', {<Host: 192.168.200.23:9042 dc1>: Unavailable('Error from server: code=1000 [Unavailable exception] message="Cannot achieve consistency level QUORUM" info={\'required_replicas\': 2, \'alive_replicas\': 1, \'consistency\': \'QUORUM\'}',)})Logs from the
tf-cassandrapods:INFO [OptionalTasks:1] 2024-09-09 08:59:36,231 CassandraRoleManager.java:419 - Setup task failed with error, rescheduling WARN [OptionalTasks:1] 2024-09-09 08:59:46,231 CassandraRoleManager.java:379 - CassandraRoleManager skipped default role setup: some nodes were not ready
To work around the issue, restart the Cassandra services in the Tungsten Fabric namespace by deleting the affected pods sequentially to establish the connection between them:
kubectl -n tf delete pod tf-cassandra-config-dc1-rack1-0
kubectl -n tf delete pod tf-cassandra-config-dc1-rack1-1
kubectl -n tf delete pod tf-cassandra-config-dc1-rack1-2
Now, all other services in the Tungsten Fabric namespace should be in
the Active state.
The designate-zone-setup Kubernetes job in the openstack namespace
fails during update to MOSK 24.3 with the following error present in the
logs of the job pod:
openstack.exceptions.BadRequestException: BadRequestException: 400:
Client Error for url: http://designate-api.openstack.svc.cluster.local:9001/v2/zones,
Invalid TLD
The issue occurs when the DNS service (OpenStack Designate) has any TLDs
created, but test is not among them. Since DNS service monitoring
was added to MOSK 24.3, it attempts to create a test zone test-zone.test
in the Designate service, which fails if the test TLD is missing.
To work around the issue, verify that there are created TLDs present in the DNS service:
openstack tld list -f value -c name
If there are TLDs present and test is not one of them, create it:
Warning
Do not create the test TLD if no TLDs were present
in the DNS service initially. In this case, the issue is caused by
a different factor, and creating the test TLD when none existed
before may disrupt users of both the DNS and Networking services.
openstack tld create --name test
Example output:
+-------------+--------------------------------------+
| Field | Value |
+-------------+--------------------------------------+
| created_at | 2024-10-22T19:22:15.000000 |
| description | None |
| id | 930fed8b-1e91-4c8c-a00f-7abf68b944d0 |
| name | test |
| updated_at | None |
+-------------+--------------------------------------+
During major or patch update of a MOSK cluster with StackLight enabled in
non-HA mode, the KubePodsCrashLooping alert may be firing for the Grafana
ReplicaSet.
Grafana relies on PostgreSQL for persistent data. In non-HA StackLight setup,
PostgreSQL becomes temporarily unavailable during updates. If Grafana loses its
database connection or fails to establish one during startup, Grafana fails
with an error. This may cause the Grafana pod to enter the CrashLoopBackOff
state. Such behavior is expected in non-HA StackLight setups. The Grafana pod
will resume normal operation after PostgreSQL is restored.
To prevent the issue, deploy StackLight in HA mode.
The incompatibility between the newly implemented session refresh in the
upstream simple-salesforce with the MOSK implementation of session refresh
in sf-notifier results in the uncontrolled growth of new logins and lack
of session reuse. The issue applies to both MOSK and management clusters.
Workaround:
The workaround to the issue is to change the sf-notifier image tag directly
in the Deployment object. This change is not persistent as this direct change
in the Deployment object will be reverted or overridden by:
Container Cloud version update (for management clusters)
Cluster release version update (for MOSK cluster)
Any
sf-notifier-related operation (for all clusters):Disable and enable
Credentials change
IDs change
Any configuration change for resources, node selector, tolerations, and log level
Once applied, this workaround must be re-applied whenever one of the above operations is performed in the cluster.
Print the currently used image:
kubectl get deployment sf-notifier -n stacklight -o jsonpath="{.spec.template.spec.containers[0].image}"
Possible results:
mirantis.azurecr.io/stacklight/sf-notifier:v0.4-20250113023013or
127.0.0.1:44301/stacklight/sf-notifier:v0.4-20250113023013Compare the
sf-notifierimage tag with the list of affected tags. If the image is affected, it has to be replaced. Otherwise, your cluster is not affected.Affected tags:
v0.4-20241021023015 v0.4-20241028023015 v0.4-20241118023015 v0.4-20241216023012 v0.4-20250113023013 v0.4-20250217023014 v0.4-20250317092322 v0.4-20250414023016
In the resulting string, replace only the tag of the affected image with the desired
v0.4-20240828023015tag. Keep the registry the same as in the original Deployment object.Resulting images from examples:
mirantis.azurecr.io/stacklight/sf-notifier:v0.4-20240828023015
or
127.0.0.1:44301/stacklight/sf-notifier:v0.4-20240828023015
Update the
sf-notifierDeployment with the new image:kubectl set image deployment/sf-notifier sf-notifier=<new image> -n stacklight
For example:
kubectl set image deployment/sf-notifier sf-notifier=mirantis.azurecr.io/stacklight/sf-notifier:v0.4-20240828023015 -n stacklight
or
kubectl set image deployment/sf-notifier sf-notifier=127.0.0.1:44301/stacklight/sf-notifier:v0.4-20240828023015 -n stacklight
Wait until the pod with the updated image is created, and check the logs. Verify that there are no errors in the logs:
kubectl logs pod/<sf-notifier pod> -n stacklight
As this change is not persistent and can be reverted by the cluster update
operation or any operation related to sf-notifier, periodically check all
clusters and if the change has been reverted, re-apply the workaround.
Optionally, you can add a custom alert that will monitor the current tag of
the sf-notifier image and will fire the alert if the tag is present in
the list of affected tags. For the custom alert configuration details,
refer to Alert configuration.
Example of a custom alert to monitor the current tag of the sf-notifier
image:
- name: stacklight
values:
...
prometheusServer:
...
customAlerts:
...
- alert: SFnotifierImageVersion
annotations:
description: "sf-notifier image has a buggy tag, please revert deployment image back to sf-notifier:v0.4-20240828023015. This should be fixed in MCC 2.29.3 / MOSK 24.3.5, remove the alert after this release upgrade."
summary: "This image might be causing too many API logins and exceeding our monthly API budget, please act immediately"
expr: >-
avg(kube_pod_container_info{container="sf-notifier",image_spec=~".*v0.4-(20241021023015|20241028023015|20241118023015|20241216023012|20250113023013|20250217023014|20250317092322|20250414023016)"})
for: 5m
labels:
service: alertmanager
severity: critical
Fixed in 2.30.0 (21.0.0 and 20.0.0)
A compact MOSK cluster fails to be deployed through the Container Cloud web UI
due to inability to add any label to the control plane machines along with
inability to change dedicatedControlPlane: false using the web UI.
To work around the issue, manually add the required labels using CLI. Once done, the cluster deployment resumes.
A newly created project does not display all available tabs and contains different access denied errors during first five minutes after creation.
To work around the issue, refresh the browser in five minutes after the project creation.
The following table provides details on the impact of a MOSK cluster update to a patch release within the 24.2 series.
Note
For the detailed workflow of update to a patch release, refer to Update to a patch version.
Updated component |
Impact on cloud users |
Impact on cloud workloads |
|---|---|---|
OpenStack and Tungsten Fabric |
|
Open vSwitch networking - interruption of North-South connectivity, depending on the type of virtual routers used by a workload:
Tungsten Fabric networking - no impact |
Ceph |
~1% of read operations on object storage API may fail |
IO performance degradation for Ceph-backed virtual storage devices. Pay special attention to the known issue 50566 that may affect the maintenance window. |
Host OS components |
No impact |
No impact |
- 0(1,2)
You can bypass updating components of the cloud data plane to avoid the network downtime during Update to a patch version. By using this technique, you accept the risk that some security fixes may not be applied.
24.1 series
Major and patch versions update path
The primary distinction between major and patch product versions lies in the fact that major release versions introduce new functionalities, whereas patch release versions predominantly offer minor product enhancements, mostly CVE resolutions for your clusters.
Depending on your deployment needs, you can either update only between major releases or apply patch updates between major releases. Choosing the latter option, which includes patch updates, ensures you receive security fixes as soon as they become available. Though, be prepared to update your cluster frequently, approximately once every three weeks.
Refer to the following documentation for the details about the release content, update schemes, and so on:
Starting from MOSK 24.1.5, Mirantis introduces a new update scheme allowing for the update path flexibility. For details, Cluster update scheme.
24.1
Release date |
March 04, 2024 |
|---|---|
Name |
MOSK 24.1 |
Cluster release |
17.1.0 |
Highlights |
|
Component |
Support scope |
Feature |
|---|---|---|
Update |
Full |
Pre-update inspection of pinned product artifacts in a Cluster object |
OpenStack |
Full |
|
TechPreview |
||
TechPreview |
||
TechPreview |
||
Full |
||
Full |
||
Tungsten Fabric |
TechPreview |
|
Unsupported |
||
TechPreview |
||
StackLight |
Full |
|
Removed |
||
Security |
Full |
To ensure that Container Cloud clusters remain consistently updated with the
latest security fixes and product improvements, the Admission Controller
has been enhanced. Now, it actively prevents the utilization of pinned
custom artifacts for Container Cloud components. Specifically, it blocks
a management or managed cluster release update, or any cluster configuration
update, for example, adding public keys or proxy, if a Cluster object
contains any custom Container Cloud artifacts with global or image-related
values overwritten in the helm-releases section, until these values are
removed.
Normally, the Container Cloud clusters do not contain pinned artifacts,
which eliminates the need for any pre-update actions in most deployments.
However, if the update of your cluster is blocked with the
invalid HelmReleases configuration error, refer to
Update notes: Pre-update actions for details.
Note
In rare cases, if the image-related or global values should be
changed, you can use the ClusterRelease or KaaSRelease objects
instead. But make sure to update these values manually after every major
and patch update.
Note
The pre-update inspection applies only to images delivered by Container Cloud that are overwritten. Any custom images unrelated to the product components are not verified and do not block cluster update.
Learn more
Added full support for OpenStack Antelope with Open vSwitch and Tungsten Fabric 21.4 networking backends.
Starting from 24.1, MOSK deploys all new clouds with OpenStack Antelope by default. To upgrade an existing cloud from OpenStack Yoga to Antelope, follow the Upgrade OpenStack procedure.
For the OpenStack support cycle in MOSK, refer to OpenStack support cycle.
Highlights from upstream OpenStack supported by MOSK deployed on Antelope
Designate:
Ability to share Designate zones across multiple projects. This not only allows two or more projects to manage recordsets in the zone but also enables “Classless IN-ADDR.ARPA delegation” (RFC 2317) in Designate. “Classless IN-ADDR.ARPA delegation” permits IP address DNS PTR record assignment in smaller blocks without creating a DNS zone for each address.
Manila:
Feature parity between the native client and OSC.
Capability for users to specify metadata when creating their share snapshots. The behavior should be similar to Manila shares, allowing users to query snapshots filtering them by metadata, and update or delete the metadata of the given resources.
Neutron:
Capability for managing network traffic based on packet rate by implementing the QoS (Quality of Service) rule type “packet per second” (pps).
Nova:
Improved behavior for Windows guests by adding new Hyper-V enlightments on all libvirt guests by default.
Ability to unshelve an instance to a specific host (admin only).
With microversion 2.92, the capability to only import a public key and not generate a keypair. Also, the capability to use an extended name pattern.
Octavia:
Support for notifications about major events of the life cycle of a load balancer. Only
loadbalancer.[create|update|delete].endevents are emitted.
To view the full list of OpenStack Antelope features, including those not supported by MOSK, refer to OpenStack Antelope upstream documentation: Release notes and source code.
TechPreview
Implemented the capability to enable SPICE remote console through the
OpenStackDeployment custom resource as a method to interact with
OpenStack virtual machines through the CLI and desktop client as well
as MOSK Dashboard (OpenStack Horizon).
The usage of the SPICE remote console is an alternative to using the noVNC-based VNC remote console.
Learn more
TechPreview
Implemented the capability to configure and run Windows guests on OpenStack, which allows for optimization of cloud infrastructure for diverse workloads.
Learn more
TechPreview
Introduced support for the Virtual Graphics Processing Unit (vGPU) feature that allows for leveraging the power of virtualized GPU resources to enhance performance and scalability of cloud deployments.
Implemented a new logic for Open vSwitch restart process during a MOSK cluster update that allows for minimized workload downtime.
Implemented automated management and coordination of relocating stateful applications.
TechPreview
Enhanced the connectivity between the Tungsten Fabric services and Cassandra database clusters through the Cassandra Query Language (CQL) protocol.
TechPreview
Introduced the technical preview support for the API v2 for the Tungsten Fabric Operator. This API version aligns with the OpenStack Controller API and provides better interface for advanced configurations.
In MOSK 24.1, the API v2 is available only for the greenfield product deployments with Tungsten Fabric. The Tungsten Fabric configuration documentation provides configuration examples for both API v1alpha1 and API v2.
Removed from support Tungsten Fabric analytics services, primarily designed for collecting various metrics from the Tungsten Fabric services.
Despite its initial implementation, user demand for this feature has been minimal. As a result, Tungsten Fabric analytics services become unsupported in the product.
All greenfield deployments starting from MOSK 24.1 do not include Tungsten Fabric analytics services using StackLight capabilities instead by default. The existing deployments updated to 24.1 and newer versions will include Tungsten Fabric analytics services as well as the ability to disable them.
Implemented alerts to notify the cloud users when their OpenStack administrator and OpenStack service user credentials are overdue for rotation.
Learn more
Removed StackLight telegraf-openstack plugin and replaced it with
osdpl-exporter.
All valuable Telegraf metrics used by StackLight components have been
reimplemented in osdpl-exporter and all dependent StackLight alerts
and dashboards started using new metrics.
Implemented more restrictive network policies for Kubernetes pods running OpenStack services.
As part of the enhancement, added NetworkPolicy objects for all types of
Ceph daemons. These policies allow only specified ports to be used by the
corresponding Ceph daemon pods.
Learn more
Mirantis has tested MOSK against a very specific configuration and can guarantee a predictable behavior of the product only in the exact same environments. The table below includes the major MOSK components with the exact versions against which testing has been performed.
Component |
Version |
|---|---|
Cluster release |
17.1.0 (Cluster release notes) |
OpenStack |
Antelope, Yoga |
OpenStack Operator |
0.15.9 |
Tungsten Fabric |
21.4 |
Tungsten Fabric Operator |
0.14.3 |
See also
For the supported versions of operating system, Ceph, and other components, refer to Compatibility Matrix.
This section describes the MOSK known issues with available workarounds. For the known issues in the related version of Mirantis Container Cloud, refer to Mirantis Container Cloud: Release Notes.
This section lists the OpenStack known issues with workarounds for the Mirantis OpenStack for Kubernetes release 24.1.
During MariaDB operations on a management cluster, Pods may get stuck in continuous restarts with the following example error:
[ERROR] WSREP: Corrupt buffer header: \
addr: 0x7faec6f8e518, \
seqno: 3185219421952815104, \
size: 909455917, \
ctx: 0x557094f65038, \
flags: 11577. store: 49, \
type: 49
Workaround:
Create a backup of the
/var/lib/mysqldirectory on themariadb-serverPod.Verify that other replicas are up and ready.
Remove the
galera.cachefile for the affectedmariadb-serverPod.Remove the affected
mariadb-serverPod or wait until it is automatically restarted.
After Kubernetes restarts the Pod, the Pod clones the database in 1-2 minutes and restores the quorum.
After provisioning the controller node, the etcd pod initiates before the Kubernetes networking is fully operational. As a result, the pod encounters difficulties resolving DNS and establishing connections with other members, ultimately leading to a panic state for the etcd service.
Workaround:
Delete the PVC related to the replaced controller node:
kubectl -n openstack delete pvc <PVC-NAME>
Delete pods related to the crashing etcd service on the replaced controller node:
kubectl -n openstack delete pods <ETCD-POD-NAME>
Fixed in MOSK 24.1.2 Fixed in MOSK 24.2
On large (500+ compute nodes) clusters, openstack-controller-exporter may
fail to initialize within the default timeout.
As a workaround, define OSCTL_EXPORTER_MAX_POLL_TIMEOUT in the cluster
object:
spec:
providerSpec:
value:
helmReleases:
- name: openstack-operator
values:
exporter:
settings:
raw:
OSCTL_EXPORTER_MAX_POLL_TIMEOUT: 900
Due to the MetalLB upstream issue, a load balancer service may not obtain the external IP address.
The issue occurs when two services share the same external IP address and have
the same externalTrafficPolicy value. Initially, the services have the
external IP address assigned and are accessible. After modifying the
externalTrafficPolicy value for both services from Cluster to
Local, the first service that has been changed remains with no external IP
address assigned. Though, the second service, which was changed later, has the
external IP assigned as expected.
To work around the issue, make a dummy change to the service object where
external IP is <pending>:
Identify the service that is stuck:
kubectl get svc -A | grep pending
Example of system response:
stacklight iam-proxy-prometheus LoadBalancer 10.233.28.196 <pending> 443:30430/TCP
Add an arbitrary label to the service that is stuck. For example:
kubectl label svc -n stacklight iam-proxy-prometheus reconcile=1
Example of system response:
service/iam-proxy-prometheus labeledVerify that the external IP was allocated to the service:
kubectl get svc -n stacklight iam-proxy-prometheus
Example of system response:
NAME TYPE CLUSTER-IP EXTERNAL-IP PORT(S) AGE iam-proxy-prometheus LoadBalancer 10.233.28.196 10.0.34.108 443:30430/TCP 12d
Sometimes, after changing the OpenStackDeployment custom resource,
it does not transition to the APPLYING state as expected.
To work around the issue, restart the rockoon` pod in the osh-system
namespace.
Fixed in MOSK 24.2.1 Fixed in MOSK 24.3
After upgrading to OpenStack Antelope, clusters with configured trunk ports experience traffic flow disruptions that block the cluster updates.
To work around the issue, pin the MOSK Networking service (OpenStack Neutron) container image by adding the following content to the OpenStackDeployment custom resource:
spec:
services:
networking:
neutron:
values:
images:
tags:
neutron_openvswitch_agent: mirantis.azurecr.io/openstack/neutron:antelope-jammy-20240816113600
Caution
Remove the pinning after updating to MOSK 24.2.1 or later patch or major release.
After upgrade to OpenStack Antelope, the virtual machines experience connectivity disruptions when sending data over the virtual networks. Network packets with full MTU are dropped.
The issue affects the MOSK clusters with Open vSwitch as the networking backend and with the following specific MTU settings:
The MTU configured on the tunnel interface of compute nodes is equal to the value of the
spec:services:networking:neutron:values:conf:neutron:DEFAULT:global_physnet_mtuparameter of theOpenStackDeploymentcustom resource (if not specified, default is1500bytes).If the MTU of the tunnel interface is higher by at least 4 bytes, the cluster is not affected by the issue.
The cluster contains virtual machines that have the MTU of the network interfaces of the guest operating system larger than the MTU of the value of the
global_physnet_mtuparameter above minus 50 bytes.
To work around the issue, pin the MOSK Networking
service (OpenStack Neutron) container image by adding the following content
to the OpenStackDeployment custom resource:
spec:
services:
networking:
neutron:
values:
images:
tags:
neutron_openvswitch_agent: mirantis.azurecr.io/openstack/neutron:antelope-jammy-20240816113600
Caution
Remove the pinning after updating to MOSK 24.2.1 or later patch or major release.
This section lists the Tungsten Fabric (TF) known issues with workarounds for the Mirantis OpenStack for Kubernetes release 24.1. For TF limitations, see Tungsten Fabric known limitations.
Occasionally, RabbitMQ instances in tf-rabbitmq pods fail to enable
the tracking_records_in_ets during the initialization process.
To work around the problem, restart the affected pods manually.
Rebooting all Cassandra cluster TFConfig or TFAnalytics nodes, maintenance, or other circumstances that cause the Cassandra pods to start simultaneously may cause a broken Cassandra TFConfig and/or TFAnalytics cluster. In this case, Cassandra nodes do not join the ring and do not update the IPs of the neighbor nodes. As a result, the TF services cannot operate Cassandra cluster(s).
To verify that a Cassandra cluster is affected:
Run the nodetool status command specifying the config or
analytics cluster and the replica number:
kubectl -n tf exec -it tf-cassandra-<config/analytics>-dc1-rack1-<replica number> -c cassandra -- nodetool status
Example of system response with outdated IP addresses:
Datacenter: DC1
===============
Status=Up/Down
|/ State=Normal/Leaving/Joining/Moving
-- Address Load Tokens Owns (effective) Host ID Rack
DN <outdated ip> ? 256 64.9% a58343d0-1e3f-4d54-bcdf-9b9b949ca873 r1
DN <outdated ip> ? 256 69.8% 67f1d07c-8b13-4482-a2f1-77fa34e90d48 r1
Datacenter: dc1
===============
Status=Up/Down
|/ State=Normal/Leaving/Joining/Moving
-- Address Load Tokens Owns (effective) Host ID Rack
UN <actual ip> 3.84 GiB 256 65.2% 7324ebc4-577a-425f-b3de-96faac95a331 rack1
Workaround:
Manually delete the Cassandra pod from the failed config or analytics
cluster to re-initiate the bootstrap process for one of the Cassandra nodes:
kubectl -n tf delete pod tf-cassandra-<config/analytics>-dc1-rack1-<replica_num>
This section lists the update known issues with workarounds for the MOSK release 24.1.
Fixed in MOSK 24.1.1 Fixed in MOSK 24.2
During the ClusterRelease update of a MOSK cluster, a
node cannot be removed from the Kubernetes cluster if the related
Machine object is disabled.
As a workaround, remove the finalizer from the affected Node
object.
During major or patch update of a MOSK cluster with StackLight enabled in
non-HA mode, the KubePodsCrashLooping alert may be firing for the Grafana
ReplicaSet.
Grafana relies on PostgreSQL for persistent data. In non-HA StackLight setup,
PostgreSQL becomes temporarily unavailable during updates. If Grafana loses its
database connection or fails to establish one during startup, Grafana fails
with an error. This may cause the Grafana pod to enter the CrashLoopBackOff
state. Such behavior is expected in non-HA StackLight setups. The Grafana pod
will resume normal operation after PostgreSQL is restored.
To prevent the issue, deploy StackLight in HA mode.
The cluster update may stuck if the maximum number of the worker nodes to update simultaneously is ten or higher.
To work around the problem, set the
spec.providerSpec.maxWorkerUpgradeCount to a value lower than 10.
For configuration details, see Configure the parallel update of worker nodes.
This section lists the components artifacts of the MOSK 24.1 release that includes binaries, Docker images, and Helm charts.
MOSK 24.1 OpenStack Antelope binaries and Docker images
Component |
Path |
License information for main executable programs |
|---|---|---|
Binaries |
||
octavia-amphora |
https://binary.mirantis.com/openstack/bin/octavia/amphora-x64-haproxy-antelope-20240117112744.qcow2 |
Mirantis Proprietary License |
mirantis |
https://binary.mirantis.com/openstack/bin/horizon/mirantis-antelope-18a1377-20230817112356.tar.gz |
Mirantis Proprietary License |
kernel |
GPL-2.0 |
|
initramfs |
https://binary.mirantis.com/openstack/bin/ironic/tinyipa/tinyipa-stable-antelope-20231123060809.gz |
GPL-2.0 |
service-image |
https://binary.mirantis.com/openstack/bin/manila/manila-service-image-20221228132450.qcow2 |
Mirantis Proprietary License |
Docker images |
||
keystone |
mirantis.azurecr.io/openstack/keystone:antelope-jammy-20240202140750 |
Apache License 2.0 |
heat |
mirantis.azurecr.io/openstack/heat:antelope-jammy-20240202140750 |
Apache License 2.0 |
glance |
mirantis.azurecr.io/openstack/glance:antelope-jammy-20240202140750 |
Apache License 2.0 |
cinder |
mirantis.azurecr.io/openstack/cinder:antelope-jammy-20240202140750 |
Apache License 2.0 |
cloudprober |
mirantis.azurecr.io/openstack/extra/cloudprober:v0.13.2-20240131075124 |
Apache License 2.0 |
neutron |
mirantis.azurecr.io/openstack/neutron:antelope-jammy-20240202140750 |
Apache License 2.0 |
nova |
mirantis.azurecr.io/openstack/nova:antelope-jammy-20240202140750 |
Apache License 2.0 |
horizon |
mirantis.azurecr.io/openstack/horizon:antelope-jammy-20240202140750 |
Apache License 2.0 |
tempest |
mirantis.azurecr.io/openstack/tempest:antelope-jammy-20240202140750 |
Apache License 2.0 |
octavia |
mirantis.azurecr.io/openstack/octavia:antelope-jammy-20240202140750 |
Apache License 2.0 |
designate |
mirantis.azurecr.io/openstack/designate:antelope-jammy-20240202140750 |
Apache License 2.0 |
ironic |
mirantis.azurecr.io/openstack/ironic:antelope-jammy-20240202140750 |
Apache License 2.0 |
barbican |
mirantis.azurecr.io/openstack/barbican:antelope-jammy-20240202140750 |
Apache License 2.0 |
libvirt |
mirantis.azurecr.io/general/libvirt:8.0.x-jammy-20231211175451 |
LGPL-2.1 License |
pause |
mirantis.azurecr.io/general/external/pause:3.1 |
Apache License 2.0 |
openvswitch |
mirantis.azurecr.io/general/openvswitch:2.17-jammy-20231018050930 |
Apache License 2.0 |
openvswitch-dpdk |
mirantis.azurecr.io/general/openvswitch-dpdk:2.17-jammy-20231018050930 |
Apache License 2.0 |
openstack-tools |
mirantis.azurecr.io/openstack/openstack-tools:yoga-jammy-20240202140749 |
Apache License 2.0 |
rabbitmq-3.10.x |
mirantis.azurecr.io/openstack/extra/rabbitmq:3.10.18-focal-20230222154055 |
Mozilla Public License 2.0 |
rabbitmq-3.10.x-management |
mirantis.azurecr.io/openstack/extra/rabbitmq-management:3.10.18-focal-20230222154055 |
Mozilla Public License 2.0 |
kubernetes-entrypoint |
mirantis.azurecr.io/openstack/extra/kubernetes-entrypoint:v1.0.1-55b02f7-20231019172556 |
Apache License 2.0 |
memcached |
mirantis.azurecr.io/general/memcached:v1.6.23-alpine-20240131134844 |
BSD 3-Clause “New” or “Revised” License |
etcd |
mirantis.azurecr.io/openstack/extra/etcd:v3.5.11-alpine-20240131112547 |
Apache License 2.0 |
powerdns |
mirantis.azurecr.io/openstack/extra/powerdns:4.7-alpine-20240131140954 |
GPL-2.0 License |
nginx-ingress-controller |
mirantis.azurecr.io/openstack/extra/nginx-ingress-controller:1.9.6-alpine-20240129151228 |
Apache License 2.0 |
tls-proxy |
mirantis.azurecr.io/openstack/tls-proxy:focal-fipster-20230725114156 |
Mirantis Proprietary License |
defaultbackend |
mirantis.azurecr.io/openstack/extra/defaultbackend:v1.19.2-77af1ef-20220823043839 |
Apache License 2.0 |
mariadb |
mirantis.azurecr.io/general/mariadb:10.6.14-focal-20231127070342 |
GPLv2, LGPLv2.1 (client libraries) |
rabbitmq-exporter |
mirantis.azurecr.io/stacklight/rabbitmq-exporter:1.0.0-RC19 |
MIT License |
memcached-exporter |
mirantis.azurecr.io/stacklight/memcached-exporter:0-20231208095208 |
Apache License 2.0 |
prometheus-mysql-exporter |
mirantis.azurecr.io/stacklight/mysqld-exporter:v0.11.0 |
Apache License 2.0 |
aodh |
mirantis.azurecr.io/openstack/aodh:antelope-jammy-20240202140750 |
Apache License 2.0 |
ceilometer |
mirantis.azurecr.io/openstack/ceilometer:antelope-jammy-20240202140750 |
Apache License 2.0 |
gnocchi |
mirantis.azurecr.io/openstack/gnocchi:antelope-jammy-20240202140750 |
Apache License 2.0 |
redis |
mirantis.azurecr.io/openstack/extra/redis:7.2.4-alpine3.19-1 |
BSD 3-Clause “New” or “Revised” License |
frr |
mirantis.azurecr.io/general/external/docker.io/frrouting/frr:v8.5.1-20240131110410 |
GPL-2.0 and LGPL-2.1 |
strongswan |
mirantis.azurecr.io/openstack/extra/strongswan:alpine-5.9.12-20240129155309 |
GPL-2.0 |
rsyslog |
mirantis.azurecr.io/openstack/extra/rsyslog:v8.2001.0-20231018050930 |
GNU General Public License v3 |
descheduler |
mirantis.azurecr.io/openstack/extra/descheduler:v0.28.1 |
Apache License 2.0 |
nginx |
mirantis.azurecr.io/openstack/extra/nginx:1.25.3-20240131112557 |
Apache License 2.0 |
requirements |
mirantis.azurecr.io/openstack/requirements:antelope-jammy-20240202140750 |
Apache License 2.0 |
stepler |
mirantis.azurecr.io/openstack/stepler:antelope-jammy-20240124144254 |
Apache License 2.0 |
placement |
mirantis.azurecr.io/openstack/placement:antelope-jammy-20240202140750 |
Apache License 2.0 |
masakari |
mirantis.azurecr.io/openstack/masakari:antelope-jammy-20240202140750 |
Apache License 2.0 |
masakari-monitors |
mirantis.azurecr.io/openstack/masakari-monitors:antelope-jammy-20240202140750 |
Apache License 2.0 |
ironic-inspector |
mirantis.azurecr.io/openstack/ironic-inspector:antelope-jammy-20240202140750 |
Apache License 2.0 |
manila |
mirantis.azurecr.io/openstack/manila:antelope-jammy-20240202140750 |
Apache License 2.0 |
MOSK 24.1 OpenStack Yoga binaries and Docker images
Component |
Path |
License information for main executable programs |
|---|---|---|
Binaries |
||
octavia-amphora |
https://binary.mirantis.com/openstack/bin/octavia/amphora-x64-haproxy-yoga-20240115150429.qcow2 |
Mirantis Proprietary License |
mirantis |
https://binary.mirantis.com/openstack/bin/horizon/mirantis-yoga-186584b-20230817112411.tar.gz |
Mirantis Proprietary License |
kernel |
https://binary.mirantis.com/openstack/bin/ironic/tinyipa/tinyipa-stable-yoga-20231004061110.vmlinuz |
GPL-2.0 |
initramfs |
https://binary.mirantis.com/openstack/bin/ironic/tinyipa/tinyipa-stable-yoga-20231004061110.gz |
GPL-2.0 |
service-image |
https://binary.mirantis.com/openstack/bin/manila/manila-service-image-20221228132450.qcow2 |
Mirantis Proprietary License |
Docker images |
||
keystone |
mirantis.azurecr.io/openstack/keystone:yoga-jammy-20240202140749 |
Apache License 2.0 |
heat |
mirantis.azurecr.io/openstack/heat:yoga-jammy-20240202140749 |
Apache License 2.0 |
glance |
mirantis.azurecr.io/openstack/glance:yoga-jammy-20240202140749 |
Apache License 2.0 |
cinder |
mirantis.azurecr.io/openstack/cinder:yoga-jammy-20240202140749 |
Apache License 2.0 |
cloudprober |
mirantis.azurecr.io/openstack/extra/cloudprober:v0.13.2-20240131075124 |
Apache License 2.0 |
neutron |
mirantis.azurecr.io/openstack/neutron:yoga-jammy-20240202140749 |
Apache License 2.0 |
nova |
mirantis.azurecr.io/openstack/nova:yoga-jammy-20240202140749 |
Apache License 2.0 |
horizon |
mirantis.azurecr.io/openstack/horizon:yoga-jammy-20240202140749 |
Apache License 2.0 |
tempest |
mirantis.azurecr.io/openstack/tempest:yoga-jammy-20240202140749 |
Apache License 2.0 |
octavia |
mirantis.azurecr.io/openstack/octavia:yoga-jammy-20240202140749 |
Apache License 2.0 |
designate |
mirantis.azurecr.io/openstack/designate:yoga-jammy-20240202140749 |
Apache License 2.0 |
ironic |
mirantis.azurecr.io/openstack/ironic:yoga-jammy-20240202140749 |
Apache License 2.0 |
barbican |
mirantis.azurecr.io/openstack/barbican:yoga-jammy-20240202140749 |
Apache License 2.0 |
libvirt |
mirantis.azurecr.io/general/libvirt:8.0.x-jammy-20231211175451 |
LGPL-2.1 License |
pause |
mirantis.azurecr.io/general/external/pause:3.1 |
Apache License 2.0 |
openvswitch |
mirantis.azurecr.io/general/openvswitch:2.17-jammy-20231018050930 |
Apache License 2.0 |
openvswitch-dpdk |
mirantis.azurecr.io/general/openvswitch-dpdk:2.17-jammy-20231018050930 |
Apache License 2.0 |
openstack-tools |
mirantis.azurecr.io/openstack/openstack-tools:yoga-jammy-20240202140749 |
Apache License 2.0 |
rabbitmq-3.10.x |
mirantis.azurecr.io/openstack/extra/rabbitmq:3.10.18-focal-20230222154055 |
Mozilla Public License 2.0 |
rabbitmq-3.10.x-management |
mirantis.azurecr.io/openstack/extra/rabbitmq-management:3.10.18-focal-20230222154055 |
Mozilla Public License 2.0 |
kubernetes-entrypoint |
mirantis.azurecr.io/openstack/extra/kubernetes-entrypoint:v1.0.1-55b02f7-20231019172556 |
Apache License 2.0 |
memcached |
mirantis.azurecr.io/general/memcached:v1.6.23-alpine-20240131134844 |
BSD 3-Clause “New” or “Revised” License |
etcd |
mirantis.azurecr.io/openstack/extra/etcd:v3.5.11-alpine-20240131112547 |
Apache License 2.0 |
powerdns |
mirantis.azurecr.io/openstack/extra/powerdns:4.7-alpine-20240131140954 |
GPL-2.0 License |
nginx-ingress-controller |
mirantis.azurecr.io/openstack/extra/nginx-ingress-controller:1.9.6-alpine-20240129151228 |
Apache License 2.0 |
tls-proxy |
mirantis.azurecr.io/openstack/tls-proxy:focal-fipster-20230725114156 |
Mirantis Proprietary License |
defaultbackend |
mirantis.azurecr.io/openstack/extra/defaultbackend:v1.19.2-77af1ef-20220823043839 |
Apache License 2.0 |
mariadb |
mirantis.azurecr.io/general/mariadb:10.6.14-focal-20231127070342 |
GPLv2, LGPLv2.1 (client libraries) |
rabbitmq-exporter |
mirantis.azurecr.io/stacklight/rabbitmq-exporter:1.0.0-RC19 |
MIT License |
memcached-exporter |
mirantis.azurecr.io/stacklight/memcached-exporter:0-20231208095208 |
Apache License 2.0 |
prometheus-mysql-exporter |
mirantis.azurecr.io/stacklight/mysqld-exporter:v0.11.0 |
Apache License 2.0 |
aodh |
mirantis.azurecr.io/openstack/aodh:yoga-jammy-20240202140749 |
Apache License 2.0 |
ceilometer |
mirantis.azurecr.io/openstack/ceilometer:yoga-jammy-20240202140749 |
Apache License 2.0 |
gnocchi |
mirantis.azurecr.io/openstack/gnocchi:yoga-jammy-20240202140749 |
Apache License 2.0 |
redis |
mirantis.azurecr.io/openstack/extra/redis:7.2.4-alpine3.19-1 |
BSD 3-Clause “New” or “Revised” License |
frr |
mirantis.azurecr.io/general/external/docker.io/frrouting/frr:v8.5.1-20240131110410 |
GPL-2.0 and LGPL-2.1 |
strongswan |
mirantis.azurecr.io/openstack/extra/strongswan:alpine-5.9.12-20240129155309 |
GPL-2.0 |
rsyslog |
mirantis.azurecr.io/openstack/extra/rsyslog:v8.2001.0-20231018050930 |
GNU General Public License v3 |
descheduler |
mirantis.azurecr.io/openstack/extra/descheduler:v0.28.1 |
Apache License 2.0 |
nginx |
mirantis.azurecr.io/openstack/extra/nginx:1.25.3-20240131112557 |
Apache License 2.0 |
requirements |
mirantis.azurecr.io/openstack/requirements:yoga-jammy-20240202140749 |
Apache License 2.0 |
stepler |
mirantis.azurecr.io/openstack/stepler:yoga-focal-20240104174902 |
Apache License 2.0 |
placement |
mirantis.azurecr.io/openstack/placement:yoga-jammy-20240202140749 |
Apache License 2.0 |
masakari |
mirantis.azurecr.io/openstack/masakari:yoga-jammy-20240202140749 |
Apache License 2.0 |
masakari-monitors |
mirantis.azurecr.io/openstack/masakari-monitors:yoga-jammy-20240202140749 |
Apache License 2.0 |
ironic-inspector |
mirantis.azurecr.io/openstack/ironic-inspector:yoga-jammy-20240202140749 |
Apache License 2.0 |
manila |
mirantis.azurecr.io/openstack/manila:yoga-jammy-20240202140749 |
Apache License 2.0 |
MOSK 24.1 OpenStack Helm charts
MOSK 24.1 Tungsten Fabric 21.4 artifacts
Component |
Path |
License information for main executable programs |
|---|---|---|
Helm charts |
||
Tungsten Fabric Operator |
https://binary.mirantis.com/tungsten/helm/tungstenfabric-operator-0.14.3.tgz |
Mirantis Proprietary License |
Docker images |
||
tungstenfabric-operator |
mirantis.azurecr.io/tungsten-operator/tungstenfabric-operator:0.14.3 |
Mirantis Proprietary License |
tungsten-pytest |
mirantis.azurecr.io/tungsten/tungsten-pytest:0.1-20240123162016 |
MIT License |
casskop |
mirantis.azurecr.io/tungsten-operator/casskop:v2.2.1 |
Apache License 2.0 |
cassandra-bootstrap |
mirantis.azurecr.io/tungsten/cassandra-bootstrap:0.1.13 |
Apache License 2.0 |
cassandra |
mirantis.azurecr.io/tungsten/cassandra:3.11.10-20230622 |
Apache License 2.0 |
cassandra-config-builder |
mirantis.azurecr.io/tungsten/cass-config-builder:v2-20240122114202 |
Apache License 2.0 |
kafka-k8s-operator |
mirantis.azurecr.io/tungsten-operator/kafka-k8s-operator:0.3.8 |
Mirantis Proprietary License |
cp-kafka |
mirantis.azurecr.io/tungsten/cp-kafka:7.5.3 |
Apache License 2.0 |
kafka-jmx-exporter |
mirantis.azurecr.io/stacklight/jmx-exporter:0.20.0-debian-11-r1 |
Apache License 2.0 |
rabbitmq-operator |
mirantis.azurecr.io/tungsten-operator/rabbitmq-operator:0.4.2 |
Mirantis Proprietary License |
rabbitmq |
mirantis.azurecr.io/tungsten/rabbitmq:3.11.16 |
Mozilla Public License 2.0 |
rabbitmq-exporter |
mirantis.azurecr.io/stacklight/rabbitmq-exporter:1.0.0-RC19 |
MIT License |
zookeeper-operator |
mirantis.azurecr.io/tungsten-operator/zookeeper-operator:0.2.20-mcp |
Apache License 2.0 |
zookeeper |
mirantis.azurecr.io/tungsten/zookeeper:3.8.3-20231019 |
Apache License 2.0 |
redis-operator |
mirantis.azurecr.io/tungsten-operator/redis-operator:0.4.2 |
Apache License 2.0 |
redis |
mirantis.azurecr.io/tungsten/redis:7.2.4-alpine |
BSD 3-Clause “New” or “Revised” License |
redis-exporter |
mirantis.azurecr.io/stacklight/redis_exporter:v1.45.0 |
BSD 3-Clause “New” or “Revised” License |
tf-cli |
mirantis.azurecr.io/tungsten/tf-cli:0.1-20240116162056 |
MIT License |
kubernetes-entrypoint |
mirantis.azurecr.io/openstack/extra/kubernetes-entrypoint:v1.0.1-55b02f7-20231019172556 |
Apache License 2.0 |
pause |
mirantis.azurecr.io/general/external/pause:3.1 |
Apache License 2.0 |
tf-nodeinfo |
mirantis.azurecr.io/tungsten/tf-nodeinfo:0.1-20231017142953 |
MIT License |
contrail-analytics-alarm-gen |
mirantis.azurecr.io/tungsten/contrail-analytics-alarm-gen:21.4.20240118000000 |
Apache License 2.0 |
contrail-analytics-api |
mirantis.azurecr.io/tungsten/contrail-analytics-api:21.4.20240118000000 |
Apache License 2.0 |
contrail-analytics-collector |
mirantis.azurecr.io/tungsten/contrail-analytics-collector:21.4.20240118000000 |
Apache License 2.0 |
contrail-analytics-query-engine |
mirantis.azurecr.io/tungsten/contrail-analytics-query-engine:21.4.20240118000000 |
Apache License 2.0 |
contrail-analytics-snmp-collector |
mirantis.azurecr.io/tungsten/contrail-analytics-snmp-collector:21.4.20240118000000 |
Apache License 2.0 |
contrail-analytics-snmp-topology |
mirantis.azurecr.io/tungsten/contrail-analytics-snmp-topology:21.4.20240118000000 |
Apache License 2.0 |
contrail-controller-config-api |
mirantis.azurecr.io/tungsten/contrail-controller-config-api:21.4.20240118000000 |
Apache License 2.0 |
contrail-controller-config-devicemgr |
mirantis.azurecr.io/tungsten/contrail-controller-config-devicemgr:21.4.20240118000000 |
Apache License 2.0 |
contrail-controller-config-dnsmasq |
mirantis.azurecr.io/tungsten/contrail-controller-config-dnsmasq:21.4.20240118000000 |
Apache License 2.0 |
contrail-controller-config-schema |
mirantis.azurecr.io/tungsten/contrail-controller-config-schema:21.4.20240118000000 |
Apache License 2.0 |
contrail-controller-config-svcmonitor |
mirantis.azurecr.io/tungsten/contrail-controller-config-svcmonitor:21.4.20240118000000 |
Apache License 2.0 |
contrail-controller-control-control |
mirantis.azurecr.io/tungsten/contrail-controller-control-control:21.4.20240118000000 |
Apache License 2.0 |
contrail-controller-control-dns |
mirantis.azurecr.io/tungsten/contrail-controller-control-dns:21.4.20240118000000 |
Apache License 2.0 |
contrail-controller-control-named |
mirantis.azurecr.io/tungsten/contrail-controller-control-named:21.4.20240118000000 |
Apache License 2.0 |
contrail-controller-webui-job |
mirantis.azurecr.io/tungsten/contrail-controller-webui-job:21.4.20240118000000 |
Apache License 2.0 |
contrail-controller-webui-web |
mirantis.azurecr.io/tungsten/contrail-controller-webui-web:21.4.20240118000000 |
Apache License 2.0 |
contrail-node-init |
mirantis.azurecr.io/tungsten/contrail-node-init:21.4.20240118000000 |
Apache License 2.0 |
contrail-nodemgr |
mirantis.azurecr.io/tungsten/contrail-nodemgr:21.4.20240118000000 |
Apache License 2.0 |
contrail-provisioner |
mirantis.azurecr.io/tungsten/contrail-provisioner:21.4.20240118000000 |
Apache License 2.0 |
contrail-tools |
mirantis.azurecr.io/tungsten/contrail-tools:21.4.20240118000000 |
Apache License 2.0 |
contrail-vrouter-agent |
mirantis.azurecr.io/tungsten/contrail-vrouter-agent:21.4.20240118000000 |
Apache License 2.0 |
contrail-vrouter-agent-dpdk |
mirantis.azurecr.io/tungsten/contrail-vrouter-agent-dpdk:21.4.20240118000000 |
Apache License 2.0 |
contrail-vrouter-kernel-build-init |
mirantis.azurecr.io/tungsten/contrail-vrouter-kernel-build-init:21.4.20240118000000 |
Apache License 2.0 |
MOSK 24.1 StackLight artifacts
Component |
Path |
License information for main executable programs |
|---|---|---|
Docker images |
||
prometheus-libvirt-exporter |
mirantis.azurecr.io/stacklight/prometheus-libvirt-exporter:v0.2-20240201074016 |
Mirantis Proprietary License |
tungstenfabric-prometheus-exporter |
mirantis.azurecr.io/stacklight/tungstenfabric-prometheus-exporter:0.1-20240119124301 |
Mirantis Proprietary License |
Helm charts |
||
fluentd |
https://binary.mirantis.com/stacklight/helm/fluentd-2.0.3-mcp-52.tgz |
Mirantis Proprietary License |
prometheus-libvirt-exporter |
https://binary.mirantis.com/stacklight/helm/prometheus-libvirt-exporter-0.2.0-mcp-7.tgz |
Mirantis Proprietary License |
prometheus-tungstenfabric-exporter |
https://binary.mirantis.com/stacklight/helm/prometheus-tungstenfabric-exporter-0.2.0-mcp-7.tgz |
Mirantis Proprietary License |
The following issues have been addressed in the MOSK 24.1 release:
[OpenStack] [Antelope] [37678] Resolved the issue that prevented instance live-migration due to CPU incompatibility.
[OpenStack] [38629] Optimized resource allocation to enable
designate-apito scale up its operation.[OpenStack] [38792] Resolved the issue that prevented MOSK from creating instances and volumes from images stored in Pure Storage.
[OpenStack] [39069] Resolved the issue that caused the logging of false alerts about 401 responses from OpenStack endpoints.
[StackLight] [36211] Resolved the issue that caused the deprecated dashboards NGINX Ingress controller and Ceph Nodes to be displayed in Grafana. These dashboards are now removed. Therefore, Mirantis recommends switching to the following dashboards:
OpenStack Ingress controller instead of NGINX Ingress controller
For Ceph:
Ceph Cluster dashboard for Ceph stats
System dashboard for resource utilization, which includes filtering by Ceph node labels, such as
ceph_role_osd,ceph_role_mon, andceph_role_mgr
This section describes the specific actions you as a Cloud Operator need to complete to accurately plan and successfully perform your Mirantis OpenStack for Kubernetes (MOSK) cluster update to the version 24.1. Consider this information as a supplement to the generic update procedure published in Operations Guide: Update a MOSK cluster.
The MOSK cluster will obtain the newly implemented capabilities automatically with no significant impact on the update procedure.
See also
The following table provides details on the update impact on a MOSK cluster.
Updated component |
Impact on cloud users |
Impact on cloud workloads |
|---|---|---|
OpenStack and Tungsten Fabric |
|
Open vSwitch networking - interruption of the North-South connectivity, depending on the type of virtual routers used by a workload:
Tungsten Fabric networking - no impact |
Ceph |
~1% of read operations on object storage API may fail |
IO performance degradation for Ceph-backed virtual storage devices |
Host OS components |
No impact |
Instance network connectivity interruption up to 5 minutes |
Host OS kernel |
No impact |
Restart of instances due to the hypervisor reboot 0 |
- 0
Host operating system needs to be rebooted for the kernel update to be applied. Configure live-migration of workloads to avoid the impact on the instances running on a host.
To properly plan the update maintenance window, use the following documentation:
Before updating the cluster, be sure to review the potential issues that may arise during the process and the recommended solutions to address them, as outlined in Update known issues.
If your are updating to MOSK 24.1 from the 23.2 series, make sure that you apply the workaround for [37545] Cloud public API becomes inaccessible during update.
If any pinned product artifacts are present in the Cluster object of a
management or managed cluster, the update will be blocked by the Admission
Controller with the invalid HelmReleases configuration error until such
artifacts are removed. The update process does not start and any changes in
the Cluster object are blocked by the Admission Controller except the
removal of fields with pinned product artifacts.
Therefore, verify that the following sections of the Cluster objects
do not contain any image-related (tag, name, pullPolicy,
repository) and global values inside Helm releases:
.spec.providerSpec.value.helmReleases.spec.providerSpec.value.kaas.management.helmReleases.spec.providerSpec.value.regionalHelmReleases.spec.providerSpec.value.regional
For example, a cluster configuration that contains the following highlighted lines will be blocked until you remove them:
- name: kaas-ipam
values:
kaas_ipam:
image:
tag: base-focal-20230127092754
exampleKey: exampleValue
- name: kaas-ipam
values:
global:
anyKey: anyValue
kaas_ipam:
image:
tag: base-focal-20230127092754
exampleKey: exampleValue
The custom pinned product artifacts are inspected and blocked by the Admission Controller to ensure that Container Cloud clusters remain consistently updated with the latest security fixes and product improvements
Note
The pre-update inspection applies only to images delivered by Container Cloud that are overwritten. Any custom images unrelated to the product components are not verified and do not block cluster update.
With 24.1, MOSK is rolling out OpenStack Antelope support for both Open vSwitch and Tungsten Fabric-based deployments.
Mirantis encourages you to upgrade to Antelope to start benefitting from the enhanced functionality and new features of this OpenStack release. MOSK allows for direct upgrade from Yoga to Antelope, without the need to upgrade to the intermediate Zed release. To upgrade the cloud, complete the Upgrade OpenStack procedure.
Important
There are several known issue affecting MOSK clusters running OpenStack Antelope that can disrupt the network connectivity of the cloud workloads.
If your cluster is still running OpenStack Yoga, update to the MOSK 24.2.1 patch release first and only then upgrade to OpenStack Antelope. If you have not been applying patch releases previously and would prefer to switch back to major releases-only mode, you will be able to do this when MOSK 24.3 is released.
If you have updated your cluster to OpenStack Antelope, apply the workarounds described in Release notes: OpenStack known issues for the following issues:
[45879] [Antelope] Incorrect packet handling between instance and its gateway
[44813] Traffic disruption observed on trunk ports
If your cluster runs Tungsten Fabric analytics services and you want to obtain a more lightweight setup, you can disable these services through the custom resource of the Tungsten Fabric Operator. For the details, refer to the Tungsten Fabric analytics services deprecation notice.
In total, since MOSK 23.3 major release, in 24.1, 327 Common Vulnerabilities and Exposures (CVE) have been fixed: 15 of critical and 312 of high severity.
The table below includes the total number of addressed unique and common CVEs by MOSK-specific component since MOSK 23.3.4. The common CVEs are issues addressed across several images.
Product component |
CVE type |
Critical |
High |
Total |
|---|---|---|---|---|
OpenStack |
Unique |
2 |
8 |
10 |
Common |
2 |
10 |
12 |
|
Tungsten Fabric |
Unique |
4 |
29 |
33 |
Common |
8 |
44 |
52 |
Mirantis Security Portal
For the detailed list of fixed and present CVEs across the Mirantis Container Cloud and MOSK products, refer to Mirantis Security Portal.
Mirantis Container Cloud CVEs
For the number of fixed CVEs in the Mirantis Container Cloud-related components including kaas core, bare metal, Ceph, and StackLight, refer to Container Cloud 2.26.0: Security notes.
24.1.1 patch
The patch release notes contain the description of product enhancements, the list of updated artifacts and Common Vulnerabilities and Exposures (CVE) fixes as well as description of the addressed product issues for the MOSK 24.1.1 patch.
For the list of enhancements and bug fixes that relate to Mirantis Container Cloud, refer to the Mirantis Container Cloud Release notes.
Release date |
March 20, 2024 |
|---|---|
Scope |
Patch |
Cluster release |
17.1.1 |
OpenStack Operator |
0.15.10 |
Tungsten Fabric Operator |
0.14.5 |
This section outlines enhancements introduced in the MOSK 24.1.1 patch release.
Introduced the ability to update Ubuntu packages including kernel minor version update, when available in a product release, to address CVE issues on a host operating system.
On management clusters, the update of Ubuntu mirror along with the update of minor kernel version occurs automatically with cordon-drain and reboot of machines.
On MOSK clusters, the update of Ubuntu mirror along with the update of
minor kernel version applies during a manual cluster update without automatic
cordon-drain and reboot of machines. After a managed cluster update, all
cluster machines have the reboot is required notification.
The kernel update is not obligatory on MOSK clusters. Though, if you prefer obtaining the latest CVE fixes for Ubuntu, update the kernel by manually rebooting machines during a convenient maintenance window using GracefulRebootRequest resource.
In MOSK 24.1.1, the kernel version has been updated to
5.15.0-97-generic.
This section lists the components artifacts of the MOSK 24.1.1 release that includes binaries, Docker images, and Helm charts.
MOSK 24.1.1 OpenStack Antelope binaries and Docker images
Component |
Path |
License information for main executable programs |
|---|---|---|
Binaries |
||
octavia-amphora |
https://binary.mirantis.com/openstack/bin/octavia/amphora-x64-haproxy-antelope-20240117112744.qcow2 |
Mirantis Proprietary License |
mirantis |
https://binary.mirantis.com/openstack/bin/horizon/mirantis-antelope-18a1377-20230817112356.tar.gz |
Mirantis Proprietary License |
kernel |
GPL-2.0 |
|
initramfs |
https://binary.mirantis.com/openstack/bin/ironic/tinyipa/tinyipa-stable-antelope-20231123060809.gz |
GPL-2.0 |
service-image |
https://binary.mirantis.com/openstack/bin/manila/manila-service-image-20221228132450.qcow2 |
Mirantis Proprietary License |
Docker images |
||
keystone |
mirantis.azurecr.io/openstack/keystone:antelope-jammy-20240223093139 |
Apache License 2.0 |
heat |
mirantis.azurecr.io/openstack/heat:antelope-jammy-20240223093139 |
Apache License 2.0 |
glance |
mirantis.azurecr.io/openstack/glance:antelope-jammy-20240223093139 |
Apache License 2.0 |
cinder |
mirantis.azurecr.io/openstack/cinder:antelope-jammy-20240223093139 |
Apache License 2.0 |
cloudprober |
mirantis.azurecr.io/openstack/extra/cloudprober:v0.13.2-20240131075124 |
Apache License 2.0 |
neutron |
mirantis.azurecr.io/openstack/neutron:antelope-jammy-20240223093139 |
Apache License 2.0 |
nova |
mirantis.azurecr.io/openstack/nova:antelope-jammy-20240223093139 |
Apache License 2.0 |
horizon |
mirantis.azurecr.io/openstack/horizon:antelope-jammy-20240223093139 |
Apache License 2.0 |
tempest |
mirantis.azurecr.io/openstack/tempest:antelope-jammy-20240223093139 |
Apache License 2.0 |
octavia |
mirantis.azurecr.io/openstack/octavia:antelope-jammy-20240223093139 |
Apache License 2.0 |
designate |
mirantis.azurecr.io/openstack/designate:antelope-jammy-20240223093139 |
Apache License 2.0 |
ironic |
mirantis.azurecr.io/openstack/ironic:antelope-jammy-20240223093139 |
Apache License 2.0 |
barbican |
mirantis.azurecr.io/openstack/barbican:antelope-jammy-20240223093139 |
Apache License 2.0 |
libvirt |
mirantis.azurecr.io/general/libvirt:8.0.x-jammy-20240209162006 |
LGPL-2.1 License |
pause |
mirantis.azurecr.io/general/external/pause:3.1 |
Apache License 2.0 |
openvswitch |
mirantis.azurecr.io/general/openvswitch:2.17-jammy-20231018050930 |
Apache License 2.0 |
openvswitch-dpdk |
mirantis.azurecr.io/general/openvswitch-dpdk:2.17-jammy-20231018050930 |
Apache License 2.0 |
openstack-tools |
mirantis.azurecr.io/openstack/openstack-tools:yoga-jammy-20240223093139 |
Apache License 2.0 |
rabbitmq-3.10.x |
mirantis.azurecr.io/openstack/extra/rabbitmq:3.10.18-focal-20230222154055 |
Mozilla Public License 2.0 |
rabbitmq-3.10.x-management |
mirantis.azurecr.io/openstack/extra/rabbitmq-management:3.10.18-focal-20230222154055 |
Mozilla Public License 2.0 |
kubernetes-entrypoint |
mirantis.azurecr.io/openstack/extra/kubernetes-entrypoint:v1.0.1-55b02f7-20231019172556 |
Apache License 2.0 |
memcached |
mirantis.azurecr.io/general/memcached:v1.6.23-alpine-20240131134844 |
BSD 3-Clause “New” or “Revised” License |
etcd |
mirantis.azurecr.io/openstack/extra/etcd:v3.5.11-alpine-20240131112547 |
Apache License 2.0 |
powerdns |
mirantis.azurecr.io/openstack/extra/powerdns:4.7-alpine-20240212154001 |
GPL-2.0 License |
nginx-ingress-controller |
mirantis.azurecr.io/openstack/extra/nginx-ingress-controller:1.9.6-alpine-20240129151228 |
Apache License 2.0 |
tls-proxy |
mirantis.azurecr.io/openstack/tls-proxy:focal-fipster-20230725114156 |
Mirantis Proprietary License |
defaultbackend |
mirantis.azurecr.io/openstack/extra/defaultbackend:v1.19.2-77af1ef-20220823043839 |
Apache License 2.0 |
mariadb |
mirantis.azurecr.io/general/mariadb:10.6.14-focal-20231127070342 |
GPLv2, LGPLv2.1 (client libraries) |
rabbitmq-exporter |
mirantis.azurecr.io/stacklight/rabbitmq-exporter:1.0.0-RC19 |
MIT License |
memcached-exporter |
mirantis.azurecr.io/stacklight/memcached-exporter:0-20231208095208 |
Apache License 2.0 |
prometheus-mysql-exporter |
mirantis.azurecr.io/stacklight/mysqld-exporter:v0.11.0 |
Apache License 2.0 |
aodh |
mirantis.azurecr.io/openstack/aodh:antelope-jammy-20240223093139 |
Apache License 2.0 |
ceilometer |
mirantis.azurecr.io/openstack/ceilometer:antelope-jammy-20240223093139 |
Apache License 2.0 |
gnocchi |
mirantis.azurecr.io/openstack/gnocchi:antelope-jammy-20240223093139 |
Apache License 2.0 |
redis |
mirantis.azurecr.io/openstack/extra/redis:7.2.4-alpine3.19-1 |
BSD 3-Clause “New” or “Revised” License |
frr |
mirantis.azurecr.io/general/external/docker.io/frrouting/frr:v8.5.1-20240212084423 |
GPL-2.0 and LGPL-2.1 |
strongswan |
mirantis.azurecr.io/openstack/extra/strongswan:alpine-5.9.12-20240129155309 |
GPL-2.0 |
rsyslog |
mirantis.azurecr.io/openstack/extra/rsyslog:v8.2001.0-20231018050930 |
GNU General Public License v3 |
descheduler |
mirantis.azurecr.io/openstack/extra/descheduler:v0.29.0 |
Apache License 2.0 |
nginx |
mirantis.azurecr.io/openstack/extra/nginx:1.25.3-20240131112557 |
Apache License 2.0 |
requirements |
mirantis.azurecr.io/openstack/requirements:antelope-jammy-20240223093139 |
Apache License 2.0 |
stepler |
mirantis.azurecr.io/openstack/stepler:antelope-jammy-20240220093950 |
Apache License 2.0 |
placement |
mirantis.azurecr.io/openstack/placement:antelope-jammy-20240223093139 |
Apache License 2.0 |
masakari |
mirantis.azurecr.io/openstack/masakari:antelope-jammy-20240223093139 |
Apache License 2.0 |
masakari-monitors |
mirantis.azurecr.io/openstack/masakari-monitors:antelope-jammy-20240223093139 |
Apache License 2.0 |
ironic-inspector |
mirantis.azurecr.io/openstack/ironic-inspector:antelope-jammy-20240223093139 |
Apache License 2.0 |
manila |
mirantis.azurecr.io/openstack/manila:antelope-jammy-20240223093139 |
Apache License 2.0 |
MOSK 24.1.1 OpenStack Yoga binaries and Docker images
Component |
Path |
License information for main executable programs |
|---|---|---|
Binaries |
||
octavia-amphora |
https://binary.mirantis.com/openstack/bin/octavia/amphora-x64-haproxy-yoga-20240115150429.qcow2 |
Mirantis Proprietary License |
mirantis |
https://binary.mirantis.com/openstack/bin/horizon/mirantis-yoga-186584b-20230817112411.tar.gz |
Mirantis Proprietary License |
kernel |
https://binary.mirantis.com/openstack/bin/ironic/tinyipa/tinyipa-stable-yoga-20231004061110.vmlinuz |
GPL-2.0 |
initramfs |
https://binary.mirantis.com/openstack/bin/ironic/tinyipa/tinyipa-stable-yoga-20231004061110.gz |
GPL-2.0 |
service-image |
https://binary.mirantis.com/openstack/bin/manila/manila-service-image-20221228132450.qcow2 |
Mirantis Proprietary License |
Docker images |
||
keystone |
mirantis.azurecr.io/openstack/keystone:yoga-jammy-20240223093139 |
Apache License 2.0 |
heat |
mirantis.azurecr.io/openstack/heat:yoga-jammy-20240223093139 |
Apache License 2.0 |
glance |
mirantis.azurecr.io/openstack/glance:yoga-jammy-20240223093139 |
Apache License 2.0 |
cinder |
mirantis.azurecr.io/openstack/cinder:yoga-jammy-20240223093139 |
Apache License 2.0 |
cloudprober |
mirantis.azurecr.io/openstack/extra/cloudprober:v0.13.2-20240131075124 |
Apache License 2.0 |
neutron |
mirantis.azurecr.io/openstack/neutron:yoga-jammy-20240223093139 |
Apache License 2.0 |
nova |
mirantis.azurecr.io/openstack/nova:yoga-jammy-20240223093139 |
Apache License 2.0 |
horizon |
mirantis.azurecr.io/openstack/horizon:yoga-jammy-20240223093139 |
Apache License 2.0 |
tempest |
mirantis.azurecr.io/openstack/tempest:yoga-jammy-20240223093139 |
Apache License 2.0 |
octavia |
mirantis.azurecr.io/openstack/octavia:yoga-jammy-20240223093139 |
Apache License 2.0 |
designate |
mirantis.azurecr.io/openstack/designate:yoga-jammy-20240223093139 |
Apache License 2.0 |
ironic |
mirantis.azurecr.io/openstack/ironic:yoga-jammy-20240223093139 |
Apache License 2.0 |
barbican |
mirantis.azurecr.io/openstack/barbican:yoga-jammy-20240223093139 |
Apache License 2.0 |
libvirt |
mirantis.azurecr.io/general/libvirt:8.0.x-jammy-20240209162006 |
LGPL-2.1 License |
pause |
mirantis.azurecr.io/general/external/pause:3.1 |
Apache License 2.0 |
openvswitch |
mirantis.azurecr.io/general/openvswitch:2.17-jammy-20231018050930 |
Apache License 2.0 |
openvswitch-dpdk |
mirantis.azurecr.io/general/openvswitch-dpdk:2.17-jammy-20231018050930 |
Apache License 2.0 |
openstack-tools |
mirantis.azurecr.io/openstack/openstack-tools:yoga-jammy-20240223093139 |
Apache License 2.0 |
rabbitmq-3.10.x |
mirantis.azurecr.io/openstack/extra/rabbitmq:3.10.18-focal-20230222154055 |
Mozilla Public License 2.0 |
rabbitmq-3.10.x-management |
mirantis.azurecr.io/openstack/extra/rabbitmq-management:3.10.18-focal-20230222154055 |
Mozilla Public License 2.0 |
kubernetes-entrypoint |
mirantis.azurecr.io/openstack/extra/kubernetes-entrypoint:v1.0.1-55b02f7-20231019172556 |
Apache License 2.0 |
memcached |
mirantis.azurecr.io/general/memcached:v1.6.23-alpine-20240131134844 |
BSD 3-Clause “New” or “Revised” License |
etcd |
mirantis.azurecr.io/openstack/extra/etcd:v3.5.11-alpine-20240131112547 |
Apache License 2.0 |
powerdns |
mirantis.azurecr.io/openstack/extra/powerdns:4.7-alpine-20240212154001 |
GPL-2.0 License |
nginx-ingress-controller |
mirantis.azurecr.io/openstack/extra/nginx-ingress-controller:1.9.6-alpine-20240129151228 |
Apache License 2.0 |
tls-proxy |
mirantis.azurecr.io/openstack/tls-proxy:focal-fipster-20230725114156 |
Mirantis Proprietary License |
defaultbackend |
mirantis.azurecr.io/openstack/extra/defaultbackend:v1.19.2-77af1ef-20220823043839 |
Apache License 2.0 |
mariadb |
mirantis.azurecr.io/general/mariadb:10.6.14-focal-20231127070342 |
GPLv2, LGPLv2.1 (client libraries) |
rabbitmq-exporter |
mirantis.azurecr.io/stacklight/rabbitmq-exporter:1.0.0-RC19 |
MIT License |
memcached-exporter |
mirantis.azurecr.io/stacklight/memcached-exporter:0-20231208095208 |
Apache License 2.0 |
prometheus-mysql-exporter |
mirantis.azurecr.io/stacklight/mysqld-exporter:v0.11.0 |
Apache License 2.0 |
aodh |
mirantis.azurecr.io/openstack/aodh:yoga-jammy-20240223093139 |
Apache License 2.0 |
ceilometer |
mirantis.azurecr.io/openstack/ceilometer:yoga-jammy-20240223093139 |
Apache License 2.0 |
gnocchi |
mirantis.azurecr.io/openstack/gnocchi:yoga-jammy-20240223093139 |
Apache License 2.0 |
redis |
mirantis.azurecr.io/openstack/extra/redis:7.2.4-alpine3.19-1 |
BSD 3-Clause “New” or “Revised” License |
frr |
mirantis.azurecr.io/general/external/docker.io/frrouting/frr:v8.5.1-20240212084423 |
GPL-2.0 and LGPL-2.1 |
strongswan |
mirantis.azurecr.io/openstack/extra/strongswan:alpine-5.9.12-20240129155309 |
GPL-2.0 |
rsyslog |
mirantis.azurecr.io/openstack/extra/rsyslog:v8.2001.0-20231018050930 |
GNU General Public License v3 |
descheduler |
mirantis.azurecr.io/openstack/extra/descheduler:v0.29.0 |
Apache License 2.0 |
nginx |
mirantis.azurecr.io/openstack/extra/nginx:1.25.3-20240131112557 |
Apache License 2.0 |
requirements |
mirantis.azurecr.io/openstack/requirements:yoga-jammy-20240223093139 |
Apache License 2.0 |
stepler |
mirantis.azurecr.io/openstack/stepler:yoga-focal-20240220093914 |
Apache License 2.0 |
placement |
mirantis.azurecr.io/openstack/placement:yoga-jammy-20240223093139 |
Apache License 2.0 |
masakari |
mirantis.azurecr.io/openstack/masakari:yoga-jammy-20240223093139 |
Apache License 2.0 |
masakari-monitors |
mirantis.azurecr.io/openstack/masakari-monitors:yoga-jammy-20240223093139 |
Apache License 2.0 |
ironic-inspector |
mirantis.azurecr.io/openstack/ironic-inspector:yoga-jammy-20240223093139 |
Apache License 2.0 |
manila |
mirantis.azurecr.io/openstack/manila:yoga-jammy-20240223093139 |
Apache License 2.0 |
MOSK 24.1.1 OpenStack Helm charts
MOSK 24.1.1 Tungsten Fabric 21.4 artifacts
Component |
Path |
License information for main executable programs |
|---|---|---|
Helm charts |
||
Tungsten Fabric Operator |
https://binary.mirantis.com/tungsten/helm/tungstenfabric-operator-0.14.5.tgz |
Mirantis Proprietary License |
Docker images |
||
tungstenfabric-operator |
mirantis.azurecr.io/tungsten-operator/tungstenfabric-operator:0.14.5 |
Mirantis Proprietary License |
tungsten-pytest |
mirantis.azurecr.io/tungsten/tungsten-pytest:0.1-20240213163655 |
MIT License |
casskop |
mirantis.azurecr.io/tungsten-operator/casskop:v2.2.1 |
Apache License 2.0 |
cassandra-bootstrap |
mirantis.azurecr.io/tungsten/cassandra-bootstrap:0.1.13 |
Apache License 2.0 |
cassandra |
mirantis.azurecr.io/tungsten/cassandra:3.11.10-20230622 |
Apache License 2.0 |
cassandra-config-builder |
mirantis.azurecr.io/tungsten/cass-config-builder:v2-20240122114202 |
Apache License 2.0 |
kafka-k8s-operator |
mirantis.azurecr.io/tungsten-operator/kafka-k8s-operator:0.3.8 |
Mirantis Proprietary License |
cp-kafka |
mirantis.azurecr.io/tungsten/cp-kafka:7.5.3 |
Apache License 2.0 |
kafka-jmx-exporter |
mirantis.azurecr.io/stacklight/jmx-exporter:0.20.0-debian-11-r24 |
Apache License 2.0 |
rabbitmq-operator |
mirantis.azurecr.io/tungsten-operator/rabbitmq-operator:0.4.2 |
Mirantis Proprietary License |
rabbitmq |
mirantis.azurecr.io/tungsten/rabbitmq:3.11.16 |
Mozilla Public License 2.0 |
rabbitmq-exporter |
mirantis.azurecr.io/stacklight/rabbitmq-exporter:1.0.0-RC19 |
MIT License |
zookeeper-operator |
mirantis.azurecr.io/tungsten-operator/zookeeper-operator:0.2.20-mcp |
Apache License 2.0 |
zookeeper |
mirantis.azurecr.io/tungsten/zookeeper:3.8.3-20231019 |
Apache License 2.0 |
redis-operator |
mirantis.azurecr.io/tungsten-operator/redis-operator:0.4.2 |
Apache License 2.0 |
redis |
mirantis.azurecr.io/tungsten/redis:7.2.4-alpine3.19 |
BSD 3-Clause “New” or “Revised” License |
redis-exporter |
mirantis.azurecr.io/stacklight/redis_exporter:v1.45.0 |
BSD 3-Clause “New” or “Revised” License |
tf-cli |
mirantis.azurecr.io/tungsten/tf-cli:0.1-20240116162056 |
MIT License |
kubernetes-entrypoint |
mirantis.azurecr.io/openstack/extra/kubernetes-entrypoint:v1.0.1-55b02f7-20231019172556 |
Apache License 2.0 |
pause |
mirantis.azurecr.io/general/external/pause:3.1 |
Apache License 2.0 |
tf-nodeinfo |
mirantis.azurecr.io/tungsten/tf-nodeinfo:0.1-20231017142953 |
MIT License |
contrail-analytics-alarm-gen |
mirantis.azurecr.io/tungsten/contrail-analytics-alarm-gen:24.1-r21.4.20240227154027 |
Apache License 2.0 |
contrail-analytics-api |
mirantis.azurecr.io/tungsten/contrail-analytics-api:24.1-r21.4.20240227154027 |
Apache License 2.0 |
contrail-analytics-collector |
mirantis.azurecr.io/tungsten/contrail-analytics-collector:24.1-r21.4.20240227154027 |
Apache License 2.0 |
contrail-analytics-query-engine |
mirantis.azurecr.io/tungsten/contrail-analytics-query-engine:24.1-r21.4.20240227154027 |
Apache License 2.0 |
contrail-analytics-snmp-collector |
mirantis.azurecr.io/tungsten/contrail-analytics-snmp-collector:24.1-r21.4.20240227154027 |
Apache License 2.0 |
contrail-analytics-snmp-topology |
mirantis.azurecr.io/tungsten/contrail-analytics-snmp-topology:24.1-r21.4.20240227154027 |
Apache License 2.0 |
contrail-controller-config-api |
mirantis.azurecr.io/tungsten/contrail-controller-config-api:24.1-r21.4.20240227154027 |
Apache License 2.0 |
contrail-controller-config-devicemgr |
mirantis.azurecr.io/tungsten/contrail-controller-config-devicemgr:24.1-r21.4.20240227154027 |
Apache License 2.0 |
contrail-controller-config-dnsmasq |
mirantis.azurecr.io/tungsten/contrail-controller-config-dnsmasq:24.1-r21.4.20240227154027 |
Apache License 2.0 |
contrail-controller-config-schema |
mirantis.azurecr.io/tungsten/contrail-controller-config-schema:24.1-r21.4.20240227154027 |
Apache License 2.0 |
contrail-controller-config-svcmonitor |
mirantis.azurecr.io/tungsten/contrail-controller-config-svcmonitor:24.1-r21.4.20240227154027 |
Apache License 2.0 |
contrail-controller-control-control |
mirantis.azurecr.io/tungsten/contrail-controller-control-control:24.1-r21.4.20240227154027 |
Apache License 2.0 |
contrail-controller-control-dns |
mirantis.azurecr.io/tungsten/contrail-controller-control-dns:24.1-r21.4.20240227154027 |
Apache License 2.0 |
contrail-controller-control-named |
mirantis.azurecr.io/tungsten/contrail-controller-control-named:24.1-r21.4.20240227154027 |
Apache License 2.0 |
contrail-controller-webui-job |
mirantis.azurecr.io/tungsten/contrail-controller-webui-job:24.1-r21.4.20240227154027 |
Apache License 2.0 |
contrail-controller-webui-web |
mirantis.azurecr.io/tungsten/contrail-controller-webui-web:24.1-r21.4.20240227154027 |
Apache License 2.0 |
contrail-node-init |
mirantis.azurecr.io/tungsten/contrail-node-init:21.4.20240118000000 |
Apache License 2.0 |
contrail-nodemgr |
mirantis.azurecr.io/tungsten/contrail-nodemgr:24.1-r21.4.20240227154027 |
Apache License 2.0 |
contrail-provisioner |
mirantis.azurecr.io/tungsten/contrail-provisioner:24.1-r21.4.20240227154027 |
Apache License 2.0 |
contrail-tools |
mirantis.azurecr.io/tungsten/contrail-tools:24.1-r21.4.20240227154027 |
Apache License 2.0 |
contrail-vrouter-agent |
mirantis.azurecr.io/tungsten/contrail-vrouter-agent:21.4.20240118000000 |
Apache License 2.0 |
contrail-vrouter-agent-dpdk |
mirantis.azurecr.io/tungsten/contrail-vrouter-agent-dpdk:21.4.20240118000000 |
Apache License 2.0 |
contrail-vrouter-kernel-build-init |
mirantis.azurecr.io/tungsten/contrail-vrouter-kernel-build-init:21.4.20240118000000 |
Apache License 2.0 |
MOSK 24.1.1 StackLight artifacts
Component |
Path |
License information for main executable programs |
|---|---|---|
Docker images |
||
prometheus-libvirt-exporter |
mirantis.azurecr.io/stacklight/prometheus-libvirt-exporter:v0.2-20240228023010 |
Mirantis Proprietary License |
tungstenfabric-prometheus-exporter |
mirantis.azurecr.io/stacklight/tungstenfabric-prometheus-exporter:0.1-20230912105027 |
Mirantis Proprietary License |
Helm charts |
||
fluentd |
https://binary.mirantis.com/stacklight/helm/fluentd-2.0.3-mcp-52.tgz |
Mirantis Proprietary License |
prometheus-libvirt-exporter |
https://binary.mirantis.com/stacklight/helm/prometheus-libvirt-exporter-0.2.0-mcp-7.tgz |
Mirantis Proprietary License |
prometheus-tungstenfabric-exporter |
https://binary.mirantis.com/stacklight/helm/prometheus-tungstenfabric-exporter-0.2.0-mcp-7.tgz |
Mirantis Proprietary License |
In total, since MOSK 24.1 release, in 24.1.1, 223 Common Vulnerabilities and Exposures (CVE) have been fixed: 8 of critical and 215 of high severity.
Product component |
CVE type |
Critical |
High |
Total |
|---|---|---|---|---|
OpenStack |
Unique |
0 |
8 |
8 |
Common |
0 |
50 |
50 |
|
Tungsten Fabric |
Unique |
8 |
50 |
58 |
Common |
8 |
165 |
173 |
Mirantis Security Portal
For the detailed list of fixed and present CVEs across the Mirantis Container Cloud and MOSK products, refer to Mirantis Security Portal.
Mirantis Container Cloud CVEs
For the number of fixed CVEs in the Mirantis Container Cloud-related components including kaas core, bare metal, Ceph, and StackLight, refer to Container Cloud 2.26.1: Security notes.
The following issues have been addressed in the MOSK 24.1.1 release:
[40036] Resolved the issue causing nodes to remain in the Kubernetes cluster when the corresponding machine is marked as disabled during cluster update.
This section lists MOSK known issues with workarounds for the Mirantis OpenStack for Kubernetes release 24.1.1.
During MariaDB operations on a management cluster, Pods may get stuck in continuous restarts with the following example error:
[ERROR] WSREP: Corrupt buffer header: \
addr: 0x7faec6f8e518, \
seqno: 3185219421952815104, \
size: 909455917, \
ctx: 0x557094f65038, \
flags: 11577. store: 49, \
type: 49
Workaround:
Create a backup of the
/var/lib/mysqldirectory on themariadb-serverPod.Verify that other replicas are up and ready.
Remove the
galera.cachefile for the affectedmariadb-serverPod.Remove the affected
mariadb-serverPod or wait until it is automatically restarted.
After Kubernetes restarts the Pod, the Pod clones the database in 1-2 minutes and restores the quorum.
After provisioning the controller node, the etcd pod initiates before the Kubernetes networking is fully operational. As a result, the pod encounters difficulties resolving DNS and establishing connections with other members, ultimately leading to a panic state for the etcd service.
Workaround:
Delete the PVC related to the replaced controller node:
kubectl -n openstack delete pvc <PVC-NAME>
Delete pods related to the crashing etcd service on the replaced controller node:
kubectl -n openstack delete pods <ETCD-POD-NAME>
Fixed in MOSK 24.1.2 Fixed in MOSK 24.2
On large (500+ compute nodes) clusters, openstack-controller-exporter may
fail to initialize within the default timeout.
As a workaround, define OSCTL_EXPORTER_MAX_POLL_TIMEOUT in the cluster
object:
spec:
providerSpec:
value:
helmReleases:
- name: openstack-operator
values:
exporter:
settings:
raw:
OSCTL_EXPORTER_MAX_POLL_TIMEOUT: 900
The cluster update may stuck if the maximum number of the worker nodes to update simultaneously is ten or higher.
To work around the problem, set the
spec.providerSpec.maxWorkerUpgradeCount to a value lower than 10.
For configuration details, see Configure the parallel update of worker nodes.
Due to the MetalLB upstream issue, a load balancer service may not obtain the external IP address.
The issue occurs when two services share the same external IP address and have
the same externalTrafficPolicy value. Initially, the services have the
external IP address assigned and are accessible. After modifying the
externalTrafficPolicy value for both services from Cluster to
Local, the first service that has been changed remains with no external IP
address assigned. Though, the second service, which was changed later, has the
external IP assigned as expected.
To work around the issue, make a dummy change to the service object where
external IP is <pending>:
Identify the service that is stuck:
kubectl get svc -A | grep pending
Example of system response:
stacklight iam-proxy-prometheus LoadBalancer 10.233.28.196 <pending> 443:30430/TCP
Add an arbitrary label to the service that is stuck. For example:
kubectl label svc -n stacklight iam-proxy-prometheus reconcile=1
Example of system response:
service/iam-proxy-prometheus labeledVerify that the external IP was allocated to the service:
kubectl get svc -n stacklight iam-proxy-prometheus
Example of system response:
NAME TYPE CLUSTER-IP EXTERNAL-IP PORT(S) AGE iam-proxy-prometheus LoadBalancer 10.233.28.196 10.0.34.108 443:30430/TCP 12d
Sometimes, after changing the OpenStackDeployment custom resource,
it does not transition to the APPLYING state as expected.
To work around the issue, restart the rockoon` pod in the osh-system
namespace.
Fixed in MOSK 24.2.1 Fixed in MOSK 24.3
After upgrading to OpenStack Antelope, clusters with configured trunk ports experience traffic flow disruptions that block the cluster updates.
To work around the issue, pin the MOSK Networking service (OpenStack Neutron) container image by adding the following content to the OpenStackDeployment custom resource:
spec:
services:
networking:
neutron:
values:
images:
tags:
neutron_openvswitch_agent: mirantis.azurecr.io/openstack/neutron:antelope-jammy-20240816113600
Caution
Remove the pinning after updating to MOSK 24.2.1 or later patch or major release.
After upgrade to OpenStack Antelope, the virtual machines experience connectivity disruptions when sending data over the virtual networks. Network packets with full MTU are dropped.
The issue affects the MOSK clusters with Open vSwitch as the networking backend and with the following specific MTU settings:
The MTU configured on the tunnel interface of compute nodes is equal to the value of the
spec:services:networking:neutron:values:conf:neutron:DEFAULT:global_physnet_mtuparameter of theOpenStackDeploymentcustom resource (if not specified, default is1500bytes).If the MTU of the tunnel interface is higher by at least 4 bytes, the cluster is not affected by the issue.
The cluster contains virtual machines that have the MTU of the network interfaces of the guest operating system larger than the MTU of the value of the
global_physnet_mtuparameter above minus 50 bytes.
To work around the issue, pin the MOSK Networking
service (OpenStack Neutron) container image by adding the following content
to the OpenStackDeployment custom resource:
spec:
services:
networking:
neutron:
values:
images:
tags:
neutron_openvswitch_agent: mirantis.azurecr.io/openstack/neutron:antelope-jammy-20240816113600
Caution
Remove the pinning after updating to MOSK 24.2.1 or later patch or major release.
Occasionally, RabbitMQ instances in tf-rabbitmq pods fail to enable
the tracking_records_in_ets during the initialization process.
To work around the problem, restart the affected pods manually.
Rebooting all Cassandra cluster TFConfig or TFAnalytics nodes, maintenance, or other circumstances that cause the Cassandra pods to start simultaneously may cause a broken Cassandra TFConfig and/or TFAnalytics cluster. In this case, Cassandra nodes do not join the ring and do not update the IPs of the neighbor nodes. As a result, the TF services cannot operate Cassandra cluster(s).
To verify that a Cassandra cluster is affected:
Run the nodetool status command specifying the config or
analytics cluster and the replica number:
kubectl -n tf exec -it tf-cassandra-<config/analytics>-dc1-rack1-<replica number> -c cassandra -- nodetool status
Example of system response with outdated IP addresses:
Datacenter: DC1
===============
Status=Up/Down
|/ State=Normal/Leaving/Joining/Moving
-- Address Load Tokens Owns (effective) Host ID Rack
DN <outdated ip> ? 256 64.9% a58343d0-1e3f-4d54-bcdf-9b9b949ca873 r1
DN <outdated ip> ? 256 69.8% 67f1d07c-8b13-4482-a2f1-77fa34e90d48 r1
Datacenter: dc1
===============
Status=Up/Down
|/ State=Normal/Leaving/Joining/Moving
-- Address Load Tokens Owns (effective) Host ID Rack
UN <actual ip> 3.84 GiB 256 65.2% 7324ebc4-577a-425f-b3de-96faac95a331 rack1
Workaround:
Manually delete the Cassandra pod from the failed config or analytics
cluster to re-initiate the bootstrap process for one of the Cassandra nodes:
kubectl -n tf delete pod tf-cassandra-<config/analytics>-dc1-rack1-<replica_num>
During major or patch update of a MOSK cluster with StackLight enabled in
non-HA mode, the KubePodsCrashLooping alert may be firing for the Grafana
ReplicaSet.
Grafana relies on PostgreSQL for persistent data. In non-HA StackLight setup,
PostgreSQL becomes temporarily unavailable during updates. If Grafana loses its
database connection or fails to establish one during startup, Grafana fails
with an error. This may cause the Grafana pod to enter the CrashLoopBackOff
state. Such behavior is expected in non-HA StackLight setups. The Grafana pod
will resume normal operation after PostgreSQL is restored.
To prevent the issue, deploy StackLight in HA mode.
The following table provides details on the impact of a MOSK cluster update to a patch release within the 24.1 series.
Note
For the detailed workflow of update to a patch release, refer to Update to a patch version.
Updated component |
Impact on cloud users |
Impact on cloud workloads |
|---|---|---|
OpenStack and Tungsten Fabric |
|
Open vSwitch networking - interruption of North-South connectivity, depending on the type of virtual routers used by a workload:
Tungsten Fabric networking - no impact |
Ceph |
~1% of read operations on object storage API may fail |
IO performance degradation for Ceph-backed virtual storage devices |
Host OS components |
No impact |
No impact |
- 0(1,2)
You can bypass updating components of the cloud data plane to avoid the network downtime during Update to a patch version. By using this technique, you accept the risk that some security fixes may not be applied.
Learn more about the release cadence
24.1.2 patch
The patch release notes contain the description of product enhancements, the list of updated artifacts and Common Vulnerabilities and Exposures (CVE) fixes as well as description of the addressed product issues for the MOSK 24.1.2 patch.
Release date |
April 08, 2024 |
|---|---|
Scope |
Patch |
Cluster release |
17.1.2 |
OpenStack Operator |
0.15.13 |
Tungsten Fabric Operator |
0.14.7 |
The MOSK 24.1.2 patch provides the following updates:
Support for MKE 3.7.6
Update of minor kernel version from
5.15.0-97-genericto5.15.0-101-genericSecurity fixes for CVEs in images
Resolved product issues
This section lists the components artifacts of the MOSK 24.1.2 release that includes binaries, Docker images, and Helm charts.
MOSK 24.1.2 OpenStack Antelope binaries and Docker images
Component |
Path |
License information for main executable programs |
|---|---|---|
Binaries |
||
octavia-amphora |
https://binary.mirantis.com/openstack/bin/octavia/amphora-x64-haproxy-antelope-20240117112744.qcow2 |
Mirantis Proprietary License |
mirantis |
https://binary.mirantis.com/openstack/bin/horizon/mirantis-antelope-18a1377-20230817112356.tar.gz |
Mirantis Proprietary License |
kernel |
GPL-2.0 |
|
initramfs |
https://binary.mirantis.com/openstack/bin/ironic/tinyipa/tinyipa-stable-antelope-20231123060809.gz |
GPL-2.0 |
service-image |
https://binary.mirantis.com/openstack/bin/manila/manila-service-image-20221228132450.qcow2 |
Mirantis Proprietary License |
Docker images |
||
keystone |
mirantis.azurecr.io/openstack/keystone:antelope-jammy-20240318153252 |
Apache License 2.0 |
heat |
mirantis.azurecr.io/openstack/heat:antelope-jammy-20240318153252 |
Apache License 2.0 |
glance |
mirantis.azurecr.io/openstack/glance:antelope-jammy-20240318153252 |
Apache License 2.0 |
cinder |
mirantis.azurecr.io/openstack/cinder:antelope-jammy-20240318153252 |
Apache License 2.0 |
cloudprober |
mirantis.azurecr.io/openstack/extra/cloudprober:v0.13.2-20240131075124 |
Apache License 2.0 |
neutron |
mirantis.azurecr.io/openstack/neutron:antelope-jammy-20240318153252 |
Apache License 2.0 |
nova |
mirantis.azurecr.io/openstack/nova:antelope-jammy-20240318153252 |
Apache License 2.0 |
horizon |
mirantis.azurecr.io/openstack/horizon:antelope-jammy-20240318153252 |
Apache License 2.0 |
tempest |
mirantis.azurecr.io/openstack/tempest:antelope-jammy-20240318153252 |
Apache License 2.0 |
octavia |
mirantis.azurecr.io/openstack/octavia:antelope-jammy-20240318153252 |
Apache License 2.0 |
designate |
mirantis.azurecr.io/openstack/designate:antelope-jammy-20240318153252 |
Apache License 2.0 |
ironic |
mirantis.azurecr.io/openstack/ironic:antelope-jammy-20240318153252 |
Apache License 2.0 |
barbican |
mirantis.azurecr.io/openstack/barbican:antelope-jammy-20240318153252 |
Apache License 2.0 |
libvirt |
mirantis.azurecr.io/general/libvirt:8.0.x-jammy-20240316092942 |
LGPL-2.1 License |
pause |
mirantis.azurecr.io/general/external/pause:3.1 |
Apache License 2.0 |
openvswitch |
mirantis.azurecr.io/general/openvswitch:2.17-jammy-20231018050930 |
Apache License 2.0 |
openvswitch-dpdk |
mirantis.azurecr.io/general/openvswitch-dpdk:2.17-jammy-20231018050930 |
Apache License 2.0 |
openstack-tools |
mirantis.azurecr.io/openstack/openstack-tools:yoga-jammy-20240318153251 |
Apache License 2.0 |
rabbitmq-3.10.x |
mirantis.azurecr.io/openstack/extra/rabbitmq:3.10.18-focal-20230222154055 |
Mozilla Public License 2.0 |
rabbitmq-3.10.x-management |
mirantis.azurecr.io/openstack/extra/rabbitmq-management:3.10.18-focal-20230222154055 |
Mozilla Public License 2.0 |
kubernetes-entrypoint |
mirantis.azurecr.io/openstack/extra/kubernetes-entrypoint:v1.0.1-55b02f7-20231019172556 |
Apache License 2.0 |
memcached |
mirantis.azurecr.io/general/memcached:v1.6.23-alpine-20240131134844 |
BSD 3-Clause “New” or “Revised” License |
etcd |
mirantis.azurecr.io/openstack/extra/etcd:v3.5.11-alpine-20240131112547 |
Apache License 2.0 |
powerdns |
mirantis.azurecr.io/openstack/extra/powerdns:4.8-alpine-20240308161357 |
GPL-2.0 License |
nginx-ingress-controller |
mirantis.azurecr.io/openstack/extra/nginx-ingress-controller:1.10.0-alpine-20240305082401 |
Apache License 2.0 |
tls-proxy |
mirantis.azurecr.io/openstack/tls-proxy:focal-fipster-20230725114156 |
Mirantis Proprietary License |
defaultbackend |
mirantis.azurecr.io/openstack/extra/defaultbackend:v1.19.2-77af1ef-20220823043839 |
Apache License 2.0 |
mariadb |
mirantis.azurecr.io/general/mariadb:10.6.14-focal-20240311120505 |
GPLv2, LGPLv2.1 (client libraries) |
rabbitmq-exporter |
mirantis.azurecr.io/stacklight/rabbitmq-exporter:1.0.0-RC19 |
MIT License |
memcached-exporter |
mirantis.azurecr.io/stacklight/memcached-exporter:0-20231208095208 |
Apache License 2.0 |
prometheus-mysql-exporter |
mirantis.azurecr.io/stacklight/mysqld-exporter:v0.11.0 |
Apache License 2.0 |
aodh |
mirantis.azurecr.io/openstack/aodh:antelope-jammy-20240318153252 |
Apache License 2.0 |
ceilometer |
mirantis.azurecr.io/openstack/ceilometer:antelope-jammy-20240318153252 |
Apache License 2.0 |
gnocchi |
mirantis.azurecr.io/openstack/gnocchi:antelope-jammy-20240318153252 |
Apache License 2.0 |
redis |
mirantis.azurecr.io/openstack/extra/redis:7.2.4-alpine3.19-1 |
BSD 3-Clause “New” or “Revised” License |
frr |
mirantis.azurecr.io/general/external/docker.io/frrouting/frr:v9.0.2-20240318063427 |
GPL-2.0 and LGPL-2.1 |
strongswan |
mirantis.azurecr.io/openstack/extra/strongswan:alpine-5.9.12-20240129155309 |
GPL-2.0 |
rsyslog |
mirantis.azurecr.io/openstack/extra/rsyslog:v8.2001.0-20231018050930 |
GNU General Public License v3 |
descheduler |
mirantis.azurecr.io/openstack/extra/descheduler:v0.29.0 |
Apache License 2.0 |
nginx |
mirantis.azurecr.io/openstack/extra/nginx:1.25.3-20240131112557 |
Apache License 2.0 |
requirements |
mirantis.azurecr.io/openstack/requirements:antelope-jammy-20240318153252 |
Apache License 2.0 |
stepler |
mirantis.azurecr.io/openstack/stepler:antelope-jammy-20240315112519 |
Apache License 2.0 |
placement |
mirantis.azurecr.io/openstack/placement:antelope-jammy-20240318153252 |
Apache License 2.0 |
masakari |
mirantis.azurecr.io/openstack/masakari:antelope-jammy-20240318153252 |
Apache License 2.0 |
masakari-monitors |
mirantis.azurecr.io/openstack/masakari-monitors:antelope-jammy-20240318153252 |
Apache License 2.0 |
ironic-inspector |
mirantis.azurecr.io/openstack/ironic-inspector:antelope-jammy-20240318153252 |
Apache License 2.0 |
manila |
mirantis.azurecr.io/openstack/manila:antelope-jammy-20240318153252 |
Apache License 2.0 |
MOSK 24.1.2 OpenStack Yoga binaries and Docker images
Component |
Path |
License information for main executable programs |
|---|---|---|
Binaries |
||
octavia-amphora |
https://binary.mirantis.com/openstack/bin/octavia/amphora-x64-haproxy-yoga-20240115150429.qcow2 |
Mirantis Proprietary License |
mirantis |
https://binary.mirantis.com/openstack/bin/horizon/mirantis-yoga-186584b-20230817112411.tar.gz |
Mirantis Proprietary License |
kernel |
https://binary.mirantis.com/openstack/bin/ironic/tinyipa/tinyipa-stable-yoga-20231004061110.vmlinuz |
GPL-2.0 |
initramfs |
https://binary.mirantis.com/openstack/bin/ironic/tinyipa/tinyipa-stable-yoga-20231004061110.gz |
GPL-2.0 |
service-image |
https://binary.mirantis.com/openstack/bin/manila/manila-service-image-20221228132450.qcow2 |
Mirantis Proprietary License |
Docker images |
||
keystone |
mirantis.azurecr.io/openstack/keystone:yoga-jammy-20240318153251 |
Apache License 2.0 |
heat |
mirantis.azurecr.io/openstack/heat:yoga-jammy-20240318153251 |
Apache License 2.0 |
glance |
mirantis.azurecr.io/openstack/glance:yoga-jammy-20240318153251 |
Apache License 2.0 |
cinder |
mirantis.azurecr.io/openstack/cinder:yoga-jammy-20240318153251 |
Apache License 2.0 |
cloudprober |
mirantis.azurecr.io/openstack/extra/cloudprober:v0.13.2-20240131075124 |
Apache License 2.0 |
neutron |
mirantis.azurecr.io/openstack/neutron:yoga-jammy-20240318153251 |
Apache License 2.0 |
nova |
mirantis.azurecr.io/openstack/nova:yoga-jammy-20240318153251 |
Apache License 2.0 |
horizon |
mirantis.azurecr.io/openstack/horizon:yoga-jammy-20240318153251 |
Apache License 2.0 |
tempest |
mirantis.azurecr.io/openstack/tempest:yoga-jammy-20240318153251 |
Apache License 2.0 |
octavia |
mirantis.azurecr.io/openstack/octavia:yoga-jammy-20240318153251 |
Apache License 2.0 |
designate |
mirantis.azurecr.io/openstack/designate:yoga-jammy-20240318153251 |
Apache License 2.0 |
ironic |
mirantis.azurecr.io/openstack/ironic:yoga-jammy-20240318153251 |
Apache License 2.0 |
barbican |
mirantis.azurecr.io/openstack/barbican:yoga-jammy-20240318153251 |
Apache License 2.0 |
libvirt |
mirantis.azurecr.io/general/libvirt:8.0.x-jammy-20240316092942 |
LGPL-2.1 License |
pause |
mirantis.azurecr.io/general/external/pause:3.1 |
Apache License 2.0 |
openvswitch |
mirantis.azurecr.io/general/openvswitch:2.17-jammy-20231018050930 |
Apache License 2.0 |
openvswitch-dpdk |
mirantis.azurecr.io/general/openvswitch-dpdk:2.17-jammy-20231018050930 |
Apache License 2.0 |
openstack-tools |
mirantis.azurecr.io/openstack/openstack-tools:yoga-jammy-20240318153251 |
Apache License 2.0 |
rabbitmq-3.10.x |
mirantis.azurecr.io/openstack/extra/rabbitmq:3.10.18-focal-20230222154055 |
Mozilla Public License 2.0 |
rabbitmq-3.10.x-management |
mirantis.azurecr.io/openstack/extra/rabbitmq-management:3.10.18-focal-20230222154055 |
Mozilla Public License 2.0 |
kubernetes-entrypoint |
mirantis.azurecr.io/openstack/extra/kubernetes-entrypoint:v1.0.1-55b02f7-20231019172556 |
Apache License 2.0 |
memcached |
mirantis.azurecr.io/general/memcached:v1.6.23-alpine-20240131134844 |
BSD 3-Clause “New” or “Revised” License |
etcd |
mirantis.azurecr.io/openstack/extra/etcd:v3.5.11-alpine-20240131112547 |
Apache License 2.0 |
powerdns |
mirantis.azurecr.io/openstack/extra/powerdns:4.8-alpine-20240308161357 |
GPL-2.0 License |
nginx-ingress-controller |
mirantis.azurecr.io/openstack/extra/nginx-ingress-controller:1.10.0-alpine-20240305082401 |
Apache License 2.0 |
tls-proxy |
mirantis.azurecr.io/openstack/tls-proxy:focal-fipster-20230725114156 |
Mirantis Proprietary License |
defaultbackend |
mirantis.azurecr.io/openstack/extra/defaultbackend:v1.19.2-77af1ef-20220823043839 |
Apache License 2.0 |
mariadb |
mirantis.azurecr.io/general/mariadb:10.6.14-focal-20240311120505 |
GPLv2, LGPLv2.1 (client libraries) |
rabbitmq-exporter |
mirantis.azurecr.io/stacklight/rabbitmq-exporter:1.0.0-RC19 |
MIT License |
memcached-exporter |
mirantis.azurecr.io/stacklight/memcached-exporter:0-20231208095208 |
Apache License 2.0 |
prometheus-mysql-exporter |
mirantis.azurecr.io/stacklight/mysqld-exporter:v0.11.0 |
Apache License 2.0 |
aodh |
mirantis.azurecr.io/openstack/aodh:yoga-jammy-20240318153251 |
Apache License 2.0 |
ceilometer |
mirantis.azurecr.io/openstack/ceilometer:yoga-jammy-20240318153251 |
Apache License 2.0 |
gnocchi |
mirantis.azurecr.io/openstack/gnocchi:yoga-jammy-20240318153251 |
Apache License 2.0 |
redis |
mirantis.azurecr.io/openstack/extra/redis:7.2.4-alpine3.19-1 |
BSD 3-Clause “New” or “Revised” License |
frr |
mirantis.azurecr.io/general/external/docker.io/frrouting/frr:v9.0.2-20240318063427 |
GPL-2.0 and LGPL-2.1 |
strongswan |
mirantis.azurecr.io/openstack/extra/strongswan:alpine-5.9.12-20240129155309 |
GPL-2.0 |
rsyslog |
mirantis.azurecr.io/openstack/extra/rsyslog:v8.2001.0-20231018050930 |
GNU General Public License v3 |
descheduler |
mirantis.azurecr.io/openstack/extra/descheduler:v0.29.0 |
Apache License 2.0 |
nginx |
mirantis.azurecr.io/openstack/extra/nginx:1.25.3-20240131112557 |
Apache License 2.0 |
requirements |
mirantis.azurecr.io/openstack/requirements:yoga-jammy-20240318153251 |
Apache License 2.0 |
stepler |
mirantis.azurecr.io/openstack/stepler:yoga-focal-20240313091248 |
Apache License 2.0 |
placement |
mirantis.azurecr.io/openstack/placement:yoga-jammy-20240318153251 |
Apache License 2.0 |
masakari |
mirantis.azurecr.io/openstack/masakari:yoga-jammy-20240318153251 |
Apache License 2.0 |
masakari-monitors |
mirantis.azurecr.io/openstack/masakari-monitors:yoga-jammy-20240318153251 |
Apache License 2.0 |
ironic-inspector |
mirantis.azurecr.io/openstack/ironic-inspector:yoga-jammy-20240318153251 |
Apache License 2.0 |
manila |
mirantis.azurecr.io/openstack/manila:yoga-jammy-20240318153251 |
Apache License 2.0 |
MOSK 24.1.2 OpenStack Helm charts
MOSK 24.1.2 Tungsten Fabric 21.4 artifacts
Component |
Path |
License information for main executable programs |
|---|---|---|
Helm charts |
||
tungstenfabric-operator |
https://binary.mirantis.com/tungsten/helm/tungstenfabric-operator-0.14.7.tgz |
Mirantis Proprietary License |
Docker images |
||
tungstenfabric-operator |
mirantis.azurecr.io/tungsten-operator/tungstenfabric-operator:0.14.7 |
Mirantis Proprietary License |
tungsten-pytest |
mirantis.azurecr.io/tungsten/tungsten-pytest:0.1-20240307145514 |
MIT License |
casskop |
mirantis.azurecr.io/tungsten-operator/casskop:v2.2.1 |
Apache License 2.0 |
cassandra-bootstrap |
mirantis.azurecr.io/tungsten/cassandra-bootstrap:0.1.14 |
Apache License 2.0 |
cassandra |
mirantis.azurecr.io/tungsten/cassandra:3.11.10-20230622 |
Apache License 2.0 |
cassandra-config-builder |
mirantis.azurecr.io/tungsten/cass-config-builder:v2-20240122114202 |
Apache License 2.0 |
kafka-k8s-operator |
mirantis.azurecr.io/tungsten-operator/kafka-k8s-operator:0.3.8 |
Mirantis Proprietary License |
cp-kafka |
mirantis.azurecr.io/tungsten/cp-kafka:7.5.3 |
Apache License 2.0 |
kafka-jmx-exporter |
mirantis.azurecr.io/stacklight/jmx-exporter:0.20.0-debian-11-r24 |
Apache License 2.0 |
rabbitmq-operator |
mirantis.azurecr.io/tungsten-operator/rabbitmq-operator:0.4.2 |
Mirantis Proprietary License |
rabbitmq |
mirantis.azurecr.io/tungsten/rabbitmq:3.11.16 |
Mozilla Public License 2.0 |
rabbitmq-exporter |
mirantis.azurecr.io/stacklight/rabbitmq-exporter:1.0.0-RC19 |
MIT License |
zookeeper-operator |
mirantis.azurecr.io/tungsten-operator/zookeeper-operator:0.2.20-mcp |
Apache License 2.0 |
zookeeper |
mirantis.azurecr.io/tungsten/zookeeper:3.8.3-20231019 |
Apache License 2.0 |
redis-operator |
mirantis.azurecr.io/tungsten-operator/redis-operator:0.4.2 |
Apache License 2.0 |
redis |
mirantis.azurecr.io/tungsten/redis:7.2.4-alpine3.19 |
BSD 3-Clause “New” or “Revised” License |
redis-exporter |
mirantis.azurecr.io/stacklight/redis_exporter:v1.45.0 |
BSD 3-Clause “New” or “Revised” License |
tf-cli |
mirantis.azurecr.io/tungsten/tf-cli:0.1-20240116162056 |
MIT License |
kubernetes-entrypoint |
mirantis.azurecr.io/openstack/extra/kubernetes-entrypoint:v1.0.1-55b02f7-20231019172556 |
Apache License 2.0 |
pause |
mirantis.azurecr.io/general/external/pause:3.1 |
Apache License 2.0 |
tf-nodeinfo |
mirantis.azurecr.io/tungsten/tf-nodeinfo:0.1-20231017142953 |
MIT License |
contrail-analytics-alarm-gen |
mirantis.azurecr.io/tungsten/contrail-analytics-alarm-gen:24.1-r21.4.20240322210912 |
Apache License 2.0 |
contrail-analytics-api |
mirantis.azurecr.io/tungsten/contrail-analytics-api:24.1-r21.4.20240322210912 |
Apache License 2.0 |
contrail-analytics-collector |
mirantis.azurecr.io/tungsten/contrail-analytics-collector:24.1-r21.4.20240322210912 |
Apache License 2.0 |
contrail-analytics-query-engine |
mirantis.azurecr.io/tungsten/contrail-analytics-query-engine:24.1-r21.4.20240322210912 |
Apache License 2.0 |
contrail-analytics-snmp-collector |
mirantis.azurecr.io/tungsten/contrail-analytics-snmp-collector:24.1-r21.4.20240322210912 |
Apache License 2.0 |
contrail-analytics-snmp-topology |
mirantis.azurecr.io/tungsten/contrail-analytics-snmp-topology:24.1-r21.4.20240322210912 |
Apache License 2.0 |
contrail-controller-config-api |
mirantis.azurecr.io/tungsten/contrail-controller-config-api:24.1-r21.4.20240322210912 |
Apache License 2.0 |
contrail-controller-config-devicemgr |
mirantis.azurecr.io/tungsten/contrail-controller-config-devicemgr:24.1-r21.4.20240322210912 |
Apache License 2.0 |
contrail-controller-config-dnsmasq |
mirantis.azurecr.io/tungsten/contrail-controller-config-dnsmasq:24.1-r21.4.20240322210912 |
Apache License 2.0 |
contrail-controller-config-schema |
mirantis.azurecr.io/tungsten/contrail-controller-config-schema:24.1-r21.4.20240322210912 |
Apache License 2.0 |
contrail-controller-config-svcmonitor |
mirantis.azurecr.io/tungsten/contrail-controller-config-svcmonitor:24.1-r21.4.20240322210912 |
Apache License 2.0 |
contrail-controller-control-control |
mirantis.azurecr.io/tungsten/contrail-controller-control-control:24.1-r21.4.20240322210912 |
Apache License 2.0 |
contrail-controller-control-dns |
mirantis.azurecr.io/tungsten/contrail-controller-control-dns:24.1-r21.4.20240322210912 |
Apache License 2.0 |
contrail-controller-control-named |
mirantis.azurecr.io/tungsten/contrail-controller-control-named:24.1-r21.4.20240322210912 |
Apache License 2.0 |
contrail-controller-webui-job |
mirantis.azurecr.io/tungsten/contrail-controller-webui-job:24.1-r21.4.20240322210912 |
Apache License 2.0 |
contrail-controller-webui-web |
mirantis.azurecr.io/tungsten/contrail-controller-webui-web:24.1-r21.4.20240322210912 |
Apache License 2.0 |
contrail-node-init |
mirantis.azurecr.io/tungsten/contrail-node-init:21.4.20240118000000 |
Apache License 2.0 |
contrail-nodemgr |
mirantis.azurecr.io/tungsten/contrail-nodemgr:24.1-r21.4.20240322210912 |
Apache License 2.0 |
contrail-provisioner |
mirantis.azurecr.io/tungsten/contrail-provisioner:24.1-r21.4.20240322210912 |
Apache License 2.0 |
contrail-tools |
mirantis.azurecr.io/tungsten/contrail-tools:24.1-r21.4.20240322210912 |
Apache License 2.0 |
contrail-vrouter-agent |
mirantis.azurecr.io/tungsten/contrail-vrouter-agent:21.4.20240118000000 |
Apache License 2.0 |
contrail-vrouter-agent-dpdk |
mirantis.azurecr.io/tungsten/contrail-vrouter-agent-dpdk:21.4.20240118000000 |
Apache License 2.0 |
contrail-vrouter-kernel-build-init |
mirantis.azurecr.io/tungsten/contrail-vrouter-kernel-build-init:21.4.20240118000000 |
Apache License 2.0 |
MOSK 24.1.2 StackLight artifacts
Component |
Path |
License information for main executable programs |
|---|---|---|
Docker images |
||
prometheus-libvirt-exporter |
mirantis.azurecr.io/stacklight/prometheus-libvirt-exporter:v0.2-20240318062244 |
Mirantis Proprietary License |
tungstenfabric-prometheus-exporter |
mirantis.azurecr.io/stacklight/tungstenfabric-prometheus-exporter:0.1-20240119124301 |
Mirantis Proprietary License |
Helm charts |
||
fluentd |
https://binary.mirantis.com/stacklight/helm/fluentd-2.0.3-mcp-52.tgz |
Mirantis Proprietary License |
prometheus-libvirt-exporter |
https://binary.mirantis.com/stacklight/helm/prometheus-libvirt-exporter-0.2.0-mcp-7.tgz |
Mirantis Proprietary License |
prometheus-tungstenfabric-exporter |
https://binary.mirantis.com/stacklight/helm/prometheus-tungstenfabric-exporter-0.2.0-mcp-7.tgz |
Mirantis Proprietary License |
The table below includes the total number of addressed unique and common CVEs by MOSK-specific component since MOSK 24.1.1. The common CVEs are issues addressed across several images.
Product component |
CVE type |
Critical |
High |
Total |
|---|---|---|---|---|
OpenStack |
Unique |
0 |
7 |
7 |
Common |
0 |
7 |
7 |
|
Tungsten Fabric |
Unique |
0 |
3 |
3 |
Common |
0 |
4 |
4 |
Mirantis Security Portal
For the detailed list of fixed and present CVEs across the Mirantis Container Cloud and MOSK products, refer to Mirantis Security Portal.
Mirantis Container Cloud CVEs
For the number of fixed CVEs in the Mirantis Container Cloud-related components including kaas core, bare metal, Ceph, and StackLight, refer to Container Cloud 2.26.2: Security notes.
The following issues have been addressed in the MOSK 24.1.2 release:
[39663] Resolved the issue in OpenStack notifications for the Keystone component where the
"event_type": "identity.user.deleted"field lacked the ID of the request initiator (req_initiator) in the CADF payload.[39768] Resolved the issue that caused the OpenStack controller exporter to fail to initialize within the default timeout on large (500+ compute nodes) clusters.
[40712] Resolved the issue that caused
nova-manageimage_propertyto show traces.[40740] Resolved the issue that caused the OpenStack sos report logs collection failure.
This section lists MOSK known issues with workarounds for the Mirantis OpenStack for Kubernetes release 24.1.2.
During MariaDB operations on a management cluster, Pods may get stuck in continuous restarts with the following example error:
[ERROR] WSREP: Corrupt buffer header: \
addr: 0x7faec6f8e518, \
seqno: 3185219421952815104, \
size: 909455917, \
ctx: 0x557094f65038, \
flags: 11577. store: 49, \
type: 49
Workaround:
Create a backup of the
/var/lib/mysqldirectory on themariadb-serverPod.Verify that other replicas are up and ready.
Remove the
galera.cachefile for the affectedmariadb-serverPod.Remove the affected
mariadb-serverPod or wait until it is automatically restarted.
After Kubernetes restarts the Pod, the Pod clones the database in 1-2 minutes and restores the quorum.
After provisioning the controller node, the etcd pod initiates before the Kubernetes networking is fully operational. As a result, the pod encounters difficulties resolving DNS and establishing connections with other members, ultimately leading to a panic state for the etcd service.
Workaround:
Delete the PVC related to the replaced controller node:
kubectl -n openstack delete pvc <PVC-NAME>
Delete pods related to the crashing etcd service on the replaced controller node:
kubectl -n openstack delete pods <ETCD-POD-NAME>
The cluster update may stuck if the maximum number of the worker nodes to update simultaneously is ten or higher.
To work around the problem, set the
spec.providerSpec.maxWorkerUpgradeCount to a value lower than 10.
For configuration details, see Configure the parallel update of worker nodes.
Due to the MetalLB upstream issue, a load balancer service may not obtain the external IP address.
The issue occurs when two services share the same external IP address and have
the same externalTrafficPolicy value. Initially, the services have the
external IP address assigned and are accessible. After modifying the
externalTrafficPolicy value for both services from Cluster to
Local, the first service that has been changed remains with no external IP
address assigned. Though, the second service, which was changed later, has the
external IP assigned as expected.
To work around the issue, make a dummy change to the service object where
external IP is <pending>:
Identify the service that is stuck:
kubectl get svc -A | grep pending
Example of system response:
stacklight iam-proxy-prometheus LoadBalancer 10.233.28.196 <pending> 443:30430/TCP
Add an arbitrary label to the service that is stuck. For example:
kubectl label svc -n stacklight iam-proxy-prometheus reconcile=1
Example of system response:
service/iam-proxy-prometheus labeledVerify that the external IP was allocated to the service:
kubectl get svc -n stacklight iam-proxy-prometheus
Example of system response:
NAME TYPE CLUSTER-IP EXTERNAL-IP PORT(S) AGE iam-proxy-prometheus LoadBalancer 10.233.28.196 10.0.34.108 443:30430/TCP 12d
Sometimes, after changing the OpenStackDeployment custom resource,
it does not transition to the APPLYING state as expected.
To work around the issue, restart the rockoon` pod in the osh-system
namespace.
Fixed in MOSK 24.2.1 Fixed in MOSK 24.3
After upgrading to OpenStack Antelope, clusters with configured trunk ports experience traffic flow disruptions that block the cluster updates.
To work around the issue, pin the MOSK Networking service (OpenStack Neutron) container image by adding the following content to the OpenStackDeployment custom resource:
spec:
services:
networking:
neutron:
values:
images:
tags:
neutron_openvswitch_agent: mirantis.azurecr.io/openstack/neutron:antelope-jammy-20240816113600
Caution
Remove the pinning after updating to MOSK 24.2.1 or later patch or major release.
After upgrade to OpenStack Antelope, the virtual machines experience connectivity disruptions when sending data over the virtual networks. Network packets with full MTU are dropped.
The issue affects the MOSK clusters with Open vSwitch as the networking backend and with the following specific MTU settings:
The MTU configured on the tunnel interface of compute nodes is equal to the value of the
spec:services:networking:neutron:values:conf:neutron:DEFAULT:global_physnet_mtuparameter of theOpenStackDeploymentcustom resource (if not specified, default is1500bytes).If the MTU of the tunnel interface is higher by at least 4 bytes, the cluster is not affected by the issue.
The cluster contains virtual machines that have the MTU of the network interfaces of the guest operating system larger than the MTU of the value of the
global_physnet_mtuparameter above minus 50 bytes.
To work around the issue, pin the MOSK Networking
service (OpenStack Neutron) container image by adding the following content
to the OpenStackDeployment custom resource:
spec:
services:
networking:
neutron:
values:
images:
tags:
neutron_openvswitch_agent: mirantis.azurecr.io/openstack/neutron:antelope-jammy-20240816113600
Caution
Remove the pinning after updating to MOSK 24.2.1 or later patch or major release.
Occasionally, RabbitMQ instances in tf-rabbitmq pods fail to enable
the tracking_records_in_ets during the initialization process.
To work around the problem, restart the affected pods manually.
Rebooting all Cassandra cluster TFConfig or TFAnalytics nodes, maintenance, or other circumstances that cause the Cassandra pods to start simultaneously may cause a broken Cassandra TFConfig and/or TFAnalytics cluster. In this case, Cassandra nodes do not join the ring and do not update the IPs of the neighbor nodes. As a result, the TF services cannot operate Cassandra cluster(s).
To verify that a Cassandra cluster is affected:
Run the nodetool status command specifying the config or
analytics cluster and the replica number:
kubectl -n tf exec -it tf-cassandra-<config/analytics>-dc1-rack1-<replica number> -c cassandra -- nodetool status
Example of system response with outdated IP addresses:
Datacenter: DC1
===============
Status=Up/Down
|/ State=Normal/Leaving/Joining/Moving
-- Address Load Tokens Owns (effective) Host ID Rack
DN <outdated ip> ? 256 64.9% a58343d0-1e3f-4d54-bcdf-9b9b949ca873 r1
DN <outdated ip> ? 256 69.8% 67f1d07c-8b13-4482-a2f1-77fa34e90d48 r1
Datacenter: dc1
===============
Status=Up/Down
|/ State=Normal/Leaving/Joining/Moving
-- Address Load Tokens Owns (effective) Host ID Rack
UN <actual ip> 3.84 GiB 256 65.2% 7324ebc4-577a-425f-b3de-96faac95a331 rack1
Workaround:
Manually delete the Cassandra pod from the failed config or analytics
cluster to re-initiate the bootstrap process for one of the Cassandra nodes:
kubectl -n tf delete pod tf-cassandra-<config/analytics>-dc1-rack1-<replica_num>
During major or patch update of a MOSK cluster with StackLight enabled in
non-HA mode, the KubePodsCrashLooping alert may be firing for the Grafana
ReplicaSet.
Grafana relies on PostgreSQL for persistent data. In non-HA StackLight setup,
PostgreSQL becomes temporarily unavailable during updates. If Grafana loses its
database connection or fails to establish one during startup, Grafana fails
with an error. This may cause the Grafana pod to enter the CrashLoopBackOff
state. Such behavior is expected in non-HA StackLight setups. The Grafana pod
will resume normal operation after PostgreSQL is restored.
To prevent the issue, deploy StackLight in HA mode.
The following table provides details on the impact of a MOSK cluster update to a patch release within the 24.1 series.
Note
For the detailed workflow of update to a patch release, refer to Update to a patch version.
Updated component |
Impact on cloud users |
Impact on cloud workloads |
|---|---|---|
OpenStack and Tungsten Fabric |
|
Open vSwitch networking - interruption of North-South connectivity, depending on the type of virtual routers used by a workload:
Tungsten Fabric networking - no impact |
Ceph |
~1% of read operations on object storage API may fail |
IO performance degradation for Ceph-backed virtual storage devices |
Host OS components |
No impact |
No impact |
- 0(1,2)
You can bypass updating components of the cloud data plane to avoid the network downtime during Update to a patch version. By using this technique, you accept the risk that some security fixes may not be applied.
For the list of enhancements and bug fixes that relate to Mirantis Container Cloud, refer to the Mirantis Container Cloud Release notes.
Learn more about the release cadence
24.1.3 patch
The patch release notes contain the description of product enhancements, the list of updated artifacts and Common Vulnerabilities and Exposures (CVE) fixes as well as description of the addressed product issues for the MOSK 24.1.3 patch.
Release date |
April 29, 2024 |
|---|---|
Scope |
Patch |
Cluster release |
17.1.3 |
OpenStack Operator |
0.15.14 |
Tungsten Fabric Operator |
0.14.8 |
The MOSK 24.1.3 patch provides the following updates:
Monitoring of the cluster upgrade progress. See OpenStackDeploymentStatus custom resource for details.
Support for MKE 3.7.7.
Update of minor kernel version from
5.15.0-101-genericto5.15.0-102-generic.Security fixes for CVEs in images.
Resolved product issues.
This section lists the components artifacts of the MOSK 24.1.3 release that includes binaries, Docker images, and Helm charts.
MOSK 24.1.3 OpenStack Antelope binaries and Docker images
Component |
Path |
License information for main executable programs |
|---|---|---|
Binaries |
||
octavia-amphora |
https://binary.mirantis.com/openstack/bin/octavia/amphora-x64-haproxy-antelope-20240117112744.qcow2 |
Mirantis Proprietary License |
mirantis |
https://binary.mirantis.com/openstack/bin/horizon/mirantis-antelope-18a1377-20230817112356.tar.gz |
Mirantis Proprietary License |
kernel |
GPL-2.0 |
|
initramfs |
https://binary.mirantis.com/openstack/bin/ironic/tinyipa/tinyipa-stable-antelope-20231123060809.gz |
GPL-2.0 |
service-image |
https://binary.mirantis.com/openstack/bin/manila/manila-service-image-20221228132450.qcow2 |
Mirantis Proprietary License |
Docker images |
||
keystone |
mirantis.azurecr.io/openstack/keystone:antelope-jammy-20240412114318 |
Apache License 2.0 |
heat |
mirantis.azurecr.io/openstack/heat:antelope-jammy-20240412114318 |
Apache License 2.0 |
glance |
mirantis.azurecr.io/openstack/glance:antelope-jammy-20240412114318 |
Apache License 2.0 |
cinder |
mirantis.azurecr.io/openstack/cinder:antelope-jammy-20240412114318 |
Apache License 2.0 |
osprober |
mirantis.azurecr.io/openstack/extra/cloudprober:v0.13.2-20240131075124 |
Unknown |
neutron |
mirantis.azurecr.io/openstack/neutron:antelope-jammy-20240412114318 |
Apache License 2.0 |
nova |
mirantis.azurecr.io/openstack/nova:antelope-jammy-20240412114318 |
Apache License 2.0 |
horizon |
mirantis.azurecr.io/openstack/horizon:antelope-jammy-20240412114318 |
Apache License 2.0 |
tempest |
mirantis.azurecr.io/openstack/tempest:antelope-jammy-20240412114318 |
Apache License 2.0 |
octavia |
mirantis.azurecr.io/openstack/octavia:antelope-jammy-20240412114318 |
Apache License 2.0 |
designate |
mirantis.azurecr.io/openstack/designate:antelope-jammy-20240412114318 |
Apache License 2.0 |
ironic |
mirantis.azurecr.io/openstack/ironic:antelope-jammy-20240412114318 |
Apache License 2.0 |
barbican |
mirantis.azurecr.io/openstack/barbican:antelope-jammy-20240412114318 |
Apache License 2.0 |
libvirt |
mirantis.azurecr.io/general/libvirt:8.0.x-jammy-20240316092942 |
LGPL-2.1 License |
pause |
mirantis.azurecr.io/general/external/pause:3.1 |
Apache License 2.0 |
openvswitch |
mirantis.azurecr.io/general/openvswitch:2.17-jammy-20231018050930 |
Apache License 2.0 |
openvswitch-dpdk |
mirantis.azurecr.io/general/openvswitch-dpdk:2.17-jammy-20231018050930 |
Apache License 2.0 |
openstack-tools |
mirantis.azurecr.io/openstack/openstack-tools:yoga-jammy-20240412114317 |
Apache License 2.0 |
rabbitmq |
mirantis.azurecr.io/openstack/extra/rabbitmq:3.10.18-focal-20230222154055 |
Mozilla Public License 2.0 |
rabbitmq-management |
mirantis.azurecr.io/openstack/extra/rabbitmq-management:3.10.18-focal-20230222154055 |
Mozilla Public License 2.0 |
kubernetes-entrypoint |
mirantis.azurecr.io/openstack/extra/kubernetes-entrypoint:v1.0.1-55b02f7-20231019172556 |
Apache License 2.0 |
memcached |
mirantis.azurecr.io/general/memcached:v1.6.23-alpine-20240131134844 |
BSD 3-Clause “New” or “Revised” License |
etcd |
mirantis.azurecr.io/openstack/extra/etcd:v3.5.11-alpine-20240131112547 |
Apache License 2.0 |
powerdns |
mirantis.azurecr.io/openstack/extra/powerdns:4.8-alpine-20240308161357 |
GPL-2.0 License |
nginx-ingress-controller |
mirantis.azurecr.io/openstack/extra/nginx-ingress-controller:1.10.0-alpine-20240305082401 |
Apache License 2.0 |
tls-proxy |
mirantis.azurecr.io/openstack/tls-proxy:focal-fipster-20230725114156 |
Mirantis Proprietary License |
defaultbackend |
mirantis.azurecr.io/openstack/extra/defaultbackend:v1.19.2-77af1ef-20220823043839 |
Apache License 2.0 |
mariadb |
mirantis.azurecr.io/general/mariadb:10.6.17-focal-20240327104027 |
GPLv2, LGPLv2.1 (client libraries) |
rabbitmq-exporter |
mirantis.azurecr.io/stacklight/rabbitmq-exporter:1.0.0-RC19 |
MIT License |
memcached-exporter |
mirantis.azurecr.io/stacklight/memcached-exporter:0-20231208095208 |
Apache License 2.0 |
prometheus-mysql-exporter |
mirantis.azurecr.io/stacklight/mysqld-exporter:v0.11.0 |
Apache License 2.0 |
aodh |
mirantis.azurecr.io/openstack/aodh:antelope-jammy-20240412114318 |
Apache License 2.0 |
ceilometer |
mirantis.azurecr.io/openstack/ceilometer:antelope-jammy-20240412114318 |
Apache License 2.0 |
gnocchi |
mirantis.azurecr.io/openstack/gnocchi:antelope-jammy-20240412114318 |
Apache License 2.0 |
redis |
mirantis.azurecr.io/openstack/extra/redis:7.2.4-alpine3.19-1 |
BSD 3-Clause “New” or “Revised” License |
frr |
mirantis.azurecr.io/general/external/docker.io/frrouting/frr:v9.0.2-20240318063427 |
GPL-2.0 and LGPL-2.1 |
strongswan |
mirantis.azurecr.io/openstack/extra/strongswan:alpine-5.9.12-20240129155309 |
GPL-2.0 |
rsyslog |
mirantis.azurecr.io/openstack/extra/rsyslog:v8.2001.0-20231018050930 |
GNU General Public License v3 |
descheduler |
mirantis.azurecr.io/openstack/extra/descheduler:v0.29.0 |
Apache License 2.0 |
nginx |
mirantis.azurecr.io/openstack/extra/nginx:1.25.3-20240131112557 |
Apache License 2.0 |
requirements |
mirantis.azurecr.io/openstack/requirements:antelope-jammy-20240412114318 |
Apache License 2.0 |
stepler |
mirantis.azurecr.io/openstack/stepler:antelope-jammy-20240411173711 |
Apache License 2.0 |
placement |
mirantis.azurecr.io/openstack/placement:antelope-jammy-20240412114318 |
Apache License 2.0 |
masakari |
mirantis.azurecr.io/openstack/masakari:antelope-jammy-20240412114318 |
Apache License 2.0 |
masakari-monitors |
mirantis.azurecr.io/openstack/masakari-monitors:antelope-jammy-20240412114318 |
Apache License 2.0 |
ironic-inspector |
mirantis.azurecr.io/openstack/ironic-inspector:antelope-jammy-20240412114318 |
Apache License 2.0 |
manila |
mirantis.azurecr.io/openstack/manila:antelope-jammy-20240412114318 |
Apache License 2.0 |
MOSK 24.1.3 OpenStack Yoga binaries and Docker images
Component |
Path |
License information for main executable programs |
|---|---|---|
Binaries |
||
octavia-amphora |
https://binary.mirantis.com/openstack/bin/octavia/amphora-x64-haproxy-yoga-20240115150429.qcow2 |
Mirantis Proprietary License |
mirantis |
https://binary.mirantis.com/openstack/bin/horizon/mirantis-yoga-186584b-20230817112411.tar.gz |
Mirantis Proprietary License |
kernel |
https://binary.mirantis.com/openstack/bin/ironic/tinyipa/tinyipa-stable-yoga-20231004061110.vmlinuz |
GPL-2.0 |
initramfs |
https://binary.mirantis.com/openstack/bin/ironic/tinyipa/tinyipa-stable-yoga-20231004061110.gz |
GPL-2.0 |
service-image |
https://binary.mirantis.com/openstack/bin/manila/manila-service-image-20221228132450.qcow2 |
Mirantis Proprietary License |
Docker images |
||
keystone |
mirantis.azurecr.io/openstack/keystone:yoga-jammy-20240412114317 |
Apache License 2.0 |
heat |
mirantis.azurecr.io/openstack/heat:yoga-jammy-20240412114317 |
Apache License 2.0 |
glance |
mirantis.azurecr.io/openstack/glance:yoga-jammy-20240412114317 |
Apache License 2.0 |
cinder |
mirantis.azurecr.io/openstack/cinder:yoga-jammy-20240412114317 |
Apache License 2.0 |
osprober |
mirantis.azurecr.io/openstack/extra/cloudprober:v0.13.2-20240131075124 |
Unknown |
neutron |
mirantis.azurecr.io/openstack/neutron:yoga-jammy-20240412114317 |
Apache License 2.0 |
nova |
mirantis.azurecr.io/openstack/nova:yoga-jammy-20240412114317 |
Apache License 2.0 |
horizon |
mirantis.azurecr.io/openstack/horizon:yoga-jammy-20240412114317 |
Apache License 2.0 |
tempest |
mirantis.azurecr.io/openstack/tempest:yoga-jammy-20240412114317 |
Apache License 2.0 |
octavia |
mirantis.azurecr.io/openstack/octavia:yoga-jammy-20240412114317 |
Apache License 2.0 |
designate |
mirantis.azurecr.io/openstack/designate:yoga-jammy-20240412114317 |
Apache License 2.0 |
ironic |
mirantis.azurecr.io/openstack/ironic:yoga-jammy-20240412114317 |
Apache License 2.0 |
barbican |
mirantis.azurecr.io/openstack/barbican:yoga-jammy-20240412114317 |
Apache License 2.0 |
libvirt |
mirantis.azurecr.io/general/libvirt:8.0.x-jammy-20240316092942 |
LGPL-2.1 License |
pause |
mirantis.azurecr.io/general/external/pause:3.1 |
Apache License 2.0 |
openvswitch |
mirantis.azurecr.io/general/openvswitch:2.17-jammy-20231018050930 |
Apache License 2.0 |
openvswitch-dpdk |
mirantis.azurecr.io/general/openvswitch-dpdk:2.17-jammy-20231018050930 |
Apache License 2.0 |
openstack-tools |
mirantis.azurecr.io/openstack/openstack-tools:yoga-jammy-20240412114317 |
Apache License 2.0 |
rabbitmq |
mirantis.azurecr.io/openstack/extra/rabbitmq:3.10.18-focal-20230222154055 |
Mozilla Public License 2.0 |
rabbitmq-management |
mirantis.azurecr.io/openstack/extra/rabbitmq-management:3.10.18-focal-20230222154055 |
Mozilla Public License 2.0 |
kubernetes-entrypoint |
mirantis.azurecr.io/openstack/extra/kubernetes-entrypoint:v1.0.1-55b02f7-20231019172556 |
Apache License 2.0 |
memcached |
mirantis.azurecr.io/general/memcached:v1.6.23-alpine-20240131134844 |
BSD 3-Clause “New” or “Revised” License |
etcd |
mirantis.azurecr.io/openstack/extra/etcd:v3.5.11-alpine-20240131112547 |
Apache License 2.0 |
powerdns |
mirantis.azurecr.io/openstack/extra/powerdns:4.8-alpine-20240308161357 |
GPL-2.0 License |
nginx-ingress-controller |
mirantis.azurecr.io/openstack/extra/nginx-ingress-controller:1.10.0-alpine-20240305082401 |
Apache License 2.0 |
tls-proxy |
mirantis.azurecr.io/openstack/tls-proxy:focal-fipster-20230725114156 |
Mirantis Proprietary License |
defaultbackend |
mirantis.azurecr.io/openstack/extra/defaultbackend:v1.19.2-77af1ef-20220823043839 |
Apache License 2.0 |
mariadb |
mirantis.azurecr.io/general/mariadb:10.6.17-focal-20240327104027 |
GPLv2, LGPLv2.1 (client libraries) |
rabbitmq-exporter |
mirantis.azurecr.io/stacklight/rabbitmq-exporter:1.0.0-RC19 |
MIT License |
memcached-exporter |
mirantis.azurecr.io/stacklight/memcached-exporter:0-20231208095208 |
Apache License 2.0 |
prometheus-mysql-exporter |
mirantis.azurecr.io/stacklight/mysqld-exporter:v0.11.0 |
Apache License 2.0 |
aodh |
mirantis.azurecr.io/openstack/aodh:yoga-jammy-20240412114317 |
Apache License 2.0 |
ceilometer |
mirantis.azurecr.io/openstack/ceilometer:yoga-jammy-20240412114317 |
Apache License 2.0 |
gnocchi |
mirantis.azurecr.io/openstack/gnocchi:yoga-jammy-20240412114317 |
Apache License 2.0 |
redis |
mirantis.azurecr.io/openstack/extra/redis:7.2.4-alpine3.19-1 |
BSD 3-Clause “New” or “Revised” License |
frr |
mirantis.azurecr.io/general/external/docker.io/frrouting/frr:v9.0.2-20240318063427 |
GPL-2.0 and LGPL-2.1 |
strongswan |
mirantis.azurecr.io/openstack/extra/strongswan:alpine-5.9.12-20240129155309 |
GPL-2.0 |
rsyslog |
mirantis.azurecr.io/openstack/extra/rsyslog:v8.2001.0-20231018050930 |
GNU General Public License v3 |
descheduler |
mirantis.azurecr.io/openstack/extra/descheduler:v0.29.0 |
Apache License 2.0 |
nginx |
mirantis.azurecr.io/openstack/extra/nginx:1.25.3-20240131112557 |
Apache License 2.0 |
requirements |
mirantis.azurecr.io/openstack/requirements:yoga-jammy-20240412114317 |
Apache License 2.0 |
stepler |
mirantis.azurecr.io/openstack/stepler:yoga-focal-20240313091248 |
Apache License 2.0 |
placement |
mirantis.azurecr.io/openstack/placement:yoga-jammy-20240412114317 |
Apache License 2.0 |
masakari |
mirantis.azurecr.io/openstack/masakari:yoga-jammy-20240412114317 |
Apache License 2.0 |
masakari-monitors |
mirantis.azurecr.io/openstack/masakari-monitors:yoga-jammy-20240412114317 |
Apache License 2.0 |
ironic-inspector |
mirantis.azurecr.io/openstack/ironic-inspector:yoga-jammy-20240412114317 |
Apache License 2.0 |
manila |
mirantis.azurecr.io/openstack/manila:yoga-jammy-20240412114317 |
Apache License 2.0 |
MOSK 24.1.3 OpenStack Helm charts
MOSK 24.1.3 Tungsten Fabric 21.4 artifacts
Component |
Path |
License information for main executable programs |
|---|---|---|
Helm charts |
||
tungstenfabric-operator |
https://binary.mirantis.com/tungsten/helm/tungstenfabric-operator-0.14.8.tgz |
Mirantis Proprietary License |
Docker images |
||
tungstenfabric-operator |
mirantis.azurecr.io/tungsten-operator/tungstenfabric-operator:0.14.8 |
Mirantis Proprietary License |
tungsten-pytes |
mirantis.azurecr.io/tungsten/tungsten-pytest:0.1-20240307145514 |
MIT License |
casskop |
mirantis.azurecr.io/tungsten-operator/casskop:v2.2.1 |
Apache License 2.0 |
cassandra-bootstrap |
mirantis.azurecr.io/tungsten/cassandra-bootstrap:0.1.14 |
Apache License 2.0 |
cassandra |
mirantis.azurecr.io/tungsten/cassandra:3.11.10-20230622 |
Apache License 2.0 |
cassandra-config-builder |
mirantis.azurecr.io/tungsten/cass-config-builder:v2-20240122114202 |
Apache License 2.0 |
kafka-k8s-operator |
mirantis.azurecr.io/tungsten-operator/kafka-k8s-operator:0.3.8 |
Mirantis Proprietary License |
cp-kafka |
mirantis.azurecr.io/tungsten/cp-kafka:7.5.3 |
Apache License 2.0 |
kafka-jmx-exporter |
mirantis.azurecr.io/stacklight/jmx-exporter:0.20.0-debian-11-r24 |
Apache License 2.0 |
rabbitmq-operator |
mirantis.azurecr.io/tungsten-operator/rabbitmq-operator:0.4.2 |
Mirantis Proprietary License |
rabbitmq |
mirantis.azurecr.io/tungsten/rabbitmq:3.11.16 |
Mozilla Public License 2.0 |
rabbitmq-exporter |
mirantis.azurecr.io/stacklight/rabbitmq-exporter:1.0.0-RC19 |
MIT License |
zookeeper-operator |
mirantis.azurecr.io/tungsten-operator/zookeeper-operator:0.2.20-mcp |
Apache License 2.0 |
zookeeper |
mirantis.azurecr.io/tungsten/zookeeper:3.8.4-20240315 |
Apache License 2.0 |
redis-operator |
mirantis.azurecr.io/tungsten-operator/redis-operator:0.4.2 |
Apache License 2.0 |
redis |
mirantis.azurecr.io/tungsten/redis:7.2.4-alpine3.19 |
BSD 3-Clause “New” or “Revised” License |
redis-exporter |
mirantis.azurecr.io/stacklight/redis_exporter:v1.45.0 |
BSD 3-Clause “New” or “Revised” License |
tf-cli |
mirantis.azurecr.io/tungsten/tf-cli:0.1-20240116162056 |
MIT License |
kubernetes-entrypoint |
mirantis.azurecr.io/openstack/extra/kubernetes-entrypoint:v1.0.1-55b02f7-20231019172556 |
Apache License 2.0 |
pause |
mirantis.azurecr.io/general/external/pause:3.1 |
Apache License 2.0 |
tf-nodeinfo |
mirantis.azurecr.io/tungsten/tf-nodeinfo:0.1-20231017142953 |
MIT License |
contrail-analytics-alarm-gen |
mirantis.azurecr.io/tungsten/contrail-analytics-alarm-gen:24.1-r21.4.20240322210912 |
Apache License 2.0 |
contrail-analytics-api |
mirantis.azurecr.io/tungsten/contrail-analytics-api:24.1-r21.4.20240322210912 |
Apache License 2.0 |
contrail-analytics-collector |
mirantis.azurecr.io/tungsten/contrail-analytics-collector:24.1-r21.4.20240322210912 |
Apache License 2.0 |
contrail-analytics-query-engine |
mirantis.azurecr.io/tungsten/contrail-analytics-query-engine:24.1-r21.4.20240322210912 |
Apache License 2.0 |
contrail-analytics-snmp-collector |
mirantis.azurecr.io/tungsten/contrail-analytics-snmp-collector:24.1-r21.4.20240322210912 |
Apache License 2.0 |
contrail-analytics-snmp-topology |
mirantis.azurecr.io/tungsten/contrail-analytics-snmp-topology:24.1-r21.4.20240322210912 |
Apache License 2.0 |
contrail-controller-config-api |
mirantis.azurecr.io/tungsten/contrail-controller-config-api:24.1-r21.4.20240322210912 |
Apache License 2.0 |
contrail-controller-config-devicemgr |
mirantis.azurecr.io/tungsten/contrail-controller-config-devicemgr:24.1-r21.4.20240322210912 |
Apache License 2.0 |
contrail-controller-config-dnsmasq |
mirantis.azurecr.io/tungsten/contrail-controller-config-dnsmasq:24.1-r21.4.20240322210912 |
Apache License 2.0 |
contrail-controller-config-schema |
mirantis.azurecr.io/tungsten/contrail-controller-config-schema:24.1-r21.4.20240322210912 |
Apache License 2.0 |
contrail-controller-config-svcmonitor |
mirantis.azurecr.io/tungsten/contrail-controller-config-svcmonitor:24.1-r21.4.20240322210912 |
Apache License 2.0 |
contrail-controller-control-control |
mirantis.azurecr.io/tungsten/contrail-controller-control-control:24.1-r21.4.20240322210912 |
Apache License 2.0 |
contrail-controller-control-dns |
mirantis.azurecr.io/tungsten/contrail-controller-control-dns:24.1-r21.4.20240322210912 |
Apache License 2.0 |
contrail-controller-control-named |
mirantis.azurecr.io/tungsten/contrail-controller-control-named:24.1-r21.4.20240322210912 |
Apache License 2.0 |
contrail-controller-webui-job |
mirantis.azurecr.io/tungsten/contrail-controller-webui-job:24.1-r21.4.20240322210912 |
Apache License 2.0 |
contrail-controller-webui-web |
mirantis.azurecr.io/tungsten/contrail-controller-webui-web:24.1-r21.4.20240322210912 |
Apache License 2.0 |
contrail-node-init |
mirantis.azurecr.io/tungsten/contrail-node-init:21.4.20240118000000 |
Apache License 2.0 |
contrail-nodemgr |
mirantis.azurecr.io/tungsten/contrail-nodemgr:24.1-r21.4.20240322210912 |
Apache License 2.0 |
contrail-provisioner |
mirantis.azurecr.io/tungsten/contrail-provisioner:24.1-r21.4.20240322210912 |
Apache License 2.0 |
contrail-tools |
mirantis.azurecr.io/tungsten/contrail-tools:24.1-r21.4.20240322210912 |
Apache License 2.0 |
contrail-vrouter-agent |
mirantis.azurecr.io/tungsten/contrail-vrouter-agent:21.4.20240118000000 |
Apache License 2.0 |
contrail-vrouter-agent-dpdk |
mirantis.azurecr.io/tungsten/contrail-vrouter-agent-dpdk:21.4.20240118000000 |
Apache License 2.0 |
contrail-vrouter-kernel-build-init |
mirantis.azurecr.io/tungsten/contrail-vrouter-kernel-build-init:21.4.20240118000000 |
Apache License 2.0 |
MOSK 24.1.3 StackLight artifacts
Component |
Path |
License information for main executable programs |
|---|---|---|
Docker images |
||
prometheus-libvirt-exporter |
mirantis.azurecr.io/stacklight/prometheus-libvirt-exporter:v0.2-20240403023015 |
Mirantis Proprietary License |
tungstenfabric-prometheus-exporter |
mirantis.azurecr.io/stacklight/tungstenfabric-prometheus-exporter:0.1-20240119124301 |
Mirantis Proprietary License |
Helm charts |
||
fluentd |
https://binary.mirantis.com/stacklight/helm/fluentd-2.0.3-mcp-52.tgz |
Mirantis Proprietary License |
prometheus-libvirt-exporter |
https://binary.mirantis.com/stacklight/helm/prometheus-libvirt-exporter-0.2.0-mcp-7.tgz |
Mirantis Proprietary License |
prometheus-tungstenfabric-exporter |
https://binary.mirantis.com/stacklight/helm/prometheus-tungstenfabric-exporter-0.2.0-mcp-7.tgz |
Mirantis Proprietary License |
The table below includes the total number of addressed unique and common CVEs by MOSK-specific component since MOSK 24.1.2. The common CVEs are issues addressed across several images.
Product component |
CVE type |
Critical |
High |
Total |
|---|---|---|---|---|
OpenStack |
Unique |
0 |
4 |
4 |
Common |
0 |
4 |
4 |
|
Tungsten Fabric |
Unique |
0 |
1 |
1 |
Common |
0 |
4 |
4 |
Mirantis Security Portal
For the detailed list of fixed and present CVEs across the Mirantis Container Cloud and MOSK products, refer to Mirantis Security Portal.
Mirantis Container Cloud CVEs
For the number of fixed CVEs in the Mirantis Container Cloud-related components including kaas core, bare metal, Ceph, and StackLight, refer to Container Cloud 2.26.3: Security notes.
The following issues have been addressed in the MOSK 24.1.3 release:
[41810] Resolved the cluster update issue caused by the OpenStack controller flooding.
This section lists MOSK known issues with workarounds for the Mirantis OpenStack for Kubernetes release 24.1.3.
During MariaDB operations on a management cluster, Pods may get stuck in continuous restarts with the following example error:
[ERROR] WSREP: Corrupt buffer header: \
addr: 0x7faec6f8e518, \
seqno: 3185219421952815104, \
size: 909455917, \
ctx: 0x557094f65038, \
flags: 11577. store: 49, \
type: 49
Workaround:
Create a backup of the
/var/lib/mysqldirectory on themariadb-serverPod.Verify that other replicas are up and ready.
Remove the
galera.cachefile for the affectedmariadb-serverPod.Remove the affected
mariadb-serverPod or wait until it is automatically restarted.
After Kubernetes restarts the Pod, the Pod clones the database in 1-2 minutes and restores the quorum.
After provisioning the controller node, the etcd pod initiates before the Kubernetes networking is fully operational. As a result, the pod encounters difficulties resolving DNS and establishing connections with other members, ultimately leading to a panic state for the etcd service.
Workaround:
Delete the PVC related to the replaced controller node:
kubectl -n openstack delete pvc <PVC-NAME>
Delete pods related to the crashing etcd service on the replaced controller node:
kubectl -n openstack delete pods <ETCD-POD-NAME>
Due to the MetalLB upstream issue, a load balancer service may not obtain the external IP address.
The issue occurs when two services share the same external IP address and have
the same externalTrafficPolicy value. Initially, the services have the
external IP address assigned and are accessible. After modifying the
externalTrafficPolicy value for both services from Cluster to
Local, the first service that has been changed remains with no external IP
address assigned. Though, the second service, which was changed later, has the
external IP assigned as expected.
To work around the issue, make a dummy change to the service object where
external IP is <pending>:
Identify the service that is stuck:
kubectl get svc -A | grep pending
Example of system response:
stacklight iam-proxy-prometheus LoadBalancer 10.233.28.196 <pending> 443:30430/TCP
Add an arbitrary label to the service that is stuck. For example:
kubectl label svc -n stacklight iam-proxy-prometheus reconcile=1
Example of system response:
service/iam-proxy-prometheus labeledVerify that the external IP was allocated to the service:
kubectl get svc -n stacklight iam-proxy-prometheus
Example of system response:
NAME TYPE CLUSTER-IP EXTERNAL-IP PORT(S) AGE iam-proxy-prometheus LoadBalancer 10.233.28.196 10.0.34.108 443:30430/TCP 12d
Sometimes, after changing the OpenStackDeployment custom resource,
it does not transition to the APPLYING state as expected.
To work around the issue, restart the rockoon` pod in the osh-system
namespace.
Fixed in MOSK 24.2.1 Fixed in MOSK 24.3
After upgrading to OpenStack Antelope, clusters with configured trunk ports experience traffic flow disruptions that block the cluster updates.
To work around the issue, pin the MOSK Networking service (OpenStack Neutron) container image by adding the following content to the OpenStackDeployment custom resource:
spec:
services:
networking:
neutron:
values:
images:
tags:
neutron_openvswitch_agent: mirantis.azurecr.io/openstack/neutron:antelope-jammy-20240816113600
Caution
Remove the pinning after updating to MOSK 24.2.1 or later patch or major release.
After upgrade to OpenStack Antelope, the virtual machines experience connectivity disruptions when sending data over the virtual networks. Network packets with full MTU are dropped.
The issue affects the MOSK clusters with Open vSwitch as the networking backend and with the following specific MTU settings:
The MTU configured on the tunnel interface of compute nodes is equal to the value of the
spec:services:networking:neutron:values:conf:neutron:DEFAULT:global_physnet_mtuparameter of theOpenStackDeploymentcustom resource (if not specified, default is1500bytes).If the MTU of the tunnel interface is higher by at least 4 bytes, the cluster is not affected by the issue.
The cluster contains virtual machines that have the MTU of the network interfaces of the guest operating system larger than the MTU of the value of the
global_physnet_mtuparameter above minus 50 bytes.
To work around the issue, pin the MOSK Networking
service (OpenStack Neutron) container image by adding the following content
to the OpenStackDeployment custom resource:
spec:
services:
networking:
neutron:
values:
images:
tags:
neutron_openvswitch_agent: mirantis.azurecr.io/openstack/neutron:antelope-jammy-20240816113600
Caution
Remove the pinning after updating to MOSK 24.2.1 or later patch or major release.
Occasionally, RabbitMQ instances in tf-rabbitmq pods fail to enable
the tracking_records_in_ets during the initialization process.
To work around the problem, restart the affected pods manually.
Rebooting all Cassandra cluster TFConfig or TFAnalytics nodes, maintenance, or other circumstances that cause the Cassandra pods to start simultaneously may cause a broken Cassandra TFConfig and/or TFAnalytics cluster. In this case, Cassandra nodes do not join the ring and do not update the IPs of the neighbor nodes. As a result, the TF services cannot operate Cassandra cluster(s).
To verify that a Cassandra cluster is affected:
Run the nodetool status command specifying the config or
analytics cluster and the replica number:
kubectl -n tf exec -it tf-cassandra-<config/analytics>-dc1-rack1-<replica number> -c cassandra -- nodetool status
Example of system response with outdated IP addresses:
Datacenter: DC1
===============
Status=Up/Down
|/ State=Normal/Leaving/Joining/Moving
-- Address Load Tokens Owns (effective) Host ID Rack
DN <outdated ip> ? 256 64.9% a58343d0-1e3f-4d54-bcdf-9b9b949ca873 r1
DN <outdated ip> ? 256 69.8% 67f1d07c-8b13-4482-a2f1-77fa34e90d48 r1
Datacenter: dc1
===============
Status=Up/Down
|/ State=Normal/Leaving/Joining/Moving
-- Address Load Tokens Owns (effective) Host ID Rack
UN <actual ip> 3.84 GiB 256 65.2% 7324ebc4-577a-425f-b3de-96faac95a331 rack1
Workaround:
Manually delete the Cassandra pod from the failed config or analytics
cluster to re-initiate the bootstrap process for one of the Cassandra nodes:
kubectl -n tf delete pod tf-cassandra-<config/analytics>-dc1-rack1-<replica_num>
During major or patch update of a MOSK cluster with StackLight enabled in
non-HA mode, the KubePodsCrashLooping alert may be firing for the Grafana
ReplicaSet.
Grafana relies on PostgreSQL for persistent data. In non-HA StackLight setup,
PostgreSQL becomes temporarily unavailable during updates. If Grafana loses its
database connection or fails to establish one during startup, Grafana fails
with an error. This may cause the Grafana pod to enter the CrashLoopBackOff
state. Such behavior is expected in non-HA StackLight setups. The Grafana pod
will resume normal operation after PostgreSQL is restored.
To prevent the issue, deploy StackLight in HA mode.
The following table provides details on the impact of a MOSK cluster update to a patch release within the 24.1 series.
Note
For the detailed workflow of update to a patch release, refer to Update to a patch version.
Updated component |
Impact on cloud users |
Impact on cloud workloads |
|---|---|---|
OpenStack and Tungsten Fabric |
|
Open vSwitch networking - interruption of North-South connectivity, depending on the type of virtual routers used by a workload:
Tungsten Fabric networking - no impact |
Ceph |
~1% of read operations on object storage API may fail |
IO performance degradation for Ceph-backed virtual storage devices |
Host OS components |
No impact |
No impact |
- 0(1,2)
You can bypass updating components of the cloud data plane to avoid the network downtime during Update to a patch version. By using this technique, you accept the risk that some security fixes may not be applied.
For the list of enhancements and bug fixes that relate to Mirantis Container Cloud, refer to the Mirantis Container Cloud Release notes.
Learn more about the release cadence
24.1.4 patch
The patch release notes contain the description of product enhancements, the list of updated artifacts and Common Vulnerabilities and Exposures (CVE) fixes as well as description of the addressed product issues for the MOSK 24.1.4 patch.
Release date |
May 20, 2024 |
|---|---|
Scope |
Patch |
Cluster release |
17.1.4 |
OpenStack Operator |
0.15.16 |
Tungsten Fabric Operator |
0.14.9 |
This section lists the components artifacts of the MOSK 24.1.4 release that includes binaries, Docker images, and Helm charts.
MOSK 24.1.4 OpenStack Antelope binaries and Docker images
Component |
Path |
License information for main executable programs |
|---|---|---|
Binaries |
||
octavia-amphora |
https://binary.mirantis.com/openstack/bin/octavia/amphora-x64-haproxy-antelope-20240117112744.qcow2 |
Mirantis Proprietary License |
mirantis |
https://binary.mirantis.com/openstack/bin/horizon/mirantis-antelope-18a1377-20230817112356.tar.gz |
Mirantis Proprietary License |
kernel |
GPL-2.0 |
|
initramfs |
https://binary.mirantis.com/openstack/bin/ironic/tinyipa/tinyipa-stable-antelope-20231123060809.gz |
GPL-2.0 |
service-image |
https://binary.mirantis.com/openstack/bin/manila/manila-service-image-20221228132450.qcow2 |
Mirantis Proprietary License |
Docker images |
||
keystone |
mirantis.azurecr.io/openstack/keystone:antelope-jammy-20240502124148 |
Apache License 2.0 |
heat |
mirantis.azurecr.io/openstack/heat:antelope-jammy-20240502124148 |
Apache License 2.0 |
glance |
mirantis.azurecr.io/openstack/glance:antelope-jammy-20240502124148 |
Apache License 2.0 |
cinder |
mirantis.azurecr.io/openstack/cinder:antelope-jammy-20240502124148 |
Apache License 2.0 |
osprober |
mirantis.azurecr.io/openstack/extra/cloudprober:v0.13.2-20240131075124 |
Unknown |
neutron |
mirantis.azurecr.io/openstack/neutron:antelope-jammy-20240502124148 |
Apache License 2.0 |
nova |
mirantis.azurecr.io/openstack/nova:antelope-jammy-20240502124148 |
Apache License 2.0 |
horizon |
mirantis.azurecr.io/openstack/horizon:antelope-jammy-20240502124148 |
Apache License 2.0 |
tempest |
mirantis.azurecr.io/openstack/tempest:antelope-jammy-20240502124148 |
Apache License 2.0 |
octavia |
mirantis.azurecr.io/openstack/octavia:antelope-jammy-20240502124148 |
Apache License 2.0 |
designate |
mirantis.azurecr.io/openstack/designate:antelope-jammy-20240502124148 |
Apache License 2.0 |
ironic |
mirantis.azurecr.io/openstack/ironic:antelope-jammy-20240502124148 |
Apache License 2.0 |
barbican |
mirantis.azurecr.io/openstack/barbican:antelope-jammy-20240502124148 |
Apache License 2.0 |
libvirt |
mirantis.azurecr.io/general/libvirt:8.0.x-jammy-20240316092942 |
LGPL-2.1 License |
pause |
mirantis.azurecr.io/general/external/pause:3.1 |
Apache License 2.0 |
openvswitch |
mirantis.azurecr.io/general/openvswitch:2.17-jammy-20231018050930 |
Apache License 2.0 |
openvswitch-dpdk |
mirantis.azurecr.io/general/openvswitch-dpdk:2.17-jammy-20231018050930 |
Apache License 2.0 |
openstack-tools |
mirantis.azurecr.io/openstack/openstack-tools:yoga-jammy-20240502124148 |
Apache License 2.0 |
rabbitmq |
mirantis.azurecr.io/openstack/extra/rabbitmq:3.10.18-focal-20230222154055 |
Mozilla Public License 2.0 |
rabbitmq-management |
mirantis.azurecr.io/openstack/extra/rabbitmq-management:3.10.18-focal-20230222154055 |
Mozilla Public License 2.0 |
kubernetes-entrypoint |
mirantis.azurecr.io/openstack/extra/kubernetes-entrypoint:v1.0.1-ba8ada4-20240405150338 |
Apache License 2.0 |
memcached |
mirantis.azurecr.io/general/memcached:v1.6.23-alpine-20240131134844 |
BSD 3-Clause “New” or “Revised” License |
etcd |
mirantis.azurecr.io/openstack/extra/etcd:v3.5.11-alpine-20240131112547 |
Apache License 2.0 |
powerdns |
mirantis.azurecr.io/openstack/extra/powerdns:4.8-alpine-20240308161357 |
GPL-2.0 License |
nginx-ingress-controller |
mirantis.azurecr.io/openstack/extra/nginx-ingress-controller:1.10.0-alpine-20240305082401 |
Apache License 2.0 |
tls-proxy |
mirantis.azurecr.io/openstack/tls-proxy:focal-fipster-20230725114156 |
Mirantis Proprietary License |
defaultbackend |
mirantis.azurecr.io/openstack/extra/defaultbackend:v1.19.2-77af1ef-20220823043839 |
Apache License 2.0 |
mariadb |
mirantis.azurecr.io/general/mariadb:10.6.17-focal-20240327104027 |
GPLv2, LGPLv2.1 (client libraries) |
rabbitmq-exporter |
mirantis.azurecr.io/stacklight/rabbitmq-exporter:1.0.0-RC19 |
MIT License |
memcached-exporter |
mirantis.azurecr.io/stacklight/memcached-exporter:0-20231208095208 |
Apache License 2.0 |
prometheus-mysql-exporter |
mirantis.azurecr.io/stacklight/mysqld-exporter:v0.11.0 |
Apache License 2.0 |
aodh |
mirantis.azurecr.io/openstack/aodh:antelope-jammy-20240502124148 |
Apache License 2.0 |
ceilometer |
mirantis.azurecr.io/openstack/ceilometer:antelope-jammy-20240502124148 |
Apache License 2.0 |
gnocchi |
mirantis.azurecr.io/openstack/gnocchi:antelope-jammy-20240502124148 |
Apache License 2.0 |
redis |
mirantis.azurecr.io/openstack/extra/redis:7.2.4-alpine3.19-1 |
BSD 3-Clause “New” or “Revised” License |
redis-operator |
mirantis.azurecr.io/openstack/extra/redis-operator:v1.2.4-20240422155834 |
Unknown |
frr |
mirantis.azurecr.io/general/external/docker.io/frrouting/frr:v9.0.2-20240318063427 |
GPL-2.0 and LGPL-2.1 |
strongswan |
mirantis.azurecr.io/openstack/extra/strongswan:alpine-5.9.12-20240129155309 |
GPL-2.0 |
rsyslog |
mirantis.azurecr.io/openstack/extra/rsyslog:v8.2001.0-20231018050930 |
GNU General Public License v3 |
descheduler |
mirantis.azurecr.io/openstack/extra/descheduler:v0.29.0 |
Apache License 2.0 |
nginx |
mirantis.azurecr.io/openstack/extra/nginx:1.25.3-20240131112557 |
Apache License 2.0 |
requirements |
mirantis.azurecr.io/openstack/requirements:antelope-jammy-20240502124148 |
Apache License 2.0 |
stepler |
mirantis.azurecr.io/openstack/stepler:antelope-jammy-20240418091859 |
Apache License 2.0 |
placement |
mirantis.azurecr.io/openstack/placement:antelope-jammy-20240502124148 |
Apache License 2.0 |
masakari |
mirantis.azurecr.io/openstack/masakari:antelope-jammy-20240502124148 |
Apache License 2.0 |
masakari-monitors |
mirantis.azurecr.io/openstack/masakari-monitors:antelope-jammy-20240502124148 |
Apache License 2.0 |
ironic-inspector |
mirantis.azurecr.io/openstack/ironic-inspector:antelope-jammy-20240502124148 |
Apache License 2.0 |
manila |
mirantis.azurecr.io/openstack/manila:antelope-jammy-20240502124148 |
Apache License 2.0 |
MOSK 24.1.4 OpenStack Yoga binaries and Docker images
Component |
Path |
License information for main executable programs |
|---|---|---|
Binaries |
||
octavia-amphora |
https://binary.mirantis.com/openstack/bin/octavia/amphora-x64-haproxy-yoga-20240115150429.qcow2 |
Mirantis Proprietary License |
mirantis |
https://binary.mirantis.com/openstack/bin/horizon/mirantis-yoga-186584b-20230817112411.tar.gz |
Mirantis Proprietary License |
kernel |
https://binary.mirantis.com/openstack/bin/ironic/tinyipa/tinyipa-stable-yoga-20231004061110.vmlinuz |
GPL-2.0 |
initramfs |
https://binary.mirantis.com/openstack/bin/ironic/tinyipa/tinyipa-stable-yoga-20231004061110.gz |
GPL-2.0 |
service-image |
https://binary.mirantis.com/openstack/bin/manila/manila-service-image-20221228132450.qcow2 |
Mirantis Proprietary License |
Docker images |
||
keystone |
mirantis.azurecr.io/openstack/keystone:yoga-jammy-20240502124148 |
Apache License 2.0 |
heat |
mirantis.azurecr.io/openstack/heat:yoga-jammy-20240502124148 |
Apache License 2.0 |
glance |
mirantis.azurecr.io/openstack/glance:yoga-jammy-20240502124148 |
Apache License 2.0 |
cinder |
mirantis.azurecr.io/openstack/cinder:yoga-jammy-20240502124148 |
Apache License 2.0 |
osprober |
mirantis.azurecr.io/openstack/extra/cloudprober:v0.13.2-20240131075124 |
Unknown |
neutron |
mirantis.azurecr.io/openstack/neutron:yoga-jammy-20240502124148 |
Apache License 2.0 |
nova |
mirantis.azurecr.io/openstack/nova:yoga-jammy-20240502124148 |
Apache License 2.0 |
horizon |
mirantis.azurecr.io/openstack/horizon:yoga-jammy-20240502124148 |
Apache License 2.0 |
tempest |
mirantis.azurecr.io/openstack/tempest:yoga-jammy-20240502124148 |
Apache License 2.0 |
octavia |
mirantis.azurecr.io/openstack/octavia:yoga-jammy-20240502124148 |
Apache License 2.0 |
designate |
mirantis.azurecr.io/openstack/designate:yoga-jammy-20240502124148 |
Apache License 2.0 |
ironic |
mirantis.azurecr.io/openstack/ironic:yoga-jammy-20240502124148 |
Apache License 2.0 |
barbican |
mirantis.azurecr.io/openstack/barbican:yoga-jammy-20240502124148 |
Apache License 2.0 |
libvirt |
mirantis.azurecr.io/general/libvirt:8.0.x-jammy-20240316092942 |
LGPL-2.1 License |
pause |
mirantis.azurecr.io/general/external/pause:3.1 |
Apache License 2.0 |
openvswitch |
mirantis.azurecr.io/general/openvswitch:2.17-jammy-20231018050930 |
Apache License 2.0 |
openvswitch-dpdk |
mirantis.azurecr.io/general/openvswitch-dpdk:2.17-jammy-20231018050930 |
Apache License 2.0 |
openstack-tools |
mirantis.azurecr.io/openstack/openstack-tools:yoga-jammy-20240502124148 |
Apache License 2.0 |
rabbitmq |
mirantis.azurecr.io/openstack/extra/rabbitmq:3.10.18-focal-20230222154055 |
Mozilla Public License 2.0 |
rabbitmq-management |
mirantis.azurecr.io/openstack/extra/rabbitmq-management:3.10.18-focal-20230222154055 |
Mozilla Public License 2.0 |
kubernetes-entrypoint |
mirantis.azurecr.io/openstack/extra/kubernetes-entrypoint:v1.0.1-ba8ada4-20240405150338 |
Apache License 2.0 |
memcached |
mirantis.azurecr.io/general/memcached:v1.6.23-alpine-20240131134844 |
BSD 3-Clause “New” or “Revised” License |
etcd |
mirantis.azurecr.io/openstack/extra/etcd:v3.5.11-alpine-20240131112547 |
Apache License 2.0 |
powerdns |
mirantis.azurecr.io/openstack/extra/powerdns:4.8-alpine-20240308161357 |
GPL-2.0 License |
nginx-ingress-controller |
mirantis.azurecr.io/openstack/extra/nginx-ingress-controller:1.10.0-alpine-20240305082401 |
Apache License 2.0 |
tls-proxy |
mirantis.azurecr.io/openstack/tls-proxy:focal-fipster-20230725114156 |
Mirantis Proprietary License |
defaultbackend |
mirantis.azurecr.io/openstack/extra/defaultbackend:v1.19.2-77af1ef-20220823043839 |
Apache License 2.0 |
mariadb |
mirantis.azurecr.io/general/mariadb:10.6.17-focal-20240327104027 |
GPLv2, LGPLv2.1 (client libraries) |
rabbitmq-exporter |
mirantis.azurecr.io/stacklight/rabbitmq-exporter:1.0.0-RC19 |
MIT License |
memcached-exporter |
mirantis.azurecr.io/stacklight/memcached-exporter:0-20231208095208 |
Apache License 2.0 |
prometheus-mysql-exporter |
mirantis.azurecr.io/stacklight/mysqld-exporter:v0.11.0 |
Apache License 2.0 |
aodh |
mirantis.azurecr.io/openstack/aodh:yoga-jammy-20240502124148 |
Apache License 2.0 |
ceilometer |
mirantis.azurecr.io/openstack/ceilometer:yoga-jammy-20240502124148 |
Apache License 2.0 |
gnocchi |
mirantis.azurecr.io/openstack/gnocchi:yoga-jammy-20240502124148 |
Apache License 2.0 |
redis |
mirantis.azurecr.io/openstack/extra/redis:7.2.4-alpine3.19-1 |
BSD 3-Clause “New” or “Revised” License |
redis-operator |
mirantis.azurecr.io/openstack/extra/redis-operator:v1.2.4-20240422155834 |
Unknown |
frr |
mirantis.azurecr.io/general/external/docker.io/frrouting/frr:v9.0.2-20240318063427 |
GPL-2.0 and LGPL-2.1 |
strongswan |
mirantis.azurecr.io/openstack/extra/strongswan:alpine-5.9.12-20240129155309 |
GPL-2.0 |
rsyslog |
mirantis.azurecr.io/openstack/extra/rsyslog:v8.2001.0-20231018050930 |
GNU General Public License v3 |
descheduler |
mirantis.azurecr.io/openstack/extra/descheduler:v0.29.0 |
Apache License 2.0 |
nginx |
mirantis.azurecr.io/openstack/extra/nginx:1.25.3-20240131112557 |
Apache License 2.0 |
requirements |
mirantis.azurecr.io/openstack/requirements:yoga-jammy-20240502124148 |
Apache License 2.0 |
stepler |
mirantis.azurecr.io/openstack/stepler:yoga-focal-20240419160325 |
Apache License 2.0 |
placement |
mirantis.azurecr.io/openstack/placement:yoga-jammy-20240502124148 |
Apache License 2.0 |
masakari |
mirantis.azurecr.io/openstack/masakari:yoga-jammy-20240502124148 |
Apache License 2.0 |
masakari-monitors |
mirantis.azurecr.io/openstack/masakari-monitors:yoga-jammy-20240502124148 |
Apache License 2.0 |
ironic-inspector |
mirantis.azurecr.io/openstack/ironic-inspector:yoga-jammy-20240502124148 |
Apache License 2.0 |
manila |
mirantis.azurecr.io/openstack/manila:yoga-jammy-20240502124148 |
Apache License 2.0 |
MOSK 24.1.4 OpenStack Helm charts
MOSK 24.1.4 Tungsten Fabric 21.4 artifacts
Component |
Path |
License information for main executable programs |
|---|---|---|
Helm charts |
||
tungstenfabric-operator |
https://binary.mirantis.com/tungsten/helm/tungstenfabric-operator-0.14.9.tgz |
Mirantis Proprietary License |
Docker images |
||
tungstenfabric-operator |
mirantis.azurecr.io/tungsten-operator/tungstenfabric-operator:0.14.9 |
Mirantis Proprietary License |
tungsten-pytest |
mirantis.azurecr.io/tungsten/tungsten-pytest:0.1-20240425092454 |
MIT License |
casskop |
mirantis.azurecr.io/tungsten-operator/casskop:2.2.4 |
Apache License 2.0 |
cassandra-bootstrap |
mirantis.azurecr.io/tungsten/cassandra-bootstrap:0.1.15 |
Apache License 2.0 |
cassandra |
mirantis.azurecr.io/tungsten/cassandra:3.11.10-20230622 |
Apache License 2.0 |
cassandra-config-builder |
mirantis.azurecr.io/tungsten/cass-config-builder:v2-20240122114202 |
Apache License 2.0 |
kafka-k8s-operator |
mirantis.azurecr.io/tungsten-operator/kafka-k8s-operator:0.3.9 |
Mirantis Proprietary License |
cp-kafka |
mirantis.azurecr.io/tungsten/cp-kafka:7.5.3 |
Apache License 2.0 |
kafka-jmx-exporter |
mirantis.azurecr.io/stacklight/jmx-exporter:0.20.0-debian-12-r14 |
Apache License 2.0 |
rabbitmq-operator |
mirantis.azurecr.io/tungsten-operator/rabbitmq-operator:0.4.3 |
Mirantis Proprietary License |
rabbitmq |
mirantis.azurecr.io/tungsten/rabbitmq:3.11.16 |
Mozilla Public License 2.0 |
rabbitmq-exporter |
mirantis.azurecr.io/stacklight/rabbitmq-exporter:1.0.0-RC19 |
MIT License |
zookeeper-operator |
mirantis.azurecr.io/tungsten-operator/zookeeper-operator:0.2.21-mcp |
Apache License 2.0 |
zookeeper |
mirantis.azurecr.io/tungsten/zookeeper:3.8.4-20240315 |
Apache License 2.0 |
redis-operator |
mirantis.azurecr.io/tungsten-operator/redis-operator:0.4.3 |
Apache License 2.0 |
redis |
mirantis.azurecr.io/tungsten/redis:7.2.4-alpine3.19 |
BSD 3-Clause “New” or “Revised” License |
redis-exporter |
mirantis.azurecr.io/stacklight/redis_exporter:v1.45.0 |
BSD 3-Clause “New” or “Revised” License |
tf-cli |
mirantis.azurecr.io/tungsten/tf-cli:0.1-20240415181047 |
MIT License |
kubernetes-entrypoint |
mirantis.azurecr.io/openstack/extra/kubernetes-entrypoint:v1.0.1-ba8ada4-20240405150338 |
Apache License 2.0 |
pause |
mirantis.azurecr.io/general/external/pause:3.1 |
Apache License 2.0 |
tf-nodeinfo |
mirantis.azurecr.io/tungsten/tf-nodeinfo:0.1-20240415104417 |
MIT License |
contrail-analytics-alarm-gen |
mirantis.azurecr.io/tungsten/contrail-analytics-alarm-gen:24.1-r21.4.20240423151748 |
Apache License 2.0 |
contrail-analytics-api |
mirantis.azurecr.io/tungsten/contrail-analytics-api:24.1-r21.4.20240423151748 |
Apache License 2.0 |
contrail-analytics-collector |
mirantis.azurecr.io/tungsten/contrail-analytics-collector:24.1-r21.4.20240423151748 |
Apache License 2.0 |
contrail-analytics-query-engine |
mirantis.azurecr.io/tungsten/contrail-analytics-query-engine:24.1-r21.4.20240423151748 |
Apache License 2.0 |
contrail-analytics-snmp-collector |
mirantis.azurecr.io/tungsten/contrail-analytics-snmp-collector:24.1-r21.4.20240423151748 |
Apache License 2.0 |
contrail-analytics-snmp-topology |
mirantis.azurecr.io/tungsten/contrail-analytics-snmp-topology:24.1-r21.4.20240423151748 |
Apache License 2.0 |
contrail-controller-config-api |
mirantis.azurecr.io/tungsten/contrail-controller-config-api:24.1-r21.4.20240423151748 |
Apache License 2.0 |
contrail-controller-config-devicemgr |
mirantis.azurecr.io/tungsten/contrail-controller-config-devicemgr:24.1-r21.4.20240423151748 |
Apache License 2.0 |
contrail-controller-config-dnsmasq |
mirantis.azurecr.io/tungsten/contrail-controller-config-dnsmasq:24.1-r21.4.20240423151748 |
Apache License 2.0 |
contrail-controller-config-schema |
mirantis.azurecr.io/tungsten/contrail-controller-config-schema:24.1-r21.4.20240423151748 |
Apache License 2.0 |
contrail-controller-config-svcmonitor |
mirantis.azurecr.io/tungsten/contrail-controller-config-svcmonitor:24.1-r21.4.20240423151748 |
Apache License 2.0 |
contrail-controller-control-control |
mirantis.azurecr.io/tungsten/contrail-controller-control-control:24.1-r21.4.20240423151748 |
Apache License 2.0 |
contrail-controller-control-dns |
mirantis.azurecr.io/tungsten/contrail-controller-control-dns:24.1-r21.4.20240423151748 |
Apache License 2.0 |
contrail-controller-control-named |
mirantis.azurecr.io/tungsten/contrail-controller-control-named:24.1-r21.4.20240423151748 |
Apache License 2.0 |
contrail-controller-webui-job |
mirantis.azurecr.io/tungsten/contrail-controller-webui-job:24.1-r21.4.20240423151748 |
Apache License 2.0 |
contrail-controller-webui-web |
mirantis.azurecr.io/tungsten/contrail-controller-webui-web:24.1-r21.4.20240423151748 |
Apache License 2.0 |
contrail-node-init |
mirantis.azurecr.io/tungsten/contrail-node-init:21.4.20240118000000 |
Apache License 2.0 |
contrail-nodemgr |
mirantis.azurecr.io/tungsten/contrail-nodemgr:24.1-r21.4.20240423151748 |
Apache License 2.0 |
contrail-provisioner |
mirantis.azurecr.io/tungsten/contrail-provisioner:24.1-r21.4.20240423151748 |
Apache License 2.0 |
contrail-tools |
mirantis.azurecr.io/tungsten/contrail-tools:24.1-r21.4.20240423151748 |
Apache License 2.0 |
contrail-vrouter-agent |
mirantis.azurecr.io/tungsten/contrail-vrouter-agent:21.4.20240118000000 |
Apache License 2.0 |
contrail-vrouter-agent-dpdk |
mirantis.azurecr.io/tungsten/contrail-vrouter-agent-dpdk:21.4.20240118000000 |
Apache License 2.0 |
contrail-vrouter-kernel-build-init |
mirantis.azurecr.io/tungsten/contrail-vrouter-kernel-build-init:21.4.20240118000000 |
Apache License 2.0 |
MOSK 24.1.4 StackLight artifacts
Component |
Path |
License information for main executable programs |
|---|---|---|
Docker images |
||
prometheus-libvirt-exporter |
mirantis.azurecr.io/stacklight/prometheus-libvirt-exporter:v0.2-20240424023010 |
Mirantis Proprietary License |
tungstenfabric-prometheus-exporter |
mirantis.azurecr.io/stacklight/tungstenfabric-prometheus-exporter:0.1-20240119124301 |
Mirantis Proprietary License |
Helm charts |
||
fluentd |
https://binary.mirantis.com/stacklight/helm/fluentd-2.0.3-mcp-52.tgz |
Mirantis Proprietary License |
prometheus-libvirt-exporter |
https://binary.mirantis.com/stacklight/helm/prometheus-libvirt-exporter-0.2.0-mcp-7.tgz |
Mirantis Proprietary License |
prometheus-tungstenfabric-exporter |
https://binary.mirantis.com/stacklight/helm/prometheus-tungstenfabric-exporter-0.2.0-mcp-7.tgz |
Mirantis Proprietary License |
The table below includes the total number of addressed unique and common CVEs by MOSK-specific component compared to the previous patch release version. The common CVEs are issues addressed across several images.
Product component |
CVE type |
Critical |
High |
Total |
|---|---|---|---|---|
OpenStack |
Unique |
0 |
4 |
4 |
Common |
0 |
20 |
20 |
|
Tungsten Fabric |
Unique |
9 |
98 |
107 |
Common |
17 |
131 |
148 |
Mirantis Security Portal
For the detailed list of fixed and present CVEs across the Mirantis Container Cloud and MOSK products, refer to Mirantis Security Portal.
Mirantis Container Cloud CVEs
For the number of fixed CVEs in the Mirantis Container Cloud-related components including kaas core, bare metal, Ceph, and StackLight, refer to Container Cloud 2.26.4: Security notes.
The following issues have been addressed in the MOSK 24.1.4 release:
[40897] [Tungsten Fabric] Resolved the issue caused by absence of check for error 500 while checking the Tungsten Fabric services.
[41613] [Tungsten Fabric] Resolved the issue caused by incosistencies in the Database Management Tool (the
db_manage.pyscript) that checks, heals, and cleans up inconsistent database entries.[41784] [OpenStack] Resolved the issue caused by the missing dependency between FIP association and router interface addition to the subnet with a server.
This section lists MOSK known issues with workarounds for the Mirantis OpenStack for Kubernetes release 24.1.4.
During MariaDB operations on a management cluster, Pods may get stuck in continuous restarts with the following example error:
[ERROR] WSREP: Corrupt buffer header: \
addr: 0x7faec6f8e518, \
seqno: 3185219421952815104, \
size: 909455917, \
ctx: 0x557094f65038, \
flags: 11577. store: 49, \
type: 49
Workaround:
Create a backup of the
/var/lib/mysqldirectory on themariadb-serverPod.Verify that other replicas are up and ready.
Remove the
galera.cachefile for the affectedmariadb-serverPod.Remove the affected
mariadb-serverPod or wait until it is automatically restarted.
After Kubernetes restarts the Pod, the Pod clones the database in 1-2 minutes and restores the quorum.
After provisioning the controller node, the etcd pod initiates before the Kubernetes networking is fully operational. As a result, the pod encounters difficulties resolving DNS and establishing connections with other members, ultimately leading to a panic state for the etcd service.
Workaround:
Delete the PVC related to the replaced controller node:
kubectl -n openstack delete pvc <PVC-NAME>
Delete pods related to the crashing etcd service on the replaced controller node:
kubectl -n openstack delete pods <ETCD-POD-NAME>
Due to the MetalLB upstream issue, a load balancer service may not obtain the external IP address.
The issue occurs when two services share the same external IP address and have
the same externalTrafficPolicy value. Initially, the services have the
external IP address assigned and are accessible. After modifying the
externalTrafficPolicy value for both services from Cluster to
Local, the first service that has been changed remains with no external IP
address assigned. Though, the second service, which was changed later, has the
external IP assigned as expected.
To work around the issue, make a dummy change to the service object where
external IP is <pending>:
Identify the service that is stuck:
kubectl get svc -A | grep pending
Example of system response:
stacklight iam-proxy-prometheus LoadBalancer 10.233.28.196 <pending> 443:30430/TCP
Add an arbitrary label to the service that is stuck. For example:
kubectl label svc -n stacklight iam-proxy-prometheus reconcile=1
Example of system response:
service/iam-proxy-prometheus labeledVerify that the external IP was allocated to the service:
kubectl get svc -n stacklight iam-proxy-prometheus
Example of system response:
NAME TYPE CLUSTER-IP EXTERNAL-IP PORT(S) AGE iam-proxy-prometheus LoadBalancer 10.233.28.196 10.0.34.108 443:30430/TCP 12d
Sometimes, after changing the OpenStackDeployment custom resource,
it does not transition to the APPLYING state as expected.
To work around the issue, restart the rockoon` pod in the osh-system
namespace.
Fixed in MOSK 24.2.1 Fixed in MOSK 24.3
After upgrading to OpenStack Antelope, clusters with configured trunk ports experience traffic flow disruptions that block the cluster updates.
To work around the issue, pin the MOSK Networking service (OpenStack Neutron) container image by adding the following content to the OpenStackDeployment custom resource:
spec:
services:
networking:
neutron:
values:
images:
tags:
neutron_openvswitch_agent: mirantis.azurecr.io/openstack/neutron:antelope-jammy-20240816113600
Caution
Remove the pinning after updating to MOSK 24.2.1 or later patch or major release.
After upgrade to OpenStack Antelope, the virtual machines experience connectivity disruptions when sending data over the virtual networks. Network packets with full MTU are dropped.
The issue affects the MOSK clusters with Open vSwitch as the networking backend and with the following specific MTU settings:
The MTU configured on the tunnel interface of compute nodes is equal to the value of the
spec:services:networking:neutron:values:conf:neutron:DEFAULT:global_physnet_mtuparameter of theOpenStackDeploymentcustom resource (if not specified, default is1500bytes).If the MTU of the tunnel interface is higher by at least 4 bytes, the cluster is not affected by the issue.
The cluster contains virtual machines that have the MTU of the network interfaces of the guest operating system larger than the MTU of the value of the
global_physnet_mtuparameter above minus 50 bytes.
To work around the issue, pin the MOSK Networking
service (OpenStack Neutron) container image by adding the following content
to the OpenStackDeployment custom resource:
spec:
services:
networking:
neutron:
values:
images:
tags:
neutron_openvswitch_agent: mirantis.azurecr.io/openstack/neutron:antelope-jammy-20240816113600
Caution
Remove the pinning after updating to MOSK 24.2.1 or later patch or major release.
Occasionally, RabbitMQ instances in tf-rabbitmq pods fail to enable
the tracking_records_in_ets during the initialization process.
To work around the problem, restart the affected pods manually.
Rebooting all Cassandra cluster TFConfig or TFAnalytics nodes, maintenance, or other circumstances that cause the Cassandra pods to start simultaneously may cause a broken Cassandra TFConfig and/or TFAnalytics cluster. In this case, Cassandra nodes do not join the ring and do not update the IPs of the neighbor nodes. As a result, the TF services cannot operate Cassandra cluster(s).
To verify that a Cassandra cluster is affected:
Run the nodetool status command specifying the config or
analytics cluster and the replica number:
kubectl -n tf exec -it tf-cassandra-<config/analytics>-dc1-rack1-<replica number> -c cassandra -- nodetool status
Example of system response with outdated IP addresses:
Datacenter: DC1
===============
Status=Up/Down
|/ State=Normal/Leaving/Joining/Moving
-- Address Load Tokens Owns (effective) Host ID Rack
DN <outdated ip> ? 256 64.9% a58343d0-1e3f-4d54-bcdf-9b9b949ca873 r1
DN <outdated ip> ? 256 69.8% 67f1d07c-8b13-4482-a2f1-77fa34e90d48 r1
Datacenter: dc1
===============
Status=Up/Down
|/ State=Normal/Leaving/Joining/Moving
-- Address Load Tokens Owns (effective) Host ID Rack
UN <actual ip> 3.84 GiB 256 65.2% 7324ebc4-577a-425f-b3de-96faac95a331 rack1
Workaround:
Manually delete the Cassandra pod from the failed config or analytics
cluster to re-initiate the bootstrap process for one of the Cassandra nodes:
kubectl -n tf delete pod tf-cassandra-<config/analytics>-dc1-rack1-<replica_num>
During major or patch update of a MOSK cluster with StackLight enabled in
non-HA mode, the KubePodsCrashLooping alert may be firing for the Grafana
ReplicaSet.
Grafana relies on PostgreSQL for persistent data. In non-HA StackLight setup,
PostgreSQL becomes temporarily unavailable during updates. If Grafana loses its
database connection or fails to establish one during startup, Grafana fails
with an error. This may cause the Grafana pod to enter the CrashLoopBackOff
state. Such behavior is expected in non-HA StackLight setups. The Grafana pod
will resume normal operation after PostgreSQL is restored.
To prevent the issue, deploy StackLight in HA mode.
The following table provides details on the impact of a MOSK cluster update to a patch release within the 24.1 series.
Note
For the detailed workflow of update to a patch release, refer to Update to a patch version.
Updated component |
Impact on cloud users |
Impact on cloud workloads |
|---|---|---|
OpenStack and Tungsten Fabric |
|
Open vSwitch networking - interruption of North-South connectivity, depending on the type of virtual routers used by a workload:
Tungsten Fabric networking - no impact |
Ceph |
~1% of read operations on object storage API may fail |
IO performance degradation for Ceph-backed virtual storage devices |
Host OS components |
No impact |
No impact |
- 0(1,2)
You can bypass updating components of the cloud data plane to avoid the network downtime during Update to a patch version. By using this technique, you accept the risk that some security fixes may not be applied.
The MOSK 24.1.4 patch provides the following updates:
Support for MKE 3.7.8
Update of minor kernel version from
5.15.0-102-genericto5.15.0-105-genericSecurity fixes for CVEs in images
Resolved product issues
For the list of enhancements and bug fixes that relate to Mirantis Container Cloud, refer to the Mirantis Container Cloud Release notes.
Learn more about the release cadence
24.1.5 patch
The patch release notes contain the description of product enhancements, the list of updated artifacts and Common Vulnerabilities and Exposures (CVE) fixes as well as description of the addressed product issues for the MOSK 24.1.5 patch:
Release date |
June 18, 2024 |
|---|---|
Scope |
Patch |
Cluster release |
17.1.5 |
OpenStack Operator |
0.15.20 |
Tungsten Fabric Operator |
0.14.10 |
The MOSK 24.1.5 patch provides the following updates:
Update of minor kernel version from
5.15.0-105-genericto5.15.0-107-genericSecurity fixes for CVEs in images
Resolved product issues
For the list of enhancements and bug fixes that relate to Mirantis Container Cloud, refer to the Mirantis Container Cloud Release notes.
Learn more about the release cadence
This section lists the components artifacts of the MOSK 24.1.5 release that includes binaries, Docker images, and Helm charts.
MOSK 24.1.5 OpenStack Antelope binaries and Docker images
Component |
Path |
License information for main executable programs |
|---|---|---|
Binaries |
||
octavia-amphora |
https://binary.mirantis.com/openstack/bin/octavia/amphora-x64-haproxy-antelope-20240117112744.qcow2 |
Mirantis Proprietary License |
mirantis |
https://binary.mirantis.com/openstack/bin/horizon/mirantis-antelope-18a1377-20230817112356.tar.gz |
Mirantis Proprietary License |
kernel |
GPL-2.0 |
|
initramfs |
https://binary.mirantis.com/openstack/bin/ironic/tinyipa/tinyipa-stable-antelope-20231123060809.gz |
GPL-2.0 |
service-image |
https://binary.mirantis.com/openstack/bin/manila/manila-service-image-20221228132450.qcow2 |
Mirantis Proprietary License |
Docker images |
||
keystone |
mirantis.azurecr.io/openstack/keystone:antelope-jammy-20240522120643 |
Apache License 2.0 |
heat |
mirantis.azurecr.io/openstack/heat:antelope-jammy-20240522120643 |
Apache License 2.0 |
glance |
mirantis.azurecr.io/openstack/glance:antelope-jammy-20240522120643 |
Apache License 2.0 |
cinder |
mirantis.azurecr.io/openstack/cinder:antelope-jammy-20240522120643 |
Apache License 2.0 |
osprober |
mirantis.azurecr.io/openstack/extra/cloudprober:v0.13.2-20240131075124 |
Unknown |
neutron |
mirantis.azurecr.io/openstack/neutron:antelope-jammy-20240522120643 |
Apache License 2.0 |
nova |
mirantis.azurecr.io/openstack/nova:antelope-jammy-20240522120643 |
Apache License 2.0 |
horizon |
mirantis.azurecr.io/openstack/horizon:antelope-jammy-20240522120643 |
Apache License 2.0 |
tempest |
mirantis.azurecr.io/openstack/tempest:antelope-jammy-20240522120643 |
Apache License 2.0 |
octavia |
mirantis.azurecr.io/openstack/octavia:antelope-jammy-20240522120643 |
Apache License 2.0 |
designate |
mirantis.azurecr.io/openstack/designate:antelope-jammy-20240522120643 |
Apache License 2.0 |
ironic |
mirantis.azurecr.io/openstack/ironic:antelope-jammy-20240522120643 |
Apache License 2.0 |
barbican |
mirantis.azurecr.io/openstack/barbican:antelope-jammy-20240522120643 |
Apache License 2.0 |
libvirt |
mirantis.azurecr.io/general/libvirt:8.0.x-jammy-20240507155140 |
LGPL-2.1 License |
pause |
mirantis.azurecr.io/general/external/pause:3.1 |
Apache License 2.0 |
openvswitch |
mirantis.azurecr.io/general/openvswitch:2.17-jammy-20231018050930 |
Apache License 2.0 |
openvswitch-dpdk |
mirantis.azurecr.io/general/openvswitch-dpdk:2.17-jammy-20231018050930 |
Apache License 2.0 |
openstack-tools |
mirantis.azurecr.io/openstack/openstack-tools:yoga-jammy-20240522120640 |
Apache License 2.0 |
rabbitmq |
mirantis.azurecr.io/openstack/extra/rabbitmq:3.10.18-focal-20230222154055 |
Mozilla Public License 2.0 |
rabbitmq-management |
mirantis.azurecr.io/openstack/extra/rabbitmq-management:3.10.18-focal-20230222154055 |
Mozilla Public License 2.0 |
kubernetes-entrypoint |
mirantis.azurecr.io/openstack/extra/kubernetes-entrypoint:v1.0.1-ba8ada4-20240405150338 |
Apache License 2.0 |
memcached |
mirantis.azurecr.io/general/memcached:v1.6.23-alpine-20240131134844 |
BSD 3-Clause “New” or “Revised” License |
etcd |
mirantis.azurecr.io/openstack/extra/etcd:v3.5.11-alpine-20240131112547 |
Apache License 2.0 |
powerdns |
mirantis.azurecr.io/openstack/extra/powerdns:4.8-alpine-20240308161357 |
GPL-2.0 License |
nginx-ingress-controller |
mirantis.azurecr.io/openstack/extra/nginx-ingress-controller:1.10.1-alpine-20240424084259 |
Apache License 2.0 |
tls-proxy |
mirantis.azurecr.io/openstack/tls-proxy:focal-fipster-20230725114156 |
Mirantis Proprietary License |
defaultbackend |
mirantis.azurecr.io/openstack/extra/defaultbackend:v1.19.2-77af1ef-20220823043839 |
Apache License 2.0 |
mariadb |
mirantis.azurecr.io/general/mariadb:10.6.17-focal-20240523075821 |
GPLv2, LGPLv2.1 (client libraries) |
rabbitmq-exporter |
mirantis.azurecr.io/stacklight/rabbitmq-exporter:1.0.0-RC19 |
MIT License |
memcached-exporter |
mirantis.azurecr.io/stacklight/memcached-exporter:0-20231208095208 |
Apache License 2.0 |
prometheus-mysql-exporter |
mirantis.azurecr.io/stacklight/mysqld-exporter:v0.11.0 |
Apache License 2.0 |
aodh |
mirantis.azurecr.io/openstack/aodh:antelope-jammy-20240522120643 |
Apache License 2.0 |
ceilometer |
mirantis.azurecr.io/openstack/ceilometer:antelope-jammy-20240522120643 |
Apache License 2.0 |
gnocchi |
mirantis.azurecr.io/openstack/gnocchi:antelope-jammy-20240522120643 |
Apache License 2.0 |
redis |
mirantis.azurecr.io/openstack/extra/redis:7.2.4-alpine3.19-1 |
BSD 3-Clause “New” or “Revised” License |
redis-operator |
mirantis.azurecr.io/openstack/extra/redis-operator:v1.2.4-20240427152750 |
Unknown |
frr |
mirantis.azurecr.io/general/external/docker.io/frrouting/frr:v9.0.2-20240318063427 |
GPL-2.0 and LGPL-2.1 |
strongswan |
mirantis.azurecr.io/openstack/extra/strongswan:alpine-5.9.12-20240129155309 |
GPL-2.0 |
rsyslog |
mirantis.azurecr.io/openstack/extra/rsyslog:v8.2001.0-20231018050930 |
GNU General Public License v3 |
descheduler |
mirantis.azurecr.io/openstack/extra/descheduler:v0.29.0 |
Apache License 2.0 |
nginx |
mirantis.azurecr.io/openstack/extra/nginx:1.25.3-20240131112557 |
Apache License 2.0 |
requirements |
mirantis.azurecr.io/openstack/requirements:antelope-jammy-20240522120643 |
Apache License 2.0 |
drb-controller |
mirantis.azurecr.io/openstack/extra/drb-controller:0.1.0-20240522142810 |
Mirantis Proprietary License |
stepler |
mirantis.azurecr.io/openstack/stepler:antelope-jammy-20240522142159 |
Apache License 2.0 |
placement |
mirantis.azurecr.io/openstack/placement:antelope-jammy-20240522120643 |
Apache License 2.0 |
masakari |
mirantis.azurecr.io/openstack/masakari:antelope-jammy-20240522120643 |
Apache License 2.0 |
masakari-monitors |
mirantis.azurecr.io/openstack/masakari-monitors:antelope-jammy-20240522120643 |
Apache License 2.0 |
ironic-inspector |
mirantis.azurecr.io/openstack/ironic-inspector:antelope-jammy-20240522120643 |
Apache License 2.0 |
manila |
mirantis.azurecr.io/openstack/manila:antelope-jammy-20240522120643 |
Apache License 2.0 |
MOSK 24.1.5 OpenStack Yoga binaries and Docker images
Component |
Path |
License information for main executable programs |
|---|---|---|
Binaries |
||
octavia-amphora |
https://binary.mirantis.com/openstack/bin/octavia/amphora-x64-haproxy-yoga-20240115150429.qcow2 |
Mirantis Proprietary License |
mirantis |
https://binary.mirantis.com/openstack/bin/horizon/mirantis-yoga-186584b-20230817112411.tar.gz |
Mirantis Proprietary License |
kernel |
https://binary.mirantis.com/openstack/bin/ironic/tinyipa/tinyipa-stable-yoga-20231004061110.vmlinuz |
GPL-2.0 |
initramfs |
https://binary.mirantis.com/openstack/bin/ironic/tinyipa/tinyipa-stable-yoga-20231004061110.gz |
GPL-2.0 |
service-image |
https://binary.mirantis.com/openstack/bin/manila/manila-service-image-20221228132450.qcow2 |
Mirantis Proprietary License |
Docker images |
||
keystone |
mirantis.azurecr.io/openstack/keystone:yoga-jammy-20240522120640 |
Apache License 2.0 |
heat |
mirantis.azurecr.io/openstack/heat:yoga-jammy-20240522120640 |
Apache License 2.0 |
glance |
mirantis.azurecr.io/openstack/glance:yoga-jammy-20240522120640 |
Apache License 2.0 |
cinder |
mirantis.azurecr.io/openstack/cinder:yoga-jammy-20240522120640 |
Apache License 2.0 |
osprober |
mirantis.azurecr.io/openstack/extra/cloudprober:v0.13.2-20240131075124 |
Unknown |
neutron |
mirantis.azurecr.io/openstack/neutron:yoga-jammy-20240522120640 |
Apache License 2.0 |
nova |
mirantis.azurecr.io/openstack/nova:yoga-jammy-20240522120640 |
Apache License 2.0 |
horizon |
mirantis.azurecr.io/openstack/horizon:yoga-jammy-20240522120640 |
Apache License 2.0 |
tempest |
mirantis.azurecr.io/openstack/tempest:yoga-jammy-20240522120640 |
Apache License 2.0 |
octavia |
mirantis.azurecr.io/openstack/octavia:yoga-jammy-20240522120640 |
Apache License 2.0 |
designate |
mirantis.azurecr.io/openstack/designate:yoga-jammy-20240522120640 |
Apache License 2.0 |
ironic |
mirantis.azurecr.io/openstack/ironic:yoga-jammy-20240522120640 |
Apache License 2.0 |
barbican |
mirantis.azurecr.io/openstack/barbican:yoga-jammy-20240522120640 |
Apache License 2.0 |
libvirt |
mirantis.azurecr.io/general/libvirt:8.0.x-jammy-20240507155140 |
LGPL-2.1 License |
pause |
mirantis.azurecr.io/general/external/pause:3.1 |
Apache License 2.0 |
openvswitch |
mirantis.azurecr.io/general/openvswitch:2.17-jammy-20231018050930 |
Apache License 2.0 |
openvswitch-dpdk |
mirantis.azurecr.io/general/openvswitch-dpdk:2.17-jammy-20231018050930 |
Apache License 2.0 |
openstack-tools |
mirantis.azurecr.io/openstack/openstack-tools:yoga-jammy-20240522120640 |
Apache License 2.0 |
rabbitmq |
mirantis.azurecr.io/openstack/extra/rabbitmq:3.10.18-focal-20230222154055 |
Mozilla Public License 2.0 |
rabbitmq-management |
mirantis.azurecr.io/openstack/extra/rabbitmq-management:3.10.18-focal-20230222154055 |
Mozilla Public License 2.0 |
kubernetes-entrypoint |
mirantis.azurecr.io/openstack/extra/kubernetes-entrypoint:v1.0.1-ba8ada4-20240405150338 |
Apache License 2.0 |
memcached |
mirantis.azurecr.io/general/memcached:v1.6.23-alpine-20240131134844 |
BSD 3-Clause “New” or “Revised” License |
etcd |
mirantis.azurecr.io/openstack/extra/etcd:v3.5.11-alpine-20240131112547 |
Apache License 2.0 |
powerdns |
mirantis.azurecr.io/openstack/extra/powerdns:4.8-alpine-20240308161357 |
GPL-2.0 License |
nginx-ingress-controller |
mirantis.azurecr.io/openstack/extra/nginx-ingress-controller:1.10.1-alpine-20240424084259 |
Apache License 2.0 |
tls-proxy |
mirantis.azurecr.io/openstack/tls-proxy:focal-fipster-20230725114156 |
Mirantis Proprietary License |
defaultbackend |
mirantis.azurecr.io/openstack/extra/defaultbackend:v1.19.2-77af1ef-20220823043839 |
Apache License 2.0 |
mariadb |
mirantis.azurecr.io/general/mariadb:10.6.17-focal-20240523075821 |
GPLv2, LGPLv2.1 (client libraries) |
rabbitmq-exporter |
mirantis.azurecr.io/stacklight/rabbitmq-exporter:1.0.0-RC19 |
MIT License |
memcached-exporter |
mirantis.azurecr.io/stacklight/memcached-exporter:0-20231208095208 |
Apache License 2.0 |
prometheus-mysql-exporter |
mirantis.azurecr.io/stacklight/mysqld-exporter:v0.11.0 |
Apache License 2.0 |
aodh |
mirantis.azurecr.io/openstack/aodh:yoga-jammy-20240522120640 |
Apache License 2.0 |
ceilometer |
mirantis.azurecr.io/openstack/ceilometer:yoga-jammy-20240522120640 |
Apache License 2.0 |
gnocchi |
mirantis.azurecr.io/openstack/gnocchi:yoga-jammy-20240522120640 |
Apache License 2.0 |
redis |
mirantis.azurecr.io/openstack/extra/redis:7.2.4-alpine3.19-1 |
BSD 3-Clause “New” or “Revised” License |
redis-operator |
mirantis.azurecr.io/openstack/extra/redis-operator:v1.2.4-20240427152750 |
Unknown |
frr |
mirantis.azurecr.io/general/external/docker.io/frrouting/frr:v9.0.2-20240318063427 |
GPL-2.0 and LGPL-2.1 |
strongswan |
mirantis.azurecr.io/openstack/extra/strongswan:alpine-5.9.12-20240129155309 |
GPL-2.0 |
rsyslog |
mirantis.azurecr.io/openstack/extra/rsyslog:v8.2001.0-20231018050930 |
GNU General Public License v3 |
descheduler |
mirantis.azurecr.io/openstack/extra/descheduler:v0.29.0 |
Apache License 2.0 |
nginx |
mirantis.azurecr.io/openstack/extra/nginx:1.25.3-20240131112557 |
Apache License 2.0 |
requirements |
mirantis.azurecr.io/openstack/requirements:yoga-jammy-20240522120640 |
Apache License 2.0 |
drb-controller |
mirantis.azurecr.io/openstack/extra/drb-controller:0.1.0-20240522142810 |
Mirantis Proprietary License |
stepler |
mirantis.azurecr.io/openstack/stepler:yoga-focal-20240419160325 |
Apache License 2.0 |
placement |
mirantis.azurecr.io/openstack/placement:yoga-jammy-20240522120640 |
Apache License 2.0 |
masakari |
mirantis.azurecr.io/openstack/masakari:yoga-jammy-20240522120640 |
Apache License 2.0 |
masakari-monitors |
mirantis.azurecr.io/openstack/masakari-monitors:yoga-jammy-20240522120640 |
Apache License 2.0 |
ironic-inspector |
mirantis.azurecr.io/openstack/ironic-inspector:yoga-jammy-20240522120640 |
Apache License 2.0 |
manila |
mirantis.azurecr.io/openstack/manila:yoga-jammy-20240522120640 |
Apache License 2.0 |
MOSK 24.1.5 OpenStack Helm charts
MOSK 24.1.5 Tungsten Fabric 21.4 artifacts
Component |
Path |
License information for main executable programs |
|---|---|---|
Helm charts |
||
tungstenfabric-operator |
https://binary.mirantis.com/tungsten/helm/tungstenfabric-operator-0.14.10.tgz |
Mirantis Proprietary License |
Docker images |
||
tungstenfabric-operator |
mirantis.azurecr.io/tungsten-operator/tungstenfabric-operator:0.14.10 |
Mirantis Proprietary License |
tungsten-pytest |
mirantis.azurecr.io/tungsten/tungsten-pytest:0.1-20240514103153 |
MIT License |
casskop |
mirantis.azurecr.io/tungsten-operator/casskop:2.2.4 |
Apache License 2.0 |
cassandra-bootstrap |
mirantis.azurecr.io/tungsten/cassandra-bootstrap:0.1.15 |
Apache License 2.0 |
cassandra |
mirantis.azurecr.io/tungsten/cassandra:3.11.10-20230622 |
Apache License 2.0 |
cassandra-config-builder |
mirantis.azurecr.io/tungsten/cass-config-builder:v2-20240508173904 |
Apache License 2.0 |
kafka-k8s-operator |
mirantis.azurecr.io/tungsten-operator/kafka-k8s-operator:0.3.9 |
Mirantis Proprietary License |
cp-kafka |
mirantis.azurecr.io/tungsten/cp-kafka:7.5.3 |
Apache License 2.0 |
kafka-jmx-exporter |
mirantis.azurecr.io/stacklight/jmx-exporter:0.20.0-debian-12-r14 |
Apache License 2.0 |
rabbitmq-operator |
mirantis.azurecr.io/tungsten-operator/rabbitmq-operator:0.4.3 |
Mirantis Proprietary License |
rabbitmq |
mirantis.azurecr.io/tungsten/rabbitmq:3.11.16 |
Mozilla Public License 2.0 |
rabbitmq-exporter |
mirantis.azurecr.io/stacklight/rabbitmq-exporter:1.0.0-RC19 |
MIT License |
zookeeper-operator |
mirantis.azurecr.io/tungsten-operator/zookeeper-operator:0.2.21-mcp |
Apache License 2.0 |
zookeeper |
mirantis.azurecr.io/tungsten/zookeeper:3.8.4-20240315 |
Apache License 2.0 |
redis-operator |
mirantis.azurecr.io/tungsten-operator/redis-operator:0.4.3 |
Apache License 2.0 |
redis |
mirantis.azurecr.io/tungsten/redis:7.2.4-alpine3.19 |
BSD 3-Clause “New” or “Revised” License |
redis-exporter |
mirantis.azurecr.io/stacklight/redis_exporter:v1.45.0 |
BSD 3-Clause “New” or “Revised” License |
tf-cli |
mirantis.azurecr.io/tungsten/tf-cli:0.1-20240514103649 |
MIT License |
kubernetes-entrypoint |
mirantis.azurecr.io/openstack/extra/kubernetes-entrypoint:v1.0.1-ba8ada4-20240405150338 |
Apache License 2.0 |
pause |
mirantis.azurecr.io/general/external/pause:3.1 |
Apache License 2.0 |
tf-nodeinfo |
mirantis.azurecr.io/tungsten/tf-nodeinfo:0.1-20240415104417 |
MIT License |
contrail-analytics-alarm-gen |
mirantis.azurecr.io/tungsten/contrail-analytics-alarm-gen:24.1-r21.4.20240423151748 |
Apache License 2.0 |
contrail-analytics-api |
mirantis.azurecr.io/tungsten/contrail-analytics-api:24.1-r21.4.20240423151748 |
Apache License 2.0 |
contrail-analytics-collector |
mirantis.azurecr.io/tungsten/contrail-analytics-collector:24.1-r21.4.20240423151748 |
Apache License 2.0 |
contrail-analytics-query-engine |
mirantis.azurecr.io/tungsten/contrail-analytics-query-engine:24.1-r21.4.20240423151748 |
Apache License 2.0 |
contrail-analytics-snmp-collector |
mirantis.azurecr.io/tungsten/contrail-analytics-snmp-collector:24.1-r21.4.20240423151748 |
Apache License 2.0 |
contrail-analytics-snmp-topology |
mirantis.azurecr.io/tungsten/contrail-analytics-snmp-topology:24.1-r21.4.20240423151748 |
Apache License 2.0 |
contrail-controller-config-api |
mirantis.azurecr.io/tungsten/contrail-controller-config-api:24.1-r21.4.20240423151748 |
Apache License 2.0 |
contrail-controller-config-devicemgr |
mirantis.azurecr.io/tungsten/contrail-controller-config-devicemgr:24.1-r21.4.20240423151748 |
Apache License 2.0 |
contrail-controller-config-dnsmasq |
mirantis.azurecr.io/tungsten/contrail-controller-config-dnsmasq:24.1-r21.4.20240423151748 |
Apache License 2.0 |
contrail-controller-config-schema |
mirantis.azurecr.io/tungsten/contrail-controller-config-schema:24.1-r21.4.20240423151748 |
Apache License 2.0 |
contrail-controller-config-svcmonitor |
mirantis.azurecr.io/tungsten/contrail-controller-config-svcmonitor:24.1-r21.4.20240423151748 |
Apache License 2.0 |
contrail-controller-control-control |
mirantis.azurecr.io/tungsten/contrail-controller-control-control:24.1-r21.4.20240423151748 |
Apache License 2.0 |
contrail-controller-control-dns |
mirantis.azurecr.io/tungsten/contrail-controller-control-dns:24.1-r21.4.20240423151748 |
Apache License 2.0 |
contrail-controller-control-named |
mirantis.azurecr.io/tungsten/contrail-controller-control-named:24.1-r21.4.20240423151748 |
Apache License 2.0 |
contrail-controller-webui-job |
mirantis.azurecr.io/tungsten/contrail-controller-webui-job:24.1-r21.4.20240423151748 |
Apache License 2.0 |
contrail-controller-webui-web |
mirantis.azurecr.io/tungsten/contrail-controller-webui-web:24.1-r21.4.20240423151748 |
Apache License 2.0 |
contrail-node-init |
mirantis.azurecr.io/tungsten/contrail-node-init:21.4.20240118000000 |
Apache License 2.0 |
contrail-nodemgr |
mirantis.azurecr.io/tungsten/contrail-nodemgr:24.1-r21.4.20240423151748 |
Apache License 2.0 |
contrail-provisioner |
mirantis.azurecr.io/tungsten/contrail-provisioner:24.1-r21.4.20240423151748 |
Apache License 2.0 |
contrail-tools |
mirantis.azurecr.io/tungsten/contrail-tools:24.1-r21.4.20240423151748 |
Apache License 2.0 |
contrail-vrouter-agent |
mirantis.azurecr.io/tungsten/contrail-vrouter-agent:21.4.20240118000000 |
Apache License 2.0 |
contrail-vrouter-agent-dpdk |
mirantis.azurecr.io/tungsten/contrail-vrouter-agent-dpdk:21.4.20240118000000 |
Apache License 2.0 |
contrail-vrouter-kernel-build-init |
mirantis.azurecr.io/tungsten/contrail-vrouter-kernel-build-init:21.4.20240118000000 |
Apache License 2.0 |
MOSK 24.1.5 StackLight artifacts
Component |
Path |
License information for main executable programs |
|---|---|---|
Docker images |
||
prometheus-libvirt-exporter |
mirantis.azurecr.io/stacklight/prometheus-libvirt-exporter:v0.2-20240515023010 |
Mirantis Proprietary License |
tungstenfabric-prometheus-exporter |
mirantis.azurecr.io/stacklight/tungstenfabric-prometheus-exporter:0.1-20240119124301 |
Mirantis Proprietary License |
Helm charts |
||
fluentd |
https://binary.mirantis.com/stacklight/helm/fluentd-2.0.3-mcp-52.tgz |
Mirantis Proprietary License |
prometheus-libvirt-exporter |
https://binary.mirantis.com/stacklight/helm/prometheus-libvirt-exporter-0.2.0-mcp-7.tgz |
Mirantis Proprietary License |
prometheus-tungstenfabric-exporter |
https://binary.mirantis.com/stacklight/helm/prometheus-tungstenfabric-exporter-0.2.0-mcp-7.tgz |
Mirantis Proprietary License |
The table below includes the total number of addressed unique and common CVEs by MOSK-specific component compared to the previous patch release version. The common CVEs are issues addressed across several images.
Product component |
CVE type |
Critical |
High |
Total |
|---|---|---|---|---|
OpenStack |
Unique |
0 |
5 |
5 |
Common |
0 |
26 |
26 |
|
Tungsten Fabric |
Unique |
3 |
19 |
22 |
Common |
3 |
27 |
30 |
Mirantis Security Portal
For the detailed list of fixed and present CVEs across the Mirantis Container Cloud and MOSK products, refer to Mirantis Security Portal.
Mirantis Container Cloud CVEs
For the number of fixed CVEs in the Mirantis Container Cloud-related components including kaas core, bare metal, Ceph, and StackLight, refer to Container Cloud 2.26.5: Security notes.
The following issues have been addressed in the MOSK 24.1.5 release:
[42375] [OpenStack] Resolved the issue with the OpenStack Controller releasing more
NodeWorkloadLockobjects than allowed during creation of concurrentNodeMaintenanceRequestobjects.
This section lists MOSK known issues with workarounds for the Mirantis OpenStack for Kubernetes release 24.1.5.
During MariaDB operations on a management cluster, Pods may get stuck in continuous restarts with the following example error:
[ERROR] WSREP: Corrupt buffer header: \
addr: 0x7faec6f8e518, \
seqno: 3185219421952815104, \
size: 909455917, \
ctx: 0x557094f65038, \
flags: 11577. store: 49, \
type: 49
Workaround:
Create a backup of the
/var/lib/mysqldirectory on themariadb-serverPod.Verify that other replicas are up and ready.
Remove the
galera.cachefile for the affectedmariadb-serverPod.Remove the affected
mariadb-serverPod or wait until it is automatically restarted.
After Kubernetes restarts the Pod, the Pod clones the database in 1-2 minutes and restores the quorum.
After provisioning the controller node, the etcd pod initiates before the Kubernetes networking is fully operational. As a result, the pod encounters difficulties resolving DNS and establishing connections with other members, ultimately leading to a panic state for the etcd service.
Workaround:
Delete the PVC related to the replaced controller node:
kubectl -n openstack delete pvc <PVC-NAME>
Delete pods related to the crashing etcd service on the replaced controller node:
kubectl -n openstack delete pods <ETCD-POD-NAME>
Due to the MetalLB upstream issue, a load balancer service may not obtain the external IP address.
The issue occurs when two services share the same external IP address and have
the same externalTrafficPolicy value. Initially, the services have the
external IP address assigned and are accessible. After modifying the
externalTrafficPolicy value for both services from Cluster to
Local, the first service that has been changed remains with no external IP
address assigned. Though, the second service, which was changed later, has the
external IP assigned as expected.
To work around the issue, make a dummy change to the service object where
external IP is <pending>:
Identify the service that is stuck:
kubectl get svc -A | grep pending
Example of system response:
stacklight iam-proxy-prometheus LoadBalancer 10.233.28.196 <pending> 443:30430/TCP
Add an arbitrary label to the service that is stuck. For example:
kubectl label svc -n stacklight iam-proxy-prometheus reconcile=1
Example of system response:
service/iam-proxy-prometheus labeledVerify that the external IP was allocated to the service:
kubectl get svc -n stacklight iam-proxy-prometheus
Example of system response:
NAME TYPE CLUSTER-IP EXTERNAL-IP PORT(S) AGE iam-proxy-prometheus LoadBalancer 10.233.28.196 10.0.34.108 443:30430/TCP 12d
Sometimes, after changing the OpenStackDeployment custom resource,
it does not transition to the APPLYING state as expected.
To work around the issue, restart the rockoon` pod in the osh-system
namespace.
Fixed in MOSK 24.2.1 Fixed in MOSK 24.3
After upgrading to OpenStack Antelope, clusters with configured trunk ports experience traffic flow disruptions that block the cluster updates.
To work around the issue, pin the MOSK Networking service (OpenStack Neutron) container image by adding the following content to the OpenStackDeployment custom resource:
spec:
services:
networking:
neutron:
values:
images:
tags:
neutron_openvswitch_agent: mirantis.azurecr.io/openstack/neutron:antelope-jammy-20240816113600
Caution
Remove the pinning after updating to MOSK 24.2.1 or later patch or major release.
After upgrade to OpenStack Antelope, the virtual machines experience connectivity disruptions when sending data over the virtual networks. Network packets with full MTU are dropped.
The issue affects the MOSK clusters with Open vSwitch as the networking backend and with the following specific MTU settings:
The MTU configured on the tunnel interface of compute nodes is equal to the value of the
spec:services:networking:neutron:values:conf:neutron:DEFAULT:global_physnet_mtuparameter of theOpenStackDeploymentcustom resource (if not specified, default is1500bytes).If the MTU of the tunnel interface is higher by at least 4 bytes, the cluster is not affected by the issue.
The cluster contains virtual machines that have the MTU of the network interfaces of the guest operating system larger than the MTU of the value of the
global_physnet_mtuparameter above minus 50 bytes.
To work around the issue, pin the MOSK Networking
service (OpenStack Neutron) container image by adding the following content
to the OpenStackDeployment custom resource:
spec:
services:
networking:
neutron:
values:
images:
tags:
neutron_openvswitch_agent: mirantis.azurecr.io/openstack/neutron:antelope-jammy-20240816113600
Caution
Remove the pinning after updating to MOSK 24.2.1 or later patch or major release.
Rebooting all Cassandra cluster TFConfig or TFAnalytics nodes, maintenance, or other circumstances that cause the Cassandra pods to start simultaneously may cause a broken Cassandra TFConfig and/or TFAnalytics cluster. In this case, Cassandra nodes do not join the ring and do not update the IPs of the neighbor nodes. As a result, the TF services cannot operate Cassandra cluster(s).
To verify that a Cassandra cluster is affected:
Run the nodetool status command specifying the config or
analytics cluster and the replica number:
kubectl -n tf exec -it tf-cassandra-<config/analytics>-dc1-rack1-<replica number> -c cassandra -- nodetool status
Example of system response with outdated IP addresses:
Datacenter: DC1
===============
Status=Up/Down
|/ State=Normal/Leaving/Joining/Moving
-- Address Load Tokens Owns (effective) Host ID Rack
DN <outdated ip> ? 256 64.9% a58343d0-1e3f-4d54-bcdf-9b9b949ca873 r1
DN <outdated ip> ? 256 69.8% 67f1d07c-8b13-4482-a2f1-77fa34e90d48 r1
Datacenter: dc1
===============
Status=Up/Down
|/ State=Normal/Leaving/Joining/Moving
-- Address Load Tokens Owns (effective) Host ID Rack
UN <actual ip> 3.84 GiB 256 65.2% 7324ebc4-577a-425f-b3de-96faac95a331 rack1
Workaround:
Manually delete the Cassandra pod from the failed config or analytics
cluster to re-initiate the bootstrap process for one of the Cassandra nodes:
kubectl -n tf delete pod tf-cassandra-<config/analytics>-dc1-rack1-<replica_num>
Occasionally, RabbitMQ instances in tf-rabbitmq pods fail to enable
the tracking_records_in_ets during the initialization process.
To work around the problem, restart the affected pods manually.
After replacing a failed Tungsten Fabric controller node as described in Replace a failed TF controller node, the first restart of the Cassandra pod on this node may cause an issue if the Cassandra node with the outdated IP address has not been removed from the cluster. Subsequent Cassandra pod restarts should not trigger this problem.
To verify if your Cassandra cluster is affected, run the nodetool status command specifying the config or analytics cluster and the replica number:
kubectl -n tf exec -it tf-cassandra-<CONFIG-OR-ANALYTICS>-dc1-rack1-<REPLICA-NUM> -c cassandra -- nodetool status
Example of the system response with outdated IP addresses:
Datacenter: dc1
===============
Status=Up/Down
|/ State=Normal/Leaving/Joining/Moving
-- Address Load Tokens Owns Host ID Rack
UN 192.168.201.144 509.43 KiB 256 ? 7e760a99-fae5-4921-b0c5-d9e6e1eca1c5 rack1
UN 192.168.50.146 534.18 KiB 256 ? 2248ea35-85d4-4887-820b-1fac4733021f rack1
UN 192.168.145.147 484.19 KiB 256 ? d988aaaa-44ae-4fec-a617-0b0a253e736d rack1
DN 192.168.145.144 481.53 KiB 256 ? c23703a1-6854-47a7-a4a2-af649d63af0c rack1
An extra node will appear in the cluster with an outdated IP address
(the IP of the terminated Cassandra pod) in the Down state.
To work around the issue, after replacing the Tungsten Fabric controller node, delete the Cassandra pod on the replaced node and remove the outdated node from the Cassandra cluster using nodetool:
kubectl -n tf exec -it tf-cassandra-<CONFIG-OR-ANALYTICS>-dc1-rack1-<REPLICA-NUM> -c cassandra -- nodetool removenode <HOST-ID>
In rare cases, when ceph-controller cannot confirm the existence of
MOSK pools, instead of denying action and raising errors,
it proceeds to recreate the Cinder Ceph client. Such behavior may
potentially cause issues with OpenStack workloads.
Workaround:
In
spec.cephClusterSpecof theKaaSCephClustercustom resource, remove theexternalsection.Wait for the Not all mgrs are running: 1/2 message to disappear from the
KaaSCephClusterstatus.Verify that the
novaCeph client that is integrated to MOSK has the same keyring as in the Ceph cluster.Keyring verification for the Ceph
novaclientCompare the keyring used in the
nova-computeandlibvirtpods with the one from the Ceph cluster:kubectl -n openstack get pod | grep nova-compute kubectl -n openstack exec -it <nova-compute-pod-name> -- cat /etc/ceph/ceph.client.nova.keyring kubectl -n openstack get pod | grep libvirt kubectl -n openstack exec -it <libvirt-pod-name> -- cat /etc/ceph/ceph.client.nova.keyring kubectl -n rook-ceph exec -it deploy/rook-ceph-tools -- ceph auth get client.nova
If the keyring differs, change the one stored in Ceph cluster with the key from the OpenStack pods:
kubectl -n rook-ceph exec -it deploy/rook-ceph-tools -- bash ceph auth get client.nova -o /tmp/nova.key vi /tmp/nova.key # in the editor, change "key" value to the key obtained from the OpenStack pods # then save and exit editing ceph auth import -i /tmp/nova.key
Verify that the
client.novakeyring of the Ceph cluster matches the one obtained from the OpenStack pods:kubectl -n rook-ceph exec -it deploy/rook-ceph-tools -- ceph auth get client.nova
Verify that
nova-computeandlibvirtpods have access to the Ceph cluster:kubectl -n openstack get pod | grep nova-compute kubectl -n openstack exec -it <nova-compute-pod-name> -- ceph -s -n client.nova kubectl -n openstack get pod | grep libvirt kubectl -n openstack exec -it <libvirt-pod-name> -- ceph -s -n client.nova
Verify that the
cinderCeph client integrated to MOSK has the same keyring as in the Ceph cluster:Keyring verification for the Ceph
cinderclientCompare the keyring used in the
cinder-volumepods with the one from the Ceph cluster.kubectl -n openstack get pod | grep cinder-volume kubectl -n openstack exec -it <cinder-volume-pod-name> -- cat /etc/ceph/ceph.client.cinder.keyring kubectl -n rook-ceph exec -it deploy/rook-ceph-tools -- ceph auth get client.cinder
If the keyring differs, change the one stored in Ceph cluster with the key from the OpenStack pods:
kubectl -n rook-ceph exec -it deploy/rook-ceph-tools -- bash ceph auth get client.cinder -o /tmp/cinder.key vi /tmp/cinder.key # in the editor, change "key" value to the key obtained from the OpenStack pods # then save and exit editing ceph auth import -i /tmp/cinder.key
Verify that the
client.cinderkeyring of the Ceph cluster matches the one obtained from the OpenStack pods:kubectl -n rook-ceph exec -it deploy/rook-ceph-tools -- ceph auth get client.cinder
Verify that the
cinder-volumepods have access to the Ceph cluster:kubectl -n openstack get pod | grep cinder-volume kubectl -n openstack exec -it <cinder-volume-pod-name> -- ceph -s -n client.cinder
Verify that the
glanceCeph client integrated to MOSK has the same keyring as in the Ceph cluster.Keyring verification for the Ceph
glanceclientCompare the keyring used in the
glance-apipods with the one from the Ceph cluster:kubectl -n openstack get pod | grep glance-api kubectl -n openstack exec -it <glance-api-pod-name> -- cat /etc/ceph/ceph.client.glance.keyring kubectl -n rook-ceph exec -it deploy/rook-ceph-tools -- ceph auth get client.glance
If the keyring differs, change the one stored in Ceph cluster with the key from the OpenStack pods:
kubectl -n rook-ceph exec -it deploy/rook-ceph-tools -- bash ceph auth get client.glance -o /tmp/glance.key vi /tmp/glance.key # in the editor, change "key" value to the key obtained from the OpenStack pods # then save and exit editing ceph auth import -i /tmp/glance.key
Verify that the
client.glancekeyring of the Ceph cluster matches the one obtained from the OpenStack pods:kubectl -n rook-ceph exec -it deploy/rook-ceph-tools -- ceph auth get client.glance
Verify that the
glance-apipods have access to the Ceph cluster:kubectl -n openstack get pod | grep glance-api kubectl -n openstack exec -it <glance-api-pod-name> -- ceph -s -n client.glance
During major or patch update of a MOSK cluster with StackLight enabled in
non-HA mode, the KubePodsCrashLooping alert may be firing for the Grafana
ReplicaSet.
Grafana relies on PostgreSQL for persistent data. In non-HA StackLight setup,
PostgreSQL becomes temporarily unavailable during updates. If Grafana loses its
database connection or fails to establish one during startup, Grafana fails
with an error. This may cause the Grafana pod to enter the CrashLoopBackOff
state. Such behavior is expected in non-HA StackLight setups. The Grafana pod
will resume normal operation after PostgreSQL is restored.
To prevent the issue, deploy StackLight in HA mode.
The following table provides details on the impact of a MOSK cluster update to a patch release within the 24.1 series.
Note
For the detailed workflow of update to a patch release, refer to Update to a patch version.
Updated component |
Impact on cloud users |
Impact on cloud workloads |
|---|---|---|
OpenStack and Tungsten Fabric |
|
Open vSwitch networking - interruption of North-South connectivity, depending on the type of virtual routers used by a workload:
Tungsten Fabric networking - no impact |
Ceph |
~1% of read operations on object storage API may fail |
IO performance degradation for Ceph-backed virtual storage devices |
Host OS components |
No impact |
No impact |
- 0(1,2)
You can bypass updating components of the cloud data plane to avoid the network downtime during Update to a patch version. By using this technique, you accept the risk that some security fixes may not be applied.
To improve user update experience and make the update path more flexible, MOSK is introducing a new scheme of updating between cluster releases. More specifically, MOSK intends to ultimately provide a possibility to update to any newer patch version within single series at any point of time. The patch version downgrade is not supported.
Though, in some cases, Mirantis may request to update to some specific patch version in the series to be able to update to the next major series. This may be necessary due to the specifics of technical content already released or planned for the release.
Note
The management cluster update scheme remains the same. A management cluster obtains the new product version automatically after release.
For the possible update paths for the current and upcoming product versions refer to MOSK cluster update schema.
Learn more
24.1.6 patch
The patch release notes contain the description of product enhancements, the list of updated artifacts and Common Vulnerabilities and Exposures (CVE) fixes as well as description of the addressed product issues for the MOSK 24.1.6 patch:
Release date |
July 16, 2024 |
|---|---|
Scope |
Patch |
Cluster release |
17.1.6 |
OpenStack Operator |
0.15.21 |
Tungsten Fabric Operator |
0.14.12 |
The MOSK 24.1.6 patch provides the following updates:
Support for MKE 3.7.10
Update of minor kernel version from
5.15.0-107-genericto5.15.0-113-genericSecurity fixes for CVEs in images
Resolved product issues
For the list of enhancements and bug fixes that relate to Mirantis Container Cloud, refer to the Mirantis Container Cloud Release notes.
Learn more about the release cadence
This section lists the components artifacts of the MOSK 24.1.6 release that includes binaries, Docker images, and Helm charts.
MOSK 24.1.6 OpenStack Antelope binaries and Docker images
Component |
Path |
License information for main executable programs |
|---|---|---|
Binaries |
||
octavia-amphora |
https://binary.mirantis.com/openstack/bin/octavia/amphora-x64-haproxy-antelope-20240117112744.qcow2 |
Mirantis Proprietary License |
mirantis |
https://binary.mirantis.com/openstack/bin/horizon/mirantis-antelope-18a1377-20230817112356.tar.gz |
Mirantis Proprietary License |
kernel |
GPL-2.0 |
|
initramfs |
https://binary.mirantis.com/openstack/bin/ironic/tinyipa/tinyipa-stable-antelope-20231123060809.gz |
GPL-2.0 |
service-image |
https://binary.mirantis.com/openstack/bin/manila/manila-service-image-20221228132450.qcow2 |
Mirantis Proprietary License |
Docker images |
||
keystone |
mirantis.azurecr.io/openstack/keystone:antelope-jammy-20240625145417 |
Apache License 2.0 |
heat |
mirantis.azurecr.io/openstack/heat:antelope-jammy-20240625145417 |
Apache License 2.0 |
glance |
mirantis.azurecr.io/openstack/glance:antelope-jammy-20240625145417 |
Apache License 2.0 |
cinder |
mirantis.azurecr.io/openstack/cinder:antelope-jammy-20240625145417 |
Apache License 2.0 |
cloudprober |
mirantis.azurecr.io/openstack/extra/cloudprober:v0.13.2-20240131075124 |
Apache License 2.0 |
neutron |
mirantis.azurecr.io/openstack/neutron:antelope-jammy-20240625145417 |
Apache License 2.0 |
nova |
mirantis.azurecr.io/openstack/nova:antelope-jammy-20240625145417 |
Apache License 2.0 |
horizon |
mirantis.azurecr.io/openstack/horizon:antelope-jammy-20240625145417 |
Apache License 2.0 |
tempest |
mirantis.azurecr.io/openstack/tempest:antelope-jammy-20240625145417 |
Apache License 2.0 |
octavia |
mirantis.azurecr.io/openstack/octavia:antelope-jammy-20240625145417 |
Apache License 2.0 |
designate |
mirantis.azurecr.io/openstack/designate:antelope-jammy-20240625145417 |
Apache License 2.0 |
ironic |
mirantis.azurecr.io/openstack/ironic:antelope-jammy-20240625145417 |
Apache License 2.0 |
barbican |
mirantis.azurecr.io/openstack/barbican:antelope-jammy-20240625145417 |
Apache License 2.0 |
libvirt |
mirantis.azurecr.io/general/libvirt:8.0.x-jammy-20240507155140 |
LGPL-2.1 License |
pause |
mirantis.azurecr.io/general/external/pause:3.1 |
Apache License 2.0 |
openvswitch |
mirantis.azurecr.io/general/openvswitch:2.17-jammy-20231018050930 |
Apache License 2.0 |
openvswitch-dpdk |
mirantis.azurecr.io/general/openvswitch-dpdk:2.17-jammy-20231018050930 |
Apache License 2.0 |
openstack-tools |
mirantis.azurecr.io/openstack/openstack-tools:yoga-jammy-20240625145417 |
Apache License 2.0 |
rabbitmq-3.10.x |
mirantis.azurecr.io/openstack/extra/rabbitmq:3.10.18-focal-20230222154055 |
Mozilla Public License 2.0 |
rabbitmq-3.10.x-management |
mirantis.azurecr.io/openstack/extra/rabbitmq-management:3.10.18-focal-20230222154055 |
Mozilla Public License 2.0 |
kubernetes-entrypoint |
mirantis.azurecr.io/openstack/extra/kubernetes-entrypoint:v1.0.1-ba8ada4-20240405150338 |
Apache License 2.0 |
memcached |
mirantis.azurecr.io/general/memcached:v1.6.23-alpine-20240131134844 |
BSD 3-Clause “New” or “Revised” License |
etcd |
mirantis.azurecr.io/openstack/extra/etcd:v3.5.11-alpine-20240131112547 |
Apache License 2.0 |
powerdns |
mirantis.azurecr.io/openstack/extra/powerdns:4.8-alpine-20240308161357 |
GPL-2.0 License |
nginx-ingress-controller |
mirantis.azurecr.io/openstack/extra/nginx-ingress-controller:1.10.1-alpine-20240424084259 |
Apache License 2.0 |
tls-proxy |
mirantis.azurecr.io/openstack/tls-proxy:focal-fipster-20230725114156 |
Mirantis Proprietary License |
defaultbackend |
mirantis.azurecr.io/openstack/extra/defaultbackend:v1.19.2-77af1ef-20220823043839 |
Apache License 2.0 |
mariadb |
mirantis.azurecr.io/general/mariadb:10.6.17-focal-20240523075821 |
GPLv2, LGPLv2.1 (client libraries) |
rabbitmq-exporter |
mirantis.azurecr.io/stacklight/rabbitmq-exporter:1.0.0-RC19 |
MIT License |
memcached-exporter |
mirantis.azurecr.io/stacklight/memcached-exporter:0-20231208095208 |
Apache License 2.0 |
prometheus-mysql-exporter |
mirantis.azurecr.io/stacklight/mysqld-exporter:v0.11.0 |
Apache License 2.0 |
aodh |
mirantis.azurecr.io/openstack/aodh:antelope-jammy-20240625145417 |
Apache License 2.0 |
ceilometer |
mirantis.azurecr.io/openstack/ceilometer:antelope-jammy-20240625145417 |
Apache License 2.0 |
gnocchi |
mirantis.azurecr.io/openstack/gnocchi:antelope-jammy-20240625145417 |
Apache License 2.0 |
redis |
mirantis.azurecr.io/openstack/extra/redis:7.2.4-alpine3.19-1 |
BSD 3-Clause “New” or “Revised” License |
redis-operator |
mirantis.azurecr.io/openstack/extra/redis-operator:v1.2.4-20240427152750 |
Apache License 2.0 |
frr |
mirantis.azurecr.io/general/external/docker.io/frrouting/frr:v9.0.2-20240318063427 |
GPL-2.0 and LGPL-2.1 |
strongswan |
mirantis.azurecr.io/openstack/extra/strongswan:alpine-5.9.12-20240129155309 |
GPL-2.0 |
rsyslog |
mirantis.azurecr.io/openstack/extra/rsyslog:v8.2001.0-20231018050930 |
GNU General Public License v3 |
descheduler |
mirantis.azurecr.io/openstack/extra/descheduler:v0.29.0 |
Apache License 2.0 |
nginx |
mirantis.azurecr.io/openstack/extra/nginx:1.25.3-20240131112557 |
Apache License 2.0 |
requirements |
mirantis.azurecr.io/openstack/requirements:antelope-jammy-20240625145417 |
Apache License 2.0 |
stepler |
mirantis.azurecr.io/openstack/stepler:antelope-jammy-20240611060850 |
Apache License 2.0 |
placement |
mirantis.azurecr.io/openstack/placement:antelope-jammy-20240625145417 |
Apache License 2.0 |
masakari |
mirantis.azurecr.io/openstack/masakari:antelope-jammy-20240625145417 |
Apache License 2.0 |
masakari-monitors |
mirantis.azurecr.io/openstack/masakari-monitors:antelope-jammy-20240625145417 |
Apache License 2.0 |
ironic-inspector |
mirantis.azurecr.io/openstack/ironic-inspector:antelope-jammy-20240625145417 |
Apache License 2.0 |
manila |
mirantis.azurecr.io/openstack/manila:antelope-jammy-20240625145417 |
Apache License 2.0 |
MOSK 24.1.6 OpenStack Yoga binaries and Docker images
Component |
Path |
License information for main executable programs |
|---|---|---|
Binaries |
||
octavia-amphora |
https://binary.mirantis.com/openstack/bin/octavia/amphora-x64-haproxy-yoga-20240115150429.qcow2 |
Mirantis Proprietary License |
mirantis |
https://binary.mirantis.com/openstack/bin/horizon/mirantis-yoga-186584b-20230817112411.tar.gz |
Mirantis Proprietary License |
kernel |
https://binary.mirantis.com/openstack/bin/ironic/tinyipa/tinyipa-stable-yoga-20231004061110.vmlinuz |
GPL-2.0 |
initramfs |
https://binary.mirantis.com/openstack/bin/ironic/tinyipa/tinyipa-stable-yoga-20231004061110.gz |
GPL-2.0 |
service-image |
https://binary.mirantis.com/openstack/bin/manila/manila-service-image-20221228132450.qcow2 |
Mirantis Proprietary License |
Docker images |
||
keystone |
mirantis.azurecr.io/openstack/keystone:yoga-jammy-20240625145417 |
Apache License 2.0 |
heat |
mirantis.azurecr.io/openstack/heat:yoga-jammy-20240625145417 |
Apache License 2.0 |
glance |
mirantis.azurecr.io/openstack/glance:yoga-jammy-20240625145417 |
Apache License 2.0 |
cinder |
mirantis.azurecr.io/openstack/cinder:yoga-jammy-20240625145417 |
Apache License 2.0 |
cloudprober |
mirantis.azurecr.io/openstack/extra/cloudprober:v0.13.2-20240131075124 |
Apache License 2.0 |
neutron |
mirantis.azurecr.io/openstack/neutron:yoga-jammy-20240625145417 |
Apache License 2.0 |
nova |
mirantis.azurecr.io/openstack/nova:yoga-jammy-20240625145417 |
Apache License 2.0 |
horizon |
mirantis.azurecr.io/openstack/horizon:yoga-jammy-20240625145417 |
Apache License 2.0 |
tempest |
mirantis.azurecr.io/openstack/tempest:yoga-jammy-20240625145417 |
Apache License 2.0 |
octavia |
mirantis.azurecr.io/openstack/octavia:yoga-jammy-20240625145417 |
Apache License 2.0 |
designate |
mirantis.azurecr.io/openstack/designate:yoga-jammy-20240625145417 |
Apache License 2.0 |
ironic |
mirantis.azurecr.io/openstack/ironic:yoga-jammy-20240625145417 |
Apache License 2.0 |
barbican |
mirantis.azurecr.io/openstack/barbican:yoga-jammy-20240625145417 |
Apache License 2.0 |
libvirt |
mirantis.azurecr.io/general/libvirt:8.0.x-jammy-20240507155140 |
LGPL-2.1 License |
pause |
mirantis.azurecr.io/general/external/pause:3.1 |
Apache License 2.0 |
openvswitch |
mirantis.azurecr.io/general/openvswitch:2.17-jammy-20231018050930 |
Apache License 2.0 |
openvswitch-dpdk |
mirantis.azurecr.io/general/openvswitch-dpdk:2.17-jammy-20231018050930 |
Apache License 2.0 |
openstack-tools |
mirantis.azurecr.io/openstack/openstack-tools:yoga-jammy-20240625145417 |
Apache License 2.0 |
rabbitmq-3.10.x |
mirantis.azurecr.io/openstack/extra/rabbitmq:3.10.18-focal-20230222154055 |
Mozilla Public License 2.0 |
rabbitmq-3.10.x-management |
mirantis.azurecr.io/openstack/extra/rabbitmq-management:3.10.18-focal-20230222154055 |
Mozilla Public License 2.0 |
kubernetes-entrypoint |
mirantis.azurecr.io/openstack/extra/kubernetes-entrypoint:v1.0.1-ba8ada4-20240405150338 |
Apache License 2.0 |
memcached |
mirantis.azurecr.io/general/memcached:v1.6.23-alpine-20240131134844 |
BSD 3-Clause “New” or “Revised” License |
etcd |
mirantis.azurecr.io/openstack/extra/etcd:v3.5.11-alpine-20240131112547 |
Apache License 2.0 |
powerdns |
mirantis.azurecr.io/openstack/extra/powerdns:4.8-alpine-20240308161357 |
GPL-2.0 License |
nginx-ingress-controller |
mirantis.azurecr.io/openstack/extra/nginx-ingress-controller:1.10.1-alpine-20240424084259 |
Apache License 2.0 |
tls-proxy |
mirantis.azurecr.io/openstack/tls-proxy:focal-fipster-20230725114156 |
Mirantis Proprietary License |
defaultbackend |
mirantis.azurecr.io/openstack/extra/defaultbackend:v1.19.2-77af1ef-20220823043839 |
Apache License 2.0 |
mariadb |
mirantis.azurecr.io/general/mariadb:10.6.17-focal-20240523075821 |
GPLv2, LGPLv2.1 (client libraries) |
rabbitmq-exporter |
mirantis.azurecr.io/stacklight/rabbitmq-exporter:1.0.0-RC19 |
MIT License |
memcached-exporter |
mirantis.azurecr.io/stacklight/memcached-exporter:0-20231208095208 |
Apache License 2.0 |
prometheus-mysql-exporter |
mirantis.azurecr.io/stacklight/mysqld-exporter:v0.11.0 |
Apache License 2.0 |
aodh |
mirantis.azurecr.io/openstack/aodh:yoga-jammy-20240625145417 |
Apache License 2.0 |
ceilometer |
mirantis.azurecr.io/openstack/ceilometer:yoga-jammy-20240625145417 |
Apache License 2.0 |
gnocchi |
mirantis.azurecr.io/openstack/gnocchi:yoga-jammy-20240625145417 |
Apache License 2.0 |
redis |
mirantis.azurecr.io/openstack/extra/redis:7.2.4-alpine3.19-1 |
BSD 3-Clause “New” or “Revised” License |
redis-operator |
mirantis.azurecr.io/openstack/extra/redis-operator:v1.2.4-20240427152750 |
Apache License 2.0 |
frr |
mirantis.azurecr.io/general/external/docker.io/frrouting/frr:v9.0.2-20240318063427 |
GPL-2.0 and LGPL-2.1 |
strongswan |
mirantis.azurecr.io/openstack/extra/strongswan:alpine-5.9.12-20240129155309 |
GPL-2.0 |
rsyslog |
mirantis.azurecr.io/openstack/extra/rsyslog:v8.2001.0-20231018050930 |
GNU General Public License v3 |
descheduler |
mirantis.azurecr.io/openstack/extra/descheduler:v0.29.0 |
Apache License 2.0 |
nginx |
mirantis.azurecr.io/openstack/extra/nginx:1.25.3-20240131112557 |
Apache License 2.0 |
requirements |
mirantis.azurecr.io/openstack/requirements:yoga-jammy-20240625145417 |
Apache License 2.0 |
stepler |
mirantis.azurecr.io/openstack/stepler:yoga-focal-20240610161716 |
Apache License 2.0 |
placement |
mirantis.azurecr.io/openstack/placement:yoga-jammy-20240625145417 |
Apache License 2.0 |
masakari |
mirantis.azurecr.io/openstack/masakari:yoga-jammy-20240625145417 |
Apache License 2.0 |
masakari-monitors |
mirantis.azurecr.io/openstack/masakari-monitors:yoga-jammy-20240625145417 |
Apache License 2.0 |
ironic-inspector |
mirantis.azurecr.io/openstack/ironic-inspector:yoga-jammy-20240625145417 |
Apache License 2.0 |
manila |
mirantis.azurecr.io/openstack/manila:yoga-jammy-20240625145417 |
Apache License 2.0 |
MOSK 24.1.6 OpenStack Helm charts
MOSK 24.1.6 Tungsten Fabric 21.4 artifacts
Component |
Path |
License information for main executable programs |
|---|---|---|
Helm charts |
||
tungstenfabric-operator |
https://binary.mirantis.com/tungsten/helm/tungstenfabric-operator-0.14.12.tgz |
Mirantis Proprietary License |
Docker images |
||
tungstenfabric-operator |
mirantis.azurecr.io/tungsten-operator/tungstenfabric-operator:0.14.12 |
Mirantis Proprietary License |
tungsten-pytest |
mirantis.azurecr.io/tungsten/tungsten-pytest:0.1-20240701111153 |
MIT License |
casskop |
mirantis.azurecr.io/tungsten-operator/casskop:2.2.5 |
Apache License 2.0 |
cassandra-bootstrap |
mirantis.azurecr.io/tungsten/cassandra-bootstrap:0.1.17 |
Apache License 2.0 |
cassandra |
mirantis.azurecr.io/tungsten/cassandra:3.11.10-20230622 |
Apache License 2.0 |
cassandra-config-builder |
mirantis.azurecr.io/tungsten/cass-config-builder:v2-20240626115402 |
Apache License 2.0 |
rabbitmq-operator |
mirantis.azurecr.io/tungsten-operator/rabbitmq-operator:0.4.3 |
Mirantis Proprietary License |
rabbitmq |
mirantis.azurecr.io/tungsten/rabbitmq:3.11.16 |
Mozilla Public License 2.0 |
rabbitmq-exporter |
mirantis.azurecr.io/stacklight/rabbitmq-exporter:1.0.0-RC19 |
MIT License |
zookeeper-operator |
mirantis.azurecr.io/tungsten-operator/zookeeper-operator:0.2.21-mcp |
Apache License 2.0 |
zookeeper |
mirantis.azurecr.io/tungsten/zookeeper:3.8.4-20240315 |
Apache License 2.0 |
redis-operator |
mirantis.azurecr.io/tungsten-operator/redis-operator:0.4.3 |
Apache License 2.0 |
redis |
mirantis.azurecr.io/tungsten/redis:7.2.4-alpine3.19 |
BSD 3-Clause “New” or “Revised” License |
redis-exporter |
mirantis.azurecr.io/stacklight/redis_exporter:v1.45.0 |
BSD 3-Clause “New” or “Revised” License |
tf-cli |
mirantis.azurecr.io/tungsten/tf-cli:0.1-20240613145714 |
MIT License |
kubernetes-entrypoint |
mirantis.azurecr.io/openstack/extra/kubernetes-entrypoint:v1.0.1-ba8ada4-20240405150338 |
Apache License 2.0 |
pause |
mirantis.azurecr.io/general/external/pause:3.1 |
Apache License 2.0 |
tf-nodeinfo |
mirantis.azurecr.io/tungsten/tf-nodeinfo:0.1-20240415104417 |
MIT License |
contrail-controller-config-api |
mirantis.azurecr.io/tungsten/contrail-controller-config-api:24.1-r21.4.20240423151748 |
Apache License 2.0 |
contrail-controller-config-devicemgr |
mirantis.azurecr.io/tungsten/contrail-controller-config-devicemgr:24.1-r21.4.20240423151748 |
Apache License 2.0 |
contrail-controller-config-dnsmasq |
mirantis.azurecr.io/tungsten/contrail-controller-config-dnsmasq:24.1-r21.4.20240423151748 |
Apache License 2.0 |
contrail-controller-config-schema |
mirantis.azurecr.io/tungsten/contrail-controller-config-schema:24.1-r21.4.20240423151748 |
Apache License 2.0 |
contrail-controller-config-svcmonitor |
mirantis.azurecr.io/tungsten/contrail-controller-config-svcmonitor:24.1-r21.4.20240423151748 |
Apache License 2.0 |
contrail-controller-control-control |
mirantis.azurecr.io/tungsten/contrail-controller-control-control:24.1-r21.4.20240423151748 |
Apache License 2.0 |
contrail-controller-control-dns |
mirantis.azurecr.io/tungsten/contrail-controller-control-dns:24.1-r21.4.20240423151748 |
Apache License 2.0 |
contrail-controller-control-named |
mirantis.azurecr.io/tungsten/contrail-controller-control-named:24.1-r21.4.20240423151748 |
Apache License 2.0 |
contrail-controller-webui-job |
mirantis.azurecr.io/tungsten/contrail-controller-webui-job:24.1-r21.4.20240423151748 |
Apache License 2.0 |
contrail-controller-webui-web |
mirantis.azurecr.io/tungsten/contrail-controller-webui-web:24.1-r21.4.20240423151748 |
Apache License 2.0 |
contrail-node-init |
mirantis.azurecr.io/tungsten/contrail-node-init:21.4.20240118000000 |
Apache License 2.0 |
contrail-nodemgr |
mirantis.azurecr.io/tungsten/contrail-nodemgr:24.1-r21.4.20240423151748 |
Apache License 2.0 |
contrail-provisioner |
mirantis.azurecr.io/tungsten/contrail-provisioner:24.1-r21.4.20240423151748 |
Apache License 2.0 |
contrail-tools |
mirantis.azurecr.io/tungsten/contrail-tools:24.1-r21.4.20240423151748 |
Apache License 2.0 |
contrail-vrouter-agent |
mirantis.azurecr.io/tungsten/contrail-vrouter-agent:21.4.20240118000000 |
Apache License 2.0 |
contrail-vrouter-agent-dpdk |
mirantis.azurecr.io/tungsten/contrail-vrouter-agent-dpdk:21.4.20240118000000 |
Apache License 2.0 |
contrail-vrouter-kernel-build-init |
mirantis.azurecr.io/tungsten/contrail-vrouter-kernel-build-init:21.4.20240118000000 |
Apache License 2.0 |
MOSK 24.1.6 StackLight artifacts
Component |
Path |
License information for main executable programs |
|---|---|---|
Docker images |
||
prometheus-libvirt-exporter |
mirantis.azurecr.io/stacklight/prometheus-libvirt-exporter:v0.2-20240701140356 |
Mirantis Proprietary License |
tungstenfabric-prometheus-exporter |
mirantis.azurecr.io/stacklight/tungstenfabric-prometheus-exporter:0.1-20240119124301 |
Mirantis Proprietary License |
Helm charts |
||
fluentd |
https://binary.mirantis.com/stacklight/helm/fluentd-2.0.3-mcp-52.tgz |
Mirantis Proprietary License |
prometheus-libvirt-exporter |
https://binary.mirantis.com/stacklight/helm/prometheus-libvirt-exporter-0.2.0-mcp-7.tgz |
Mirantis Proprietary License |
prometheus-tungstenfabric-exporter |
https://binary.mirantis.com/stacklight/helm/prometheus-tungstenfabric-exporter-0.2.0-mcp-7.tgz |
Mirantis Proprietary License |
The table below includes the total number of addressed unique and common CVEs by MOSK-specific component compared to the previous patch release version. The common CVEs are issues addressed across several images.
Product component |
CVE type |
Critical |
High |
Total |
|---|---|---|---|---|
OpenStack |
Unique |
0 |
10 |
10 |
Common |
0 |
10 |
10 |
|
Tungsten Fabric |
Unique |
5 |
53 |
58 |
Common |
22 |
345 |
367 |
Mirantis Security Portal
For the detailed list of fixed and present CVEs across the Mirantis Container Cloud and MOSK products, refer to Mirantis Security Portal.
Mirantis Container Cloud CVEs
For the number of fixed CVEs in the Mirantis Container Cloud-related components including kaas core, bare metal, Ceph, and StackLight, refer to Container Cloud 2.27.1: Security notes.
The following issues have been addressed in the MOSK 24.1.6 release:
[42725] Resolved the issue with the OpenStack Controller Exporter failing to scrub the metrics after credential rotation.
[43065] Resolved the DNS query issue.
This section lists MOSK known issues with workarounds for the MOSK release 24.1.6.
During MariaDB operations on a management cluster, Pods may get stuck in continuous restarts with the following example error:
[ERROR] WSREP: Corrupt buffer header: \
addr: 0x7faec6f8e518, \
seqno: 3185219421952815104, \
size: 909455917, \
ctx: 0x557094f65038, \
flags: 11577. store: 49, \
type: 49
Workaround:
Create a backup of the
/var/lib/mysqldirectory on themariadb-serverPod.Verify that other replicas are up and ready.
Remove the
galera.cachefile for the affectedmariadb-serverPod.Remove the affected
mariadb-serverPod or wait until it is automatically restarted.
After Kubernetes restarts the Pod, the Pod clones the database in 1-2 minutes and restores the quorum.
After provisioning the controller node, the etcd pod initiates before the Kubernetes networking is fully operational. As a result, the pod encounters difficulties resolving DNS and establishing connections with other members, ultimately leading to a panic state for the etcd service.
Workaround:
Delete the PVC related to the replaced controller node:
kubectl -n openstack delete pvc <PVC-NAME>
Delete pods related to the crashing etcd service on the replaced controller node:
kubectl -n openstack delete pods <ETCD-POD-NAME>
Due to the MetalLB upstream issue, a load balancer service may not obtain the external IP address.
The issue occurs when two services share the same external IP address and have
the same externalTrafficPolicy value. Initially, the services have the
external IP address assigned and are accessible. After modifying the
externalTrafficPolicy value for both services from Cluster to
Local, the first service that has been changed remains with no external IP
address assigned. Though, the second service, which was changed later, has the
external IP assigned as expected.
To work around the issue, make a dummy change to the service object where
external IP is <pending>:
Identify the service that is stuck:
kubectl get svc -A | grep pending
Example of system response:
stacklight iam-proxy-prometheus LoadBalancer 10.233.28.196 <pending> 443:30430/TCP
Add an arbitrary label to the service that is stuck. For example:
kubectl label svc -n stacklight iam-proxy-prometheus reconcile=1
Example of system response:
service/iam-proxy-prometheus labeledVerify that the external IP was allocated to the service:
kubectl get svc -n stacklight iam-proxy-prometheus
Example of system response:
NAME TYPE CLUSTER-IP EXTERNAL-IP PORT(S) AGE iam-proxy-prometheus LoadBalancer 10.233.28.196 10.0.34.108 443:30430/TCP 12d
Sometimes, after changing the OpenStackDeployment custom resource,
it does not transition to the APPLYING state as expected.
To work around the issue, restart the rockoon` pod in the osh-system
namespace.
Fixed in MOSK 24.2.1 Fixed in MOSK 24.3
After upgrading to OpenStack Antelope, clusters with configured trunk ports experience traffic flow disruptions that block the cluster updates.
To work around the issue, pin the MOSK Networking service (OpenStack Neutron) container image by adding the following content to the OpenStackDeployment custom resource:
spec:
services:
networking:
neutron:
values:
images:
tags:
neutron_openvswitch_agent: mirantis.azurecr.io/openstack/neutron:antelope-jammy-20240816113600
Caution
Remove the pinning after updating to MOSK 24.2.1 or later patch or major release.
After upgrade to OpenStack Antelope, the virtual machines experience connectivity disruptions when sending data over the virtual networks. Network packets with full MTU are dropped.
The issue affects the MOSK clusters with Open vSwitch as the networking backend and with the following specific MTU settings:
The MTU configured on the tunnel interface of compute nodes is equal to the value of the
spec:services:networking:neutron:values:conf:neutron:DEFAULT:global_physnet_mtuparameter of theOpenStackDeploymentcustom resource (if not specified, default is1500bytes).If the MTU of the tunnel interface is higher by at least 4 bytes, the cluster is not affected by the issue.
The cluster contains virtual machines that have the MTU of the network interfaces of the guest operating system larger than the MTU of the value of the
global_physnet_mtuparameter above minus 50 bytes.
To work around the issue, pin the MOSK Networking
service (OpenStack Neutron) container image by adding the following content
to the OpenStackDeployment custom resource:
spec:
services:
networking:
neutron:
values:
images:
tags:
neutron_openvswitch_agent: mirantis.azurecr.io/openstack/neutron:antelope-jammy-20240816113600
Caution
Remove the pinning after updating to MOSK 24.2.1 or later patch or major release.
Rebooting all Cassandra cluster TFConfig or TFAnalytics nodes, maintenance, or other circumstances that cause the Cassandra pods to start simultaneously may cause a broken Cassandra TFConfig and/or TFAnalytics cluster. In this case, Cassandra nodes do not join the ring and do not update the IPs of the neighbor nodes. As a result, the TF services cannot operate Cassandra cluster(s).
To verify that a Cassandra cluster is affected:
Run the nodetool status command specifying the config or
analytics cluster and the replica number:
kubectl -n tf exec -it tf-cassandra-<config/analytics>-dc1-rack1-<replica number> -c cassandra -- nodetool status
Example of system response with outdated IP addresses:
Datacenter: DC1
===============
Status=Up/Down
|/ State=Normal/Leaving/Joining/Moving
-- Address Load Tokens Owns (effective) Host ID Rack
DN <outdated ip> ? 256 64.9% a58343d0-1e3f-4d54-bcdf-9b9b949ca873 r1
DN <outdated ip> ? 256 69.8% 67f1d07c-8b13-4482-a2f1-77fa34e90d48 r1
Datacenter: dc1
===============
Status=Up/Down
|/ State=Normal/Leaving/Joining/Moving
-- Address Load Tokens Owns (effective) Host ID Rack
UN <actual ip> 3.84 GiB 256 65.2% 7324ebc4-577a-425f-b3de-96faac95a331 rack1
Workaround:
Manually delete the Cassandra pod from the failed config or analytics
cluster to re-initiate the bootstrap process for one of the Cassandra nodes:
kubectl -n tf delete pod tf-cassandra-<config/analytics>-dc1-rack1-<replica_num>
Occasionally, RabbitMQ instances in tf-rabbitmq pods fail to enable
the tracking_records_in_ets during the initialization process.
To work around the problem, restart the affected pods manually.
After replacing a failed Tungsten Fabric controller node as described in Replace a failed TF controller node, the first restart of the Cassandra pod on this node may cause an issue if the Cassandra node with the outdated IP address has not been removed from the cluster. Subsequent Cassandra pod restarts should not trigger this problem.
To verify if your Cassandra cluster is affected, run the nodetool status command specifying the config or analytics cluster and the replica number:
kubectl -n tf exec -it tf-cassandra-<CONFIG-OR-ANALYTICS>-dc1-rack1-<REPLICA-NUM> -c cassandra -- nodetool status
Example of the system response with outdated IP addresses:
Datacenter: dc1
===============
Status=Up/Down
|/ State=Normal/Leaving/Joining/Moving
-- Address Load Tokens Owns Host ID Rack
UN 192.168.201.144 509.43 KiB 256 ? 7e760a99-fae5-4921-b0c5-d9e6e1eca1c5 rack1
UN 192.168.50.146 534.18 KiB 256 ? 2248ea35-85d4-4887-820b-1fac4733021f rack1
UN 192.168.145.147 484.19 KiB 256 ? d988aaaa-44ae-4fec-a617-0b0a253e736d rack1
DN 192.168.145.144 481.53 KiB 256 ? c23703a1-6854-47a7-a4a2-af649d63af0c rack1
An extra node will appear in the cluster with an outdated IP address
(the IP of the terminated Cassandra pod) in the Down state.
To work around the issue, after replacing the Tungsten Fabric controller node, delete the Cassandra pod on the replaced node and remove the outdated node from the Cassandra cluster using nodetool:
kubectl -n tf exec -it tf-cassandra-<CONFIG-OR-ANALYTICS>-dc1-rack1-<REPLICA-NUM> -c cassandra -- nodetool removenode <HOST-ID>
In rare cases, when ceph-controller cannot confirm the existence of
MOSK pools, instead of denying action and raising errors,
it proceeds to recreate the Cinder Ceph client. Such behavior may
potentially cause issues with OpenStack workloads.
Workaround:
In
spec.cephClusterSpecof theKaaSCephClustercustom resource, remove theexternalsection.Wait for the Not all mgrs are running: 1/2 message to disappear from the
KaaSCephClusterstatus.Verify that the
novaCeph client that is integrated to MOSK has the same keyring as in the Ceph cluster.Keyring verification for the Ceph
novaclientCompare the keyring used in the
nova-computeandlibvirtpods with the one from the Ceph cluster:kubectl -n openstack get pod | grep nova-compute kubectl -n openstack exec -it <nova-compute-pod-name> -- cat /etc/ceph/ceph.client.nova.keyring kubectl -n openstack get pod | grep libvirt kubectl -n openstack exec -it <libvirt-pod-name> -- cat /etc/ceph/ceph.client.nova.keyring kubectl -n rook-ceph exec -it deploy/rook-ceph-tools -- ceph auth get client.nova
If the keyring differs, change the one stored in Ceph cluster with the key from the OpenStack pods:
kubectl -n rook-ceph exec -it deploy/rook-ceph-tools -- bash ceph auth get client.nova -o /tmp/nova.key vi /tmp/nova.key # in the editor, change "key" value to the key obtained from the OpenStack pods # then save and exit editing ceph auth import -i /tmp/nova.key
Verify that the
client.novakeyring of the Ceph cluster matches the one obtained from the OpenStack pods:kubectl -n rook-ceph exec -it deploy/rook-ceph-tools -- ceph auth get client.nova
Verify that
nova-computeandlibvirtpods have access to the Ceph cluster:kubectl -n openstack get pod | grep nova-compute kubectl -n openstack exec -it <nova-compute-pod-name> -- ceph -s -n client.nova kubectl -n openstack get pod | grep libvirt kubectl -n openstack exec -it <libvirt-pod-name> -- ceph -s -n client.nova
Verify that the
cinderCeph client integrated to MOSK has the same keyring as in the Ceph cluster:Keyring verification for the Ceph
cinderclientCompare the keyring used in the
cinder-volumepods with the one from the Ceph cluster.kubectl -n openstack get pod | grep cinder-volume kubectl -n openstack exec -it <cinder-volume-pod-name> -- cat /etc/ceph/ceph.client.cinder.keyring kubectl -n rook-ceph exec -it deploy/rook-ceph-tools -- ceph auth get client.cinder
If the keyring differs, change the one stored in Ceph cluster with the key from the OpenStack pods:
kubectl -n rook-ceph exec -it deploy/rook-ceph-tools -- bash ceph auth get client.cinder -o /tmp/cinder.key vi /tmp/cinder.key # in the editor, change "key" value to the key obtained from the OpenStack pods # then save and exit editing ceph auth import -i /tmp/cinder.key
Verify that the
client.cinderkeyring of the Ceph cluster matches the one obtained from the OpenStack pods:kubectl -n rook-ceph exec -it deploy/rook-ceph-tools -- ceph auth get client.cinder
Verify that the
cinder-volumepods have access to the Ceph cluster:kubectl -n openstack get pod | grep cinder-volume kubectl -n openstack exec -it <cinder-volume-pod-name> -- ceph -s -n client.cinder
Verify that the
glanceCeph client integrated to MOSK has the same keyring as in the Ceph cluster.Keyring verification for the Ceph
glanceclientCompare the keyring used in the
glance-apipods with the one from the Ceph cluster:kubectl -n openstack get pod | grep glance-api kubectl -n openstack exec -it <glance-api-pod-name> -- cat /etc/ceph/ceph.client.glance.keyring kubectl -n rook-ceph exec -it deploy/rook-ceph-tools -- ceph auth get client.glance
If the keyring differs, change the one stored in Ceph cluster with the key from the OpenStack pods:
kubectl -n rook-ceph exec -it deploy/rook-ceph-tools -- bash ceph auth get client.glance -o /tmp/glance.key vi /tmp/glance.key # in the editor, change "key" value to the key obtained from the OpenStack pods # then save and exit editing ceph auth import -i /tmp/glance.key
Verify that the
client.glancekeyring of the Ceph cluster matches the one obtained from the OpenStack pods:kubectl -n rook-ceph exec -it deploy/rook-ceph-tools -- ceph auth get client.glance
Verify that the
glance-apipods have access to the Ceph cluster:kubectl -n openstack get pod | grep glance-api kubectl -n openstack exec -it <glance-api-pod-name> -- ceph -s -n client.glance
During major or patch update of a MOSK cluster with StackLight enabled in
non-HA mode, the KubePodsCrashLooping alert may be firing for the Grafana
ReplicaSet.
Grafana relies on PostgreSQL for persistent data. In non-HA StackLight setup,
PostgreSQL becomes temporarily unavailable during updates. If Grafana loses its
database connection or fails to establish one during startup, Grafana fails
with an error. This may cause the Grafana pod to enter the CrashLoopBackOff
state. Such behavior is expected in non-HA StackLight setups. The Grafana pod
will resume normal operation after PostgreSQL is restored.
To prevent the issue, deploy StackLight in HA mode.
To improve user update experience and make the update path more flexible, MOSK is introducing a new scheme of updating between cluster releases. More specifically, MOSK intends to ultimately provide a possibility to update to any newer patch version within single series at any point of time. The patch version downgrade is not supported.
Though, in some cases, Mirantis may request to update to some specific patch version in the series to be able to update to the next major series. This may be necessary due to the specifics of technical content already released or planned for the release.
Note
The management cluster update scheme remains the same. A management cluster obtains the new product version automatically after release.
For the possible update paths for the current and upcoming product versions refer to MOSK cluster update schema.
The following table provides details on the impact of a MOSK cluster update to a patch release within the 24.1 series.
Note
For the detailed workflow of update to a patch release, refer to Update to a patch version.
Updated component |
Impact on cloud users |
Impact on cloud workloads |
|---|---|---|
OpenStack and Tungsten Fabric |
|
Open vSwitch networking - interruption of North-South connectivity, depending on the type of virtual routers used by a workload:
Tungsten Fabric networking - no impact |
Ceph |
~1% of read operations on object storage API may fail |
IO performance degradation for Ceph-backed virtual storage devices |
Host OS components |
No impact |
No impact |
- 0(1,2)
You can bypass updating components of the cloud data plane to avoid the network downtime during Update to a patch version. By using this technique, you accept the risk that some security fixes may not be applied.
Learn more
24.1.7 patch
The patch release notes contain the description of product enhancements, the list of updated artifacts and Common Vulnerabilities and Exposures (CVE) fixes as well as description of the addressed product issues for the MOSK 24.1.7 patch:
Release date |
August 05, 2024 |
|---|---|
Scope |
Patch |
Cluster release |
17.1.7 |
OpenStack Operator |
0.15.22 |
Tungsten Fabric Operator |
0.14.14 |
The MOSK 24.1.7 patch provides the following updates:
Support for MKE 3.7.11
Security fixes for CVEs in images
Resolved product issues
For the list of enhancements and bug fixes that relate to Mirantis Container Cloud, refer to the Mirantis Container Cloud Release notes.
Learn more about the release cadence
This section lists the components artifacts of the MOSK 24.1.7 release that includes binaries, Docker images, and Helm charts.
MOSK 24.1.7 OpenStack Antelope binaries and Docker images
Component |
Path |
License information for main executable programs |
|---|---|---|
Binaries |
||
octavia-amphora |
https://binary.mirantis.com/openstack/bin/octavia/amphora-x64-haproxy-antelope-20240117112744.qcow2 |
Mirantis Proprietary License |
mirantis |
https://binary.mirantis.com/openstack/bin/horizon/mirantis-antelope-18a1377-20230817112356.tar.gz |
Mirantis Proprietary License |
kernel |
GPL-2.0 |
|
initramfs |
https://binary.mirantis.com/openstack/bin/ironic/tinyipa/tinyipa-stable-antelope-20231123060809.gz |
GPL-2.0 |
service-image |
https://binary.mirantis.com/openstack/bin/manila/manila-service-image-20221228132450.qcow2 |
Mirantis Proprietary License |
Docker images |
||
keystone |
mirantis.azurecr.io/openstack/keystone:antelope-jammy-20240717071031 |
Apache License 2.0 |
heat |
mirantis.azurecr.io/openstack/heat:antelope-jammy-20240717071031 |
Apache License 2.0 |
glance |
mirantis.azurecr.io/openstack/glance:antelope-jammy-20240717071031 |
Apache License 2.0 |
cinder |
mirantis.azurecr.io/openstack/cinder:antelope-jammy-20240717071031 |
Apache License 2.0 |
cloudprober |
mirantis.azurecr.io/openstack/extra/cloudprober:v0.13.2-20240131075124 |
Apache License 2.0 |
neutron |
mirantis.azurecr.io/openstack/neutron:antelope-jammy-20240717071031 |
Apache License 2.0 |
nova |
mirantis.azurecr.io/openstack/nova:antelope-jammy-20240717071031 |
Apache License 2.0 |
horizon |
mirantis.azurecr.io/openstack/horizon:antelope-jammy-20240717071031 |
Apache License 2.0 |
tempest |
mirantis.azurecr.io/openstack/tempest:antelope-jammy-20240717071031 |
Apache License 2.0 |
octavia |
mirantis.azurecr.io/openstack/octavia:antelope-jammy-20240717071031 |
Apache License 2.0 |
designate |
mirantis.azurecr.io/openstack/designate:antelope-jammy-20240717071031 |
Apache License 2.0 |
ironic |
mirantis.azurecr.io/openstack/ironic:antelope-jammy-20240717071031 |
Apache License 2.0 |
barbican |
mirantis.azurecr.io/openstack/barbican:antelope-jammy-20240717071031 |
Apache License 2.0 |
libvirt |
mirantis.azurecr.io/general/libvirt:8.0.x-jammy-20240705072041 |
LGPL-2.1 License |
pause |
mirantis.azurecr.io/general/external/pause:3.1 |
Apache License 2.0 |
openvswitch |
mirantis.azurecr.io/general/openvswitch:2.17-jammy-20231018050930 |
Apache License 2.0 |
openvswitch-dpdk |
mirantis.azurecr.io/general/openvswitch-dpdk:2.17-jammy-20231018050930 |
Apache License 2.0 |
openstack-tools |
mirantis.azurecr.io/openstack/openstack-tools:yoga-jammy-20240716141249 |
Apache License 2.0 |
rabbitmq-3.10.x |
mirantis.azurecr.io/openstack/extra/rabbitmq:3.10.18-focal-20230222154055 |
Mozilla Public License 2.0 |
rabbitmq-3.10.x-management |
mirantis.azurecr.io/openstack/extra/rabbitmq-management:3.10.18-focal-20230222154055 |
Mozilla Public License 2.0 |
kubernetes-entrypoint |
mirantis.azurecr.io/openstack/extra/kubernetes-entrypoint:v1.0.1-ba8ada4-20240405150338 |
Apache License 2.0 |
memcached |
mirantis.azurecr.io/general/memcached:v1.6.23-alpine-20240131134844 |
BSD 3-Clause “New” or “Revised” License |
etcd |
mirantis.azurecr.io/openstack/extra/etcd:v3.5.11-alpine-20240131112547 |
Apache License 2.0 |
powerdns |
mirantis.azurecr.io/openstack/extra/powerdns:4.8-alpine-20240308161357 |
GPL-2.0 License |
nginx-ingress-controller |
mirantis.azurecr.io/openstack/extra/nginx-ingress-controller:1.10.1-alpine-20240424084259 |
Apache License 2.0 |
tls-proxy |
mirantis.azurecr.io/openstack/tls-proxy:focal-fipster-20230725114156 |
Mirantis Proprietary License |
defaultbackend |
mirantis.azurecr.io/openstack/extra/defaultbackend:v1.19.2-77af1ef-20220823043839 |
Apache License 2.0 |
mariadb |
mirantis.azurecr.io/general/mariadb:10.6.17-focal-20240523075821 |
GPLv2, LGPLv2.1 (client libraries) |
rabbitmq-exporter |
mirantis.azurecr.io/stacklight/rabbitmq-exporter:1.0.0-RC19 |
MIT License |
memcached-exporter |
mirantis.azurecr.io/stacklight/memcached-exporter:0-20231208095208 |
Apache License 2.0 |
prometheus-mysql-exporter |
mirantis.azurecr.io/stacklight/mysqld-exporter:v0.11.0 |
Apache License 2.0 |
aodh |
mirantis.azurecr.io/openstack/aodh:antelope-jammy-20240717071031 |
Apache License 2.0 |
ceilometer |
mirantis.azurecr.io/openstack/ceilometer:antelope-jammy-20240717071031 |
Apache License 2.0 |
gnocchi |
mirantis.azurecr.io/openstack/gnocchi:antelope-jammy-20240717071031 |
Apache License 2.0 |
redis |
mirantis.azurecr.io/openstack/extra/redis:7.2.4-alpine3.19-1 |
BSD 3-Clause “New” or “Revised” License |
redis-operator |
mirantis.azurecr.io/openstack/extra/redis-operator:v1.2.4-20240427152750 |
Apache License 2.0 |
frr |
mirantis.azurecr.io/general/external/docker.io/frrouting/frr:v9.0.2-20240318063427 |
GPL-2.0 and LGPL-2.1 |
strongswan |
mirantis.azurecr.io/openstack/extra/strongswan:alpine-5.9.12-20240129155309 |
GPL-2.0 |
rsyslog |
mirantis.azurecr.io/openstack/extra/rsyslog:v8.2001.0-20231018050930 |
GNU General Public License v3 |
descheduler |
mirantis.azurecr.io/openstack/extra/descheduler:v0.29.0 |
Apache License 2.0 |
nginx |
mirantis.azurecr.io/openstack/extra/nginx:1.25.3-20240131112557 |
Apache License 2.0 |
requirements |
mirantis.azurecr.io/openstack/requirements:antelope-jammy-20240717071031 |
Apache License 2.0 |
stepler |
mirantis.azurecr.io/openstack/stepler:antelope-jammy-20240611060850 |
Apache License 2.0 |
placement |
mirantis.azurecr.io/openstack/placement:antelope-jammy-20240717071031 |
Apache License 2.0 |
masakari |
mirantis.azurecr.io/openstack/masakari:antelope-jammy-20240717071031 |
Apache License 2.0 |
masakari-monitors |
mirantis.azurecr.io/openstack/masakari-monitors:antelope-jammy-20240717071031 |
Apache License 2.0 |
ironic-inspector |
mirantis.azurecr.io/openstack/ironic-inspector:antelope-jammy-20240717071031 |
Apache License 2.0 |
manila |
mirantis.azurecr.io/openstack/manila:antelope-jammy-20240717071031 |
Apache License 2.0 |
MOSK 24.1.7 OpenStack Yoga binaries and Docker images
Component |
Path |
License information for main executable programs |
|---|---|---|
Binaries |
||
octavia-amphora |
https://binary.mirantis.com/openstack/bin/octavia/amphora-x64-haproxy-yoga-20240115150429.qcow2 |
Mirantis Proprietary License |
mirantis |
https://binary.mirantis.com/openstack/bin/horizon/mirantis-yoga-186584b-20230817112411.tar.gz |
Mirantis Proprietary License |
kernel |
https://binary.mirantis.com/openstack/bin/ironic/tinyipa/tinyipa-stable-yoga-20231004061110.vmlinuz |
GPL-2.0 |
initramfs |
https://binary.mirantis.com/openstack/bin/ironic/tinyipa/tinyipa-stable-yoga-20231004061110.gz |
GPL-2.0 |
service-image |
https://binary.mirantis.com/openstack/bin/manila/manila-service-image-20221228132450.qcow2 |
Mirantis Proprietary License |
Docker images |
||
keystone |
mirantis.azurecr.io/openstack/keystone:yoga-jammy-20240716141249 |
Apache License 2.0 |
heat |
mirantis.azurecr.io/openstack/heat:yoga-jammy-20240716141249 |
Apache License 2.0 |
glance |
mirantis.azurecr.io/openstack/glance:yoga-jammy-20240716141249 |
Apache License 2.0 |
cinder |
mirantis.azurecr.io/openstack/cinder:yoga-jammy-20240716141249 |
Apache License 2.0 |
cloudprober |
mirantis.azurecr.io/openstack/extra/cloudprober:v0.13.2-20240131075124 |
Apache License 2.0 |
neutron |
mirantis.azurecr.io/openstack/neutron:yoga-jammy-20240716141249 |
Apache License 2.0 |
nova |
mirantis.azurecr.io/openstack/nova:yoga-jammy-20240716141249 |
Apache License 2.0 |
horizon |
mirantis.azurecr.io/openstack/horizon:yoga-jammy-20240716141249 |
Apache License 2.0 |
tempest |
mirantis.azurecr.io/openstack/tempest:yoga-jammy-20240716141249 |
Apache License 2.0 |
octavia |
mirantis.azurecr.io/openstack/octavia:yoga-jammy-20240716141249 |
Apache License 2.0 |
designate |
mirantis.azurecr.io/openstack/designate:yoga-jammy-20240716141249 |
Apache License 2.0 |
ironic |
mirantis.azurecr.io/openstack/ironic:yoga-jammy-20240716141249 |
Apache License 2.0 |
barbican |
mirantis.azurecr.io/openstack/barbican:yoga-jammy-20240716141249 |
Apache License 2.0 |
libvirt |
mirantis.azurecr.io/general/libvirt:8.0.x-jammy-20240705072041 |
LGPL-2.1 License |
pause |
mirantis.azurecr.io/general/external/pause:3.1 |
Apache License 2.0 |
openvswitch |
mirantis.azurecr.io/general/openvswitch:2.17-jammy-20231018050930 |
Apache License 2.0 |
openvswitch-dpdk |
mirantis.azurecr.io/general/openvswitch-dpdk:2.17-jammy-20231018050930 |
Apache License 2.0 |
openstack-tools |
mirantis.azurecr.io/openstack/openstack-tools:yoga-jammy-20240716141249 |
Apache License 2.0 |
rabbitmq-3.10.x |
mirantis.azurecr.io/openstack/extra/rabbitmq:3.10.18-focal-20230222154055 |
Mozilla Public License 2.0 |
rabbitmq-3.10.x-management |
mirantis.azurecr.io/openstack/extra/rabbitmq-management:3.10.18-focal-20230222154055 |
Mozilla Public License 2.0 |
kubernetes-entrypoint |
mirantis.azurecr.io/openstack/extra/kubernetes-entrypoint:v1.0.1-ba8ada4-20240405150338 |
Apache License 2.0 |
memcached |
mirantis.azurecr.io/general/memcached:v1.6.23-alpine-20240131134844 |
BSD 3-Clause “New” or “Revised” License |
etcd |
mirantis.azurecr.io/openstack/extra/etcd:v3.5.11-alpine-20240131112547 |
Apache License 2.0 |
powerdns |
mirantis.azurecr.io/openstack/extra/powerdns:4.8-alpine-20240308161357 |
GPL-2.0 License |
nginx-ingress-controller |
mirantis.azurecr.io/openstack/extra/nginx-ingress-controller:1.10.1-alpine-20240424084259 |
Apache License 2.0 |
tls-proxy |
mirantis.azurecr.io/openstack/tls-proxy:focal-fipster-20230725114156 |
Mirantis Proprietary License |
defaultbackend |
mirantis.azurecr.io/openstack/extra/defaultbackend:v1.19.2-77af1ef-20220823043839 |
Apache License 2.0 |
mariadb |
mirantis.azurecr.io/general/mariadb:10.6.17-focal-20240523075821 |
GPLv2, LGPLv2.1 (client libraries) |
rabbitmq-exporter |
mirantis.azurecr.io/stacklight/rabbitmq-exporter:1.0.0-RC19 |
MIT License |
memcached-exporter |
mirantis.azurecr.io/stacklight/memcached-exporter:0-20231208095208 |
Apache License 2.0 |
prometheus-mysql-exporter |
mirantis.azurecr.io/stacklight/mysqld-exporter:v0.11.0 |
Apache License 2.0 |
aodh |
mirantis.azurecr.io/openstack/aodh:yoga-jammy-20240716141249 |
Apache License 2.0 |
ceilometer |
mirantis.azurecr.io/openstack/ceilometer:yoga-jammy-20240716141249 |
Apache License 2.0 |
gnocchi |
mirantis.azurecr.io/openstack/gnocchi:yoga-jammy-20240716141249 |
Apache License 2.0 |
redis |
mirantis.azurecr.io/openstack/extra/redis:7.2.4-alpine3.19-1 |
BSD 3-Clause “New” or “Revised” License |
redis-operator |
mirantis.azurecr.io/openstack/extra/redis-operator:v1.2.4-20240427152750 |
Apache License 2.0 |
frr |
mirantis.azurecr.io/general/external/docker.io/frrouting/frr:v9.0.2-20240318063427 |
GPL-2.0 and LGPL-2.1 |
strongswan |
mirantis.azurecr.io/openstack/extra/strongswan:alpine-5.9.12-20240129155309 |
GPL-2.0 |
rsyslog |
mirantis.azurecr.io/openstack/extra/rsyslog:v8.2001.0-20231018050930 |
GNU General Public License v3 |
descheduler |
mirantis.azurecr.io/openstack/extra/descheduler:v0.29.0 |
Apache License 2.0 |
nginx |
mirantis.azurecr.io/openstack/extra/nginx:1.25.3-20240131112557 |
Apache License 2.0 |
requirements |
mirantis.azurecr.io/openstack/requirements:yoga-jammy-20240716141249 |
Apache License 2.0 |
stepler |
mirantis.azurecr.io/openstack/stepler:yoga-focal-20240610161716 |
Apache License 2.0 |
placement |
mirantis.azurecr.io/openstack/placement:yoga-jammy-20240716141249 |
Apache License 2.0 |
masakari |
mirantis.azurecr.io/openstack/masakari:yoga-jammy-20240716141249 |
Apache License 2.0 |
masakari-monitors |
mirantis.azurecr.io/openstack/masakari-monitors:yoga-jammy-20240716141249 |
Apache License 2.0 |
ironic-inspector |
mirantis.azurecr.io/openstack/ironic-inspector:yoga-jammy-20240716141249 |
Apache License 2.0 |
manila |
mirantis.azurecr.io/openstack/manila:yoga-jammy-20240716141249 |
Apache License 2.0 |
MOSK 24.1.7 OpenStack Helm charts
MOSK 24.1.7 Tungsten Fabric 21.4 artifacts
Component |
Path |
License information for main executable programs |
|---|---|---|
Helm charts |
||
tungstenfabric-operator |
https://binary.mirantis.com/tungsten/helm/tungstenfabric-operator-0.14.14.tgz |
Mirantis Proprietary License |
Docker images |
||
tungstenfabric-operator |
mirantis.azurecr.io/tungsten-operator/tungstenfabric-operator:0.14.14 |
Mirantis Proprietary License |
tungsten-pytest |
mirantis.azurecr.io/tungsten/tungsten-pytest:0.1-20240718144406 |
MIT License |
casskop |
mirantis.azurecr.io/tungsten-operator/casskop:2.2.5 |
Apache License 2.0 |
cassandra-bootstrap |
mirantis.azurecr.io/tungsten/cassandra-bootstrap:0.1.18 |
Apache License 2.0 |
cassandra |
mirantis.azurecr.io/tungsten/cassandra:3.11.10-20230622 |
Apache License 2.0 |
cassandra-config-builder |
mirantis.azurecr.io/tungsten/cass-config-builder:v2-20240715193519 |
Apache License 2.0 |
rabbitmq-operator |
mirantis.azurecr.io/tungsten-operator/rabbitmq-operator:0.4.3 |
Mirantis Proprietary License |
rabbitmq |
mirantis.azurecr.io/tungsten/rabbitmq:3.11.16 |
Mozilla Public License 2.0 |
rabbitmq-exporter |
mirantis.azurecr.io/stacklight/rabbitmq-exporter:1.0.0-RC19 |
MIT License |
zookeeper-operator |
mirantis.azurecr.io/tungsten-operator/zookeeper-operator:0.2.21-mcp |
Apache License 2.0 |
zookeeper |
mirantis.azurecr.io/tungsten/zookeeper:3.8.4-20240315 |
Apache License 2.0 |
redis-operator |
mirantis.azurecr.io/tungsten-operator/redis-operator:0.4.3 |
Apache License 2.0 |
redis |
mirantis.azurecr.io/tungsten/redis:7.2.4-alpine3.19 |
BSD 3-Clause “New” or “Revised” License |
redis-exporter |
mirantis.azurecr.io/stacklight/redis_exporter:v1.45.0 |
BSD 3-Clause “New” or “Revised” License |
tf-cli |
mirantis.azurecr.io/tungsten/tf-cli:0.1-20240715193039 |
MIT License |
kubernetes-entrypoint |
mirantis.azurecr.io/openstack/extra/kubernetes-entrypoint:v1.0.1-ba8ada4-20240405150338 |
Apache License 2.0 |
pause |
mirantis.azurecr.io/general/external/pause:3.1 |
Apache License 2.0 |
tf-nodeinfo |
mirantis.azurecr.io/tungsten/tf-nodeinfo:0.1-20240415104417 |
MIT License |
contrail-controller-config-api |
mirantis.azurecr.io/tungsten/contrail-controller-config-api:24.1-r21.4.20240423151748 |
Apache License 2.0 |
contrail-controller-config-devicemgr |
mirantis.azurecr.io/tungsten/contrail-controller-config-devicemgr:24.1-r21.4.20240423151748 |
Apache License 2.0 |
contrail-controller-config-dnsmasq |
mirantis.azurecr.io/tungsten/contrail-controller-config-dnsmasq:24.1-r21.4.20240423151748 |
Apache License 2.0 |
contrail-controller-config-schema |
mirantis.azurecr.io/tungsten/contrail-controller-config-schema:24.1-r21.4.20240423151748 |
Apache License 2.0 |
contrail-controller-config-svcmonitor |
mirantis.azurecr.io/tungsten/contrail-controller-config-svcmonitor:24.1-r21.4.20240423151748 |
Apache License 2.0 |
contrail-controller-control-control |
mirantis.azurecr.io/tungsten/contrail-controller-control-control:24.1-r21.4.20240423151748 |
Apache License 2.0 |
contrail-controller-control-dns |
mirantis.azurecr.io/tungsten/contrail-controller-control-dns:24.1-r21.4.20240423151748 |
Apache License 2.0 |
contrail-controller-control-named |
mirantis.azurecr.io/tungsten/contrail-controller-control-named:24.1-r21.4.20240423151748 |
Apache License 2.0 |
contrail-controller-webui-job |
mirantis.azurecr.io/tungsten/contrail-controller-webui-job:24.1-r21.4.20240423151748 |
Apache License 2.0 |
contrail-controller-webui-web |
mirantis.azurecr.io/tungsten/contrail-controller-webui-web:24.1-r21.4.20240423151748 |
Apache License 2.0 |
contrail-node-init |
mirantis.azurecr.io/tungsten/contrail-node-init:21.4.20240118000000 |
Apache License 2.0 |
contrail-nodemgr |
mirantis.azurecr.io/tungsten/contrail-nodemgr:24.1-r21.4.20240423151748 |
Apache License 2.0 |
contrail-provisioner |
mirantis.azurecr.io/tungsten/contrail-provisioner:24.1-r21.4.20240423151748 |
Apache License 2.0 |
contrail-tools |
mirantis.azurecr.io/tungsten/contrail-tools:24.1-r21.4.20240423151748 |
Apache License 2.0 |
contrail-vrouter-agent |
mirantis.azurecr.io/tungsten/contrail-vrouter-agent:21.4.20240118000000 |
Apache License 2.0 |
contrail-vrouter-agent-dpdk |
mirantis.azurecr.io/tungsten/contrail-vrouter-agent-dpdk:21.4.20240118000000 |
Apache License 2.0 |
contrail-vrouter-kernel-build-init |
mirantis.azurecr.io/tungsten/contrail-vrouter-kernel-build-init:21.4.20240118000000 |
Apache License 2.0 |
MOSK 24.1.7 StackLight artifacts
Component |
Path |
License information for main executable programs |
|---|---|---|
Docker images |
||
prometheus-libvirt-exporter |
mirantis.azurecr.io/stacklight/prometheus-libvirt-exporter:v0.2-20240710023012 |
Mirantis Proprietary License |
tungstenfabric-prometheus-exporter |
mirantis.azurecr.io/stacklight/tungstenfabric-prometheus-exporter:0.1-20240119124301 |
Mirantis Proprietary License |
Helm charts |
||
fluentd |
https://binary.mirantis.com/stacklight/helm/fluentd-2.0.3-mcp-52.tgz |
Mirantis Proprietary License |
prometheus-libvirt-exporter |
https://binary.mirantis.com/stacklight/helm/prometheus-libvirt-exporter-0.2.0-mcp-7.tgz |
Mirantis Proprietary License |
prometheus-tungstenfabric-exporter |
https://binary.mirantis.com/stacklight/helm/prometheus-tungstenfabric-exporter-0.2.0-mcp-7.tgz |
Mirantis Proprietary License |
The table below includes the total number of addressed unique and common CVEs by MOSK-specific component compared to the previous patch release version. The common CVEs are issues addressed across several images.
Product component |
CVE type |
Critical |
High |
Total |
|---|---|---|---|---|
OpenStack |
Unique |
0 |
9 |
9 |
Common |
0 |
13 |
13 |
|
Tungsten Fabric |
Unique |
1 |
11 |
12 |
Common |
1 |
20 |
21 |
Mirantis Security Portal
For the detailed list of fixed and present CVEs across the Mirantis Container Cloud and MOSK products, refer to Mirantis Security Portal.
Mirantis Container Cloud CVEs
For the number of fixed CVEs in the Mirantis Container Cloud-related components including kaas core, bare metal, Ceph, and StackLight, refer to Container Cloud 2.27.2: Security notes.
The following issues have been addressed in the MOSK 24.1.7 release:
[43902] [Antelope] Resolved the issue in Neutron that prevented the user with the
memberrole from creating instances.
This section lists MOSK known issues with workarounds for the MOSK release 24.1.7.
During MariaDB operations on a management cluster, Pods may get stuck in continuous restarts with the following example error:
[ERROR] WSREP: Corrupt buffer header: \
addr: 0x7faec6f8e518, \
seqno: 3185219421952815104, \
size: 909455917, \
ctx: 0x557094f65038, \
flags: 11577. store: 49, \
type: 49
Workaround:
Create a backup of the
/var/lib/mysqldirectory on themariadb-serverPod.Verify that other replicas are up and ready.
Remove the
galera.cachefile for the affectedmariadb-serverPod.Remove the affected
mariadb-serverPod or wait until it is automatically restarted.
After Kubernetes restarts the Pod, the Pod clones the database in 1-2 minutes and restores the quorum.
After provisioning the controller node, the etcd pod initiates before the Kubernetes networking is fully operational. As a result, the pod encounters difficulties resolving DNS and establishing connections with other members, ultimately leading to a panic state for the etcd service.
Workaround:
Delete the PVC related to the replaced controller node:
kubectl -n openstack delete pvc <PVC-NAME>
Delete pods related to the crashing etcd service on the replaced controller node:
kubectl -n openstack delete pods <ETCD-POD-NAME>
Due to the MetalLB upstream issue, a load balancer service may not obtain the external IP address.
The issue occurs when two services share the same external IP address and have
the same externalTrafficPolicy value. Initially, the services have the
external IP address assigned and are accessible. After modifying the
externalTrafficPolicy value for both services from Cluster to
Local, the first service that has been changed remains with no external IP
address assigned. Though, the second service, which was changed later, has the
external IP assigned as expected.
To work around the issue, make a dummy change to the service object where
external IP is <pending>:
Identify the service that is stuck:
kubectl get svc -A | grep pending
Example of system response:
stacklight iam-proxy-prometheus LoadBalancer 10.233.28.196 <pending> 443:30430/TCP
Add an arbitrary label to the service that is stuck. For example:
kubectl label svc -n stacklight iam-proxy-prometheus reconcile=1
Example of system response:
service/iam-proxy-prometheus labeledVerify that the external IP was allocated to the service:
kubectl get svc -n stacklight iam-proxy-prometheus
Example of system response:
NAME TYPE CLUSTER-IP EXTERNAL-IP PORT(S) AGE iam-proxy-prometheus LoadBalancer 10.233.28.196 10.0.34.108 443:30430/TCP 12d
Sometimes, after changing the OpenStackDeployment custom resource,
it does not transition to the APPLYING state as expected.
To work around the issue, restart the rockoon` pod in the osh-system
namespace.
Fixed in MOSK 24.2.1 Fixed in MOSK 24.3
After upgrading to OpenStack Antelope, clusters with configured trunk ports experience traffic flow disruptions that block the cluster updates.
To work around the issue, pin the MOSK Networking service (OpenStack Neutron) container image by adding the following content to the OpenStackDeployment custom resource:
spec:
services:
networking:
neutron:
values:
images:
tags:
neutron_openvswitch_agent: mirantis.azurecr.io/openstack/neutron:antelope-jammy-20240816113600
Caution
Remove the pinning after updating to MOSK 24.2.1 or later patch or major release.
After upgrade to OpenStack Antelope, the virtual machines experience connectivity disruptions when sending data over the virtual networks. Network packets with full MTU are dropped.
The issue affects the MOSK clusters with Open vSwitch as the networking backend and with the following specific MTU settings:
The MTU configured on the tunnel interface of compute nodes is equal to the value of the
spec:services:networking:neutron:values:conf:neutron:DEFAULT:global_physnet_mtuparameter of theOpenStackDeploymentcustom resource (if not specified, default is1500bytes).If the MTU of the tunnel interface is higher by at least 4 bytes, the cluster is not affected by the issue.
The cluster contains virtual machines that have the MTU of the network interfaces of the guest operating system larger than the MTU of the value of the
global_physnet_mtuparameter above minus 50 bytes.
To work around the issue, pin the MOSK Networking
service (OpenStack Neutron) container image by adding the following content
to the OpenStackDeployment custom resource:
spec:
services:
networking:
neutron:
values:
images:
tags:
neutron_openvswitch_agent: mirantis.azurecr.io/openstack/neutron:antelope-jammy-20240816113600
Caution
Remove the pinning after updating to MOSK 24.2.1 or later patch or major release.
Rebooting all Cassandra cluster TFConfig or TFAnalytics nodes, maintenance, or other circumstances that cause the Cassandra pods to start simultaneously may cause a broken Cassandra TFConfig and/or TFAnalytics cluster. In this case, Cassandra nodes do not join the ring and do not update the IPs of the neighbor nodes. As a result, the TF services cannot operate Cassandra cluster(s).
To verify that a Cassandra cluster is affected:
Run the nodetool status command specifying the config or
analytics cluster and the replica number:
kubectl -n tf exec -it tf-cassandra-<config/analytics>-dc1-rack1-<replica number> -c cassandra -- nodetool status
Example of system response with outdated IP addresses:
Datacenter: DC1
===============
Status=Up/Down
|/ State=Normal/Leaving/Joining/Moving
-- Address Load Tokens Owns (effective) Host ID Rack
DN <outdated ip> ? 256 64.9% a58343d0-1e3f-4d54-bcdf-9b9b949ca873 r1
DN <outdated ip> ? 256 69.8% 67f1d07c-8b13-4482-a2f1-77fa34e90d48 r1
Datacenter: dc1
===============
Status=Up/Down
|/ State=Normal/Leaving/Joining/Moving
-- Address Load Tokens Owns (effective) Host ID Rack
UN <actual ip> 3.84 GiB 256 65.2% 7324ebc4-577a-425f-b3de-96faac95a331 rack1
Workaround:
Manually delete the Cassandra pod from the failed config or analytics
cluster to re-initiate the bootstrap process for one of the Cassandra nodes:
kubectl -n tf delete pod tf-cassandra-<config/analytics>-dc1-rack1-<replica_num>
Occasionally, RabbitMQ instances in tf-rabbitmq pods fail to enable
the tracking_records_in_ets during the initialization process.
To work around the problem, restart the affected pods manually.
After replacing a failed Tungsten Fabric controller node as described in Replace a failed TF controller node, the first restart of the Cassandra pod on this node may cause an issue if the Cassandra node with the outdated IP address has not been removed from the cluster. Subsequent Cassandra pod restarts should not trigger this problem.
To verify if your Cassandra cluster is affected, run the nodetool status command specifying the config or analytics cluster and the replica number:
kubectl -n tf exec -it tf-cassandra-<CONFIG-OR-ANALYTICS>-dc1-rack1-<REPLICA-NUM> -c cassandra -- nodetool status
Example of the system response with outdated IP addresses:
Datacenter: dc1
===============
Status=Up/Down
|/ State=Normal/Leaving/Joining/Moving
-- Address Load Tokens Owns Host ID Rack
UN 192.168.201.144 509.43 KiB 256 ? 7e760a99-fae5-4921-b0c5-d9e6e1eca1c5 rack1
UN 192.168.50.146 534.18 KiB 256 ? 2248ea35-85d4-4887-820b-1fac4733021f rack1
UN 192.168.145.147 484.19 KiB 256 ? d988aaaa-44ae-4fec-a617-0b0a253e736d rack1
DN 192.168.145.144 481.53 KiB 256 ? c23703a1-6854-47a7-a4a2-af649d63af0c rack1
An extra node will appear in the cluster with an outdated IP address
(the IP of the terminated Cassandra pod) in the Down state.
To work around the issue, after replacing the Tungsten Fabric controller node, delete the Cassandra pod on the replaced node and remove the outdated node from the Cassandra cluster using nodetool:
kubectl -n tf exec -it tf-cassandra-<CONFIG-OR-ANALYTICS>-dc1-rack1-<REPLICA-NUM> -c cassandra -- nodetool removenode <HOST-ID>
In rare cases, when ceph-controller cannot confirm the existence of
MOSK pools, instead of denying action and raising errors,
it proceeds to recreate the Cinder Ceph client. Such behavior may
potentially cause issues with OpenStack workloads.
Workaround:
In
spec.cephClusterSpecof theKaaSCephClustercustom resource, remove theexternalsection.Wait for the Not all mgrs are running: 1/2 message to disappear from the
KaaSCephClusterstatus.Verify that the
novaCeph client that is integrated to MOSK has the same keyring as in the Ceph cluster.Keyring verification for the Ceph
novaclientCompare the keyring used in the
nova-computeandlibvirtpods with the one from the Ceph cluster:kubectl -n openstack get pod | grep nova-compute kubectl -n openstack exec -it <nova-compute-pod-name> -- cat /etc/ceph/ceph.client.nova.keyring kubectl -n openstack get pod | grep libvirt kubectl -n openstack exec -it <libvirt-pod-name> -- cat /etc/ceph/ceph.client.nova.keyring kubectl -n rook-ceph exec -it deploy/rook-ceph-tools -- ceph auth get client.nova
If the keyring differs, change the one stored in Ceph cluster with the key from the OpenStack pods:
kubectl -n rook-ceph exec -it deploy/rook-ceph-tools -- bash ceph auth get client.nova -o /tmp/nova.key vi /tmp/nova.key # in the editor, change "key" value to the key obtained from the OpenStack pods # then save and exit editing ceph auth import -i /tmp/nova.key
Verify that the
client.novakeyring of the Ceph cluster matches the one obtained from the OpenStack pods:kubectl -n rook-ceph exec -it deploy/rook-ceph-tools -- ceph auth get client.nova
Verify that
nova-computeandlibvirtpods have access to the Ceph cluster:kubectl -n openstack get pod | grep nova-compute kubectl -n openstack exec -it <nova-compute-pod-name> -- ceph -s -n client.nova kubectl -n openstack get pod | grep libvirt kubectl -n openstack exec -it <libvirt-pod-name> -- ceph -s -n client.nova
Verify that the
cinderCeph client integrated to MOSK has the same keyring as in the Ceph cluster:Keyring verification for the Ceph
cinderclientCompare the keyring used in the
cinder-volumepods with the one from the Ceph cluster.kubectl -n openstack get pod | grep cinder-volume kubectl -n openstack exec -it <cinder-volume-pod-name> -- cat /etc/ceph/ceph.client.cinder.keyring kubectl -n rook-ceph exec -it deploy/rook-ceph-tools -- ceph auth get client.cinder
If the keyring differs, change the one stored in Ceph cluster with the key from the OpenStack pods:
kubectl -n rook-ceph exec -it deploy/rook-ceph-tools -- bash ceph auth get client.cinder -o /tmp/cinder.key vi /tmp/cinder.key # in the editor, change "key" value to the key obtained from the OpenStack pods # then save and exit editing ceph auth import -i /tmp/cinder.key
Verify that the
client.cinderkeyring of the Ceph cluster matches the one obtained from the OpenStack pods:kubectl -n rook-ceph exec -it deploy/rook-ceph-tools -- ceph auth get client.cinder
Verify that the
cinder-volumepods have access to the Ceph cluster:kubectl -n openstack get pod | grep cinder-volume kubectl -n openstack exec -it <cinder-volume-pod-name> -- ceph -s -n client.cinder
Verify that the
glanceCeph client integrated to MOSK has the same keyring as in the Ceph cluster.Keyring verification for the Ceph
glanceclientCompare the keyring used in the
glance-apipods with the one from the Ceph cluster:kubectl -n openstack get pod | grep glance-api kubectl -n openstack exec -it <glance-api-pod-name> -- cat /etc/ceph/ceph.client.glance.keyring kubectl -n rook-ceph exec -it deploy/rook-ceph-tools -- ceph auth get client.glance
If the keyring differs, change the one stored in Ceph cluster with the key from the OpenStack pods:
kubectl -n rook-ceph exec -it deploy/rook-ceph-tools -- bash ceph auth get client.glance -o /tmp/glance.key vi /tmp/glance.key # in the editor, change "key" value to the key obtained from the OpenStack pods # then save and exit editing ceph auth import -i /tmp/glance.key
Verify that the
client.glancekeyring of the Ceph cluster matches the one obtained from the OpenStack pods:kubectl -n rook-ceph exec -it deploy/rook-ceph-tools -- ceph auth get client.glance
Verify that the
glance-apipods have access to the Ceph cluster:kubectl -n openstack get pod | grep glance-api kubectl -n openstack exec -it <glance-api-pod-name> -- ceph -s -n client.glance
During major or patch update of a MOSK cluster with StackLight enabled in
non-HA mode, the KubePodsCrashLooping alert may be firing for the Grafana
ReplicaSet.
Grafana relies on PostgreSQL for persistent data. In non-HA StackLight setup,
PostgreSQL becomes temporarily unavailable during updates. If Grafana loses its
database connection or fails to establish one during startup, Grafana fails
with an error. This may cause the Grafana pod to enter the CrashLoopBackOff
state. Such behavior is expected in non-HA StackLight setups. The Grafana pod
will resume normal operation after PostgreSQL is restored.
To prevent the issue, deploy StackLight in HA mode.
To improve user update experience and make the update path more flexible, MOSK is introducing a new scheme of updating between cluster releases. For the details and possible update paths, refer to 24.1.5 update notes: Cluster update scheme.
The following table provides details on the impact of a MOSK cluster update to a patch release within the 24.1 series.
Note
For the detailed workflow of update to a patch release, refer to Update to a patch version.
Updated component |
Impact on cloud users |
Impact on cloud workloads |
|---|---|---|
OpenStack and Tungsten Fabric |
|
Open vSwitch networking - interruption of North-South connectivity, depending on the type of virtual routers used by a workload:
Tungsten Fabric networking - no impact |
Ceph |
~1% of read operations on object storage API may fail |
IO performance degradation for Ceph-backed virtual storage devices |
Host OS components |
No impact |
No impact |
- 0(1,2)
You can bypass updating components of the cloud data plane to avoid the network downtime during Update to a patch version. By using this technique, you accept the risk that some security fixes may not be applied.
23.3 series
23.3
Release date |
November 06, 2023 |
|---|---|
Name |
MOSK 23.3 |
Cluster release |
17.0.0 |
Highlights |
|
Component |
Support scope |
Feature |
|---|---|---|
OpenStack |
TechPreview |
|
TechPreview |
||
Security |
Full |
|
Full |
|
|
Tungsten Fabric |
TechPreview |
|
StackLight |
Full |
|
Full |
||
n/a |
Operations Guide:
Security Guide:
|
TechPreview
Provided the technical preview support for OpenStack Antelope with Neutron OVS and Tungsten Fabric 21.4 for greenfield deployments.
To start experimenting with the new functionality, set openstack_version to
antelope in the OpenStackDeployment custom resource during the cloud
deployment.
TechPreview
Implemented the capability to automatically collect logs and generate support
dumps that provide valuable insights for troubleshooting OpenStack-related
problems through the osctl sos report tool present within
the openstack-controller image.
Introduced FIPS-compatible encryption into the API of all MOSK cloud services, ensuring data security and regulatory compliance with the FIPS 140-2 standard.
Introduced support for Mirantis Kubernetes Engine (MKE) 3.7 with Kubernetes 1.27. MOSK clusters are updated to the latest supported MKE version during the cluster update.
Learn more
Upgraded Open vSwitch to 2.17 for better performance.
TechPreview
Implemented the capability to disable the Tungsten Fabric analytics services to obtain a more lightweight setup.
Implemented the OpenStack Usage Efficiency dashboard for Grafana that provides information about requested (allocated) CPU and memory usage efficiency on a per-project and per-flavor basis.
This dashboard aims to identify flavors that specific projects are not effectively using, with allocations significantly exceeding actual usage. Also, it evaluates per-instance underuse for specific projects.
Implemented the following monitoring improvements for Ceph:
Optimized the following Ceph dashboards in Grafana: Ceph Cluster, Ceph Pools, Ceph OSDs.
Removed the redundant Ceph Nodes Grafana dashboard. You can view its content using the following dashboards:
Ceph stats through the Ceph Cluster dashboard.
Resource utilization through the System dashboard, which now includes filtering by Ceph node labels, such as
ceph_role_osd,ceph_role_mon, andceph_role_mgr.
Removed the
rook_clusteralert label.Removed the redundant
CephOSDDownalert.Renamed the
CephNodeDownalert toCephOSDNodeDown.
Implemented an online calculator for quick calculation of the approximate time required to update your MOSK cluster that uses Open vSwitch as a networking backend.
Published a procedure that instructs on how to orchestrate Tungsten Fabric objects through Heat templates to ensure repeatability and consistency across deployments.
Published an overview of the data protection capabilities available in MOSK, focusing primarily on data encryption.
Learn more
Published a section that explains the principles of encrypting control plane communications in MOSK.
Learn more
Mirantis has tested MOSK against a very specific configuration and can guarantee a predictable behavior of the product only in the exact same environments. The table below includes the major MOSK components with the exact versions against which testing has been performed.
Component |
Version |
|---|---|
Cluster release |
17.0.0 (Cluster release notes) |
OpenStack |
Yoga,
Antelope TechPreview
|
OpenStack Operator |
0.14.7 |
Tungsten Fabric |
21.4 |
Tungsten Fabric Operator |
0.13.2 |
See also
For the supported versions of operating system, Ceph, and other components, refer to Compatibility Matrix.
This section describes the MOSK known issues with available workarounds. For the known issues in the related version of Mirantis Container Cloud, refer to Mirantis Container Cloud: Release Notes.
This section lists the OpenStack known issues with workarounds for the Mirantis OpenStack for Kubernetes release 23.3.
Due to the upstream MariaDB issue, during MariaDB operations on a management cluster, Pods may get stuck in continuous restarts with the following example error:
[ERROR] WSREP: Corrupt buffer header: \
addr: 0x7faec6f8e518, \
seqno: 3185219421952815104, \
size: 909455917, \
ctx: 0x557094f65038, \
flags: 11577. store: 49, \
type: 49
Workaround:
Create a backup of the
/var/lib/mysqldirectory on themariadb-serverPod.Verify that other replicas are up and ready.
Remove the
galera.cachefile for the affectedmariadb-serverPod.Remove the affected
mariadb-serverPod or wait until it is automatically restarted.
After Kubernetes restarts the Pod, the Pod clones the database in 1-2 minutes and restores the quorum.
Due to the MetalLB upstream issue, a load balancer service may not obtain the external IP address.
The issue occurs when two services share the same external IP address and have
the same externalTrafficPolicy value. Initially, the services have the
external IP address assigned and are accessible. After modifying the
externalTrafficPolicy value for both services from Cluster to
Local, the first service that has been changed remains with no external IP
address assigned. Though, the second service, which was changed later, has the
external IP assigned as expected.
To work around the issue, make a dummy change to the service object where
external IP is <pending>:
Identify the service that is stuck:
kubectl get svc -A | grep pending
Example of system response:
stacklight iam-proxy-prometheus LoadBalancer 10.233.28.196 <pending> 443:30430/TCP
Add an arbitrary label to the service that is stuck. For example:
kubectl label svc -n stacklight iam-proxy-prometheus reconcile=1
Example of system response:
service/iam-proxy-prometheus labeledVerify that the external IP was allocated to the service:
kubectl get svc -n stacklight iam-proxy-prometheus
Example of system response:
NAME TYPE CLUSTER-IP EXTERNAL-IP PORT(S) AGE iam-proxy-prometheus LoadBalancer 10.233.28.196 10.0.34.108 443:30430/TCP 12d
This section lists the Tungsten Fabric (TF) known issues with workarounds for the Mirantis OpenStack for Kubernetes release 23.3. For TF limitations, see Tungsten Fabric known limitations.
[37684] Cassandra containers are experiencing high resource utilization
[13755] TF pods switch to CrashLoopBackOff after a simultaneous reboot
The Cassandra containers of the tf-cassandra-analytics service are
experiencing high CPU and memory utilization. This is happening because
Cassandra Analytics is running out of memory, causing restarts of both
Cassandra and the Tungsten Fabric control plane services.
To work around the issue, use the custom images from the Mirantis public repository:
Specify the image for
config-apiin theTFOperatorcustom resource:controllers: tf-config: api: containers: - image: mirantis.azurecr.io/tungsten/contrail-controller-config-api:23.2-r21.4.20231208123354 name: api
Wait for the
tf-configpods to restart.Monitor the Cassandra Analytics resources continuously. If the Out Of Memory (OOM) error is not present, the applied workaround is sufficient.
Otherwise, modify the TF vRouters configuration as well:
controllers: tf-vrouter: agent: containers: - env: - name: VROUTER_GATEWAY value: 10.32.6.1 - name: DISABLE_TX_OFFLOAD value: "YES" name: agent image: mirantis.azurecr.io/tungsten/contrail-vrouter-agent:23.2-r21.4.20231208123354
To apply the changes, restart the vRouters manually.
Rebooting all Cassandra cluster TFConfig or TFAnalytics nodes, maintenance, or other circumstances that cause the Cassandra pods to start simultaneously may cause a broken Cassandra TFConfig and/or TFAnalytics cluster. In this case, Cassandra nodes do not join the ring and do not update the IPs of the neighbor nodes. As a result, the TF services cannot operate Cassandra cluster(s).
To verify that a Cassandra cluster is affected:
Run the nodetool status command specifying the config or
analytics cluster and the replica number:
kubectl -n tf exec -it tf-cassandra-<config/analytics>-dc1-rack1-<replica number> -c cassandra -- nodetool status
Example of system response with outdated IP addresses:
Datacenter: DC1
===============
Status=Up/Down
|/ State=Normal/Leaving/Joining/Moving
-- Address Load Tokens Owns (effective) Host ID Rack
DN <outdated ip> ? 256 64.9% a58343d0-1e3f-4d54-bcdf-9b9b949ca873 r1
DN <outdated ip> ? 256 69.8% 67f1d07c-8b13-4482-a2f1-77fa34e90d48 r1
Datacenter: dc1
===============
Status=Up/Down
|/ State=Normal/Leaving/Joining/Moving
-- Address Load Tokens Owns (effective) Host ID Rack
UN <actual ip> 3.84 GiB 256 65.2% 7324ebc4-577a-425f-b3de-96faac95a331 rack1
Workaround:
Manually delete the Cassandra pod from the failed config or analytics
cluster to re-initiate the bootstrap process for one of the Cassandra nodes:
kubectl -n tf delete pod tf-cassandra-<config/analytics>-dc1-rack1-<replica_num>
This section lists the StackLight known issues with workarounds for the Mirantis OpenStack for Kubernetes MOSK release 23.3.
The deprecated dashboards NGINX Ingress controller and Ceph Nodes, which may expose inaccurate information, are displayed in Grafana.
These dashboards will be removed in the following MOSK release. Therefore, Mirantis recommends switching to the following dashboards in this release:
OpenStack Ingress controller instead of NGINX Ingress controller
For Ceph:
Ceph Cluster dashboard for Ceph stats
System dashboard for resource utilization, which includes filtering by Ceph node labels, such as
ceph_role_osd,ceph_role_mon, andceph_role_mgr
This section lists the update known issues with workarounds for the MOSK release 23.3.
While updating your cluster, the Instance High Availability service (OpenStack Masakari) may not work as expected.
As a workaround, temporarily disable the service by removing
instance-ha from the service list in the OpenStackDeployment
custom resource.
During update, the ingress pods that have not been updated yet adopt the configuration meant for the updated pods, causing disruptions. This occurs as ingress pods are sequentially updated, leading to potential inaccessibility to the cloud public API for unpredictable durations until all ingress pods are updated.
To mitigate this issue, Mirantis recommends updating ingress pods in larger batches, preferably half of all pods at a time. This approach minimizes downtime for the public API.
Workaround:
Before you start updating to MOSK 23.3:
Increase
maxUnavailablefor the ingress DaemonSet to 50% of replicas by patching directly the DaemonSet:kubectl -n openstack patch ds ingress -p '{"spec":{"updateStrategy":{"rollingUpdate":{"maxUnavailable":"50%"}}}}'
In certain scenarios, the change may trigger an immediate restart of half of the ingress pods. Therefore, after patching the ingress, wait until all ingress pods become ready, taking into account that there might be occasional failures in public API calls.
To verify that the patch has been applied successfully:
kubectl -n openstack get ds ingress -o jsonpath={.spec.updateStrategy.rollingUpdate.maxUnavailable}
Disable FIPS
tls_proxyexplicitly in MOSK 23.2 by adding the following configuration into theOpenStackDeploymentcustom resource:spec: features: ssl: tls_proxy: enabled: false
Update to MOSK 23.3.
Update to MOSK 24.1.
Re-enable FIPS
tls_proxyby removing the configuration added to theOpenStackDeploymentcustom resource above.
This section lists the components artifacts of the MOSK 23.3 release that includes binaries, Docker images, and Helm charts.
MOSK 23.3 OpenStack Yoga binaries and Docker images
Component |
Path |
License information for main executable programs |
|---|---|---|
Binaries |
||
octavia-amphora |
https://binary.mirantis.com/openstack/bin/octavia/amphora-x64-haproxy-yoga-20230928140935.qcow2 |
Mirantis Proprietary License |
mirantis |
https://binary.mirantis.com/openstack/bin/horizon/mirantis-yoga-186584b-20230817112411.tar.gz |
Mirantis Proprietary License |
kernel |
https://binary.mirantis.com/openstack/bin/ironic/tinyipa/tinyipa-stable-yoga-20230128061113.vmlinuz |
GPL-2.0 |
initramfs |
https://binary.mirantis.com/openstack/bin/ironic/tinyipa/tinyipa-stable-yoga-20230128061113.gz |
GPL-2.0 |
service-image |
https://binary.mirantis.com/openstack/bin/manila/manila-service-image-20221228132450.qcow2 |
Mirantis Proprietary License |
Docker images |
||
keystone |
mirantis.azurecr.io/openstack/keystone:yoga-jammy-20231013125630 |
Apache License 2.0 |
heat |
mirantis.azurecr.io/openstack/heat:yoga-jammy-20231013125630 |
Apache License 2.0 |
glance |
mirantis.azurecr.io/openstack/glance:yoga-jammy-20231013125630 |
Apache License 2.0 |
cinder |
mirantis.azurecr.io/openstack/cinder:yoga-jammy-20231013125630 |
Apache License 2.0 |
cloudprober |
mirantis.azurecr.io/openstack/extra/cloudprober:v0.12.9 |
Apache License 2.0 |
neutron |
mirantis.azurecr.io/openstack/neutron:yoga-jammy-20231013125630 |
Apache License 2.0 |
nova |
mirantis.azurecr.io/openstack/nova:yoga-jammy-20231013125630 |
Apache License 2.0 |
horizon |
mirantis.azurecr.io/openstack/horizon:yoga-jammy-20231013125630 |
Apache License 2.0 |
tempest |
mirantis.azurecr.io/openstack/tempest:yoga-jammy-20231013125630 |
Apache License 2.0 |
octavia |
mirantis.azurecr.io/openstack/octavia:yoga-jammy-20231013125630 |
Apache License 2.0 |
designate |
mirantis.azurecr.io/openstack/designate:yoga-jammy-20231013125630 |
Apache License 2.0 |
ironic |
mirantis.azurecr.io/openstack/ironic:yoga-jammy-20231013125630 |
Apache License 2.0 |
barbican |
mirantis.azurecr.io/openstack/barbican:yoga-jammy-20231013125630 |
Apache License 2.0 |
libvirt |
mirantis.azurecr.io/general/libvirt:8.0.x-jammy-20231006073052 |
LGPL-2.1 License |
pause |
mirantis.azurecr.io/general/external/pause:3.1 |
Apache License 2.0 |
openvswitch |
mirantis.azurecr.io/general/openvswitch:2.17-jammy-20231006073052 |
Apache License 2.0 |
openvswitch-dpdk |
mirantis.azurecr.io/general/openvswitch-dpdk:2.17-jammy-20231006073052 |
Apache License 2.0 |
openstack-tools |
mirantis.azurecr.io/openstack/openstack-tools:yoga-jammy-20231013125630 |
Apache License 2.0 |
rabbitmq-3.10.x |
mirantis.azurecr.io/openstack/extra/rabbitmq:3.10.18-focal-20230222154055 |
Mozilla Public License 2.0 |
rabbitmq-3.10.x-management |
mirantis.azurecr.io/openstack/extra/rabbitmq-management:3.10.18-focal-20230222154055 |
Mozilla Public License 2.0 |
kubernetes-entrypoint |
mirantis.azurecr.io/openstack/extra/kubernetes-entrypoint:v1.0.1-5359171-20230810125608 |
Apache License 2.0 |
memcached |
mirantis.azurecr.io/general/memcached:v1.6.21-alpine-20230913050002 |
BSD 3-Clause “New” or “Revised” License |
etcd |
mirantis.azurecr.io/openstack/extra/etcd:v3.5.9-alpine-20230912131525 |
Apache License 2.0 |
powerdns |
mirantis.azurecr.io/openstack/extra/powerdns:4.7-alpine-20230817061604 |
GPL-2.0 License |
nginx-ingress-controller |
mirantis.azurecr.io/openstack/extra/nginx-ingress-controller:1.8.2-alpine-20230928053836 |
Apache License 2.0 |
tls-proxy |
mirantis.azurecr.io/openstack/tls-proxy:focal-fipster-20230725114156 |
Mirantis Proprietary License |
defaultbackend |
mirantis.azurecr.io/openstack/extra/defaultbackend:v1.19.2-77af1ef-20220823043839 |
Apache License 2.0 |
mariadb |
mirantis.azurecr.io/general/mariadb:10.6.14-focal-20230920121405 |
GPLv2, LGPLv2.1 (client libraries) |
rabbitmq-exporter |
mirantis.azurecr.io/stacklight/rabbitmq-exporter:1.0.0-RC19 |
MIT License |
memcached-exporter |
mirantis.azurecr.io/stacklight/memcached-exporter:v0.11.3 |
Apache License 2.0 |
prometheus-mysql-exporter |
mirantis.azurecr.io/stacklight/mysqld-exporter:v0.11.0 |
Apache License 2.0 |
aodh |
mirantis.azurecr.io/openstack/aodh:yoga-jammy-20231013125630 |
Apache License 2.0 |
ceilometer |
mirantis.azurecr.io/openstack/ceilometer:yoga-jammy-20231013125630 |
Apache License 2.0 |
gnocchi |
mirantis.azurecr.io/openstack/gnocchi:yoga-jammy-20231013125630 |
Apache License 2.0 |
redis |
mirantis.azurecr.io/tungsten/redis:7.2.1-alpine3.18 |
BSD 3-Clause “New” or “Revised” License |
frr |
mirantis.azurecr.io/general/external/docker.io/frrouting/frr:v8.5.1-20230619084330 |
GPL-2.0 and LGPL-2.1 |
strongswan |
mirantis.azurecr.io/openstack/extra/strongswan:alpine-5.9.8-20230928073518 |
GPL-2.0 |
rsyslog |
mirantis.azurecr.io/openstack/extra/rsyslog:v8.2001.0-20230920121951 |
GNU General Public License v3 |
descheduler |
mirantis.azurecr.io/openstack/extra/descheduler:v0.27.0 |
Apache License 2.0 |
nginx |
mirantis.azurecr.io/openstack/extra/nginx:1.25.1-alpine-slim |
Apache License 2.0 |
requirements |
mirantis.azurecr.io/openstack/requirements:yoga-jammy-20231013125630 |
Apache License 2.0 |
stepler |
mirantis.azurecr.io/openstack/stepler:yoga-focal-20231007133456 |
Apache License 2.0 |
placement |
mirantis.azurecr.io/openstack/placement:yoga-jammy-20231013125630 |
Apache License 2.0 |
masakari |
mirantis.azurecr.io/openstack/masakari:yoga-jammy-20231013125630 |
Apache License 2.0 |
masakari-monitors |
mirantis.azurecr.io/openstack/masakari-monitors:yoga-jammy-20231013125630 |
Apache License 2.0 |
ironic-inspector |
mirantis.azurecr.io/openstack/ironic-inspector:yoga-jammy-20231013125630 |
Apache License 2.0 |
manila |
mirantis.azurecr.io/openstack/manila:yoga-jammy-20231013125630 |
Apache License 2.0 |
MOSK 23.3 OpenStack Antelope binaries and Docker images
Component |
Path |
License information for main executable programs |
|---|---|---|
Binaries |
||
octavia-amphora |
https://binary.mirantis.com/openstack/bin/octavia/amphora-x64-haproxy-antelope-20230927122744.qcow2 |
Mirantis Proprietary License |
mirantis |
https://binary.mirantis.com/openstack/bin/horizon/mirantis-antelope-18a1377-20230817112356.tar.gz |
Mirantis Proprietary License |
kernel |
GPL-2.0 |
|
initramfs |
https://binary.mirantis.com/openstack/bin/ironic/tinyipa/tinyipa-stable-antelope-20230831060811.gz |
GPL-2.0 |
service-image |
https://binary.mirantis.com/openstack/bin/manila/manila-service-image-20221228132450.qcow2 |
Mirantis Proprietary License |
Docker images |
||
keystone |
mirantis.azurecr.io/openstack/keystone:antelope-jammy-20231013125630 |
Apache License 2.0 |
heat |
mirantis.azurecr.io/openstack/heat:antelope-jammy-20231013125630 |
Apache License 2.0 |
glance |
mirantis.azurecr.io/openstack/glance:antelope-jammy-20231013125630 |
Apache License 2.0 |
cinder |
mirantis.azurecr.io/openstack/cinder:antelope-jammy-20231013125630 |
Apache License 2.0 |
cloudprober |
mirantis.azurecr.io/openstack/extra/cloudprober:v0.12.9 |
Apache License 2.0 |
neutron |
mirantis.azurecr.io/openstack/neutron:antelope-jammy-20231013125630 |
Apache License 2.0 |
nova |
mirantis.azurecr.io/openstack/nova:antelope-jammy-20231013125630 |
Apache License 2.0 |
horizon |
mirantis.azurecr.io/openstack/horizon:antelope-jammy-20231013125630 |
Apache License 2.0 |
tempest |
mirantis.azurecr.io/openstack/tempest:antelope-jammy-20231013125630 |
Apache License 2.0 |
octavia |
mirantis.azurecr.io/openstack/octavia:antelope-jammy-20231013125630 |
Apache License 2.0 |
designate |
mirantis.azurecr.io/openstack/designate:antelope-jammy-20231013125630 |
Apache License 2.0 |
ironic |
mirantis.azurecr.io/openstack/ironic:antelope-jammy-20231013125630 |
Apache License 2.0 |
barbican |
mirantis.azurecr.io/openstack/barbican:antelope-jammy-20231013125630 |
Apache License 2.0 |
libvirt |
mirantis.azurecr.io/general/libvirt:8.0.x-jammy-20231006073052 |
LGPL-2.1 License |
pause |
mirantis.azurecr.io/general/external/pause:3.1 |
Apache License 2.0 |
openvswitch |
mirantis.azurecr.io/general/openvswitch:2.17-jammy-20231006073052 |
Apache License 2.0 |
openvswitch-dpdk |
mirantis.azurecr.io/general/openvswitch-dpdk:2.17-jammy-20231006073052 |
Apache License 2.0 |
openstack-tools |
mirantis.azurecr.io/openstack/openstack-tools:yoga-jammy-20231013125630 |
Apache License 2.0 |
rabbitmq-3.10.x |
mirantis.azurecr.io/openstack/extra/rabbitmq:3.10.18-focal-20230222154055 |
Mozilla Public License 2.0 |
rabbitmq-3.10.x-management |
mirantis.azurecr.io/openstack/extra/rabbitmq-management:3.10.18-focal-20230222154055 |
Mozilla Public License 2.0 |
kubernetes-entrypoint |
mirantis.azurecr.io/openstack/extra/kubernetes-entrypoint:v1.0.1-5359171-20230810125608 |
Apache License 2.0 |
memcached |
mirantis.azurecr.io/general/memcached:v1.6.21-alpine-20230913050002 |
BSD 3-Clause “New” or “Revised” License |
etcd |
mirantis.azurecr.io/openstack/extra/etcd:v3.5.9-alpine-20230912131525 |
Apache License 2.0 |
powerdns |
mirantis.azurecr.io/openstack/extra/powerdns:4.7-alpine-20230817061604 |
GPL-2.0 License |
nginx-ingress-controller |
mirantis.azurecr.io/openstack/extra/nginx-ingress-controller:1.8.2-alpine-20230928053836 |
Apache License 2.0 |
tls-proxy |
mirantis.azurecr.io/openstack/tls-proxy:focal-fipster-20230725114156 |
Mirantis Proprietary License |
defaultbackend |
mirantis.azurecr.io/openstack/extra/defaultbackend:v1.19.2-77af1ef-20220823043839 |
Apache License 2.0 |
mariadb |
mirantis.azurecr.io/general/mariadb:10.6.14-focal-20230920121405 |
GPLv2, LGPLv2.1 (client libraries) |
rabbitmq-exporter |
mirantis.azurecr.io/stacklight/rabbitmq-exporter:1.0.0-RC19 |
MIT License |
memcached-exporter |
mirantis.azurecr.io/stacklight/memcached-exporter:v0.11.3 |
Apache License 2.0 |
prometheus-mysql-exporter |
mirantis.azurecr.io/stacklight/mysqld-exporter:v0.11.0 |
Apache License 2.0 |
aodh |
mirantis.azurecr.io/openstack/aodh:antelope-jammy-20231013125630 |
Apache License 2.0 |
ceilometer |
mirantis.azurecr.io/openstack/ceilometer:antelope-jammy-20231013125630 |
Apache License 2.0 |
gnocchi |
mirantis.azurecr.io/openstack/gnocchi:antelope-jammy-20231013125630 |
Apache License 2.0 |
redis |
mirantis.azurecr.io/tungsten/redis:7.2.1-alpine3.18 |
BSD 3-Clause “New” or “Revised” License |
frr |
mirantis.azurecr.io/general/external/docker.io/frrouting/frr:v8.5.1-20230619084330 |
GPL-2.0 and LGPL-2.1 |
strongswan |
mirantis.azurecr.io/openstack/extra/strongswan:alpine-5.9.8-20230928073518 |
GPL-2.0 |
rsyslog |
mirantis.azurecr.io/openstack/extra/rsyslog:v8.2001.0-20230920121951 |
GNU General Public License v3 |
descheduler |
mirantis.azurecr.io/openstack/extra/descheduler:v0.27.0 |
Apache License 2.0 |
nginx |
mirantis.azurecr.io/openstack/extra/nginx:1.25.1-alpine-slim |
Apache License 2.0 |
requirements |
mirantis.azurecr.io/openstack/requirements:antelope-jammy-20231013125630 |
Apache License 2.0 |
stepler |
mirantis.azurecr.io/openstack/stepler:antelope-jammy-20231006073052 |
Apache License 2.0 |
placement |
mirantis.azurecr.io/openstack/placement:antelope-jammy-20231013125630 |
Apache License 2.0 |
masakari |
mirantis.azurecr.io/openstack/masakari:antelope-jammy-20231013125630 |
Apache License 2.0 |
masakari-monitors |
mirantis.azurecr.io/openstack/masakari-monitors:antelope-jammy-20231013125630 |
Apache License 2.0 |
ironic-inspector |
mirantis.azurecr.io/openstack/ironic-inspector:antelope-jammy-20231013125630 |
Apache License 2.0 |
manila |
mirantis.azurecr.io/openstack/manila:antelope-jammy-20231013125630 |
Apache License 2.0 |
MOSK 23.3 OpenStack Helm charts
MOSK 23.3 Tungsten Fabric 21.4 artifacts
Component |
Path |
License information for main executable programs |
|---|---|---|
Helm charts |
||
Tungsten Fabric Operator |
https://binary.mirantis.com/tungsten/helm/tungstenfabric-operator-0.13.2.tgz |
Mirantis Proprietary License |
Docker images |
||
Tungsten Fabric Operator |
mirantis.azurecr.io/tungsten-operator/tungstenfabric-operator:0.13.2 |
Mirantis Proprietary License |
Analytics Alarm |
mirantis.azurecr.io/tungsten/contrail-analytics-alarm-gen:21.4.20230929000000 |
Apache License 2.0 |
Analytics |
mirantis.azurecr.io/tungsten/contrail-analytics-api:21.4.20230929000000 |
Apache License 2.0 |
mirantis.azurecr.io/tungsten/contrail-analytics-collector:21.4.20230929000000 |
Apache License 2.0 |
|
Analytics DB |
mirantis.azurecr.io/tungsten/contrail-analytics-query-engine:21.4.20230929000000 |
Apache License 2.0 |
Analytics SNMP |
mirantis.azurecr.io/tungsten/contrail-analytics-snmp-collector:21.4.20230929000000 |
Apache License 2.0 |
mirantis.azurecr.io/tungsten/contrail-analytics-snmp-topology:21.4.20230929000000 |
Apache License 2.0 |
|
Config |
mirantis.azurecr.io/tungsten/contrail-controller-config-api:21.4.20230929000000 |
Apache License 2.0 |
mirantis.azurecr.io/tungsten/contrail-controller-config-devicemgr:21.4.20230929000000 |
Apache License 2.0 |
|
mirantis.azurecr.io/tungsten/contrail-controller-config-dnsmasq:21.4.20230929000000 |
Apache License 2.0 |
|
mirantis.azurecr.io/tungsten/contrail-controller-config-schema:21.4.20230929000000 |
Apache License 2.0 |
|
mirantis.azurecr.io/tungsten/contrail-controller-config-svcmonitor:21.4.20230929000000 |
Apache License 2.0 |
|
Control |
mirantis.azurecr.io/tungsten/contrail-controller-control-control:21.4.20230929000000 |
Apache License 2.0 |
mirantis.azurecr.io/tungsten/contrail-controller-control-dns:21.4.20230929000000 |
Apache License 2.0 |
|
mirantis.azurecr.io/tungsten/contrail-controller-control-named:21.4.20230929000000 |
Apache License 2.0 |
|
Web UI |
mirantis.azurecr.io/tungsten/contrail-controller-webui-job:21.4.20230929000000 |
Apache License 2.0 |
mirantis.azurecr.io/tungsten/contrail-controller-webui-web:21.4.20230929000000 |
Apache License 2.0 |
|
Nodemanager |
mirantis.azurecr.io/tungsten/contrail-nodemgr:21.4.20230929000000 |
Apache License 2.0 |
vRouter |
mirantis.azurecr.io/tungsten/contrail-vrouter-agent:21.4.20230929000000 |
Apache License 2.0 |
mirantis.azurecr.io/tungsten/contrail-vrouter-agent-dpdk:21.4.20230929000000 |
Apache License 2.0 |
|
mirantis.azurecr.io/tungsten/contrail-node-init:21.4.20230929000000 |
Apache License 2.0 |
|
mirantis.azurecr.io/tungsten/contrail-vrouter-kernel-build-init:21.4.20230929000000 |
Apache License 2.0 |
|
Cassandra operator |
mirantis.azurecr.io/tungsten-operator/casskop:2.1.19 |
Apache License 2.0 |
Cassandra |
mirantis.azurecr.io/tungsten/cassandra-bootstrap:0.1.12 |
Apache License 2.0 |
mirantis.azurecr.io/tungsten/cassandra:3.11.10-20230622 |
Apache License 2.0 |
|
mirantis.azurecr.io/tungsten/instaclustr-icarus:v2-20230328121138 |
Apache License 2.0 |
|
mirantis.azurecr.io/tungsten/cass-config-builder:v2-20230830113546 |
Apache License 2.0 |
|
Kafka |
mirantis.azurecr.io/tungsten/cp-kafka:7.5.0 |
Apache License 2.0 |
mirantis.azurecr.io/stacklight/jmx-exporter:0.18.0-debian-11-r32 |
Apache License 2.0 |
|
Kafka operator |
mirantis.azurecr.io/tungsten-operator/kafka-k8s-operator:0.3.7 |
Mirantis Proprietary License |
RabbitMQ operator |
mirantis.azurecr.io/tungsten-operator/rabbitmq-operator:0.4.1 |
Mirantis Proprietary License |
RabbitMQ |
mirantis.azurecr.io/tungsten/rabbitmq:3.11.16 |
Mozilla Public License 2.0 |
mirantis.azurecr.io/stacklight/rabbitmq-exporter:1.0.0-RC19 |
MIT License |
|
ZooKeeper operator |
mirantis.azurecr.io/tungsten-operator/zookeeper-operator:0.2.19-mcp |
Apache License 2.0 |
ZooKeeper |
mirantis.azurecr.io/tungsten/zookeeper:3.8.1-20230425 |
Apache License 2.0 |
Redis operator |
mirantis.azurecr.io/tungsten-operator/redis-operator:0.4.1 |
Apache License 2.0 |
Redis |
mirantis.azurecr.io/tungsten/redis:7.2.1-alpine3.18 |
BSD 3-Clause “New” or “Revised” License |
mirantis.azurecr.io/stacklight/redis_exporter:v1.45.0 |
BSD 3-Clause “New” or “Revised” License |
|
TF Provisioner |
mirantis.azurecr.io/tungsten/contrail-provisioner:21.4.20230929000000 |
Apache License 2.0 |
TF Test |
mirantis.azurecr.io/tungsten/tungsten-pytest:0.1-20230921141620 |
MIT License |
TF CLI |
mirantis.azurecr.io/tungsten/tf-cli:0.1-20230927135644 |
MIT License |
TF NodeInfo |
mirantis.azurecr.io/tungsten/tf-nodeinfo:0.1-20230328120524 |
MIT License |
TF Tools |
mirantis.azurecr.io/tungsten/contrail-tools:21.4.20230929000000 |
Apache License 2.0 |
kubernetes-entrypoint |
mirantis.azurecr.io/openstack/extra/kubernetes-entrypoint:v1.0.1-5359171-20230810125608 |
Apache License 2.0 |
pause |
mirantis.azurecr.io/general/external/pause:3.1 |
Apache License 2.0 |
MOSK 23.3 StackLight artifacts
Component |
Path |
License information for main executable programs |
|---|---|---|
Docker images |
||
prometheus-libvirt-exporter |
mirantis.azurecr.io/stacklight/prometheus-libvirt-exporter:v0.2-20230929023009 |
Mirantis Proprietary License |
tungstenfabric-prometheus-exporter |
mirantis.azurecr.io/stacklight/tungstenfabric-prometheus-exporter:0.1-20230912105027 |
Mirantis Proprietary License |
Helm charts |
||
fluentd |
https://binary.mirantis.com/stacklight/helm/fluentd-2.0.3-mcp-49.tgz |
Mirantis Proprietary License |
prometheus-libvirt-exporter |
https://binary.mirantis.com/stacklight/helm/prometheus-libvirt-exporter-0.2.0-mcp-3.tgz |
Mirantis Proprietary License |
prometheus-tungstenfabric-exporter |
https://binary.mirantis.com/stacklight/helm/prometheus-tungstenfabric-exporter-0.2.0-mcp-3.tgz |
Mirantis Proprietary License |
The following issues have been addressed in the MOSK 23.3 release:
[OpenStack] [34897] Resolved the issue that caused the unavailability of machines from the nodes with DPDK after update of OpenStack from Victoria to Wallaby.
[OpenStack] [34411] Resolved the issue with an incorrect port value for RabbitMQ after update.
[OpenStack] [25124] Improved performance while sending data between instances affected by the Multiprotocol Label Switching over Generic Routing Encapsulation (MPLSoGRE) throughput limitation.
[TF] [30738] Fixed the issue that caused the
tf-vrouter-agentreadiness probe failure (No Configuration for self).[Update] [35111] Resolved the issue that caused the openstack-operator-ensure-resources job getting stuck in
CrashLoopBackOff.[WireGuard] [35147] Resolved the issue that prevented the WireGuard interface from having the IPv4 address assigned.
[Bare metal] [34342] Resolved the issue that caused a failure of the etcd pods due to the simultaneous deployment of several pods on a single node. To ensure that etcd pods are always placed on different nodes, MOSK now deploys etcd with the
requiredDuringSchedulingIgnoredDuringExecutionpolicy.[StackLight] [35738] Resolved the issue with
ucp-node-exporter. It was unable to bind port 9100, causing theucp-node-exporterstart failure. This issue was due to a conflict with the StackLightnode-exporter, which was also binding the same port.The resolution of the issue involves an automatic change of the port for the StackLight
node-exporterfrom 9100 to 19100. No manual port update is required.If your cluster uses a firewall, add an additional firewall rule that grants the same permissions to port 19100 as those currently assigned to port 9100 on all cluster nodes.
This section describes the specific actions you as a Cloud Operator need to complete to accurately plan and successfully perform your Mirantis OpenStack for Kubernetes (MOSK) cluster update to the version 23.3. Consider this information as a supplement to the generic update procedure published in Operations Guide: Update a MOSK cluster.
The MOSK cluster will obtain the newly implemented capabilities automatically with no significant impact on the update procedure.
As part of the update to MOSK 23.3, the following automatic updates of major component versions will take place:
MKE 3.6 with Kubernetes 1.24 to MKE 3.7 with Kubernetes 1.27
Open vSwitch 2.13 to 2.17
See also
The update to MOSK 23.3 does not include any version-specific impact on the cluster.
To properly plan the update maintenance window, use the following documentation:
Before updating the cluster, be sure to review the potential issues that may arise during the process and the recommended solutions to address them, as outlined in Update known issues.
Specifically, apply the workaround for the [37545] Cloud public API becomes inaccessible during update known issue.
In the 23.3 release series, MOSK stops supporting Ubuntu 18.04. Therefore, upgrade the operating system on your cluster machines to Ubuntu 20.04 before you update to MOSK 23.3. Otherwise, the Cluster release update for the cluster running on Ubuntu 18.04 becomes impossible.
It is not mandatory to upgrade all machines at once. You can upgrade them one by one or in small batches, for example, if the maintenance window is limited in time.
For details on distribution upgrade, see Upgrade an operating system distribution.
Warning
Make sure to manually reboot machines after the distribution upgrade before updating MOSK to 23.3.
MOSK supports the OpenStack Victoria version until September, 2023. MOSK 23.2 was the last release version where OpenStack Victoria packages were updated.
If you have not already upgraded your OpenStack version to Yoga, perform the upgrade before cluster update.
See also
While updating your cluster, the Instance High Availability service
(OpenStack Masakari) may not work as expected. Therefore, temporarily
disable the service by removing instance-ha from the service list
in the OpenStackDeployment custom resource.
During the update, you may encounter the issue that causes a failure of the etcd pods due to the simultaneous deployment of several pods on a single node.
Therefore, before starting the update, ensure that each OpenStack controller node runs only one etcd pod.
No specific actions are needed to finalize the cluster update.
In total, since MOSK 23.2 major release, in 23.3, 466 Common Vulnerabilities and Exposures (CVE) have been fixed: 24 of critical and 442 of high severity.
The table below includes the total numbers of addressed unique and common CVEs by MOSK-specific component since MOSK 23.2.3. The common CVEs are issues addressed across several images.
MOSK component |
CVE type |
Critical |
High |
Total |
|---|---|---|---|---|
OpenStack |
Unique |
0 |
19 |
19 |
Common |
0 |
45 |
45 |
|
Tungsten Fabric |
Unique |
2 |
19 |
21 |
Common |
2 |
57 |
59 |
Mirantis Security Portal
For the detailed list of fixed and present CVEs across the Mirantis Container Cloud and MOSK products, refer to Mirantis Security Portal.
Mirantis Container Cloud CVEs
For the number of fixed CVEs in the Mirantis Container Cloud-related components including kaas core, bare metal, Ceph, and StackLight, refer to Container Cloud 2.25.0: Security notes.
23.3.1 patch
The patch release notes contain the list of updated artifacts and Common Vulnerabilities and Exposures (CVE) fixes in images as well as description of the addressed product issues for the MOSK 23.3.1 patch.
For the list of enhancements and bug fixes that relate to Mirantis Container Cloud, refer to the Mirantis Container Cloud Release notes.
Release date |
November 27, 2023 |
|---|---|
Scope |
Patch |
Cluster release |
17.0.1 |
OpenStack Operator |
0.14.12 |
Tungsten Fabric Operator |
0.13.4 |
This section lists the components artifacts of the MOSK 23.3.1 release that includes binaries, Docker images, and Helm charts.
MOSK 23.3.1 OpenStack Antelope binaries and Docker images
Component |
Path |
License information for main executable programs |
|---|---|---|
Binaries |
||
octavia-amphora |
Mirantis Proprietary License |
|
mirantis |
Mirantis Proprietary License |
|
kernel |
GPL-2.0 |
|
initramfs |
GPL-2.0 |
|
service-image |
Mirantis Proprietary License |
|
Docker images |
||
keystone |
docker-dev-kaas-virtual.docker.mirantis.net/openstack/keystone:antelope-jammy-20231110182826 |
Apache License 2.0 |
heat |
docker-dev-kaas-virtual.docker.mirantis.net/openstack/heat:antelope-jammy-20231110182826 |
Apache License 2.0 |
glance |
docker-dev-kaas-virtual.docker.mirantis.net/openstack/glance:antelope-jammy-20231110182826 |
Apache License 2.0 |
cinder |
docker-dev-kaas-virtual.docker.mirantis.net/openstack/cinder:antelope-jammy-20231110182826 |
Apache License 2.0 |
cloudprober |
docker-dev-kaas-virtual.docker.mirantis.net/openstack/extra/cloudprober:main-rc1 |
Apache License 2.0 |
neutron |
docker-dev-kaas-virtual.docker.mirantis.net/openstack/neutron:antelope-jammy-20231110182826 |
Apache License 2.0 |
nova |
docker-dev-kaas-virtual.docker.mirantis.net/openstack/nova:antelope-jammy-20231110182826 |
Apache License 2.0 |
horizon |
docker-dev-kaas-virtual.docker.mirantis.net/openstack/horizon:antelope-jammy-20231110182826 |
Apache License 2.0 |
tempest |
docker-dev-kaas-virtual.docker.mirantis.net/openstack/tempest:antelope-jammy-20231110182826 |
Apache License 2.0 |
octavia |
docker-dev-kaas-virtual.docker.mirantis.net/openstack/octavia:antelope-jammy-20231110182826 |
Apache License 2.0 |
designate |
docker-dev-kaas-virtual.docker.mirantis.net/openstack/designate:antelope-jammy-20231110182826 |
Apache License 2.0 |
ironic |
docker-dev-kaas-virtual.docker.mirantis.net/openstack/ironic:antelope-jammy-20231110182826 |
Apache License 2.0 |
barbican |
docker-dev-kaas-virtual.docker.mirantis.net/openstack/barbican:antelope-jammy-20231110182826 |
Apache License 2.0 |
libvirt |
docker-dev-kaas-virtual.docker.mirantis.net/general/libvirt:8.0.x-jammy-20231018050930 |
LGPL-2.1 License |
pause |
docker-dev-kaas-virtual.docker.mirantis.net/general/external/pause:3.1 |
Apache License 2.0 |
openvswitch |
docker-dev-kaas-virtual.docker.mirantis.net/general/openvswitch:2.17-jammy-20231018050930 |
Apache License 2.0 |
openvswitch-dpdk |
docker-dev-kaas-virtual.docker.mirantis.net/general/openvswitch-dpdk:2.17-jammy-20231018050930 |
Apache License 2.0 |
openstack-tools |
docker-dev-kaas-virtual.docker.mirantis.net/openstack/openstack-tools:yoga-jammy-20231110182826 |
Apache License 2.0 |
rabbitmq-3.10.x |
docker-dev-kaas-virtual.docker.mirantis.net/openstack/extra/rabbitmq:3.10.18-focal-20230222154055 |
Mozilla Public License 2.0 |
rabbitmq-3.10.x-management |
docker-dev-kaas-virtual.docker.mirantis.net/openstack/extra/rabbitmq-management:3.10.18-focal-20230222154055 |
Mozilla Public License 2.0 |
kubernetes-entrypoint |
docker-dev-kaas-virtual.docker.mirantis.net/openstack/extra/kubernetes-entrypoint:v1.0.1-55b02f7-20231019172556 |
Apache License 2.0 |
memcached |
docker-dev-kaas-virtual.docker.mirantis.net/general/memcached:v1.6.21-alpine-20230913050002 |
BSD 3-Clause “New” or “Revised” License |
etcd |
docker-dev-kaas-virtual.docker.mirantis.net/openstack/extra/etcd:v3.5.10-alpine-20231031103038 |
Apache License 2.0 |
powerdns |
docker-dev-kaas-virtual.docker.mirantis.net/openstack/extra/powerdns:4.7-alpine-20230817061604 |
GPL-2.0 License |
nginx-ingress-controller |
docker-dev-kaas-virtual.docker.mirantis.net/openstack/extra/nginx-ingress-controller:1.9.3 |
Apache License 2.0 |
tls-proxy |
docker-dev-kaas-virtual.docker.mirantis.net/openstack/tls-proxy:focal-fipster-20230725114156 |
Mirantis Proprietary License |
defaultbackend |
docker-dev-kaas-virtual.docker.mirantis.net/openstack/extra/defaultbackend:v1.19.2-77af1ef-20220823043839 |
Apache License 2.0 |
mariadb |
docker-dev-kaas-virtual.docker.mirantis.net/general/mariadb:10.6.14-focal-20231024091216 |
GPLv2, LGPLv2.1 (client libraries) |
rabbitmq-exporter |
docker-dev-kaas-virtual.docker.mirantis.net/stacklight/rabbitmq-exporter:1.0.0-RC19 |
MIT License |
memcached-exporter |
docker-dev-kaas-virtual.docker.mirantis.net/stacklight/memcached-exporter:v0.11.3 |
Apache License 2.0 |
prometheus-mysql-exporter |
docker-dev-kaas-virtual.docker.mirantis.net/stacklight/mysqld-exporter:v0.11.0 |
Apache License 2.0 |
aodh |
docker-dev-kaas-virtual.docker.mirantis.net/openstack/aodh:antelope-jammy-20231110182826 |
Apache License 2.0 |
ceilometer |
docker-dev-kaas-virtual.docker.mirantis.net/openstack/ceilometer:antelope-jammy-20231110182826 |
Apache License 2.0 |
gnocchi |
docker-dev-kaas-virtual.docker.mirantis.net/openstack/gnocchi:antelope-jammy-20231110182826 |
Apache License 2.0 |
redis |
docker-dev-kaas-virtual.docker.mirantis.net/tungsten/redis:7.2.1-alpine3.18 |
BSD 3-Clause “New” or “Revised” License |
frr |
docker-dev-kaas-virtual.docker.mirantis.net/general/external/docker.io/frrouting/frr:v8.5.1-20230619084330 |
GPL-2.0 and LGPL-2.1 |
strongswan |
docker-dev-kaas-virtual.docker.mirantis.net/openstack/extra/strongswan:alpine-5.9.8-20231021164312 |
GPL-2.0 |
rsyslog |
docker-dev-kaas-virtual.docker.mirantis.net/openstack/extra/rsyslog:v8.2001.0-20231018050930 |
GNU General Public License v3 |
descheduler |
docker-dev-kaas-virtual.docker.mirantis.net/openstack/extra/descheduler:v0.27.0 |
Apache License 2.0 |
nginx |
docker-dev-kaas-virtual.docker.mirantis.net/openstack/extra/nginx:1.25.1-alpine-slim |
Apache License 2.0 |
requirements |
docker-dev-kaas-virtual.docker.mirantis.net/openstack/requirements:antelope-jammy-20231110182826 |
Apache License 2.0 |
stepler |
docker-dev-kaas-virtual.docker.mirantis.net/openstack/stepler:antelope-jammy-20231109062439 |
Apache License 2.0 |
placement |
docker-dev-kaas-virtual.docker.mirantis.net/openstack/placement:antelope-jammy-20231110182826 |
Apache License 2.0 |
masakari |
docker-dev-kaas-virtual.docker.mirantis.net/openstack/masakari:antelope-jammy-20231110182826 |
Apache License 2.0 |
masakari-monitors |
docker-dev-kaas-virtual.docker.mirantis.net/openstack/masakari-monitors:antelope-jammy-20231110182826 |
Apache License 2.0 |
ironic-inspector |
docker-dev-kaas-virtual.docker.mirantis.net/openstack/ironic-inspector:antelope-jammy-20231110182826 |
Apache License 2.0 |
manila |
docker-dev-kaas-virtual.docker.mirantis.net/openstack/manila:antelope-jammy-20231110182826 |
Apache License 2.0 |
MOSK 23.3.1 OpenStack Yoga binaries and Docker images
Component |
Path |
License information for main executable programs |
|---|---|---|
Binaries |
||
octavia-amphora |
Mirantis Proprietary License |
|
mirantis |
Mirantis Proprietary License |
|
kernel |
GPL-2.0 |
|
initramfs |
GPL-2.0 |
|
service-image |
Mirantis Proprietary License |
|
Docker images |
||
keystone |
docker-dev-kaas-virtual.docker.mirantis.net/openstack/keystone:yoga-jammy-20231110182826 |
Apache License 2.0 |
heat |
docker-dev-kaas-virtual.docker.mirantis.net/openstack/heat:yoga-jammy-20231110182826 |
Apache License 2.0 |
glance |
docker-dev-kaas-virtual.docker.mirantis.net/openstack/glance:yoga-jammy-20231110182826 |
Apache License 2.0 |
cinder |
docker-dev-kaas-virtual.docker.mirantis.net/openstack/cinder:yoga-jammy-20231110182826 |
Apache License 2.0 |
cloudprober |
docker-dev-kaas-virtual.docker.mirantis.net/openstack/extra/cloudprober:main-rc1 |
Apache License 2.0 |
neutron |
docker-dev-kaas-virtual.docker.mirantis.net/openstack/neutron:yoga-jammy-20231110182826 |
Apache License 2.0 |
nova |
docker-dev-kaas-virtual.docker.mirantis.net/openstack/nova:yoga-jammy-20231110182826 |
Apache License 2.0 |
horizon |
docker-dev-kaas-virtual.docker.mirantis.net/openstack/horizon:yoga-jammy-20231110182826 |
Apache License 2.0 |
tempest |
docker-dev-kaas-virtual.docker.mirantis.net/openstack/tempest:yoga-jammy-20231110182826 |
Apache License 2.0 |
octavia |
docker-dev-kaas-virtual.docker.mirantis.net/openstack/octavia:yoga-jammy-20231110182826 |
Apache License 2.0 |
designate |
docker-dev-kaas-virtual.docker.mirantis.net/openstack/designate:yoga-jammy-20231110182826 |
Apache License 2.0 |
ironic |
docker-dev-kaas-virtual.docker.mirantis.net/openstack/ironic:yoga-jammy-20231110182826 |
Apache License 2.0 |
barbican |
docker-dev-kaas-virtual.docker.mirantis.net/openstack/barbican:yoga-jammy-20231110182826 |
Apache License 2.0 |
libvirt |
docker-dev-kaas-virtual.docker.mirantis.net/general/libvirt:8.0.x-jammy-20231018050930 |
LGPL-2.1 License |
pause |
docker-dev-kaas-virtual.docker.mirantis.net/general/external/pause:3.1 |
Apache License 2.0 |
openvswitch |
docker-dev-kaas-virtual.docker.mirantis.net/general/openvswitch:2.17-jammy-20231018050930 |
Apache License 2.0 |
openvswitch-dpdk |
docker-dev-kaas-virtual.docker.mirantis.net/general/openvswitch-dpdk:2.17-jammy-20231018050930 |
Apache License 2.0 |
openstack-tools |
docker-dev-kaas-virtual.docker.mirantis.net/openstack/openstack-tools:yoga-jammy-20231110182826 |
Apache License 2.0 |
rabbitmq-3.10.x |
docker-dev-kaas-virtual.docker.mirantis.net/openstack/extra/rabbitmq:3.10.18-focal-20230222154055 |
Mozilla Public License 2.0 |
rabbitmq-3.10.x-management |
docker-dev-kaas-virtual.docker.mirantis.net/openstack/extra/rabbitmq-management:3.10.18-focal-20230222154055 |
Mozilla Public License 2.0 |
kubernetes-entrypoint |
docker-dev-kaas-virtual.docker.mirantis.net/openstack/extra/kubernetes-entrypoint:v1.0.1-55b02f7-20231019172556 |
Apache License 2.0 |
memcached |
docker-dev-kaas-virtual.docker.mirantis.net/general/memcached:v1.6.21-alpine-20230913050002 |
BSD 3-Clause “New” or “Revised” License |
etcd |
docker-dev-kaas-virtual.docker.mirantis.net/openstack/extra/etcd:v3.5.10-alpine-20231031103038 |
Apache License 2.0 |
powerdns |
docker-dev-kaas-virtual.docker.mirantis.net/openstack/extra/powerdns:4.7-alpine-20230817061604 |
GPL-2.0 License |
nginx-ingress-controller |
docker-dev-kaas-virtual.docker.mirantis.net/openstack/extra/nginx-ingress-controller:1.9.3 |
Apache License 2.0 |
tls-proxy |
docker-dev-kaas-virtual.docker.mirantis.net/openstack/tls-proxy:focal-fipster-20230725114156 |
Mirantis Proprietary License |
defaultbackend |
docker-dev-kaas-virtual.docker.mirantis.net/openstack/extra/defaultbackend:v1.19.2-77af1ef-20220823043839 |
Apache License 2.0 |
mariadb |
docker-dev-kaas-virtual.docker.mirantis.net/general/mariadb:10.6.14-focal-20231024091216 |
GPLv2, LGPLv2.1 (client libraries) |
rabbitmq-exporter |
docker-dev-kaas-virtual.docker.mirantis.net/stacklight/rabbitmq-exporter:1.0.0-RC19 |
MIT License |
memcached-exporter |
docker-dev-kaas-virtual.docker.mirantis.net/stacklight/memcached-exporter:v0.11.3 |
Apache License 2.0 |
prometheus-mysql-exporter |
docker-dev-kaas-virtual.docker.mirantis.net/stacklight/mysqld-exporter:v0.11.0 |
Apache License 2.0 |
aodh |
docker-dev-kaas-virtual.docker.mirantis.net/openstack/aodh:yoga-jammy-20231110182826 |
Apache License 2.0 |
ceilometer |
docker-dev-kaas-virtual.docker.mirantis.net/openstack/ceilometer:yoga-jammy-20231110182826 |
Apache License 2.0 |
gnocchi |
docker-dev-kaas-virtual.docker.mirantis.net/openstack/gnocchi:yoga-jammy-20231110182826 |
Apache License 2.0 |
redis |
docker-dev-kaas-virtual.docker.mirantis.net/tungsten/redis:7.2.1-alpine3.18 |
BSD 3-Clause “New” or “Revised” License |
frr |
docker-dev-kaas-virtual.docker.mirantis.net/general/external/docker.io/frrouting/frr:v8.5.1-20230619084330 |
GPL-2.0 and LGPL-2.1 |
strongswan |
docker-dev-kaas-virtual.docker.mirantis.net/openstack/extra/strongswan:alpine-5.9.8-20231021164312 |
GPL-2.0 |
rsyslog |
docker-dev-kaas-virtual.docker.mirantis.net/openstack/extra/rsyslog:v8.2001.0-20231018050930 |
GNU General Public License v3 |
descheduler |
docker-dev-kaas-virtual.docker.mirantis.net/openstack/extra/descheduler:v0.27.0 |
Apache License 2.0 |
nginx |
docker-dev-kaas-virtual.docker.mirantis.net/openstack/extra/nginx:1.25.1-alpine-slim |
Apache License 2.0 |
requirements |
docker-dev-kaas-virtual.docker.mirantis.net/openstack/requirements:yoga-jammy-20231110182826 |
Apache License 2.0 |
stepler |
docker-dev-kaas-virtual.docker.mirantis.net/openstack/stepler:yoga-focal-20231108073953 |
Apache License 2.0 |
placement |
docker-dev-kaas-virtual.docker.mirantis.net/openstack/placement:yoga-jammy-20231110182826 |
Apache License 2.0 |
masakari |
docker-dev-kaas-virtual.docker.mirantis.net/openstack/masakari:yoga-jammy-20231110182826 |
Apache License 2.0 |
masakari-monitors |
docker-dev-kaas-virtual.docker.mirantis.net/openstack/masakari-monitors:yoga-jammy-20231110182826 |
Apache License 2.0 |
ironic-inspector |
docker-dev-kaas-virtual.docker.mirantis.net/openstack/ironic-inspector:yoga-jammy-20231110182826 |
Apache License 2.0 |
manila |
docker-dev-kaas-virtual.docker.mirantis.net/openstack/manila:yoga-jammy-20231110182826 |
Apache License 2.0 |
MOSK 23.3.1 OpenStack Helm charts
Component |
Path |
License information for main executable programs |
|---|---|---|
openstack-operator |
Mirantis Proprietary License |
|
aodh |
Apache License 2.0 (no License file in Helm chart) |
|
barbican |
Apache License 2.0 (no License file in Helm chart) |
|
ceilometer |
Apache License 2.0 (no License file in Helm chart) |
|
cinder |
Apache License 2.0 (no License file in Helm chart) |
|
designate |
Apache License 2.0 (no License file in Helm chart) |
|
glance |
Apache License 2.0 (no License file in Helm chart) |
|
heat |
Apache License 2.0 (no License file in Helm chart) |
|
horizon |
Apache License 2.0 (no License file in Helm chart) |
|
ironic |
Apache License 2.0 (no License file in Helm chart) |
|
keystone |
Apache License 2.0 (no License file in Helm chart) |
|
neutron |
Apache License 2.0 (no License file in Helm chart) |
|
nova |
Apache License 2.0 (no License file in Helm chart) |
|
octavia |
Apache License 2.0 (no License file in Helm chart) |
|
panko |
Apache License 2.0 (no License file in Helm chart) |
|
tempest |
Apache License 2.0 (no License file in Helm chart) |
|
stepler |
Apache License 2.0 (no License file in Helm chart) |
|
placement |
Apache License 2.0 (no License file in Helm chart) |
|
masakari |
Apache License 2.0 (no License file in Helm chart) |
|
manila |
Apache License 2.0 (no License file in Helm chart) |
|
ceph-rgw |
Apache License 2.0 (no License file in Helm chart) |
|
cloudprober |
Apache License 2.0 (no License file in Helm chart) |
|
etcd |
Apache License 2.0 (no License file in Helm chart) |
|
gnocchi |
Apache License 2.0 (no License file in Helm chart) |
|
helm-toolkit |
Apache License 2.0 (no License file in Helm chart) |
|
ingress |
Apache License 2.0 (no License file in Helm chart) |
|
libvirt |
Apache License 2.0 (no License file in Helm chart) |
|
mariadb |
Apache License 2.0 (no License file in Helm chart) |
|
memcached |
Apache License 2.0 (no License file in Helm chart) |
|
openvswitch |
Apache License 2.0 (no License file in Helm chart) |
|
powerdns |
Apache License 2.0 (no License file in Helm chart) |
|
rabbitmq |
Apache License 2.0 (no License file in Helm chart) |
|
frr |
Apache License 2.0 (no License file in Helm chart) |
|
iscsi |
Apache License 2.0 (no License file in Helm chart) |
|
strongswan |
Apache License 2.0 (no License file in Helm chart) |
|
descheduler |
Apache License 2.0 (no License file in Helm chart) |
MOSK 23.3.1 Tungsten Fabric 21.4 artifacts
Component |
Path |
License information for main executable programs |
|---|---|---|
Helm charts |
||
Tungsten Fabric Operator |
https://binary.mirantis.com/tungsten/helm/tungstenfabric-operator-0.13.4.tgz |
Mirantis Proprietary License |
Docker images |
||
tungstenfabric-operator |
mirantis.azurecr.io/tungsten-operator/tungstenfabric-operator:0.13.4 |
Mirantis Proprietary License |
tungsten-pytest |
mirantis.azurecr.io/tungsten/tungsten-pytest:0.1-20231018094104 |
MIT License |
casskop |
mirantis.azurecr.io/tungsten-operator/casskop:v2.2.0 |
Apache License 2.0 |
cassandra-bootstrap |
mirantis.azurecr.io/tungsten/cassandra-bootstrap:0.1.13 |
Apache License 2.0 |
cassandra |
mirantis.azurecr.io/tungsten/cassandra:3.11.10-20230622 |
Apache License 2.0 |
cassandra-config-builder |
mirantis.azurecr.io/tungsten/cass-config-builder:v2-20231026075239 |
Apache License 2.0 |
cassandra-backrest-sidecar |
mirantis.azurecr.io/tungsten/instaclustr-icarus:v2-20230328121138 |
Apache License 2.0 |
kafka-k8s-operator |
mirantis.azurecr.io/tungsten-operator/kafka-k8s-operator:0.3.8 |
Mirantis Proprietary License |
cp-kafka |
mirantis.azurecr.io/tungsten/cp-kafka:7.5.0 |
Apache License 2.0 |
kafka-jmx-exporter |
mirantis.azurecr.io/stacklight/jmx-exporter:0.18.0-debian-11-r32 |
Apache License 2.0 |
rabbitmq-operator |
mirantis.azurecr.io/tungsten-operator/rabbitmq-operator:0.4.2 |
Mirantis Proprietary License |
rabbitmq |
mirantis.azurecr.io/tungsten/rabbitmq:3.11.16 |
Mozilla Public License 2.0 |
rabbitmq-exporter |
mirantis.azurecr.io/stacklight/rabbitmq-exporter:1.0.0-RC19 |
MIT License |
zookeeper-operator |
mirantis.azurecr.io/tungsten-operator/zookeeper-operator:0.2.20-mcp |
Apache License 2.0 |
zookeeper |
mirantis.azurecr.io/tungsten/zookeeper:3.8.3-20231019 |
Apache License 2.0 |
redis-operator |
mirantis.azurecr.io/tungsten-operator/redis-operator:0.4.2 |
Apache License 2.0 |
redis |
mirantis.azurecr.io/tungsten/redis:7.2.1-alpine3.18 |
BSD 3-Clause “New” or “Revised” License |
redis-exporter |
mirantis.azurecr.io/stacklight/redis_exporter:v1.45.0 |
BSD 3-Clause “New” or “Revised” License |
tf-cli |
mirantis.azurecr.io/tungsten/tf-cli:0.1-20231025094005 |
MIT License |
kubernetes-entrypoint |
mirantis.azurecr.io/openstack/extra/kubernetes-entrypoint:v1.0.1-5359171-20230810125608 |
Apache License 2.0 |
pause |
mirantis.azurecr.io/general/external/pause:3.1 |
Apache License 2.0 |
tf-nodeinfo |
mirantis.azurecr.io/tungsten/tf-nodeinfo:0.1-20231017142953 |
MIT License |
contrail-analytics-alarm-gen |
mirantis.azurecr.io/tungsten/contrail-analytics-alarm-gen:23.3-r21.4.20231030213711 |
Apache License 2.0 |
contrail-analytics-api |
mirantis.azurecr.io/tungsten/contrail-analytics-api:23.3-r21.4.20231030213711 |
Apache License 2.0 |
contrail-analytics-collector |
mirantis.azurecr.io/tungsten/contrail-analytics-collector:23.3-r21.4.20231030213711 |
Apache License 2.0 |
contrail-analytics-query-engine |
mirantis.azurecr.io/tungsten/contrail-analytics-query-engine:23.3-r21.4.20231030213711 |
Apache License 2.0 |
contrail-analytics-snmp-collector |
mirantis.azurecr.io/tungsten/contrail-analytics-snmp-collector:23.3-r21.4.20231030213711 |
Apache License 2.0 |
contrail-analytics-snmp-topology |
mirantis.azurecr.io/tungsten/contrail-analytics-snmp-topology:23.3-r21.4.20231030213711 |
Apache License 2.0 |
contrail-controller-config-api |
mirantis.azurecr.io/tungsten/contrail-controller-config-api:23.3-r21.4.20231030213711 |
Apache License 2.0 |
contrail-controller-config-devicemgr |
mirantis.azurecr.io/tungsten/contrail-controller-config-devicemgr:23.3-r21.4.20231030213711 |
Apache License 2.0 |
contrail-controller-config-dnsmasq |
mirantis.azurecr.io/tungsten/contrail-controller-config-dnsmasq:23.3-r21.4.20231030213711 |
Apache License 2.0 |
contrail-controller-config-schema |
mirantis.azurecr.io/tungsten/contrail-controller-config-schema:23.3-r21.4.20231030213711 |
Apache License 2.0 |
contrail-controller-config-svcmonitor |
mirantis.azurecr.io/tungsten/contrail-controller-config-svcmonitor:23.3-r21.4.20231030213711 |
Apache License 2.0 |
contrail-controller-control-control |
mirantis.azurecr.io/tungsten/contrail-controller-control-control:23.3-r21.4.20231030213711 |
Apache License 2.0 |
contrail-controller-control-dns |
mirantis.azurecr.io/tungsten/contrail-controller-control-dns:23.3-r21.4.20231030213711 |
Apache License 2.0 |
contrail-controller-control-named |
mirantis.azurecr.io/tungsten/contrail-controller-control-named:23.3-r21.4.20231030213711 |
Apache License 2.0 |
contrail-controller-webui-job |
mirantis.azurecr.io/tungsten/contrail-controller-webui-job:23.3-r21.4.20231030213711 |
Apache License 2.0 |
contrail-controller-webui-web |
mirantis.azurecr.io/tungsten/contrail-controller-webui-web:23.3-r21.4.20231030213711 |
Apache License 2.0 |
contrail-node-init |
mirantis.azurecr.io/tungsten/contrail-node-init:21.4.20230929000000 |
Apache License 2.0 |
contrail-nodemgr |
mirantis.azurecr.io/tungsten/contrail-nodemgr:23.3-r21.4.20231030213711 |
Apache License 2.0 |
contrail-provisioner |
mirantis.azurecr.io/tungsten/contrail-provisioner:23.3-r21.4.20231030213711 |
Apache License 2.0 |
contrail-tools |
mirantis.azurecr.io/tungsten/contrail-tools:23.3-r21.4.20231030213711 |
Apache License 2.0 |
contrail-vrouter-agent |
mirantis.azurecr.io/tungsten/contrail-vrouter-agent:21.4.20230929000000 |
Apache License 2.0 |
contrail-vrouter-agent-dpdk |
mirantis.azurecr.io/tungsten/contrail-vrouter-agent-dpdk:21.4.20230929000000 |
Apache License 2.0 |
contrail-vrouter-kernel-build-init |
mirantis.azurecr.io/tungsten/contrail-vrouter-kernel-build-init:21.4.20230929000000 |
Apache License 2.0 |
MOSK 23.3.1 StackLight artifacts
Component |
Path |
License information for main executable programs |
|---|---|---|
Docker images |
||
prometheus-libvirt-exporter |
mirantis.azurecr.io/stacklight/prometheus-libvirt-exporter:v0.2-20231027023009 |
Mirantis Proprietary License |
tungstenfabric-prometheus-exporter |
mirantis.azurecr.io/stacklight/tungstenfabric-prometheus-exporter:0.1-20230912105027 |
Mirantis Proprietary License |
Helm charts |
||
fluentd |
https://binary.mirantis.com/stacklight/helm/fluentd-2.0.3-mcp-52.tgz |
Mirantis Proprietary License |
prometheus-libvirt-exporter |
https://binary.mirantis.com/stacklight/helm/prometheus-libvirt-exporter-0.2.0-mcp-7.tgz |
Mirantis Proprietary License |
prometheus-tungstenfabric-exporter |
https://binary.mirantis.com/stacklight/helm/prometheus-tungstenfabric-exporter-0.2.0-mcp-7.tgz |
Mirantis Proprietary License |
In total, since MOSK 23.3 release, in 23.3.1, 157 Common Vulnerabilities and Exposures (CVE) have been fixed: 5 of critical and 152 of high severity.
The table below includes the total numbers of addressed unique and common CVEs by MOSK-specific component since MOSK 23.2.3. The common CVEs are issues addressed across several images.
MOSK component |
CVE type |
Critical |
High |
Total |
|---|---|---|---|---|
OpenStack |
Unique |
1 |
16 |
17 |
Common |
3 |
69 |
72 |
|
Tungsten Fabric |
Unique |
1 |
15 |
16 |
Common |
2 |
83 |
85 |
Mirantis Security Portal
For the detailed list of fixed and present CVEs across the Mirantis Container Cloud and MOSK products, refer to Mirantis Security Portal.
Mirantis Container Cloud CVEs
For the number of fixed CVEs in the Mirantis Container Cloud-related components including kaas core, bare metal, Ceph, and StackLight, refer to Container Cloud 2.25.1: Security notes.
The following issues have been addressed in the MOSK 23.3.1 release:
[37012] Resolved the issue that caused the cluster update failure due to instances evacuation when they were not supposed to be evacuated.
[37083] Resolved the issue that caused Cloudprober to produce warnings about large amount of targets.
[37185] Resolved the issue that caused the OpenStack Controller to fail while applying the Manila Helm charts during the attempt to enable Manila through the
OpenStackDeploymentcustom resource.
Learn more about the release cadence
23.3.2 patch
The patch release notes contain the list of updated artifacts and Common Vulnerabilities and Exposures (CVE) fixes in images for the MOSK 23.3.2 patch.
For the list of enhancements and bug fixes that relate to Mirantis Container Cloud, refer to the Mirantis Container Cloud Release notes.
Release date |
December 05, 2023 |
|---|---|
Scope |
Patch |
Cluster release |
17.0.2 |
OpenStack Operator |
0.14.14 |
Tungsten Fabric Operator |
0.13.5 |
This section lists the components artifacts of the MOSK 23.3.2 release that includes binaries, Docker images, and Helm charts.
MOSK 23.3.2 OpenStack Antelope binaries and Docker images
Component |
Path |
License information for main executable programs |
|---|---|---|
Binaries |
||
octavia-amphora |
https://binary.mirantis.com/openstack/bin/octavia/amphora-x64-haproxy-antelope-20230927122744.qcow2 |
Mirantis Proprietary License |
mirantis |
https://binary.mirantis.com/openstack/bin/horizon/mirantis-antelope-18a1377-20230817112356.tar.gz |
Mirantis Proprietary License |
kernel |
GPL-2.0 |
|
initramfs |
https://binary.mirantis.com/openstack/bin/ironic/tinyipa/tinyipa-stable-antelope-20230831060811.gz |
GPL-2.0 |
service-image |
https://binary.mirantis.com/openstack/bin/manila/manila-service-image-20221228132450.qcow2 |
Mirantis Proprietary License |
Docker images |
||
keystone |
mirantis.azurecr.io/openstack/keystone:antelope-jammy-20231110182826 |
Apache License 2.0 |
heat |
mirantis.azurecr.io/openstack/heat:antelope-jammy-20231110182826 |
Apache License 2.0 |
glance |
mirantis.azurecr.io/openstack/glance:antelope-jammy-20231110182826 |
Apache License 2.0 |
cinder |
mirantis.azurecr.io/openstack/cinder:antelope-jammy-20231110182826 |
Apache License 2.0 |
cloudprober |
mirantis.azurecr.io/openstack/extra/cloudprober:v0.13.1-6-geb9d5960-20231120094223 |
Apache License 2.0 |
neutron |
mirantis.azurecr.io/openstack/neutron:antelope-jammy-20231110182826 |
Apache License 2.0 |
nova |
mirantis.azurecr.io/openstack/nova:antelope-jammy-20231110182826 |
Apache License 2.0 |
horizon |
mirantis.azurecr.io/openstack/horizon:antelope-jammy-20231110182826 |
Apache License 2.0 |
tempest |
mirantis.azurecr.io/openstack/tempest:antelope-jammy-20231110182826 |
Apache License 2.0 |
octavia |
mirantis.azurecr.io/openstack/octavia:antelope-jammy-20231110182826 |
Apache License 2.0 |
designate |
mirantis.azurecr.io/openstack/designate:antelope-jammy-20231110182826 |
Apache License 2.0 |
ironic |
mirantis.azurecr.io/openstack/ironic:antelope-jammy-20231110182826 |
Apache License 2.0 |
barbican |
mirantis.azurecr.io/openstack/barbican:antelope-jammy-20231110182826 |
Apache License 2.0 |
libvirt |
mirantis.azurecr.io/general/libvirt:8.0.x-jammy-20231114112207 |
LGPL-2.1 License |
pause |
mirantis.azurecr.io/general/external/pause:3.1 |
Apache License 2.0 |
openvswitch |
mirantis.azurecr.io/general/openvswitch:2.17-jammy-20231018050930 |
Apache License 2.0 |
openvswitch-dpdk |
mirantis.azurecr.io/general/openvswitch-dpdk:2.17-jammy-20231018050930 |
Apache License 2.0 |
openstack-tools |
mirantis.azurecr.io/openstack/openstack-tools:yoga-jammy-20231110182826 |
Apache License 2.0 |
rabbitmq-3.10.x |
mirantis.azurecr.io/openstack/extra/rabbitmq:3.10.18-focal-20230222154055 |
Mozilla Public License 2.0 |
rabbitmq-3.10.x-management |
mirantis.azurecr.io/openstack/extra/rabbitmq-management:3.10.18-focal-20230222154055 |
Mozilla Public License 2.0 |
kubernetes-entrypoint |
mirantis.azurecr.io/openstack/extra/kubernetes-entrypoint:v1.0.1-55b02f7-20231019172556 |
Apache License 2.0 |
memcached |
mirantis.azurecr.io/general/memcached:v1.6.22-alpine-20231117094504 |
BSD 3-Clause “New” or “Revised” License |
etcd |
mirantis.azurecr.io/openstack/extra/etcd:v3.5.10-alpine-20231117141230 |
Apache License 2.0 |
powerdns |
mirantis.azurecr.io/openstack/extra/powerdns:4.7-alpine-20231116135030 |
GPL-2.0 License |
nginx-ingress-controller |
mirantis.azurecr.io/openstack/extra/nginx-ingress-controller:1.9.3-alpine-20231120101958 |
Apache License 2.0 |
tls-proxy |
mirantis.azurecr.io/openstack/tls-proxy:focal-fipster-20230725114156 |
Mirantis Proprietary License |
defaultbackend |
mirantis.azurecr.io/openstack/extra/defaultbackend:v1.19.2-77af1ef-20220823043839 |
Apache License 2.0 |
mariadb |
mirantis.azurecr.io/general/mariadb:10.6.14-focal-20231024091216 |
GPLv2, LGPLv2.1 (client libraries) |
rabbitmq-exporter |
mirantis.azurecr.io/stacklight/rabbitmq-exporter:1.0.0-RC19 |
MIT License |
memcached-exporter |
mirantis.azurecr.io/stacklight/memcached-exporter:v0.11.3 |
Apache License 2.0 |
prometheus-mysql-exporter |
mirantis.azurecr.io/stacklight/mysqld-exporter:v0.11.0 |
Apache License 2.0 |
aodh |
mirantis.azurecr.io/openstack/aodh:antelope-jammy-20231110182826 |
Apache License 2.0 |
ceilometer |
mirantis.azurecr.io/openstack/ceilometer:antelope-jammy-20231110182826 |
Apache License 2.0 |
gnocchi |
mirantis.azurecr.io/openstack/gnocchi:antelope-jammy-20231110182826 |
Apache License 2.0 |
redis |
mirantis.azurecr.io/openstack/extra/redis:7.2.3-alpine3.18 |
BSD 3-Clause “New” or “Revised” License |
frr |
mirantis.azurecr.io/general/external/docker.io/frrouting/frr:v8.5.1-20231117093402 |
GPL-2.0 and LGPL-2.1 |
strongswan |
mirantis.azurecr.io/openstack/extra/strongswan:alpine-5.9.8-20231116165931 |
GPL-2.0 |
rsyslog |
mirantis.azurecr.io/openstack/extra/rsyslog:v8.2001.0-20231018050930 |
GNU General Public License v3 |
descheduler |
mirantis.azurecr.io/openstack/extra/descheduler:v0.27.0 |
Apache License 2.0 |
nginx |
mirantis.azurecr.io/openstack/extra/nginx:1.25.3-20231120120521 |
Apache License 2.0 |
requirements |
mirantis.azurecr.io/openstack/requirements:antelope-jammy-20231110182826 |
Apache License 2.0 |
stepler |
mirantis.azurecr.io/openstack/stepler:antelope-jammy-20231117084119 |
Apache License 2.0 |
placement |
mirantis.azurecr.io/openstack/placement:antelope-jammy-20231110182826 |
Apache License 2.0 |
masakari |
mirantis.azurecr.io/openstack/masakari:antelope-jammy-20231110182826 |
Apache License 2.0 |
masakari-monitors |
mirantis.azurecr.io/openstack/masakari-monitors:antelope-jammy-20231110182826 |
Apache License 2.0 |
ironic-inspector |
mirantis.azurecr.io/openstack/ironic-inspector:antelope-jammy-20231110182826 |
Apache License 2.0 |
manila |
mirantis.azurecr.io/openstack/manila:antelope-jammy-20231110182826 |
Apache License 2.0 |
MOSK 23.3.2 OpenStack Yoga binaries and Docker images
Component |
Path |
License information for main executable programs |
|---|---|---|
Binaries |
||
octavia-amphora |
https://binary.mirantis.com/openstack/bin/octavia/amphora-x64-haproxy-yoga-20230928140935.qcow2 |
Mirantis Proprietary License |
mirantis |
https://binary.mirantis.com/openstack/bin/horizon/mirantis-yoga-186584b-20230817112411.tar.gz |
Mirantis Proprietary License |
kernel |
https://binary.mirantis.com/openstack/bin/ironic/tinyipa/tinyipa-stable-yoga-20230128061113.vmlinuz |
GPL-2.0 |
initramfs |
https://binary.mirantis.com/openstack/bin/ironic/tinyipa/tinyipa-stable-yoga-20230128061113.gz |
GPL-2.0 |
service-image |
https://binary.mirantis.com/openstack/bin/manila/manila-service-image-20221228132450.qcow2 |
Mirantis Proprietary License |
Docker images |
||
keystone |
mirantis.azurecr.io/openstack/keystone:yoga-jammy-20231110182826 |
Apache License 2.0 |
heat |
mirantis.azurecr.io/openstack/heat:yoga-jammy-20231110182826 |
Apache License 2.0 |
glance |
mirantis.azurecr.io/openstack/glance:yoga-jammy-20231110182826 |
Apache License 2.0 |
cinder |
mirantis.azurecr.io/openstack/cinder:yoga-jammy-20231110182826 |
Apache License 2.0 |
cloudprober |
mirantis.azurecr.io/openstack/extra/cloudprober:v0.13.1-6-geb9d5960-20231120094223 |
Apache License 2.0 |
neutron |
mirantis.azurecr.io/openstack/neutron:yoga-jammy-20231110182826 |
Apache License 2.0 |
nova |
mirantis.azurecr.io/openstack/nova:yoga-jammy-20231110182826 |
Apache License 2.0 |
horizon |
mirantis.azurecr.io/openstack/horizon:yoga-jammy-20231110182826 |
Apache License 2.0 |
tempest |
mirantis.azurecr.io/openstack/tempest:yoga-jammy-20231110182826 |
Apache License 2.0 |
octavia |
mirantis.azurecr.io/openstack/octavia:yoga-jammy-20231110182826 |
Apache License 2.0 |
designate |
mirantis.azurecr.io/openstack/designate:yoga-jammy-20231110182826 |
Apache License 2.0 |
ironic |
mirantis.azurecr.io/openstack/ironic:yoga-jammy-20231110182826 |
Apache License 2.0 |
barbican |
mirantis.azurecr.io/openstack/barbican:yoga-jammy-20231110182826 |
Apache License 2.0 |
libvirt |
mirantis.azurecr.io/general/libvirt:8.0.x-jammy-20231114112207 |
LGPL-2.1 License |
pause |
mirantis.azurecr.io/general/external/pause:3.1 |
Apache License 2.0 |
openvswitch |
mirantis.azurecr.io/general/openvswitch:2.17-jammy-20231018050930 |
Apache License 2.0 |
openvswitch-dpdk |
mirantis.azurecr.io/general/openvswitch-dpdk:2.17-jammy-20231018050930 |
Apache License 2.0 |
openstack-tools |
mirantis.azurecr.io/openstack/openstack-tools:yoga-jammy-20231110182826 |
Apache License 2.0 |
rabbitmq-3.10.x |
mirantis.azurecr.io/openstack/extra/rabbitmq:3.10.18-focal-20230222154055 |
Mozilla Public License 2.0 |
rabbitmq-3.10.x-management |
mirantis.azurecr.io/openstack/extra/rabbitmq-management:3.10.18-focal-20230222154055 |
Mozilla Public License 2.0 |
kubernetes-entrypoint |
mirantis.azurecr.io/openstack/extra/kubernetes-entrypoint:v1.0.1-55b02f7-20231019172556 |
Apache License 2.0 |
memcached |
mirantis.azurecr.io/general/memcached:v1.6.22-alpine-20231117094504 |
BSD 3-Clause “New” or “Revised” License |
etcd |
mirantis.azurecr.io/openstack/extra/etcd:v3.5.10-alpine-20231117141230 |
Apache License 2.0 |
powerdns |
mirantis.azurecr.io/openstack/extra/powerdns:4.7-alpine-20231116135030 |
GPL-2.0 License |
nginx-ingress-controller |
mirantis.azurecr.io/openstack/extra/nginx-ingress-controller:1.9.3-alpine-20231120101958 |
Apache License 2.0 |
tls-proxy |
mirantis.azurecr.io/openstack/tls-proxy:focal-fipster-20230725114156 |
Mirantis Proprietary License |
defaultbackend |
mirantis.azurecr.io/openstack/extra/defaultbackend:v1.19.2-77af1ef-20220823043839 |
Apache License 2.0 |
mariadb |
mirantis.azurecr.io/general/mariadb:10.6.14-focal-20231024091216 |
GPLv2, LGPLv2.1 (client libraries) |
rabbitmq-exporter |
mirantis.azurecr.io/stacklight/rabbitmq-exporter:1.0.0-RC19 |
MIT License |
memcached-exporter |
mirantis.azurecr.io/stacklight/memcached-exporter:v0.11.3 |
Apache License 2.0 |
prometheus-mysql-exporter |
mirantis.azurecr.io/stacklight/mysqld-exporter:v0.11.0 |
Apache License 2.0 |
aodh |
mirantis.azurecr.io/openstack/aodh:yoga-jammy-20231110182826 |
Apache License 2.0 |
ceilometer |
mirantis.azurecr.io/openstack/ceilometer:yoga-jammy-20231110182826 |
Apache License 2.0 |
gnocchi |
mirantis.azurecr.io/openstack/gnocchi:yoga-jammy-20231110182826 |
Apache License 2.0 |
redis |
mirantis.azurecr.io/openstack/extra/redis:7.2.3-alpine3.18 |
BSD 3-Clause “New” or “Revised” License |
frr |
mirantis.azurecr.io/general/external/docker.io/frrouting/frr:v8.5.1-20231117093402 |
GPL-2.0 and LGPL-2.1 |
strongswan |
mirantis.azurecr.io/openstack/extra/strongswan:alpine-5.9.8-20231116165931 |
GPL-2.0 |
rsyslog |
mirantis.azurecr.io/openstack/extra/rsyslog:v8.2001.0-20231018050930 |
GNU General Public License v3 |
descheduler |
mirantis.azurecr.io/openstack/extra/descheduler:v0.27.0 |
Apache License 2.0 |
nginx |
mirantis.azurecr.io/openstack/extra/nginx:1.25.3-20231120120521 |
Apache License 2.0 |
requirements |
mirantis.azurecr.io/openstack/requirements:yoga-jammy-20231110182826 |
Apache License 2.0 |
stepler |
mirantis.azurecr.io/openstack/stepler:yoga-focal-20231117072125 |
Apache License 2.0 |
placement |
mirantis.azurecr.io/openstack/placement:yoga-jammy-20231110182826 |
Apache License 2.0 |
masakari |
mirantis.azurecr.io/openstack/masakari:yoga-jammy-20231110182826 |
Apache License 2.0 |
masakari-monitors |
mirantis.azurecr.io/openstack/masakari-monitors:yoga-jammy-20231110182826 |
Apache License 2.0 |
ironic-inspector |
mirantis.azurecr.io/openstack/ironic-inspector:yoga-jammy-20231110182826 |
Apache License 2.0 |
manila |
mirantis.azurecr.io/openstack/manila:yoga-jammy-20231110182826 |
Apache License 2.0 |
MOSK 23.3.2 OpenStack Helm charts
MOSK 23.3.2 Tungsten Fabric 21.4 artifacts
Component |
Path |
License information for main executable programs |
|---|---|---|
Helm charts |
||
Tungsten Fabric Operator |
https://binary.mirantis.com/tungsten/helm/tungstenfabric-operator-0.13.5.tgz |
Mirantis Proprietary License |
Docker images |
||
tungstenfabric-operator |
mirantis.azurecr.io/tungsten-operator/tungstenfabric-operator:0.13.5 |
Mirantis Proprietary License |
tungsten-pytest |
mirantis.azurecr.io/tungsten/tungsten-pytest:0.1-20231018094104 |
MIT License |
casskop |
mirantis.azurecr.io/tungsten-operator/casskop:v2.2.0 |
Apache License 2.0 |
cassandra-bootstrap |
mirantis.azurecr.io/tungsten/cassandra-bootstrap:0.1.13 |
Apache License 2.0 |
cassandra |
mirantis.azurecr.io/tungsten/cassandra:3.11.10-20230622 |
Apache License 2.0 |
cassandra-config-builder |
mirantis.azurecr.io/tungsten/cass-config-builder:v2-20231115112406 |
Apache License 2.0 |
cassandra-backrest-sidecar |
mirantis.azurecr.io/tungsten/instaclustr-icarus:v2-20230328121138 |
Apache License 2.0 |
kafka-k8s-operator |
mirantis.azurecr.io/tungsten-operator/kafka-k8s-operator:0.3.8 |
Mirantis Proprietary License |
cp-kafka |
mirantis.azurecr.io/tungsten/cp-kafka:7.5.2 |
Apache License 2.0 |
kafka-jmx-exporter |
mirantis.azurecr.io/stacklight/jmx-exporter:0.20.0-debian-11-r1 |
Apache License 2.0 |
rabbitmq-operator |
mirantis.azurecr.io/tungsten-operator/rabbitmq-operator:0.4.2 |
Mirantis Proprietary License |
rabbitmq |
mirantis.azurecr.io/tungsten/rabbitmq:3.11.16 |
Mozilla Public License 2.0 |
rabbitmq-exporter |
mirantis.azurecr.io/stacklight/rabbitmq-exporter:1.0.0-RC19 |
MIT License |
zookeeper-operator |
mirantis.azurecr.io/tungsten-operator/zookeeper-operator:0.2.20-mcp |
Apache License 2.0 |
zookeeper |
mirantis.azurecr.io/tungsten/zookeeper:3.8.3-20231019 |
Apache License 2.0 |
redis-operator |
mirantis.azurecr.io/tungsten-operator/redis-operator:0.4.2 |
Apache License 2.0 |
redis |
mirantis.azurecr.io/tungsten/redis:7.2.3-alpine |
BSD 3-Clause “New” or “Revised” License |
redis-exporter |
mirantis.azurecr.io/stacklight/redis_exporter:v1.45.0 |
BSD 3-Clause “New” or “Revised” License |
tf-cli |
mirantis.azurecr.io/tungsten/tf-cli:0.1-20231120173127 |
MIT License |
kubernetes-entrypoint |
mirantis.azurecr.io/openstack/extra/kubernetes-entrypoint:v1.0.1-5359171-20230810125608 |
Apache License 2.0 |
pause |
mirantis.azurecr.io/general/external/pause:3.1 |
Apache License 2.0 |
tf-nodeinfo |
mirantis.azurecr.io/tungsten/tf-nodeinfo:0.1-20231017142953 |
MIT License |
contrail-analytics-alarm-gen |
mirantis.azurecr.io/tungsten/contrail-analytics-alarm-gen:23.3-r21.4.20231030213711 |
Apache License 2.0 |
contrail-analytics-api |
mirantis.azurecr.io/tungsten/contrail-analytics-api:23.3-r21.4.20231030213711 |
Apache License 2.0 |
contrail-analytics-collector |
mirantis.azurecr.io/tungsten/contrail-analytics-collector:23.3-r21.4.20231030213711 |
Apache License 2.0 |
contrail-analytics-query-engine |
mirantis.azurecr.io/tungsten/contrail-analytics-query-engine:23.3-r21.4.20231030213711 |
Apache License 2.0 |
contrail-analytics-snmp-collector |
mirantis.azurecr.io/tungsten/contrail-analytics-snmp-collector:23.3-r21.4.20231030213711 |
Apache License 2.0 |
contrail-analytics-snmp-topology |
mirantis.azurecr.io/tungsten/contrail-analytics-snmp-topology:23.3-r21.4.20231030213711 |
Apache License 2.0 |
contrail-controller-config-api |
mirantis.azurecr.io/tungsten/contrail-controller-config-api:23.3-r21.4.20231030213711 |
Apache License 2.0 |
contrail-controller-config-devicemgr |
mirantis.azurecr.io/tungsten/contrail-controller-config-devicemgr:23.3-r21.4.20231030213711 |
Apache License 2.0 |
contrail-controller-config-dnsmasq |
mirantis.azurecr.io/tungsten/contrail-controller-config-dnsmasq:23.3-r21.4.20231030213711 |
Apache License 2.0 |
contrail-controller-config-schema |
mirantis.azurecr.io/tungsten/contrail-controller-config-schema:23.3-r21.4.20231030213711 |
Apache License 2.0 |
contrail-controller-config-svcmonitor |
mirantis.azurecr.io/tungsten/contrail-controller-config-svcmonitor:23.3-r21.4.20231030213711 |
Apache License 2.0 |
contrail-controller-control-control |
mirantis.azurecr.io/tungsten/contrail-controller-control-control:23.3-r21.4.20231030213711 |
Apache License 2.0 |
contrail-controller-control-dns |
mirantis.azurecr.io/tungsten/contrail-controller-control-dns:23.3-r21.4.20231030213711 |
Apache License 2.0 |
contrail-controller-control-named |
mirantis.azurecr.io/tungsten/contrail-controller-control-named:23.3-r21.4.20231030213711 |
Apache License 2.0 |
contrail-controller-webui-job |
mirantis.azurecr.io/tungsten/contrail-controller-webui-job:23.3-r21.4.20231030213711 |
Apache License 2.0 |
contrail-controller-webui-web |
mirantis.azurecr.io/tungsten/contrail-controller-webui-web:23.3-r21.4.20231030213711 |
Apache License 2.0 |
contrail-node-init |
mirantis.azurecr.io/tungsten/contrail-node-init:21.4.20230929000000 |
Apache License 2.0 |
contrail-nodemgr |
mirantis.azurecr.io/tungsten/contrail-nodemgr:23.3-r21.4.20231030213711 |
Apache License 2.0 |
contrail-provisioner |
mirantis.azurecr.io/tungsten/contrail-provisioner:23.3-r21.4.20231030213711 |
Apache License 2.0 |
contrail-tools |
mirantis.azurecr.io/tungsten/contrail-tools:23.3-r21.4.20231030213711 |
Apache License 2.0 |
contrail-vrouter-agent |
mirantis.azurecr.io/tungsten/contrail-vrouter-agent:21.4.20230929000000 |
Apache License 2.0 |
contrail-vrouter-agent-dpdk |
mirantis.azurecr.io/tungsten/contrail-vrouter-agent-dpdk:21.4.20230929000000 |
Apache License 2.0 |
contrail-vrouter-kernel-build-init |
mirantis.azurecr.io/tungsten/contrail-vrouter-kernel-build-init:21.4.20230929000000 |
Apache License 2.0 |
MOSK 23.3.2 StackLight artifacts
Component |
Path |
License information for main executable programs |
|---|---|---|
Docker images |
||
prometheus-libvirt-exporter |
mirantis.azurecr.io/stacklight/prometheus-libvirt-exporter:v0.2-20231117023009 |
Mirantis Proprietary License |
tungstenfabric-prometheus-exporter |
mirantis.azurecr.io/stacklight/tungstenfabric-prometheus-exporter:0.1-20230912105027 |
Mirantis Proprietary License |
Helm charts |
||
fluentd |
https://binary.mirantis.com/stacklight/helm/fluentd-2.0.3-mcp-52.tgz |
Mirantis Proprietary License |
prometheus-libvirt-exporter |
https://binary.mirantis.com/stacklight/helm/prometheus-libvirt-exporter-0.2.0-mcp-7.tgz |
Mirantis Proprietary License |
prometheus-tungstenfabric-exporter |
https://binary.mirantis.com/stacklight/helm/prometheus-tungstenfabric-exporter-0.2.0-mcp-7.tgz |
Mirantis Proprietary License |
The table below includes the total number of addressed unique and common CVEs by MOSK-specific component since MOSK 23.3.1. The common CVEs are issues addressed across several images.
Product component |
CVE type |
Critical |
High |
Total |
|---|---|---|---|---|
OpenStack |
Unique |
0 |
2 |
2 |
Common |
0 |
19 |
19 |
|
Tungsten Fabric |
Unique |
0 |
18 |
18 |
Common |
0 |
39 |
39 |
Mirantis Security Portal
For the detailed list of fixed and present CVEs across the Mirantis Container Cloud and MOSK products, refer to Mirantis Security Portal.
Mirantis Container Cloud CVEs
For the number of fixed CVEs in the Mirantis Container Cloud-related components including kaas core, bare metal, Ceph, and StackLight, refer to Container Cloud 2.25.2: Security notes.
Learn more about the release cadence
23.3.3 patch
The patch release notes contain the lists of updated artifacts and addressed product issues, as well as the details on Common Vulnerabilities and Exposures (CVE) fixes in images for the MOSK 23.3.3 patch.
For the list of enhancements and bug fixes that relate to Mirantis Container Cloud, refer to the Mirantis Container Cloud Release notes.
Release date |
December 18, 2023 |
|---|---|
Scope |
Patch |
Cluster release |
17.0.3 |
OpenStack Operator |
0.14.17 |
Tungsten Fabric Operator |
0.13.5 |
This section lists the components artifacts of the MOSK 23.3.3 release that includes binaries, Docker images, and Helm charts.
MOSK 23.3.3 OpenStack Antelope binaries and Docker images
Component |
Path |
License information for main executable programs |
|---|---|---|
Binaries |
||
octavia-amphora |
https://binary.mirantis.com/openstack/bin/octavia/amphora-x64-haproxy-antelope-20230927122744.qcow2 |
Mirantis Proprietary License |
mirantis |
https://binary.mirantis.com/openstack/bin/horizon/mirantis-antelope-18a1377-20230817112356.tar.gz |
Mirantis Proprietary License |
kernel |
GPL-2.0 |
|
initramfs |
https://binary.mirantis.com/openstack/bin/ironic/tinyipa/tinyipa-stable-antelope-20230831060811.gz |
GPL-2.0 |
service-image |
https://binary.mirantis.com/openstack/bin/manila/manila-service-image-20221228132450.qcow2 |
Mirantis Proprietary License |
Docker images |
||
keystone |
mirantis.azurecr.io/openstack/keystone:antelope-jammy-20231204144213 |
Apache License 2.0 |
heat |
mirantis.azurecr.io/openstack/heat:antelope-jammy-20231204144213 |
Apache License 2.0 |
glance |
mirantis.azurecr.io/openstack/glance:antelope-jammy-20231204144213 |
Apache License 2.0 |
cinder |
mirantis.azurecr.io/openstack/cinder:antelope-jammy-20231204144213 |
Apache License 2.0 |
cloudprober |
mirantis.azurecr.io/openstack/extra/cloudprober:v0.13.1-6-geb9d5960-20231120094223 |
Apache License 2.0 |
neutron |
mirantis.azurecr.io/openstack/neutron:antelope-jammy-20231204144213 |
Apache License 2.0 |
nova |
mirantis.azurecr.io/openstack/nova:antelope-jammy-20231204144213 |
Apache License 2.0 |
horizon |
mirantis.azurecr.io/openstack/horizon:antelope-jammy-20231204144213 |
Apache License 2.0 |
tempest |
mirantis.azurecr.io/openstack/tempest:antelope-jammy-20231204144213 |
Apache License 2.0 |
octavia |
mirantis.azurecr.io/openstack/octavia:antelope-jammy-20231204144213 |
Apache License 2.0 |
designate |
mirantis.azurecr.io/openstack/designate:antelope-jammy-20231204144213 |
Apache License 2.0 |
ironic |
mirantis.azurecr.io/openstack/ironic:antelope-jammy-20231204144213 |
Apache License 2.0 |
barbican |
mirantis.azurecr.io/openstack/barbican:antelope-jammy-20231204144213 |
Apache License 2.0 |
libvirt |
mirantis.azurecr.io/general/libvirt:8.0.x-jammy-20231114112207 |
LGPL-2.1 License |
pause |
mirantis.azurecr.io/general/external/pause:3.1 |
Apache License 2.0 |
openvswitch |
mirantis.azurecr.io/general/openvswitch:2.17-jammy-20231018050930 |
Apache License 2.0 |
openvswitch-dpdk |
mirantis.azurecr.io/general/openvswitch-dpdk:2.17-jammy-20231018050930 |
Apache License 2.0 |
openstack-tools |
mirantis.azurecr.io/openstack/openstack-tools:yoga-jammy-20231204144213 |
Apache License 2.0 |
rabbitmq-3.10.x |
mirantis.azurecr.io/openstack/extra/rabbitmq:3.10.18-focal-20230222154055 |
Mozilla Public License 2.0 |
rabbitmq-3.10.x-management |
mirantis.azurecr.io/openstack/extra/rabbitmq-management:3.10.18-focal-20230222154055 |
Mozilla Public License 2.0 |
kubernetes-entrypoint |
mirantis.azurecr.io/openstack/extra/kubernetes-entrypoint:v1.0.1-55b02f7-20231019172556 |
Apache License 2.0 |
memcached |
mirantis.azurecr.io/general/memcached:v1.6.22-alpine-20231117094504 |
BSD 3-Clause “New” or “Revised” License |
etcd |
mirantis.azurecr.io/openstack/extra/etcd:v3.5.10-alpine-20231117141230 |
Apache License 2.0 |
powerdns |
mirantis.azurecr.io/openstack/extra/powerdns:4.7-alpine-20231201092632 |
GPL-2.0 License |
nginx-ingress-controller |
mirantis.azurecr.io/openstack/extra/nginx-ingress-controller:1.9.3-alpine-20231120101958 |
Apache License 2.0 |
tls-proxy |
mirantis.azurecr.io/openstack/tls-proxy:focal-fipster-20230725114156 |
Mirantis Proprietary License |
defaultbackend |
mirantis.azurecr.io/openstack/extra/defaultbackend:v1.19.2-77af1ef-20220823043839 |
Apache License 2.0 |
mariadb |
mirantis.azurecr.io/general/mariadb:10.6.14-focal-20231127070342 |
GPLv2, LGPLv2.1 (client libraries) |
rabbitmq-exporter |
mirantis.azurecr.io/stacklight/rabbitmq-exporter:1.0.0-RC19 |
MIT License |
memcached-exporter |
mirantis.azurecr.io/stacklight/memcached-exporter:0-20231208095208 |
Apache License 2.0 |
prometheus-mysql-exporter |
mirantis.azurecr.io/stacklight/mysqld-exporter:v0.11.0 |
Apache License 2.0 |
aodh |
mirantis.azurecr.io/openstack/aodh:antelope-jammy-20231204144213 |
Apache License 2.0 |
ceilometer |
mirantis.azurecr.io/openstack/ceilometer:antelope-jammy-20231204144213 |
Apache License 2.0 |
gnocchi |
mirantis.azurecr.io/openstack/gnocchi:antelope-jammy-20231204144213 |
Apache License 2.0 |
redis |
mirantis.azurecr.io/openstack/extra/redis:7.2.3-alpine3.18 |
BSD 3-Clause “New” or “Revised” License |
frr |
mirantis.azurecr.io/general/external/docker.io/frrouting/frr:v8.5.1-20231117093402 |
GPL-2.0 and LGPL-2.1 |
strongswan |
mirantis.azurecr.io/openstack/extra/strongswan:alpine-5.9.8-20231116165931 |
GPL-2.0 |
rsyslog |
mirantis.azurecr.io/openstack/extra/rsyslog:v8.2001.0-20231018050930 |
GNU General Public License v3 |
descheduler |
mirantis.azurecr.io/openstack/extra/descheduler:v0.28.1 |
Apache License 2.0 |
nginx |
mirantis.azurecr.io/openstack/extra/nginx:1.25.3-20231120120521 |
Apache License 2.0 |
requirements |
mirantis.azurecr.io/openstack/requirements:antelope-jammy-20231204144213 |
Apache License 2.0 |
stepler |
mirantis.azurecr.io/openstack/stepler:antelope-jammy-20231205121024 |
Apache License 2.0 |
placement |
mirantis.azurecr.io/openstack/placement:antelope-jammy-20231204144213 |
Apache License 2.0 |
masakari |
mirantis.azurecr.io/openstack/masakari:antelope-jammy-20231204144213 |
Apache License 2.0 |
masakari-monitors |
mirantis.azurecr.io/openstack/masakari-monitors:antelope-jammy-20231204144213 |
Apache License 2.0 |
ironic-inspector |
mirantis.azurecr.io/openstack/ironic-inspector:antelope-jammy-20231204144213 |
Apache License 2.0 |
manila |
mirantis.azurecr.io/openstack/manila:antelope-jammy-20231204144213 |
Apache License 2.0 |
MOSK 23.3.3 OpenStack Yoga binaries and Docker images
Component |
Path |
License information for main executable programs |
|---|---|---|
Binaries |
||
octavia-amphora |
https://binary.mirantis.com/openstack/bin/octavia/amphora-x64-haproxy-yoga-20230928140935.qcow2 |
Mirantis Proprietary License |
mirantis |
https://binary.mirantis.com/openstack/bin/horizon/mirantis-yoga-186584b-20230817112411.tar.gz |
Mirantis Proprietary License |
kernel |
https://binary.mirantis.com/openstack/bin/ironic/tinyipa/tinyipa-stable-yoga-20230128061113.vmlinuz |
GPL-2.0 |
initramfs |
https://binary.mirantis.com/openstack/bin/ironic/tinyipa/tinyipa-stable-yoga-20230128061113.gz |
GPL-2.0 |
service-image |
https://binary.mirantis.com/openstack/bin/manila/manila-service-image-20221228132450.qcow2 |
Mirantis Proprietary License |
Docker images |
||
keystone |
mirantis.azurecr.io/openstack/keystone:yoga-jammy-20231204144213 |
Apache License 2.0 |
heat |
mirantis.azurecr.io/openstack/heat:yoga-jammy-20231204144213 |
Apache License 2.0 |
glance |
mirantis.azurecr.io/openstack/glance:yoga-jammy-20231204144213 |
Apache License 2.0 |
cinder |
mirantis.azurecr.io/openstack/cinder:yoga-jammy-20231204144213 |
Apache License 2.0 |
cloudprober |
mirantis.azurecr.io/openstack/extra/cloudprober:v0.13.1-6-geb9d5960-20231120094223 |
Apache License 2.0 |
neutron |
mirantis.azurecr.io/openstack/neutron:yoga-jammy-20231204144213 |
Apache License 2.0 |
nova |
mirantis.azurecr.io/openstack/nova:yoga-jammy-20231204144213 |
Apache License 2.0 |
horizon |
mirantis.azurecr.io/openstack/horizon:yoga-jammy-20231204144213 |
Apache License 2.0 |
tempest |
mirantis.azurecr.io/openstack/tempest:yoga-jammy-20231204144213 |
Apache License 2.0 |
octavia |
mirantis.azurecr.io/openstack/octavia:yoga-jammy-20231204144213 |
Apache License 2.0 |
designate |
mirantis.azurecr.io/openstack/designate:yoga-jammy-20231204144213 |
Apache License 2.0 |
ironic |
mirantis.azurecr.io/openstack/ironic:yoga-jammy-20231204144213 |
Apache License 2.0 |
barbican |
mirantis.azurecr.io/openstack/barbican:yoga-jammy-20231204144213 |
Apache License 2.0 |
libvirt |
mirantis.azurecr.io/general/libvirt:8.0.x-jammy-20231114112207 |
LGPL-2.1 License |
pause |
mirantis.azurecr.io/general/external/pause:3.1 |
Apache License 2.0 |
openvswitch |
mirantis.azurecr.io/general/openvswitch:2.17-jammy-20231018050930 |
Apache License 2.0 |
openvswitch-dpdk |
mirantis.azurecr.io/general/openvswitch-dpdk:2.17-jammy-20231018050930 |
Apache License 2.0 |
openstack-tools |
mirantis.azurecr.io/openstack/openstack-tools:yoga-jammy-20231204144213 |
Apache License 2.0 |
rabbitmq-3.10.x |
mirantis.azurecr.io/openstack/extra/rabbitmq:3.10.18-focal-20230222154055 |
Mozilla Public License 2.0 |
rabbitmq-3.10.x-management |
mirantis.azurecr.io/openstack/extra/rabbitmq-management:3.10.18-focal-20230222154055 |
Mozilla Public License 2.0 |
kubernetes-entrypoint |
mirantis.azurecr.io/openstack/extra/kubernetes-entrypoint:v1.0.1-55b02f7-20231019172556 |
Apache License 2.0 |
memcached |
mirantis.azurecr.io/general/memcached:v1.6.22-alpine-20231117094504 |
BSD 3-Clause “New” or “Revised” License |
etcd |
mirantis.azurecr.io/openstack/extra/etcd:v3.5.10-alpine-20231117141230 |
Apache License 2.0 |
powerdns |
mirantis.azurecr.io/openstack/extra/powerdns:4.7-alpine-20231201092632 |
GPL-2.0 License |
nginx-ingress-controller |
mirantis.azurecr.io/openstack/extra/nginx-ingress-controller:1.9.3-alpine-20231120101958 |
Apache License 2.0 |
tls-proxy |
mirantis.azurecr.io/openstack/tls-proxy:focal-fipster-20230725114156 |
Mirantis Proprietary License |
defaultbackend |
mirantis.azurecr.io/openstack/extra/defaultbackend:v1.19.2-77af1ef-20220823043839 |
Apache License 2.0 |
mariadb |
mirantis.azurecr.io/general/mariadb:10.6.14-focal-20231127070342 |
GPLv2, LGPLv2.1 (client libraries) |
rabbitmq-exporter |
mirantis.azurecr.io/stacklight/rabbitmq-exporter:1.0.0-RC19 |
MIT License |
memcached-exporter |
mirantis.azurecr.io/stacklight/memcached-exporter:0-20231208095208 |
Apache License 2.0 |
prometheus-mysql-exporter |
mirantis.azurecr.io/stacklight/mysqld-exporter:v0.11.0 |
Apache License 2.0 |
aodh |
mirantis.azurecr.io/openstack/aodh:yoga-jammy-20231204144213 |
Apache License 2.0 |
ceilometer |
mirantis.azurecr.io/openstack/ceilometer:yoga-jammy-20231204144213 |
Apache License 2.0 |
gnocchi |
mirantis.azurecr.io/openstack/gnocchi:yoga-jammy-20231204144213 |
Apache License 2.0 |
redis |
mirantis.azurecr.io/openstack/extra/redis:7.2.3-alpine3.18 |
BSD 3-Clause “New” or “Revised” License |
frr |
mirantis.azurecr.io/general/external/docker.io/frrouting/frr:v8.5.1-20231117093402 |
GPL-2.0 and LGPL-2.1 |
strongswan |
mirantis.azurecr.io/openstack/extra/strongswan:alpine-5.9.8-20231116165931 |
GPL-2.0 |
rsyslog |
mirantis.azurecr.io/openstack/extra/rsyslog:v8.2001.0-20231018050930 |
GNU General Public License v3 |
descheduler |
mirantis.azurecr.io/openstack/extra/descheduler:v0.28.1 |
Apache License 2.0 |
nginx |
mirantis.azurecr.io/openstack/extra/nginx:1.25.3-20231120120521 |
Apache License 2.0 |
requirements |
mirantis.azurecr.io/openstack/requirements:yoga-jammy-20231204144213 |
Apache License 2.0 |
stepler |
mirantis.azurecr.io/openstack/stepler:yoga-focal-20231205122540 |
Apache License 2.0 |
placement |
mirantis.azurecr.io/openstack/placement:yoga-jammy-20231204144213 |
Apache License 2.0 |
masakari |
mirantis.azurecr.io/openstack/masakari:yoga-jammy-20231204144213 |
Apache License 2.0 |
masakari-monitors |
mirantis.azurecr.io/openstack/masakari-monitors:yoga-jammy-20231204144213 |
Apache License 2.0 |
ironic-inspector |
mirantis.azurecr.io/openstack/ironic-inspector:yoga-jammy-20231204144213 |
Apache License 2.0 |
manila |
mirantis.azurecr.io/openstack/manila:yoga-jammy-20231204144213 |
Apache License 2.0 |
MOSK 23.3.3 OpenStack Helm charts
MOSK 23.3.3 Tungsten Fabric 21.4 artifacts
Component |
Path |
License information for main executable programs |
|---|---|---|
Helm charts |
||
Tungsten Fabric Operator |
https://binary.mirantis.com/tungsten/helm/tungstenfabric-operator-0.13.5.tgz |
Mirantis Proprietary License |
Docker images |
||
tungstenfabric-operator |
mirantis.azurecr.io/tungsten-operator/tungstenfabric-operator:0.13.5 |
Mirantis Proprietary License |
tungsten-pytest |
mirantis.azurecr.io/tungsten/tungsten-pytest:0.1-20231018094104 |
MIT License |
casskop |
mirantis.azurecr.io/tungsten-operator/casskop:v2.2.0 |
Apache License 2.0 |
cassandra-bootstrap |
mirantis.azurecr.io/tungsten/cassandra-bootstrap:0.1.13 |
Apache License 2.0 |
cassandra |
mirantis.azurecr.io/tungsten/cassandra:3.11.10-20230622 |
Apache License 2.0 |
cassandra-config-builder |
mirantis.azurecr.io/tungsten/cass-config-builder:v2-20231115112406 |
Apache License 2.0 |
cassandra-backrest-sidecar |
mirantis.azurecr.io/tungsten/instaclustr-icarus:v2-20230328121138 |
Apache License 2.0 |
kafka-k8s-operator |
mirantis.azurecr.io/tungsten-operator/kafka-k8s-operator:0.3.8 |
Mirantis Proprietary License |
cp-kafka |
mirantis.azurecr.io/tungsten/cp-kafka:7.5.2 |
Apache License 2.0 |
kafka-jmx-exporter |
mirantis.azurecr.io/stacklight/jmx-exporter:0.20.0-debian-11-r1 |
Apache License 2.0 |
rabbitmq-operator |
mirantis.azurecr.io/tungsten-operator/rabbitmq-operator:0.4.2 |
Mirantis Proprietary License |
rabbitmq |
mirantis.azurecr.io/tungsten/rabbitmq:3.11.16 |
Mozilla Public License 2.0 |
rabbitmq-exporter |
mirantis.azurecr.io/stacklight/rabbitmq-exporter:1.0.0-RC19 |
MIT License |
zookeeper-operator |
mirantis.azurecr.io/tungsten-operator/zookeeper-operator:0.2.20-mcp |
Apache License 2.0 |
zookeeper |
mirantis.azurecr.io/tungsten/zookeeper:3.8.3-20231019 |
Apache License 2.0 |
redis-operator |
mirantis.azurecr.io/tungsten-operator/redis-operator:0.4.2 |
Apache License 2.0 |
redis |
mirantis.azurecr.io/tungsten/redis:7.2.3-alpine |
BSD 3-Clause “New” or “Revised” License |
redis-exporter |
mirantis.azurecr.io/stacklight/redis_exporter:v1.45.0 |
BSD 3-Clause “New” or “Revised” License |
tf-cli |
mirantis.azurecr.io/tungsten/tf-cli:0.1-20231120173127 |
MIT License |
kubernetes-entrypoint |
mirantis.azurecr.io/openstack/extra/kubernetes-entrypoint:v1.0.1-5359171-20230810125608 |
Apache License 2.0 |
pause |
mirantis.azurecr.io/general/external/pause:3.1 |
Apache License 2.0 |
tf-nodeinfo |
mirantis.azurecr.io/tungsten/tf-nodeinfo:0.1-20231017142953 |
MIT License |
contrail-analytics-alarm-gen |
mirantis.azurecr.io/tungsten/contrail-analytics-alarm-gen:23.3-r21.4.20231030213711 |
Apache License 2.0 |
contrail-analytics-api |
mirantis.azurecr.io/tungsten/contrail-analytics-api:23.3-r21.4.20231030213711 |
Apache License 2.0 |
contrail-analytics-collector |
mirantis.azurecr.io/tungsten/contrail-analytics-collector:23.3-r21.4.20231030213711 |
Apache License 2.0 |
contrail-analytics-query-engine |
mirantis.azurecr.io/tungsten/contrail-analytics-query-engine:23.3-r21.4.20231030213711 |
Apache License 2.0 |
contrail-analytics-snmp-collector |
mirantis.azurecr.io/tungsten/contrail-analytics-snmp-collector:23.3-r21.4.20231030213711 |
Apache License 2.0 |
contrail-analytics-snmp-topology |
mirantis.azurecr.io/tungsten/contrail-analytics-snmp-topology:23.3-r21.4.20231030213711 |
Apache License 2.0 |
contrail-controller-config-api |
mirantis.azurecr.io/tungsten/contrail-controller-config-api:23.3-r21.4.20231030213711 |
Apache License 2.0 |
contrail-controller-config-devicemgr |
mirantis.azurecr.io/tungsten/contrail-controller-config-devicemgr:23.3-r21.4.20231030213711 |
Apache License 2.0 |
contrail-controller-config-dnsmasq |
mirantis.azurecr.io/tungsten/contrail-controller-config-dnsmasq:23.3-r21.4.20231030213711 |
Apache License 2.0 |
contrail-controller-config-schema |
mirantis.azurecr.io/tungsten/contrail-controller-config-schema:23.3-r21.4.20231030213711 |
Apache License 2.0 |
contrail-controller-config-svcmonitor |
mirantis.azurecr.io/tungsten/contrail-controller-config-svcmonitor:23.3-r21.4.20231030213711 |
Apache License 2.0 |
contrail-controller-control-control |
mirantis.azurecr.io/tungsten/contrail-controller-control-control:23.3-r21.4.20231030213711 |
Apache License 2.0 |
contrail-controller-control-dns |
mirantis.azurecr.io/tungsten/contrail-controller-control-dns:23.3-r21.4.20231030213711 |
Apache License 2.0 |
contrail-controller-control-named |
mirantis.azurecr.io/tungsten/contrail-controller-control-named:23.3-r21.4.20231030213711 |
Apache License 2.0 |
contrail-controller-webui-job |
mirantis.azurecr.io/tungsten/contrail-controller-webui-job:23.3-r21.4.20231030213711 |
Apache License 2.0 |
contrail-controller-webui-web |
mirantis.azurecr.io/tungsten/contrail-controller-webui-web:23.3-r21.4.20231030213711 |
Apache License 2.0 |
contrail-node-init |
mirantis.azurecr.io/tungsten/contrail-node-init:21.4.20230929000000 |
Apache License 2.0 |
contrail-nodemgr |
mirantis.azurecr.io/tungsten/contrail-nodemgr:23.3-r21.4.20231030213711 |
Apache License 2.0 |
contrail-provisioner |
mirantis.azurecr.io/tungsten/contrail-provisioner:23.3-r21.4.20231030213711 |
Apache License 2.0 |
contrail-tools |
mirantis.azurecr.io/tungsten/contrail-tools:23.3-r21.4.20231030213711 |
Apache License 2.0 |
contrail-vrouter-agent |
mirantis.azurecr.io/tungsten/contrail-vrouter-agent:21.4.20230929000000 |
Apache License 2.0 |
contrail-vrouter-agent-dpdk |
mirantis.azurecr.io/tungsten/contrail-vrouter-agent-dpdk:21.4.20230929000000 |
Apache License 2.0 |
contrail-vrouter-kernel-build-init |
mirantis.azurecr.io/tungsten/contrail-vrouter-kernel-build-init:21.4.20230929000000 |
Apache License 2.0 |
MOSK 23.3.3 StackLight artifacts
Component |
Path |
License information for main executable programs |
|---|---|---|
Docker images |
||
prometheus-libvirt-exporter |
mirantis.azurecr.io/stacklight/prometheus-libvirt-exporter:v0.2-20231201023010 |
Mirantis Proprietary License |
tungstenfabric-prometheus-exporter |
mirantis.azurecr.io/stacklight/tungstenfabric-prometheus-exporter:0.1-20231204150325 |
Mirantis Proprietary License |
Helm charts |
||
fluentd |
https://binary.mirantis.com/stacklight/helm/fluentd-2.0.3-mcp-52.tgz |
Mirantis Proprietary License |
prometheus-libvirt-exporter |
https://binary.mirantis.com/stacklight/helm/prometheus-libvirt-exporter-0.2.0-mcp-7.tgz |
Mirantis Proprietary License |
prometheus-tungstenfabric-exporter |
https://binary.mirantis.com/stacklight/helm/prometheus-tungstenfabric-exporter-0.2.0-mcp-7.tgz |
Mirantis Proprietary License |
The table below includes the total number of addressed unique and common CVEs by MOSK-specific component since MOSK 23.3.2. The common CVEs are issues addressed across several images.
Product component |
CVE type |
Critical |
High |
Total |
|---|---|---|---|---|
OpenStack |
Unique |
0 |
1 |
1 |
Common |
0 |
1 |
1 |
Mirantis Security Portal
For the detailed list of fixed and present CVEs across the Mirantis Container Cloud and MOSK products, refer to Mirantis Security Portal.
Mirantis Container Cloud CVEs
For the number of fixed CVEs in the Mirantis Container Cloud-related components including kaas core, bare metal, Ceph, and StackLight, refer to Container Cloud 2.25.3: Security notes.
The following issues have been addressed in the MOSK 23.3.3 release:
[37545] Resolved the issue that led to potential inaccessibility to the cloud public API for unpredictable durations during a cluster update.
Learn more about the release cadence
23.3.4 patch
The patch release notes contain the lists of updated artifacts and addressed product issues, as well as the details on Common Vulnerabilities and Exposures (CVE) fixes in images for the MOSK 23.3.4 patch.
For the list of enhancements and bug fixes that relate to Mirantis Container Cloud, refer to the Mirantis Container Cloud Release notes.
Release date |
January 10, 2023 |
|---|---|
Scope |
Patch |
Cluster release |
17.0.4 |
OpenStack Operator |
0.14.18 |
Tungsten Fabric Operator |
0.13.6 |
This section lists the components artifacts of the MOSK 23.3.4 release that includes binaries, Docker images, and Helm charts.
MOSK 23.3.4 OpenStack Antelope binaries and Docker images
Component |
Path |
License information for main executable programs |
|---|---|---|
Binaries |
||
octavia-amphora |
https://binary.mirantis.com/openstack/bin/octavia/amphora-x64-haproxy-antelope-20230927122744.qcow2 |
Mirantis Proprietary License |
mirantis |
https://binary.mirantis.com/openstack/bin/horizon/mirantis-antelope-18a1377-20230817112356.tar.gz |
Mirantis Proprietary License |
kernel |
GPL-2.0 |
|
initramfs |
https://binary.mirantis.com/openstack/bin/ironic/tinyipa/tinyipa-stable-antelope-20230831060811.gz |
GPL-2.0 |
service-image |
https://binary.mirantis.com/openstack/bin/manila/manila-service-image-20221228132450.qcow2 |
Mirantis Proprietary License |
Docker images |
||
keystone |
mirantis.azurecr.io/openstack/keystone:antelope-jammy-20231214160210 |
Apache License 2.0 |
heat |
mirantis.azurecr.io/openstack/heat:antelope-jammy-20231214160210 |
Apache License 2.0 |
glance |
mirantis.azurecr.io/openstack/glance:antelope-jammy-20231214160210 |
Apache License 2.0 |
cinder |
mirantis.azurecr.io/openstack/cinder:antelope-jammy-20231214160210 |
Apache License 2.0 |
cloudprober |
mirantis.azurecr.io/openstack/extra/cloudprober:v0.13.1-6-geb9d5960-20231120094223 |
Apache License 2.0 |
neutron |
mirantis.azurecr.io/openstack/neutron:antelope-jammy-20231214160210 |
Apache License 2.0 |
nova |
mirantis.azurecr.io/openstack/nova:antelope-jammy-20231214160210 |
Apache License 2.0 |
horizon |
mirantis.azurecr.io/openstack/horizon:antelope-jammy-20231214160210 |
Apache License 2.0 |
tempest |
mirantis.azurecr.io/openstack/tempest:antelope-jammy-20231214160210 |
Apache License 2.0 |
octavia |
mirantis.azurecr.io/openstack/octavia:antelope-jammy-20231214160210 |
Apache License 2.0 |
designate |
mirantis.azurecr.io/openstack/designate:antelope-jammy-20231214160210 |
Apache License 2.0 |
ironic |
mirantis.azurecr.io/openstack/ironic:antelope-jammy-20231214160210 |
Apache License 2.0 |
barbican |
mirantis.azurecr.io/openstack/barbican:antelope-jammy-20231214160210 |
Apache License 2.0 |
libvirt |
mirantis.azurecr.io/general/libvirt:8.0.x-jammy-20231211175451 |
LGPL-2.1 License |
pause |
mirantis.azurecr.io/general/external/pause:3.1 |
Apache License 2.0 |
openvswitch |
mirantis.azurecr.io/general/openvswitch:2.17-jammy-20231018050930 |
Apache License 2.0 |
openvswitch-dpdk |
mirantis.azurecr.io/general/openvswitch-dpdk:2.17-jammy-20231018050930 |
Apache License 2.0 |
openstack-tools |
mirantis.azurecr.io/openstack/openstack-tools:yoga-jammy-20231214151928 |
Apache License 2.0 |
rabbitmq-3.10.x |
mirantis.azurecr.io/openstack/extra/rabbitmq:3.10.18-focal-20230222154055 |
Mozilla Public License 2.0 |
rabbitmq-3.10.x-management |
mirantis.azurecr.io/openstack/extra/rabbitmq-management:3.10.18-focal-20230222154055 |
Mozilla Public License 2.0 |
kubernetes-entrypoint |
mirantis.azurecr.io/openstack/extra/kubernetes-entrypoint:v1.0.1-55b02f7-20231019172556 |
Apache License 2.0 |
memcached |
mirantis.azurecr.io/general/memcached:v1.6.22-alpine-20231117094504 |
BSD 3-Clause “New” or “Revised” License |
etcd |
mirantis.azurecr.io/openstack/extra/etcd:v3.5.11-alpine-20231211203412 |
Apache License 2.0 |
powerdns |
mirantis.azurecr.io/openstack/extra/powerdns:4.7-alpine-20231201092632 |
GPL-2.0 License |
nginx-ingress-controller |
mirantis.azurecr.io/openstack/extra/nginx-ingress-controller:1.9.3-alpine-20231120101958 |
Apache License 2.0 |
tls-proxy |
mirantis.azurecr.io/openstack/tls-proxy:focal-fipster-20230725114156 |
Mirantis Proprietary License |
defaultbackend |
mirantis.azurecr.io/openstack/extra/defaultbackend:v1.19.2-77af1ef-20220823043839 |
Apache License 2.0 |
mariadb |
mirantis.azurecr.io/general/mariadb:10.6.14-focal-20231127070342 |
GPLv2, LGPLv2.1 (client libraries) |
rabbitmq-exporter |
mirantis.azurecr.io/stacklight/rabbitmq-exporter:1.0.0-RC19 |
MIT License |
memcached-exporter |
mirantis.azurecr.io/stacklight/memcached-exporter:0-20231208095208 |
Apache License 2.0 |
prometheus-mysql-exporter |
mirantis.azurecr.io/stacklight/mysqld-exporter:v0.11.0 |
Apache License 2.0 |
aodh |
mirantis.azurecr.io/openstack/aodh:antelope-jammy-20231214160210 |
Apache License 2.0 |
ceilometer |
mirantis.azurecr.io/openstack/ceilometer:antelope-jammy-20231214160210 |
Apache License 2.0 |
gnocchi |
mirantis.azurecr.io/openstack/gnocchi:antelope-jammy-20231214160210 |
Apache License 2.0 |
redis |
mirantis.azurecr.io/openstack/extra/redis:7.2.3-alpine3.18 |
BSD 3-Clause “New” or “Revised” License |
frr |
mirantis.azurecr.io/general/external/docker.io/frrouting/frr:v8.5.1-20231117093402 |
GPL-2.0 and LGPL-2.1 |
strongswan |
mirantis.azurecr.io/openstack/extra/strongswan:alpine-5.9.8-20231116165931 |
GPL-2.0 |
rsyslog |
mirantis.azurecr.io/openstack/extra/rsyslog:v8.2001.0-20231018050930 |
GNU General Public License v3 |
descheduler |
mirantis.azurecr.io/openstack/extra/descheduler:v0.28.1 |
Apache License 2.0 |
nginx |
mirantis.azurecr.io/openstack/extra/nginx:1.25.3-20231120120521 |
Apache License 2.0 |
requirements |
mirantis.azurecr.io/openstack/requirements:antelope-jammy-20231214160210 |
Apache License 2.0 |
stepler |
mirantis.azurecr.io/openstack/stepler:antelope-jammy-20231205121024 |
Apache License 2.0 |
placement |
mirantis.azurecr.io/openstack/placement:antelope-jammy-20231214160210 |
Apache License 2.0 |
masakari |
mirantis.azurecr.io/openstack/masakari:antelope-jammy-20231214160210 |
Apache License 2.0 |
masakari-monitors |
mirantis.azurecr.io/openstack/masakari-monitors:antelope-jammy-20231214160210 |
Apache License 2.0 |
ironic-inspector |
mirantis.azurecr.io/openstack/ironic-inspector:antelope-jammy-20231214160210 |
Apache License 2.0 |
manila |
mirantis.azurecr.io/openstack/manila:antelope-jammy-20231214160210 |
Apache License 2.0 |
MOSK 23.3.4 OpenStack Yoga binaries and Docker images
Component |
Path |
License information for main executable programs |
|---|---|---|
Binaries |
||
octavia-amphora |
https://binary.mirantis.com/openstack/bin/octavia/amphora-x64-haproxy-yoga-20230928140935.qcow2 |
Mirantis Proprietary License |
mirantis |
https://binary.mirantis.com/openstack/bin/horizon/mirantis-yoga-186584b-20230817112411.tar.gz |
Mirantis Proprietary License |
kernel |
https://binary.mirantis.com/openstack/bin/ironic/tinyipa/tinyipa-stable-yoga-20230128061113.vmlinuz |
GPL-2.0 |
initramfs |
https://binary.mirantis.com/openstack/bin/ironic/tinyipa/tinyipa-stable-yoga-20230128061113.gz |
GPL-2.0 |
service-image |
https://binary.mirantis.com/openstack/bin/manila/manila-service-image-20221228132450.qcow2 |
Mirantis Proprietary License |
Docker images |
||
keystone |
mirantis.azurecr.io/openstack/keystone:yoga-jammy-20231214151928 |
Apache License 2.0 |
heat |
mirantis.azurecr.io/openstack/heat:yoga-jammy-20231214151928 |
Apache License 2.0 |
glance |
mirantis.azurecr.io/openstack/glance:yoga-jammy-20231214151928 |
Apache License 2.0 |
cinder |
mirantis.azurecr.io/openstack/cinder:yoga-jammy-20231214151928 |
Apache License 2.0 |
cloudprober |
mirantis.azurecr.io/openstack/extra/cloudprober:v0.13.1-6-geb9d5960-20231120094223 |
Apache License 2.0 |
neutron |
mirantis.azurecr.io/openstack/neutron:yoga-jammy-20231214151928 |
Apache License 2.0 |
nova |
mirantis.azurecr.io/openstack/nova:yoga-jammy-20231214151928 |
Apache License 2.0 |
horizon |
mirantis.azurecr.io/openstack/horizon:yoga-jammy-20231214151928 |
Apache License 2.0 |
tempest |
mirantis.azurecr.io/openstack/tempest:yoga-jammy-20231214151928 |
Apache License 2.0 |
octavia |
mirantis.azurecr.io/openstack/octavia:yoga-jammy-20231214151928 |
Apache License 2.0 |
designate |
mirantis.azurecr.io/openstack/designate:yoga-jammy-20231214151928 |
Apache License 2.0 |
ironic |
mirantis.azurecr.io/openstack/ironic:yoga-jammy-20231214151928 |
Apache License 2.0 |
barbican |
mirantis.azurecr.io/openstack/barbican:yoga-jammy-20231214151928 |
Apache License 2.0 |
libvirt |
mirantis.azurecr.io/general/libvirt:8.0.x-jammy-20231211175451 |
LGPL-2.1 License |
pause |
mirantis.azurecr.io/general/external/pause:3.1 |
Apache License 2.0 |
openvswitch |
mirantis.azurecr.io/general/openvswitch:2.17-jammy-20231018050930 |
Apache License 2.0 |
openvswitch-dpdk |
mirantis.azurecr.io/general/openvswitch-dpdk:2.17-jammy-20231018050930 |
Apache License 2.0 |
openstack-tools |
mirantis.azurecr.io/openstack/openstack-tools:yoga-jammy-20231214151928 |
Apache License 2.0 |
rabbitmq-3.10.x |
mirantis.azurecr.io/openstack/extra/rabbitmq:3.10.18-focal-20230222154055 |
Mozilla Public License 2.0 |
rabbitmq-3.10.x-management |
mirantis.azurecr.io/openstack/extra/rabbitmq-management:3.10.18-focal-20230222154055 |
Mozilla Public License 2.0 |
kubernetes-entrypoint |
mirantis.azurecr.io/openstack/extra/kubernetes-entrypoint:v1.0.1-55b02f7-20231019172556 |
Apache License 2.0 |
memcached |
mirantis.azurecr.io/general/memcached:v1.6.22-alpine-20231117094504 |
BSD 3-Clause “New” or “Revised” License |
etcd |
mirantis.azurecr.io/openstack/extra/etcd:v3.5.11-alpine-20231211203412 |
Apache License 2.0 |
powerdns |
mirantis.azurecr.io/openstack/extra/powerdns:4.7-alpine-20231201092632 |
GPL-2.0 License |
nginx-ingress-controller |
mirantis.azurecr.io/openstack/extra/nginx-ingress-controller:1.9.3-alpine-20231120101958 |
Apache License 2.0 |
tls-proxy |
mirantis.azurecr.io/openstack/tls-proxy:focal-fipster-20230725114156 |
Mirantis Proprietary License |
defaultbackend |
mirantis.azurecr.io/openstack/extra/defaultbackend:v1.19.2-77af1ef-20220823043839 |
Apache License 2.0 |
mariadb |
mirantis.azurecr.io/general/mariadb:10.6.14-focal-20231127070342 |
GPLv2, LGPLv2.1 (client libraries) |
rabbitmq-exporter |
mirantis.azurecr.io/stacklight/rabbitmq-exporter:1.0.0-RC19 |
MIT License |
memcached-exporter |
mirantis.azurecr.io/stacklight/memcached-exporter:0-20231208095208 |
Apache License 2.0 |
prometheus-mysql-exporter |
mirantis.azurecr.io/stacklight/mysqld-exporter:v0.11.0 |
Apache License 2.0 |
aodh |
mirantis.azurecr.io/openstack/aodh:yoga-jammy-20231214151928 |
Apache License 2.0 |
ceilometer |
mirantis.azurecr.io/openstack/ceilometer:yoga-jammy-20231214151928 |
Apache License 2.0 |
gnocchi |
mirantis.azurecr.io/openstack/gnocchi:yoga-jammy-20231214151928 |
Apache License 2.0 |
redis |
mirantis.azurecr.io/openstack/extra/redis:7.2.3-alpine3.18 |
BSD 3-Clause “New” or “Revised” License |
frr |
mirantis.azurecr.io/general/external/docker.io/frrouting/frr:v8.5.1-20231117093402 |
GPL-2.0 and LGPL-2.1 |
strongswan |
mirantis.azurecr.io/openstack/extra/strongswan:alpine-5.9.8-20231116165931 |
GPL-2.0 |
rsyslog |
mirantis.azurecr.io/openstack/extra/rsyslog:v8.2001.0-20231018050930 |
GNU General Public License v3 |
descheduler |
mirantis.azurecr.io/openstack/extra/descheduler:v0.28.1 |
Apache License 2.0 |
nginx |
mirantis.azurecr.io/openstack/extra/nginx:1.25.3-20231120120521 |
Apache License 2.0 |
requirements |
mirantis.azurecr.io/openstack/requirements:yoga-jammy-20231214151928 |
Apache License 2.0 |
stepler |
mirantis.azurecr.io/openstack/stepler:yoga-focal-20231205122540 |
Apache License 2.0 |
placement |
mirantis.azurecr.io/openstack/placement:yoga-jammy-20231214151928 |
Apache License 2.0 |
masakari |
mirantis.azurecr.io/openstack/masakari:yoga-jammy-20231214151928 |
Apache License 2.0 |
masakari-monitors |
mirantis.azurecr.io/openstack/masakari-monitors:yoga-jammy-20231214151928 |
Apache License 2.0 |
ironic-inspector |
mirantis.azurecr.io/openstack/ironic-inspector:yoga-jammy-20231214151928 |
Apache License 2.0 |
manila |
mirantis.azurecr.io/openstack/manila:yoga-jammy-20231214151928 |
Apache License 2.0 |
MOSK 23.3.4 OpenStack Helm charts
MOSK 23.3.4 Tungsten Fabric 21.4 artifacts
Component |
Path |
License information for main executable programs |
|---|---|---|
Helm charts |
||
Tungsten Fabric Operator |
https://binary.mirantis.com/tungsten/helm/tungstenfabric-operator-0.13.6.tgz |
Mirantis Proprietary License |
Docker images |
||
tungstenfabric-operator |
mirantis.azurecr.io/tungsten-operator/tungstenfabric-operator:0.13.6 |
Mirantis Proprietary License |
tungsten-pytest |
mirantis.azurecr.io/tungsten/tungsten-pytest:0.1-20231213155208 |
MIT License |
casskop |
mirantis.azurecr.io/tungsten-operator/casskop:v2.2.1 |
Apache License 2.0 |
cassandra-bootstrap |
mirantis.azurecr.io/tungsten/cassandra-bootstrap:0.1.13 |
Apache License 2.0 |
cassandra |
mirantis.azurecr.io/tungsten/cassandra:3.11.10-20230622 |
Apache License 2.0 |
cassandra-config-builder |
mirantis.azurecr.io/tungsten/cass-config-builder:v2-20231115112406 |
Apache License 2.0 |
cassandra-backrest-sidecar |
mirantis.azurecr.io/tungsten/instaclustr-icarus:v2-20230328121138 |
Apache License 2.0 |
kafka-k8s-operator |
mirantis.azurecr.io/tungsten-operator/kafka-k8s-operator:0.3.8 |
Mirantis Proprietary License |
cp-kafka |
mirantis.azurecr.io/tungsten/cp-kafka:7.5.2 |
Apache License 2.0 |
kafka-jmx-exporter |
mirantis.azurecr.io/stacklight/jmx-exporter:0.20.0-debian-11-r1 |
Apache License 2.0 |
rabbitmq-operator |
mirantis.azurecr.io/tungsten-operator/rabbitmq-operator:0.4.2 |
Mirantis Proprietary License |
rabbitmq |
mirantis.azurecr.io/tungsten/rabbitmq:3.11.16 |
Mozilla Public License 2.0 |
rabbitmq-exporter |
mirantis.azurecr.io/stacklight/rabbitmq-exporter:1.0.0-RC19 |
MIT License |
zookeeper-operator |
mirantis.azurecr.io/tungsten-operator/zookeeper-operator:0.2.20-mcp |
Apache License 2.0 |
zookeeper |
mirantis.azurecr.io/tungsten/zookeeper:3.8.3-20231019 |
Apache License 2.0 |
redis-operator |
mirantis.azurecr.io/tungsten-operator/redis-operator:0.4.2 |
Apache License 2.0 |
redis |
mirantis.azurecr.io/tungsten/redis:7.2.3-alpine |
BSD 3-Clause “New” or “Revised” License |
redis-exporter |
mirantis.azurecr.io/stacklight/redis_exporter:v1.45.0 |
BSD 3-Clause “New” or “Revised” License |
tf-cli |
mirantis.azurecr.io/tungsten/tf-cli:0.1-20231120173127 |
MIT License |
kubernetes-entrypoint |
mirantis.azurecr.io/openstack/extra/kubernetes-entrypoint:v1.0.1-5359171-20230810125608 |
Apache License 2.0 |
pause |
mirantis.azurecr.io/general/external/pause:3.1 |
Apache License 2.0 |
tf-nodeinfo |
mirantis.azurecr.io/tungsten/tf-nodeinfo:0.1-20231017142953 |
MIT License |
contrail-analytics-alarm-gen |
mirantis.azurecr.io/tungsten/contrail-analytics-alarm-gen:23.3-r21.4.20231214142113 |
Apache License 2.0 |
contrail-analytics-api |
mirantis.azurecr.io/tungsten/contrail-analytics-api:23.3-r21.4.20231214142113 |
Apache License 2.0 |
contrail-analytics-collector |
mirantis.azurecr.io/tungsten/contrail-analytics-collector:23.3-r21.4.20231214142113 |
Apache License 2.0 |
contrail-analytics-query-engine |
mirantis.azurecr.io/tungsten/contrail-analytics-query-engine:23.3-r21.4.20231214142113 |
Apache License 2.0 |
contrail-analytics-snmp-collector |
mirantis.azurecr.io/tungsten/contrail-analytics-snmp-collector:23.3-r21.4.20231214142113 |
Apache License 2.0 |
contrail-analytics-snmp-topology |
mirantis.azurecr.io/tungsten/contrail-analytics-snmp-topology:23.3-r21.4.20231214142113 |
Apache License 2.0 |
contrail-controller-config-api |
mirantis.azurecr.io/tungsten/contrail-controller-config-api:23.3-r21.4.20231214142113 |
Apache License 2.0 |
contrail-controller-config-devicemgr |
mirantis.azurecr.io/tungsten/contrail-controller-config-devicemgr:23.3-r21.4.20231214142113 |
Apache License 2.0 |
contrail-controller-config-dnsmasq |
mirantis.azurecr.io/tungsten/contrail-controller-config-dnsmasq:23.3-r21.4.20231214142113 |
Apache License 2.0 |
contrail-controller-config-schema |
mirantis.azurecr.io/tungsten/contrail-controller-config-schema:23.3-r21.4.20231214142113 |
Apache License 2.0 |
contrail-controller-config-svcmonitor |
mirantis.azurecr.io/tungsten/contrail-controller-config-svcmonitor:23.3-r21.4.20231214142113 |
Apache License 2.0 |
contrail-controller-control-control |
mirantis.azurecr.io/tungsten/contrail-controller-control-control:23.3-r21.4.20231214142113 |
Apache License 2.0 |
contrail-controller-control-dns |
mirantis.azurecr.io/tungsten/contrail-controller-control-dns:23.3-r21.4.20231214142113 |
Apache License 2.0 |
contrail-controller-control-named |
mirantis.azurecr.io/tungsten/contrail-controller-control-named:23.3-r21.4.20231214142113 |
Apache License 2.0 |
contrail-controller-webui-job |
mirantis.azurecr.io/tungsten/contrail-controller-webui-job:23.3-r21.4.20231214142113 |
Apache License 2.0 |
contrail-controller-webui-web |
mirantis.azurecr.io/tungsten/contrail-controller-webui-web:23.3-r21.4.20231214142113 |
Apache License 2.0 |
contrail-node-init |
mirantis.azurecr.io/tungsten/contrail-node-init:21.4.20230929000000 |
Apache License 2.0 |
contrail-nodemgr |
mirantis.azurecr.io/tungsten/contrail-nodemgr:23.3-r21.4.20231214142113 |
Apache License 2.0 |
contrail-provisioner |
mirantis.azurecr.io/tungsten/contrail-provisioner:23.3-r21.4.20231214142113 |
Apache License 2.0 |
contrail-tools |
mirantis.azurecr.io/tungsten/contrail-tools:23.3-r21.4.20231214142113 |
Apache License 2.0 |
contrail-vrouter-agent |
mirantis.azurecr.io/tungsten/contrail-vrouter-agent:21.4.20230929000000 |
Apache License 2.0 |
contrail-vrouter-agent-dpdk |
mirantis.azurecr.io/tungsten/contrail-vrouter-agent-dpdk:21.4.20230929000000 |
Apache License 2.0 |
contrail-vrouter-kernel-build-init |
mirantis.azurecr.io/tungsten/contrail-vrouter-kernel-build-init:21.4.20230929000000 |
Apache License 2.0 |
MOSK 23.3.4 StackLight artifacts
Component |
Path |
License information for main executable programs |
|---|---|---|
Docker images |
||
prometheus-libvirt-exporter |
mirantis.azurecr.io/stacklight/prometheus-libvirt-exporter:v0.2-20231215023010 |
Mirantis Proprietary License |
tungstenfabric-prometheus-exporter |
mirantis.azurecr.io/stacklight/tungstenfabric-prometheus-exporter:0.1-20231204150325 |
Mirantis Proprietary License |
Helm charts |
||
fluentd |
https://binary.mirantis.com/stacklight/helm/fluentd-2.0.3-mcp-52.tgz |
Mirantis Proprietary License |
prometheus-libvirt-exporter |
https://binary.mirantis.com/stacklight/helm/prometheus-libvirt-exporter-0.2.0-mcp-7.tgz |
Mirantis Proprietary License |
prometheus-tungstenfabric-exporter |
https://binary.mirantis.com/stacklight/helm/prometheus-tungstenfabric-exporter-0.2.0-mcp-7.tgz |
Mirantis Proprietary License |
The table below includes the total number of addressed unique and common CVEs by MOSK-specific component since MOSK 23.3.3. The common CVEs are issues addressed across several images.
Product component |
CVE type |
Critical |
High |
Total |
|---|---|---|---|---|
OpenStack |
Unique |
0 |
1 |
1 |
Common |
0 |
3 |
3 |
|
Tungsten Fabric |
Unique |
2 |
22 |
24 |
Common |
2 |
26 |
28 |
Mirantis Security Portal
For the detailed list of fixed and present CVEs across the Mirantis Container Cloud and MOSK products, refer to Mirantis Security Portal.
Mirantis Container Cloud CVEs
For the number of fixed CVEs in the Mirantis Container Cloud-related components including kaas core, bare metal, Ceph, and StackLight, refer to Container Cloud 2.25.4: Security notes.
The following issue has been addressed in the MOSK 23.3.4 release:
[37684] Resolved the issue that led to high resource utilization by Cassandra containers of the
tf-cassandra-analyticsservice.
Learn more about the release cadence
23.2 series
23.2
Release date |
August 21, 2023 |
|---|---|
Name |
MOSK 23.2 |
Cluster release |
15.0.1 |
Highlights |
|
Component |
Support scope |
Feature |
|---|---|---|
OpenStack |
TechPreview |
|
Full |
||
TechPreview |
||
TechPreview |
||
Security |
Full |
|
Full |
||
Tungsten Fabric |
TechPreview |
Tungsten Fabric graceful restart and long-lived graceful restart |
TechPreview |
||
Major version changes |
Full |
|
Full |
||
Full |
||
Other components |
TechPreview |
|
TechPreview |
||
TechPreview |
||
TechPreview |
||
Documentation |
n/a |
TechPreview
Implemented the capability to parallelize OpenStack, Ceph, and Tungsten Fabric node update operations, significantly improving the efficiency of MOSK deployments. The parallel node update feature applies to any operation that utilizes the Node Maintenance API, such as cluster updates or graceful node reboots.
Implemented the automatic removal of OpenStack-related metadata during the graceful machine deletion.
Learn more
TechPreview
Implemented the OpenStack workload monitoring feature through the Cloudprober exporter.
After enablement and proper configuration, the exporter allows for monitoring the availability of instance floating IP addresses per OpenStack compute node and project, as well as viewing the probe statistics for individual instance floating IP addresses through the Openstack Instances Availability dashboard in Grafana.
TechPreview
Introduced the Technology Preview support for the BGP dynamic routing extension to the Networking service (OpenStack Neutron) that will be particularly useful for the MOSK clouds where private networks managed by cloud users need to be transparently integrated into the networking of the data center.
Learn more
Implemented the encryption of the exposed message bus (RabbitMQ) endpoint for secure connection.
Implemented the TLS encryption feature for QEMU and libvirt to secure all data transports during live migration, including disks not on shared storage.
Available since MOSK 23.2 for Tungsten Fabric 21.4 only TechPreview
Added support for graceful restart and long-lived graceful restart allowing for a more efficient and robust routing experience for Tungsten Fabric. These features enhance the speed at which routing tables converge, specifically when dealing with BGP router restarts or failures.
TechPreview
Implemented Technology Preview support for configuring a remote NFS storage for Tungsten Fabric data backup and restoration.
Introduced support for Mirantis Kubernetes Engine (MKE) 3.6 with Kubernetes 1.24. MOSK clusters are updated to the latest supported MKE version during the cluster update.
Learn more
Upgraded Keycloak major version from 18.0.0 to 21.1.1 during the Cluster version update.
Learn more
Upgraded Ceph major version from Pacific to Quincy with an automatic upgrade of Ceph components during the Cluster version update.
Learn more
TechPreview
Implemented the capability to configure a MOSK cluster without Ceph and, for example, rely on external storage appliances to host their data instead.
Learn more
TechPreview
Added initial Technology Preview support for WireGuard that enables traffic encryption on the Kubernetes workloads network.
Learn more
Deployment Guide: Create a bare metal managed cluster <create-cluster>
TechPreview
Added initial Technology Preview support for custom host names of cluster machines. When enabled, any machine host name in a particular region matches the related Machine object name.
TechPreview
Added initial Technology Preview support for the Linux Audit daemon auditd to monitor activity of cluster processes that allow for detection of potential malicious activity.
Added a tutorial to help you build your first cloud application and onboard it to a MOSK cloud. It will guide you through the process of deploying a simple application using the cloud web UI (OpenStack Horizon).
Mirantis has tested MOSK against a very specific configuration and can guarantee a predictable behavior of the product only in the exact same environments. The table below includes the major MOSK components with the exact versions against which testing has been performed.
Component |
Version |
|---|---|
Cluster release |
15.0.1 (Cluster release notes) |
OpenStack |
Yoga |
OpenStack Operator |
0.13.8 |
Tungsten Fabric |
21.4 |
Tungsten Fabric Operator |
0.12.4 |
See also
For the supported versions of operating system, Ceph, and other components, refer to Compatibility Matrix.
This section describes the MOSK known issues with available workarounds. For the known issues in the related version of Mirantis Container Cloud, refer to Mirantis Container Cloud: Release Notes.
This section lists the OpenStack known issues with workarounds for the Mirantis OpenStack for Kubernetes release 23.2.
Multiprotocol Label Switching over Generic Routing Encapsulation (MPLSoGRE) provides limited throughput while sending data between VMs up to 38 Mbps, as per Mirantis tests.
As a workaround, switch the encapsulation type to VXLAN in the
OpenStackDeployment custom resource:
spec:
services:
networking:
neutron:
values:
conf:
bagpipe_bgp:
dataplane_driver_ipvpn:
mpls_over_gre: "False"
vxlan_encap: "True"
Due to the upstream MariaDB issue, during MariaDB operations on a management cluster, Pods may get stuck in continuous restarts with the following example error:
[ERROR] WSREP: Corrupt buffer header: \
addr: 0x7faec6f8e518, \
seqno: 3185219421952815104, \
size: 909455917, \
ctx: 0x557094f65038, \
flags: 11577. store: 49, \
type: 49
Workaround:
Create a backup of the
/var/lib/mysqldirectory on themariadb-serverPod.Verify that other replicas are up and ready.
Remove the
galera.cachefile for the affectedmariadb-serverPod.Remove the affected
mariadb-serverPod or wait until it is automatically restarted.
After Kubernetes restarts the Pod, the Pod clones the database in 1-2 minutes and restores the quorum.
After update of OpenStack from Victoria to Wallaby, the machines from nodes with DPDK become unavailable.
Workaround:
Search for the nodes with the OVS ports:
for i in $(kubectl -n openstack get pods |grep openvswitch-vswitchd | awk '{print $1}'); do kubectl -n openstack exec -it -c openvswitch-vswitchd $i -- ovs-vsctl show |grep -q "tag: 4095" && echo $i; done
Restart the
neutron-ovs-agentagent on the affected nodes.
Due to the MetalLB upstream issue, a load balancer service may not obtain the external IP address.
The issue occurs when two services share the same external IP address and have
the same externalTrafficPolicy value. Initially, the services have the
external IP address assigned and are accessible. After modifying the
externalTrafficPolicy value for both services from Cluster to
Local, the first service that has been changed remains with no external IP
address assigned. Though, the second service, which was changed later, has the
external IP assigned as expected.
To work around the issue, make a dummy change to the service object where
external IP is <pending>:
Identify the service that is stuck:
kubectl get svc -A | grep pending
Example of system response:
stacklight iam-proxy-prometheus LoadBalancer 10.233.28.196 <pending> 443:30430/TCP
Add an arbitrary label to the service that is stuck. For example:
kubectl label svc -n stacklight iam-proxy-prometheus reconcile=1
Example of system response:
service/iam-proxy-prometheus labeledVerify that the external IP was allocated to the service:
kubectl get svc -n stacklight iam-proxy-prometheus
Example of system response:
NAME TYPE CLUSTER-IP EXTERNAL-IP PORT(S) AGE iam-proxy-prometheus LoadBalancer 10.233.28.196 10.0.34.108 443:30430/TCP 12d
This section lists the Tungsten Fabric (TF) known issues with workarounds for the Mirantis OpenStack for Kubernetes release 23.2. For TF limitations, see Tungsten Fabric known limitations.
[37684] Cassandra containers are experiencing high resource utilization
[30738] ‘tf-vrouter-agent’ readiness probe failed (No Configuration for self)
[13755] TF pods switch to CrashLoopBackOff after a simultaneous reboot
The Cassandra containers of the tf-cassandra-analytics service are
experiencing high CPU and memory utilization. This is happening because
Cassandra Analytics is running out of memory, causing restarts of both
Cassandra and the Tungsten Fabric control plane services.
To work around the issue, use the custom images from the Mirantis public repository:
Specify the image for
config-apiin theTFOperatorcustom resource:controllers: tf-config: api: containers: - image: mirantis.azurecr.io/tungsten/contrail-controller-config-api:23.2-r21.4.20231208123354 name: api
Wait for the
tf-configpods to restart.Monitor the Cassandra Analytics resources continuously. If the Out Of Memory (OOM) error is not present, the applied workaround is sufficient.
Otherwise, modify the TF vRouters configuration as well:
controllers: tf-vrouter: agent: containers: - env: - name: VROUTER_GATEWAY value: 10.32.6.1 - name: DISABLE_TX_OFFLOAD value: "YES" name: agent image: mirantis.azurecr.io/tungsten/contrail-vrouter-agent:23.2-r21.4.20231208123354
To apply the changes, restart the vRouters manually.
Fixed in MOSK 23.3 Fixed in MOSK 23.2.1
Execution of the TF Heat Tempest test test_template_global_vrouter_config
can result in lost vRouter configuration. This causes the tf-vrouter pod
readiness probe to fail with the following error message:
"Readiness probe failed: vRouter is PRESENT contrail-vrouter-agent: initializing (No Configuration for self)"
As a result, vRouters may have an incomplete routing table making some services, such as metadata, become unavailable.
Workaround:
Add the
tf_heat_tempest_plugintests with global configuration to the exclude list in theOpenStackDeploymentcustom resource:spec: tempest: tempest: values: conf: blacklist: - (?:tf_heat_tempest_plugin.tests.functional.test_global.*)
If you ran
test_template_global_vrouter_configandtf-vrouter-agentpods moved to theerrorstate with the above error, re-create these pods through deletion:kubectl -n tf delete pod tf-vrouter-agent-*
Rebooting all Cassandra cluster TFConfig or TFAnalytics nodes, maintenance, or other circumstances that cause the Cassandra pods to start simultaneously may cause a broken Cassandra TFConfig and/or TFAnalytics cluster. In this case, Cassandra nodes do not join the ring and do not update the IPs of the neighbor nodes. As a result, the TF services cannot operate Cassandra cluster(s).
To verify that a Cassandra cluster is affected:
Run the nodetool status command specifying the config or
analytics cluster and the replica number:
kubectl -n tf exec -it tf-cassandra-<config/analytics>-dc1-rack1-<replica number> -c cassandra -- nodetool status
Example of system response with outdated IP addresses:
Datacenter: DC1
===============
Status=Up/Down
|/ State=Normal/Leaving/Joining/Moving
-- Address Load Tokens Owns (effective) Host ID Rack
DN <outdated ip> ? 256 64.9% a58343d0-1e3f-4d54-bcdf-9b9b949ca873 r1
DN <outdated ip> ? 256 69.8% 67f1d07c-8b13-4482-a2f1-77fa34e90d48 r1
Datacenter: dc1
===============
Status=Up/Down
|/ State=Normal/Leaving/Joining/Moving
-- Address Load Tokens Owns (effective) Host ID Rack
UN <actual ip> 3.84 GiB 256 65.2% 7324ebc4-577a-425f-b3de-96faac95a331 rack1
Workaround:
Manually delete the Cassandra pod from the failed config or analytics
cluster to re-initiate the bootstrap process for one of the Cassandra nodes:
kubectl -n tf delete pod tf-cassandra-<config/analytics>-dc1-rack1-<replica_num>
This section lists the Wireguard known issues with workarounds for the Mirantis OpenStack for Kubernetes release 23.2.
Due to the upstream Calico issue, on clusters with Wireguard enabled, the Wireguard interface on a node may not have the IPv4 address assigned. This leads to broken inter-Pod communication between the affected node and other cluster nodes.
The node is affected if the IP address is missing on the Wireguard interface:
ip a show wireguard.cali
Example of system response:
40: wireguard.cali: <POINTOPOINT,NOARP,UP,LOWER_UP> mtu 1440 qdisc noqueue state UNKNOWN group default qlen 1000 link/none
The workaround is to manually restart the calico-node Pod to allocate
the IPv4 address on the Wireguard interface:
docker restart $(docker ps -f "label=name=Calico node" -q)
This section lists the cluster update known issues with workarounds for the Mirantis OpenStack for Kubernetes release 23.2.
During MOSK update to either 23.2 major release or
any patch release of the 23.2 release series, the
openstack-operator-ensure-resources job may get stuck in
the CrashLoopBackOff state with the following error:
Traceback (most recent call last):
File "/usr/local/bin/osctl-ensure-shared-resources", line 8, in <module>
sys.exit(main())
File "/usr/local/lib/python3.8/dist-packages/openstack_controller/cli/ensure_shared_resources.py", line 61, in main
obj.update()
File "/usr/local/lib/python3.8/dist-packages/pykube/objects.py", line 165, in update
self.patch(self.obj, subresource=subresource)
File "/usr/local/lib/python3.8/dist-packages/pykube/objects.py", line 157, in patch
self.api.raise_for_status(r)
File "/usr/local/lib/python3.8/dist-packages/pykube/http.py", line 444, in raise_for_status
raise HTTPError(resp.status_code, payload["message"])
pykube.exceptions.HTTPError: CustomResourceDefinition.apiextensions.k8s.io "redisfailovers.databases.spotahome.com" is invalid: spec.preserveUnknownFields: Invalid value: true: must be false in order to use defaults in the schema
As a workaround, delete the redisfailovers.databases.spotahome.com
CRD from your cluster:
kubectl delete crd redisfailovers.databases.spotahome.com
While updating your cluster, the Instance High Availability service (OpenStack Masakari) may not work as expected.
As a workaround, temporarily disable the service by removing
instance-ha from the service list in the OpenStackDeployment
custom resource.
This section lists the components artifacts of the MOSK 23.2 release that includes binaries, Docker images, and Helm charts.
MOSK 23.2 OpenStack Yoga binaries and Docker images
Component |
Path |
License information for main executable programs |
|---|---|---|
Binaries |
||
octavia-amphora |
https://binary.mirantis.com/openstack/bin/octavia/amphora-x64-haproxy-yoga-20230718165730.qcow2 |
Mirantis Proprietary License |
mirantis |
https://binary.mirantis.com/openstack/bin/horizon/mirantis-xena-9f691e3-20220110111511.tar.gz |
Mirantis Proprietary License |
kernel |
https://binary.mirantis.com/openstack/bin/ironic/tinyipa/tinyipa-stable-yoga-20230128061113.vmlinuz |
GPL-2.0 |
initramfs |
https://binary.mirantis.com/openstack/bin/ironic/tinyipa/tinyipa-stable-yoga-20230128061113.gz |
GPL-2.0 |
service-image |
https://binary.mirantis.com/openstack/bin/manila/manila-service-image-20221228132450.qcow2 |
Mirantis Proprietary License |
Docker images |
||
keystone |
mirantis.azurecr.io/openstack/keystone:yoga-focal-20230730141349 |
Apache License 2.0 |
heat |
mirantis.azurecr.io/openstack/heat:yoga-focal-20230730141349 |
Apache License 2.0 |
glance |
mirantis.azurecr.io/openstack/glance:yoga-focal-20230730141349 |
Apache License 2.0 |
cinder |
mirantis.azurecr.io/openstack/cinder:yoga-focal-20230730141349 |
Apache License 2.0 |
cloudprober |
mirantis.azurecr.io/openstack/extra/cloudprober:v0.12.7-20230623070627 |
Apache License 2.0 |
neutron |
mirantis.azurecr.io/openstack/neutron:yoga-focal-20230730141349 |
Apache License 2.0 |
nova |
mirantis.azurecr.io/openstack/nova:yoga-focal-20230730141349 |
Apache License 2.0 |
horizon |
mirantis.azurecr.io/openstack/horizon:yoga-focal-20230730141349 |
Apache License 2.0 |
tempest |
mirantis.azurecr.io/openstack/tempest:yoga-focal-20230730141349 |
Apache License 2.0 |
octavia |
mirantis.azurecr.io/openstack/octavia:yoga-focal-20230730141349 |
Apache License 2.0 |
designate |
mirantis.azurecr.io/openstack/designate:yoga-focal-20230730141349 |
Apache License 2.0 |
ironic |
mirantis.azurecr.io/openstack/ironic:yoga-focal-20230730141349 |
Apache License 2.0 |
barbican |
mirantis.azurecr.io/openstack/barbican:yoga-focal-20230730141349 |
Apache License 2.0 |
libvirt |
mirantis.azurecr.io/general/libvirt:6.0.0-focal-20230730124813 |
LGPL-2.1 License |
pause |
mirantis.azurecr.io/general/external/pause:3.1 |
Apache License 2.0 |
openvswitch |
mirantis.azurecr.io/general/openvswitch:2.13-focal-20230730124813 |
Apache License 2.0 |
openvswitch-dpdk |
mirantis.azurecr.io/general/openvswitch-dpdk:2.13-focal-20230730124813 |
Apache License 2.0 |
openstack-tools |
mirantis.azurecr.io/openstack/openstack-tools:yoga-focal-20230718163224 |
Apache License 2.0 |
rabbitmq-3.10.x |
mirantis.azurecr.io/openstack/extra/rabbitmq:3.10.18-focal-20230222154055 |
Mozilla Public License 2.0 |
rabbitmq-3.10.x-management |
mirantis.azurecr.io/openstack/extra/rabbitmq-management:3.10.18-focal-20230222154055 |
Mozilla Public License 2.0 |
kubernetes-entrypoint |
mirantis.azurecr.io/openstack/extra/kubernetes-entrypoint:v1.0.1-27d64fb-20230421151539 |
Apache License 2.0 |
memcached |
mirantis.azurecr.io/general/memcached:v1.6.20-alpine-20230614113432 |
BSD 3-Clause “New” or “Revised” License |
etcd |
mirantis.azurecr.io/openstack/extra/etcd:v3.5.9-alpine-20230610071256 |
Apache License 2.0 |
powerdns |
mirantis.azurecr.io/openstack/extra/powerdns:4.7-alpine-20230610074056 |
GPL-2.0 License |
nginx-ingress-controller |
mirantis.azurecr.io/openstack/extra/nginx-ingress-controller:1.8.0-alpine-20230617191825 |
Apache License 2.0 |
tls-proxy |
mirantis.azurecr.io/openstack/tls-proxy:focal-20230725114156 |
Mirantis Proprietary License |
defaultbackend |
mirantis.azurecr.io/openstack/extra/defaultbackend:v1.19.2-77af1ef-20220823043839 |
Apache License 2.0 |
mariadb |
mirantis.azurecr.io/general/mariadb:10.6.14-focal-20230730124341 |
GPLv2, LGPLv2.1 (client libraries) |
rabbitmq-exporter |
mirantis.azurecr.io/stacklight/rabbitmq-exporter:1.0.0-RC19 |
MIT License |
memcached-exporter |
mirantis.azurecr.io/stacklight/memcached-exporter:v0.11.3 |
Apache License 2.0 |
prometheus-mysql-exporter |
mirantis.azurecr.io/stacklight/mysqld-exporter:v0.11.0 |
Apache License 2.0 |
aodh |
mirantis.azurecr.io/openstack/aodh:yoga-focal-20230730141349 |
Apache License 2.0 |
ceilometer |
mirantis.azurecr.io/openstack/ceilometer:yoga-focal-20230730141349 |
Apache License 2.0 |
gnocchi |
mirantis.azurecr.io/openstack/gnocchi:yoga-focal-20230730141349 |
Apache License 2.0 |
redis |
mirantis.azurecr.io/openstack/extra/redis:7.0.11-alpine3.18 |
BSD 3-Clause “New” or “Revised” License |
frr |
mirantis.azurecr.io/general/external/docker.io/frrouting/frr:v8.5.1-20230619084330 |
GPL-2.0 and LGPL-2.1 |
strongswan |
mirantis.azurecr.io/openstack/extra/strongswan:alpine-5.9.8-20230720054838 |
GPL-2.0 |
rsyslog |
mirantis.azurecr.io/openstack/extra/rsyslog:v8.2001.0-20230730124813 |
GNU General Public License v3 |
descheduler |
mirantis.azurecr.io/openstack/extra/descheduler:v0.27.0 |
Apache License 2.0 |
nginx |
mirantis.azurecr.io/openstack/extra/nginx:1.25.1-alpine-slim |
Apache License 2.0 |
tgt |
mirantis.azurecr.io/general/tgt:1.0.x-focal-20230730124813 |
GPL-2.0 |
requirements |
mirantis.azurecr.io/openstack/requirements:yoga-focal-20230730141349 |
Apache License 2.0 |
stepler |
mirantis.azurecr.io/openstack/stepler:yoga-focal-20230730124813 |
Apache License 2.0 |
placement |
mirantis.azurecr.io/openstack/placement:yoga-focal-20230730141349 |
Apache License 2.0 |
masakari |
mirantis.azurecr.io/openstack/masakari:yoga-focal-20230730141349 |
Apache License 2.0 |
masakari-monitors |
mirantis.azurecr.io/openstack/masakari-monitors:yoga-focal-20230730141349 |
Apache License 2.0 |
ironic-inspector |
mirantis.azurecr.io/openstack/ironic-inspector:yoga-focal-20230730141349 |
Apache License 2.0 |
manila |
mirantis.azurecr.io/openstack/manila:yoga-focal-20230730141349 |
Apache License 2.0 |
MOSK 23.2 OpenStack Victoria binaries and Docker images
Component |
Path |
License information for main executable programs |
|---|---|---|
Binaries |
||
octavia-amphora |
https://binary.mirantis.com/openstack/bin/octavia/amphora-x64-haproxy-victoria-20230706155916.qcow2 |
Mirantis Proprietary License |
mirantis |
https://binary.mirantis.com/openstack/bin/horizon/mirantis-victoria-8f71802-20210119120707.tar.gz |
Mirantis Proprietary License |
kernel |
GPL-2.0 |
|
initramfs |
https://binary.mirantis.com/openstack/bin/ironic/tinyipa/tinyipa-stable-victoria-20230128063511.gz |
GPL-2.0 |
service-image |
https://binary.mirantis.com/openstack/bin/manila/manila-service-image-20221228132450.qcow2 |
Mirantis Proprietary License |
Docker images |
||
keystone |
mirantis.azurecr.io/openstack/keystone:victoria-focal-20230730130947 |
Apache License 2.0 |
heat |
mirantis.azurecr.io/openstack/heat:victoria-focal-20230730130947 |
Apache License 2.0 |
glance |
mirantis.azurecr.io/openstack/glance:victoria-focal-20230730130947 |
Apache License 2.0 |
cinder |
mirantis.azurecr.io/openstack/cinder:victoria-focal-20230730130947 |
Apache License 2.0 |
cloudprober |
mirantis.azurecr.io/openstack/extra/cloudprober:v0.12.7-20230623070627 |
Apache License 2.0 |
neutron |
mirantis.azurecr.io/openstack/neutron:victoria-focal-20230730130947 |
Apache License 2.0 |
nova |
mirantis.azurecr.io/openstack/nova:victoria-focal-20230730130947 |
Apache License 2.0 |
horizon |
mirantis.azurecr.io/openstack/horizon:victoria-focal-20230730130947 |
Apache License 2.0 |
tempest |
mirantis.azurecr.io/openstack/tempest:victoria-focal-20230730130947 |
Apache License 2.0 |
octavia |
mirantis.azurecr.io/openstack/octavia:victoria-focal-20230730130947 |
Apache License 2.0 |
designate |
mirantis.azurecr.io/openstack/designate:victoria-focal-20230730130947 |
Apache License 2.0 |
ironic |
mirantis.azurecr.io/openstack/ironic:victoria-focal-20230730130947 |
Apache License 2.0 |
barbican |
mirantis.azurecr.io/openstack/barbican:victoria-focal-20230730130947 |
Apache License 2.0 |
libvirt |
mirantis.azurecr.io/general/libvirt:6.0.0-focal-20230730124813 |
LGPL-2.1 License |
pause |
mirantis.azurecr.io/general/external/pause:3.1 |
Apache License 2.0 |
openvswitch |
mirantis.azurecr.io/general/openvswitch:2.13-focal-20230730124813 |
Apache License 2.0 |
openvswitch-dpdk |
mirantis.azurecr.io/general/openvswitch-dpdk:2.13-focal-20230730124813 |
Apache License 2.0 |
openstack-tools |
mirantis.azurecr.io/openstack/openstack-tools:yoga-focal-20230718163224 |
Apache License 2.0 |
rabbitmq-3.10.x |
mirantis.azurecr.io/openstack/extra/rabbitmq:3.10.18-focal-20230222154055 |
Mozilla Public License 2.0 |
rabbitmq-3.10.x-management |
mirantis.azurecr.io/openstack/extra/rabbitmq-management:3.10.18-focal-20230222154055 |
Mozilla Public License 2.0 |
kubernetes-entrypoint |
mirantis.azurecr.io/openstack/extra/kubernetes-entrypoint:v1.0.1-27d64fb-20230421151539 |
Apache License 2.0 |
memcached |
mirantis.azurecr.io/general/memcached:v1.6.20-alpine-20230614113432 |
BSD 3-Clause “New” or “Revised” License |
etcd |
mirantis.azurecr.io/openstack/extra/etcd:v3.5.9-alpine-20230610071256 |
Apache License 2.0 |
powerdns |
mirantis.azurecr.io/openstack/extra/powerdns:4.7-alpine-20230610074056 |
GPL-2.0 License |
nginx-ingress-controller |
mirantis.azurecr.io/openstack/extra/nginx-ingress-controller:1.8.0-alpine-20230617191825 |
Apache License 2.0 |
tls-proxy |
mirantis.azurecr.io/openstack/tls-proxy:focal-20230725114156 |
Mirantis Proprietary License |
defaultbackend |
mirantis.azurecr.io/openstack/extra/defaultbackend:v1.19.2-77af1ef-20220823043839 |
Apache License 2.0 |
mariadb |
mirantis.azurecr.io/general/mariadb:10.6.14-focal-20230730124341 |
GPLv2, LGPLv2.1 (client libraries) |
rabbitmq-exporter |
mirantis.azurecr.io/stacklight/rabbitmq-exporter:1.0.0-RC19 |
MIT License |
memcached-exporter |
mirantis.azurecr.io/stacklight/memcached-exporter:v0.11.3 |
Apache License 2.0 |
prometheus-mysql-exporter |
mirantis.azurecr.io/stacklight/mysqld-exporter:v0.11.0 |
Apache License 2.0 |
aodh |
mirantis.azurecr.io/openstack/aodh:victoria-focal-20230730130947 |
Apache License 2.0 |
ceilometer |
mirantis.azurecr.io/openstack/ceilometer:victoria-focal-20230730130947 |
Apache License 2.0 |
gnocchi |
mirantis.azurecr.io/openstack/gnocchi:victoria-focal-20230730130947 |
Apache License 2.0 |
redis |
mirantis.azurecr.io/openstack/extra/redis:7.0.11-alpine3.18 |
BSD 3-Clause “New” or “Revised” License |
frr |
mirantis.azurecr.io/general/external/docker.io/frrouting/frr:v8.5.1-20230619084330 |
GPL-2.0 and LGPL-2.1 |
strongswan |
mirantis.azurecr.io/openstack/extra/strongswan:alpine-5.9.8-20230720054838 |
GPL-2.0 |
rsyslog |
mirantis.azurecr.io/openstack/extra/rsyslog:v8.2001.0-20230730124813 |
GNU General Public License v3 |
descheduler |
mirantis.azurecr.io/openstack/extra/descheduler:v0.27.0 |
Apache License 2.0 |
nginx |
mirantis.azurecr.io/openstack/extra/nginx:1.25.1-alpine-slim |
Apache License 2.0 |
tgt |
mirantis.azurecr.io/general/tgt:1.0.x-focal-20230730124813 |
GPL-2.0 |
requirements |
mirantis.azurecr.io/openstack/requirements:victoria-focal-20230730130947 |
Apache License 2.0 |
placement |
mirantis.azurecr.io/openstack/placement:victoria-focal-20230730130947 |
Apache License 2.0 |
stepler |
mirantis.azurecr.io/openstack/stepler:victoria-focal-20230730124813 |
Apache License 2.0 |
masakari |
mirantis.azurecr.io/openstack/masakari:victoria-focal-20230730130947 |
Apache License 2.0 |
masakari-monitors |
mirantis.azurecr.io/openstack/masakari-monitors:victoria-focal-20230730130947 |
Apache License 2.0 |
ironic-inspector |
mirantis.azurecr.io/openstack/ironic-inspector:victoria-focal-20230730130947 |
Apache License 2.0 |
panko |
mirantis.azurecr.io/openstack/panko:victoria-focal-20230730130947 |
Apache License 2.0 |
MOSK 23.2 OpenStack Helm charts
MOSK 23.2 Tungsten Fabric 21.4 artifacts
Component |
Path |
License information for main executable programs |
|---|---|---|
Helm charts |
||
Tungsten Fabric Operator |
https://binary.mirantis.com/tungsten/helm/tungstenfabric-operator-0.12.4.tgz |
Mirantis Proprietary License |
Docker images |
||
Tungsten Fabric Operator |
mirantis.azurecr.io/tungsten-operator/tungstenfabric-operator:0.12.4 |
Mirantis Proprietary License |
Analytics Alarm |
mirantis.azurecr.io/tungsten/contrail-analytics-alarm-gen:23.2_R21.4.20230810083758 |
Apache License 2.0 |
Analytics |
mirantis.azurecr.io/tungsten/contrail-analytics-api:23.2_R21.4.20230810083758 |
Apache License 2.0 |
mirantis.azurecr.io/tungsten/contrail-analytics-collector:23.2_R21.4.20230810083758 |
Apache License 2.0 |
|
Analytics DB |
mirantis.azurecr.io/tungsten/contrail-analytics-query-engine:23.2_R21.4.20230810083758 |
Apache License 2.0 |
Analytics SNMP |
mirantis.azurecr.io/tungsten/contrail-analytics-snmp-collector:23.2_R21.4.20230810083758 |
Apache License 2.0 |
mirantis.azurecr.io/tungsten/contrail-analytics-snmp-topology:23.2_R21.4.20230810083758 |
Apache License 2.0 |
|
Config |
mirantis.azurecr.io/tungsten/contrail-controller-config-api:23.2_R21.4.20230810083758 |
Apache License 2.0 |
mirantis.azurecr.io/tungsten/contrail-controller-config-devicemgr:23.2_R21.4.20230810083758 |
Apache License 2.0 |
|
mirantis.azurecr.io/tungsten/contrail-controller-config-dnsmasq:23.2_R21.4.20230810083758 |
Apache License 2.0 |
|
mirantis.azurecr.io/tungsten/contrail-controller-config-schema:23.2_R21.4.20230810083758 |
Apache License 2.0 |
|
mirantis.azurecr.io/tungsten/contrail-controller-config-svcmonitor:23.2_R21.4.20230810083758 |
Apache License 2.0 |
|
Control |
mirantis.azurecr.io/tungsten/contrail-controller-control-control:23.2_R21.4.20230810083758 |
Apache License 2.0 |
mirantis.azurecr.io/tungsten/contrail-controller-control-dns:23.2_R21.4.20230810083758 |
Apache License 2.0 |
|
mirantis.azurecr.io/tungsten/contrail-controller-control-named:23.2_R21.4.20230810083758 |
Apache License 2.0 |
|
Web UI |
mirantis.azurecr.io/tungsten/contrail-controller-webui-job:23.2_R21.4.20230810083758 |
Apache License 2.0 |
mirantis.azurecr.io/tungsten/contrail-controller-webui-web:23.2_R21.4.20230810083758 |
Apache License 2.0 |
|
Nodemanager |
mirantis.azurecr.io/tungsten/contrail-nodemgr:23.2_R21.4.20230810083758 |
Apache License 2.0 |
vRouter |
mirantis.azurecr.io/tungsten/contrail-vrouter-agent:23.2_R21.4.20230810083758 |
Apache License 2.0 |
mirantis.azurecr.io/tungsten/contrail-vrouter-agent-dpdk:23.2_R21.4.20230810083758 |
Apache License 2.0 |
|
mirantis.azurecr.io/tungsten/contrail-node-init:23.2_R21.4.20230810083758 |
Apache License 2.0 |
|
mirantis.azurecr.io/tungsten/contrail-vrouter-kernel-build-init:23.2_R21.4.20230810083758 |
Apache License 2.0 |
|
Cassandra operator |
mirantis.azurecr.io/tungsten-operator/casskop:2.1.17 |
Apache License 2.0 |
Cassandra |
mirantis.azurecr.io/tungsten/cassandra-bootstrap:0.1.12 |
Apache License 2.0 |
mirantis.azurecr.io/tungsten/cassandra:3.11.10-20230622 |
Apache License 2.0 |
|
mirantis.azurecr.io/tungsten/instaclustr-icarus:v2-20230328121138 |
Apache License 2.0 |
|
mirantis.azurecr.io/tungsten/cass-config-builder:v2-20230622161721 |
Apache License 2.0 |
|
Kafka |
mirantis.azurecr.io/tungsten/cp-kafka:7.4.1 |
Apache License 2.0 |
mirantis.azurecr.io/stacklight/jmx-exporter:0.18.0-debian-11-r32 |
Apache License 2.0 |
|
Kafka operator |
mirantis.azurecr.io/tungsten-operator/kafka-k8s-operator:0.3.5 |
Mirantis Proprietary License |
RabbitMQ operator |
mirantis.azurecr.io/tungsten-operator/rabbitmq-operator:0.3.7 |
Mirantis Proprietary License |
RabbitMQ |
mirantis.azurecr.io/tungsten/rabbitmq:3.11.16 |
Mozilla Public License 2.0 |
mirantis.azurecr.io/stacklight/rabbitmq-exporter:1.0.0-RC19 |
MIT License |
|
ZooKeeper operator |
mirantis.azurecr.io/tungsten-operator/zookeeper-operator:0.2.17-mcp |
Apache License 2.0 |
ZooKeeper |
mirantis.azurecr.io/tungsten/zookeeper:3.8.1-20230425 |
Apache License 2.0 |
Redis operator |
mirantis.azurecr.io/tungsten-operator/redis-operator:0.3.8 |
Apache License 2.0 |
Redis |
mirantis.azurecr.io/tungsten/redis:7.0.11-alpine3.18 |
BSD 3-Clause “New” or “Revised” License |
mirantis.azurecr.io/stacklight/redis_exporter:v1.45.0 |
BSD 3-Clause “New” or “Revised” License |
|
TF Provisioner |
mirantis.azurecr.io/tungsten/contrail-provisioner:23.2_R21.4.20230810083758 |
Apache License 2.0 |
TF Test |
mirantis.azurecr.io/tungsten/tungsten-pytest:0.1-20230713172410 |
MIT License |
TF CLI |
mirantis.azurecr.io/tungsten/tf-cli:0.1-20230802163214 |
MIT License |
TF NodeInfo |
mirantis.azurecr.io/tungsten/tf-nodeinfo:0.1-20230328120524 |
MIT License |
TF Tools |
mirantis.azurecr.io/tungsten/contrail-tools:23.2_R21.4.20230810083758 |
Apache License 2.0 |
kubernetes-entrypoint |
mirantis.azurecr.io/openstack/extra/kubernetes-entrypoint:v1.0.1-27d64fb-20230421151539 |
Apache License 2.0 |
pause |
mirantis.azurecr.io/general/external/pause:3.1 |
Apache License 2.0 |
MOSK 23.2 StackLight artifacts
Component |
Path |
License information for main executable programs |
|---|---|---|
Docker images |
||
prometheus-libvirt-exporter |
mirantis.azurecr.io/stacklight/prometheus-libvirt-exporter:v0.2-20230714023011 |
Mirantis Proprietary License |
tungstenfabric-prometheus-exporter |
mirantis.azurecr.io/stacklight/tungstenfabric-prometheus-exporter:0.1-20230531104437 |
Mirantis Proprietary License |
Helm charts |
||
prometheus-libvirt-exporter |
https://binary.mirantis.com/stacklight/helm/prometheus-libvirt-exporter-0.2.0-mcp-3.tgz |
Mirantis Proprietary License |
prometheus-tungstenfabric-exporter |
https://binary.mirantis.com/stacklight/helm/prometheus-tungstenfabric-exporter-0.2.0-mcp-3.tgz |
Mirantis Proprietary License |
The following issues have been addressed in the MOSK 23.2 release:
[OpenStack] [33006] Fixed the issue that prevented communication between virtual machines on the same network.
[OpenStack] [34208] Prevented the Masakari API pods from constant restart.
[TF] [32723] Fixed the issue that prevented a compiled vRouter
kmodfrom automatic refreshing with the new kernel.[TF] [32326] Fixed the issue that allowed for unathorized access to the Tungsten Fabric API.
[Ceph] [30635] Fixed the issue with irrelevant error message displaying in the
osd-preparePod during the deployment of Ceph OSDs on removable devices on AMD nodes. Now, the error message clearly states that removable devices with hotplug enabled are not supported for deploying Ceph OSDs.[Ceph] [31630] Fixed the issue that caused the Ceph cluster upgrade to Pacific to be stuck with Rook connection failure.
[Ceph] [31555] Fixed the issue with Ceph finding only 1 out of 2
mgrafter update.[Ceph] [23292] Fixed the issue that caused the failure of the Ceph
rook-operatorwith FIPS kernel.[Update] [27797] Fixed the issue that stopped cluster
kubeconfigfrom working during the MKE minor version update.[Update] [32311] Fixed the issue with the
tf-rabbit-exporterReplicaSet blocking the cluster update.[StackLight] [30867] Fixed the Instance Info panel for RabbitMQ in Grafana.
This section describes the specific actions you as a Cloud Operator need to complete to accurately plan and successfully perform your Mirantis OpenStack for Kubernetes (MOSK) cluster update to the version 23.2. Consider this information as a supplement to the generic update procedure published in Operations Guide: Update a MOSK cluster.
The MOSK cluster will obtain the newly implemented capabilities automatically with no significant impact on the update procedure.
As part of the update to MOSK 23.2, the following automatic updates of major component versions will take place:
MKE 3.5 with Kubernetes 1.21 to 3.6 with Kubernetes 1.24
Ceph Pacific to Quincy
See also
The update to MOSK 23.2 does not include any version-specific impact on the cluster. To start planning a maintenance window, use the Operations Guide: Update a MOSK cluster standard procedure.
Before updating the cluster, be sure to review the potential issues that may arise during the process and the recommended solutions to address them, as outlined in Cluster update known issues.
While updating your cluster, the Instance High Availability service
(OpenStack Masakari) may not work as expected. Therefore, temporarily
disable the service by removing instance-ha from the service list
in the OpenStackDeployment custom resource.
In the next release series, MOSK will stop supporting Ubuntu 18.04. Therefore, Mirantis highly recommends upgrading an operating system on your cluster machines to Ubuntu 20.04 during the course of the MOSK 23.2 series by rebooting cluster nodes.
It is not mandatory to reboot all machines at once. You can reboot them one by one or in small batches, for example, if the maintenance window is limited in time.
Otherwise, the Cluster release update for the cluster running on Ubuntu 18.04 will become impossible.
For details on distribution upgrade, see Upgrade an operating system distribution.
MOSK supports the OpenStack Victoria version until September, 2023. MOSK 23.2 is the last release version where OpenStack Victoria packages are updated.
If you have not already upgraded your OpenStack version to Yoga, Mirantis highly recommends doing this during the course of the MOSK 23.2 series.
After the update, the notifications from OpenStack become unavailable in StackLight. On an attempt to establish a TCP connection to the RabbitMQ server, the connection is refused with the following error:
Could not establish TCP connection to any of the configured hosts
As a workaround, add the following annotation to
the openstack-rabbitmq-users-credentials secret:
kubectl -n openstack patch secrets openstack-rabbitmq-users-credentials --type='json' -p='[{"op": "add", "path": "/metadata/annotations/foo", "value":"bar"}]'
In total, since MOSK 23.1 major release, in 23.2, 1611 Common Vulnerabilities and Exposures (CVE) have been fixed: 65 of critical and 1546 of high severity.
Among them, 689 CVEs that are listed in Addressed CVEs - detailed have been fixed since 23.1.4 patch release: 29 of critical and 660 of high severity. The fixes for the rest of CVEs were released with the patch releases of the MOSK 23.1 series.
The full list of the CVEs present in the current Mirantis OpenStack for Kubernetes (MOSK) release is available at the Mirantis Security Portal.
The Addressed CVEs - summary table includes the total number of unique CVEs along with the total number of issues fixed across images.
Severity |
Critical |
High |
Total |
|---|---|---|---|
Unique CVEs |
5 |
64 |
69 |
Total issues across images |
29 |
660 |
689 |
Note
Duplicate CVEs for packages in
the Addressed CVEs - detailed table can mean that they were
discovered in container images with the same names but different tags,
for example, openstack/barbican for Openstack Victoria and Yoga
versions.
Image |
Component name |
CVE |
|---|---|---|
ceph/mcp/ceph-controller |
libcrypto3 |
CVE-2023-2650 (High) |
libssl3 |
CVE-2023-2650 (High) |
|
ceph/rook |
openssl |
CVE-2022-3786 (High) |
CVE-2022-3602 (High) |
||
CVE-2023-0286 (High) |
||
openssl-libs |
CVE-2022-3602 (High) |
|
CVE-2022-3786 (High) |
||
CVE-2023-0286 (High) |
||
cryptography |
CVE-2023-2650 (High) |
|
general/amqproxy |
libcrypto3 |
CVE-2023-2650 (High) |
libssl3 |
CVE-2023-2650 (High) |
|
general/external/docker.io/frrouting/frr |
libcrypto3 |
CVE-2023-2650 (High) |
libssl3 |
CVE-2023-2650 (High) |
|
libcap2 |
CVE-2023-2603 (High) |
|
ncurses-libs |
CVE-2023-29491 (High) |
|
ncurses-terminfo-base |
CVE-2023-29491 (High) |
|
general/memcached |
libcrypto3 |
CVE-2023-2650 (High) |
libssl3 |
CVE-2023-2650 (High) |
|
general/openvswitch |
linux-libc-dev |
CVE-2023-3090 (High) |
CVE-2023-32629 (High) |
||
CVE-2023-3390 (High) |
||
CVE-2023-35001 (High) |
||
CVE-2023-1380 (High) |
||
CVE-2023-30456 (High) |
||
CVE-2023-31436 (High) |
||
CVE-2023-32233 (High) |
||
CVE-2023-35788 (High) |
||
general/openvswitch-dpdk |
linux-libc-dev |
CVE-2023-35788 (High) |
CVE-2023-1380 (High) |
||
CVE-2023-30456 (High) |
||
CVE-2023-31436 (High) |
||
CVE-2023-32233 (High) |
||
CVE-2023-3090 (High) |
||
CVE-2023-32629 (High) |
||
CVE-2023-3390 (High) |
||
CVE-2023-35001 (High) |
||
mirantis/ceph |
openssl |
CVE-2022-3786 (High) |
CVE-2022-3602 (High) |
||
CVE-2023-0286 (High) |
||
openssl-libs |
CVE-2022-3602 (High) |
|
CVE-2022-3786 (High) |
||
CVE-2023-0286 (High) |
||
python3 |
CVE-2023-24329 (High) |
|
python3-devel |
CVE-2023-24329 (High) |
|
python3-libs |
CVE-2023-24329 (High) |
|
mirantis/cephcsi |
openssl |
CVE-2022-3786 (High) |
CVE-2022-3602 (High) |
||
CVE-2023-0286 (High) |
||
openssl-libs |
CVE-2022-3602 (High) |
|
CVE-2022-3786 (High) |
||
CVE-2023-0286 (High) |
||
cryptography |
CVE-2023-2650 (High) |
|
mirantis/fio |
libcrypto3 |
CVE-2023-2650 (High) |
libssl3 |
CVE-2023-2650 (High) |
|
openstack/aodh |
cryptography |
CVE-2023-2650 (High) |
sqlparse |
CVE-2023-30608 (High) |
|
openstack/barbican |
linux-libc-dev |
CVE-2023-1380 (High) |
CVE-2023-30456 (High) |
||
CVE-2023-31436 (High) |
||
CVE-2023-32233 (High) |
||
CVE-2023-35788 (High) |
||
CVE-2023-1829 (High) |
||
CVE-2023-3567 (High) |
||
CVE-2023-3090 (High) |
||
CVE-2023-32629 (High) |
||
CVE-2023-3390 (High) |
||
CVE-2023-35001 (High) |
||
CVE-2023-1380 (High) |
||
CVE-2023-30456 (High) |
||
CVE-2023-31436 (High) |
||
CVE-2023-32233 (High) |
||
CVE-2023-3090 (High) |
||
CVE-2023-32629 (High) |
||
CVE-2023-3390 (High) |
||
CVE-2023-35001 (High) |
||
CVE-2023-35788 (High) |
||
cryptography |
CVE-2023-2650 (High) |
|
sqlparse |
CVE-2023-30608 (High) |
|
openstack/ceilometer |
cryptography |
CVE-2023-2650 (High) |
sqlparse |
CVE-2023-30608 (High) |
|
openstack/cinder |
cryptography |
CVE-2023-2650 (High) |
sqlparse |
CVE-2023-30608 (High) |
|
openstack/designate |
cryptography |
CVE-2023-2650 (High) |
sqlparse |
CVE-2023-30608 (High) |
|
openstack/extra/etcd |
libcrypto3 |
CVE-2023-2650 (High) |
libssl3 |
CVE-2023-2650 (High) |
|
openstack/extra/kubernetes-entrypoint |
github.com/emicklei/go-restful |
CVE-2022-1996 (Critical) |
golang.org/x/net |
CVE-2022-27664 (High) |
|
CVE-2022-41721 (High) |
||
golang.org/x/text |
CVE-2022-32149 (High) |
|
openstack/extra/nginx |
libcrypto3 |
CVE-2023-2650 (High) |
libssl3 |
CVE-2023-2650 (High) |
|
openstack/extra/nginx-ingress-controller |
golang.org/x/net |
CVE-2022-41721 (High) |
CVE-2022-27664 (High) |
||
curl |
CVE-2023-28319 (High) |
|
libcurl |
CVE-2023-28319 (High) |
|
libcrypto1.1 |
CVE-2023-2650 (High) |
|
libssl1.1 |
CVE-2023-2650 (High) |
|
openssl |
CVE-2023-2650 (High) |
|
github.com/opencontainers/runc |
CVE-2023-28642 (High) |
|
golang.org/x/text |
CVE-2022-32149 (High) |
|
ncurses-libs |
CVE-2023-29491 (High) |
|
ncurses-terminfo-base |
CVE-2023-29491 (High) |
|
nghttp2-libs |
CVE-2023-35945 (High) |
|
openstack/extra/powerdns |
libcrypto3 |
CVE-2023-2650 (High) |
libssl3 |
CVE-2023-2650 (High) |
|
ncurses-libs |
CVE-2023-29491 (High) |
|
ncurses-terminfo-base |
CVE-2023-29491 (High) |
|
openstack/extra/redis |
libcrypto3 |
CVE-2023-2650 (High) |
libssl3 |
CVE-2023-2650 (High) |
|
openstack/extra/strongswan |
libcrypto3 |
CVE-2023-2650 (High) |
libssl3 |
CVE-2023-2650 (High) |
|
openssl |
CVE-2023-2650 (High) |
|
ncurses-libs |
CVE-2023-29491 (High) |
|
ncurses-terminfo-base |
CVE-2023-29491 (High) |
|
nghttp2-libs |
CVE-2023-35945 (High) |
|
openstack/glance |
cryptography |
CVE-2023-2650 (High) |
sqlparse |
CVE-2023-30608 (High) |
|
openstack/gnocchi |
cryptography |
CVE-2023-2650 (High) |
sqlparse |
CVE-2023-30608 (High) |
|
openstack/heat |
cryptography |
CVE-2023-2650 (High) |
sqlparse |
CVE-2023-30608 (High) |
|
openstack/horizon |
cryptography |
CVE-2023-2650 (High) |
sqlparse |
CVE-2023-30608 (High) |
|
Django |
CVE-2023-36053 (High) |
|
openstack/ironic |
cryptography |
CVE-2023-2650 (High) |
sqlparse |
CVE-2023-30608 (High) |
|
openstack/ironic-inspector |
cryptography |
CVE-2023-2650 (High) |
sqlparse |
CVE-2023-30608 (High) |
|
openstack/keystone |
cryptography |
CVE-2023-2650 (High) |
sqlparse |
CVE-2023-30608 (High) |
|
openstack/manila |
cryptography |
CVE-2023-2650 (High) |
openstack/masakari |
cryptography |
CVE-2023-2650 (High) |
sqlparse |
CVE-2023-30608 (High) |
|
openstack/masakari-monitors |
cryptography |
CVE-2023-2650 (High) |
openstack/neutron |
cryptography |
CVE-2023-2650 (High) |
sqlparse |
CVE-2023-30608 (High) |
|
openstack/nova |
cryptography |
CVE-2023-2650 (High) |
sqlparse |
CVE-2023-30608 (High) |
|
openstack/octavia |
cryptography |
CVE-2023-2650 (High) |
sqlparse |
CVE-2023-30608 (High) |
|
openstack/openstack-controller |
cryptography |
CVE-2023-2650 (High) |
aiohttp |
CVE-2023-37276 (High) |
|
openstack/openstack-tools |
cryptography |
CVE-2023-2650 (High) |
openstack/panko |
cryptography |
CVE-2023-2650 (High) |
sqlparse |
CVE-2023-30608 (High) |
|
openstack/placement |
cryptography |
CVE-2023-2650 (High) |
sqlparse |
CVE-2023-30608 (High) |
|
openstack/stepler |
linux-libc-dev |
CVE-2023-1380 (High) |
CVE-2023-30456 (High) |
||
CVE-2023-31436 (High) |
||
CVE-2023-32233 (High) |
||
CVE-2023-1829 (High) |
||
CVE-2023-3567 (High) |
||
CVE-2023-3090 (High) |
||
CVE-2023-32629 (High) |
||
CVE-2023-3390 (High) |
||
CVE-2023-35001 (High) |
||
CVE-2023-35788 (High) |
||
CVE-2023-1829 (High) |
||
CVE-2023-35788 (High) |
||
CVE-2023-3090 (High) |
||
CVE-2023-32629 (High) |
||
CVE-2023-3390 (High) |
||
CVE-2023-35001 (High) |
||
CVE-2023-1380 (High) |
||
CVE-2023-30456 (High) |
||
CVE-2023-31436 (High) |
||
CVE-2023-32233 (High) |
||
CVE-2023-3567 (High) |
||
cryptography |
CVE-2023-2650 (High) |
|
openstack/tempest |
cryptography |
CVE-2023-2650 (High) |
sqlparse |
CVE-2023-30608 (High) |
|
stacklight/alerta-web |
libcrypto3 |
CVE-2023-2650 (High) |
libssl3 |
CVE-2023-2650 (High) |
|
stacklight/alertmanager |
golang.org/x/net |
CVE-2022-41723 (High) |
stacklight/alertmanager-webhook-servicenow |
libcrypto3 |
CVE-2023-2650 (High) |
libssl3 |
CVE-2023-2650 (High) |
|
openssl-dev |
CVE-2023-2650 (High) |
|
Flask |
CVE-2023-30861 (High) |
|
stacklight/alpine-utils |
libcrypto3 |
CVE-2023-2650 (High) |
libssl3 |
CVE-2023-2650 (High) |
|
ncurses-libs |
CVE-2023-29491 (High) |
|
ncurses-terminfo-base |
CVE-2023-29491 (High) |
|
stacklight/blackbox-exporter |
golang.org/x/net |
CVE-2022-41723 (High) |
stacklight/cadvisor |
libcrypto1.1 |
CVE-2023-2650 (High) |
libssl1.1 |
CVE-2023-2650 (High) |
|
stacklight/cerebro |
org.xerial:sqlite-jdbc |
CVE-2023-32697 (Critical) |
com.fasterxml.jackson.core:jackson-databind |
CVE-2021-46877 (High) |
|
CVE-2022-42003 (High) |
||
CVE-2022-42004 (High) |
||
CVE-2020-36518 (High) |
||
libssl1.1 |
CVE-2023-0464 (High) |
|
CVE-2023-2650 (High) |
||
openssl |
CVE-2023-0464 (High) |
|
CVE-2023-2650 (High) |
||
stacklight/fluentd |
libssl-dev |
CVE-2023-0464 (High) |
CVE-2023-2650 (High) |
||
libssl1.1 |
CVE-2023-0464 (High) |
|
CVE-2023-2650 (High) |
||
openssl |
CVE-2023-0464 (High) |
|
CVE-2023-2650 (High) |
||
stacklight/grafana |
libcrypto3 |
CVE-2023-2650 (High) |
libssl3 |
CVE-2023-2650 (High) |
|
ncurses-libs |
CVE-2023-29491 (High) |
|
ncurses-terminfo-base |
CVE-2023-29491 (High) |
|
stacklight/grafana-image-renderer |
tough-cookie |
CVE-2023-26136 (Critical) |
stacklight/jmx-exporter |
libssl1.1 |
CVE-2023-0464 (High) |
CVE-2023-2650 (High) |
||
libncurses6 |
CVE-2022-29458 (High) |
|
libncursesw6 |
CVE-2022-29458 (High) |
|
libtinfo6 |
CVE-2022-29458 (High) |
|
ncurses-base |
CVE-2022-29458 (High) |
|
stacklight/k8s-sidecar |
libcrypto1.1 |
CVE-2023-2650 (High) |
libssl1.1 |
CVE-2023-2650 (High) |
|
ncurses-libs |
CVE-2023-29491 (High) |
|
ncurses-terminfo-base |
CVE-2023-29491 (High) |
|
stacklight/kubectl |
libssl1.1 |
CVE-2023-0464 (High) |
CVE-2023-2650 (High) |
||
openssl |
CVE-2023-0464 (High) |
|
CVE-2023-2650 (High) |
||
stacklight/metric-collector |
libcrypto3 |
CVE-2023-2650 (High) |
libssl3 |
CVE-2023-2650 (High) |
|
stacklight/metricbeat |
python |
CVE-2023-24329 (High) |
python-libs |
CVE-2023-24329 (High) |
|
stacklight/node-exporter |
golang.org/x/net |
CVE-2022-41723 (High) |
stacklight/opensearch |
org.codelibs.elasticsearch.module:ingest-common |
CVE-2015-5377 (Critical) |
CVE-2019-7611 (High) |
||
org.xerial:sqlite-jdbc |
CVE-2023-32697 (Critical) |
|
org.springframework:spring-core |
CVE-2023-20860 (High) |
|
ncurses |
CVE-2023-29491 (High) |
|
ncurses-base |
CVE-2023-29491 (High) |
|
ncurses-libs |
CVE-2023-29491 (High) |
|
stacklight/opensearch-dashboards |
tough-cookie |
CVE-2023-26136 (Critical) |
debug |
CVE-2015-8315 (High) |
|
decode-uri-component |
CVE-2022-38900 (High) |
|
glob-parent |
CVE-2021-35065 (High) |
|
ncurses |
CVE-2023-29491 (High) |
|
ncurses-base |
CVE-2023-29491 (High) |
|
ncurses-libs |
CVE-2023-29491 (High) |
|
stacklight/prometheus |
github.com/docker/docker |
CVE-2023-28840 (High) |
golang.org/x/net |
CVE-2022-41723 (High) |
|
stacklight/prometheus-es-exporter |
libcrypto1.1 |
CVE-2023-2650 (High) |
libssl1.1 |
CVE-2023-2650 (High) |
|
ncurses-libs |
CVE-2023-29491 (High) |
|
ncurses-terminfo-base |
CVE-2023-29491 (High) |
|
stacklight/prometheus-libvirt-exporter |
libcrypto3 |
CVE-2023-2650 (High) |
libssl3 |
CVE-2023-2650 (High) |
|
stacklight/prometheus-patroni-exporter |
libcrypto3 |
CVE-2023-2650 (High) |
libssl3 |
CVE-2023-2650 (High) |
|
stacklight/prometheus-relay |
libcrypto3 |
CVE-2023-2650 (High) |
libssl3 |
CVE-2023-2650 (High) |
|
stacklight/sf-notifier |
libcrypto1.1 |
CVE-2023-2650 (High) |
libssl1.1 |
CVE-2023-2650 (High) |
|
openssl-dev |
CVE-2023-2650 (High) |
|
ncurses-libs |
CVE-2023-29491 (High) |
|
ncurses-terminfo-base |
CVE-2023-29491 (High) |
|
stacklight/sf-reporter |
libcrypto3 |
CVE-2023-2650 (High) |
libssl3 |
CVE-2023-2650 (High) |
|
ncurses-libs |
CVE-2023-29491 (High) |
|
ncurses-terminfo-base |
CVE-2023-29491 (High) |
|
stacklight/spilo |
PyJWT |
CVE-2022-29217 (High) |
golang.org/x/net |
CVE-2022-27664 (High) |
|
golang.org/x/text |
CVE-2022-32149 (High) |
|
gopkg.in/yaml.v3 |
CVE-2022-28948 (High) |
|
stacklight/stacklight-toolkit |
libcrypto3 |
CVE-2023-2650 (High) |
libssl3 |
CVE-2023-2650 (High) |
|
ncurses-libs |
CVE-2023-29491 (High) |
|
ncurses-terminfo-base |
CVE-2023-29491 (High) |
|
stacklight/telegraf |
libssl1.1 |
CVE-2023-0464 (High) |
CVE-2023-2650 (High) |
||
openssl |
CVE-2023-0464 (High) |
|
CVE-2023-2650 (High) |
||
stacklight/telemeter |
libcrypto3 |
CVE-2023-2650 (High) |
libssl3 |
CVE-2023-2650 (High) |
|
stacklight/tungstenfabric-prometheus-exporter |
libcrypto3 |
CVE-2023-2650 (High) |
libssl3 |
CVE-2023-2650 (High) |
|
stacklight/yq |
libcrypto3 |
CVE-2023-2650 (High) |
libssl3 |
CVE-2023-2650 (High) |
|
tungsten-operator/casskop |
libssl1.1 |
CVE-2023-0464 (High) |
CVE-2023-2650 (High) |
||
openssl |
CVE-2023-0464 (High) |
|
CVE-2023-2650 (High) |
||
tungsten/cass-config-builder |
python-unversioned-command |
CVE-2023-24329 (High) |
python3 |
CVE-2023-24329 (High) |
|
python3-libs |
CVE-2023-24329 (High) |
|
java-1.8.0-openjdk-headless |
CVE-2023-21930 (High) |
|
tungsten/cassandra |
libssl1.1 |
CVE-2023-0286 (High) |
openssl |
CVE-2023-0286 (High) |
|
tungsten/cassandra-bootstrap |
libssl1.1 |
CVE-2023-0464 (High) |
CVE-2023-2650 (High) |
||
openssl |
CVE-2023-0464 (High) |
|
CVE-2023-2650 (High) |
||
libtinfo6 |
CVE-2022-29458 (High) |
|
ncurses-base |
CVE-2022-29458 (High) |
|
tungsten/contrail-analytics-alarm-gen |
bottle |
CVE-2022-31799 (Critical) |
python |
CVE-2023-24329 (High) |
|
python-devel |
CVE-2023-24329 (High) |
|
python-libs |
CVE-2023-24329 (High) |
|
python3 |
CVE-2023-24329 (High) |
|
python3-libs |
CVE-2023-24329 (High) |
|
openssl |
CVE-2023-0286 (High) |
|
openssl-libs |
CVE-2023-0286 (High) |
|
c-ares |
CVE-2023-32067 (High) |
|
nss |
CVE-2023-0767 (High) |
|
nss-sysinit |
CVE-2023-0767 (High) |
|
nss-tools |
CVE-2023-0767 (High) |
|
bind-license |
CVE-2023-2828 (High) |
|
pip |
CVE-2018-20225 (High) |
|
wheel |
CVE-2022-40898 (High) |
|
tungsten/contrail-analytics-api |
bottle |
CVE-2022-31799 (Critical) |
python |
CVE-2023-24329 (High) |
|
python-devel |
CVE-2023-24329 (High) |
|
python-libs |
CVE-2023-24329 (High) |
|
python3 |
CVE-2023-24329 (High) |
|
python3-libs |
CVE-2023-24329 (High) |
|
openssl |
CVE-2023-0286 (High) |
|
openssl-libs |
CVE-2023-0286 (High) |
|
c-ares |
CVE-2023-32067 (High) |
|
nss |
CVE-2023-0767 (High) |
|
nss-sysinit |
CVE-2023-0767 (High) |
|
nss-tools |
CVE-2023-0767 (High) |
|
bind-license |
CVE-2023-2828 (High) |
|
pip |
CVE-2018-20225 (High) |
|
wheel |
CVE-2022-40898 (High) |
|
tungsten/contrail-analytics-collector |
bottle |
CVE-2022-31799 (Critical) |
python |
CVE-2023-24329 (High) |
|
python-devel |
CVE-2023-24329 (High) |
|
python-libs |
CVE-2023-24329 (High) |
|
python3 |
CVE-2023-24329 (High) |
|
python3-libs |
CVE-2023-24329 (High) |
|
openssl |
CVE-2023-0286 (High) |
|
openssl-libs |
CVE-2023-0286 (High) |
|
c-ares |
CVE-2023-32067 (High) |
|
nss |
CVE-2023-0767 (High) |
|
nss-sysinit |
CVE-2023-0767 (High) |
|
nss-tools |
CVE-2023-0767 (High) |
|
bind-license |
CVE-2023-2828 (High) |
|
pip |
CVE-2018-20225 (High) |
|
wheel |
CVE-2022-40898 (High) |
|
tungsten/contrail-analytics-query-engine |
bottle |
CVE-2022-31799 (Critical) |
python |
CVE-2023-24329 (High) |
|
python-devel |
CVE-2023-24329 (High) |
|
python-libs |
CVE-2023-24329 (High) |
|
python3 |
CVE-2023-24329 (High) |
|
python3-libs |
CVE-2023-24329 (High) |
|
openssl |
CVE-2023-0286 (High) |
|
openssl-libs |
CVE-2023-0286 (High) |
|
c-ares |
CVE-2023-32067 (High) |
|
nss |
CVE-2023-0767 (High) |
|
nss-sysinit |
CVE-2023-0767 (High) |
|
nss-tools |
CVE-2023-0767 (High) |
|
bind-license |
CVE-2023-2828 (High) |
|
pip |
CVE-2018-20225 (High) |
|
wheel |
CVE-2022-40898 (High) |
|
tungsten/contrail-analytics-snmp-collector |
bottle |
CVE-2022-31799 (Critical) |
python |
CVE-2023-24329 (High) |
|
python-devel |
CVE-2023-24329 (High) |
|
python-libs |
CVE-2023-24329 (High) |
|
python3 |
CVE-2023-24329 (High) |
|
python3-libs |
CVE-2023-24329 (High) |
|
openssl |
CVE-2023-0286 (High) |
|
openssl-libs |
CVE-2023-0286 (High) |
|
c-ares |
CVE-2023-32067 (High) |
|
nss |
CVE-2023-0767 (High) |
|
nss-sysinit |
CVE-2023-0767 (High) |
|
nss-tools |
CVE-2023-0767 (High) |
|
bind-license |
CVE-2023-2828 (High) |
|
pip |
CVE-2018-20225 (High) |
|
wheel |
CVE-2022-40898 (High) |
|
tungsten/contrail-analytics-snmp-topology |
bottle |
CVE-2022-31799 (Critical) |
python |
CVE-2023-24329 (High) |
|
python-devel |
CVE-2023-24329 (High) |
|
python-libs |
CVE-2023-24329 (High) |
|
python3 |
CVE-2023-24329 (High) |
|
python3-libs |
CVE-2023-24329 (High) |
|
openssl |
CVE-2023-0286 (High) |
|
openssl-libs |
CVE-2023-0286 (High) |
|
c-ares |
CVE-2023-32067 (High) |
|
nss |
CVE-2023-0767 (High) |
|
nss-sysinit |
CVE-2023-0767 (High) |
|
nss-tools |
CVE-2023-0767 (High) |
|
bind-license |
CVE-2023-2828 (High) |
|
pip |
CVE-2018-20225 (High) |
|
wheel |
CVE-2022-40898 (High) |
|
tungsten/contrail-controller-config-api |
bottle |
CVE-2022-31799 (Critical) |
python |
CVE-2023-24329 (High) |
|
python-devel |
CVE-2023-24329 (High) |
|
python-libs |
CVE-2023-24329 (High) |
|
python3 |
CVE-2023-24329 (High) |
|
python3-libs |
CVE-2023-24329 (High) |
|
openssl |
CVE-2023-0286 (High) |
|
openssl-libs |
CVE-2023-0286 (High) |
|
c-ares |
CVE-2023-32067 (High) |
|
nss |
CVE-2023-0767 (High) |
|
nss-sysinit |
CVE-2023-0767 (High) |
|
nss-tools |
CVE-2023-0767 (High) |
|
openssh |
CVE-2023-38408 (High) |
|
openssh-clients |
CVE-2023-38408 (High) |
|
bind-license |
CVE-2023-2828 (High) |
|
pip |
CVE-2018-20225 (High) |
|
wheel |
CVE-2022-40898 (High) |
|
tungsten/contrail-controller-config-devicemgr |
bottle |
CVE-2022-31799 (Critical) |
git |
CVE-2023-25652 (High) |
|
CVE-2023-29007 (High) |
||
CVE-2022-41903 (High) |
||
CVE-2022-23521 (High) |
||
perl-Git |
CVE-2022-23521 (High) |
|
CVE-2022-41903 (High) |
||
CVE-2023-29007 (High) |
||
CVE-2023-25652 (High) |
||
python |
CVE-2023-24329 (High) |
|
python-devel |
CVE-2023-24329 (High) |
|
python-libs |
CVE-2023-24329 (High) |
|
python3 |
CVE-2023-24329 (High) |
|
python3-libs |
CVE-2023-24329 (High) |
|
openssl |
CVE-2023-0286 (High) |
|
openssl-libs |
CVE-2023-0286 (High) |
|
c-ares |
CVE-2023-32067 (High) |
|
nss |
CVE-2023-0767 (High) |
|
nss-sysinit |
CVE-2023-0767 (High) |
|
nss-tools |
CVE-2023-0767 (High) |
|
openssh |
CVE-2023-38408 (High) |
|
openssh-clients |
CVE-2023-38408 (High) |
|
bind-license |
CVE-2023-2828 (High) |
|
pip |
CVE-2018-20225 (High) |
|
wheel |
CVE-2022-40898 (High) |
|
tungsten/contrail-controller-config-dnsmasq |
bottle |
CVE-2022-31799 (Critical) |
python |
CVE-2023-24329 (High) |
|
python-libs |
CVE-2023-24329 (High) |
|
python3 |
CVE-2023-24329 (High) |
|
python3-libs |
CVE-2023-24329 (High) |
|
openssl-libs |
CVE-2023-0286 (High) |
|
c-ares |
CVE-2023-32067 (High) |
|
nss |
CVE-2023-0767 (High) |
|
nss-sysinit |
CVE-2023-0767 (High) |
|
nss-tools |
CVE-2023-0767 (High) |
|
bind-license |
CVE-2023-2828 (High) |
|
pip |
CVE-2018-20225 (High) |
|
wheel |
CVE-2022-40898 (High) |
|
tungsten/contrail-controller-config-schema |
bottle |
CVE-2022-31799 (Critical) |
python |
CVE-2023-24329 (High) |
|
python-devel |
CVE-2023-24329 (High) |
|
python-libs |
CVE-2023-24329 (High) |
|
python3 |
CVE-2023-24329 (High) |
|
python3-libs |
CVE-2023-24329 (High) |
|
openssl |
CVE-2023-0286 (High) |
|
openssl-libs |
CVE-2023-0286 (High) |
|
c-ares |
CVE-2023-32067 (High) |
|
nss |
CVE-2023-0767 (High) |
|
nss-sysinit |
CVE-2023-0767 (High) |
|
nss-tools |
CVE-2023-0767 (High) |
|
openssh |
CVE-2023-38408 (High) |
|
openssh-clients |
CVE-2023-38408 (High) |
|
bind-license |
CVE-2023-2828 (High) |
|
pip |
CVE-2018-20225 (High) |
|
wheel |
CVE-2022-40898 (High) |
|
tungsten/contrail-controller-config-svcmonitor |
bottle |
CVE-2022-31799 (Critical) |
python |
CVE-2023-24329 (High) |
|
python-devel |
CVE-2023-24329 (High) |
|
python-libs |
CVE-2023-24329 (High) |
|
python3 |
CVE-2023-24329 (High) |
|
python3-libs |
CVE-2023-24329 (High) |
|
openssl |
CVE-2023-0286 (High) |
|
openssl-libs |
CVE-2023-0286 (High) |
|
c-ares |
CVE-2023-32067 (High) |
|
nss |
CVE-2023-0767 (High) |
|
nss-sysinit |
CVE-2023-0767 (High) |
|
nss-tools |
CVE-2023-0767 (High) |
|
openssh |
CVE-2023-38408 (High) |
|
openssh-clients |
CVE-2023-38408 (High) |
|
bind-license |
CVE-2023-2828 (High) |
|
pip |
CVE-2018-20225 (High) |
|
wheel |
CVE-2022-40898 (High) |
|
tungsten/contrail-controller-control-control |
bottle |
CVE-2022-31799 (Critical) |
python |
CVE-2023-24329 (High) |
|
python-devel |
CVE-2023-24329 (High) |
|
python-libs |
CVE-2023-24329 (High) |
|
python3 |
CVE-2023-24329 (High) |
|
python3-libs |
CVE-2023-24329 (High) |
|
openssl |
CVE-2023-0286 (High) |
|
openssl-libs |
CVE-2023-0286 (High) |
|
c-ares |
CVE-2023-32067 (High) |
|
nss |
CVE-2023-0767 (High) |
|
nss-sysinit |
CVE-2023-0767 (High) |
|
nss-tools |
CVE-2023-0767 (High) |
|
bind-license |
CVE-2023-2828 (High) |
|
pip |
CVE-2018-20225 (High) |
|
wheel |
CVE-2022-40898 (High) |
|
tungsten/contrail-controller-control-dns |
bottle |
CVE-2022-31799 (Critical) |
python |
CVE-2023-24329 (High) |
|
python-devel |
CVE-2023-24329 (High) |
|
python-libs |
CVE-2023-24329 (High) |
|
python3 |
CVE-2023-24329 (High) |
|
python3-libs |
CVE-2023-24329 (High) |
|
openssl |
CVE-2023-0286 (High) |
|
openssl-libs |
CVE-2023-0286 (High) |
|
c-ares |
CVE-2023-32067 (High) |
|
nss |
CVE-2023-0767 (High) |
|
nss-sysinit |
CVE-2023-0767 (High) |
|
nss-tools |
CVE-2023-0767 (High) |
|
bind-license |
CVE-2023-2828 (High) |
|
pip |
CVE-2018-20225 (High) |
|
wheel |
CVE-2022-40898 (High) |
|
tungsten/contrail-controller-control-named |
bottle |
CVE-2022-31799 (Critical) |
python |
CVE-2023-24329 (High) |
|
python-devel |
CVE-2023-24329 (High) |
|
python-libs |
CVE-2023-24329 (High) |
|
python3 |
CVE-2023-24329 (High) |
|
python3-libs |
CVE-2023-24329 (High) |
|
openssl |
CVE-2023-0286 (High) |
|
openssl-libs |
CVE-2023-0286 (High) |
|
c-ares |
CVE-2023-32067 (High) |
|
nss |
CVE-2023-0767 (High) |
|
nss-sysinit |
CVE-2023-0767 (High) |
|
nss-tools |
CVE-2023-0767 (High) |
|
bind-license |
CVE-2023-2828 (High) |
|
pip |
CVE-2018-20225 (High) |
|
wheel |
CVE-2022-40898 (High) |
|
tungsten/contrail-controller-webui-job |
tough-cookie |
CVE-2023-26136 (Critical) |
python |
CVE-2023-24329 (High) |
|
python-libs |
CVE-2023-24329 (High) |
|
python3 |
CVE-2023-24329 (High) |
|
python3-libs |
CVE-2023-24329 (High) |
|
openssl |
CVE-2023-0286 (High) |
|
openssl-libs |
CVE-2023-0286 (High) |
|
nss |
CVE-2023-0767 (High) |
|
nss-sysinit |
CVE-2023-0767 (High) |
|
nss-tools |
CVE-2023-0767 (High) |
|
bind-license |
CVE-2023-2828 (High) |
|
pip |
CVE-2018-20225 (High) |
|
ansi-regex |
CVE-2021-3807 (High) |
|
decode-uri-component |
CVE-2022-38900 (High) |
|
minimatch |
CVE-2022-3517 (High) |
|
qs |
CVE-2022-24999 (High) |
|
CVE-2017-1000048 (High) |
||
redis |
CVE-2021-29469 (High) |
|
trim-newlines |
CVE-2021-33623 (High) |
|
wheel |
CVE-2022-40898 (High) |
|
tungsten/contrail-controller-webui-web |
tough-cookie |
CVE-2023-26136 (Critical) |
python |
CVE-2023-24329 (High) |
|
python-libs |
CVE-2023-24329 (High) |
|
python3 |
CVE-2023-24329 (High) |
|
python3-libs |
CVE-2023-24329 (High) |
|
openssl |
CVE-2023-0286 (High) |
|
openssl-libs |
CVE-2023-0286 (High) |
|
nss |
CVE-2023-0767 (High) |
|
nss-sysinit |
CVE-2023-0767 (High) |
|
nss-tools |
CVE-2023-0767 (High) |
|
bind-license |
CVE-2023-2828 (High) |
|
pip |
CVE-2018-20225 (High) |
|
ansi-regex |
CVE-2021-3807 (High) |
|
decode-uri-component |
CVE-2022-38900 (High) |
|
minimatch |
CVE-2022-3517 (High) |
|
qs |
CVE-2022-24999 (High) |
|
CVE-2017-1000048 (High) |
||
redis |
CVE-2021-29469 (High) |
|
trim-newlines |
CVE-2021-33623 (High) |
|
wheel |
CVE-2022-40898 (High) |
|
tungsten/contrail-node-init |
bottle |
CVE-2022-31799 (Critical) |
python |
CVE-2023-24329 (High) |
|
python-devel |
CVE-2023-24329 (High) |
|
python-libs |
CVE-2023-24329 (High) |
|
python3 |
CVE-2023-24329 (High) |
|
python3-libs |
CVE-2023-24329 (High) |
|
openssl |
CVE-2023-0286 (High) |
|
openssl-libs |
CVE-2023-0286 (High) |
|
c-ares |
CVE-2023-32067 (High) |
|
nss |
CVE-2023-0767 (High) |
|
nss-sysinit |
CVE-2023-0767 (High) |
|
nss-tools |
CVE-2023-0767 (High) |
|
bind-license |
CVE-2023-2828 (High) |
|
pip |
CVE-2018-20225 (High) |
|
wheel |
CVE-2022-40898 (High) |
|
tungsten/contrail-nodemgr |
bottle |
CVE-2022-31799 (Critical) |
github.com/emicklei/go-restful |
CVE-2022-1996 (Critical) |
|
golang.org/x/net |
CVE-2022-27664 (High) |
|
CVE-2021-33194 (High) |
||
CVE-2022-27664 (High) |
||
CVE-2022-41721 (High) |
||
CVE-2022-27664 (High) |
||
python |
CVE-2023-24329 (High) |
|
python-devel |
CVE-2023-24329 (High) |
|
python-libs |
CVE-2023-24329 (High) |
|
python3 |
CVE-2023-24329 (High) |
|
python3-libs |
CVE-2023-24329 (High) |
|
openssl |
CVE-2023-0286 (High) |
|
openssl-libs |
CVE-2023-0286 (High) |
|
c-ares |
CVE-2023-32067 (High) |
|
nss |
CVE-2023-0767 (High) |
|
nss-sysinit |
CVE-2023-0767 (High) |
|
nss-tools |
CVE-2023-0767 (High) |
|
bind-license |
CVE-2023-2828 (High) |
|
github.com/opencontainers/runc |
CVE-2023-28642 (High) |
|
pip |
CVE-2018-20225 (High) |
|
golang.org/x/text |
CVE-2022-32149 (High) |
|
wheel |
CVE-2022-40898 (High) |
|
tungsten/contrail-provisioner |
bottle |
CVE-2022-31799 (Critical) |
python |
CVE-2023-24329 (High) |
|
python-devel |
CVE-2023-24329 (High) |
|
python-libs |
CVE-2023-24329 (High) |
|
python3 |
CVE-2023-24329 (High) |
|
python3-libs |
CVE-2023-24329 (High) |
|
openssl |
CVE-2023-0286 (High) |
|
openssl-libs |
CVE-2023-0286 (High) |
|
c-ares |
CVE-2023-32067 (High) |
|
nss |
CVE-2023-0767 (High) |
|
nss-sysinit |
CVE-2023-0767 (High) |
|
nss-tools |
CVE-2023-0767 (High) |
|
bind-license |
CVE-2023-2828 (High) |
|
pip |
CVE-2018-20225 (High) |
|
wheel |
CVE-2022-40898 (High) |
|
tungsten/contrail-tools |
bottle |
CVE-2022-31799 (Critical) |
python |
CVE-2023-24329 (High) |
|
python-devel |
CVE-2023-24329 (High) |
|
python-libs |
CVE-2023-24329 (High) |
|
python3 |
CVE-2023-24329 (High) |
|
python3-libs |
CVE-2023-24329 (High) |
|
openssl |
CVE-2023-0286 (High) |
|
openssl-libs |
CVE-2023-0286 (High) |
|
sudo |
CVE-2023-22809 (High) |
|
c-ares |
CVE-2023-32067 (High) |
|
nss |
CVE-2023-0767 (High) |
|
nss-sysinit |
CVE-2023-0767 (High) |
|
nss-tools |
CVE-2023-0767 (High) |
|
openssh |
CVE-2023-38408 (High) |
|
openssh-clients |
CVE-2023-38408 (High) |
|
bind-license |
CVE-2023-2828 (High) |
|
pip |
CVE-2018-20225 (High) |
|
wheel |
CVE-2022-40898 (High) |
|
tungsten/contrail-vrouter-agent |
bottle |
CVE-2022-31799 (Critical) |
python |
CVE-2023-24329 (High) |
|
python-devel |
CVE-2023-24329 (High) |
|
python-libs |
CVE-2023-24329 (High) |
|
python3 |
CVE-2023-24329 (High) |
|
python3-libs |
CVE-2023-24329 (High) |
|
openssl |
CVE-2023-0286 (High) |
|
openssl-libs |
CVE-2023-0286 (High) |
|
sudo |
CVE-2023-22809 (High) |
|
c-ares |
CVE-2023-32067 (High) |
|
nss |
CVE-2023-0767 (High) |
|
nss-sysinit |
CVE-2023-0767 (High) |
|
nss-tools |
CVE-2023-0767 (High) |
|
bind-export-libs |
CVE-2023-2828 (High) |
|
bind-license |
CVE-2023-2828 (High) |
|
pip |
CVE-2018-20225 (High) |
|
wheel |
CVE-2022-40898 (High) |
|
tungsten/contrail-vrouter-agent-dpdk |
bottle |
CVE-2022-31799 (Critical) |
python |
CVE-2023-24329 (High) |
|
python-devel |
CVE-2023-24329 (High) |
|
python-libs |
CVE-2023-24329 (High) |
|
python3 |
CVE-2023-24329 (High) |
|
python3-libs |
CVE-2023-24329 (High) |
|
openssl |
CVE-2023-0286 (High) |
|
openssl-libs |
CVE-2023-0286 (High) |
|
sudo |
CVE-2023-22809 (High) |
|
c-ares |
CVE-2023-32067 (High) |
|
nss |
CVE-2023-0767 (High) |
|
nss-sysinit |
CVE-2023-0767 (High) |
|
nss-tools |
CVE-2023-0767 (High) |
|
bind-export-libs |
CVE-2023-2828 (High) |
|
bind-license |
CVE-2023-2828 (High) |
|
pip |
CVE-2018-20225 (High) |
|
wheel |
CVE-2022-40898 (High) |
|
tungsten/contrail-vrouter-kernel-build-init |
kernel-headers |
CVE-2023-0461 (High) |
CVE-2022-3564 (High) |
||
tungsten/cp-kafka |
python39 |
CVE-2023-24329 (High) |
python39-libs |
CVE-2023-24329 (High) |
|
platform-python |
CVE-2023-24329 (High) |
|
python3-libs |
CVE-2023-24329 (High) |
|
tungsten/redis |
libcrypto3 |
CVE-2023-2650 (High) |
libssl3 |
CVE-2023-2650 (High) |
|
tungsten/tf-cli |
kernel-headers |
CVE-2023-0461 (High) |
CVE-2022-3564 (High) |
||
python39 |
CVE-2023-24329 (High) |
|
python39-devel |
CVE-2023-24329 (High) |
|
python39-libs |
CVE-2023-24329 (High) |
|
platform-python |
CVE-2023-24329 (High) |
|
python3-libs |
CVE-2023-24329 (High) |
|
bind-libs |
CVE-2023-2828 (High) |
|
bind-libs-lite |
CVE-2023-2828 (High) |
|
bind-license |
CVE-2023-2828 (High) |
|
bind-utils |
CVE-2023-2828 (High) |
|
python3-bind |
CVE-2023-2828 (High) |
|
tungsten/tungsten-pytest |
python39 |
CVE-2023-24329 (High) |
python39-libs |
CVE-2023-24329 (High) |
|
platform-python |
CVE-2023-24329 (High) |
|
python3-libs |
CVE-2023-24329 (High) |
|
cryptography |
CVE-2023-2650 (High) |
23.2.1 patch
The patch release notes contain the list of artifacts and Common Vulnerabilities and Exposures (CVE) fixes for the MOSK 23.2.1 patch released on August 29, 2023.
For the list of enhancements and bug fixes that relate to Mirantis Container Cloud, refer to the Mirantis Container Cloud Release notes.
Release date |
August 29, 2023 |
|---|---|
Scope |
Patch |
Cluster release |
15.0.2 |
OpenStack Operator |
0.13.10 |
Tungsten Fabric Operator |
0.12.4 |
This section lists the components artifacts of the MOSK 23.2.1 release that includes binaries, Docker images, and Helm charts.
MOSK 23.2.1 OpenStack Victoria binaries and Docker images
Component |
Path |
License information for main executable programs |
|---|---|---|
Binaries |
||
octavia-amphora |
https://binary.mirantis.com/openstack/bin/octavia/amphora-x64-haproxy-victoria-20230706155916.qcow2 |
Mirantis Proprietary License |
mirantis |
https://binary.mirantis.com/openstack/bin/horizon/mirantis-victoria-8f71802-20210119120707.tar.gz |
Mirantis Proprietary License |
kernel |
GPL-2.0 |
|
initramfs |
https://binary.mirantis.com/openstack/bin/ironic/tinyipa/tinyipa-stable-victoria-20230128063511.gz |
GPL-2.0 |
service-image |
https://binary.mirantis.com/openstack/bin/manila/manila-service-image-20221228132450.qcow2 |
Mirantis Proprietary License |
Docker images |
||
keystone |
mirantis.azurecr.io/openstack/keystone:victoria-focal-20230821170130 |
Apache License 2.0 |
heat |
mirantis.azurecr.io/openstack/heat:victoria-focal-20230821170130 |
Apache License 2.0 |
glance |
mirantis.azurecr.io/openstack/glance:victoria-focal-20230821170130 |
Apache License 2.0 |
cinder |
mirantis.azurecr.io/openstack/cinder:victoria-focal-20230821170130 |
Apache License 2.0 |
cloudprober |
mirantis.azurecr.io/openstack/extra/cloudprober:v0.12.7-20230623070627 |
Apache License 2.0 |
neutron |
mirantis.azurecr.io/openstack/neutron:victoria-focal-20230821170130 |
Apache License 2.0 |
nova |
mirantis.azurecr.io/openstack/nova:victoria-focal-20230821170130 |
Apache License 2.0 |
horizon |
mirantis.azurecr.io/openstack/horizon:victoria-focal-20230821170130 |
Apache License 2.0 |
tempest |
mirantis.azurecr.io/openstack/tempest:victoria-focal-20230821170130 |
Apache License 2.0 |
octavia |
mirantis.azurecr.io/openstack/octavia:victoria-focal-20230821170130 |
Apache License 2.0 |
designate |
mirantis.azurecr.io/openstack/designate:victoria-focal-20230821170130 |
Apache License 2.0 |
ironic |
mirantis.azurecr.io/openstack/ironic:victoria-focal-20230821170130 |
Apache License 2.0 |
barbican |
mirantis.azurecr.io/openstack/barbican:victoria-focal-20230821170130 |
Apache License 2.0 |
libvirt |
mirantis.azurecr.io/general/libvirt:6.0.0-focal-20230730124813 |
LGPL-2.1 License |
pause |
mirantis.azurecr.io/general/external/pause:3.1 |
Apache License 2.0 |
openvswitch |
mirantis.azurecr.io/general/openvswitch:2.13-focal-20230730124813 |
Apache License 2.0 |
openvswitch-dpdk |
mirantis.azurecr.io/general/openvswitch-dpdk:2.13-focal-20230730124813 |
Apache License 2.0 |
openstack-tools |
mirantis.azurecr.io/openstack/openstack-tools:yoga-focal-20230821170130 |
Apache License 2.0 |
rabbitmq-3.10.x |
mirantis.azurecr.io/openstack/extra/rabbitmq:3.10.18-focal-20230222154055 |
Mozilla Public License 2.0 |
rabbitmq-3.10.x-management |
mirantis.azurecr.io/openstack/extra/rabbitmq-management:3.10.18-focal-20230222154055 |
Mozilla Public License 2.0 |
kubernetes-entrypoint |
mirantis.azurecr.io/openstack/extra/kubernetes-entrypoint:v1.0.1-5359171-20230810125608 |
Apache License 2.0 |
memcached |
mirantis.azurecr.io/general/memcached:v1.6.20-alpine-20230614113432 |
BSD 3-Clause “New” or “Revised” License |
etcd |
mirantis.azurecr.io/openstack/extra/etcd:v3.5.9-alpine-20230610071256 |
Apache License 2.0 |
powerdns |
mirantis.azurecr.io/openstack/extra/powerdns:4.7-alpine-20230817061604 |
GPL-2.0 License |
nginx-ingress-controller |
mirantis.azurecr.io/openstack/extra/nginx-ingress-controller:1.8.0-alpine-20230617191825 |
Apache License 2.0 |
tls-proxy |
mirantis.azurecr.io/openstack/tls-proxy:focal-fipster-20230725114156 |
Mirantis Proprietary License |
defaultbackend |
mirantis.azurecr.io/openstack/extra/defaultbackend:v1.19.2-77af1ef-20220823043839 |
Apache License 2.0 |
mariadb |
mirantis.azurecr.io/general/mariadb:10.6.14-focal-20230730124341 |
GPLv2, LGPLv2.1 (client libraries) |
rabbitmq-exporter |
mirantis.azurecr.io/stacklight/rabbitmq-exporter:1.0.0-RC19 |
MIT License |
memcached-exporter |
mirantis.azurecr.io/stacklight/memcached-exporter:v0.11.3 |
Apache License 2.0 |
prometheus-mysql-exporter |
mirantis.azurecr.io/stacklight/mysqld-exporter:v0.11.0 |
Apache License 2.0 |
aodh |
mirantis.azurecr.io/openstack/aodh:victoria-focal-20230821170130 |
Apache License 2.0 |
ceilometer |
mirantis.azurecr.io/openstack/ceilometer:victoria-focal-20230821170130 |
Apache License 2.0 |
gnocchi |
mirantis.azurecr.io/openstack/gnocchi:victoria-focal-20230821170130 |
Apache License 2.0 |
redis |
mirantis.azurecr.io/openstack/extra/redis:7.0.11-alpine3.18 |
BSD 3-Clause “New” or “Revised” License |
frr |
mirantis.azurecr.io/general/external/docker.io/frrouting/frr:v8.5.1-20230619084330 |
GPL-2.0 and LGPL-2.1 |
strongswan |
mirantis.azurecr.io/openstack/extra/strongswan:alpine-5.9.8-20230720054838 |
GPL-2.0 |
rsyslog |
mirantis.azurecr.io/openstack/extra/rsyslog:v8.2001.0-20230730124813 |
GNU General Public License v3 |
descheduler |
mirantis.azurecr.io/openstack/extra/descheduler:v0.27.0 |
Apache License 2.0 |
nginx |
mirantis.azurecr.io/openstack/extra/nginx:1.25.1-alpine-slim |
Apache License 2.0 |
requirements |
mirantis.azurecr.io/openstack/requirements:victoria-focal-20230821170130 |
Apache License 2.0 |
placement |
mirantis.azurecr.io/openstack/placement:victoria-focal-20230821170130 |
Apache License 2.0 |
stepler |
mirantis.azurecr.io/openstack/stepler:victoria-focal-20230730124813 |
Apache License 2.0 |
masakari |
mirantis.azurecr.io/openstack/masakari:victoria-focal-20230821170130 |
Apache License 2.0 |
masakari-monitors |
mirantis.azurecr.io/openstack/masakari-monitors:victoria-focal-20230821170130 |
Apache License 2.0 |
ironic-inspector |
mirantis.azurecr.io/openstack/ironic-inspector:victoria-focal-20230821170130 |
Apache License 2.0 |
panko |
mirantis.azurecr.io/openstack/panko:victoria-focal-20230821170130 |
Apache License 2.0 |
MOSK 23.2.1 OpenStack Yoga binaries and Docker images
Component |
Path |
License information for main executable programs |
|---|---|---|
Binaries |
||
octavia-amphora |
https://binary.mirantis.com/openstack/bin/octavia/amphora-x64-haproxy-yoga-20230718165730.qcow2 |
Mirantis Proprietary License |
mirantis |
https://binary.mirantis.com/openstack/bin/horizon/mirantis-xena-9f691e3-20220110111511.tar.gz |
Mirantis Proprietary License |
kernel |
https://binary.mirantis.com/openstack/bin/ironic/tinyipa/tinyipa-stable-yoga-20230128061113.vmlinuz |
GPL-2.0 |
initramfs |
https://binary.mirantis.com/openstack/bin/ironic/tinyipa/tinyipa-stable-yoga-20230128061113.gz |
GPL-2.0 |
service-image |
https://binary.mirantis.com/openstack/bin/manila/manila-service-image-20221228132450.qcow2 |
Mirantis Proprietary License |
Docker images |
||
keystone |
mirantis.azurecr.io/openstack/keystone:yoga-focal-20230821170130 |
Apache License 2.0 |
heat |
mirantis.azurecr.io/openstack/heat:yoga-focal-20230821170130 |
Apache License 2.0 |
glance |
mirantis.azurecr.io/openstack/glance:yoga-focal-20230821170130 |
Apache License 2.0 |
cinder |
mirantis.azurecr.io/openstack/cinder:yoga-focal-20230821170130 |
Apache License 2.0 |
cloudprober |
mirantis.azurecr.io/openstack/extra/cloudprober:v0.12.7-20230623070627 |
Apache License 2.0 |
neutron |
mirantis.azurecr.io/openstack/neutron:yoga-focal-20230821170130 |
Apache License 2.0 |
nova |
mirantis.azurecr.io/openstack/nova:yoga-focal-20230821170130 |
Apache License 2.0 |
horizon |
mirantis.azurecr.io/openstack/horizon:yoga-focal-20230821170130 |
Apache License 2.0 |
tempest |
mirantis.azurecr.io/openstack/tempest:yoga-focal-20230821170130 |
Apache License 2.0 |
octavia |
mirantis.azurecr.io/openstack/octavia:yoga-focal-20230821170130 |
Apache License 2.0 |
designate |
mirantis.azurecr.io/openstack/designate:yoga-focal-20230821170130 |
Apache License 2.0 |
ironic |
mirantis.azurecr.io/openstack/ironic:yoga-focal-20230821170130 |
Apache License 2.0 |
barbican |
mirantis.azurecr.io/openstack/barbican:yoga-focal-20230821170130 |
Apache License 2.0 |
libvirt |
mirantis.azurecr.io/general/libvirt:6.0.0-focal-20230730124813 |
LGPL-2.1 License |
pause |
mirantis.azurecr.io/general/external/pause:3.1 |
Apache License 2.0 |
openvswitch |
mirantis.azurecr.io/general/openvswitch:2.13-focal-20230730124813 |
Apache License 2.0 |
openvswitch-dpdk |
mirantis.azurecr.io/general/openvswitch-dpdk:2.13-focal-20230730124813 |
Apache License 2.0 |
openstack-tools |
mirantis.azurecr.io/openstack/openstack-tools:yoga-focal-20230821170130 |
Apache License 2.0 |
rabbitmq-3.10.x |
mirantis.azurecr.io/openstack/extra/rabbitmq:3.10.18-focal-20230222154055 |
Mozilla Public License 2.0 |
rabbitmq-3.10.x-management |
mirantis.azurecr.io/openstack/extra/rabbitmq-management:3.10.18-focal-20230222154055 |
Mozilla Public License 2.0 |
kubernetes-entrypoint |
mirantis.azurecr.io/openstack/extra/kubernetes-entrypoint:v1.0.1-5359171-20230810125608 |
Apache License 2.0 |
memcached |
mirantis.azurecr.io/general/memcached:v1.6.20-alpine-20230614113432 |
BSD 3-Clause “New” or “Revised” License |
etcd |
mirantis.azurecr.io/openstack/extra/etcd:v3.5.9-alpine-20230610071256 |
Apache License 2.0 |
powerdns |
mirantis.azurecr.io/openstack/extra/powerdns:4.7-alpine-20230817061604 |
GPL-2.0 License |
nginx-ingress-controller |
mirantis.azurecr.io/openstack/extra/nginx-ingress-controller:1.8.0-alpine-20230617191825 |
Apache License 2.0 |
tls-proxy |
mirantis.azurecr.io/openstack/tls-proxy:focal-fipster-20230725114156 |
Mirantis Proprietary License |
defaultbackend |
mirantis.azurecr.io/openstack/extra/defaultbackend:v1.19.2-77af1ef-20220823043839 |
Apache License 2.0 |
mariadb |
mirantis.azurecr.io/general/mariadb:10.6.14-focal-20230730124341 |
GPLv2, LGPLv2.1 (client libraries) |
rabbitmq-exporter |
mirantis.azurecr.io/stacklight/rabbitmq-exporter:1.0.0-RC19 |
MIT License |
memcached-exporter |
mirantis.azurecr.io/stacklight/memcached-exporter:v0.11.3 |
Apache License 2.0 |
prometheus-mysql-exporter |
mirantis.azurecr.io/stacklight/mysqld-exporter:v0.11.0 |
Apache License 2.0 |
aodh |
mirantis.azurecr.io/openstack/aodh:yoga-focal-20230821170130 |
Apache License 2.0 |
ceilometer |
mirantis.azurecr.io/openstack/ceilometer:yoga-focal-20230821170130 |
Apache License 2.0 |
gnocchi |
mirantis.azurecr.io/openstack/gnocchi:yoga-focal-20230821170130 |
Apache License 2.0 |
redis |
mirantis.azurecr.io/openstack/extra/redis:7.0.11-alpine3.18 |
BSD 3-Clause “New” or “Revised” License |
frr |
mirantis.azurecr.io/general/external/docker.io/frrouting/frr:v8.5.1-20230619084330 |
GPL-2.0 and LGPL-2.1 |
strongswan |
mirantis.azurecr.io/openstack/extra/strongswan:alpine-5.9.8-20230720054838 |
GPL-2.0 |
rsyslog |
mirantis.azurecr.io/openstack/extra/rsyslog:v8.2001.0-20230730124813 |
GNU General Public License v3 |
descheduler |
mirantis.azurecr.io/openstack/extra/descheduler:v0.27.0 |
Apache License 2.0 |
nginx |
mirantis.azurecr.io/openstack/extra/nginx:1.25.1-alpine-slim |
Apache License 2.0 |
requirements |
mirantis.azurecr.io/openstack/requirements:yoga-focal-20230821170130 |
Apache License 2.0 |
stepler |
mirantis.azurecr.io/openstack/stepler:yoga-focal-20230730124813 |
Apache License 2.0 |
placement |
mirantis.azurecr.io/openstack/placement:yoga-focal-20230821170130 |
Apache License 2.0 |
masakari |
mirantis.azurecr.io/openstack/masakari:yoga-focal-20230821170130 |
Apache License 2.0 |
masakari-monitors |
mirantis.azurecr.io/openstack/masakari-monitors:yoga-focal-20230821170130 |
Apache License 2.0 |
ironic-inspector |
mirantis.azurecr.io/openstack/ironic-inspector:yoga-focal-20230821170130 |
Apache License 2.0 |
manila |
mirantis.azurecr.io/openstack/manila:yoga-focal-20230821170130 |
Apache License 2.0 |
MOSK 23.2.1 OpenStack Helm charts
MOSK 23.2.1 Tungsten Fabric 21.4 artifacts
Component |
Path |
License information for main executable programs |
|---|---|---|
Helm charts |
||
Tungsten Fabric Operator |
https://binary.mirantis.com/tungsten/helm/tungstenfabric-operator-0.12.4.tgz |
Mirantis Proprietary License |
Docker images |
||
Tungsten Fabric Operator |
mirantis.azurecr.io/tungsten-operator/tungstenfabric-operator:0.12.4 |
Mirantis Proprietary License |
Analytics Alarm |
mirantis.azurecr.io/tungsten/contrail-analytics-alarm-gen:23.2_R21.4.20230810083758 |
Apache License 2.0 |
Analytics |
mirantis.azurecr.io/tungsten/contrail-analytics-api:23.2_R21.4.20230810083758 |
Apache License 2.0 |
mirantis.azurecr.io/tungsten/contrail-analytics-collector:23.2_R21.4.20230810083758 |
Apache License 2.0 |
|
Analytics DB |
mirantis.azurecr.io/tungsten/contrail-analytics-query-engine:23.2_R21.4.20230810083758 |
Apache License 2.0 |
Analytics SNMP |
mirantis.azurecr.io/tungsten/contrail-analytics-snmp-collector:23.2_R21.4.20230810083758 |
Apache License 2.0 |
mirantis.azurecr.io/tungsten/contrail-analytics-snmp-topology:23.2_R21.4.20230810083758 |
Apache License 2.0 |
|
Config |
mirantis.azurecr.io/tungsten/contrail-controller-config-api:23.2_R21.4.20230810083758 |
Apache License 2.0 |
mirantis.azurecr.io/tungsten/contrail-controller-config-devicemgr:23.2_R21.4.20230810083758 |
Apache License 2.0 |
|
mirantis.azurecr.io/tungsten/contrail-controller-config-dnsmasq:23.2_R21.4.20230810083758 |
Apache License 2.0 |
|
mirantis.azurecr.io/tungsten/contrail-controller-config-schema:23.2_R21.4.20230810083758 |
Apache License 2.0 |
|
mirantis.azurecr.io/tungsten/contrail-controller-config-svcmonitor:23.2_R21.4.20230810083758 |
Apache License 2.0 |
|
Control |
mirantis.azurecr.io/tungsten/contrail-controller-control-control:23.2_R21.4.20230810083758 |
Apache License 2.0 |
mirantis.azurecr.io/tungsten/contrail-controller-control-dns:23.2_R21.4.20230810083758 |
Apache License 2.0 |
|
mirantis.azurecr.io/tungsten/contrail-controller-control-named:23.2_R21.4.20230810083758 |
Apache License 2.0 |
|
Web UI |
mirantis.azurecr.io/tungsten/contrail-controller-webui-job:23.2_R21.4.20230810083758 |
Apache License 2.0 |
mirantis.azurecr.io/tungsten/contrail-controller-webui-web:23.2_R21.4.20230810083758 |
Apache License 2.0 |
|
Nodemanager |
mirantis.azurecr.io/tungsten/contrail-nodemgr:23.2_R21.4.20230810083758 |
Apache License 2.0 |
vRouter |
mirantis.azurecr.io/tungsten/contrail-vrouter-agent:23.2_R21.4.20230810083758 |
Apache License 2.0 |
mirantis.azurecr.io/tungsten/contrail-vrouter-agent-dpdk:23.2_R21.4.20230810083758 |
Apache License 2.0 |
|
mirantis.azurecr.io/tungsten/contrail-node-init:23.2_R21.4.20230810083758 |
Apache License 2.0 |
|
mirantis.azurecr.io/tungsten/contrail-vrouter-kernel-build-init:23.2_R21.4.20230810083758 |
Apache License 2.0 |
|
Cassandra operator |
mirantis.azurecr.io/tungsten-operator/casskop:2.1.17 |
Apache License 2.0 |
Cassandra |
mirantis.azurecr.io/tungsten/cassandra-bootstrap:0.1.12 |
Apache License 2.0 |
mirantis.azurecr.io/tungsten/cassandra:3.11.10-20230622 |
Apache License 2.0 |
|
mirantis.azurecr.io/tungsten/instaclustr-icarus:v2-20230328121138 |
Apache License 2.0 |
|
mirantis.azurecr.io/tungsten/cass-config-builder:v2-20230622161721 |
Apache License 2.0 |
|
Kafka |
mirantis.azurecr.io/tungsten/cp-kafka:7.4.1 |
Apache License 2.0 |
mirantis.azurecr.io/stacklight/jmx-exporter:0.18.0-debian-11-r32 |
Apache License 2.0 |
|
Kafka operator |
mirantis.azurecr.io/tungsten-operator/kafka-k8s-operator:0.3.5 |
Mirantis Proprietary License |
RabbitMQ operator |
mirantis.azurecr.io/tungsten-operator/rabbitmq-operator:0.3.7 |
Mirantis Proprietary License |
RabbitMQ |
mirantis.azurecr.io/tungsten/rabbitmq:3.11.16 |
Mozilla Public License 2.0 |
mirantis.azurecr.io/stacklight/rabbitmq-exporter:1.0.0-RC19 |
MIT License |
|
ZooKeeper operator |
mirantis.azurecr.io/tungsten-operator/zookeeper-operator:0.2.17-mcp |
Apache License 2.0 |
ZooKeeper |
mirantis.azurecr.io/tungsten/zookeeper:3.8.1-20230425 |
Apache License 2.0 |
Redis operator |
mirantis.azurecr.io/tungsten-operator/redis-operator:0.3.8 |
Apache License 2.0 |
Redis |
mirantis.azurecr.io/tungsten/redis:7.0.11-alpine3.18 |
BSD 3-Clause “New” or “Revised” License |
mirantis.azurecr.io/stacklight/redis_exporter:v1.45.0 |
BSD 3-Clause “New” or “Revised” License |
|
TF Provisioner |
mirantis.azurecr.io/tungsten/contrail-provisioner:23.2_R21.4.20230810083758 |
Apache License 2.0 |
TF Test |
mirantis.azurecr.io/tungsten/tungsten-pytest:0.1-20230713172410 |
MIT License |
TF CLI |
mirantis.azurecr.io/tungsten/tf-cli:0.1-20230802163214 |
MIT License |
TF NodeInfo |
mirantis.azurecr.io/tungsten/tf-nodeinfo:0.1-20230328120524 |
MIT License |
TF Tools |
mirantis.azurecr.io/tungsten/contrail-tools:23.2_R21.4.20230810083758 |
Apache License 2.0 |
kubernetes-entrypoint |
mirantis.azurecr.io/openstack/extra/kubernetes-entrypoint:v1.0.1-27d64fb-20230421151539 |
Apache License 2.0 |
pause |
mirantis.azurecr.io/general/external/pause:3.1 |
Apache License 2.0 |
MOSK 23.2.1 StackLight artifacts
Component |
Path |
License information for main executable programs |
|---|---|---|
Docker images |
||
prometheus-libvirt-exporter |
mirantis.azurecr.io/stacklight/prometheus-libvirt-exporter:v0.2-20230811023010 |
Mirantis Proprietary License |
tungstenfabric-prometheus-exporter |
mirantis.azurecr.io/stacklight/tungstenfabric-prometheus-exporter:0.1-20230531104437 |
Mirantis Proprietary License |
Helm charts |
||
prometheus-libvirt-exporter |
https://binary.mirantis.com/stacklight/helm/prometheus-libvirt-exporter-0.2.0-mcp-3.tgz |
Mirantis Proprietary License |
prometheus-tungstenfabric-exporter |
https://binary.mirantis.com/stacklight/helm/prometheus-tungstenfabric-exporter-0.2.0-mcp-3.tgz |
Mirantis Proprietary License |
In total, in the MOSK 23.2.1 release, 43 Common Vulnerabilities and Exposures (CVE) with high severity have been fixed.
The full list of the CVEs present in the current MOSK release is available at the Mirantis Security Portal.
Severity |
Critical |
High |
Total |
|---|---|---|---|
Unique CVEs |
0 |
10 |
10 |
Total issues across images |
0 |
43 |
43 |
Image |
Component name |
CVE |
|---|---|---|
ceph/rook |
python3 |
CVE-2023-24329 (High) |
python3-devel |
CVE-2023-24329 (High) |
|
python3-libs |
CVE-2023-24329 (High) |
|
cryptography |
CVE-2023-38325 (High) |
|
mirantis/ceph |
cryptography |
CVE-2023-2650 (High) |
mirantis/cephcsi |
python3 |
CVE-2023-24329 (High) |
python3-devel |
CVE-2023-24329 (High) |
|
python3-libs |
CVE-2023-24329 (High) |
|
cryptography |
CVE-2023-38325 (High) |
|
openstack/aodh |
cryptography |
CVE-2023-38325 (High) |
openstack/barbican |
cryptography |
CVE-2023-38325 (High) |
openstack/ceilometer |
cryptography |
CVE-2023-38325 (High) |
openstack/cinder |
cryptography |
CVE-2023-38325 (High) |
openstack/designate |
cryptography |
CVE-2023-38325 (High) |
openstack/extra/powerdns |
libpq |
CVE-2023-39417 (High) |
openstack/glance |
cryptography |
CVE-2023-38325 (High) |
openstack/gnocchi |
cryptography |
CVE-2023-38325 (High) |
openstack/heat |
cryptography |
CVE-2023-38325 (High) |
openstack/horizon |
cryptography |
CVE-2023-38325 (High) |
openstack/ironic |
cryptography |
CVE-2023-38325 (High) |
openstack/ironic-inspector |
cryptography |
CVE-2023-38325 (High) |
openstack/keystone |
cryptography |
CVE-2023-38325 (High) |
openstack/manila |
cryptography |
CVE-2023-38325 (High) |
openstack/masakari |
cryptography |
CVE-2023-38325 (High) |
openstack/masakari-monitors |
cryptography |
CVE-2023-38325 (High) |
openstack/neutron |
cryptography |
CVE-2023-38325 (High) |
openstack/nova |
cryptography |
CVE-2023-38325 (High) |
openstack/octavia |
cryptography |
CVE-2023-38325 (High) |
openstack/openstack-tools |
cryptography |
CVE-2023-38325 (High) |
openstack/panko |
cryptography |
CVE-2023-38325 (High) |
openstack/placement |
cryptography |
CVE-2023-38325 (High) |
openstack/tempest |
cryptography |
CVE-2023-38325 (High) |
stacklight/alpine-utils |
nghttp2-libs |
CVE-2023-35945 (High) |
stacklight/cadvisor |
github.com/docker/docker |
CVE-2023-28840 (High) |
github.com/opencontainers/runc |
CVE-2023-28642 (High) |
|
golang.org/x/net |
CVE-2022-41723 (High) |
|
stacklight/grafana |
nghttp2-libs |
CVE-2023-35945 (High) |
stacklight/metricbeat |
bind-license |
CVE-2023-2828 (High) |
stacklight/opensearch |
libnghttp2 |
CVE-2023-35945 (High) |
stacklight/opensearch-dashboards |
libnghttp2 |
CVE-2023-35945 (High) |
stacklight/prometheus-libvirt-exporter |
nghttp2-libs |
CVE-2023-35945 (High) |
stacklight/stacklight-toolkit |
nghttp2-libs |
CVE-2023-35945 (High) |
stacklight/telegraf |
github.com/snowflakedb/gosnowflake |
CVE-2023-34231 (High) |
The following issues have been addressed in the MOSK 23.2.1 release:
[TF] [30738] Fixed the issue that caused the
tf-vrouter-agentreadiness probe failure (No Configuration for self).
This section lists the cluster update known issues with workarounds for the Mirantis OpenStack for Kubernetes release 23.2.1.
During MOSK update to either 23.2 major release or
any patch release of the 23.2 release series, the
openstack-operator-ensure-resources job may get stuck in
the CrashLoopBackOff state with the following error:
Traceback (most recent call last):
File "/usr/local/bin/osctl-ensure-shared-resources", line 8, in <module>
sys.exit(main())
File "/usr/local/lib/python3.8/dist-packages/openstack_controller/cli/ensure_shared_resources.py", line 61, in main
obj.update()
File "/usr/local/lib/python3.8/dist-packages/pykube/objects.py", line 165, in update
self.patch(self.obj, subresource=subresource)
File "/usr/local/lib/python3.8/dist-packages/pykube/objects.py", line 157, in patch
self.api.raise_for_status(r)
File "/usr/local/lib/python3.8/dist-packages/pykube/http.py", line 444, in raise_for_status
raise HTTPError(resp.status_code, payload["message"])
pykube.exceptions.HTTPError: CustomResourceDefinition.apiextensions.k8s.io "redisfailovers.databases.spotahome.com" is invalid: spec.preserveUnknownFields: Invalid value: true: must be false in order to use defaults in the schema
As a workaround, delete the redisfailovers.databases.spotahome.com
CRD from your cluster:
kubectl delete crd redisfailovers.databases.spotahome.com
While updating your cluster, the Instance High Availability service (OpenStack Masakari) may not work as expected.
As a workaround, temporarily disable the service by removing
instance-ha from the service list in the OpenStackDeployment
custom resource.
Learn more about the release cadence
23.2.2 patch
The patch release notes contain the list of artifacts and Common Vulnerabilities and Exposures (CVE) fixes for the MOSK 23.2.2 patch released on September 14, 2023.
For the list of enhancements and bug fixes that relate to Mirantis Container Cloud, refer to the Mirantis Container Cloud Release notes.
Release date |
September 14, 2023 |
|---|---|
Scope |
Patch |
Cluster release |
15.0.3 |
OpenStack Operator |
0.13.11 |
Tungsten Fabric Operator |
0.12.5 |
The following issues have been addressed in the MOSK 23.2.2 release:
[34342] Resolved the issue that caused a failure of the etcd pods due to the simultaneous deployment of several pods on a single node. To ensure that etcd pods are always placed on different nodes, MOSK now deploys etcd with the
requiredDuringSchedulingIgnoredDuringExecutionpolicy.[34276] Resolved the issue that caused the presence of stale namespaces if the agent responsible for hosting the network was modified while the agent was offline.
This section lists the components artifacts of the MOSK 23.2.2 release that includes binaries, Docker images, and Helm charts.
MOSK 23.2.2 OpenStack Victoria binaries and Docker images
Component |
Path |
License information for main executable programs |
|---|---|---|
Binaries |
||
octavia-amphora |
https://binary.mirantis.com/openstack/bin/octavia/amphora-x64-haproxy-victoria-20230706155916.qcow2 |
Mirantis Proprietary License |
mirantis |
https://binary.mirantis.com/openstack/bin/horizon/mirantis-victoria-8f71802-20210119120707.tar.gz |
Mirantis Proprietary License |
kernel |
GPL-2.0 |
|
initramfs |
https://binary.mirantis.com/openstack/bin/ironic/tinyipa/tinyipa-stable-victoria-20230128063511.gz |
GPL-2.0 |
service-image |
https://binary.mirantis.com/openstack/bin/manila/manila-service-image-20221228132450.qcow2 |
Mirantis Proprietary License |
Docker images |
||
keystone |
mirantis.azurecr.io/openstack/keystone:victoria-focal-20230830092445 |
Apache License 2.0 |
heat |
mirantis.azurecr.io/openstack/heat:victoria-focal-20230830092445 |
Apache License 2.0 |
glance |
mirantis.azurecr.io/openstack/glance:victoria-focal-20230830092445 |
Apache License 2.0 |
cinder |
mirantis.azurecr.io/openstack/cinder:victoria-focal-20230830092445 |
Apache License 2.0 |
cloudprober |
mirantis.azurecr.io/openstack/extra/cloudprober:v0.12.7-20230623070627 |
Apache License 2.0 |
neutron |
mirantis.azurecr.io/openstack/neutron:victoria-focal-20230830092445 |
Apache License 2.0 |
nova |
mirantis.azurecr.io/openstack/nova:victoria-focal-20230830092445 |
Apache License 2.0 |
horizon |
mirantis.azurecr.io/openstack/horizon:victoria-focal-20230830092445 |
Apache License 2.0 |
tempest |
mirantis.azurecr.io/openstack/tempest:victoria-focal-20230830092445 |
Apache License 2.0 |
octavia |
mirantis.azurecr.io/openstack/octavia:victoria-focal-20230830092445 |
Apache License 2.0 |
designate |
mirantis.azurecr.io/openstack/designate:victoria-focal-20230830092445 |
Apache License 2.0 |
ironic |
mirantis.azurecr.io/openstack/ironic:victoria-focal-20230830092445 |
Apache License 2.0 |
barbican |
mirantis.azurecr.io/openstack/barbican:victoria-focal-20230830092445 |
Apache License 2.0 |
libvirt |
mirantis.azurecr.io/general/libvirt:6.0.0-focal-20230730124813 |
LGPL-2.1 License |
pause |
mirantis.azurecr.io/general/external/pause:3.1 |
Apache License 2.0 |
openvswitch |
mirantis.azurecr.io/general/openvswitch:2.13-focal-20230830072226 |
Apache License 2.0 |
openvswitch-dpdk |
mirantis.azurecr.io/general/openvswitch-dpdk:2.13-focal-20230830072225 |
Apache License 2.0 |
openstack-tools |
mirantis.azurecr.io/openstack/openstack-tools:yoga-focal-20230830092445 |
Apache License 2.0 |
rabbitmq-3.10.x |
mirantis.azurecr.io/openstack/extra/rabbitmq:3.10.18-focal-20230222154055 |
Mozilla Public License 2.0 |
rabbitmq-3.10.x-management |
mirantis.azurecr.io/openstack/extra/rabbitmq-management:3.10.18-focal-20230222154055 |
Mozilla Public License 2.0 |
kubernetes-entrypoint |
mirantis.azurecr.io/openstack/extra/kubernetes-entrypoint:v1.0.1-5359171-20230810125608 |
Apache License 2.0 |
memcached |
mirantis.azurecr.io/general/memcached:v1.6.20-alpine-20230614113432 |
BSD 3-Clause “New” or “Revised” License |
etcd |
mirantis.azurecr.io/openstack/extra/etcd:v3.5.9-alpine-20230610071256 |
Apache License 2.0 |
powerdns |
mirantis.azurecr.io/openstack/extra/powerdns:4.7-alpine-20230817061604 |
GPL-2.0 License |
nginx-ingress-controller |
mirantis.azurecr.io/openstack/extra/nginx-ingress-controller:1.8.0-alpine-20230617191825 |
Apache License 2.0 |
tls-proxy |
mirantis.azurecr.io/openstack/tls-proxy:focal-fipster-20230725114156 |
Mirantis Proprietary License |
defaultbackend |
mirantis.azurecr.io/openstack/extra/defaultbackend:v1.19.2-77af1ef-20220823043839 |
Apache License 2.0 |
mariadb |
mirantis.azurecr.io/general/mariadb:10.6.14-focal-20230730124341 |
GPLv2, LGPLv2.1 (client libraries) |
rabbitmq-exporter |
mirantis.azurecr.io/stacklight/rabbitmq-exporter:1.0.0-RC19 |
MIT License |
memcached-exporter |
mirantis.azurecr.io/stacklight/memcached-exporter:v0.11.3 |
Apache License 2.0 |
prometheus-mysql-exporter |
mirantis.azurecr.io/stacklight/mysqld-exporter:v0.11.0 |
Apache License 2.0 |
aodh |
mirantis.azurecr.io/openstack/aodh:victoria-focal-20230830092445 |
Apache License 2.0 |
ceilometer |
mirantis.azurecr.io/openstack/ceilometer:victoria-focal-20230830092445 |
Apache License 2.0 |
gnocchi |
mirantis.azurecr.io/openstack/gnocchi:victoria-focal-20230830092445 |
Apache License 2.0 |
redis |
mirantis.azurecr.io/openstack/extra/redis:7.0.11-alpine3.18 |
BSD 3-Clause “New” or “Revised” License |
frr |
mirantis.azurecr.io/general/external/docker.io/frrouting/frr:v8.5.1-20230619084330 |
GPL-2.0 and LGPL-2.1 |
strongswan |
mirantis.azurecr.io/openstack/extra/strongswan:alpine-5.9.8-20230720054838 |
GPL-2.0 |
rsyslog |
mirantis.azurecr.io/openstack/extra/rsyslog:v8.2001.0-20230730124813 |
GNU General Public License v3 |
descheduler |
mirantis.azurecr.io/openstack/extra/descheduler:v0.27.0 |
Apache License 2.0 |
nginx |
mirantis.azurecr.io/openstack/extra/nginx:1.25.1-alpine-slim |
Apache License 2.0 |
requirements |
mirantis.azurecr.io/openstack/requirements:victoria-focal-20230830092445 |
Apache License 2.0 |
placement |
mirantis.azurecr.io/openstack/placement:victoria-focal-20230830092445 |
Apache License 2.0 |
stepler |
mirantis.azurecr.io/openstack/stepler:victoria-focal-20230830072225 |
Apache License 2.0 |
masakari |
mirantis.azurecr.io/openstack/masakari:victoria-focal-20230830092445 |
Apache License 2.0 |
masakari-monitors |
mirantis.azurecr.io/openstack/masakari-monitors:victoria-focal-20230830092445 |
Apache License 2.0 |
ironic-inspector |
mirantis.azurecr.io/openstack/ironic-inspector:victoria-focal-20230830092445 |
Apache License 2.0 |
panko |
mirantis.azurecr.io/openstack/panko:victoria-focal-20230830092445 |
Apache License 2.0 |
MOSK 23.2.2 OpenStack Yoga binaries and Docker images
Component |
Path |
License information for main executable programs |
|---|---|---|
Binaries |
||
octavia-amphora |
https://binary.mirantis.com/openstack/bin/octavia/amphora-x64-haproxy-yoga-20230718165730.qcow2 |
Mirantis Proprietary License |
mirantis |
https://binary.mirantis.com/openstack/bin/horizon/mirantis-xena-9f691e3-20220110111511.tar.gz |
Mirantis Proprietary License |
kernel |
https://binary.mirantis.com/openstack/bin/ironic/tinyipa/tinyipa-stable-yoga-20230128061113.vmlinuz |
GPL-2.0 |
initramfs |
https://binary.mirantis.com/openstack/bin/ironic/tinyipa/tinyipa-stable-yoga-20230128061113.gz |
GPL-2.0 |
service-image |
https://binary.mirantis.com/openstack/bin/manila/manila-service-image-20221228132450.qcow2 |
Mirantis Proprietary License |
Docker images |
||
keystone |
mirantis.azurecr.io/openstack/keystone:yoga-focal-20230830092445 |
Apache License 2.0 |
heat |
mirantis.azurecr.io/openstack/heat:yoga-focal-20230830092445 |
Apache License 2.0 |
glance |
mirantis.azurecr.io/openstack/glance:yoga-focal-20230830092445 |
Apache License 2.0 |
cinder |
mirantis.azurecr.io/openstack/cinder:yoga-focal-20230830092445 |
Apache License 2.0 |
cloudprober |
mirantis.azurecr.io/openstack/extra/cloudprober:v0.12.7-20230623070627 |
Apache License 2.0 |
neutron |
mirantis.azurecr.io/openstack/neutron:yoga-focal-20230830092445 |
Apache License 2.0 |
nova |
mirantis.azurecr.io/openstack/nova:yoga-focal-20230830092445 |
Apache License 2.0 |
horizon |
mirantis.azurecr.io/openstack/horizon:yoga-focal-20230830092445 |
Apache License 2.0 |
tempest |
mirantis.azurecr.io/openstack/tempest:yoga-focal-20230830092445 |
Apache License 2.0 |
octavia |
mirantis.azurecr.io/openstack/octavia:yoga-focal-20230830092445 |
Apache License 2.0 |
designate |
mirantis.azurecr.io/openstack/designate:yoga-focal-20230830092445 |
Apache License 2.0 |
ironic |
mirantis.azurecr.io/openstack/ironic:yoga-focal-20230830092445 |
Apache License 2.0 |
barbican |
mirantis.azurecr.io/openstack/barbican:yoga-focal-20230830092445 |
Apache License 2.0 |
libvirt |
mirantis.azurecr.io/general/libvirt:6.0.0-focal-20230730124813 |
LGPL-2.1 License |
pause |
mirantis.azurecr.io/general/external/pause:3.1 |
Apache License 2.0 |
openvswitch |
mirantis.azurecr.io/general/openvswitch:2.13-focal-20230830072226 |
Apache License 2.0 |
openvswitch-dpdk |
mirantis.azurecr.io/general/openvswitch-dpdk:2.13-focal-20230830072225 |
Apache License 2.0 |
openstack-tools |
mirantis.azurecr.io/openstack/openstack-tools:yoga-focal-20230830092445 |
Apache License 2.0 |
rabbitmq-3.10.x |
mirantis.azurecr.io/openstack/extra/rabbitmq:3.10.18-focal-20230222154055 |
Mozilla Public License 2.0 |
rabbitmq-3.10.x-management |
mirantis.azurecr.io/openstack/extra/rabbitmq-management:3.10.18-focal-20230222154055 |
Mozilla Public License 2.0 |
kubernetes-entrypoint |
mirantis.azurecr.io/openstack/extra/kubernetes-entrypoint:v1.0.1-5359171-20230810125608 |
Apache License 2.0 |
memcached |
mirantis.azurecr.io/general/memcached:v1.6.20-alpine-20230614113432 |
BSD 3-Clause “New” or “Revised” License |
etcd |
mirantis.azurecr.io/openstack/extra/etcd:v3.5.9-alpine-20230610071256 |
Apache License 2.0 |
powerdns |
mirantis.azurecr.io/openstack/extra/powerdns:4.7-alpine-20230817061604 |
GPL-2.0 License |
nginx-ingress-controller |
mirantis.azurecr.io/openstack/extra/nginx-ingress-controller:1.8.0-alpine-20230617191825 |
Apache License 2.0 |
tls-proxy |
mirantis.azurecr.io/openstack/tls-proxy:focal-fipster-20230725114156 |
Mirantis Proprietary License |
defaultbackend |
mirantis.azurecr.io/openstack/extra/defaultbackend:v1.19.2-77af1ef-20220823043839 |
Apache License 2.0 |
mariadb |
mirantis.azurecr.io/general/mariadb:10.6.14-focal-20230730124341 |
GPLv2, LGPLv2.1 (client libraries) |
rabbitmq-exporter |
mirantis.azurecr.io/stacklight/rabbitmq-exporter:1.0.0-RC19 |
MIT License |
memcached-exporter |
mirantis.azurecr.io/stacklight/memcached-exporter:v0.11.3 |
Apache License 2.0 |
prometheus-mysql-exporter |
mirantis.azurecr.io/stacklight/mysqld-exporter:v0.11.0 |
Apache License 2.0 |
aodh |
mirantis.azurecr.io/openstack/aodh:yoga-focal-20230830092445 |
Apache License 2.0 |
ceilometer |
mirantis.azurecr.io/openstack/ceilometer:yoga-focal-20230830092445 |
Apache License 2.0 |
gnocchi |
mirantis.azurecr.io/openstack/gnocchi:yoga-focal-20230830092445 |
Apache License 2.0 |
redis |
mirantis.azurecr.io/openstack/extra/redis:7.0.11-alpine3.18 |
BSD 3-Clause “New” or “Revised” License |
frr |
mirantis.azurecr.io/general/external/docker.io/frrouting/frr:v8.5.1-20230619084330 |
GPL-2.0 and LGPL-2.1 |
strongswan |
mirantis.azurecr.io/openstack/extra/strongswan:alpine-5.9.8-20230720054838 |
GPL-2.0 |
rsyslog |
mirantis.azurecr.io/openstack/extra/rsyslog:v8.2001.0-20230730124813 |
GNU General Public License v3 |
descheduler |
mirantis.azurecr.io/openstack/extra/descheduler:v0.27.0 |
Apache License 2.0 |
nginx |
mirantis.azurecr.io/openstack/extra/nginx:1.25.1-alpine-slim |
Apache License 2.0 |
requirements |
mirantis.azurecr.io/openstack/requirements:yoga-focal-20230830092445 |
Apache License 2.0 |
stepler |
mirantis.azurecr.io/openstack/stepler:yoga-focal-20230830072225 |
Apache License 2.0 |
placement |
mirantis.azurecr.io/openstack/placement:yoga-focal-20230830092445 |
Apache License 2.0 |
masakari |
mirantis.azurecr.io/openstack/masakari:yoga-focal-20230830092445 |
Apache License 2.0 |
masakari-monitors |
mirantis.azurecr.io/openstack/masakari-monitors:yoga-focal-20230830092445 |
Apache License 2.0 |
ironic-inspector |
mirantis.azurecr.io/openstack/ironic-inspector:yoga-focal-20230830092445 |
Apache License 2.0 |
manila |
mirantis.azurecr.io/openstack/manila:yoga-focal-20230830092445 |
Apache License 2.0 |
MOSK 23.2.2 OpenStack Helm charts
MOSK 23.2.2 Tungsten Fabric 21.4 artifacts
Component |
Path |
License information for main executable programs |
|---|---|---|
Helm charts |
||
Tungsten Fabric Operator |
https://binary.mirantis.com/tungsten/helm/tungstenfabric-operator-0.12.5.tgz |
Mirantis Proprietary License |
Docker images |
||
Tungsten Fabric Operator |
mirantis.azurecr.io/tungsten-operator/tungstenfabric-operator:0.12.5 |
Mirantis Proprietary License |
Analytics Alarm |
mirantis.azurecr.io/tungsten/contrail-analytics-alarm-gen:23.2_R21.4.20230810083758 |
Apache License 2.0 |
Analytics |
mirantis.azurecr.io/tungsten/contrail-analytics-api:23.2_R21.4.20230810083758 |
Apache License 2.0 |
mirantis.azurecr.io/tungsten/contrail-analytics-collector:23.2_R21.4.20230810083758 |
Apache License 2.0 |
|
Analytics DB |
mirantis.azurecr.io/tungsten/contrail-analytics-query-engine:23.2_R21.4.20230810083758 |
Apache License 2.0 |
Analytics SNMP |
mirantis.azurecr.io/tungsten/contrail-analytics-snmp-collector:23.2_R21.4.20230810083758 |
Apache License 2.0 |
mirantis.azurecr.io/tungsten/contrail-analytics-snmp-topology:23.2_R21.4.20230810083758 |
Apache License 2.0 |
|
Config |
mirantis.azurecr.io/tungsten/contrail-controller-config-api:23.2_R21.4.20230810083758 |
Apache License 2.0 |
mirantis.azurecr.io/tungsten/contrail-controller-config-devicemgr:23.2_R21.4.20230810083758 |
Apache License 2.0 |
|
mirantis.azurecr.io/tungsten/contrail-controller-config-dnsmasq:23.2_R21.4.20230810083758 |
Apache License 2.0 |
|
mirantis.azurecr.io/tungsten/contrail-controller-config-schema:23.2_R21.4.20230810083758 |
Apache License 2.0 |
|
mirantis.azurecr.io/tungsten/contrail-controller-config-svcmonitor:23.2_R21.4.20230810083758 |
Apache License 2.0 |
|
Control |
mirantis.azurecr.io/tungsten/contrail-controller-control-control:23.2_R21.4.20230810083758 |
Apache License 2.0 |
mirantis.azurecr.io/tungsten/contrail-controller-control-dns:23.2_R21.4.20230810083758 |
Apache License 2.0 |
|
mirantis.azurecr.io/tungsten/contrail-controller-control-named:23.2_R21.4.20230810083758 |
Apache License 2.0 |
|
Web UI |
mirantis.azurecr.io/tungsten/contrail-controller-webui-job:23.2_R21.4.20230810083758 |
Apache License 2.0 |
mirantis.azurecr.io/tungsten/contrail-controller-webui-web:23.2_R21.4.20230810083758 |
Apache License 2.0 |
|
Nodemanager |
mirantis.azurecr.io/tungsten/contrail-nodemgr:23.2_R21.4.20230810083758 |
Apache License 2.0 |
vRouter |
mirantis.azurecr.io/tungsten/contrail-vrouter-agent:23.2_R21.4.20230810083758 |
Apache License 2.0 |
mirantis.azurecr.io/tungsten/contrail-vrouter-agent-dpdk:23.2_R21.4.20230810083758 |
Apache License 2.0 |
|
mirantis.azurecr.io/tungsten/contrail-node-init:23.2_R21.4.20230810083758 |
Apache License 2.0 |
|
mirantis.azurecr.io/tungsten/contrail-vrouter-kernel-build-init:23.2_R21.4.20230810083758 |
Apache License 2.0 |
|
Cassandra operator |
mirantis.azurecr.io/tungsten-operator/casskop:2.1.17 |
Apache License 2.0 |
Cassandra |
mirantis.azurecr.io/tungsten/cassandra-bootstrap:0.1.12 |
Apache License 2.0 |
mirantis.azurecr.io/tungsten/cassandra:3.11.10-20230622 |
Apache License 2.0 |
|
mirantis.azurecr.io/tungsten/instaclustr-icarus:v2-20230328121138 |
Apache License 2.0 |
|
mirantis.azurecr.io/tungsten/cass-config-builder:v2-20230830113546 |
Apache License 2.0 |
|
Kafka |
mirantis.azurecr.io/tungsten/cp-kafka:7.4.1 |
Apache License 2.0 |
mirantis.azurecr.io/stacklight/jmx-exporter:0.18.0-debian-11-r32 |
Apache License 2.0 |
|
Kafka operator |
mirantis.azurecr.io/tungsten-operator/kafka-k8s-operator:0.3.5 |
Mirantis Proprietary License |
RabbitMQ operator |
mirantis.azurecr.io/tungsten-operator/rabbitmq-operator:0.3.7 |
Mirantis Proprietary License |
RabbitMQ |
mirantis.azurecr.io/tungsten/rabbitmq:3.11.16 |
Mozilla Public License 2.0 |
mirantis.azurecr.io/stacklight/rabbitmq-exporter:1.0.0-RC19 |
MIT License |
|
ZooKeeper operator |
mirantis.azurecr.io/tungsten-operator/zookeeper-operator:0.2.17-mcp |
Apache License 2.0 |
ZooKeeper |
mirantis.azurecr.io/tungsten/zookeeper:3.8.1-20230425 |
Apache License 2.0 |
Redis operator |
mirantis.azurecr.io/tungsten-operator/redis-operator:0.3.8 |
Apache License 2.0 |
Redis |
mirantis.azurecr.io/tungsten/redis:7.0.11-alpine3.18 |
BSD 3-Clause “New” or “Revised” License |
mirantis.azurecr.io/stacklight/redis_exporter:v1.45.0 |
BSD 3-Clause “New” or “Revised” License |
|
TF Provisioner |
mirantis.azurecr.io/tungsten/contrail-provisioner:23.2_R21.4.20230810083758 |
Apache License 2.0 |
TF Test |
mirantis.azurecr.io/tungsten/tungsten-pytest:0.1-20230713172410 |
MIT License |
TF CLI |
mirantis.azurecr.io/tungsten/tf-cli:0.1-20230828085831 |
MIT License |
TF NodeInfo |
mirantis.azurecr.io/tungsten/tf-nodeinfo:0.1-20230328120524 |
MIT License |
TF Tools |
mirantis.azurecr.io/tungsten/contrail-tools:23.2_R21.4.20230810083758 |
Apache License 2.0 |
kubernetes-entrypoint |
mirantis.azurecr.io/openstack/extra/kubernetes-entrypoint:v1.0.1-27d64fb-20230421151539 |
Apache License 2.0 |
pause |
mirantis.azurecr.io/general/external/pause:3.1 |
Apache License 2.0 |
MOSK 23.2.2 StackLight artifacts
Component |
Path |
License information for main executable programs |
|---|---|---|
Docker images |
||
prometheus-libvirt-exporter |
mirantis.azurecr.io/stacklight/prometheus-libvirt-exporter:v0.2-20230825023009 |
Mirantis Proprietary License |
tungstenfabric-prometheus-exporter |
mirantis.azurecr.io/stacklight/tungstenfabric-prometheus-exporter:0.1-20230531104437 |
Mirantis Proprietary License |
Helm charts |
||
prometheus-libvirt-exporter |
https://binary.mirantis.com/stacklight/helm/prometheus-libvirt-exporter-0.2.0-mcp-3.tgz |
Mirantis Proprietary License |
prometheus-tungstenfabric-exporter |
https://binary.mirantis.com/stacklight/helm/prometheus-tungstenfabric-exporter-0.2.0-mcp-3.tgz |
Mirantis Proprietary License |
In total, in the MOSK 23.2.2 release, 72 Common Vulnerabilities and Exposures (CVE) have been fixed: 8 of critical and 64 of high severity.
The full list of the CVEs present in the current MOSK release is available at the Mirantis Security Portal.
Severity |
Critical |
High |
Total |
|---|---|---|---|
Unique CVEs |
2 |
19 |
21 |
Total issues across images |
8 |
64 |
72 |
Image |
Component name |
CVE |
|---|---|---|
general/openvswitch |
linux-libc-dev |
CVE-2023-20593 (High) |
CVE-2023-3609 (High) |
||
CVE-2023-3611 (High) |
||
CVE-2023-3776 (High) |
||
general/openvswitch-dpdk |
linux-libc-dev |
CVE-2023-20593 (High) |
CVE-2023-3609 (High) |
||
CVE-2023-3611 (High) |
||
CVE-2023-3776 (High) |
||
iam/keycloak-gatekeeper |
golang.org/x/crypto |
CVE-2021-43565 (High) |
CVE-2020-29652 (High) |
||
CVE-2022-27191 (High) |
||
golang.org/x/net |
CVE-2021-33194 (High) |
|
CVE-2022-27664 (High) |
||
golang.org/x/text |
CVE-2021-38561 (High) |
|
CVE-2022-32149 (High) |
||
github.com/prometheus/client_golang |
CVE-2022-21698 (High) |
|
openstack/aodh |
grpcio |
CVE-2023-33953 (High) |
CVE-2023-33953 (High) |
||
openstack/barbican |
linux-libc-dev |
CVE-2023-20593 (High) |
CVE-2023-3609 (High) |
||
CVE-2023-3611 (High) |
||
CVE-2023-3776 (High) |
||
CVE-2023-20593 (High) |
||
CVE-2023-3609 (High) |
||
CVE-2023-3611 (High) |
||
CVE-2023-3776 (High) |
||
openstack/ceilometer |
grpcio |
CVE-2023-33953 (High) |
CVE-2023-33953 (High) |
||
openstack/designate |
Werkzeug |
CVE-2022-29361 (Critical) |
CVE-2023-25577 (High) |
||
Flask |
CVE-2023-30861 (High) |
|
openstack/gnocchi |
Werkzeug |
CVE-2022-29361 (Critical) |
CVE-2023-25577 (High) |
||
grpcio |
CVE-2023-33953 (High) |
|
CVE-2023-33953 (High) |
||
openstack/ironic-inspector |
Werkzeug |
CVE-2022-29361 (Critical) |
CVE-2023-25577 (High) |
||
Flask |
CVE-2023-30861 (High) |
|
openstack/keystone |
Werkzeug |
CVE-2022-29361 (Critical) |
CVE-2023-25577 (High) |
||
Flask |
CVE-2023-30861 (High) |
|
openstack/octavia |
Werkzeug |
CVE-2022-29361 (Critical) |
CVE-2023-25577 (High) |
||
Flask |
CVE-2023-30861 (High) |
|
openstack/panko |
grpcio |
CVE-2023-33953 (High) |
openstack/stepler |
linux-libc-dev |
CVE-2023-20593 (High) |
CVE-2023-3609 (High) |
||
CVE-2023-3611 (High) |
||
CVE-2023-3776 (High) |
||
CVE-2023-20593 (High) |
||
CVE-2023-3609 (High) |
||
CVE-2023-3611 (High) |
||
CVE-2023-3776 (High) |
||
cryptography |
CVE-2023-38325 (High) |
|
CVE-2023-38325 (High) |
||
scale/psql-client |
busybox |
CVE-2022-48174 (Critical) |
busybox-binsh |
CVE-2022-48174 (Critical) |
|
ssl_client |
CVE-2022-48174 (Critical) |
|
libpq |
CVE-2023-39417 (High) |
|
postgresql13-client |
CVE-2023-39417 (High) |
|
stacklight/alerta-web |
grpcio |
CVE-2023-33953 (High) |
libpq |
CVE-2023-39417 (High) |
|
postgresql15-client |
CVE-2023-39417 (High) |
|
stacklight/pgbouncer |
libpq |
CVE-2023-39417 (High) |
postgresql-client |
CVE-2023-39417 (High) |
|
tungsten/cass-config-builder |
cups-libs |
CVE-2023-32360 (High) |
tungsten/tf-cli |
dnf-plugin-subscription-manager |
CVE-2023-3899 (High) |
python3-cloud-what |
CVE-2023-3899 (High) |
|
python3-subscription-manager-rhsm |
CVE-2023-3899 (High) |
|
python3-syspurpose |
CVE-2023-3899 (High) |
|
subscription-manager |
CVE-2023-3899 (High) |
|
subscription-manager-rhsm-certificates |
CVE-2023-3899 (High) |
This section lists the cluster update known issues with workarounds for the Mirantis OpenStack for Kubernetes release 23.2.2.
During the update, you may encounter the issue that causes a failure of the etcd pods due to the simultaneous deployment of several pods on a single node.
The workaround is to remove the PVC for one etcd pod.
During MOSK update to either 23.2 major release or
any patch release of the 23.2 release series, the
openstack-operator-ensure-resources job may get stuck in
the CrashLoopBackOff state with the following error:
Traceback (most recent call last):
File "/usr/local/bin/osctl-ensure-shared-resources", line 8, in <module>
sys.exit(main())
File "/usr/local/lib/python3.8/dist-packages/openstack_controller/cli/ensure_shared_resources.py", line 61, in main
obj.update()
File "/usr/local/lib/python3.8/dist-packages/pykube/objects.py", line 165, in update
self.patch(self.obj, subresource=subresource)
File "/usr/local/lib/python3.8/dist-packages/pykube/objects.py", line 157, in patch
self.api.raise_for_status(r)
File "/usr/local/lib/python3.8/dist-packages/pykube/http.py", line 444, in raise_for_status
raise HTTPError(resp.status_code, payload["message"])
pykube.exceptions.HTTPError: CustomResourceDefinition.apiextensions.k8s.io "redisfailovers.databases.spotahome.com" is invalid: spec.preserveUnknownFields: Invalid value: true: must be false in order to use defaults in the schema
As a workaround, delete the redisfailovers.databases.spotahome.com
CRD from your cluster:
kubectl delete crd redisfailovers.databases.spotahome.com
While updating your cluster, the Instance High Availability service (OpenStack Masakari) may not work as expected.
As a workaround, temporarily disable the service by removing
instance-ha from the service list in the OpenStackDeployment
custom resource.
Learn more about the release cadence
23.2.3 patch
The patch release notes contain the list of artifacts and Common Vulnerabilities and Exposures (CVE) fixes as well as description of the fixed product issues for the MOSK 23.2.3 patch released on September 26, 2023.
For the list of enhancements and bug fixes that relate to Mirantis Container Cloud, refer to the Mirantis Container Cloud Release notes.
Release date |
September 26, 2023 |
|---|---|
Scope |
Patch |
Cluster release |
15.0.4 |
OpenStack Operator |
0.13.12 |
Tungsten Fabric Operator |
0.12.6 |
The following issues have been addressed in the MOSK 23.2.3 release:
[31155] Resolved the issue that caused the OpenStack Redis operator CPU throttling in StackLight.
[34978] Resolved the issue that caused the Tungsten Fabric Redis operator to crash due to the upcoming MKE version update.
This section lists the components artifacts of the MOSK 23.2.3 release that includes binaries, Docker images, and Helm charts.
MOSK 23.2.3 OpenStack Victoria binaries and Docker images
Component |
Path |
License information for main executable programs |
|---|---|---|
Binaries |
||
octavia-amphora |
https://binary.mirantis.com/openstack/bin/octavia/amphora-x64-haproxy-victoria-20230706155916.qcow2 |
Mirantis Proprietary License |
mirantis |
https://binary.mirantis.com/openstack/bin/horizon/mirantis-victoria-8f71802-20210119120707.tar.gz |
Mirantis Proprietary License |
kernel |
GPL-2.0 |
|
initramfs |
https://binary.mirantis.com/openstack/bin/ironic/tinyipa/tinyipa-stable-victoria-20230128063511.gz |
GPL-2.0 |
service-image |
https://binary.mirantis.com/openstack/bin/manila/manila-service-image-20221228132450.qcow2 |
Mirantis Proprietary License |
Docker images |
||
keystone |
mirantis.azurecr.io/openstack/keystone:victoria-focal-20230912131036 |
Apache License 2.0 |
heat |
mirantis.azurecr.io/openstack/heat:victoria-focal-20230912131036 |
Apache License 2.0 |
glance |
mirantis.azurecr.io/openstack/glance:victoria-focal-20230912131036 |
Apache License 2.0 |
cinder |
mirantis.azurecr.io/openstack/cinder:victoria-focal-20230912131036 |
Apache License 2.0 |
cloudprober |
mirantis.azurecr.io/openstack/extra/cloudprober:v0.12.9 |
Apache License 2.0 |
neutron |
mirantis.azurecr.io/openstack/neutron:victoria-focal-20230912131036 |
Apache License 2.0 |
nova |
mirantis.azurecr.io/openstack/nova:victoria-focal-20230912131036 |
Apache License 2.0 |
horizon |
mirantis.azurecr.io/openstack/horizon:victoria-focal-20230912131036 |
Apache License 2.0 |
tempest |
mirantis.azurecr.io/openstack/tempest:victoria-focal-20230912131036 |
Apache License 2.0 |
octavia |
mirantis.azurecr.io/openstack/octavia:victoria-focal-20230912131036 |
Apache License 2.0 |
designate |
mirantis.azurecr.io/openstack/designate:victoria-focal-20230912131036 |
Apache License 2.0 |
ironic |
mirantis.azurecr.io/openstack/ironic:victoria-focal-20230912131036 |
Apache License 2.0 |
barbican |
mirantis.azurecr.io/openstack/barbican:victoria-focal-20230912131036 |
Apache License 2.0 |
libvirt |
mirantis.azurecr.io/general/libvirt:6.0.0-focal-20230730124813 |
LGPL-2.1 License |
pause |
mirantis.azurecr.io/general/external/pause:3.1 |
Apache License 2.0 |
openvswitch |
mirantis.azurecr.io/general/openvswitch:2.13-focal-20230912122504 |
Apache License 2.0 |
openvswitch-dpdk |
mirantis.azurecr.io/general/openvswitch-dpdk:2.13-focal-20230912122503 |
Apache License 2.0 |
openstack-tools |
mirantis.azurecr.io/openstack/openstack-tools:yoga-focal-20230913143832 |
Apache License 2.0 |
rabbitmq-3.10.x |
mirantis.azurecr.io/openstack/extra/rabbitmq:3.10.18-focal-20230222154055 |
Mozilla Public License 2.0 |
rabbitmq-3.10.x-management |
mirantis.azurecr.io/openstack/extra/rabbitmq-management:3.10.18-focal-20230222154055 |
Mozilla Public License 2.0 |
kubernetes-entrypoint |
mirantis.azurecr.io/openstack/extra/kubernetes-entrypoint:v1.0.1-5359171-20230810125608 |
Apache License 2.0 |
memcached |
mirantis.azurecr.io/general/memcached:v1.6.21-alpine-20230913050002 |
BSD 3-Clause “New” or “Revised” License |
etcd |
mirantis.azurecr.io/openstack/extra/etcd:v3.5.9-alpine-20230912131525 |
Apache License 2.0 |
powerdns |
mirantis.azurecr.io/openstack/extra/powerdns:4.7-alpine-20230817061604 |
GPL-2.0 License |
nginx-ingress-controller |
mirantis.azurecr.io/openstack/extra/nginx-ingress-controller:1.8.2-alpine-20230912142938 |
Apache License 2.0 |
tls-proxy |
mirantis.azurecr.io/openstack/tls-proxy:focal-fipster-20230725114156 |
Mirantis Proprietary License |
defaultbackend |
mirantis.azurecr.io/openstack/extra/defaultbackend:v1.19.2-77af1ef-20220823043839 |
Apache License 2.0 |
mariadb |
mirantis.azurecr.io/general/mariadb:10.6.14-focal-20230912121635 |
GPLv2, LGPLv2.1 (client libraries) |
rabbitmq-exporter |
mirantis.azurecr.io/stacklight/rabbitmq-exporter:1.0.0-RC19 |
MIT License |
memcached-exporter |
mirantis.azurecr.io/stacklight/memcached-exporter:v0.11.3 |
Apache License 2.0 |
prometheus-mysql-exporter |
mirantis.azurecr.io/stacklight/mysqld-exporter:v0.11.0 |
Apache License 2.0 |
aodh |
mirantis.azurecr.io/openstack/aodh:victoria-focal-20230912131036 |
Apache License 2.0 |
ceilometer |
mirantis.azurecr.io/openstack/ceilometer:victoria-focal-20230912131036 |
Apache License 2.0 |
gnocchi |
mirantis.azurecr.io/openstack/gnocchi:victoria-focal-20230912131036 |
Apache License 2.0 |
redis |
mirantis.azurecr.io/tungsten/redis:7.2.1-alpine3.18 |
BSD 3-Clause “New” or “Revised” License |
frr |
mirantis.azurecr.io/general/external/docker.io/frrouting/frr:v8.5.1-20230619084330 |
GPL-2.0 and LGPL-2.1 |
strongswan |
mirantis.azurecr.io/openstack/extra/strongswan:alpine-5.9.8-20230720054838 |
GPL-2.0 |
rsyslog |
mirantis.azurecr.io/openstack/extra/rsyslog:v8.2001.0-20230912122503 |
GNU General Public License v3 |
descheduler |
mirantis.azurecr.io/openstack/extra/descheduler:v0.27.0 |
Apache License 2.0 |
nginx |
mirantis.azurecr.io/openstack/extra/nginx:1.25.1-alpine-slim |
Apache License 2.0 |
requirements |
mirantis.azurecr.io/openstack/requirements:victoria-focal-20230912131036 |
n/a |
placement |
mirantis.azurecr.io/openstack/placement:victoria-focal-20230912131036 |
Apache License 2.0 |
stepler |
mirantis.azurecr.io/openstack/stepler:victoria-focal-20230912122503 |
Apache License 2.0 |
masakari |
mirantis.azurecr.io/openstack/masakari:victoria-focal-20230912131036 |
Apache License 2.0 |
masakari-monitors |
mirantis.azurecr.io/openstack/masakari-monitors:victoria-focal-20230912131036 |
Apache License 2.0 |
ironic-inspector |
mirantis.azurecr.io/openstack/ironic-inspector:victoria-focal-20230912131036 |
Apache License 2.0 |
panko |
mirantis.azurecr.io/openstack/panko:victoria-focal-20230912131036 |
Apache License 2.0 |
MOSK 23.2.3 OpenStack Yoga binaries and Docker images
Component |
Path |
License information for main executable programs |
|---|---|---|
Binaries |
||
octavia-amphora |
https://binary.mirantis.com/openstack/bin/octavia/amphora-x64-haproxy-yoga-20230718165730.qcow2 |
Mirantis Proprietary License |
mirantis |
https://binary.mirantis.com/openstack/bin/horizon/mirantis-xena-9f691e3-20220110111511.tar.gz |
Mirantis Proprietary License |
kernel |
https://binary.mirantis.com/openstack/bin/ironic/tinyipa/tinyipa-stable-yoga-20230128061113.vmlinuz |
GPL-2.0 |
initramfs |
https://binary.mirantis.com/openstack/bin/ironic/tinyipa/tinyipa-stable-yoga-20230128061113.gz |
GPL-2.0 |
service-image |
https://binary.mirantis.com/openstack/bin/manila/manila-service-image-20221228132450.qcow2 |
Mirantis Proprietary License |
Docker images |
||
keystone |
mirantis.azurecr.io/openstack/keystone:yoga-focal-20230913143832 |
Apache License 2.0 |
heat |
mirantis.azurecr.io/openstack/heat:yoga-focal-20230913143832 |
Apache License 2.0 |
glance |
mirantis.azurecr.io/openstack/glance:yoga-focal-20230913143832 |
Apache License 2.0 |
cinder |
mirantis.azurecr.io/openstack/cinder:yoga-focal-20230913143832 |
Apache License 2.0 |
cloudprober |
mirantis.azurecr.io/openstack/extra/cloudprober:v0.12.9 |
Apache License 2.0 |
neutron |
mirantis.azurecr.io/openstack/neutron:yoga-focal-20230913143832 |
Apache License 2.0 |
nova |
mirantis.azurecr.io/openstack/nova:yoga-focal-20230913143832 |
Apache License 2.0 |
horizon |
mirantis.azurecr.io/openstack/horizon:yoga-focal-20230913143832 |
Apache License 2.0 |
tempest |
mirantis.azurecr.io/openstack/tempest:yoga-focal-20230913143832 |
Apache License 2.0 |
octavia |
mirantis.azurecr.io/openstack/octavia:yoga-focal-20230913143832 |
Apache License 2.0 |
designate |
mirantis.azurecr.io/openstack/designate:yoga-focal-20230913143832 |
Apache License 2.0 |
ironic |
mirantis.azurecr.io/openstack/ironic:yoga-focal-20230913143832 |
Apache License 2.0 |
barbican |
mirantis.azurecr.io/openstack/barbican:yoga-focal-20230913143832 |
Apache License 2.0 |
libvirt |
mirantis.azurecr.io/general/libvirt:6.0.0-focal-20230730124813 |
LGPL-2.1 License |
pause |
mirantis.azurecr.io/general/external/pause:3.1 |
Apache License 2.0 |
openvswitch |
mirantis.azurecr.io/general/openvswitch:2.13-focal-20230912122504 |
Apache License 2.0 |
openvswitch-dpdk |
mirantis.azurecr.io/general/openvswitch-dpdk:2.13-focal-20230912122503 |
Apache License 2.0 |
openstack-tools |
mirantis.azurecr.io/openstack/openstack-tools:yoga-focal-20230913143832 |
Apache License 2.0 |
rabbitmq-3.10.x |
mirantis.azurecr.io/openstack/extra/rabbitmq:3.10.18-focal-20230222154055 |
Mozilla Public License 2.0 |
rabbitmq-3.10.x-management |
mirantis.azurecr.io/openstack/extra/rabbitmq-management:3.10.18-focal-20230222154055 |
Mozilla Public License 2.0 |
kubernetes-entrypoint |
mirantis.azurecr.io/openstack/extra/kubernetes-entrypoint:v1.0.1-5359171-20230810125608 |
Apache License 2.0 |
memcached |
mirantis.azurecr.io/general/memcached:v1.6.21-alpine-20230913050002 |
BSD 3-Clause “New” or “Revised” License |
etcd |
mirantis.azurecr.io/openstack/extra/etcd:v3.5.9-alpine-20230912131525 |
Apache License 2.0 |
powerdns |
mirantis.azurecr.io/openstack/extra/powerdns:4.7-alpine-20230817061604 |
GPL-2.0 License |
nginx-ingress-controller |
mirantis.azurecr.io/openstack/extra/nginx-ingress-controller:1.8.2-alpine-20230912142938 |
Apache License 2.0 |
tls-proxy |
mirantis.azurecr.io/openstack/tls-proxy:focal-fipster-20230725114156 |
Mirantis Proprietary License |
defaultbackend |
mirantis.azurecr.io/openstack/extra/defaultbackend:v1.19.2-77af1ef-20220823043839 |
Apache License 2.0 |
mariadb |
mirantis.azurecr.io/general/mariadb:10.6.14-focal-20230912121635 |
GPLv2, LGPLv2.1 (client libraries) |
rabbitmq-exporter |
mirantis.azurecr.io/stacklight/rabbitmq-exporter:1.0.0-RC19 |
MIT License |
memcached-exporter |
mirantis.azurecr.io/stacklight/memcached-exporter:v0.11.3 |
Apache License 2.0 |
prometheus-mysql-exporter |
mirantis.azurecr.io/stacklight/mysqld-exporter:v0.11.0 |
Apache License 2.0 |
aodh |
mirantis.azurecr.io/openstack/aodh:yoga-focal-20230913143832 |
Apache License 2.0 |
ceilometer |
mirantis.azurecr.io/openstack/ceilometer:yoga-focal-20230913143832 |
Apache License 2.0 |
gnocchi |
mirantis.azurecr.io/openstack/gnocchi:yoga-focal-20230913143832 |
Apache License 2.0 |
redis |
mirantis.azurecr.io/tungsten/redis:7.2.1-alpine3.18 |
BSD 3-Clause “New” or “Revised” License |
frr |
mirantis.azurecr.io/general/external/docker.io/frrouting/frr:v8.5.1-20230619084330 |
GPL-2.0 and LGPL-2.1 |
strongswan |
mirantis.azurecr.io/openstack/extra/strongswan:alpine-5.9.8-20230720054838 |
GPL-2.0 |
rsyslog |
mirantis.azurecr.io/openstack/extra/rsyslog:v8.2001.0-20230912122503 |
GNU General Public License v3 |
descheduler |
mirantis.azurecr.io/openstack/extra/descheduler:v0.27.0 |
Apache License 2.0 |
nginx |
mirantis.azurecr.io/openstack/extra/nginx:1.25.1-alpine-slim |
Apache License 2.0 |
requirements |
mirantis.azurecr.io/openstack/requirements:yoga-focal-20230913143832 |
n/a |
stepler |
mirantis.azurecr.io/openstack/stepler:yoga-focal-20230913183155 |
Apache License 2.0 |
placement |
mirantis.azurecr.io/openstack/placement:yoga-focal-20230913143832 |
Apache License 2.0 |
masakari |
mirantis.azurecr.io/openstack/masakari:yoga-focal-20230913143832 |
Apache License 2.0 |
masakari-monitors |
mirantis.azurecr.io/openstack/masakari-monitors:yoga-focal-20230913143832 |
Apache License 2.0 |
ironic-inspector |
mirantis.azurecr.io/openstack/ironic-inspector:yoga-focal-20230913143832 |
Apache License 2.0 |
manila |
mirantis.azurecr.io/openstack/manila:yoga-focal-20230913143832 |
Apache License 2.0 |
MOSK 23.2.3 OpenStack Helm charts
MOSK 23.2.3 Tungsten Fabric 21.4 artifacts
Component |
Path |
License information for main executable programs |
|---|---|---|
Helm charts |
||
Tungsten Fabric Operator |
https://binary.mirantis.com/tungsten/helm/tungstenfabric-operator-0.12.6.tgz |
Mirantis Proprietary License |
Docker images |
||
Tungsten Fabric Operator |
mirantis.azurecr.io/tungsten-operator/tungstenfabric-operator:0.12.6 |
Mirantis Proprietary License |
Analytics Alarm |
mirantis.azurecr.io/tungsten/contrail-analytics-alarm-gen:23.2-r21.4.20230913134453 |
Apache License 2.0 |
Analytics |
mirantis.azurecr.io/tungsten/contrail-analytics-api:23.2-r21.4.20230913134453 |
Apache License 2.0 |
mirantis.azurecr.io/tungsten/contrail-analytics-collector:23.2-r21.4.20230913134453 |
Apache License 2.0 |
|
Analytics DB |
mirantis.azurecr.io/tungsten/contrail-analytics-query-engine:23.2-r21.4.20230913134453 |
Apache License 2.0 |
Analytics SNMP |
mirantis.azurecr.io/tungsten/contrail-analytics-snmp-collector:23.2-r21.4.20230913134453 |
Apache License 2.0 |
mirantis.azurecr.io/tungsten/contrail-analytics-snmp-topology:23.2-r21.4.20230913134453 |
Apache License 2.0 |
|
Config |
mirantis.azurecr.io/tungsten/contrail-controller-config-api:23.2-r21.4.20230913134453 |
Apache License 2.0 |
mirantis.azurecr.io/tungsten/contrail-controller-config-devicemgr:23.2-r21.4.20230913134453 |
Apache License 2.0 |
|
mirantis.azurecr.io/tungsten/contrail-controller-config-dnsmasq:23.2-r21.4.20230913134453 |
Apache License 2.0 |
|
mirantis.azurecr.io/tungsten/contrail-controller-config-schema:23.2-r21.4.20230913134453 |
Apache License 2.0 |
|
mirantis.azurecr.io/tungsten/contrail-controller-config-svcmonitor:23.2-r21.4.20230913134453 |
Apache License 2.0 |
|
Control |
mirantis.azurecr.io/tungsten/contrail-controller-control-control:23.2-r21.4.20230913134453 |
Apache License 2.0 |
mirantis.azurecr.io/tungsten/contrail-controller-control-dns:23.2-r21.4.20230913134453 |
Apache License 2.0 |
|
mirantis.azurecr.io/tungsten/contrail-controller-control-named:23.2-r21.4.20230913134453 |
Apache License 2.0 |
|
Web UI |
mirantis.azurecr.io/tungsten/contrail-controller-webui-job:23.2-r21.4.20230913134453 |
Apache License 2.0 |
mirantis.azurecr.io/tungsten/contrail-controller-webui-web:23.2-r21.4.20230913134453 |
Apache License 2.0 |
|
Nodemanager |
mirantis.azurecr.io/tungsten/contrail-nodemgr:23.2-r21.4.20230913134453 |
Apache License 2.0 |
vRouter |
mirantis.azurecr.io/tungsten/contrail-vrouter-agent:23.2_R21.4.20230810083758 |
Apache License 2.0 |
mirantis.azurecr.io/tungsten/contrail-vrouter-agent-dpdk:23.2_R21.4.20230810083758 |
Apache License 2.0 |
|
mirantis.azurecr.io/tungsten/contrail-node-init:23.2_R21.4.20230810083758 |
Apache License 2.0 |
|
mirantis.azurecr.io/tungsten/contrail-vrouter-kernel-build-init:23.2_R21.4.20230810083758 |
Apache License 2.0 |
|
Cassandra operator |
mirantis.azurecr.io/tungsten-operator/casskop:2.1.17 |
Apache License 2.0 |
Cassandra |
mirantis.azurecr.io/tungsten/cassandra-bootstrap:0.1.12 |
Apache License 2.0 |
mirantis.azurecr.io/tungsten/cassandra:3.11.10-20230622 |
Apache License 2.0 |
|
mirantis.azurecr.io/tungsten/instaclustr-icarus:v2-20230328121138 |
Apache License 2.0 |
|
mirantis.azurecr.io/tungsten/cass-config-builder:v2-20230830113546 |
Apache License 2.0 |
|
Kafka |
mirantis.azurecr.io/tungsten/cp-kafka:7.4.1 |
Apache License 2.0 |
mirantis.azurecr.io/stacklight/jmx-exporter:0.18.0-debian-11-r32 |
Apache License 2.0 |
|
Kafka operator |
mirantis.azurecr.io/tungsten-operator/kafka-k8s-operator:0.3.5 |
Mirantis Proprietary License |
RabbitMQ operator |
mirantis.azurecr.io/tungsten-operator/rabbitmq-operator:0.3.8 |
Mirantis Proprietary License |
RabbitMQ |
mirantis.azurecr.io/tungsten/rabbitmq:3.11.16 |
Mozilla Public License 2.0 |
mirantis.azurecr.io/stacklight/rabbitmq-exporter:1.0.0-RC19 |
MIT License |
|
ZooKeeper operator |
mirantis.azurecr.io/tungsten-operator/zookeeper-operator:0.2.17-mcp |
Apache License 2.0 |
ZooKeeper |
mirantis.azurecr.io/tungsten/zookeeper:3.8.1-20230425 |
Apache License 2.0 |
Redis operator |
mirantis.azurecr.io/tungsten-operator/redis-operator:0.3.9 |
Apache License 2.0 |
Redis |
mirantis.azurecr.io/tungsten/redis:7.2.1-alpine3.18 |
BSD 3-Clause “New” or “Revised” License |
mirantis.azurecr.io/stacklight/redis_exporter:v1.45.0 |
BSD 3-Clause “New” or “Revised” License |
|
TF Provisioner |
mirantis.azurecr.io/tungsten/contrail-provisioner:23.2-r21.4.20230913134453 |
Apache License 2.0 |
TF Test |
mirantis.azurecr.io/tungsten/tungsten-pytest:0.1-20230915094303 |
MIT License |
TF CLI |
mirantis.azurecr.io/tungsten/tf-cli:0.1-20230828085831 |
MIT License |
TF NodeInfo |
mirantis.azurecr.io/tungsten/tf-nodeinfo:0.1-20230328120524 |
MIT License |
TF Tools |
mirantis.azurecr.io/tungsten/contrail-tools:23.2-r21.4.20230913134453 |
Apache License 2.0 |
kubernetes-entrypoint |
mirantis.azurecr.io/openstack/extra/kubernetes-entrypoint:v1.0.1-27d64fb-20230421151539 |
Apache License 2.0 |
pause |
mirantis.azurecr.io/general/external/pause:3.1 |
Apache License 2.0 |
MOSK 23.2.3 StackLight artifacts
Component |
Path |
License information for main executable programs |
|---|---|---|
Docker images |
||
prometheus-libvirt-exporter |
mirantis.azurecr.io/stacklight/prometheus-libvirt-exporter:v0.2-20230915023013 |
Mirantis Proprietary License |
tungstenfabric-prometheus-exporter |
mirantis.azurecr.io/stacklight/tungstenfabric-prometheus-exporter:0.1-20230912105027 |
Mirantis Proprietary License |
Helm charts |
||
prometheus-libvirt-exporter |
https://binary.mirantis.com/stacklight/helm/prometheus-libvirt-exporter-0.2.0-mcp-3.tgz |
Mirantis Proprietary License |
prometheus-tungstenfabric-exporter |
https://binary.mirantis.com/stacklight/helm/prometheus-tungstenfabric-exporter-0.2.0-mcp-3.tgz |
Mirantis Proprietary License |
In total, in the MOSK 23.2.3 release, 331 Common Vulnerabilities and Exposures (CVE) have been fixed: 39 of critical and 292 of high severity.
The full list of the CVEs present in the current MOSK release is available at the Mirantis Security Portal.
Severity |
Critical |
High |
Total |
|---|---|---|---|
Unique CVEs |
1 |
18 |
19 |
Total issues across images |
39 |
292 |
331 |
Image |
Component name |
CVE |
|---|---|---|
core/external/nginx |
libwebp |
CVE-2023-4863 (High) |
core/frontend |
libwebp |
CVE-2023-4863 (High) |
general/memcached |
busybox |
CVE-2022-48174 (Critical) |
busybox-binsh |
CVE-2022-48174 (Critical) |
|
ssl_client |
CVE-2022-48174 (Critical) |
|
lcm/kubernetes/openstack-cloud-controller-manager-amd64 |
busybox |
CVE-2022-48174 (Critical) |
busybox-binsh |
CVE-2022-48174 (Critical) |
|
ssl_client |
CVE-2022-48174 (Critical) |
|
lcm/registry |
busybox |
CVE-2022-48174 (Critical) |
busybox-binsh |
CVE-2022-48174 (Critical) |
|
ssl_client |
CVE-2022-48174 (Critical) |
|
openstack/extra/cloudprober |
busybox |
CVE-2022-48174 (Critical) |
busybox-binsh |
CVE-2022-48174 (Critical) |
|
ssl_client |
CVE-2022-48174 (Critical) |
|
openstack/extra/etcd |
busybox |
CVE-2022-48174 (Critical) |
busybox-binsh |
CVE-2022-48174 (Critical) |
|
ssl_client |
CVE-2022-48174 (Critical) |
|
openstack/extra/nginx-ingress-controller |
busybox |
CVE-2022-48174 (Critical) |
busybox-binsh |
CVE-2022-48174 (Critical) |
|
ssl_client |
CVE-2022-48174 (Critical) |
|
openstack/extra/redis |
busybox |
CVE-2022-48174 (Critical) |
busybox-binsh |
CVE-2022-48174 (Critical) |
|
ssl_client |
CVE-2022-48174 (Critical) |
|
openstack/horizon |
Django |
CVE-2023-41164 (High) |
scale/curl-jq |
busybox |
CVE-2022-48174 (Critical) |
busybox-binsh |
CVE-2022-48174 (Critical) |
|
ssl_client |
CVE-2022-48174 (Critical) |
|
stacklight/alertmanager-webhook-servicenow |
busybox |
CVE-2022-48174 (Critical) |
busybox-binsh |
CVE-2022-48174 (Critical) |
|
ssl_client |
CVE-2022-48174 (Critical) |
|
stacklight/grafana-image-renderer |
libwebp |
CVE-2023-4863 (High) |
stacklight/ironic-prometheus-exporter |
busybox |
CVE-2022-48174 (Critical) |
busybox-binsh |
CVE-2022-48174 (Critical) |
|
ssl_client |
CVE-2022-48174 (Critical) |
|
stacklight/sf-reporter |
busybox |
CVE-2022-48174 (Critical) |
busybox-binsh |
CVE-2022-48174 (Critical) |
|
ssl_client |
CVE-2022-48174 (Critical) |
|
stacklight/tungstenfabric-prometheus-exporter |
busybox |
CVE-2022-48174 (Critical) |
busybox-binsh |
CVE-2022-48174 (Critical) |
|
ssl_client |
CVE-2022-48174 (Critical) |
|
tungsten/contrail-analytics-alarm-gen |
kernel-headers |
CVE-2022-1012 (High) |
CVE-2023-2163 (High) |
||
CVE-2022-42896 (High) |
||
CVE-2023-3611 (High) |
||
CVE-2023-35001 (High) |
||
CVE-2023-3609 (High) |
||
CVE-2020-8834 (High) |
||
CVE-2021-3715 (High) |
||
CVE-2023-4128 (High) |
||
CVE-2023-32233 (High) |
||
CVE-2022-2639 (High) |
||
CVE-2023-1829 (High) |
||
CVE-2023-3776 (High) |
||
CVE-2018-20976 (High) |
||
CVE-2023-1281 (High) |
||
CVE-2023-35788 (High) |
||
tungsten/contrail-analytics-api |
kernel-headers |
CVE-2022-1012 (High) |
CVE-2023-2163 (High) |
||
CVE-2022-42896 (High) |
||
CVE-2023-3611 (High) |
||
CVE-2023-35001 (High) |
||
CVE-2023-3609 (High) |
||
CVE-2020-8834 (High) |
||
CVE-2021-3715 (High) |
||
CVE-2023-4128 (High) |
||
CVE-2023-32233 (High) |
||
CVE-2022-2639 (High) |
||
CVE-2023-1829 (High) |
||
CVE-2023-3776 (High) |
||
CVE-2018-20976 (High) |
||
CVE-2023-1281 (High) |
||
CVE-2023-35788 (High) |
||
tungsten/contrail-analytics-collector |
kernel-headers |
CVE-2023-35788 (High) |
CVE-2022-1012 (High) |
||
CVE-2023-2163 (High) |
||
CVE-2022-42896 (High) |
||
CVE-2023-3611 (High) |
||
CVE-2023-35001 (High) |
||
CVE-2023-3609 (High) |
||
CVE-2020-8834 (High) |
||
CVE-2021-3715 (High) |
||
CVE-2023-4128 (High) |
||
CVE-2023-32233 (High) |
||
CVE-2022-2639 (High) |
||
CVE-2023-1829 (High) |
||
CVE-2023-3776 (High) |
||
CVE-2018-20976 (High) |
||
CVE-2023-1281 (High) |
||
tungsten/contrail-analytics-query-engine |
kernel-headers |
CVE-2023-35788 (High) |
CVE-2022-1012 (High) |
||
CVE-2023-2163 (High) |
||
CVE-2022-42896 (High) |
||
CVE-2023-3611 (High) |
||
CVE-2023-35001 (High) |
||
CVE-2023-3609 (High) |
||
CVE-2020-8834 (High) |
||
CVE-2021-3715 (High) |
||
CVE-2023-4128 (High) |
||
CVE-2023-32233 (High) |
||
CVE-2022-2639 (High) |
||
CVE-2023-1829 (High) |
||
CVE-2023-3776 (High) |
||
CVE-2018-20976 (High) |
||
CVE-2023-1281 (High) |
||
tungsten/contrail-analytics-snmp-collector |
kernel-headers |
CVE-2022-1012 (High) |
CVE-2023-2163 (High) |
||
CVE-2022-42896 (High) |
||
CVE-2023-3611 (High) |
||
CVE-2023-35001 (High) |
||
CVE-2023-3609 (High) |
||
CVE-2020-8834 (High) |
||
CVE-2021-3715 (High) |
||
CVE-2023-4128 (High) |
||
CVE-2023-32233 (High) |
||
CVE-2022-2639 (High) |
||
CVE-2023-1829 (High) |
||
CVE-2023-3776 (High) |
||
CVE-2018-20976 (High) |
||
CVE-2023-1281 (High) |
||
CVE-2023-35788 (High) |
||
tungsten/contrail-analytics-snmp-topology |
kernel-headers |
CVE-2022-1012 (High) |
CVE-2023-2163 (High) |
||
CVE-2022-42896 (High) |
||
CVE-2023-3611 (High) |
||
CVE-2023-35001 (High) |
||
CVE-2023-3609 (High) |
||
CVE-2020-8834 (High) |
||
CVE-2021-3715 (High) |
||
CVE-2023-4128 (High) |
||
CVE-2023-32233 (High) |
||
CVE-2022-2639 (High) |
||
CVE-2023-1829 (High) |
||
CVE-2023-3776 (High) |
||
CVE-2018-20976 (High) |
||
CVE-2023-1281 (High) |
||
CVE-2023-35788 (High) |
||
tungsten/contrail-controller-config-api |
kernel-headers |
CVE-2022-1012 (High) |
CVE-2023-2163 (High) |
||
CVE-2022-42896 (High) |
||
CVE-2023-3611 (High) |
||
CVE-2023-35001 (High) |
||
CVE-2023-3609 (High) |
||
CVE-2020-8834 (High) |
||
CVE-2021-3715 (High) |
||
CVE-2023-4128 (High) |
||
CVE-2023-32233 (High) |
||
CVE-2022-2639 (High) |
||
CVE-2023-1829 (High) |
||
CVE-2023-3776 (High) |
||
CVE-2018-20976 (High) |
||
CVE-2023-1281 (High) |
||
CVE-2023-35788 (High) |
||
tungsten/contrail-controller-config-devicemgr |
kernel-headers |
CVE-2022-1012 (High) |
CVE-2023-2163 (High) |
||
CVE-2022-42896 (High) |
||
CVE-2023-3611 (High) |
||
CVE-2023-35001 (High) |
||
CVE-2023-3609 (High) |
||
CVE-2020-8834 (High) |
||
CVE-2021-3715 (High) |
||
CVE-2023-4128 (High) |
||
CVE-2023-32233 (High) |
||
CVE-2022-2639 (High) |
||
CVE-2023-1829 (High) |
||
CVE-2023-3776 (High) |
||
CVE-2018-20976 (High) |
||
CVE-2023-1281 (High) |
||
CVE-2023-35788 (High) |
||
tungsten/contrail-controller-config-schema |
kernel-headers |
CVE-2023-35788 (High) |
CVE-2022-1012 (High) |
||
CVE-2023-2163 (High) |
||
CVE-2022-42896 (High) |
||
CVE-2023-3611 (High) |
||
CVE-2023-35001 (High) |
||
CVE-2023-3609 (High) |
||
CVE-2020-8834 (High) |
||
CVE-2021-3715 (High) |
||
CVE-2023-4128 (High) |
||
CVE-2023-32233 (High) |
||
CVE-2022-2639 (High) |
||
CVE-2023-1829 (High) |
||
CVE-2023-3776 (High) |
||
CVE-2018-20976 (High) |
||
CVE-2023-1281 (High) |
||
tungsten/contrail-controller-config-svcmonitor |
kernel-headers |
CVE-2023-35788 (High) |
CVE-2022-1012 (High) |
||
CVE-2023-2163 (High) |
||
CVE-2022-42896 (High) |
||
CVE-2023-3611 (High) |
||
CVE-2023-35001 (High) |
||
CVE-2023-3609 (High) |
||
CVE-2020-8834 (High) |
||
CVE-2021-3715 (High) |
||
CVE-2023-4128 (High) |
||
CVE-2023-32233 (High) |
||
CVE-2022-2639 (High) |
||
CVE-2023-1829 (High) |
||
CVE-2023-3776 (High) |
||
CVE-2018-20976 (High) |
||
CVE-2023-1281 (High) |
||
tungsten/contrail-controller-control-control |
kernel-headers |
CVE-2022-1012 (High) |
CVE-2023-2163 (High) |
||
CVE-2022-42896 (High) |
||
CVE-2023-3611 (High) |
||
CVE-2023-35001 (High) |
||
CVE-2023-3609 (High) |
||
CVE-2020-8834 (High) |
||
CVE-2021-3715 (High) |
||
CVE-2023-4128 (High) |
||
CVE-2023-32233 (High) |
||
CVE-2022-2639 (High) |
||
CVE-2023-1829 (High) |
||
CVE-2023-3776 (High) |
||
CVE-2018-20976 (High) |
||
CVE-2023-1281 (High) |
||
CVE-2023-35788 (High) |
||
tungsten/contrail-controller-control-dns |
kernel-headers |
CVE-2023-35788 (High) |
CVE-2022-1012 (High) |
||
CVE-2023-2163 (High) |
||
CVE-2022-42896 (High) |
||
CVE-2023-3611 (High) |
||
CVE-2023-35001 (High) |
||
CVE-2023-3609 (High) |
||
CVE-2020-8834 (High) |
||
CVE-2021-3715 (High) |
||
CVE-2023-4128 (High) |
||
CVE-2023-32233 (High) |
||
CVE-2022-2639 (High) |
||
CVE-2023-1829 (High) |
||
CVE-2023-3776 (High) |
||
CVE-2018-20976 (High) |
||
CVE-2023-1281 (High) |
||
tungsten/contrail-controller-control-named |
kernel-headers |
CVE-2023-35788 (High) |
CVE-2022-1012 (High) |
||
CVE-2023-2163 (High) |
||
CVE-2022-42896 (High) |
||
CVE-2023-3611 (High) |
||
CVE-2023-35001 (High) |
||
CVE-2023-3609 (High) |
||
CVE-2020-8834 (High) |
||
CVE-2021-3715 (High) |
||
CVE-2023-4128 (High) |
||
CVE-2023-32233 (High) |
||
CVE-2022-2639 (High) |
||
CVE-2023-1829 (High) |
||
CVE-2023-3776 (High) |
||
CVE-2018-20976 (High) |
||
CVE-2023-1281 (High) |
||
tungsten/contrail-controller-webui-job |
kernel-headers |
CVE-2023-35788 (High) |
CVE-2022-1012 (High) |
||
CVE-2023-2163 (High) |
||
CVE-2022-42896 (High) |
||
CVE-2023-3611 (High) |
||
CVE-2023-35001 (High) |
||
CVE-2023-3609 (High) |
||
CVE-2020-8834 (High) |
||
CVE-2021-3715 (High) |
||
CVE-2023-4128 (High) |
||
CVE-2023-32233 (High) |
||
CVE-2022-2639 (High) |
||
CVE-2023-1829 (High) |
||
CVE-2023-3776 (High) |
||
CVE-2018-20976 (High) |
||
CVE-2023-1281 (High) |
||
tungsten/contrail-controller-webui-web |
kernel-headers |
CVE-2022-1012 (High) |
CVE-2023-2163 (High) |
||
CVE-2022-42896 (High) |
||
CVE-2023-3611 (High) |
||
CVE-2023-35001 (High) |
||
CVE-2023-3609 (High) |
||
CVE-2020-8834 (High) |
||
CVE-2021-3715 (High) |
||
CVE-2023-4128 (High) |
||
CVE-2023-32233 (High) |
||
CVE-2022-2639 (High) |
||
CVE-2023-1829 (High) |
||
CVE-2023-3776 (High) |
||
CVE-2018-20976 (High) |
||
CVE-2023-1281 (High) |
||
CVE-2023-35788 (High) |
||
tungsten/contrail-nodemgr |
kernel-headers |
CVE-2023-35788 (High) |
CVE-2022-1012 (High) |
||
CVE-2023-2163 (High) |
||
CVE-2022-42896 (High) |
||
CVE-2023-3611 (High) |
||
CVE-2023-35001 (High) |
||
CVE-2023-3609 (High) |
||
CVE-2020-8834 (High) |
||
CVE-2021-3715 (High) |
||
CVE-2023-4128 (High) |
||
CVE-2023-32233 (High) |
||
CVE-2022-2639 (High) |
||
CVE-2023-1829 (High) |
||
CVE-2023-3776 (High) |
||
CVE-2018-20976 (High) |
||
CVE-2023-1281 (High) |
||
tungsten/contrail-provisioner |
kernel-headers |
CVE-2022-1012 (High) |
CVE-2023-2163 (High) |
||
CVE-2022-42896 (High) |
||
CVE-2023-3611 (High) |
||
CVE-2023-35001 (High) |
||
CVE-2023-3609 (High) |
||
CVE-2020-8834 (High) |
||
CVE-2021-3715 (High) |
||
CVE-2023-4128 (High) |
||
CVE-2023-32233 (High) |
||
CVE-2022-2639 (High) |
||
CVE-2023-1829 (High) |
||
CVE-2023-3776 (High) |
||
CVE-2018-20976 (High) |
||
CVE-2023-1281 (High) |
||
CVE-2023-35788 (High) |
||
tungsten/contrail-tools |
kernel-headers |
CVE-2023-35788 (High) |
CVE-2022-1012 (High) |
||
CVE-2023-2163 (High) |
||
CVE-2022-42896 (High) |
||
CVE-2023-3611 (High) |
||
CVE-2023-35001 (High) |
||
CVE-2023-3609 (High) |
||
CVE-2020-8834 (High) |
||
CVE-2021-3715 (High) |
||
CVE-2023-4128 (High) |
||
CVE-2023-32233 (High) |
||
CVE-2022-2639 (High) |
||
CVE-2023-1829 (High) |
||
CVE-2023-3776 (High) |
||
CVE-2018-20976 (High) |
||
CVE-2023-1281 (High) |
||
tungsten/redis |
busybox |
CVE-2022-48174 (Critical) |
busybox-binsh |
CVE-2022-48174 (Critical) |
|
ssl_client |
CVE-2022-48174 (Critical) |
This section lists the cluster update known issues with workarounds for the Mirantis OpenStack for Kubernetes release 23.2.3.
During the update, you may encounter the issue that causes a failure of the etcd pods due to the simultaneous deployment of several pods on a single node.
The workaround is to remove the PVC for one etcd pod.
During MOSK update to either 23.2 major release or
any patch release of the 23.2 release series, the
openstack-operator-ensure-resources job may get stuck in
the CrashLoopBackOff state with the following error:
Traceback (most recent call last):
File "/usr/local/bin/osctl-ensure-shared-resources", line 8, in <module>
sys.exit(main())
File "/usr/local/lib/python3.8/dist-packages/openstack_controller/cli/ensure_shared_resources.py", line 61, in main
obj.update()
File "/usr/local/lib/python3.8/dist-packages/pykube/objects.py", line 165, in update
self.patch(self.obj, subresource=subresource)
File "/usr/local/lib/python3.8/dist-packages/pykube/objects.py", line 157, in patch
self.api.raise_for_status(r)
File "/usr/local/lib/python3.8/dist-packages/pykube/http.py", line 444, in raise_for_status
raise HTTPError(resp.status_code, payload["message"])
pykube.exceptions.HTTPError: CustomResourceDefinition.apiextensions.k8s.io "redisfailovers.databases.spotahome.com" is invalid: spec.preserveUnknownFields: Invalid value: true: must be false in order to use defaults in the schema
As a workaround, delete the redisfailovers.databases.spotahome.com
CRD from your cluster:
kubectl delete crd redisfailovers.databases.spotahome.com
While updating your cluster, the Instance High Availability service (OpenStack Masakari) may not work as expected.
As a workaround, temporarily disable the service by removing
instance-ha from the service list in the OpenStackDeployment
custom resource.
Learn more about the release cadence
23.1 series
23.1
Release date |
April 4, 2023 |
|---|---|
Name |
MOSK 23.1 |
Cluster release |
12.7.0 |
Highlights |
|
Component |
Support scope |
Feature |
|---|---|---|
OpenStack |
Full |
|
Tungsten Fabric |
Full |
|
TechPreview |
||
Full |
|
|
Full |
|
|
TechPreview |
|
|
Full |
|
|
Full |
|
|
n/a |
Introduced a new default way to configure the resource oversubscription in the cloud that enables the cloud operator to dynamically control the oversubscription through the Compute service (OpenStack Nova) placement API.
The initial configuration is performed through the OpenStackDeployment
custom resource. By default, the following values are applied:
cpu: 8.0disk: 1.6ram: 1.0
Starting from 23.1, MOSK deploys all new clouds using Tungsten Fabric 21.4 by default. The existing OpenStack deployments using Tungsten Fabric as a networking backend will obtain this new version automatically during the cluster update to MOSK 23.1.
One of the key highlights of the Tungsten Fabric 21.4 release is the support for configuring Maximum Transmission Unit for virtual networks. This capability enables you to set the maximum packet size for your virtual networks, ensuring that your network traffic is optimized for performance and efficiency.
TechPreview
Enhanced load balancing as a service for Tungsten Fabric -enabled MOSK clouds by adding support for Amphora instances on top of the Tungsten Fabric networks.
Compared to the old implementation, which relied on the Tungsten Fabric-controlled HAproxy, the new approach offers:
Full compatibility with the OpenStack Octavia API
Layer 7 load balancing policies and rules
Support for HTTPs/TLS terminating load balancers
Support for the UDP protocol
Implemented the following list of alerts for the OpenStack controller:
OsDplExporterTargetDownOsDplSSLCertExpirationHighOsDplSSLCertExpirationMedium
Implemented the new panels in the Grafana dashboards for OpenSearch and Prometheus that provide details on the storage usage and allow calculating the possible retention time based on provisioned storage and average usage.
Implemented monitoring of bond interfaces.
Learn more
Added the capability to forward logs to external Elasticsearch and OpenSearch servers as the
fluentd-logsoutput. This enhancement also expands existing configuration options for log forwarding to syslog.Implemented the ability to set up custom TLS certificates for the following StackLight
iam-proxyendpoints:iam-proxy-alertaiam-proxy-alertmanageriam-proxy-grafanaiam-proxy-kibanaiam-proxy-prometheus
Implemented the capability to hide sensitive fields from the
OpenStackDeploymentobject by adding reference to a secret to this object using thevalue_fromstructure.Implemented the functionality that enables cloud operators to periodically rotate credentials of OpenStack admin and service users with minimized impact on service availability and workload downtime.
Ensured better security for the noVNC client by allowing encryption of data transfer between the instances and the noVNC proxy server using VeNCrypt authentication scheme. You can enable this feature by defining
features:nova:console:novnc:tls:enabledin theOpenStackDeploymentcustom resource.Technology Preview. Reworked the default MOSK access policies to restrict the permissions of a project administrator role exclusively to the scope of their project.
Implemented the capability to reboot several cluster nodes in one go by using the Graceful reboot mechanism provided by Mirantis Container Cloud. The mechanism restarts the selected nodes one by one, honoring the instance migration policies.
Implemented the capability to identify the nodes requiring reboot through both the Mirantis Container Cloud API and web UI:
API:
reboot.required.trueinstatus:providerStatusof aMachineobjectWeb UI: the One or more machines require a reboot notification on the Clusters and Machines pages
Learn more
Upgraded Ceph to Pacific 16.2.11 from Octopus 15.2.17
Upgraded PowerDNS to 4.7 from 4.2
Published the tutorial to help you build your first cloud application and onboard it to a MOSK cloud. The dedicated section in the User Guide will guide you through the process of deploying and managing a sample application using automation, and showcase the powerful capabilities of OpenStack.
Published the instructions on how you can customize the functionality of MOSK OpenStack services by installing custom system or Python packages into their container images.
Mirantis has tested MOSK against a very specific configuration and can guarantee a predictable behavior of the product only in the exact same environments. The table below includes the major MOSK components with the exact versions against which testing has been performed.
Component |
Version |
|---|---|
Cluster release |
12.7.0 (Cluster release notes) |
OpenStack |
Yoga |
OpenStack Operator |
0.12.4 |
Tungsten Fabric |
21.4 |
Tungsten Fabric Operator |
0.11.7 |
See also
For the supported versions of operating system, Ceph, and other components, refer to Compatibility Matrix.
This section describes the MOSK known issues with available workarounds. For the known issues in the related version of Mirantis Container Cloud, refer to Mirantis Container Cloud: Release Notes.
This section lists the OpenStack known issues with workarounds for the Mirantis OpenStack for Kubernetes release 23.1.
Multiprotocol Label Switching over Generic Routing Encapsulation (MPLSoGRE) provides limited throughput while sending data between VMs up to 38 Mbps, as per Mirantis tests.
As a workaround, switch the encapsulation type to VXLAN in the
OpenStackDeployment custom resource:
spec:
services:
networking:
neutron:
values:
conf:
bagpipe_bgp:
dataplane_driver_ipvpn:
mpls_over_gre: "False"
vxlan_encap: "True"
This section lists the Tungsten Fabric (TF) known issues with workarounds for the Mirantis OpenStack for Kubernetes release 23.1. For TF limitations, see Tungsten Fabric known limitations.
[30738] ‘tf-vrouter-agent’ readiness probe failed (No Configuration for self)
[13755] TF pods switch to CrashLoopBackOff after a simultaneous reboot
[32723] Compiled vRouter kernel module does not refresh with the new kernel
Fixed in MOSK 23.2 Fixed in MOSK 23.2.1
Execution of the TF Heat Tempest test test_template_global_vrouter_config
can result in lost vRouter configuration. This causes the tf-vrouter pod
readiness probe to fail with the following error message:
"Readiness probe failed: vRouter is PRESENT contrail-vrouter-agent: initializing (No Configuration for self)"
As a result, vRouters may have an incomplete routing table making some services, such as metadata, become unavailable.
Workaround:
Add the
tf_heat_tempest_plugintests with global configuration to the exclude list in theOpenStackDeploymentcustom resource:spec: tempest: tempest: values: conf: blacklist: - (?:tf_heat_tempest_plugin.tests.functional.test_global.*)
If you ran
test_template_global_vrouter_configandtf-vrouter-agentpods moved to theerrorstate with the above error, re-create these pods through deletion:kubectl -n tf delete pod tf-vrouter-agent-*
Rebooting all Cassandra cluster TFConfig or TFAnalytics nodes, maintenance, or other circumstances that cause the Cassandra pods to start simultaneously may cause a broken Cassandra TFConfig and/or TFAnalytics cluster. In this case, Cassandra nodes do not join the ring and do not update the IPs of the neighbor nodes. As a result, the TF services cannot operate Cassandra cluster(s).
To verify that a Cassandra cluster is affected:
Run the nodetool status command specifying the config or
analytics cluster and the replica number:
kubectl -n tf exec -it tf-cassandra-<config/analytics>-dc1-rack1-<replica number> -c cassandra -- nodetool status
Example of system response with outdated IP addresses:
Datacenter: DC1
===============
Status=Up/Down
|/ State=Normal/Leaving/Joining/Moving
-- Address Load Tokens Owns (effective) Host ID Rack
DN <outdated ip> ? 256 64.9% a58343d0-1e3f-4d54-bcdf-9b9b949ca873 r1
DN <outdated ip> ? 256 69.8% 67f1d07c-8b13-4482-a2f1-77fa34e90d48 r1
Datacenter: dc1
===============
Status=Up/Down
|/ State=Normal/Leaving/Joining/Moving
-- Address Load Tokens Owns (effective) Host ID Rack
UN <actual ip> 3.84 GiB 256 65.2% 7324ebc4-577a-425f-b3de-96faac95a331 rack1
Workaround:
Manually delete the Cassandra pod from the failed config or analytics
cluster to re-initiate the bootstrap process for one of the Cassandra nodes:
kubectl -n tf delete pod tf-cassandra-<config/analytics>-dc1-rack1-<replica_num>
The vRouter kernel module remains at
/usr/src/vrouter-<TF-VROUTER-IMAGE-VERSION>, even
if it was initially compiled for an older kernel version. This leads
to the reuse of compiled artifacts without recompilation. Consequently,
after upgrading to Mirantis OpenStack for Kubernetes 23.1, an outdated module gets
loaded onto the new kernel. This mismatch results in a failure that
triggers the CrashLoop state for the vRouter on the affected node.
Workaround:
On the affected node, move the old vRouter kernel module to another directory. For example:
mkdir /root/old_vrouter_kmods mv /lib/modules/`uname -r`/updates/dkms/vrouter* /root/old_vrouter_kmods mv /usr/src/vrouter-21.4.20230306000000 /root/old_vrouter_kmods
On the cluster, remove the
tf-vrouter-agentpod:kubectl delete -n tf pod tf-vrouter-agent-<POD_ID>
This section lists the Ceph known issues with workarounds for the Mirantis OpenStack for Kubernetes release 23.1.
[30857] Irrelevant error during Ceph OSD deployment on removable devices
[31630] Ceph cluster upgrade to Pacific is stuck with Rook connection failure
[31555] Ceph can find only 1 out of 2 ‘mgr’ after update to MOSK 23.1
The deployment of Ceph OSDs fails with the following messages in the status
section of the KaaSCephCluster custom resource:
shortClusterInfo:
messages:
- Not all osds are deployed
- Not all osds are in
- Not all osds are up
To find out if your cluster is affected, verify if the devices on
the AMD hosts you use for the Ceph OSDs deployment are removable.
For example, if the sdb device name is specified in
spec.cephClusterSpec.nodes.storageDevices of the KaaSCephCluster
custom resource for the affected host, run:
# cat /sys/block/sdb/removable
1
The system output shows that the reason of the above messages in status
is the enabled hotplug functionality on the AMD nodes, which marks all drives
as removable. And the hotplug functionality is not supported by Ceph in
MOSK.
As a workaround, disable the hotplug functionality in the BIOS settings for disks that are configured to be used as Ceph OSD data devices.
During update to MOSK 23.1, the Ceph cluster gets stuck during upgrade to Ceph Pacific.
To verify whether your cluster is affected:
The cluster is affected if the following conditions are true:
The
ceph-status-controllerpod on the MOSK cluster contains the following log lines:kubectl -n ceph-lcm-mirantis logs <ceph-status-controller-podname> ... E0405 08:07:15.603247 1 cluster.go:222] Cluster health: "HEALTH_ERR" W0405 08:07:15.603266 1 cluster.go:230] found issue error: {Urgent failed to get status. . timed out: exit status 1}
The
KaaSCephClustercustom resource contains the following configuration option in therookConfigsection:spec: cephClusterSpec: rookConfig: ms_crc_data: "false" # or 'ms crc data: "false"'
As a workaround, remove ms_crc_data (or ms crc data) configuration
key from the KaaSCephCluster custom resource and wait for the
rook-ceph-mon pods to restart on the MOSK cluster:
kubectl -n rook-ceph get pod -l app=rook-ceph-mon -w
After update to MOSK 23.1, the status section of the KaaSCephCluster
custom resource can contain the following message:
shortClusterInfo:
messages:
- Not all mgrs are running: 1/2
To verify whether the cluster is affected:
If the KaaSCephCluster spec contains the external section, the cluster
is affected:
spec:
cephClusterSpec:
external:
enable: false
Workaround::
In
spec.cephClusterSpecof theKaaSCephClustercustom resource, remove theexternalsection.Wait for the Not all mgrs are running: 1/2 message to disappear from the
KaaSCephClusterstatus.Verify that the
novaCeph client that is integrated to MOSK has the same keyring as in the Ceph cluster.Keyring verification for the Ceph
novaclientCompare the keyring used in the
nova-computeandlibvirtpods with the one from the Ceph cluster:kubectl -n openstack get pod | grep nova-compute kubectl -n openstack exec -it <nova-compute-pod-name> -- cat /etc/ceph/ceph.client.nova.keyring kubectl -n openstack get pod | grep libvirt kubectl -n openstack exec -it <libvirt-pod-name> -- cat /etc/ceph/ceph.client.nova.keyring kubectl -n rook-ceph exec -it deploy/rook-ceph-tools -- ceph auth get client.nova
If the keyring differs, change the one stored in Ceph cluster with the key from the OpenStack pods:
kubectl -n rook-ceph exec -it deploy/rook-ceph-tools -- bash ceph auth get client.nova -o /tmp/nova.key vi /tmp/nova.key # in the editor, change "key" value to the key obtained from the OpenStack pods # then save and exit editing ceph auth import -i /tmp/nova.key
Verify that the
client.novakeyring of the Ceph cluster matches the one obtained from the OpenStack pods:kubectl -n rook-ceph exec -it deploy/rook-ceph-tools -- ceph auth get client.nova
Verify that
nova-computeandlibvirtpods have access to the Ceph cluster:kubectl -n openstack get pod | grep nova-compute kubectl -n openstack exec -it <nova-compute-pod-name> -- ceph -s -n client.nova kubectl -n openstack get pod | grep libvirt kubectl -n openstack exec -it <libvirt-pod-name> -- ceph -s -n client.nova
Verify that the
cinderCeph client integrated to MOSK has the same keyring as in the Ceph cluster:Keyring verification for the Ceph
cinderclientCompare the keyring used in the
cinder-volumepods with the one from the Ceph cluster.kubectl -n openstack get pod | grep cinder-volume kubectl -n openstack exec -it <cinder-volume-pod-name> -- cat /etc/ceph/ceph.client.cinder.keyring kubectl -n rook-ceph exec -it deploy/rook-ceph-tools -- ceph auth get client.cinder
If the keyring differs, change the one stored in Ceph cluster with the key from the OpenStack pods:
kubectl -n rook-ceph exec -it deploy/rook-ceph-tools -- bash ceph auth get client.cinder -o /tmp/cinder.key vi /tmp/cinder.key # in the editor, change "key" value to the key obtained from the OpenStack pods # then save and exit editing ceph auth import -i /tmp/cinder.key
Verify that the
client.cinderkeyring of the Ceph cluster matches the one obtained from the OpenStack pods:kubectl -n rook-ceph exec -it deploy/rook-ceph-tools -- ceph auth get client.cinder
Verify that the
cinder-volumepods have access to the Ceph cluster:kubectl -n openstack get pod | grep cinder-volume kubectl -n openstack exec -it <cinder-volume-pod-name> -- ceph -s -n client.cinder
Verify that the
glanceCeph client integrated to MOSK has the same keyring as in the Ceph cluster.Keyring verification for the Ceph
glanceclientCompare the keyring used in the
glance-apipods with the one from the Ceph cluster:kubectl -n openstack get pod | grep glance-api kubectl -n openstack exec -it <glance-api-pod-name> -- cat /etc/ceph/ceph.client.glance.keyring kubectl -n rook-ceph exec -it deploy/rook-ceph-tools -- ceph auth get client.glance
If the keyring differs, change the one stored in Ceph cluster with the key from the OpenStack pods:
kubectl -n rook-ceph exec -it deploy/rook-ceph-tools -- bash ceph auth get client.glance -o /tmp/glance.key vi /tmp/glance.key # in the editor, change "key" value to the key obtained from the OpenStack pods # then save and exit editing ceph auth import -i /tmp/glance.key
Verify that the
client.glancekeyring of the Ceph cluster matches the one obtained from the OpenStack pods:kubectl -n rook-ceph exec -it deploy/rook-ceph-tools -- ceph auth get client.glance
Verify that the
glance-apipods have access to the Ceph cluster:kubectl -n openstack get pod | grep glance-api kubectl -n openstack exec -it <glance-api-pod-name> -- ceph -s -n client.glance
This section lists the StackLight known issues with workarounds for the Mirantis OpenStack for Kubernetes release 23.1.
Due to the table widget failure, the Instance Info panel in the RabbitMQ Grafana dashboard is empty.
Workaround:
Download the packaged chart with the fixed RabbitMQ dashboard.
Unpack the archive, open
grafana-3.3.10-mcp-199/grafana/dashboards/rabbitmq.json, and copy the file content to the clipboard.In the Grafana web UI, navigate to Dashboards > Import.
In the Import dashboard wizard that opens, paste the imported RabbitMQ dashboard into the Import via panel json box. Click Load.
Specify the dashboard name, for example,
RabbitMQ_fixto avoid colliding with the current dashboard.Click Import to save the dashboard.
Now, the Instance Info panel in the imported RabbitMQ dashboard should be displayed correctly.
This section lists the cluster update known issues with workarounds for the Mirantis OpenStack for Kubernetes release 23.1.
During update of a Container Cloud management cluster, if the MKE minor
version is updated from 3.4.x to 3.5.x, access to the cluster using the
existing kubeconfig fails with the You must be logged in to the server
(Unauthorized) error due to OIDC settings being reconfigured.
As a workaround, during the Container Cloud cluster update, use the
admin kubeconfig instead of the existing one. Once the update
completes, you can use the existing cluster kubeconfig again.
To obtain the admin kubeconfig:
kubectl --kubeconfig <pathToMgmtKubeconfig> get secret -n <affectedClusterNamespace> \
-o yaml <affectedClusterName>-kubeconfig | awk '/admin.conf/ {print $2}' | \
head -1 | base64 -d > clusterKubeconfig.yaml
On a cluster with Tungsten Fabric enabled, the cluster update is stuck with
the tf-rabbit-exporter deployment having a number of pods in the
Terminating state.
To verify whether your cluster is affected:
kubectl -n tf get pods | grep tf-rabbit-exporter
Example of system response on the affected cluster:
tf-rabbit-exporter-6cd5bcd677-dz4bw 1/1 Running 0 9m13s
tf-rabbit-exporter-8665b5886f-4n66m 0/1 Terminating 0 5s
tf-rabbit-exporter-8665b5886f-58q4z 0/1 Terminating 0 0s
tf-rabbit-exporter-8665b5886f-7t5bp 0/1 Terminating 0 7s
tf-rabbit-exporter-8665b5886f-b2vp9 0/1 Terminating 0 3s
tf-rabbit-exporter-8665b5886f-k4gn2 0/1 Terminating 0 6s
tf-rabbit-exporter-8665b5886f-lscb2 0/1 Terminating 0 5s
tf-rabbit-exporter-8665b5886f-pdp78 0/1 Terminating 0 1s
tf-rabbit-exporter-8665b5886f-qgpcl 0/1 Terminating 0 1s
tf-rabbit-exporter-8665b5886f-vpfrg 0/1 Terminating 0 8s
tf-rabbit-exporter-8665b5886f-vsqqk 0/1 Terminating 0 13s
tf-rabbit-exporter-8665b5886f-xfjgf 0/1 Terminating 0 2s
Workaround:
Drop an extra custom resource of RabbitMQ:
kubectl -n tf get rabbitmq
Example of system response on the affected cluster:
NAME AGE tf-rabbit-exporter 545d tf-rabbitmq 545d
Delete the
tf-rabbit-exportercustom resource:kubectl -n tf delete rabbitmq tf-rabbit-exporter
This section lists the components artifacts of the MOSK 23.1 release that includes binaries, Docker images, and Helm charts.
MOSK 23.1 OpenStack Yoga binaries and Docker images
Component |
Path |
License information for main executable programs |
|---|---|---|
Binaries |
||
octavia-amphora |
https://binary.mirantis.com/openstack/bin/octavia/amphora-x64-haproxy-yoga-20230227101732.qcow2 |
Mirantis Proprietary License |
mirantis |
https://binary.mirantis.com/openstack/bin/horizon/mirantis-xena-9f691e3-20220110111511.tar.gz |
Mirantis Proprietary License |
kernel |
https://binary.mirantis.com/openstack/bin/ironic/tinyipa/tinyipa-stable-yoga-20230128061113.vmlinuz |
GPL-2.0 |
initramfs |
https://binary.mirantis.com/openstack/bin/ironic/tinyipa/tinyipa-stable-yoga-20230128061113.gz |
GPL-2.0 |
service-image |
https://binary.mirantis.com/openstack/bin/manila/manila-service-image-20221228132450.qcow2 |
Mirantis Proprietary License |
Docker images |
||
keystone |
mirantis.azurecr.io/openstack/keystone:yoga-focal-20230227093206 |
Apache License 2.0 |
heat |
mirantis.azurecr.io/openstack/heat:yoga-focal-20230227093206 |
Apache License 2.0 |
glance |
mirantis.azurecr.io/openstack/glance:yoga-focal-20230227093206 |
Apache License 2.0 |
cinder |
mirantis.azurecr.io/openstack/cinder:yoga-focal-20230227093206 |
Apache License 2.0 |
neutron |
mirantis.azurecr.io/openstack/neutron:yoga-focal-20230227093206 |
Apache License 2.0 |
nova |
mirantis.azurecr.io/openstack/nova:yoga-focal-20230227093206 |
Apache License 2.0 |
horizon |
mirantis.azurecr.io/openstack/horizon:yoga-focal-20230227093206 |
Apache License 2.0 |
tempest |
mirantis.azurecr.io/openstack/tempest:yoga-focal-20230227093206 |
Apache License 2.0 |
octavia |
mirantis.azurecr.io/openstack/octavia:yoga-focal-20230227093206 |
Apache License 2.0 |
designate |
mirantis.azurecr.io/openstack/designate:yoga-focal-20230227093206 |
Apache License 2.0 |
ironic |
mirantis.azurecr.io/openstack/ironic:yoga-focal-20230227093206 |
Apache License 2.0 |
barbican |
mirantis.azurecr.io/openstack/barbican:yoga-focal-20230227093206 |
Apache License 2.0 |
libvirt |
mirantis.azurecr.io/general/libvirt:6.0.0-focal-20230227123148 |
LGPL-2.1 License |
pause |
mirantis.azurecr.io/general/external/pause:3.1 |
Apache License 2.0 |
openvswitch |
mirantis.azurecr.io/general/openvswitch:2.13-focal-20230227123148 |
Apache License 2.0 |
openvswitch-dpdk |
mirantis.azurecr.io/general/openvswitch-dpdk:2.13-focal-20230227123149 |
Apache License 2.0 |
openstack-tools |
mirantis.azurecr.io/openstack/openstack-tools:yoga-focal-20230227093206 |
Apache License 2.0 |
rabbitmq-3.10.x |
mirantis.azurecr.io/openstack/extra/rabbitmq:3.10.18-focal-20230222154055 |
Mozilla Public License 2.0 |
rabbitmq-3.10.x-management |
mirantis.azurecr.io/openstack/extra/rabbitmq-management:3.10.18-focal-20230222154055 |
Mozilla Public License 2.0 |
amqproxy-0.8.x |
mirantis.azurecr.io/general/amqproxy:v0.8.3 |
MIT license |
kubernetes-entrypoint |
mirantis.azurecr.io/openstack/extra/kubernetes-entrypoint:v1.0.1-48d1e8a-20220919122849 |
Apache License 2.0 |
memcached |
mirantis.azurecr.io/general/memcached:1.6.17-alpine3.16 |
BSD 3-Clause “New” or “Revised” License |
ceph-config-helper |
mirantis.azurecr.io/openstack/extra/ceph-config-helper:pacific-focal-20230227123148 |
Apache License 2.0, LGPL-2.1 or LGPL-3 |
etcd |
mirantis.azurecr.io/openstack/extra/etcd:v3.5.4-alpine-20221116085516 |
Apache License 2.0 |
powerdns |
mirantis.azurecr.io/openstack/extra/powerdns:4.7-alpine-20230113154410 |
GPL-2.0 License |
nginx-ingress-controller |
mirantis.azurecr.io/openstack/extra/nginx-ingress-controller:1.3.1 |
Apache License 2.0 |
tls-proxy |
mirantis.azurecr.io/openstack/tls-proxy:focal-20220804082840 |
Mirantis Proprietary License |
defaultbackend |
mirantis.azurecr.io/openstack/extra/defaultbackend:v1.19.2-77af1ef-20220823043839 |
Apache License 2.0 |
mariadb |
mirantis.azurecr.io/general/mariadb:10.6.12-focal-20230227122722 |
GPLv2, LGPLv2.1 (client libraries) |
rabbitmq-exporter |
mirantis.azurecr.io/stacklight/rabbitmq-exporter:v1.0.0-RC8 |
MIT License |
memcached-exporter |
mirantis.azurecr.io/stacklight/memcached-exporter:v0.11.1 |
Apache License 2.0 |
prometheus-mysql-exporter |
mirantis.azurecr.io/stacklight/mysqld-exporter:v0.11.0 |
Apache License 2.0 |
xrally-openstack |
mirantis.azurecr.io/openstack/extra/xrally-openstack:2.2.0-20230228212732 |
Apache License 2.0 |
aodh |
mirantis.azurecr.io/openstack/aodh:yoga-focal-20230227093206 |
Apache License 2.0 |
ceilometer |
mirantis.azurecr.io/openstack/ceilometer:yoga-focal-20230227093206 |
Apache License 2.0 |
gnocchi |
mirantis.azurecr.io/openstack/gnocchi:yoga-focal-20230227093206 |
Apache License 2.0 |
redis |
mirantis.azurecr.io/openstack/extra/redis:7.0.5-alpine3.16 |
BSD 3-Clause “New” or “Revised” License |
frr |
mirantis.azurecr.io/general/external/docker.io/frrouting/frr:v8.3.1 |
GPL-2.0 and LGPL-2.1 |
strongswan |
mirantis.azurecr.io/openstack/extra/strongswan:alpine-5.9.5-20221028090933 |
GPL-2.0 |
rsyslog |
mirantis.azurecr.io/openstack/extra/rsyslog:v8.2001.0-20230227123149 |
GNU General Public License v3 |
descheduler |
mirantis.azurecr.io/openstack/extra/descheduler:v0.25.0-amd64-20220922181123 |
Apache License 2.0 |
nginx |
mirantis.azurecr.io/openstack/extra/nginx:1.23.3-alpine-slim |
Apache License 2.0 |
tgt |
mirantis.azurecr.io/general/tgt:1.0.x-focal-20230227123149 |
GPL-2.0 |
stepler |
mirantis.azurecr.io/openstack/stepler:yoga-focal-20230223144137 |
Apache License 2.0 |
placement |
mirantis.azurecr.io/openstack/placement:yoga-focal-20230227093206 |
Apache License 2.0 |
masakari |
mirantis.azurecr.io/openstack/masakari:yoga-focal-20230227093206 |
Apache License 2.0 |
masakari-monitors |
mirantis.azurecr.io/openstack/masakari-monitors:yoga-focal-20230227093206 |
Apache License 2.0 |
ironic-inspector |
mirantis.azurecr.io/openstack/ironic-inspector:yoga-focal-20230227093206 |
Apache License 2.0 |
manila |
mirantis.azurecr.io/openstack/manila:yoga-focal-20230227093206 |
Apache License 2.0 |
MOSK 23.1 OpenStack Victoria binaries and Docker images
Component |
Path |
License information for main executable programs |
|---|---|---|
Binaries |
||
octavia-amphora |
https://binary.mirantis.com/openstack/bin/octavia/amphora-x64-haproxy-victoria-20230223191854.qcow2 |
Mirantis Proprietary License |
mirantis |
https://binary.mirantis.com/openstack/bin/horizon/mirantis-victoria-8f71802-20210119120707.tar.gz |
Mirantis Proprietary License |
kernel |
GPL-2.0 |
|
initramfs |
https://binary.mirantis.com/openstack/bin/ironic/tinyipa/tinyipa-stable-victoria-20230128063511.gz |
GPL-2.0 |
service-image |
https://binary.mirantis.com/openstack/bin/manila/manila-service-image-20221228132450.qcow2 |
Mirantis Proprietary License |
Docker images |
||
keystone |
mirantis.azurecr.io/openstack/keystone:victoria-focal-20230223184118 |
Apache License 2.0 |
heat |
mirantis.azurecr.io/openstack/heat:victoria-focal-20230223184118 |
Apache License 2.0 |
glance |
mirantis.azurecr.io/openstack/glance:victoria-focal-20230223184118 |
Apache License 2.0 |
cinder |
mirantis.azurecr.io/openstack/cinder:victoria-focal-20230223184118 |
Apache License 2.0 |
neutron |
mirantis.azurecr.io/openstack/neutron:victoria-focal-20230223184118 |
Apache License 2.0 |
nova |
mirantis.azurecr.io/openstack/nova:victoria-focal-20230223184118 |
Apache License 2.0 |
horizon |
mirantis.azurecr.io/openstack/horizon:victoria-focal-20230223184118 |
Apache License 2.0 |
tempest |
mirantis.azurecr.io/openstack/tempest:victoria-focal-20230223184118 |
Apache License 2.0 |
octavia |
mirantis.azurecr.io/openstack/octavia:victoria-focal-20230223184118 |
Apache License 2.0 |
designate |
mirantis.azurecr.io/openstack/designate:victoria-focal-20230223184118 |
Apache License 2.0 |
ironic |
mirantis.azurecr.io/openstack/ironic:victoria-focal-20230223184118 |
Apache License 2.0 |
barbican |
mirantis.azurecr.io/openstack/barbican:victoria-focal-20230223184118 |
Apache License 2.0 |
libvirt |
mirantis.azurecr.io/general/libvirt:6.0.0-focal-20230227123148 |
LGPL-2.1 License |
pause |
mirantis.azurecr.io/general/external/pause:3.1 |
Apache License 2.0 |
openvswitch |
mirantis.azurecr.io/general/openvswitch:2.13-focal-20230227123148 |
Apache License 2.0 |
openvswitch-dpdk |
mirantis.azurecr.io/general/openvswitch-dpdk:2.13-focal-20230227123149 |
Apache License 2.0 |
openstack-tools |
mirantis.azurecr.io/openstack/openstack-tools:yoga-focal-20230227093206 |
Apache License 2.0 |
rabbitmq-3.10.x |
mirantis.azurecr.io/openstack/extra/rabbitmq:3.10.18-focal-20230222154055 |
Mozilla Public License 2.0 |
rabbitmq-3.10.x-management |
mirantis.azurecr.io/openstack/extra/rabbitmq-management:3.10.18-focal-20230222154055 |
Mozilla Public License 2.0 |
amqproxy-0.8.x |
mirantis.azurecr.io/general/amqproxy:v0.8.3 |
MIT license |
kubernetes-entrypoint |
mirantis.azurecr.io/openstack/extra/kubernetes-entrypoint:v1.0.1-48d1e8a-20220919122849 |
Apache License 2.0 |
memcached |
mirantis.azurecr.io/general/memcached:1.6.17-alpine3.16 |
BSD 3-Clause “New” or “Revised” License |
ceph-config-helper |
mirantis.azurecr.io/openstack/extra/ceph-config-helper:pacific-focal-20230227123148 |
Apache License 2.0, LGPL-2.1 or LGPL-3 |
etcd |
mirantis.azurecr.io/openstack/extra/etcd:v3.5.4-alpine-20221116085516 |
Apache License 2.0 |
powerdns |
mirantis.azurecr.io/openstack/extra/powerdns:4.7-alpine-20230113154410 |
GPL-2.0 License |
nginx-ingress-controller |
mirantis.azurecr.io/openstack/extra/nginx-ingress-controller:1.3.1 |
Apache License 2.0 |
tls-proxy |
mirantis.azurecr.io/openstack/tls-proxy:focal-20220804082840 |
Mirantis Proprietary License |
defaultbackend |
mirantis.azurecr.io/openstack/extra/defaultbackend:v1.19.2-77af1ef-20220823043839 |
Apache License 2.0 |
mariadb |
mirantis.azurecr.io/general/mariadb:10.6.12-focal-20230227122722 |
GPLv2, LGPLv2.1 (client libraries) |
rabbitmq-exporter |
mirantis.azurecr.io/stacklight/rabbitmq-exporter:v1.0.0-RC8 |
MIT License |
memcached-exporter |
mirantis.azurecr.io/stacklight/memcached-exporter:v0.11.1 |
Apache License 2.0 |
prometheus-mysql-exporter |
mirantis.azurecr.io/stacklight/mysqld-exporter:v0.11.0 |
Apache License 2.0 |
xrally-openstack |
mirantis.azurecr.io/openstack/extra/xrally-openstack:2.2.0-20230228212732 |
Apache License 2.0 |
aodh |
mirantis.azurecr.io/openstack/aodh:victoria-focal-20230223184118 |
Apache License 2.0 |
ceilometer |
mirantis.azurecr.io/openstack/ceilometer:victoria-focal-20230223184118 |
Apache License 2.0 |
gnocchi |
mirantis.azurecr.io/openstack/gnocchi:victoria-focal-20230223184118 |
Apache License 2.0 |
redis |
mirantis.azurecr.io/openstack/extra/redis:7.0.5-alpine3.16 |
BSD 3-Clause “New” or “Revised” License |
frr |
mirantis.azurecr.io/general/external/docker.io/frrouting/frr:v8.3.1 |
GPL-2.0 and LGPL-2.1 |
strongswan |
mirantis.azurecr.io/openstack/extra/strongswan:alpine-5.9.5-20221028090933 |
GPL-2.0 |
rsyslog |
mirantis.azurecr.io/openstack/extra/rsyslog:v8.2001.0-20230227123149 |
GNU General Public License v3 |
descheduler |
mirantis.azurecr.io/openstack/extra/descheduler:v0.25.0-amd64-20220922181123 |
Apache License 2.0 |
nginx |
mirantis.azurecr.io/openstack/extra/nginx:1.23.3-alpine-slim |
Apache License 2.0 |
tgt |
mirantis.azurecr.io/general/tgt:1.0.x-focal-20230227123149 |
GPL-2.0 |
placement |
mirantis.azurecr.io/openstack/placement:victoria-focal-20230223184118 |
Apache License 2.0 |
stepler |
mirantis.azurecr.io/openstack/stepler:victoria-focal-20230227123149 |
Apache License 2.0 |
masakari |
mirantis.azurecr.io/openstack/masakari:victoria-focal-20230223184118 |
Apache License 2.0 |
masakari-monitors |
mirantis.azurecr.io/openstack/masakari-monitors:victoria-focal-20230223184118 |
Apache License 2.0 |
ironic-inspector |
mirantis.azurecr.io/openstack/ironic-inspector:victoria-focal-20230223184118 |
Apache License 2.0 |
panko |
mirantis.azurecr.io/openstack/panko:victoria-focal-20230223184118 |
Apache License 2.0 |
MOSK 23.1 OpenStack Helm charts
MOSK 23.1 Tungsten Fabric 21.4 artifacts
Component |
Path |
License information for main executable programs |
|---|---|---|
Helm charts |
||
Tungsten Fabric Operator |
https://binary.mirantis.com/tungsten/helm/tungstenfabric-operator-0.11.7.tgz |
Mirantis Proprietary License |
Docker images |
||
Tungsten Fabric Operator |
mirantis.azurecr.io/tungsten-operator/tungstenfabric-operator:0.11.7 |
Mirantis Proprietary License |
Analytics Alarm |
mirantis.azurecr.io/tungsten/contrail-analytics-alarm-gen:21.4.20230306000000 |
Apache License 2.0 |
Analytics |
mirantis.azurecr.io/tungsten/contrail-analytics-api:21.4.20230306000000 |
Apache License 2.0 |
mirantis.azurecr.io/tungsten/contrail-analytics-collector:21.4.20230306000000 |
Apache License 2.0 |
|
Analytics DB |
mirantis.azurecr.io/tungsten/contrail-analytics-query-engine:21.4.20230306000000 |
Apache License 2.0 |
Analytics SNMP |
mirantis.azurecr.io/tungsten/contrail-analytics-snmp-collector:21.4.20230306000000 |
Apache License 2.0 |
mirantis.azurecr.io/tungsten/contrail-analytics-snmp-topology:21.4.20230306000000 |
Apache License 2.0 |
|
Config |
mirantis.azurecr.io/tungsten/contrail-controller-config-api:21.4.20230306000000 |
Apache License 2.0 |
mirantis.azurecr.io/tungsten/contrail-controller-config-devicemgr:21.4.20230306000000 |
Apache License 2.0 |
|
mirantis.azurecr.io/tungsten/contrail-controller-config-dnsmasq:21.4.20230306000000 |
Apache License 2.0 |
|
mirantis.azurecr.io/tungsten/contrail-controller-config-schema:21.4.20230306000000 |
Apache License 2.0 |
|
mirantis.azurecr.io/tungsten/contrail-controller-config-svcmonitor:21.4.20230306000000 |
Apache License 2.0 |
|
Control |
mirantis.azurecr.io/tungsten/contrail-controller-control-control:21.4.20230306000000 |
Apache License 2.0 |
mirantis.azurecr.io/tungsten/contrail-controller-control-dns:21.4.20230306000000 |
Apache License 2.0 |
|
mirantis.azurecr.io/tungsten/contrail-controller-control-named:21.4.20230306000000 |
Apache License 2.0 |
|
Web UI |
mirantis.azurecr.io/tungsten/contrail-controller-webui-job:21.4.20230306000000 |
Apache License 2.0 |
mirantis.azurecr.io/tungsten/contrail-controller-webui-web:21.4.20230306000000 |
Apache License 2.0 |
|
Nodemanager |
mirantis.azurecr.io/tungsten/contrail-nodemgr:21.4.20230306000000 |
Apache License 2.0 |
TF Provisioner |
mirantis.azurecr.io/tungsten/contrail-provisioner:21.4.20230306000000 |
Apache License 2.0 |
vRouter |
mirantis.azurecr.io/tungsten/contrail-vrouter-agent:21.4.20230306000000 |
Apache License 2.0 |
mirantis.azurecr.io/tungsten/contrail-vrouter-agent-dpdk:21.4.20230306000000 |
Apache License 2.0 |
|
mirantis.azurecr.io/tungsten/contrail-node-init:21.4.20230306000000 |
Apache License 2.0 |
|
mirantis.azurecr.io/tungsten/contrail-vrouter-kernel-build-init:21.4.20230306000000 |
Apache License 2.0 |
|
Cassandra operator |
mirantis.azurecr.io/tungsten-operator/casskop:2.1.14 |
Apache License 2.0 |
Cassandra |
mirantis.azurecr.io/tungsten/cassandra-bootstrap:0.1.11 |
Apache License 2.0 |
mirantis.azurecr.io/tungsten/cassandra:3.11.10-20230126 |
Apache License 2.0 |
|
mirantis.azurecr.io/tungsten/instaclustr-icarus:v2-20220919122317 |
Apache License 2.0 |
|
mirantis.azurecr.io/tungsten/cass-config-builder:v2-20220919114133 |
Apache License 2.0 |
|
Kafka operator |
mirantis.azurecr.io/tungsten-operator/kafka-k8s-operator:0.3.1 |
Mirantis Proprietary License |
Kafka |
mirantis.azurecr.io/tungsten/cp-kafka:7.3.1 |
Apache License 2.0 |
mirantis.azurecr.io/stacklight/jmx-exporter:0.17.2-debian-11-r47 |
Apache License 2.0 |
|
Pause |
mirantis.azurecr.io/general/external/pause:3.1 |
Google Cloud Platform |
RabbitMQ operator |
mirantis.azurecr.io/tungsten-operator/rabbitmq-operator:0.3.1 |
Mirantis Proprietary License |
RabbitMQ |
mirantis.azurecr.io/general/rabbitmq:3.11.2 |
Mozilla Public License 2.0 |
mirantis.azurecr.io/stacklight/rabbitmq-exporter:v1.0.0-RC8 |
MIT License |
|
ZooKeeper operator |
mirantis.azurecr.io/tungsten-operator/zookeeper-operator:0.2.14 |
Apache License 2.0 |
ZooKeeper |
mirantis.azurecr.io/tungsten/zookeeper:3.7.1-20220914 |
Apache License 2.0 |
Redis operator |
mirantis.azurecr.io/tungsten-operator/redis-operator:0.3.6 |
Apache License 2.0 |
Redis |
mirantis.azurecr.io/tungsten/redis:7.0.5-alpine3.16 |
BSD 3-Clause “New” or “Revised” License |
mirantis.azurecr.io/stacklight/redis_exporter:v1.45.0 |
BSD 3-Clause “New” or “Revised” License |
|
TF Test |
mirantis.azurecr.io/tungsten/tungsten-pytest:0.1-20230306110548 |
MIT License |
TF CLI |
mirantis.azurecr.io/tungsten/tf-cli:0.1-20230223110354 |
MIT License |
TF NodeInfo |
mirantis.azurecr.io/tungsten/tf-nodeinfo:0.1-20221109111149 |
MIT License |
TF Tools |
mirantis.azurecr.io/tungsten/contrail-tools:21.4.20230306000000 |
Apache License 2.0 |
kubernetes-entrypoint |
mirantis.azurecr.io/openstack/extra/kubernetes-entrypoint:v1.0.1-48d1e8a-20220919122849 |
Apache License 2.0 |
pause |
mirantis.azurecr.io/general/external/pause:3.1 |
Apache License 2.0 |
MOSK 23.1 StackLight artifacts
Component |
Path |
License information for main executable programs |
|---|---|---|
Docker images |
||
prometheus-libvirt-exporter |
mirantis.azurecr.io/stacklight/prometheus-libvirt-exporter:v0.2-20230203125533 |
Mirantis Proprietary License |
prometheus-tungstenfabric-exporter |
mirantis.azurecr.io/stacklight/tungstenfabric-prometheus-exporter:0.1-20221226123816 |
Mirantis Proprietary License |
Helm charts |
||
prometheus-libvirt-exporter |
https://binary.mirantis.com/stacklight/helm/prometheus-libvirt-exporter-0.2.0-mcp-1.tgz |
Mirantis Proprietary License |
prometheus-tungstenfabric-exporter |
https://binary.mirantis.com/stacklight/helm/prometheus-tungstenfabric-exporter-0.2.0-mcp-3.tgz |
Mirantis Proprietary License |
The following issues have been addressed in the MOSK 23.1 release:
[OpenStack] [30450] Fixed the issue causing high CPU load of MariaDB.
[OpenStack] [29501] Fixed the issue when Cinder periodic database cleanup resets the state of volumes.
[OpenStack] [27168] Fixed the issue that made
openvswitch-openvswitch-vswitchd-defaultandneutron-ovs-agent-defaultpods stuck in theNotReadystatus after restart.[OpenStack] [29539] Fixed the issue with missing network traffic for a trunked port in OpenStack Yoga.
[OpenStack] [Yoga] [24067] Fixed the issue with inability to set up a secondary DNS zone in OpenStack Yoga.
Note
The issue still affects OpenStack Victoria.
[TF] [10096] Fixed the issue that prevented
tf-controlfrom refreshing IP addresses of Cassandra pods.[TF] [28728] Fixed the issue when
tungstenFabricMonitoring.enabledwas not enabled by default during Tungsten Fabric deployment.[TF] [30449] Fixed the issue that resulted in losing connectivity after the primary TF Controller node reboot.
[Ceph] [28142] Added the ability to specify node affinity for
rook-discoverpods through theceph-operatorHelm release.[Ceph] [26820] Fixed the issue when the
statussection in theKaaSCephCluster.statuscustom resource did not reflect issues during the process of a Ceph cluster deletion.[StackLight] [28372] Fixed the issue causing false-positive liveness probe failures for
fluentd-notifications.[StackLight] [29330] Fixed the issue that prevented
tf-rabbitmqfrom being monitored.[Updates] [29438] Fixed the issue that caused the cluster update being stuck during the Tungsten Fabric Operator update.
This section describes the specific actions you as a Cloud Operator need to complete to accurately plan and successfully perform your Mirantis OpenStack for Kubernetes (MOSK) cluster update to the version 23.1. Consider this information as a supplement to the generic update procedure published in Operations Guide: Update a MOSK cluster.
The MOSK cluster will obtain the newly implemented capabilities automatically with no significant impact on the update procedure.
As part of the update to MOSK 23.1, Tungsten Fabric will automatically get updated from version 2011 to version 21.4.
Note
For the compatibility matrix of the most recent MOSK releases and their major components in conjunction with Container Cloud and Cluster releases, refer to Compatibility Matrix.
The update to MOSK 23.1 does not include any version-specific impact on the cluster. To start planning a maintenance window, use the Operations Guide: Update a MOSK cluster standard procedure.
Before updating the cluster, be sure to review the potential issues that may arise during the process and the recommended solutions to address them, as outlined in Cluster update known issues.
If your Container Cloud management cluster has updated to 2.24.1, to avoid
the issue with waiting for the lcm-agent to update
the currentDistribution field during the cluster update to
MOSK 23.1, replace the baremetal-provider image
1.37.15 tag with 1.37.18:
Open the
kaasreleaseobject for editing:kubectl edit kaasrelease kaas-2-24-1
Replace the
1.37.15tag with1.37.18for thebaremetal-providerimage:- chartURL: core/helm/baremetal-provider-1.37.15.tgz helmV3: true name: baremetal-provider namespace: kaas values: cluster_api_provider_baremetal: image: tag: 1.37.18
MOSK 23.1 introduces a new default value for the
OIDCClaimDelimiter parameter, which defines the delimiter to use when
setting multi-valued claims in the HTTP headers. See the MOSK 23.1 OpenStack
API Reference
for details.
Previously, the value of the OIDCClaimDelimiter parameter defaulted to
",". This value misaligned with the behavior expected by Keystone.
As a result, when creating federation mappings for Keystone, the cloud operator
was forced to write more complex rules. Therefore, in MOSK
22.4, Mirantis announced the change of the default value for the
OIDCClaimDelimiter parameter.
If your deployment is affected and you have not explicitly defined the
OIDCClaimDelimiter parameter, as Mirantis advised, after update to
MOSK 22.4 or 22.5, now would be a good time to do it.
Otherwise, you may encounter unforeseen consequences after the update to
MOSK 23.1.
Affected deployments
Proceed with the instruction below only if the following conditions are true:
Keystone is set to use federation through the OpenID Connect protocol, with Mirantis Container Cloud Keycloak in particular. The following configuration is present in your
OpenStackDeploymentcustom resource:kind: OpenStackDeployment spec: features: keystone: keycloak: enabled: true
No value has already been specified for the
OIDCClaimDelimiterparameter in yourOpenStackDeploymentcustom resource.
To facilitate smooth transition of the existing deployments to the new default
value, explicitly define the OIDCClaimDelimiter parameter as follows:
kind: OpenStackDeployment
spec:
features:
keystone:
keycloak:
oidc:
OIDCClaimDelimiter: ","
Note
The new default value for the OIDCClaimDelimiter parameter
is ";". To find out whether your Keystone mappings will need
adjustment after changing the default value, set the parameter to
";" on your staging environment and verify the rules.
Verify that the KaaSCephCluster custom resource does not contain the
following entries. If they exist, remove them.
In the
spec.cephClusterSpecsection, theexternalsection.Caution
If the
externalsection exists in theKaaSCephClusterspec during upgrade to MOSK 23.1, it will cause Ceph outage that leads to corruption of the Cinder volumes file system and requires a lot of routine work to fix sectors with Cinder volumes one-by-one after fixing Ceph outage.Therefore, make sure that the
externalsection is removed from theKaaSCephClusterspec right before starting cluster upgrade.In the
spec.cephClusterSpec.rookConfigsection, thems_crc_dataorms crc dataconfiguration key. After you remove the key, wait forrook-ceph-monpods to restart on the MOSK cluster.Caution
If the
ms_crc_datakey exists in therookConfigsection ofKaaSCephClusterduring upgrade to MOSK 23.1, it causes missing connection between Rook Operator and Ceph Monitors during Ceph version upgrade leading to a stuck upgrade and requires that you manually disable thems_crc_datakey for all Ceph Monitors.Therefore, make sure that the
ms_crc_datakey is removed from theKaaSCephClusterspec right before starting cluster upgrade.
To prevent issues during graceful reboot of the OpenStack controller nodes,
temporarily remove Tempest from the OpenStackDeployment object:
spec:
features:
services:
- tempest
The OpenStackDeploymentSecret custom resource has been deprecated in
MOSK 23.1. The fields that store confidential settings
in OpenStackDeploymentSecret and OpenStackDeployment custom resources
need to be migrated to the Kubernetes secrets.
The full list of the affected fields include:
spec:
features:
ssl:
public_endpoints:
- ca_cert
- api_cert
- api_key
barbican:
backends:
vault:
- approle_role_id
- approle_secret_id
- ssl_ca_crt_file
baremetal:
ngs:
hardware:
*:
- username
- password
- ssh_private_key
- secret
keystone:
domain_specific_configuration:
...
ks_domains:
*:
config:
...
ldap:
...
password: <password>
user: <user-name>
After the update, migrate the fields mentioned above from
OpenStackDeployment and OpenStackDeploymentSecret custom resources:
Create a Kubernetes secret
<osdpl-name>-hiddenin theopenstacknamespace either using the helper script or manually:Use the
osctl-move-sensitive-datahelper script from theopenstack-controllerpod:osctl-move-sensitive-data osh-dev --secret-name osh-dev-hidden
Create the Kubernetes secret and add content of required fields to the
OpenStackDeploymentcustom resource. For example:apiVersion: v1 kind: Secret metadata: name: osh-dev-hidden namespace: openstack labels: openstack.lcm.mirantis.com/osdpl_secret: 'true' type: Opaque data: ca_cert: ... api_cert: ... api_key: ...
Add a reference from appropriate fields in the
OpenStackDeploymentobject. For example:spec: features: ssl: public_endpoints: api_cert: value_from: secret_key_ref: key: api_cert name: osh-dev-hidden api_key: value_from: secret_key_ref: key: api_key name: osh-dev-hidden ca_cert: value_from: secret_key_ref: key: ca_cert name: osh-dev-hidden
If you used to store your sensitive information in the
OpenStackDeploymentSecretobject, remove it from your cluster configuration.
To ensure stability for production workloads, MOSK 23.1
changes the default value of RAM oversubscription on compute nodes to 1.0,
which is no oversubscription. In MOSK 22.5 and earlier,
the effective default value of RAM allocation ratio is 1.1.
This change will be applied only to the compute nodes added to the cloud after update to MOSK 23.1. The effective RAM oversubscription value for existing compute nodes will not automatically change after updating to MOSK 23.1.
Therefore, Mirantis strongly recommends adjusting the oversubscription values to new defaults for existing compute nodes as well. For the procedure, refer to Change oversubscription settings for existing compute nodes.
Since MOSK 23.1, the Compute service (OpenStack Nova) enables you to control the resource oversubscription dynamically through the placement API.
However, if your cloud already makes use of custom allocation ratios, the new
functionality will not become immediately available after update. Any compute
node configured with explicit values for the cpu_allocation_ratio,
disk_allocation_ratio, and ram_allocation_ratio configuration options
will continue to enforce those values in the placement service. Therefore, any
changes made through the placement API will be overridden by the values set in
those configuration options in the Compute service. To modify oversubscription,
you should adjust the values of these configuration options in the
OpenStackDeployment custom resource. This procedure should be performed
with caution as modifying these values may result in compute service restarts
and potential disruptions in the instance builds.
To enable the use of the new functionality, Mirantis recommends removing
explicit values for the cpu_allocation_ratio, disk_allocation_ratio,
and ram_allocation_ratio options from the OpenStackDeployment custom
resource. Instead, use the new configuration options as described in
Configuring initial resource oversubscription. Also, keep in mind that
the changes will only impact newly added compute nodes and will not be applied
to the existing ones.
The table below contains the number of vendor-specific addressed CVEs with Critical or High severity.
In total, in the MOSK 23.1 release, 432 CVEs have been fixed and 85 artifacts (images) updated.
Fixed CVE ID |
# of updated artifacts |
|---|---|
ALAS2-2022-1877 |
2 |
ALAS2-2022-1885 |
2 |
ALAS2-2022-1902 |
4 |
ALAS2-2023-1904 |
1 |
ALAS2-2023-1908 |
2 |
ALAS2-2023-1911 |
2 |
ALAS2-2023-1915 |
2 |
ALAS2-2023-1958 |
2 |
CVE-2014-10064 |
4 |
CVE-2015-8315 |
2 |
CVE-2015-8851 |
2 |
CVE-2016-10539 |
2 |
CVE-2016-10540 |
8 |
CVE-2016-1252 |
1 |
CVE-2016-2515 |
2 |
CVE-2016-2537 |
4 |
CVE-2016-6313 |
2 |
CVE-2017-15010 |
4 |
CVE-2017-16042 |
2 |
CVE-2017-16119 |
2 |
CVE-2017-16138 |
8 |
CVE-2017-18077 |
4 |
CVE-2017-20165 |
8 |
CVE-2017-9445 |
1 |
CVE-2018-1000001 |
1 |
CVE-2018-1000620 |
4 |
CVE-2018-16492 |
4 |
CVE-2018-16864 |
1 |
CVE-2018-16865 |
1 |
CVE-2018-20834 |
2 |
CVE-2018-3728 |
4 |
CVE-2018-3737 |
4 |
CVE-2018-7408 |
2 |
CVE-2019-10744 |
4 |
CVE-2019-13173 |
4 |
CVE-2019-16776 |
2 |
CVE-2019-19919 |
2 |
CVE-2019-20920 |
2 |
CVE-2019-20922 |
2 |
CVE-2019-25013 |
9 |
CVE-2019-3462 |
1 |
CVE-2020-10684 |
1 |
CVE-2020-1737 |
1 |
CVE-2020-1971 |
1 |
CVE-2020-26301 |
2 |
CVE-2020-7754 |
2 |
CVE-2020-7774 |
2 |
CVE-2020-7788 |
2 |
CVE-2020-8203 |
6 |
CVE-2021-23337 |
6 |
CVE-2021-23358 |
4 |
CVE-2021-23369 |
4 |
CVE-2021-23383 |
4 |
CVE-2021-23807 |
4 |
CVE-2021-33574 |
69 |
CVE-2021-3711 |
2 |
CVE-2021-3918 |
4 |
CVE-2021-44906 |
7 |
CVE-2022-0144 |
3 |
CVE-2022-0686 |
1 |
CVE-2022-0691 |
1 |
CVE-2022-0778 |
5 |
CVE-2022-1292 |
5 |
CVE-2022-1664 |
6 |
CVE-2022-1941 |
8 |
CVE-2022-2068 |
6 |
CVE-2022-23218 |
6 |
CVE-2022-23219 |
6 |
CVE-2022-24407 |
3 |
CVE-2022-24785 |
2 |
CVE-2022-27404 |
2 |
CVE-2022-29155 |
5 |
CVE-2022-29167 |
4 |
CVE-2022-29217 |
2 |
CVE-2022-31129 |
3 |
CVE-2022-3515 |
2 |
CVE-2022-37599 |
1 |
CVE-2022-37601 |
1 |
CVE-2022-37603 |
1 |
CVE-2022-39379 |
1 |
CVE-2022-40023 |
19 |
CVE-2022-40899 |
10 |
RHSA-2019:0997 |
2 |
RHSA-2019:1145 |
1 |
RHSA-2019:1619 |
1 |
RHSA-2019:1714 |
1 |
RHSA-2019:2692 |
1 |
RHSA-2019:4114 |
5 |
RHSA-2020:0271 |
1 |
RHSA-2020:0273 |
1 |
RHSA-2020:0575 |
4 |
RHSA-2020:0902 |
1 |
RHSA-2020:2338 |
1 |
RHSA-2020:2344 |
3 |
RHSA-2020:2637 |
1 |
RHSA-2020:2755 |
1 |
RHSA-2020:2894 |
2 |
RHSA-2020:3014 |
5 |
RHSA-2020:3658 |
1 |
RHSA-2020:5476 |
1 |
RHSA-2020:5566 |
1 |
RHSA-2021:0670 |
1 |
RHSA-2021:0671 |
3 |
RHSA-2021:1024 |
1 |
RHSA-2021:1206 |
2 |
RHSA-2021:1469 |
3 |
RHSA-2021:1989 |
1 |
RHSA-2021:2147 |
1 |
RHSA-2021:2170 |
1 |
RHSA-2021:2359 |
3 |
RHSA-2021:2717 |
8 |
RHSA-2021:4903 |
5 |
RHSA-2021:4904 |
3 |
RHSA-2021:5082 |
8 |
RHSA-2022:0332 |
8 |
RHSA-2022:0666 |
1 |
RHSA-2022:1066 |
1 |
RHSA-2022:1069 |
1 |
RHSA-2022:2191 |
1 |
RHSA-2022:2213 |
1 |
RHSA-2022:4799 |
2 |
RHSA-2022:5052 |
2 |
RHSA-2022:5056 |
2 |
RHSA-2022:6160 |
2 |
RHSA-2022:6170 |
1 |
RHSA-2022:6765 |
3 |
RHSA-2022:6778 |
3 |
RHSA-2022:6834 |
2 |
RHSA-2022:7186 |
24 |
RHSA-2022:8492 |
5 |
RHSA-2022:8640 |
32 |
RHSA-2023:0101 |
1 |
RHSA-2023:0284 |
2 |
RHSA-2023:0379 |
2 |
RHSA-2023:0610 |
4 |
RHSA-2023:0838 |
8 |
RHSA-2023:1252 |
5 |
The full list of the CVEs present in the current MOSK release is available at the Mirantis Security Portal.
23.1.1 patch
The patch release notes contain the list of artifacts and Common Vulnerabilities and Exposures (CVE) fixes for the MOSK 23.1.1 patch released on April 20, 2023.
This section lists the components artifacts of the MOSK 23.1.1 patch release that includes binaries, Docker images, and Helm charts.
MOSK 23.1.1 OpenStack Victoria binaries and Docker images
Component |
Path |
License information for main executable programs |
|---|---|---|
Binaries |
||
octavia-amphora |
https://binary.mirantis.com/openstack/bin/octavia/amphora-x64-haproxy-victoria-20230223191854.qcow2 |
Mirantis Proprietary License |
mirantis |
https://binary.mirantis.com/openstack/bin/horizon/mirantis-victoria-8f71802-20210119120707.tar.gz |
Mirantis Proprietary License |
kernel |
GPL-2.0 |
|
initramfs |
https://binary.mirantis.com/openstack/bin/ironic/tinyipa/tinyipa-stable-victoria-20230128063511.gz |
GPL-2.0 |
service-image |
https://binary.mirantis.com/openstack/bin/manila/manila-service-image-20221228132450.qcow2 |
Mirantis Proprietary License |
Docker images |
||
keystone |
mirantis.azurecr.io/openstack/keystone:victoria-focal-20230403060017 |
Apache License 2.0 |
heat |
mirantis.azurecr.io/openstack/heat:victoria-focal-20230403060017 |
Apache License 2.0 |
glance |
mirantis.azurecr.io/openstack/glance:victoria-focal-20230403060017 |
Apache License 2.0 |
cinder |
mirantis.azurecr.io/openstack/cinder:victoria-focal-20230403060017 |
Apache License 2.0 |
neutron |
mirantis.azurecr.io/openstack/neutron:victoria-focal-20230403060017 |
Apache License 2.0 |
nova |
mirantis.azurecr.io/openstack/nova:victoria-focal-20230403060017 |
Apache License 2.0 |
horizon |
mirantis.azurecr.io/openstack/horizon:victoria-focal-20230403060017 |
Apache License 2.0 |
tempest |
mirantis.azurecr.io/openstack/tempest:victoria-focal-20230403060017 |
Apache License 2.0 |
octavia |
mirantis.azurecr.io/openstack/octavia:victoria-focal-20230403060017 |
Apache License 2.0 |
designate |
mirantis.azurecr.io/openstack/designate:victoria-focal-20230403060017 |
Apache License 2.0 |
ironic |
mirantis.azurecr.io/openstack/ironic:victoria-focal-20230403060017 |
Apache License 2.0 |
barbican |
mirantis.azurecr.io/openstack/barbican:victoria-focal-20230403060017 |
Apache License 2.0 |
libvirt |
mirantis.azurecr.io/general/libvirt:6.0.0-focal-20230323105551 |
LGPL-2.1 License |
pause |
mirantis.azurecr.io/general/external/pause:3.1 |
Apache License 2.0 |
openvswitch |
mirantis.azurecr.io/general/openvswitch:2.13-focal-20230227123148 |
Apache License 2.0 |
openvswitch-dpdk |
mirantis.azurecr.io/general/openvswitch-dpdk:2.13-focal-20230227123149 |
Apache License 2.0 |
openstack-tools |
mirantis.azurecr.io/openstack/openstack-tools:yoga-focal-20230403060017 |
Apache License 2.0 |
rabbitmq-3.10.x |
mirantis.azurecr.io/openstack/extra/rabbitmq:3.10.18-focal-20230222154055 |
Mozilla Public License 2.0 |
rabbitmq-3.10.x-management |
mirantis.azurecr.io/openstack/extra/rabbitmq-management:3.10.18-focal-20230222154055 |
Mozilla Public License 2.0 |
amqproxy-0.8.x |
mirantis.azurecr.io/general/amqproxy:v0.8.3 |
MIT license |
kubernetes-entrypoint |
mirantis.azurecr.io/openstack/extra/kubernetes-entrypoint:v1.0.1-de7c287-20230321181457 |
Apache License 2.0 |
memcached |
mirantis.azurecr.io/general/memcached:1.6.19-alpine3.17.3 |
BSD 3-Clause “New” or “Revised” License |
ceph-config-helper |
mirantis.azurecr.io/openstack/extra/ceph-config-helper:pacific-focal-20230323105551 |
Apache License 2.0, LGPL-2.1 or LGPL-3 |
etcd |
mirantis.azurecr.io/openstack/extra/etcd:v3.5.7-alpine-20230331115754 |
Apache License 2.0 |
powerdns |
mirantis.azurecr.io/openstack/extra/powerdns:4.7-alpine-20230324153219 |
GPL-2.0 License |
nginx-ingress-controller |
mirantis.azurecr.io/openstack/extra/nginx-ingress-controller:1.3.1-alpine-20230331115133 |
Apache License 2.0 |
tls-proxy |
mirantis.azurecr.io/openstack/tls-proxy:focal-20220804082840 |
Mirantis Proprietary License |
defaultbackend |
mirantis.azurecr.io/openstack/extra/defaultbackend:v1.19.2-77af1ef-20220823043839 |
Apache License 2.0 |
mariadb |
mirantis.azurecr.io/general/mariadb:10.6.12-focal-20230331112513 |
GPLv2, LGPLv2.1 (client libraries) |
rabbitmq-exporter |
mirantis.azurecr.io/stacklight/rabbitmq-exporter:1.0.0-RC19 |
MIT License |
memcached-exporter |
mirantis.azurecr.io/stacklight/memcached-exporter:v0.11.1 |
Apache License 2.0 |
prometheus-mysql-exporter |
mirantis.azurecr.io/stacklight/mysqld-exporter:v0.11.0 |
Apache License 2.0 |
xrally-openstack |
mirantis.azurecr.io/openstack/extra/xrally-openstack:2.2.0-20230328221837 |
Apache License 2.0 |
aodh |
mirantis.azurecr.io/openstack/aodh:victoria-focal-20230403060017 |
Apache License 2.0 |
ceilometer |
mirantis.azurecr.io/openstack/ceilometer:victoria-focal-20230403060017 |
Apache License 2.0 |
gnocchi |
mirantis.azurecr.io/openstack/gnocchi:victoria-focal-20230403060017 |
Apache License 2.0 |
redis |
mirantis.azurecr.io/openstack/extra/redis:7.0.10-alpine3.17 |
BSD 3-Clause “New” or “Revised” License |
frr |
mirantis.azurecr.io/general/external/docker.io/frrouting/frr:v8.5.0 |
GPL-2.0 and LGPL-2.1 |
strongswan |
mirantis.azurecr.io/openstack/extra/strongswan:alpine-5.9.5-20230331105620 |
GPL-2.0 |
rsyslog |
mirantis.azurecr.io/openstack/extra/rsyslog:v8.2001.0-20230323105551 |
GNU General Public License v3 |
descheduler |
mirantis.azurecr.io/openstack/extra/descheduler:v0.26.0 |
Apache License 2.0 |
nginx |
mirantis.azurecr.io/openstack/extra/nginx:1.23.4-alpine-slim |
Apache License 2.0 |
tgt |
mirantis.azurecr.io/general/tgt:1.0.x-focal-20230323105551 |
GPL-2.0 |
requirements |
mirantis.azurecr.io/openstack/requirements:victoria-focal-20230403060017 |
Apache License 2.0 |
placement |
mirantis.azurecr.io/openstack/placement:victoria-focal-20230403060017 |
Apache License 2.0 |
stepler |
mirantis.azurecr.io/openstack/stepler:victoria-focal-20230324131216 |
Apache License 2.0 |
masakari |
mirantis.azurecr.io/openstack/masakari:victoria-focal-20230403060017 |
Apache License 2.0 |
masakari-monitors |
mirantis.azurecr.io/openstack/masakari-monitors:victoria-focal-20230403060017 |
Apache License 2.0 |
ironic-inspector |
mirantis.azurecr.io/openstack/ironic-inspector:victoria-focal-20230403060017 |
Apache License 2.0 |
panko |
mirantis.azurecr.io/openstack/panko:victoria-focal-20230403060017 |
Apache License 2.0 |
MOSK 23.1.1 OpenStack Yoga binaries and Docker images
Component |
Path |
License information for main executable programs |
|---|---|---|
Binaries |
||
octavia-amphora |
https://binary.mirantis.com/openstack/bin/octavia/amphora-x64-haproxy-yoga-20230227101732.qcow2 |
Mirantis Proprietary License |
mirantis |
https://binary.mirantis.com/openstack/bin/horizon/mirantis-xena-9f691e3-20220110111511.tar.gz |
Mirantis Proprietary License |
kernel |
https://binary.mirantis.com/openstack/bin/ironic/tinyipa/tinyipa-stable-yoga-20230128061113.vmlinuz |
GPL-2.0 |
initramfs |
https://binary.mirantis.com/openstack/bin/ironic/tinyipa/tinyipa-stable-yoga-20230128061113.gz |
GPL-2.0 |
service-image |
https://binary.mirantis.com/openstack/bin/manila/manila-service-image-20221228132450.qcow2 |
Mirantis Proprietary License |
Docker images |
||
keystone |
mirantis.azurecr.io/openstack/keystone:yoga-focal-20230403060017 |
Apache License 2.0 |
heat |
mirantis.azurecr.io/openstack/heat:yoga-focal-20230403060017 |
Apache License 2.0 |
glance |
mirantis.azurecr.io/openstack/glance:yoga-focal-20230403060017 |
Apache License 2.0 |
cinder |
mirantis.azurecr.io/openstack/cinder:yoga-focal-20230403060017 |
Apache License 2.0 |
neutron |
mirantis.azurecr.io/openstack/neutron:yoga-focal-20230403060017 |
Apache License 2.0 |
nova |
mirantis.azurecr.io/openstack/nova:yoga-focal-20230403060017 |
Apache License 2.0 |
horizon |
mirantis.azurecr.io/openstack/horizon:yoga-focal-20230403060017 |
Apache License 2.0 |
tempest |
mirantis.azurecr.io/openstack/tempest:yoga-focal-20230403060017 |
Apache License 2.0 |
octavia |
mirantis.azurecr.io/openstack/octavia:yoga-focal-20230403060017 |
Apache License 2.0 |
designate |
mirantis.azurecr.io/openstack/designate:yoga-focal-20230403060017 |
Apache License 2.0 |
ironic |
mirantis.azurecr.io/openstack/ironic:yoga-focal-20230403060017 |
Apache License 2.0 |
barbican |
mirantis.azurecr.io/openstack/barbican:yoga-focal-20230403060017 |
Apache License 2.0 |
libvirt |
mirantis.azurecr.io/general/libvirt:6.0.0-focal-20230323105551 |
LGPL-2.1 License |
pause |
mirantis.azurecr.io/general/external/pause:3.1 |
Apache License 2.0 |
openvswitch |
mirantis.azurecr.io/general/openvswitch:2.13-focal-20230227123148 |
Apache License 2.0 |
openvswitch-dpdk |
mirantis.azurecr.io/general/openvswitch-dpdk:2.13-focal-20230227123149 |
Apache License 2.0 |
openstack-tools |
mirantis.azurecr.io/openstack/openstack-tools:yoga-focal-20230403060017 |
Apache License 2.0 |
rabbitmq-3.10.x |
mirantis.azurecr.io/openstack/extra/rabbitmq:3.10.18-focal-20230222154055 |
Mozilla Public License 2.0 |
rabbitmq-3.10.x-management |
mirantis.azurecr.io/openstack/extra/rabbitmq-management:3.10.18-focal-20230222154055 |
Mozilla Public License 2.0 |
amqproxy-0.8.x |
mirantis.azurecr.io/general/amqproxy:v0.8.3 |
MIT license |
kubernetes-entrypoint |
mirantis.azurecr.io/openstack/extra/kubernetes-entrypoint:v1.0.1-de7c287-20230321181457 |
Apache License 2.0 |
memcached |
mirantis.azurecr.io/general/memcached:1.6.19-alpine3.17.3 |
BSD 3-Clause “New” or “Revised” License |
ceph-config-helper |
mirantis.azurecr.io/openstack/extra/ceph-config-helper:pacific-focal-20230323105551 |
Apache License 2.0, LGPL-2.1 or LGPL-3 |
etcd |
mirantis.azurecr.io/openstack/extra/etcd:v3.5.7-alpine-20230331115754 |
Apache License 2.0 |
powerdns |
mirantis.azurecr.io/openstack/extra/powerdns:4.7-alpine-20230324153219 |
GPL-2.0 License |
nginx-ingress-controller |
mirantis.azurecr.io/openstack/extra/nginx-ingress-controller:1.3.1-alpine-20230331115133 |
Apache License 2.0 |
tls-proxy |
mirantis.azurecr.io/openstack/tls-proxy:focal-20220804082840 |
Mirantis Proprietary License |
defaultbackend |
mirantis.azurecr.io/openstack/extra/defaultbackend:v1.19.2-77af1ef-20220823043839 |
Apache License 2.0 |
mariadb |
mirantis.azurecr.io/general/mariadb:10.6.12-focal-20230331112513 |
GPLv2, LGPLv2.1 (client libraries) |
rabbitmq-exporter |
mirantis.azurecr.io/stacklight/rabbitmq-exporter:1.0.0-RC19 |
MIT License |
memcached-exporter |
mirantis.azurecr.io/stacklight/memcached-exporter:v0.11.1 |
Apache License 2.0 |
prometheus-mysql-exporter |
mirantis.azurecr.io/stacklight/mysqld-exporter:v0.11.0 |
Apache License 2.0 |
xrally-openstack |
mirantis.azurecr.io/openstack/extra/xrally-openstack:2.2.0-20230328221837 |
Apache License 2.0 |
aodh |
mirantis.azurecr.io/openstack/aodh:yoga-focal-20230403060017 |
Apache License 2.0 |
ceilometer |
mirantis.azurecr.io/openstack/ceilometer:yoga-focal-20230403060017 |
Apache License 2.0 |
gnocchi |
mirantis.azurecr.io/openstack/gnocchi:yoga-focal-20230403060017 |
Apache License 2.0 |
redis |
mirantis.azurecr.io/openstack/extra/redis:7.0.10-alpine3.17 |
BSD 3-Clause “New” or “Revised” License |
frr |
mirantis.azurecr.io/general/external/docker.io/frrouting/frr:v8.5.0 |
GPL-2.0 and LGPL-2.1 |
strongswan |
mirantis.azurecr.io/openstack/extra/strongswan:alpine-5.9.5-20230331105620 |
GPL-2.0 |
rsyslog |
mirantis.azurecr.io/openstack/extra/rsyslog:v8.2001.0-20230323105551 |
GNU General Public License v3 |
descheduler |
mirantis.azurecr.io/openstack/extra/descheduler:v0.26.0 |
Apache License 2.0 |
nginx |
mirantis.azurecr.io/openstack/extra/nginx:1.23.4-alpine-slim |
Apache License 2.0 |
tgt |
mirantis.azurecr.io/general/tgt:1.0.x-focal-20230323105551 |
GPL-2.0 |
requirements |
mirantis.azurecr.io/openstack/requirements:yoga-focal-20230403060017 |
Apache License 2.0 |
stepler |
mirantis.azurecr.io/openstack/stepler:yoga-focal-20230329122808 |
Apache License 2.0 |
placement |
mirantis.azurecr.io/openstack/placement:yoga-focal-20230403060017 |
Apache License 2.0 |
masakari |
mirantis.azurecr.io/openstack/masakari:yoga-focal-20230403060017 |
Apache License 2.0 |
masakari-monitors |
mirantis.azurecr.io/openstack/masakari-monitors:yoga-focal-20230403060017 |
Apache License 2.0 |
ironic-inspector |
mirantis.azurecr.io/openstack/ironic-inspector:yoga-focal-20230403060017 |
Apache License 2.0 |
manila |
mirantis.azurecr.io/openstack/manila:yoga-focal-20230403060017 |
Apache License 2.0 |
MOSK 23.1.1 OpenStack Helm charts
MOSK 23.1.1 Tungsten Fabric 21.4 artifacts
Component |
Path |
License information for main executable programs |
|---|---|---|
Helm charts |
||
Tungsten Fabric Operator |
https://binary.mirantis.com/tungsten/helm/tungstenfabric-operator-0.11.8.tgz |
Mirantis Proprietary License |
Docker images |
||
Tungsten Fabric Operator |
mirantis.azurecr.io/tungsten-operator/tungstenfabric-operator:0.11.8 |
Mirantis Proprietary License |
Analytics Alarm |
mirantis.azurecr.io/tungsten/contrail-analytics-alarm-gen:21.4.20230306000000 |
Apache License 2.0 |
Analytics |
mirantis.azurecr.io/tungsten/contrail-analytics-api:21.4.20230306000000 |
Apache License 2.0 |
mirantis.azurecr.io/tungsten/contrail-analytics-collector:21.4.20230306000000 |
Apache License 2.0 |
|
Analytics DB |
mirantis.azurecr.io/tungsten/contrail-analytics-query-engine:21.4.20230306000000 |
Apache License 2.0 |
Analytics SNMP |
mirantis.azurecr.io/tungsten/contrail-analytics-snmp-collector:21.4.20230306000000 |
Apache License 2.0 |
mirantis.azurecr.io/tungsten/contrail-analytics-snmp-topology:21.4.20230306000000 |
Apache License 2.0 |
|
Config |
mirantis.azurecr.io/tungsten/contrail-controller-config-api:21.4.20230306000000 |
Apache License 2.0 |
mirantis.azurecr.io/tungsten/contrail-controller-config-devicemgr:21.4.20230306000000 |
Apache License 2.0 |
|
mirantis.azurecr.io/tungsten/contrail-controller-config-dnsmasq:21.4.20230306000000 |
Apache License 2.0 |
|
mirantis.azurecr.io/tungsten/contrail-controller-config-schema:21.4.20230306000000 |
Apache License 2.0 |
|
mirantis.azurecr.io/tungsten/contrail-controller-config-svcmonitor:21.4.20230306000000 |
Apache License 2.0 |
|
Control |
mirantis.azurecr.io/tungsten/contrail-controller-control-control:21.4.20230306000000 |
Apache License 2.0 |
mirantis.azurecr.io/tungsten/contrail-controller-control-dns:21.4.20230306000000 |
Apache License 2.0 |
|
mirantis.azurecr.io/tungsten/contrail-controller-control-named:21.4.20230306000000 |
Apache License 2.0 |
|
Web UI |
mirantis.azurecr.io/tungsten/contrail-controller-webui-job:21.4.20230306000000 |
Apache License 2.0 |
mirantis.azurecr.io/tungsten/contrail-controller-webui-web:21.4.20230306000000 |
Apache License 2.0 |
|
Nodemanager |
mirantis.azurecr.io/tungsten/contrail-nodemgr:21.4.20230306000000 |
Apache License 2.0 |
TF Provisioner |
mirantis.azurecr.io/tungsten/contrail-provisioner:21.4.20230306000000 |
Apache License 2.0 |
vRouter |
mirantis.azurecr.io/tungsten/contrail-vrouter-agent:21.4.20230306000000 |
Apache License 2.0 |
mirantis.azurecr.io/tungsten/contrail-vrouter-agent-dpdk:21.4.20230306000000 |
Apache License 2.0 |
|
mirantis.azurecr.io/tungsten/contrail-node-init:21.4.20230306000000 |
Apache License 2.0 |
|
mirantis.azurecr.io/tungsten/contrail-vrouter-kernel-build-init:21.4.20230306000000 |
Apache License 2.0 |
|
Cassandra operator |
mirantis.azurecr.io/tungsten-operator/casskop:2.1.15 |
Apache License 2.0 |
Cassandra |
mirantis.azurecr.io/tungsten/cassandra-bootstrap:0.1.11 |
Apache License 2.0 |
mirantis.azurecr.io/tungsten/cassandra:3.11.10-20230126 |
Apache License 2.0 |
|
mirantis.azurecr.io/tungsten/instaclustr-icarus:v2-20230328121138 |
Apache License 2.0 |
|
mirantis.azurecr.io/tungsten/cass-config-builder:v2-20230328121021 |
Apache License 2.0 |
|
Kafka operator |
mirantis.azurecr.io/tungsten-operator/kafka-k8s-operator:0.3.2 |
Mirantis Proprietary License |
Kafka |
mirantis.azurecr.io/tungsten/cp-kafka:7.3.1 |
Apache License 2.0 |
mirantis.azurecr.io/stacklight/jmx-exporter:0.17.2-debian-11-r54 |
Apache License 2.0 |
|
Pause |
mirantis.azurecr.io/general/external/pause:3.1 |
Google Cloud Platform |
RabbitMQ operator |
mirantis.azurecr.io/tungsten-operator/rabbitmq-operator:0.3.2 |
Mirantis Proprietary License |
RabbitMQ |
mirantis.azurecr.io/general/rabbitmq:3.11.2 |
Mozilla Public License 2.0 |
mirantis.azurecr.io/stacklight/rabbitmq-exporter:v1.0.0-RC19 |
MIT License |
|
ZooKeeper operator |
mirantis.azurecr.io/tungsten-operator/zookeeper-operator:0.2.15-17-de1dffc4 |
Apache License 2.0 |
ZooKeeper |
mirantis.azurecr.io/tungsten/zookeeper:3.7.1-20230323 |
Apache License 2.0 |
Redis operator |
mirantis.azurecr.io/tungsten-operator/redis-operator:0.3.7 |
Apache License 2.0 |
Redis |
mirantis.azurecr.io/tungsten/redis:7.0.9-alpine3.17 |
BSD 3-Clause “New” or “Revised” License |
mirantis.azurecr.io/stacklight/redis_exporter:v1.45.0 |
BSD 3-Clause “New” or “Revised” License |
|
TF Test |
mirantis.azurecr.io/tungsten/tungsten-pytest:0.1-20230321053606 |
MIT License |
TF CLI |
mirantis.azurecr.io/tungsten/tf-cli:0.1-20230223110354 |
MIT License |
TF NodeInfo |
mirantis.azurecr.io/tungsten/tf-nodeinfo:0.1-20230328120524 |
MIT License |
TF Tools |
mirantis.azurecr.io/tungsten/contrail-tools:21.4.20230306000000 |
Apache License 2.0 |
kubernetes-entrypoint |
mirantis.azurecr.io/openstack/extra/kubernetes-entrypoint:v1.0.1-48d1e8a-20220919122849 |
Apache License 2.0 |
MOSK 23.1.1 StackLight artifacts
Component |
Path |
License information for main executable programs |
|---|---|---|
Docker images |
||
prometheus-libvirt-exporter |
mirantis.azurecr.io/stacklight/prometheus-libvirt-exporter:v0.2-20230331023012 |
Mirantis Proprietary License |
prometheus-tungstenfabric-exporter |
mirantis.azurecr.io/stacklight/tungstenfabric-prometheus-exporter:0.1-20230330133839 |
Mirantis Proprietary License |
Helm charts |
||
prometheus-libvirt-exporter |
https://binary.mirantis.com/stacklight/helm/prometheus-libvirt-exporter-0.2.0-mcp-1.tgz |
Mirantis Proprietary License |
prometheus-tungstenfabric-exporter |
https://binary.mirantis.com/stacklight/helm/prometheus-tungstenfabric-exporter-0.2.0-mcp-3.tgz |
Mirantis Proprietary License |
In total, in the MOSK 23.1.1 release, 418 Common Vulnerabilities and Exposures (CVE) have been fixed: 22 of critical and 396 of high severity.
The full list of the CVEs present in the current MOSK release is available at the Mirantis Security Portal.
Learn more about new release cadence
23.1.2 patch
Release date |
May 4, 2023 |
|---|---|
Scope |
Patch |
Cluster release |
12.7.2 |
OpenStack Operator |
0.12.6 |
Tungsten Fabric Operator |
0.11.10 |
This section lists the components artifacts of the MOSK 23.1.2 patch release that includes binaries, Docker images, and Helm charts.
MOSK 23.1.2 OpenStack Victoria binaries and Docker images
Component |
Path |
License information for main executable programs |
|---|---|---|
Binaries |
||
octavia-amphora |
https://binary.mirantis.com/openstack/bin/octavia/amphora-x64-haproxy-victoria-20230223191854.qcow2 |
Mirantis Proprietary License |
mirantis |
https://binary.mirantis.com/openstack/bin/horizon/mirantis-victoria-8f71802-20210119120707.tar.gz |
Mirantis Proprietary License |
kernel |
GPL-2.0 |
|
initramfs |
https://binary.mirantis.com/openstack/bin/ironic/tinyipa/tinyipa-stable-victoria-20230128063511.gz |
GPL-2.0 |
service-image |
https://binary.mirantis.com/openstack/bin/manila/manila-service-image-20221228132450.qcow2 |
Mirantis Proprietary License |
Docker images |
||
keystone |
mirantis.azurecr.io/openstack/keystone:victoria-focal-20230403060017 |
Apache License 2.0 |
heat |
mirantis.azurecr.io/openstack/heat:victoria-focal-20230403060017 |
Apache License 2.0 |
glance |
mirantis.azurecr.io/openstack/glance:victoria-focal-20230403060017 |
Apache License 2.0 |
cinder |
mirantis.azurecr.io/openstack/cinder:victoria-focal-20230403060017 |
Apache License 2.0 |
neutron |
mirantis.azurecr.io/openstack/neutron:victoria-focal-20230403060017 |
Apache License 2.0 |
nova |
mirantis.azurecr.io/openstack/nova:victoria-focal-20230403060017 |
Apache License 2.0 |
horizon |
mirantis.azurecr.io/openstack/horizon:victoria-focal-20230403060017 |
Apache License 2.0 |
tempest |
mirantis.azurecr.io/openstack/tempest:victoria-focal-20230403060017 |
Apache License 2.0 |
octavia |
mirantis.azurecr.io/openstack/octavia:victoria-focal-20230403060017 |
Apache License 2.0 |
designate |
mirantis.azurecr.io/openstack/designate:victoria-focal-20230403060017 |
Apache License 2.0 |
ironic |
mirantis.azurecr.io/openstack/ironic:victoria-focal-20230403060017 |
Apache License 2.0 |
barbican |
mirantis.azurecr.io/openstack/barbican:victoria-focal-20230423104356 |
Apache License 2.0 |
libvirt |
mirantis.azurecr.io/general/libvirt:6.0.0-focal-20230323105551 |
LGPL-2.1 License |
pause |
mirantis.azurecr.io/general/external/pause:3.1 |
Apache License 2.0 |
openvswitch |
mirantis.azurecr.io/general/openvswitch:2.13-focal-20230227123148 |
Apache License 2.0 |
openvswitch-dpdk |
mirantis.azurecr.io/general/openvswitch-dpdk:2.13-focal-20230227123149 |
Apache License 2.0 |
rabbitmq-3.10.x |
mirantis.azurecr.io/openstack/extra/rabbitmq:3.10.18-focal-20230222154055 |
Mozilla Public License 2.0 |
rabbitmq-3.10.x-management |
mirantis.azurecr.io/openstack/extra/rabbitmq-management:3.10.18-focal-20230222154055 |
Mozilla Public License 2.0 |
amqproxy-0.8.x |
mirantis.azurecr.io/general/amqproxy:0.8.6-alpine3.17.3-20230422135216 |
MIT license |
kubernetes-entrypoint |
mirantis.azurecr.io/openstack/extra/kubernetes-entrypoint:v1.0.1-27d64fb-20230421151539 |
Apache License 2.0 |
memcached |
mirantis.azurecr.io/general/memcached:1.6.19-alpine3.17.3 |
BSD 3-Clause “New” or “Revised” License |
etcd |
mirantis.azurecr.io/openstack/extra/etcd:v3.5.8-alpine-20230422141943 |
Apache License 2.0 |
powerdns |
mirantis.azurecr.io/openstack/extra/powerdns:4.7-alpine-20230324153219 |
GPL-2.0 License |
nginx-ingress-controller |
mirantis.azurecr.io/openstack/extra/nginx-ingress-controller:1.3.1-alpine-20230422140933 |
Apache License 2.0 |
tls-proxy |
mirantis.azurecr.io/openstack/tls-proxy:focal-20220804082840 |
Mirantis Proprietary License |
defaultbackend |
mirantis.azurecr.io/openstack/extra/defaultbackend:v1.19.2-77af1ef-20220823043839 |
Apache License 2.0 |
mariadb |
mirantis.azurecr.io/general/mariadb:10.6.12-focal-20230331112513 |
GPLv2, LGPLv2.1 (client libraries) |
rabbitmq-exporter |
mirantis.azurecr.io/stacklight/rabbitmq-exporter:1.0.0-RC19 |
MIT License |
memcached-exporter |
mirantis.azurecr.io/stacklight/memcached-exporter:v0.11.1 |
Apache License 2.0 |
prometheus-mysql-exporter |
mirantis.azurecr.io/stacklight/mysqld-exporter:v0.11.0 |
Apache License 2.0 |
xrally-openstack |
mirantis.azurecr.io/openstack/extra/xrally-openstack:2.2.0-20230328221837 |
Apache License 2.0 |
aodh |
mirantis.azurecr.io/openstack/aodh:victoria-focal-20230403060017 |
Apache License 2.0 |
ceilometer |
mirantis.azurecr.io/openstack/ceilometer:victoria-focal-20230403060017 |
Apache License 2.0 |
gnocchi |
mirantis.azurecr.io/openstack/gnocchi:victoria-focal-20230403060017 |
Apache License 2.0 |
redis |
mirantis.azurecr.io/openstack/extra/redis:7.0.11-alpine3.17 |
BSD 3-Clause “New” or “Revised” License |
frr |
mirantis.azurecr.io/general/external/docker.io/frrouting/frr:v8.5.0 |
GPL-2.0 and LGPL-2.1 |
strongswan |
mirantis.azurecr.io/openstack/extra/strongswan:alpine-5.9.5-20230422141212 |
GPL-2.0 |
rsyslog |
mirantis.azurecr.io/openstack/extra/rsyslog:v8.2001.0-20230323105551 |
GNU General Public License v3 |
descheduler |
mirantis.azurecr.io/openstack/extra/descheduler:v0.26.0 |
Apache License 2.0 |
nginx |
mirantis.azurecr.io/openstack/extra/nginx:1.23.4-alpine-slim |
Apache License 2.0 |
tgt |
mirantis.azurecr.io/general/tgt:1.0.x-focal-20230323105551 |
GPL-2.0 |
requirements |
mirantis.azurecr.io/openstack/requirements:victoria-focal-20230403060017 |
Apache License 2.0 |
placement |
mirantis.azurecr.io/openstack/placement:victoria-focal-20230403060017 |
Apache License 2.0 |
stepler |
mirantis.azurecr.io/openstack/stepler:victoria-focal-20230324131216 |
Apache License 2.0 |
masakari |
mirantis.azurecr.io/openstack/masakari:victoria-focal-20230403060017 |
Apache License 2.0 |
masakari-monitors |
mirantis.azurecr.io/openstack/masakari-monitors:victoria-focal-20230403060017 |
Apache License 2.0 |
ironic-inspector |
mirantis.azurecr.io/openstack/ironic-inspector:victoria-focal-20230403060017 |
Apache License 2.0 |
panko |
mirantis.azurecr.io/openstack/panko:victoria-focal-20230403060017 |
Apache License 2.0 |
MOSK 23.1.2 OpenStack Yoga binaries and Docker images
Component |
Path |
License information for main executable programs |
|---|---|---|
Binaries |
||
octavia-amphora |
https://binary.mirantis.com/openstack/bin/octavia/amphora-x64-haproxy-yoga-20230227101732.qcow2 |
Mirantis Proprietary License |
mirantis |
https://binary.mirantis.com/openstack/bin/horizon/mirantis-xena-9f691e3-20220110111511.tar.gz |
Mirantis Proprietary License |
kernel |
https://binary.mirantis.com/openstack/bin/ironic/tinyipa/tinyipa-stable-yoga-20230128061113.vmlinuz |
GPL-2.0 |
initramfs |
https://binary.mirantis.com/openstack/bin/ironic/tinyipa/tinyipa-stable-yoga-20230128061113.gz |
GPL-2.0 |
service-image |
https://binary.mirantis.com/openstack/bin/manila/manila-service-image-20221228132450.qcow2 |
Mirantis Proprietary License |
Docker images |
||
keystone |
mirantis.azurecr.io/openstack/keystone:yoga-focal-20230403060017 |
Apache License 2.0 |
heat |
mirantis.azurecr.io/openstack/heat:yoga-focal-20230403060017 |
Apache License 2.0 |
glance |
mirantis.azurecr.io/openstack/glance:yoga-focal-20230403060017 |
Apache License 2.0 |
cinder |
mirantis.azurecr.io/openstack/cinder:yoga-focal-20230403060017 |
Apache License 2.0 |
neutron |
mirantis.azurecr.io/openstack/neutron:yoga-focal-20230403060017 |
Apache License 2.0 |
nova |
mirantis.azurecr.io/openstack/nova:yoga-focal-20230403060017 |
Apache License 2.0 |
horizon |
mirantis.azurecr.io/openstack/horizon:yoga-focal-20230403060017 |
Apache License 2.0 |
tempest |
mirantis.azurecr.io/openstack/tempest:yoga-focal-20230403060017 |
Apache License 2.0 |
octavia |
mirantis.azurecr.io/openstack/octavia:yoga-focal-20230403060017 |
Apache License 2.0 |
designate |
mirantis.azurecr.io/openstack/designate:yoga-focal-20230403060017 |
Apache License 2.0 |
ironic |
mirantis.azurecr.io/openstack/ironic:yoga-focal-20230403060017 |
Apache License 2.0 |
barbican |
mirantis.azurecr.io/openstack/barbican:yoga-focal-20230423104356 |
Apache License 2.0 |
libvirt |
mirantis.azurecr.io/general/libvirt:6.0.0-focal-20230323105551 |
LGPL-2.1 License |
pause |
mirantis.azurecr.io/general/external/pause:3.1 |
Apache License 2.0 |
openvswitch |
mirantis.azurecr.io/general/openvswitch:2.13-focal-20230227123148 |
Apache License 2.0 |
openvswitch-dpdk |
mirantis.azurecr.io/general/openvswitch-dpdk:2.13-focal-20230227123149 |
Apache License 2.0 |
rabbitmq-3.10.x |
mirantis.azurecr.io/openstack/extra/rabbitmq:3.10.18-focal-20230222154055 |
Mozilla Public License 2.0 |
rabbitmq-3.10.x-management |
mirantis.azurecr.io/openstack/extra/rabbitmq-management:3.10.18-focal-20230222154055 |
Mozilla Public License 2.0 |
amqproxy-0.8.x |
mirantis.azurecr.io/general/amqproxy:0.8.6-alpine3.17.3-20230422135216 |
MIT license |
kubernetes-entrypoint |
mirantis.azurecr.io/openstack/extra/kubernetes-entrypoint:v1.0.1-27d64fb-20230421151539 |
Apache License 2.0 |
memcached |
mirantis.azurecr.io/general/memcached:1.6.19-alpine3.17.3 |
BSD 3-Clause “New” or “Revised” License |
etcd |
mirantis.azurecr.io/openstack/extra/etcd:v3.5.8-alpine-20230422141943 |
Apache License 2.0 |
powerdns |
mirantis.azurecr.io/openstack/extra/powerdns:4.7-alpine-20230324153219 |
GPL-2.0 License |
nginx-ingress-controller |
mirantis.azurecr.io/openstack/extra/nginx-ingress-controller:1.3.1-alpine-20230422140933 |
Apache License 2.0 |
tls-proxy |
mirantis.azurecr.io/openstack/tls-proxy:focal-20220804082840 |
Mirantis Proprietary License |
defaultbackend |
mirantis.azurecr.io/openstack/extra/defaultbackend:v1.19.2-77af1ef-20220823043839 |
Apache License 2.0 |
mariadb |
mirantis.azurecr.io/general/mariadb:10.6.12-focal-20230331112513 |
GPLv2, LGPLv2.1 (client libraries) |
rabbitmq-exporter |
mirantis.azurecr.io/stacklight/rabbitmq-exporter:1.0.0-RC19 |
MIT License |
memcached-exporter |
mirantis.azurecr.io/stacklight/memcached-exporter:v0.11.1 |
Apache License 2.0 |
prometheus-mysql-exporter |
mirantis.azurecr.io/stacklight/mysqld-exporter:v0.11.0 |
Apache License 2.0 |
xrally-openstack |
mirantis.azurecr.io/openstack/extra/xrally-openstack:2.2.0-20230328221837 |
Apache License 2.0 |
aodh |
mirantis.azurecr.io/openstack/aodh:yoga-focal-20230403060017 |
Apache License 2.0 |
ceilometer |
mirantis.azurecr.io/openstack/ceilometer:yoga-focal-20230403060017 |
Apache License 2.0 |
gnocchi |
mirantis.azurecr.io/openstack/gnocchi:yoga-focal-20230403060017 |
Apache License 2.0 |
redis |
mirantis.azurecr.io/openstack/extra/redis:7.0.11-alpine3.17 |
BSD 3-Clause “New” or “Revised” License |
frr |
mirantis.azurecr.io/general/external/docker.io/frrouting/frr:v8.5.0 |
GPL-2.0 and LGPL-2.1 |
strongswan |
mirantis.azurecr.io/openstack/extra/strongswan:alpine-5.9.5-20230422141212 |
GPL-2.0 |
rsyslog |
mirantis.azurecr.io/openstack/extra/rsyslog:v8.2001.0-20230323105551 |
GNU General Public License v3 |
descheduler |
mirantis.azurecr.io/openstack/extra/descheduler:v0.26.0 |
Apache License 2.0 |
nginx |
mirantis.azurecr.io/openstack/extra/nginx:1.23.4-alpine-slim |
Apache License 2.0 |
tgt |
mirantis.azurecr.io/general/tgt:1.0.x-focal-20230323105551 |
GPL-2.0 |
requirements |
mirantis.azurecr.io/openstack/requirements:yoga-focal-20230403060017 |
Apache License 2.0 |
stepler |
mirantis.azurecr.io/openstack/stepler:yoga-focal-20230329122808 |
Apache License 2.0 |
placement |
mirantis.azurecr.io/openstack/placement:yoga-focal-20230403060017 |
Apache License 2.0 |
masakari |
mirantis.azurecr.io/openstack/masakari:yoga-focal-20230403060017 |
Apache License 2.0 |
masakari-monitors |
mirantis.azurecr.io/openstack/masakari-monitors:yoga-focal-20230403060017 |
Apache License 2.0 |
ironic-inspector |
mirantis.azurecr.io/openstack/ironic-inspector:yoga-focal-20230403060017 |
Apache License 2.0 |
manila |
mirantis.azurecr.io/openstack/manila:yoga-focal-20230403060017 |
Apache License 2.0 |
MOSK 23.1.2 OpenStack Helm charts
MOSK 23.1.2 Tungsten Fabric 21.4 artifacts
Component |
Path |
License information for main executable programs |
|---|---|---|
Helm charts |
||
Tungsten Fabric Operator |
https://binary.mirantis.com/tungsten/helm/tungstenfabric-operator-0.11.10.tgz |
Mirantis Proprietary License |
Docker images |
||
Tungsten Fabric Operator |
mirantis.azurecr.io/tungsten-operator/tungstenfabric-operator:0.11.10 |
Mirantis Proprietary License |
Analytics Alarm |
mirantis.azurecr.io/tungsten/contrail-analytics-alarm-gen:21.4.20230306000000 |
Apache License 2.0 |
Analytics |
mirantis.azurecr.io/tungsten/contrail-analytics-api:21.4.20230306000000 |
Apache License 2.0 |
mirantis.azurecr.io/tungsten/contrail-analytics-collector:21.4.20230306000000 |
Apache License 2.0 |
|
Analytics DB |
mirantis.azurecr.io/tungsten/contrail-analytics-query-engine:21.4.20230306000000 |
Apache License 2.0 |
Analytics SNMP |
mirantis.azurecr.io/tungsten/contrail-analytics-snmp-collector:21.4.20230306000000 |
Apache License 2.0 |
mirantis.azurecr.io/tungsten/contrail-analytics-snmp-topology:21.4.20230306000000 |
Apache License 2.0 |
|
Config |
mirantis.azurecr.io/tungsten/contrail-controller-config-api:21.4.20230306000000 |
Apache License 2.0 |
mirantis.azurecr.io/tungsten/contrail-controller-config-devicemgr:21.4.20230306000000 |
Apache License 2.0 |
|
mirantis.azurecr.io/tungsten/contrail-controller-config-dnsmasq:21.4.20230306000000 |
Apache License 2.0 |
|
mirantis.azurecr.io/tungsten/contrail-controller-config-schema:21.4.20230306000000 |
Apache License 2.0 |
|
mirantis.azurecr.io/tungsten/contrail-controller-config-svcmonitor:21.4.20230306000000 |
Apache License 2.0 |
|
Control |
mirantis.azurecr.io/tungsten/contrail-controller-control-control:21.4.20230306000000 |
Apache License 2.0 |
mirantis.azurecr.io/tungsten/contrail-controller-control-dns:21.4.20230306000000 |
Apache License 2.0 |
|
mirantis.azurecr.io/tungsten/contrail-controller-control-named:21.4.20230306000000 |
Apache License 2.0 |
|
Web UI |
mirantis.azurecr.io/tungsten/contrail-controller-webui-job:21.4.20230306000000 |
Apache License 2.0 |
mirantis.azurecr.io/tungsten/contrail-controller-webui-web:21.4.20230306000000 |
Apache License 2.0 |
|
Nodemanager |
mirantis.azurecr.io/tungsten/contrail-nodemgr:21.4.20230306000000 |
Apache License 2.0 |
TF Provisioner |
mirantis.azurecr.io/tungsten/contrail-provisioner:21.4.20230306000000 |
Apache License 2.0 |
vRouter |
mirantis.azurecr.io/tungsten/contrail-vrouter-agent:21.4.20230306000000 |
Apache License 2.0 |
mirantis.azurecr.io/tungsten/contrail-vrouter-agent-dpdk:21.4.20230306000000 |
Apache License 2.0 |
|
mirantis.azurecr.io/tungsten/contrail-node-init:21.4.20230306000000 |
Apache License 2.0 |
|
mirantis.azurecr.io/tungsten/contrail-vrouter-kernel-build-init:21.4.20230306000000 |
Apache License 2.0 |
|
Cassandra operator |
mirantis.azurecr.io/tungsten-operator/casskop:2.1.15 |
Apache License 2.0 |
Cassandra |
mirantis.azurecr.io/tungsten/cassandra-bootstrap:0.1.11 |
Apache License 2.0 |
mirantis.azurecr.io/tungsten/cassandra:3.11.10-20230126 |
Apache License 2.0 |
|
mirantis.azurecr.io/tungsten/instaclustr-icarus:v2-20230328121138 |
Apache License 2.0 |
|
mirantis.azurecr.io/tungsten/cass-config-builder:v2-20230424135332 |
Apache License 2.0 |
|
Kafka operator |
mirantis.azurecr.io/tungsten-operator/kafka-k8s-operator:0.3.2 |
Mirantis Proprietary License |
Kafka |
mirantis.azurecr.io/tungsten/cp-kafka:7.3.3 |
Apache License 2.0 |
mirantis.azurecr.io/stacklight/jmx-exporter:0.18.0-debian-11-r9 |
Apache License 2.0 |
|
Pause |
mirantis.azurecr.io/general/external/pause:3.1 |
Google Cloud Platform |
RabbitMQ operator |
mirantis.azurecr.io/tungsten-operator/rabbitmq-operator:0.3.2 |
Mirantis Proprietary License |
RabbitMQ |
mirantis.azurecr.io/tungsten/rabbitmq:3.11.2 |
Mozilla Public License 2.0 |
mirantis.azurecr.io/stacklight/rabbitmq-exporter:1.0.0-RC19 |
MIT License |
|
ZooKeeper operator |
mirantis.azurecr.io/tungsten-operator/zookeeper-operator:0.2.15-17-de1dffc4 |
Apache License 2.0 |
ZooKeeper |
mirantis.azurecr.io/tungsten/zookeeper:3.7.1-20230323 |
Apache License 2.0 |
Redis operator |
mirantis.azurecr.io/tungsten-operator/redis-operator:0.3.7 |
Apache License 2.0 |
Redis |
mirantis.azurecr.io/tungsten/redis:7.0.11-alpine3.17 |
BSD 3-Clause “New” or “Revised” License |
mirantis.azurecr.io/stacklight/redis_exporter:v1.45.0 |
BSD 3-Clause “New” or “Revised” License |
|
TF Test |
mirantis.azurecr.io/tungsten/tungsten-pytest:0.1-20230420090701 |
MIT License |
TF CLI |
mirantis.azurecr.io/tungsten/tf-cli:0.1-20230424100414 |
MIT License |
TF NodeInfo |
mirantis.azurecr.io/tungsten/tf-nodeinfo:0.1-20230328120524 |
MIT License |
TF Tools |
mirantis.azurecr.io/tungsten/contrail-tools:21.4.20230306000000 |
Apache License 2.0 |
kubernetes-entrypoint |
mirantis.azurecr.io/openstack/extra/kubernetes-entrypoint:v1.0.1-48d1e8a-20220919122849 |
Apache License 2.0 |
MOSK 23.1.2 StackLight artifacts
Component |
Path |
License information for main executable programs |
|---|---|---|
Docker images |
||
prometheus-libvirt-exporter |
mirantis.azurecr.io/stacklight/prometheus-libvirt-exporter:v0.2-20230414023012 |
Mirantis Proprietary License |
prometheus-tungstenfabric-exporter |
mirantis.azurecr.io/stacklight/tungstenfabric-prometheus-exporter:0.1-20230330133839 |
Mirantis Proprietary License |
Helm charts |
||
prometheus-libvirt-exporter |
https://binary.mirantis.com/stacklight/helm/prometheus-libvirt-exporter-0.2.0-mcp-1.tgz |
Mirantis Proprietary License |
prometheus-tungstenfabric-exporter |
https://binary.mirantis.com/stacklight/helm/prometheus-tungstenfabric-exporter-0.2.0-mcp-3.tgz |
Mirantis Proprietary License |
In total, in the MOSK 23.1.2 release, 40 Common Vulnerabilities and Exposures (CVE) have been fixed: 4 of critical and 36 of high severity.
The full list of the CVEs present in the current MOSK release is available at the Mirantis Security Portal.
This section describes the patch-related known issues with available workarounds.
Fixed in MOSK 23.1.3
The OpenStack upgrade to Yoga fails due to the delay in the Cinder start.
Workaround:
Follow the
openstack-controllerlogs from theOpenStackDeploymentcontainer. When the controller is stuck on checking health for any OpenStack component, verify the Helm releases statuses:helm3 --namespace openstack list
Example of a system response:
NAME NAMESPACE REVISION UPDATED STATUS CHART openstack-cinder openstack 111 2023-04-30 20:49:08.969450386 +0000 UTC failed cinder-0.1.0-mcp-4241
If there is a release in the failed state, roll it back:
helm3 --namespace openstack rollback openstack-cinder
See also
Learn more about new release cadence
23.1.3 patch
Release date |
May 22, 2023 |
|---|---|
Scope |
Patch |
Cluster release |
12.7.3 |
OpenStack Operator |
0.12.8 |
Tungsten Fabric Operator |
0.11.11 |
This section lists the components artifacts of the MOSK 23.1.3 release that includes binaries, Docker images, and Helm charts.
MOSK 23.1.3 OpenStack Victoria binaries and Docker images
Component |
Path |
License information for main executable programs |
|---|---|---|
Binaries |
||
octavia-amphora |
https://binary.mirantis.com/openstack/bin/octavia/amphora-x64-haproxy-victoria-20230223191854.qcow2 |
Mirantis Proprietary License |
mirantis |
https://binary.mirantis.com/openstack/bin/horizon/mirantis-victoria-8f71802-20210119120707.tar.gz |
Mirantis Proprietary License |
kernel |
GPL-2.0 |
|
initramfs |
https://binary.mirantis.com/openstack/bin/ironic/tinyipa/tinyipa-stable-victoria-20230128063511.gz |
GPL-2.0 |
service-image |
https://binary.mirantis.com/openstack/bin/manila/manila-service-image-20221228132450.qcow2 |
Mirantis Proprietary License |
Docker images |
||
keystone |
mirantis.azurecr.io/openstack/keystone:victoria-focal-20230423104356 |
Apache License 2.0 |
heat |
mirantis.azurecr.io/openstack/heat:victoria-focal-20230423104356 |
Apache License 2.0 |
glance |
mirantis.azurecr.io/openstack/glance:victoria-focal-20230423104356 |
Apache License 2.0 |
cinder |
mirantis.azurecr.io/openstack/cinder:victoria-focal-20230423104356 |
Apache License 2.0 |
neutron |
mirantis.azurecr.io/openstack/neutron:victoria-focal-20230423104356 |
Apache License 2.0 |
nova |
mirantis.azurecr.io/openstack/nova:victoria-focal-20230423104356 |
Apache License 2.0 |
horizon |
mirantis.azurecr.io/openstack/horizon:victoria-focal-20230423104356 |
Apache License 2.0 |
tempest |
mirantis.azurecr.io/openstack/tempest:victoria-focal-20230423104356 |
Apache License 2.0 |
octavia |
mirantis.azurecr.io/openstack/octavia:victoria-focal-20230423104356 |
Apache License 2.0 |
designate |
mirantis.azurecr.io/openstack/designate:victoria-focal-20230423104356 |
Apache License 2.0 |
ironic |
mirantis.azurecr.io/openstack/ironic:victoria-focal-20230423104356 |
Apache License 2.0 |
barbican |
mirantis.azurecr.io/openstack/barbican:victoria-focal-20230423104356 |
Apache License 2.0 |
libvirt |
mirantis.azurecr.io/general/libvirt:6.0.0-focal-20230427072424 |
LGPL-2.1 License |
pause |
mirantis.azurecr.io/general/external/pause:3.1 |
Apache License 2.0 |
openvswitch |
mirantis.azurecr.io/general/openvswitch:2.13-focal-20230427182440 |
Apache License 2.0 |
openvswitch-dpdk |
mirantis.azurecr.io/general/openvswitch-dpdk:2.13-focal-20230427182440 |
Apache License 2.0 |
rabbitmq-3.10.x |
mirantis.azurecr.io/openstack/extra/rabbitmq:3.10.18-focal-20230222154055 |
Mozilla Public License 2.0 |
rabbitmq-3.10.x-management |
mirantis.azurecr.io/openstack/extra/rabbitmq-management:3.10.18-focal-20230222154055 |
Mozilla Public License 2.0 |
amqproxy-0.8.x |
mirantis.azurecr.io/general/amqproxy:0.8.6-alpine3.17.3-20230422135216 |
MIT license |
kubernetes-entrypoint |
mirantis.azurecr.io/openstack/extra/kubernetes-entrypoint:v1.0.1-27d64fb-20230421151539 |
Apache License 2.0 |
memcached |
mirantis.azurecr.io/general/memcached:1.6.19-alpine3.17.3 |
BSD 3-Clause “New” or “Revised” License |
etcd |
mirantis.azurecr.io/openstack/extra/etcd:v3.5.8-alpine-20230422141943 |
Apache License 2.0 |
powerdns |
mirantis.azurecr.io/openstack/extra/powerdns:4.7-alpine-20230324153219 |
GPL-2.0 License |
nginx-ingress-controller |
mirantis.azurecr.io/openstack/extra/nginx-ingress-controller:1.3.1-alpine-20230422140933 |
Apache License 2.0 |
tls-proxy |
mirantis.azurecr.io/openstack/tls-proxy:focal-20220804082840 |
Mirantis Proprietary License |
defaultbackend |
mirantis.azurecr.io/openstack/extra/defaultbackend:v1.19.2-77af1ef-20220823043839 |
Apache License 2.0 |
mariadb |
mirantis.azurecr.io/general/mariadb:10.6.12-focal-20230423170220 |
GPLv2, LGPLv2.1 (client libraries) |
rabbitmq-exporter |
mirantis.azurecr.io/stacklight/rabbitmq-exporter:1.0.0-RC19 |
MIT License |
memcached-exporter |
mirantis.azurecr.io/stacklight/memcached-exporter:v0.11.3 |
Apache License 2.0 |
prometheus-mysql-exporter |
mirantis.azurecr.io/stacklight/mysqld-exporter:v0.11.0 |
Apache License 2.0 |
aodh |
mirantis.azurecr.io/openstack/aodh:victoria-focal-20230423104356 |
Apache License 2.0 |
ceilometer |
mirantis.azurecr.io/openstack/ceilometer:victoria-focal-20230423104356 |
Apache License 2.0 |
gnocchi |
mirantis.azurecr.io/openstack/gnocchi:victoria-focal-20230423104356 |
Apache License 2.0 |
redis |
mirantis.azurecr.io/openstack/extra/redis:7.0.11-alpine3.17 |
BSD 3-Clause “New” or “Revised” License |
frr |
mirantis.azurecr.io/general/external/docker.io/frrouting/frr:v8.5.1 |
GPL-2.0 and LGPL-2.1 |
strongswan |
mirantis.azurecr.io/openstack/extra/strongswan:alpine-5.9.5-20230422141212 |
GPL-2.0 |
rsyslog |
mirantis.azurecr.io/openstack/extra/rsyslog:v8.2001.0-20230423172355 |
GNU General Public License v3 |
descheduler |
mirantis.azurecr.io/openstack/extra/descheduler:v0.26.0 |
Apache License 2.0 |
nginx |
mirantis.azurecr.io/openstack/extra/nginx:1.23.4-alpine-slim |
Apache License 2.0 |
tgt |
mirantis.azurecr.io/general/tgt:1.0.x-focal-20230423172355 |
GPL-2.0 |
requirements |
mirantis.azurecr.io/openstack/requirements:victoria-focal-20230423104356 |
Apache License 2.0 |
placement |
mirantis.azurecr.io/openstack/placement:victoria-focal-20230423104356 |
Apache License 2.0 |
stepler |
mirantis.azurecr.io/openstack/stepler:victoria-focal-20230423172355 |
Apache License 2.0 |
masakari |
mirantis.azurecr.io/openstack/masakari:victoria-focal-20230423104356 |
Apache License 2.0 |
masakari-monitors |
mirantis.azurecr.io/openstack/masakari-monitors:victoria-focal-20230423104356 |
Apache License 2.0 |
ironic-inspector |
mirantis.azurecr.io/openstack/ironic-inspector:victoria-focal-20230423104356 |
Apache License 2.0 |
panko |
mirantis.azurecr.io/openstack/panko:victoria-focal-20230423104356 |
Apache License 2.0 |
MOSK 23.1.3 OpenStack Yoga binaries and Docker images
Component |
Path |
License information for main executable programs |
|---|---|---|
Binaries |
||
octavia-amphora |
https://binary.mirantis.com/openstack/bin/octavia/amphora-x64-haproxy-yoga-20230227101732.qcow2 |
Mirantis Proprietary License |
mirantis |
https://binary.mirantis.com/openstack/bin/horizon/mirantis-xena-9f691e3-20220110111511.tar.gz |
Mirantis Proprietary License |
kernel |
https://binary.mirantis.com/openstack/bin/ironic/tinyipa/tinyipa-stable-yoga-20230128061113.vmlinuz |
GPL-2.0 |
initramfs |
https://binary.mirantis.com/openstack/bin/ironic/tinyipa/tinyipa-stable-yoga-20230128061113.gz |
GPL-2.0 |
service-image |
https://binary.mirantis.com/openstack/bin/manila/manila-service-image-20221228132450.qcow2 |
Mirantis Proprietary License |
Docker images |
||
keystone |
mirantis.azurecr.io/openstack/keystone:yoga-focal-20230423104356 |
Apache License 2.0 |
heat |
mirantis.azurecr.io/openstack/heat:yoga-focal-20230423104356 |
Apache License 2.0 |
glance |
mirantis.azurecr.io/openstack/glance:yoga-focal-20230423104356 |
Apache License 2.0 |
cinder |
mirantis.azurecr.io/openstack/cinder:yoga-focal-20230423104356 |
Apache License 2.0 |
neutron |
mirantis.azurecr.io/openstack/neutron:yoga-focal-20230423104356 |
Apache License 2.0 |
nova |
mirantis.azurecr.io/openstack/nova:yoga-focal-20230423104356 |
Apache License 2.0 |
horizon |
mirantis.azurecr.io/openstack/horizon:yoga-focal-20230423104356 |
Apache License 2.0 |
tempest |
mirantis.azurecr.io/openstack/tempest:yoga-focal-20230423104356 |
Apache License 2.0 |
octavia |
mirantis.azurecr.io/openstack/octavia:yoga-focal-20230423104356 |
Apache License 2.0 |
designate |
mirantis.azurecr.io/openstack/designate:yoga-focal-20230423104356 |
Apache License 2.0 |
ironic |
mirantis.azurecr.io/openstack/ironic:yoga-focal-20230423104356 |
Apache License 2.0 |
barbican |
mirantis.azurecr.io/openstack/barbican:yoga-focal-20230423104356 |
Apache License 2.0 |
libvirt |
mirantis.azurecr.io/general/libvirt:6.0.0-focal-20230427072424 |
LGPL-2.1 License |
pause |
mirantis.azurecr.io/general/external/pause:3.1 |
Apache License 2.0 |
openvswitch |
mirantis.azurecr.io/general/openvswitch:2.13-focal-20230427182440 |
Apache License 2.0 |
openvswitch-dpdk |
mirantis.azurecr.io/general/openvswitch-dpdk:2.13-focal-20230427182440 |
Apache License 2.0 |
rabbitmq-3.10.x |
mirantis.azurecr.io/openstack/extra/rabbitmq:3.10.18-focal-20230222154055 |
Mozilla Public License 2.0 |
rabbitmq-3.10.x-management |
mirantis.azurecr.io/openstack/extra/rabbitmq-management:3.10.18-focal-20230222154055 |
Mozilla Public License 2.0 |
amqproxy-0.8.x |
mirantis.azurecr.io/general/amqproxy:0.8.6-alpine3.17.3-20230422135216 |
MIT license |
kubernetes-entrypoint |
mirantis.azurecr.io/openstack/extra/kubernetes-entrypoint:v1.0.1-27d64fb-20230421151539 |
Apache License 2.0 |
memcached |
mirantis.azurecr.io/general/memcached:1.6.19-alpine3.17.3 |
BSD 3-Clause “New” or “Revised” License |
etcd |
mirantis.azurecr.io/openstack/extra/etcd:v3.5.8-alpine-20230422141943 |
Apache License 2.0 |
powerdns |
mirantis.azurecr.io/openstack/extra/powerdns:4.7-alpine-20230324153219 |
GPL-2.0 License |
nginx-ingress-controller |
mirantis.azurecr.io/openstack/extra/nginx-ingress-controller:1.3.1-alpine-20230422140933 |
Apache License 2.0 |
tls-proxy |
mirantis.azurecr.io/openstack/tls-proxy:focal-20220804082840 |
Mirantis Proprietary License |
defaultbackend |
mirantis.azurecr.io/openstack/extra/defaultbackend:v1.19.2-77af1ef-20220823043839 |
Apache License 2.0 |
mariadb |
mirantis.azurecr.io/general/mariadb:10.6.12-focal-20230423170220 |
GPLv2, LGPLv2.1 (client libraries) |
rabbitmq-exporter |
mirantis.azurecr.io/stacklight/rabbitmq-exporter:1.0.0-RC19 |
MIT License |
memcached-exporter |
mirantis.azurecr.io/stacklight/memcached-exporter:v0.11.3 |
Apache License 2.0 |
prometheus-mysql-exporter |
mirantis.azurecr.io/stacklight/mysqld-exporter:v0.11.0 |
Apache License 2.0 |
aodh |
mirantis.azurecr.io/openstack/aodh:yoga-focal-20230423104356 |
Apache License 2.0 |
ceilometer |
mirantis.azurecr.io/openstack/ceilometer:yoga-focal-20230423104356 |
Apache License 2.0 |
gnocchi |
mirantis.azurecr.io/openstack/gnocchi:yoga-focal-20230423104356 |
Apache License 2.0 |
redis |
mirantis.azurecr.io/openstack/extra/redis:7.0.11-alpine3.17 |
BSD 3-Clause “New” or “Revised” License |
frr |
mirantis.azurecr.io/general/external/docker.io/frrouting/frr:v8.5.1 |
GPL-2.0 and LGPL-2.1 |
strongswan |
mirantis.azurecr.io/openstack/extra/strongswan:alpine-5.9.5-20230422141212 |
GPL-2.0 |
rsyslog |
mirantis.azurecr.io/openstack/extra/rsyslog:v8.2001.0-20230423172355 |
GNU General Public License v3 |
descheduler |
mirantis.azurecr.io/openstack/extra/descheduler:v0.26.0 |
Apache License 2.0 |
nginx |
mirantis.azurecr.io/openstack/extra/nginx:1.23.4-alpine-slim |
Apache License 2.0 |
tgt |
mirantis.azurecr.io/general/tgt:1.0.x-focal-20230423172355 |
GPL-2.0 |
requirements |
mirantis.azurecr.io/openstack/requirements:yoga-focal-20230423104356 |
Apache License 2.0 |
stepler |
mirantis.azurecr.io/openstack/stepler:yoga-focal-20230423172355 |
Apache License 2.0 |
placement |
mirantis.azurecr.io/openstack/placement:yoga-focal-20230423104356 |
Apache License 2.0 |
masakari |
mirantis.azurecr.io/openstack/masakari:yoga-focal-20230423104356 |
Apache License 2.0 |
masakari-monitors |
mirantis.azurecr.io/openstack/masakari-monitors:yoga-focal-20230423104356 |
Apache License 2.0 |
ironic-inspector |
mirantis.azurecr.io/openstack/ironic-inspector:yoga-focal-20230423104356 |
Apache License 2.0 |
manila |
mirantis.azurecr.io/openstack/manila:yoga-focal-20230423104356 |
Apache License 2.0 |
MOSK 23.1.3 OpenStack Helm charts
MOSK 23.1.3 Tungsten Fabric 21.4 artifacts
Component |
Path |
License information for main executable programs |
|---|---|---|
Helm charts |
||
Tungsten Fabric Operator |
https://binary.mirantis.com/tungsten/helm/tungstenfabric-operator-0.11.11.tgz |
Mirantis Proprietary License |
Docker images |
||
Tungsten Fabric Operator |
mirantis.azurecr.io/tungsten-operator/tungstenfabric-operator:0.11.11 |
Mirantis Proprietary License |
Analytics Alarm |
mirantis.azurecr.io/tungsten/contrail-analytics-alarm-gen:21.4.20230306000000 |
Apache License 2.0 |
Analytics |
mirantis.azurecr.io/tungsten/contrail-analytics-api:21.4.20230306000000 |
Apache License 2.0 |
mirantis.azurecr.io/tungsten/contrail-analytics-collector:21.4.20230306000000 |
Apache License 2.0 |
|
Analytics DB |
mirantis.azurecr.io/tungsten/contrail-analytics-query-engine:21.4.20230306000000 |
Apache License 2.0 |
Analytics SNMP |
mirantis.azurecr.io/tungsten/contrail-analytics-snmp-collector:21.4.20230306000000 |
Apache License 2.0 |
mirantis.azurecr.io/tungsten/contrail-analytics-snmp-topology:21.4.20230306000000 |
Apache License 2.0 |
|
Config |
mirantis.azurecr.io/tungsten/contrail-controller-config-api:21.4.20230306000000 |
Apache License 2.0 |
mirantis.azurecr.io/tungsten/contrail-controller-config-devicemgr:21.4.20230306000000 |
Apache License 2.0 |
|
mirantis.azurecr.io/tungsten/contrail-controller-config-dnsmasq:21.4.20230306000000 |
Apache License 2.0 |
|
mirantis.azurecr.io/tungsten/contrail-controller-config-schema:21.4.20230306000000 |
Apache License 2.0 |
|
mirantis.azurecr.io/tungsten/contrail-controller-config-svcmonitor:21.4.20230306000000 |
Apache License 2.0 |
|
Control |
mirantis.azurecr.io/tungsten/contrail-controller-control-control:21.4.20230306000000 |
Apache License 2.0 |
mirantis.azurecr.io/tungsten/contrail-controller-control-dns:21.4.20230306000000 |
Apache License 2.0 |
|
mirantis.azurecr.io/tungsten/contrail-controller-control-named:21.4.20230306000000 |
Apache License 2.0 |
|
Web UI |
mirantis.azurecr.io/tungsten/contrail-controller-webui-job:21.4.20230306000000 |
Apache License 2.0 |
mirantis.azurecr.io/tungsten/contrail-controller-webui-web:21.4.20230306000000 |
Apache License 2.0 |
|
Nodemanager |
mirantis.azurecr.io/tungsten/contrail-nodemgr:21.4.20230306000000 |
Apache License 2.0 |
TF Provisioner |
mirantis.azurecr.io/tungsten/contrail-provisioner:21.4.20230306000000 |
Apache License 2.0 |
vRouter |
mirantis.azurecr.io/tungsten/contrail-vrouter-agent:21.4.20230306000000 |
Apache License 2.0 |
mirantis.azurecr.io/tungsten/contrail-vrouter-agent-dpdk:21.4.20230306000000 |
Apache License 2.0 |
|
mirantis.azurecr.io/tungsten/contrail-node-init:21.4.20230306000000 |
Apache License 2.0 |
|
mirantis.azurecr.io/tungsten/contrail-vrouter-kernel-build-init:21.4.20230306000000 |
Apache License 2.0 |
|
Cassandra operator |
mirantis.azurecr.io/tungsten-operator/casskop:2.1.16 |
Apache License 2.0 |
Cassandra |
mirantis.azurecr.io/tungsten/cassandra-bootstrap:0.1.11 |
Apache License 2.0 |
mirantis.azurecr.io/tungsten/cassandra:3.11.10-20230126 |
Apache License 2.0 |
|
mirantis.azurecr.io/tungsten/instaclustr-icarus:v2-20230328121138 |
Apache License 2.0 |
|
mirantis.azurecr.io/tungsten/cass-config-builder:v2-20230424135332 |
Apache License 2.0 |
|
Kafka operator |
mirantis.azurecr.io/tungsten-operator/kafka-k8s-operator:0.3.2 |
Mirantis Proprietary License |
Kafka |
mirantis.azurecr.io/tungsten/cp-kafka:7.4.0 |
Apache License 2.0 |
mirantis.azurecr.io/stacklight/jmx-exporter:0.18.0-debian-11-r9 |
Apache License 2.0 |
|
Pause |
mirantis.azurecr.io/general/external/pause:3.1 |
Google Cloud Platform |
RabbitMQ operator |
mirantis.azurecr.io/tungsten-operator/rabbitmq-operator:0.3.2 |
Mirantis Proprietary License |
RabbitMQ |
mirantis.azurecr.io/tungsten/rabbitmq:3.11.2 |
Mozilla Public License 2.0 |
mirantis.azurecr.io/stacklight/rabbitmq-exporter:1.0.0-RC19 |
MIT License |
|
ZooKeeper operator |
mirantis.azurecr.io/tungsten-operator/zookeeper-operator:0.2.15-17-de1dffc4 |
Apache License 2.0 |
ZooKeeper |
mirantis.azurecr.io/tungsten/zookeeper:3.8.1-20230425 |
Apache License 2.0 |
Redis operator |
mirantis.azurecr.io/tungsten-operator/redis-operator:0.3.7 |
Apache License 2.0 |
Redis |
mirantis.azurecr.io/tungsten/redis:7.0.11-alpine3.17 |
BSD 3-Clause “New” or “Revised” License |
mirantis.azurecr.io/stacklight/redis_exporter:v1.45.0 |
BSD 3-Clause “New” or “Revised” License |
|
TF Test |
mirantis.azurecr.io/tungsten/tungsten-pytest:0.1-20230420090701 |
MIT License |
TF CLI |
mirantis.azurecr.io/tungsten/tf-cli:0.1-20230424100414 |
MIT License |
TF NodeInfo |
mirantis.azurecr.io/tungsten/tf-nodeinfo:0.1-20230328120524 |
MIT License |
TF Tools |
mirantis.azurecr.io/tungsten/contrail-tools:21.4.20230306000000 |
Apache License 2.0 |
kubernetes-entrypoint |
mirantis.azurecr.io/openstack/extra/kubernetes-entrypoint:v1.0.1-48d1e8a-20220919122849 |
Apache License 2.0 |
MOSK 23.1.3 StackLight artifacts
Component |
Path |
License information for main executable programs |
|---|---|---|
Docker images |
||
prometheus-libvirt-exporter |
mirantis.azurecr.io/stacklight/prometheus-libvirt-exporter:v0.2-20230505023010 |
Mirantis Proprietary License |
tungstenfabric-prometheus-exporter |
mirantis.azurecr.io/stacklight/tungstenfabric-prometheus-exporter:0.1-20230330133839 |
Mirantis Proprietary License |
Helm charts |
||
prometheus-libvirt-exporter |
https://binary.mirantis.com/stacklight/helm/prometheus-libvirt-exporter-0.2.0-mcp-1.tgz |
Mirantis Proprietary License |
prometheus-tungstenfabric-exporter |
https://binary.mirantis.com/stacklight/helm/prometheus-tungstenfabric-exporter-0.2.0-mcp-3.tgz |
Mirantis Proprietary License |
In total, in the MOSK 23.1.3 release, 7 Common Vulnerabilities and Exposures (CVE) have been fixed: 2 of critical and 5 of high severity.
The full list of the CVEs present in the current MOSK release is available at the Mirantis Security Portal.
Learn more about new release cadence
23.1.4 patch
Release date |
June 05, 2023 |
|---|---|
Scope |
Patch |
Cluster release |
12.7.4 |
OpenStack Operator |
0.12.11 |
Tungsten Fabric Operator |
0.11.11 |
This section lists the components artifacts of the MOSK 23.1.4 release that includes binaries, Docker images, and Helm charts.
MOSK 23.1.4 OpenStack Victoria binaries and Docker images
Component |
Path |
License information for main executable programs |
|---|---|---|
Binaries |
||
octavia-amphora |
https://binary.mirantis.com/openstack/bin/octavia/amphora-x64-haproxy-victoria-20230223191854.qcow2 |
Mirantis Proprietary License |
mirantis |
https://binary.mirantis.com/openstack/bin/horizon/mirantis-victoria-8f71802-20210119120707.tar.gz |
Mirantis Proprietary License |
kernel |
GPL-2.0 |
|
initramfs |
https://binary.mirantis.com/openstack/bin/ironic/tinyipa/tinyipa-stable-victoria-20230128063511.gz |
GPL-2.0 |
service-image |
https://binary.mirantis.com/openstack/bin/manila/manila-service-image-20221228132450.qcow2 |
Mirantis Proprietary License |
Docker images |
||
keystone |
mirantis.azurecr.io/openstack/keystone:victoria-focal-20230423104356 |
Apache License 2.0 |
heat |
mirantis.azurecr.io/openstack/heat:victoria-focal-20230423104356 |
Apache License 2.0 |
glance |
mirantis.azurecr.io/openstack/glance:victoria-focal-20230423104356 |
Apache License 2.0 |
cinder |
mirantis.azurecr.io/openstack/cinder:victoria-focal-20230423104356 |
Apache License 2.0 |
neutron |
mirantis.azurecr.io/openstack/neutron:victoria-focal-20230423104356 |
Apache License 2.0 |
nova |
mirantis.azurecr.io/openstack/nova:victoria-focal-20230423104356 |
Apache License 2.0 |
horizon |
mirantis.azurecr.io/openstack/horizon:victoria-focal-20230423104356 |
Apache License 2.0 |
tempest |
mirantis.azurecr.io/openstack/tempest:victoria-focal-20230423104356 |
Apache License 2.0 |
octavia |
mirantis.azurecr.io/openstack/octavia:victoria-focal-20230423104356 |
Apache License 2.0 |
designate |
mirantis.azurecr.io/openstack/designate:victoria-focal-20230423104356 |
Apache License 2.0 |
ironic |
mirantis.azurecr.io/openstack/ironic:victoria-focal-20230423104356 |
Apache License 2.0 |
barbican |
mirantis.azurecr.io/openstack/barbican:victoria-focal-20230423104356 |
Apache License 2.0 |
libvirt |
mirantis.azurecr.io/general/libvirt:6.0.0-focal-20230427072424 |
LGPL-2.1 License |
pause |
mirantis.azurecr.io/general/external/pause:3.1 |
Apache License 2.0 |
openvswitch |
mirantis.azurecr.io/general/openvswitch:2.13-focal-20230524130506 |
Apache License 2.0 |
openvswitch-dpdk |
mirantis.azurecr.io/general/openvswitch-dpdk:2.13-focal-20230524130506 |
Apache License 2.0 |
openstack-tools |
mirantis.azurecr.io/openstack/openstack-tools:yoga-focal-20230524115243 |
Apache License 2.0 |
rabbitmq-3.10.x |
mirantis.azurecr.io/openstack/extra/rabbitmq:3.10.18-focal-20230222154055 |
Mozilla Public License 2.0 |
rabbitmq-3.10.x-management |
mirantis.azurecr.io/openstack/extra/rabbitmq-management:3.10.18-focal-20230222154055 |
Mozilla Public License 2.0 |
amqproxy-0.8.x |
mirantis.azurecr.io/general/amqproxy:0.8.6-alpine3.17.3-20230422135216 |
MIT license |
kubernetes-entrypoint |
mirantis.azurecr.io/openstack/extra/kubernetes-entrypoint:v1.0.1-27d64fb-20230421151539 |
Apache License 2.0 |
memcached |
mirantis.azurecr.io/general/memcached:1.6.19-alpine3.17.3 |
BSD 3-Clause “New” or “Revised” License |
etcd |
mirantis.azurecr.io/openstack/extra/etcd:v3.5.8-alpine-20230422141943 |
Apache License 2.0 |
powerdns |
mirantis.azurecr.io/openstack/extra/powerdns:4.7-alpine-20230523174753 |
GPL-2.0 License |
nginx-ingress-controller |
mirantis.azurecr.io/openstack/extra/nginx-ingress-controller:1.3.1-alpine-20230422140933 |
Apache License 2.0 |
tls-proxy |
mirantis.azurecr.io/openstack/tls-proxy:focal-20220804082840 |
Mirantis Proprietary License |
defaultbackend |
mirantis.azurecr.io/openstack/extra/defaultbackend:v1.19.2-77af1ef-20220823043839 |
Apache License 2.0 |
mariadb |
mirantis.azurecr.io/general/mariadb:10.6.12-focal-20230423170220 |
GPLv2, LGPLv2.1 (client libraries) |
rabbitmq-exporter |
mirantis.azurecr.io/stacklight/rabbitmq-exporter:1.0.0-RC19 |
MIT License |
memcached-exporter |
mirantis.azurecr.io/stacklight/memcached-exporter:v0.11.3 |
Apache License 2.0 |
prometheus-mysql-exporter |
mirantis.azurecr.io/stacklight/mysqld-exporter:v0.11.0 |
Apache License 2.0 |
aodh |
mirantis.azurecr.io/openstack/aodh:victoria-focal-20230423104356 |
Apache License 2.0 |
ceilometer |
mirantis.azurecr.io/openstack/ceilometer:victoria-focal-20230423104356 |
Apache License 2.0 |
gnocchi |
mirantis.azurecr.io/openstack/gnocchi:victoria-focal-20230423104356 |
Apache License 2.0 |
redis |
mirantis.azurecr.io/openstack/extra/redis:7.0.11-alpine3.17 |
BSD 3-Clause “New” or “Revised” License |
frr |
mirantis.azurecr.io/general/external/docker.io/frrouting/frr:v8.5.1 |
GPL-2.0 and LGPL-2.1 |
strongswan |
mirantis.azurecr.io/openstack/extra/strongswan:alpine-5.9.8-20230522060448 |
GPL-2.0 |
rsyslog |
mirantis.azurecr.io/openstack/extra/rsyslog:v8.2001.0-20230423172355 |
GNU General Public License v3 |
descheduler |
mirantis.azurecr.io/openstack/extra/descheduler:v0.27.0 |
Apache License 2.0 |
nginx |
mirantis.azurecr.io/openstack/extra/nginx:1.23.4-alpine-slim |
Apache License 2.0 |
tgt |
mirantis.azurecr.io/general/tgt:1.0.x-focal-20230423172355 |
GPL-2.0 |
requirements |
mirantis.azurecr.io/openstack/requirements:victoria-focal-20230423104356 |
Apache License 2.0 |
placement |
mirantis.azurecr.io/openstack/placement:victoria-focal-20230423104356 |
Apache License 2.0 |
stepler |
mirantis.azurecr.io/openstack/stepler:victoria-focal-20230423172355 |
Apache License 2.0 |
masakari |
mirantis.azurecr.io/openstack/masakari:victoria-focal-20230423104356 |
Apache License 2.0 |
masakari-monitors |
mirantis.azurecr.io/openstack/masakari-monitors:victoria-focal-20230423104356 |
Apache License 2.0 |
ironic-inspector |
mirantis.azurecr.io/openstack/ironic-inspector:victoria-focal-20230423104356 |
Apache License 2.0 |
panko |
mirantis.azurecr.io/openstack/panko:victoria-focal-20230423104356 |
Apache License 2.0 |
MOSK 23.1.4 OpenStack Yoga binaries and Docker images
Component |
Path |
License information for main executable programs |
|---|---|---|
Binaries |
||
octavia-amphora |
https://binary.mirantis.com/openstack/bin/octavia/amphora-x64-haproxy-yoga-20230227101732.qcow2 |
Mirantis Proprietary License |
mirantis |
https://binary.mirantis.com/openstack/bin/horizon/mirantis-xena-9f691e3-20220110111511.tar.gz |
Mirantis Proprietary License |
kernel |
https://binary.mirantis.com/openstack/bin/ironic/tinyipa/tinyipa-stable-yoga-20230128061113.vmlinuz |
GPL-2.0 |
initramfs |
https://binary.mirantis.com/openstack/bin/ironic/tinyipa/tinyipa-stable-yoga-20230128061113.gz |
GPL-2.0 |
service-image |
https://binary.mirantis.com/openstack/bin/manila/manila-service-image-20221228132450.qcow2 |
Mirantis Proprietary License |
Docker images |
||
keystone |
mirantis.azurecr.io/openstack/keystone:yoga-focal-20230524115243 |
Apache License 2.0 |
heat |
mirantis.azurecr.io/openstack/heat:yoga-focal-20230524115243 |
Apache License 2.0 |
glance |
mirantis.azurecr.io/openstack/glance:yoga-focal-20230524115243 |
Apache License 2.0 |
cinder |
mirantis.azurecr.io/openstack/cinder:yoga-focal-20230524115243 |
Apache License 2.0 |
neutron |
mirantis.azurecr.io/openstack/neutron:yoga-focal-20230524115243 |
Apache License 2.0 |
nova |
mirantis.azurecr.io/openstack/nova:yoga-focal-20230524115243 |
Apache License 2.0 |
horizon |
mirantis.azurecr.io/openstack/horizon:yoga-focal-20230524115243 |
Apache License 2.0 |
tempest |
mirantis.azurecr.io/openstack/tempest:yoga-focal-20230524115243 |
Apache License 2.0 |
octavia |
mirantis.azurecr.io/openstack/octavia:yoga-focal-20230524115243 |
Apache License 2.0 |
designate |
mirantis.azurecr.io/openstack/designate:yoga-focal-20230524115243 |
Apache License 2.0 |
ironic |
mirantis.azurecr.io/openstack/ironic:yoga-focal-20230524115243 |
Apache License 2.0 |
barbican |
mirantis.azurecr.io/openstack/barbican:yoga-focal-20230524115243 |
Apache License 2.0 |
libvirt |
mirantis.azurecr.io/general/libvirt:6.0.0-focal-20230427072424 |
LGPL-2.1 License |
pause |
mirantis.azurecr.io/general/external/pause:3.1 |
Apache License 2.0 |
openvswitch |
mirantis.azurecr.io/general/openvswitch:2.13-focal-20230524130506 |
Apache License 2.0 |
openvswitch-dpdk |
mirantis.azurecr.io/general/openvswitch-dpdk:2.13-focal-20230524130506 |
Apache License 2.0 |
openstack-tools |
mirantis.azurecr.io/openstack/openstack-tools:yoga-focal-20230524115243 |
Apache License 2.0 |
rabbitmq-3.10.x |
mirantis.azurecr.io/openstack/extra/rabbitmq:3.10.18-focal-20230222154055 |
Mozilla Public License 2.0 |
rabbitmq-3.10.x-management |
mirantis.azurecr.io/openstack/extra/rabbitmq-management:3.10.18-focal-20230222154055 |
Mozilla Public License 2.0 |
amqproxy-0.8.x |
mirantis.azurecr.io/general/amqproxy:0.8.6-alpine3.17.3-20230422135216 |
MIT license |
kubernetes-entrypoint |
mirantis.azurecr.io/openstack/extra/kubernetes-entrypoint:v1.0.1-27d64fb-20230421151539 |
Apache License 2.0 |
memcached |
mirantis.azurecr.io/general/memcached:1.6.19-alpine3.17.3 |
BSD 3-Clause “New” or “Revised” License |
etcd |
mirantis.azurecr.io/openstack/extra/etcd:v3.5.8-alpine-20230422141943 |
Apache License 2.0 |
powerdns |
mirantis.azurecr.io/openstack/extra/powerdns:4.7-alpine-20230523174753 |
GPL-2.0 License |
nginx-ingress-controller |
mirantis.azurecr.io/openstack/extra/nginx-ingress-controller:1.3.1-alpine-20230422140933 |
Apache License 2.0 |
tls-proxy |
mirantis.azurecr.io/openstack/tls-proxy:focal-20220804082840 |
Mirantis Proprietary License |
defaultbackend |
mirantis.azurecr.io/openstack/extra/defaultbackend:v1.19.2-77af1ef-20220823043839 |
Apache License 2.0 |
mariadb |
mirantis.azurecr.io/general/mariadb:10.6.12-focal-20230423170220 |
GPLv2, LGPLv2.1 (client libraries) |
rabbitmq-exporter |
mirantis.azurecr.io/stacklight/rabbitmq-exporter:1.0.0-RC19 |
MIT License |
memcached-exporter |
mirantis.azurecr.io/stacklight/memcached-exporter:v0.11.3 |
Apache License 2.0 |
prometheus-mysql-exporter |
mirantis.azurecr.io/stacklight/mysqld-exporter:v0.11.0 |
Apache License 2.0 |
aodh |
mirantis.azurecr.io/openstack/aodh:yoga-focal-20230524115243 |
Apache License 2.0 |
ceilometer |
mirantis.azurecr.io/openstack/ceilometer:yoga-focal-20230524115243 |
Apache License 2.0 |
gnocchi |
mirantis.azurecr.io/openstack/gnocchi:yoga-focal-20230524115243 |
Apache License 2.0 |
redis |
mirantis.azurecr.io/openstack/extra/redis:7.0.11-alpine3.17 |
BSD 3-Clause “New” or “Revised” License |
frr |
mirantis.azurecr.io/general/external/docker.io/frrouting/frr:v8.5.1 |
GPL-2.0 and LGPL-2.1 |
strongswan |
mirantis.azurecr.io/openstack/extra/strongswan:alpine-5.9.8-20230522060448 |
GPL-2.0 |
rsyslog |
mirantis.azurecr.io/openstack/extra/rsyslog:v8.2001.0-20230423172355 |
GNU General Public License v3 |
descheduler |
mirantis.azurecr.io/openstack/extra/descheduler:v0.27.0 |
Apache License 2.0 |
nginx |
mirantis.azurecr.io/openstack/extra/nginx:1.23.4-alpine-slim |
Apache License 2.0 |
tgt |
mirantis.azurecr.io/general/tgt:1.0.x-focal-20230423172355 |
GPL-2.0 |
requirements |
mirantis.azurecr.io/openstack/requirements:yoga-focal-20230524115243 |
Apache License 2.0 |
stepler |
mirantis.azurecr.io/openstack/stepler:yoga-focal-20230423172355 |
Apache License 2.0 |
placement |
mirantis.azurecr.io/openstack/placement:yoga-focal-20230524115243 |
Apache License 2.0 |
masakari |
mirantis.azurecr.io/openstack/masakari:yoga-focal-20230524115243 |
Apache License 2.0 |
masakari-monitors |
mirantis.azurecr.io/openstack/masakari-monitors:yoga-focal-20230524115243 |
Apache License 2.0 |
ironic-inspector |
mirantis.azurecr.io/openstack/ironic-inspector:yoga-focal-20230524115243 |
Apache License 2.0 |
manila |
mirantis.azurecr.io/openstack/manila:yoga-focal-20230524115243 |
Apache License 2.0 |
MOSK 23.1.4 OpenStack Helm charts
MOSK 23.1.4 Tungsten Fabric 21.4 artifacts
Component |
Path |
License information for main executable programs |
|---|---|---|
Helm charts |
||
Tungsten Fabric Operator |
https://binary.mirantis.com/tungsten/helm/tungstenfabric-operator-0.11.11.tgz |
Mirantis Proprietary License |
Docker images |
||
Tungsten Fabric Operator |
mirantis.azurecr.io/tungsten-operator/tungstenfabric-operator:0.11.11 |
Mirantis Proprietary License |
Analytics Alarm |
mirantis.azurecr.io/tungsten/contrail-analytics-alarm-gen:21.4.20230306000000 |
Apache License 2.0 |
Analytics |
mirantis.azurecr.io/tungsten/contrail-analytics-api:21.4.20230306000000 |
Apache License 2.0 |
mirantis.azurecr.io/tungsten/contrail-analytics-collector:21.4.20230306000000 |
Apache License 2.0 |
|
Analytics DB |
mirantis.azurecr.io/tungsten/contrail-analytics-query-engine:21.4.20230306000000 |
Apache License 2.0 |
Analytics SNMP |
mirantis.azurecr.io/tungsten/contrail-analytics-snmp-collector:21.4.20230306000000 |
Apache License 2.0 |
mirantis.azurecr.io/tungsten/contrail-analytics-snmp-topology:21.4.20230306000000 |
Apache License 2.0 |
|
Config |
mirantis.azurecr.io/tungsten/contrail-controller-config-api:21.4.20230306000000 |
Apache License 2.0 |
mirantis.azurecr.io/tungsten/contrail-controller-config-devicemgr:21.4.20230306000000 |
Apache License 2.0 |
|
mirantis.azurecr.io/tungsten/contrail-controller-config-dnsmasq:21.4.20230306000000 |
Apache License 2.0 |
|
mirantis.azurecr.io/tungsten/contrail-controller-config-schema:21.4.20230306000000 |
Apache License 2.0 |
|
mirantis.azurecr.io/tungsten/contrail-controller-config-svcmonitor:21.4.20230306000000 |
Apache License 2.0 |
|
Control |
mirantis.azurecr.io/tungsten/contrail-controller-control-control:21.4.20230306000000 |
Apache License 2.0 |
mirantis.azurecr.io/tungsten/contrail-controller-control-dns:21.4.20230306000000 |
Apache License 2.0 |
|
mirantis.azurecr.io/tungsten/contrail-controller-control-named:21.4.20230306000000 |
Apache License 2.0 |
|
Web UI |
mirantis.azurecr.io/tungsten/contrail-controller-webui-job:21.4.20230306000000 |
Apache License 2.0 |
mirantis.azurecr.io/tungsten/contrail-controller-webui-web:21.4.20230306000000 |
Apache License 2.0 |
|
Nodemanager |
mirantis.azurecr.io/tungsten/contrail-nodemgr:21.4.20230306000000 |
Apache License 2.0 |
TF Provisioner |
mirantis.azurecr.io/tungsten/contrail-provisioner:21.4.20230306000000 |
Apache License 2.0 |
vRouter |
mirantis.azurecr.io/tungsten/contrail-vrouter-agent:21.4.20230306000000 |
Apache License 2.0 |
mirantis.azurecr.io/tungsten/contrail-vrouter-agent-dpdk:21.4.20230306000000 |
Apache License 2.0 |
|
mirantis.azurecr.io/tungsten/contrail-node-init:21.4.20230306000000 |
Apache License 2.0 |
|
mirantis.azurecr.io/tungsten/contrail-vrouter-kernel-build-init:21.4.20230306000000 |
Apache License 2.0 |
|
Cassandra operator |
mirantis.azurecr.io/tungsten-operator/casskop:2.1.16 |
Apache License 2.0 |
Cassandra |
mirantis.azurecr.io/tungsten/cassandra-bootstrap:0.1.11 |
Apache License 2.0 |
mirantis.azurecr.io/tungsten/cassandra:3.11.10-20230126 |
Apache License 2.0 |
|
mirantis.azurecr.io/tungsten/instaclustr-icarus:v2-20230328121138 |
Apache License 2.0 |
|
mirantis.azurecr.io/tungsten/cass-config-builder:v2-20230424135332 |
Apache License 2.0 |
|
Kafka operator |
mirantis.azurecr.io/tungsten-operator/kafka-k8s-operator:0.3.2 |
Mirantis Proprietary License |
Kafka |
mirantis.azurecr.io/tungsten/cp-kafka:7.4.0 |
Apache License 2.0 |
mirantis.azurecr.io/stacklight/jmx-exporter:0.18.0-debian-11-r9 |
Apache License 2.0 |
|
Pause |
mirantis.azurecr.io/general/external/pause:3.1 |
Google Cloud Platform |
RabbitMQ operator |
mirantis.azurecr.io/tungsten-operator/rabbitmq-operator:0.3.2 |
Mirantis Proprietary License |
RabbitMQ |
mirantis.azurecr.io/tungsten/rabbitmq:3.11.2 |
Mozilla Public License 2.0 |
mirantis.azurecr.io/stacklight/rabbitmq-exporter:1.0.0-RC19 |
MIT License |
|
ZooKeeper operator |
mirantis.azurecr.io/tungsten-operator/zookeeper-operator:0.2.15-17-de1dffc4 |
Apache License 2.0 |
ZooKeeper |
mirantis.azurecr.io/tungsten/zookeeper:3.8.1-20230425 |
Apache License 2.0 |
Redis operator |
mirantis.azurecr.io/tungsten-operator/redis-operator:0.3.7 |
Apache License 2.0 |
Redis |
mirantis.azurecr.io/tungsten/redis:7.0.11-alpine3.17 |
BSD 3-Clause “New” or “Revised” License |
mirantis.azurecr.io/stacklight/redis_exporter:v1.45.0 |
BSD 3-Clause “New” or “Revised” License |
|
TF Test |
mirantis.azurecr.io/tungsten/tungsten-pytest:0.1-20230420090701 |
MIT License |
TF CLI |
mirantis.azurecr.io/tungsten/tf-cli:0.1-20230424100414 |
MIT License |
TF NodeInfo |
mirantis.azurecr.io/tungsten/tf-nodeinfo:0.1-20230328120524 |
MIT License |
TF Tools |
mirantis.azurecr.io/tungsten/contrail-tools:21.4.20230306000000 |
Apache License 2.0 |
kubernetes-entrypoint |
mirantis.azurecr.io/openstack/extra/kubernetes-entrypoint:v1.0.1-48d1e8a-20220919122849 |
Apache License 2.0 |
MOSK 23.1.4 StackLight artifacts
Component |
Path |
License information for main executable programs |
|---|---|---|
Docker images |
||
prometheus-libvirt-exporter |
mirantis.azurecr.io/stacklight/prometheus-libvirt-exporter:v0.2-20230519023010 |
Mirantis Proprietary License |
tungstenfabric-prometheus-exporter |
mirantis.azurecr.io/stacklight/tungstenfabric-prometheus-exporter:0.1-20230330133839 |
Mirantis Proprietary License |
Helm charts |
||
prometheus-libvirt-exporter |
https://binary.mirantis.com/stacklight/helm/prometheus-libvirt-exporter-0.2.0-mcp-1.tgz |
Mirantis Proprietary License |
prometheus-tungstenfabric-exporter |
https://binary.mirantis.com/stacklight/helm/prometheus-tungstenfabric-exporter-0.2.0-mcp-3.tgz |
Mirantis Proprietary License |
In total, in the MOSK 23.1.4 release, 8 Common Vulnerabilities and Exposures (CVE) have been fixed: 1 of critical and 7 of high severity.
The full list of the CVEs present in the current MOSK release is available at the Mirantis Security Portal.
Image |
Component name |
CVE |
|---|---|---|
openstack/extra/descheduler |
golang.org/x/net |
CVE-2022-41723 (High) |
openstack/extra/powerdns |
libpq |
CVE-2023-2454 (High) |
openstack/extra/strongswan |
libcurl |
CVE-2023-28319 (High) |
CVE-2023-28321 (High) |
||
CVE-2023-28322 (High) |
||
libcap |
CVE-2023-2603 (High) |
|
openstack/horizon |
django |
CVE-2023-31047 (Critical) |
openstack/manila |
sqlparse |
CVE-2023-30608 (High) |
The following issues have been addressed in the MOSK 23.1.4 release:
[27031] Fixed the removal of objects marked as
Deletedfrom the Barbican database during the database cleanup.[30224] Decreased the default weight for
build_failure_weight_multiplierto2to normalize instance spreading across compute nodes.[30673] Fixed the issue with duplicate tasks responses from the
ironic-pythonagent on theironic-conductorside.[30888] Adjusted the caching time for PowerDNS to fit Designate timeouts.
[31021] Fixed the race in
openstack-controllerthat could lead to setting the default user names and passwords in configuration files during initial deployment.[31358] Configured the warning message about the world readable directory with fernet keys to be logged only once during the startup.
[31711] Started to pass the autogenerated
memcache_secret_keyto avoid its regeneration every time the Manila Helm chart gets updated.
This section describes the patch-related known issues with available workarounds.
During the initial deployment of Mirantis Container Cloud, some nodes may get stuck in the cleaning state. The workaround is to wipe disks manually before initializing the Mirantis Container Cloud bootstrap.
Learn more about new release cadence
Release notes for older product versions
22.5
Release date |
December 19, 2022 |
|---|---|
Name |
MOSK 22.5 |
Cluster release |
12.5.0 |
Highlights |
The fifth and last MOSK release in 2022 introduces the following key features:
|
Component |
Support scope |
Feature |
|---|---|---|
OpenStack |
Full |
|
Full |
||
TechPreview |
||
TechPreview |
||
Mirantis Kubernetes Engine |
Full |
|
Ceph |
Full |
Automated configuration of public FQDN for the Object Storage endpoint |
StackLight |
Full |
|
Container Cloud |
Full |
|
Documentation |
n/a |
Added full support for OpenStack Yoga with Open vSwitch and Tungsten Fabric 2011 networking backends.
Starting from 22.5, MOSK deploys all new clouds using OpenStack Yoga by default. To upgrade an existing cloud from OpenStack Victoria to Yoga, follow the Upgrade OpenStack procedure.
For the OpenStack support cycle in MOSK, refer to OpenStack support cycle.
Highlights from upstream supported by Mirantis OpenStack deployed on Yoga
[Cinder] Removed the deprecated Block Storage API version 2.0. Instead, use the Block Storage API version 3.0 that is fully compatible with the previous version.
[Cinder] Removed the requirement for the request URLs to contain a project ID in the Block Storage API making it more consistent with other OpenStack APIs. For backward compatibility, legacy URLs containing a project ID continue to be recognized.
[Designate] Added support for the
CERTresource record type enabling new use cases such as secure email and publication of certificate revocation list through DNS.[Horizon] Added support for the Network QoS Policy creation.
[Glance] Implemented
/v2/images/<image-id>/tasksto get tasks associated with an image.[Ironic] Changed the default deployment boot mode from legacy BIOS to UEFI.
[Masakari] Added support for disabling and enabling failover segments. Now, cloud operators can put whole segments into the maintenance mode.
[Neutron] Implemented the
address-groupsresource that can be used to add groups of IP addresses to security group rules.[Nova] Added support for the API microversion 2.90. It enables the users to configure the host name exposed through the Nova metadata service during instances creating or rebuilding.
[Octavia] Increased the performance and scalability of load balancers that use the amphora provider when using amphora images built with version 2.x of the HAProxy load balancing engine.
[Octavia] Improved the observability of load balancers by adding the
PROMETHEUSlisteners that expose a Prometheus exporter endpoint. The Octavia amphora provider exposes over 150 unique metrics.
To view the full list of OpenStack Yoga features, including those not supported by MOSK, refer to OpenStack Yoga upstream documentation: Release notes and source code.
Implemented the capability to securely expose part of a MOSK cluster message bus (RabbitMQ) to the outside world. This enables external consumers to subscribe to notification messages emitted by the cluster services and can be helpful in several use cases:
Analysis of notification history for retrospective security audit
Real-time aggregation of notification messages to collect statistics of cloud resource consumption for capacity planning or charge-back
The external notification endpoint can be easily enabled and configured through
the OpenStackDeployment custom resource.
TechPreview
Implemented the ability to enable the BGP load-balancing mode for MOSK underlying Kubernetes to allow distribution of services providing OpenStack APIs across multiple independent racks that have no L2 segments in common.
Based MOSK 22.5 on the Cluster release 12.5.0 that supports Mirantis Kubernetes Engine (MKE) 3.5.5.
Learn more
The fully qualified domain name (FQDN) for the Object Storage service
(Ceph Object gateway) public endpoint is now configurable through just
a single parameter in the KaaSCephCluster custom resource, which is
spec.cephClusterSpec.ingress.publicDomain. Previously, you had to perform
a set of manual steps to define a custom name. If the parameter is not set,
the FQDN settings from the OpenStackDeployment custom resource apply
by default.
The new parameter simplifies configuration of Transport Layer Security of user-facing endpoints of the Object Storage service.
Implemented the following enhancements for etcd monitoring:
Introduced etcd monitoring for OpenStack by implementing the Etcd Grafana dashboard and by adding OpenStack to the set of existing alerts for etcd that were used for MKE clusters only in previous releases.
Improved etcd monitoring for MKE on MOSK clusters by implementing the Etcd dashboard and
etcdDbSizeCriticalandetcdDbSizeMajoralerts that inform about the size of the etcd database.
Implemented the ability to set a custom value for a predefined node label using
the Container Cloud web UI. The list of available node labels is
obtained from allowedNodeLabels of your current Cluster release.
If the value field is not defined in allowedNodeLabels, select the
check box of the required label and define an appropriate custom value for
this label to be set to the node.
Published concept documentation about implementing edge computing in MOSK using the remote computes design
Learn more
Restructured the content about the maintenance of OpenStack databases
Mirantis has tested MOSK against a very specific configuration and can guarantee a predictable behavior of the product only in the exact same environments. The table below includes the major MOSK components with the exact versions against which testing has been performed.
Component |
Version |
|---|---|
Cluster release |
12.5.0 (Cluster release notes) |
OpenStack |
Yoga |
OpenStack Operator |
0.11.7 |
Tungsten Fabric |
|
Tungsten Fabric Operator |
0.10.5 |
See also
For the supported versions of operating system, Ceph, and other components, refer to Compatibility Matrix.
This section describes the MOSK known issues with available workarounds. For the known issues in the related version of Mirantis Container Cloud, refer to Mirantis Container Cloud: Release Notes.
This section lists the OpenStack known issues with workarounds for the Mirantis OpenStack for Kubernetes release 22.5.
[29501] Cinder periodic database cleanup resets the state of volumes
[25594] Security groups shared through RBAC cannot be used to create instances
One of the most common symptoms of the high CPU load of MariaDB is slow API responses. To troubleshoot the issue, verify the CPU consumption of MariaDB using the General > Kubernetes Pods Grafana dashboard or through the CLI as follows:
Obtain the resource consumption details for the MariaDB server:
kubectl -n openstack exec -it mariadb-server-0 -- bash mysql@mariadb-server-0:/$ top
Example of system response:
top - 19:16:29 up 278 days, 20:56, 0 users, load average: 16.62, 16.54, 16.39 Tasks: 8 total, 1 running, 7 sleeping, 0 stopped, 0 zombie %Cpu(s): 6.3 us, 2.8 sy, 0.0 ni, 89.6 id, 0.0 wa, 0.0 hi, 1.3 si, 0.0 st MiB Mem : 515709.3 total, 375731.7 free, 111383.8 used, 28593.7 buff/cache MiB Swap: 0.0 total, 0.0 free, 0.0 used. 399307.2 avail Mem PID USER PR NI VIRT RES SHR S %CPU %MEM TIME+ COMMAND 275 mysql 20 0 76.3g 18.8g 1.0g S 786.4 3.7 22656,15 mysqld
Determine which exact query is progressing. This is usually the one in the
Sending datastate:mysql@mariadb-server-0:/$ mysql -u root -p$MYSQL_DBADMIN_PASSWORD -e "show processlist;" | grep -v Sleep
Example of system response:
Id User Host db Command Time State Info Progress 60067757 placementgF9D11u29 10.233.195.246:40746 placement Query 10 Sending data SELECT a.id, a.resource_class_id, a.used, a.updated_at, a.created_at, c.id AS consumer_id, c.generat 0.000
Obtain more information about the query and the used tables:
mysql@mariadb-server-0:/$ mysql -u root -p$MYSQL_DBADMIN_PASSWORD -e " ANALYZE FORMAT=JSON SELECT <QUERY_ID>;"
Example of system response:
"table": { "table_name": "c", "access_type": "eq_ref", "possible_keys": [ "uniq_consumers0uuid", "consumers_project_id_user_id_uuid_idx", "consumers_project_id_uuid_idx" ], "key": "uniq_consumers0uuid", "key_length": "110", "used_key_parts": ["uuid"], "ref": ["placement.a.consumer_id"], "r_loops": 838200, "rows": 1, "r_rows": 1, "r_table_time_ms": 62602.5453, "r_other_time_ms": 369.5835268, "filtered": 100, "r_filtered": 0.005249344, "attached_condition": "c.user_id = u.`id` and c.project_id = p.`id`" }
If you are observing a huge difference between the
filteredandr_filteredcolumns for the query, as in the example of system response above, analyze the performance of tables by running the ANALYZE TABLE <TABLE_NAME>; and ANALYZE TABLE <TABLE_NAME> PERSISTENT FOR ALL; commands:mysql@mariadb-server-0:/$ mysql -u root -p$MYSQL_DBADMIN_PASSWORD MariaDB > ANALYZE TABLE placement.allocations; MariaDB > ANALYZE TABLE placement.allocations PERSISTENT FOR ALL; MariaDB > ANALYZE TABLE placement.consumers; MariaDB > ANALYZE TABLE placement.consumers PERSISTENT FOR ALL; MariaDB > ANALYZE TABLE placement.users; MariaDB > ANALYZE TABLE placement.users PERSISTENT FOR ALL; MariaDB > ANALYZE TABLE placement.projects; MariaDB > ANALYZE TABLE placement.projects PERSISTENT FOR ALL;
Due to an issue in the database auto-cleanup job for the Block Storage service
(OpenStack Cinder), the state of volumes that are attached to instances gets
reset every time the job runs. The instances can still write and read block
storage data, however, volume objects appear in the OpenStack API as
not attached causing confusion.
The workaround is to temporarily disable the job until the issue is fixed and execute the script below to restore the affected instances.
To disable the job, update the OpenStackDeployment custom resource as
follows:
kind: OpenStackDeployment
spec:
features:
database:
cleanup:
cinder:
enabled: false
To restore the affected instances:
Obtain one of the Nova API pods:
nova_api_pod=$(kubectl -n openstack get pod -l application=nova,component=os-api --no-headers | head -n1 | awk '{print $1}')
Download the
restore_volume_attachments.pyscript to your local environment.Note
The provided script does not fix the Cinder database clean-up job and is only intended to restore the functionality of the affected instances. Therefore, leave the job disabled.
Copy the script to the Nova API pod:
kubectl -n openstack cp restore_volume_attachments.py $nova_api_pod:tmp/
Run the script in the dry-run mode to only list affected instances and volumes:
kubectl -n openstack exec -ti $nova_api_pod -- python /tmp/restore_volume_attachments.py --dry-run
Run the script to restore the volume attachments:
kubectl -n openstack exec -ti $nova_api_pod -- python /tmp/restore_volume_attachments.py
Multiprotocol Label Switching over Generic Routing Encapsulation (MPLSoGRE) provides limited throughput while sending data between VMs up to 38 Mbps, as per Mirantis tests.
As a workaround, switch the encapsulation type to VXLAN in the
OpenStackDeployment custom resource:
spec:
services:
networking:
neutron:
values:
conf:
bagpipe_bgp:
dataplane_driver_ipvpn:
mpls_over_gre: "False"
vxlan_encap: "True"
This section lists the Tungsten Fabric known issues with workarounds for the Mirantis OpenStack for Kubernetes release 22.5. For Tungsten Fabric limitations, see Tungsten Fabric known limitations.
[13755] TF pods switch to CrashLoopBackOff after a simultaneous reboot
[10096] tf-control does not refresh IP addresses of Cassandra pods
Rebooting all Cassandra cluster TFConfig or TFAnalytics nodes, maintenance, or other circumstances that cause the Cassandra pods to start simultaneously may cause a broken Cassandra TFConfig and/or TFAnalytics cluster. In this case, Cassandra nodes do not join the ring and do not update the IPs of the neighbor nodes. As a result, the TF services cannot operate Cassandra cluster(s).
To verify that a Cassandra cluster is affected:
Run the nodetool status command specifying the config or
analytics cluster and the replica number:
kubectl -n tf exec -it tf-cassandra-<config/analytics>-dc1-rack1-<replica number> -c cassandra -- nodetool status
Example of system response with outdated IP addresses:
Datacenter: DC1
===============
Status=Up/Down
|/ State=Normal/Leaving/Joining/Moving
-- Address Load Tokens Owns (effective) Host ID Rack
DN <outdated ip> ? 256 64.9% a58343d0-1e3f-4d54-bcdf-9b9b949ca873 r1
DN <outdated ip> ? 256 69.8% 67f1d07c-8b13-4482-a2f1-77fa34e90d48 r1
Datacenter: dc1
===============
Status=Up/Down
|/ State=Normal/Leaving/Joining/Moving
-- Address Load Tokens Owns (effective) Host ID Rack
UN <actual ip> 3.84 GiB 256 65.2% 7324ebc4-577a-425f-b3de-96faac95a331 rack1
Workaround:
Manually delete a Cassandra pod from the failed config or analytics
cluster to re-initiate the bootstrap process for one of the Cassandra nodes:
kubectl -n tf delete pod tf-cassandra-<config/analytics>-dc1-rack1-<replica number>
The tf-control service resolves the DNS names of Cassandra pods at startup
and does not update them if Cassandra pods got new IP addresses, for example,
in case of a restart. As a workaround, to refresh the IP addresses of
Cassandra pods, restart the tf-control pods one by one:
kubectl -n tf delete pod tf-control-<hash>
Caution
Before restarting the tf-control pods:
Verify that the new pods are successfully spawned.
Verify that no vRouters are connected to only one
tf-controlpod that will be restarted.
This section lists the cluster update known issues with workarounds for the Mirantis OpenStack for Kubernetes release 22.5.
[29438] Cluster update gets stuck during the Tungsten Fabric operator update
[27797] Cluster ‘kubeconfig’ stops working during MKE minor version update
If the tungstenfabric-operator-metrics service was present on the cluster
in MOSK 22.4, the update to 22.5 can stuck due to absence
of correct labels for this service. As a workaround, delete the service
manually:
kubectl -n tf delete svc tungstenfabric-operator-metrics
During update of a Container Cloud management cluster, if the MKE minor
version is updated from 3.4.x to 3.5.x, access to the cluster using the
existing kubeconfig fails with the You must be logged in to the server
(Unauthorized) error due to OIDC settings being reconfigured.
As a workaround, during the Container Cloud cluster update, use the
admin kubeconfig instead of the existing one. Once the update
completes, you can use the existing cluster kubeconfig again.
To obtain the admin kubeconfig:
kubectl --kubeconfig <pathToMgmtKubeconfig> get secret -n <affectedClusterNamespace> \
-o yaml <affectedClusterName>-kubeconfig | awk '/admin.conf/ {print $2}' | \
head -1 | base64 -d > clusterKubeconfig.yaml
This section lists the Ceph known issues with workarounds for the Mirantis OpenStack for Kubernetes release 22.5.
The status section in the KaaSCephCluster.status CR does not reflect
issues during the process of a Ceph cluster deletion.
As a workaround, inspect Ceph Controller logs on the managed cluster:
kubectl --kubeconfig <managedClusterKubeconfig> -n ceph-lcm-mirantis logs <ceph-controller-pod-name>
This section lists the StackLight known issues with workarounds for the Mirantis OpenStack for Kubernetes release 22.5.
If a cluster does not currently have any ongoing operations that comprise
OpenStack notifications, the fluentd containers in the
fluentd-notifications Pods are frequently restarted due to false-positive
failures of liveness probe and trigger alerts.
Ignore such failures and alerts if the Pods are in the Running state.
To verify the fluentd-notifications Pods:
kubectl get po -n stacklight -l app=fluentd
Example of system response:
fluentd-notifications-64fdc5f5cd-pgmjp 1/1 Running 9 4h51m
fluentd-notifications-64fdc5f5cd-xjfrs 1/1 Running 9 4h51m
This section lists the components artifacts of the MOSK 22.5 release that includes binaries, Docker images, and Helm charts.
MOSK 22.5 OpenStack Yoga binaries and Docker images
Component |
Path |
License information for main executable programs |
|---|---|---|
Binaries |
||
initramfs |
https://binary.mirantis.com/openstack/bin/ironic/tinyipa/tinyipa-stable-yoga-20221117061110.gz |
GPL-2.0 |
kernel |
https://binary.mirantis.com/openstack/bin/ironic/tinyipa/tinyipa-stable-yoga-20221117061110.vmlinuz |
GPL-2.0 |
mirantis |
https://binary.mirantis.com/openstack/bin/horizon/mirantis-xena-9f691e3-20220110111511.tar.gz |
Mirantis Proprietary License |
octavia-amphora |
https://binary.mirantis.com/openstack/bin/octavia/amphora-x64-haproxy-yoga-20221118095950.qcow2 |
Mirantis Proprietary License |
service-image |
https://binary.mirantis.com/openstack/bin/manila/manila-service-image-1.3.0-77.qcow2 |
Mirantis Proprietary License |
Docker images |
||
keystone |
mirantis.azurecr.io/openstack/keystone:yoga-focal-20221118093824 |
Apache License 2.0 |
heat |
mirantis.azurecr.io/openstack/heat:yoga-focal-20221118093824 |
Apache License 2.0 |
glance |
mirantis.azurecr.io/openstack/glance:yoga-focal-20221118093824 |
Apache License 2.0 |
cinder |
mirantis.azurecr.io/openstack/cinder:yoga-focal-20221118093824 |
Apache License 2.0 |
neutron |
mirantis.azurecr.io/openstack/neutron:yoga-focal-20221118093824 |
Apache License 2.0 |
nova |
mirantis.azurecr.io/openstack/nova:yoga-focal-20221118093824 |
Apache License 2.0 |
horizon |
mirantis.azurecr.io/openstack/horizon:yoga-focal-20221118093824 |
Apache License 2.0 |
tempest |
mirantis.azurecr.io/openstack/tempest:yoga-focal-20221118093824 |
Apache License 2.0 |
octavia |
mirantis.azurecr.io/openstack/octavia:yoga-focal-20221118093824 |
Apache License 2.0 |
designate |
mirantis.azurecr.io/openstack/designate:yoga-focal-20221118093824 |
Apache License 2.0 |
ironic |
mirantis.azurecr.io/openstack/ironic:yoga-focal-20221118093824 |
Apache License 2.0 |
barbican |
mirantis.azurecr.io/openstack/barbican:yoga-focal-20221118093824 |
Apache License 2.0 |
libvirt |
mirantis.azurecr.io/general/libvirt:6.0.0-focal-20221028120749 |
LGPL-2.1 License |
pause |
mirantis.azurecr.io/general/external/pause:3.1 |
Apache License 2.0 |
openvswitch |
mirantis.azurecr.io/general/openvswitch:2.13-focal-20221028120749 |
Apache License 2.0 |
openvswitch-dpdk |
mirantis.azurecr.io/general/openvswitch-dpdk:2.13-focal-20221028120749 |
Apache License 2.0 |
openstack-tools |
mirantis.azurecr.io/openstack/openstack-tools:yoga-focal-20221118093824 |
Apache License 2.0 |
rabbitmq-3.10.x |
mirantis.azurecr.io/openstack/extra/rabbitmq:3.10.7-focal-20220810183358 |
Mozilla Public License 2.0 |
rabbitmq-3.10.x-management |
mirantis.azurecr.io/openstack/extra/rabbitmq-management:3.10.7-focal-20220810183358 |
Mozilla Public License 2.0 |
amqproxy-0.7.x |
mirantis.azurecr.io/general/amqproxy:v0.7.0 |
MIT license |
kubernetes-entrypoint |
mirantis.azurecr.io/openstack/extra/kubernetes-entrypoint:v1.0.1-48d1e8a-20220919122849 |
Apache License 2.0 |
memcached |
mirantis.azurecr.io/general/memcached:1.6.17-alpine3.16 |
BSD 3-Clause “New” or “Revised” License |
ceph-config-helper |
mirantis.azurecr.io/openstack/extra/ceph-config-helper:pacific-focal-20221027123328 |
Apache License 2.0, LGPL-2.1 or LGPL-3 |
etcd |
mirantis.azurecr.io/openstack/extra/etcd:v3.5.4-alpine-20221116085516 |
Apache License 2.0 |
powerdns |
mirantis.azurecr.io/openstack/extra/powerdns:4.2-alpine-20200117133238 |
GPL-2.0 License |
nginx-ingress-controller |
mirantis.azurecr.io/openstack/extra/nginx-ingress-controller:1.3.0 |
Apache License 2.0 |
tls-proxy |
mirantis.azurecr.io/openstack/tls-proxy:focal-20220804082840 |
Mirantis Proprietary License |
defaultbackend |
mirantis.azurecr.io/openstack/extra/defaultbackend:v1.19.2-77af1ef-20220823043839 |
Apache License 2.0 |
mariadb |
mirantis.azurecr.io/general/mariadb:10.6.7-focal-20221028120155 |
GPLv2, LGPLv2.1 (client libraries) |
rabbitmq-exporter |
mirantis.azurecr.io/stacklight/rabbitmq-exporter:v1.0.0-RC8 |
MIT License |
prometheus-memcached-exporter |
mirantis.azurecr.io/stacklight/memcached-exporter:0.9.0 |
Apache License 2.0 |
prometheus-mysql-exporter |
mirantis.azurecr.io/stacklight/mysqld-exporter:v0.11.0 |
Apache License 2.0 |
xrally-openstack |
mirantis.azurecr.io/openstack/extra/xrally-openstack:2.2.0-20221108015104 |
Apache License 2.0 |
aodh |
mirantis.azurecr.io/openstack/aodh:yoga-focal-20221118093824 |
Apache License 2.0 |
ceilometer |
mirantis.azurecr.io/openstack/ceilometer:yoga-focal-20221118093824 |
Apache License 2.0 |
gnocchi |
mirantis.azurecr.io/openstack/gnocchi:yoga-focal-20221118093824 |
Apache License 2.0 |
redis |
mirantis.azurecr.io/openstack/extra/redis:6.2.6-alpine3.15 |
BSD 3-Clause “New” or “Revised” License |
frr |
mirantis.azurecr.io/general/external/docker.io/frrouting/frr:v8.3.1 |
GPL-2.0 and LGPL-2.1 |
strongswan |
mirantis.azurecr.io/openstack/extra/strongswan:alpine-5.9.5-20221028090933 |
GPL-2.0 |
rsyslog |
mirantis.azurecr.io/openstack/extra/rsyslog:v8.2001.0-20221028120749 |
GNU General Public License v3 |
descheduler |
mirantis.azurecr.io/openstack/extra/descheduler:v0.25.0-amd64-20220922181123 |
Apache License 2.0 |
nginx |
mirantis.azurecr.io/openstack/extra/nginx:1.23.2-alpine |
Apache License 2.0 |
tgt |
mirantis.azurecr.io/general/tgt:1.0.x-focal-20221028120749 |
GPL-2.0 |
stepler |
mirantis.azurecr.io/openstack/stepler:yoga-focal-20221028141101 |
Apache License 2.0 |
placement |
mirantis.azurecr.io/openstack/placement:yoga-focal-20221118093824 |
Apache License 2.0 |
masakari |
mirantis.azurecr.io/openstack/masakari:yoga-focal-20221118093824 |
Apache License 2.0 |
masakari-monitors |
mirantis.azurecr.io/openstack/masakari-monitors:yoga-focal-20221118093824 |
Apache License 2.0 |
ironic-inspector |
mirantis.azurecr.io/openstack/ironic-inspector:yoga-focal-20221118093824 |
Apache License 2.0 |
manila |
mirantis.azurecr.io/openstack/manila:yoga-focal-20221118093824 |
Apache License 2.0 |
MOSK 22.5 OpenStack Victoria binaries and Docker images
Component |
Path |
License information for main executable programs |
|---|---|---|
Binaries |
||
initramfs |
https://binary.mirantis.com/openstack/bin/ironic/tinyipa/tinyipa-stable-victoria-20221021063512.gz |
GPL-2.0 |
kernel |
GPL-2.0 |
|
mirantis |
https://binary.mirantis.com/openstack/bin/horizon/mirantis-victoria-8f71802-20210119120707.tar.gz |
Mirantis Proprietary License |
octavia-amphora |
https://binary.mirantis.com/openstack/bin/octavia/amphora-x64-haproxy-victoria-20221028084954.qcow2 |
Mirantis Proprietary License |
service-image |
https://binary.mirantis.com/openstack/bin/manila/manila-service-image-1.3.0-77.qcow2 |
Mirantis Proprietary License |
Docker images |
||
keystone |
mirantis.azurecr.io/openstack/keystone:victoria-focal-20221028080549 |
Apache License 2.0 |
heat |
mirantis.azurecr.io/openstack/heat:victoria-focal-20221028080549 |
Apache License 2.0 |
glance |
mirantis.azurecr.io/openstack/glance:victoria-focal-20221028080549 |
Apache License 2.0 |
cinder |
mirantis.azurecr.io/openstack/cinder:victoria-focal-20221028080549 |
Apache License 2.0 |
neutron |
mirantis.azurecr.io/openstack/neutron:victoria-focal-20221028080549 |
Apache License 2.0 |
nova |
mirantis.azurecr.io/openstack/nova:victoria-focal-20221028080549 |
Apache License 2.0 |
horizon |
mirantis.azurecr.io/openstack/horizon:victoria-focal-20221028080549 |
Apache License 2.0 |
tempest |
mirantis.azurecr.io/openstack/tempest:victoria-focal-20221028080549 |
Apache License 2.0 |
octavia |
mirantis.azurecr.io/openstack/octavia:victoria-focal-20221028080549 |
Apache License 2.0 |
designate |
mirantis.azurecr.io/openstack/designate:victoria-focal-20221028080549 |
Apache License 2.0 |
ironic |
mirantis.azurecr.io/openstack/ironic:victoria-focal-20221028080549 |
Apache License 2.0 |
barbican |
mirantis.azurecr.io/openstack/barbican:victoria-focal-20221028080549 |
Apache License 2.0 |
libvirt |
mirantis.azurecr.io/general/libvirt:6.0.0-focal-20221028120749 |
LGPL-2.1 License |
pause |
mirantis.azurecr.io/general/external/pause:3.1 |
Apache License 2.0 |
openvswitch |
mirantis.azurecr.io/general/openvswitch:2.13-focal-20221028120749 |
Apache License 2.0 |
openvswitch-dpdk |
mirantis.azurecr.io/general/openvswitch-dpdk:2.13-focal-20221028120749 |
Apache License 2.0 |
openstack-tools |
mirantis.azurecr.io/openstack/openstack-tools:yoga-focal-20221028080549 |
Apache License 2.0 |
rabbitmq-3.10.x |
mirantis.azurecr.io/openstack/extra/rabbitmq:3.10.7-focal-20220810183358 |
Mozilla Public License 2.0 |
rabbitmq-3.10.x-management |
mirantis.azurecr.io/openstack/extra/rabbitmq-management:3.10.7-focal-20220810183358 |
Mozilla Public License 2.0 |
amqproxy-0.7.x |
mirantis.azurecr.io/general/amqproxy:v0.7.0 |
MIT license |
kubernetes-entrypoint |
mirantis.azurecr.io/openstack/extra/kubernetes-entrypoint:v1.0.1-48d1e8a-20220919122849 |
Apache License 2.0 |
memcached |
mirantis.azurecr.io/general/memcached:1.6.17-alpine3.16 |
BSD 3-Clause “New” or “Revised” License |
ceph-config-helper |
mirantis.azurecr.io/openstack/extra/ceph-config-helper:pacific-focal-20221027123328 |
Apache License 2.0, LGPL-2.1 or LGPL-3 |
etcd |
mirantis.azurecr.io/openstack/extra/etcd:v3.5.4-alpine-20221116085516 |
Apache License 2.0 |
powerdns |
mirantis.azurecr.io/openstack/extra/powerdns:4.2-alpine-20200117133238 |
GPL-2.0 License |
nginx-ingress-controller |
mirantis.azurecr.io/openstack/extra/nginx-ingress-controller:1.3.0 |
Apache License 2.0 |
tls-proxy |
mirantis.azurecr.io/openstack/tls-proxy:focal-20220804082840 |
Mirantis Proprietary License |
defaultbackend |
mirantis.azurecr.io/openstack/extra/defaultbackend:v1.19.2-77af1ef-20220823043839 |
Apache License 2.0 |
mariadb |
mirantis.azurecr.io/general/mariadb:10.6.7-focal-20221028120155 |
GPLv2, LGPLv2.1 (client libraries) |
rabbitmq-exporter |
mirantis.azurecr.io/stacklight/rabbitmq-exporter:v1.0.0-RC8 |
MIT License |
prometheus-memcached-exporter |
mirantis.azurecr.io/stacklight/memcached-exporter:0.9.0 |
Apache License 2.0 |
prometheus-mysql-exporter |
mirantis.azurecr.io/stacklight/mysqld-exporter:v0.11.0 |
Apache License 2.0 |
xrally-openstack |
mirantis.azurecr.io/openstack/extra/xrally-openstack:2.2.0-20221003215949 |
Apache License 2.0 |
aodh |
mirantis.azurecr.io/openstack/aodh:victoria-focal-20221028080549 |
Apache License 2.0 |
ceilometer |
mirantis.azurecr.io/openstack/ceilometer:victoria-focal-20221028080549 |
Apache License 2.0 |
gnocchi |
mirantis.azurecr.io/openstack/gnocchi:victoria-focal-20221028080549 |
Apache License 2.0 |
redis |
mirantis.azurecr.io/openstack/extra/redis:6.2.6-alpine3.15 |
BSD 3-Clause “New” or “Revised” License |
frr |
mirantis.azurecr.io/general/external/docker.io/frrouting/frr:v8.3.1 |
GPL-2.0 and LGPL-2.1 |
strongswan |
mirantis.azurecr.io/openstack/extra/strongswan:alpine-5.9.5-20221028090933 |
GPL License |
rsyslog |
mirantis.azurecr.io/openstack/extra/rsyslog:v8.2001.0-20221028120749 |
GNU General Public License v3 |
descheduler |
mirantis.azurecr.io/openstack/extra/descheduler:v0.25.0-amd64-20220922181123 |
Apache License 2.0 |
nginx |
mirantis.azurecr.io/openstack/extra/nginx:1.23.2-alpine |
Apache License 2.0 |
tgt |
mirantis.azurecr.io/general/tgt:1.0.x-focal-20221028120749 |
GPL-2.0 |
placement |
mirantis.azurecr.io/openstack/placement:victoria-focal-20221028080549 |
Apache License 2.0 |
stepler |
mirantis.azurecr.io/openstack/stepler:victoria-focal-20221028141116 |
Apache License 2.0 |
masakari |
mirantis.azurecr.io/openstack/masakari:victoria-focal-20221028080549 |
Apache License 2.0 |
masakari-monitors |
mirantis.azurecr.io/openstack/masakari-monitors:victoria-focal-20221028080549 |
Apache License 2.0 |
ironic-inspector |
mirantis.azurecr.io/openstack/ironic-inspector:victoria-focal-20221028080549 |
Apache License 2.0 |
panko |
mirantis.azurecr.io/openstack/panko:victoria-focal-20221028080549 |
Apache License 2.0 |
MOSK 22.5 OpenStack Helm charts
MOSK 22.5 Tungsten Fabric 2011 artifacts
Component |
Path |
License information for main executable programs |
|---|---|---|
Helm charts |
||
Tungsten Fabric Operator |
https://binary.mirantis.com/tungsten/helm/tungstenfabric-operator-0.10.5.tgz |
Mirantis Proprietary License |
Docker images |
||
Tungsten Fabric Operator |
mirantis.azurecr.io/tungsten-operator/tungstenfabric-operator:0.10.5 |
Mirantis Proprietary License |
Analytics |
mirantis.azurecr.io/tungsten/contrail-analytics-api:2011.20221123000911 |
Apache License 2.0 |
mirantis.azurecr.io/tungsten/contrail-analytics-collector:2011.20221123000911 |
Apache License 2.0 |
|
Analytics Alarm |
mirantis.azurecr.io/tungsten/contrail-analytics-alarm-gen:2011.20221123000911 |
Apache License 2.0 |
Analytics DB |
mirantis.azurecr.io/tungsten/contrail-analytics-query-engine:2011.20221123000911 |
Apache License 2.0 |
Analytics SNMP |
mirantis.azurecr.io/tungsten/contrail-analytics-snmp-collector:2011.20221123000911 |
Apache License 2.0 |
mirantis.azurecr.io/tungsten/contrail-analytics-snmp-topology:2011.20221123000911 |
Apache License 2.0 |
|
Config |
mirantis.azurecr.io/tungsten/contrail-controller-config-api:2011.20221123000911 |
Apache License 2.0 |
mirantis.azurecr.io/tungsten/contrail-controller-config-devicemgr:2011.20221123000911 |
Apache License 2.0 |
|
mirantis.azurecr.io/tungsten/contrail-controller-config-dnsmasq:2011.20221123000911 |
Apache License 2.0 |
|
mirantis.azurecr.io/tungsten/contrail-controller-config-schema:2011.20221123000911 |
Apache License 2.0 |
|
mirantis.azurecr.io/tungsten/contrail-controller-config-svcmonitor:2011.20221123000911 |
Apache License 2.0 |
|
mirantis.azurecr.io/openstack/extra/kubernetes-entrypoint:v1.0.0-20200311160233 |
Apache License 2.0 |
|
Control |
mirantis.azurecr.io/tungsten/contrail-controller-control-control:2011.20221123000911 |
Apache License 2.0 |
mirantis.azurecr.io/tungsten/contrail-controller-control-dns:2011.20221123000911 |
Apache License 2.0 |
|
mirantis.azurecr.io/tungsten/contrail-controller-control-named:2011.20221123000911 |
Apache License 2.0 |
|
Web UI |
mirantis.azurecr.io/tungsten/contrail-controller-webui-job:2011.20221123000911 |
Apache License 2.0 |
mirantis.azurecr.io/tungsten/contrail-controller-webui-web:2011.20221123000911 |
Apache License 2.0 |
|
vRouter |
mirantis.azurecr.io/tungsten/contrail-vrouter-agent:2011.20221123000911 |
Apache License 2.0 |
mirantis.azurecr.io/tungsten/contrail-vrouter-agent-dpdk:2011.20221123000911 |
Apache License 2.0 |
|
mirantis.azurecr.io/tungsten/contrail-vrouter-kernel-build-init:2011.20221123000911 |
Apache License 2.0 |
|
mirantis.azurecr.io/tungsten/contrail-node-init:2011.20221123000911 |
Apache License 2.0 |
|
Nodemanager |
mirantis.azurecr.io/tungsten/contrail-nodemgr:2011.20221123000911 |
Apache License 2.0 |
Provisioner |
mirantis.azurecr.io/tungsten/contrail-provisioner:2011.20221123000911 |
Apache License 2.0 |
Cassandra operator |
mirantis.azurecr.io/tungsten-operator/casskop:2.1.14 |
Apache License 2.0 |
Cassandra |
mirantis.azurecr.io/tungsten/cassandra-bootstrap:0.1.10 |
Apache License 2.0 |
mirantis.azurecr.io/tungsten/cassandra:3.11.10 |
Apache License 2.0 |
|
mirantis.azurecr.io/tungsten/instaclustr-icarus:v2-20220919122317 |
Apache License 2.0 |
|
mirantis.azurecr.io/tungsten/cass-config-builder:v2-20220919114133 |
Apache License 2.0 |
|
Kafka operator |
mirantis.azurecr.io/tungsten-operator/kafka-k8s-operator:0.2.2 |
Mirantis Proprietary License |
Kafka |
mirantis.azurecr.io/tungsten/cp-kafka:7.2.2 |
Apache License 2.0 |
mirantis.azurecr.io/tungsten/prometheus-jmx-exporter:0.17.2-debian-11-r6 |
Apache License 2.0 |
|
Pause |
mirantis.azurecr.io/general/external/pause:3.1 |
Google Cloud Platform |
RabbitMQ operator |
mirantis.azurecr.io/tungsten-operator/rabbitmq-operator:0.2.3 |
Mirantis Proprietary License |
RabbitMQ |
mirantis.azurecr.io/tungsten/rabbitmq:3.11.2 |
Mozilla Public License 2.0 |
mirantis.azurecr.io/stacklight/rabbitmq-exporter:v1.0.0-RC8 |
MIT License |
|
ZooKeeper operator |
mirantis.azurecr.io/tungsten-operator/zookeeper-operator:0.2.14 |
Apache License 2.0 |
ZooKeeper |
mirantis.azurecr.io/tungsten/zookeeper:3.7.1-20220914 |
Apache License 2.0 |
Redis operator |
mirantis.azurecr.io/tungsten-operator/redis-operator:0.3.4 |
Apache License 2.0 |
Redis |
mirantis.azurecr.io/tungsten/redis:7.0.5-alpine3.16 |
BSD 3-Clause “New” or “Revised” License |
mirantis.azurecr.io/openstack/extra/redis_exporter:v1.43.0-alpine |
BSD 3-Clause “New” or “Revised” License |
|
TF Test |
mirantis.azurecr.io/tungsten/tungsten-pytest:0.1-20221205131707 |
MIT License |
TF CLI |
mirantis.azurecr.io/tungsten/tf-cli:0.1-20221030153940 |
MIT License |
TF NodeInfo |
mirantis.azurecr.io/tungsten/tf-nodeinfo:0.1-20221109111149 |
MIT License |
TF Tools |
mirantis.azurecr.io/tungsten/contrail-tools:2011.20221123000911 |
Apache License 2.0 |
MOSK 22.5 Tungsten Fabric 21.4 artifacts
Important
Tungsten Fabric 21.4 is available as technical preview. For details, see Tungsten Fabric 21.4 support.
Component |
Path |
License information for main executable programs |
|---|---|---|
Helm charts |
||
Tungsten Fabric Operator |
https://binary.mirantis.com/tungsten/helm/tungstenfabric-operator-0.10.5.tgz |
Mirantis Proprietary License |
Docker images |
||
Tungsten Fabric Operator |
mirantis.azurecr.io/tungsten-operator/tungstenfabric-operator:0.10.5 |
Mirantis Proprietary License |
Analytics Alarm |
mirantis.azurecr.io/tungsten/contrail-analytics-alarm-gen:21.4.20221205000000 |
Apache License 2.0 |
Analytics |
mirantis.azurecr.io/tungsten/contrail-analytics-api:21.4.20221205000000 |
Apache License 2.0 |
mirantis.azurecr.io/tungsten/contrail-analytics-collector:21.4.20221205000000 |
Apache License 2.0 |
|
Analytics DB |
mirantis.azurecr.io/tungsten/contrail-analytics-query-engine:21.4.20221205000000 |
Apache License 2.0 |
Analytics SNMP |
mirantis.azurecr.io/tungsten/contrail-analytics-snmp-collector:21.4.20221205000000 |
Apache License 2.0 |
mirantis.azurecr.io/tungsten/contrail-analytics-snmp-topology:21.4.20221205000000 |
Apache License 2.0 |
|
Config |
mirantis.azurecr.io/tungsten/contrail-controller-config-api:21.4.20221205000000 |
Apache License 2.0 |
mirantis.azurecr.io/tungsten/contrail-controller-config-devicemgr:21.4.20221205000000 |
Apache License 2.0 |
|
mirantis.azurecr.io/tungsten/contrail-controller-config-dnsmasq:21.4.20221205000000 |
Apache License 2.0 |
|
mirantis.azurecr.io/tungsten/contrail-controller-config-schema:21.4.20221205000000 |
Apache License 2.0 |
|
mirantis.azurecr.io/tungsten/contrail-controller-config-svcmonitor:21.4.20221205000000 |
Apache License 2.0 |
|
Control |
mirantis.azurecr.io/tungsten/contrail-controller-control-control:21.4.20221205000000 |
Apache License 2.0 |
mirantis.azurecr.io/tungsten/contrail-controller-control-dns:21.4.20221205000000 |
Apache License 2.0 |
|
mirantis.azurecr.io/tungsten/contrail-controller-control-named:21.4.20221205000000 |
Apache License 2.0 |
|
Web UI |
mirantis.azurecr.io/tungsten/contrail-controller-webui-job:21.4.20221205000000 |
Apache License 2.0 |
mirantis.azurecr.io/tungsten/contrail-controller-webui-web:21.4.20221205000000 |
Apache License 2.0 |
|
Nodemanager |
mirantis.azurecr.io/tungsten/contrail-nodemgr:21.4.20221205000000 |
Apache License 2.0 |
TF Provisioner |
mirantis.azurecr.io/tungsten/contrail-provisioner:21.4.20221205000000 |
Apache License 2.0 |
vRouter |
mirantis.azurecr.io/tungsten/contrail-vrouter-agent:21.4.20221205000000 |
Apache License 2.0 |
mirantis.azurecr.io/tungsten/contrail-vrouter-agent-dpdk:21.4.20221205000000 |
Apache License 2.0 |
|
mirantis.azurecr.io/tungsten/contrail-node-init:21.4.20221205000000 |
Apache License 2.0 |
|
mirantis.azurecr.io/tungsten/contrail-vrouter-kernel-build-init:21.4.20221205000000 |
Apache License 2.0 |
|
Cassandra operator |
mirantis.azurecr.io/tungsten-operator/casskop:2.1.14 |
Apache License 2.0 |
Cassandra |
mirantis.azurecr.io/tungsten/cassandra-bootstrap:0.1.10 |
Apache License 2.0 |
mirantis.azurecr.io/tungsten/cassandra:3.11.10 |
Apache License 2.0 |
|
mirantis.azurecr.io/tungsten/instaclustr-icarus:v2-20220919122317 |
Apache License 2.0 |
|
mirantis.azurecr.io/tungsten/cass-config-builder:v2-20220919114133 |
Apache License 2.0 |
|
Kafka operator |
mirantis.azurecr.io/tungsten-operator/kafka-k8s-operator:0.2.2 |
Mirantis Proprietary License |
Kafka |
mirantis.azurecr.io/tungsten/cp-kafka:7.2.2 |
Apache License 2.0 |
mirantis.azurecr.io/tungsten/prometheus-jmx-exporter:0.17.2-debian-11-r6 |
Apache License 2.0 |
|
Pause |
mirantis.azurecr.io/general/external/pause:3.1 |
Google Cloud Platform |
RabbitMQ operator |
mirantis.azurecr.io/tungsten-operator/rabbitmq-operator:0.2.3 |
Mirantis Proprietary License |
RabbitMQ |
mirantis.azurecr.io/tungsten/rabbitmq:3.11.2 |
Mozilla Public License 2.0 |
mirantis.azurecr.io/stacklight/rabbitmq-exporter:v1.0.0-RC8 |
MIT License |
|
ZooKeeper operator |
mirantis.azurecr.io/tungsten-operator/zookeeper-operator:0.2.14 |
Apache License 2.0 |
ZooKeeper |
mirantis.azurecr.io/tungsten/zookeeper:3.7.1-20220914 |
Apache License 2.0 |
Redis operator |
mirantis.azurecr.io/tungsten-operator/redis-operator:0.3.4 |
Apache License 2.0 |
Redis |
mirantis.azurecr.io/tungsten/redis:7.0.5-alpine3.16 |
BSD 3-Clause “New” or “Revised” License |
mirantis.azurecr.io/openstack/extra/redis_exporter:v1.43.0-alpine |
BSD 3-Clause “New” or “Revised” License |
|
TF Test |
mirantis.azurecr.io/tungsten/tungsten-pytest:0.1-20221205131707 |
MIT License |
TF CLI |
mirantis.azurecr.io/tungsten/tf-cli:0.1-20221030153940 |
MIT License |
TF NodeInfo |
mirantis.azurecr.io/tungsten/tf-nodeinfo:0.1-20221109111149 |
MIT License |
TF Tools |
mirantis.azurecr.io/tungsten/contrail-tools:21.4.20221205000000 |
Apache License 2.0 |
MOSK 22.5 StackLight artifacts
Component |
Path |
License information for main executable programs |
|---|---|---|
Docker images |
||
prometheus-libvirt-exporter |
mirantis.azurecr.io/stacklight/prometheus-libvirt-exporter:v0.1-20200610164751 |
Mirantis Proprietary License |
prometheus-tungstenfabric-exporter |
mirantis.azurecr.io/stacklight/tungstenfabric-prometheus-exporter:0.1-20210115152338 |
Mirantis Proprietary License |
Helm charts |
||
prometheus-libvirt-exporter |
https://binary.mirantis.com/stacklight/helm/prometheus-libvirt-exporter-0.2.0-mcp-1.tgz |
Mirantis Proprietary License |
prometheus-tungstenfabric-exporter |
https://binary.mirantis.com/stacklight/helm/prometheus-tungstenfabric-exporter-0.2.0-mcp-3.tgz |
Mirantis Proprietary License |
The following issues have been addressed in the MOSK 22.5 release:
[26773] Fixed the issue with VM autoscaling failure when using the CPU-related metrics in Telemetry.
[26534] Fixed the issue with the
ironic-conductorPod getting stuck in theCrashLoopBackOffstate after the Container Cloud management cluster upgrade from 2.19.0 to 2.20.0. The issue occurred due to the race condition between theironic-conductorandironic-conductor-httpcontainers of theironic-conductorPod that tried to useca-bundle.pemsimultaneously but from different users.[25594][Yoga] Fixed the issue with security groups shared through RBAC not being filtered and used by Nova to create instances due to the OpenStack known issue #1942615.
Note
The bug still affects OpenStack Victoria and is fixed for OpenStack Yoga.
[24435] Fixed the issue with MetalLB speaker failing to announce the LB IP for the Ingress service after the MOSK cluster update.
For existing clusters, you can set
externalTrafficPolicyback fromClustertoLocalafter updating to 22.5. For details, see Post-upgrade actions.
This section describes the specific actions you as a Cloud Operator need to complete to accurately plan and successfully perform your Mirantis OpenStack for Kubernetes (MOSK) cluster update to the version 22.5. Consider this information as a supplement to the generic update procedure published in Operations Guide: Update a MOSK cluster.
Additionally, read through the Cluster update known issues for the problems that are known to occur during update with recommended workarounds.
The MOSK cluster will obtain the newly implemented capabilities automatically with no significant impact on the update procedure.
The update to MOSK 22.5 does not include any version-specific impact on the cluster. To start planning a maintenance window, use the Operations Guide: Update a MOSK cluster standard procedure.
Before you proceed with updating the cluster, make sure that you perform the following pre-update actions if applicable:
Due to the [29438] Cluster update gets stuck during the Tungsten Fabric operator update known issue, the MOSK cluster update from 22.4 to 22.5 can get stuck. Your cluster is affected if it has been updated from MOSK 22.3 to 22.4, regardless of the SDN backend in use (Open vSwitch or Tungsten Fabric). The newly deployed MOSK 22.4 clusters are not affected.
To avoid the issue, manually delete the
tungstenfabric-operator-metricsservice from the cluster before update:kubectl -n tf delete svc tungstenfabric-operator-metrics
Due to the known issue in the database auto-cleanup job for the Block Storage service (OpenStack Cinder), the state of volumes that are attached to instances gets reset every time the job runs. The workaround is to temporarily disable the job until the issue is fixed. For details, refer to [29501] Cinder periodic database cleanup resets the state of volumes.
The OIDCClaimDelimiter parameter defines the delimiter to use when setting
multi-valued claims in the HTTP headers. See the MOSK 22.5 OpenStack API
Reference
for details.
The current default value of the OIDCClaimDelimiter parameter is ",".
This value misaligns with the behavior expected by Keystone. As a result, when
creating federation mappings for Keystone, the cloud operator may be forced
to write more complex rules. Therefore, in early 2023, Mirantis will change
the default value for the OIDCClaimDelimiter parameter.
Affected deployments
Proceed with the instruction below only if the following conditions are true:
Keystone is set to use federation through the OpenID Connect protocol, with Mirantis Container Cloud Keycloak in particular. The following configuration is present in your
OpenStackDeploymentcustom resource:kind: OpenStackDeployment spec: features: keystone: keycloak: enabled: true
No value has already been specified for the
OIDCClaimDelimiterparameter in yourOpenStackDeploymentcustom resource.
To facilitate smooth transition of the existing deployments to the new default
value, explicitly define the OIDCClaimDelimiter parameter as follows:
kind: OpenStackDeployment
spec:
features:
keystone:
keycloak:
oidc:
OIDCClaimDelimiter: ","
Note
The new default value for the OIDCClaimDelimiter parameter
will be ";". To find out whether your Keystone mappings will need
adjustment after changing the default value, set the parameter to
";" on your staging environment and verify the rules.
In MOSK 22.4 and older versions, the OpenStack Ingress
service was not accessible through its LB IP address on the environments
having the external network restricted to a few nodes in the
MOSK cluster. For such use cases, Mirantis recommended
setting the externalTrafficPolicy parameter to Cluster as a workaround.
The issue #24435 has been fixed in
MOSK 22.5. Therefore, if the monitoring of source IPs of
the requests to OpenStack services is required, you can set the
externalTrafficPolicy parameter back to Local.
Affected deployments
You are affected if your deployment configuration matches the following conditions:
The external network is restricted to a few nodes in the MOSK cluster. In this case, only a limited set of nodes have IPs in the external network where MetalLB announces LB IPs.
The workaround was applied by setting
externalTrafficPolicy=Clusterfor the Ingress service.
To set externalTrafficPolicy back from Cluster to Local:
On the MOSK cluster, add the node selector to the
L2AdvertisementMetalLB object so that it matches the nodes in the MOSK cluster having IPs in the external network, or a subset of those nodes.Example command to edit
L2Advertisement:kubectl -n metallb-system edit l2advertisements
Example of
L2Advertisement.spec:spec: ipAddressPools: - services nodeSelectors: - matchLabels: openstack-control-plane: enabled
The
openstack-control-plane: enabledlabel selector defines nodes in the MOSK cluster having IPs in the external network.In the MOSK
Clusterobject located on the management cluster, remove or edit node selectors and affinity for MetalLB speaker in the MetalLB chart values, if required.Example of the
helmReleasessection inCluster.specafter editing thenodeSelectorparameter:helmReleases: - name: metallb values: configInline: address-pools: [] speaker: nodeSelector: kubernetes.io/os: linux resources: limits: cpu: 100m memory: 500Mi
The MetalLB speaker DaemonSet must have the same node selector as the OpenStack Ingress service DaemonSet.
Note
By default, the OpenStack Ingress service Pods run on all Linux cluster nodes.
Change
externalTrafficPolicytoLocalfor the OpenStack Ingress service.Example command to alter the
Ingressobject:kubectl -n openstack patch svc ingress -p '{"spec":{"externalTrafficPolicy":"Local"}}'
Verify that OpenStack services are accessible through the load balancer IP of the OpenStack Ingress service.
The OpenStack Panko service has been removed from the product since MOSK 22.2 in OpenStack Victoria without the user being involved. The OpenStack Panko service is no longer maintained in the upstream OpenStack. See the project repository page for details.
Though, in MOSK 22.5, before upgrading to OpenStack Yoga,
verify that you remove the Panko service from the cloud by removing the
event entry from the spec:features:services structure in the
OpenStackDeployment resource as described in Operations Guide:
Remove an OpenStack service.
The table below contains the number of vendor-specific addressed CVEs with Critical or High severity.
In total, in the MOSK 22.5 release, 108 CVEs have been fixed and 77 artifacts (images) updated.
Fixed CVE ID |
# of updated artifacts |
|---|---|
CVE-2022-29187 |
1 |
CVE-2022-29155 |
1 |
CVE-2022-24765 |
1 |
CVE-2022-23219 |
1 |
CVE-2022-23218 |
1 |
CVE-2022-2068 |
2 |
CVE-2022-1679 |
1 |
CVE-2022-1664 |
2 |
CVE-2022-1292 |
2 |
CVE-2021-39686 |
1 |
CVE-2021-3847 |
1 |
CVE-2021-3737 |
1 |
CVE-2021-3520 |
1 |
CVE-2021-33574 |
1 |
CVE-2021-30475 |
1 |
CVE-2021-30474 |
1 |
CVE-2021-30473 |
1 |
CVE-2021-29921 |
1 |
CVE-2021-20312 |
1 |
CVE-2021-20309 |
1 |
CVE-2021-20246 |
1 |
CVE-2021-20245 |
1 |
CVE-2021-20244 |
1 |
CVE-2019-9169 |
1 |
CVE-2019-25013 |
1 |
CVE-2019-19814 |
1 |
CVE-2019-15794 |
1 |
CVE-2019-12900 |
1 |
CVE-2018-6551 |
1 |
CVE-2018-6485 |
1 |
CVE-2018-1000001 |
1 |
CVE-2016-2779 |
1 |
CVE-2015-20107 |
1 |
CVE-2013-7445 |
1 |
ELSA-2022-9564 |
1 |
RHSA-2022:7110 |
1 |
RHSA-2022:6834 |
24 |
RHSA-2022:6778 |
5 |
RHSA-2022:6765 |
26 |
RHSA-2022:6206 |
7 |
RHSA-2022:6180 |
1 |
RHSA-2022:5696 |
1 |
RHSA-2022:5056 |
1 |
RHSA-2022:4991 |
2 |
RHSA-2022:1642 |
1 |
RHSA-2022:1537 |
1 |
The full list of the CVEs present in the current MOSK release is available at the Mirantis Security Portal.
22.4
Release date |
September 29, 2022 |
|---|---|
Name |
MOSK 22.4 |
Cluster release |
8.10.0 |
Highlights |
The fourth MOSK release in 2022 introduces the following key features:
|
Component |
Support scope |
Feature |
|---|---|---|
OpenStack |
TechPreview |
|
Full |
||
Full |
||
TechPreview |
||
TechPreview |
||
Tungsten Fabric |
TechPreview |
|
Full |
||
Ceph |
Full |
TechPreview
Provided the technical preview support for OpenStack Yoga with Neutron OVS and Tungsten Fabric 21.4.
To start experimenting with the new functionality, set openstack_version to
yoga in the OpenStackDeployment custom resource during the cloud
deployment.
TechPreview
Provided the technical preview support for Tungsten Fabric 21.4. The new version of the Tungsten Fabric networking enables support for the EVPN type 2 routes for graceful restart and long-lived graceful restart features in MOSK.
Note
Implementation of the Red Hat Universal Base Image 8 (UBI 8) support for the Tungsten Fabric container images is being under development and will be released in one of the upcoming product versions.
To start experimenting with the new functionality, set tfVersion to
21.4 in the TFOperator custom resource during the cloud deployment.
Learn more
Enabled the application credentials mechanism in the Identity service for application automation tools to securely authenticate against the cloud’s API.
Enabled the capability of the OpenStack services to emit notifications in
the Cloud Auditing Data Federation (CADF) format. The CADF notifications
configuration is available through the features:logging:cadf section of
the OpenStackDeployment custom resource.
TechPreview
Added the capability to configure the name of the OpenStack region used for
the deployment. By default, the name is RegionOne.
Learn more
TechPreview
Implemented the capability to store the OpenStack database backup data
externally. Instead of the default Ceph volume, the cloud operator can
now easily configure the NFS storage backend through the
OpenStackDeployment CR.
Learn more
Implemented the post-update restart of the TF vRouter pods. Previously, the cloud operator had to manually restart the vRouter pods after updating the deployment to a newer MOSK version. The update procedure has been amended accordingly.
Learn more
Implemented the capability to easily view the summary and health status of all Ceph clusters through the Container Cloud web UI.
Mirantis has tested MOSK against a very specific configuration and can guarantee a predictable behavior of the product only in the exact same environments. The table below includes the major MOSK components with the exact versions against which testing has been performed.
Component |
Version |
|---|---|
Cluster release |
8.10.0 (Cluster release notes) |
OpenStack |
|
OpenStack Operator |
0.10.5 |
Tungsten Fabric |
|
Tungsten Fabric Operator |
0.9.4 |
See also
This section describes the MOSK known issues with available workarounds. For the known issues in the related version of Mirantis Container Cloud, refer to Mirantis Container Cloud: Release Notes.
This section lists the OpenStack known issues with workarounds for the Mirantis OpenStack for Kubernetes release 22.4.
One of the most common symptoms of the high CPU load of MariaDB is slow API responses. To troubleshoot the issue, verify the CPU consumption of MariaDB using the General > Kubernetes Pods Grafana dashboard or through the CLI as follows:
Obtain the resource consumption details for the MariaDB server:
kubectl -n openstack exec -it mariadb-server-0 -- bash mysql@mariadb-server-0:/$ top
Example of system response:
top - 19:16:29 up 278 days, 20:56, 0 users, load average: 16.62, 16.54, 16.39 Tasks: 8 total, 1 running, 7 sleeping, 0 stopped, 0 zombie %Cpu(s): 6.3 us, 2.8 sy, 0.0 ni, 89.6 id, 0.0 wa, 0.0 hi, 1.3 si, 0.0 st MiB Mem : 515709.3 total, 375731.7 free, 111383.8 used, 28593.7 buff/cache MiB Swap: 0.0 total, 0.0 free, 0.0 used. 399307.2 avail Mem PID USER PR NI VIRT RES SHR S %CPU %MEM TIME+ COMMAND 275 mysql 20 0 76.3g 18.8g 1.0g S 786.4 3.7 22656,15 mysqld
Determine which exact query is progressing. This is usually the one in the
Sending datastate:mysql@mariadb-server-0:/$ mysql -u root -p$MYSQL_DBADMIN_PASSWORD -e "show processlist;" | grep -v Sleep
Example of system response:
Id User Host db Command Time State Info Progress 60067757 placementgF9D11u29 10.233.195.246:40746 placement Query 10 Sending data SELECT a.id, a.resource_class_id, a.used, a.updated_at, a.created_at, c.id AS consumer_id, c.generat 0.000
Obtain more information about the query and the used tables:
mysql@mariadb-server-0:/$ mysql -u root -p$MYSQL_DBADMIN_PASSWORD -e " ANALYZE FORMAT=JSON SELECT <QUERY_ID>;"
Example of system response:
"table": { "table_name": "c", "access_type": "eq_ref", "possible_keys": [ "uniq_consumers0uuid", "consumers_project_id_user_id_uuid_idx", "consumers_project_id_uuid_idx" ], "key": "uniq_consumers0uuid", "key_length": "110", "used_key_parts": ["uuid"], "ref": ["placement.a.consumer_id"], "r_loops": 838200, "rows": 1, "r_rows": 1, "r_table_time_ms": 62602.5453, "r_other_time_ms": 369.5835268, "filtered": 100, "r_filtered": 0.005249344, "attached_condition": "c.user_id = u.`id` and c.project_id = p.`id`" }
If you are observing a huge difference between the
filteredandr_filteredcolumns for the query, as in the example of system response above, analyze the performance of tables by running the ANALYZE TABLE <TABLE_NAME>; and ANALYZE TABLE <TABLE_NAME> PERSISTENT FOR ALL; commands:mysql@mariadb-server-0:/$ mysql -u root -p$MYSQL_DBADMIN_PASSWORD MariaDB > ANALYZE TABLE placement.allocations; MariaDB > ANALYZE TABLE placement.allocations PERSISTENT FOR ALL; MariaDB > ANALYZE TABLE placement.consumers; MariaDB > ANALYZE TABLE placement.consumers PERSISTENT FOR ALL; MariaDB > ANALYZE TABLE placement.users; MariaDB > ANALYZE TABLE placement.users PERSISTENT FOR ALL; MariaDB > ANALYZE TABLE placement.projects; MariaDB > ANALYZE TABLE placement.projects PERSISTENT FOR ALL;
Multiprotocol Label Switching over Generic Routing Encapsulation (MPLSoGRE) provides limited throughput while sending data between VMs up to 38 Mbps, as per Mirantis tests.
As a workaround, switch the encapsulation type to VXLAN in the
OpenStackDeployment custom resource:
spec:
services:
networking:
neutron:
values:
conf:
bagpipe_bgp:
dataplane_driver_ipvpn:
mpls_over_gre: "False"
vxlan_encap: "True"
This section lists the Tungsten Fabric known issues with workarounds for the Mirantis OpenStack for Kubernetes release 22.4. For Tungsten Fabric limitations, see Tungsten Fabric known limitations.
[13755] TF pods switch to CrashLoopBackOff after a simultaneous reboot
[10096] tf-control does not refresh IP addresses of Cassandra pods
Rebooting all Cassandra cluster TFConfig or TFAnalytics nodes, maintenance, or other circumstances that cause the Cassandra pods to start simultaneously may cause a broken Cassandra TFConfig and/or TFAnalytics cluster. In this case, Cassandra nodes do not join the ring and do not update the IPs of the neighbor nodes. As a result, the TF services cannot operate Cassandra cluster(s).
To verify that a Cassandra cluster is affected:
Run the nodetool status command specifying the config or
analytics cluster and the replica number:
kubectl -n tf exec -it tf-cassandra-<config/analytics>-dc1-rack1-<replica number> -c cassandra -- nodetool status
Example of system response with outdated IP addresses:
Datacenter: DC1
===============
Status=Up/Down
|/ State=Normal/Leaving/Joining/Moving
-- Address Load Tokens Owns (effective) Host ID Rack
DN <outdated ip> ? 256 64.9% a58343d0-1e3f-4d54-bcdf-9b9b949ca873 r1
DN <outdated ip> ? 256 69.8% 67f1d07c-8b13-4482-a2f1-77fa34e90d48 r1
Datacenter: dc1
===============
Status=Up/Down
|/ State=Normal/Leaving/Joining/Moving
-- Address Load Tokens Owns (effective) Host ID Rack
UN <actual ip> 3.84 GiB 256 65.2% 7324ebc4-577a-425f-b3de-96faac95a331 rack1
Workaround:
Manually delete a Cassandra pod from the failed config or analytics
cluster to re-initiate the bootstrap process for one of the Cassandra nodes:
kubectl -n tf delete pod tf-cassandra-<config/analytics>-dc1-rack1-<replica number>
The tf-control service resolves the DNS names of Cassandra pods at startup
and does not update them if Cassandra pods got new IP addresses, for example,
in case of a restart. As a workaround, to refresh the IP addresses of
Cassandra pods, restart the tf-control pods one by one:
kubectl -n tf delete pod tf-control-<hash>
Caution
Before restarting the tf-control pods:
Verify that the new pods are successfully spawned.
Verify that no vRouters are connected to only one
tf-controlpod that will be restarted.
This section lists the cluster update known issues with workarounds for the Mirantis OpenStack for Kubernetes release 22.4.
[26534] The ‘ironic-conductor’ Pod fails after the management cluster upgrade
[24435] MetalLB speaker fails to announce the LB IP for the Ingress service
After the Container Cloud management cluster upgrade from 2.19.0 to 2.20.0,
the ironic-conductor Pod gets stuck in the CrashLoopBackOff state. The
issue occurs due to the race condition between the ironic-conductor and
ironic-conductor-http containers of the ironic-conductor Pod that try
to use ca-bundle.pem simultaneously but from different users.
As a workaround, run the following command:
kubectl -n openstack exec -t <failedPodName> -c ironic-conductor-http -- chown 42424:42424 /certs/ca-bundle.pem
After updating the MOSK cluster, MetalLB speaker may fail to announce the Load Balancer (LB) IP address for the OpenStack Ingress service. As a result, the OpenStack Ingress service is not accessible using its LB IP address.
The issue may occur if the MetalLB speaker nodeSelector selects not all
the nodes selected by nodeSelector of the OpenStack Ingress service.
The issue may arise and disappear when a new MetalLB speaker is being selected by the MetalLB Controller to announce the LB IP address.
The issue occurs since MOSK 22.2 after
externalTrafficPolicy was set to local for the OpenStack Ingress
service.
Workaround:
Select from the following options:
Set
externalTrafficPolicytoclusterfor the OpenStack Ingress service.This option is preferable in the following cases:
If not all cluster nodes have connection to the external network
If the connection to the external network cannot be established
If network configuration changes are not desired
If network configuration is allowed and if you require the
externalTrafficPolicy: localoption:Wire the external network to all cluster nodes where the OpenStack Ingress service Pods are running.
Configure IP addresses in the external network on the nodes and change the default routes on the nodes.
Change
nodeSelectorof MetalLB speaker to matchnodeSelectorof the OpenStack Ingress service.
This section lists the Ceph known issues with workarounds for the Mirantis OpenStack for Kubernetes release 22.4.
The status section in the KaaSCephCluster.status CR does not reflect
issues during the process of a Ceph cluster deletion.
As a workaround, inspect Ceph Controller logs on the managed cluster:
kubectl --kubeconfig <managedClusterKubeconfig> -n ceph-lcm-mirantis logs <ceph-controller-pod-name>
This section lists the StackLight known issues with workarounds for the Mirantis OpenStack for Kubernetes release 22.4.
If a cluster does not currently have any ongoing operations that comprise
OpenStack notifications, the fluentd containers in the
fluentd-notifications Pods are frequently restarted due to false-positive
failures of liveness probe and trigger alerts.
Ignore such failures and alerts if the Pods are in the Running state.
To verify the fluentd-notifications Pods:
kubectl get po -n stacklight -l app=fluentd
Example of system response:
fluentd-notifications-64fdc5f5cd-pgmjp 1/1 Running 9 4h51m
fluentd-notifications-64fdc5f5cd-xjfrs 1/1 Running 9 4h51m
This section lists the components artifacts of the MOSK 22.4 release that includes binaries, Docker images, and Helm charts.
MOSK 22.4 OpenStack Victoria binaries and Docker images
Component |
Path |
License information for main executable programs |
|---|---|---|
Binaries |
||
initramfs |
https://binary.mirantis.com/openstack/bin/ironic/tinyipa/tinyipa-stable-victoria-20220210133249.gz |
GPL-2.0 |
kernel |
GPL-2.0 |
|
mirantis |
https://binary.mirantis.com/openstack/bin/horizon/mirantis-victoria-8f71802-20210119120707.tar.gz |
Mirantis Proprietary License |
octavia-amphora |
https://binary.mirantis.com/openstack/bin/octavia/amphora-x64-haproxy-victoria-20220823190806.qcow2 |
Mirantis Proprietary License |
Docker images |
||
keystone |
mirantis.azurecr.io/openstack/keystone:victoria-focal-20220823183431 |
Apache License 2.0 |
heat |
mirantis.azurecr.io/openstack/heat:victoria-focal-20220823183431 |
Apache License 2.0 |
glance |
mirantis.azurecr.io/openstack/glance:victoria-focal-20220823183431 |
Apache License 2.0 |
cinder |
mirantis.azurecr.io/openstack/cinder:victoria-focal-20220823183431 |
Apache License 2.0 |
neutron |
mirantis.azurecr.io/openstack/neutron:victoria-focal-20220823183431 |
Apache License 2.0 |
nova |
mirantis.azurecr.io/openstack/nova:victoria-focal-20220823183431 |
Apache License 2.0 |
horizon |
mirantis.azurecr.io/openstack/horizon:victoria-focal-20220823183431 |
Apache License 2.0 |
tempest |
mirantis.azurecr.io/openstack/tempest:victoria-focal-20220823183431 |
Apache License 2.0 |
octavia |
mirantis.azurecr.io/openstack/octavia:victoria-focal-20220823183431 |
Apache License 2.0 |
designate |
mirantis.azurecr.io/openstack/designate:victoria-focal-20220823183431 |
Apache License 2.0 |
ironic |
mirantis.azurecr.io/openstack/ironic:victoria-focal-20220823183431 |
Apache License 2.0 |
barbican |
mirantis.azurecr.io/openstack/barbican:victoria-focal-20220823183431 |
Apache License 2.0 |
libvirt |
mirantis.azurecr.io/general/libvirt:6.0.0-focal-20220811132755 |
LGPL-2.1 License |
pause |
mirantis.azurecr.io/general/external/pause:3.1 |
Apache License 2.0 |
openvswitch |
mirantis.azurecr.io/general/openvswitch:2.13-focal-20220811132755 |
Apache License 2.0 |
openvswitch-dpdk |
mirantis.azurecr.io/general/openvswitch-dpdk:2.13-focal-20220811132755 |
Apache License 2.0 |
openstack-tools |
mirantis.azurecr.io/openstack/openstack-tools:victoria-focal-20220823183431 |
Apache License 2.0 |
rabbitmq-3.10.x |
mirantis.azurecr.io/openstack/extra/rabbitmq:3.10.7-focal-20220810183358 |
Mozilla Public License 2.0 |
rabbitmq-3.10.x-management |
mirantis.azurecr.io/openstack/extra/rabbitmq-management:3.10.7-focal-20220810183358 |
Mozilla Public License 2.0 |
kubernetes-entrypoint |
mirantis.azurecr.io/openstack/extra/kubernetes-entrypoint:v1.0.1-44bd8b3-20220812062625 |
Apache License 2.0 |
memcached |
mirantis.azurecr.io/general/memcached:1.6.16-alpine3.16 |
BSD 3-Clause “New” or “Revised” License |
ceph-config-helper |
mirantis.azurecr.io/openstack/extra/ceph-config-helper:pacific-focal-20220705100042 |
Apache License 2.0, LGPL-2.1 or LGPL-3 |
etcd |
mirantis.azurecr.io/openstack/extra/etcd:v3.5.4-alpine-20220808224108 |
Apache License 2.0 |
powerdns |
mirantis.azurecr.io/openstack/extra/powerdns:4.2-alpine-20200117133238 |
GPL-2.0 License |
nginx-ingress-controller |
mirantis.azurecr.io/openstack/extra/nginx-ingress-controller:1.3.0 |
Apache License 2.0 |
tls-proxy |
mirantis.azurecr.io/openstack/tls-proxy:focal-20220804082840 |
Mirantis Proprietary License |
defaultbackend |
mirantis.azurecr.io/openstack/extra/defaultbackend:v1.19.2-77af1ef-20220823043839 |
Apache License 2.0 |
mariadb |
mirantis.azurecr.io/general/mariadb:10.6.7-focal-20220811085105 |
GPLv2, LGPLv2.1 (client libraries) |
rabbitmq-exporter |
mirantis.azurecr.io/stacklight/rabbitmq-exporter:v1.0.0-RC8 |
MIT License |
prometheus-memcached-exporter |
mirantis.azurecr.io/stacklight/memcached-exporter:0.9.0 |
Apache License 2.0 |
prometheus-mysql-exporter |
mirantis.azurecr.io/stacklight/mysqld-exporter:v0.11.0 |
Apache License 2.0 |
xrally-openstack |
mirantis.azurecr.io/openstack/extra/xrally-openstack:2.2.0-20220711181928 |
Apache License 2.0 |
aodh |
mirantis.azurecr.io/openstack/aodh:victoria-focal-20220823183431 |
Apache License 2.0 |
ceilometer |
mirantis.azurecr.io/openstack/ceilometer:victoria-focal-20220823183431 |
Apache License 2.0 |
gnocchi |
mirantis.azurecr.io/openstack/gnocchi:victoria-focal-20220823183431 |
Apache License 2.0 |
redis |
mirantis.azurecr.io/openstack/extra/redis:6.2.6-alpine3.15 |
BSD 3-Clause “New” or “Revised” License |
frr |
mirantis.azurecr.io/general/external/docker.io/frrouting/frr:v8.3.0 |
GPL-2.0 and LGPL-2.1 |
strongswan |
mirantis.azurecr.io/openstack/extra/strongswan:alpine-5.9.5-20220809060458 |
GPL License |
rsyslog |
mirantis.azurecr.io/openstack/extra/rsyslog:v8.2001.0-20210901090922 |
GNU General Public License v3 |
descheduler |
mirantis.azurecr.io/openstack/extra/descheduler:v0.24.1-amd64-20220822204951 |
Apache License 2.0 |
nginx |
mirantis.azurecr.io/openstack/extra/nginx:1.23.1-alpine |
Apache License 2.0 |
tgt |
mirantis.azurecr.io/general/tgt:1.0.x-focal-20220811132755 |
GPL-2.0 |
placement |
mirantis.azurecr.io/openstack/placement:victoria-focal-20220823183431 |
Apache License 2.0 |
stepler |
mirantis.azurecr.io/openstack/stepler:victoria-focal-20220811132755 |
Apache License 2.0 |
masakari |
mirantis.azurecr.io/openstack/masakari:victoria-focal-20220823183431 |
Apache License 2.0 |
masakari-monitors |
mirantis.azurecr.io/openstack/masakari-monitors:victoria-focal-20220823183431 |
Apache License 2.0 |
ironic-inspector |
mirantis.azurecr.io/openstack/ironic-inspector:victoria-focal-20220823183431 |
Apache License 2.0 |
panko |
mirantis.azurecr.io/openstack/panko:victoria-focal-20220823183431 |
Apache License 2.0 |
MOSK 22.4 OpenStack Yoga binaries and Docker images
Important
OpenStack Yoga is available as technical preview. For details, see OpenStack Yoga support.
Component |
Path |
License information for main executable programs |
|---|---|---|
Binaries |
||
initramfs |
https://binary.mirantis.com/openstack/bin/ironic/tinyipa/tinyipa-stable-yoga-20220714061116.gz |
GPL-2.0 |
kernel |
https://binary.mirantis.com/openstack/bin/ironic/tinyipa/tinyipa-stable-yoga-20220714061116.vmlinuz |
GPL-2.0 |
mirantis |
https://binary.mirantis.com/openstack/bin/horizon/mirantis-xena-9f691e3-20220110111511.tar.gz |
Mirantis Proprietary License |
octavia-amphora |
https://binary.mirantis.com/openstack/bin/octavia/amphora-x64-haproxy-yoga-20220905111550.qcow2 |
Mirantis Proprietary License |
Docker images |
||
keystone |
mirantis.azurecr.io/openstack/keystone:yoga-focal-20220905101550 |
Apache License 2.0 |
heat |
mirantis.azurecr.io/openstack/heat:yoga-focal-20220905101550 |
Apache License 2.0 |
glance |
mirantis.azurecr.io/openstack/glance:yoga-focal-20220905101550 |
Apache License 2.0 |
cinder |
mirantis.azurecr.io/openstack/cinder:yoga-focal-20220905101550 |
Apache License 2.0 |
neutron |
mirantis.azurecr.io/openstack/neutron:yoga-focal-20220905101550 |
Apache License 2.0 |
nova |
mirantis.azurecr.io/openstack/nova:yoga-focal-20220905101550 |
Apache License 2.0 |
horizon |
mirantis.azurecr.io/openstack/horizon:yoga-focal-20220905101550 |
Apache License 2.0 |
tempest |
mirantis.azurecr.io/openstack/tempest:yoga-focal-20220905101550 |
Apache License 2.0 |
octavia |
mirantis.azurecr.io/openstack/octavia:yoga-focal-20220905101550 |
Apache License 2.0 |
designate |
mirantis.azurecr.io/openstack/designate:yoga-focal-20220905101550 |
Apache License 2.0 |
ironic |
mirantis.azurecr.io/openstack/ironic:yoga-focal-20220905101550 |
Apache License 2.0 |
barbican |
mirantis.azurecr.io/openstack/barbican:yoga-focal-20220905101550 |
Apache License 2.0 |
libvirt |
mirantis.azurecr.io/general/libvirt:6.0.0-focal-20220811132755 |
LGPL-2.1 License |
pause |
mirantis.azurecr.io/general/external/pause:3.1 |
Apache License 2.0 |
openvswitch |
mirantis.azurecr.io/general/openvswitch:2.13-focal-20220811132755 |
Apache License 2.0 |
openvswitch-dpdk |
mirantis.azurecr.io/general/openvswitch-dpdk:2.13-focal-20220811132755 |
Apache License 2.0 |
openstack-tools |
mirantis.azurecr.io/openstack/openstack-tools:victoria-focal-20220823183431 |
Apache License 2.0 |
rabbitmq-3.10.x |
mirantis.azurecr.io/openstack/extra/rabbitmq:3.10.7-focal-20220810183358 |
Mozilla Public License 2.0 |
rabbitmq-3.10.x-management |
mirantis.azurecr.io/openstack/extra/rabbitmq-management:3.10.7-focal-20220810183358 |
Mozilla Public License 2.0 |
kubernetes-entrypoint |
mirantis.azurecr.io/openstack/extra/kubernetes-entrypoint:v1.0.1-44bd8b3-20220812062625 |
Apache License 2.0 |
memcached |
mirantis.azurecr.io/general/memcached:1.6.16-alpine3.16 |
BSD 3-Clause “New” or “Revised” License |
ceph-config-helper |
mirantis.azurecr.io/openstack/extra/ceph-config-helper:pacific-focal-20220705100042”Apache License 2.0 |
LGPL-2.1 or LGPL-3” |
etcd |
mirantis.azurecr.io/openstack/extra/etcd:v3.5.4-alpine-20220808224108 |
Apache License 2.0 |
powerdns |
mirantis.azurecr.io/openstack/extra/powerdns:4.2-alpine-20200117133238 |
GPL-2.0 License |
nginx-ingress-controller |
mirantis.azurecr.io/openstack/extra/nginx-ingress-controller:1.3.0 |
Apache License 2.0 |
tls-proxy |
mirantis.azurecr.io/openstack/tls-proxy:focal-20220804082840 |
Mirantis Proprietary License |
defaultbackend |
mirantis.azurecr.io/openstack/extra/defaultbackend:v1.19.2-77af1ef-20220823043839 |
Apache License 2.0 |
mariadb |
mirantis.azurecr.io/general/mariadb:10.6.7-focal-20220811085105 |
GPLv2, LGPLv2.1 (client libraries) |
rabbitmq-exporter |
mirantis.azurecr.io/stacklight/rabbitmq-exporter:v1.0.0-RC8 |
MIT License |
prometheus-memcached-exporter |
mirantis.azurecr.io/stacklight/memcached-exporter:0.9.0 |
Apache License 2.0 |
prometheus-mysql-exporter |
mirantis.azurecr.io/stacklight/mysqld-exporter:v0.11.0 |
Apache License 2.0 |
xrally-openstack |
mirantis.azurecr.io/openstack/extra/xrally-openstack:2.2.0-20220711181928 |
Apache License 2.0 |
aodh |
mirantis.azurecr.io/openstack/aodh:yoga-focal-20220905101550 |
Apache License 2.0 |
ceilometer |
mirantis.azurecr.io/openstack/ceilometer:yoga-focal-20220905101550 |
Apache License 2.0 |
gnocchi |
mirantis.azurecr.io/openstack/gnocchi:yoga-focal-20220905101550 |
Apache License 2.0 |
redis |
mirantis.azurecr.io/openstack/extra/redis:6.2.6-alpine3.15 |
BSD 3-Clause “New” or “Revised” License |
frr |
mirantis.azurecr.io/general/external/docker.io/frrouting/frr:v8.3.0 |
GPL-2.0 and LGPL-2.1 |
strongswan |
mirantis.azurecr.io/openstack/extra/strongswan:alpine-5.9.5-20220809060458 |
GPL-2.0 |
rsyslog |
mirantis.azurecr.io/openstack/extra/rsyslog:v8.2001.0-20210901090922 |
GNU General Public License v3 |
descheduler |
mirantis.azurecr.io/openstack/extra/descheduler:v0.24.1-amd64-20220822204951 |
Apache License 2.0 |
nginx |
mirantis.azurecr.io/openstack/extra/nginx:1.23.1-alpine |
Apache License 2.0 |
tgt |
mirantis.azurecr.io/general/tgt:1.0.x-focal-20220811132755 |
GPL-2.0 |
stepler |
mirantis.azurecr.io/openstack/stepler:yoga-focal-20220811132755 |
Apache License 2.0 |
placement |
mirantis.azurecr.io/openstack/placement:yoga-focal-20220905101550 |
Apache License 2.0 |
masakari |
mirantis.azurecr.io/openstack/masakari:yoga-focal-20220905101550 |
Apache License 2.0 |
masakari-monitors |
mirantis.azurecr.io/openstack/masakari-monitors:yoga-focal-20220905101550 |
Apache License 2.0 |
ironic-inspector |
mirantis.azurecr.io/openstack/ironic-inspector:yoga-focal-20220905101550 |
Apache License 2.0 |
MOSK 22.4 OpenStack Helm charts
MOSK 22.4 Tungsten Fabric 2011 artifacts
Component |
Path |
License information for main executable programs |
|---|---|---|
Helm charts |
||
Tungsten Fabric Operator |
https://binary.mirantis.com/tungsten/helm/tungstenfabric-operator-0.9.4.tgz |
Mirantis Proprietary License |
Docker images |
||
Tungsten Fabric Operator |
mirantis.azurecr.io/tungsten-operator/tungstenfabric-operator:0.9.4 |
Mirantis Proprietary License |
Analytics |
mirantis.azurecr.io/tungsten/contrail-analytics-api:2011.20220907032746 |
Apache License 2.0 |
mirantis.azurecr.io/tungsten/contrail-analytics-collector:2011.20220907032746 |
Apache License 2.0 |
|
Analytics Alarm |
mirantis.azurecr.io/tungsten/contrail-analytics-alarm-gen:2011.20220907032746 |
Apache License 2.0 |
Analytics DB |
mirantis.azurecr.io/tungsten/contrail-analytics-query-engine:2011.20220907032746 |
Apache License 2.0 |
Analytics SNMP |
mirantis.azurecr.io/tungsten/contrail-analytics-snmp-collector:2011.20220907032746 |
Apache License 2.0 |
mirantis.azurecr.io/tungsten/contrail-analytics-snmp-topology:2011.20220907032746 |
Apache License 2.0 |
|
Config |
mirantis.azurecr.io/tungsten/contrail-controller-config-api:2011.20220907032746 |
Apache License 2.0 |
mirantis.azurecr.io/tungsten/contrail-controller-config-devicemgr:2011.20220907032746 |
Apache License 2.0 |
|
mirantis.azurecr.io/tungsten/contrail-controller-config-dnsmasq:2011.20220907032746 |
Apache License 2.0 |
|
mirantis.azurecr.io/tungsten/contrail-controller-config-schema:2011.20220907032746 |
Apache License 2.0 |
|
mirantis.azurecr.io/tungsten/contrail-controller-config-svcmonitor:2011.20220907032746 |
Apache License 2.0 |
|
mirantis.azurecr.io/openstack/extra/kubernetes-entrypoint:v1.0.0-20200311160233 |
Apache License 2.0 |
|
Control |
mirantis.azurecr.io/tungsten/contrail-controller-control-control:2011.20220907032746 |
Apache License 2.0 |
mirantis.azurecr.io/tungsten/contrail-controller-control-dns:2011.20220907032746 |
Apache License 2.0 |
|
mirantis.azurecr.io/tungsten/contrail-controller-control-named:2011.20220907032746 |
Apache License 2.0 |
|
Web UI |
mirantis.azurecr.io/tungsten/contrail-controller-webui-job:2011.20220907032746 |
Apache License 2.0 |
mirantis.azurecr.io/tungsten/contrail-controller-webui-web:2011.20220907032746 |
Apache License 2.0 |
|
vRouter |
mirantis.azurecr.io/tungsten/contrail-vrouter-agent:2011.20220907032746 |
Apache License 2.0 |
mirantis.azurecr.io/tungsten/contrail-vrouter-agent-dpdk:2011.20220907032746 |
Apache License 2.0 |
|
mirantis.azurecr.io/tungsten/contrail-vrouter-kernel-build-init:2011.20220907032746 |
Apache License 2.0 |
|
mirantis.azurecr.io/tungsten/contrail-node-init:2011.20220907032746 |
Apache License 2.0 |
|
Nodemanager |
mirantis.azurecr.io/tungsten/contrail-nodemgr:2011.20220907032746 |
Apache License 2.0 |
Provisioner |
mirantis.azurecr.io/tungsten/contrail-provisioner:2011.20220907032746 |
Apache License 2.0 |
Cassandra operator |
mirantis.azurecr.io/tungsten-operator/casskop:2.1.4 |
Apache License 2.0 |
Cassandra |
mirantis.azurecr.io/tungsten/cassandra-bootstrap:0.1.9 |
Apache License 2.0 |
mirantis.azurecr.io/tungsten/cassandra:3.11.10 |
Apache License 2.0 |
|
mirantis.azurecr.io/tungsten/instaclustr-icarus:v2-20220705125748 |
Apache License 2.0 |
|
mirantis.azurecr.io/tungsten/cass-config-builder:v2-20220616143636 |
Apache License 2.0 |
|
Kafka operator |
mirantis.azurecr.io/tungsten-operator/kafka-k8s-operator:0.2.0 |
Mirantis Proprietary License |
Kafka |
mirantis.azurecr.io/tungsten/cp-kafka:7.1.1 |
Apache License 2.0 |
mirantis.azurecr.io/tungsten/prometheus-jmx-exporter:0.17.0-debian-11-r29 |
Apache License 2.0 |
|
Pause |
mirantis.azurecr.io/general/external/pause:3.1 |
Google Cloud Platform |
RabbitMQ operator |
mirantis.azurecr.io/tungsten-operator/rabbitmq-operator:0.2.0 |
Mirantis Proprietary License |
RabbitMQ |
mirantis.azurecr.io/general/rabbitmq:3.9.8 |
Mozilla Public License 2.0 |
mirantis.azurecr.io/stacklight/rabbitmq-exporter:v1.0.0-RC8 |
MIT License |
|
ZooKeeper operator |
mirantis.azurecr.io/tungsten-operator/zookeeper-operator:0.2.14 |
Apache License 2.0 |
ZooKeeper |
mirantis.azurecr.io/tungsten/zookeeper:3.7.0-0.2.14 |
Apache License 2.0 |
Redis operator |
mirantis.azurecr.io/tungsten-operator/redis-operator:0.3.2 |
Apache License 2.0 |
Redis |
mirantis.azurecr.io/tungsten/redis:7.0.2-alpine3.16 |
BSD 3-Clause “New” or “Revised” License |
mirantis.azurecr.io/openstack/extra/redis_exporter:v1.43.0-alpine |
BSD 3-Clause “New” or “Revised” License |
|
TF Test |
mirantis.azurecr.io/tungsten/tungsten-pytest:0.1-20220905045430 |
MIT License |
TF CLI |
mirantis.azurecr.io/tungsten/tf-cli:0.1-20220819122303 |
MIT License |
TF NodeInfo |
mirantis.azurecr.io/tungsten/tf-nodeinfo:0.1-20210430090010 |
MIT License |
TF Tools |
mirantis.azurecr.io/tungsten/contrail-tools:2011.20220907032746 |
Apache License 2.0 |
ToR agent |
mirantis.azurecr.io/tungsten/contrail-tor-agent:2011.20220907032746 |
Apache License 2.0 |
TF status |
mirantis.azurecr.io/tungsten/contrail-status:2011.20220907032746 |
Apache License 2.0 |
MOSK 22.4 Tungsten Fabric 21.4 artifacts
Important
Tungsten Fabric 21.4 is available as technical preview. For details, see Tungsten Fabric 21.4 support.
Component |
Path |
License information for main executable programs |
|---|---|---|
Helm charts |
||
Tungsten Fabric Operator |
https://binary.mirantis.com/tungsten/helm/tungstenfabric-operator-0.9.4.tgz |
Mirantis Proprietary License |
Docker images |
||
Tungsten Fabric Operator |
mirantis.azurecr.io/tungsten-operator/tungstenfabric-operator:0.9.4 |
Mirantis Proprietary License |
Analytics Alarm |
mirantis.azurecr.io/tungsten/contrail-analytics-alarm-gen:21.4.20220801000000 |
Apache License 2.0 |
Analytics |
mirantis.azurecr.io/tungsten/contrail-analytics-api:21.4.20220801000000 |
Apache License 2.0 |
mirantis.azurecr.io/tungsten/contrail-analytics-collector:21.4.20220801000000 |
Apache License 2.0 |
|
Analytics DB |
mirantis.azurecr.io/tungsten/contrail-analytics-query-engine:21.4.20220801000000 |
Apache License 2.0 |
Analytics SNMP |
mirantis.azurecr.io/tungsten/contrail-analytics-snmp-collector:21.4.20220801000000 |
Apache License 2.0 |
mirantis.azurecr.io/tungsten/contrail-analytics-snmp-topology:21.4.20220801000000 |
Apache License 2.0 |
|
Config |
mirantis.azurecr.io/tungsten/contrail-controller-config-api:21.4.20220801000000 |
Apache License 2.0 |
mirantis.azurecr.io/tungsten/contrail-controller-config-devicemgr:21.4.20220801000000 |
Apache License 2.0 |
|
mirantis.azurecr.io/tungsten/contrail-controller-config-dnsmasq:21.4.20220801000000 |
Apache License 2.0 |
|
mirantis.azurecr.io/tungsten/contrail-controller-config-schema:21.4.20220801000000 |
Apache License 2.0 |
|
mirantis.azurecr.io/tungsten/contrail-controller-config-svcmonitor:21.4.20220801000000 |
Apache License 2.0 |
|
Control |
mirantis.azurecr.io/tungsten/contrail-controller-control-control:21.4.20220801000000 |
Apache License 2.0 |
mirantis.azurecr.io/tungsten/contrail-controller-control-dns:21.4.20220801000000 |
Apache License 2.0 |
|
mirantis.azurecr.io/tungsten/contrail-controller-control-named:21.4.20220801000000 |
Apache License 2.0 |
|
Web UI |
mirantis.azurecr.io/tungsten/contrail-controller-webui-job:21.4.20220801000000 |
Apache License 2.0 |
mirantis.azurecr.io/tungsten/contrail-controller-webui-web:21.4.20220801000000 |
Apache License 2.0 |
|
Nodemanager |
mirantis.azurecr.io/tungsten/contrail-nodemgr:21.4.20220801000000 |
Apache License 2.0 |
TF Provisioner |
mirantis.azurecr.io/tungsten/contrail-provisioner:21.4.20220801000000 |
Apache License 2.0 |
TF status |
mirantis.azurecr.io/tungsten/contrail-status:21.4.20220801000000 |
Apache License 2.0 |
TF tools |
mirantis.azurecr.io/tungsten/contrail-tools:21.4.20220801000000 |
Apache License 2.0 |
ToR agent |
mirantis.azurecr.io/tungsten/contrail-tor-agent:21.4.20220801000000 |
Apache License 2.0 |
vRouter |
mirantis.azurecr.io/tungsten/contrail-vrouter-agent:21.4.20220801000000 |
Apache License 2.0 |
mirantis.azurecr.io/tungsten/contrail-vrouter-agent-dpdk:21.4.20220801000000 |
Apache License 2.0 |
|
mirantis.azurecr.io/tungsten/contrail-node-init:21.4.20220801000000 |
Apache License 2.0 |
|
mirantis.azurecr.io/tungsten/contrail-vrouter-kernel-build-init:21.4.20220801000000 |
Apache License 2.0 |
MOSK 22.4 StackLight artifacts
Component |
Path |
License information for main executable programs |
|---|---|---|
Docker images |
||
prometheus-libvirt-exporter |
mirantis.azurecr.io/stacklight/prometheus-libvirt-exporter:v0.1-20200610164751 |
Mirantis Proprietary License |
prometheus-tungstenfabric-exporter |
mirantis.azurecr.io/stacklight/tungstenfabric-prometheus-exporter:0.1-20210115152338 |
Mirantis Proprietary License |
Helm charts |
||
prometheus-libvirt-exporter |
https://binary.mirantis.com/stacklight/helm/prometheus-libvirt-exporter-0.2.0-mcp-1.tgz |
Mirantis Proprietary License |
prometheus-tungstenfabric-exporter |
https://binary.mirantis.com/stacklight/helm/prometheus-tungstenfabric-exporter-0.2.0-mcp-3.tgz |
Mirantis Proprietary License |
The following issues have been addressed in the MOSK 22.4 release:
[25349][Update] Fixed the issue causing MOSK cluster update failure after an OpenStack controller node replacement.
[26278][OpenStack] Fixed the issue with
l3-agentbeing stuck in theNot readystate and routers not being initialized properly during Neutron restart.[25447][OpenStack] Fixed the issue that caused a Masakari instance evacuation to fail if an encrypted volume was attached to a node.
[25448][OpenStack] Fixed the issue that caused some Masakari instances to get stuck in the
RebuildorErrorstate when being migrated to a new OpenStack compute node during host evacuation. The issue occurred on OpenStack compute nodes with a large number of instances.[22930][OpenStack] Fixed the issue wherein Octavia load balancers provisioning, and, occasionally, the listeners or pools associated with these load balancers got stuck in the
ERROR,PENDING_UPDATE,PENDING_CREATE, orPENDING_DELETEstate.[25450][OpenStack] Implemented the capability to enable
trustedmode for SR-IOV ports.[25316][StackLight] Introduced projects filtering by a domain name for the
defaultdomain to fix the issue wherein a wrong project was chosen by name in case of multiple projects with the same names.[24376][Ceph] Implemented the capability to parametrize the RADOS Block Device (RBD) device map to avoid Ceph volumes being unresponsive due to a disabled cyclic redundancy check (CRC) mode. Now you can use the
rbdDeviceMapOptionsfield in the Ceph pool parameters of theKaaSCephClusterCR to specify custom RBD map options to use withStorageClassof a corresponding Ceph pool. For details, see Pool parameters.[28783] [Ceph] Fixed the issue causing Ceph conditon stuck in absence of the Ceph cluster secrets information. If you applied the workaround to your MOSK 22.3 cluster before the update, remove the
versionparameter definition fromKaaSCephClusterafter the managed cluster update because the Ceph cluster version in MOSK 22.4 updates to 15.2.17.
This section describes the specific actions you as a Cloud Operator need to complete to accurately plan and successfully perform your Mirantis OpenStack for Kubernetes (MOSK) cluster to the version 22.4. Consider this information as a supplement to the generic update procedure published in Operations Guide: Update a MOSK cluster.
Additionally, read through the Cluster update known issues for the problems that are known to occur during update with recommended workarounds.
The MOSK cluster will obtain the newly implemented capabilities automatically with no significant impact on the update procedure.
When updating to MOSK 22.4, the Cloud Operator can easily
determine if a node needs to be rebooted by checking for the
restartRequired flag in the machine status. For details,
see Determine if the node needs to be rebooted.
The OIDCClaimDelimiter parameter defines the delimiter to use when setting
multi-valued claims in the HTTP headers. See the MOSK 22.4 OpenStack API
Reference
for details.
The current default value of the OIDCClaimDelimiter parameter is ",".
This value misaligns with the behavior expected by Keystone. As a result, when
creating federation mappings for Keystone, the cloud operator may be forced
to write more complex rules. Therefore, in early 2023, Mirantis will change
the default value for the OIDCClaimDelimiter parameter.
Affected deployments
Proceed with the instruction below only if the following conditions are true:
Keystone is set to use federation through the OpenID Connect protocol, with Mirantis Container Cloud Keycloak in particular. The following configuration is present in your
OpenStackDeploymentcustom resource:kind: OpenStackDeployment spec: features: keystone: keycloak: enabled: true
No value has already been specified for the
OIDCClaimDelimiterparameter in yourOpenStackDeploymentcustom resource.
To facilitate smooth transition of the existing deployments to the new default
value, explicitly define the OIDCClaimDelimiter parameter as follows:
kind: OpenStackDeployment
spec:
features:
keystone:
keycloak:
oidc:
OIDCClaimDelimiter: ","
Note
The new default value for the OIDCClaimDelimiter parameter
will be ";". To find out whether your Keystone mappings will need
adjustment after changing the default value, set the parameter to
";" on your staging environment and verify the rules.
The table below contains the number of vendor-specific addressed CVEs with Critical or High severity.
In total, in the MOSK 22.4 release, 124 CVEs have been fixed and 26 artifacts (images) updated.
Fixed CVE ID |
# of updated artifacts |
|---|---|
CVE-2022-27404 |
3 |
CVE-2022-29217 |
2 |
CVE-2022-1652 |
1 |
CVE-2022-22822 |
1 |
CVE-2022-22823 |
1 |
CVE-2022-22824 |
1 |
CVE-2022-23852 |
1 |
CVE-2022-23990 |
1 |
CVE-2022-25315 |
1 |
CVE-2022-32207 |
1 |
CVE-2022-32250 |
1 |
CVE-2021-20231 |
1 |
CVE-2021-20232 |
1 |
CVE-2021-3156 |
1 |
CVE-2021-3177 |
1 |
CVE-2021-41945 |
1 |
CVE-2021-45960 |
1 |
CVE-2020-10878 |
1 |
RHSA-2022:5052 |
48 |
RHSA-2022:6160 |
54 |
RHSA-2022:6170 |
1 |
The full list of the CVEs present in the current MOSK release is available at the Mirantis Security Portal.
22.3
Release date |
June 30, 2022 |
|---|---|
Name |
MOSK 22.3 |
Cluster release |
8.8.0 |
Highlights |
The third MOSK release in 2022 introduces the following key features:
|
Component |
Support scope |
Feature |
|---|---|---|
OpenStack |
Full |
Ubuntu 20.04 on OpenStack with OVS and Tungsten Fabric greenfield deployments |
Full |
||
Full |
||
Full |
||
Tungsten Fabric |
Full |
|
Container Cloud |
Full |
Implemented full support for Ubuntu 20.04 LTS (Focal Fossa) as the default host operating system on OpenStack with OVS and OpenStack with Tungsten Fabric greenfield deployments.
MOSK is now confirmed to be able to run up to 10,000 virtual machines under a single control plane.
Depending on the cloud workload profile and the number of OpenStack objects in use, the control plane needs to be extended with additional hardware. Specifically, for the MOSK clouds that use Open vSwitch as a backend for the Networking service (OpenStack Neutron) and run more than 12,000 network ports, Mirantis recommends deploying extra tenant gateways.
The maximum size of a MOSK cluster is limited to 500 nodes in total, regardless of their roles.
Introduced the OpenStackDeploymentSecret custom resource to aggregate
the cloud’s confidential settings such as SSL/TLS certificates, access
credentials for external systems, and other secrets. Previously, the secrets
were stored together with the rest of configuration in the
OpenStackDeployment custom resource.
The following fields have been moved out of the OpenStackDeployment
custom resource:
features:sslfeatures:barbican:backends:vault:approle_role_idfeatures:barbican:backends:vault:approle_secret_id
Switched all OpenStack services to use the built-in policies, aka in-code
policies, to control user access to cloud functions. MOSK
keeps the built-in policies up-to-date with the OpenStack development ensuring
safe by default behavior as well as allowing you to override only those access
rules that you actually need through the features:policies structure in
the OpenStackDeployment custom resource.
Sticking to the default policy set as much as possible simplifies the future enablement of advanced authentication and access control functionality, such as scoped tokens and scoped access policies.
Learn more
OpenStack official documentation: Policy in code specification
Added capability to precache containers’ images on Kubernetes nodes
to minimize possible downtime on the components update. The feature is
enabled by default and can be disabled through the TFOperator custom
resource if required.
Implemented support for custom Docker registries configuration. Using the
ContainerRegistry custom resource, you can configure CA certificates on
machines to access private Docker registries.
Learn more
Mirantis has tested MOSK against a very specific configuration and can guarantee a predictable behavior of the product only in the exact same environments. The table below includes the major MOSK components with the exact versions against which testing has been performed.
Component |
Version |
|---|---|
Cluster release |
|
OpenStack |
|
openstack-operator |
0.9.7 |
Tungsten Fabric |
|
tungstenfabric-operator |
0.8.5 |
See also
This section describes the MOSK known issues with available workarounds. For the known issues in the related version of Mirantis Container Cloud, refer to Mirantis Container Cloud: Release Notes.
This section lists the OpenStack known issues with workarounds for the Mirantis OpenStack for Kubernetes release 22.3.
During l3-agent restart, routers may not be initialized properly due to
erroneous logic in Neutron code causing l3-agent to get stuck in the
Not ready state. The readiness probe states that one of routers is not
ready with the keepalived process not started.
Example output of the kubectl -n openstack describe pod <neutron-l3 agent pod name> command:
Warning Unhealthy 109s (x476 over 120m) kubelet, ti-rs-nhmrmiuyqzxl-2-2obcnor6vt24-server-tmtr5ajqjflf \
Readiness probe failed: /tmp/health-probe.py:259: \
ERROR:/tmp/health-probe.py:The router: 66a885b7-0c7c-463a-a574-bdb19733baf3 is not initialized.
Workaround:
Remove the router from
l3-agent:neutron l3-agent-router-remove <router-name> <l3-agent-name>
Wait up to one minute.
Add the router back to
l3-agent:neutron l3-agent-router-add <router-name> <l3-agent-name>
Octavia load balancers provisioning_status may get stuck in the
ERROR, PENDING_UPDATE, PENDING_CREATE, or PENDING_DELETE state.
Occasionally, the listeners or pools associated with these load balancers may
also get stuck in the same state.
Workaround:
For administrative users that have access to the keystone-client pod:
Log in to a
keystone-clientpod.Delete the affected load balancer:
openstack loadbalancer delete <load_balancer_id> --force
For non-administrative users, access the Octavia API directly and delete the affected load balancer using the
"force": trueargument in the delete request:Access the Octavia API.
Obtain the token:
TOKEN=$(openstack token issue -f value -c id)
Obtain the endpoint:
ENDPOINT=$(openstack version show --service load-balancer --interface public --status CURRENT -f value -c Endpoint)
Delete the affected load balancers:
curl -H "X-Auth-Token: $TOKEN" -d '{"force": true}' -X DELETE $ENDPOINT/loadbalancers/<load_balancer_id>
This section lists the Tungsten Fabric known issues with workarounds for the Mirantis OpenStack for Kubernetes release 22.3. For Tungsten Fabric limitations, see Tungsten Fabric known limitations.
[13755] TF pods switch to CrashLoopBackOff after a simultaneous reboot
[10096] tf-control does not refresh IP addresses of Cassandra pods
Rebooting all Cassandra cluster TFConfig or TFAnalytics nodes, maintenance, or other circumstances that cause the Cassandra pods to start simultaneously may cause a broken Cassandra TFConfig and/or TFAnalytics cluster. In this case, Cassandra nodes do not join the ring and do not update the IPs of the neighbor nodes. As a result, the TF services cannot operate Cassandra cluster(s).
To verify that a Cassandra cluster is affected:
Run the nodetool status command specifying the config or
analytics cluster and the replica number:
kubectl -n tf exec -it tf-cassandra-<config/analytics>-dc1-rack1-<replica number> -c cassandra -- nodetool status
Example of system response with outdated IP addresses:
Datacenter: DC1
===============
Status=Up/Down
|/ State=Normal/Leaving/Joining/Moving
-- Address Load Tokens Owns (effective) Host ID Rack
DN <outdated ip> ? 256 64.9% a58343d0-1e3f-4d54-bcdf-9b9b949ca873 r1
DN <outdated ip> ? 256 69.8% 67f1d07c-8b13-4482-a2f1-77fa34e90d48 r1
Datacenter: dc1
===============
Status=Up/Down
|/ State=Normal/Leaving/Joining/Moving
-- Address Load Tokens Owns (effective) Host ID Rack
UN <actual ip> 3.84 GiB 256 65.2% 7324ebc4-577a-425f-b3de-96faac95a331 rack1
Workaround:
Manually delete a Cassandra pod from the failed config or analytics
cluster to re-initiate the bootstrap process for one of the Cassandra nodes:
kubectl -n tf delete pod tf-cassandra-<config/analytics>-dc1-rack1-<replica number>
The tf-control service resolves the DNS names of Cassandra pods at startup
and does not update them if Cassandra pods got new IP addresses, for example,
in case of a restart. As a workaround, to refresh the IP addresses of
Cassandra pods, restart the tf-control pods one by one:
kubectl -n tf delete pod tf-control-<hash>
Caution
Before restarting the tf-control pods:
Verify that the new pods are successfully spawned.
Verify that no vRouters are connected to only one
tf-controlpod that will be restarted.
This section lists the Ceph known issues with workarounds for the Mirantis OpenStack for Kubernetes release 22.3.
Ceph conditon gets stuck in absence of the Ceph cluster secrets information. The observed behaviour can be found on the MOSK clusters that have automatically updated their management cluster to Container Cloud 2.21 but are still running the MOSK 22.3 version.
The list of the symptoms includes:
The
Clusterobject contains the following condition:Failed to configure Ceph cluster: ceph cluster status info is not \ updated at least for 5 minutes, ceph cluster secrets info is not available yet
The
ceph-kcc-controllerlogs from thekaasnamespace contain the following loglines:2022-11-30 19:39:17.393595 E | ceph-spec: failed to update cluster condition to \ {Type:Ready Status:True Reason:ClusterCreated Message:Cluster created successfully \ LastHeartbeatTime:2022-11-30 19:39:17.378401993 +0000 UTC m=+2617.717554955 \ LastTransitionTime:2022-05-16 16:14:37 +0000 UTC}. failed to update object \ "rook-ceph/rook-ceph" status: Operation cannot be fulfilled on \ cephclusters.ceph.rook.io "rook-ceph": the object has been modified; please \ apply your changes to the latest version and try again
Workaround:
Edit
KaaSCephClusterof the affected managed cluster:kubectl -n <managedClusterProject> edit kaascephcluster
Substitute
<managedClusterProject>with the corresponding managed cluster namespace.Define the
versionparameter in theKaaSCephClusterspec:spec: cephClusterSpec: version: 15.2.13
Note
Starting from MOSK 22.4, the Ceph cluster version updates to 15.2.17. Therefore, remove the
versionparameter definition fromKaaSCephClusterafter the managed cluster update.Save the updated
KaaSCephClusterspec.Find the
MiraCephCustom Resource on a managed cluster and copy all annotations starting withmeta.helm.sh:kubectl --kubeconfig <managedClusterKubeconfig> get crd miracephs.lcm.mirantis.com -o yaml
Substitute
<managedClusterKubeconfig>with a corresponding managed clusterkubeconfig.Example of a system output:
apiVersion: apiextensions.k8s.io/v1 kind: CustomResourceDefinition metadata: annotations: controller-gen.kubebuilder.io/version: v0.6.0 # save all annotations with "meta.helm.sh" somewhere meta.helm.sh/release-name: ceph-controller meta.helm.sh/release-namespace: ceph ...
Create the
miracephsecretscrd.yamlfile and fill it with the following template:apiVersion: apiextensions.k8s.io/v1 kind: CustomResourceDefinition metadata: annotations: controller-gen.kubebuilder.io/version: v0.6.0 <insert all "meta.helm.sh" annotations here> labels: app.kubernetes.io/managed-by: Helm name: miracephsecrets.lcm.mirantis.com spec: conversion: strategy: None group: lcm.mirantis.com names: kind: MiraCephSecret listKind: MiraCephSecretList plural: miracephsecrets singular: miracephsecret scope: Namespaced versions: - name: v1alpha1 schema: openAPIV3Schema: description: MiraCephSecret aggregates secrets created by Ceph properties: apiVersion: type: string kind: type: string metadata: type: object status: properties: lastSecretCheck: type: string lastSecretUpdate: type: string messages: items: type: string type: array state: type: string type: object type: object served: true storage: true
Insert the copied
meta.helm.shannotations to themetadata.annotationssection of the template.Apply
miracephsecretscrd.yamlon the managed cluster:kubectl --kubeconfig <managedClusterKubeconfig> apply -f miracephsecretscrd.yaml
Substitute
<managedClusterKubeconfig>with a corresponding managed clusterkubeconfig.Obtain the
MiraCephname from the managed cluster:kubectl --kubeconfig <managedClusterKubeconfig> -n ceph-lcm-mirantis get miraceph -o name
Substitute
<managedClusterKubeconfig>with the corresponding managed clusterkubeconfig.Example of a system output:
miraceph.lcm.mirantis.com/rook-ceph
Copy the
MiraCephname after slash, therook-cephpart from the example above.Create the
mcs.yamlfile and fill it with the following template:apiVersion: lcm.mirantis.com/v1alpha1 kind: MiraCephSecret metadata: name: <miracephName> namespace: ceph-lcm-mirantis status: {}
Substitute
<miracephName>with theMiraCephname from the previous step.Apply
mcs.yamlon the managed cluster:kubectl --kubeconfig <managedClusterKubeconfig> apply -f mcs.yaml
Substitute
<managedClusterKubeconfig>with a corresponding managed clusterkubeconfig.
After some delay, the cluster condition will be updated to the health
state.
This section lists the cluster update known issues with workarounds for the Mirantis OpenStack for Kubernetes release 22.3.
[26534] The ‘ironic-conductor’ Pod fails after the management cluster upgrade
[25349] Cluster update failure after OpenStack controller node replacement
[24435] MetalLB speaker fails to announce the LB IP for the Ingress service
[23154] Ceph health is in ‘HEALTH_WARN’ state after managed cluster update
After the Container Cloud management cluster upgrade from 2.19.0 to 2.20.0,
the ironic-conductor Pod gets stuck in the CrashLoopBackOff state. The
issue occurs due to the race condition between the ironic-conductor and
ironic-conductor-http containers of the ironic-conductor Pod that try
to use ca-bundle.pem simultaneously but from different users.
As a workaround, run the following command:
kubectl -n openstack exec -t <failedPodName> -c ironic-conductor-http -- chown 42424:42424 /certs/ca-bundle.pem
After an OpenStack controller node replacement, the
octavia-create-resources job does not restart and the Octavia Health
Manager Pod on the new node cannot find its port in the Kubernetes secret. As a
result, MOSK cluster update may fail.
Workaround:
After adding the new OpenStack controller node but before the update process
starts, manually restart the octavia-create-resources job:
kubectl -n osh-system exec <OSCTL_POD> -- osctl-job-rerun octavia-create-resources openstack
After updating the MOSK cluster, MetalLB speaker may fail to announce the Load Balancer (LB) IP address for the OpenStack Ingress service. As a result, the OpenStack Ingress service is not accessible using its LB IP address.
The issue may occur if the MetalLB speaker nodeSelector selects not all
the nodes selected by nodeSelector of the OpenStack Ingress service.
The issue may arise and disappear when a new MetalLB speaker is being selected by the MetalLB Controller to announce the LB IP address.
The issue occurs since MOSK 22.2 after
externalTrafficPolicy was set to local for the OpenStack Ingress
service.
Workaround:
Select from the following options:
Set
externalTrafficPolicytoclusterfor the OpenStack Ingress service.This option is preferable in the following cases:
If not all cluster nodes have connection to the external network
If the connection to the external network cannot be established
If network configuration changes are not desired
If network configuration is allowed and if you require the
externalTrafficPolicy: localoption:Wire the external network to all cluster nodes where the OpenStack Ingress service Pods are running.
Configure IP addresses in the external network on the nodes and change the default routes on the nodes.
Change
nodeSelectorof MetalLB speaker to matchnodeSelectorof the OpenStack Ingress service.
After updating the MOSK cluster, Ceph health is in
the HEALTH_WARN state with the SLOW_OPS health message.
The workaround is to restart the affected Ceph Monitors.
This section lists the components artifacts of the MOSK 22.3 release.
Component |
Path |
License information for main executable programs |
|---|---|---|
Binaries |
||
mirantis |
https://binary.mirantis.com/openstack/bin/horizon/mirantis-victoria-8f71802-20210119120707.tar.gz |
Mirantis Proprietary License |
octavia-amphora |
https://binary.mirantis.com/openstack/bin/octavia/amphora-x64-haproxy-victoria-20220528060551.qcow2 |
Mirantis Proprietary License |
Docker images |
||
ironic-inspector |
mirantis.azurecr.io/openstack/ironic-inspector:victoria-focal-20220528051016 |
Apache License 2.0 |
masakari-monitors |
mirantis.azurecr.io/openstack/masakari-monitors:victoria-focal-20220528051016 |
Apache License 2.0 |
masakari |
mirantis.azurecr.io/openstack/masakari:victoria-focal-20220528051016 |
Apache License 2.0 |
placement |
mirantis.azurecr.io/openstack/placement:victoria-focal-20220528051016 |
Apache License 2.0 |
keystone |
mirantis.azurecr.io/openstack/keystone:victoria-focal-20220528051016 |
Apache License 2.0 |
heat |
mirantis.azurecr.io/openstack/heat:victoria-focal-20220528051016 |
Apache License 2.0 |
glance |
mirantis.azurecr.io/openstack/glance:victoria-focal-20220528051016 |
Apache License 2.0 |
cinder |
mirantis.azurecr.io/openstack/cinder:victoria-focal-20220528051016 |
Apache License 2.0 |
neutron |
mirantis.azurecr.io/openstack/neutron:victoria-focal-20220528051016 |
Apache License 2.0 |
nova |
mirantis.azurecr.io/openstack/nova:victoria-focal-20220528051016 |
Apache License 2.0 |
horizon |
mirantis.azurecr.io/openstack/horizon:victoria-focal-20220528051016 |
Apache License 2.0 |
tempest |
mirantis.azurecr.io/openstack/tempest:victoria-focal-20220528051016 |
Apache License 2.0 |
octavia |
mirantis.azurecr.io/openstack/octavia:victoria-focal-20220528051016 |
Apache License 2.0 |
designate |
mirantis.azurecr.io/openstack/designate:victoria-focal-20220528051016 |
Apache License 2.0 |
ironic |
mirantis.azurecr.io/openstack/ironic:victoria-focal-20220528051016 |
Apache License 2.0 |
barbican |
mirantis.azurecr.io/openstack/barbican:victoria-focal-20220528051016 |
Apache License 2.0 |
libvirt |
mirantis.azurecr.io/general/libvirt:6.0.0-focal-20220503164811 |
LGPL-2.1 License |
pause |
mirantis.azurecr.io/general/external/pause:3.1 |
Apache License 2.0 |
openvswitch |
mirantis.azurecr.io/general/openvswitch:2.13-focal-20220505142933 |
Apache License 2.0 |
openvswitch-dpdk |
mirantis.azurecr.io/general/openvswitch-dpdk:2.13-focal-20220505142933 |
Apache License 2.0 |
openstack-tools |
mirantis.azurecr.io/openstack/openstack-tools:victoria-focal-20220528051016 |
Apache License 2.0 |
rabbitmq-3.9 |
mirantis.azurecr.io/general/rabbitmq:3.9.8 |
Mozilla Public License 2.0 |
rabbitmq-3.9-management |
mirantis.azurecr.io/general/rabbitmq:3.9.8-management |
Mozilla Public License 2.0 |
kubernetes-entrypoint |
mirantis.azurecr.io/openstack/extra/kubernetes-entrypoint:v1.0.0-20200311160233 |
Apache License 2.0 |
docker |
mirantis.azurecr.io/openstack/extra/docker:17.07.0 |
Apache License 2.0 |
memcached |
mirantis.azurecr.io/general/memcached:1.6.6-alpine |
BSD 3-Clause “New” or “Revised” License |
ceph-config-helper |
mirantis.azurecr.io/openstack/extra/ceph-config-helper:octopus-focal-20220516093942 |
Apache License 2.0, LGPL-2.1 or LGPL-3 |
etcd |
mirantis.azurecr.io/openstack/extra/etcd:3.5.2 |
Apache License 2.0 |
powerdns |
mirantis.azurecr.io/openstack/extra/powerdns:4.2-alpine-20200117133238 |
GPL-2.0 License |
nginx-ingress-controller |
mirantis.azurecr.io/openstack/extra/nginx-ingress-controller:0.49.3 |
Apache License 2.0 |
defaultbackend |
mirantis.azurecr.io/openstack/extra/defaultbackend:1.0 |
Apache License 2.0 |
mariadb |
mirantis.azurecr.io/general/mariadb:10.6.7-focal-20220503161631 |
GPLv2, LGPLv2.1 (client libraries) |
rabbitmq-exporter |
mirantis.azurecr.io/stacklight/rabbitmq-exporter:v1.0.0-RC8 |
MIT License |
prometheus-memcached-exporter |
mirantis.azurecr.io/stacklight/memcached-exporter:0.9.0 |
Apache License 2.0 |
prometheus-mysql-exporter |
mirantis.azurecr.io/stacklight/mysqld-exporter:v0.11.0 |
Apache License 2.0 |
xrally-openstack |
mirantis.azurecr.io/openstack/extra/xrally-openstack:2.2.0-20220217210744 |
Apache License 2.0 |
aodh |
mirantis.azurecr.io/openstack/aodh:victoria-focal-20220528051016 |
Apache License 2.0 |
panko |
mirantis.azurecr.io/openstack/panko:victoria-focal-20220528051016 |
Apache License 2.0 |
ceilometer |
mirantis.azurecr.io/openstack/ceilometer:victoria-focal-20220528051016 |
Apache License 2.0 |
gnocchi |
mirantis.azurecr.io/openstack/gnocchi:victoria-focal-20220528051016 |
Apache License 2.0 |
redis |
mirantis.azurecr.io/openstack/extra/redis:6.2.6-alpine3.15 |
BSD 3-Clause “New” or “Revised” License |
frr |
mirantis.azurecr.io/general/external/docker.io/frrouting/frr:v8.2.2 |
GPL-2.0 License |
strongswan |
mirantis.azurecr.io/openstack/extra/strongswan:alpine-5.9.1-20211018180158 |
GPL License |
descheduler |
mirantis.azurecr.io/openstack/extra/descheduler:v0.21.0 |
Apache License 2.0 |
Component |
Path |
License information for main executable programs |
|---|---|---|
Binaries |
||
mirantis |
https://binary.mirantis.com/openstack/bin/horizon/mirantis-ussuri-48f346e-20210119132403.tar.gz |
Mirantis Proprietary License |
octavia-amphora |
https://binary.mirantis.com/openstack/bin/octavia/amphora-x64-haproxy-ussuri-20220513090507.qcow2 |
Mirantis Proprietary License |
Docker images |
||
ironic-inspector |
mirantis.azurecr.io/openstack/ironic-inspector:ussuri-bionic-20220513073430 |
Apache License 2.0 |
masakari-monitors |
mirantis.azurecr.io/openstack/masakari-monitors:ussuri-bionic-20220513073430 |
Apache License 2.0 |
masakari |
mirantis.azurecr.io/openstack/masakari:ussuri-bionic-20220513073430 |
Apache License 2.0 |
placement |
mirantis.azurecr.io/openstack/placement:ussuri-bionic-20220513073430 |
Apache License 2.0 |
redis |
mirantis.azurecr.io/openstack/extra/redis:6.2.6-alpine3.15 |
BSD 3-Clause “New” or “Revised” License |
gnocchi |
mirantis.azurecr.io/openstack/gnocchi:ussuri-bionic-20220513073430 |
Apache License 2.0 |
ceilometer |
mirantis.azurecr.io/openstack/ceilometer:ussuri-bionic-20220513073430 |
Apache License 2.0 |
panko |
mirantis.azurecr.io/openstack/panko:ussuri-bionic-20220513073430 |
Apache License 2.0 |
aodh |
mirantis.azurecr.io/openstack/aodh:ussuri-bionic-20220513073430 |
Apache License 2.0 |
xrally-openstack |
mirantis.azurecr.io/openstack/extra/xrally-openstack:2.2.0-20220217210744 |
Apache License 2.0 |
prometheus-mysql-exporter |
mirantis.azurecr.io/stacklight/mysqld-exporter:v0.11.0 |
Apache License 2.0 |
prometheus-memcached-exporter |
mirantis.azurecr.io/stacklight/memcached-exporter:0.9.0 |
Apache License 2.0 |
rabbitmq-exporter |
mirantis.azurecr.io/stacklight/rabbitmq-exporter:v1.0.0-RC8 |
MIT License |
mariadb |
mirantis.azurecr.io/general/mariadb:10.6.7-focal-20220503161631 |
GPLv2, LGPLv2.1 (client libraries) |
defaultbackend |
mirantis.azurecr.io/openstack/extra/defaultbackend:1.0 |
Apache License 2.0 |
nginx-ingress-controller |
mirantis.azurecr.io/openstack/extra/nginx-ingress-controller:0.49.3 |
Apache License 2.0 |
powerdns |
mirantis.azurecr.io/openstack/extra/powerdns:4.2-alpine-20200117133238 |
GPL-2.0 License |
etcd |
mirantis.azurecr.io/openstack/extra/etcd:3.2.26 |
Apache License 2.0 |
ceph-config-helper |
mirantis.azurecr.io/openstack/extra/ceph-config-helper:octopus-focal-20220516093942 |
Apache License 2.0, LGPL-2.1 or LGPL-3 |
memcached |
mirantis.azurecr.io/general/memcached:1.6.6-alpine |
BSD 3-Clause “New” or “Revised” License |
docker |
mirantis.azurecr.io/openstack/extra/docker:17.07.0 |
Apache License 2.0 |
kubernetes-entrypoint |
mirantis.azurecr.io/openstack/extra/kubernetes-entrypoint:v1.0.0-20200311160233 |
Apache License 2.0 |
rabbitmq-3.9-management |
mirantis.azurecr.io/general/rabbitmq:3.9.8-management |
Mozilla Public License 2.0 |
rabbitmq-3.9 |
mirantis.azurecr.io/general/rabbitmq:3.9.8 |
Mozilla Public License 2.0 |
openstack-tools |
mirantis.azurecr.io/openstack/openstack-tools:victoria-focal-20220516060019 |
Apache License 2.0 |
openvswitch-dpdk |
mirantis.azurecr.io/general/openvswitch-dpdk:2.11-bionic-20220421094914 |
Apache License 2.0 |
openvswitch |
mirantis.azurecr.io/general/openvswitch:2.11-bionic-20220421094914 |
Apache License 2.0 |
pause |
mirantis.azurecr.io/general/external/pause:3.1 |
Apache License 2.0 |
libvirt |
mirantis.azurecr.io/general/libvirt:6.0.0-focal-20220503164811 |
LGPL-2.1 License |
barbican |
mirantis.azurecr.io/openstack/barbican:ussuri-bionic-20220513073430 |
Apache License 2.0 |
ironic |
mirantis.azurecr.io/openstack/ironic:ussuri-bionic-20220513073430 |
Apache License 2.0 |
designate |
mirantis.azurecr.io/openstack/designate:ussuri-bionic-20220513073430 |
Apache License 2.0 |
octavia |
mirantis.azurecr.io/openstack/octavia:ussuri-bionic-20220513073430 |
Apache License 2.0 |
tempest |
mirantis.azurecr.io/openstack/tempest:ussuri-bionic-20220513073430 |
Apache License 2.0 |
horizon |
mirantis.azurecr.io/openstack/horizon:ussuri-bionic-20220513073430 |
Apache License 2.0 |
nova |
mirantis.azurecr.io/openstack/nova:ussuri-bionic-20220513073430 |
Apache License 2.0 |
neutron |
mirantis.azurecr.io/openstack/neutron:ussuri-bionic-20220513073430 |
Apache License 2.0 |
cinder |
mirantis.azurecr.io/openstack/cinder:ussuri-bionic-20220513073430 |
Apache License 2.0 |
glance |
mirantis.azurecr.io/openstack/glance:ussuri-bionic-20220513073430 |
Apache License 2.0 |
heat |
mirantis.azurecr.io/openstack/heat:ussuri-bionic-20220513073430 |
Apache License 2.0 |
keystone |
mirantis.azurecr.io/openstack/keystone:ussuri-bionic-20220513073430 |
Apache License 2.0 |
frr |
mirantis.azurecr.io/general/external/docker.io/frrouting/frr:v8.2.2 |
GPL-2.0 License |
strongswan |
mirantis.azurecr.io/openstack/extra/strongswan:alpine-5.9.1-20211018180158 |
GPL License |
descheduler |
mirantis.azurecr.io/openstack/extra/descheduler:v0.21.0 |
Apache License 2.0 |
Component |
Path |
License information for main executable programs |
|---|---|---|
Helm charts |
||
Tungsten Fabric Operator |
https://binary.mirantis.com/tungsten/helm/tungstenfabric-operator-0.8.5.tgz |
Mirantis Proprietary License |
Docker images |
||
Tungsten Fabric Operator |
mirantis.azurecr.io/tungsten-operator/tungstenfabric-operator:0.8.5 |
Mirantis Proprietary License |
Analytics |
mirantis.azurecr.io/tungsten/contrail-analytics-api:5.1.20220127155145 |
Apache License 2.0 |
mirantis.azurecr.io/tungsten/contrail-analytics-collector:5.1.20220127155145 |
Apache License 2.0 |
|
Analytics Alarm |
mirantis.azurecr.io/tungsten/contrail-analytics-alarm-gen:5.1.20220127155145 |
Apache License 2.0 |
Analytics DB |
mirantis.azurecr.io/tungsten/contrail-analytics-query-engine:5.1.20220127155145 |
Apache License 2.0 |
Analytics SNMP |
mirantis.azurecr.io/tungsten/contrail-analytics-snmp-collector:5.1.20220127155145 |
Apache License 2.0 |
mirantis.azurecr.io/tungsten/contrail-analytics-snmp-topology:5.1.20220127155145 |
Apache License 2.0 |
|
Config |
mirantis.azurecr.io/tungsten/contrail-controller-config-api:5.1.20220127155145 |
Apache License 2.0 |
mirantis.azurecr.io/tungsten/contrail-controller-config-devicemgr:5.1.20220127155145 |
Apache License 2.0 |
|
mirantis.azurecr.io/tungsten/contrail-controller-config-schema:5.1.20220127155145 |
Apache License 2.0 |
|
mirantis.azurecr.io/tungsten/contrail-controller-config-svcmonitor:5.1.20220127155145 |
Apache License 2.0 |
|
Control |
mirantis.azurecr.io/tungsten/contrail-controller-control-control:5.1.20220127155145 |
Apache License 2.0 |
mirantis.azurecr.io/tungsten/contrail-controller-control-dns:5.1.20220127155145 |
Apache License 2.0 |
|
mirantis.azurecr.io/tungsten/contrail-controller-control-named:5.1.20220127155145 |
Apache License 2.0 |
|
Web UI |
mirantis.azurecr.io/tungsten/contrail-controller-webui-job:5.1.20220127155145 |
Apache License 2.0 |
mirantis.azurecr.io/tungsten/contrail-controller-webui-web:5.1.20220127155145 |
Apache License 2.0 |
|
vRouter |
mirantis.azurecr.io/tungsten/contrail-vrouter-agent:5.1.20220127155145 |
Apache License 2.0 |
mirantis.azurecr.io/tungsten/contrail-vrouter-kernel-build-init:5.1.20220127155145 |
Apache License 2.0 |
|
Nodemanager |
mirantis.azurecr.io/tungsten/contrail-nodemgr:5.1.20220127155145 |
Apache License 2.0 |
Cassandra operator |
mirantis.azurecr.io/tungsten-operator/casskop:v2.0.2-release |
Apache License 2.0 |
Cassandra |
mirantis.azurecr.io/tungsten/cassandra-bootstrap:0.1.9 |
Apache License 2.0 |
mirantis.azurecr.io/tungsten/cassandra:3.11.10 |
Apache License 2.0 |
|
mirantis.azurecr.io/tungsten/cass-config-builder:1.0.4 |
Apache License 2.0 |
|
mirantis.azurecr.io/tungsten/instaclustr-icarus:1.1.0 |
Apache License 2.0 |
|
Kafka operator |
mirantis.azurecr.io/tungsten-operator/kafka-k8s-operator:0.1.4 |
Mirantis Proprietary License |
Kafka |
mirantis.azurecr.io/tungsten/cp-kafka:5.5.7 |
Apache License 2.0 |
mirantis.azurecr.io/stacklight/prometheus-jmx-exporter:0.16.1-debian-10-r208 |
Apache License 2.0 |
|
RabbitMQ operator |
mirantis.azurecr.io/tungsten-operator/rabbitmq-operator:0.1.9 |
Mirantis Proprietary License |
RabbitMQ |
mirantis.azurecr.io/general/rabbitmq:3.9.8 |
Mozilla Public License 2.0 |
mirantis.azurecr.io/stacklight/rabbitmq-exporter:v1.0.0-RC8 |
MIT License |
|
ZooKeeper operator |
mirantis.azurecr.io/tungsten-operator/zookeeper-operator:0.2.12 |
Apache License 2.0 |
ZooKeeper |
mirantis.azurecr.io/tungsten/zookeeper:3.6.3-0.2.13 |
Apache License 2.0 |
Redis operator |
mirantis.azurecr.io/tungsten-operator/redis-operator:0.2.2-1-8cba7b0 |
Apache License 2.0 |
Redis |
mirantis.azurecr.io/tungsten/redis:6.2.7-alpine3.16 |
BSD 3-Clause “New” or “Revised” License |
TF Test |
mirantis.azurecr.io/tungsten/tungsten-pytest:0.1-20220601115218 |
MIT License |
TF CLI |
mirantis.azurecr.io/tungsten/tf-cli:0.1-20220406152321 |
MIT License |
TF NodeInfo |
mirantis.azurecr.io/tungsten/tf-nodeinfo:0.1-20210430090010 |
MIT License |
Component |
Path |
License information for main executable programs |
|---|---|---|
Helm charts |
||
Tungsten Fabric Operator |
https://binary.mirantis.com/tungsten/helm/tungstenfabric-operator-0.8.5.tgz |
Mirantis Proprietary License |
Docker images |
||
Tungsten Fabric Operator |
mirantis.azurecr.io/tungsten-operator/tungstenfabric-operator:0.8.5 |
Mirantis Proprietary License |
Analytics |
mirantis.azurecr.io/tungsten/contrail-analytics-api:2011.20220601111608 |
Apache License 2.0 |
mirantis.azurecr.io/tungsten/contrail-analytics-collector:2011.20220601111608 |
Apache License 2.0 |
|
Analytics Alarm |
mirantis.azurecr.io/tungsten/contrail-analytics-alarm-gen:2011.20220601111608 |
Apache License 2.0 |
Analytics DB |
mirantis.azurecr.io/tungsten/contrail-analytics-query-engine:2011.20220601111608 |
Apache License 2.0 |
Analytics SNMP |
mirantis.azurecr.io/tungsten/contrail-analytics-snmp-collector:2011.20220601111608 |
Apache License 2.0 |
mirantis.azurecr.io/tungsten/contrail-analytics-snmp-topology:2011.20220601111608 |
Apache License 2.0 |
|
Config |
mirantis.azurecr.io/tungsten/contrail-controller-config-api:2011.20220601111608 |
Apache License 2.0 |
mirantis.azurecr.io/tungsten/contrail-controller-config-devicemgr:2011.20220601111608 |
Apache License 2.0 |
|
mirantis.azurecr.io/tungsten/contrail-controller-config-schema:2011.20220601111608 |
Apache License 2.0 |
|
mirantis.azurecr.io/tungsten/contrail-controller-config-svcmonitor:2011.20220601111608 |
Apache License 2.0 |
|
mirantis.azurecr.io/openstack/extra/kubernetes-entrypoint:v1.0.0-20200311160233 |
Apache License 2.0 |
|
Control |
contrail-controller-control-control:2011.20220601111608 |
Apache License 2.0 |
mirantis.azurecr.io/tungsten/contrail-controller-control-dns:2011.20220601111608 |
Apache License 2.0 |
|
mirantis.azurecr.io/tungsten/contrail-controller-control-named:2011.20220601111608 |
Apache License 2.0 |
|
Web UI |
mirantis.azurecr.io/tungsten/contrail-controller-webui-job:2011.20220601111608 |
Apache License 2.0 |
mirantis.azurecr.io/tungsten/contrail-controller-webui-web:2011.20220601111608 |
Apache License 2.0 |
|
vRouter |
mirantis.azurecr.io/tungsten/contrail-vrouter-agent:2011.20220601111608 |
Apache License 2.0 |
mirantis.azurecr.io/tungsten/contrail-vrouter-kernel-build-init:2011.20220601111608 |
Apache License 2.0 |
|
mirantis.azurecr.io/tungsten/contrail-node-init:2011.20220601111608 |
Apache License 2.0 |
|
Nodemanager |
mirantis.azurecr.io/tungsten/contrail-nodemgr:2011.20220601111608 |
Apache License 2.0 |
Provisioner |
mirantis.azurecr.io/tungsten/contrail-provisioner:2011.20220601111608 |
Apache License 2.0 |
Cassandra operator |
mirantis.azurecr.io/tungsten-operator/casskop:v2.0.2-release |
Apache License 2.0 |
Cassandra |
mirantis.azurecr.io/tungsten/cassandra-bootstrap:0.1.9 |
Apache License 2.0 |
mirantis.azurecr.io/tungsten/cassandra:3.11.10 |
Apache License 2.0 |
|
mirantis.azurecr.io/tungsten/cass-config-builder:1.0.4 |
Apache License 2.0 |
|
mirantis.azurecr.io/tungsten/instaclustr-icarus:v2-20220601125122 |
Apache License 2.0 |
|
Kafka operator |
mirantis.azurecr.io/tungsten-operator/kafka-k8s-operator:0.1.4 |
Mirantis Proprietary License |
Kafka |
mirantis.azurecr.io/tungsten/cp-kafka:5.5.7 |
Apache License 2.0 |
mirantis.azurecr.io/stacklight/prometheus-jmx-exporter:0.16.1-debian-10-r208 |
Apache License 2.0 |
|
RabbitMQ operator |
mirantis.azurecr.io/tungsten-operator/rabbitmq-operator:0.1.9 |
Mirantis Proprietary License |
RabbitMQ |
mirantis.azurecr.io/general/rabbitmq:3.9.8 |
Mozilla Public License 2.0 |
mirantis.azurecr.io/stacklight/rabbitmq-exporter:v1.0.0-RC8 |
MIT License |
|
ZooKeeper operator |
mirantis.azurecr.io/tungsten-operator/zookeeper-operator:0.2.12 |
Apache License 2.0 |
ZooKeeper |
mirantis.azurecr.io/tungsten/zookeeper:3.6.3-0.2.13 |
Apache License 2.0 |
Redis operator |
mirantis.azurecr.io/tungsten-operator/redis-operator:0.2.2-1-8cba7b0 |
Apache License 2.0 |
Redis |
mirantis.azurecr.io/tungsten/redis:6.2.7-alpine3.16 |
BSD 3-Clause “New” or “Revised” License |
TF Test |
mirantis.azurecr.io/tungsten/tungsten-pytest:0.1-20220601115218 |
MIT License |
TF CLI |
mirantis.azurecr.io/tungsten/tf-cli:0.1-20220406152321 |
MIT License |
TF NodeInfo |
mirantis.azurecr.io/tungsten/tf-nodeinfo:0.1-20210430090010 |
MIT License |
TF Tools |
mirantis.azurecr.io/tungsten/contrail-tools:2011.20220601111608 |
Apache License 2.0 |
Component |
Path |
License information for main executable programs |
|---|---|---|
Docker images |
||
prometheus-libvirt-exporter |
mirantis.azurecr.io/stacklight/prometheus-libvirt-exporter:v0.1-20200610164751 |
Mirantis Proprietary License |
prometheus-tungstenfabric-exporter |
mirantis.azurecr.io/stacklight/tungstenfabric-prometheus-exporter:0.1-20210115152338 |
Mirantis Proprietary License |
Helm charts |
||
prometheus-libvirt-exporter |
https://binary.mirantis.com/stacklight/helm/prometheus-libvirt-exporter-0.2.0-mcp-1.tgz |
Mirantis Proprietary License |
prometheus-tungstenfabric-exporter |
https://binary.mirantis.com/stacklight/helm/prometheus-tungstenfabric-exporter-0.2.0-mcp-3.tgz |
Mirantis Proprietary License |
The following issues have been addressed in the MOSK 22.3 release:
[23771][Update] Fixed the issue that caused connectivity loss due to a wrong update order of Neutron services.
[23131][Update] Fixed the issue that caused live migration to fail during an update of a cluster with encrypted storage. Now, you can perform live migrations using the following command:
openstack --os-cloud osctl server migrate --live-migration <INSTANCE_ID>
[21790][Update] Fixed the issue wherein the Ceph cluster failed to update on a managed cluster with the Daemonset csi-rbdplugin is not found error message.
[23985][OpenStack] Fixed the issue that caused the federated authorization failure on the Keycloak URL update.
[23484][OpenStack] To prevent from
ovsdbsession disconnection causing port processing operations being blocked, configured the default timeouts forovsdb.[23297][OpenStack] Fixed the issue that caused VMs to be unaccessible through floating IP due to missing IPtables rules for floating IPs on the OpenStack compute DVR router.
[23043][OpenStack] Updated Neutron Open vSwitch to version 2.13 to fix the issue that caused broken communication between VMs in the same network.
[19065][OpenStack] Fixed the issue that caused Octavia load balancers to lose Amphora VMs after failover.
[23338][Tungsten Fabric] Fixed the issue wherein the Tungsten Fabric (TF) tools from the
contrail-toolscontainer did not work on DPDK nodes.[22273][Tungsten Fabric] To avoid issues with
CassandraCacheHitRateTooLowStackLight alerts raising for thetf-cassandra-analyticsPods, implemented the capability to configurefile_cache_size_in_mbfor thetf-cassandra-analyticsortf-cassandra-configCassandra deployment. By default, this parameter is set to512. For details, see Cassandra configuration.
This section describes the specific actions you as a cloud operator need to complete to accurately plan and successfully perform your Mirantis OpenStack for Kubernetes (MOSK) cluster to the version 22.3. Consider this information as a supplement to the generic update procedure published in Operations Guide: Update a MOSK cluster.
Additionally, read through the Cluster update known issues for the problems that are known to occur during update with recommended workarounds.
The OpenStackDeploymentSecret custom resource replaced the fields in
OpenStackDeployment customer resource that used to keep the cloud’s
confidential settings. These include:
features:sslfeatures:barbican:backends:vault:approle_role_idfeatures:barbican:backends:vault:approle_secret_id
After the update, migrate the fields mentioned above from OpenStackDeployment to OpenStackDeploymentSecret custom resource as follows:
Create an
OpenStackDeploymentSecretobject with the same name as theOpenStackDeploymentobject.Set the fields in the
OpenStackDeploymentSecretcustom resource as required.Remove the related fields from the
OpenStackDeploymentcustom resource.
Switched all OpenStack components to built-in policies by default. If you have
any custom policies defined through the features:policies structure in
the OpenStackDeployment custom resource, some API calls may not work as
usual. Therefore, after completing the update, revalidate all the custom
access rules configured for your cloud.
Revalidate all the custom OpenStack access rules configured through the
features:policies structure in the OpenStackDeployment custom
resource.
To complete the update of a cluster with Tungsten Fabric as a backend for networking, manually restart Tungsten Fabric vRouter agent Pods on all compute nodes.
Restart of a vRouter agent on a compute node will cause up to 30-60 seconds of networking downtime per instance hosted there. If downtime is unacceptable for some workloads, we recommend that you migrate them before restarting the vRouter Pods.
Warning
Under certain rare circumstances, the reload of the vRouter kernel
module triggered by the restart of a vRouter agent can hang due to
the inability to complete the drop_caches operation. Watch the status
and logs of the vRouter agent being restarted and trigger the reboot of
the node, if necessary.
To restart the vRouter Pods:
Remove the vRouter pods one by one manually.
Note
Manual removal is required because vRouter pods use the
OnDeleteupdate strategy. vRouter pod restart causes networking downtime for workloads on the affected node. If it is not applicable for some workloads, migrate them before restarting the vRouter pods.kubectl -n tf delete pod <VROUTER-POD-NAME>
Verify that all
tf-vrouter-*pods have been updated:kubectl -n tf get ds | grep tf-vrouter
The
UP-TO-DATEandCURRENTfields must have the same values.
Switch to the new format of domain_specific_configuration in the
OpenStackDeployment object. For details, see Reference Architecture:
Standard configuration.
Reboot the cluster nodes to complete the update as described in Cluster update.
The table below contains the number of vendor-specific addressed CVEs with Critical or High severity.
In total, in the MOSK 22.3 release, 88 CVEs have been fixed and 196 artifacts updated.
Fixed CVE ID |
# of updated artifacts |
|---|---|
CVE-2022-28347 |
3 |
CVE-2022-28346 |
3 |
CVE-2022-1048 |
2 |
CVE-2022-0435 |
1 |
CVE-2021-43527 |
2 |
CVE-2021-42008 |
1 |
CVE-2021-4197 |
2 |
CVE-2021-4157 |
1 |
CVE-2021-41495 |
1 |
CVE-2021-4083 |
1 |
CVE-2021-4034 |
1 |
CVE-2021-39713 |
1 |
CVE-2021-39698 |
1 |
CVE-2021-39685 |
1 |
CVE-2021-39634 |
1 |
CVE-2021-38300 |
1 |
CVE-2021-38160 |
1 |
CVE-2021-37576 |
1 |
CVE-2021-3752 |
1 |
CVE-2021-3715 |
1 |
CVE-2021-3640 |
1 |
CVE-2021-3612 |
1 |
CVE-2021-3609 |
1 |
CVE-2021-3573 |
1 |
CVE-2021-35550 |
1 |
CVE-2021-3517 |
1 |
CVE-2021-33909 |
1 |
CVE-2021-3347 |
1 |
CVE-2021-31535 |
2 |
CVE-2021-29154 |
1 |
CVE-2021-28972 |
1 |
CVE-2021-28660 |
1 |
CVE-2021-27928 |
1 |
CVE-2021-2389 |
1 |
CVE-2021-23133 |
1 |
CVE-2021-20302 |
1 |
CVE-2021-20300 |
1 |
CVE-2021-20292 |
1 |
CVE-2021-1048 |
1 |
CVE-2021-0941 |
1 |
CVE-2021-0920 |
1 |
CVE-2020-36329 |
1 |
CVE-2020-36328 |
1 |
CVE-2020-36158 |
1 |
CVE-2020-29661 |
1 |
CVE-2020-29569 |
1 |
CVE-2020-29368 |
1 |
CVE-2020-27843 |
1 |
CVE-2020-27786 |
1 |
CVE-2020-27777 |
1 |
CVE-2020-25696 |
1 |
CVE-2020-25671 |
1 |
CVE-2020-25670 |
1 |
CVE-2020-25669 |
1 |
CVE-2020-25668 |
1 |
CVE-2020-25643 |
1 |
CVE-2020-1747 |
1 |
CVE-2020-15780 |
1 |
CVE-2020-15436 |
1 |
CVE-2020-14386 |
1 |
CVE-2020-14356 |
1 |
CVE-2020-13974 |
1 |
CVE-2020-12464 |
1 |
CVE-2020-10757 |
1 |
CVE-2020-0466 |
1 |
CVE-2020-0465 |
1 |
CVE-2020-0452 |
1 |
CVE-2020-0444 |
1 |
CVE-2019-20908 |
1 |
CVE-2019-19816 |
1 |
CVE-2019-19813 |
1 |
CVE-2019-19074 |
1 |
CVE-2019-11324 |
1 |
CVE-2019-10906 |
1 |
CVE-2019-1010142 |
1 |
CVE-2019-0145 |
1 |
CVE-2018-7750 |
1 |
CVE-2018-25014 |
1 |
CVE-2018-25011 |
1 |
CVE-2018-20060 |
1 |
CVE-2018-18074 |
1 |
CVE-2018-1000805 |
1 |
CVE-2017-18342 |
1 |
CVE-2017-12852 |
1 |
RHSA-2022:2213 |
27 |
RHSA-2022:2191 |
23 |
RHSA-2022:1069 |
23 |
RHSA-2022:1066 |
31 |
The full list of the CVEs present in the current MOSK release is available at the Mirantis Security Portal.
MOSK 22.2 release
Release date |
April 14, 2022 |
|---|---|
Name |
MOSK 22.2 |
Cluster release |
8.6.0+22.2 |
Highlights |
The second MOSK release in 2022 introduces the following key features:
|
Component |
Support scope |
Feature |
|---|---|---|
OpenStack |
Full |
|
Full |
||
TechPreview |
||
n/a |
||
Full |
||
Tungsten Fabric |
Full |
|
Bare metal |
TechPreview |
Updated the minor version of MariaDB from 10.4 to 10.6. The update applies automatically during the MOSK cluster update procedure.
Exposed the IP addresses of the cloud users that consume API of a cloud to all user-facing cloud services, such as OpenStack, Ceph, and others. Now, the IP addresses get recoded in the corresponding logs allowing for easy troubleshooting and security auditing of the cloud.
TechPreview
Implemented the capability to configure CPU isolation using the cpusets
mechanism in Linux kernel. Configuring CPU isolation using the isolcpus
configuration parameter for Linux kernel is considered deprecated.
Validated MOSK against the upstream OpenStack Security Checklist. The default configuration of MOSK services that include Identity, Dashboard, Compute, Block Storage, and Networking services is compliant with the security recommendations from the OpenStack community.
Encryption of all the internal communications for MOSK services will become available in one of the nearest product releases.
Implemented the capability to configure the LoadBalancer type for PowerDNS
through the spec:features:designate definition in the
OpenStackDeployment CR, for example, to expose the TCP protocol instead of
the default UDP, or both.
Added the tf-control-dns-external service to the list of the Tungsten
Fabric configuration options. The service is created by default to expose TF
control dns. You can disable creation of this service using the
enableDNSExternal parameter in the TFOperator CR.
TechPreview
Implemented the initial Technology Preview support for MOSK
deployment on local software-based mdadm Redundant Array of Independent Disks
(RAID) devices of level 10 (raid10) to withstand failure of one device
at a time.
The raid10 RAID type requires at least four and in total an even number
of storage devices available on your servers.
To create and configure RAID, use the softRaidDevices field in
BaremetalHostProfile.
Also, added the capability to create LVM volume groups on top of mdadm-based RAID devices.
Mirantis has tested MOSK against a very specific configuration and can guarantee a predictable behavior of the product only in the exact same environments. The table below includes the major MOSK components with the exact versions against which testing has been performed.
Component |
Version |
|---|---|
Cluster release |
|
OpenStack |
|
openstack-operator |
0.8.4 |
Tungsten Fabric |
|
tungstenfabric-operator |
0.7.2 |
See also
This section describes the MOSK known issues with available workarounds. For the known issues in the related version of Mirantis Container Cloud, refer to Mirantis Container Cloud: Release Notes.
This section lists the Tungsten Fabric known issues with workarounds for the Mirantis OpenStack for Kubernetes release 22.2. For Tungsten Fabric limitations, see Tungsten Fabric known limitations.
[13755] TF pods switch to CrashLoopBackOff after a simultaneous reboot
[10096] tf-control does not refresh IP addresses of Cassandra pods
Rebooting all Cassandra cluster TFConfig or TFAnalytics nodes, maintenance, or other circumstances that cause the Cassandra pods to start simultaneously may cause a broken Cassandra TFConfig and/or TFAnalytics cluster. In this case, Cassandra nodes do not join the ring and do not update the IPs of the neighbor nodes. As a result, the TF services cannot operate Cassandra cluster(s).
To verify that a Cassandra cluster is affected:
Run the nodetool status command specifying the config or
analytics cluster and the replica number:
kubectl -n tf exec -it tf-cassandra-<config/analytics>-dc1-rack1-<replica number> -c cassandra -- nodetool status
Example of system response with outdated IP addresses:
Datacenter: DC1
===============
Status=Up/Down
|/ State=Normal/Leaving/Joining/Moving
-- Address Load Tokens Owns (effective) Host ID Rack
DN <outdated ip> ? 256 64.9% a58343d0-1e3f-4d54-bcdf-9b9b949ca873 r1
DN <outdated ip> ? 256 69.8% 67f1d07c-8b13-4482-a2f1-77fa34e90d48 r1
Datacenter: dc1
===============
Status=Up/Down
|/ State=Normal/Leaving/Joining/Moving
-- Address Load Tokens Owns (effective) Host ID Rack
UN <actual ip> 3.84 GiB 256 65.2% 7324ebc4-577a-425f-b3de-96faac95a331 rack1
Workaround:
Manually delete a Cassandra pod from the failed config or analytics
cluster to re-initiate the bootstrap process for one of the Cassandra nodes:
kubectl -n tf delete pod tf-cassandra-<config/analytics>-dc1-rack1-<replica number>
The tf-control service resolves the DNS names of Cassandra pods at startup
and does not update them if Cassandra pods got new IP addresses, for example,
in case of a restart. As a workaround, to refresh the IP addresses of
Cassandra pods, restart the tf-control pods one by one:
kubectl -n tf delete pod tf-control-<hash>
Caution
Before restarting the tf-control pods:
Verify that the new pods are successfully spawned.
Verify that no vRouters are connected to only one
tf-controlpod that will be restarted.
This section lists the OpenStack known issues with workarounds for the Mirantis OpenStack for Kubernetes release 22.2.
[25594] Security groups shared through RBAC cannot be used to create instances
[23985] Federated authorization fails after updating Keycloak URL
[19065] Octavia load balancers lose Amphora VMs after failover
[6912] Octavia load balancers may not work properly with DVR
During l3-agent restart, routers may not be initialized properly due to
erroneous logic in Neutron code causing l3-agent to get stuck in the
Not ready state. The readiness probe states that one of routers is not
ready with the keepalived process not started.
Example output of the kubectl -n openstack describe pod <neutron-l3 agent pod name> command:
Warning Unhealthy 109s (x476 over 120m) kubelet, ti-rs-nhmrmiuyqzxl-2-2obcnor6vt24-server-tmtr5ajqjflf \
Readiness probe failed: /tmp/health-probe.py:259: \
ERROR:/tmp/health-probe.py:The router: 66a885b7-0c7c-463a-a574-bdb19733baf3 is not initialized.
Workaround:
Remove the router from
l3-agent:neutron l3-agent-router-remove <router-name> <l3-agent-name>
Wait up to one minute.
Add the router back to
l3-agent:neutron l3-agent-router-add <router-name> <l3-agent-name>
Octavia load balancers provisioning_status may get stuck in the
ERROR, PENDING_UPDATE, PENDING_CREATE, or PENDING_DELETE state.
Occasionally, the listeners or pools associated with these load balancers may
also get stuck in the same state.
Workaround:
For administrative users that have access to the keystone-client pod:
Log in to a
keystone-clientpod.Delete the affected load balancer:
openstack loadbalancer delete <load_balancer_id> --force
For non-administrative users, access the Octavia API directly and delete the affected load balancer using the
"force": trueargument in the delete request:Access the Octavia API.
Obtain the token:
TOKEN=$(openstack token issue -f value -c id)
Obtain the endpoint:
ENDPOINT=$(openstack version show --service load-balancer --interface public --status CURRENT -f value -c Endpoint)
Delete the affected load balancers:
curl -H "X-Auth-Token: $TOKEN" -d '{"force": true}' -X DELETE $ENDPOINT/loadbalancers/<load_balancer_id>
If an Amphora VM does not respond or responds too long to heartbeat requests, the Octavia load balancer automatically initiates a failover process after 60 seconds of unsuccessful attempts. Long responses of an Amphora VM may be caused by various events, such as a high load on the OpenStack compute node that hosts the Amphora VM, network issues, system service updates, and so on. After a failover, the Amphora VMs may be missing in the completed Octavia load balancer.
Workaround:
If your deployment is already affected, manually restore the work of the load balancer by recreating the Amphora VM:
Define the load balancer ID:
openstack loadbalancer amphora list --column loadbalancer_id --format value --status ERROR
Start the load balancer failover:
openstack loadbalancer failover <Load balancer ID>
To avoid an automatic failover start that may cause the issue, set the
heartbeat_timeoutparameter in theOpenStackDeploymentCR to a large value in seconds. The default is 60 seconds. For example:spec: services: load-balancer: octavia: values: conf: octavia: health_manager: heartbeat_timeout: 31536000
Limitation
When Neutron is deployed in the DVR mode, Octavia load balancers may not work correctly. The symptoms include both failure to properly balance traffic and failure to perform an amphora failover. For details, see DVR incompatibility with ARP announcements and VRRP.
This section lists the cluster update known issues with workarounds for the Mirantis OpenStack for Kubernetes release 22.2.
[22777] Admission Controller exception for deployments with Tungsten Fabric
[21790] Ceph cluster fails to update due to ‘csi-rbdplugin’ not found
[23154] Ceph health is in ‘HEALTH_WARN’ state after managed cluster update
[23771] Connectivity loss due to wrong update order of Neutron services
[24435] MetalLB speaker fails to announce the LB IP for the Ingress service
Affects only MOSK 22.2
After updating the MOSK cluster, Admission
Controller prohibits the OsDpl update with the following error message:
TungstenFabric as network backend and setting of floating network
physnet name without network type and segmentation id are not compatible.
As a workaround, after the update remove the orphaned physnet parameter
from the OsDpl CR:
features:
neutron:
backend: tungstenfabric
floating_network:
enabled: true
physnet: physnet1
A Ceph cluster fails to update on a managed cluster with the following message:
Failed to configure Ceph cluster: ceph cluster verification is failed:
[Daemonset csi-rbdplugin is not found]
As a workaround, restart the rook-ceph-operator pod:
kubectl -n rook-ceph scale deploy rook-ceph-operator --replicas 0
kubectl -n rook-ceph scale deploy rook-ceph-operator --replicas 1
After updating the MOSK cluster, Ceph health is in
the HEALTH_WARN state with the SLOW_OPS health message.
The workaround is to restart the affected Ceph Monitors.
After updating the cluster, simultaneous unordered restart of Neutron L2
and L3, DHCP, and Metadata services leads to the state when ports on
br-int are tagged with valid VLAN tags but with trunks: [4095].
Example of affected ports in Open vSwitch:
Port "tapdb11212e-15"
tag: 1
trunks: [4095]
Workaround:
Search for the nodes with the OVS ports:
for i in $(kubectl -n openstack get pods |grep openvswitch-vswitchd | awk '{print $1}'); do echo $i; kubectl -n openstack exec -it -c openvswitch-vswitchd $i -- ovs-vsctl show |grep trunks|head -1; done
Exec into the
openvswitch-vswitchdpod with affected ports obtained in the previous step and run:for i in $(ovs-vsctl show |grep trunks -B 3 |grep Port | awk '{print $2}' | tr -d '"'); do ovs-vsctl set port $i tag=4095; done
Restart the
neutron-ovsagent on the affected nodes.
After updating the MOSK cluster, MetalLB speaker may fail to announce the Load Balancer (LB) IP address for the OpenStack Ingress service. As a result, the OpenStack Ingress service is not accessible using its LB IP address.
The issue may occur if the MetalLB speaker nodeSelector selects not all
the nodes selected by nodeSelector of the OpenStack Ingress service.
The issue may arise and disappear when a new MetalLB speaker is being selected by the MetalLB Controller to announce the LB IP address.
The issue occurs since MOSK 22.2 after
externalTrafficPolicy was set to local for the OpenStack Ingress
service.
Workaround:
Select from the following options:
Set
externalTrafficPolicytoclusterfor the OpenStack Ingress service.This option is preferable in the following cases:
If not all cluster nodes have connection to the external network
If the connection to the external network cannot be established
If network configuration changes are not desired
If network configuration is allowed and if you require the
externalTrafficPolicy: localoption:Wire the external network to all cluster nodes where the OpenStack Ingress service Pods are running.
Configure IP addresses in the external network on the nodes and change the default routes on the nodes.
Change
nodeSelectorof MetalLB speaker to matchnodeSelectorof the OpenStack Ingress service.
This section lists the components artifacts of the MOSK 22.2 release.
Component |
Path |
License information for main executable programs |
|---|---|---|
Binaries |
||
mirantis |
https://binary.mirantis.com/openstack/bin/horizon/mirantis-victoria-8f71802-20210119120707.tar.gz |
Mirantis Proprietary License |
octavia-amphora |
https://binary.mirantis.com/openstack/bin/octavia/amphora-x64-haproxy-victoria-20220324132511.qcow2 |
Mirantis Proprietary License |
Docker images |
||
ironic-inspector |
mirantis.azurecr.io/openstack/ironic-inspector:victoria-bionic-20220324125700 |
Apache License 2.0 |
masakari-monitors |
mirantis.azurecr.io/openstack/masakari-monitors:victoria-bionic-20220324125700 |
Apache License 2.0 |
masakari |
mirantis.azurecr.io/openstack/masakari:victoria-bionic-20220324125700 |
Apache License 2.0 |
placement |
mirantis.azurecr.io/openstack/placement:victoria-bionic-20220324125700 |
Apache License 2.0 |
keystone |
mirantis.azurecr.io/openstack/keystone:victoria-bionic-20220324125700 |
Apache License 2.0 |
heat |
mirantis.azurecr.io/openstack/heat:victoria-bionic-20220324125700 |
Apache License 2.0 |
glance |
mirantis.azurecr.io/openstack/glance:victoria-bionic-20220324125700 |
Apache License 2.0 |
cinder |
mirantis.azurecr.io/openstack/cinder:victoria-bionic-20220324125700 |
Apache License 2.0 |
neutron |
mirantis.azurecr.io/openstack/neutron:victoria-bionic-20220324125700 |
Apache License 2.0 |
nova |
mirantis.azurecr.io/openstack/nova:victoria-bionic-20220324125700 |
Apache License 2.0 |
horizon |
mirantis.azurecr.io/openstack/horizon:victoria-bionic-20220324125700 |
Apache License 2.0 |
tempest |
mirantis.azurecr.io/openstack/tempest:victoria-bionic-20220324125700 |
Apache License 2.0 |
octavia |
mirantis.azurecr.io/openstack/octavia:victoria-bionic-20220324125700 |
Apache License 2.0 |
designate |
mirantis.azurecr.io/openstack/designate:victoria-bionic-20220324125700 |
Apache License 2.0 |
ironic |
mirantis.azurecr.io/openstack/ironic:victoria-bionic-20220324125700 |
Apache License 2.0 |
barbican |
mirantis.azurecr.io/openstack/barbican:victoria-bionic-20220324125700 |
Apache License 2.0 |
libvirt |
mirantis.azurecr.io/general/libvirt:6.0.0-bionic-20220217094810 |
LGPL-2.1 License |
pause |
mirantis.azurecr.io/general/external/pause:3.1 |
Apache License 2.0 |
openvswitch |
mirantis.azurecr.io/general/openvswitch:2.11-bionic-20220217094810 |
Apache License 2.0 |
openvswitch-dpdk |
mirantis.azurecr.io/general/openvswitch-dpdk:2.11-bionic-20220217094810 |
Apache License 2.0 |
openstack-tools |
mirantis.azurecr.io/openstack/openstack-tools:ussuri-bionic-20220113100346 |
Apache License 2.0 |
rabbitmq-3.9 |
mirantis.azurecr.io/general/rabbitmq:3.9.8 |
Mozilla Public License 2.0 |
rabbitmq-3.9-management |
mirantis.azurecr.io/general/rabbitmq:3.9.8-management |
Mozilla Public License 2.0 |
kubernetes-entrypoint |
mirantis.azurecr.io/openstack/extra/kubernetes-entrypoint:v1.0.0-20200311160233 |
Apache License 2.0 |
docker |
mirantis.azurecr.io/openstack/extra/docker:17.07.0 |
Apache License 2.0 |
memcached |
mirantis.azurecr.io/general/memcached:1.6.6.2.6-alpine3.15 |
BSD 3-Clause “New” or “Revised” License |
ceph-config-helper |
mirantis.azurecr.io/openstack/extra/ceph-config-helper:nautilus-bionic-20211025114106 |
Apache License 2.0, LGPL-2.1 or LGPL-3 |
etcd |
mirantis.azurecr.io/openstack/extra/etcd:3.2.26 |
Apache License 2.0 |
powerdns |
mirantis.azurecr.io/openstack/extra/powerdns:4.2-alpine-20200117133238 |
GPL-2.0 License |
nginx-ingress-controller |
mirantis.azurecr.io/openstack/extra/nginx-ingress-controller:0.49.3 |
Apache License 2.0 |
defaultbackend |
mirantis.azurecr.io/openstack/extra/defaultbackend:1.0 |
Apache License 2.0 |
mariadb |
mirantis.azurecr.io/general/mariadb:10.6.7-bionic-20220303173211 |
GPLv2, LGPLv2.1 (client libraries) |
rabbitmq-exporter |
mirantis.azurecr.io/stacklight/rabbitmq-exporter:v1.0.0-RC8 |
MIT License |
prometheus-memcached-exporter |
mirantis.azurecr.io/stacklight/memcached-exporter:v0.9.0 |
Apache License 2.0 |
prometheus-mysql-exporter |
mirantis.azurecr.io/stacklight/mysqld-exporter:v0.11.0 |
Apache License 2.0 |
xrally-openstack |
mirantis.azurecr.io/openstack/extra/xrally-openstack:2.2.0-20220217210744 |
Apache License 2.0 |
aodh |
mirantis.azurecr.io/openstack/aodh:victoria-bionic-20220324125700 |
Apache License 2.0 |
panko |
mirantis.azurecr.io/openstack/panko:victoria-bionic-20220324125700 |
Apache License 2.0 |
ceilometer |
mirantis.azurecr.io/openstack/ceilometer:victoria-bionic-20220324125700 |
Apache License 2.0 |
gnocchi |
mirantis.azurecr.io/openstack/gnocchi:victoria-bionic-20220324125700 |
Apache License 2.0 |
redis |
mirantis.azurecr.io/openstack/extra/redis:5.0-alpine |
BSD 3-Clause “New” or “Revised” License |
frr |
mirantis.azurecr.io/general/external/docker.io/frrouting/frr:v7.5.0 |
GPL-2.0 License |
strongswan |
mirantis.azurecr.io/openstack/extra/strongswan:alpine-5.9.1-20211018180158 |
GPL License |
descheduler |
mirantis.azurecr.io/openstack/extra/descheduler:v0.21.0 |
Apache License 2.0 |
Component |
Path |
License information for main executable programs |
|---|---|---|
Binaries |
||
mirantis |
https://binary.mirantis.com/openstack/bin/horizon/mirantis-ussuri-48f346e-20210119132403.tar.gz |
Mirantis Proprietary License |
octavia-amphora |
https://binary.mirantis.com/openstack/bin/octavia/amphora-x64-haproxy-ussuri-20220316010058.qcow2 |
Mirantis Proprietary License |
Docker images |
||
ironic-inspector |
mirantis.azurecr.io/openstack/ironic-inspector:ussuri-bionic-20220113100346 |
Apache License 2.0 |
masakari-monitors |
mirantis.azurecr.io/openstack/masakari-monitors:ussuri-bionic-20220113100346 |
Apache License 2.0 |
masakari |
mirantis.azurecr.io/openstack/masakari:ussuri-bionic-20220113100346 |
Apache License 2.0 |
placement |
mirantis.azurecr.io/openstack/placement:ussuri-bionic-20220113100346 |
Apache License 2.0 |
redis |
mirantis.azurecr.io/openstack/extra/redis:5.0-alpine |
BSD 3-Clause “New” or “Revised” License |
gnocchi |
mirantis.azurecr.io/openstack/gnocchi:ussuri-bionic-20220113100346 |
Apache License 2.0 |
ceilometer |
mirantis.azurecr.io/openstack/ceilometer:ussuri-bionic-20220113100346 |
Apache License 2.0 |
panko |
mirantis.azurecr.io/openstack/panko:ussuri-bionic-20220113100346 |
Apache License 2.0 |
aodh |
mirantis.azurecr.io/openstack/aodh:ussuri-bionic-20220113100346 |
Apache License 2.0 |
xrally-openstack |
mirantis.azurecr.io/openstack/extra/xrally-openstack:2.2.0-20220217210744 |
Apache License 2.0 |
prometheus-mysql-exporter |
mirantis.azurecr.io/stacklight/mysqld-exporter:v0.11.0 |
Apache License 2.0 |
prometheus-memcached-exporter |
mirantis.azurecr.io/stacklight/memcached-exporter:v0.9.0 |
Apache License 2.0 |
rabbitmq-exporter |
mirantis.azurecr.io/stacklight/rabbitmq-exporter:v1.0.0-RC8 |
MIT License |
mariadb |
mirantis.azurecr.io/general/mariadb:10.6.7-bionic-20220303173211 |
GPLv2, LGPLv2.1 (client libraries) |
defaultbackend |
mirantis.azurecr.io/openstack/extra/defaultbackend:1.0 |
Apache License 2.0 |
nginx-ingress-controller |
mirantis.azurecr.io/openstack/extra/nginx-ingress-controller:0.49.3 |
Apache License 2.0 |
powerdns |
mirantis.azurecr.io/openstack/extra/powerdns:4.2-alpine-20200117133238 |
GPL-2.0 License |
etcd |
mirantis.azurecr.io/openstack/extra/etcd:3.2.26 |
Apache License 2.0 |
ceph-config-helper |
mirantis.azurecr.io/openstack/extra/ceph-config-helper:nautilus-bionic-20211025114106 |
Apache License 2.0, LGPL-2.1 or LGPL-3 |
memcached |
mirantis.azurecr.io/general/memcached:1.6.6.2.6-alpine3.15 |
BSD 3-Clause “New” or “Revised” License |
docker |
mirantis.azurecr.io/openstack/extra/docker:17.07.0 |
Apache License 2.0 |
kubernetes-entrypoint |
mirantis.azurecr.io/openstack/extra/kubernetes-entrypoint:v1.0.0-20200311160233 |
Apache License 2.0 |
rabbitmq-3.9-management |
mirantis.azurecr.io/general/rabbitmq:3.9.8-management |
Mozilla Public License 2.0 |
rabbitmq-3.9 |
mirantis.azurecr.io/general/rabbitmq:3.9.8 |
Mozilla Public License 2.0 |
openstack-tools |
mirantis.azurecr.io/openstack/openstack-tools:ussuri-bionic-20220113100346 |
Apache License 2.0 |
openvswitch-dpdk |
mirantis.azurecr.io/general/openvswitch-dpdk:2.11-bionic-20220217094810 |
Apache License 2.0 |
openvswitch |
mirantis.azurecr.io/general/openvswitch:2.11-bionic-20220217094810 |
Apache License 2.0 |
pause |
mirantis.azurecr.io/general/external/pause:3.1 |
Apache License 2.0 |
libvirt |
mirantis.azurecr.io/general/libvirt:6.0.0-bionic-20220217094810 |
LGPL-2.1 License |
barbican |
mirantis.azurecr.io/openstack/barbican:ussuri-bionic-20220113100346 |
Apache License 2.0 |
ironic |
mirantis.azurecr.io/openstack/ironic:ussuri-bionic-20220113100346 |
Apache License 2.0 |
designate |
mirantis.azurecr.io/openstack/designate:ussuri-bionic-20220113100346 |
Apache License 2.0 |
octavia |
mirantis.azurecr.io/openstack/octavia:ussuri-bionic-20220113100346 |
Apache License 2.0 |
tempest |
mirantis.azurecr.io/openstack/tempest:ussuri-bionic-20220113100346 |
Apache License 2.0 |
horizon |
mirantis.azurecr.io/openstack/horizon:ussuri-bionic-20220113100346 |
Apache License 2.0 |
nova |
mirantis.azurecr.io/openstack/nova:ussuri-bionic-20220113100346 |
Apache License 2.0 |
neutron |
mirantis.azurecr.io/openstack/neutron:ussuri-bionic-20220113100346 |
Apache License 2.0 |
cinder |
mirantis.azurecr.io/openstack/cinder:ussuri-bionic-20220113100346 |
Apache License 2.0 |
glance |
mirantis.azurecr.io/openstack/glance:ussuri-bionic-20220113100346 |
Apache License 2.0 |
heat |
mirantis.azurecr.io/openstack/heat:ussuri-bionic-20220113100346 |
Apache License 2.0 |
keystone |
mirantis.azurecr.io/openstack/keystone:ussuri-bionic-20220113100346 |
Apache License 2.0 |
frr |
mirantis.azurecr.io/general/external/docker.io/frrouting/frr:v7.5.0 |
GPL-2.0 License |
strongswan |
mirantis.azurecr.io/openstack/extra/strongswan:alpine-5.9.1-20211018180158 |
GPL License |
descheduler |
mirantis.azurecr.io/openstack/extra/descheduler:v0.21.0 |
Apache License 2.0 |
Component |
Path |
License information for main executable programs |
|---|---|---|
Helm charts |
||
Tungsten Fabric Operator |
https://binary.mirantis.com/tungsten/helm/tungstenfabric-operator-0.7.2.tgz |
Mirantis Proprietary License |
Docker images |
||
Tungsten Fabric Operator |
mirantis.azurecr.io/tungsten-operator/tungstenfabric-operator:0.7.2 |
Mirantis Proprietary License |
Analytics |
mirantis.azurecr.io/tungsten/contrail-analytics-api:5.1.20220127155145 |
Apache License 2.0 |
mirantis.azurecr.io/tungsten/contrail-analytics-collector:5.1.20220127155145 |
Apache License 2.0 |
|
Analytics Alarm |
mirantis.azurecr.io/tungsten/contrail-analytics-alarm-gen:5.1.20220127155145 |
Apache License 2.0 |
Analytics DB |
mirantis.azurecr.io/tungsten/contrail-analytics-query-engine:5.1.20220127155145 |
Apache License 2.0 |
Analytics SNMP |
mirantis.azurecr.io/tungsten/contrail-analytics-snmp-collector:5.1.20220127155145 |
Apache License 2.0 |
mirantis.azurecr.io/tungsten/contrail-analytics-snmp-topology:5.1.20220127155145 |
Apache License 2.0 |
|
Config |
mirantis.azurecr.io/tungsten/contrail-controller-config-api:5.1.20220127155145 |
Apache License 2.0 |
mirantis.azurecr.io/tungsten/contrail-controller-config-devicemgr:5.1.20220127155145 |
Apache License 2.0 |
|
mirantis.azurecr.io/tungsten/contrail-controller-config-schema:5.1.20220127155145 |
Apache License 2.0 |
|
mirantis.azurecr.io/tungsten/contrail-controller-config-svcmonitor:5.1.20220127155145 |
Apache License 2.0 |
|
Control |
mirantis.azurecr.io/tungsten/contrail-controller-control-control:5.1.20220127155145 |
Apache License 2.0 |
mirantis.azurecr.io/tungsten/contrail-controller-control-dns:5.1.20220127155145 |
Apache License 2.0 |
|
mirantis.azurecr.io/tungsten/contrail-controller-control-named:5.1.20220127155145 |
Apache License 2.0 |
|
Web UI |
mirantis.azurecr.io/tungsten/contrail-controller-webui-job:5.1.20220127155145 |
Apache License 2.0 |
mirantis.azurecr.io/tungsten/contrail-controller-webui-web:5.1.20220127155145 |
Apache License 2.0 |
|
vRouter |
mirantis.azurecr.io/tungsten/contrail-vrouter-agent:5.1.20220127155145 |
Apache License 2.0 |
mirantis.azurecr.io/tungsten/contrail-vrouter-kernel-build-init:5.1.20220127155145 |
Apache License 2.0 |
|
Nodemanager |
mirantis.azurecr.io/tungsten/contrail-nodemgr:5.1.20220127155145 |
Apache License 2.0 |
Cassandra operator |
mirantis.azurecr.io/tungsten-operator/casskop:v2.0.2-release |
Apache License 2.0 |
Cassandra |
mirantis.azurecr.io/tungsten/cassandra-bootstrap:0.1.9 |
Apache License 2.0 |
mirantis.azurecr.io/tungsten/cassandra:3.11.10 |
Apache License 2.0 |
|
mirantis.azurecr.io/tungsten/cass-config-builder:1.0.4 |
Apache License 2.0 |
|
mirantis.azurecr.io/tungsten/instaclustr-icarus:1.1.0 |
Apache License 2.0 |
|
Kafka operator |
mirantis.azurecr.io/tungsten-operator/kafka-k8s-operator:0.1.2 |
Mirantis Proprietary License |
Kafka |
mirantis.azurecr.io/tungsten/cp-kafka:5.5.7 |
Apache License 2.0 |
mirantis.azurecr.io/stacklight/prometheus-jmx-exporter:0.16.1-debian-10-r208 |
Apache License 2.0 |
|
RabbitMQ operator |
mirantis.azurecr.io/tungsten-operator/rabbitmq-operator:0.1.8 |
Mirantis Proprietary License |
RabbitMQ |
mirantis.azurecr.io/general/rabbitmq:3.8.23 |
Mozilla Public License 2.0 |
mirantis.azurecr.io/stacklight/rabbitmq-exporter:v1.0.0-RC8 |
MIT License |
|
ZooKeeper operator |
mirantis.azurecr.io/tungsten-operator/zookeeper-operator:0.2.12 |
Apache License 2.0 |
ZooKeeper |
mirantis.azurecr.io/tungsten/zookeeper:3.6.3-0.2.13 |
Apache License 2.0 |
Redis operator |
mirantis.azurecr.io/tungsten-operator/redis-operator:0.2.2-1-8cba7b0 |
Apache License 2.0 |
Redis |
mirantis.azurecr.io/tungsten/redis:6.2.6-alpine3.15 |
BSD 3-Clause “New” or “Revised” License |
TF Test |
mirantis.azurecr.io/tungsten/tungsten-pytest:0.1-20220321092905 |
MIT License |
TF CLI |
mirantis.azurecr.io/tungsten/tf-cli:0.1-20210214191656 |
MIT License |
TF NodeInfo |
mirantis.azurecr.io/tungsten/tf-nodeinfo:0.1-20210430090010 |
MIT License |
Component |
Path |
License information for main executable programs |
|---|---|---|
Helm charts |
||
Tungsten Fabric Operator |
https://binary.mirantis.com/tungsten/helm/tungstenfabric-operator-0.7.2.tgz |
Mirantis Proprietary License |
Docker images |
||
Tungsten Fabric Operator |
mirantis.azurecr.io/tungsten-operator/tungstenfabric-operator:0.7.2 |
Mirantis Proprietary License |
Analytics |
mirantis.azurecr.io/tungsten/contrail-analytics-api:2011.20220322143737 |
Apache License 2.0 |
mirantis.azurecr.io/tungsten/contrail-analytics-collector:2011.20220322143737 |
Apache License 2.0 |
|
Analytics Alarm |
mirantis.azurecr.io/tungsten/contrail-analytics-alarm-gen:2011.20220322143737 |
Apache License 2.0 |
Analytics DB |
mirantis.azurecr.io/tungsten/contrail-analytics-query-engine:2011.20220322143737 |
Apache License 2.0 |
Analytics SNMP |
mirantis.azurecr.io/tungsten/contrail-analytics-snmp-collector:2011.20220322143737 |
Apache License 2.0 |
mirantis.azurecr.io/tungsten/contrail-analytics-snmp-topology:2011.20220322143737 |
Apache License 2.0 |
|
Config |
mirantis.azurecr.io/tungsten/contrail-controller-config-api:2011.20220322143737 |
Apache License 2.0 |
mirantis.azurecr.io/tungsten/contrail-controller-config-devicemgr:2011.20220322143737 |
Apache License 2.0 |
|
mirantis.azurecr.io/tungsten/contrail-controller-config-schema:2011.20220322143737 |
Apache License 2.0 |
|
mirantis.azurecr.io/tungsten/contrail-controller-config-svcmonitor:2011.20220322143737 |
Apache License 2.0 |
|
mirantis.azurecr.io/openstack/extra/kubernetes-entrypoint:v1.0.0-20200311160233 |
Apache License 2.0 |
|
Control |
contrail-controller-control-control:2011.20220322143737 |
Apache License 2.0 |
mirantis.azurecr.io/tungsten/contrail-controller-control-dns:2011.20220322143737 |
Apache License 2.0 |
|
mirantis.azurecr.io/tungsten/contrail-controller-control-named:2011.20220322143737 |
Apache License 2.0 |
|
Web UI |
mirantis.azurecr.io/tungsten/contrail-controller-webui-job:2011.20220322143737 |
Apache License 2.0 |
mirantis.azurecr.io/tungsten/contrail-controller-webui-web:2011.20220322143737 |
Apache License 2.0 |
|
vRouter |
mirantis.azurecr.io/tungsten/contrail-vrouter-agent:2011.20220322143737 |
Apache License 2.0 |
mirantis.azurecr.io/tungsten/contrail-vrouter-kernel-build-init:2011.20220322143737 |
Apache License 2.0 |
|
mirantis.azurecr.io/tungsten/contrail-node-init:2011.20220322143737 |
Apache License 2.0 |
|
Nodemanager |
mirantis.azurecr.io/tungsten/contrail-nodemgr:2011.20220322143737 |
Apache License 2.0 |
Provisioner |
mirantis.azurecr.io/tungsten/contrail-provisioner:2011.20220322143737 |
Apache License 2.0 |
Cassandra operator |
mirantis.azurecr.io/tungsten-operator/casskop:v2.0.2-release |
Apache License 2.0 |
Cassandra |
mirantis.azurecr.io/tungsten/cassandra-bootstrap:0.1.9 |
Apache License 2.0 |
mirantis.azurecr.io/tungsten/cassandra:3.11.10 |
Apache License 2.0 |
|
mirantis.azurecr.io/tungsten/cass-config-builder:1.0.4 |
Apache License 2.0 |
|
mirantis.azurecr.io/tungsten/instaclustr-icarus:1.1.0 |
Apache License 2.0 |
|
Kafka operator |
mirantis.azurecr.io/tungsten-operator/kafka-k8s-operator:0.1.2 |
Mirantis Proprietary License |
Kafka |
mirantis.azurecr.io/tungsten/cp-kafka:5.5.7 |
Apache License 2.0 |
mirantis.azurecr.io/stacklight/prometheus-jmx-exporter:0.16.1-debian-10-r208 |
Apache License 2.0 |
|
RabbitMQ operator |
mirantis.azurecr.io/tungsten-operator/rabbitmq-operator:0.1.8 |
Mirantis Proprietary License |
RabbitMQ |
mirantis.azurecr.io/general/rabbitmq:3.8.23 |
Mozilla Public License 2.0 |
mirantis.azurecr.io/stacklight/rabbitmq-exporter:v1.0.0-RC8 |
MIT License |
|
ZooKeeper operator |
mirantis.azurecr.io/tungsten-operator/zookeeper-operator:0.2.12 |
Apache License 2.0 |
ZooKeeper |
mirantis.azurecr.io/tungsten/zookeeper:3.6.3-0.2.13 |
Apache License 2.0 |
Redis operator |
mirantis.azurecr.io/tungsten-operator/redis-operator:0.2.2-1-8cba7b0 |
Apache License 2.0 |
Redis |
mirantis.azurecr.io/tungsten/redis:6.2.6-alpine3.15 |
BSD 3-Clause “New” or “Revised” License |
TF Test |
mirantis.azurecr.io/tungsten/tungsten-pytest:0.1-20220321092905 |
MIT License |
TF CLI |
mirantis.azurecr.io/tungsten/tf-cli:0.1-20210214191656 |
MIT License |
TF NodeInfo |
mirantis.azurecr.io/tungsten/tf-nodeinfo:0.1-20210430090010 |
MIT License |
TF Tools |
mirantis.azurecr.io/tungsten/contrail-tools:2011.20220322143737 |
Apache License 2.0 |
Component |
Path |
License information for main executable programs |
|---|---|---|
Docker images |
||
prometheus-libvirt-exporter |
mirantis.azurecr.io/stacklight/prometheus-libvirt-exporter:v0.1-20200610164751 |
Mirantis Proprietary License |
prometheus-tungstenfabric-exporter |
mirantis.azurecr.io/stacklight/tungstenfabric-prometheus-exporter:0.1-20210115152338 |
Mirantis Proprietary License |
Helm charts |
||
prometheus-libvirt-exporter |
https://binary.mirantis.com/stacklight/helm/prometheus-libvirt-exporter-0.2.0-mcp-1.tgz |
Mirantis Proprietary License |
prometheus-tungstenfabric-exporter |
https://binary.mirantis.com/stacklight/helm/prometheus-tungstenfabric-exporter-0.2.0-mcp-3.tgz |
Mirantis Proprietary License |
The following issues have been addressed in the MOSK 22.2 release:
[22725][Update] Fixed the issue raising upon managed cluster update and causing live migration to fail for instances with deleted images.
[18871][Update] Fixed the issue causing MySQL to crash during a managed cluster update or instances live migration.
[16987][Update] Fixed the issue that caused update of a MOSK cluster to fail with the ceph csi-driver is not evacuated yet, waiting… error during the Ceph CSI pod eviction.
[22321][OpenStack] Fixed the issue wherein the Neutron backend option in
OsDplinadvertently changed fromml2totungstenfabricupon managed cluster update.[21998][OpenStack] Fixed the issue wherein the OpenStack Controller got stuck during the managed cluster update.
[21838][OpenStack] Fixed the issue wherein the Designate API failed to log requests.
[21376][OpenStack] Fixed the issue that caused inability to create non-encrypted volumes from a large image.
[15354][OpenStack] Implemented coordination between instances of the Masakari API service to prevent creation of multiple evacuation flows for instances.
[1659][OpenStack] Fixed the issue wherein the Neutron Open vSwitch agent did not clean tunnels upon changes of the
tunnel_ipoption.[20192][StackLight] To avoid issues causing false-positive
CassandraTombstonesTooManyMajorStackLight alerts, adjusted the thresholds for theCassandraTombstonesTooManyMajorandCassandraTombstonesTooManyWarningalerts and added a newCassandraTombstonesTooManyCriticalalert.[21064][Ceph] Fixed the issue causing the MOSK managed cluster to fail with the Error updating release ceph/ceph-controller error and enabled Helm v3 for Ceph Controller.
This section describes the specific actions you as a cloud operator need to complete to accurately plan and successfully perform your Mirantis OpenStack for Kubernetes (MOSK) cluster to the version 22.2. Consider this information as a supplement to the generic update procedure published in Operations Guide: Update a MOSK cluster.
Additionally, read through the Cluster update known issues for the problems that are known to occur during update with recommended workarounds.
Your MOSK cluster will obtain the newly implemented capabilities automatically with no significant impact on the update procedure.
During the Kubernetes master nodes update, there is a downtime on Kubernetes cluster’s internal DNS service. Thus, Tungsten Fabric vRouter pods lose connection with the control plane resulting in up to 1 minute of downtime for the Tungsten Fabric data plane nodes and impact on the tenant networking.
To complete the update of the cluster with Tungsten Fabric, manually restart Tungsten Fabric vRouter Agent pods on all compute nodes. The restart of a vRouter Agent on a compute node will cause up to 30-60 seconds of networking downtime per instance hosted there. If downtime is unacceptable for some workloads, we recommend that you migrate them before restarting the vRouter pods.
Warning
Under certain rare circumstances, the reload of the vRouter kernel
module triggered by the restart of a vRouter Agent can hang due to
the inability to complete the drop_caches operation. Watch the status
and logs of the vRouter Agent being restarted and trigger the reboot of
the node, if necessary.
The table below contains the number of vendor-specific addressed CVEs with Critical or High severity.
CVE ID |
Fixed artifacts |
|---|---|
CVE-2022-23833 |
3 |
CVE-2022-26485 |
1 |
CVE-2022-26486 |
1 |
RHSA-2021:4904 |
6 |
RHSA-2022:0666 |
37 |
The full list of the CVEs present in the current MOSK release is available at the Mirantis Security Portal.
MOSK 22.1 release
Release date |
February 23, 2022 |
|---|---|
Name |
MOSK 22.1 |
Cluster release |
8.5.0+22.1 |
Highlights |
The first MOSK release in 2022 introduces the following key features:
The list of the major changes in the component versions includes:
|
Component |
Support scope |
Feature |
|---|---|---|
OpenStack |
Full |
|
Full |
||
Tungsten Fabric |
Full |
|
Full |
||
TechPreview |
||
Documentation |
n/a |
The list of the major changes in the component versions includes:
Host OS kernel v5.4
RabbitMQ 3.9
Mirantis Kubernetes Engine (MKE) 3.4.6 with Kubernetes 1.20
All the relevant changes are applied to the MOSK cluster automatically during the cluster update procedure. The host machine’s kernel update implies node reboot. See the links below for details.
Implemented the capability to configure the CPU model through the
spec:features:nova:vcpu_type definition of the OpenStackDeployment CR.
The default CPU model is now host-model, which replaces the previous
default kvm64 CPU model.
For deployments with CPU model customized through spec:services, remove
this customization after upgrading your managed cluster.
Learn more
Implemented the capability to automatically back up and restore the Tungsten Fabric data stored in Cassandra and ZooKeeper.
The user can perform the automatic data backup by enabling the
tf-dbBackup controller through the Tungsten Fabric Operator CR.
By default, the job is scheduled for weekly execution, allocating PVC
with 5Gi size for storing backups, and keeping 5 previous backups.
Also, MOSK allows for automatic data restoration with the ability to restore from the exact backup if required.
Implemented the Border Gateway Protocol (BGP) and encapsulation settings in the Tungsten Fabric Operator custom resource. This feature provides persistency of the BGP and encapsulation parameters.
Also, added technical preview of the VxLAN encapsulation feature.
TechPreview
Implemented object storage encryption integrated with the OpenStack Key Manager service (Barbican). The feature is enabled by default in MOSK deployments with Barbican.
Published the procedure on how to calculate target ratio for Ceph pools.
Learn more
Mirantis has tested MOSK against a very specific configuration and can guarantee a predictable behavior of the product only in the exact same environments. The table below includes the major MOSK components with the exact versions against which testing has been performed.
Component |
Version |
|---|---|
Cluster release |
|
OpenStack |
|
openstack-operator |
0.7.14 |
Tungsten Fabric |
|
tungstenfabric-operator |
0.6.11 |
See also
This section describes the MOSK known issues with available workarounds. For the known issues in the related version of Mirantis Container Cloud, refer to Mirantis Container Cloud: Release Notes.
This section lists the Tungsten Fabric known issues with workarounds for the Mirantis OpenStack for Kubernetes release 22.1.
[10096] tf-control does not refresh IP addresses of Cassandra pods
[13755] TF pods switch to CrashLoopBackOff after a simultaneous reboot
[15684] Pods fail when rolling Tungsten Fabric 2011 back to 5.1
Tungsten Fabric does not provide the following functionality:
Automatic generation of network port records in DNSaaS (Designate) as Neutron with Tungsten Fabric as a backend is not integrated with DNSaaS. As a workaround, you can use the Tungsten Fabric built-in DNS service that enables virtual machines to resolve each other names.
Secret management (Barbican). You cannot use the certificates stored in Barbican to terminate HTTPs in a load balancer.
Role Based Access Control (RBAC) for Neutron objects.
The tf-control service resolves the DNS names of Cassandra pods at startup
and does not update them if Cassandra pods got new IP addresses, for example,
in case of a restart. As a workaround, to refresh the IP addresses of
Cassandra pods, restart the tf-control pods one by one:
kubectl -n tf delete pod tf-control-<hash>
Caution
Before restarting the tf-control pods:
Verify that the new pods are successfully spawned.
Verify that no vRouters are connected to only one
tf-controlpod that will be restarted.
Rebooting all Cassandra cluster TFConfig or TFAnalytics nodes, maintenance, or other circumstances that cause the Cassandra pods to start simultaneously may cause a broken Cassandra TFConfig and/or TFAnalytics cluster. In this case, Cassandra nodes do not join the ring and do not update the IPs of the neighbor nodes. As a result, the TF services cannot operate Cassandra cluster(s).
To verify that a Cassandra cluster is affected:
Run the nodetool status command specifying the config or
analytics cluster and the replica number:
kubectl -n tf exec -it tf-cassandra-<config/analytics>-dc1-rack1-<replica number> -c cassandra -- nodetool status
Example of system response with outdated IP addresses:
Datacenter: DC1
===============
Status=Up/Down
|/ State=Normal/Leaving/Joining/Moving
-- Address Load Tokens Owns (effective) Host ID Rack
DN <outdated ip> ? 256 64.9% a58343d0-1e3f-4d54-bcdf-9b9b949ca873 r1
DN <outdated ip> ? 256 69.8% 67f1d07c-8b13-4482-a2f1-77fa34e90d48 r1
Datacenter: dc1
===============
Status=Up/Down
|/ State=Normal/Leaving/Joining/Moving
-- Address Load Tokens Owns (effective) Host ID Rack
UN <actual ip> 3.84 GiB 256 65.2% 7324ebc4-577a-425f-b3de-96faac95a331 rack1
Workaround:
Manually delete a Cassandra pod from the failed config or analytics
cluster to re-initiate the bootstrap process for one of the Cassandra nodes:
kubectl -n tf delete pod tf-cassandra-<config/analytics>-dc1-rack1-<replica number>
Some tf-control and tf-analytics pods may fail during the Tungsten
Fabric rollback from version 2011 to 5.1. In this case, the control
container from the tf-control pod and/or the collector container from
the tf-analytics pod contain SYS_WARN messages such as
… AMQP_QUEUE_DELETE_METHOD caused: PRECONDITION_FAILED - queue
‘<contrail-control/contrail-collector>.<nodename>’ in vhost ‘/’ not empty
….
The workaround is to manually delete the queue that fails to be deleted by
AMQP_QUEUE_DELETE_METHOD:
kubectl -n tf exec -it tf-rabbitmq-<num of replica> -- rabbitmqctl delete_queue <queue name>
This section lists the OpenStack known issues with workarounds for the Mirantis OpenStack for Kubernetes release 22.1.
[25594] Security groups shared through RBAC cannot be used to create instances
[23985] Federated authorization fails after updating Keycloak URL
[6912] Octavia load balancers may not work properly with DVR
[19065] Octavia load balancers lose Amphora VMs after failover
Limitation
When Neutron is deployed in the DVR mode, Octavia load balancers may not work correctly. The symptoms include both failure to properly balance traffic and failure to perform an amphora failover. For details, see DVR incompatibility with ARP announcements and VRRP.
If an Amphora VM does not respond or responds too long to heartbeat requests, the Octavia load balancer automatically initiates a failover process after 60 seconds of unsuccessful attempts. Long responses of an Amphora VM may be caused by various events, such as a high load on the OpenStack compute node that hosts the Amphora VM, network issues, system service updates, and so on. After a failover, the Amphora VMs may be missing in the completed Octavia load balancer.
Workaround:
If your deployment is already affected, manually restore the work of the load balancer by recreating the Amphora VM:
Define the load balancer ID:
openstack loadbalancer amphora list --column loadbalancer_id --format value --status ERROR
Start the load balancer failover:
openstack loadbalancer failover <Load balancer ID>
To avoid an automatic failover start that may cause the issue, set the
heartbeat_timeoutparameter in theOpenStackDeploymentCR to a large value in seconds. The default is 60 seconds. For example:spec: services: load-balancer: octavia: values: conf: octavia: health_manager: heartbeat_timeout: 31536000
This section lists the cluster update known issues with workarounds for the Mirantis OpenStack for Kubernetes release 22.1.
[21790] Ceph cluster fails to update due to ‘csi-rbdplugin’ not found
[22725] Live migration may fail for instances with deleted images
[18871] MySQL crashes during managed cluster update or instances live migration
[21998] OpenStack Controller may get stuck during the managed cluster update
A Ceph cluster fails to update on a managed cluster with the following message:
Failed to configure Ceph cluster: ceph cluster verification is failed:
[Daemonset csi-rbdplugin is not found]
As a workaround, restart the rook-ceph-operator pod:
kubectl -n rook-ceph scale deploy rook-ceph-operator --replicas 0
kubectl -n rook-ceph scale deploy rook-ceph-operator --replicas 1
During the update of a MOSK cluster to 22.1, live
migration may fail for instances if their images were previously deleted. In
this case, the nova-compute pod contains an error message similar to the
following one:
2022-03-22 23:55:24.468 11816 ERROR nova.compute.manager [instance: 128cf508-f7f7-4a40-b742-392c8c80fc7d] Command: scp -C -r kaas-node-03ab613d-cf79-4830-ac70-ed735453481a:/var/l
ib/nova/instances/_base/e2b6c1622d45071ec8a88a41d07ef785e4dfdfe8 /var/lib/nova/instances/_base/e2b6c1622d45071ec8a88a41d07ef785e4dfdfe8
2022-03-22 23:55:24.468 11816 ERROR nova.compute.manager [instance: 128cf508-f7f7-4a40-b742-392c8c80fc7d] Exit code: 1
2022-03-22 23:55:24.468 11816 ERROR nova.compute.manager [instance: 128cf508-f7f7-4a40-b742-392c8c80fc7d] Stdout: ''
2022-03-22 23:55:24.468 11816 ERROR nova.compute.manager [instance: 128cf508-f7f7-4a40-b742-392c8c80fc7d] Stderr: 'ssh: Could not resolve hostname kaas-node-03ab613d-cf79-4830-ac
70-ed735453481a: Name or service not known\r\n'
Workaround:
If you have not yet started the managed cluster update, change the
nova-computeimage by setting the following metadata in theOpenStackDeploymentCR:spec: services: compute: nova: values: images: tags: nova_compute: mirantis.azurecr.io/openstack/nova:victoria-bionic-20220324125700
If you have already started the managed cluster update, manually update the
nova-computecontainer image in thenova-computeDaemonSet tomirantis.azurecr.io/openstack/nova:victoria-bionic-20220324125700.
An update of a MOSK cluster may fail with the ceph csi-driver is not evacuated yet, waiting… error during the Ceph CSI pod eviction.
Workaround:
Scale the affected
StatefulSetof the pod that fails to init down to0replicas. If it is theDaemonSetsuch asnova-compute, it must not be scheduled on the affected node.On every
csi-rbdpluginpod, search for stuckcsi-vol:rbd device list | grep <csi-vol-uuid>
Unmap the affected
csi-vol:rbd unmap -o force /dev/rbd<i>
Delete
volumeattachmentof the affected pod:kubectl get volumeattachments | grep <csi-vol-uuid> kubectl delete volumeattacmhent <id>
Scale the affected
StatefulSetback to the original number of replicas or until its state isRunning. If it is aDaemonSet, run the pod on the affected node again.
MySQL may crash when performing instances live migration or during a managed
cluster update. After the crash, MariaDB cannot connect to the cluster and gets
stuck in the CrashLoopBackOff state.
Workaround:
Verify that other MariaDB replicas are up and running and have joined the cluster:
Verify that at least 2 pods are running and operational (
2/2andRunning):kubectl -n openstack get pods |grep maria
Example of system response where the pods
mariadb-server-0andmariadb-server-2are operational:mariadb-controller-77b5ff47d5-ndj68 1/1 Running 0 39m mariadb-server-0 2/2 Running 0 39m mariadb-server-1 0/2 Running 0 39m mariadb-server-2 2/2 Running 0 39m
Log in to each operational pod and verify that the node is
Primaryand the cluster size is at least2. For example:mysql -u root -p$MYSQL_DBADMIN_PASSWORD -e "show status;" |grep -e \ wsrep_cluster_size -e "wsrep_cluster_status" -e "wsrep_local_state_comment"
Example of system response:
wsrep_cluster_size 2 wsrep_cluster_status Primary wsrep_local_state_comment Synced
Remove the content of the
/var/lib/mysql/*directory:kubectl -n openstack exec -it mariadb-server-1 – rm -rf /var/lib/mysql/*
Restart the MariaDB container:
kubectl -n openstack delete pod mariadb-server-1
During the MOSK cluster update, the OpenStack Controller may get stuck with the following symptoms:
Multiple
nodemaintenancerequestsexist:kubectl get nodemaintenancerequests NAME AGE kaas-node-50a51d95-1e4b-487e-a973-199de400b97d 17m kaas-node-e41a610a-ceaf-4d80-90ee-4ea7b4dee161 85s
One
nodemaintenancerequesthas aDeletedAttime stamp and an activeopenstack-controllerfinalizer:finalizers: - lcm.mirantis.com/openstack-controller.nodemaintenancerequest-finalizerIn the
openstack-controllerlogs, retries are exhausted:2022-02-17 18:41:43,317 [ERROR] kopf._core.engines.peering: Request attempt #8 failed; will retry: PATCH https://10.232.0.1:443/apis/zalando.org/v1/namespaces/openstack/kopfpeerings/openstack-controller.nodemaintenancerequest -> APIServerError('Internal error occurred: unable to unmarshal response in forceLegacy: json: cannot unmarshal number into Go value of type bool', {'kind': 'Status', 'apiVersion': 'v1', 'metadata': {}, 'status': 'Failure', 'message': 'Internal error occurred: unable to unmarshal response in forceLegacy: json: cannot unmarshal number into Go value of type bool', 'reason': 'InternalError', 'details': {'causes': [{'message': 'unable to unmarshal response in forceLegacy: json: cannot unmarshal number into Go value of type bool'}]}, 'code': 500}) 2022-02-17 18:42:50,834 [INFO] kopf.objects: Timer 'heartbeat' succeeded. 2022-02-17 18:47:50,848 [INFO] kopf.objects: Timer 'heartbeat' succeeded. 2022-02-17 18:52:50,853 [INFO] kopf.objects: Timer 'heartbeat' succeeded. 2022-02-17 18:57:50,858 [INFO] kopf.objects: Timer 'heartbeat' succeeded. 2022-02-17 19:02:50,862 [INFO] kopf.objects: Timer 'heartbeat' succeeded.
Notification about a successful finish does not exist:
kopf.objects: Handler 'node_maintenance_request_delete_handler' succeeded.
As a workaround, delete the OpenStack Controller pod:
kubectl -n osh-system delete pod -l app.kubernetes.io/name=openstack-operator
An update of the MOSK cluster with Tungsten Fabric may hang due to the changed Neutron backend with the following symptoms:
The
libvirtandnova-computepods fail to start:Entrypoint WARNING: 2022/03/03 08:49:45 entrypoint.go:72: Resolving dependency Pod on same host with labels map[application:neutron component:neutron-ovs-agent] in namespace openstack failed: Found no pods matching labels: map[application:neutron component:neutron-ovs-agent] .
In the
OSDPLnetwork section, theml2backend is specified instead oftungstenfabric:spec: features: neutron: backend: ml2
As a workaround, change the backend option from ml2 to
tungstenfabric:
spec:
features:
neutron:
backend: tungstenfabric
This section lists the components artifacts of the MOSK 22.1 release.
Component |
Path |
License information for main executable programs |
|---|---|---|
Binaries |
||
mirantis |
https://binary.mirantis.com/openstack/bin/horizon/mirantis-victoria-8f71802-20210119120707.tar.gz |
Mirantis Proprietary License |
octavia-amphora |
https://binary.mirantis.com/openstack/bin/octavia/amphora-x64-haproxy-victoria-20220119130236.qcow2 |
Mirantis Proprietary License |
Docker images |
||
ironic-inspector |
mirantis.azurecr.io/openstack/ironic-inspector:victoria-bionic-20220119123458 |
Apache License 2.0 |
masakari-monitors |
mirantis.azurecr.io/openstack/masakari-monitors:victoria-bionic-20220119123458 |
Apache License 2.0 |
masakari |
mirantis.azurecr.io/openstack/masakari:victoria-bionic-20220119123458 |
Apache License 2.0 |
placement |
mirantis.azurecr.io/openstack/placement:victoria-bionic-20220119123458 |
Apache License 2.0 |
keystone |
mirantis.azurecr.io/openstack/keystone:victoria-bionic-20220119123458 |
Apache License 2.0 |
heat |
mirantis.azurecr.io/openstack/heat:victoria-bionic-20220119123458 |
Apache License 2.0 |
glance |
mirantis.azurecr.io/openstack/glance:victoria-bionic-20220119123458 |
Apache License 2.0 |
cinder |
mirantis.azurecr.io/openstack/cinder:victoria-bionic-20220119123458 |
Apache License 2.0 |
neutron |
mirantis.azurecr.io/openstack/neutron:victoria-bionic-20220119123458 |
Apache License 2.0 |
nova |
mirantis.azurecr.io/openstack/nova:victoria-bionic-20220119123458 |
Apache License 2.0 |
horizon |
mirantis.azurecr.io/openstack/horizon:victoria-bionic-20220119123458 |
Apache License 2.0 |
tempest |
mirantis.azurecr.io/openstack/tempest:victoria-bionic-20220119123458 |
Apache License 2.0 |
octavia |
mirantis.azurecr.io/openstack/octavia:victoria-bionic-20220119123458 |
Apache License 2.0 |
designate |
mirantis.azurecr.io/openstack/designate:victoria-bionic-20220119123458 |
Apache License 2.0 |
ironic |
mirantis.azurecr.io/openstack/ironic:victoria-bionic-20220119123458 |
Apache License 2.0 |
barbican |
mirantis.azurecr.io/openstack/barbican:victoria-bionic-20220119123458 |
Apache License 2.0 |
libvirt |
mirantis.azurecr.io/general/libvirt:6.0.0-bionic-20220106104815 |
LGPL-2.1 License |
pause |
mirantis.azurecr.io/general/external/pause:3.1 |
Apache License 2.0 |
openvswitch |
mirantis.azurecr.io/general/openvswitch:2.11-bionic-20220106104815 |
Apache License 2.0 |
openvswitch-dpdk |
mirantis.azurecr.io/general/openvswitch-dpdk:2.11-bionic-20220106104815 |
Apache License 2.0 |
openstack-tools |
mirantis.azurecr.io/openstack/openstack-tools:ussuri-bionic-20220113100346 |
Apache License 2.0 |
rabbitmq-3.9 |
mirantis.azurecr.io/general/rabbitmq:3.9.8 |
Mozilla Public License 2.0 |
rabbitmq-3.9-management |
mirantis.azurecr.io/general/rabbitmq:3.9.8-management |
Mozilla Public License 2.0 |
kubernetes-entrypoint |
mirantis.azurecr.io/openstack/extra/kubernetes-entrypoint:v1.0.0-20200311160233 |
Apache License 2.0 |
docker |
mirantis.azurecr.io/openstack/extra/docker:17.07.0 |
Apache License 2.0 |
memcached |
mirantis.azurecr.io/general/memcached:1.6.6-alpine |
BSD 3-Clause “New” or “Revised” License |
ceph-config-helper |
mirantis.azurecr.io/openstack/extra/ceph-config-helper:nautilus-bionic-20211025114106 |
Apache License 2.0, LGPL-2.1 or LGPL-3 |
etcd |
mirantis.azurecr.io/openstack/extra/etcd:3.2.26 |
Apache License 2.0 |
powerdns |
mirantis.azurecr.io/openstack/extra/powerdns:4.2-alpine-20200117133238 |
GPL-2.0 License |
nginx-ingress-controller |
mirantis.azurecr.io/openstack/extra/nginx-ingress-controller:0.49.3 |
Apache License 2.0 |
defaultbackend |
mirantis.azurecr.io/openstack/extra/defaultbackend:1.0 |
Apache License 2.0 |
mariadb |
mirantis.azurecr.io/general/mariadb:10.4.17-bionic-20220106095058 |
GPLv2, LGPLv2.1 (client libraries) |
rabbitmq-exporter |
mirantis.azurecr.io/stacklight/rabbitmq-exporter:v1.0.0-RC8 |
MIT License |
prometheus-memcached-exporter |
mirantis.azurecr.io/stacklight/memcached-exporter:v0.9.0 |
Apache License 2.0 |
prometheus-mysql-exporter |
mirantis.azurecr.io/stacklight/mysqld-exporter:v0.11.0 |
Apache License 2.0 |
xrally-openstack |
mirantis.azurecr.io/openstack/extra/xrally-openstack:2.1.0-20211116035447 |
Apache License 2.0 |
aodh |
mirantis.azurecr.io/openstack/aodh:victoria-bionic-20220119123458 |
Apache License 2.0 |
panko |
mirantis.azurecr.io/openstack/panko:victoria-bionic-20220119123458 |
Apache License 2.0 |
ceilometer |
mirantis.azurecr.io/openstack/ceilometer:victoria-bionic-20220119123458 |
Apache License 2.0 |
gnocchi |
mirantis.azurecr.io/openstack/gnocchi:victoria-bionic-20220119123458 |
Apache License 2.0 |
redis |
mirantis.azurecr.io/openstack/extra/redis:5.0-alpine |
BSD 3-Clause “New” or “Revised” License |
frr |
mirantis.azurecr.io/general/external/docker.io/frrouting/frr:v7.5.0 |
GPL-2.0 License |
strongswan |
mirantis.azurecr.io/openstack/extra/strongswan:alpine-5.9.1-20211018180158 |
GPL License |
descheduler NEW |
mirantis.azurecr.io/openstack/extra/descheduler:v0.21.0 |
Apache License 2.0 |
Component |
Path |
License information for main executable programs |
|---|---|---|
Binaries |
||
mirantis |
https://binary.mirantis.com/openstack/bin/horizon/mirantis-ussuri-48f346e-20210119132403.tar.gz |
Mirantis Proprietary License |
octavia-amphora |
https://binary.mirantis.com/openstack/bin/octavia/amphora-x64-haproxy-ussuri-20220113104335.qcow2 |
Mirantis Proprietary License |
Docker images |
||
ironic-inspector |
mirantis.azurecr.io/openstack/ironic-inspector:ussuri-bionic-20220113100346 |
Apache License 2.0 |
masakari-monitors |
mirantis.azurecr.io/openstack/masakari-monitors:ussuri-bionic-20220113100346 |
Apache License 2.0 |
masakari |
mirantis.azurecr.io/openstack/masakari:ussuri-bionic-20220113100346 |
Apache License 2.0 |
placement |
mirantis.azurecr.io/openstack/placement:ussuri-bionic-20220113100346 |
Apache License 2.0 |
redis |
mirantis.azurecr.io/openstack/extra/redis:5.0-alpine |
BSD 3-Clause “New” or “Revised” License |
gnocchi |
mirantis.azurecr.io/openstack/gnocchi:ussuri-bionic-20220113100346 |
Apache License 2.0 |
ceilometer |
mirantis.azurecr.io/openstack/ceilometer:ussuri-bionic-20220113100346 |
Apache License 2.0 |
panko |
mirantis.azurecr.io/openstack/panko:ussuri-bionic-20220113100346 |
Apache License 2.0 |
aodh |
mirantis.azurecr.io/openstack/aodh:ussuri-bionic-20220113100346 |
Apache License 2.0 |
xrally-openstack |
mirantis.azurecr.io/openstack/extra/xrally-openstack:2.1.0-20211116035447 |
Apache License 2.0 |
prometheus-mysql-exporter |
mirantis.azurecr.io/stacklight/mysqld-exporter:v0.11.0 |
Apache License 2.0 |
prometheus-memcached-exporter |
mirantis.azurecr.io/stacklight/memcached-exporter:v0.9.0 |
Apache License 2.0 |
rabbitmq-exporter |
mirantis.azurecr.io/stacklight/rabbitmq-exporter:v1.0.0-RC8 |
MIT License |
mariadb |
mirantis.azurecr.io/general/mariadb:10.4.17-bionic-20220106095058 |
GPLv2, LGPLv2.1 (client libraries) |
defaultbackend |
mirantis.azurecr.io/openstack/extra/defaultbackend:1.0 |
Apache License 2.0 |
nginx-ingress-controller |
mirantis.azurecr.io/openstack/extra/nginx-ingress-controller:0.49.3 |
Apache License 2.0 |
powerdns |
mirantis.azurecr.io/openstack/extra/powerdns:4.2-alpine-20200117133238 |
GPL-2.0 License |
etcd |
mirantis.azurecr.io/openstack/extra/etcd:3.2.26 |
Apache License 2.0 |
ceph-config-helper |
mirantis.azurecr.io/openstack/extra/ceph-config-helper:nautilus-bionic-20211025114106 |
Apache License 2.0, LGPL-2.1 or LGPL-3 |
memcached |
mirantis.azurecr.io/general/memcached:1.6.6-alpine |
BSD 3-Clause “New” or “Revised” License |
docker |
mirantis.azurecr.io/openstack/extra/docker:17.07.0 |
Apache License 2.0 |
kubernetes-entrypoint |
mirantis.azurecr.io/openstack/extra/kubernetes-entrypoint:v1.0.0-20200311160233 |
Apache License 2.0 |
rabbitmq-3.9-management |
mirantis.azurecr.io/general/rabbitmq:3.9.8-management |
Mozilla Public License 2.0 |
rabbitmq-3.9 |
mirantis.azurecr.io/general/rabbitmq:3.9.8 |
Mozilla Public License 2.0 |
openstack-tools |
mirantis.azurecr.io/openstack/openstack-tools:ussuri-bionic-20220113100346 |
Apache License 2.0 |
openvswitch-dpdk |
mirantis.azurecr.io/general/openvswitch-dpdk:2.11-bionic-20220106104815 |
Apache License 2.0 |
openvswitch |
mirantis.azurecr.io/general/openvswitch:2.11-bionic-20220106104815 |
Apache License 2.0 |
pause |
mirantis.azurecr.io/general/external/pause:3.1 |
Apache License 2.0 |
libvirt |
mirantis.azurecr.io/general/libvirt:6.0.0-bionic-20220106104815 |
LGPL-2.1 License |
barbican |
mirantis.azurecr.io/openstack/barbican:ussuri-bionic-20220113100346 |
Apache License 2.0 |
ironic |
mirantis.azurecr.io/openstack/ironic:ussuri-bionic-20220113100346 |
Apache License 2.0 |
designate |
mirantis.azurecr.io/openstack/designate:ussuri-bionic-20220113100346 |
Apache License 2.0 |
octavia |
mirantis.azurecr.io/openstack/octavia:ussuri-bionic-20220113100346 |
Apache License 2.0 |
tempest |
mirantis.azurecr.io/openstack/tempest:ussuri-bionic-20220113100346 |
Apache License 2.0 |
horizon |
mirantis.azurecr.io/openstack/horizon:ussuri-bionic-20220113100346 |
Apache License 2.0 |
nova |
mirantis.azurecr.io/openstack/nova:ussuri-bionic-20220113100346 |
Apache License 2.0 |
neutron |
mirantis.azurecr.io/openstack/neutron:ussuri-bionic-20220113100346 |
Apache License 2.0 |
cinder |
mirantis.azurecr.io/openstack/cinder:ussuri-bionic-20220113100346 |
Apache License 2.0 |
glance |
mirantis.azurecr.io/openstack/glance:ussuri-bionic-20220113100346 |
Apache License 2.0 |
heat |
mirantis.azurecr.io/openstack/heat:ussuri-bionic-20220113100346 |
Apache License 2.0 |
keystone |
mirantis.azurecr.io/openstack/keystone:ussuri-bionic-20220113100346 |
Apache License 2.0 |
frr |
mirantis.azurecr.io/general/external/docker.io/frrouting/frr:v7.5.0 |
GPL-2.0 License |
strongswan |
mirantis.azurecr.io/openstack/extra/strongswan:alpine-5.9.1-20211018180158 |
GPL License |
descheduler NEW |
mirantis.azurecr.io/openstack/extra/descheduler:v0.21.0 |
Apache License 2.0 |
Component |
Path |
License information for main executable programs |
|---|---|---|
Helm charts |
||
Tungsten Fabric Operator |
https://binary.mirantis.com/tungsten/helm/tungstenfabric-operator-0.6.11.tgz |
Mirantis Proprietary License |
Docker images |
||
Tungsten Fabric Operator |
mirantis.azurecr.io/tungsten-operator/tungstenfabric-operator:0.6.11 |
Mirantis Proprietary License |
Analytics |
mirantis.azurecr.io/tungsten/contrail-analytics-api:5.1.20220127155145 |
Apache License 2.0 |
mirantis.azurecr.io/tungsten/contrail-analytics-collector:5.1.20220127155145 |
Apache License 2.0 |
|
Analytics Alarm |
mirantis.azurecr.io/tungsten/contrail-analytics-alarm-gen:5.1.20220127155145 |
Apache License 2.0 |
Analytics DB |
mirantis.azurecr.io/tungsten/contrail-analytics-query-engine:5.1.20220127155145 |
Apache License 2.0 |
Analytics SNMP |
mirantis.azurecr.io/tungsten/contrail-analytics-snmp-collector:5.1.20220127155145 |
Apache License 2.0 |
mirantis.azurecr.io/tungsten/contrail-analytics-snmp-topology:5.1.20220127155145 |
Apache License 2.0 |
|
Config |
mirantis.azurecr.io/tungsten/contrail-controller-config-api:5.1.20220127155145 |
Apache License 2.0 |
mirantis.azurecr.io/tungsten/contrail-controller-config-devicemgr:5.1.20220127155145 |
Apache License 2.0 |
|
mirantis.azurecr.io/tungsten/contrail-controller-config-schema:5.1.20220127155145 |
Apache License 2.0 |
|
mirantis.azurecr.io/tungsten/contrail-controller-config-svcmonitor:5.1.20220127155145 |
Apache License 2.0 |
|
Control |
mirantis.azurecr.io/tungsten/contrail-controller-control-control:5.1.20220127155145 |
Apache License 2.0 |
mirantis.azurecr.io/tungsten/contrail-controller-control-dns:5.1.20220127155145 |
Apache License 2.0 |
|
mirantis.azurecr.io/tungsten/contrail-controller-control-named:5.1.20220127155145 |
Apache License 2.0 |
|
Web UI |
mirantis.azurecr.io/tungsten/contrail-controller-webui-job:5.1.20220127155145 |
Apache License 2.0 |
mirantis.azurecr.io/tungsten/contrail-controller-webui-web:5.1.20220127155145 |
Apache License 2.0 |
|
vRouter |
mirantis.azurecr.io/tungsten/contrail-vrouter-agent:5.1.20220127155145 |
Apache License 2.0 |
mirantis.azurecr.io/tungsten/contrail-vrouter-kernel-build-init:5.1.20220127155145 |
Apache License 2.0 |
|
Nodemanager |
mirantis.azurecr.io/tungsten/contrail-nodemgr:5.1.20220127155145 |
Apache License 2.0 |
Cassandra operator |
mirantis.azurecr.io/tungsten-operator/casskop:v2.0.2-release |
Apache License 2.0 |
Cassandra |
mirantis.azurecr.io/tungsten/cassandra-bootstrap:0.1.9 |
Apache License 2.0 |
mirantis.azurecr.io/tungsten/cassandra:3.11.10 |
Apache License 2.0 |
|
mirantis.azurecr.io/tungsten/cass-config-builder:1.0.4 |
Apache License 2.0 |
|
mirantis.azurecr.io/tungsten/instaclustr-icarus:1.1.0 |
Apache License 2.0 |
|
Kafka operator |
mirantis.azurecr.io/tungsten-operator/kafka-k8s-operator:0.1.0 |
Mirantis Proprietary License |
Kafka |
mirantis.azurecr.io/tungsten/cp-kafka:5.5.7 |
Apache License 2.0 |
mirantis.azurecr.io/stacklight/prometheus-jmx-exporter:0.14.0-r50 |
Apache License 2.0 |
|
RabbitMQ operator |
mirantis.azurecr.io/tungsten-operator/rabbitmq-operator:0.1.5 |
Mirantis Proprietary License |
RabbitMQ |
mirantis.azurecr.io/general/rabbitmq:3.8.23 |
Mozilla Public License 2.0 |
mirantis.azurecr.io/stacklight/rabbitmq-exporter:v1.0.0-RC8 |
MIT License |
|
ZooKeeper operator |
mirantis.azurecr.io/tungsten-operator/zookeeper-operator:0.2.12 |
Apache License 2.0 |
ZooKeeper |
mirantis.azurecr.io/tungsten/zookeeper:3.6.3-0.2.13 |
Apache License 2.0 |
Redis operator |
mirantis.azurecr.io/tungsten-operator/redis-operator:0.2.2-1-8cba7b0 |
Apache License 2.0 |
Redis |
mirantis.azurecr.io/tungsten/redis:6-alpine |
BSD 3-Clause “New” or “Revised” License |
TF Test |
mirantis.azurecr.io/tungsten/tungsten-pytest:0.1-20220120132145 |
MIT License |
TF CLI |
mirantis.azurecr.io/tungsten/tf-cli:0.1-20210214191656 |
MIT License |
TF NodeInfo |
mirantis.azurecr.io/tungsten/tf-nodeinfo:0.1-20210430090010 |
MIT License |
Component |
Path |
License information for main executable programs |
|---|---|---|
Helm charts |
||
Tungsten Fabric Operator |
https://binary.mirantis.com/tungsten/helm/tungstenfabric-operator-0.6.11.tgz |
Mirantis Proprietary License |
Docker images |
||
Tungsten Fabric Operator |
mirantis.azurecr.io/tungsten-operator/tungstenfabric-operator:0.6.11 |
Mirantis Proprietary License |
Analytics |
mirantis.azurecr.io/tungsten/contrail-analytics-api:2011.20220202093934 |
Apache License 2.0 |
mirantis.azurecr.io/tungsten/contrail-analytics-collector:2011.20220202093934 |
Apache License 2.0 |
|
Analytics Alarm |
mirantis.azurecr.io/tungsten/contrail-analytics-alarm-gen:2011.20220202093934 |
Apache License 2.0 |
Analytics DB |
mirantis.azurecr.io/tungsten/contrail-analytics-query-engine:2011.20220202093934 |
Apache License 2.0 |
Analytics SNMP |
mirantis.azurecr.io/tungsten/contrail-analytics-snmp-collector:2011.20220202093934 |
Apache License 2.0 |
mirantis.azurecr.io/tungsten/contrail-analytics-snmp-topology:2011.20220202093934 |
Apache License 2.0 |
|
Config |
mirantis.azurecr.io/tungsten/contrail-controller-config-api:2011.20220202093934 |
Apache License 2.0 |
mirantis.azurecr.io/tungsten/contrail-controller-config-devicemgr:2011.20220202093934 |
Apache License 2.0 |
|
mirantis.azurecr.io/tungsten/contrail-controller-config-schema:2011.20220202093934 |
Apache License 2.0 |
|
mirantis.azurecr.io/tungsten/contrail-controller-config-svcmonitor:2011.20220202093934 |
Apache License 2.0 |
|
mirantis.azurecr.io/openstack/extra/kubernetes-entrypoint:v1.0.0-20200311160233 |
Apache License 2.0 |
|
Control |
contrail-controller-control-control:2011.20220202093934 |
Apache License 2.0 |
mirantis.azurecr.io/tungsten/contrail-controller-control-dns:2011.20220202093934 |
Apache License 2.0 |
|
mirantis.azurecr.io/tungsten/contrail-controller-control-named:2011.20220202093934 |
Apache License 2.0 |
|
Web UI |
mirantis.azurecr.io/tungsten/contrail-controller-webui-job:2011.20220202093934 |
Apache License 2.0 |
mirantis.azurecr.io/tungsten/contrail-controller-webui-web:2011.20220202093934 |
Apache License 2.0 |
|
vRouter |
mirantis.azurecr.io/tungsten/contrail-vrouter-agent:2011.20220202093934 |
Apache License 2.0 |
mirantis.azurecr.io/tungsten/contrail-vrouter-kernel-build-init:2011.20220202093934 |
Apache License 2.0 |
|
NEW mirantis.azurecr.io/tungsten/contrail-node-init:2011.20220202093934 |
Apache License 2.0 |
|
Nodemanager |
mirantis.azurecr.io/tungsten/contrail-nodemgr:2011.20220202093934 |
Apache License 2.0 |
Provisioner |
mirantis.azurecr.io/tungsten/contrail-provisioner:2011.20220202093934 |
Apache License 2.0 |
Cassandra operator |
mirantis.azurecr.io/tungsten-operator/casskop:v2.0.2-release |
Apache License 2.0 |
Cassandra |
mirantis.azurecr.io/tungsten/cassandra-bootstrap:0.1.9 |
Apache License 2.0 |
mirantis.azurecr.io/tungsten/cassandra:3.11.10 |
Apache License 2.0 |
|
mirantis.azurecr.io/tungsten/cass-config-builder:1.0.4 |
Apache License 2.0 |
|
mirantis.azurecr.io/tungsten/instaclustr-icarus:1.1.0 |
Apache License 2.0 |
|
Kafka operator |
mirantis.azurecr.io/tungsten-operator/kafka-k8s-operator:0.1.0 |
Mirantis Proprietary License |
Kafka |
mirantis.azurecr.io/tungsten/cp-kafka:5.5.7 |
Apache License 2.0 |
mirantis.azurecr.io/stacklight/prometheus-jmx-exporter:0.14.0-r50 |
Apache License 2.0 |
|
RabbitMQ operator |
mirantis.azurecr.io/tungsten-operator/rabbitmq-operator:0.1.5 |
Mirantis Proprietary License |
RabbitMQ |
mirantis.azurecr.io/general/rabbitmq:3.8.23 |
Mozilla Public License 2.0 |
mirantis.azurecr.io/stacklight/rabbitmq-exporter:v1.0.0-RC8 |
MIT License |
|
ZooKeeper operator |
mirantis.azurecr.io/tungsten-operator/zookeeper-operator:0.2.12 |
Apache License 2.0 |
ZooKeeper |
mirantis.azurecr.io/tungsten/zookeeper:3.6.3-0.2.13 |
Apache License 2.0 |
Redis operator |
mirantis.azurecr.io/tungsten-operator/redis-operator:0.2.2-1-8cba7b0 |
Apache License 2.0 |
Redis |
mirantis.azurecr.io/tungsten/redis:6-alpine |
BSD 3-Clause “New” or “Revised” License |
TF Test |
mirantis.azurecr.io/tungsten/tungsten-pytest:0.1-20220120132145 |
MIT License |
TF CLI |
mirantis.azurecr.io/tungsten/tf-cli:0.1-20210214191656 |
MIT License |
TF NodeInfo |
mirantis.azurecr.io/tungsten/tf-nodeinfo:0.1-20210430090010 |
MIT License |
TF Tools |
mirantis.azurecr.io/tungsten/contrail-tools:2011.20220202093934 |
Apache License 2.0 |
Component |
Path |
License information for main executable programs |
|---|---|---|
Docker images |
||
prometheus-libvirt-exporter |
mirantis.azurecr.io/stacklight/prometheus-libvirt-exporter:v0.1-20200610164751 |
Mirantis Proprietary License |
prometheus-tungstenfabric-exporter |
mirantis.azurecr.io/stacklight/tungstenfabric-prometheus-exporter:0.1-20210115152338 |
Mirantis Proprietary License |
Helm charts |
||
prometheus-libvirt-exporter |
https://binary.mirantis.com/stacklight/helm/prometheus-libvirt-exporter-0.2.0-mcp-1.tgz |
Mirantis Proprietary License |
prometheus-tungstenfabric-exporter |
https://binary.mirantis.com/stacklight/helm/prometheus-tungstenfabric-exporter-0.2.0-mcp-3.tgz |
Mirantis Proprietary License |
The following issues have been addressed in the MOSK 22.1 release:
[16495][OpenStack] Fixed the issue with Kubernetes not rescheduling OpenStack deployment pods after a node recovery.
[18713][OpenStack] Fixed the issue causing inability to remove a Glance image after an unsuccessful instance spawn attempt when image signature verification was enabled but the signature on the image was incorrect.
[19274][OpenStack] Fixed the issue causing inability to create a Heat stack by specifying the Heat template as a URL link due to Horizon container missing proxy variables.
[19791][OpenStack] Fixed the issue with the
DEFAULTvolume type being automatically created, as well as listed as a volume type in Horizon, for database migration even ifdefault_volume_typewas set incinder.conf.[18829][StackLight] Fixed the issue causing the Prometheus exporter for the Tungsten Fabric Controller pod to fail to start upon the StackLight log level change.
[18879][Ceph] Fixed the issue with the RADOS Gateway (RGW) pod overriding the global CA bundle located at
/etc/pki/tls/certswith an incorrect self-signed CA bundle during deployment of a Ceph cluster.[19195][Tungsten Fabric] Fixed the issue causing the managed cluster status to flap between the
Ready/Not Readystates in the Container Cloud web UI.
This section describes the specific actions you as a cloud operator need to complete to accurately plan and successfully perform your Mirantis OpenStack for Kubernetes (MOSK) cluster to the version 22.1. Consider this information as a supplement to the generic update procedure published in Operations Guide: Update a MOSK cluster.
Additionally, read through the Cluster update known issues for the problems that are known to occur during update with recommended workarounds.
Starting from MOSK 22.1, the virtual CPU mode is set to
host-model by default, which replaces the previous default kvm64
CPU model.
The new default option provides performance and workload portability, namely reliable live and cold migration of instances between hosts, and ability to run modern guest operating systems, such as Windows Server.
For the deployments the virtual CPU mode settings customized through
spec:services, remove this customization in favor of the defaults
after the update.
MOSK 22.1 includes the updated version of the host machine’s kernel that is v5.4. All nodes in the cluster will get restarted to apply the relevant changes.
Node group |
Sequential restart |
Impact on end users and workloads |
|---|---|---|
Kubernetes master nodes |
Yes |
No |
Control plane nodes |
Yes |
No |
Storage nodes |
Yes |
No |
Compute nodes |
Yes |
15-20 minutes of downtime for workloads hosted on a compute node depending on the hardware specifications of the node |
During the Kubernetes master nodes update, there is a downtime on Kubernetes cluster’s internal DNS service. Thus, Tungsten Fabric vRouter pods lose connection with the control plane resulting in up to 1 minute of downtime for the Tungsten Fabric data plane nodes and impact on the tenant networking.
To complete the update of the cluster with Tungsten Fabric, manually restart Tungsten Fabric vRouter Agent pods on all compute nodes. The restart of a vRouter Agent on a compute node will cause up to 30-60 seconds of networking downtime per instance hosted there. If downtime is unacceptable for some workloads, we recommend that you migrate them before restarting the vRouter pods.
Warning
Under certain rare circumstances, the reload of the vRouter kernel
module triggered by the restart of a vRouter Agent is known to hang due to
the inability to complete the drop_caches operation. Watch the status
and logs of the vRouter Agent being restarted and trigger the reboot of
the node if necessary.
MOS 21.6 release
Release date |
Name |
Cluster release |
Highlights |
|---|---|---|---|
November 11, 2021 |
MOS 21.6 |
6.20.0+21.6 |
|
Component |
Support scope |
Feature |
|---|---|---|
OpenStack |
Full |
|
TechPreview |
||
TechPreview |
||
Tungsten Fabric |
Full |
|
TechPreview |
||
Tungsten Fabric |
Full |
|
StackLight |
Full |
Implemented an automatic cleanup of deleted entries from the databases of OpenStack services. By default, the deleted rows older than 30 days are sanely and safely purged from the Barbican, Cinder, Glance, Heat, Masakari, and Nova databases for all relevant tables.
TechPreview
Implemented the capability to perform image signature verification when booting an OpenStack instance, uploading a Glance image with signature metadata fields set, and creating a volume from an image.
TechPreview
Implemented the ability to set the kv_mountpoint and namespace
in spec:features:barbican to specify the mountpoint of a Key-Value
store and the Vault namespace to be used for all requests to Vault
respectively.
Implemented the capability for the Tungsten Fabric Operator to use
ValidatingAdmissionWebhook to validate environment variables set to
Tungsten Fabric components upon the TFOperator object creation or update.
Tungsten Fabric 2011 is now set as the default version for deployment.
Tungsten Fabric 5.1 is considered deprecated and will be declared unsupported in one of the upcoming releases. Therefore, Mirantis highly recommends upgrading from Tungsten Fabric 5.1 to 2011.
Learn more
TechPreview
Implemented the capability to deploy a MOS with Tungsten Fabric cluster with a multi-rack architecture to allow for native integration with the Layer 3-centric networking topologies.
Implemented the following improvements to StackLight alerting:
Implemented per-service
*TargetDownand*TargetsOutagealerts that raise if one or all Prometheus targets are down.Enhanced the alert inhibition rules to reduce alert flooding.
Learn more
Mirantis has tested MOS against a very specific configuration and can guarantee a predictable behavior of the product only in the exact same environments. The table below includes the major MOS components with the exact versions against which testing has been performed.
Component |
Version |
|---|---|
Cluster release |
|
OpenStack |
|
openstack-operator |
0.6.3 |
Tungsten Fabric |
|
tungstenfabric-operator |
0.5.3 |
See also
This section describes the MOS known issues with available workarounds. For the known issues in the related version of Mirantis Container Cloud, refer to Mirantis Container Cloud: Release Notes.
This section lists the Tungsten Fabric known issues with workarounds for the Mirantis OpenStack for Kubernetes release 21.6.
[10096] tf-control does not refresh IP addresses of Cassandra pods
[13755] TF pods switch to CrashLoopBackOff after a simultaneous reboot
[15684] Pods fail when rolling Tungsten Fabric 2011 back to 5.1
[18148] TF resets BGP_ASN, ENCAP_PRIORITY, and VXLAN_VN_ID_MODE to defaults
[19195] Managed cluster status is flapping between the Ready/Not Ready states
Tungsten Fabric does not provide the following functionality:
Automatic generation of network port records in DNSaaS (Designate) as Neutron with Tungsten Fabric as a backend is not integrated with DNSaaS. As a workaround, you can use the Tungsten Fabric built-in DNS service that enables virtual machines to resolve each other names.
Secret management (Barbican). You cannot use the certificates stored in Barbican to terminate HTTPs in a load balancer.
Role Based Access Control (RBAC) for Neutron objects.
Modification of custom vRouter DaemonSets based on the SR-IOV definition in the
OsDplCR.
The tf-control service resolves the DNS names of Cassandra pods at startup
and does not update them if Cassandra pods got new IP addresses, for example,
in case of a restart. As a workaround, to refresh the IP addresses of
Cassandra pods, restart the tf-control pods one by one:
Caution
Before restarting the tf-control pods:
Verify that the new pods are successfully spawned.
Verify that no vRouters are connected to only one
tf-controlpod that will be restarted.
kubectl -n tf delete pod tf-control-<hash>
Rebooting all Cassandra cluster TFConfig or TFAnalytics nodes, maintenance, or other circumstances that cause the Cassandra pods to start simultaneously may cause a broken Cassandra TFConfig and/or TFAnalytics cluster. In this case, Cassandra nodes do not join the ring and do not update the IPs of the neighbor nodes. As a result, the TF services cannot operate Cassandra cluster(s).
To verify that a Cassandra cluster is affected:
Run the nodetool status command specifying the config or
analytics cluster and the replica number:
kubectl -n tf exec -it tf-cassandra-<config/analytics>-dc1-rack1-<replica number> -c cassandra -- nodetool status
Example of system response with outdated IP addresses:
Datacenter: DC1
===============
Status=Up/Down
|/ State=Normal/Leaving/Joining/Moving
-- Address Load Tokens Owns (effective) Host ID Rack
DN <outdated ip> ? 256 64.9% a58343d0-1e3f-4d54-bcdf-9b9b949ca873 r1
DN <outdated ip> ? 256 69.8% 67f1d07c-8b13-4482-a2f1-77fa34e90d48 r1
Datacenter: dc1
===============
Status=Up/Down
|/ State=Normal/Leaving/Joining/Moving
-- Address Load Tokens Owns (effective) Host ID Rack
UN <actual ip> 3.84 GiB 256 65.2% 7324ebc4-577a-425f-b3de-96faac95a331 rack1
Workaround:
Manually delete a Cassandra pod from the failed config or analytics
cluster to re-initiate the bootstrap process for one of the Cassandra nodes:
kubectl -n tf delete pod tf-cassandra-<config/analytics>-dc1-rack1-<replica number>
Some tf-control and tf-analytics pods may fail during the Tungsten
Fabric rollback from version 2011 to 5.1. In this case, the control
container from the tf-control pod and/or the collector container from
the tf-analytics pod contain SYS_WARN messages such as
… AMQP_QUEUE_DELETE_METHOD caused: PRECONDITION_FAILED - queue
‘<contrail-control/contrail-collector>.<nodename>’ in vhost ‘/’ not empty
….
The workaround is to manually delete the queue that fails to be deleted by
AMQP_QUEUE_DELETE_METHOD:
kubectl -n tf exec -it tf-rabbitmq-<num of replica> -- rabbitmqctl delete_queue <queue name>
During LCM operations such as Tungsten Fabric update or upgrade, the following
parameters defined by the cluster administrator are reset to the following
defaults upon the tf-config pod restart:
BGP_ASNto64512ENCAP_PRIORITYtoMPLSoUDP,MPLSoGRE,VXLANVXLAN_VN_ID_MODEtoautomatic
As a workaround, manually set up values for the required parameters if they differ from the defaults:
controllers:
tf-config:
provisioner:
containers:
- env:
- name: BGP_ASN
value: <USER_BGP_ASN_VALUE>
- name: ENCAP_PRIORITY
value: <USER_ENCAP_PRIORITY_VALUE>
name: provisioner
The status of a managed cluster may be flapping between the Ready and
Not Ready states in the Container Cloud web UI. In this case, if the
cluster Status field includes a message about not ready
tf/tf-tool-status-aggregator and/or tf-tool-status-party deployments
with 1/1 replicas, the status flapping may be caused by frequent updates of
these deployments by the Tungsten Fabric Operator.
Workaround:
Verify whether the
tf/tf-tool-status-aggregatorandtf-tool-status-partydeployments are up and running:kubectl -n tf get deployments
Safely disable the
tf/tf-tool-status-aggregatorandtf-tool-status-partydeployments through theTFOperatorCR:spec: controllers: tf-tool: status: enabled: false statusAggregator: enabled: false statusThirdParty: enabled: false
This section lists the OpenStack known issues with workarounds for the Mirantis OpenStack for Kubernetes release 21.6.
[25594] Security groups shared through RBAC cannot be used to create instances
[23985] Federated authorization fails after updating Keycloak URL
[6912] Octavia load balancers may not work properly with DVR
[16495] Failure to reschedule OpenStack deployment pods after a node recovery
[18713] Inability to remove a Glance image after an unsuccessful instance spawn
[19065] Octavia load balancers lose Amphora VMs after failover
Limitation
When Neutron is deployed in the DVR mode, Octavia load balancers may not work correctly. The symptoms include both failure to properly balance traffic and failure to perform an amphora failover. For details, see DVR incompatibility with ARP announcements and VRRP.
Kubernetes does not reschedule OpenStack deployment pods after a node recovery.
As a workaround, delete all pods of the deployment:
for i in $(kubectl -n openstack get deployments |grep -v NAME | awk '{print $1}');
do
kubectl -n openstack rollout restart deployment/$i;
done
Once done, the pods will respawn automatically.
When image signature verification is enabled and the signature is incorrect on the image, it is impossible to remove a Glance image right after an unsuccessful instance spawn attempt. As a workaround, wait for at least one minute before trying to remove the image.
Horizon container is missing proxy variables. As a result, it is not possible to create a Heat stack by specifying the Heat template as a URL link. As a workaround, use a different upload method and specify the file from a local folder.
If an Amphora VM does not respond or responds too long to heartbeat requests, the Octavia load balancer automatically initiates a failover process after 60 seconds of unsuccessful attempts. Long responses of an Amphora VM may be caused by various events, such as a high load on the OpenStack compute node that hosts the Amphora VM, network issues, system service updates, and so on. After a failover, the Amphora VMs may be missing in the completed Octavia load balancer.
Workaround:
If your deployment is already affected, manually restore the work of the load balancer by recreating the Amphora VM:
Define the load balancer ID:
openstack loadbalancer amphora list --column loadbalancer_id --format value --status ERROR
Start the load balancer failover:
openstack loadbalancer failover <Load balancer ID>
To avoid an automatic failover start that may cause the issue, set the
heartbeat_timeoutparameter in theOpenStackDeploymentCR to a large value in seconds. The default is 60 seconds. For example:spec: services: load-balancer: octavia: values: conf: octavia: health_manager: heartbeat_timeout: 31536000
This section lists the cluster update known issues with workarounds for the Mirantis OpenStack for Kubernetes release 21.6.
A MOS cluster may fail to update to the latest Cluster release with kubelet being stuck and reporting authorization errors.
The cluster is affected by the issue if you see the Failed to make webhook authorizer request: context canceled error in the kubelet logs:
docker logs ucp-kubelet --since 5m 2>&1 | grep 'Failed to make webhook authorizer request: context canceled'
As a workaround, restart the ucp-kubelet container on the affected
node(s):
ctr -n com.docker.ucp snapshot rm ucp-kubelet
docker rm -f ucp-kubelet
Note
Ignore failures in the output of the first command, if any.
An update of a MOS cluster may fail with the ceph csi-driver is not evacuated yet, waiting… error during the Ceph CSI pod eviction.
Workaround:
Scale the affected
StatefulSetof the pod that fails to init down to0replicas. If it is theDaemonSetsuch asnova-compute, it must not be scheduled on the affected node.On every
csi-rbdpluginpod, search for stuckcsi-vol:rbd device list | grep <csi-vol-uuid>
Unmap the affected
csi-vol:rbd unmap -o force /dev/rbd<i>
Delete
volumeattachmentof the affected pod:kubectl get volumeattachments | grep <csi-vol-uuid> kubectl delete volumeattacmhent <id>
Scale the affected
StatefulSetback to the original number of replicas or until its state isRunning. If it is aDaemonSet, run the pod on the affected node again.
MySQL may crash when performing instances live migration or during an update of
a managed cluster running MOS from version 6.19.0 to 6.20.0. After the crash,
MariaDB cannot connect to the cluster and gets stuck in the
CrashLoopBackOff state.
Workaround:
Verify that other MariaDB replicas are up and running and have joined the cluster:
Verify that at least 2 pods are running and operational (
2/2andRunning):kubectl -n openstack get pods |grep maria
Example of system response where the pods
mariadb-server-0andmariadb-server-2are operational:mariadb-controller-77b5ff47d5-ndj68 1/1 Running 0 39m mariadb-server-0 2/2 Running 0 39m mariadb-server-1 0/2 Running 0 39m mariadb-server-2 2/2 Running 0 39m
Log in to each operational pod and verify that the node is
Primaryand the cluster size is at least2. For example:mysql -u root -p$MYSQL_DBADMIN_PASSWORD -e "show status;" |grep -e \ wsrep_cluster_size -e "wsrep_cluster_status" -e "wsrep_local_state_comment"
Example of system response:
wsrep_cluster_size 2 wsrep_cluster_status Primary wsrep_local_state_comment Synced
Remove the content of the
/var/lib/mysql/*directory:kubectl -n openstack exec -it mariadb-server-1 – rm -rf /var/lib/mysql/*
Restart the MariaDB container:
kubectl -n openstack delete pod mariadb-server-1
This section lists Ceph known issues with workarounds for the Mirantis OpenStack for Kubernetes release 21.6.
During deployment of a Ceph cluster, the RADOS Gateway (RGW) pod overrides
the global CA bundle located at /etc/pki/tls/certs with an incorrect
self-signed CA bundle. The issue affects only clusters with public
certificates.
Workaround:
Open the
KaasCephClusterCR of a managed cluster for editing:kubectl edit kaascephcluster -n <managedClusterProjectName>
Substitute
<managedClusterProjectName>with a corresponding value.Note
If the public CA certificates also apply to the
OsDplCR, edit this resource as well.Select from the following options:
If you are using the GoDaddy certificates, in the
cephClusterSpec.objectStorage.rgwsection, replace thecacertparameters with your public CA certificate that already contains both the root CA certificate and intermediate CA certificate:cephClusterSpec: objectStorage: rgw: SSLCert: cacert: | -----BEGIN CERTIFICATE----- ca-certificate here -----END CERTIFICATE----- tlsCert: | -----BEGIN CERTIFICATE----- private TLS certificate here -----END CERTIFICATE----- tlsKey: | -----BEGIN RSA PRIVATE KEY----- private TLS key here -----END RSA PRIVATE KEY-----
If you are using the DigiCert certificates:
Download the
<root_CA>from DigiCert.In the
cephClusterSpec.objectStorage.rgwsection, replace thecacertparameters with your public intermediate CA certificate along with the root one:cephClusterSpec: objectStorage: rgw: SSLCert: cacert: | -----BEGIN CERTIFICATE----- <root CA here> <intermediate CA here> -----END CERTIFICATE----- tlsCert: | -----BEGIN CERTIFICATE----- private TLS certificate here -----END CERTIFICATE----- tlsKey: | -----BEGIN RSA PRIVATE KEY----- private TLS key here -----END RSA PRIVATE KEY-----
This section lists the components artifacts of the MOS 21.6 release:
Component |
Path |
License information for main executable programs |
|---|---|---|
Binaries |
||
mirantis |
https://binary.mirantis.com/openstack/bin/horizon/mirantis-victoria-8f71802-20210119120707.tar.gz |
Mirantis Proprietary License |
octavia-amphora |
https://binary.mirantis.com/openstack/bin/octavia/amphora-x64-haproxy-victoria-20211025092055.qcow2 |
Mirantis Proprietary License |
Docker images |
||
ironic-inspector |
mirantis.azurecr.io/openstack/ironic-inspector:victoria-bionic-20211025085835 |
Apache License 2.0 |
masakari-monitors |
mirantis.azurecr.io/openstack/masakari-monitors:victoria-bionic-20211025085835 |
Apache License 2.0 |
masakari |
mirantis.azurecr.io/openstack/masakari:victoria-bionic-20211025085835 |
Apache License 2.0 |
placement |
mirantis.azurecr.io/openstack/placement:victoria-bionic-20211025085835 |
Apache License 2.0 |
keystone |
mirantis.azurecr.io/openstack/keystone:victoria-bionic-20211025085835 |
Apache License 2.0 |
heat |
mirantis.azurecr.io/openstack/heat:victoria-bionic-20211025085835 |
Apache License 2.0 |
glance |
mirantis.azurecr.io/openstack/glance:victoria-bionic-20211025085835 |
Apache License 2.0 |
cinder |
mirantis.azurecr.io/openstack/cinder:victoria-bionic-20211025085835 |
Apache License 2.0 |
neutron |
mirantis.azurecr.io/openstack/neutron:victoria-bionic-20211025085835 |
Apache License 2.0 |
nova |
mirantis.azurecr.io/openstack/nova:victoria-bionic-20211025085835 |
Apache License 2.0 |
horizon |
mirantis.azurecr.io/openstack/horizon:victoria-bionic-20211025085835 |
Apache License 2.0 |
tempest |
mirantis.azurecr.io/openstack/tempest:victoria-bionic-20211025085835 |
Apache License 2.0 |
octavia |
mirantis.azurecr.io/openstack/octavia:victoria-bionic-20211025085835 |
Apache License 2.0 |
designate |
mirantis.azurecr.io/openstack/designate:victoria-bionic-20211025085835 |
Apache License 2.0 |
ironic |
mirantis.azurecr.io/openstack/ironic:victoria-bionic-20211025085835 |
Apache License 2.0 |
barbican |
mirantis.azurecr.io/openstack/barbican:victoria-bionic-20211025085835 |
Apache License 2.0 |
libvirt |
mirantis.azurecr.io/general/libvirt:6.0.0-bionic-20211007094813 |
LGPL-2.1 License |
pause |
mirantis.azurecr.io/general/external/pause:3.1 |
Apache License 2.0 |
openvswitch |
mirantis.azurecr.io/general/openvswitch:2.11-bionic-20211007094813 |
Apache License 2.0 |
openvswitch-dpdk |
mirantis.azurecr.io/general/openvswitch-dpdk:2.11-bionic-20211007094813 |
Apache License 2.0 |
openstack-tools |
mirantis.azurecr.io/openstack/openstack-tools:ussuri-bionic-20211025060022 |
Apache License 2.0 |
rabbitmq-3.8 |
mirantis.azurecr.io/general/rabbitmq:3.8.14 |
Mozilla Public License 2.0 |
rabbitmq-3.8-management |
mirantis.azurecr.io/general/rabbitmq:3.8.14-management |
Mozilla Public License 2.0 |
kubernetes-entrypoint |
mirantis.azurecr.io/openstack/extra/kubernetes-entrypoint:v1.0.0-20200311160233 |
Apache License 2.0 |
docker |
mirantis.azurecr.io/openstack/extra/docker:17.07.0 |
Apache License 2.0 |
memcached |
mirantis.azurecr.io/general/memcached:1.6.6-alpine |
BSD 3-Clause “New” or “Revised” License |
ceph-config-helper |
mirantis.azurecr.io/openstack/extra/ceph-config-helper:nautilus-bionic-20210804080905 |
Apache License 2.0, LGPL-2.1 or LGPL-3 |
etcd |
mirantis.azurecr.io/openstack/extra/etcd:3.2.26 |
Apache License 2.0 |
powerdns |
mirantis.azurecr.io/openstack/extra/powerdns:4.2-alpine-20200117133238 |
GPL-2.0 License |
nginx-ingress-controller |
mirantis.azurecr.io/openstack/extra/nginx-ingress-controller:0.49.3 |
Apache License 2.0 |
defaultbackend |
mirantis.azurecr.io/openstack/extra/defaultbackend:1.0 |
Apache License 2.0 |
mariadb |
mirantis.azurecr.io/general/mariadb:10.4.17-bionic-20211007085158 |
GPLv2, LGPLv2.1 (client libraries) |
rabbitmq-exporter |
mirantis.azurecr.io/stacklight/rabbitmq-exporter:v1.0.0-RC8 |
MIT License |
prometheus-memcached-exporter |
mirantis.azurecr.io/stacklight/memcached-exporter:v0.9.0 |
Apache License 2.0 |
prometheus-mysql-exporter |
mirantis.azurecr.io/stacklight/mysqld-exporter:v0.11.0 |
Apache License 2.0 |
xrally-openstack |
mirantis.azurecr.io/openstack/extra/xrally-openstack:2.1.0-20211007200025 |
Apache License 2.0 |
aodh |
mirantis.azurecr.io/openstack/aodh:victoria-bionic-20211025085835 |
Apache License 2.0 |
panko |
mirantis.azurecr.io/openstack/panko:victoria-bionic-20211025085835 |
Apache License 2.0 |
ceilometer |
mirantis.azurecr.io/openstack/ceilometer:victoria-bionic-20211025085835 |
Apache License 2.0 |
gnocchi |
mirantis.azurecr.io/openstack/gnocchi:victoria-bionic-20211025085835 |
Apache License 2.0 |
redis |
mirantis.azurecr.io/openstack/extra/redis:5.0-alpine |
BSD 3-Clause “New” or “Revised” License |
frr |
mirantis.azurecr.io/general/external/docker.io/frrouting/frr:v7.5.0 |
GPL-2.0 License |
strongswan |
mirantis.azurecr.io/openstack/extra/strongswan:alpine-5.9.1-20211018180158 |
GPL License |
Component |
Path |
License information for main executable programs |
|---|---|---|
Binaries |
||
mirantis |
https://binary.mirantis.com/openstack/bin/horizon/mirantis-ussuri-48f346e-20210119132403.tar.gz |
Mirantis Proprietary License |
octavia-amphora |
https://binary.mirantis.com/openstack/bin/octavia/amphora-x64-haproxy-ussuri-20211025093130.qcow2 |
Mirantis Proprietary License |
Docker images |
||
ironic-inspector |
mirantis.azurecr.io/openstack/ironic-inspector:ussuri-bionic-20211025085835 |
Apache License 2.0 |
masakari-monitors |
mirantis.azurecr.io/openstack/masakari-monitors:ussuri-bionic-20211025085835 |
Apache License 2.0 |
masakari |
mirantis.azurecr.io/openstack/masakari:ussuri-bionic-20211025085835 |
Apache License 2.0 |
placement |
mirantis.azurecr.io/openstack/placement:ussuri-bionic-20211025085835 |
Apache License 2.0 |
redis |
mirantis.azurecr.io/openstack/extra/redis:5.0-alpine |
BSD 3-Clause “New” or “Revised” License |
gnocchi |
mirantis.azurecr.io/openstack/gnocchi:ussuri-bionic-20211025085835 |
Apache License 2.0 |
ceilometer |
mirantis.azurecr.io/openstack/ceilometer:ussuri-bionic-20211025085835 |
Apache License 2.0 |
panko |
mirantis.azurecr.io/openstack/panko:ussuri-bionic-20211025085835 |
Apache License 2.0 |
aodh |
mirantis.azurecr.io/openstack/aodh:ussuri-bionic-20211025085835 |
Apache License 2.0 |
xrally-openstack |
mirantis.azurecr.io/openstack/extra/xrally-openstack:2.1.0-20211007200025 |
Apache License 2.0 |
prometheus-mysql-exporter |
mirantis.azurecr.io/stacklight/mysqld-exporter:v0.11.0 |
Apache License 2.0 |
prometheus-memcached-exporter |
mirantis.azurecr.io/stacklight/memcached-exporter:v0.9.0 |
Apache License 2.0 |
rabbitmq-exporter |
mirantis.azurecr.io/stacklight/rabbitmq-exporter:v1.0.0-RC8 |
MIT License |
mariadb |
mirantis.azurecr.io/general/mariadb:10.4.17-bionic-20211007085158 |
GPLv2, LGPLv2.1 (client libraries) |
defaultbackend |
mirantis.azurecr.io/openstack/extra/defaultbackend:1.0 |
Apache License 2.0 |
nginx-ingress-controller |
mirantis.azurecr.io/openstack/extra/nginx-ingress-controller:0.49.3 |
Apache License 2.0 |
powerdns |
mirantis.azurecr.io/openstack/extra/powerdns:4.2-alpine-20200117133238 |
GPL-2.0 License |
etcd |
mirantis.azurecr.io/openstack/extra/etcd:3.2.26 |
Apache License 2.0 |
ceph-config-helper |
mirantis.azurecr.io/openstack/extra/ceph-config-helper:nautilus-bionic-20210804080905 |
Apache License 2.0, LGPL-2.1 or LGPL-3 |
memcached |
mirantis.azurecr.io/general/memcached:1.6.6-alpine |
BSD 3-Clause “New” or “Revised” License |
docker |
mirantis.azurecr.io/openstack/extra/docker:17.07.0 |
Apache License 2.0 |
kubernetes-entrypoint |
mirantis.azurecr.io/openstack/extra/kubernetes-entrypoint:v1.0.0-20200311160233 |
Apache License 2.0 |
rabbitmq-3.8-management |
mirantis.azurecr.io/general/rabbitmq:3.8.14-management |
Mozilla Public License 2.0 |
rabbitmq-3.8 |
mirantis.azurecr.io/general/rabbitmq:3.8.14 |
Mozilla Public License 2.0 |
openstack-tools |
mirantis.azurecr.io/openstack/openstack-tools:ussuri-bionic-20211025085835 |
Apache License 2.0 |
openvswitch-dpdk |
mirantis.azurecr.io/general/openvswitch-dpdk:2.11-bionic-20211007094813 |
Apache License 2.0 |
openvswitch |
mirantis.azurecr.io/general/openvswitch:2.11-bionic-20211007094813 |
Apache License 2.0 |
pause |
mirantis.azurecr.io/general/external/pause:3.1 |
Apache License 2.0 |
libvirt |
mirantis.azurecr.io/general/libvirt:6.0.0-bionic-20211007094813 |
LGPL-2.1 License |
barbican |
mirantis.azurecr.io/openstack/barbican:ussuri-bionic-20211025085835 |
Apache License 2.0 |
ironic |
mirantis.azurecr.io/openstack/ironic:ussuri-bionic-20211025085835 |
Apache License 2.0 |
designate |
mirantis.azurecr.io/openstack/designate:ussuri-bionic-20211025085835 |
Apache License 2.0 |
octavia |
mirantis.azurecr.io/openstack/octavia:ussuri-bionic-20211025085835 |
Apache License 2.0 |
tempest |
mirantis.azurecr.io/openstack/tempest:ussuri-bionic-20211025085835 |
Apache License 2.0 |
horizon |
mirantis.azurecr.io/openstack/horizon:ussuri-bionic-20211025085835 |
Apache License 2.0 |
nova |
mirantis.azurecr.io/openstack/nova:ussuri-bionic-20211025085835 |
Apache License 2.0 |
neutron |
mirantis.azurecr.io/openstack/neutron:ussuri-bionic-20211025085835 |
Apache License 2.0 |
cinder |
mirantis.azurecr.io/openstack/cinder:ussuri-bionic-20211025085835 |
Apache License 2.0 |
glance |
mirantis.azurecr.io/openstack/glance:ussuri-bionic-20211025085835 |
Apache License 2.0 |
heat |
mirantis.azurecr.io/openstack/heat:ussuri-bionic-20211025085835 |
Apache License 2.0 |
keystone |
mirantis.azurecr.io/openstack/keystone:ussuri-bionic-20211025085835 |
Apache License 2.0 |
frr |
mirantis.azurecr.io/general/external/docker.io/frrouting/frr:v7.5.0 |
GPL-2.0 License |
strongswan |
mirantis.azurecr.io/openstack/extra/strongswan:alpine-5.9.1-20211018180158 |
GPL License |
Component |
Path |
License information for main executable programs |
|---|---|---|
Helm charts |
||
Tungsten Fabric Operator |
https://binary.mirantis.com/tungsten/helm/tungstenfabric-operator-0.5.3.tgz |
Mirantis Proprietary License |
Docker images |
||
Tungsten Fabric Operator |
mirantis.azurecr.io/tungsten-operator/tungstenfabric-operator:0.5.3 |
Mirantis Proprietary License |
Analytics |
mirantis.azurecr.io/tungsten/contrail-analytics-api:5.1.20211021075650 |
Apache License 2.0 |
mirantis.azurecr.io/tungsten/contrail-analytics-collector:5.1.20211021075650 |
Apache License 2.0 |
|
Analytics Alarm |
mirantis.azurecr.io/tungsten/contrail-analytics-alarm-gen:5.1.20211021075650 |
Apache License 2.0 |
Analytics DB |
mirantis.azurecr.io/tungsten/contrail-analytics-query-engine:5.1.20211021075650 |
Apache License 2.0 |
Analytics SNMP |
mirantis.azurecr.io/tungsten/contrail-analytics-snmp-collector:5.1.20211021075650 |
Apache License 2.0 |
mirantis.azurecr.io/tungsten/contrail-analytics-snmp-topology:5.1.20211021075650 |
Apache License 2.0 |
|
Config |
mirantis.azurecr.io/tungsten/contrail-controller-config-api:5.1.20211021075650 |
Apache License 2.0 |
mirantis.azurecr.io/tungsten/contrail-controller-config-devicemgr:5.1.20211021075650 |
Apache License 2.0 |
|
mirantis.azurecr.io/tungsten/contrail-controller-config-schema:5.1.20211021075650 |
Apache License 2.0 |
|
mirantis.azurecr.io/tungsten/contrail-controller-config-svcmonitor:5.1.20211021075650 |
Apache License 2.0 |
|
Control |
mirantis.azurecr.io/tungsten/contrail-controller-control-control:5.1.20211021075650 |
Apache License 2.0 |
mirantis.azurecr.io/tungsten/contrail-controller-control-dns:5.1.20211021075650 |
Apache License 2.0 |
|
mirantis.azurecr.io/tungsten/contrail-controller-control-named:5.1.20211021075650 |
Apache License 2.0 |
|
Web UI |
mirantis.azurecr.io/tungsten/contrail-controller-webui-job:5.1.20211021075650 |
Apache License 2.0 |
mirantis.azurecr.io/tungsten/contrail-controller-webui-web:5.1.20211021075650 |
Apache License 2.0 |
|
Status |
mirantis.azurecr.io/tungsten/contrail-status:5.1.20211021075650 |
Apache License 2.0 |
mirantis.azurecr.io/tungsten/contrail-tf-status:5.1.20211021075650 |
Apache License 2.0 |
|
mirantis.azurecr.io/tungsten/contrail-tf-status-aggregator:5.1.20211021075650 |
Apache License 2.0 |
|
mirantis.azurecr.io/tungsten/contrail-tf-status-party:5.1.20211021075650 |
Apache License 2.0 |
|
vRouter |
mirantis.azurecr.io/tungsten/contrail-vrouter-agent:5.1.20211021075650 |
Apache License 2.0 |
mirantis.azurecr.io/tungsten/contrail-vrouter-kernel-build-init:5.1.20211021075650 |
Apache License 2.0 |
|
Nodemanager |
mirantis.azurecr.io/tungsten/contrail-nodemgr:5.1.20211021075650 |
Apache License 2.0 |
Cassandra operator |
mirantis.azurecr.io/tungsten-operator/casskop:v2.0.2-release |
Apache License 2.0 |
Cassandra |
mirantis.azurecr.io/tungsten/cassandra-bootstrap:0.1.4 |
Apache License 2.0 |
mirantis.azurecr.io/tungsten/cassandra:3.11.6 |
Apache License 2.0 |
|
NEW mirantis.azurecr.io/tungsten/cass-config-builder:1.0.4 |
Apache License 2.0 |
|
NEW mirantis.azurecr.io/tungsten/instaclustr-icarus:1.1.0 |
Apache License 2.0 |
|
Kafka operator |
mirantis.azurecr.io/tungsten-operator/kafka-k8s-operator:0.1.0 |
Mirantis Proprietary License |
Kafka |
mirantis.azurecr.io/tungsten/cp-kafka:5.5.4 |
Apache License 2.0 |
mirantis.azurecr.io/stacklight/prometheus-jmx-exporter:0.14.0-r50 |
Apache License 2.0 |
|
RabbitMQ operator |
mirantis.azurecr.io/tungsten-operator/rabbitmq-operator:0.1.5 |
Mirantis Proprietary License |
RabbitMQ |
mirantis.azurecr.io/general/rabbitmq:3.8.23 |
Mozilla Public License 2.0 |
mirantis.azurecr.io/stacklight/rabbitmq-exporter:v1.0.0-RC8 |
MIT License |
|
ZooKeeper operator |
mirantis.azurecr.io/tungsten-operator/zookeeper-operator:0.2.12 |
Apache License 2.0 |
ZooKeeper |
mirantis.azurecr.io/tungsten/zookeeper:3.6.3-0.2.13 |
Apache License 2.0 |
Redis operator |
mirantis.azurecr.io/tungsten-operator/redis-operator:0.2.2-1-8cba7b0 |
Apache License 2.0 |
Redis |
mirantis.azurecr.io/tungsten/redis:6-alpine |
BSD 3-Clause “New” or “Revised” License |
TF Test |
mirantis.azurecr.io/tungsten/tungsten-pytest:0.1-20211019145848 |
MIT License |
TF CLI |
mirantis.azurecr.io/tungsten/tf-cli:0.1-20210214191656 |
MIT License |
TF NodeInfo |
mirantis.azurecr.io/tungsten/tf-nodeinfo:0.1-20210430090010 |
MIT License |
Component |
Path |
License information for main executable programs |
|---|---|---|
Helm charts |
||
Tungsten Fabric Operator |
https://binary.mirantis.com/tungsten/helm/tungstenfabric-operator-0.4.2.tgz |
Mirantis Proprietary License |
Docker images |
||
Tungsten Fabric Operator |
mirantis.azurecr.io/tungsten-operator/tungstenfabric-operator:0.4.2 |
Mirantis Proprietary License |
Analytics |
mirantis.azurecr.io/tungsten/contrail-analytics-api:2011.20211019042938 |
Apache License 2.0 |
mirantis.azurecr.io/tungsten/contrail-analytics-collector:2011.20211019042938 |
Apache License 2.0 |
|
Analytics Alarm |
mirantis.azurecr.io/tungsten/contrail-analytics-alarm-gen:2011.20211019042938 |
Apache License 2.0 |
Analytics DB |
mirantis.azurecr.io/tungsten/contrail-analytics-query-engine:2011.20211019042938 |
Apache License 2.0 |
Analytics SNMP |
mirantis.azurecr.io/tungsten/contrail-analytics-snmp-collector:2011.20211019042938 |
Apache License 2.0 |
mirantis.azurecr.io/tungsten/contrail-analytics-snmp-topology:2011.20211019042938 |
Apache License 2.0 |
|
Config |
mirantis.azurecr.io/tungsten/contrail-controller-config-api:2011.20211019042938 |
Apache License 2.0 |
mirantis.azurecr.io/tungsten/contrail-controller-config-devicemgr:2011.20211019042938 |
Apache License 2.0 |
|
mirantis.azurecr.io/tungsten/contrail-controller-config-schema:2011.20211019042938 |
Apache License 2.0 |
|
mirantis.azurecr.io/tungsten/contrail-controller-config-svcmonitor:2011.20211019042938 |
Apache License 2.0 |
|
Control |
contrail-controller-control-control:2011.20211019042938 |
Apache License 2.0 |
mirantis.azurecr.io/tungsten/contrail-controller-control-dns:2011.20211019042938 |
Apache License 2.0 |
|
mirantis.azurecr.io/tungsten/contrail-controller-control-named:2011.20211019042938 |
Apache License 2.0 |
|
Web UI |
mirantis.azurecr.io/tungsten/contrail-controller-webui-job:2011.20211019042938 |
Apache License 2.0 |
mirantis.azurecr.io/tungsten/contrail-controller-webui-web:2011.20211019042938 |
Apache License 2.0 |
|
Status |
mirantis.azurecr.io/tungsten/contrail-status:2011.20211019042938 |
Apache License 2.0 |
mirantis.azurecr.io/tungsten/contrail-tf-status:2011.20211019042938 |
Apache License 2.0 |
|
mirantis.azurecr.io/tungsten/contrail-tf-status-aggregator:2011.20211019042938 |
Apache License 2.0 |
|
mirantis.azurecr.io/tungsten/contrail-tf-status-party:2011.20211019042938 |
Apache License 2.0 |
|
vRouter |
mirantis.azurecr.io/tungsten/contrail-vrouter-agent:2011.20211019042938 |
Apache License 2.0 |
mirantis.azurecr.io/tungsten/contrail-vrouter-kernel-build-init:2011.20211019042938 |
Apache License 2.0 |
|
Nodemanager |
mirantis.azurecr.io/tungsten/contrail-nodemgr:2011.20211019042938 |
Apache License 2.0 |
Provisioner |
mirantis.azurecr.io/tungsten/contrail-provisioner:2011.20211019042938 |
Apache License 2.0 |
Cassandra operator |
mirantis.azurecr.io/tungsten-operator/casskop:v2.0.2-release |
Apache License 2.0 |
Cassandra |
mirantis.azurecr.io/tungsten/cassandra-bootstrap:0.1.4 |
Apache License 2.0 |
mirantis.azurecr.io/tungsten/cassandra:3.11.6 |
Apache License 2.0 |
|
NEW mirantis.azurecr.io/tungsten/cass-config-builder:1.0.4 |
Apache License 2.0 |
|
NEW mirantis.azurecr.io/tungsten/instaclustr-icarus:1.1.0 |
Apache License 2.0 |
|
Kafka operator |
mirantis.azurecr.io/tungsten-operator/kafka-k8s-operator:0.1.0 |
Mirantis Proprietary License |
Kafka |
mirantis.azurecr.io/tungsten/cp-kafka:5.5.4 |
Apache License 2.0 |
mirantis.azurecr.io/stacklight/prometheus-jmx-exporter:0.14.0-r50 |
Apache License 2.0 |
|
RabbitMQ operator |
mirantis.azurecr.io/tungsten-operator/rabbitmq-operator:0.1.5 |
Mirantis Proprietary License |
RabbitMQ |
mirantis.azurecr.io/general/rabbitmq:3.8.23 |
Mozilla Public License 2.0 |
mirantis.azurecr.io/stacklight/rabbitmq-exporter:v1.0.0-RC8 |
MIT License |
|
ZooKeeper operator |
mirantis.azurecr.io/tungsten-operator/zookeeper-operator:0.2.12 |
Apache License 2.0 |
ZooKeeper |
mirantis.azurecr.io/tungsten/zookeeper:3.6.3-0.2.13 |
Apache License 2.0 |
Redis operator |
mirantis.azurecr.io/tungsten-operator/redis-operator:0.2.2-1-8cba7b0 |
Apache License 2.0 |
Redis |
mirantis.azurecr.io/tungsten/redis:6-alpine |
BSD 3-Clause “New” or “Revised” License |
TF Test |
mirantis.azurecr.io/tungsten/tungsten-pytest:0.1-20211019145848 |
MIT License |
TF CLI |
mirantis.azurecr.io/tungsten/tf-cli:0.1-20210214191656 |
MIT License |
TF NodeInfo |
mirantis.azurecr.io/tungsten/tf-nodeinfo:0.1-20210430090010 |
MIT License |
TF Tools |
mirantis.azurecr.io/tungsten/contrail-tools:2011.20211019042938 |
Apache License 2.0 |
Component |
Path |
License information for main executable programs |
|---|---|---|
Docker images |
||
prometheus-libvirt-exporter |
mirantis.azurecr.io/stacklight/libvirt-exporter:v0.1-20200610164751 |
Mirantis Proprietary License |
prometheus-tungstenfabric-exporter |
mirantis.azurecr.io/stacklight/tungstenfabric-prometheus-exporter:0.1-20210115152338 |
Mirantis Proprietary License |
Helm charts |
||
prometheus-libvirt-exporter |
https://binary.mirantis.com/stacklight/helm/prometheus-libvirt-exporter-0.1.0-mcp-2.tgz |
Mirantis Proprietary License |
prometheus-tungstenfabric-exporter |
https://binary.mirantis.com/stacklight/helm/prometheus-tungstenfabric-exporter-0.1.0-mcp-1.tgz |
Mirantis Proprietary License |
The following issues have been addressed in the Mirantis OpenStack for Kubernetes 21.6 release:
[16452][OpenStack] Fixed the issue causing failure to update the Octavia policy after policies removal from the OsDpl CR. The issue affected OpenStack Victoria.
[16103][OpenStack] Fixed the issue causing Glance client to return the
HTTPInternalServerErrorwhile operating with volume when Glance was configured with the Cinder backend TechPreview.[17321][OpenStack] Fixed the issue causing RPC errors in the logs of the
designate-centralpods during liveness probes.[17927][OpenStack] Fixed the issue causing inability to delete volume backups created from encrypted volumes.
[18029][OpenStack] Fixed the issue with live migration of instances with SR-IOV
macvtapports occasionally requiring the same virtual functions (VF) number to be free on the destination compute nodes.[18744][OpenStack] Fixed the issue with the
application_credentialauthentication method being disabled in Keystone in case of an enabled Keycloak integration.[17246][StackLight] Deprecated the redundant
openstack.externalFQDN(string) parameter and added the newexternalFQDNs.enabled(bool) parameter.
MOS 21.5 release
Release date |
Name |
Cluster release |
Highlights |
|---|---|---|---|
October 05, 2021 |
MOS 21.5 |
6.19.0+21.5 |
Update for the MOS GA release introducing the following key features:
|
Component |
Support scope |
Feature |
|---|---|---|
OpenStack |
Full |
|
TechPreview |
||
Tungsten Fabric |
Full |
|
TechPreview |
||
StackLight |
Full |
|
Full |
||
Documentation |
n/a |
|
n/a |
Implemented a machine-readable status for OpenStack deployments. Now, you can
use the OpenStackDeploymentStatus (OsDplSt) custom resource as a single
data structure that describes the OpenStackDeployment (OsDpl) status at a
particular moment.
Learn more
TechPreview
Implemented the capability to enable Cinder volume encryption through the
OpenStackDeployment CR using Barbican that will store the encryption keys
and Linux Unified Key Setup (LUKS) that will create encrypted Cinder volumes
including bootable ones. If an encrypted volume is bootable, Nova will get a
symmetric encryption key from Barbican.
Learn more
Implemented full support for Tungsten Fabric 2011. Though, Tungsten Fabric 5.1
is deployed by default in MOS 21.5, you can use the
tfVersion parameter to define the 2011 version for deployment.
Learn more
TechPreview
Implemented support for multiple workers of the contrail-api in Tungsten
Fabric. Starting from the MOS 21.5 release, six workers
of the contrail-api
service are used by default. In the previous MOS releases,
only one worker of this service was used.
Learn more
Enhanced the Grafana dashboards to display user-friendly short names for
Kubernetes nodes, for example, master-0, instead of long name labels
such as kaas-node-f736fc1c-3baa-11eb-8262-0242ac110002.
This feature provides for consistency with Kubernetes nodes naming in the
Mirantis Container Cloud web UI.
All Grafana dashboards that present node data now have an additional Node identifier drop-down menu. By default, it is set to machine to display short names for Kubernetes nodes. To display Kubernetes node name labels as previously, change this option to node.
Learn more
Implemented the following improvements to StackLight alerting:
Added the
OpenstackServiceInternalApiOutageandOpenstackServicePublicApiOutagealerts that raise in case of an OpenStack service internal or public API outage.Enhanced the alert inhibition rules.
Reworked a number of alerts to improve alerting efficiency and reduce alert flooding.
Removed the inefficient
OpenstackServiceApiDownandOpenstackServiceApiOutagealerts.
Learn more
Published MOS Release Compatibility Matrix that describes the cloud configurations that have been supported by the product over the course of its lifetime and the path a MOS cloud can take to move from an older configuration to a newer one.
Learn more
Published the OpenStack Ussuri to Victoria upgrade procedure and Tungsten Fabric 5.1 to 2011 upgrade procedure that instruct cloud operators on how to prepare for the upgrade, use the MOS life cycle management API to perform the upgrade, and verify the cloud operability after the upgrade.
Learn more
Mirantis has tested MOS against a very specific configuration and can guarantee a predictable behavior of the product onlyin the exact same environments. The table below includes the major MOS components with the exact versions against which testing has been performed.
This section describes the MOS known issues with available workarounds. For the known issues in the related version of Mirantis Container Cloud, refer to Mirantis Container Cloud: Release Notes.
This section lists the Tungsten Fabric known issues with workarounds for the Mirantis OpenStack for Kubernetes release 21.5.
[10096] tf-control does not refresh IP addresses of Cassandra pods
[13755] TF pods switch to CrashLoopBackOff after a simultaneous reboot
[15684] Pods fail when rolling Tungsten Fabric 2011 back to 5.1
[18148] TF resets BGP_ASN, ENCAP_PRIORITY, and VXLAN_VN_ID_MODE to defaults
Tungsten Fabric does not provide the following functionality:
Automatic generation of network port records in DNSaaS (Designate) as Neutron with Tungsten Fabric as a backend is not integrated with DNSaaS. As a workaround, you can use the Tungsten Fabric built-in DNS service that enables virtual machines to resolve each other names.
Secret management (Barbican). You cannot use the certificates stored in Barbican to terminate HTTPs in a load balancer.
Role Based Access Control (RBAC) for Neutron objects.
Modification of custom vRouter DaemonSets based on the SR-IOV definition in the
OsDplCR.
The tf-control service resolves the DNS names of Cassandra pods at startup
and does not update them if Cassandra pods got new IP addresses, for example,
in case of a restart. As a workaround, to refresh the IP addresses of
Cassandra pods, restart the tf-control pods one by one:
Caution
Before restarting the tf-control pods:
Verify that the new pods are successfully spawned.
Verify that no vRouters are connected to only one
tf-controlpod that will be restarted.
kubectl -n tf delete pod tf-control-<hash>
Rebooting all Cassandra cluster TFConfig or TFAnalytics nodes, maintenance, or other circumstances that cause the Cassandra pods to start simultaneously may cause a broken Cassandra TFConfig and/or TFAnalytics cluster. In this case, Cassandra nodes do not join the ring and do not update the IPs of the neighbor nodes. As a result, the TF services cannot operate Cassandra cluster(s).
To verify that a Cassandra cluster is affected:
Run the nodetool status command specifying the config or
analytics cluster and the replica number:
kubectl -n tf exec -it tf-cassandra-<config/analytics>-dc1-rack1-<replica number> -c cassandra -- nodetool status
Example of system response with outdated IP addresses:
Datacenter: DC1
===============
Status=Up/Down
|/ State=Normal/Leaving/Joining/Moving
-- Address Load Tokens Owns (effective) Host ID Rack
DN <outdated ip> ? 256 64.9% a58343d0-1e3f-4d54-bcdf-9b9b949ca873 r1
DN <outdated ip> ? 256 69.8% 67f1d07c-8b13-4482-a2f1-77fa34e90d48 r1
Datacenter: dc1
===============
Status=Up/Down
|/ State=Normal/Leaving/Joining/Moving
-- Address Load Tokens Owns (effective) Host ID Rack
UN <actual ip> 3.84 GiB 256 65.2% 7324ebc4-577a-425f-b3de-96faac95a331 rack1
Workaround:
Manually delete a Cassandra pod from the failed config or analytics
cluster to re-initiate the bootstrap process for one of the Cassandra nodes:
kubectl -n tf delete pod tf-cassandra-<config/analytics>-dc1-rack1-<replica number>
Some tf-control and tf-analytics pods may fail during the Tungsten
Fabric rollback from version 2011 to 5.1. In this case, the control
container from the tf-control pod and/or the collector container from
the tf-analytics pod contain SYS_WARN messages such as
… AMQP_QUEUE_DELETE_METHOD caused: PRECONDITION_FAILED - queue
‘<contrail-control/contrail-collector>.<nodename>’ in vhost ‘/’ not empty ….
The workaround is to manually delete the queue that fails to be deleted by
AMQP_QUEUE_DELETE_METHOD:
kubectl -n tf exec -it tf-rabbitmq-<num of replica> -- rabbitmqctl delete_queue <queue name>
During LCM operations such as Tungsten Fabric update or upgrade, the following
parameters defined by the cluster administrator are reset to the following
defaults upon the tf-config pod restart:
BGP_ASNto64512ENCAP_PRIORITYtoMPLSoUDP,MPLSoGRE,VXLANVXLAN_VN_ID_MODEtoautomatic
As a workaround, manually set up values for the required parameters if they differ from the defaults:
controllers:
tf-config:
provisioner:
containers:
- env:
- name: BGP_ASN
value: <USER_BGP_ASN_VALUE>
- name: ENCAP_PRIORITY
value: <USER_ENCAP_PRIORITY_VALUE>
name: provisioner
This section lists the OpenStack known issues with workarounds for the Mirantis OpenStack for Kubernetes release 21.5.
[6912] Octavia load balancers may not work properly with DVR
[16495] Failure to reschedule OpenStack deployment pods after a node recovery
[16452] Failure to update the Octavia policy after policies removal
[19065] Octavia load balancers lose Amphora VMs after failover
Limitation
When Neutron is deployed in the DVR mode, Octavia load balancers may not work correctly. The symptoms include both failure to properly balance traffic and failure to perform an amphora failover. For details, see DVR incompatibility with ARP announcements and VRRP.
Kubernetes does not reschedule OpenStack deployment pods after a node recovery.
As a workaround, delete all pods of the deployment:
for i in $(kubectl -n openstack get deployments |grep -v NAME | awk '{print $1}');
do
kubectl -n openstack rollout restart deployment/$i;
done
Once done, the pods will respawn automatically.
The Octavia policy fails to be updated after policies removal from the OsDpl CR. The issue affects OpenStack Victoria.
As a workaround, restart the Octavia API pods:
kubectl -n openstack delete pod -l application=octavia,component=api
When Glance is configured with the Cinder backend TechPreview, the
Glance client may return the HTTPInternalServerError error while operating
with volume. In this case, repeat the action again until it succeeds.
If an Amphora VM does not respond or responds too long to heartbeat requests, the Octavia load balancer automatically initiates a failover process after 60 seconds of unsuccessful attempts. Long responses of an Amphora VM may be caused by various events, such as a high load on the OpenStack compute node that hosts the Amphora VM, network issues, system service updates, and so on. After a failover, the Amphora VMs may be missing in the completed Octavia load balancer.
Workaround:
If your deployment is already affected, manually restore the work of the load balancer by recreating the Amphora VM:
Define the load balancer ID:
openstack loadbalancer amphora list --column loadbalancer_id --format value --status ERROR
Start the load balancer failover:
openstack loadbalancer failover <Load balancer ID>
To avoid an automatic failover start that may cause the issue, set the
heartbeat_timeoutparameter in theOpenStackDeploymentCR to a large value in seconds. The default is 60 seconds. For example:spec: services: load-balancer: octavia: values: conf: octavia: health_manager: heartbeat_timeout: 31536000
This section lists the cluster update known issues with workarounds for the Mirantis OpenStack for Kubernetes release 21.5.
A MOS cluster may fail to update to the latest Cluster release with kubelet being stuck and reporting authorization errors.
The cluster is affected by the issue if you see the Failed to make webhook authorizer request: context canceled error in the kubelet logs:
docker logs ucp-kubelet --since 5m 2>&1 | grep 'Failed to make webhook authorizer request: context canceled'
As a workaround, restart the ucp-kubelet container on the affected
node(s):
ctr -n com.docker.ucp snapshot rm ucp-kubelet
docker rm -f ucp-kubelet
Note
Ignore failures in the output of the first command, if any.
An update of a MOS cluster may fail with the ceph csi-driver is not evacuated yet, waiting… error during the Ceph CSI pod eviction.
Workaround:
Scale the affected
StatefulSetof the pod that fails to init down to0replicas. If it is theDaemonSetsuch asnova-compute, it must not be scheduled on the affected node.On every
csi-rbdpluginpod, search for stuckcsi-vol:rbd device list | grep <csi-vol-uuid>
Unmap the affected
csi-vol:rbd unmap -o force /dev/rbd<i>
Delete
volumeattachmentof the affected pod:kubectl get volumeattachments | grep <csi-vol-uuid> kubectl delete volumeattacmhent <id>
Scale the affected
StatefulSetback to the original number of replicas or until its state isRunning. If it is aDaemonSet, run the pod on the affected node again.
This section lists Ceph known issues with workarounds for the Mirantis OpenStack for Kubernetes release 21.5.
During deployment of a Ceph cluster, the RADOS Gateway (RGW) pod overrides
the global CA bundle located at /etc/pki/tls/certs with an incorrect
self-signed CA bundle. The issue affects only clusters with public
certificates.
Workaround:
Open the
KaasCephClusterCR of a managed cluster for editing:kubectl edit kaascephcluster -n <managedClusterProjectName>
Substitute
<managedClusterProjectName>with a corresponding value.Note
If the public CA certificates also apply to the
OsDplCR, edit this resource as well.Select from the following options:
If you are using the GoDaddy certificates, in the
cephClusterSpec.objectStorage.rgwsection, replace thecacertparameters with your public CA certificate that already contains both the root CA certificate and intermediate CA certificate:cephClusterSpec: objectStorage: rgw: SSLCert: cacert: | -----BEGIN CERTIFICATE----- ca-certificate here -----END CERTIFICATE----- tlsCert: | -----BEGIN CERTIFICATE----- private TLS certificate here -----END CERTIFICATE----- tlsKey: | -----BEGIN RSA PRIVATE KEY----- private TLS key here -----END RSA PRIVATE KEY-----
If you are using the DigiCert certificates:
Download the
<root_CA>from DigiCert.In the
cephClusterSpec.objectStorage.rgwsection, replace thecacertparameters with your public intermediate CA certificate along with the root one:cephClusterSpec: objectStorage: rgw: SSLCert: cacert: | -----BEGIN CERTIFICATE----- <root CA here> <intermediate CA here> -----END CERTIFICATE----- tlsCert: | -----BEGIN CERTIFICATE----- private TLS certificate here -----END CERTIFICATE----- tlsKey: | -----BEGIN RSA PRIVATE KEY----- private TLS key here -----END RSA PRIVATE KEY-----
This section lists the components artifacts of the MOS 21.5 release:
Component |
Path |
License information for main executable programs |
|---|---|---|
Binaries |
||
mirantis |
https://binary.mirantis.com/openstack/bin/horizon/mirantis-victoria-8f71802-20210119120707.tar.gz |
Mirantis Proprietary License |
octavia-amphora |
https://binary.mirantis.com/openstack/bin/octavia/amphora-x64-haproxy-victoria-20210819064238.qcow2 |
Mirantis Proprietary License |
Docker images |
||
ironic-inspector |
mirantis.azurecr.io/openstack/ironic-inspector:victoria-bionic-20210913060022 |
Apache License 2.0 |
masakari-monitors |
mirantis.azurecr.io/openstack/masakari-monitors:victoria-bionic-20210913060022 |
Apache License 2.0 |
masakari |
mirantis.azurecr.io/openstack/masakari:victoria-bionic-20210913060022 |
Apache License 2.0 |
stepler |
mirantis.azurecr.io/openstack/stepler:victoria-bionic-20210909120529 |
Mirantis Proprietary License |
placement |
mirantis.azurecr.io/openstack/placement:victoria-bionic-20210913060022 |
Apache License 2.0 |
keystone |
mirantis.azurecr.io/openstack/keystone:victoria-bionic-20210913060022 |
Apache License 2.0 |
heat |
mirantis.azurecr.io/openstack/heat:victoria-bionic-20210913060022 |
Apache License 2.0 |
glance |
mirantis.azurecr.io/openstack/glance:victoria-bionic-20210913060022 |
Apache License 2.0 |
cinder |
mirantis.azurecr.io/openstack/cinder:victoria-bionic-20210913060022 |
Apache License 2.0 |
neutron |
mirantis.azurecr.io/openstack/neutron:victoria-bionic-20210913060022 |
Apache License 2.0 |
nova |
mirantis.azurecr.io/openstack/nova:victoria-bionic-20210913060022 |
Apache License 2.0 |
horizon |
mirantis.azurecr.io/openstack/horizon:victoria-bionic-20210913060022 |
Apache License 2.0 |
tempest |
mirantis.azurecr.io/openstack/tempest:victoria-bionic-20210913060022 |
Apache License 2.0 |
octavia |
mirantis.azurecr.io/openstack/octavia:victoria-bionic-20210913060022 |
Apache License 2.0 |
designate |
mirantis.azurecr.io/openstack/designate:victoria-bionic-20210913060022 |
Apache License 2.0 |
ironic |
mirantis.azurecr.io/openstack/ironic:victoria-bionic-20210913060022 |
Apache License 2.0 |
barbican |
mirantis.azurecr.io/openstack/barbican:victoria-bionic-20210913060022 |
Apache License 2.0 |
libvirt |
mirantis.azurecr.io/general/libvirt:6.0.0-bionic-20210617094817 |
LGPL-2.1 License |
pause |
mirantis.azurecr.io/general/external/pause:3.1 |
Apache License 2.0 |
openvswitch |
mirantis.azurecr.io/general/openvswitch:2.11-bionic-20210617094817 |
Apache License 2.0 |
openvswitch-dpdk |
mirantis.azurecr.io/general/openvswitch-dpdk:2.11-bionic-20210617094817 |
Apache License 2.0 |
openstack-tools |
mirantis.azurecr.io/openstack/openstack-tools:ussuri-bionic-20210913060022 |
Apache License 2.0 |
rabbitmq-3.8 |
mirantis.azurecr.io/general/rabbitmq:3.8.14 |
Mozilla Public License 2.0 |
rabbitmq-3.8-management |
mirantis.azurecr.io/general/rabbitmq:3.8.14-management |
Mozilla Public License 2.0 |
kubernetes-entrypoint |
mirantis.azurecr.io/openstack/extra/kubernetes-entrypoint:v1.0.0-20200311160233 |
Apache License 2.0 |
docker |
mirantis.azurecr.io/openstack/extra/docker:17.07.0 |
Apache License 2.0 |
memcached |
mirantis.azurecr.io/general/memcached:1.6.6-alpine |
BSD 3-Clause “New” or “Revised” License |
ceph-config-helper |
mirantis.azurecr.io/openstack/extra/ceph-config-helper:nautilus-bionic-20210804080905 |
Apache License 2.0, LGPL-2.1 or LGPL-3 |
etcd |
mirantis.azurecr.io/openstack/extra/etcd:3.2.26 |
Apache License 2.0 |
powerdns |
mirantis.azurecr.io/openstack/extra/powerdns:4.2-alpine-20200117133238 |
GPL-2.0 License |
nginx-ingress-controller |
mirantis.azurecr.io/openstack/extra/nginx-ingress-controller:0.49.0 |
Apache License 2.0 |
defaultbackend |
mirantis.azurecr.io/openstack/extra/defaultbackend:1.0 |
Apache License 2.0 |
mariadb |
mirantis.azurecr.io/general/mariadb:10.4.17-bionic-20210617085111 |
GPLv2, LGPLv2.1 (client libraries) |
rabbitmq-exporter |
mirantis.azurecr.io/stacklight/rabbitmq-exporter:v1.0.0-RC8 |
MIT License |
prometheus-memcached-exporter |
mirantis.azurecr.io/stacklight/memcached-exporter:v0.5.0 |
Apache License 2.0 |
prometheus-mysql-exporter |
mirantis.azurecr.io/stacklight/mysqld-exporter:v0.11.0 |
Apache License 2.0 |
xrally-openstack |
mirantis.azurecr.io/openstack/extra/xrally-openstack:2.1.0-20210830173823 |
Apache License 2.0 |
aodh |
mirantis.azurecr.io/openstack/aodh:victoria-bionic-20210913060022 |
Apache License 2.0 |
panko |
mirantis.azurecr.io/openstack/panko:victoria-bionic-20210913060022 |
Apache License 2.0 |
ceilometer |
mirantis.azurecr.io/openstack/ceilometer:victoria-bionic-20210913060022 |
Apache License 2.0 |
gnocchi |
mirantis.azurecr.io/openstack/gnocchi:victoria-bionic-20210913060022 |
Apache License 2.0 |
redis |
mirantis.azurecr.io/openstack/extra/redis:5.0-alpine |
BSD 3-Clause “New” or “Revised” License |
frr |
mirantis.azurecr.io/general/external/docker.io/frrouting/frr:v7.5.0 |
GPL-2.0 License |
strongswan |
mirantis.azurecr.io/openstack/extra/strongswan:alpine-5.9.1-20210511072313 |
GPL License |
Component |
Path |
License information for main executable programs |
|---|---|---|
Binaries |
||
mirantis |
https://binary.mirantis.com/openstack/bin/horizon/mirantis-ussuri-48f346e-20210119132403.tar.gz |
Mirantis Proprietary License |
octavia-amphora |
https://binary.mirantis.com/openstack/bin/octavia/amphora-x64-haproxy-ussuri-20210121085750.qcow2 |
Mirantis Proprietary License |
Docker images |
||
ironic-inspector |
mirantis.azurecr.io/openstack/ironic-inspector:ussuri-bionic-20210910182329 |
Apache License 2.0 |
masakari-monitors |
mirantis.azurecr.io/openstack/masakari-monitors:ussuri-bionic-20210910182329 |
Apache License 2.0 |
masakari |
mirantis.azurecr.io/openstack/masakari:ussuri-bionic-20210910182329 |
Apache License 2.0 |
stepler |
mirantis.azurecr.io/openstack/stepler:ussuri-bionic-20210909094910 |
Mirantis Proprietary License |
placement |
mirantis.azurecr.io/openstack/placement:ussuri-bionic-20210910182329 |
Apache License 2.0 |
redis |
mirantis.azurecr.io/openstack/extra/redis:5.0-alpine |
BSD 3-Clause “New” or “Revised” License |
gnocchi |
mirantis.azurecr.io/openstack/gnocchi:ussuri-bionic-20210910182329 |
Apache License 2.0 |
ceilometer |
mirantis.azurecr.io/openstack/ceilometer:ussuri-bionic-20210910182329 |
Apache License 2.0 |
panko |
mirantis.azurecr.io/openstack/panko:ussuri-bionic-20210910182329 |
Apache License 2.0 |
aodh |
mirantis.azurecr.io/openstack/aodh:ussuri-bionic-20210910182329 |
Apache License 2.0 |
xrally-openstack |
mirantis.azurecr.io/openstack/extra/xrally-openstack:2.1.0-20210830173823 |
Apache License 2.0 |
prometheus-mysql-exporter |
mirantis.azurecr.io/stacklight/mysqld-exporter:v0.11.0 |
Apache License 2.0 |
prometheus-memcached-exporter |
mirantis.azurecr.io/stacklight/memcached-exporter:v0.5.0 |
Apache License 2.0 |
rabbitmq-exporter |
mirantis.azurecr.io/stacklight/rabbitmq-exporter:v1.0.0-RC8 |
MIT License |
mariadb |
mirantis.azurecr.io/general/mariadb:10.4.17-bionic-20210617085111 |
GPLv2, LGPLv2.1 (client libraries) |
defaultbackend |
mirantis.azurecr.io/openstack/extra/defaultbackend:1.0 |
Apache License 2.0 |
nginx-ingress-controller |
mirantis.azurecr.io/openstack/extra/nginx-ingress-controller:0.49.0 |
Apache License 2.0 |
powerdns |
mirantis.azurecr.io/openstack/extra/powerdns:4.2-alpine-20200117133238 |
GPL-2.0 License |
etcd |
mirantis.azurecr.io/openstack/extra/etcd:3.2.26 |
Apache License 2.0 |
ceph-config-helper |
mirantis.azurecr.io/openstack/extra/ceph-config-helper:nautilus-bionic-20210804080905 |
Apache License 2.0, LGPL-2.1 or LGPL-3 |
memcached |
mirantis.azurecr.io/general/memcached:1.6.6-alpine |
BSD 3-Clause “New” or “Revised” License |
docker |
mirantis.azurecr.io/openstack/extra/docker:17.07.0 |
Apache License 2.0 |
kubernetes-entrypoint |
mirantis.azurecr.io/openstack/extra/kubernetes-entrypoint:v1.0.0-20200311160233 |
Apache License 2.0 |
rabbitmq-3.8-management |
mirantis.azurecr.io/general/rabbitmq:3.8.14-management |
Mozilla Public License 2.0 |
rabbitmq-3.8 |
mirantis.azurecr.io/general/rabbitmq:3.8.14 |
Mozilla Public License 2.0 |
openstack-tools |
mirantis.azurecr.io/openstack/openstack-tools:ussuri-bionic-20210910182329 |
Apache License 2.0 |
openvswitch-dpdk |
mirantis.azurecr.io/general/openvswitch-dpdk:2.11-bionic-20210617094817 |
Apache License 2.0 |
openvswitch |
mirantis.azurecr.io/general/openvswitch:2.11-bionic-20210617094817 |
Apache License 2.0 |
pause |
mirantis.azurecr.io/general/external/pause:3.1 |
Apache License 2.0 |
libvirt |
mirantis.azurecr.io/general/libvirt:6.0.0-bionic-20210617094817 |
LGPL-2.1 License |
barbican |
mirantis.azurecr.io/openstack/barbican:ussuri-bionic-20210910182329 |
Apache License 2.0 |
ironic |
mirantis.azurecr.io/openstack/ironic:ussuri-bionic-20210910182329 |
Apache License 2.0 |
designate |
mirantis.azurecr.io/openstack/designate:ussuri-bionic-20210910182329 |
Apache License 2.0 |
octavia |
mirantis.azurecr.io/openstack/octavia:ussuri-bionic-20210910182329 |
Apache License 2.0 |
tempest |
mirantis.azurecr.io/openstack/tempest:ussuri-bionic-20210910182329 |
Apache License 2.0 |
horizon |
mirantis.azurecr.io/openstack/horizon:ussuri-bionic-20210910182329 |
Apache License 2.0 |
nova |
mirantis.azurecr.io/openstack/nova:ussuri-bionic-20210910182329 |
Apache License 2.0 |
neutron |
mirantis.azurecr.io/openstack/neutron:ussuri-bionic-20210910182329 |
Apache License 2.0 |
cinder |
mirantis.azurecr.io/openstack/cinder:ussuri-bionic-20210910182329 |
Apache License 2.0 |
glance |
mirantis.azurecr.io/openstack/glance:ussuri-bionic-20210910182329 |
Apache License 2.0 |
heat |
mirantis.azurecr.io/openstack/heat:ussuri-bionic-20210910182329 |
Apache License 2.0 |
keystone |
mirantis.azurecr.io/openstack/keystone:ussuri-bionic-20210910182329 |
Apache License 2.0 |
frr |
mirantis.azurecr.io/general/external/docker.io/frrouting/frr:v7.5.0 |
GPL-2.0 License |
strongswan |
mirantis.azurecr.io/openstack/extra/strongswan:alpine-5.9.1-20210511072313 |
GPL License |
Component |
Path |
License information for main executable programs |
|---|---|---|
Helm charts |
||
Tungsten Fabric Operator |
https://binary.mirantis.com/tungsten/helm/tungstenfabric-operator-0.4.2.tgz |
Mirantis Proprietary License |
Docker images |
||
Tungsten Fabric Operator |
mirantis.azurecr.io/tungsten-operator/tungstenfabric-operator:0.4.2 |
Mirantis Proprietary License |
Analytics |
mirantis.azurecr.io/tungsten/contrail-analytics-api:5.1.20210826171459 |
Apache License 2.0 |
mirantis.azurecr.io/tungsten/contrail-analytics-collector:5.1.20210826171459 |
Apache License 2.0 |
|
Analytics Alarm |
mirantis.azurecr.io/tungsten/contrail-analytics-alarm-gen:5.1.20210826171459 |
Apache License 2.0 |
Analytics DB |
mirantis.azurecr.io/tungsten/contrail-analytics-query-engine:5.1.20210826171459 |
Apache License 2.0 |
Analytics SNMP |
mirantis.azurecr.io/tungsten/contrail-analytics-snmp-collector:5.1.20210826171459 |
Apache License 2.0 |
mirantis.azurecr.io/tungsten/contrail-analytics-snmp-topology:5.1.20210826171459 |
Apache License 2.0 |
|
Config |
mirantis.azurecr.io/tungsten/contrail-controller-config-api:5.1.20210826171459 |
Apache License 2.0 |
mirantis.azurecr.io/tungsten/contrail-controller-config-devicemgr:5.1.20210826171459 |
Apache License 2.0 |
|
mirantis.azurecr.io/tungsten/contrail-controller-config-schema:5.1.20210826171459 |
Apache License 2.0 |
|
mirantis.azurecr.io/tungsten/contrail-controller-config-svcmonitor:5.1.20210826171459 |
Apache License 2.0 |
|
Control |
mirantis.azurecr.io/tungsten/contrail-controller-control-control:5.1.20210826171459 |
Apache License 2.0 |
mirantis.azurecr.io/tungsten/contrail-controller-control-dns:5.1.20210826171459 |
Apache License 2.0 |
|
mirantis.azurecr.io/tungsten/contrail-controller-control-named:5.1.20210826171459 |
Apache License 2.0 |
|
Web UI |
mirantis.azurecr.io/tungsten/contrail-controller-webui-job:5.1.20210826171459 |
Apache License 2.0 |
mirantis.azurecr.io/tungsten/contrail-controller-webui-web:5.1.20210826171459 |
Apache License 2.0 |
|
Status |
mirantis.azurecr.io/tungsten/contrail-status:5.1.20210826171459 |
Apache License 2.0 |
mirantis.azurecr.io/tungsten/contrail-tf-status:5.1.20210826171459 |
Apache License 2.0 |
|
mirantis.azurecr.io/tungsten/contrail-tf-status-aggregator:5.1.20210826171459 |
Apache License 2.0 |
|
mirantis.azurecr.io/tungsten/contrail-tf-status-party:5.1.20210826171459 |
Apache License 2.0 |
|
vRouter |
mirantis.azurecr.io/tungsten/contrail-vrouter-agent:5.1.20210826171459 |
Apache License 2.0 |
mirantis.azurecr.io/tungsten/contrail-vrouter-kernel-build-init:5.1.20210826171459 |
Apache License 2.0 |
|
Nodemanager |
mirantis.azurecr.io/tungsten/contrail-nodemgr:5.1.20210826171459 |
Apache License 2.0 |
Cassandra operator |
mirantis.azurecr.io/tungsten-operator/casskop:v0.5.3-release |
Apache License 2.0 |
Cassandra |
mirantis.azurecr.io/tungsten/cassandra-bootstrap:0.1.4 |
Apache License 2.0 |
mirantis.azurecr.io/tungsten/cassandra:3.11.6 |
Apache License 2.0 |
|
Kafka operator |
mirantis.azurecr.io/tungsten-operator/kafka-k8s-operator:0.0.9 |
Mirantis Proprietary License |
Kafka |
mirantis.azurecr.io/tungsten/cp-kafka:5.5.4 |
Apache License 2.0 |
RabbitMQ operator |
mirantis.azurecr.io/tungsten-operator/rabbitmq-operator:0.1.4 |
Mirantis Proprietary License |
RabbitMQ |
mirantis.azurecr.io/general/rabbitmq:3.8.14 |
Mozilla Public License 2.0 |
ZooKeeper operator |
mirantis.azurecr.io/tungsten-operator/zookeeper-operator:0.2.10 |
Apache License 2.0 |
ZooKeeper |
mirantis.azurecr.io/tungsten/zookeeper:3.6.1-0.2.9 |
Apache License 2.0 |
Redis operator |
mirantis.azurecr.io/tungsten-operator/redis-operator:0.1.5-1-ccd6a63 |
Apache License 2.0 |
Redis |
mirantis.azurecr.io/tungsten/redis:5-alpine |
BSD 3-Clause “New” or “Revised” License |
TF Test |
mirantis.azurecr.io/tungsten/tungsten-pytest:0.1-20210428100236 |
MIT License |
TF CLI |
mirantis.azurecr.io/tungsten/tf-cli:0.1-20210214191656 |
MIT License |
TF NodeInfo |
mirantis.azurecr.io/tungsten/tf-nodeinfo:0.1-20210430090010 |
MIT License |
Component |
Path |
License information for main executable programs |
|---|---|---|
Helm charts |
||
Tungsten Fabric Operator |
https://binary.mirantis.com/tungsten/helm/tungstenfabric-operator-0.4.2.tgz |
Mirantis Proprietary License |
Docker images |
||
Tungsten Fabric Operator |
mirantis.azurecr.io/tungsten-operator/tungstenfabric-operator:0.4.2 |
Mirantis Proprietary License |
Analytics |
mirantis.azurecr.io/tungsten/contrail-analytics-api:2011.20210906142040 |
Apache License 2.0 |
mirantis.azurecr.io/tungsten/contrail-analytics-collector:2011.20210906142040 |
Apache License 2.0 |
|
Analytics Alarm |
mirantis.azurecr.io/tungsten/contrail-analytics-alarm-gen:2011.20210906142040 |
Apache License 2.0 |
Analytics DB |
mirantis.azurecr.io/tungsten/contrail-analytics-query-engine:2011.20210906142040 |
Apache License 2.0 |
Analytics SNMP |
mirantis.azurecr.io/tungsten/contrail-analytics-snmp-collector:2011.20210906142040 |
Apache License 2.0 |
mirantis.azurecr.io/tungsten/contrail-analytics-snmp-topology:2011.20210906142040 |
Apache License 2.0 |
|
Config |
mirantis.azurecr.io/tungsten/contrail-controller-config-api:2011.20210906142040 |
Apache License 2.0 |
mirantis.azurecr.io/tungsten/contrail-controller-config-devicemgr:2011.20210906142040 |
Apache License 2.0 |
|
mirantis.azurecr.io/tungsten/contrail-controller-config-schema:2011.20210906142040 |
Apache License 2.0 |
|
mirantis.azurecr.io/tungsten/contrail-controller-config-svcmonitor:2011.20210906142040 |
Apache License 2.0 |
|
Control |
contrail-controller-control-control:2011.20210906142040 |
Apache License 2.0 |
mirantis.azurecr.io/tungsten/contrail-controller-control-dns:2011.20210906142040 |
Apache License 2.0 |
|
mirantis.azurecr.io/tungsten/contrail-controller-control-named:2011.20210906142040 |
Apache License 2.0 |
|
Web UI |
mirantis.azurecr.io/tungsten/contrail-controller-webui-job:2011.20210906142040 |
Apache License 2.0 |
mirantis.azurecr.io/tungsten/contrail-controller-webui-web:2011.20210906142040 |
Apache License 2.0 |
|
Status |
mirantis.azurecr.io/tungsten/contrail-status:2011.20210906142040 |
Apache License 2.0 |
mirantis.azurecr.io/tungsten/contrail-tf-status:2011.20210906142040 |
Apache License 2.0 |
|
mirantis.azurecr.io/tungsten/contrail-tf-status-aggregator:2011.20210906142040 |
Apache License 2.0 |
|
mirantis.azurecr.io/tungsten/contrail-tf-status-party:2011.20210906142040 |
Apache License 2.0 |
|
vRouter |
mirantis.azurecr.io/tungsten/contrail-vrouter-agent:2011.20210906142040 |
Apache License 2.0 |
mirantis.azurecr.io/tungsten/contrail-vrouter-kernel-build-init:2011.20210906142040 |
Apache License 2.0 |
|
Nodemanager |
mirantis.azurecr.io/tungsten/contrail-nodemgr:2011.20210906142040 |
Apache License 2.0 |
Provisioner |
mirantis.azurecr.io/tungsten/contrail-provisioner:2011.20210906142040 |
Apache License 2.0 |
Cassandra operator |
mirantis.azurecr.io/tungsten-operator/casskop:v0.5.3-release |
Apache License 2.0 |
Cassandra |
mirantis.azurecr.io/tungsten/cassandra-bootstrap:0.1.4 |
Apache License 2.0 |
mirantis.azurecr.io/tungsten/cassandra:3.11.6 |
Apache License 2.0 |
|
Kafka operator |
mirantis.azurecr.io/tungsten-operator/kafka-k8s-operator:0.0.9 |
Mirantis Proprietary License |
Kafka |
mirantis.azurecr.io/tungsten/cp-kafka:5.5.4 |
Apache License 2.0 |
RabbitMQ operator |
mirantis.azurecr.io/tungsten-operator/rabbitmq-operator:0.1.4 |
Mirantis Proprietary License |
RabbitMQ |
mirantis.azurecr.io/general/rabbitmq:3.8.14 |
Mozilla Public License 2.0 |
ZooKeeper operator |
mirantis.azurecr.io/tungsten-operator/zookeeper-operator:0.2.10 |
Apache License 2.0 |
ZooKeeper |
mirantis.azurecr.io/tungsten/zookeeper:3.6.1-0.2.9 |
Apache License 2.0 |
Redis operator |
mirantis.azurecr.io/tungsten-operator/redis-operator:0.1.5-1-ccd6a63 |
Apache License 2.0 |
Redis |
mirantis.azurecr.io/tungsten/redis:5-alpine |
BSD 3-Clause “New” or “Revised” License |
TF Test |
mirantis.azurecr.io/tungsten/tungsten-pytest:0.1-20210428100236 |
MIT License |
TF CLI |
mirantis.azurecr.io/tungsten/tf-cli:0.1-20210214191656 |
MIT License |
TF NodeInfo |
mirantis.azurecr.io/tungsten/tf-nodeinfo:0.1-20210430090010 |
MIT License |
TF Tools |
mirantis.azurecr.io/tungsten/contrail-tools:2011.20210906142040 |
Apache License 2.0 |
Component |
Path |
License information for main executable programs |
|---|---|---|
Docker images |
||
prometheus-libvirt-exporter |
mirantis.azurecr.io/stacklight/libvirt-exporter:v0.1-20200610164751 |
Mirantis Proprietary License |
prometheus-tungstenfabric-exporter |
mirantis.azurecr.io/stacklight/tungstenfabric-prometheus-exporter:0.1-20210115152338 |
Mirantis Proprietary License |
Helm charts |
||
prometheus-libvirt-exporter |
https://binary.mirantis.com/stacklight/helm/prometheus-libvirt-exporter-0.1.0-mcp-2.tgz |
Mirantis Proprietary License |
prometheus-tungstenfabric-exporter |
https://binary.mirantis.com/stacklight/helm/prometheus-tungstenfabric-exporter-0.1.0-mcp-1.tgz |
Mirantis Proprietary License |
The following issues have been addressed in the Mirantis OpenStack for Kubernetes 21.5 release:
[17115][Update] Fixed the issue with the
status.providerStatus.releaseRefs.previous.namefield in the Cluster object for Ceph not changing during the MOS cluster update. If you have previously applied the workaround as described in [17115] Cluster update does not change releaseRefs in Cluster object for Ceph, manually add thesubresourcessection back to theclusterworkloadlockCRD:kubectl edit crd clusterworkloadlocks.lcm.mirantis.com # add here 'subresources' section: spec: versions: - name: v1alpha1 subresources: status: {}
[17477][Update] Fixed the issue with StackLight in HA mode placed on controller nodes being not deployed or cluster update being blocked. Once you update your MOS cluster from the Cluster release 6.18.0 to 6.19.0, roll back the workaround applied as described in [17477] StackLight in HA mode is not deployed or cluster update is blocked:
Remove
stacklightlabels from worker nodes. Wait for the labels to be removed.Remove the custom
nodeSelectorsection from the cluster spec.
[16103][OpenStack] Fixed the issue with the Glance client returning the
HTTPInternalServerErrorerror while operating with a volume if Glance was configured with the Cinder backend TechPreview.[14678][OpenStack] Fixed the issue with instance being inaccessible through floating IP upon floating IP quick reuse when using a small floating network.
[16963][OpenStack] Fixed the issue with Ironic failing to provide nodes on deployments with OpenStack Victoria.
[16241][Tungsten Fabric] Fixed the issue causing failure to update a port, or security group assigned to the port, through the Horizon web UI.
[17045][StackLight] Fixed the issue causing the
fluentd-notificationspod failing to track the RabbitMQ credentials updates in the Secret object.[17573][StackLight] Fixed the issue with OpenStack notifications missing in Elasticsearch and the Kibana
notification-*index being empty.
MOS 21.4 release
Release date |
Name |
Container Cloud Cluster release |
Highlights |
|---|---|---|---|
September 01, 2021 |
MOS 21.4 |
6.18.0+21.4 |
Update for the MOS GA release introducing the following key features:
|
Component |
Support scope |
Feature |
|---|---|---|
OpenStack |
Full |
|
Full |
||
TechPreview |
||
Full |
||
TechPreview |
||
TechPreview |
||
Full |
||
Full |
||
TechPreview |
||
n/a |
||
Tungsten Fabric |
TechPreview |
|
StackLight |
Full |
|
Full |
Implemented full support for OpenStack Victoria with OVS or Tungsten Fabric 5.1. However, for new OpenStack Victoria with Tungsten Fabric deployments, Mirantis recommends that you install Tungsten Fabric 2011, which is shipped as TechPreview in this release.
Verified the upgrade path from Ussuri with OVS or Tungsten Fabric 5.1 to Victoria with OVS or Tungsten Fabric 5.1.
OpenStack Ussuri is considered deprecated and will be declared unsupported in one of the upcoming releases. Therefore, start planning your Ussuri to Victoria cloud upgrade.
Implemented the mechanism to define additional policy rules for the core
OpenStack services through the OpenStackDeployment Custom Resource.
TechPreview
Implemented support for Masakari instance evacuation. Now, Masakari host monitor is deployed by default with Instances High Availability Service for OpenStack to provide automatic instance evacuation from failed instances.
Implemented the usage of direct Helm 3 communication by the OpenStack operator. The usage of HelmBundles is dropped and automatic transition from Helm 2 to Helm 3 is performed during the MOS 21.3 to MOS 21.4 release update.
TechPreview
Implemented the capability to configure Cinder backend for images through
the OpenStackDeployment Custom Resource. The usage of Cinder backend
for Glance enables the OpenStack clouds relying on third-party appliances
for block storage to have images in one place.
TechPreview
Added the capability to collocate the OpenStack control plane with the managed
cluster master nodes through the OpenStackDeployment Custom Resource.
Note
If the StackLight cluster is configured to run in the HA mode on the same nodes with the control plane services, additional manual steps are required for an upgrade to MOS 21.4 or for a greenfield deployment. For details, see known issue 17477.
Implemented full support for the SR-IOV with the Neutron OVS backend topology.
Learn more
Added support for large-scale deployments that number up to 200 nodes out of the box. The use case has been verified for core OpenStack services with OVS and non-DVR Neutron configuration on a dedicated hardware scale lab.
For a successful deployment, we recommend sticking to the optimal limit for the number of ports on gateway nodes that is 1500 ports per gateway node. This recommendation was confirmed during the testing and should be taken into account when planning large environments.
TechPreview
Implemented the capability to enable the BGP VPN service to allow for connection of OpenStack Virtual Private Networks with external VPN sites through either BGP/MPLS IP VPNs or E-VPN.
Learn more
Published MOS API Reference to provide cloud operators with an up-to-date and comprehensive definition of the language they need to use to communicate with MOS OpenStack and Tungsten Fabric.
Learn more
TechPreview
Implemented support for SR-IOV and DPDK with Tungsten Fabric 2011.
Implemented the following improvements to StackLight alerting:
Added the following alerts:
CinderServiceDisabledthat raises when a Cinder service is disabled on all hosts.NeutronAgentDisabledthat raises when a Neutron Agent is disabled on all hosts.NeutronAgentOutagethat raises when a Neutron Agent is down on all hosts where it is enabled.NovaServiceDisabledthat raises when a Nova service is disabled on all hosts.TungstenFabricAPI401Criticalthat raises when Tungsten Fabric API responds with HTTP 401.TungstenFabricAPI5xxCriticalthat raises when Tungsten Fabric API responds with HTTP 5xx.
Reworked the alert inhibition rules.
Reworked a number of alerts to improve alerting efficiency and reduce alert flooding.
Removed the inefficient
*ServicesDownMajor,*ServicesDownMinor,*AgentsDownMajor,*AgentsDownMinoralerts.
Learn more
Enhanced StackLight to send all OpenStack notifications to the notification
index. Now, to view the previously called audit notifications, see the
cadf Logger in the Kibana Notifications
dashboard.
Mirantis has tested MOS against a very specific configuration and can guarantee a predictable behavior of the product only in the exact same environments. The table below includes the major MOS components with the exact versions against which testing has been performed.
This section describes the MOS known issues with available workarounds. For the known issues in the related version of Mirantis Container Cloud, refer to Mirantis Container Cloud: Release Notes.
This section lists the Tungsten Fabric known issues with workarounds for the Mirantis OpenStack for Kubernetes release 21.4.
[10096] tf-control does not refresh IP addresses of Cassandra pods
[13755] TF pods switch to CrashLoopBackOff after a simultaneous reboot
Tungsten Fabric does not provide the following functionality:
Automatic generation of network port records in DNSaaS (Designate) as Neutron with Tungsten Fabric as a backend is not integrated with DNSaaS. As a workaround, you can use the Tungsten Fabric built-in DNS service that enables virtual machines to resolve each other names.
Secret management (Barbican). You cannot use the certificates stored in Barbican to terminate HTTPs in a load balancer.
Role Based Access Control (RBAC) for Neutron objects.
Modification of custom vRouter DaemonSets based on the SR-IOV definition in the
OsDplCR.
The tf-control service resolves the DNS names of Cassandra pods at startup
and does not update them if Cassandra pods got new IP addresses, for example,
in case of a restart. As a workaround, to refresh the IP addresses of
Cassandra pods, restart the tf-control pods one by one:
Caution
Before restarting the tf-control pods:
Verify that the new pods are successfully spawned.
Verify that no vRouters are connected to only one
tf-controlpod that will be restarted.
kubectl -n tf delete pod tf-control-<hash>
Rebooting all Cassandra cluster TFConfig or TFAnalytics nodes, maintenance, or other circumstances that cause the Cassandra pods to start simultaneously may cause a broken Cassandra TFConfig and/or TFAnalytics cluster. In this case, Cassandra nodes do not join the ring and do not update the IPs of the neighbor nodes. As a result, the TF services cannot operate Cassandra cluster(s).
To verify that a Cassandra cluster is affected:
Run the nodetool status command specifying the config or
analytics cluster and the replica number:
kubectl -n tf exec -it tf-cassandra-<config/analytics>-dc1-rack1-<replica number> -c cassandra -- nodetool status
Example of system response with outdated IP addresses:
Datacenter: DC1
===============
Status=Up/Down
|/ State=Normal/Leaving/Joining/Moving
-- Address Load Tokens Owns (effective) Host ID Rack
DN <outdated ip> ? 256 64.9% a58343d0-1e3f-4d54-bcdf-9b9b949ca873 r1
DN <outdated ip> ? 256 69.8% 67f1d07c-8b13-4482-a2f1-77fa34e90d48 r1
Datacenter: dc1
===============
Status=Up/Down
|/ State=Normal/Leaving/Joining/Moving
-- Address Load Tokens Owns (effective) Host ID Rack
UN <actual ip> 3.84 GiB 256 65.2% 7324ebc4-577a-425f-b3de-96faac95a331 rack1
Workaround:
Manually delete a Cassandra pod from the failed config or analytics
cluster to re-initiate the bootstrap process for one of the Cassandra nodes:
kubectl -n tf delete pod tf-cassandra-<config/analytics>-dc1-rack1-<replica number>
Fixed in MOS 21.5
Updating a port or security group assigned to the port through the Horizon web UI fails with an error.
Workaround:
Update the port through the Tungsten Fabric web UI:
Log in to the Tungsten Fabric web UI.
Navigate to Configure > Networking > Ports.
Click the gear icon next to the required port and click Edit.
Change the parameters as required and click Save.
Update the port through CLI:
Log in to the
keystone-clientpod.Run the openstack port set with the required parameters. For example:
openstack port set 48f7dfce-9111-4951-a2d3-95a63c94b64e --name port-name-changed
This section lists the OpenStack known issues with workarounds for the Mirantis OpenStack for Kubernetes release 21.4.
[6912] Octavia load balancers may not work properly with DVR
[14678] Instance inaccessible through floating IP upon floating IP quick reuse
[16495] Failure to reschedule OpenStack deployment pods after a node recovery
[16452] Failure to update the Octavia policy after policies removal
Limitation
When Neutron is deployed in the DVR mode, Octavia load balancers may not work correctly. The symptoms include both failure to properly balance traffic and failure to perform an amphora failover. For details, see DVR incompatibility with ARP announcements and VRRP.
Fixed in MOS 21.5
When using a small floating network and the floating IP that was previously allocated to an instance and re-associated with another instance in a short period of time, the instance may be inaccessible. The Address Resolution Protocol (ARP) cache timeout on the infrastructure layer is typically set to 5 minutes.
As a workaround, set a shorter ARP cache timeout on the infrastructure side.
Fixed in MOS 21.5
On deployments with OpenStack Victoria, Ironic may fail to provide nodes.
Workaround:
In the OsDpl CR, set
valid_interfacestopublic,internal:spec: services: baremetal: ironic: values: conf: ironic: service_catalog: valid_interfaces: public,internal
Trigger the OpenStack deployment to restart Ironic:
kubectl apply -f openstackdeployment.yaml
To monitor the status:
kubectl -n openstack get pods kubectl -n openstack describe osdpl osh-dev
Kubernetes does not reschedule OpenStack deployment pods after a node recovery.
As a workaround, delete all pods of the deployment:
for i in $(kubectl -n openstack get deployments |grep -v NAME | awk '{print $1}');
do
kubectl -n openstack rollout restart deployment/$i;
done
Once done, the pods will respawn automatically.
The Octavia policy fails to be updated after policies removal from the OsDpl CR. The issue affects OpenStack Victoria.
As a workaround, restart the Octavia API pods:
kubectl -n openstack delete pod -l application=octavia,component=api
When Glance is configured with the Cinder backend TechPreview, the
Glance client may return the HTTPInternalServerError error while operating
with volume. In this case, repeat the action again until it succeeds.
This section lists the StackLight known issues with workarounds for the Mirantis OpenStack for Kubernetes release 21.4.
[17045] fluentd-notifications does not track RabbitMQ credentials updates
[17573] OpenStack notifications missing in Elasticsearch and Kibana
Fixed in MOS 21.5
The fluentd-notifications pod fails to track the RabbitMQ credentials
updates in the Secret object. In this case, the fluentd-notifications pods
in the StackLight namespace are being restarted too often with the following
error message present in logs:
Authentication with RabbitMQ failed. Please check your connection settings.
Workaround:
Delete the affected fluentd-notifications pod. For example:
kubectl delete pod fluentd-notifications-cfcf77f9-h2wd7 -n stacklight
Once done, a new pod will be created automatically and will read the valid credentials from the Secret object.
If the issue still persists, apply the workaround described in [17573] OpenStack notifications missing in Elasticsearch and Kibana.
Fixed in MOS 21.5
OpenStack notifications may be missing in Elasticsearch and the Kibana
notification-* index may be empty. In this case, error messages
similar to the following one may be present in the
fluentd-notifications logs:
kubectl logs -l release=fluentd-notifications -n stacklight
2021-09-08 11:02:49 +0000 [error]: #0 unexpected error error_class=Bunny::
# AuthenticationFailureError error="Authentication with RabbitMQ failed.
# Please check your connection settings. Username: stacklight5BwVEEwd4s,
# vhost: openstack, password length: 10"
Workaround:
Apply the workaround described in [17045] fluentd-notifications does not track RabbitMQ credentials updates. If the issue still persists, perform the following steps:
On the affected managed cluster, obtain the proper user name and password from the
rabbitmq-credsSecret in theopenstack-lma-sharednamespace (stripb'prefix and'suffix):kubectl get secret -n openstack-lma-shared rabbitmq-creds -o jsonpath="{.data.password}" | base64 -d b'81g4B0wvEJ0rB2LWdAQcMBANf3E2DaEa' kubectl get secret -n openstack-lma-shared rabbitmq-creds -o jsonpath="{.data.username}" | base64 -d b'stacklightN7MAuk4LVd'
On the related management cluster, modify the affected Cluster object by specifying the obtained user name and password.
kubectl edit cluster <affectedManagedClusterName> -n <affectedManagedClusterProjectName>
For example:
spec: ... providerSpec: ... value: ... helmReleases: ... - name: stacklight values: ... openstack: rabbitmq: credentialsDiscovery: enabled: false credentialsConfig: username: stacklightN7MAuk4LVd password: 81g4B0wvEJ0rB2LWdAQcMBANf3E2DaEa
This section lists the cluster update known issues with workarounds for the Mirantis OpenStack for Kubernetes release 21.4.
[17477] StackLight in HA mode is not deployed or cluster update is blocked
[17305] Cluster update fails with the ‘Not ready releases: descheduler’ error
[17115] Cluster update does not change releaseRefs in Cluster object for Ceph
Fixed in MOS 21.5
The deployment of new managed clusters using the Cluster release 6.18.0 with StackLight enabled in the HA mode on control plane nodes does not have StackLight deployed. The update of existing clusters with such StackLight configuration that were created using the Cluster release 6.16.0 is blocked with the following error message:
cluster release version upgrade is forbidden: \
Minimum number of worker machines with StackLight label is 3
Workaround:
On the affected managed cluster:
Create a key-value pair that will be used as a unique label on the cluster nodes. In our example, it is
forcedRole: stacklight.To verify the labels names that already exist on the cluster nodes:
kubectl get nodes --show-labels
Add the new label to the target nodes for StackLight. For example, to the Kubernetes master nodes:
kubectl label nodes --selector=node-role.kubernetes.io/master forcedRole=stacklight
Verify that the new label is added:
kubectl get nodes --show-labels
On the related management cluster:
Configure
nodeSelectorfor the StackLight components by modifying the affectedClusterobject:kubectl edit cluster <affectedManagedClusterName> -n <affectedManagedClusterProjectName>
For example:
spec: ... providerSpec: ... value: ... helmReleases: ... - name: stacklight values: ... nodeSelector: default: forcedRole: stacklight
Select from the following options:
If you faced the issue during a managed cluster deployment, skip this step.
If you faced the issue during a managed cluster update, wait until all StackLight components resources are recreated on the target nodes with updated node selectors.
To monitor the cluster status:
kubectl get cluster <affectedManagedClusterName> -n <affectedManagedClusterProjectName> -o jsonpath='{.status.providerStatus.conditions[?(@.type=="StackLight")]}' | jq
In the cluster status, verify that the
elasticsearch-masterandprometheus-serverresources are ready. The process can take up to 30 minutes.Example of a negative system response:
{ "message": "not ready: statefulSets: stacklight/elasticsearch-master got 2/3 replicas", "ready": false, "type": "StackLight" }
In the Container Cloud web UI, add a fake StackLight label to any 3 worker nodes to satisfy the deployment requirement as described in Create a machine using web UI. Eventually, StackLight will be still placed on the target nodes with the
forcedRole: stacklightlabel.Once done, the StackLight deployment or update proceeds
Affects only MOS 21.4
An update of a MOS cluster from the Cluster release 6.16.0 to 6.18.0 may fail with the following exemplary error message:
Cluster data status: conditions:
- message: 'Helm charts are not installed(upgraded) yet. Not ready releases: descheduler.'
ready: false
type: Helm
The issue may affect the descheduler and metrics-server Helm releases.
As a workaround, run helm uninstall descheduler or helm uninstall metrics-server and wait for Helm Controller to recreate the affected release.
Fixed in MOS 22.2
An update of a MOS cluster may fail with the ceph csi-driver is not evacuated yet, waiting… error during the Ceph CSI pod eviction.
Workaround:
Scale the affected
StatefulSetof the pod that fails to init down to0replicas. If it is theDaemonSetsuch asnova-compute, it must not be scheduled on the affected node.On every
csi-rbdpluginpod, search for stuckcsi-vol:rbd device list | grep <csi-vol-uuid>
Unmap the affected
csi-vol:rbd unmap -o force /dev/rbd<i>
Delete
volumeattachmentof the affected pod:kubectl get volumeattachments | grep <csi-vol-uuid> kubectl delete volumeattacmhent <id>
Scale the affected
StatefulSetback to the original number of replicas or until its state isRunning. If it is aDaemonSet, run the pod on the affected node again.
Fixed in MOS 21.5
During an update of a MOS cluster from the Cluster release 6.16.0 to 6.18.0,
the status.providerStatus.releaseRefs.previous.name field in the Cluster
object does not change.
Workaround:
In the
clusterworkloadlockCRD, remove thesubresourcessection:kubectl edit crd clusterworkloadlocks.lcm.mirantis.com # remove here 'subresources' section: spec: versions: - name: v1alpha1 subresources: status: {}
Obtain
clusterReleasefrom theceph-controllersettings ConfigMap:kubectl -n ceph-lcm-mirantis get cm ccsettings -o jsonpath='{.data.clusterRelease}'
Create a
ceph-cwl.yamlfile with CephClusterWorkloadLock:apiVersion: lcm.mirantis.com/v1alpha1 kind: ClusterWorkloadLock metadata: name: ceph-clusterworkloadlock spec: controllerName: ceph status: state: inactive release: <clusterRelease> # from the previous step
Substitute
<clusterRelease>withclusterReleaseobtained in the previous step.Apply the resource:
kubectl apply -f ceph-cwl.yaml
Verify that the lock has been created:
kubectl get clusterworkloadlock ceph-clusterworkloadlock -o yaml
Affects only MOS 21.4
A MOS cluster update from the Cluster version
6.16.0 to 6.18.0 may fail with the Timeout waiting for pods statuses
timeout error. The error means that pods containers will be not ready
and will often restart with OOMKilled as a restart reason. For example:
kubectl describe pod prometheus-server-0 -n stacklight
...
Containers:
...
prometheus-server:
...
Last State: Terminated
Reason: OOMKilled
Exit Code: 137
Started: Mon, 16 Aug 2021 12:47:57 +0400
Finished: Mon, 16 Aug 2021 12:58:02 +0400
...
Workaround:
In the cluster object, set
clusterSizetomediumas described in Operations Guide: StackLight configuration parameters.Wait until the updated resource limits propagate to the
prometheus-serverStatefulSetobject.Delete the affected
prometheus-serverpods. For example:kubectl delete pods prometheus-server-0 prometheus-server-1 -n stacklight
Once done, new pods with updated resource limits will be created automatically.
This section lists the components artifacts of the MOS 21.4 release:
Component |
Path |
License information for main executable programs |
|---|---|---|
Binaries |
||
mirantis |
https://binary.mirantis.com/openstack/bin/horizon/mirantis-victoria-8f71802-20210119120707.tar.gz |
Mirantis Proprietary License |
octavia-amphora |
https://binary.mirantis.com/openstack/bin/octavia/amphora-x64-haproxy-victoria-20210813064403.qcow2 |
Mirantis Proprietary License |
Docker images |
||
ironic-inspector |
mirantis.azurecr.io/openstack/ironic-inspector:victoria-bionic-20210816060025 |
Apache License 2.0 |
masakari-monitors |
mirantis.azurecr.io/openstack/masakari-monitors:victoria-bionic-20210816060025 |
Apache License 2.0 |
masakari |
mirantis.azurecr.io/openstack/masakari:victoria-bionic-20210816060025 |
Apache License 2.0 |
stepler |
mirantis.azurecr.io/openstack/stepler:victoria-bionic-20210812104817 |
Mirantis Proprietary License |
placement |
mirantis.azurecr.io/openstack/placement:victoria-bionic-20210816060025 |
Apache License 2.0 |
keystone |
mirantis.azurecr.io/openstack/keystone:victoria-bionic-20210816060025 |
Apache License 2.0 |
heat |
mirantis.azurecr.io/openstack/heat:victoria-bionic-20210816060025 |
Apache License 2.0 |
glance |
mirantis.azurecr.io/openstack/glance:victoria-bionic-20210816060025 |
Apache License 2.0 |
cinder |
mirantis.azurecr.io/openstack/cinder:victoria-bionic-20210816060025 |
Apache License 2.0 |
neutron |
mirantis.azurecr.io/openstack/neutron:victoria-bionic-20210816060025 |
Apache License 2.0 |
nova |
mirantis.azurecr.io/openstack/nova:victoria-bionic-20210816060025 |
Apache License 2.0 |
horizon |
mirantis.azurecr.io/openstack/horizon:victoria-bionic-20210816060025 |
Apache License 2.0 |
tempest |
mirantis.azurecr.io/openstack/tempest:victoria-bionic-20210816060025 |
Apache License 2.0 |
octavia |
mirantis.azurecr.io/openstack/octavia:victoria-bionic-20210816060025 |
Apache License 2.0 |
designate |
mirantis.azurecr.io/openstack/designate:victoria-bionic-20210816060025 |
Apache License 2.0 |
ironic |
mirantis.azurecr.io/openstack/ironic:victoria-bionic-20210816060025 |
Apache License 2.0 |
barbican |
mirantis.azurecr.io/openstack/barbican:victoria-bionic-20210816060025 |
Apache License 2.0 |
libvirt |
mirantis.azurecr.io/general/libvirt:6.0.0-bionic-20210617094817 |
LGPL-2.1 License |
pause |
mirantis.azurecr.io/general/external/pause:3.1 |
Apache License 2.0 |
openvswitch |
mirantis.azurecr.io/general/openvswitch:2.11-bionic-20210617094817 |
Apache License 2.0 |
openvswitch-dpdk |
mirantis.azurecr.io/general/openvswitch-dpdk:2.11-bionic-20210617094817 |
Apache License 2.0 |
openstack-tools |
mirantis.azurecr.io/openstack/openstack-tools:ussuri-bionic-20210809060028 |
Apache License 2.0 |
rabbitmq-3.8 |
mirantis.azurecr.io/general/rabbitmq:3.8.14 |
Mozilla Public License 2.0 |
rabbitmq-3.8-management |
mirantis.azurecr.io/general/rabbitmq:3.8.14-management |
Mozilla Public License 2.0 |
kubernetes-entrypoint |
mirantis.azurecr.io/openstack/extra/kubernetes-entrypoint:v1.0.0-20200311160233 |
Apache License 2.0 |
docker |
mirantis.azurecr.io/openstack/extra/docker:17.07.0 |
Apache License 2.0 |
memcached |
mirantis.azurecr.io/general/memcached:1.6.6-alpine |
BSD 3-Clause “New” or “Revised” License |
ceph-config-helper |
mirantis.azurecr.io/openstack/extra/ceph-config-helper:nautilus-bionic-20210804080905 |
Apache License 2.0, LGPL-2.1 or LGPL-3 |
etcd |
mirantis.azurecr.io/openstack/extra/etcd:3.2.26 |
Apache License 2.0 |
powerdns |
mirantis.azurecr.io/openstack/extra/powerdns:4.2-alpine-20200117133238 |
GPL-2.0 License |
nginx-ingress-controller |
mirantis.azurecr.io/openstack/extra/nginx-ingress-controller:0.47.0 |
Apache License 2.0 |
defaultbackend |
mirantis.azurecr.io/openstack/extra/defaultbackend:1.0 |
Apache License 2.0 |
mariadb |
mirantis.azurecr.io/general/mariadb:10.4.17-bionic-20210617085111 |
GPLv2, LGPLv2.1 (client libraries) |
xrally-openstack |
mirantis.azurecr.io/openstack/extra/xrally-openstack:2.1.0-20210729214058 |
Apache License 2.0 |
prometheus-memcached-exporter |
mirantis.azurecr.io/stacklight/memcached-exporter:v0.5.0 |
Apache License 2.0 |
prometheus-mysql-exporter |
mirantis.azurecr.io/stacklight/mysqld-exporter:v0.11.0 |
Apache License 2.0 |
rabbitmq-exporter |
mirantis.azurecr.io/stacklight/rabbitmq-exporter:v1.0.0-RC8 |
MIT License |
aodh |
mirantis.azurecr.io/openstack/aodh:victoria-bionic-20210816060025 |
Apache License 2.0 |
panko |
mirantis.azurecr.io/openstack/panko:victoria-bionic-20210816060025 |
Apache License 2.0 |
ceilometer |
mirantis.azurecr.io/openstack/ceilometer:victoria-bionic-20210816060025 |
Apache License 2.0 |
gnocchi |
mirantis.azurecr.io/openstack/gnocchi:victoria-bionic-20210816060025 |
Apache License 2.0 |
redis |
mirantis.azurecr.io/openstack/extra/redis:5.0-alpine |
BSD 3-Clause “New” or “Revised” License |
frr |
mirantis.azurecr.io/general/external/docker.io/frrouting/frr:v7.5.0 |
GPL-2.0 License |
strongswan |
mirantis.azurecr.io/openstack/extra/strongswan:alpine-5.9.1-20210511072313 |
GPL License |
Component |
Path |
License information for main executable programs |
|---|---|---|
Binaries |
||
mirantis |
https://binary.mirantis.com/openstack/bin/horizon/mirantis-ussuri-48f346e-20210119132403.tar.gz |
Mirantis Proprietary License |
octavia-amphora |
https://binary.mirantis.com/openstack/bin/octavia/amphora-x64-haproxy-ussuri-20210121085750.qcow2 |
Mirantis Proprietary License |
Docker images |
||
ironic-inspector |
mirantis.azurecr.io/openstack/ironic-inspector:ussuri-bionic-20210805152625 |
Apache License 2.0 |
masakari-monitors |
mirantis.azurecr.io/openstack/masakari-monitors:ussuri-bionic-20210805152625 |
Apache License 2.0 |
masakari |
mirantis.azurecr.io/openstack/masakari:ussuri-bionic-20210805152625 |
Apache License 2.0 |
stepler |
mirantis.azurecr.io/openstack/stepler:ussuri-bionic-20210805094820 |
Mirantis Proprietary License |
placement |
mirantis.azurecr.io/openstack/placement:ussuri-bionic-20210805152625 |
Apache License 2.0 |
redis |
mirantis.azurecr.io/openstack/extra/redis:5.0-alpine |
BSD 3-Clause “New” or “Revised” License |
gnocchi |
mirantis.azurecr.io/openstack/gnocchi:ussuri-bionic-20210805152625 |
Apache License 2.0 |
ceilometer |
mirantis.azurecr.io/openstack/ceilometer:ussuri-bionic-20210805152625 |
Apache License 2.0 |
panko |
mirantis.azurecr.io/openstack/panko:ussuri-bionic-20210805152625 |
Apache License 2.0 |
aodh |
mirantis.azurecr.io/openstack/aodh:ussuri-bionic-20210805152625 |
Apache License 2.0 |
xrally-openstack |
mirantis.azurecr.io/openstack/extra/xrally-openstack:2.1.0-20210729214058 |
Apache License 2.0 |
prometheus-memcached-exporter |
mirantis.azurecr.io/stacklight/memcached-exporter:v0.5.0 |
Apache License 2.0 |
prometheus-mysql-exporter |
mirantis.azurecr.io/stacklight/mysqld-exporter:v0.11.0 |
Apache License 2.0 |
rabbitmq-exporter |
mirantis.azurecr.io/stacklight/rabbitmq-exporter:v1.0.0-RC8 |
MIT License |
mariadb |
mirantis.azurecr.io/general/mariadb:10.4.17-bionic-20210617085111 |
GPLv2, LGPLv2.1 (client libraries) |
defaultbackend |
mirantis.azurecr.io/openstack/extra/defaultbackend:1.0 |
Apache License 2.0 |
nginx-ingress-controller |
mirantis.azurecr.io/openstack/extra/nginx-ingress-controller:0.47.0 |
Apache License 2.0 |
powerdns |
mirantis.azurecr.io/openstack/extra/powerdns:4.2-alpine-20200117133238 |
GPL-2.0 License |
etcd |
mirantis.azurecr.io/openstack/extra/etcd:3.2.26 |
Apache License 2.0 |
ceph-config-helper |
mirantis.azurecr.io/openstack/extra/ceph-config-helper:nautilus-bionic-20210804080905 |
Apache License 2.0, LGPL-2.1 or LGPL-3 |
memcached |
mirantis.azurecr.io/general/memcached:1.6.6-alpine |
BSD 3-Clause “New” or “Revised” License |
docker |
mirantis.azurecr.io/openstack/extra/docker:17.07.0 |
Apache License 2.0 |
kubernetes-entrypoint |
mirantis.azurecr.io/openstack/extra/kubernetes-entrypoint:v1.0.0-20200311160233 |
Apache License 2.0 |
rabbitmq-3.8-management |
mirantis.azurecr.io/general/rabbitmq:3.8.14-management |
Mozilla Public License 2.0 |
rabbitmq-3.8 |
mirantis.azurecr.io/general/rabbitmq:3.8.14 |
Mozilla Public License 2.0 |
openstack-tools |
mirantis.azurecr.io/openstack/openstack-tools:ussuri-bionic-20210805152625 |
Apache License 2.0 |
openvswitch-dpdk |
mirantis.azurecr.io/general/openvswitch-dpdk:2.11-bionic-20210617094817 |
Apache License 2.0 |
openvswitch |
mirantis.azurecr.io/general/openvswitch:2.11-bionic-20210617094817 |
Apache License 2.0 |
pause |
mirantis.azurecr.io/general/external/pause:3.1 |
Apache License 2.0 |
libvirt |
mirantis.azurecr.io/general/libvirt:6.0.0-bionic-20210617094817 |
LGPL-2.1 License |
barbican |
mirantis.azurecr.io/openstack/barbican:ussuri-bionic-20210805152625 |
Apache License 2.0 |
ironic |
mirantis.azurecr.io/openstack/ironic:ussuri-bionic-20210805152625 |
Apache License 2.0 |
designate |
mirantis.azurecr.io/openstack/designate:ussuri-bionic-20210805152625 |
Apache License 2.0 |
octavia |
mirantis.azurecr.io/openstack/octavia:ussuri-bionic-20210805152625 |
Apache License 2.0 |
tempest |
mirantis.azurecr.io/openstack/tempest:ussuri-bionic-20210805152625 |
Apache License 2.0 |
horizon |
mirantis.azurecr.io/openstack/horizon:ussuri-bionic-20210805152625 |
Apache License 2.0 |
nova |
mirantis.azurecr.io/openstack/nova:ussuri-bionic-20210805152625 |
Apache License 2.0 |
neutron |
mirantis.azurecr.io/openstack/neutron:ussuri-bionic-20210805152625 |
Apache License 2.0 |
cinder |
mirantis.azurecr.io/openstack/cinder:ussuri-bionic-20210805152625 |
Apache License 2.0 |
glance |
mirantis.azurecr.io/openstack/glance:ussuri-bionic-20210805152625 |
Apache License 2.0 |
heat |
mirantis.azurecr.io/openstack/heat:ussuri-bionic-20210805152625 |
Apache License 2.0 |
keystone |
mirantis.azurecr.io/openstack/keystone:ussuri-bionic-20210805152625 |
Apache License 2.0 |
frr |
mirantis.azurecr.io/general/external/docker.io/frrouting/frr:v7.5.0 |
GPL-2.0 License |
strongswan |
mirantis.azurecr.io/openstack/extra/strongswan:alpine-5.9.1-20210511072313 |
GPL License |
Component |
Path |
License information for main executable programs |
|---|---|---|
Helm charts |
||
Tungsten Fabric Operator |
https://binary.mirantis.com/tungsten/helm/tungstenfabric-operator-0.3.9.tgz |
Mirantis Proprietary License |
Docker images |
||
Tungsten Fabric Operator |
mirantis.azurecr.io/tungsten-operator/tungstenfabric-operator:0.3.9 |
Mirantis Proprietary License |
Analytics |
mirantis.azurecr.io/tungsten/contrail-analytics-api:5.1.20210723093724 |
Apache License 2.0 |
mirantis.azurecr.io/tungsten/contrail-analytics-collector:5.1.20210723093724 |
Apache License 2.0 |
|
Analytics Alarm |
mirantis.azurecr.io/tungsten/contrail-analytics-alarm-gen:5.1.20210723093724 |
Apache License 2.0 |
Analytics DB |
mirantis.azurecr.io/tungsten/contrail-analytics-query-engine:5.1.20210723093724 |
Apache License 2.0 |
Analytics SNMP |
mirantis.azurecr.io/tungsten/contrail-analytics-snmp-collector:5.1.20210723093724 |
Apache License 2.0 |
mirantis.azurecr.io/tungsten/contrail-analytics-snmp-topology:5.1.20210723093724 |
Apache License 2.0 |
|
Config |
mirantis.azurecr.io/tungsten/contrail-controller-config-api:5.1.20210723093724 |
Apache License 2.0 |
mirantis.azurecr.io/tungsten/contrail-controller-config-devicemgr:5.1.20210723093724 |
Apache License 2.0 |
|
mirantis.azurecr.io/tungsten/contrail-controller-config-schema:5.1.20210723093724 |
Apache License 2.0 |
|
mirantis.azurecr.io/tungsten/contrail-controller-config-svcmonitor:5.1.20210723093724 |
Apache License 2.0 |
|
Control |
mirantis.azurecr.io/tungsten/contrail-controller-control-control:5.1.20210723093724 |
Apache License 2.0 |
mirantis.azurecr.io/tungsten/contrail-controller-control-dns:5.1.20210723093724 |
Apache License 2.0 |
|
mirantis.azurecr.io/tungsten/contrail-controller-control-named:5.1.20210723093724 |
Apache License 2.0 |
|
Web UI |
mirantis.azurecr.io/tungsten/contrail-controller-webui-job:5.1.20210723093724 |
Apache License 2.0 |
mirantis.azurecr.io/tungsten/contrail-controller-webui-web:5.1.20210723093724 |
Apache License 2.0 |
|
Status |
mirantis.azurecr.io/tungsten/contrail-status:5.1.20210723093724 |
Apache License 2.0 |
mirantis.azurecr.io/tungsten/contrail-tf-status:5.1.20210723093724 |
Apache License 2.0 |
|
mirantis.azurecr.io/tungsten/contrail-tf-status-aggregator:5.1.20210723093724 |
Apache License 2.0 |
|
mirantis.azurecr.io/tungsten/contrail-tf-status-party:5.1.20210723093724 |
Apache License 2.0 |
|
vRouter |
mirantis.azurecr.io/tungsten/contrail-vrouter-agent:5.1.20210723093724 |
Apache License 2.0 |
mirantis.azurecr.io/tungsten/contrail-vrouter-kernel-build-init:5.1.20210723093724 |
Apache License 2.0 |
|
Nodemanager |
mirantis.azurecr.io/tungsten/contrail-nodemgr:5.1.20210723093724 |
Apache License 2.0 |
Cassandra operator |
mirantis.azurecr.io/tungsten-operator/casskop:v0.5.3-release |
Apache License 2.0 |
Cassandra |
mirantis.azurecr.io/tungsten/cassandra-bootstrap:0.1.4 |
Apache License 2.0 |
mirantis.azurecr.io/tungsten/cassandra:3.11.6 |
Apache License 2.0 |
|
Kafka operator |
mirantis.azurecr.io/tungsten-operator/kafka-k8s-operator:0.0.9 |
Mirantis Proprietary License |
Kafka |
mirantis.azurecr.io/tungsten/cp-kafka:5.5.4 |
Apache License 2.0 |
RabbitMQ operator |
mirantis.azurecr.io/tungsten-operator/rabbitmq-operator:0.1.4 |
Mirantis Proprietary License |
RabbitMQ |
mirantis.azurecr.io/general/rabbitmq:3.8.14 |
Mozilla Public License 2.0 |
ZooKeeper operator |
mirantis.azurecr.io/tungsten-operator/zookeeper-operator:0.2.10 |
Apache License 2.0 |
ZooKeeper |
mirantis.azurecr.io/tungsten/zookeeper:3.6.1-0.2.9 |
Apache License 2.0 |
Redis operator |
mirantis.azurecr.io/tungsten-operator/redis-operator:0.1.5-1-ccd6a63 |
Apache License 2.0 |
Redis |
mirantis.azurecr.io/tungsten/redis:5-alpine |
BSD 3-Clause “New” or “Revised” License |
TF Test |
mirantis.azurecr.io/tungsten/tungsten-pytest:0.1-20210428100236 |
MIT License |
TF CLI |
mirantis.azurecr.io/tungsten/tf-cli:0.1-20210214191656 |
MIT License |
TF NodeInfo |
mirantis.azurecr.io/tungsten/tf-nodeinfo:0.1-20210430090010 |
MIT License |
Component |
Path |
License information for main executable programs |
|---|---|---|
Helm charts |
||
Tungsten Fabric Operator |
https://binary.mirantis.com/tungsten/helm/tungstenfabric-operator-0.3.9.tgz |
Mirantis Proprietary License |
Docker images |
||
Tungsten Fabric Operator |
mirantis.azurecr.io/tungsten-operator/tungstenfabric-operator:0.3.9 |
Mirantis Proprietary License |
Analytics |
mirantis.azurecr.io/tungsten/contrail-analytics-api:2011.20210728070330 |
Apache License 2.0 |
mirantis.azurecr.io/tungsten/contrail-analytics-collector:2011.20210728070330 |
Apache License 2.0 |
|
Analytics Alarm |
mirantis.azurecr.io/tungsten/contrail-analytics-alarm-gen:2011.20210728070330 |
Apache License 2.0 |
Analytics DB |
mirantis.azurecr.io/tungsten/contrail-analytics-query-engine:2011.20210728070330 |
Apache License 2.0 |
Analytics SNMP |
mirantis.azurecr.io/tungsten/contrail-analytics-snmp-collector:2011.20210728070330 |
Apache License 2.0 |
mirantis.azurecr.io/tungsten/contrail-analytics-snmp-topology:2011.20210728070330 |
Apache License 2.0 |
|
Config |
mirantis.azurecr.io/tungsten/contrail-controller-config-api:2011.20210728070330 |
Apache License 2.0 |
mirantis.azurecr.io/tungsten/contrail-controller-config-devicemgr:2011.20210728070330 |
Apache License 2.0 |
|
mirantis.azurecr.io/tungsten/contrail-controller-config-schema:2011.20210728070330 |
Apache License 2.0 |
|
mirantis.azurecr.io/tungsten/contrail-controller-config-svcmonitor:2011.20210728070330 |
Apache License 2.0 |
|
Control |
contrail-controller-control-control:2011.20210728070330 |
Apache License 2.0 |
mirantis.azurecr.io/tungsten/contrail-controller-control-dns:2011.20210728070330 |
Apache License 2.0 |
|
mirantis.azurecr.io/tungsten/contrail-controller-control-named:2011.20210728070330 |
Apache License 2.0 |
|
Web UI |
mirantis.azurecr.io/tungsten/contrail-controller-webui-job:2011.20210728070330 |
Apache License 2.0 |
mirantis.azurecr.io/tungsten/contrail-controller-webui-web:2011.20210728070330 |
Apache License 2.0 |
|
Status |
mirantis.azurecr.io/tungsten/contrail-status:2011.20210728070330 |
Apache License 2.0 |
mirantis.azurecr.io/tungsten/contrail-tf-status:2011.20210728070330 |
Apache License 2.0 |
|
mirantis.azurecr.io/tungsten/contrail-tf-status-aggregator:2011.20210728070330 |
Apache License 2.0 |
|
mirantis.azurecr.io/tungsten/contrail-tf-status-party:2011.20210728070330 |
Apache License 2.0 |
|
vRouter |
mirantis.azurecr.io/tungsten/contrail-vrouter-agent:2011.20210728070330 |
Apache License 2.0 |
mirantis.azurecr.io/tungsten/contrail-vrouter-kernel-build-init:2011.20210728070330 |
Apache License 2.0 |
|
Nodemanager |
mirantis.azurecr.io/tungsten/contrail-nodemgr:2011.20210728070330 |
Apache License 2.0 |
Provisioner |
mirantis.azurecr.io/tungsten/contrail-provisioner:2011.20210728070330 |
Apache License 2.0 |
Cassandra operator |
mirantis.azurecr.io/tungsten-operator/casskop:v0.5.3-release |
Apache License 2.0 |
Cassandra |
mirantis.azurecr.io/tungsten/cassandra-bootstrap:0.1.4 |
Apache License 2.0 |
mirantis.azurecr.io/tungsten/cassandra:3.11.6 |
Apache License 2.0 |
|
Kafka operator |
mirantis.azurecr.io/tungsten-operator/kafka-k8s-operator:0.0.9 |
Mirantis Proprietary License |
Kafka |
mirantis.azurecr.io/tungsten/cp-kafka:5.5.4 |
Apache License 2.0 |
RabbitMQ operator |
mirantis.azurecr.io/tungsten-operator/rabbitmq-operator:0.1.4 |
Mirantis Proprietary License |
RabbitMQ |
mirantis.azurecr.io/general/rabbitmq:3.8.14 |
Mozilla Public License 2.0 |
ZooKeeper operator |
mirantis.azurecr.io/tungsten-operator/zookeeper-operator:0.2.10 |
Apache License 2.0 |
ZooKeeper |
mirantis.azurecr.io/tungsten/zookeeper:3.6.1-0.2.9 |
Apache License 2.0 |
Redis operator |
mirantis.azurecr.io/tungsten-operator/redis-operator:0.1.5-1-ccd6a63 |
Apache License 2.0 |
Redis |
mirantis.azurecr.io/tungsten/redis:5-alpine |
BSD 3-Clause “New” or “Revised” License |
TF Test |
mirantis.azurecr.io/tungsten/tungsten-pytest:0.1-20210428100236 |
MIT License |
TF CLI |
mirantis.azurecr.io/tungsten/tf-cli:0.1-20210214191656 |
MIT License |
TF NodeInfo |
mirantis.azurecr.io/tungsten/tf-nodeinfo:0.1-20210430090010 |
MIT License |
TF Tools New |
mirantis.azurecr.io/tungsten/contrail-tools:2011.20210728070330 |
Apache License 2.0 |
Component |
Path |
License information for main executable programs |
|---|---|---|
Docker images |
||
prometheus-libvirt-exporter |
mirantis.azurecr.io/stacklight/libvirt-exporter:v0.1-20200610164751 |
Mirantis Proprietary License |
prometheus-tungstenfabric-exporter |
mirantis.azurecr.io/stacklight/tungstenfabric-prometheus-exporter:0.1-20210115152338 |
Mirantis Proprietary License |
Helm charts |
||
prometheus-libvirt-exporter |
https://binary.mirantis.com/stacklight/helm/prometheus-libvirt-exporter-0.1.0-mcp-2.tgz |
Mirantis Proprietary License |
prometheus-tungstenfabric-exporter |
https://binary.mirantis.com/stacklight/helm/prometheus-tungstenfabric-exporter-0.1.0-mcp-1.tgz |
Mirantis Proprietary License |
The following issues have been addressed in the Mirantis OpenStack for Kubernetes 21.4 release:
[13273][OpenStack] Fixed the issue with Octavia amphora getting stuck after the MOS cluster update.
[16849][OpenStack] Fixed the issue causing inability to delete a load balancer with a number higher than the maximum limit in API.
[16180][Tungsten Fabric] Fixed the issue with inability to schedule vRouter DPDK on a node with DPDK and 1 GB huge pages enabled. Enhanced Tungsten Fabric Operator to support 1 GB huge pages for a DPDK-based vRouter.
[16033][Ceph] Fixed the issue with inability to access RADOS Gateway through using S3 authentication. Added
rgw s3 auth use keystone = trueto the default RADOS Gateway options.[16604][StackLight] To avoid issues with
defunctprocesses on the OpenStack controller nodes, temporarily disabled instances downtime monitoring and removed the KPI - Downtime Grafana dashboard.
MOS 21.3 release
Release date |
Name |
Container Cloud Cluster release |
Highlights |
|---|---|---|---|
June 15, 2021 |
MOS 21.3 |
6.16.0+21.3 |
Update for the MOS GA release introducing support for Hyperconverged OpenStack compute nodes, SR-IOV and control interface specification for Tungsten Fabric, and the following Technology Preview features:
|
Implemented full support for colocation of a cluster services on the same host, for example, Ceph OSD and OpenStack compute. To avoid nodes overloading, limit the hardware resources consumption by the OpenStack compute services as described in Deployment Guide: Limit HW resources for hyperconverged OpenStack compute nodes.
TechPreview
Implemented the capability to configure LVM as a backend for the OpenStack Block Storage service.
TechPreview
Implemented the capability to encrypt the east-west tenant traffic between the OpenStack compute nodes and gateways using strongSwan Internet Protocol Security (IPsec) solution.
Implemented the capability to specify the TF control service interface for
the BGP and XMPP traffic, for example, to combine it with the data traffic.
TechPreview
Implemented support for Tungsten Fabric 2011.
Implemented full support for SR-IOV in Tungsten Fabric.
After the OpenStackDeployment CR modification, the TF Operator
now generates a separate vRouter DaemonSet with specified settings.
After the SR-IOV enablement, the tf-vrouter-agent pods
are automatically restarted on the corresponding nodes causing
the network services interruption on virtual machines running on these hosts.
Therefore, plan this procedure accordingly.
Enhanced Ceph Controller to automatically specify default configuration options for each Ceph cluster during the Ceph deployment.
Implemented the capability to disable the transmit (TX) offloading using the
DISABLE_TX_OFFLOAD parameter in the TFOperator CR.
Implemented the targetSizeRatio parameter for the replicated
MOS Ceph pools. The targetSizeRatio value specifies
the default ratio for each Ceph pool type to define the expected consumption
of the Ceph cluster capacity.
Added the customIngress parameter to implement the capability to specify
a custom Ingress Controller when configuring the Ceph RGW TLS.
Caution
Starting from MOS 21.3, external Ceph RGW service is not supported and will be deleted during update. If your system already uses endpoints of an external RGW service, reconfigure them to the ingress endpoints.
Learn more
Implemented the following OpenStack service-level alerts on public/ingress endpoints:
OpenstackAPI401CriticalOpenstackAPI5xxCriticalOpenstackPublicAPI401CriticalOpenstackPublicAPI5xxCritical
Learn more
Mirantis has tested MOS against a very specific configuration and can guarantee a predictable behavior of the product only in the exact same environments. The table below includes the major MOS components with the exact versions against which testing has been performed.
This section contains the description of the known issues with available workarounds.
This section lists the Tungsten Fabric known issues with workarounds for the Mirantis OpenStack for Kubernetes release 21.3.
[10096] tf-control does not refresh IP addresses of Cassandra pods
[13755] TF pods switch to CrashLoopBackOff after a simultaneous reboot
Tungsten Fabric does not provide the following functionality:
Automatic generation of network port records in DNSaaS (Designate) as Neutron with Tungsten Fabric as a backend is not integrated with DNSaaS. As a workaround, you can use the Tungsten Fabric built-in DNS service that enables virtual machines to resolve each other names.
Secret management (Barbican). You cannot use the certificates stored in Barbican to terminate HTTPs in a load balancer.
Role Based Access Control (RBAC) for Neutron objects.
Modification of custom vRouter DaemonSets based on the SR-IOV definition in the
OsDplCR.
The tf-control service resolves the DNS names of Cassandra pods at startup
and does not update them if Cassandra pods got new IP addresses, for example,
in case of a restart. As a workaround, to refresh the IP addresses of
Cassandra pods, restart the tf-control pods one by one:
Caution
Before restarting the tf-control pods:
Verify that the new pods are successfully spawned.
Verify that no vRouters are connected to only one
tf-controlpod that will be restarted.
kubectl -n tf delete pod tf-control-<hash>
Rebooting all Cassandra cluster TFConfig or TFAnalytics nodes, maintenance, or other circumstances that cause the Cassandra pods to start simultaneously may cause a broken Cassandra TFConfig and/or TFAnalytics cluster. In this case, Cassandra nodes do not join the ring and do not update the IPs of the neighbor nodes. As a result, the TF services cannot operate Cassandra cluster(s).
To verify that a Cassandra cluster is affected:
Run the nodetool status command specifying the config or
analytics cluster and the replica number:
kubectl -n tf exec -it tf-cassandra-<config/analytics>-dc1-rack1-<replica number> -c cassandra -- nodetool status
Example of system response with outdated IP addresses:
Datacenter: DC1
===============
Status=Up/Down
|/ State=Normal/Leaving/Joining/Moving
-- Address Load Tokens Owns (effective) Host ID Rack
DN <outdated ip> ? 256 64.9% a58343d0-1e3f-4d54-bcdf-9b9b949ca873 r1
DN <outdated ip> ? 256 69.8% 67f1d07c-8b13-4482-a2f1-77fa34e90d48 r1
Datacenter: dc1
===============
Status=Up/Down
|/ State=Normal/Leaving/Joining/Moving
-- Address Load Tokens Owns (effective) Host ID Rack
UN <actual ip> 3.84 GiB 256 65.2% 7324ebc4-577a-425f-b3de-96faac95a331 rack1
Workaround:
Manually delete a Cassandra pod from the failed config or analytics
cluster to re-initiate the bootstrap process for one of the Cassandra nodes:
kubectl -n tf delete pod tf-cassandra-<config/analytics>-dc1-rack1-<replica number>
This section lists the OpenStack known issues with workarounds for the Mirantis OpenStack for Kubernetes release 21.3.
[15525] HelmBundle Controller gets stuck during cluster update
[6912] Octavia load balancers may not work properly with DVR
Affects only MOS 21.3
The HelmBundle Controller that handles OpenStack releases gets stuck during
cluster update and does not apply HelmBundle changes. The issue is caused
by an unlimited releases history that increases the amount of RAM consumed by
Tiller. The workaround is to manually limit the releases number history to 3.
Workaround:
Remove the old releases:
Clean up releases in the
stacklightnamespace:function cleanup_release_history { pattern=$1 left_items=${2:-3} for i in $(kubectl -n stacklight get cm |grep "$pattern" | awk '{print $1}' | sort -V | head -n -${left_items}) do kubectl -n stacklight delete cm $i done }
For example:
kubectl -n stacklight get cm |grep "openstack-cinder.v" | awk '{print $1}' openstack-cinder.v1 ... openstack-cinder.v50 openstack-cinder.v51 cleanup_release_history openstack-cinder.v
Fix the releases in the
FAILEDstate:Connect to one of StackLight Helm Controller pods and list the releases in the
FAILEDstate:kubectl -n stacklight exec -it stacklight-helm-controller-699cc6949-dtfgr -- sh ./helm --host localhost:44134 list
Example of system response:
# openstack-heat 2313 Wed Jun 23 06:50:55 2021 FAILED heat-0.1.0-mcp-3860 openstack # openstack-keystone 76 Sun Jun 20 22:47:50 2021 FAILED keystone-0.1.0-mcp-3860 openstack # openstack-neutron 147 Wed Jun 23 07:00:37 2021 FAILED neutron-0.1.0-mcp-3860 openstack # openstack-nova 1 Wed Jun 23 07:09:43 2021 FAILED nova-0.1.0-mcp-3860 openstack # openstack-nova-rabbitmq 15 Wed Jun 23 07:04:38 2021 FAILED rabbitmq-0.1.0-mcp-2728 openstack
Determine the reason for a release failure. Typically, this is due to changes in the immutable objects (jobs). For example:
./helm --host localhost:44134 history openstack-mariadb
Example of system response:
REVISION UPDATED STATUS CHART APP VERSION DESCRIPTION 173 Thu Jun 17 20:26:14 2021 DEPLOYED mariadb-0.1.0-mcp-2710 Upgrade complete 212 Wed Jun 23 07:07:58 2021 FAILED mariadb-0.1.0-mcp-2728 Upgrade "openstack-mariadb" failed: Job.batch "openstack-... 213 Wed Jun 23 07:55:22 2021 FAILED mariadb-0.1.0-mcp-2728 Upgrade "openstack-mariadb" failed: Job.batch "exporter-c...
Remove the
FAILEDjob and roll back the release. For example:kubectl -n openstack delete job -l application=mariadb ./helm --host localhost:44134 rollback openstack-mariadb 213
Verify that the release is in the
DEPLOYEDstate. For example:./helm --host localhost:44134 history openstack-mariadb
Perform the steps above for all releases in the
FAILEDstate one by one.
Set
TILLER_HISTORY_MAXin the StackLight Controller to3:kubectl -n stacklight edit deployment stacklight-helm-controller
Fixed in MOS 21.4
After the MOS cluster update, Octavia amphora may get stuck with the WARNING octavia.amphorae.drivers.haproxy.rest_api_driver [-] Could not connect to instance. Retrying. error message present in the Octavia worker logs. The workaround is to manually switch the Octavia amphorae driver from V2 to V1.
Workaround:
In the OsDpl CR, specify the following configuration:
spec: services: load-balancer: octavia: values: conf: octavia: api_settings: default_provider_driver: amphora
Trigger the OpenStack deployment to restart Octavia:
kubectl apply -f openstackdeployment.yaml
To monitor the status:
kubectl -n openstack get pods kubectl -n openstack describe osdpl osh-dev
Limitation
When Neutron is deployed in the DVR mode, Octavia load balancers may not work correctly. The symptoms include both failure to properly balance traffic and failure to perform an amphora failover. For details, see DVR incompatibility with ARP announcements and VRRP.
This section lists the Ceph known issues with workarounds for the Mirantis OpenStack for Kubernetes release 21.3.
During the MOS cluster update to Cluster release 6.16.0, the Ceph Controller may fail with the following traceback:
panic: runtime error: invalid memory address on nil pointer dereference
[signal SIGSEGV: segmentation violation code=0x1 addr=0x28 pc=0x15d2c58]
goroutine 352 [running]:
github.com/Mirantis/ceph-controller/pkg/controller/miraceph.VerifyCertificateExpireDate(0x0, 0x0, 0x0, 0x6, 0x28a7bc0)
ceph-controller/pkg/controller/miraceph/util.go:250 +0x48
Workaround:
Obtain the
certbase64-encoded value of therook-ceph/rgw-ssl-certificatesecret:kubectl -n rook-ceph get secret rgw-ssl-certificate -o jsonpath='{.data.cert}' | base64 -d
Example of system response:
-----BEGIN RSA PRIVATE KEY----- ... -----END RSA PRIVATE KEY----- -----BEGIN CERTIFICATE----- ... -----END CERTIFICATE----- -----BEGIN CERTIFICATE----- ... -----END CERTIFICATE-----
Copy last certificate in the chain and save it to the temp file, for example,
tmp-cacert.crt.Encode the certificate from
tmp-cacert.crtwith base64 encoding in one line:cat tmp-cacert.crt | base64 -w 0
Create a new
cacertkey in therook-ceph/rgw-ssl-certificatesecret and copy the base64-encodedcacertto its value. The following is an example of the resulting secret data:data: cert: <base64 string> cacert: <copied base64 cacert string>
Restart the
ceph-lcm-mirantis/ceph-controllerpod:kubectl -n ceph-lcm-mirantis delete pod -l app=ceph-controller
This section lists the StackLight known issues with workarounds for the Mirantis OpenStack for Kubernetes release 21.3.
OpenStack API availability data is shown in a 0 - 1 scale instead of an expected 0 - 100 scale.
As a workaround, manually set the extraQueries for OpenStack services
API to * 100 in the StackLight Helm chart values of the Cluster release
resource:
sfReporter:
extraQueries:
nova_api:
title: 'Nova API'
expr: 'avg(avg_over_time(openstack_api_check_status{service_name="nova"}[24h])) * 100'
cinder_api:
title: 'Cinder API'
expr: 'avg(avg_over_time(openstack_api_check_status{service_name="cinderv2"}[24h])) * 100'
glance_api:
title: 'Glance API'
expr: 'avg(avg_over_time(openstack_api_check_status{service_name="glance"}[24h])) * 100'
keystone_api:
title: 'Keystone API'
expr: 'avg(avg_over_time(openstack_api_check_status{service_name="keystone"}[24h])) * 100'
neutron_api:
title: 'Neutron API'
expr: 'avg(avg_over_time(openstack_api_check_status{service_name="neutron"}[24h])) * 100'
This section lists the components artifacts of the MOS 21.3 release:
Component |
Path |
License information for main executable programs |
|---|---|---|
Binaries |
||
mirantis |
https://binary.mirantis.com/openstack/bin/horizon/mirantis-victoria-8f71802-20210119120707.tar.gz |
Mirantis Proprietary License |
octavia-amphora |
https://binary.mirantis.com/openstack/bin/octavia/amphora-x64-haproxy-victoria-20210518064309.qcow2 |
Mirantis Proprietary License |
Docker images |
||
ironic-inspector |
mirantis.azurecr.io/openstack/ironic-inspector:victoria-bionic-20210521110756 |
Apache License 2.0 |
masakari-monitors |
mirantis.azurecr.io/openstack/masakari-monitors:victoria-bionic-20210521110756 |
Apache License 2.0 |
masakari |
mirantis.azurecr.io/openstack/masakari:victoria-bionic-20210521110756 |
Apache License 2.0 |
stepler |
mirantis.azurecr.io/openstack/stepler:victoria-bionic-20210520105038 |
Mirantis Proprietary License |
placement |
mirantis.azurecr.io/openstack/placement:victoria-bionic-20210521110756 |
Apache License 2.0 |
keystone |
mirantis.azurecr.io/openstack/keystone:victoria-bionic-20210521110756 |
Apache License 2.0 |
heat |
mirantis.azurecr.io/openstack/heat:victoria-bionic-20210521110756 |
Apache License 2.0 |
glance |
mirantis.azurecr.io/openstack/glance:victoria-bionic-20210521110756 |
Apache License 2.0 |
cinder |
mirantis.azurecr.io/openstack/cinder:victoria-bionic-20210521110756 |
Apache License 2.0 |
neutron |
mirantis.azurecr.io/openstack/neutron:victoria-bionic-20210521110756 |
Apache License 2.0 |
nova |
mirantis.azurecr.io/openstack/nova:victoria-bionic-20210521110756 |
Apache License 2.0 |
horizon |
mirantis.azurecr.io/openstack/horizon:victoria-bionic-20210521110756 |
Apache License 2.0 |
tempest |
mirantis.azurecr.io/openstack/tempest:victoria-bionic-20210521110756 |
Apache License 2.0 |
octavia |
mirantis.azurecr.io/openstack/octavia:victoria-bionic-20210521110756 |
Apache License 2.0 |
designate |
mirantis.azurecr.io/openstack/designate:victoria-bionic-20210521110756 |
Apache License 2.0 |
ironic |
mirantis.azurecr.io/openstack/ironic:victoria-bionic-20210521110756 |
Apache License 2.0 |
barbican |
mirantis.azurecr.io/openstack/barbican:victoria-bionic-20210521110756 |
Apache License 2.0 |
libvirt |
mirantis.azurecr.io/general/libvirt:6.0.0-bionic-20210509034813 |
LGPL-2.1 License |
pause |
mirantis.azurecr.io/general/external/pause:3.1 |
Apache License 2.0 |
openvswitch |
mirantis.azurecr.io/general/openvswitch:2.11-bionic-20210509034813 |
Apache License 2.0 |
openvswitch-dpdk |
mirantis.azurecr.io/general/openvswitch-dpdk:2.11-bionic-20210509034813 |
Apache License 2.0 |
openstack-tools |
mirantis.azurecr.io/openstack/openstack-tools:ussuri-bionic-20210517170337 |
Apache License 2.0 |
rabbitmq-3.8 |
mirantis.azurecr.io/general/rabbitmq:3.8.14 |
Mozilla Public License 2.0 |
rabbitmq-3.8-management |
mirantis.azurecr.io/general/rabbitmq:3.8.14-management |
Mozilla Public License 2.0 |
kubernetes-entrypoint |
mirantis.azurecr.io/openstack/extra/kubernetes-entrypoint:v1.0.0-20200311160233 |
Apache License 2.0 |
docker |
mirantis.azurecr.io/openstack/extra/docker:17.07.0 |
Apache License 2.0 |
memcached |
mirantis.azurecr.io/general/memcached:1.6.6-alpine |
BSD 3-Clause “New” or “Revised” License |
ceph-config-helper |
mirantis.azurecr.io/openstack/extra/ceph-config-helper:nautilus-bionic-20210519111601 |
Apache License 2.0, LGPL-2.1 or LGPL-3 |
etcd |
mirantis.azurecr.io/openstack/extra/etcd:3.2.26 |
Apache License 2.0 |
powerdns |
mirantis.azurecr.io/openstack/extra/powerdns:4.2-alpine-20200117133238 |
GPL-2.0 License |
nginx-ingress-controller |
mirantis.azurecr.io/openstack/extra/nginx-ingress-controller:0.42.0 |
Apache License 2.0 |
defaultbackend |
mirantis.azurecr.io/openstack/extra/defaultbackend:1.0 |
Apache License 2.0 |
mariadb |
mirantis.azurecr.io/general/mariadb:10.4.17-bionic-20210509025121 |
GPLv2, LGPLv2.1 (client libraries) |
xrally-openstack |
mirantis.azurecr.io/openstack/extra/xrally-openstack:2.1.0-20210408062007 |
Apache License 2.0 |
prometheus-memcached-exporter |
mirantis.azurecr.io/stacklight/memcached-exporter:v0.5.0 |
Apache License 2.0 |
prometheus-mysql-exporter |
mirantis.azurecr.io/stacklight/mysqld-exporter:v0.11.0 |
Apache License 2.0 |
rabbitmq-exporter |
mirantis.azurecr.io/stacklight/rabbitmq-exporter:v1.0.0-RC8 |
MIT License |
aodh |
mirantis.azurecr.io/openstack/aodh:victoria-bionic-20210521110756 |
Apache License 2.0 |
panko |
mirantis.azurecr.io/openstack/panko:victoria-bionic-20210521110756 |
Apache License 2.0 |
ceilometer |
mirantis.azurecr.io/openstack/ceilometer:victoria-bionic-20210521110756 |
Apache License 2.0 |
gnocchi |
mirantis.azurecr.io/openstack/gnocchi:victoria-bionic-20210521110756 |
Apache License 2.0 |
redis |
mirantis.azurecr.io/openstack/extra/redis:5.0-alpine |
BSD 3-Clause “New” or “Revised” License |
frr |
mirantis.azurecr.io/general/external/docker.io/frrouting/frr:v7.5.0 |
GPL-2.0 License |
strongswan New |
mirantis.azurecr.io/openstack/extra/strongswan:alpine-5.9.1-20210511072313 |
GPL License |
Component |
Path |
License information for main executable programs |
|---|---|---|
Binaries |
||
mirantis |
https://binary.mirantis.com/openstack/bin/horizon/mirantis-ussuri-48f346e-20210119132403.tar.gz |
Mirantis Proprietary License |
octavia-amphora |
https://binary.mirantis.com/openstack/bin/octavia/amphora-x64-haproxy-ussuri-20210121085750.qcow2 |
Mirantis Proprietary License |
Docker images |
||
ironic-inspector |
mirantis.azurecr.io/openstack/ironic-inspector:ussuri-bionic-20210517170337 |
Apache License 2.0 |
masakari-monitors |
mirantis.azurecr.io/openstack/masakari-monitors:ussuri-bionic-20210517170337 |
Apache License 2.0 |
masakari |
mirantis.azurecr.io/openstack/masakari:ussuri-bionic-20210517170337 |
Apache License 2.0 |
stepler |
mirantis.azurecr.io/openstack/stepler:ussuri-bionic-20210512124012 |
Mirantis Proprietary License |
placement |
mirantis.azurecr.io/openstack/placement:ussuri-bionic-20210517170337 |
Apache License 2.0 |
redis |
mirantis.azurecr.io/openstack/extra/redis:5.0-alpine |
BSD 3-Clause “New” or “Revised” License |
gnocchi |
mirantis.azurecr.io/openstack/gnocchi:ussuri-bionic-20210517170337 |
Apache License 2.0 |
ceilometer |
mirantis.azurecr.io/openstack/ceilometer:ussuri-bionic-20210517170337 |
Apache License 2.0 |
panko |
mirantis.azurecr.io/openstack/panko:ussuri-bionic-20210517170337 |
Apache License 2.0 |
aodh |
mirantis.azurecr.io/openstack/aodh:ussuri-bionic-20210517170337 |
Apache License 2.0 |
xrally-openstack |
mirantis.azurecr.io/openstack/extra/xrally-openstack:2.1.0-20210408062007 |
Apache License 2.0 |
prometheus-memcached-exporter |
mirantis.azurecr.io/stacklight/memcached-exporter:v0.5.0 |
Apache License 2.0 |
prometheus-mysql-exporter |
mirantis.azurecr.io/stacklight/mysqld-exporter:v0.11.0 |
Apache License 2.0 |
rabbitmq-exporter |
mirantis.azurecr.io/stacklight/rabbitmq-exporter:v1.0.0-RC8 |
MIT License |
mariadb |
mirantis.azurecr.io/general/mariadb:10.4.17-bionic-20210509025121 |
GPLv2, LGPLv2.1 (client libraries) |
defaultbackend |
mirantis.azurecr.io/openstack/extra/defaultbackend:1.0 |
Apache License 2.0 |
nginx-ingress-controller |
mirantis.azurecr.io/openstack/extra/nginx-ingress-controller:0.42.0 |
Apache License 2.0 |
powerdns |
mirantis.azurecr.io/openstack/extra/powerdns:4.2-alpine-20200117133238 |
GPL-2.0 License |
etcd |
mirantis.azurecr.io/openstack/extra/etcd:3.2.26 |
Apache License 2.0 |
ceph-config-helper |
mirantis.azurecr.io/openstack/extra/ceph-config-helper:nautilus-bionic-20210519111601 |
Apache License 2.0, LGPL-2.1 or LGPL-3 |
memcached |
mirantis.azurecr.io/general/memcached:1.6.6-alpine |
BSD 3-Clause “New” or “Revised” License |
docker |
mirantis.azurecr.io/openstack/extra/docker:17.07.0 |
Apache License 2.0 |
kubernetes-entrypoint |
mirantis.azurecr.io/openstack/extra/kubernetes-entrypoint:v1.0.0-20200311160233 |
Apache License 2.0 |
rabbitmq-3.8-management |
mirantis.azurecr.io/general/rabbitmq:3.8.14-management |
Mozilla Public License 2.0 |
rabbitmq-3.8 |
mirantis.azurecr.io/general/rabbitmq:3.8.14 |
Mozilla Public License 2.0 |
openstack-tools |
mirantis.azurecr.io/openstack/openstack-tools:ussuri-bionic-20210517170337 |
Apache License 2.0 |
openvswitch-dpdk |
mirantis.azurecr.io/general/openvswitch-dpdk:2.11-bionic-20210509034813 |
Apache License 2.0 |
openvswitch |
mirantis.azurecr.io/general/openvswitch:2.11-bionic-20210509034813 |
Apache License 2.0 |
pause |
mirantis.azurecr.io/general/external/pause:3.1 |
Apache License 2.0 |
libvirt |
mirantis.azurecr.io/general/libvirt:6.0.0-bionic-20210509034813 |
LGPL-2.1 License |
barbican |
mirantis.azurecr.io/openstack/barbican:ussuri-bionic-20210517170337 |
Apache License 2.0 |
ironic |
mirantis.azurecr.io/openstack/ironic:ussuri-bionic-20210517170337 |
Apache License 2.0 |
designate |
mirantis.azurecr.io/openstack/designate:ussuri-bionic-20210517170337 |
Apache License 2.0 |
octavia |
mirantis.azurecr.io/openstack/octavia:ussuri-bionic-20210517170337 |
Apache License 2.0 |
tempest |
mirantis.azurecr.io/openstack/tempest:ussuri-bionic-20210517170337 |
Apache License 2.0 |
horizon |
mirantis.azurecr.io/openstack/horizon:ussuri-bionic-20210517170337 |
Apache License 2.0 |
nova |
mirantis.azurecr.io/openstack/nova:ussuri-bionic-20210517170337 |
Apache License 2.0 |
neutron |
mirantis.azurecr.io/openstack/neutron:ussuri-bionic-20210517170337 |
Apache License 2.0 |
cinder |
mirantis.azurecr.io/openstack/cinder:ussuri-bionic-20210517170337 |
Apache License 2.0 |
glance |
mirantis.azurecr.io/openstack/glance:ussuri-bionic-20210517170337 |
Apache License 2.0 |
heat |
mirantis.azurecr.io/openstack/heat:ussuri-bionic-20210517170337 |
Apache License 2.0 |
keystone |
mirantis.azurecr.io/openstack/keystone:ussuri-bionic-20210517170337 |
Apache License 2.0 |
frr |
mirantis.azurecr.io/general/external/docker.io/frrouting/frr:v7.5.0 |
GPL-2.0 License |
strongswan New |
mirantis.azurecr.io/openstack/extra/strongswan:alpine-5.9.1-20210511072313 |
GPL License |
Component |
Path |
License information for main executable programs |
|---|---|---|
Helm charts |
||
Tungsten Fabric Operator |
https://binary.mirantis.com/tungsten/helm/tungstenfabric-operator-0.3.1.tgz |
Mirantis Proprietary License |
Docker images |
||
Tungsten Fabric Operator |
mirantis.azurecr.io/tungsten-operator/tungstenfabric-operator:0.3.1 |
Mirantis Proprietary License |
Analytics |
mirantis.azurecr.io/tungsten/contrail-analytics-api:5.1.20210518083050 |
Apache License 2.0 |
mirantis.azurecr.io/tungsten/contrail-analytics-collector:5.1.20210518083050 |
Apache License 2.0 |
|
Analytics Alarm |
mirantis.azurecr.io/tungsten/contrail-analytics-alarm-gen:5.1.20210518083050 |
Apache License 2.0 |
Analytics DB |
mirantis.azurecr.io/tungsten/contrail-analytics-query-engine:5.1.20210518083050 |
Apache License 2.0 |
Analytics SNMP |
mirantis.azurecr.io/tungsten/contrail-analytics-snmp-collector:5.1.20210518083050 |
Apache License 2.0 |
mirantis.azurecr.io/tungsten/contrail-analytics-snmp-topology:5.1.20210518083050 |
Apache License 2.0 |
|
Config |
mirantis.azurecr.io/tungsten/contrail-controller-config-api:5.1.20210518083050 |
Apache License 2.0 |
mirantis.azurecr.io/tungsten/contrail-controller-config-devicemgr:5.1.20210518083050 |
Apache License 2.0 |
|
mirantis.azurecr.io/tungsten/contrail-controller-config-schema:5.1.20210518083050 |
Apache License 2.0 |
|
mirantis.azurecr.io/tungsten/contrail-controller-config-svcmonitor:5.1.20210518083050 |
Apache License 2.0 |
|
Control |
mirantis.azurecr.io/tungsten/contrail-controller-control-control:5.1.20210518083050 |
Apache License 2.0 |
mirantis.azurecr.io/tungsten/contrail-controller-control-dns:5.1.20210518083050 |
Apache License 2.0 |
|
mirantis.azurecr.io/tungsten/contrail-controller-control-named:5.1.20210518083050 |
Apache License 2.0 |
|
Web UI |
mirantis.azurecr.io/tungsten/contrail-controller-webui-job:5.1.20210518083050 |
Apache License 2.0 |
mirantis.azurecr.io/tungsten/contrail-controller-webui-web:5.1.20210518083050 |
Apache License 2.0 |
|
Status |
mirantis.azurecr.io/tungsten/contrail-status:5.1.20210518083050 |
Apache License 2.0 |
mirantis.azurecr.io/tungsten/contrail-tf-status:5.1.20210518083050 |
Apache License 2.0 |
|
mirantis.azurecr.io/tungsten/contrail-tf-status-aggregator:5.1.20210518083050 |
Apache License 2.0 |
|
mirantis.azurecr.io/tungsten/contrail-tf-status-party:5.1.20210518083050 |
Apache License 2.0 |
|
vRouter |
mirantis.azurecr.io/tungsten/contrail-vrouter-agent:5.1.20210518083050 |
Apache License 2.0 |
mirantis.azurecr.io/tungsten/contrail-vrouter-kernel-build-init:5.1.20210518083050 |
Apache License 2.0 |
|
Nodemanager |
mirantis.azurecr.io/tungsten/contrail-nodemgr:5.1.20210518083050 |
Apache License 2.0 |
Cassandra operator |
mirantis.azurecr.io/tungsten-operator/casskop:v0.5.3-release |
Apache License 2.0 |
Cassandra |
mirantis.azurecr.io/tungsten/cassandra-bootstrap:0.1.4 |
Apache License 2.0 |
mirantis.azurecr.io/tungsten/cassandra:3.11.6 |
Apache License 2.0 |
|
Kafka operator |
mirantis.azurecr.io/tungsten-operator/kafka-k8s-operator:0.0.8 |
Mirantis Proprietary License |
Kafka |
mirantis.azurecr.io/tungsten/cp-kafka:5.5.4 |
Apache License 2.0 |
RabbitMQ operator |
mirantis.azurecr.io/tungsten-operator/rabbitmq-operator:0.1.3 |
Mirantis Proprietary License |
RabbitMQ |
mirantis.azurecr.io/general/rabbitmq:3.8.14 |
Mozilla Public License 2.0 |
ZooKeeper operator |
mirantis.azurecr.io/tungsten-operator/zookeeper-operator:0.2.10 |
Apache License 2.0 |
ZooKeeper |
mirantis.azurecr.io/tungsten/zookeeper:3.6.1-0.2.9 |
Apache License 2.0 |
Redis operator |
mirantis.azurecr.io/tungsten-operator/redis-operator:0.1.5-1-ccd6a63 |
Apache License 2.0 |
Redis |
mirantis.azurecr.io/tungsten/redis:5-alpine |
BSD 3-Clause “New” or “Revised” License |
TF Test |
mirantis.azurecr.io/tungsten/tungsten-pytest:0.1-20210428100236 |
MIT License |
TF CLI |
mirantis.azurecr.io/tungsten/tf-cli:0.1-20210214191656 |
MIT License |
TF NodeInfo New |
mirantis.azurecr.io/tungsten/tf-nodeinfo:0.1-20210430090010 |
MIT License |
Component |
Path |
License information for main executable programs |
|---|---|---|
Helm charts |
||
Tungsten Fabric Operator |
https://binary.mirantis.com/tungsten/helm/tungstenfabric-operator-0.3.1.tgz |
Mirantis Proprietary License |
Docker images |
||
Tungsten Fabric Operator |
mirantis.azurecr.io/tungsten-operator/tungstenfabric-operator:0.3.1 |
Mirantis Proprietary License |
Analytics |
mirantis.azurecr.io/tungsten/contrail-analytics-api:mos-R2011-20210520121530 |
Apache License 2.0 |
mirantis.azurecr.io/tungsten/contrail-analytics-collector:mos-R2011-20210520121530 |
Apache License 2.0 |
|
Analytics Alarm |
mirantis.azurecr.io/tungsten/contrail-analytics-alarm-gen:mos-R2011-20210520121530 |
Apache License 2.0 |
Analytics DB |
mirantis.azurecr.io/tungsten/contrail-analytics-query-engine:mos-R2011-20210520121530 |
Apache License 2.0 |
Analytics SNMP |
mirantis.azurecr.io/tungsten/contrail-analytics-snmp-collector:mos-R2011-20210520121530 |
Apache License 2.0 |
mirantis.azurecr.io/tungsten/contrail-analytics-snmp-topology:mos-R2011-20210520121530 |
Apache License 2.0 |
|
Config |
mirantis.azurecr.io/tungsten/contrail-controller-config-api:mos-R2011-20210520121530 |
Apache License 2.0 |
mirantis.azurecr.io/tungsten/contrail-controller-config-devicemgr:mos-R2011-20210520121530 |
Apache License 2.0 |
|
mirantis.azurecr.io/tungsten/contrail-controller-config-schema:mos-R2011-20210520121530 |
Apache License 2.0 |
|
mirantis.azurecr.io/tungsten/contrail-controller-config-svcmonitor:mos-R2011-20210520121530 |
Apache License 2.0 |
|
Control |
contrail-controller-control-control:mos-R2011-20210520121530 |
Apache License 2.0 |
mirantis.azurecr.io/tungsten/contrail-controller-control-dns:mos-R2011-20210520121530 |
Apache License 2.0 |
|
mirantis.azurecr.io/tungsten/contrail-controller-control-named:mos-R2011-20210520121530 |
Apache License 2.0 |
|
Web UI |
mirantis.azurecr.io/tungsten/contrail-controller-webui-job:mos-R2011-20210520121530 |
Apache License 2.0 |
mirantis.azurecr.io/tungsten/contrail-controller-webui-web:mos-R2011-20210520121530 |
Apache License 2.0 |
|
Status |
mirantis.azurecr.io/tungsten/contrail-status:mos-R2011-20210520121530 |
Apache License 2.0 |
mirantis.azurecr.io/tungsten/contrail-tf-status:mos-R2011-20210520121530 |
Apache License 2.0 |
|
mirantis.azurecr.io/tungsten/contrail-tf-status-aggregator:mos-R2011-20210520121530 |
Apache License 2.0 |
|
mirantis.azurecr.io/tungsten/contrail-tf-status-party:mos-R2011-20210520121530 |
Apache License 2.0 |
|
vRouter |
mirantis.azurecr.io/tungsten/contrail-vrouter-agent:mos-R2011-20210520121530 |
Apache License 2.0 |
mirantis.azurecr.io/tungsten/contrail-vrouter-kernel-build-init:mos-R2011-20210520121530 |
Apache License 2.0 |
|
Nodemanager |
mirantis.azurecr.io/tungsten/contrail-nodemgr:mos-R2011-20210520121530 |
Apache License 2.0 |
Provisioner |
mirantis.azurecr.io/tungsten/contrail-provisioner:mos-R2011-20210520121530 |
Apache License 2.0 |
Cassandra operator |
mirantis.azurecr.io/tungsten-operator/casskop:v0.5.3-release |
Apache License 2.0 |
Cassandra |
mirantis.azurecr.io/tungsten/cassandra-bootstrap:0.1.4 |
Apache License 2.0 |
mirantis.azurecr.io/tungsten/cassandra:3.11.6 |
Apache License 2.0 |
|
Kafka operator |
mirantis.azurecr.io/tungsten-operator/kafka-k8s-operator:0.0.8 |
Mirantis Proprietary License |
Kafka |
mirantis.azurecr.io/tungsten/cp-kafka:5.5.4 |
Apache License 2.0 |
RabbitMQ operator |
mirantis.azurecr.io/tungsten-operator/rabbitmq-operator:0.1.3 |
Mirantis Proprietary License |
RabbitMQ |
mirantis.azurecr.io/general/rabbitmq:3.8.14 |
Mozilla Public License 2.0 |
ZooKeeper operator |
mirantis.azurecr.io/tungsten-operator/zookeeper-operator:0.2.10 |
Apache License 2.0 |
ZooKeeper |
mirantis.azurecr.io/tungsten/zookeeper:3.6.1-0.2.9 |
Apache License 2.0 |
Redis operator |
mirantis.azurecr.io/tungsten-operator/redis-operator:0.1.5-1-ccd6a63 |
Apache License 2.0 |
Redis |
mirantis.azurecr.io/tungsten/redis:5-alpine |
BSD 3-Clause “New” or “Revised” License |
TF Test |
mirantis.azurecr.io/tungsten/tungsten-pytest:0.1-20210428100236 |
MIT License |
TF CLI |
mirantis.azurecr.io/tungsten/tf-cli:0.1-20210214191656 |
MIT License |
TF NodeInfo New |
mirantis.azurecr.io/tungsten/tf-nodeinfo:0.1-20210430090010 |
MIT License |
Component |
Path |
License information for main executable programs |
|---|---|---|
Docker images |
||
prometheus-libvirt-exporter |
mirantis.azurecr.io/stacklight/libvirt-exporter:v0.1-20200610164751 |
Mirantis Proprietary License |
prometheus-tungstenfabric-exporter |
mirantis.azurecr.io/stacklight/tungstenfabric-prometheus-exporter:0.1-20210115152338 |
Mirantis Proprietary License |
Helm charts |
||
prometheus-libvirt-exporter |
https://binary.mirantis.com/stacklight/helm/prometheus-libvirt-exporter-0.1.0-mcp-2.tgz |
Mirantis Proprietary License |
prometheus-tungstenfabric-exporter |
https://binary.mirantis.com/stacklight/helm/prometheus-tungstenfabric-exporter-0.1.0-mcp-1.tgz |
Mirantis Proprietary License |
The following issues have been addressed in the Mirantis OpenStack for Kubernetes 21.3 release:
[13422][OpenStack] Fixed the issue with some Redis pods remaining in
Pendingstate and causing failure to update the Cluster release.[12511][OpenStack] Fixed the issue with Kubernetes nodes getting stuck in the
Preparestate during the MOS cluster update.[13233][StackLight] Fixed the issue with low memory limits for StackLight Helm Controller causing update failure.
[12917][StackLight] Fixed the issue with
prometheus-tf-vrouter-exporterpods failing to start on Tungsten Fabric nodes with DPDK. To remove thenodeSelectordefinition specified when applying the workaround:Remove the
nodeSelector.component.tfVrouterExporterdefinition from thestackLighthelmRelease(.spec.providerSpec.value.helmReleases) values of the Cluster resource.Remove the label using the following command. Do not remove the last dash sign.
kubectl label node <node_name> tfvrouter-fix-
[11961][Tungsten Fabric] Fixed the issue with members failing to join the RabbitMQ cluster after the
tf-controlnodes reboot.
MOS 21.2 release
Release date |
Name |
Container Cloud Cluster release |
Highlights |
|---|---|---|---|
April 22, 2021 |
MOS 21.2 |
6.14.0+21.2 |
Update for the MOS GA release introducing proxy support and the following Technology Preview features:
|
Implemented the cache and proxy support for MOS managed clusters. By default, during a MOS cluster deployment and update the Mirantis artifacts are downloaded through a cache running on a management or regional cluster. If you have an external application that requires Internet access, you can now use proxy with required parameters specified for that application.
TechPreview
Implemented the capability to enable Masakari, the OpenStack service that ensures high availability of instances running on a host. The feature is disabled by default.
TechPreview
Implemented the capability to configure LVM as a backend for the VM disks and ephemeral storage and configure ephemeral disk encryption.
TechPreview
Implemented the capability to enable SR-IOV for the Tungsten Fabric vRouter.
TechPreview
Implemented the capability to specify custom settings for the Tungsten Fabric
vRouter nodes using the customSpecs parameter, such as to change the name
of the tunnel network interface or enable debug level logging.
Improved user experience by moving the rgw.ingress parameters of the
KaasCephCluster CR to a common cephClusterSpec.ingress section. The
rgw section is deprecated. However, if you continue using rgw.ingress,
it will be automatically translated into cephClusterSpec.ingress during
the MOS cluster release update.
Learn more
Mirantis has tested MOS against a very specific configuration and can guarantee a predictable behavior of the product only in the exact same environments. The table below includes the major MOS components with the exact versions against which testing has been performed.
This section contains the description of the known issues with available workarounds.
This section lists the Tungsten Fabric known issues with workarounds for the Mirantis OpenStack for Kubernetes release 21.2.
[10096] tf-control does not refresh IP addresses of Cassandra pods
[13755] TF pods switch to CrashLoopBackOff after a simultaneous reboot
Tungsten Fabric does not provide the following functionality:
Automatic generation of network port records in DNSaaS (Designate) as Neutron with Tungsten Fabric as a backend is not integrated with DNSaaS. As a workaround, you can use the Tungsten Fabric built-in DNS service that enables virtual machines to resolve each other names.
Secret management (Barbican). You cannot use the certificates stored in Barbican to terminate HTTPs in a load balancer.
Role Based Access Control (RBAC) for Neutron objects.
Modification of custom vRouter DaemonSets based on the SR-IOV definition in the
OsDplCR.
The tf-control service resolves the DNS names of Cassandra pods at startup
and does not update them if Cassandra pods got new IP addresses, for example,
in case of a restart. As a workaround, to refresh the IP addresses of
Cassandra pods, restart the tf-control pods one by one:
Caution
Before restarting the tf-control pods:
Verify that the new pods are successfully spawned.
Verify that no vRouters are connected to only one
tf-controlpod that will be restarted.
kubectl -n tf delete pod tf-control-<hash>
Rebooting all Cassandra cluster TFConfig or TFAnalytics nodes,
maintenance, or other circumstances that cause the Cassandra pods to
start simultaneously may cause a broken Cassandra TFConfig and/or
TFAnalytics cluster. In this case, Cassandra nodes do not join the
ring and do not update the IPs of the neighbor nodes. As a result, the
TF services cannot operate Cassandra cluster(s).
To verify that a Cassandra cluster is affected:
Run the nodetool status command specifying the config or
analytics cluster and the replica number:
kubectl -n tf exec -it tf-cassandra-<config/analytics>-dc1-rack1-<replica number> -c cassandra -- nodetool status
Example of system response with outdated IP addresses:
Datacenter: DC1
===============
Status=Up/Down
|/ State=Normal/Leaving/Joining/Moving
-- Address Load Tokens Owns (effective) Host ID Rack
DN <outdated ip> ? 256 64.9% a58343d0-1e3f-4d54-bcdf-9b9b949ca873 r1
DN <outdated ip> ? 256 69.8% 67f1d07c-8b13-4482-a2f1-77fa34e90d48 r1
Datacenter: dc1
===============
Status=Up/Down
|/ State=Normal/Leaving/Joining/Moving
-- Address Load Tokens Owns (effective) Host ID Rack
UN <actual ip> 3.84 GiB 256 65.2% 7324ebc4-577a-425f-b3de-96faac95a331 rack1
Workaround:
Manually delete a Cassandra pod from the failed config or analytics
cluster to re-initiate the bootstrap process for one of the Cassandra nodes:
kubectl -n tf delete pod tf-cassandra-<config/analytics>-dc1-rack1-<replica number>
This section lists the OpenStack known issues with workarounds for the Mirantis OpenStack for Kubernetes release 21.2.
[13422] Redis pods remain in Pending state and cause update failure
[6912] Octavia load balancers may not work properly with DVR
During the MOS cluster update to Cluster release
6.14.0, some Redis pods may remain in the Pending state and cause update
failure.
Workaround:
Scale the Redis deployment to
0replicas:kubectl -n openstack-redis scale deployment rfs-openstack-redis --replicas=0
Wait for the pods removal.
Scale the Redis deployment back to
3replicas:kubectl -n openstack-redis scale deployment rfs-openstack-redis --replicas=3
Obtain the list of replicas:
kubectl -n openstack-redis get replicaset
Example of system response:
NAME DESIRED CURRENT READY AGE os-redis-operator-redisoperator-6bd8455f8c 1 1 1 26h rfs-openstack-redis-568b8f6fcb 0 0 0 26h rfs-openstack-redis-798655cf9b 3 3 3 24h
Remove the ReplicaSet with
0replicas:kubectl -n openstack-redis delete replicaset rfs-openstack-redis-568b8f6fcb
During the MOS cluster update to Cluster release
6.14.0, Kubernetes nodes may get stuck in the Prepare state. At the same
time, the LCM Controller logs may contain the following errors:
evicting pod "horizon-57f7ccff74-d469c"
error when evicting pod "horizon-57f7ccff74-d469c" (will retry after
5s): Cannot evict pod as it would violate the pod's disruption budget.
The workaround is to decrease the Pod Disruption Budget (PDB) limit for Horizon by executing the following command on the managed cluster:
kubectl -n openstack patch pdb horizon -p='{"spec": {"minAvailable": 1}}'
After the MOS cluster update, Octavia amphora may get stuck with the WARNING octavia.amphorae.drivers.haproxy.rest_api_driver [-] Could not connect to instance. Retrying. error message present in the Octavia worker logs. The workaround is to manually switch the Octavia amphorae driver from V2 to V1.
Workaround:
In the OsDpl CR, specify the following configuration:
spec: services: load-balancer: octavia: values: conf: octavia: api_settings: default_provider_driver: amphora
Trigger the OpenStack deployment to restart Octavia:
kubectl apply -f openstackdeployment.yaml
To monitor the status:
kubectl -n openstack get pods kubectl -n openstack describe osdpl osh-dev
Limitation
When Neutron is deployed in the DVR mode, Octavia load balancers may not work correctly. The symptoms include both failure to properly balance traffic and failure to perform an amphora failover. For details, see DVR incompatibility with ARP announcements and VRRP.
This section lists the StackLight known issues with workarounds for the Mirantis OpenStack for Kubernetes release 21.2.
[13233] Low memory limits for StackLight Helm Controller cause update failure
[12917] prometheus-tf-vrouter-exporter pods fail to start on TF nodes with DPDK
During the MOS cluster update to Cluster release
6.14.0, StackLight Helm Controller containers (controller and/or
tiller) may get OOMKilled and cause failure to update.
As a workaround, manually increase the default resource requests and limits
for stacklightHelmControllerController and
stacklightHelmControllerTiller in the StackLight Helm chart values of the
Cluster release resource:
resources:
stacklightHelmControllerController:
requests:
cpu: "250m"
memory: "128Mi"
limits:
cpu: "1000m"
memory: "512Mi"
stacklightHelmControllerTiller:
requests:
cpu: "250m"
memory: "128Mi"
limits:
cpu: "1000m"
memory: "2048Mi"
For details about resource limits, see Operations Guide: Resource limits.
StackLight deploys the prometheus-tf-vrouter-exporter exporter based on the
node selector matching the tfvrouter: enabled node label. The Tungsten
Fabric nodes with DPDK have the tfvrouter-dpdk: enabled label set instead.
Therefore, the prometheus-tf-vrouter-exporter exporter fails to start on
these nodes.
Workaround:
Add the
tfvrouter-fix: enabledlabel to every node that contains either thetfvrouter: enabledor thetfvrouter-dpdk: enablednode label.kubectl label node <node_name> tfvrouter-fix=enabled
In the Cluster release resource, specify the following
nodeSelectordefinition in the StackLight Helm chart values:nodeSelector: component: tfVrouterExporter: tfvrouter-fix: enabled
Once done, prometheus-tf-vrouter-exporter will be deployed to every node
with the tfvrouter-fix: enabled label.
This section lists the components artifacts of the MOS 21.2 release:
Component |
Path |
License information for main executable programs |
|---|---|---|
Binaries |
||
mirantis |
https://binary.mirantis.com/openstack/bin/horizon/mirantis-victoria-8f71802-20210119120707.tar.gz |
Mirantis Proprietary License |
octavia-amphora |
https://binary.mirantis.com/openstack/bin/octavia/amphora-x64-haproxy-victoria-20210318064459.qcow2 |
Mirantis Proprietary License |
Docker images |
||
ironic-inspector New |
mirantis.azurecr.io/openstack/ironic-inspector:victoria-bionic-20210326055904 |
Apache License 2.0 |
masakari-monitors New |
mirantis.azurecr.io/openstack/masakari-monitors:victoria-bionic-20210326055904 |
Apache License 2.0 |
masakari New |
mirantis.azurecr.io/openstack/masakari:victoria-bionic-20210326055904 |
Apache License 2.0 |
stepler |
mirantis.azurecr.io/openstack/stepler:victoria-bionic-20210325154004 |
Mirantis Proprietary License |
placement |
mirantis.azurecr.io/openstack/placement:victoria-bionic-20210326055904 |
Apache License 2.0 |
keystone |
mirantis.azurecr.io/openstack/keystone:victoria-bionic-20210326055904 |
Apache License 2.0 |
heat |
mirantis.azurecr.io/openstack/heat:victoria-bionic-20210326055904 |
Apache License 2.0 |
glance |
mirantis.azurecr.io/openstack/glance:victoria-bionic-20210326055904 |
Apache License 2.0 |
cinder |
mirantis.azurecr.io/openstack/cinder:victoria-bionic-20210326055904 |
Apache License 2.0 |
neutron |
mirantis.azurecr.io/openstack/neutron:victoria-bionic-20210326055904 |
Apache License 2.0 |
nova |
mirantis.azurecr.io/openstack/nova:victoria-bionic-20210326055904 |
Apache License 2.0 |
horizon |
mirantis.azurecr.io/openstack/horizon:victoria-bionic-20210326055904 |
Apache License 2.0 |
tempest |
mirantis.azurecr.io/openstack/tempest:victoria-bionic-20210326055904 |
Apache License 2.0 |
octavia |
mirantis.azurecr.io/openstack/octavia:victoria-bionic-20210326055904 |
Apache License 2.0 |
designate |
mirantis.azurecr.io/openstack/designate:victoria-bionic-20210326055904 |
Apache License 2.0 |
ironic |
mirantis.azurecr.io/openstack/ironic:victoria-bionic-20210326055904 |
Apache License 2.0 |
barbican |
mirantis.azurecr.io/openstack/barbican:victoria-bionic-20210326055904 |
Apache License 2.0 |
libvirt |
mirantis.azurecr.io/general/libvirt:6.0.0-bionic-20210325145045 |
LGPL-2.1 License |
pause |
mirantis.azurecr.io/general/external/pause:3.1 |
Apache License 2.0 |
openvswitch |
mirantis.azurecr.io/general/openvswitch:2.11-bionic-20210325145045 |
Apache License 2.0 |
openvswitch-dpdk |
mirantis.azurecr.io/general/openvswitch-dpdk:2.11-bionic-20210325145045 |
Apache License 2.0 |
openstack-tools |
mirantis.azurecr.io/openstack/openstack-tools:ussuri-bionic-20210323180013 |
Apache License 2.0 |
rabbitmq-3.8 |
mirantis.azurecr.io/general/rabbitmq:3.8.9 |
Mozilla Public License 2.0 |
rabbitmq-3.8-management |
mirantis.azurecr.io/general/rabbitmq:3.8.9-management |
Mozilla Public License 2.0 |
kubernetes-entrypoint |
mirantis.azurecr.io/openstack/extra/kubernetes-entrypoint:v1.0.0-20200311160233 |
Apache License 2.0 |
docker |
mirantis.azurecr.io/openstack/extra/docker:17.07.0 |
Apache License 2.0 |
memcached |
mirantis.azurecr.io/general/memcached:1.6.6-alpine |
BSD 3-Clause “New” or “Revised” License |
ceph-config-helper |
mirantis.azurecr.io/openstack/extra/ceph-config-helper:nautilus-bionic-20210202133935 |
Apache License 2.0, LGPL-2.1 or LGPL-3 |
etcd |
mirantis.azurecr.io/openstack/extra/etcd:3.2.26 |
Apache License 2.0 |
powerdns |
mirantis.azurecr.io/openstack/extra/powerdns:4.2-alpine-20200117133238 |
GPL-2.0 License |
nginx-ingress-controller |
mirantis.azurecr.io/openstack/extra/nginx-ingress-controller:0.42.0 |
Apache License 2.0 |
defaultbackend |
mirantis.azurecr.io/openstack/extra/defaultbackend:1.0 |
Apache License 2.0 |
mariadb |
mirantis.azurecr.io/general/mariadb:10.4.17-bionic-20210203155435 |
GPLv2, LGPLv2.1 (client libraries) |
xrally-openstack |
mirantis.azurecr.io/openstack/extra/xrally-openstack:2.1.0-20210212172540 |
Apache License 2.0 |
prometheus-memcached-exporter |
mirantis.azurecr.io/stacklight/memcached-exporter:v0.5.0 |
Apache License 2.0 |
prometheus-mysql-exporter |
mirantis.azurecr.io/stacklight/mysqld-exporter:v0.11.0 |
Apache License 2.0 |
rabbitmq-exporter |
mirantis.azurecr.io/stacklight/rabbitmq-exporter:v1.0.0-RC7.1 |
MIT License |
aodh |
mirantis.azurecr.io/openstack/aodh:victoria-bionic-20210326055904 |
Apache License 2.0 |
panko |
mirantis.azurecr.io/openstack/panko:victoria-bionic-20210326055904 |
Apache License 2.0 |
ceilometer |
mirantis.azurecr.io/openstack/ceilometer:victoria-bionic-20210326055904 |
Apache License 2.0 |
gnocchi |
mirantis.azurecr.io/openstack/gnocchi:victoria-bionic-20210326055904 |
Apache License 2.0 |
redis |
mirantis.azurecr.io/openstack/extra/redis:5.0-alpine |
BSD 3-Clause “New” or “Revised” License |
frr New |
mirantis.azurecr.io/general/external/docker.io/frrouting/frr:v7.5.0 |
GPL-2.0 License |
Component |
Path |
License information for main executable programs |
|---|---|---|
Binaries |
||
mirantis |
https://binary.mirantis.com/openstack/bin/horizon/mirantis-ussuri-48f346e-20210119132403.tar.gz |
Mirantis Proprietary License |
octavia-amphora |
https://binary.mirantis.com/openstack/bin/octavia/amphora-x64-haproxy-ussuri-20210121085750.qcow2 |
Mirantis Proprietary License |
Docker images |
||
ironic-inspector New |
mirantis.azurecr.io/openstack/ironic-inspector:ussuri-bionic-20210326055904 |
Apache License 2.0 |
masakari-monitors New |
mirantis.azurecr.io/openstack/masakari-monitors:ussuri-bionic-20210326055904 |
Apache License 2.0 |
masakari New |
mirantis.azurecr.io/openstack/masakari:ussuri-bionic-20210326055904 |
Apache License 2.0 |
stepler |
mirantis.azurecr.io/openstack/stepler:ussuri-bionic-20210325151618 |
Mirantis Proprietary License |
placement |
mirantis.azurecr.io/openstack/placement:ussuri-bionic-20210326055904 |
Apache License 2.0 |
redis |
mirantis.azurecr.io/openstack/extra/redis:5.0-alpine |
BSD 3-Clause “New” or “Revised” License |
gnocchi |
mirantis.azurecr.io/openstack/gnocchi:ussuri-bionic-20210326055904 |
Apache License 2.0 |
ceilometer |
mirantis.azurecr.io/openstack/ceilometer:ussuri-bionic-20210326055904 |
Apache License 2.0 |
panko |
mirantis.azurecr.io/openstack/panko:ussuri-bionic-20210326055904 |
Apache License 2.0 |
aodh |
mirantis.azurecr.io/openstack/aodh:ussuri-bionic-20210326055904 |
Apache License 2.0 |
xrally-openstack |
mirantis.azurecr.io/openstack/extra/xrally-openstack:2.1.0-20210212172540 |
Apache License 2.0 |
prometheus-memcached-exporter |
mirantis.azurecr.io/stacklight/memcached-exporter:v0.5.0 |
Apache License 2.0 |
prometheus-mysql-exporter |
mirantis.azurecr.io/stacklight/mysqld-exporter:v0.11.0 |
Apache License 2.0 |
rabbitmq-exporter |
mirantis.azurecr.io/stacklight/rabbitmq-exporter:v1.0.0-RC7.1 |
MIT License |
mariadb |
mirantis.azurecr.io/general/mariadb:10.4.17-bionic-20210203155435 |
GPLv2, LGPLv2.1 (client libraries) |
defaultbackend |
mirantis.azurecr.io/openstack/extra/defaultbackend:1.0 |
Apache License 2.0 |
nginx-ingress-controller |
mirantis.azurecr.io/openstack/extra/nginx-ingress-controller:0.42.0 |
Apache License 2.0 |
powerdns |
mirantis.azurecr.io/openstack/extra/powerdns:4.2-alpine-20200117133238 |
GPL-2.0 License |
etcd |
mirantis.azurecr.io/openstack/extra/etcd:3.2.26 |
Apache License 2.0 |
ceph-config-helper |
mirantis.azurecr.io/openstack/extra/ceph-config-helper:nautilus-bionic-20210202133935 |
Apache License 2.0, LGPL-2.1 or LGPL-3 |
memcached |
mirantis.azurecr.io/general/memcached:1.6.6-alpine |
BSD 3-Clause “New” or “Revised” License |
docker |
mirantis.azurecr.io/openstack/extra/docker:17.07.0 |
Apache License 2.0 |
kubernetes-entrypoint |
mirantis.azurecr.io/openstack/extra/kubernetes-entrypoint:v1.0.0-20200311160233 |
Apache License 2.0 |
rabbitmq-3.8-management |
mirantis.azurecr.io/general/rabbitmq:3.8.9-management |
Mozilla Public License 2.0 |
rabbitmq-3.8 |
mirantis.azurecr.io/general/rabbitmq:3.8.9 |
Mozilla Public License 2.0 |
openstack-tools |
mirantis.azurecr.io/openstack/openstack-tools:ussuri-bionic-20210326055904 |
Apache License 2.0 |
openvswitch-dpdk |
mirantis.azurecr.io/general/openvswitch-dpdk:2.11-bionic-20210325145045 |
Apache License 2.0 |
openvswitch |
mirantis.azurecr.io/general/openvswitch:2.11-bionic-20210325145045 |
Apache License 2.0 |
pause |
mirantis.azurecr.io/general/external/pause:3.1 |
Apache License 2.0 |
libvirt |
mirantis.azurecr.io/general/libvirt:6.0.0-bionic-20210325145045 |
LGPL-2.1 License |
barbican |
mirantis.azurecr.io/openstack/barbican:ussuri-bionic-20210326055904 |
Apache License 2.0 |
ironic |
mirantis.azurecr.io/openstack/ironic:ussuri-bionic-20210326055904 |
Apache License 2.0 |
designate |
mirantis.azurecr.io/openstack/designate:ussuri-bionic-20210326055904 |
Apache License 2.0 |
octavia |
mirantis.azurecr.io/openstack/octavia:ussuri-bionic-20210326055904 |
Apache License 2.0 |
tempest |
mirantis.azurecr.io/openstack/tempest:ussuri-bionic-20210326055904 |
Apache License 2.0 |
horizon |
mirantis.azurecr.io/openstack/horizon:ussuri-bionic-20210326055904 |
Apache License 2.0 |
nova |
mirantis.azurecr.io/openstack/nova:ussuri-bionic-20210326055904 |
Apache License 2.0 |
neutron |
mirantis.azurecr.io/openstack/neutron:ussuri-bionic-20210326055904 |
Apache License 2.0 |
cinder |
mirantis.azurecr.io/openstack/cinder:ussuri-bionic-20210326055904 |
Apache License 2.0 |
glance |
mirantis.azurecr.io/openstack/glance:ussuri-bionic-20210326055904 |
Apache License 2.0 |
heat |
mirantis.azurecr.io/openstack/heat:ussuri-bionic-20210326055904 |
Apache License 2.0 |
keystone |
mirantis.azurecr.io/openstack/keystone:ussuri-bionic-20210326055904 |
Apache License 2.0 |
frr New |
mirantis.azurecr.io/general/external/docker.io/frrouting/frr:v7.5.0 |
GPL-2.0 License |
Component |
Path |
License information for main executable programs |
|---|---|---|
Helm charts |
||
Tungsten Fabric Operator |
https://binary.mirantis.com/tungsten/helm/tungstenfabric-operator-0.2.6.tgz |
Mirantis Proprietary License |
Docker images |
||
TF Analytics |
mirantis.azurecr.io/tungsten/contrail-analytics-api:5.1.20210312153639 |
Apache License 2.0 |
mirantis.azurecr.io/tungsten/contrail-analytics-collector:5.1.20210312153639 |
Apache License 2.0 |
|
TF Analytics Alarm |
mirantis.azurecr.io/tungsten/contrail-analytics-alarm-gen:20210312153639 |
Apache License 2.0 |
TF Analytics DB |
mirantis.azurecr.io/tungsten/contrail-analytics-query-engine:5.1.20210312153639 |
Apache License 2.0 |
TF Analytics SNMP |
mirantis.azurecr.io/tungsten/contrail-analytics-snmp-collector:5.1.20210312153639 |
Apache License 2.0 |
mirantis.azurecr.io/tungsten/contrail-analytics-snmp-topology:5.1.20210312153639 |
Apache License 2.0 |
|
TF Config |
mirantis.azurecr.io/tungsten/contrail-controller-config-api:5.1.20210312153639 |
Apache License 2.0 |
mirantis.azurecr.io/tungsten/contrail-controller-config-devicemgr:5.1.20210312153639 |
Apache License 2.0 |
|
mirantis.azurecr.io/tungsten/contrail-controller-config-schema:5.1.20210312153639 |
Apache License 2.0 |
|
mirantis.azurecr.io/tungsten/contrail-controller-config-svcmonitor:5.1.20210312153639 |
Apache License 2.0 |
|
TF Control |
mirantis.azurecr.io/tungsten/contrail-controller-control-control:5.1.20210312153639 |
Apache License 2.0 |
mirantis.azurecr.io/tungsten/contrail-controller-control-dns:5.1.20210312153639 |
Apache License 2.0 |
|
mirantis.azurecr.io/tungsten/contrail-controller-control-named:5.1.20210312153639 |
Apache License 2.0 |
|
TF Web UI |
mirantis.azurecr.io/tungsten/contrail-controller-webui-job:5.1.20210312153639 |
Apache License 2.0 |
mirantis.azurecr.io/tungsten/contrail-controller-webui-web:5.1.20210312153639 |
Apache License 2.0 |
|
Nodemanager |
mirantis.azurecr.io/tungsten/contrail-nodemgr:5.1.20210312153639 |
Apache License 2.0 |
TF Status |
mirantis.azurecr.io/tungsten/contrail-status:5.1.20210312153639 |
Apache License 2.0 |
mirantis.azurecr.io/tungsten/contrail-tf-status:5.1.20210312153639 |
Apache License 2.0 |
|
mirantis.azurecr.io/tungsten/contrail-tf-status-aggregator:5.1.20210312153639 |
Apache License 2.0 |
|
mirantis.azurecr.io/tungsten/contrail-tf-status-party:5.1.20210312153639 |
Apache License 2.0 |
|
TF VRouter |
mirantis.azurecr.io/tungsten/contrail-vrouter-agent:5.1.20210312153639 |
Apache License 2.0 |
mirantis.azurecr.io/tungsten/contrail-vrouter-kernel-build-init:5.1.20210312153639 |
Apache License 2.0 |
|
Cassandra operator |
mirantis.azurecr.io/tungsten-operator/casskop:v0.5.3-release |
Apache License 2.0 |
Cassandra |
mirantis.azurecr.io/tungsten/cassandra-bootstrap:0.1.4 |
Apache License 2.0 |
mirantis.azurecr.io/tungsten/cassandra:3.11.6 |
Apache License 2.0 |
|
Kafka operator |
mirantis.azurecr.io/tungsten-operator/kafka-k8s-operator:0.0.7 |
Mirantis Proprietary License |
Kafka |
mirantis.azurecr.io/tungsten/cp-kafka:5.5.2 |
Apache License 2.0 |
RabbitMQ operator |
mirantis.azurecr.io/tungsten-operator/rabbitmq-operator:0.1.1 |
Mirantis Proprietary License |
RabbitMQ |
mirantis.azurecr.io/general/rabbitmq:3.8.9 |
Mozilla Public License 2.0 |
Zookeeper operator |
mirantis.azurecr.io/tungsten-operator/zookeeper-operator:0.2.9 |
Apache License 2.0 |
Zookeeper |
mirantis.azurecr.io/tungsten/zookeeper:3.6.1-0.2.9 |
Apache License 2.0 |
Redis operator |
mirantis.azurecr.io/tungsten-operator/redis-operator:0.1.5-1-ccd6a63 |
Apache License 2.0 |
Redis |
mirantis.azurecr.io/tungsten/redis:5-alpine |
BSD 3-Clause “New” or “Revised” License |
TF Test |
mirantis.azurecr.io/tungsten/tungsten-pytest:0.1-20210211114307 |
MIT License |
TF CLI |
mirantis.azurecr.io/tungsten/tf-cli:0.1-20210214191656 |
MIT License |
Component |
Path |
License information for main executable programs |
|---|---|---|
Docker images |
||
prometheus-libvirt-exporter |
mirantis.azurecr.io/stacklight/libvirt-exporter:v0.1-20200610164751 |
Mirantis Proprietary License |
prometheus-tungstenfabric-exporter |
mirantis.azurecr.io/stacklight/tungstenfabric-prometheus-exporter:0.1-20210115152338 |
Mirantis Proprietary License |
Helm charts |
||
prometheus-libvirt-exporter |
https://binary.mirantis.com/stacklight/helm/prometheus-libvirt-exporter-0.1.0-mcp-2.tgz |
Mirantis Proprietary License |
prometheus-tungstenfabric-exporter |
https://binary.mirantis.com/stacklight/helm/prometheus-tungstenfabric-exporter-0.1.0-mcp-1.tgz |
Mirantis Proprietary License |
The following issues have been addressed in the Mirantis OpenStack for Kubernetes 21.2 release:
[7725][Tungsten Fabric] Fixed the issue with the Neturon service failing to create a network through Horizon and OpenStack CLI throwing the
An unknown exception occurrederror.
MOS 21.1 release
Release date |
Name |
Container Cloud Cluster release |
Highlights |
|---|---|---|---|
March 01, 2021 |
MOS 21.1 |
6.12.0+21.1 |
Update for the MOS GA release introducing support for the PCI passthrough feature and Tungsten Fabric monitoring, as well as the following Technology Preview features:
|
Added support for the Peripheral Component Interconnect (PCI) passthrough feature in OpenStack to use, mainly, as a part of the SR-IOV network traffic acceleration technique. Now, MOS enables the user to configure Nova on a per-node basis to allow PCI devices to be passed through from hosts to virtual machines.
TechPreview
Implemented support for OpenStack Victoria with Neutron OVS and Tungsten Fabric 5.1.
TechPreview
Implemented support for the SR-IOV with the Neutron OVS backend topology.
Learn more
TechPreview
Implemented the capability to colocate components on the same host, for example, Ceph OSD and OpenStack compute.
Enhanced StackLight to monitor Tungsten Fabric and its components, including Casandra, Kafka, Redis, and ZooKeeper. Implemented the Tungsten Fabric alerts and Grafana dashboards. The feature is disabled by default. You can enable it manually during or after the Tungsten Fabric deployment.
Implemented alert inhibition rules to provide a clearer view on the cloud status and simplify troubleshooting. Using alert inhibition rules, Alertmanager decreases alert noise by suppressing dependent alerts notifications. The feature is enabled by default. For details, see Operations Guide: Alert dependencies.
Implemented integration between Grafana and Kibana by adding a View logs in Kibana link to most Grafana dashboards, which allows you to immediately view contextually relevant logs through the Kibana web UI.
Learn more
Added the capability to configure the Transport Layer Security (TLS) protocol
for a Ceph RGW public endpoint using MOS TLS if enabled,
or using a custom ingress specified in the KaaSCephCluster custom
resource.
Learn more
Mirantis has tested MOS against a very specific configuration and can guarantee a predictable behavior of the product only in the exact same environments. The table below includes the major MOS components with the exact versions against which testing has been performed.
This section contains the description of the known issues with available workarounds.
This section lists the OpenStack known issues for the Mirantis OpenStack for Kubernetes release 21.1.
Limitation
When Neutron is deployed in the DVR mode, Octavia load balancers may not work correctly. The symptoms include both failure to properly balance traffic and failure to perform an amphora failover. For details, see DVR incompatibility with ARP announcements and VRRP.
This section lists the Tungsten Fabric known issues with workarounds for the Mirantis OpenStack for Kubernetes release 21.1.
Tungsten Fabric does not provide the following functionality:
Automatic generation of network port records in DNSaaS (Designate) as Neutron with Tungsten Fabric as a backend is not integrated with DNSaaS. As a workaround, you can use the Tungsten Fabric built-in DNS service that enables virtual machines to resolve each other names.
Secret management (Barbican). You cannot use the certificates stored in Barbican to terminate HTTPs in a load balancer.
Role Based Access Control (RBAC) for Neutron objects.
Fixed in MOS 21.2
The Neturon service fails to create a network through Horizon and
OpenStack CLI throwing the An unknown exception occurred error.
The workaround is to restart the tf-config pods:
Obtain the list of the
tf-configpods:kubectl -n tf get pod -l app=tf-config
Delete the
tf-config-*pods. For example:kubectl -n tf delete pod tf-config-2whbb
Verify that the pods have been recreated:
kubectl -n tf get pod -l app=tf-config
The tf-control service resolves the DNS names of Cassandra pods at startup
and does not update them if Cassandra pods got new IP addresses, for example,
in case of a restart. As a workaround, to refresh the IP addresses of
Cassandra pods, restart the tf-control pods one by one:
Caution
Before restarting the tf-control pods:
Verify that the new pods are successfully spawned.
Verify that no vRouters are connected to only one
tf-controlpod that will be restarted.
kubectl -n tf delete pod tf-control-<hash>
This section lists the components artifacts of the MOS 21.1 release:
Component |
Path |
License information for main executable programs |
|---|---|---|
Binaries |
||
mirantis |
https://binary.mirantis.com/openstack/bin/horizon/mirantis-victoria-8f71802-20210119120707.tar.gz |
Mirantis Proprietary License |
octavia-amphora |
https://binary.mirantis.com/openstack/bin/octavia/amphora-x64-haproxy-victoria-20210119144419.qcow2 |
Mirantis Proprietary License |
Docker images |
||
stepler |
mirantis.azurecr.io/openstack/stepler:victoria-bionic-20210118135111 |
Mirantis Proprietary License |
placement |
mirantis.azurecr.io/openstack/placement:victoria-bionic-20210129120815 |
Apache License 2.0 |
keystone |
mirantis.azurecr.io/openstack/keystone:victoria-bionic-20210129120815 |
Apache License 2.0 |
heat |
mirantis.azurecr.io/openstack/heat:victoria-bionic-20210129120815 |
Apache License 2.0 |
glance |
mirantis.azurecr.io/openstack/glance:victoria-bionic-20210129120815 |
Apache License 2.0 |
cinder |
mirantis.azurecr.io/openstack/cinder:victoria-bionic-20210129120815 |
Apache License 2.0 |
neutron |
mirantis.azurecr.io/openstack/neutron:victoria-bionic-20210129120815 |
Apache License 2.0 |
nova |
mirantis.azurecr.io/openstack/nova:victoria-bionic-20210129120815 |
Apache License 2.0 |
horizon |
mirantis.azurecr.io/openstack/horizon:victoria-bionic-20210129120815 |
Apache License 2.0 |
tempest |
mirantis.azurecr.io/openstack/tempest:victoria-bionic-20210129120815 |
Apache License 2.0 |
octavia |
mirantis.azurecr.io/openstack/octavia:victoria-bionic-20210129120815 |
Apache License 2.0 |
designate |
mirantis.azurecr.io/openstack/designate:victoria-bionic-20210129120815 |
Apache License 2.0 |
ironic |
mirantis.azurecr.io/openstack/ironic:victoria-bionic-20210129120815 |
Apache License 2.0 |
barbican |
mirantis.azurecr.io/openstack/barbican:victoria-bionic-20210129120815 |
Apache License 2.0 |
libvirt |
mirantis.azurecr.io/general/libvirt:6.0.0-bionic-20210106163230 |
LGPL-2.1 License |
pause |
mirantis.azurecr.io/general/external/pause:3.1 |
Apache License 2.0 |
openvswitch |
mirantis.azurecr.io/general/openvswitch:2.11-bionic-20210106163231 |
Apache License 2.0 |
openvswitch-dpdk |
mirantis.azurecr.io/general/openvswitch-dpdk:2.11-bionic-20210106163230 |
Apache License 2.0 |
openstack-tools |
mirantis.azurecr.io/openstack/openstack-tools:ussuri-bionic-20210127180024 |
Apache License 2.0 |
rabbitmq-3.8 |
mirantis.azurecr.io/general/rabbitmq:3.8.9 |
Mozilla Public License 2.0 |
rabbitmq-3.8-management |
mirantis.azurecr.io/general/rabbitmq:3.8.9-management |
Mozilla Public License 2.0 |
kubernetes-entrypoint |
mirantis.azurecr.io/openstack/extra/kubernetes-entrypoint:v1.0.0-20200311160233 |
Apache License 2.0 |
docker |
mirantis.azurecr.io/openstack/extra/docker:17.07.0 |
Apache License 2.0 |
memcached |
mirantis.azurecr.io/general/memcached:1.6.6-alpine |
BSD 3-Clause “New” or “Revised” License |
ceph-config-helper |
mirantis.azurecr.io/openstack/extra:ceph-config-helper:nautilus-bionic-20210112174540 |
Apache License 2.0, LGPL-2.1 or LGPL-3 |
etcd |
mirantis.azurecr.io/openstack/extra/etcd:3.2.26 |
Apache License 2.0 |
powerdns |
mirantis.azurecr.io/openstack/extra/powerdns:4.2-alpine-20200117133238 |
GPL-2.0 License |
nginx-ingress-controller |
mirantis.azurecr.io/openstack/extra/nginx-ingress-controller:0.42.0 |
Apache License 2.0 |
defaultbackend |
mirantis.azurecr.io/openstack/extra/defaultbackend:1.0 |
Apache License 2.0 |
mariadb |
mirantis.azurecr.io/general/mariadb:10.4.17-bionic-20210106145941 |
GPLv2, LGPLv2.1 (client libraries) |
xrally-openstack |
mirantis.azurecr.io/openstack/extra/xrally-openstack:2.1.0-20210115084431 |
Apache License 2.0 |
prometheus-memcached-exporter |
mirantis.azurecr.io/stacklight/memcached-exporter:v0.5.0 |
Apache License 2.0 |
prometheus-mysql-exporter |
mirantis.azurecr.io/stacklight/mysqld-exporter:v0.11.0 |
Apache License 2.0 |
rabbitmq-exporter |
mirantis.azurecr.io/stacklight/rabbitmq-exporter:v1.0.0-RC7.1 |
MIT License |
aodh |
mirantis.azurecr.io/openstack/aodh:victoria-bionic-20210129120815 |
Apache License 2.0 |
panko |
mirantis.azurecr.io/openstack/panko:victoria-bionic-20210129120815 |
Apache License 2.0 |
ceilometer |
mirantis.azurecr.io/openstack/ceilometer:victoria-bionic-20210129120815 |
Apache License 2.0 |
gnocchi |
mirantis.azurecr.io/openstack/gnocchi:victoria-bionic-20210129120815 |
Apache License 2.0 |
redis |
mirantis.azurecr.io/openstack/extra/redis:5.0-alpine |
BSD 3-Clause “New” or “Revised” License |
Component |
Path |
License information for main executable programs |
|---|---|---|
Binaries |
||
mirantis |
https://binary.mirantis.com/openstack/bin/horizon/mirantis-ussuri-48f346e-20210119132403.tar.gz |
Mirantis Proprietary License |
octavia-amphora |
https://binary.mirantis.com/openstack/bin/octavia/amphora-x64-haproxy-ussuri-20210121085750.qcow2 |
Mirantis Proprietary License |
Docker images |
||
stepler |
mirantis.azurecr.io/openstack/stepler:ussuri-bionic-20210121144938 |
Mirantis Proprietary License |
placement |
mirantis.azurecr.io/openstack/placement:ussuri-bionic-20210127180024 |
Apache License 2.0 |
redis |
mirantis.azurecr.io/openstack/extra/redis:5.0-alpine |
BSD 3-Clause “New” or “Revised” License |
gnocchi |
mirantis.azurecr.io/openstack/gnocchi:ussuri-bionic-20210127180024 |
Apache License 2.0 |
ceilometer |
mirantis.azurecr.io/openstack/ceilometer:ussuri-bionic-20210127180024 |
Apache License 2.0 |
panko |
mirantis.azurecr.io/openstack/panko:ussuri-bionic-20210127180024 |
Apache License 2.0 |
aodh |
mirantis.azurecr.io/openstack/aodh:ussuri-bionic-20210127180024 |
Apache License 2.0 |
xrally-openstack |
mirantis.azurecr.io/openstack/extra/xrally-openstack:2.1.0-20210115084431 |
Apache License 2.0 |
mariadb |
mirantis.azurecr.io/general/mariadb:10.4.17-bionic-20210106145941 |
GPLv2, LGPLv2.1 (client libraries) |
defaultbackend |
mirantis.azurecr.io/openstack/extra/defaultbackend:1.0 |
Apache License 2.0 |
nginx-ingress-controller |
mirantis.azurecr.io/openstack/extra/nginx-ingress-controller:0.42.0 |
Apache License 2.0 |
powerdns |
mirantis.azurecr.io/openstack/extra/powerdns:4.2-alpine-20200117133238 |
GPL-2.0 License |
etcd |
mirantis.azurecr.io/openstack/extra/etcd:3.2.26 |
Apache License 2.0 |
ceph-config-helper |
mirantis.azurecr.io/openstack/extra/ceph-config-helper:nautilus-bionic-20210112174540 |
Apache License 2.0, LGPL-2.1 or LGPL-3 |
memcached |
mirantis.azurecr.io/general/memcached:1.6.6-alpine |
BSD 3-Clause “New” or “Revised” License |
docker |
mirantis.azurecr.io/openstack/extra/docker:17.07.0 |
Apache License 2.0 |
kubernetes-entrypoint |
mirantis.azurecr.io/openstack/extra/kubernetes-entrypoint:v1.0.0-20200311160233 |
Apache License 2.0 |
rabbitmq-3.8-management |
mirantis.azurecr.io/general/rabbitmq:3.8.9-management |
Mozilla Public License 2.0 |
rabbitmq-3.8 |
mirantis.azurecr.io/general/rabbitmq:3.8.9 |
Mozilla Public License 2.0 |
openstack-tools |
mirantis.azurecr.io/openstack/openstack-tools:ussuri-bionic-20210127180024 |
Apache License 2.0 |
openvswitch-dpdk |
mirantis.azurecr.io/general/openvswitch-dpdk:2.11-bionic-20210106163230 |
Apache License 2.0 |
openvswitch |
mirantis.azurecr.io/general/openvswitch:2.11-bionic-20210106163231 |
Apache License 2.0 |
pause |
mirantis.azurecr.io/general/external/pause:3.1 |
Apache License 2.0 |
prometheus-memcached-exporter |
mirantis.azurecr.io/stacklight/memcached-exporter:v0.5.0 |
Apache License 2.0 |
prometheus-mysql-exporter |
mirantis.azurecr.io/stacklight/mysqld-exporter:v0.11.0 |
Apache License 2.0 |
rabbitmq-exporter |
mirantis.azurecr.io/stacklight/rabbitmq-exporter:v1.0.0-RC7.1 |
MIT License |
libvirt |
mirantis.azurecr.io/general/libvirt:6.0.0-bionic-20210106163230 |
LGPL-2.1 License |
barbican |
mirantis.azurecr.io/openstack/barbican:ussuri-bionic-20210127180024 |
Apache License 2.0 |
ironic |
mirantis.azurecr.io/openstack/ironic:ussuri-bionic-20210127180024 |
Apache License 2.0 |
designate |
mirantis.azurecr.io/openstack/designate:ussuri-bionic-20210127180024 |
Apache License 2.0 |
octavia |
mirantis.azurecr.io/openstack/octavia:ussuri-bionic-20210127180024 |
Apache License 2.0 |
tempest |
mirantis.azurecr.io/openstack/tempest:ussuri-bionic-20210127180024 |
Apache License 2.0 |
horizon |
mirantis.azurecr.io/openstack/horizon:ussuri-bionic-20210127180024 |
Apache License 2.0 |
nova |
mirantis.azurecr.io/openstack/nova:ussuri-bionic-20210127180024 |
Apache License 2.0 |
neutron |
mirantis.azurecr.io/openstack/neutron:ussuri-bionic-20210127180024 |
Apache License 2.0 |
cinder |
mirantis.azurecr.io/openstack/cinder:ussuri-bionic-20210127180024 |
Apache License 2.0 |
glance |
mirantis.azurecr.io/openstack/glance:ussuri-bionic-20210127180024 |
Apache License 2.0 |
heat |
mirantis.azurecr.io/openstack/heat:ussuri-bionic-20210127180024 |
Apache License 2.0 |
keystone |
mirantis.azurecr.io/openstack/keystone:ussuri-bionic-20210127180024 |
Apache License 2.0 |
Component |
Path |
License information for main executable programs |
|---|---|---|
Helm charts |
||
Tungsten Fabric Operator |
https://binary.mirantis.com/tungsten/helm/tungstenfabric-operator-0.2.3.tgz |
Mirantis Proprietary License |
Docker images |
||
TF Analytics |
mirantis.azurecr.io/tungsten/contrail-analytics-api:5.1.20210129092117 |
Apache License 2.0 |
mirantis.azurecr.io/tungsten/contrail-analytics-collector:5.1.20210129092117 |
Apache License 2.0 |
|
TF Analytics Alarm |
mirantis.azurecr.io/tungsten/contrail-analytics-alarm-gen:5.1.20210129092117 |
Apache License 2.0 |
TF Analytics DB |
mirantis.azurecr.io/tungsten/contrail-analytics-query-engine:5.1.20210129092117 |
Apache License 2.0 |
TF Analytics SNMP |
mirantis.azurecr.io/tungsten/contrail-analytics-snmp-collector:5.1.20210129092117 |
Apache License 2.0 |
mirantis.azurecr.io/tungsten/contrail-analytics-snmp-topology:5.1.20210129092117 |
Apache License 2.0 |
|
TF Config |
mirantis.azurecr.io/tungsten/contrail-controller-config-api:5.1.20210129092117 |
Apache License 2.0 |
mirantis.azurecr.io/tungsten/contrail-controller-config-devicemgr:5.1.20210129092117 |
Apache License 2.0 |
|
mirantis.azurecr.io/tungsten/contrail-controller-config-schema:5.1.20210129092117 |
Apache License 2.0 |
|
mirantis.azurecr.io/tungsten/contrail-controller-config-svcmonitor:5.1.20210129092117 |
Apache License 2.0 |
|
TF Control |
mirantis.azurecr.io/tungsten/contrail-controller-control-control:5.1.20210129092117 |
Apache License 2.0 |
mirantis.azurecr.io/tungsten/contrail-controller-control-dns:5.1.20210129092117 |
Apache License 2.0 |
|
mirantis.azurecr.io/tungsten/contrail-controller-control-named:5.1.20210129092117 |
Apache License 2.0 |
|
TF Web UI |
mirantis.azurecr.io/tungsten/contrail-controller-webui-job:5.1.20210129092117 |
Apache License 2.0 |
mirantis.azurecr.io/tungsten/contrail-controller-webui-web:5.1.20210129092117 |
Apache License 2.0 |
|
Nodemanager |
mirantis.azurecr.io/tungsten/contrail-nodemgr:5.1.20210129092117 |
Apache License 2.0 |
TF Status |
mirantis.azurecr.io/tungsten/contrail-status:5.1.20210129092117 |
Apache License 2.0 |
mirantis.azurecr.io/tungsten/contrail-tf-status:5.1.20210129092117 |
Apache License 2.0 |
|
mirantis.azurecr.io/tungsten/contrail-tf-status-aggregator:5.1.20210129092117 |
Apache License 2.0 |
|
mirantis.azurecr.io/tungsten/contrail-tf-status-party:5.1.20210129092117 |
Apache License 2.0 |
|
TF VRouter |
mirantis.azurecr.io/tungsten/contrail-vrouter-agent:5.1.20210129092117 |
Apache License 2.0 |
mirantis.azurecr.io/tungsten/contrail-vrouter-kernel-build-init:5.1.20210129092117 |
Apache License 2.0 |
|
Cassandra operator |
mirantis.azurecr.io/tungsten-operator/casskop:v0.5.3-release |
Apache License 2.0 |
Cassandra |
mirantis.azurecr.io/tungsten/cassandra-bootstrap:0.1.4 |
Apache License 2.0 |
mirantis.azurecr.io/tungsten/cassandra:3.11.6 |
Apache License 2.0 |
|
Kafka operator |
mirantis.azurecr.io/tungsten-operator/kafka-k8s-operator:0.0.7 |
Mirantis Proprietary License |
Kafka |
mirantis.azurecr.io/tungsten/cp-kafka:5.5.2 |
Apache License 2.0 |
RabbitMQ operator |
mirantis.azurecr.io/tungsten-operator/rabbitmq-operator:0.1.1 |
Mirantis Proprietary License |
RabbitMQ |
mirantis.azurecr.io/general/rabbitmq:3.8.9 |
Mozilla Public License 2.0 |
Zookeeper operator |
mirantis.azurecr.io/tungsten-operator/zookeeper-operator:0.2.9 |
Apache License 2.0 |
Zookeeper |
mirantis.azurecr.io/tungsten/zookeeper:3.6.1-0.2.9 |
Apache License 2.0 |
Redis operator |
mirantis.azurecr.io/tungsten-operator/redis-operator:0.1.5-1-ccd6a63 |
Apache License 2.0 |
Redis |
mirantis.azurecr.io/tungsten/redis:5-alpine |
BSD 3-Clause “New” or “Revised” License |
TF Test |
mirantis.azurecr.io/tungsten/tungsten-pytest:0.1-20210202061227 |
MIT License |
TF CLI |
mirantis.azurecr.io/tungsten/tf-cli:0.1-20210202130729 |
MIT License |
Component |
Path |
License information for main executable programs |
|---|---|---|
Docker images |
||
prometheus-libvirt-exporter |
mirantis.azurecr.io/stacklight/libvirt-exporter:v0.1-20200610164751 |
Mirantis Proprietary License |
prometheus-tungstenfabric-exporter New |
mirantis.azurecr.io/stacklight/tungstenfabric-prometheus-exporter:0.1-20210115152338 |
Mirantis Proprietary License |
Helm charts |
||
prometheus-libvirt-exporter |
https://binary.mirantis.com/stacklight/helm/prometheus-libvirt-exporter-0.1.0-mcp-2.tgz |
Mirantis Proprietary License |
prometheus-tungstenfabric-exporter New |
https://binary.mirantis.com/stacklight/helm/prometheus-tungstenfabric-exporter-0.1.0-mcp-1.tgz |
Mirantis Proprietary License |
The following issues have been addressed in the Mirantis OpenStack for Kubernetes 21.1 release:
[9809] [Kubernetes] Fixed the issue with the pods getting stuck in the
Pendingstate during update of a MOSK cluster by increasing the defaultkubelet_max_podssetting to150.[9589][StackLight] Fixed the issue with the Patroni pod crashing when scheduled to an OpenStack compute node with huge pages.
[8573] [OpenStack] Fixed the issue with the external authentication to Horizon failing to log in a different user.
MOS Ussuri GA Update release
Release date |
Name |
Container Cloud Cluster release |
Highlights |
|---|---|---|---|
December 23, 2020 |
MOS Ussuri Update |
6.10.0 |
The first update to MOS Ussuri release introducing support for object storage and a Telco deployment profile, which includes implementation of baseline Enhanced Platform Awareness (NUMA awareness, huge pages, CPU pinning) capabilities, and a technical preview of packet processing acceleration (Data Plane Development Kit-enabled Tungsten Fabric). |
Implemented the capability to easily perform the node-specific configuration through the OpenStack Controller. More specifically, the node-specific overrides allow you to:
Enable DPDK with OVS Technical Preview
Enable libvirt CPU pinning
Implemented the capability to customize the look and feel of Horizon through
the OpenStackDeployment custom resource. Cloud operator is now able
to specify the origin of the theme bundle to be applied to OpenStack Horizon
in features:horizon:themes.
TechPreview
Implemented the capability to enable the DPDK mode for OVS.
Implemented the capability to enable huge pages and configure CPU isolation and CPU pinning in your MOS deployment.
Added support for RADOS Gateway Object Storage (SWIFT).
Implemented the capability to disable HTTP probes for public endpoints from the OpenStack service catalog. In this case, Telegraf performs HTTP checks only for the admin and internal OpenStack endpoints. By default, Telegraf verifies all endpoints from the OpenStack service catalog.
TechPreview
Implemented the capability to enable DPDK mode for the Tungsten Fabric vRouter.
Implemented the capability to verify the status of Tungsten Fabric services,
including the third-party services such as Cassandra, ZooKeeper, Kafka, Redis,
and RabbitMQ using the Tungsten Fabric Operator tf-status tool.
Mirantis has tested MOS against a very specific configuration and can guarantee a predictable behavior of the product only in the exact same environments. The table below includes the major MOS components with the exact versions against which testing has been performed.
This section contains the description of the known issues with available workarounds.
[9809] The default max_pods setting does not allow upgrading a cluster
[6912] Octavia load balancers may not work properly with DVR
[8573] External authentication to Horizon fails to log in a different user
Due to limitations in the Octavia and MOS integration, the clusters where Neutron is deployed in the Distributed Virtual Router (DVR) mode are not stable. Therefore, Mirantis does not recommend such configuration for production deployments.
Fixed in MOS 21.1
During update of a MOS cluster, the pods may get
stuck in the Pending state with the following example warning:
Warning FailedScheduling <unknown> default-scheduler 0/9 nodes are available:
1 node(s) were unschedulable, 2 Too many pods, 6 node(s) didn't match node selector.
Workaround
Before you update the managed cluster:
Set
kubelet_max_podsto250:UCP_HOST=$(kubectl -n <child name space> get clusters <child name> -o jsonpath='{.status.providerStatus.ucpDashboard}') AUTHTOKEN=$(curl --silent --insecure --data '{"username":"admin","password":"<PASWORD>"}' $UCP_HOST/auth/login | jq --raw-output .auth_token) curl --insecure -X GET "$UCP_HOST/api/ucp/config-toml" -H "accept: application/toml" -H "Authorization: Bearer $AUTHTOKEN" > ucp-config.toml sed -i 's/kubelet_max_pods = 110/kubelet_max_pods = 250/g' ucp-config.toml curl --insecure -X PUT -H "accept: application/toml" -H "Authorization: Bearer $AUTHTOKEN" --upload-file 'ucp-config.toml' -H "X-Ucp-Allow-Restricted-Api: i-solemnly-swear-i-am-up-to-no-good" $UCP_HOST/api/ucp/config-toml curl -k -X PUT "$UCP_HOST/api/ucp/config/tuning" -H "X-Ucp-Allow-Restricted-Api: i-solemnly-swear-i-am-up-to-no-good" -H "Authorization: Bearer $AUTHTOKEN" --data '{"kaasManagedCluster":true}'
Verify that the changes have been applied:
kubectl get nodes -o jsonpath='{.items[*].status.capacity.pods}'Example of a positive system response:
250 250 250 250 250 250 250 250 250
After you update the managed cluster, set
kubelet_max_podsto the default110value:UCP_HOST=$(kubectl -n <child name space> get clusters <child name> -o jsonpath='{.status.providerStatus.ucpDashboard}') AUTHTOKEN=$(curl --silent --insecure --data '{"username":"admin","password":"<PASWORD>"}' $UCP_HOST/auth/login | jq --raw-output .auth_token) curl --insecure -X GET "$UCP_HOST/api/ucp/config-toml" -H "accept: application/toml" -H "Authorization: Bearer $AUTHTOKEN" > ucp-config.toml sed -i 's/kubelet_max_pods = 250/kubelet_max_pods = 110/g' ucp-config.toml curl --insecure -X PUT -H "accept: application/toml" -H "Authorization: Bearer $AUTHTOKEN" --upload-file 'ucp-config.toml' -H "X-Ucp-Allow-Restricted-Api: i-solemnly-swear-i-am-up-to-no-good" $UCP_HOST/api/ucp/config-toml curl -k -X PUT "$UCP_HOST/api/ucp/config/tuning" -H "X-Ucp-Allow-Restricted-Api: i-solemnly-swear-i-am-up-to-no-good" -H "Authorization: Bearer $AUTHTOKEN" --data '{"kaasManagedCluster":true}'
Limitation
When Neutron is deployed in the DVR mode, Octavia load balancers may not work correctly. The symptoms include both failure to properly balance traffic and failure to perform an amphora failover. For details, see DVR incompatibility with ARP announcements and VRRP.
Fixed in MOS 21.1
Horizon retains the user’s credentials following their initial login using External Authentication Service, and does not allow to log in with another user credentials.
Workaround:
Clear cookies in your browser.
Select External Authentication Service on the Horizon login page.
Click Sign In. The Keycloak login page opens.
If the following error occurs, refresh the page and try again:
CSRF token missing or incorrect. Cookies may be turned off. Make sure cookies are enabled and try again.
Tungsten Fabric is not monitored by StackLight
Tungsten Fabric does not provide the following functionality:
Automatic generation of network port records in DNSaaS (Designate) as Neutron with Tungsten Fabric as a backend is not integrated with DNSaaS. As a workaround, you can use the Tungsten Fabric built-in DNS service that enables virtual machines to resolve each other names.
Secret management (Barbican). You cannot use the certificates stored in Barbican to terminate HTTPs in a load balancer.
Role Based Access Control (RBAC) for Neutron objects.
The tf-control service resolves the DNS names of Cassandra pods at startup
and does not update them if Cassandra pods got new IP addresses, for example,
in case of a restart. As a workaround, to refresh the IP addresses of
Cassandra pods, restart the tf-control pods one by one:
Caution
Before restarting the tf-control pods:
Verify that the new pods are successfully spawned.
Verify that no vRouters are connected to only one
tf-controlpod that will be restarted.
kubectl -n tf delete pod tf-control-<hash>
This section lists the components artifacts of the MOS Ussuri Update release:
Component |
Path |
License information for main executable programs |
|---|---|---|
Binaries |
||
mirantis |
https://binary.mirantis.com/openstack/bin/horizon/mirantis-ussuri-43c3886-20201121205800.tar.gz |
Mirantis Proprietary License |
octavia-amphora |
https://binary.mirantis.com/openstack/bin/octavia/amphora-x64-haproxy-ussuri-20201120005752.qcow2 |
Mirantis Proprietary License |
Docker images |
||
aodh |
mirantis.azurecr.io/openstack/aodh:ussuri-bionic-20201121180111 |
Apache License 2.0 |
barbican |
mirantis.azurecr.io/openstack/barbican:ussuri-bionic-20201121180111 |
Apache License 2.0 |
ceilometer |
mirantis.azurecr.io/openstack/ceilometer:ussuri-bionic-20201121180111 |
Apache License 2.0 |
ceph-config-helper |
mirantis.azurecr.io/openstack/extra/ceph-config-helper:nautilus-bionic-20200810084204 |
Apache License 2.0, LGPL-2.1 or LGPL-3 |
cinder |
mirantis.azurecr.io/openstack/cinder:ussuri-bionic-20201121180111 |
Apache License 2.0 |
dashboard-selenium |
mirantis.azurecr.io/openstack/dashboard-selenium:ussuri-bionic-20201123130303 |
Apache License 2.0 |
defaultbackend |
mirantis.azurecr.io/openstack/extra/defaultbackend:1.0 |
Apache License 2.0 |
designate |
mirantis.azurecr.io/openstack/designate:ussuri-bionic-20201121180111 |
Apache License 2.0 |
docker |
mirantis.azurecr.io/openstack/extra/docker:17.07.0 |
Apache License 2.0 |
etcd |
mirantis.azurecr.io/openstack/extra/etcd:3.2.26 |
Apache License 2.0 |
glance |
mirantis.azurecr.io/openstack/glance:ussuri-bionic-20201121180111 |
Apache License 2.0 |
gnocchi |
mirantis.azurecr.io/openstack/gnocchi:ussuri-bionic-20201121180111 |
Apache License 2.0 |
heat |
mirantis.azurecr.io/openstack/heat:ussuri-bionic-20201121180111 |
Apache License 2.0 |
horizon |
mirantis.azurecr.io/openstack/horizon:ussuri-bionic-20201121180111 |
Apache License 2.0 |
ironic |
mirantis.azurecr.io/openstack/ironic:ussuri-bionic-20201121180111 |
Apache License 2.0 |
keystone |
mirantis.azurecr.io/openstack/keystone:ussuri-bionic-20201121180111 |
Apache License 2.0 |
kubernetes-entrypoint |
mirantis.azurecr.io/openstack/extra/kubernetes-entrypoint:v1.0.0-20200311160233 |
Apache License 2.0 |
libvirt |
mirantis.azurecr.io/general/libvirt:6.0.0-bionic-20201105044831 |
LGPL-2.1 License |
mariadb |
mirantis.azurecr.io/general/mariadb:10.4.16-bionic-20201105025052 |
GPLv2, LGPLv2.1 (client libraries) |
memcached |
mirantis.azurecr.io/general/memcached:1.6.6-alpine |
BSD 3-Clause “New” or “Revised” License |
neutron |
mirantis.azurecr.io/openstack/neutron:ussuri-bionic-20201121180111 |
Apache License 2.0 |
nginx-ingress-controller |
mirantis.azurecr.io/openstack/extra/nginx-ingress-controller:0.32.0 |
Apache License 2.0 |
nova |
mirantis.azurecr.io/openstack/nova:ussuri-bionic-20201121180111 |
Apache License 2.0 |
octavia |
mirantis.azurecr.io/openstack/octavia:ussuri-bionic-20201121180111 |
Apache License 2.0 |
openvswitch |
mirantis.azurecr.io/general/openvswitch:2.11-bionic-20201109141859 |
Apache License 2.0 |
openvswitch-dpdk |
mirantis.azurecr.io/general/openvswitch-dpdk:2.11-bionic-20201109141858 |
Apache License 2.0 |
panko |
mirantis.azurecr.io/openstack/panko:ussuri-bionic-20201121180111 |
Apache License 2.0 |
pause |
mirantis.azurecr.io/general/external/pause:3.1 |
Apache License 2.0 |
placement |
mirantis.azurecr.io/openstack/placement:ussuri-bionic-20201121180111 |
Apache License 2.0 |
powerdns |
mirantis.azurecr.io/openstack/extra/powerdns:4.2-alpine-20200117133238 |
GPL-2.0 License |
prometheus-memcached-exporter |
mirantis.azurecr.io/stacklight/memcached-exporter:v0.5.0 |
Apache License 2.0 |
prometheus-mysql-exporter |
mirantis.azurecr.io/stacklight/mysqld-exporter:v0.11.0 |
Apache License 2.0 |
rabbitmq-3.8 |
mirantis.azurecr.io/general/rabbitmq:3.8.7 |
Mozilla Public License 2.0 |
rabbitmq-3.8-management |
mirantis.azurecr.io/general/rabbitmq:3.8.7-management |
Mozilla Public License 2.0 |
rabbitmq-exporter |
mirantis.azurecr.io/stacklight/rabbitmq-exporter:v1.0.0-RC7.1 |
MIT License |
redis |
mirantis.azurecr.io/openstack/extra/redis:5.0-alpine |
BSD 3-Clause “New” or “Revised” License |
tempest |
mirantis.azurecr.io/openstack/tempest:ussuri-bionic-20201121180111 |
Apache License 2.0 |
xrally-openstack |
mirantis.azurecr.io/openstack/extra/xrally-openstack:2.1.0 |
Apache License 2.0 |
Helm charts |
||
openstack-operator |
https://binary.mirantis.com/openstack/helm/openstack-controller/openstack-operator-0.3.18.tgz |
Mirantis Proprietary License |
aodh |
https://binary.mirantis.com/openstack/helm/openstack-helm/aodh-0.1.0-mcp-3760.tgz |
Apache License 2.0 (no License file in Helm chart) |
barbican |
https://binary.mirantis.com/openstack/helm/openstack-helm/barbican-0.1.0-mcp-3760.tgz |
Apache License 2.0 (no License file in Helm chart) |
ceilometer |
https://binary.mirantis.com/openstack/helm/openstack-helm/ceilometer-0.1.0-mcp-3760.tgz |
Apache License 2.0 (no License file in Helm chart) |
cinder |
https://binary.mirantis.com/openstack/helm/openstack-helm/cinder-0.1.0-mcp-3760.tgz |
Apache License 2.0 (no License file in Helm chart) |
designate |
https://binary.mirantis.com/openstack/helm/openstack-helm/designate-0.1.0-mcp-3760.tgz |
Apache License 2.0 (no License file in Helm chart) |
glance |
https://binary.mirantis.com/openstack/helm/openstack-helm/glance-0.1.0-mcp-3760.tgz |
Apache License 2.0 (no License file in Helm chart) |
heat |
https://binary.mirantis.com/openstack/helm/openstack-helm/heat-0.1.0-mcp-3760.tgz |
Apache License 2.0 (no License file in Helm chart) |
horizon |
https://binary.mirantis.com/openstack/helm/openstack-helm/horizon-0.1.0-mcp-3760.tgz |
Apache License 2.0 (no License file in Helm chart) |
ironic |
https://binary.mirantis.com/openstack/helm/openstack-helm/ironic-0.1.0-mcp-3760.tgz |
Apache License 2.0 (no License file in Helm chart) |
keystone |
https://binary.mirantis.com/openstack/helm/openstack-helm/keystone-0.1.0-mcp-3760.tgz |
Apache License 2.0 (no License file in Helm chart) |
magnum |
https://binary.mirantis.com/openstack/helm/openstack-helm/magnum-0.1.0-mcp-3760.tgz |
Apache License 2.0 (no License file in Helm chart) |
mistral |
https://binary.mirantis.com/openstack/helm/openstack-helm/mistral-0.1.0-mcp-3760.tgz |
Apache License 2.0 (no License file in Helm chart) |
neutron |
https://binary.mirantis.com/openstack/helm/openstack-helm/neutron-0.1.0-mcp-3760.tgz |
Apache License 2.0 (no License file in Helm chart) |
nova |
https://binary.mirantis.com/openstack/helm/openstack-helm/nova-0.1.0-mcp-3760.tgz |
Apache License 2.0 (no License file in Helm chart) |
octavia |
https://binary.mirantis.com/openstack/helm/openstack-helm/octavia-0.1.0-mcp-3760.tgz |
Apache License 2.0 (no License file in Helm chart) |
panko |
https://binary.mirantis.com/openstack/helm/openstack-helm/panko-0.1.0-mcp-3760.tgz |
Apache License 2.0 (no License file in Helm chart) |
rally |
https://binary.mirantis.com/openstack/helm/openstack-helm/rally-0.1.0-mcp-3760.tgz |
Apache License 2.0 (no License file in Helm chart) |
senlin |
https://binary.mirantis.com/openstack/helm/openstack-helm/senlin-0.1.0-mcp-3760.tgz |
Apache License 2.0 (no License file in Helm chart) |
tempest |
https://binary.mirantis.com/openstack/helm/openstack-helm/tempest-0.1.0-mcp-3742.tgz |
Apache License 2.0 (no License file in Helm chart) |
dashboard-selenium |
https://binary.mirantis.com/openstack/helm/openstack-helm/dashboard-selenium-0.1.0-mcp-3760.tgz |
Apache License 2.0 (no License file in Helm chart) |
placement |
https://binary.mirantis.com/openstack/helm/openstack-helm/placement-0.1.0-mcp-3760.tgz |
Apache License 2.0 (no License file in Helm chart) |
calico |
https://binary.mirantis.com/openstack/helm/openstack-helm-infra/calico-0.1.0-mcp-2672.tgz |
Apache License 2.0 (no License file in Helm chart) |
ceph-client |
https://binary.mirantis.com/openstack/helm/openstack-helm-infra/ceph-client-0.1.0-mcp-2672.tgz |
Apache License 2.0 (no License file in Helm chart) |
ceph-mon |
https://binary.mirantis.com/openstack/helm/openstack-helm-infra/ceph-mon-0.1.0-mcp-2672.tgz |
Apache License 2.0 (no License file in Helm chart) |
ceph-osd |
https://binary.mirantis.com/openstack/helm/openstack-helm-infra/ceph-osd-0.1.0-mcp-2672.tgz |
Apache License 2.0 (no License file in Helm chart) |
ceph-provisioners |
https://binary.mirantis.com/openstack/helm/openstack-helm-infra/ceph-provisioners-0.1.0-mcp-2672.tgz |
Apache License 2.0 (no License file in Helm chart) |
ceph-rgw |
https://binary.mirantis.com/openstack/helm/openstack-helm-infra/ceph-rgw-0.1.0-mcp-2672.tgz |
Apache License 2.0 (no License file in Helm chart) |
dnsmasq |
https://binary.mirantis.com/openstack/helm/openstack-helm-infra/dnsmasq-0.1.0-mcp-2672.tgz |
Apache License 2.0 (no License file in Helm chart) |
elastic-apm-server |
Apache License 2.0 (no License file in Helm chart) |
|
elastic-filebeat |
https://binary.mirantis.com/openstack/helm/openstack-helm-infra/elastic-filebeat-0.1.0-mcp-2672.tgz |
Apache License 2.0 (no License file in Helm chart) |
elastic-metricbeat |
Apache License 2.0 (no License file in Helm chart) |
|
elastic-packetbeat |
Apache License 2.0 (no License file in Helm chart) |
|
etcd |
https://binary.mirantis.com/openstack/helm/openstack-helm-infra/etcd-0.1.0-mcp-2672.tgz |
Apache License 2.0 (no License file in Helm chart) |
falco |
https://binary.mirantis.com/openstack/helm/openstack-helm-infra/falco-0.1.0-mcp-2672.tgz |
Apache License 2.0 (no License file in Helm chart) |
flannel |
https://binary.mirantis.com/openstack/helm/openstack-helm-infra/flannel-0.1.0-mcp-2672.tgz |
Apache License 2.0 (no License file in Helm chart) |
fluentbit |
https://binary.mirantis.com/openstack/helm/openstack-helm-infra/fluentbit-0.1.0-mcp-2672.tgz |
Apache License 2.0 (no License file in Helm chart) |
fluentd |
https://binary.mirantis.com/openstack/helm/openstack-helm-infra/fluentd-0.1.0-mcp-2672.tgz |
Apache License 2.0 (no License file in Helm chart) |
gnocchi |
https://binary.mirantis.com/openstack/helm/openstack-helm-infra/gnocchi-0.1.0-mcp-2672.tgz |
Apache License 2.0 (no License file in Helm chart) |
grafana |
https://binary.mirantis.com/openstack/helm/openstack-helm-infra/grafana-0.1.0-mcp-2672.tgz |
Apache License 2.0 (no License file in Helm chart) |
helm-toolkit |
https://binary.mirantis.com/openstack/helm/openstack-helm-infra/helm-toolkit-0.1.0-mcp-2672.tgz |
Apache License 2.0 (no License file in Helm chart) |
ingress |
https://binary.mirantis.com/openstack/helm/openstack-helm-infra/ingress-0.1.0-mcp-2672.tgz |
Apache License 2.0 (no License file in Helm chart) |
kube-dns |
https://binary.mirantis.com/openstack/helm/openstack-helm-infra/kube-dns-0.1.0-mcp-2672.tgz |
Apache License 2.0 (no License file in Helm chart) |
kubernetes-keystone-webhook |
Apache License 2.0 (no License file in Helm chart) |
|
ldap |
https://binary.mirantis.com/openstack/helm/openstack-helm-infra/ldap-0.1.0-mcp-2672.tgz |
Apache License 2.0 (no License file in Helm chart) |
libvirt |
https://binary.mirantis.com/openstack/helm/openstack-helm-infra/libvirt-0.1.0-mcp-2672.tgz |
Apache License 2.0 (no License file in Helm chart) |
lockdown |
https://binary.mirantis.com/openstack/helm/openstack-helm-infra/lockdown-0.1.0-mcp-2672.tgz |
Apache License 2.0 (no License file in Helm chart) |
mariadb |
https://binary.mirantis.com/openstack/helm/openstack-helm-infra/mariadb-0.1.0-mcp-2672.tgz |
Apache License 2.0 (no License file in Helm chart) |
memcached |
https://binary.mirantis.com/openstack/helm/openstack-helm-infra/memcached-0.1.0-mcp-2672.tgz |
Apache License 2.0 (no License file in Helm chart) |
mongodb |
https://binary.mirantis.com/openstack/helm/openstack-helm-infra/mongodb-0.1.0-mcp-2672.tgz |
Apache License 2.0 (no License file in Helm chart) |
nagios |
https://binary.mirantis.com/openstack/helm/openstack-helm-infra/nagios-0.1.0-mcp-2672.tgz |
Apache License 2.0 (no License file in Helm chart) |
nfs-provisioner |
https://binary.mirantis.com/openstack/helm/openstack-helm-infra/nfs-provisioner-0.1.0-mcp-2672.tgz |
Apache License 2.0 (no License file in Helm chart) |
openvswitch |
https://binary.mirantis.com/openstack/helm/openstack-helm-infra/openvswitch-0.1.0-mcp-2672.tgz |
Apache License 2.0 (no License file in Helm chart) |
podsecuritypolicy |
https://binary.mirantis.com/openstack/helm/openstack-helm-infra/podsecuritypolicy-0.1.0-mcp-2672.tgz |
Apache License 2.0 (no License file in Helm chart) |
postgresql |
https://binary.mirantis.com/openstack/helm/openstack-helm-infra/postgresql-0.1.0-mcp-2672.tgz |
Apache License 2.0 (no License file in Helm chart) |
powerdns |
https://binary.mirantis.com/openstack/helm/openstack-helm-infra/powerdns-0.1.0-mcp-2672.tgz |
Apache License 2.0 (no License file in Helm chart) |
prometheus |
https://binary.mirantis.com/openstack/helm/openstack-helm-infra/prometheus-0.1.0-mcp-2672.tgz |
Apache License 2.0 (no License file in Helm chart) |
prometheus-alertmanager |
Apache License 2.0 (no License file in Helm chart) |
|
prometheus-kube-state-metrics |
Apache License 2.0 (no License file in Helm chart) |
|
prometheus-node-exporter |
Apache License 2.0 (no License file in Helm chart) |
|
prometheus-openstack-exporter |
Apache License 2.0 (no License file in Helm chart) |
|
prometheus-process-exporter |
Apache License 2.0 (no License file in Helm chart) |
|
rabbitmq |
https://binary.mirantis.com/openstack/helm/openstack-helm-infra/rabbitmq-0.1.0-mcp-2672.tgz |
Apache License 2.0 (no License file in Helm chart) |
redis |
https://binary.mirantis.com/openstack/helm/openstack-helm-infra/redis-0.1.0-mcp-2672.tgz |
Apache License 2.0 (no License file in Helm chart) |
registry |
https://binary.mirantis.com/openstack/helm/openstack-helm-infra/registry-0.1.0-mcp-2672.tgz |
Apache License 2.0 (no License file in Helm chart) |
tiller |
https://binary.mirantis.com/openstack/helm/openstack-helm-infra/tiller-0.1.0-mcp-2672.tgz |
Apache License 2.0 (no License file in Helm chart) |
zookeeper |
https://binary.mirantis.com/openstack/helm/openstack-helm-infra/zookeeper-0.1.0-mcp-2672.tgz |
Apache License 2.0 (no License file in Helm chart) |
Component |
Path |
License information for main executable programs |
|---|---|---|
Helm charts |
||
Tungsten Fabric Operator |
https://binary-mirantis-com/tungsten/helm/tungstenfabric-operator-0.2.1.tgz |
Mirantis Proprietary License |
Docker images |
||
TF Analytics |
mirantis.azurecr.io/tungsten/contrail-analytics-api:5.1.20201127135523 |
Apache License 2.0 |
mirantis.azurecr.io/tungsten/contrail-analytics-collector:5.1.20201127135523 |
Apache License 2.0 |
|
TF Analytics Alarm |
mirantis.azurecr.io/tungsten/contrail-analytics-alarm-gen:5.1.20201127135523 |
Apache License 2.0 |
TF Analytics DB |
mirantis.azurecr.io/tungsten/contrail-analytics-query-engine:5.1.20201127135523 |
Apache License 2.0 |
TF Analytics SNMP |
mirantis.azurecr.io/tungsten/contrail-analytics-snmp-collector:5.1.20201127135523 |
Apache License 2.0 |
mirantis.azurecr.io/tungsten/contrail-analytics-snmp-topology:5.1.20201127135523 |
Apache License 2.0 |
|
TF Config |
mirantis.azurecr.io/tungsten/contrail-controller-config-api:5.1.20201127135523 |
Apache License 2.0 |
mirantis.azurecr.io/tungsten/contrail-controller-config-devicemgr:5.1.20201127135523 |
Apache License 2.0 |
|
mirantis.azurecr.io/tungsten/contrail-controller-config-schema:5.1.20201127135523 |
Apache License 2.0 |
|
mirantis.azurecr.io/tungsten/contrail-controller-config-svcmonitor:5.1.20201127135523 |
Apache License 2.0 |
|
TF Control |
mirantis.azurecr.io/tungsten/contrail-controller-control-control:5.1.20201127135523 |
Apache License 2.0 |
mirantis.azurecr.io/tungsten/contrail-controller-control-dns:5.1.20201127135523 |
Apache License 2.0 |
|
mirantis.azurecr.io/tungsten/contrail-controller-control-named:5.1.20201127135523 |
Apache License 2.0 |
|
TF Web UI |
mirantis.azurecr.io/tungsten/contrail-controller-webui-job:5.1.20201127135523 |
Apache License 2.0 |
mirantis.azurecr.io/tungsten/contrail-controller-webui-web:5.1.20201127135523 |
Apache License 2.0 |
|
Nodemanager |
mirantis.azurecr.io/tungsten/contrail-nodemgr:5.1.20201127135523 |
Apache License 2.0 |
TF Status |
mirantis.azurecr.io/tungsten/contrail-status:5.1.20201127135523 |
Apache License 2.0 |
mirantis.azurecr.io/tungsten/contrail-tf-status:5.1.20201127135523 |
Apache License 2.0 |
|
mirantis.azurecr.io/tungsten/contrail-tf-status-aggregator:5.1.20201127135523 |
Apache License 2.0 |
|
mirantis.azurecr.io/tungsten/contrail-tf-status-party:5.1.20201127135523 |
Apache License 2.0 |
|
TF VRouter |
mirantis.azurecr.io/tungsten/contrail-vrouter-agent:5.1.20201127135523 |
Apache License 2.0 |
mirantis.azurecr.io/tungsten/contrail-vrouter-kernel-build-init:5.1.20201127135523 |
Apache License 2.0 |
|
Cassandra operator |
mirantis.azurecr.io/tungsten-operator/casskop:v0.5.3-release |
Apache License 2.0 |
Cassandra |
mirantis.azurecr.io/tungsten/cassandra-bootstrap:0.1.4 |
Apache License 2.0 |
mirantis.azurecr.io/tungsten/cassandra:3.11.6 |
Apache License 2.0 |
|
Kafka operator |
mirantis.azurecr.io/tungsten-operator/kafka-k8s-operator:0.0.6 |
Mirantis Proprietary License |
Kafka |
mirantis.azurecr.io/tungsten/cp-kafka:5.5.2 |
Apache License 2.0 |
RabbitMQ operator |
mirantis.azurecr.io/tungsten-operator/rabbitmq-operator:0.0.7 |
Mirantis Proprietary License |
RabbitMQ |
mirantis.azurecr.io/general/rabbitmq:3.8.7 |
Mozilla Public License 2.0 |
Zookeeper operator |
mirantis.azurecr.io/tungsten-operator/zookeeper-operator:0.2.9 |
Apache License 2.0 |
Zookeeper |
mirantis.azurecr.io/tungsten/zookeeper:3.6.1-0.2.9 |
Apache License 2.0 |
Redis operator |
mirantis.azurecr.io/tungsten-operator/redis-operator:0.1.5-1-ccd6a63 |
Apache License 2.0 |
Redis |
mirantis.azurecr.io/tungsten/redis:5-alpine |
BSD 3-Clause “New” or “Revised” License |
TF Test |
mirantis.azurecr.io/tungsten/tungsten-pytest:0.1-20201127103849 |
MIT License |
The following issues have been addressed in the Mirantis OpenStack for Kubernetes Ussuri Update release:
[9681] [OS] Fixed the issue that caused the
openstack-mariadb-cluster-waitjob reaching the backoff limit during the MOS cluster update.[9883] [OS] Improved the logic of the MOS cluster update to prevent the occurrence of deadlock.
[8293] [TF] Fixed the configuration error that caused the logging of error messages on attempts to use loggers in
contrail-lbaas-haproxy-stdout.log.
MOS Ussuri GA release
Release date |
Name |
Container Cloud Cluster release |
Highlights |
|---|---|---|---|
November 05, 2020 |
MOS Ussuri |
6.8.1 |
General availability of the product with OpenStack Ussuri and choice of Neutron/OVS or Tungsten Fabric 5.1 for networking. Runs on top of a bare metal Kubernetes cluster managed by Container Cloud. |
Mirantis OpenStack for Kubernetes (MOS) represents a frictionless cloud infrastructure on-premise. MOS Ussuri is integrated with Container Cloud bare metal with Ceph and StackLight onboard and, optionally, supports Tugsten Fabric 5.1 as a backend for the OpenStack networking. In terms of updates, MOS Ussuri fully relies on the Container Cloud update delivery mechanism.
MOS provides support for OpenStack Ussuri and the following OpenStack components of this release, in particular:
Identity service (Keystone)
Compute service (Nova)
Image service (Glance)
Block Storage service (Cinder)
Orchestration (Heat)
Networking (Neutron)
Load Balancer (Octavia)
DNS service (Designate)
Dashboard (Horizon)
Key management (Barbican)
Tempest
MOS provides support for Tungsten Fabric 5.1 as an SDN backend for OpenStack.
The list of the key highlights include:
Integration with OpenStack Ussuri
Implementation of the Octavia Tungsten Fabric driver for OpenStack LBaaS
LCM operations for supported Tungsten Fabric services as well as third-party services such as Cassandra, ZooKeeper, Kafka, Redis, and RabbitMQ.
Mirantis has tested MOS against a very specific configuration and can guarantee a predictable behavior of the product only in the exact same environments. The table below includes the major MOS components with the exact versions against which testing has been performed.
This section contains the description of the known issues with available workarounds.
[6912] Octavia load balancers may not work properly with DVR
[8573] External authentication to Horizon fails to log in a different user
Due to limitations in the Octavia and MOS integration, the clusters where Neutron is deployed in the Distributed Virtual Router (DVR) mode are not stable. Therefore, Mirantis does not recommend such configuration for production deployments.
Limitation
When Neutron is deployed in the DVR mode, Octavia load balancers may not work correctly. The symptoms include both failure to properly balance traffic and failure to perform an amphora failover. For details, see DVR incompatibility with ARP announcements and VRRP.
Target fix version: next MOS update
Horizon retains the user’s credentials following their initial login using External Authentication Service, and does not allow to log in with another user credentials.
Workaround:
Clear cookies in your browser.
Select External Authentication Service on the Horizon login page.
Click Sign In. The Keycloak login page opens.
If the following error occurs, refresh the page and try again:
CSRF token missing or incorrect. Cookies may be turned off. Make sure cookies are enabled and try again.
Tungsten Fabric is not monitored by StackLight
Tungsten Fabric does not provide the following functionality:
Automatic generation of network port records in DNSaaS (Designate) as Neutron with Tungsten Fabric as a backend is not integrated with DNSaaS. As a workaround, you can use the Tungsten Fabric built-in DNS service that enables virtual machines to resolve each other names.
Secret management (Barbican). You cannot use the certificates stored in Barbican to terminate HTTPs in a load balancer.
Role Based Access Control (RBAC) for Neutron objects.
Fixed in MOS Ussuri Update
The HAProxy service, which is used as a backend for load balancers in
Tungsten Fabric, uses non-existing socket files from the log collection
service. This error in the configuration causes the logging of error
messages on attempts to use loggers in contrail-lbaas-haproxy-stdout.log.
The issue does not affect the service operability.
The tf-control service resolves the DNS names of Cassandra pods at startup
and does not update them if Cassandra pods got new IP addresses, for example,
in case of a restart. As a workaround, to refresh the IP addresses of
Cassandra pods, restart the tf-control pods one by one:
Caution
Before restarting the tf-control pods:
Verify that the new pods are successfully spawned.
Verify that no vRouters are connected to only one
tf-controlpod that will be restarted.
kubectl -n tf delete pod tf-control-<hash>
This section lists the components artifacts of the MOS Ussuri release:
Component |
Path |
License information for main executable programs |
|---|---|---|
Binaries |
||
octavia-amphora |
https://binary.mirantis.com/openstack/bin/octavia/amphora-x64-haproxy-ussuri-20200926005743.qcow2 |
Mirantis Proprietary License |
mirantis |
https://binary.mirantis.com/openstack/bin/horizon/mirantis-ussuri-26b0ff5.tar.gz |
Mirantis Proprietary License |
Docker images |
||
placement |
mirantis.azurecr.io/openstack/placement:ussuri-bionic-20201019180023 |
Apache License 2.0 |
keystone |
mirantis.azurecr.io/openstack/keystone:ussuri-bionic-20201019180023 |
Apache License 2.0 |
heat |
mirantis.azurecr.io/openstack/heat:ussuri-bionic-20201019180023 |
Apache License 2.0 |
glance |
mirantis.azurecr.io/openstack/glance:ussuri-bionic-20201019180023 |
Apache License 2.0 |
cinder |
mirantis.azurecr.io/openstack/cinder:ussuri-bionic-20201019180023 |
Apache License 2.0 |
neutron |
mirantis.azurecr.io/openstack/neutron:ussuri-bionic-20201019180023 |
Apache License 2.0 |
nova |
mirantis.azurecr.io/openstack/nova:ussuri-bionic-20201019180023 |
Apache License 2.0 |
horizon |
mirantis.azurecr.io/openstack/horizon:ussuri-bionic-20201019180023 |
Apache License 2.0 |
tempest |
mirantis.azurecr.io/openstack/tempest:ussuri-bionic-20201019180023 |
Apache License 2.0 |
dashboard-selenium |
mirantis.azurecr.io/openstack/dashboard-selenium:ussuri-bionic-20201006074752 |
Apache License 2.0 |
octavia |
mirantis.azurecr.io/openstack/octavia:ussuri-bionic-20201019180023 |
Apache License 2.0 |
designate |
mirantis.azurecr.io/openstack/designate:ussuri-bionic-20201019180023 |
Apache License 2.0 |
ironic |
mirantis.azurecr.io/openstack/ironic:ussuri-bionic-20201019180023 |
Apache License 2.0 |
barbican |
mirantis.azurecr.io/openstack/barbican:ussuri-bionic-20201019180023 |
Apache License 2.0 |
libvirt |
mirantis.azurecr.io/general/libvirt:6.0.0-bionic-20201007084753 |
LGPL-2.1 License |
pause |
mirantis.azurecr.io/general/external/pause:3.1 |
Apache License 2.0 |
openvswitch |
mirantis.azurecr.io/general/openvswitch:2.11-bionic-20200812034813 |
Apache License 2.0 |
rabbitmq-3.8 |
mirantis.azurecr.io/general/rabbitmq:3.8.7 |
Mozilla Public License 2.0 |
rabbitmq-3.8-management |
mirantis.azurecr.io/general/rabbitmq:3.8.7-management |
Mozilla Public License 2.0 |
kubernetes-entrypoint |
mirantis.azurecr.io/openstack/extra/kubernetes-entrypoint:v1.0.0-20200311160233 |
Apache License 2.0 |
docker |
mirantis.azurecr.io/openstack/extra/docker:17.07.0 |
Apache License 2.0 |
memcached |
mirantis.azurecr.io/general/memcached:1.6.6-alpine |
BSD 3-Clause “New” or “Revised” License |
ceph-config-helper |
mirantis.azurecr.io/openstack/extra/ceph-config-helper:nautilus-bionic-20200810084204 |
Apache License 2.0, LGPL-2.1 or LGPL-3 |
etcd |
mirantis.azurecr.io/openstack/extra/etcd:3.2.26 |
Apache License 2.0 |
powerdns |
mirantis.azurecr.io/openstack/extra/powerdns:4.2-alpine-20200117133238 |
GPL-2.0 License |
nginx-ingress-controller |
mirantis.azurecr.io/openstack/extra/nginx-ingress-controller:0.32.0 |
Apache License 2.0 |
defaultbackend |
mirantis.azurecr.io/openstack/extra/defaultbackend:1.0 |
Apache License 2.0 |
mariadb |
mirantis.azurecr.io/general/mariadb:10.4.14-bionic-20200812025059 |
GPLv2, LGPLv2.1 (client libraries) |
rabbitmq-exporter |
mirantis.azurecr.io/stacklight/rabbitmq-exporter:v0.29.0 |
MIT License |
prometheus-memcached-exporter |
mirantis.azurecr.io/stacklight/memcached-exporter:v0.5.0 |
Apache License 2.0 |
prometheus-mysql-exporter |
mirantis.azurecr.io/stacklight/mysqld-exporter:v0.11.0 |
Apache License 2.0 |
xrally-openstack |
mirantis.azurecr.io/openstack/extra/xrally-openstack:1.5.0 |
Apache License 2.0 |
aodh |
mirantis.azurecr.io/openstack/aodh:ussuri-bionic-20201019180023 |
Apache License 2.0 |
panko |
mirantis.azurecr.io/openstack/panko:ussuri-bionic-20201019180023 |
Apache License 2.0 |
ceilometer |
mirantis.azurecr.io/openstack/ceilometer:ussuri-bionic-20201019180023 |
Apache License 2.0 |
gnocchi |
mirantis.azurecr.io/openstack/gnocchi:ussuri-bionic-20201019180023 |
Apache License 2.0 |
redis |
mirantis.azurecr.io/openstack/extra/redis:5.0-alpine |
BSD 3-Clause “New” or “Revised” License |
Helm charts |
||
openstack-operator |
https://binary.mirantis.com/openstack/helm/openstack-controller/openstack-operator-0.3.9.tgz |
Mirantis Proprietary License |
aodh |
https://binary.mirantis.com/openstack/helm/openstack-helm/aodh-0.1.0-mcp-3742.tgz |
Apache License 2.0 (no License file in Helm chart) |
barbican |
https://binary.mirantis.com/openstack/helm/openstack-helm/barbican-0.1.0-mcp-3742.tgz |
Apache License 2.0 (no License file in Helm chart) |
ceilometer |
https://binary.mirantis.com/openstack/helm/openstack-helm/ceilometer-0.1.0-mcp-3742.tgz |
Apache License 2.0 (no License file in Helm chart) |
cinder |
https://binary.mirantis.com/openstack/helm/openstack-helm/cinder-0.1.0-mcp-3742.tgz |
Apache License 2.0 (no License file in Helm chart) |
designate |
https://binary.mirantis.com/openstack/helm/openstack-helm/designate-0.1.0-mcp-3742.tgz |
Apache License 2.0 (no License file in Helm chart) |
glance |
https://binary.mirantis.com/openstack/helm/openstack-helm/glance-0.1.0-mcp-3742.tgz |
Apache License 2.0 (no License file in Helm chart) |
heat |
https://binary.mirantis.com/openstack/helm/openstack-helm/heat-0.1.0-mcp-3742.tgz |
Apache License 2.0 (no License file in Helm chart) |
horizon |
https://binary.mirantis.com/openstack/helm/openstack-helm/horizon-0.1.0-mcp-3742.tgz |
Apache License 2.0 (no License file in Helm chart) |
ironic |
https://binary.mirantis.com/openstack/helm/openstack-helm/ironic-0.1.0-mcp-3742.tgz |
Apache License 2.0 (no License file in Helm chart) |
keystone |
https://binary.mirantis.com/openstack/helm/openstack-helm/keystone-0.1.0-mcp-3742.tgz |
Apache License 2.0 (no License file in Helm chart) |
magnum |
https://binary.mirantis.com/openstack/helm/openstack-helm/magnum-0.1.0-mcp-3742.tgz |
Apache License 2.0 (no License file in Helm chart) |
mistral |
https://binary.mirantis.com/openstack/helm/openstack-helm/mistral-0.1.0-mcp-3742.tgz |
Apache License 2.0 (no License file in Helm chart) |
neutron |
https://binary.mirantis.com/openstack/helm/openstack-helm/neutron-0.1.0-mcp-3742.tgz |
Apache License 2.0 (no License file in Helm chart) |
nova |
https://binary.mirantis.com/openstack/helm/openstack-helm/nova-0.1.0-mcp-3742.tgz |
Apache License 2.0 (no License file in Helm chart) |
octavia |
https://binary.mirantis.com/openstack/helm/openstack-helm/octavia-0.1.0-mcp-3742.tgz |
Apache License 2.0 (no License file in Helm chart) |
panko |
https://binary.mirantis.com/openstack/helm/openstack-helm/panko-0.1.0-mcp-3742.tgz |
Apache License 2.0 (no License file in Helm chart) |
rally |
https://binary.mirantis.com/openstack/helm/openstack-helm/rally-0.1.0-mcp-3742.tgz |
Apache License 2.0 (no License file in Helm chart) |
senlin |
https://binary.mirantis.com/openstack/helm/openstack-helm/senlin-0.1.0-mcp-3742.tgz |
Apache License 2.0 (no License file in Helm chart) |
tempest |
https://binary.mirantis.com/openstack/helm/openstack-helm/tempest-0.1.0-mcp-3742.tgz |
Apache License 2.0 (no License file in Helm chart) |
dashboard-selenium |
https://binary.mirantis.com/openstack/helm/openstack-helm/dashboard-selenium-0.1.0-mcp-3742.tgz |
Apache License 2.0 (no License file in Helm chart) |
placement |
https://binary.mirantis.com/openstack/helm/openstack-helm/placement-0.1.0-mcp-3742.tgz |
Apache License 2.0 (no License file in Helm chart) |
calico |
https://binary.mirantis.com/openstack/helm/openstack-helm-infra/calico-0.1.0-mcp-2650.tgz |
Apache License 2.0 (no License file in Helm chart) |
ceph-client |
https://binary.mirantis.com/openstack/helm/openstack-helm-infra/ceph-client-0.1.0-mcp-2650.tgz |
Apache License 2.0 (no License file in Helm chart) |
ceph-mon |
https://binary.mirantis.com/openstack/helm/openstack-helm-infra/ceph-mon-0.1.0-mcp-2650.tgz |
Apache License 2.0 (no License file in Helm chart) |
ceph-osd |
https://binary.mirantis.com/openstack/helm/openstack-helm-infra/ceph-osd-0.1.0-mcp-2650.tgz |
Apache License 2.0 (no License file in Helm chart) |
ceph-provisioners |
https://binary.mirantis.com/openstack/helm/openstack-helm-infra/ceph-provisioners-0.1.0-mcp-2650.tgz |
Apache License 2.0 (no License file in Helm chart) |
ceph-rgw |
https://binary.mirantis.com/openstack/helm/openstack-helm-infra/ceph-rgw-0.1.0-mcp-2650.tgz |
Apache License 2.0 (no License file in Helm chart) |
dnsmasq |
https://binary.mirantis.com/openstack/helm/openstack-helm-infra/dnsmasq-0.1.0-mcp-2650.tgz |
Apache License 2.0 (no License file in Helm chart) |
elastic-apm-server |
Apache License 2.0 (no License file in Helm chart) |
|
elastic-filebeat |
https://binary.mirantis.com/openstack/helm/openstack-helm-infra/elastic-filebeat-0.1.0-mcp-2650.tgz |
Apache License 2.0 (no License file in Helm chart) |
elastic-metricbeat |
Apache License 2.0 (no License file in Helm chart) |
|
elastic-packetbeat |
Apache License 2.0 (no License file in Helm chart) |
|
etcd |
https://binary.mirantis.com/openstack/helm/openstack-helm-infra/etcd-0.1.0-mcp-2650.tgz |
Apache License 2.0 (no License file in Helm chart) |
falco |
https://binary.mirantis.com/openstack/helm/openstack-helm-infra/falco-0.1.0-mcp-2650.tgz |
Apache License 2.0 (no License file in Helm chart) |
flannel |
https://binary.mirantis.com/openstack/helm/openstack-helm-infra/flannel-0.1.0-mcp-2650.tgz |
Apache License 2.0 (no License file in Helm chart) |
fluentbit |
https://binary.mirantis.com/openstack/helm/openstack-helm-infra/fluentbit-0.1.0-mcp-2650.tgz |
Apache License 2.0 (no License file in Helm chart) |
fluentd |
https://binary.mirantis.com/openstack/helm/openstack-helm-infra/fluentd-0.1.0-mcp-2650.tgz |
Apache License 2.0 (no License file in Helm chart) |
gnocchi |
https://binary.mirantis.com/openstack/helm/openstack-helm-infra/gnocchi-0.1.0-mcp-2650.tgz |
Apache License 2.0 (no License file in Helm chart) |
grafana |
https://binary.mirantis.com/openstack/helm/openstack-helm-infra/grafana-0.1.0-mcp-2650.tgz |
Apache License 2.0 (no License file in Helm chart) |
helm-toolkit |
https://binary.mirantis.com/openstack/helm/openstack-helm-infra/helm-toolkit-0.1.0-mcp-2650.tgz |
Apache License 2.0 (no License file in Helm chart) |
ingress |
https://binary.mirantis.com/openstack/helm/openstack-helm-infra/ingress-0.1.0-mcp-2650.tgz |
Apache License 2.0 (no License file in Helm chart) |
kube-dns |
https://binary.mirantis.com/openstack/helm/openstack-helm-infra/kube-dns-0.1.0-mcp-2650.tgz |
Apache License 2.0 (no License file in Helm chart) |
kubernetes-keystone-webhook |
Apache License 2.0 (no License file in Helm chart) |
|
ldap |
https://binary.mirantis.com/openstack/helm/openstack-helm-infra/ldap-0.1.0-mcp-2650.tgz |
Apache License 2.0 (no License file in Helm chart) |
libvirt |
https://binary.mirantis.com/openstack/helm/openstack-helm-infra/libvirt-0.1.0-mcp-2650.tgz |
Apache License 2.0 (no License file in Helm chart) |
lockdown |
https://binary.mirantis.com/openstack/helm/openstack-helm-infra/lockdown-0.1.0-mcp-2650.tgz |
Apache License 2.0 (no License file in Helm chart) |
mariadb |
https://binary.mirantis.com/openstack/helm/openstack-helm-infra/mariadb-0.1.0-mcp-2650.tgz |
Apache License 2.0 (no License file in Helm chart) |
memcached |
https://binary.mirantis.com/openstack/helm/openstack-helm-infra/memcached-0.1.0-mcp-2650.tgz |
Apache License 2.0 (no License file in Helm chart) |
mongodb |
https://binary.mirantis.com/openstack/helm/openstack-helm-infra/mongodb-0.1.0-mcp-2650.tgz |
Apache License 2.0 (no License file in Helm chart) |
nagios |
https://binary.mirantis.com/openstack/helm/openstack-helm-infra/nagios-0.1.0-mcp-2650.tgz |
Apache License 2.0 (no License file in Helm chart) |
nfs-provisioner |
https://binary.mirantis.com/openstack/helm/openstack-helm-infra/nfs-provisioner-0.1.0-mcp-2650.tgz |
Apache License 2.0 (no License file in Helm chart) |
openvswitch |
https://binary.mirantis.com/openstack/helm/openstack-helm-infra/openvswitch-0.1.0-mcp-2650.tgz |
Apache License 2.0 (no License file in Helm chart) |
podsecuritypolicy |
https://binary.mirantis.com/openstack/helm/openstack-helm-infra/podsecuritypolicy-0.1.0-mcp-2650.tgz |
Apache License 2.0 (no License file in Helm chart) |
postgresql |
https://binary.mirantis.com/openstack/helm/openstack-helm-infra/postgresql-0.1.0-mcp-2650.tgz |
Apache License 2.0 (no License file in Helm chart) |
powerdns |
https://binary.mirantis.com/openstack/helm/openstack-helm-infra/powerdns-0.1.0-mcp-2650.tgz |
Apache License 2.0 (no License file in Helm chart) |
prometheus |
https://binary.mirantis.com/openstack/helm/openstack-helm-infra/prometheus-0.1.0-mcp-2650.tgz |
Apache License 2.0 (no License file in Helm chart) |
prometheus-alertmanager |
Apache License 2.0 (no License file in Helm chart) |
|
prometheus-kube-state-metrics |
Apache License 2.0 (no License file in Helm chart) |
|
prometheus-node-exporter |
Apache License 2.0 (no License file in Helm chart) |
|
prometheus-openstack-exporter |
Apache License 2.0 (no License file in Helm chart) |
|
prometheus-process-exporter |
Apache License 2.0 (no License file in Helm chart) |
|
rabbitmq |
https://binary.mirantis.com/openstack/helm/openstack-helm-infra/rabbitmq-0.1.0-mcp-2650.tgz |
Apache License 2.0 (no License file in Helm chart) |
redis |
https://binary.mirantis.com/openstack/helm/openstack-helm-infra/redis-0.1.0-mcp-2650.tgz |
Apache License 2.0 (no License file in Helm chart) |
registry |
https://binary.mirantis.com/openstack/helm/openstack-helm-infra/registry-0.1.0-mcp-2650.tgz |
Apache License 2.0 (no License file in Helm chart) |
tiller |
https://binary.mirantis.com/openstack/helm/openstack-helm-infra/tiller-0.1.0-mcp-2650.tgz |
Apache License 2.0 (no License file in Helm chart) |
zookeeper |
https://binary.mirantis.com/openstack/helm/openstack-helm-infra/zookeeper-0.1.0-mcp-2650.tgz |
Apache License 2.0 (no License file in Helm chart) |
Component |
Path |
License information for main executable programs |
|---|---|---|
Helm charts |
||
Tungsten Fabric Operator |
https://binary-mirantis-com/tungsten/helm/tungstenfabric-operator-0.1.3.tgz |
Mirantis Proprietary License |
Docker images |
||
TF Analytics |
mirantis.azurecr.io/tungsten/contrail-analytics-api:5.1.20201022210010 |
Apache License 2.0 |
mirantis.azurecr.io/tungsten/contrail-analytics-collector:5.1.20201022210010 |
Apache License 2.0 |
|
TF Analytics Alarm |
mirantis.azurecr.io/tungsten/contrail-analytics-alarm-gen:5.1.20201022210010 |
Apache License 2.0 |
TF Analytics DB |
mirantis.azurecr.io/tungsten/contrail-analytics-query-engine:5.1.20201022210010 |
Apache License 2.0 |
TF Analytics SNMP |
mirantis.azurecr.io/tungsten/contrail-analytics-snmp-collector:5.1.20201022210010 |
Apache License 2.0 |
mirantis.azurecr.io/tungsten/contrail-analytics-snmp-topology:5.1.20201022210010 |
Apache License 2.0 |
|
TF Config |
mirantis.azurecr.io/tungsten/contrail-controller-config-api:5.1.20201022210010 |
Apache License 2.0 |
mirantis.azurecr.io/tungsten/contrail-controller-config-devicemgr:5.1.20201022210010 |
Apache License 2.0 |
|
mirantis.azurecr.io/tungsten/contrail-controller-config-schema:5.1.20201022210010 |
Apache License 2.0 |
|
mirantis.azurecr.io/tungsten/contrail-controller-config-svcmonitor:5.1.20201022210010 |
Apache License 2.0 |
|
TF Control |
mirantis.azurecr.io/tungsten/contrail-controller-control-control:5.1.20201022210010 |
Apache License 2.0 |
mirantis.azurecr.io/tungsten/contrail-controller-control-dns:5.1.20201022210010 |
Apache License 2.0 |
|
mirantis.azurecr.io/tungsten/contrail-controller-control-named:5.1.20201022210010 |
Apache License 2.0 |
|
TF Web UI |
mirantis.azurecr.io/tungsten/contrail-controller-webui-job:5.1.20201022210010 |
Apache License 2.0 |
mirantis.azurecr.io/tungsten/contrail-controller-webui-web:5.1.20201022210010 |
Apache License 2.0 |
|
Nodemanager |
mirantis.azurecr.io/tungsten/contrail-nodemgr:5.1.20201022210010 |
Apache License 2.0 |
TF Status |
mirantis.azurecr.io/tungsten/contrail-status:5.1.20201022210010 |
Apache License 2.0 |
mirantis.azurecr.io/tungsten/contrail-tf-status:5.1.20201022210010 |
Apache License 2.0 |
|
mirantis.azurecr.io/tungsten/contrail-tf-status-aggregator:5.1.20201022210010 |
Apache License 2.0 |
|
mirantis.azurecr.io/tungsten/contrail-tf-status-party:5.1.20201022210010 |
Apache License 2.0 |
|
mirantis.azurecr.io/tungsten/contrail-tungsten-pytest:5.1.20201022210010 |
MIT License |
|
TF VRouter |
mirantis.azurecr.io/tungsten/contrail-vrouter-agent:5.1.20201022210010 |
Apache License 2.0 |
mirantis.azurecr.io/tungsten/contrail-vrouter-kernel-build-init:5.1.20201022210010 |
Apache License 2.0 |
|
Cassandra operator |
mirantis.azurecr.io/tungsten-operator/casskop:v0.5.3-release |
Apache License 2.0 |
Cassandra |
mirantis.azurecr.io/tungsten/cassandra-bootstrap:0.1.4 |
Apache License 2.0 |
mirantis.azurecr.io/tungsten/cassandra:3.11.6 |
Apache License 2.0 |
|
Kafka operator |
mirantis.azurecr.io/tungsten-operator/kafka-k8s-operator:0.0.6 |
Mirantis Proprietary License |
Kafka |
mirantis.azurecr.io/tungsten/cp-kafka:5.5.2 |
Apache License 2.0 |
RabbitMQ operator |
mirantis.azurecr.io/tungsten-operator/rabbitmq-operator:0.0.7 |
Mirantis Proprietary License |
RabbitMQ |
mirantis.azurecr.io/general/rabbitmq:3.8.7 |
Mozilla Public License 2.0 |
Zookeeper operator |
mirantis.azurecr.io/tungsten-operator/zookeeper-operator:0.2.9 |
Apache License 2.0 |
Zookeeper |
mirantis.azurecr.io/tungsten/zookeeper:3.6.1-0.2.9 |
Apache License 2.0 |
Redis operator |
mirantis.azurecr.io/tungsten-operator/redis-operator:0.1.5-1-ccd6a63 |
Apache License 2.0 |
Redis |
mirantis.azurecr.io/tungsten/redis:5-alpine |
BSD 3-Clause “New” or “Revised” License |
Management cluster release notes for older releases
Major and patch versions update path
The primary distinction between major and patch product versions lies in the fact that major release versions introduce new functionalities, whereas patch release versions predominantly offer minor product enhancements, mostly CVE resolutions for your clusters.
Depending on your deployment needs, you can either update only between major Cluster releases or apply patch updates between major releases. Choosing the latter option ensures you receive security fixes as soon as they become available. Though, be prepared to update your cluster frequently, approximately once every three weeks. Otherwise, you can update only between major Cluster releases as each subsequent major Cluster release includes patch Cluster release updates of the previous major Cluster release.
Container Cloud release
|
Release date
|
Supported Cluster releases
|
Summary
|
|---|---|---|---|
Aug 11, 2025 |
Container Cloud 2.29.6 is the sixth patch release of the 2.29.x release series that contains the following updates:
|
||
Jul 14, 2025 |
Container Cloud 2.29.5 is the fifth patch release of the 2.29.x release series that contains the following updates:
|
||
Jun 16, 2025 |
Container Cloud 2.29.4 is the fourth patch release of the 2.29.x release series that contains the following updates:
|
||
May 20, 2025 |
Container Cloud 2.29.3 is the third patch release of the 2.29.x release series that contains the following updates:
|
||
Apr 22, 2025 |
Container Cloud 2.29.2 is the second patch release of the 2.29.x release series that contains the following updates:
|
||
Mar 26, 2025 |
Container Cloud 2.29.1 is the first patch release of the 2.29.x release series that introduces the following updates:
|
||
Mar 11, 2025 |
|
||
Feb 03, 2025 |
Container Cloud 2.28.5 is the fifth patch release of the 2.28.x release series that introduces the following updates:
|
||
Jan 06, 2025 |
Container Cloud 2.28.4 is the fourth patch release of the 2.28.x release series that introduces the following updates:
|
||
Dec 09, 2024 |
Container Cloud 2.28.3 is the third patch release of the 2.28.x release series that introduces the following updates:
|
||
Nov 18, 2024 |
Container Cloud 2.28.2 is the second patch release of the 2.28.x release series that introduces the following updates:
|
||
Oct 30, 2024 |
Container Cloud 2.28.1 is the first patch release of the 2.28.x release series that introduces the following updates:
|
||
Oct 16, 2024 |
|
- Cluster release is deprecated and will become unsupported in one of the following Container Cloud releases.
Container Cloud releases
This section outlines the release notes for the Mirantis Container Cloud GA releases until Container Cloud 2.29.x. Since 2.30.0, Container Cloud became part of Mirantis OpenStack for Kubernetes (MOSK) and was renamed to MOSK management.
For the latest supported MOSK management (formerly Container Cloud) release, see the MOSK latest version correlation table.
Within the scope of the Container Cloud GA release, major releases were published with new features, improvements, and critical issues resolutions to enhance the Container Cloud GA version. Between major releases, patch releases that incorporate fixes for CVEs of high and critical severity were delivered. For details, see Container Cloud releases, Cluster releases, and Patch releases.
When a new Container Cloud release was available, a management cluster automatically upgraded to a newer consecutive release unless this cluster contained managed clusters with a Cluster release unsupported by the newer Container Cloud release. For more details about the Container Cloud release mechanism, see Reference Architecture: Release Controller.
Version |
Release date |
Summary |
|---|---|---|
Aug 11, 2025 |
Container Cloud 2.29.6 is the sixth patch release of the 2.29.x release series that contains the following updates:
|
|
Jul 14, 2025 |
Container Cloud 2.29.5 is the fifth patch release of the 2.29.x release series that contains the following updates:
|
|
Jun 16, 2025 |
Container Cloud 2.29.4 is the fourth patch release of the 2.29.x release series that contains the following updates:
|
|
May 20, 2025 |
Container Cloud 2.29.3 is the third patch release of the 2.29.x release series that contains the following updates:
|
|
Apr 22, 2025 |
Container Cloud 2.29.2 is the second patch release of the 2.29.x release series that contains the following updates:
|
|
Mar 26, 2025 |
Container Cloud 2.29.1 is the first patch release of the 2.29.x release series that introduces the following updates:
|
|
Mar 11, 2025 |
|
|
Feb 03, 2025 |
Container Cloud 2.28.5 is the fifth patch release of the 2.28.x release series that introduces the following updates:
|
|
Jan 06, 2025 |
Container Cloud 2.28.4 is the fourth patch release of the 2.28.x release series that introduces the following updates:
|
2.29.6
The Container Cloud patch release 2.29.6, which is based on the 2.29.0 major release, provides the following updates:
Support for the patch Cluster releases 16.4.6 and 17.4.6 that represents MOSK patch release 25.1.1 patch
Support for Mirantis Kubernetes Engine to 3.7.24
Support for
docker-ee-cli23.0.18 on MOSK clusters (MCR 23.0.15) and 25.0.10 on management clusters (MCR 25.0.8)Bare metal: update of Ubuntu mirror from ubuntu-2025-06-23-003900 to ubuntu-2025-07-16-003900 along with update of minor kernel version from 5.15.0-142-generic to 5.15.0-143-generic
Mandatory migration of container runtime from Docker to containerd
Security fixes for CVEs in images
This patch release also supports the latest major Cluster releases 17.4.0 and 16.4.0. And it does not support greenfield deployments based on deprecated Cluster releases. Use the latest available Cluster releases instead.
For main deliverables of the parent Container Cloud release of 2.29.0, refer to 2.29.0.
For the list of MOSK addressed issues, if any, see 25.1.1 patch.
This section describes the specific actions you as a cloud operator need to complete before or after your Container Cloud cluster update to the Cluster releases 17.4.6 or 16.4.6.
Consider the information below as a supplement to the generic update procedures published in the Operations Guide: Update to a major version or Update to a patch version.
Due to the known issue 50561, after machine
disablement and consequent re-enablement, persistent volumes provisioned by
local-volume-provisioner that are not currently in use by any pod may
cause the local-volume-provisioner pod on such machine to switch to the
CrashLoopBackOff state.
To ensure that local-volume-provisioner does not block cluster update and
is healthy, either verify the cluster status in the Container Cloud web UI or
run the following command:
kubectl -n kube-system get pods
Example of system response extract with healthy local-volume-provisioner:
local-volume-provisioner-dg98z 1/1 Running 0 66d
Example of system response extract with unhealthy local-volume-provisioner:
local-volume-provisioner-h5lrc 0/1 CrashLoopBackOff 33 (2m3s ago) 90m
If local-volume-provisioner is unhealthy, proceed with the workaround
provided in the 50561 issue description.
Migration of container runtime from Docker to containerd, which is implemented for existing management and managed clusters, becomes mandatory in the scope of Container Cloud 2.29.x. Otherwise, the management cluster update to Container Cloud 2.30.0 will be blocked.
The use of containerd allows for better Kubernetes performance and component update without pod restart when applying fixes for CVEs. For the migration procedure, refer to Operations Guide: Migrate container runtime from Docker to containerd.
Important
Container runtime migration involves machine cordoning and draining.
Verify that deprecated minSizeGiB and maxSizeGiB parameters for the
devices specification and the sizeGiB parameter for the partitions
specification for devices, softRaidDevices, volumeGroups, and
logicalVolumes sections are not used in the BareMetalHostProfile
object.
If these parameters are specified, migrate them to the minSize,
maxSize, and size parameters accordingly. Instead of floats that
defined sizes in GiB for the *GiB parameters, use the
<sizeNumber><unit> text notation, for example 512Ki, 128Mi,
or 4Gi.
Caution
If the parameters are not migrated, they will be automatically
removed from all BaremetalHostProfile objects for both management and
managed clusters, which may cause those objects to become invalid.
In total, since Container Cloud 2.29.5, 142 Common Vulnerabilities and Exposures (CVE) have been fixed in 2.29.6: 1 of critical and 141 of high severity.
The table below includes the total numbers of addressed unique and common CVEs in images by product component. The common CVEs are issues addressed across several images.
Product component |
CVE type |
Critical |
High |
Total |
|---|---|---|---|---|
Ceph |
Unique |
0 |
9 |
9 |
Common |
0 |
119 |
119 |
|
Kaas core |
Unique |
0 |
5 |
5 |
Common |
0 |
8 |
8 |
|
StackLight |
Unique |
1 |
9 |
10 |
Common |
1 |
14 |
15 |
Mirantis Security Portal
For the detailed list of fixed and existing CVEs across the Mirantis Container Cloud and MOSK products, refer to Mirantis Security Portal.
MOSK CVEs
For the number of fixed CVEs in the MOSK-related components including OpenStack and Tungsten Fabric, refer to MOSK 25.1.1 release notes: Security notes.
This section lists known issues with workarounds for the Mirantis Container Cloud release 2.29.6 including the Cluster releases 17.4.6 and 16.4.6. For the known issues in the related MOSK release, see MOSK 25.1.1 release notes: Known issues.
For other issues that can occur while deploying and operating a Container Cloud cluster, see Troubleshooting Guide.
Note
This section also outlines still valid known issues from previous Container Cloud releases.
Due to the MetalLB upstream issue, a load balancer service may not obtain the external IP address.
The issue occurs when two services share the same external IP address and have
the same externalTrafficPolicy value. Initially, the services have the
external IP address assigned and are accessible. After modifying the
externalTrafficPolicy value for both services from Cluster to
Local, the first service that has been changed remains with no external IP
address assigned. Though, the second service, which was changed later, has the
external IP assigned as expected.
To work around the issue, make a dummy change to the service object where
external IP is <pending>:
Identify the service that is stuck:
kubectl get svc -A | grep pending
Example of system response:
stacklight iam-proxy-prometheus LoadBalancer 10.233.28.196 <pending> 443:30430/TCP
Add an arbitrary label to the service that is stuck. For example:
kubectl label svc -n stacklight iam-proxy-prometheus reconcile=1
Example of system response:
service/iam-proxy-prometheus labeledVerify that the external IP was allocated to the service:
kubectl get svc -n stacklight iam-proxy-prometheus
Example of system response:
NAME TYPE CLUSTER-IP EXTERNAL-IP PORT(S) AGE iam-proxy-prometheus LoadBalancer 10.233.28.196 10.0.34.108 443:30430/TCP 12d
During deletion of a manager machine running the ironic Pod from a bare
metal management cluster, the following problems occur:
All Pods are stuck in the
TerminatingstateA new
ironicPod fails to startThe related bare metal host is stuck in the
deprovisioningstate
As a workaround, before deletion of the node running the ironic Pod,
cordon and drain the node using the kubectl cordon <nodeName> and
kubectl drain <nodeName> commands.
Fixed in 2.30.0 (21.0.0 and 20.0.0)
During managed cluster update, if some node is being disabled and at the same
time ceph-maintenance-controller is restarted, a second
miracephnodedisable object is erroneously created for the node. As a
result, the second object fails in the Cleaning state, which blocks
managed cluster update.
Workaround
On the affected managed cluster, obtain the list of
miracephnodedisableobjects:kubectl get miracephnodedisable -n ceph-lcm-mirantis
The system response must contain one completed and one failed
miracephnodedisableobject for the node being disabled. For example:NAME AGE NODE NAME STATE LAST CHECK ISSUE nodedisable-353ccad2-8f19-4c11-95c9-a783abb531ba 58m kaas-node-91207a35-3200-41d1-9ba9-388500970981 Ready 2025-03-06T22:04:48Z nodedisable-58bbf563-1c76-4319-8c28-363d73a5efef 57m kaas-node-91207a35-3200-41d1-9ba9-388500970981 Cleaning 2025-03-07T11:59:27Z host clean up Job 'ceph-lcm-mirantis/host-cleanup-nodedisable-58bbf563-1c76-4319-8c28-363d73a5efef' is failed, check logs
Remove the failed
miracephnodedisableobject. For example:kubectl delete miracephnodedisable -n ceph-lcm-mirantis nodedisable-58bbf563-1c76-4319-8c28-363d73a5efef
Note
The issue does not reproduce since MOSK 25.2.
Update of a managed cluster based on bare metal and Ceph enabled fails with
PersistentVolumeClaim getting stuck in the Pending state for the
prometheus-server StatefulSet and the
MountVolume.MountDevice failed for volume warning in the StackLight event
logs.
Workaround:
Verify that the description of the Pods that failed to run contain the
FailedMountevents:kubectl -n <affectedProjectName> describe pod <affectedPodName>
In the command above, replace the following values:
<affectedProjectName>is the Container Cloud project name where the Pods failed to run<affectedPodName>is a Pod name that failed to run in the specified project
In the Pod description, identify the node name where the Pod failed to run.
Verify that the
csi-rbdpluginlogs of the affected node contain therbd volume mount failed: <csi-vol-uuid> is being usederror. The<csi-vol-uuid>is a unique RBD volume name.Identify
csiPodNameof the correspondingcsi-rbdplugin:kubectl -n rook-ceph get pod -l app=csi-rbdplugin \ -o jsonpath='{.items[?(@.spec.nodeName == "<nodeName>")].metadata.name}'
Output the affected
csiPodNamelogs:kubectl -n rook-ceph logs <csiPodName> -c csi-rbdplugin
Scale down the affected
StatefulSetorDeploymentof the Pod that fails to0replicas.On every
csi-rbdpluginPod, search for stuckcsi-vol:for pod in `kubectl -n rook-ceph get pods|grep rbdplugin|grep -v provisioner|awk '{print $1}'`; do echo $pod kubectl exec -it -n rook-ceph $pod -c csi-rbdplugin -- rbd device list | grep <csi-vol-uuid> done
Unmap the affected
csi-vol:rbd unmap -o force /dev/rbd<i>
The
/dev/rbd<i>value is a mapped RBD volume that usescsi-vol.Delete
volumeattachmentof the affected Pod:kubectl get volumeattachments | grep <csi-vol-uuid> kubectl delete volumeattacmhent <id>
Scale up the affected
StatefulSetorDeploymentback to the original number of replicas and wait until its state becomesRunning.
Fixed in 2.30.0 (21.0.0 and 20.0.0)
After machine disablement and consequent re-enablement, persistent volumes
(PVs) provisioned by local-volume-provisioner may cause the
local-volume-provisioner pod on such machine to switch to the
CrashLoopBackOff state.
This occurs because re-enabling the machine results in a new node UID being
assigned in Kubernetes. As a result, the owner ID of the volumes provisioned by
local-volume-provisioner no longer matches the new node UID. Although the
volumes remain in the correct system paths, local-volume-provisioner
detects a mismatch in ownership, leading to an unhealthy service state.
Workaround:
Identify the ID of the affected
local-volume-provisioner:kubectl -n kube-system get pods
Example of system response extract:
local-volume-provisioner-h5lrc 0/1 CrashLoopBackOff 33 (2m3s ago) 90m
In the
local-volume-provisionerlogs, identify the affected PVs. For example:kubectl logs -n kube-system local-volume-provisioner-h5lrc | less
Example of system response extract:
E0304 23:21:31.455148 1 discovery.go:221] Failed to discover local volumes: 5 error(s) while discovering volumes: [error creating PV "local-pv-1d04ed53" for volume at "/mnt/local-volumes/openstack-operator/bind-mounts/vol04": persistentvolumes "local-pv-1d04ed53" already exists error creating PV "local-pv-ce2dfc24" for volume at "/mnt/local-volumes/openstack-operator/bind-mounts/vol01": persistentvolumes "local-pv-ce2dfc24" already exists error creating PV "local-pv-bcb9e4bd" for volume at "/mnt/local-volumes/openstack-operator/bind-mounts/vol02": persistentvolumes "local-pv-bcb9e4bd" already exists error creating PV "local-pv-c5924ada" for volume at "/mnt/local-volumes/openstack-operator/bind-mounts/vol03": persistentvolumes "local-pv-c5924ada" already exists error creating PV "local-pv-7c7150cf" for volume at "/mnt/local-volumes/openstack-operator/bind-mounts/vol00": persistentvolumes "local-pv-7c7150cf" already exists]
Update the
pv.kubernetes.io/provisioned-byannotation for all PVs that are mentioned in thealready existserrors on the enabled node. The annotation must have thelocal-volume-provisioner-<K8S-NODE-NAME>-<K8S-NODE-UID>format.To obtain the node UID:
kubectl get node <K8S-NODE-NAME> -o jsonpath='{.metadata.uid}'
To edit annotations on the volumes:
kubectl edit pv <PV-NAME>
For example:
kubectl edit pv local-pv-ce2dfc24
During MariaDB operations on a management cluster, Pods may get stuck in continuous restarts with the following example error:
[ERROR] WSREP: Corrupt buffer header: \
addr: 0x7faec6f8e518, \
seqno: 3185219421952815104, \
size: 909455917, \
ctx: 0x557094f65038, \
flags: 11577. store: 49, \
type: 49
Workaround:
Create a backup of the
/var/lib/mysqldirectory on themariadb-serverPod.Verify that other replicas are up and ready.
Remove the
galera.cachefile for the affectedmariadb-serverPod.Remove the affected
mariadb-serverPod or wait until it is automatically restarted.
After Kubernetes restarts the Pod, the Pod clones the database in 1-2 minutes and restores the quorum.
Custom Grafana panels and dashboards may be corrupted after automatic migration of deprecated Angular-based plugins to the React-based ones. For details, see MOSK Deprecation Notes: Angular plugins in Grafana dashboards and the post-update step Back up custom Grafana dashboards in Container Cloud 2.28.4 update notes.
To work around the issue, manually adjust the affected dashboards to restore their custom appearance.
Fixed in 2.30.0 (21.0.0 and 20.0.0)
A compact MOSK cluster fails to be deployed through the Container Cloud web UI
due to inability to add any label to the control plane machines along with
inability to change dedicatedControlPlane: false using the web UI.
To work around the issue, manually add the required labels using CLI. Once done, the cluster deployment resumes.
A newly created project does not display all available tabs in the Container
Cloud web UI and contains different access denied errors during first five
minutes after creation.
To work around the issue, refresh the browser in five minutes after the project creation.
This section lists the artifacts of components included in the Container Cloud patch release 2.29.6. For artifacts of the Cluster releases introduced in 2.29.6, see patch Cluster releases 17.4.6 and 16.4.6.
Note
The components that are newly added, updated, deprecated, or removed
as compared to the previous release version, are marked
with a corresponding superscript,
for example, lcm-ansible Updated.
Artifact |
Component |
Path |
|---|---|---|
Binaries |
ironic-python-agent.initramfs Updated |
https://binary.mirantis.com/bm/bin/ironic/ipa/ubuntu/initramfs-caracal-jammy-debug-20250716131654 |
ironic-python-agent.kernel Updated |
https://binary.mirantis.com/bm/bin/ironic/ipa/ubuntu/kernel-caracal-jammy-debug-20250716131654 |
|
provisioning_ansible |
https://binary.mirantis.com/bm/bin/ansible/provisioning_ansible-0.1.1-167-e7a55fd.tgz |
|
Helm charts Updated |
baremetal-api |
https://binary.mirantis.com/core/helm/baremetal-api-1.42.26.tgz |
baremetal-operator |
https://binary.mirantis.com/core/helm/baremetal-operator-1.42.26.tgz |
|
baremetal-provider |
https://binary.mirantis.com/core/helm/baremetal-provider-1.42.26.tgz |
|
baremetal-public-api |
https://binary.mirantis.com/core/helm/baremetal-public-api-1.42.26.tgz |
|
kaas-ipam |
||
Docker images |
ambassador Updated |
mirantis.azurecr.io/core/external/nginx:1.42.26 |
baremetal-dnsmasq |
mirantis.azurecr.io/bm/baremetal-dnsmasq:base-2-29-alpine-20250520130542 |
|
baremetal-operator |
mirantis.azurecr.io/bm/baremetal-operator:base-2-29-alpine-20250617090210 |
|
bm-collective |
mirantis.azurecr.io/bm/bm-collective:base-2-29-alpine-20250617090858 |
|
cluster-api-provider-baremetal Updated |
mirantis.azurecr.io/core/cluster-api-provider-baremetal:1.42.26 |
|
ironic |
mirantis.azurecr.io/openstack/ironic:caracal-jammy-20250701070328 |
|
ironic-inspector |
mirantis.azurecr.io/openstack/ironic-inspector:caracal-jammy-20250701070328 |
|
ironic-prometheus-exporter |
mirantis.azurecr.io/stacklight/ironic-prometheus-exporter:0.1-20240913123302 |
|
kaas-ipam Updated |
mirantis.azurecr.io/core/kaas-ipam:1.42.26 |
|
kubernetes-entrypoint |
mirantis.azurecr.io/openstack/extra/kubernetes-entrypoint:v1.0.1-202a68c-20250203183923 |
|
mariadb |
mirantis.azurecr.io/general/mariadb:10.6.20-jammy-20241104184039 |
|
syslog-ng |
mirantis.azurecr.io/bm/syslog-ng:base-alpine-20250217103755 |
Artifact |
Component |
Path |
|---|---|---|
Bootstrap tarball Updated |
bootstrap-darwin |
https://binary.mirantis.com/core/bin/bootstrap-darwin-1.42.26.tgz |
bootstrap-linux |
https://binary.mirantis.com/core/bin/bootstrap-linux-1.42.26.tgz |
|
Helm charts |
admission-controller Updated |
https://binary.mirantis.com/core/helm/admission-controller-1.42.26.tgz |
agent-controller Updated |
https://binary.mirantis.com/core/helm/agent-controller-1.42.26.tgz |
|
ceph-kcc-controller Updated |
https://binary.mirantis.com/core/helm/ceph-kcc-controller-1.42.26.tgz |
|
cert-manager Updated |
https://binary.mirantis.com/core/helm/cert-manager-1.42.26.tgz |
|
configuration-collector Updated |
https://binary.mirantis.com/core/helm/configuration-collector-1.42.26.tgz |
|
credentials-controller Deprecated |
https://binary.mirantis.com/core/helm/credentials-controller-1.42.26.tgz |
|
event-controller Updated |
https://binary.mirantis.com/core/helm/event-controller-1.42.26.tgz |
|
host-os-modules-controller Updated |
https://binary.mirantis.com/core/helm/host-os-modules-controller-1.42.26.tgz |
|
iam-controller Updated |
https://binary.mirantis.com/core/helm/iam-controller-1.42.26.tgz |
|
kaas-exporter Updated |
https://binary.mirantis.com/core/helm/kaas-exporter-1.42.26.tgz |
|
kaas-public-api Updated |
https://binary.mirantis.com/core/helm/kaas-public-api-1.42.26.tgz |
|
kaas-ui Updated |
||
lcm-controller Updated |
https://binary.mirantis.com/core/helm/lcm-controller-1.42.26.tgz |
|
license-controller Updated |
https://binary.mirantis.com/core/helm/license-controller-1.42.26.tgz |
|
machinepool-controller Updated |
https://binary.mirantis.com/core/helm/machinepool-controller-1.42.26.tgz |
|
mcc-cache Updated |
||
mcc-cache-warmup Updated |
https://binary.mirantis.com/core/helm/mcc-cache-warmup-1.42.26.tgz |
|
openstack-provider Deprecated |
https://binary.mirantis.com/core/helm/openstack-provider-1.42.26.tgz |
|
portforward-controller Updated |
https://binary.mirantis.com/core/helm/portforward-controller-1.42.26.tgz |
|
rbac-controller Updated |
https://binary.mirantis.com/core/helm/rbac-controller-1.42.26.tgz |
|
release-controller Updated |
https://binary.mirantis.com/core/helm/release-controller-1.42.26.tgz |
|
scope-controller Updated |
https://binary.mirantis.com/core/helm/scope-controller-1.42.26.tgz |
|
secret-controller Updated |
https://binary.mirantis.com/core/helm/secret-controller-1.42.26.tgz |
|
user-controller Updated |
https://binary.mirantis.com/core/helm/user-controller-1.42.26.tgz |
|
Docker images |
admission-controller Updated |
mirantis.azurecr.io/core/admission-controller:1.42.26 |
agent-controller Updated |
mirantis.azurecr.io/core/agent-controller:1.42.26 |
|
ceph-kcc-controller Updated |
mirantis.azurecr.io/core/ceph-kcc-controller:1.42.26 |
|
cert-manager-controller |
mirantis.azurecr.io/core/external/cert-manager-controller:v1.11.0-13 |
|
configuration-collector Updated |
mirantis.azurecr.io/core/configuration-collector:1.42.26 |
|
credentials-controller Deprecated |
mirantis.azurecr.io/core/credentials-controller:1.42.26 |
|
event-controller Updated |
mirantis.azurecr.io/core/event-controller:1.42.26 |
|
frontend Updated |
mirantis.azurecr.io/core/frontend:1.42.26 |
|
host-os-modules-controller Updated |
mirantis.azurecr.io/core/host-os-modules-controller:1.42.26 |
|
iam-controller Updated |
mirantis.azurecr.io/core/iam-controller:1.42.26 |
|
kaas-exporter Updated |
mirantis.azurecr.io/core/kaas-exporter:1.42.26 |
|
kproxy Updated |
mirantis.azurecr.io/core/kproxy:1.42.26 |
|
lcm-controller Updated |
mirantis.azurecr.io/core/lcm-controller:1.42.26 |
|
license-controller Updated |
mirantis.azurecr.io/core/license-controller:1.42.26 |
|
machinepool-controller Updated |
mirantis.azurecr.io/core/machinepool-controller:1.42.26 |
|
mcc-cache-warmup Updated |
mirantis.azurecr.io/core/mcc-cache-warmup:1.42.26 |
|
nginx Updated |
mirantis.azurecr.io/core/external/nginx:1.42.26 |
|
openstack-cluster-api-controller Deprecated |
mirantis.azurecr.io/core/openstack-cluster-api-controller:1.42.26 |
|
portforward-controller Updated |
mirantis.azurecr.io/core/portforward-controller:1.42.26 |
|
rbac-controller Updated |
mirantis.azurecr.io/core/rbac-controller:1.42.26 |
|
registry |
mirantis.azurecr.io/lcm/registry:v2.8.1-16 |
|
release-controller Updated |
mirantis.azurecr.io/core/release-controller:1.42.26 |
|
scope-controller Updated |
mirantis.azurecr.io/core/scope-controller:1.42.26 |
|
secret-controller Updated |
mirantis.azurecr.io/core/secret-controller:1.42.26 |
|
user-controller Updated |
mirantis.azurecr.io/core/user-controller:1.42.26 |
Artifact |
Component |
Path |
|---|---|---|
Binaries |
hash-generate-darwin |
http://binary.mirantis.com/iam/bin/hash-generate-0.0.1-268-3cf7f17-darwin |
hash-generate-linux |
http://binary.mirantis.com/iam/bin/hash-generate-0.0.1-268-3cf7f17-linux |
|
Helm charts Updated |
iam |
|
Docker images |
kubectl |
mirantis.azurecr.io/general/kubectl:20250307094924 |
kubernetes-entrypoint |
mirantis.azurecr.io/openstack/extra/kubernetes-entrypoint:v1.0.1-d06c869-20250204085201 |
|
mariadb |
mirantis.azurecr.io/general/mariadb:10.6.20-jammy-20250218081722 |
|
mcc-keycloak Updated |
mirantis.azurecr.io/iam/mcc-keycloak:25.0.6-20250731130900 |
2.29.5
The Container Cloud patch release 2.29.5, which is based on the 2.29.0 major release, provides the following updates:
Support for the patch Cluster release 17.3.10 that represents MOSK patch release 24.3.7 patch
Support for Mirantis Kubernetes Engine to 3.7.23
Support for
docker-ee-cli23.0.18 on MOSK clusters (MCR 23.0.15) and 25.0.10 on management clusters (MCR 25.0.8)Bare metal: update of Ubuntu mirror from ubuntu-2025-05-26-003900 to ubuntu-2025-06-23-003900 along with update of minor kernel version from 5.15.0-140-generic to 5.15.0-142-generic
Mandatory migration of container runtime from Docker to containerd
Security fixes for CVEs in images
This patch release also supports the latest major Cluster releases 17.4.0 and 16.4.0. And it does not support greenfield deployments based on deprecated Cluster releases. Use the latest available Cluster releases instead.
For main deliverables of the parent Container Cloud release of 2.29.0, refer to 2.29.0.
For the list of MOSK addressed issues, if any, see Release notes 24.3.7.
This section describes the specific actions you as a cloud operator need to complete before or after your Container Cloud cluster update to the Cluster releases 17.3.10, 16.3.10, or 16.4.5.
Consider the information below as a supplement to the generic update procedures published in the Operations Guide: Update to a major version or Update to a patch version.
Due to the known issue 50561, after machine
disablement and consequent re-enablement, persistent volumes provisioned by
local-volume-provisioner that are not currently in use by any pod may
cause the local-volume-provisioner pod on such machine to switch to the
CrashLoopBackOff state.
To ensure that local-volume-provisioner does not block cluster update and
is healthy, either verify the cluster status in the Container Cloud web UI or
run the following command:
kubectl -n kube-system get pods
Example of system response extract with healthy local-volume-provisioner:
local-volume-provisioner-dg98z 1/1 Running 0 66d
Example of system response extract with unhealthy local-volume-provisioner:
local-volume-provisioner-h5lrc 0/1 CrashLoopBackOff 33 (2m3s ago) 90m
If local-volume-provisioner is unhealthy, proceed with the workaround
provided in the 50561 issue description.
Migration of container runtime from Docker to containerd, which is implemented for existing management and managed clusters, becomes mandatory in the scope of Container Cloud 2.29.x. Otherwise, the management cluster update to Container Cloud 2.30.0 will be blocked.
The use of containerd allows for better Kubernetes performance and component update without pod restart when applying fixes for CVEs. For the migration procedure, refer to Operations Guide: Migrate container runtime from Docker to containerd.
Important
Container runtime migration involves machine cordoning and draining.
In total, since Container Cloud 2.29.4, 151 Common Vulnerabilities and Exposures (CVE) have been fixed in 2.29.5: 10 of critical and 141 of high severity.
The table below includes the total numbers of addressed unique and common CVEs in images by product component. The common CVEs are issues addressed across several images.
Product component |
CVE type |
Critical |
High |
Total |
|---|---|---|---|---|
Kaas core |
Unique |
2 |
5 |
7 |
Common |
8 |
39 |
47 |
|
StackLight |
Unique |
2 |
34 |
36 |
Common |
2 |
102 |
104 |
Mirantis Security Portal
For the detailed list of fixed and existing CVEs across the Mirantis Container Cloud and MOSK products, refer to Mirantis Security Portal.
MOSK CVEs
For the number of fixed CVEs in the MOSK-related components including OpenStack and Tungsten Fabric, refer to MOSK 24.3.7 security notes.
This section lists known issues with workarounds for the Mirantis Container Cloud release 2.29.5 including the Cluster releases 17.3.10, 16.3.10, and 16.4.5. For the known issues in the related MOSK release, see Known issues.
For other issues that can occur while deploying and operating a Container Cloud cluster, see Troubleshooting Guide.
Note
This section also outlines still valid known issues from previous Container Cloud releases.
Due to the MetalLB upstream issue, a load balancer service may not obtain the external IP address.
The issue occurs when two services share the same external IP address and have
the same externalTrafficPolicy value. Initially, the services have the
external IP address assigned and are accessible. After modifying the
externalTrafficPolicy value for both services from Cluster to
Local, the first service that has been changed remains with no external IP
address assigned. Though, the second service, which was changed later, has the
external IP assigned as expected.
To work around the issue, make a dummy change to the service object where
external IP is <pending>:
Identify the service that is stuck:
kubectl get svc -A | grep pending
Example of system response:
stacklight iam-proxy-prometheus LoadBalancer 10.233.28.196 <pending> 443:30430/TCP
Add an arbitrary label to the service that is stuck. For example:
kubectl label svc -n stacklight iam-proxy-prometheus reconcile=1
Example of system response:
service/iam-proxy-prometheus labeledVerify that the external IP was allocated to the service:
kubectl get svc -n stacklight iam-proxy-prometheus
Example of system response:
NAME TYPE CLUSTER-IP EXTERNAL-IP PORT(S) AGE iam-proxy-prometheus LoadBalancer 10.233.28.196 10.0.34.108 443:30430/TCP 12d
During deletion of a manager machine running the ironic Pod from a bare
metal management cluster, the following problems occur:
All Pods are stuck in the
TerminatingstateA new
ironicPod fails to startThe related bare metal host is stuck in the
deprovisioningstate
As a workaround, before deletion of the node running the ironic Pod,
cordon and drain the node using the kubectl cordon <nodeName> and
kubectl drain <nodeName> commands.
Fixed in 2.30.0 (21.0.0 and 20.0.0)
During managed cluster update, if some node is being disabled and at the same
time ceph-maintenance-controller is restarted, a second
miracephnodedisable object is erroneously created for the node. As a
result, the second object fails in the Cleaning state, which blocks
managed cluster update.
Workaround
On the affected managed cluster, obtain the list of
miracephnodedisableobjects:kubectl get miracephnodedisable -n ceph-lcm-mirantis
The system response must contain one completed and one failed
miracephnodedisableobject for the node being disabled. For example:NAME AGE NODE NAME STATE LAST CHECK ISSUE nodedisable-353ccad2-8f19-4c11-95c9-a783abb531ba 58m kaas-node-91207a35-3200-41d1-9ba9-388500970981 Ready 2025-03-06T22:04:48Z nodedisable-58bbf563-1c76-4319-8c28-363d73a5efef 57m kaas-node-91207a35-3200-41d1-9ba9-388500970981 Cleaning 2025-03-07T11:59:27Z host clean up Job 'ceph-lcm-mirantis/host-cleanup-nodedisable-58bbf563-1c76-4319-8c28-363d73a5efef' is failed, check logs
Remove the failed
miracephnodedisableobject. For example:kubectl delete miracephnodedisable -n ceph-lcm-mirantis nodedisable-58bbf563-1c76-4319-8c28-363d73a5efef
Note
The issue does not reproduce since MOSK 25.2.
Update of a managed cluster based on bare metal and Ceph enabled fails with
PersistentVolumeClaim getting stuck in the Pending state for the
prometheus-server StatefulSet and the
MountVolume.MountDevice failed for volume warning in the StackLight event
logs.
Workaround:
Verify that the description of the Pods that failed to run contain the
FailedMountevents:kubectl -n <affectedProjectName> describe pod <affectedPodName>
In the command above, replace the following values:
<affectedProjectName>is the Container Cloud project name where the Pods failed to run<affectedPodName>is a Pod name that failed to run in the specified project
In the Pod description, identify the node name where the Pod failed to run.
Verify that the
csi-rbdpluginlogs of the affected node contain therbd volume mount failed: <csi-vol-uuid> is being usederror. The<csi-vol-uuid>is a unique RBD volume name.Identify
csiPodNameof the correspondingcsi-rbdplugin:kubectl -n rook-ceph get pod -l app=csi-rbdplugin \ -o jsonpath='{.items[?(@.spec.nodeName == "<nodeName>")].metadata.name}'
Output the affected
csiPodNamelogs:kubectl -n rook-ceph logs <csiPodName> -c csi-rbdplugin
Scale down the affected
StatefulSetorDeploymentof the Pod that fails to0replicas.On every
csi-rbdpluginPod, search for stuckcsi-vol:for pod in `kubectl -n rook-ceph get pods|grep rbdplugin|grep -v provisioner|awk '{print $1}'`; do echo $pod kubectl exec -it -n rook-ceph $pod -c csi-rbdplugin -- rbd device list | grep <csi-vol-uuid> done
Unmap the affected
csi-vol:rbd unmap -o force /dev/rbd<i>
The
/dev/rbd<i>value is a mapped RBD volume that usescsi-vol.Delete
volumeattachmentof the affected Pod:kubectl get volumeattachments | grep <csi-vol-uuid> kubectl delete volumeattacmhent <id>
Scale up the affected
StatefulSetorDeploymentback to the original number of replicas and wait until its state becomesRunning.
Fixed in 2.30.0 (21.0.0 and 20.0.0)
After machine disablement and consequent re-enablement, persistent volumes
(PVs) provisioned by local-volume-provisioner may cause the
local-volume-provisioner pod on such machine to switch to the
CrashLoopBackOff state.
This occurs because re-enabling the machine results in a new node UID being
assigned in Kubernetes. As a result, the owner ID of the volumes provisioned by
local-volume-provisioner no longer matches the new node UID. Although the
volumes remain in the correct system paths, local-volume-provisioner
detects a mismatch in ownership, leading to an unhealthy service state.
Workaround:
Identify the ID of the affected
local-volume-provisioner:kubectl -n kube-system get pods
Example of system response extract:
local-volume-provisioner-h5lrc 0/1 CrashLoopBackOff 33 (2m3s ago) 90m
In the
local-volume-provisionerlogs, identify the affected PVs. For example:kubectl logs -n kube-system local-volume-provisioner-h5lrc | less
Example of system response extract:
E0304 23:21:31.455148 1 discovery.go:221] Failed to discover local volumes: 5 error(s) while discovering volumes: [error creating PV "local-pv-1d04ed53" for volume at "/mnt/local-volumes/openstack-operator/bind-mounts/vol04": persistentvolumes "local-pv-1d04ed53" already exists error creating PV "local-pv-ce2dfc24" for volume at "/mnt/local-volumes/openstack-operator/bind-mounts/vol01": persistentvolumes "local-pv-ce2dfc24" already exists error creating PV "local-pv-bcb9e4bd" for volume at "/mnt/local-volumes/openstack-operator/bind-mounts/vol02": persistentvolumes "local-pv-bcb9e4bd" already exists error creating PV "local-pv-c5924ada" for volume at "/mnt/local-volumes/openstack-operator/bind-mounts/vol03": persistentvolumes "local-pv-c5924ada" already exists error creating PV "local-pv-7c7150cf" for volume at "/mnt/local-volumes/openstack-operator/bind-mounts/vol00": persistentvolumes "local-pv-7c7150cf" already exists]
Update the
pv.kubernetes.io/provisioned-byannotation for all PVs that are mentioned in thealready existserrors on the enabled node. The annotation must have thelocal-volume-provisioner-<K8S-NODE-NAME>-<K8S-NODE-UID>format.To obtain the node UID:
kubectl get node <K8S-NODE-NAME> -o jsonpath='{.metadata.uid}'
To edit annotations on the volumes:
kubectl edit pv <PV-NAME>
For example:
kubectl edit pv local-pv-ce2dfc24
During MariaDB operations on a management cluster, Pods may get stuck in continuous restarts with the following example error:
[ERROR] WSREP: Corrupt buffer header: \
addr: 0x7faec6f8e518, \
seqno: 3185219421952815104, \
size: 909455917, \
ctx: 0x557094f65038, \
flags: 11577. store: 49, \
type: 49
Workaround:
Create a backup of the
/var/lib/mysqldirectory on themariadb-serverPod.Verify that other replicas are up and ready.
Remove the
galera.cachefile for the affectedmariadb-serverPod.Remove the affected
mariadb-serverPod or wait until it is automatically restarted.
After Kubernetes restarts the Pod, the Pod clones the database in 1-2 minutes and restores the quorum.
Custom Grafana panels and dashboards may be corrupted after automatic migration of deprecated Angular-based plugins to the React-based ones. For details, see MOSK Deprecation Notes: Angular plugins in Grafana dashboards and the post-update step Back up custom Grafana dashboards in Container Cloud 2.28.4 update notes.
To work around the issue, manually adjust the affected dashboards to restore their custom appearance.
Fixed in 2.30.0 (21.0.0 and 20.0.0)
A compact MOSK cluster fails to be deployed through the Container Cloud web UI
due to inability to add any label to the control plane machines along with
inability to change dedicatedControlPlane: false using the web UI.
To work around the issue, manually add the required labels using CLI. Once done, the cluster deployment resumes.
A newly created project does not display all available tabs in the Container
Cloud web UI and contains different access denied errors during first five
minutes after creation.
To work around the issue, refresh the browser in five minutes after the project creation.
This section lists the artifacts of components included in the Container Cloud patch release 2.29.5. For artifacts of the Cluster releases introduced in 2.29.5, see patch Cluster releases 17.3.10, 16.3.10, and 16.4.5.
Note
The components that are newly added, updated, deprecated, or removed
as compared to the previous release version, are marked
with a corresponding superscript,
for example, lcm-ansible Updated.
Artifact |
Component |
Path |
|---|---|---|
Binaries |
ironic-python-agent.initramfs Updated |
https://binary.mirantis.com/bm/bin/ironic/ipa/ubuntu/initramfs-caracal-jammy-debug-20250624163043 |
ironic-python-agent.kernel Updated |
https://binary.mirantis.com/bm/bin/ironic/ipa/ubuntu/kernel-caracal-jammy-debug-20250624163043 |
|
provisioning_ansible |
https://binary.mirantis.com/bm/bin/ansible/provisioning_ansible-0.1.1-167-e7a55fd.tgz |
|
Helm charts Updated |
baremetal-api |
https://binary.mirantis.com/core/helm/baremetal-api-1.42.23.tgz |
baremetal-operator |
https://binary.mirantis.com/core/helm/baremetal-operator-1.42.23.tgz |
|
baremetal-provider |
https://binary.mirantis.com/core/helm/baremetal-provider-1.42.23.tgz |
|
baremetal-public-api |
https://binary.mirantis.com/core/helm/baremetal-public-api-1.42.23.tgz |
|
kaas-ipam |
||
Docker images |
ambassador Updated |
mirantis.azurecr.io/core/external/nginx:1.42.23 |
baremetal-dnsmasq |
mirantis.azurecr.io/bm/baremetal-dnsmasq:base-2-29-alpine-20250520130542 |
|
baremetal-operator Updated |
mirantis.azurecr.io/bm/baremetal-operator:base-2-29-alpine-20250617090210 |
|
bm-collective Updated |
mirantis.azurecr.io/bm/bm-collective:base-2-29-alpine-20250617090858 |
|
cluster-api-provider-baremetal Updated |
mirantis.azurecr.io/core/cluster-api-provider-baremetal:1.42.23 |
|
ironic Updated |
mirantis.azurecr.io/openstack/ironic:caracal-jammy-20250701070328 |
|
ironic-inspector Updated |
mirantis.azurecr.io/openstack/ironic-inspector:caracal-jammy-20250701070328 |
|
ironic-prometheus-exporter |
mirantis.azurecr.io/stacklight/ironic-prometheus-exporter:0.1-20240913123302 |
|
kaas-ipam Updated |
mirantis.azurecr.io/core/kaas-ipam:1.42.23 |
|
kubernetes-entrypoint |
mirantis.azurecr.io/openstack/extra/kubernetes-entrypoint:v1.0.1-202a68c-20250203183923 |
|
mariadb |
mirantis.azurecr.io/general/mariadb:10.6.20-jammy-20241104184039 |
|
syslog-ng |
mirantis.azurecr.io/bm/syslog-ng:base-alpine-20250217103755 |
Artifact |
Component |
Path |
|---|---|---|
Bootstrap tarball Updated |
bootstrap-darwin |
https://binary.mirantis.com/core/bin/bootstrap-darwin-1.42.23.tgz |
bootstrap-linux |
https://binary.mirantis.com/core/bin/bootstrap-linux-1.42.23.tgz |
|
Helm charts |
admission-controller Updated |
https://binary.mirantis.com/core/helm/admission-controller-1.42.23.tgz |
agent-controller Updated |
https://binary.mirantis.com/core/helm/agent-controller-1.42.23.tgz |
|
ceph-kcc-controller Updated |
https://binary.mirantis.com/core/helm/ceph-kcc-controller-1.42.23.tgz |
|
cert-manager Updated |
https://binary.mirantis.com/core/helm/cert-manager-1.42.23.tgz |
|
configuration-collector Updated |
https://binary.mirantis.com/core/helm/configuration-collector-1.42.23.tgz |
|
credentials-controller Deprecated |
https://binary.mirantis.com/core/helm/credentials-controller-1.42.23.tgz |
|
event-controller Updated |
https://binary.mirantis.com/core/helm/event-controller-1.42.23.tgz |
|
host-os-modules-controller Updated |
https://binary.mirantis.com/core/helm/host-os-modules-controller-1.42.23.tgz |
|
iam-controller Updated |
https://binary.mirantis.com/core/helm/iam-controller-1.42.23.tgz |
|
kaas-exporter Updated |
https://binary.mirantis.com/core/helm/kaas-exporter-1.42.23.tgz |
|
kaas-public-api Updated |
https://binary.mirantis.com/core/helm/kaas-public-api-1.42.23.tgz |
|
kaas-ui Updated |
||
lcm-controller Updated |
https://binary.mirantis.com/core/helm/lcm-controller-1.42.23.tgz |
|
license-controller Updated |
https://binary.mirantis.com/core/helm/license-controller-1.42.23.tgz |
|
machinepool-controller Updated |
https://binary.mirantis.com/core/helm/machinepool-controller-1.42.23.tgz |
|
mcc-cache Updated |
||
mcc-cache-warmup Updated |
https://binary.mirantis.com/core/helm/mcc-cache-warmup-1.42.23.tgz |
|
openstack-provider Deprecated |
https://binary.mirantis.com/core/helm/openstack-provider-1.42.23.tgz |
|
portforward-controller Updated |
https://binary.mirantis.com/core/helm/portforward-controller-1.42.23.tgz |
|
rbac-controller Updated |
https://binary.mirantis.com/core/helm/rbac-controller-1.42.23.tgz |
|
release-controller Updated |
https://binary.mirantis.com/core/helm/release-controller-1.42.23.tgz |
|
scope-controller Updated |
https://binary.mirantis.com/core/helm/scope-controller-1.42.23.tgz |
|
secret-controller Updated |
https://binary.mirantis.com/core/helm/secret-controller-1.42.23.tgz |
|
user-controller Updated |
https://binary.mirantis.com/core/helm/user-controller-1.42.23.tgz |
|
Docker images |
admission-controller Updated |
mirantis.azurecr.io/core/admission-controller:1.42.23 |
agent-controller Updated |
mirantis.azurecr.io/core/agent-controller:1.42.23 |
|
ceph-kcc-controller Updated |
mirantis.azurecr.io/core/ceph-kcc-controller:1.42.23 |
|
cert-manager-controller |
mirantis.azurecr.io/core/external/cert-manager-controller:v1.11.0-13 |
|
configuration-collector Updated |
mirantis.azurecr.io/core/configuration-collector:1.42.23 |
|
credentials-controller Deprecated |
mirantis.azurecr.io/core/credentials-controller:1.42.23 |
|
event-controller Updated |
mirantis.azurecr.io/core/event-controller:1.42.23 |
|
frontend Updated |
mirantis.azurecr.io/core/frontend:1.42.23 |
|
host-os-modules-controller Updated |
mirantis.azurecr.io/core/host-os-modules-controller:1.42.23 |
|
iam-controller Updated |
mirantis.azurecr.io/core/iam-controller:1.42.23 |
|
kaas-exporter Updated |
mirantis.azurecr.io/core/kaas-exporter:1.42.23 |
|
kproxy Updated |
mirantis.azurecr.io/core/kproxy:1.42.23 |
|
lcm-controller Updated |
mirantis.azurecr.io/core/lcm-controller:1.42.23 |
|
license-controller Updated |
mirantis.azurecr.io/core/license-controller:1.42.23 |
|
machinepool-controller Updated |
mirantis.azurecr.io/core/machinepool-controller:1.42.23 |
|
mcc-cache-warmup Updated |
mirantis.azurecr.io/core/mcc-cache-warmup:1.42.23 |
|
nginx Updated |
mirantis.azurecr.io/core/external/nginx:1.42.23 |
|
openstack-cluster-api-controller Deprecated |
mirantis.azurecr.io/core/openstack-cluster-api-controller:1.42.23 |
|
portforward-controller Updated |
mirantis.azurecr.io/core/portforward-controller:1.42.23 |
|
rbac-controller Updated |
mirantis.azurecr.io/core/rbac-controller:1.42.23 |
|
registry Updated |
mirantis.azurecr.io/lcm/registry:v2.8.1-16 |
|
release-controller Updated |
mirantis.azurecr.io/core/release-controller:1.42.23 |
|
scope-controller Updated |
mirantis.azurecr.io/core/scope-controller:1.42.23 |
|
secret-controller Updated |
mirantis.azurecr.io/core/secret-controller:1.42.23 |
|
user-controller Updated |
mirantis.azurecr.io/core/user-controller:1.42.23 |
Artifact |
Component |
Path |
|---|---|---|
Binaries |
hash-generate-darwin |
http://binary.mirantis.com/iam/bin/hash-generate-0.0.1-268-3cf7f17-darwin |
hash-generate-linux |
http://binary.mirantis.com/iam/bin/hash-generate-0.0.1-268-3cf7f17-linux |
|
Helm charts Updated |
iam |
|
Docker images |
kubectl |
mirantis.azurecr.io/general/kubectl:20250307094924 |
kubernetes-entrypoint |
mirantis.azurecr.io/openstack/extra/kubernetes-entrypoint:v1.0.1-d06c869-20250204085201 |
|
mariadb |
mirantis.azurecr.io/general/mariadb:10.6.20-jammy-20250218081722 |
|
mcc-keycloak |
mirantis.azurecr.io/iam/mcc-keycloak:25.0.6-20250304083438 |
2.29.4
The Container Cloud patch release 2.29.4, which is based on the 2.29.0 major release, provides the following updates:
Support for the patch Cluster release 17.3.9 that represents MOSK patch release 24.3.6 patch
Support for Mirantis Kubernetes Engine to 3.7.23
Support for
docker-ee-cli23.0.18 on MOSK clusters (MCR 23.0.15) and 25.0.10 on management clusters (MCR 25.0.8)Bare metal: update of Ubuntu mirror from ubuntu-2025-03-31-003900 to ubuntu-2025-05-26-003900 along with update of minor kernel version from 5.15.0-135-generic to 5.15.0-140-generic
Mandatory migration of container runtime from Docker to containerd
Security fixes for CVEs in images
This patch release also supports the latest major Cluster releases 17.4.0 and 16.4.0. And it does not support greenfield deployments based on deprecated Cluster releases. Use the latest available Cluster releases instead.
For main deliverables of the parent Container Cloud release of 2.29.0, refer to 2.29.0.
For the list of MOSK addressed issues, if any, see Release notes 24.3.6.
This section describes the specific actions you as a cloud operator need to complete before or after your Container Cloud cluster update to the Cluster releases 17.3.9, 16.3.9, or 16.4.4.
Consider the information below as a supplement to the generic update procedures published in the Operations Guide: Update to a major version or Update to a patch version.
Due to the known issue 50561, after machine
disablement and consequent re-enablement, persistent volumes provisioned by
local-volume-provisioner that are not currently in use by any pod may
cause the local-volume-provisioner pod on such machine to switch to the
CrashLoopBackOff state.
To ensure that local-volume-provisioner does not block cluster update and
is healthy, either verify the cluster status in the Container Cloud web UI or
run the following command:
kubectl -n kube-system get pods
Example of system response extract with healthy local-volume-provisioner:
local-volume-provisioner-dg98z 1/1 Running 0 66d
Example of system response extract with unhealthy local-volume-provisioner:
local-volume-provisioner-h5lrc 0/1 CrashLoopBackOff 33 (2m3s ago) 90m
If local-volume-provisioner is unhealthy, proceed with the workaround
provided in the 50561 issue description.
Migration of container runtime from Docker to containerd, which is implemented for existing management and managed clusters, becomes mandatory in the scope of Container Cloud 2.29.x. Otherwise, the management cluster update to Container Cloud 2.30.0 will be blocked.
The use of containerd allows for better Kubernetes performance and component update without pod restart when applying fixes for CVEs. For the migration procedure, refer to Operations Guide: Migrate container runtime from Docker to containerd.
Important
Container runtime migration involves machine cordoning and draining.
In total, since Container Cloud 2.29.3, 46 Common Vulnerabilities and Exposures (CVE) have been fixed in 2.29.4: 2 of critical and 44 of high severity.
The table below includes the total numbers of addressed unique and common CVEs in images by product component. The common CVEs are issues addressed across several images.
Product component |
CVE type |
Critical |
High |
Total |
|---|---|---|---|---|
Ceph |
Unique |
1 |
5 |
6 |
Common |
2 |
27 |
29 |
|
Kaas core |
Unique |
0 |
2 |
2 |
Common |
0 |
2 |
2 |
|
StackLight |
Unique |
0 |
12 |
12 |
Common |
0 |
15 |
15 |
Mirantis Security Portal
For the detailed list of fixed and existing CVEs across the Mirantis Container Cloud and MOSK products, refer to Mirantis Security Portal.
MOSK CVEs
For the number of fixed CVEs in the MOSK-related components including OpenStack and Tungsten Fabric, refer to MOSK 24.3.6 security notes.
This section lists known issues with workarounds for the Mirantis Container Cloud release 2.29.4 including the Cluster releases 17.3.9, 16.3.9, and 16.4.4. For the known issues in the related MOSK release, see Known issues.
For other issues that can occur while deploying and operating a Container Cloud cluster, see Troubleshooting Guide.
Note
This section also outlines still valid known issues from previous Container Cloud releases.
Due to the MetalLB upstream issue, a load balancer service may not obtain the external IP address.
The issue occurs when two services share the same external IP address and have
the same externalTrafficPolicy value. Initially, the services have the
external IP address assigned and are accessible. After modifying the
externalTrafficPolicy value for both services from Cluster to
Local, the first service that has been changed remains with no external IP
address assigned. Though, the second service, which was changed later, has the
external IP assigned as expected.
To work around the issue, make a dummy change to the service object where
external IP is <pending>:
Identify the service that is stuck:
kubectl get svc -A | grep pending
Example of system response:
stacklight iam-proxy-prometheus LoadBalancer 10.233.28.196 <pending> 443:30430/TCP
Add an arbitrary label to the service that is stuck. For example:
kubectl label svc -n stacklight iam-proxy-prometheus reconcile=1
Example of system response:
service/iam-proxy-prometheus labeledVerify that the external IP was allocated to the service:
kubectl get svc -n stacklight iam-proxy-prometheus
Example of system response:
NAME TYPE CLUSTER-IP EXTERNAL-IP PORT(S) AGE iam-proxy-prometheus LoadBalancer 10.233.28.196 10.0.34.108 443:30430/TCP 12d
During deletion of a manager machine running the ironic Pod from a bare
metal management cluster, the following problems occur:
All Pods are stuck in the
TerminatingstateA new
ironicPod fails to startThe related bare metal host is stuck in the
deprovisioningstate
As a workaround, before deletion of the node running the ironic Pod,
cordon and drain the node using the kubectl cordon <nodeName> and
kubectl drain <nodeName> commands.
Fixed in 2.30.0 (21.0.0 and 20.0.0)
During managed cluster update, if some node is being disabled and at the same
time ceph-maintenance-controller is restarted, a second
miracephnodedisable object is erroneously created for the node. As a
result, the second object fails in the Cleaning state, which blocks
managed cluster update.
Workaround
On the affected managed cluster, obtain the list of
miracephnodedisableobjects:kubectl get miracephnodedisable -n ceph-lcm-mirantis
The system response must contain one completed and one failed
miracephnodedisableobject for the node being disabled. For example:NAME AGE NODE NAME STATE LAST CHECK ISSUE nodedisable-353ccad2-8f19-4c11-95c9-a783abb531ba 58m kaas-node-91207a35-3200-41d1-9ba9-388500970981 Ready 2025-03-06T22:04:48Z nodedisable-58bbf563-1c76-4319-8c28-363d73a5efef 57m kaas-node-91207a35-3200-41d1-9ba9-388500970981 Cleaning 2025-03-07T11:59:27Z host clean up Job 'ceph-lcm-mirantis/host-cleanup-nodedisable-58bbf563-1c76-4319-8c28-363d73a5efef' is failed, check logs
Remove the failed
miracephnodedisableobject. For example:kubectl delete miracephnodedisable -n ceph-lcm-mirantis nodedisable-58bbf563-1c76-4319-8c28-363d73a5efef
Note
The issue does not reproduce since MOSK 25.2.
Update of a managed cluster based on bare metal and Ceph enabled fails with
PersistentVolumeClaim getting stuck in the Pending state for the
prometheus-server StatefulSet and the
MountVolume.MountDevice failed for volume warning in the StackLight event
logs.
Workaround:
Verify that the description of the Pods that failed to run contain the
FailedMountevents:kubectl -n <affectedProjectName> describe pod <affectedPodName>
In the command above, replace the following values:
<affectedProjectName>is the Container Cloud project name where the Pods failed to run<affectedPodName>is a Pod name that failed to run in the specified project
In the Pod description, identify the node name where the Pod failed to run.
Verify that the
csi-rbdpluginlogs of the affected node contain therbd volume mount failed: <csi-vol-uuid> is being usederror. The<csi-vol-uuid>is a unique RBD volume name.Identify
csiPodNameof the correspondingcsi-rbdplugin:kubectl -n rook-ceph get pod -l app=csi-rbdplugin \ -o jsonpath='{.items[?(@.spec.nodeName == "<nodeName>")].metadata.name}'
Output the affected
csiPodNamelogs:kubectl -n rook-ceph logs <csiPodName> -c csi-rbdplugin
Scale down the affected
StatefulSetorDeploymentof the Pod that fails to0replicas.On every
csi-rbdpluginPod, search for stuckcsi-vol:for pod in `kubectl -n rook-ceph get pods|grep rbdplugin|grep -v provisioner|awk '{print $1}'`; do echo $pod kubectl exec -it -n rook-ceph $pod -c csi-rbdplugin -- rbd device list | grep <csi-vol-uuid> done
Unmap the affected
csi-vol:rbd unmap -o force /dev/rbd<i>
The
/dev/rbd<i>value is a mapped RBD volume that usescsi-vol.Delete
volumeattachmentof the affected Pod:kubectl get volumeattachments | grep <csi-vol-uuid> kubectl delete volumeattacmhent <id>
Scale up the affected
StatefulSetorDeploymentback to the original number of replicas and wait until its state becomesRunning.
Fixed in 2.30.0 (21.0.0 and 20.0.0)
After machine disablement and consequent re-enablement, persistent volumes
(PVs) provisioned by local-volume-provisioner may cause the
local-volume-provisioner pod on such machine to switch to the
CrashLoopBackOff state.
This occurs because re-enabling the machine results in a new node UID being
assigned in Kubernetes. As a result, the owner ID of the volumes provisioned by
local-volume-provisioner no longer matches the new node UID. Although the
volumes remain in the correct system paths, local-volume-provisioner
detects a mismatch in ownership, leading to an unhealthy service state.
Workaround:
Identify the ID of the affected
local-volume-provisioner:kubectl -n kube-system get pods
Example of system response extract:
local-volume-provisioner-h5lrc 0/1 CrashLoopBackOff 33 (2m3s ago) 90m
In the
local-volume-provisionerlogs, identify the affected PVs. For example:kubectl logs -n kube-system local-volume-provisioner-h5lrc | less
Example of system response extract:
E0304 23:21:31.455148 1 discovery.go:221] Failed to discover local volumes: 5 error(s) while discovering volumes: [error creating PV "local-pv-1d04ed53" for volume at "/mnt/local-volumes/openstack-operator/bind-mounts/vol04": persistentvolumes "local-pv-1d04ed53" already exists error creating PV "local-pv-ce2dfc24" for volume at "/mnt/local-volumes/openstack-operator/bind-mounts/vol01": persistentvolumes "local-pv-ce2dfc24" already exists error creating PV "local-pv-bcb9e4bd" for volume at "/mnt/local-volumes/openstack-operator/bind-mounts/vol02": persistentvolumes "local-pv-bcb9e4bd" already exists error creating PV "local-pv-c5924ada" for volume at "/mnt/local-volumes/openstack-operator/bind-mounts/vol03": persistentvolumes "local-pv-c5924ada" already exists error creating PV "local-pv-7c7150cf" for volume at "/mnt/local-volumes/openstack-operator/bind-mounts/vol00": persistentvolumes "local-pv-7c7150cf" already exists]
Update the
pv.kubernetes.io/provisioned-byannotation for all PVs that are mentioned in thealready existserrors on the enabled node. The annotation must have thelocal-volume-provisioner-<K8S-NODE-NAME>-<K8S-NODE-UID>format.To obtain the node UID:
kubectl get node <K8S-NODE-NAME> -o jsonpath='{.metadata.uid}'
To edit annotations on the volumes:
kubectl edit pv <PV-NAME>
For example:
kubectl edit pv local-pv-ce2dfc24
During MariaDB operations on a management cluster, Pods may get stuck in continuous restarts with the following example error:
[ERROR] WSREP: Corrupt buffer header: \
addr: 0x7faec6f8e518, \
seqno: 3185219421952815104, \
size: 909455917, \
ctx: 0x557094f65038, \
flags: 11577. store: 49, \
type: 49
Workaround:
Create a backup of the
/var/lib/mysqldirectory on themariadb-serverPod.Verify that other replicas are up and ready.
Remove the
galera.cachefile for the affectedmariadb-serverPod.Remove the affected
mariadb-serverPod or wait until it is automatically restarted.
After Kubernetes restarts the Pod, the Pod clones the database in 1-2 minutes and restores the quorum.
Custom Grafana panels and dashboards may be corrupted after automatic migration of deprecated Angular-based plugins to the React-based ones. For details, see MOSK Deprecation Notes: Angular plugins in Grafana dashboards and the post-update step Back up custom Grafana dashboards in Container Cloud 2.28.4 update notes.
To work around the issue, manually adjust the affected dashboards to restore their custom appearance.
Fixed in 2.30.0 (21.0.0 and 20.0.0)
A compact MOSK cluster fails to be deployed through the Container Cloud web UI
due to inability to add any label to the control plane machines along with
inability to change dedicatedControlPlane: false using the web UI.
To work around the issue, manually add the required labels using CLI. Once done, the cluster deployment resumes.
A newly created project does not display all available tabs in the Container
Cloud web UI and contains different access denied errors during first five
minutes after creation.
To work around the issue, refresh the browser in five minutes after the project creation.
This section lists the artifacts of components included in the Container Cloud patch release 2.29.4. For artifacts of the Cluster releases introduced in 2.29.4, see patch Cluster releases 17.3.9, 16.3.9, and 16.4.4.
Note
The components that are newly added, updated, deprecated, or removed
as compared to the previous release version, are marked
with a corresponding superscript,
for example, lcm-ansible Updated.
Artifact |
Component |
Path |
|---|---|---|
Binaries |
ironic-python-agent.initramfs Updated |
https://binary.mirantis.com/bm/bin/ironic/ipa/ubuntu/initramfs-caracal-jammy-debug-20250526112742 |
ironic-python-agent.kernel Updated |
https://binary.mirantis.com/bm/bin/ironic/ipa/ubuntu/kernel-caracal-jammy-debug-20250526112742 |
|
provisioning_ansible |
https://binary.mirantis.com/bm/bin/ansible/provisioning_ansible-0.1.1-167-e7a55fd.tgz |
|
Helm charts Updated |
baremetal-api |
https://binary.mirantis.com/core/helm/baremetal-api-1.42.19.tgz |
baremetal-operator |
https://binary.mirantis.com/core/helm/baremetal-operator-1.42.19.tgz |
|
baremetal-provider |
https://binary.mirantis.com/core/helm/baremetal-provider-1.42.19.tgz |
|
baremetal-public-api |
https://binary.mirantis.com/core/helm/baremetal-public-api-1.42.19.tgz |
|
kaas-ipam |
||
Docker images |
ambassador Updated |
mirantis.azurecr.io/core/external/nginx:1.42.19 |
baremetal-dnsmasq Updated |
mirantis.azurecr.io/bm/baremetal-dnsmasq:base-2-29-alpine-20250520130542 |
|
baremetal-operator |
mirantis.azurecr.io/bm/baremetal-operator:base-2-29-alpine-20250422081418 |
|
bm-collective |
mirantis.azurecr.io/bm/bm-collective:base-2-29-alpine-20250303153858 |
|
cluster-api-provider-baremetal Updated |
mirantis.azurecr.io/core/cluster-api-provider-baremetal:1.42.19 |
|
ironic |
mirantis.azurecr.io/openstack/ironic:caracal-jammy-20250217105151 |
|
ironic-inspector |
mirantis.azurecr.io/openstack/ironic-inspector:caracal-jammy-20250217105151 |
|
ironic-prometheus-exporter |
mirantis.azurecr.io/stacklight/ironic-prometheus-exporter:0.1-20240913123302 |
|
kaas-ipam Updated |
mirantis.azurecr.io/core/kaas-ipam:1.42.19 |
|
kubernetes-entrypoint |
mirantis.azurecr.io/openstack/extra/kubernetes-entrypoint:v1.0.1-202a68c-20250203183923 |
|
mariadb |
mirantis.azurecr.io/general/mariadb:10.6.20-jammy-20241104184039 |
|
syslog-ng |
mirantis.azurecr.io/bm/syslog-ng:base-alpine-20250217103755 |
Artifact |
Component |
Path |
|---|---|---|
Bootstrap tarball Updated |
bootstrap-darwin |
https://binary.mirantis.com/core/bin/bootstrap-darwin-1.42.19.tgz |
bootstrap-linux |
https://binary.mirantis.com/core/bin/bootstrap-linux-1.42.19.tgz |
|
Helm charts |
admission-controller Updated |
https://binary.mirantis.com/core/helm/admission-controller-1.42.19.tgz |
agent-controller Updated |
https://binary.mirantis.com/core/helm/agent-controller-1.42.19.tgz |
|
ceph-kcc-controller Updated |
https://binary.mirantis.com/core/helm/ceph-kcc-controller-1.42.19.tgz |
|
cert-manager Updated |
https://binary.mirantis.com/core/helm/cert-manager-1.42.19.tgz |
|
configuration-collector Updated |
https://binary.mirantis.com/core/helm/configuration-collector-1.42.19.tgz |
|
credentials-controller Deprecated |
https://binary.mirantis.com/core/helm/credentials-controller-1.42.19.tgz |
|
event-controller Updated |
https://binary.mirantis.com/core/helm/event-controller-1.42.19.tgz |
|
host-os-modules-controller Updated |
https://binary.mirantis.com/core/helm/host-os-modules-controller-1.42.19.tgz |
|
iam-controller Updated |
https://binary.mirantis.com/core/helm/iam-controller-1.42.19.tgz |
|
kaas-exporter Updated |
https://binary.mirantis.com/core/helm/kaas-exporter-1.42.19.tgz |
|
kaas-public-api Updated |
https://binary.mirantis.com/core/helm/kaas-public-api-1.42.19.tgz |
|
kaas-ui Updated |
||
lcm-controller Updated |
https://binary.mirantis.com/core/helm/lcm-controller-1.42.19.tgz |
|
license-controller Updated |
https://binary.mirantis.com/core/helm/license-controller-1.42.19.tgz |
|
machinepool-controller Updated |
https://binary.mirantis.com/core/helm/machinepool-controller-1.42.19.tgz |
|
mcc-cache Updated |
||
mcc-cache-warmup Updated |
https://binary.mirantis.com/core/helm/mcc-cache-warmup-1.42.19.tgz |
|
openstack-provider Deprecated |
https://binary.mirantis.com/core/helm/openstack-provider-1.42.19.tgz |
|
portforward-controller Updated |
https://binary.mirantis.com/core/helm/portforward-controller-1.42.19.tgz |
|
rbac-controller Updated |
https://binary.mirantis.com/core/helm/rbac-controller-1.42.19.tgz |
|
release-controller Updated |
https://binary.mirantis.com/core/helm/release-controller-1.42.19.tgz |
|
scope-controller Updated |
https://binary.mirantis.com/core/helm/scope-controller-1.42.19.tgz |
|
secret-controller Updated |
https://binary.mirantis.com/core/helm/secret-controller-1.42.19.tgz |
|
user-controller Updated |
https://binary.mirantis.com/core/helm/user-controller-1.42.19.tgz |
|
Docker images |
admission-controller Updated |
mirantis.azurecr.io/core/admission-controller:1.42.19 |
agent-controller Updated |
mirantis.azurecr.io/core/agent-controller:1.42.19 |
|
ceph-kcc-controller Updated |
mirantis.azurecr.io/core/ceph-kcc-controller:1.42.19 |
|
cert-manager-controller |
mirantis.azurecr.io/core/external/cert-manager-controller:v1.11.0-13 |
|
configuration-collector Updated |
mirantis.azurecr.io/core/configuration-collector:1.42.19 |
|
credentials-controller Deprecated |
mirantis.azurecr.io/core/credentials-controller:1.42.19 |
|
event-controller Updated |
mirantis.azurecr.io/core/event-controller:1.42.19 |
|
frontend Updated |
mirantis.azurecr.io/core/frontend:1.42.19 |
|
host-os-modules-controller Updated |
mirantis.azurecr.io/core/host-os-modules-controller:1.42.19 |
|
iam-controller Updated |
mirantis.azurecr.io/core/iam-controller:1.42.19 |
|
kaas-exporter Updated |
mirantis.azurecr.io/core/kaas-exporter:1.42.19 |
|
kproxy Updated |
mirantis.azurecr.io/core/kproxy:1.42.19 |
|
lcm-controller Updated |
mirantis.azurecr.io/core/lcm-controller:1.42.19 |
|
license-controller Updated |
mirantis.azurecr.io/core/license-controller:1.42.19 |
|
machinepool-controller Updated |
mirantis.azurecr.io/core/machinepool-controller:1.42.19 |
|
mcc-cache-warmup Updated |
mirantis.azurecr.io/core/mcc-cache-warmup:1.42.19 |
|
nginx Updated |
mirantis.azurecr.io/core/external/nginx:1.42.19 |
|
openstack-cluster-api-controller Deprecated |
mirantis.azurecr.io/core/openstack-cluster-api-controller:1.42.19 |
|
portforward-controller Updated |
mirantis.azurecr.io/core/portforward-controller:1.42.19 |
|
rbac-controller Updated |
mirantis.azurecr.io/core/rbac-controller:1.42.19 |
|
registry |
mirantis.azurecr.io/lcm/registry:v2.8.1-15 |
|
release-controller Updated |
mirantis.azurecr.io/core/release-controller:1.42.19 |
|
scope-controller Updated |
mirantis.azurecr.io/core/scope-controller:1.42.19 |
|
secret-controller Updated |
mirantis.azurecr.io/core/secret-controller:1.42.19 |
|
user-controller Updated |
mirantis.azurecr.io/core/user-controller:1.42.19 |
Artifact |
Component |
Path |
|---|---|---|
Binaries |
hash-generate-darwin |
http://binary.mirantis.com/iam/bin/hash-generate-0.0.1-268-3cf7f17-darwin |
hash-generate-linux |
http://binary.mirantis.com/iam/bin/hash-generate-0.0.1-268-3cf7f17-linux |
|
Helm charts Updated |
iam |
|
Docker images |
kubectl |
mirantis.azurecr.io/general/kubectl:20250307094924 |
kubernetes-entrypoint |
mirantis.azurecr.io/openstack/extra/kubernetes-entrypoint:v1.0.1-d06c869-20250204085201 |
|
mariadb |
mirantis.azurecr.io/general/mariadb:10.6.20-jammy-20250218081722 |
|
mcc-keycloak |
mirantis.azurecr.io/iam/mcc-keycloak:25.0.6-20250304083438 |
2.29.3
The Container Cloud patch release 2.29.3, which is based on the 2.29.0 major release, provides the following updates:
Support for the patch Cluster release 17.3.8 that represents MOSK patch release 24.3.5 patch
Support for Mirantis Kubernetes Engine to 3.7.22
Support for
docker-ee-cli23.0.18 on MOSK clusters (MCR 23.0.15) and 25.0.10 on management clusters (MCR 25.0.8)Mandatory migration of container runtime from Docker to containerd
Security fixes for CVEs in images
This patch release also supports the latest major Cluster releases 17.4.0 and 16.4.0. And it does not support greenfield deployments based on deprecated Cluster releases. Use the latest available Cluster releases instead.
For main deliverables of the parent Container Cloud release of 2.29.0, refer to 2.29.0.
This section describes the specific actions you as a cloud operator need to complete before or after your Container Cloud cluster update to the Cluster releases 17.3.8, 16.3.8, or 16.4.3.
Consider the information below as a supplement to the generic update procedures published in the Operations Guide: Update to a major version or Update to a patch version.
Due to the known issue 50561, after machine
disablement and consequent re-enablement, persistent volumes provisioned by
local-volume-provisioner that are not currently in use by any pod may
cause the local-volume-provisioner pod on such machine to switch to the
CrashLoopBackOff state.
To ensure that local-volume-provisioner does not block cluster update and
is healthy, either verify the cluster status in the Container Cloud web UI or
run the following command:
kubectl -n kube-system get pods
Example of system response extract with healthy local-volume-provisioner:
local-volume-provisioner-dg98z 1/1 Running 0 66d
Example of system response extract with unhealthy local-volume-provisioner:
local-volume-provisioner-h5lrc 0/1 CrashLoopBackOff 33 (2m3s ago) 90m
If local-volume-provisioner is unhealthy, proceed with the workaround
provided in the 50561 issue description.
Migration of container runtime from Docker to containerd, which is implemented for existing management and managed clusters, becomes mandatory in the scope of Container Cloud 2.29.x. Otherwise, the management cluster update to Container Cloud 2.30.0 will be blocked.
The use of containerd allows for better Kubernetes performance and component update without pod restart when applying fixes for CVEs. For the migration procedure, refer to Operations Guide: Migrate container runtime from Docker to containerd.
Important
Container runtime migration involves machine cordoning and draining.
In total, since Container Cloud 2.29.2, 12 Common Vulnerabilities and Exposures (CVE) have been fixed in 2.29.3: 2 of critical and 10 of high severity.
The table below includes the total numbers of addressed unique and common CVEs in images by product component. The common CVEs are issues addressed across several images.
Product component |
CVE type |
Critical |
High |
Total |
|---|---|---|---|---|
Ceph |
Unique |
1 |
1 |
2 |
Common |
2 |
1 |
3 |
|
Kaas core |
Unique |
0 |
3 |
3 |
Common |
0 |
5 |
5 |
|
StackLight |
Unique |
0 |
1 |
1 |
Common |
0 |
4 |
4 |
Mirantis Security Portal
For the detailed list of fixed and existing CVEs across the Mirantis Container Cloud and MOSK products, refer to Mirantis Security Portal.
MOSK CVEs
For the number of fixed CVEs in the MOSK-related components including OpenStack and Tungsten Fabric, refer to MOSK 24.3.5 security notes.
This section lists known issues with workarounds for the Mirantis Container Cloud release 2.29.3 including the Cluster releases 17.3.8, 16.3.8, and 16.4.3. For the known issues in the related MOSK release, see Known issues.
For other issues that can occur while deploying and operating a Container Cloud cluster, see Troubleshooting Guide.
Note
This section also outlines still valid known issues from previous Container Cloud releases.
Due to the MetalLB upstream issue, a load balancer service may not obtain the external IP address.
The issue occurs when two services share the same external IP address and have
the same externalTrafficPolicy value. Initially, the services have the
external IP address assigned and are accessible. After modifying the
externalTrafficPolicy value for both services from Cluster to
Local, the first service that has been changed remains with no external IP
address assigned. Though, the second service, which was changed later, has the
external IP assigned as expected.
To work around the issue, make a dummy change to the service object where
external IP is <pending>:
Identify the service that is stuck:
kubectl get svc -A | grep pending
Example of system response:
stacklight iam-proxy-prometheus LoadBalancer 10.233.28.196 <pending> 443:30430/TCP
Add an arbitrary label to the service that is stuck. For example:
kubectl label svc -n stacklight iam-proxy-prometheus reconcile=1
Example of system response:
service/iam-proxy-prometheus labeledVerify that the external IP was allocated to the service:
kubectl get svc -n stacklight iam-proxy-prometheus
Example of system response:
NAME TYPE CLUSTER-IP EXTERNAL-IP PORT(S) AGE iam-proxy-prometheus LoadBalancer 10.233.28.196 10.0.34.108 443:30430/TCP 12d
During deletion of a manager machine running the ironic Pod from a bare
metal management cluster, the following problems occur:
All Pods are stuck in the
TerminatingstateA new
ironicPod fails to startThe related bare metal host is stuck in the
deprovisioningstate
As a workaround, before deletion of the node running the ironic Pod,
cordon and drain the node using the kubectl cordon <nodeName> and
kubectl drain <nodeName> commands.
Fixed in 2.30.0 (21.0.0 and 20.0.0)
During managed cluster update, if some node is being disabled and at the same
time ceph-maintenance-controller is restarted, a second
miracephnodedisable object is erroneously created for the node. As a
result, the second object fails in the Cleaning state, which blocks
managed cluster update.
Workaround
On the affected managed cluster, obtain the list of
miracephnodedisableobjects:kubectl get miracephnodedisable -n ceph-lcm-mirantis
The system response must contain one completed and one failed
miracephnodedisableobject for the node being disabled. For example:NAME AGE NODE NAME STATE LAST CHECK ISSUE nodedisable-353ccad2-8f19-4c11-95c9-a783abb531ba 58m kaas-node-91207a35-3200-41d1-9ba9-388500970981 Ready 2025-03-06T22:04:48Z nodedisable-58bbf563-1c76-4319-8c28-363d73a5efef 57m kaas-node-91207a35-3200-41d1-9ba9-388500970981 Cleaning 2025-03-07T11:59:27Z host clean up Job 'ceph-lcm-mirantis/host-cleanup-nodedisable-58bbf563-1c76-4319-8c28-363d73a5efef' is failed, check logs
Remove the failed
miracephnodedisableobject. For example:kubectl delete miracephnodedisable -n ceph-lcm-mirantis nodedisable-58bbf563-1c76-4319-8c28-363d73a5efef
Note
The issue does not reproduce since MOSK 25.2.
Update of a managed cluster based on bare metal and Ceph enabled fails with
PersistentVolumeClaim getting stuck in the Pending state for the
prometheus-server StatefulSet and the
MountVolume.MountDevice failed for volume warning in the StackLight event
logs.
Workaround:
Verify that the description of the Pods that failed to run contain the
FailedMountevents:kubectl -n <affectedProjectName> describe pod <affectedPodName>
In the command above, replace the following values:
<affectedProjectName>is the Container Cloud project name where the Pods failed to run<affectedPodName>is a Pod name that failed to run in the specified project
In the Pod description, identify the node name where the Pod failed to run.
Verify that the
csi-rbdpluginlogs of the affected node contain therbd volume mount failed: <csi-vol-uuid> is being usederror. The<csi-vol-uuid>is a unique RBD volume name.Identify
csiPodNameof the correspondingcsi-rbdplugin:kubectl -n rook-ceph get pod -l app=csi-rbdplugin \ -o jsonpath='{.items[?(@.spec.nodeName == "<nodeName>")].metadata.name}'
Output the affected
csiPodNamelogs:kubectl -n rook-ceph logs <csiPodName> -c csi-rbdplugin
Scale down the affected
StatefulSetorDeploymentof the Pod that fails to0replicas.On every
csi-rbdpluginPod, search for stuckcsi-vol:for pod in `kubectl -n rook-ceph get pods|grep rbdplugin|grep -v provisioner|awk '{print $1}'`; do echo $pod kubectl exec -it -n rook-ceph $pod -c csi-rbdplugin -- rbd device list | grep <csi-vol-uuid> done
Unmap the affected
csi-vol:rbd unmap -o force /dev/rbd<i>
The
/dev/rbd<i>value is a mapped RBD volume that usescsi-vol.Delete
volumeattachmentof the affected Pod:kubectl get volumeattachments | grep <csi-vol-uuid> kubectl delete volumeattacmhent <id>
Scale up the affected
StatefulSetorDeploymentback to the original number of replicas and wait until its state becomesRunning.
Fixed in 2.30.0 (21.0.0 and 20.0.0)
After machine disablement and consequent re-enablement, persistent volumes
(PVs) provisioned by local-volume-provisioner may cause the
local-volume-provisioner pod on such machine to switch to the
CrashLoopBackOff state.
This occurs because re-enabling the machine results in a new node UID being
assigned in Kubernetes. As a result, the owner ID of the volumes provisioned by
local-volume-provisioner no longer matches the new node UID. Although the
volumes remain in the correct system paths, local-volume-provisioner
detects a mismatch in ownership, leading to an unhealthy service state.
Workaround:
Identify the ID of the affected
local-volume-provisioner:kubectl -n kube-system get pods
Example of system response extract:
local-volume-provisioner-h5lrc 0/1 CrashLoopBackOff 33 (2m3s ago) 90m
In the
local-volume-provisionerlogs, identify the affected PVs. For example:kubectl logs -n kube-system local-volume-provisioner-h5lrc | less
Example of system response extract:
E0304 23:21:31.455148 1 discovery.go:221] Failed to discover local volumes: 5 error(s) while discovering volumes: [error creating PV "local-pv-1d04ed53" for volume at "/mnt/local-volumes/openstack-operator/bind-mounts/vol04": persistentvolumes "local-pv-1d04ed53" already exists error creating PV "local-pv-ce2dfc24" for volume at "/mnt/local-volumes/openstack-operator/bind-mounts/vol01": persistentvolumes "local-pv-ce2dfc24" already exists error creating PV "local-pv-bcb9e4bd" for volume at "/mnt/local-volumes/openstack-operator/bind-mounts/vol02": persistentvolumes "local-pv-bcb9e4bd" already exists error creating PV "local-pv-c5924ada" for volume at "/mnt/local-volumes/openstack-operator/bind-mounts/vol03": persistentvolumes "local-pv-c5924ada" already exists error creating PV "local-pv-7c7150cf" for volume at "/mnt/local-volumes/openstack-operator/bind-mounts/vol00": persistentvolumes "local-pv-7c7150cf" already exists]
Update the
pv.kubernetes.io/provisioned-byannotation for all PVs that are mentioned in thealready existserrors on the enabled node. The annotation must have thelocal-volume-provisioner-<K8S-NODE-NAME>-<K8S-NODE-UID>format.To obtain the node UID:
kubectl get node <K8S-NODE-NAME> -o jsonpath='{.metadata.uid}'
To edit annotations on the volumes:
kubectl edit pv <PV-NAME>
For example:
kubectl edit pv local-pv-ce2dfc24
During MariaDB operations on a management cluster, Pods may get stuck in continuous restarts with the following example error:
[ERROR] WSREP: Corrupt buffer header: \
addr: 0x7faec6f8e518, \
seqno: 3185219421952815104, \
size: 909455917, \
ctx: 0x557094f65038, \
flags: 11577. store: 49, \
type: 49
Workaround:
Create a backup of the
/var/lib/mysqldirectory on themariadb-serverPod.Verify that other replicas are up and ready.
Remove the
galera.cachefile for the affectedmariadb-serverPod.Remove the affected
mariadb-serverPod or wait until it is automatically restarted.
After Kubernetes restarts the Pod, the Pod clones the database in 1-2 minutes and restores the quorum.
Custom Grafana panels and dashboards may be corrupted after automatic migration of deprecated Angular-based plugins to the React-based ones. For details, see MOSK Deprecation Notes: Angular plugins in Grafana dashboards and the post-update step Back up custom Grafana dashboards in Container Cloud 2.28.4 update notes.
To work around the issue, manually adjust the affected dashboards to restore their custom appearance.
Fixed in 2.30.0 (21.0.0 and 20.0.0)
A compact MOSK cluster fails to be deployed through the Container Cloud web UI
due to inability to add any label to the control plane machines along with
inability to change dedicatedControlPlane: false using the web UI.
To work around the issue, manually add the required labels using CLI. Once done, the cluster deployment resumes.
A newly created project does not display all available tabs in the Container
Cloud web UI and contains different access denied errors during first five
minutes after creation.
To work around the issue, refresh the browser in five minutes after the project creation.
The following issues have been addressed in the Mirantis Container Cloud release 2.29.3 along with the Cluster releases 17.3.8, 16.3.8, and 16.4.3, where applicable. For the list of MOSK addressed issues, if any, see Release notes 24.3.5.
[50566] [Ceph] Addressed the issue that caused Ceph upgrade to run very slow during patch or major cluster update due to the upstream Ceph issue 66717.
[51339] [cluster update] Addressed the issue that caused cluster update to be blocked if at least one node of any cluster was not rebooted while applying the update.
This section lists the artifacts of components included in the Container Cloud patch release 2.29.3. For artifacts of the Cluster releases introduced in 2.29.3, see patch Cluster releases 17.3.8, 16.3.8, and 16.4.3.
Note
The components that are newly added, updated, deprecated, or removed
as compared to the previous release version, are marked
with a corresponding superscript,
for example, lcm-ansible Updated.
Artifact |
Component |
Path |
|---|---|---|
Binaries |
ironic-python-agent.initramfs |
https://binary.mirantis.com/bm/bin/ironic/ipa/ubuntu/initramfs-caracal-jammy-debug-20250331145024 |
ironic-python-agent.kernel |
https://binary.mirantis.com/bm/bin/ironic/ipa/ubuntu/kernel-caracal-jammy-debug-20250331145024 |
|
provisioning_ansible |
https://binary.mirantis.com/bm/bin/ansible/provisioning_ansible-0.1.1-167-e7a55fd.tgz |
|
Helm charts Updated |
baremetal-api |
https://binary.mirantis.com/core/helm/baremetal-api-1.42.18.tgz |
baremetal-operator |
https://binary.mirantis.com/core/helm/baremetal-operator-1.42.18.tgz |
|
baremetal-provider |
https://binary.mirantis.com/core/helm/baremetal-provider-1.42.18.tgz |
|
baremetal-public-api |
https://binary.mirantis.com/core/helm/baremetal-public-api-1.42.18.tgz |
|
kaas-ipam |
||
Docker images |
ambassador Updated |
mirantis.azurecr.io/core/external/nginx:1.42.18 |
baremetal-dnsmasq |
mirantis.azurecr.io/bm/baremetal-dnsmasq:base-2-29-alpine-20250407132604 |
|
baremetal-operator Updated |
mirantis.azurecr.io/bm/baremetal-operator:base-2-29-alpine-20250422081418 |
|
bm-collective |
mirantis.azurecr.io/bm/bm-collective:base-2-29-alpine-20250303153858 |
|
cluster-api-provider-baremetal Updated |
mirantis.azurecr.io/core/cluster-api-provider-baremetal:1.42.18 |
|
ironic |
mirantis.azurecr.io/openstack/ironic:caracal-jammy-20250217105151 |
|
ironic-inspector |
mirantis.azurecr.io/openstack/ironic-inspector:caracal-jammy-20250217105151 |
|
ironic-prometheus-exporter |
mirantis.azurecr.io/stacklight/ironic-prometheus-exporter:0.1-20240913123302 |
|
kaas-ipam Updated |
mirantis.azurecr.io/core/kaas-ipam:1.42.18 |
|
kubernetes-entrypoint |
mirantis.azurecr.io/openstack/extra/kubernetes-entrypoint:v1.0.1-202a68c-20250203183923 |
|
mariadb |
mirantis.azurecr.io/general/mariadb:10.6.20-jammy-20241104184039 |
|
syslog-ng |
mirantis.azurecr.io/bm/syslog-ng:base-alpine-20250217103755 |
Artifact |
Component |
Path |
|---|---|---|
Bootstrap tarball Updated |
bootstrap-darwin |
https://binary.mirantis.com/core/bin/bootstrap-darwin-1.42.18.tgz |
bootstrap-linux |
https://binary.mirantis.com/core/bin/bootstrap-linux-1.42.18.tgz |
|
Helm charts Updated |
admission-controller |
https://binary.mirantis.com/core/helm/admission-controller-1.42.18.tgz |
agent-controller |
https://binary.mirantis.com/core/helm/agent-controller-1.42.18.tgz |
|
ceph-kcc-controller |
https://binary.mirantis.com/core/helm/ceph-kcc-controller-1.42.18.tgz |
|
cert-manager |
https://binary.mirantis.com/core/helm/cert-manager-1.42.18.tgz |
|
configuration-collector |
https://binary.mirantis.com/core/helm/configuration-collector-1.42.18.tgz |
|
credentials-controller Deprecated |
https://binary.mirantis.com/core/helm/credentials-controller-1.42.18.tgz |
|
event-controller |
https://binary.mirantis.com/core/helm/event-controller-1.42.18.tgz |
|
host-os-modules-controller |
https://binary.mirantis.com/core/helm/host-os-modules-controller-1.42.18.tgz |
|
iam-controller |
https://binary.mirantis.com/core/helm/iam-controller-1.42.18.tgz |
|
kaas-exporter |
https://binary.mirantis.com/core/helm/kaas-exporter-1.42.18.tgz |
|
kaas-public-api |
https://binary.mirantis.com/core/helm/kaas-public-api-1.42.18.tgz |
|
kaas-ui |
||
lcm-controller |
https://binary.mirantis.com/core/helm/lcm-controller-1.42.18.tgz |
|
license-controller |
https://binary.mirantis.com/core/helm/license-controller-1.42.18.tgz |
|
machinepool-controller |
https://binary.mirantis.com/core/helm/machinepool-controller-1.42.18.tgz |
|
mcc-cache |
||
mcc-cache-warmup |
https://binary.mirantis.com/core/helm/mcc-cache-warmup-1.42.18.tgz |
|
openstack-provider Deprecated |
https://binary.mirantis.com/core/helm/openstack-provider-1.42.18.tgz |
|
portforward-controller |
https://binary.mirantis.com/core/helm/portforward-controller-1.42.18.tgz |
|
rbac-controller |
https://binary.mirantis.com/core/helm/rbac-controller-1.42.18.tgz |
|
release-controller |
https://binary.mirantis.com/core/helm/release-controller-1.42.18.tgz |
|
scope-controller |
https://binary.mirantis.com/core/helm/scope-controller-1.42.18.tgz |
|
secret-controller |
https://binary.mirantis.com/core/helm/secret-controller-1.42.18.tgz |
|
user-controller |
https://binary.mirantis.com/core/helm/user-controller-1.42.18.tgz |
|
Docker images |
admission-controller Updated |
mirantis.azurecr.io/core/admission-controller:1.42.18 |
agent-controller Updated |
mirantis.azurecr.io/core/agent-controller:1.42.18 |
|
ceph-kcc-controller Updated |
mirantis.azurecr.io/core/ceph-kcc-controller:1.42.18 |
|
cert-manager-controller |
mirantis.azurecr.io/core/external/cert-manager-controller:v1.11.0-13 |
|
configuration-collector Updated |
mirantis.azurecr.io/core/configuration-collector:1.42.18 |
|
credentials-controller Deprecated |
mirantis.azurecr.io/core/credentials-controller:1.42.18 |
|
event-controller Updated |
mirantis.azurecr.io/core/event-controller:1.42.18 |
|
frontend Updated |
mirantis.azurecr.io/core/frontend:1.42.18 |
|
host-os-modules-controller Updated |
mirantis.azurecr.io/core/host-os-modules-controller:1.42.18 |
|
iam-controller Updated |
mirantis.azurecr.io/core/iam-controller:1.42.18 |
|
kaas-exporter Updated |
mirantis.azurecr.io/core/kaas-exporter:1.42.18 |
|
kproxy Updated |
mirantis.azurecr.io/core/kproxy:1.42.18 |
|
lcm-controller Updated |
mirantis.azurecr.io/core/lcm-controller:1.42.18 |
|
license-controller Updated |
mirantis.azurecr.io/core/license-controller:1.42.18 |
|
machinepool-controller Updated |
mirantis.azurecr.io/core/machinepool-controller:1.42.18 |
|
mcc-cache-warmup Updated |
mirantis.azurecr.io/core/mcc-cache-warmup:1.42.18 |
|
nginx Updated |
mirantis.azurecr.io/core/external/nginx:1.42.18 |
|
openstack-cluster-api-controller Deprecated |
mirantis.azurecr.io/core/openstack-cluster-api-controller:1.42.18 |
|
portforward-controller Updated |
mirantis.azurecr.io/core/portforward-controller:1.42.18 |
|
rbac-controller Updated |
mirantis.azurecr.io/core/rbac-controller:1.42.18 |
|
registry |
mirantis.azurecr.io/lcm/registry:v2.8.1-15 |
|
release-controller Updated |
mirantis.azurecr.io/core/release-controller:1.42.18 |
|
scope-controller Updated |
mirantis.azurecr.io/core/scope-controller:1.42.18 |
|
secret-controller Updated |
mirantis.azurecr.io/core/secret-controller:1.42.18 |
|
user-controller Updated |
mirantis.azurecr.io/core/user-controller:1.42.18 |
Artifact |
Component |
Path |
|---|---|---|
Binaries |
hash-generate-darwin |
http://binary.mirantis.com/iam/bin/hash-generate-0.0.1-268-3cf7f17-darwin |
hash-generate-linux |
http://binary.mirantis.com/iam/bin/hash-generate-0.0.1-268-3cf7f17-linux |
|
Helm charts Updated |
iam |
|
Docker images |
kubectl |
mirantis.azurecr.io/general/kubectl:20250307094924 |
kubernetes-entrypoint |
mirantis.azurecr.io/openstack/extra/kubernetes-entrypoint:v1.0.1-d06c869-20250204085201 |
|
mariadb |
mirantis.azurecr.io/general/mariadb:10.6.20-jammy-20250218081722 |
|
mcc-keycloak |
mirantis.azurecr.io/iam/mcc-keycloak:25.0.6-20250304083438 |
2.29.2
The Container Cloud patch release 2.29.2, which is based on the 2.29.0 major release, provides the following updates:
Support for the patch Cluster release 17.3.7 that represents MOSK patch release 24.3.4 patch
Support for Mirantis Kubernetes Engine to 3.7.20
Support for
docker-ee-cli23.0.17 on MOSK clusters (MCR 23.0.15) and 25.0.9m1 on management clusters (MCR 25.0.8)Mandatory migration of container runtime from Docker to containerd
Bare metal: update of Ubuntu mirror from ubuntu-2025-03-05-003900 to ubuntu-2025-03-31-003900 along with update of minor kernel version from 5.15.0-134-generic to 5.15.0-135-generic
Ubuntu base image: support for utils that extend NVMe provisioning options
Security fixes for CVEs in images
This patch release also supports the latest major Cluster releases 17.4.0 and 16.4.0. And it does not support greenfield deployments based on deprecated Cluster releases. Use the latest available Cluster releases instead.
For main deliverables of the parent Container Cloud release of 2.29.0, refer to 2.29.0.
This section describes the specific actions you as a cloud operator need to complete before or after your Container Cloud cluster update to the Cluster releases 17.3.7, 16.3.7, or 16.4.2.
Consider the information below as a supplement to the generic update procedures published in the Operations Guide: Update to a major version or Update to a patch version.
Due to the known issue 50561, after machine
disablement and consequent re-enablement, persistent volumes provisioned by
local-volume-provisioner that are not currently in use by any pod may
cause the local-volume-provisioner pod on such machine to switch to the
CrashLoopBackOff state.
To ensure that local-volume-provisioner does not block cluster update and
is healthy, either verify the cluster status in the Container Cloud web UI or
run the following command:
kubectl -n kube-system get pods
Example of system response extract with healthy local-volume-provisioner:
local-volume-provisioner-dg98z 1/1 Running 0 66d
Example of system response extract with unhealthy local-volume-provisioner:
local-volume-provisioner-h5lrc 0/1 CrashLoopBackOff 33 (2m3s ago) 90m
If local-volume-provisioner is unhealthy, proceed with the workaround
provided in the 50561 issue description.
Migration of container runtime from Docker to containerd, which is implemented for existing management and managed clusters, becomes mandatory in the scope of Container Cloud 2.29.x. Otherwise, the management cluster update to Container Cloud 2.30.0 will be blocked.
The use of containerd allows for better Kubernetes performance and component update without pod restart when applying fixes for CVEs. For the migration procedure, refer to Operations Guide: Migrate container runtime from Docker to containerd.
Important
Container runtime migration involves machine cordoning and draining.
In total, since Container Cloud 2.29.1, 103 Common Vulnerabilities and Exposures (CVE) have been fixed in 2.29.2: 5 of critical and 98 of high severity.
The table below includes the total numbers of addressed unique and common CVEs in images by product component. The common CVEs are issues addressed across several images.
Product component |
CVE type |
Critical |
High |
Total |
|---|---|---|---|---|
Ceph |
Unique |
0 |
3 |
3 |
Common |
0 |
13 |
13 |
|
KaaS core |
Unique |
2 |
14 |
16 |
Common |
2 |
66 |
68 |
|
StackLight |
Unique |
2 |
6 |
8 |
Common |
3 |
19 |
22 |
Mirantis Security Portal
For the detailed list of fixed and existing CVEs across the Mirantis Container Cloud and MOSK products, refer to Mirantis Security Portal.
MOSK CVEs
For the number of fixed CVEs in the MOSK-related components including OpenStack and Tungsten Fabric, refer to MOSK 24.3.4 security notes.
This section lists known issues with workarounds for the Mirantis Container Cloud release 2.29.2 including the Cluster releases 17.3.7, 16.3.7, and 16.4.2. For the known issues in the related MOSK release, see Known issues.
For other issues that can occur while deploying and operating a Container Cloud cluster, see Troubleshooting Guide.
Note
This section also outlines still valid known issues from previous Container Cloud releases.
Due to the MetalLB upstream issue, a load balancer service may not obtain the external IP address.
The issue occurs when two services share the same external IP address and have
the same externalTrafficPolicy value. Initially, the services have the
external IP address assigned and are accessible. After modifying the
externalTrafficPolicy value for both services from Cluster to
Local, the first service that has been changed remains with no external IP
address assigned. Though, the second service, which was changed later, has the
external IP assigned as expected.
To work around the issue, make a dummy change to the service object where
external IP is <pending>:
Identify the service that is stuck:
kubectl get svc -A | grep pending
Example of system response:
stacklight iam-proxy-prometheus LoadBalancer 10.233.28.196 <pending> 443:30430/TCP
Add an arbitrary label to the service that is stuck. For example:
kubectl label svc -n stacklight iam-proxy-prometheus reconcile=1
Example of system response:
service/iam-proxy-prometheus labeledVerify that the external IP was allocated to the service:
kubectl get svc -n stacklight iam-proxy-prometheus
Example of system response:
NAME TYPE CLUSTER-IP EXTERNAL-IP PORT(S) AGE iam-proxy-prometheus LoadBalancer 10.233.28.196 10.0.34.108 443:30430/TCP 12d
During deletion of a manager machine running the ironic Pod from a bare
metal management cluster, the following problems occur:
All Pods are stuck in the
TerminatingstateA new
ironicPod fails to startThe related bare metal host is stuck in the
deprovisioningstate
As a workaround, before deletion of the node running the ironic Pod,
cordon and drain the node using the kubectl cordon <nodeName> and
kubectl drain <nodeName> commands.
Fixed in 2.30.0 (21.0.0 and 20.0.0)
During managed cluster update, if some node is being disabled and at the same
time ceph-maintenance-controller is restarted, a second
miracephnodedisable object is erroneously created for the node. As a
result, the second object fails in the Cleaning state, which blocks
managed cluster update.
Workaround
On the affected managed cluster, obtain the list of
miracephnodedisableobjects:kubectl get miracephnodedisable -n ceph-lcm-mirantis
The system response must contain one completed and one failed
miracephnodedisableobject for the node being disabled. For example:NAME AGE NODE NAME STATE LAST CHECK ISSUE nodedisable-353ccad2-8f19-4c11-95c9-a783abb531ba 58m kaas-node-91207a35-3200-41d1-9ba9-388500970981 Ready 2025-03-06T22:04:48Z nodedisable-58bbf563-1c76-4319-8c28-363d73a5efef 57m kaas-node-91207a35-3200-41d1-9ba9-388500970981 Cleaning 2025-03-07T11:59:27Z host clean up Job 'ceph-lcm-mirantis/host-cleanup-nodedisable-58bbf563-1c76-4319-8c28-363d73a5efef' is failed, check logs
Remove the failed
miracephnodedisableobject. For example:kubectl delete miracephnodedisable -n ceph-lcm-mirantis nodedisable-58bbf563-1c76-4319-8c28-363d73a5efef
Fixed in 2.29.3 (17.3.8, 16.3.8, and 16.4.3)
Due to the upstream Ceph issue
66717,
during CVE upgrade of the Ceph daemon image of Ceph Reef 18.2.4, OSDs may start
slow and even fail the starting probe with the following describe output in
the rook-ceph-osd-X pod:
Warning Unhealthy 57s (x16 over 3m27s) kubelet Startup probe failed:
ceph daemon health check failed with the following output:
> no valid command found; 10 closest matches:
> 0
> 1
> 2
> abort
> assert
> bluefs debug_inject_read_zeros
> bluefs files list
> bluefs stats
> bluestore bluefs device info [<alloc_size:int>]
> config diff
> admin_socket: invalid command
Workaround:
Complete the following steps during every patch or major cluster update of the Cluster releases 17.2.x, 17.3.x, and 17.4.x (until Ceph 18.2.5 becomes supported):
Plan extra time in the maintenance window for the patch cluster update.
Slow starts will still impact the update procedure, but after completing the following step, the recovery process noticeably shortens without affecting the overall cluster state and data responsiveness.
Select one of the following options:
Before the cluster update, set the
nooutflag:ceph osd set noout
Once the Ceph OSDs image upgrade is done, unset the flag:
ceph osd unset noout
Monitor the Ceph OSDs image upgrade. If the symptoms of slow start appear, set the
nooutflag as soon as possible. Once the Ceph OSDs image upgrade is done, unset the flag.
Note
The issue does not reproduce since MOSK 25.2.
Update of a managed cluster based on bare metal and Ceph enabled fails with
PersistentVolumeClaim getting stuck in the Pending state for the
prometheus-server StatefulSet and the
MountVolume.MountDevice failed for volume warning in the StackLight event
logs.
Workaround:
Verify that the description of the Pods that failed to run contain the
FailedMountevents:kubectl -n <affectedProjectName> describe pod <affectedPodName>
In the command above, replace the following values:
<affectedProjectName>is the Container Cloud project name where the Pods failed to run<affectedPodName>is a Pod name that failed to run in the specified project
In the Pod description, identify the node name where the Pod failed to run.
Verify that the
csi-rbdpluginlogs of the affected node contain therbd volume mount failed: <csi-vol-uuid> is being usederror. The<csi-vol-uuid>is a unique RBD volume name.Identify
csiPodNameof the correspondingcsi-rbdplugin:kubectl -n rook-ceph get pod -l app=csi-rbdplugin \ -o jsonpath='{.items[?(@.spec.nodeName == "<nodeName>")].metadata.name}'
Output the affected
csiPodNamelogs:kubectl -n rook-ceph logs <csiPodName> -c csi-rbdplugin
Scale down the affected
StatefulSetorDeploymentof the Pod that fails to0replicas.On every
csi-rbdpluginPod, search for stuckcsi-vol:for pod in `kubectl -n rook-ceph get pods|grep rbdplugin|grep -v provisioner|awk '{print $1}'`; do echo $pod kubectl exec -it -n rook-ceph $pod -c csi-rbdplugin -- rbd device list | grep <csi-vol-uuid> done
Unmap the affected
csi-vol:rbd unmap -o force /dev/rbd<i>
The
/dev/rbd<i>value is a mapped RBD volume that usescsi-vol.Delete
volumeattachmentof the affected Pod:kubectl get volumeattachments | grep <csi-vol-uuid> kubectl delete volumeattacmhent <id>
Scale up the affected
StatefulSetorDeploymentback to the original number of replicas and wait until its state becomesRunning.
Fixed in 2.30.0 (21.0.0 and 20.0.0)
After machine disablement and consequent re-enablement, persistent volumes
(PVs) provisioned by local-volume-provisioner may cause the
local-volume-provisioner pod on such machine to switch to the
CrashLoopBackOff state.
This occurs because re-enabling the machine results in a new node UID being
assigned in Kubernetes. As a result, the owner ID of the volumes provisioned by
local-volume-provisioner no longer matches the new node UID. Although the
volumes remain in the correct system paths, local-volume-provisioner
detects a mismatch in ownership, leading to an unhealthy service state.
Workaround:
Identify the ID of the affected
local-volume-provisioner:kubectl -n kube-system get pods
Example of system response extract:
local-volume-provisioner-h5lrc 0/1 CrashLoopBackOff 33 (2m3s ago) 90m
In the
local-volume-provisionerlogs, identify the affected PVs. For example:kubectl logs -n kube-system local-volume-provisioner-h5lrc | less
Example of system response extract:
E0304 23:21:31.455148 1 discovery.go:221] Failed to discover local volumes: 5 error(s) while discovering volumes: [error creating PV "local-pv-1d04ed53" for volume at "/mnt/local-volumes/openstack-operator/bind-mounts/vol04": persistentvolumes "local-pv-1d04ed53" already exists error creating PV "local-pv-ce2dfc24" for volume at "/mnt/local-volumes/openstack-operator/bind-mounts/vol01": persistentvolumes "local-pv-ce2dfc24" already exists error creating PV "local-pv-bcb9e4bd" for volume at "/mnt/local-volumes/openstack-operator/bind-mounts/vol02": persistentvolumes "local-pv-bcb9e4bd" already exists error creating PV "local-pv-c5924ada" for volume at "/mnt/local-volumes/openstack-operator/bind-mounts/vol03": persistentvolumes "local-pv-c5924ada" already exists error creating PV "local-pv-7c7150cf" for volume at "/mnt/local-volumes/openstack-operator/bind-mounts/vol00": persistentvolumes "local-pv-7c7150cf" already exists]
Update the
pv.kubernetes.io/provisioned-byannotation for all PVs that are mentioned in thealready existserrors on the enabled node. The annotation must have thelocal-volume-provisioner-<K8S-NODE-NAME>-<K8S-NODE-UID>format.To obtain the node UID:
kubectl get node <K8S-NODE-NAME> -o jsonpath='{.metadata.uid}'
To edit annotations on the volumes:
kubectl edit pv <PV-NAME>
For example:
kubectl edit pv local-pv-ce2dfc24
During MariaDB operations on a management cluster, Pods may get stuck in continuous restarts with the following example error:
[ERROR] WSREP: Corrupt buffer header: \
addr: 0x7faec6f8e518, \
seqno: 3185219421952815104, \
size: 909455917, \
ctx: 0x557094f65038, \
flags: 11577. store: 49, \
type: 49
Workaround:
Create a backup of the
/var/lib/mysqldirectory on themariadb-serverPod.Verify that other replicas are up and ready.
Remove the
galera.cachefile for the affectedmariadb-serverPod.Remove the affected
mariadb-serverPod or wait until it is automatically restarted.
After Kubernetes restarts the Pod, the Pod clones the database in 1-2 minutes and restores the quorum.
Custom Grafana panels and dashboards may be corrupted after automatic migration of deprecated Angular-based plugins to the React-based ones. For details, see MOSK Deprecation Notes: Angular plugins in Grafana dashboards and the post-update step Back up custom Grafana dashboards in Container Cloud 2.28.4 update notes.
To work around the issue, manually adjust the affected dashboards to restore their custom appearance.
Fixed in 2.29.3 (17.3.8, 16.3.8, and 16.4.3)
Cluster upgrade from Container Cloud 2.29.1 to 2.29.2 is blocked if at least one node of any cluster is not rebooted while applying upgrade. As a workaround, reboot all cluster nodes.
Fixed in 2.30.0 (21.0.0 and 20.0.0)
A compact MOSK cluster fails to be deployed through the Container Cloud web UI
due to inability to add any label to the control plane machines along with
inability to change dedicatedControlPlane: false using the web UI.
To work around the issue, manually add the required labels using CLI. Once done, the cluster deployment resumes.
A newly created project does not display all available tabs in the Container
Cloud web UI and contains different access denied errors during first five
minutes after creation.
To work around the issue, refresh the browser in five minutes after the project creation.
The following issues have been addressed in the Mirantis Container Cloud release 2.29.2 along with the Cluster releases 17.3.7, 16.3.7, and 16.4.2, where applicable. For the list of MOSK addressed issues, if any, see Release notes 24.3.4.
[51145] [StackLight] Addressed the issue that caused the
PrometheusTargetScrapesDuplicatealert to permanently fire on a management cluster that hassf-notifierenabled.[50636] [LCM] Addressed the issue that caused the
nfs-commonpackage to be deleted during MOSK cluster update. This package is no longer automatically removed from cluster nodes if a MOSK cluster is deployed with the MariaDB backup hosted on an external NFS backend.
This section lists the artifacts of components included in the Container Cloud patch release 2.29.2. For artifacts of the Cluster releases introduced in 2.29.2, see patch Cluster releases 17.3.7, 16.3.7, and 16.4.2.
Note
The components that are newly added, updated, deprecated, or removed
as compared to the previous release version, are marked
with a corresponding superscript,
for example, lcm-ansible Updated.
Artifact |
Component |
Path |
|---|---|---|
Binaries |
ironic-python-agent.initramfs Updated |
https://binary.mirantis.com/bm/bin/ironic/ipa/ubuntu/initramfs-caracal-jammy-debug-20250331145024 |
ironic-python-agent.kernel Updated |
https://binary.mirantis.com/bm/bin/ironic/ipa/ubuntu/kernel-caracal-jammy-debug-20250331145024 |
|
provisioning_ansible |
https://binary.mirantis.com/bm/bin/ansible/provisioning_ansible-0.1.1-167-e7a55fd.tgz |
|
Helm charts Updated |
baremetal-api |
https://binary.mirantis.com/core/helm/baremetal-api-1.42.16.tgz |
baremetal-operator |
https://binary.mirantis.com/core/helm/baremetal-operator-1.42.16.tgz |
|
baremetal-provider |
https://binary.mirantis.com/core/helm/baremetal-provider-1.42.16.tgz |
|
baremetal-public-api |
https://binary.mirantis.com/core/helm/baremetal-public-api-1.42.16.tgz |
|
kaas-ipam |
||
Docker images |
ambassador Updated |
mirantis.azurecr.io/core/external/nginx:1.42.16 |
baremetal-dnsmasq Updated |
mirantis.azurecr.io/bm/baremetal-dnsmasq:base-2-29-alpine-20250407132604 |
|
baremetal-operator Updated |
mirantis.azurecr.io/bm/baremetal-operator:base-2-29-alpine-20250407132309 |
|
bm-collective |
mirantis.azurecr.io/bm/bm-collective:base-2-29-alpine-20250303153858 |
|
cluster-api-provider-baremetal Updated |
mirantis.azurecr.io/core/cluster-api-provider-baremetal:1.42.16 |
|
ironic |
mirantis.azurecr.io/openstack/ironic:caracal-jammy-20250217105151 |
|
ironic-inspector |
mirantis.azurecr.io/openstack/ironic-inspector:caracal-jammy-20250217105151 |
|
ironic-prometheus-exporter |
mirantis.azurecr.io/stacklight/ironic-prometheus-exporter:0.1-20240913123302 |
|
kaas-ipam Updated |
mirantis.azurecr.io/core/kaas-ipam:1.42.16 |
|
kubernetes-entrypoint |
mirantis.azurecr.io/openstack/extra/kubernetes-entrypoint:v1.0.1-202a68c-20250203183923 |
|
mariadb |
mirantis.azurecr.io/general/mariadb:10.6.20-jammy-20241104184039 |
|
syslog-ng |
mirantis.azurecr.io/bm/syslog-ng:base-alpine-20250217103755 |
Artifact |
Component |
Path |
|---|---|---|
Bootstrap tarball Updated |
bootstrap-darwin |
https://binary.mirantis.com/core/bin/bootstrap-darwin-1.42.16.tgz |
bootstrap-linux |
https://binary.mirantis.com/core/bin/bootstrap-linux-1.42.16.tgz |
|
Helm charts Updated |
admission-controller |
https://binary.mirantis.com/core/helm/admission-controller-1.42.16.tgz |
agent-controller |
https://binary.mirantis.com/core/helm/agent-controller-1.42.16.tgz |
|
ceph-kcc-controller |
https://binary.mirantis.com/core/helm/ceph-kcc-controller-1.42.16.tgz |
|
cert-manager |
https://binary.mirantis.com/core/helm/cert-manager-1.42.16.tgz |
|
configuration-collector |
https://binary.mirantis.com/core/helm/configuration-collector-1.42.16.tgz |
|
credentials-controller Deprecated |
https://binary.mirantis.com/core/helm/credentials-controller-1.42.16.tgz |
|
event-controller |
https://binary.mirantis.com/core/helm/event-controller-1.42.16.tgz |
|
host-os-modules-controller |
https://binary.mirantis.com/core/helm/host-os-modules-controller-1.42.16.tgz |
|
iam-controller |
https://binary.mirantis.com/core/helm/iam-controller-1.42.16.tgz |
|
kaas-exporter |
https://binary.mirantis.com/core/helm/kaas-exporter-1.42.16.tgz |
|
kaas-public-api |
https://binary.mirantis.com/core/helm/kaas-public-api-1.42.16.tgz |
|
kaas-ui |
||
lcm-controller |
https://binary.mirantis.com/core/helm/lcm-controller-1.42.16.tgz |
|
license-controller |
https://binary.mirantis.com/core/helm/license-controller-1.42.16.tgz |
|
machinepool-controller |
https://binary.mirantis.com/core/helm/machinepool-controller-1.42.16.tgz |
|
mcc-cache |
||
mcc-cache-warmup |
https://binary.mirantis.com/core/helm/mcc-cache-warmup-1.42.16.tgz |
|
openstack-provider Deprecated |
https://binary.mirantis.com/core/helm/openstack-provider-1.42.16.tgz |
|
portforward-controller |
https://binary.mirantis.com/core/helm/portforward-controller-1.42.16.tgz |
|
rbac-controller |
https://binary.mirantis.com/core/helm/rbac-controller-1.42.16.tgz |
|
release-controller |
https://binary.mirantis.com/core/helm/release-controller-1.42.16.tgz |
|
scope-controller |
https://binary.mirantis.com/core/helm/scope-controller-1.42.16.tgz |
|
secret-controller |
https://binary.mirantis.com/core/helm/secret-controller-1.42.16.tgz |
|
user-controller |
https://binary.mirantis.com/core/helm/user-controller-1.42.16.tgz |
|
Docker images |
admission-controller Updated |
mirantis.azurecr.io/core/admission-controller:1.42.16 |
agent-controller Updated |
mirantis.azurecr.io/core/agent-controller:1.42.16 |
|
ceph-kcc-controller Updated |
mirantis.azurecr.io/core/ceph-kcc-controller:1.42.16 |
|
cert-manager-controller Updated |
mirantis.azurecr.io/core/external/cert-manager-controller:v1.11.0-13 |
|
configuration-collector Updated |
mirantis.azurecr.io/core/configuration-collector:1.42.16 |
|
credentials-controller Deprecated |
mirantis.azurecr.io/core/credentials-controller:1.42.16 |
|
event-controller Updated |
mirantis.azurecr.io/core/event-controller:1.42.16 |
|
frontend Updated |
mirantis.azurecr.io/core/frontend:1.42.16 |
|
host-os-modules-controller Updated |
mirantis.azurecr.io/core/host-os-modules-controller:1.42.16 |
|
iam-controller Updated |
mirantis.azurecr.io/core/iam-controller:1.42.16 |
|
kaas-exporter Updated |
mirantis.azurecr.io/core/kaas-exporter:1.42.16 |
|
kproxy Updated |
mirantis.azurecr.io/core/kproxy:1.42.16 |
|
lcm-controller Updated |
mirantis.azurecr.io/core/lcm-controller:1.42.16 |
|
license-controller Updated |
mirantis.azurecr.io/core/license-controller:1.42.16 |
|
machinepool-controller Updated |
mirantis.azurecr.io/core/machinepool-controller:1.42.16 |
|
mcc-cache-warmup Updated |
mirantis.azurecr.io/core/mcc-cache-warmup:1.42.16 |
|
nginx Updated |
mirantis.azurecr.io/core/external/nginx:1.42.16 |
|
openstack-cluster-api-controller Deprecated |
mirantis.azurecr.io/core/openstack-cluster-api-controller:1.42.16 |
|
portforward-controller Updated |
mirantis.azurecr.io/core/portforward-controller:1.42.16 |
|
rbac-controller Updated |
mirantis.azurecr.io/core/rbac-controller:1.42.16 |
|
registry |
mirantis.azurecr.io/lcm/registry:v2.8.1-15 |
|
release-controller Updated |
mirantis.azurecr.io/core/release-controller:1.42.16 |
|
scope-controller Updated |
mirantis.azurecr.io/core/scope-controller:1.42.16 |
|
secret-controller Updated |
mirantis.azurecr.io/core/secret-controller:1.42.16 |
|
user-controller Updated |
mirantis.azurecr.io/core/user-controller:1.42.16 |
Artifact |
Component |
Path |
|---|---|---|
Binaries |
hash-generate-darwin |
http://binary.mirantis.com/iam/bin/hash-generate-0.0.1-268-3cf7f17-darwin |
hash-generate-linux |
http://binary.mirantis.com/iam/bin/hash-generate-0.0.1-268-3cf7f17-linux |
|
Helm charts Updated |
iam |
|
Docker images |
kubectl |
mirantis.azurecr.io/general/kubectl:20250307094924 |
kubernetes-entrypoint |
mirantis.azurecr.io/openstack/extra/kubernetes-entrypoint:v1.0.1-d06c869-20250204085201 |
|
mariadb |
mirantis.azurecr.io/general/mariadb:10.6.20-jammy-20250218081722 |
|
mcc-keycloak |
mirantis.azurecr.io/iam/mcc-keycloak:25.0.6-20250304083438 |
2.29.1
The Container Cloud patch release 2.29.1, which is based on the 2.29.0 major release, provides the following updates:
Support for the patch Cluster release 17.3.6 that represents MOSK patch release 24.3.3 patch
Support for Mirantis Kubernetes Engine to 3.7.20
Support for
docker-ee-cli23.0.17 on MOSK clusters (MCR 23.0.15) and 25.0.9m1 on management clusters (MCR 25.0.8)Mandatory migration of container runtime from Docker to containerd
Bare metal: update of Ubuntu mirror to ubuntu-2025-03-05-003900 along with update of minor kernel version to 5.15.0-134-generic
Security fixes for CVEs in images
This patch release also supports the latest major Cluster releases 17.4.0 and 16.4.0. And it does not support greenfield deployments based on deprecated Cluster releases. Use the latest available Cluster releases instead.
For main deliverables of the parent Container Cloud release of 2.29.0, refer to 2.29.0.
This section describes the specific actions you as a cloud operator need to complete before or after your Container Cloud cluster update to the Cluster releases 17.3.6, 16.3.6, or 16.4.1.
Consider the information below as a supplement to the generic update procedures published in the Operations Guide: Update to a major version or Update to a patch version.
Management cluster update to Container Cloud 2.29.1 will be blocked if at least one node of any related managed cluster is running Ubuntu 20.04, which reaches end-of-life in April 2025. Moreover, in Container Cloud 2.29.0, the Cluster release update of the Ubuntu 20.04-based managed clusters became impossible, and Ubuntu 22.04 became the only supported version of the operating system.
Therefore, ensure that every node of all your managed clusters are running Ubuntu 22.04 to unblock management cluster update in Container Cloud 2.29.1 and managed cluster update in Container Cloud 2.29.0.
For the update procedure, refer to Upgrade an operating system distribution.
Note
Existing management clusters were automatically updated to Ubuntu 22.04 during cluster upgrade to the Cluster release 16.2.0 in Container Cloud 2.27.0. Greenfield deployments of management clusters are also based on Ubuntu 22.04.
Due to the known issue 50561, after machine
disablement and consequent re-enablement, persistent volumes provisioned by
local-volume-provisioner that are not currently in use by any pod may
cause the local-volume-provisioner pod on such machine to switch to the
CrashLoopBackOff state.
To ensure that local-volume-provisioner does not block cluster update and
is healthy, either verify the cluster status in the Container Cloud web UI or
run the following command:
kubectl -n kube-system get pods
Example of system response extract with healthy local-volume-provisioner:
local-volume-provisioner-dg98z 1/1 Running 0 66d
Example of system response extract with unhealthy local-volume-provisioner:
local-volume-provisioner-h5lrc 0/1 CrashLoopBackOff 33 (2m3s ago) 90m
If local-volume-provisioner is unhealthy, proceed with the workaround
provided in the 50561 issue description.
Since Container Cloud 2.28.4, Mirantis introduced an optional migration of container runtime from Docker to containerd, which is implemented for existing management and managed bare metal clusters. This migration becomes mandatory in the scope of Container Cloud 2.29.x. Otherwise, the management cluster update to Container Cloud 2.30.0 will be blocked.
The use of containerd allows for better Kubernetes performance and component update without pod restart when applying fixes for CVEs. For the migration procedure, refer to Migrate container runtime from Docker to containerd.
Important
Container runtime migration involves machine cordoning and draining.
In total, since Container Cloud 2.29.0, 203 Common Vulnerabilities and Exposures (CVE) have been fixed in 2.29.1: 21 of critical and 182 of high severity.
The table below includes the total numbers of addressed unique and common CVEs in images by product component since Container Cloud 2.29.0. The common CVEs are issues addressed across several images.
Product component |
CVE type |
Critical |
High |
Total |
|---|---|---|---|---|
Ceph |
Unique |
1 |
10 |
11 |
Common |
2 |
58 |
60 |
|
Kaas core |
Unique |
7 |
27 |
34 |
Common |
13 |
78 |
91 |
|
StackLight |
Unique |
3 |
13 |
16 |
Common |
6 |
46 |
52 |
Mirantis Security Portal
For the detailed list of fixed and existing CVEs across the Mirantis Container Cloud and MOSK products, refer to Mirantis Security Portal.
MOSK CVEs
For the number of fixed CVEs in the MOSK-related components including OpenStack and Tungsten Fabric, refer to MOSK 24.3.3 security notes.
This section lists known issues with workarounds for the Mirantis Container Cloud release 2.29.1 including the Cluster releases 17.3.6, 16.3.6, and 16.4.1. For the known issues in the related MOSK release, see Known issues.
For other issues that can occur while deploying and operating a Container Cloud cluster, see Troubleshooting Guide.
Note
This section also outlines still valid known issues from previous Container Cloud releases.
Due to the MetalLB upstream issue, a load balancer service may not obtain the external IP address.
The issue occurs when two services share the same external IP address and have
the same externalTrafficPolicy value. Initially, the services have the
external IP address assigned and are accessible. After modifying the
externalTrafficPolicy value for both services from Cluster to
Local, the first service that has been changed remains with no external IP
address assigned. Though, the second service, which was changed later, has the
external IP assigned as expected.
To work around the issue, make a dummy change to the service object where
external IP is <pending>:
Identify the service that is stuck:
kubectl get svc -A | grep pending
Example of system response:
stacklight iam-proxy-prometheus LoadBalancer 10.233.28.196 <pending> 443:30430/TCP
Add an arbitrary label to the service that is stuck. For example:
kubectl label svc -n stacklight iam-proxy-prometheus reconcile=1
Example of system response:
service/iam-proxy-prometheus labeledVerify that the external IP was allocated to the service:
kubectl get svc -n stacklight iam-proxy-prometheus
Example of system response:
NAME TYPE CLUSTER-IP EXTERNAL-IP PORT(S) AGE iam-proxy-prometheus LoadBalancer 10.233.28.196 10.0.34.108 443:30430/TCP 12d
During deletion of a manager machine running the ironic Pod from a bare
metal management cluster, the following problems occur:
All Pods are stuck in the
TerminatingstateA new
ironicPod fails to startThe related bare metal host is stuck in the
deprovisioningstate
As a workaround, before deletion of the node running the ironic Pod,
cordon and drain the node using the kubectl cordon <nodeName> and
kubectl drain <nodeName> commands.
Fixed in 2.30.0 (21.0.0 and 20.0.0)
During managed cluster update, if some node is being disabled and at the same
time ceph-maintenance-controller is restarted, a second
miracephnodedisable object is erroneously created for the node. As a
result, the second object fails in the Cleaning state, which blocks
managed cluster update.
Workaround
On the affected managed cluster, obtain the list of
miracephnodedisableobjects:kubectl get miracephnodedisable -n ceph-lcm-mirantis
The system response must contain one completed and one failed
miracephnodedisableobject for the node being disabled. For example:NAME AGE NODE NAME STATE LAST CHECK ISSUE nodedisable-353ccad2-8f19-4c11-95c9-a783abb531ba 58m kaas-node-91207a35-3200-41d1-9ba9-388500970981 Ready 2025-03-06T22:04:48Z nodedisable-58bbf563-1c76-4319-8c28-363d73a5efef 57m kaas-node-91207a35-3200-41d1-9ba9-388500970981 Cleaning 2025-03-07T11:59:27Z host clean up Job 'ceph-lcm-mirantis/host-cleanup-nodedisable-58bbf563-1c76-4319-8c28-363d73a5efef' is failed, check logs
Remove the failed
miracephnodedisableobject. For example:kubectl delete miracephnodedisable -n ceph-lcm-mirantis nodedisable-58bbf563-1c76-4319-8c28-363d73a5efef
Fixed in 2.29.3 (17.3.8, 16.3.8, and 16.4.3)
Due to the upstream Ceph issue
66717,
during CVE upgrade of the Ceph daemon image of Ceph Reef 18.2.4, OSDs may start
slow and even fail the starting probe with the following describe output in
the rook-ceph-osd-X pod:
Warning Unhealthy 57s (x16 over 3m27s) kubelet Startup probe failed:
ceph daemon health check failed with the following output:
> no valid command found; 10 closest matches:
> 0
> 1
> 2
> abort
> assert
> bluefs debug_inject_read_zeros
> bluefs files list
> bluefs stats
> bluestore bluefs device info [<alloc_size:int>]
> config diff
> admin_socket: invalid command
Workaround:
Complete the following steps during every patch or major cluster update of the Cluster releases 17.2.x, 17.3.x, and 17.4.x (until Ceph 18.2.5 becomes supported):
Plan extra time in the maintenance window for the patch cluster update.
Slow starts will still impact the update procedure, but after completing the following step, the recovery process noticeably shortens without affecting the overall cluster state and data responsiveness.
Select one of the following options:
Before the cluster update, set the
nooutflag:ceph osd set noout
Once the Ceph OSDs image upgrade is done, unset the flag:
ceph osd unset noout
Monitor the Ceph OSDs image upgrade. If the symptoms of slow start appear, set the
nooutflag as soon as possible. Once the Ceph OSDs image upgrade is done, unset the flag.
Note
The issue does not reproduce since MOSK 25.2.
Update of a managed cluster based on bare metal and Ceph enabled fails with
PersistentVolumeClaim getting stuck in the Pending state for the
prometheus-server StatefulSet and the
MountVolume.MountDevice failed for volume warning in the StackLight event
logs.
Workaround:
Verify that the description of the Pods that failed to run contain the
FailedMountevents:kubectl -n <affectedProjectName> describe pod <affectedPodName>
In the command above, replace the following values:
<affectedProjectName>is the Container Cloud project name where the Pods failed to run<affectedPodName>is a Pod name that failed to run in the specified project
In the Pod description, identify the node name where the Pod failed to run.
Verify that the
csi-rbdpluginlogs of the affected node contain therbd volume mount failed: <csi-vol-uuid> is being usederror. The<csi-vol-uuid>is a unique RBD volume name.Identify
csiPodNameof the correspondingcsi-rbdplugin:kubectl -n rook-ceph get pod -l app=csi-rbdplugin \ -o jsonpath='{.items[?(@.spec.nodeName == "<nodeName>")].metadata.name}'
Output the affected
csiPodNamelogs:kubectl -n rook-ceph logs <csiPodName> -c csi-rbdplugin
Scale down the affected
StatefulSetorDeploymentof the Pod that fails to0replicas.On every
csi-rbdpluginPod, search for stuckcsi-vol:for pod in `kubectl -n rook-ceph get pods|grep rbdplugin|grep -v provisioner|awk '{print $1}'`; do echo $pod kubectl exec -it -n rook-ceph $pod -c csi-rbdplugin -- rbd device list | grep <csi-vol-uuid> done
Unmap the affected
csi-vol:rbd unmap -o force /dev/rbd<i>
The
/dev/rbd<i>value is a mapped RBD volume that usescsi-vol.Delete
volumeattachmentof the affected Pod:kubectl get volumeattachments | grep <csi-vol-uuid> kubectl delete volumeattacmhent <id>
Scale up the affected
StatefulSetorDeploymentback to the original number of replicas and wait until its state becomesRunning.
Fixed in 2.30.0 (21.0.0 and 20.0.0)
After machine disablement and consequent re-enablement, persistent volumes
(PVs) provisioned by local-volume-provisioner may cause the
local-volume-provisioner pod on such machine to switch to the
CrashLoopBackOff state.
This occurs because re-enabling the machine results in a new node UID being
assigned in Kubernetes. As a result, the owner ID of the volumes provisioned by
local-volume-provisioner no longer matches the new node UID. Although the
volumes remain in the correct system paths, local-volume-provisioner
detects a mismatch in ownership, leading to an unhealthy service state.
Workaround:
Identify the ID of the affected
local-volume-provisioner:kubectl -n kube-system get pods
Example of system response extract:
local-volume-provisioner-h5lrc 0/1 CrashLoopBackOff 33 (2m3s ago) 90m
In the
local-volume-provisionerlogs, identify the affected PVs. For example:kubectl logs -n kube-system local-volume-provisioner-h5lrc | less
Example of system response extract:
E0304 23:21:31.455148 1 discovery.go:221] Failed to discover local volumes: 5 error(s) while discovering volumes: [error creating PV "local-pv-1d04ed53" for volume at "/mnt/local-volumes/openstack-operator/bind-mounts/vol04": persistentvolumes "local-pv-1d04ed53" already exists error creating PV "local-pv-ce2dfc24" for volume at "/mnt/local-volumes/openstack-operator/bind-mounts/vol01": persistentvolumes "local-pv-ce2dfc24" already exists error creating PV "local-pv-bcb9e4bd" for volume at "/mnt/local-volumes/openstack-operator/bind-mounts/vol02": persistentvolumes "local-pv-bcb9e4bd" already exists error creating PV "local-pv-c5924ada" for volume at "/mnt/local-volumes/openstack-operator/bind-mounts/vol03": persistentvolumes "local-pv-c5924ada" already exists error creating PV "local-pv-7c7150cf" for volume at "/mnt/local-volumes/openstack-operator/bind-mounts/vol00": persistentvolumes "local-pv-7c7150cf" already exists]
Update the
pv.kubernetes.io/provisioned-byannotation for all PVs that are mentioned in thealready existserrors on the enabled node. The annotation must have thelocal-volume-provisioner-<K8S-NODE-NAME>-<K8S-NODE-UID>format.To obtain the node UID:
kubectl get node <K8S-NODE-NAME> -o jsonpath='{.metadata.uid}'
To edit annotations on the volumes:
kubectl edit pv <PV-NAME>
For example:
kubectl edit pv local-pv-ce2dfc24
During MariaDB operations on a management cluster, Pods may get stuck in continuous restarts with the following example error:
[ERROR] WSREP: Corrupt buffer header: \
addr: 0x7faec6f8e518, \
seqno: 3185219421952815104, \
size: 909455917, \
ctx: 0x557094f65038, \
flags: 11577. store: 49, \
type: 49
Workaround:
Create a backup of the
/var/lib/mysqldirectory on themariadb-serverPod.Verify that other replicas are up and ready.
Remove the
galera.cachefile for the affectedmariadb-serverPod.Remove the affected
mariadb-serverPod or wait until it is automatically restarted.
After Kubernetes restarts the Pod, the Pod clones the database in 1-2 minutes and restores the quorum.
Fixed in 2.29.2 (17.3.7, 16.3.7, and 16.4.2)
On management clusters with sf-notifier enabled, the
PrometheusTargetScrapesDuplicate alert is permanently firing while
sf-notifier runs with no errors.
You can safely disregard the issue because it does not affect cluster health.
Custom Grafana panels and dashboards may be corrupted after automatic migration of deprecated Angular-based plugins to the React-based ones. For details, see MOSK Deprecation Notes: Angular plugins in Grafana dashboards and the post-update step Back up custom Grafana dashboards in Container Cloud 2.28.4 update notes.
To work around the issue, manually adjust the affected dashboards to restore their custom appearance.
Fixed in 2.30.0 (21.0.0 and 20.0.0)
A compact MOSK cluster fails to be deployed through the Container Cloud web UI
due to inability to add any label to the control plane machines along with
inability to change dedicatedControlPlane: false using the web UI.
To work around the issue, manually add the required labels using CLI. Once done, the cluster deployment resumes.
A newly created project does not display all available tabs in the Container
Cloud web UI and contains different access denied errors during first five
minutes after creation.
To work around the issue, refresh the browser in five minutes after the project creation.
The following issues have been addressed in the Mirantis Container Cloud release 2.29.1 along with the Cluster releases 17.3.6, 16.3.6, and 16.4.1, where applicable. For the list of MOSK addressed issues, if any, see Release notes 24.3.3.
[50768] [LCM] Addressed the issue that prevented successful editing of the
MCCUpgradeobject, which contained the Internal error failed to call webhook: the server could not find the requested resource when trying to save changes in the object.[50622] [core] Addressed the issue that prevented any user except
m:kaas@management-adminto access or modifyBareMetalHostInventoryobjects.[50287] [bare metal] Addressed the issue that prevented a
BareMetalHostobject with a Redfish Baseboard Management Controller address to pass the registering phase.[50140] [Container Cloud web UI] Addressed the issue that prevented the Clusters page for the bare metal provider to display information about the Ceph cluster in the Ceph Clusters tab.
This section lists the artifacts of components included in the Container Cloud patch release 2.29.1. For artifacts of the Cluster releases introduced in 2.29.1, see patch Cluster releases 17.3.6, 16.3.6, and 16.4.1.
Note
The components that are newly added, updated, deprecated, or removed
as compared to the previous release version, are marked
with a corresponding superscript,
for example, lcm-ansible Updated.
Artifact |
Component |
Path |
|---|---|---|
Binaries |
ironic-python-agent.initramfs Updated |
https://binary.mirantis.com/bm/bin/ironic/ipa/ubuntu/initramfs-caracal-jammy-debug-20250305171003 |
ironic-python-agent.kernel Updated |
https://binary.mirantis.com/bm/bin/ironic/ipa/ubuntu/kernel-caracal-jammy-debug-20250305171003 |
|
provisioning_ansible |
https://binary.mirantis.com/bm/bin/ansible/provisioning_ansible-0.1.1-167-e7a55fd.tgz |
|
Helm charts Updated |
baremetal-api |
https://binary.mirantis.com/core/helm/baremetal-api-1.42.13.tgz |
baremetal-operator |
https://binary.mirantis.com/core/helm/baremetal-operator-1.42.13.tgz |
|
baremetal-provider |
https://binary.mirantis.com/core/helm/baremetal-provider-1.42.13.tgz |
|
baremetal-public-api |
https://binary.mirantis.com/core/helm/baremetal-public-api-1.42.13.tgz |
|
kaas-ipam |
||
Docker images |
ambassador Updated |
mirantis.azurecr.io/core/external/nginx:1.42.13 |
baremetal-dnsmasq Updated |
mirantis.azurecr.io/bm/baremetal-dnsmasq:base-2-29-alpine-20250319110626 |
|
baremetal-operator Updated |
mirantis.azurecr.io/bm/baremetal-operator:base-2-29-alpine-20250318131222 |
|
bm-collective Updated |
mirantis.azurecr.io/bm/bm-collective:base-2-29-alpine-20250303153858 |
|
cluster-api-provider-baremetal Updated |
mirantis.azurecr.io/core/cluster-api-provider-baremetal:1.42.13 |
|
ironic Updated |
mirantis.azurecr.io/openstack/ironic:caracal-jammy-20250217105151 |
|
ironic-inspector Updated |
mirantis.azurecr.io/openstack/ironic-inspector:caracal-jammy-20250217105151 |
|
ironic-prometheus-exporter |
mirantis.azurecr.io/stacklight/ironic-prometheus-exporter:0.1-20240913123302 |
|
kaas-ipam Updated |
mirantis.azurecr.io/core/kaas-ipam:1.42.13 |
|
kubernetes-entrypoint |
mirantis.azurecr.io/openstack/extra/kubernetes-entrypoint:v1.0.1-202a68c-20250203183923 |
|
mariadb |
mirantis.azurecr.io/general/mariadb:10.6.20-jammy-20241104184039 |
|
syslog-ng |
mirantis.azurecr.io/bm/syslog-ng:base-alpine-20250217103755 |
Artifact |
Component |
Path |
|---|---|---|
Bootstrap tarball Updated |
bootstrap-darwin |
https://binary.mirantis.com/core/bin/bootstrap-darwin-1.42.13.tgz |
bootstrap-linux |
https://binary.mirantis.com/core/bin/bootstrap-linux-1.42.13.tgz |
|
Helm charts Updated |
admission-controller |
https://binary.mirantis.com/core/helm/admission-controller-1.42.13.tgz |
agent-controller |
https://binary.mirantis.com/core/helm/agent-controller-1.42.13.tgz |
|
ceph-kcc-controller |
https://binary.mirantis.com/core/helm/ceph-kcc-controller-1.42.13.tgz |
|
cert-manager |
https://binary.mirantis.com/core/helm/cert-manager-1.42.13.tgz |
|
configuration-collector |
https://binary.mirantis.com/core/helm/configuration-collector-1.42.13.tgz |
|
credentials-controller Deprecated |
https://binary.mirantis.com/core/helm/credentials-controller-1.42.13.tgz |
|
event-controller |
https://binary.mirantis.com/core/helm/event-controller-1.42.13.tgz |
|
host-os-modules-controller |
https://binary.mirantis.com/core/helm/host-os-modules-controller-1.42.13.tgz |
|
iam-controller |
https://binary.mirantis.com/core/helm/iam-controller-1.42.13.tgz |
|
kaas-exporter |
https://binary.mirantis.com/core/helm/kaas-exporter-1.42.13.tgz |
|
kaas-public-api |
https://binary.mirantis.com/core/helm/kaas-public-api-1.42.13.tgz |
|
kaas-ui |
||
lcm-controller |
https://binary.mirantis.com/core/helm/lcm-controller-1.42.13.tgz |
|
license-controller |
https://binary.mirantis.com/core/helm/license-controller-1.42.13.tgz |
|
machinepool-controller |
https://binary.mirantis.com/core/helm/machinepool-controller-1.42.13.tgz |
|
mcc-cache |
||
mcc-cache-warmup |
https://binary.mirantis.com/core/helm/mcc-cache-warmup-1.42.13.tgz |
|
openstack-provider Deprecated |
https://binary.mirantis.com/core/helm/openstack-provider-1.42.13.tgz |
|
portforward-controller |
https://binary.mirantis.com/core/helm/portforward-controller-1.42.13.tgz |
|
rbac-controller |
https://binary.mirantis.com/core/helm/rbac-controller-1.42.13.tgz |
|
release-controller |
https://binary.mirantis.com/core/helm/release-controller-1.42.13.tgz |
|
scope-controller |
https://binary.mirantis.com/core/helm/scope-controller-1.42.13.tgz |
|
secret-controller |
https://binary.mirantis.com/core/helm/secret-controller-1.42.13.tgz |
|
user-controller |
https://binary.mirantis.com/core/helm/user-controller-1.42.13.tgz |
|
Docker images |
admission-controller Updated |
mirantis.azurecr.io/core/admission-controller:1.42.13 |
agent-controller Updated |
mirantis.azurecr.io/core/agent-controller:1.42.13 |
|
ceph-kcc-controller Updated |
mirantis.azurecr.io/core/ceph-kcc-controller:1.42.13 |
|
cert-manager-controller Updated |
mirantis.azurecr.io/core/external/cert-manager-controller:v1.11.0-12 |
|
configuration-collector Updated |
mirantis.azurecr.io/core/configuration-collector:1.42.13 |
|
credentials-controller Deprecated |
mirantis.azurecr.io/core/credentials-controller:1.42.13 |
|
event-controller Updated |
mirantis.azurecr.io/core/event-controller:1.42.13 |
|
frontend Updated |
mirantis.azurecr.io/core/frontend:1.42.13 |
|
host-os-modules-controller Updated |
mirantis.azurecr.io/core/host-os-modules-controller:1.42.13 |
|
iam-controller Updated |
mirantis.azurecr.io/core/iam-controller:1.42.13 |
|
kaas-exporter Updated |
mirantis.azurecr.io/core/kaas-exporter:1.42.13 |
|
kproxy Updated |
mirantis.azurecr.io/core/kproxy:1.42.13 |
|
lcm-controller Updated |
mirantis.azurecr.io/core/lcm-controller:1.42.13 |
|
license-controller Updated |
mirantis.azurecr.io/core/license-controller:1.42.13 |
|
machinepool-controller Updated |
mirantis.azurecr.io/core/machinepool-controller:1.42.13 |
|
mcc-cache-warmup |
mirantis.azurecr.io/core/mcc-cache-warmup:1.42.13 |
|
nginx Updated |
mirantis.azurecr.io/core/external/nginx:1.42.13 |
|
openstack-cluster-api-controller Deprecated |
mirantis.azurecr.io/core/openstack-cluster-api-controller:1.42.13 |
|
portforward-controller Updated |
mirantis.azurecr.io/core/portforward-controller:1.42.13 |
|
rbac-controller Updated |
mirantis.azurecr.io/core/rbac-controller:1.42.13 |
|
registry |
mirantis.azurecr.io/lcm/registry:v2.8.1-15 |
|
release-controller Updated |
mirantis.azurecr.io/core/release-controller:1.42.13 |
|
scope-controller Updated |
mirantis.azurecr.io/core/scope-controller:1.42.13 |
|
secret-controller Updated |
mirantis.azurecr.io/core/secret-controller:1.42.13 |
|
user-controller Updated |
mirantis.azurecr.io/core/user-controller:1.42.13 |
Artifact |
Component |
Path |
|---|---|---|
Binaries |
hash-generate-darwin |
http://binary.mirantis.com/iam/bin/hash-generate-0.0.1-268-3cf7f17-darwin |
hash-generate-linux |
http://binary.mirantis.com/iam/bin/hash-generate-0.0.1-268-3cf7f17-linux |
|
Helm charts Updated |
iam |
|
Docker images Updated |
kubectl |
mirantis.azurecr.io/general/kubectl:20250307094924 |
kubernetes-entrypoint |
mirantis.azurecr.io/openstack/extra/kubernetes-entrypoint:v1.0.1-d06c869-20250204085201 |
|
mariadb |
mirantis.azurecr.io/general/mariadb:10.6.20-jammy-20250218081722 |
|
mcc-keycloak |
mirantis.azurecr.io/iam/mcc-keycloak:25.0.6-20250304083438 |
2.29.0
The Mirantis Container Cloud major release 2.29.0:
Introduces support for the Cluster release 17.4.0 that is based on the Cluster release 16.4.0 and represents MOSK 25.1.
Introduces support for the Cluster release 16.4.0 that is based on Mirantis Container Runtime (MCR) 25.0.8 and Mirantis Kubernetes Engine (MKE) 3.7.19 with Kubernetes 1.27.
Does not support greenfield deployments on deprecated Cluster releases of the 17.3.x and 16.3.x series. Use the latest available Cluster releases of the series instead.
Caution
Make sure to update the Cluster release version of your managed cluster before the current Cluster release version becomes unsupported by a new Container Cloud release version. Otherwise, Container Cloud stops auto-upgrade and eventually Container Cloud itself becomes unsupported.
This section outlines release notes for the Container Cloud release 2.29.0.
This section outlines new features and enhancements introduced in the Container Cloud release 2.29.0.
For the list of enhancements delivered with the Cluster releases introduced by Container Cloud 2.29.0, see 17.4.0 and 16.4.0.
For the list of enhancements delivered with MOSK 25.1 introduced together with Container Cloud 2.29.0, see MOSK New features.
To allow the operator use the gitops approach, implemented the
BareMetalHostInventory resource that must be used instead of
BareMetalHost for adding and modifying configuration of bare metal servers.
The BareMetalHostInventory resource monitors and manages the state of a
bare metal server and is created for each Machine with all information
about machine hardware configuration.
Each BareMetalHostInventory object is synchronized with an automatically
created BareMetalHost object, which is now used for internal purposes of
the Container Cloud private API.
Caution
Any change in the BareMetalHost object will be overwitten by
BareMetalHostInventory.
For any existing BareMetalHost object, a BareMetalHostInventory object
is created automatically during cluster update.
Caution
While the Cluster release the management cluster is 16.4.0,
BareMetalHostInventory operations are allowed to
m:kaas@management-admin only. Once the management cluster is updated
to the Cluster release 16.4.1 (or later), this limitation will be lifted.
Implemented a validation of the Subnet object changes against already
allocated IP addresses. This validation is performed by the Admission
Controller. The controller now blocks changes in the Subnet object
containing allocated IP addresses that are out of the allocatable IP address
space, which is formed by a CIDR address and include/exclude address ranges.
Improved calculation of update estimates for a managed cluster that is managed
by the ClusterUpdatePlan object. Each step of ClusterUpdatePlan now has
more precise estimates that are based on the following calculations:
The amount and type of components updated between releases during patch updates
The amount of nodes with particular roles in the OpenStack cluster
The number of nodes and storage used in the Ceph cluster
Also, the ClusterUpdatePlan object now contains the releaseNotes field
that links to MOSK release notes of the target release.
Switched the default container runtime from Docker to containerd on greenfield management and managed clusters. The use of containerd allows for better Kubernetes performance and component update without pod restart when applying fixes for CVEs.
On existing clusters, perform the mandatory migration from Docker to containerd in the scope of Container Cloud 2.29.x. Otherwise, the management cluster update to Container Cloud 2.30.0 will be blocked.
Important
Container runtime migration involves machine cordoning and draining.
The following issues have been addressed in the Mirantis Container Cloud release 2.29.0 along with the Cluster releases 17.4.0 and 16.4.0. For the list of MOSK addressed issues, see MOSK release notes 25.1: Addressed issues.
Note
This section provides descriptions of issues addressed since the last Container Cloud patch release 2.28.5.
For details on addressed issues in earlier patch releases since 2.28.0, which are also included into the major release 2.29.0, refer to 2.28.x patch releases.
[47263] [StackLight] Fixed the issue with configuration inconsistencies for
requestsandlimitsbetween the deprecatedresourcesPerClusterSizeandresourcesparameters.[44193] [StackLight] Fixed the issue with OpenSearch reaching the 85% disk usage watermark on High Availability clusters that use Local Volume Provisioner, which caused the OpenSearch cluster state to switch to
WarningorCritical.[46858] [Container Cloud web UI] Fixed the issue that prevented the drop-down menu from displaying the full list of allowed node labels.
[39437] [LCM] Fixed the issue that caused failure to replace a master node and the
Kubelet's NodeReady condition is Unknownmessage in the machine status on the remaining master nodes.
This section lists known issues with workarounds for the Mirantis Container Cloud release 2.29.0 including the Cluster releases 17.4.0 and 16.4.0. For the known issues in the related MOSK release, see Known issues.
For other issues that can occur while deploying and operating a Container Cloud cluster, see Troubleshooting Guide.
Note
This section also outlines still valid known issues from previous Container Cloud releases.
Fixed in 2.29.1 (17.3.6, 16.3.6, and 16.4.1)
During addition of a bare metal host containing a Redfish Baseboard Management Controller address with the following exemplary configuration may get stuck during the registering phase:
bmc:
address: redfish://192.168.1.150/redfish/v1/Systems/1
Workaround:
Open the
ironic-configconfigmap for editing:KUBECONFIG=mgmt_kubeconfig kubectl -n kaas edit cm ironic-config
In the
data:ironic.confsection, add theenabled_firmware_interfacesparameter:data: ironic.conf: | [DEFAULT] ... enabled_firmware_interfaces = redfish,no-firmware ...
Restart Ironic:
KUBECONFIG=mgmt_kubeconfig kubectl -n kaas rollout restart deployment/ironic
Due to the MetalLB upstream issue, a load balancer service may not obtain the external IP address.
The issue occurs when two services share the same external IP address and have
the same externalTrafficPolicy value. Initially, the services have the
external IP address assigned and are accessible. After modifying the
externalTrafficPolicy value for both services from Cluster to
Local, the first service that has been changed remains with no external IP
address assigned. Though, the second service, which was changed later, has the
external IP assigned as expected.
To work around the issue, make a dummy change to the service object where
external IP is <pending>:
Identify the service that is stuck:
kubectl get svc -A | grep pending
Example of system response:
stacklight iam-proxy-prometheus LoadBalancer 10.233.28.196 <pending> 443:30430/TCP
Add an arbitrary label to the service that is stuck. For example:
kubectl label svc -n stacklight iam-proxy-prometheus reconcile=1
Example of system response:
service/iam-proxy-prometheus labeledVerify that the external IP was allocated to the service:
kubectl get svc -n stacklight iam-proxy-prometheus
Example of system response:
NAME TYPE CLUSTER-IP EXTERNAL-IP PORT(S) AGE iam-proxy-prometheus LoadBalancer 10.233.28.196 10.0.34.108 443:30430/TCP 12d
During deletion of a manager machine running the ironic Pod from a bare
metal management cluster, the following problems occur:
All Pods are stuck in the
TerminatingstateA new
ironicPod fails to startThe related bare metal host is stuck in the
deprovisioningstate
As a workaround, before deletion of the node running the ironic Pod,
cordon and drain the node using the kubectl cordon <nodeName> and
kubectl drain <nodeName> commands.
Fixed in 2.30.0 (21.0.0 and 20.0.0)
During managed cluster update, if some node is being disabled and at the same
time ceph-maintenance-controller is restarted, a second
miracephnodedisable object is erroneously created for the node. As a
result, the second object fails in the Cleaning state, which blocks
managed cluster update.
Workaround
On the affected managed cluster, obtain the list of
miracephnodedisableobjects:kubectl get miracephnodedisable -n ceph-lcm-mirantis
The system response must contain one completed and one failed
miracephnodedisableobject for the node being disabled. For example:NAME AGE NODE NAME STATE LAST CHECK ISSUE nodedisable-353ccad2-8f19-4c11-95c9-a783abb531ba 58m kaas-node-91207a35-3200-41d1-9ba9-388500970981 Ready 2025-03-06T22:04:48Z nodedisable-58bbf563-1c76-4319-8c28-363d73a5efef 57m kaas-node-91207a35-3200-41d1-9ba9-388500970981 Cleaning 2025-03-07T11:59:27Z host clean up Job 'ceph-lcm-mirantis/host-cleanup-nodedisable-58bbf563-1c76-4319-8c28-363d73a5efef' is failed, check logs
Remove the failed
miracephnodedisableobject. For example:kubectl delete miracephnodedisable -n ceph-lcm-mirantis nodedisable-58bbf563-1c76-4319-8c28-363d73a5efef
Fixed in 2.29.3 (17.3.8, 16.3.8, and 16.4.3)
Due to the upstream Ceph issue
66717,
during CVE upgrade of the Ceph daemon image of Ceph Reef 18.2.4, OSDs may start
slow and even fail the starting probe with the following describe output in
the rook-ceph-osd-X pod:
Warning Unhealthy 57s (x16 over 3m27s) kubelet Startup probe failed:
ceph daemon health check failed with the following output:
> no valid command found; 10 closest matches:
> 0
> 1
> 2
> abort
> assert
> bluefs debug_inject_read_zeros
> bluefs files list
> bluefs stats
> bluestore bluefs device info [<alloc_size:int>]
> config diff
> admin_socket: invalid command
Workaround:
Complete the following steps during every patch or major cluster update of the Cluster releases 17.2.x, 17.3.x, and 17.4.x (until Ceph 18.2.5 becomes supported):
Plan extra time in the maintenance window for the patch cluster update.
Slow starts will still impact the update procedure, but after completing the following step, the recovery process noticeably shortens without affecting the overall cluster state and data responsiveness.
Select one of the following options:
Before the cluster update, set the
nooutflag:ceph osd set noout
Once the Ceph OSDs image upgrade is done, unset the flag:
ceph osd unset noout
Monitor the Ceph OSDs image upgrade. If the symptoms of slow start appear, set the
nooutflag as soon as possible. Once the Ceph OSDs image upgrade is done, unset the flag.
Note
The issue does not reproduce since MOSK 25.2.
Update of a managed cluster based on bare metal and Ceph enabled fails with
PersistentVolumeClaim getting stuck in the Pending state for the
prometheus-server StatefulSet and the
MountVolume.MountDevice failed for volume warning in the StackLight event
logs.
Workaround:
Verify that the description of the Pods that failed to run contain the
FailedMountevents:kubectl -n <affectedProjectName> describe pod <affectedPodName>
In the command above, replace the following values:
<affectedProjectName>is the Container Cloud project name where the Pods failed to run<affectedPodName>is a Pod name that failed to run in the specified project
In the Pod description, identify the node name where the Pod failed to run.
Verify that the
csi-rbdpluginlogs of the affected node contain therbd volume mount failed: <csi-vol-uuid> is being usederror. The<csi-vol-uuid>is a unique RBD volume name.Identify
csiPodNameof the correspondingcsi-rbdplugin:kubectl -n rook-ceph get pod -l app=csi-rbdplugin \ -o jsonpath='{.items[?(@.spec.nodeName == "<nodeName>")].metadata.name}'
Output the affected
csiPodNamelogs:kubectl -n rook-ceph logs <csiPodName> -c csi-rbdplugin
Scale down the affected
StatefulSetorDeploymentof the Pod that fails to0replicas.On every
csi-rbdpluginPod, search for stuckcsi-vol:for pod in `kubectl -n rook-ceph get pods|grep rbdplugin|grep -v provisioner|awk '{print $1}'`; do echo $pod kubectl exec -it -n rook-ceph $pod -c csi-rbdplugin -- rbd device list | grep <csi-vol-uuid> done
Unmap the affected
csi-vol:rbd unmap -o force /dev/rbd<i>
The
/dev/rbd<i>value is a mapped RBD volume that usescsi-vol.Delete
volumeattachmentof the affected Pod:kubectl get volumeattachments | grep <csi-vol-uuid> kubectl delete volumeattacmhent <id>
Scale up the affected
StatefulSetorDeploymentback to the original number of replicas and wait until its state becomesRunning.
Fixed in 2.30.0 (21.0.0 and 20.0.0)
After machine disablement and consequent re-enablement, persistent volumes
(PVs) provisioned by local-volume-provisioner may cause the
local-volume-provisioner pod on such machine to switch to the
CrashLoopBackOff state.
This occurs because re-enabling the machine results in a new node UID being
assigned in Kubernetes. As a result, the owner ID of the volumes provisioned by
local-volume-provisioner no longer matches the new node UID. Although the
volumes remain in the correct system paths, local-volume-provisioner
detects a mismatch in ownership, leading to an unhealthy service state.
Workaround:
Identify the ID of the affected
local-volume-provisioner:kubectl -n kube-system get pods
Example of system response extract:
local-volume-provisioner-h5lrc 0/1 CrashLoopBackOff 33 (2m3s ago) 90m
In the
local-volume-provisionerlogs, identify the affected PVs. For example:kubectl logs -n kube-system local-volume-provisioner-h5lrc | less
Example of system response extract:
E0304 23:21:31.455148 1 discovery.go:221] Failed to discover local volumes: 5 error(s) while discovering volumes: [error creating PV "local-pv-1d04ed53" for volume at "/mnt/local-volumes/openstack-operator/bind-mounts/vol04": persistentvolumes "local-pv-1d04ed53" already exists error creating PV "local-pv-ce2dfc24" for volume at "/mnt/local-volumes/openstack-operator/bind-mounts/vol01": persistentvolumes "local-pv-ce2dfc24" already exists error creating PV "local-pv-bcb9e4bd" for volume at "/mnt/local-volumes/openstack-operator/bind-mounts/vol02": persistentvolumes "local-pv-bcb9e4bd" already exists error creating PV "local-pv-c5924ada" for volume at "/mnt/local-volumes/openstack-operator/bind-mounts/vol03": persistentvolumes "local-pv-c5924ada" already exists error creating PV "local-pv-7c7150cf" for volume at "/mnt/local-volumes/openstack-operator/bind-mounts/vol00": persistentvolumes "local-pv-7c7150cf" already exists]
Update the
pv.kubernetes.io/provisioned-byannotation for all PVs that are mentioned in thealready existserrors on the enabled node. The annotation must have thelocal-volume-provisioner-<K8S-NODE-NAME>-<K8S-NODE-UID>format.To obtain the node UID:
kubectl get node <K8S-NODE-NAME> -o jsonpath='{.metadata.uid}'
To edit annotations on the volumes:
kubectl edit pv <PV-NAME>
For example:
kubectl edit pv local-pv-ce2dfc24
Fixed in 2.29.1 (17.3.6, 16.3.6, and 16.4.1)
While editing the MCCUpgrade object, the following error occurs when trying
to save changes:
HTTP response body: {"kind":"Status","apiVersion":"v1","metadata":{},"status":"Failure",
"message":"Internal error occurred: failed calling webhook \"mccupgrades.kaas.mirantis.com\":
failed to call webhook: the server could not find the requested resource",
"reason":"InternalError",
"details":{"causes":[{"message":"failed calling webhook \"mccupgrades.kaas.mirantis.com\":
failed to call webhook: the server could not find the requested resource"}]},"code":500}
To work around the issue, remove the
name: mccupgrades.kaas.mirantis.com entry from
mutatingwebhookconfiguration:
kubectl --kubeconfig kubeconfig edit mutatingwebhookconfiguration admission-controller
Example configuration:
- admissionReviewVersions:
- v1
- v1beta1
clientConfig:
caBundle: <REDACTED>
service:
name: admission-controller
namespace: kaas
path: /mccupgrades
port: 443
failurePolicy: Fail
matchPolicy: Equivalent
name: mccupgrades.kaas.mirantis.com
namespaceSelector: {}
objectSelector: {}
reinvocationPolicy: Never
rules:
- apiGroups:
- kaas.mirantis.com
apiVersions:
- v1alpha1
operations:
- CREATE
- UPDATE
resources:
- mccupgrades
scope: '*'
sideEffects: NoneOnDryRun
timeoutSeconds: 5
During MariaDB operations on a management cluster, Pods may get stuck in continuous restarts with the following example error:
[ERROR] WSREP: Corrupt buffer header: \
addr: 0x7faec6f8e518, \
seqno: 3185219421952815104, \
size: 909455917, \
ctx: 0x557094f65038, \
flags: 11577. store: 49, \
type: 49
Workaround:
Create a backup of the
/var/lib/mysqldirectory on themariadb-serverPod.Verify that other replicas are up and ready.
Remove the
galera.cachefile for the affectedmariadb-serverPod.Remove the affected
mariadb-serverPod or wait until it is automatically restarted.
After Kubernetes restarts the Pod, the Pod clones the database in 1-2 minutes and restores the quorum.
Fixed in 2.29.2 (17.3.7, 16.3.7, and 16.4.2)
On management clusters with sf-notifier enabled, the
PrometheusTargetScrapesDuplicate alert is permanently firing while
sf-notifier runs with no errors.
You can safely disregard the issue because it does not affect cluster health.
Custom Grafana panels and dashboards may be corrupted after automatic migration of deprecated Angular-based plugins to the React-based ones. For details, see MOSK Deprecation Notes: Angular plugins in Grafana dashboards and the post-update step Back up custom Grafana dashboards in Container Cloud 2.28.4 update notes.
To work around the issue, manually adjust the affected dashboards to restore their custom appearance.
Fixed in 2.30.0 (21.0.0 and 20.0.0)
A compact MOSK cluster fails to be deployed through the Container Cloud web UI
due to inability to add any label to the control plane machines along with
inability to change dedicatedControlPlane: false using the web UI.
To work around the issue, manually add the required labels using CLI. Once done, the cluster deployment resumes.
A newly created project does not display all available tabs in the Container
Cloud web UI and contains different access denied errors during first five
minutes after creation.
To work around the issue, refresh the browser in five minutes after the project creation.
Fixed in 2.29.1 (17.3.6, 16.3.6, 16.4.1)
The Clusters page for the bare metal provider does not display
information about the Ceph cluster in the Ceph Clusters tab and
contains access denied errors.
To work around the issue, verify the Ceph cluster state through CLI. For details, see MOSK documentation: Ceph operations - Verify Ceph.
The following table lists major components and their versions delivered in
Container Cloud 2.29.0. The components that are newly added, updated,
deprecated, or removed as compared to 2.28.0, are marked with a corresponding
superscript, for example, admission-controller Updated.
Component |
Application/Service |
Version |
|---|---|---|
Bare metal Updated |
ambassador |
1.42.9 |
baremetal-dnsmasq |
base-2-29-alpine-20250217104113 |
|
baremetal-operator |
base-2-29-alpine-20250217104322 |
|
baremetal-provider |
1.42.9 |
|
bm-collective |
base-2-29-alpine-20250217104943 |
|
cluster-api-provider-baremetal |
1.42.9 |
|
ironic |
caracal-jammy-20250128120200 |
|
ironic-inspector |
caracal-jammy-20250128120200 |
|
ironic-prometheus-exporter |
0.1-20240913123302 |
|
kaas-ipam |
1.42.9 |
|
kubernetes-entrypoint |
1.0.1-202a68c-20250203183923 |
|
mariadb |
10.6.20-jammy-20241104184039 |
|
syslog-ng |
base-alpine-20250217103755 |
|
Container Cloud Updated |
admission-controller |
1.42.9 |
agent-controller |
1.42.9 |
|
byo-cluster-api-controller |
1.42.9 |
|
ceph-kcc-controller |
1.42.9 |
|
cert-manager-controller |
1.11.0-11 |
|
configuration-collector |
1.42.9 |
|
event-controller |
1.42.9 |
|
frontend |
1.42.9 |
|
golang |
1.23.6-alpine3.20 |
|
iam-controller |
1.42.9 |
|
kaas-exporter |
1.42.9 |
|
kproxy |
1.42.9 |
|
lcm-controller |
1.42.9 |
|
license-controller |
1.42.9 |
|
machinepool-controller |
1.42.9 |
|
nginx |
1.42.9 |
|
portforward-controller |
1.42.9 |
|
rbac-controller |
1.42.9 |
|
registry |
2.8.1-15 |
|
release-controller |
1.42.9 |
|
scope-controller |
1.42.9 |
|
secret-controller |
1.42.9 |
|
user-controller |
1.42.9 |
|
IAM Updated |
iam |
1.42.9 |
mariadb |
10.6.20-jammy-20241104184039 |
|
mcc-keycloak |
25.0.6-20241114073807 |
|
OpenStack Deprecated |
host-os-modules-controller |
1.42.9 |
openstack-cluster-api-controller |
1.42.9 |
|
openstack-provider |
1.42.9 |
This section lists the artifacts of components included in the Container Cloud
release 2.29.0. The components that are newly added, updated,
deprecated, or removed as compared to 2.28.0, are marked with a corresponding
superscript, for example, admission-controller Updated.
Artifact |
Component |
Path |
|---|---|---|
Binaries |
ironic-python-agent.initramfs Updated |
https://binary.mirantis.com/bm/bin/ironic/ipa/ubuntu/initramfs-caracal-jammy-debug-20250217102957 |
ironic-python-agent.kernel Updated |
https://binary.mirantis.com/bm/bin/ironic/ipa/ubuntu/kernel-caracal-jammy-debug-20250217102957 |
|
provisioning_ansible |
https://binary.mirantis.com/bm/bin/ansible/provisioning_ansible-0.1.1-167-e7a55fd.tgz |
|
Helm charts Updated |
baremetal-api |
https://binary.mirantis.com/core/helm/baremetal-api-1.42.9.tgz |
baremetal-operator |
https://binary.mirantis.com/core/helm/baremetal-operator-1.42.9.tgz |
|
baremetal-provider |
https://binary.mirantis.com/core/helm/baremetal-provider-1.42.9.tgz |
|
baremetal-public-api |
https://binary.mirantis.com/core/helm/baremetal-public-api-1.42.9.tgz |
|
kaas-ipam |
||
Docker images Updated |
ambassador |
mirantis.azurecr.io/core/external/nginx:1.42.9 |
baremetal-dnsmasq |
mirantis.azurecr.io/bm/baremetal-dnsmasq:base-2-29-alpine-20250217104113 |
|
baremetal-operator |
mirantis.azurecr.io/bm/baremetal-operator:base-2-29-alpine-20250217104322 |
|
bm-collective |
mirantis.azurecr.io/bm/bm-collective:base-2-29-alpine-20250217104943 |
|
cluster-api-provider-baremetal |
mirantis.azurecr.io/core/cluster-api-provider-baremetal:1.42.9 |
|
ironic |
mirantis.azurecr.io/openstack/ironic:caracal-jammy-20250128120200 |
|
ironic-inspector |
mirantis.azurecr.io/openstack/ironic-inspector:caracal-jammy-20250128120200 |
|
ironic-prometheus-exporter |
mirantis.azurecr.io/stacklight/ironic-prometheus-exporter:0.1-20240913123302 |
|
kaas-ipam |
mirantis.azurecr.io/core/kaas-ipam:1.42.9 |
|
kubernetes-entrypoint |
mirantis.azurecr.io/openstack/extra/kubernetes-entrypoint:v1.0.1-202a68c-20250203183923 |
|
mariadb |
mirantis.azurecr.io/general/mariadb:10.6.20-jammy-20241104184039 |
|
syslog-ng |
mirantis.azurecr.io/bm/syslog-ng:base-alpine-20250217103755 |
Artifact |
Component |
Path |
|---|---|---|
Bootstrap tarball Updated |
bootstrap-darwin |
https://binary.mirantis.com/core/bin/bootstrap-darwin-1.42.9.tgz |
bootstrap-linux |
https://binary.mirantis.com/core/bin/bootstrap-linux-1.42.9.tgz |
|
Helm charts Updated |
admission-controller |
https://binary.mirantis.com/core/helm/admission-controller-1.42.9.tgz |
agent-controller |
https://binary.mirantis.com/core/helm/agent-controller-1.42.9.tgz |
|
byo-provider Removed |
n/a |
|
ceph-kcc-controller |
https://binary.mirantis.com/core/helm/ceph-kcc-controller-1.42.9.tgz |
|
cert-manager |
https://binary.mirantis.com/core/helm/cert-manager-1.42.9.tgz |
|
configuration-collector |
https://binary.mirantis.com/core/helm/configuration-collector-1.42.9.tgz |
|
credentials-controller Deprecated |
https://binary.mirantis.com/core/helm/credentials-controller-1.42.9.tgz |
|
event-controller |
https://binary.mirantis.com/core/helm/event-controller-1.42.9.tgz |
|
host-os-modules-controller |
https://binary.mirantis.com/core/helm/host-os-modules-controller-1.42.9.tgz |
|
iam-controller |
https://binary.mirantis.com/core/helm/iam-controller-1.42.9.tgz |
|
kaas-exporter |
https://binary.mirantis.com/core/helm/kaas-exporter-1.42.9.tgz |
|
kaas-public-api |
https://binary.mirantis.com/core/helm/kaas-public-api-1.42.9.tgz |
|
kaas-ui |
||
lcm-controller |
https://binary.mirantis.com/core/helm/lcm-controller-1.42.9.tgz |
|
license-controller |
https://binary.mirantis.com/core/helm/license-controller-1.42.9.tgz |
|
machinepool-controller |
https://binary.mirantis.com/core/helm/machinepool-controller-1.42.9.tgz |
|
mcc-cache |
||
mcc-cache-warmup |
https://binary.mirantis.com/core/helm/mcc-cache-warmup-1.42.9.tgz |
|
openstack-provider Deprecated |
https://binary.mirantis.com/core/helm/openstack-provider-1.42.9.tgz |
|
portforward-controller |
https://binary.mirantis.com/core/helm/portforward-controller-1.42.9.tgz |
|
rbac-controller |
https://binary.mirantis.com/core/helm/rbac-controller-1.42.9.tgz |
|
release-controller |
https://binary.mirantis.com/core/helm/release-controller-1.42.9.tgz |
|
scope-controller |
https://binary.mirantis.com/core/helm/scope-controller-1.42.9.tgz |
|
secret-controller |
https://binary.mirantis.com/core/helm/secret-controller-1.42.9.tgz |
|
squid-proxy Removed |
n/a |
|
user-controller |
https://binary.mirantis.com/core/helm/user-controller-1.42.9.tgz |
|
Docker images Updated |
admission-controller |
mirantis.azurecr.io/core/admission-controller:1.42.9 |
agent-controller |
mirantis.azurecr.io/core/agent-controller:1.42.9 |
|
byo-cluster-api-controller Removed |
n/a |
|
ceph-kcc-controller |
mirantis.azurecr.io/core/ceph-kcc-controller:1.42.9 |
|
cert-manager-controller |
mirantis.azurecr.io/core/external/cert-manager-controller:v1.11.0-11 |
|
configuration-collector |
mirantis.azurecr.io/core/configuration-collector:1.42.9 |
|
credentials-controller Deprecated |
mirantis.azurecr.io/core/credentials-controller:1.42.9 |
|
event-controller |
mirantis.azurecr.io/core/event-controller:1.42.9 |
|
frontend |
mirantis.azurecr.io/core/frontend:1.42.9 |
|
host-os-modules-controller |
mirantis.azurecr.io/core/host-os-modules-controller:1.42.9 |
|
iam-controller |
mirantis.azurecr.io/core/iam-controller:1.42.9 |
|
kaas-exporter |
mirantis.azurecr.io/core/kaas-exporter:1.42.9 |
|
kproxy |
mirantis.azurecr.io/core/kproxy:1.42.9 |
|
lcm-controller |
mirantis.azurecr.io/core/lcm-controller:1.42.9 |
|
license-controller |
mirantis.azurecr.io/core/license-controller:1.42.9 |
|
machinepool-controller |
mirantis.azurecr.io/core/machinepool-controller:1.42.9 |
|
mcc-cache-warmup |
mirantis.azurecr.io/core/mcc-cache-warmup:1.42.9 |
|
nginx |
mirantis.azurecr.io/core/external/nginx:1.42.9 |
|
openstack-cluster-api-controller Deprecated |
mirantis.azurecr.io/core/openstack-cluster-api-controller:1.42.9 |
|
portforward-controller |
mirantis.azurecr.io/core/portforward-controller:1.42.9 |
|
rbac-controller |
mirantis.azurecr.io/core/rbac-controller:1.42.9 |
|
registry |
mirantis.azurecr.io/lcm/registry:v2.8.1-15 |
|
release-controller |
mirantis.azurecr.io/core/release-controller:1.42.9 |
|
scope-controller |
mirantis.azurecr.io/core/scope-controller:1.42.9 |
|
secret-controller |
mirantis.azurecr.io/core/secret-controller:1.42.9 |
|
squid-proxy Removed |
n/a |
|
user-controller |
mirantis.azurecr.io/core/user-controller:1.42.9 |
Artifact |
Component |
Path |
|---|---|---|
Binaries |
hash-generate-darwin |
http://binary.mirantis.com/iam/bin/hash-generate-0.0.1-268-3cf7f17-darwin |
hash-generate-linux |
http://binary.mirantis.com/iam/bin/hash-generate-0.0.1-268-3cf7f17-linux |
|
Helm charts Updated |
iam |
|
Docker images |
kubectl |
mirantis.azurecr.io/general/kubectl:20240926142019 |
kubernetes-entrypoint |
mirantis.azurecr.io/openstack/extra/kubernetes-entrypoint:v1.0.1-ba8ada4-20240405150338 |
|
mariadb Updated |
mirantis.azurecr.io/general/mariadb:10.6.20-jammy-20241104184039 |
|
mcc-keycloak Updated |
mirantis.azurecr.io/iam/mcc-keycloak:25.0.6-20241114073807 |
In total, since Container Cloud 2.28.5, in 2.29.0, 736 Common Vulnerabilities and Exposures (CVE) have been fixed: 125 of critical and 611 of high severity.
The table below includes the total numbers of addressed unique and common vulnerabilities and exposures (CVE) by product component since the 2.28.5 patch release. The common CVEs are issues addressed across several images.
Product component |
CVE type |
Critical |
High |
Total |
|---|---|---|---|---|
Ceph |
Unique |
0 |
6 |
6 |
Common |
0 |
177 |
177 |
|
Kaas core |
Unique |
1 |
8 |
9 |
Common |
88 |
229 |
317 |
|
StackLight |
Unique |
7 |
48 |
55 |
Common |
37 |
205 |
242 |
Mirantis Security Portal
For the detailed list of fixed and existing CVEs across the Mirantis Container Cloud and MOSK products, refer to Mirantis Security Portal.
MOSK CVEs
For the number of fixed CVEs in the MOSK-related components including OpenStack and Tungsten Fabric, refer to MOSK 25.1 security notes.
This section describes the specific actions you as a cloud operator need to complete before or after your Container Cloud cluster update to the Cluster releases 17.4.0 or 16.4.0. For details on update impact and maintenance window planning, see MOSK update notes.
Consider the information below as a supplement to the generic Update to a major version procedure published in the Operations Guide.
Consider the information below as a supplement to the generic update procedures published in Operations Guide: Workflow and configuration of management cluster upgrade and Update to a major version.
In Container Cloud 2.29.0, the Cluster release update of the Ubuntu 20.04-based managed clusters becomes impossible, and Ubuntu 22.04 becomes the only supported version of the operating system. Therefore, ensure that every node of your managed clusters are running Ubuntu 22.04 to unblock managed cluster update in Container Cloud 2.29.0.
For the update procedure, refer to Upgrade an operating system distribution.
Warning
Management cluster update to Container Cloud 2.29.1 will be blocked if at least one node of any related managed cluster is running Ubuntu 20.04.
Note
Existing management clusters were automatically updated to Ubuntu 22.04 during cluster upgrade to the Cluster release 16.2.0 in Container Cloud 2.27.0. Greenfield deployments of management clusters are also based on Ubuntu 22.04.
In Container Cloud 2.29.0, Grafana is updated to version 11 where the following deprecated Angular-based plugins are automatically migrated to the React-based ones:
Graph (old) -> Time Series
Singlestat -> Stat
Stat (old) -> Stat
Table (old) -> Table
Worldmap -> Geomap
This migration may corrupt custom Grafana dashboards that have Angular-based panels. Therefore, if you have such dashboards on managed clusters, back them up and manually upgrade Angular-based panels before updating to the Cluster release 17.4.0 to prevent custom appearance issues after plugin migration.
Note
All Grafana dashboards provided by StackLight are also migrated to React automatically. For the list of default dashboards, see View Grafana dashboards.
Caution
For management clusters that are updated automatically, it is important to remove all Angular-based panels and prepare the backup of custom Grafana dashboards before Container Cloud 2.29.0 is released. For details, see Post update notes in 2.28.5 release notes. Otherwise, custom dashboards using Angular-based plugins may be corrupted and must be manually restored without a backup.
Due to the known issue 50561, after machine
disablement and consequent re-enablement, persistent volumes provisioned by
local-volume-provisioner that are not currently in use by any pod may
cause the local-volume-provisioner pod on such machine to switch to the
CrashLoopBackOff state.
To ensure that local-volume-provisioner does not block cluster update and
is healthy, either verify the cluster status in the Container Cloud web UI or
run the following command:
kubectl -n kube-system get pods
Example of system response extract with healthy local-volume-provisioner:
local-volume-provisioner-dg98z 1/1 Running 0 66d
Example of system response extract with unhealthy local-volume-provisioner:
local-volume-provisioner-h5lrc 0/1 CrashLoopBackOff 33 (2m3s ago) 90m
If local-volume-provisioner is unhealthy, proceed with the workaround
provided in the 50561 issue description.
Container Cloud 2.29.0 introduces the BareMetalHostInventory resource that
must be used instead of BareMetalHost for adding and modifying
configuration of bare metal servers. Therefore, if you need to modify an
existing or create a new configuration of a bare metal host, use
BareMetalHostInventory.
Each BareMetalHostInventory object is synchronized with an automatically
created BareMetalHost object, which is now used for internal purposes of
the Container Cloud private API.
Caution
Any change in the BareMetalHost object will be overwitten by
BareMetalHostInventory.
For any existing BareMetalHost object, a BareMetalHostInventory object
is created automatically during cluster update.
To match CIS Benchmark compliance checks for Ubuntu Linux 22.04 LTS v2.0.0 L1 Server, Container Cloud 2.29.0 introduces new password policies for local (Linux) user accounts. For details, see Improvements in the CIS Benchmark compliance for Ubuntu, MKE, and Docker.
The rules are applied automatically to all cluster nodes during cluster update. Therefore, if you use custom Linux accounts protected by passwords, do not plan any critical maintenance activities right after cluster upgrade as you may need to update Linux user passwords.
Note
By default, during cluster creation, mcc-user is created without
a password with an option to add an SSH key.
Container Cloud 2.29.0 introduces switching of the default container runtime from Docker to containerd on greenfield management and managed clusters.
On existing clusters, perform the mandatory migration from Docker to containerd in the scope of Container Cloud 2.29.x. Otherwise, the management cluster update to Container Cloud 2.30.0 will be blocked.
Important
Container runtime migration involves machine cordoning and draining.
Note
If you have not upgraded the operating system distribution on your machines to Jammy yet, Mirantis recommends migrating machines from Docker to containerd on managed clusters together with distribution upgrade to minimize the maintenance window.
In this case, ensure that all cluster machines are updated at once during the same maintenance window to prevent machines from running different container runtimes.
Required action
2.28.5
The Container Cloud patch release 2.28.5, which is based on the 2.28.0 major release, provides the following updates:
Support for the patch Cluster release 16.3.5.
Support for the patch Cluster release 17.3.5 that represents MOSK patch release 24.3.2 patch.
Support for Mirantis Kubernetes Engine 3.7.18 and Mirantis Container Runtime 23.0.15, which includes containerd 1.6.36.
Optional migration of container runtime from Docker to containerd.
Bare metal: update of Ubuntu mirror from ubuntu-2024-12-05-003900 to ubuntu-2025-01-08-003900 along with update of minor kernel version from 5.15.0-126-generic to 5.15.0-130-generic.
Security fixes for CVEs in images.
This patch release also supports the latest major Cluster releases 17.3.0 and 16.3.0. And it does not support greenfield deployments based on deprecated Cluster releases. Use the latest available Cluster release instead.
For main deliverables of the parent Container Cloud release of 2.28.5, refer to 2.28.0.
This section describes the specific actions you as a cloud operator need to complete before or after your Container Cloud cluster update to the Cluster releases 17.3.5 or 16.3.5.
Consider the information below as a supplement to the generic update procedures published in MOSK Operations Guide: Automatic upgrade of a management cluster and Update to a patch version.
Since Container Cloud 2.28.4, Mirantis introduced an optional migration of container runtime from Docker to containerd, which is implemented for existing management and managed bare metal clusters. The use of containerd allows for better Kubernetes performance and component update without pod restart when applying fixes for CVEs. For the migration procedure, refer to Operations Guide: Migrate container runtime from Docker to containerd.
Note
Container runtime migration becomes mandatory in the scope of Container Cloud 2.29.x. Otherwise, the management cluster update to Container Cloud 2.30.0 will be blocked.
Note
In Containter Cloud 2.28.x series, the default container runtime remains Docker for greenfield deployments. Support for greenfield deployments based on containerd will be announced in one of the following releases.
Important
Container runtime migration involves machine cordoning and draining.
Note
If you have not upgraded the operating system distribution on your machines to Jammy yet, Mirantis recommends migrating machines from Docker to containerd on managed clusters together with distribution upgrade to minimize the maintenance window.
In this case, ensure that all cluster machines are updated at once during the same maintenance window to prevent machines from running different container runtimes.
In Container Cloud 2.29.0, Grafana will be updated to version 11 where the following deprecated Angular-based plugins will be automatically migrated to the React-based ones:
Graph (old) -> Time Series
Singlestat -> Stat
Stat (old) -> Stat
Table (old) -> Table
Worldmap -> Geomap
This migration may corrupt custom Grafana dashboards that have Angular-based panels. Therefore, if you have such dashboards, back them up and manually upgrade Angular-based panels during the course of Container Cloud 2.28.x (Cluster releases 17.3.x and 16.3.x) to prevent custom appearance issues after plugin migration in Container Cloud 2.29.0 (Cluster releases 17.4.0 and 16.4.0).
Note
All Grafana dashboards provided by StackLight are also migrated to React automatically. For the list of default dashboards, see MOSK Operations Guide: View Grafana dashboards.
Warning
For management clusters that are updated automatically, it is important to prepare the backup before Container Cloud 2.29.0 is released. Otherwise, custom dashboards using Angular-based plugins may be corrupted.
For managed clusters, you can perform the backup after the Container Cloud 2.29.0 release date but before updating them to the Cluster release 17.4.0.
In total, since Container Cloud 2.28.4, 1 Common Vulnerability and Exposure (CVE) of high severity has been fixed in 2.28.5.
The table below includes the total numbers of addressed unique and common CVEs in images by product component since Container Cloud 2.28.4. The common CVEs are issues addressed across several images.
Product component |
CVE type |
Critical |
High |
Total |
|---|---|---|---|---|
Kaas core |
Unique |
0 |
1 |
1 |
Common |
0 |
1 |
1 |
Mirantis Security Portal
For the detailed list of fixed and existing CVEs across the Mirantis Container Cloud and MOSK products, refer to Mirantis Security Portal.
MOSK CVEs
For the number of fixed CVEs in the MOSK-related components including OpenStack and Tungsten Fabric, refer to MOSK 24.3.2: Security notes.
This section lists known issues with workarounds for the Mirantis Container Cloud release 2.28.5 including the Cluster releases 16.3.5 and 17.3.5. For the known issues in the related MOSK release, see Known issues.
For other issues that can occur while deploying and operating a Container Cloud cluster, see Troubleshooting Guide.
Note
This section also outlines still valid known issues from previous Container Cloud releases.
Note
Moving forward, the workaround for this issue will be moved from Release Notes to MOSK Troubleshooting Guide: Inspection error on bare metal hosts after dnsmasq restart.
If the dnsmasq pod is restarted during the bootstrap of newly added
nodes, those nodes may fail to undergo inspection. That can result in
inspection error in the corresponding BareMetalHost objects.
The issue can occur when:
The
dnsmasqpod was moved to another node.DHCP subnets were changed, including addition or removal. In this case, the
dhcpdcontainer of thednsmasqpod is restarted.Caution
If changing or adding of DHCP subnets is required to bootstrap new nodes, wait after changing or adding DHCP subnets until the
dnsmasqpod becomes ready, then createBareMetalHostobjects.
To verify whether the nodes are affected:
Verify whether the
BareMetalHostobjects contain theinspection error:kubectl get bmh -n <managed-cluster-namespace-name>
Example of system response:
NAME STATE CONSUMER ONLINE ERROR AGE test-master-1 provisioned test-master-1 true 9d test-master-2 provisioned test-master-2 true 9d test-master-3 provisioned test-master-3 true 9d test-worker-1 provisioned test-worker-1 true 9d test-worker-2 provisioned test-worker-2 true 9d test-worker-3 inspecting true inspection error 19h
Verify whether the
dnsmasqpod was inReadystate when the inspection of the affected baremetal hosts (test-worker-3in the example above) was started:kubectl -n kaas get pod <dnsmasq-pod-name> -oyaml
Example of system response:
... status: conditions: - lastProbeTime: null lastTransitionTime: "2024-10-10T15:37:34Z" status: "True" type: Initialized - lastProbeTime: null lastTransitionTime: "2024-10-11T07:38:54Z" status: "True" type: Ready - lastProbeTime: null lastTransitionTime: "2024-10-11T07:38:54Z" status: "True" type: ContainersReady - lastProbeTime: null lastTransitionTime: "2024-10-10T15:37:34Z" status: "True" type: PodScheduled containerStatuses: - containerID: containerd://6dbcf2fc4b36ce4c549c9191ab01f72d0236c51d42947675302675e4bfaf4cdf image: docker-dev-kaas-virtual.artifactory-eu.mcp.mirantis.net/bm/baremetal-dnsmasq:base-2-28-alpine-20240812132650 imageID: docker-dev-kaas-virtual.artifactory-eu.mcp.mirantis.net/bm/baremetal-dnsmasq@sha256:3dad3e278add18e69b2608e462691c4823942641a0f0e25e6811e703e3c23b3b lastState: terminated: containerID: containerd://816fcf079cd544acd74e312065de5b5ed4dbf1dc6159fefffff4f644b5e45987 exitCode: 0 finishedAt: "2024-10-11T07:38:35Z" reason: Completed startedAt: "2024-10-10T15:37:45Z" name: dhcpd ready: true restartCount: 2 started: true state: running: startedAt: "2024-10-11T07:38:37Z" ...
In the system response above, the
dhcpdcontainer was not ready between"2024-10-11T07:38:35Z"and"2024-10-11T07:38:54Z".Verify the affected baremetal host. For example:
kubectl get bmh -n managed-ns test-worker-3 -oyaml
Example of system response:
... status: errorCount: 15 errorMessage: Introspection timeout errorType: inspection error ... operationHistory: deprovision: end: null start: null inspect: end: null start: "2024-10-11T07:38:19Z" provision: end: null start: null register: end: "2024-10-11T07:38:19Z" start: "2024-10-11T07:37:25Z"
In the system response above, inspection was started at
"2024-10-11T07:38:19Z", immediately before the period of thedhcpdcontainer downtime. Therefore, this node is most likely affected by the issue.
Workaround
Reboot the node using the IPMI reset or cycle command.
If the node fails to boot, remove the failed
BareMetalHostobject and create it again:Remove
BareMetalHostobject. For example:kubectl delete bmh -n managed-ns test-worker-3
Verify that the
BareMetalHostobject is removed:kubectl get bmh -n managed-ns test-worker-3
Create a
BareMetalHostobject from the template. For example:kubectl create -f bmhc-test-worker-3.yaml kubectl create -f bmh-test-worker-3.yaml
Due to the MetalLB upstream issue, a load balancer service may not obtain the external IP address.
The issue occurs when two services share the same external IP address and have
the same externalTrafficPolicy value. Initially, the services have the
external IP address assigned and are accessible. After modifying the
externalTrafficPolicy value for both services from Cluster to
Local, the first service that has been changed remains with no external IP
address assigned. Though, the second service, which was changed later, has the
external IP assigned as expected.
To work around the issue, make a dummy change to the service object where
external IP is <pending>:
Identify the service that is stuck:
kubectl get svc -A | grep pending
Example of system response:
stacklight iam-proxy-prometheus LoadBalancer 10.233.28.196 <pending> 443:30430/TCP
Add an arbitrary label to the service that is stuck. For example:
kubectl label svc -n stacklight iam-proxy-prometheus reconcile=1
Example of system response:
service/iam-proxy-prometheus labeledVerify that the external IP was allocated to the service:
kubectl get svc -n stacklight iam-proxy-prometheus
Example of system response:
NAME TYPE CLUSTER-IP EXTERNAL-IP PORT(S) AGE iam-proxy-prometheus LoadBalancer 10.233.28.196 10.0.34.108 443:30430/TCP 12d
During deletion of a manager machine running the ironic Pod from a bare
metal management cluster, the following problems occur:
All Pods are stuck in the
TerminatingstateA new
ironicPod fails to startThe related bare metal host is stuck in the
deprovisioningstate
As a workaround, before deletion of the node running the ironic Pod,
cordon and drain the node using the kubectl cordon <nodeName> and
kubectl drain <nodeName> commands.
Fixed in 2.29.3 (17.3.8, 16.3.8, and 16.4.3)
Due to the upstream Ceph issue
66717,
during CVE upgrade of the Ceph daemon image of Ceph Reef 18.2.4, OSDs may start
slow and even fail the starting probe with the following describe output in
the rook-ceph-osd-X pod:
Warning Unhealthy 57s (x16 over 3m27s) kubelet Startup probe failed:
ceph daemon health check failed with the following output:
> no valid command found; 10 closest matches:
> 0
> 1
> 2
> abort
> assert
> bluefs debug_inject_read_zeros
> bluefs files list
> bluefs stats
> bluestore bluefs device info [<alloc_size:int>]
> config diff
> admin_socket: invalid command
Workaround:
Complete the following steps during every patch or major cluster update of the Cluster releases 17.2.x, 17.3.x, and 17.4.x (until Ceph 18.2.5 becomes supported):
Plan extra time in the maintenance window for the patch cluster update.
Slow starts will still impact the update procedure, but after completing the following step, the recovery process noticeably shortens without affecting the overall cluster state and data responsiveness.
Select one of the following options:
Before the cluster update, set the
nooutflag:ceph osd set noout
Once the Ceph OSDs image upgrade is done, unset the flag:
ceph osd unset noout
Monitor the Ceph OSDs image upgrade. If the symptoms of slow start appear, set the
nooutflag as soon as possible. Once the Ceph OSDs image upgrade is done, unset the flag.
Note
The issue does not reproduce since MOSK 25.2.
Update of a managed cluster based on bare metal and Ceph enabled fails with
PersistentVolumeClaim getting stuck in the Pending state for the
prometheus-server StatefulSet and the
MountVolume.MountDevice failed for volume warning in the StackLight event
logs.
Workaround:
Verify that the description of the Pods that failed to run contain the
FailedMountevents:kubectl -n <affectedProjectName> describe pod <affectedPodName>
In the command above, replace the following values:
<affectedProjectName>is the Container Cloud project name where the Pods failed to run<affectedPodName>is a Pod name that failed to run in the specified project
In the Pod description, identify the node name where the Pod failed to run.
Verify that the
csi-rbdpluginlogs of the affected node contain therbd volume mount failed: <csi-vol-uuid> is being usederror. The<csi-vol-uuid>is a unique RBD volume name.Identify
csiPodNameof the correspondingcsi-rbdplugin:kubectl -n rook-ceph get pod -l app=csi-rbdplugin \ -o jsonpath='{.items[?(@.spec.nodeName == "<nodeName>")].metadata.name}'
Output the affected
csiPodNamelogs:kubectl -n rook-ceph logs <csiPodName> -c csi-rbdplugin
Scale down the affected
StatefulSetorDeploymentof the Pod that fails to0replicas.On every
csi-rbdpluginPod, search for stuckcsi-vol:for pod in `kubectl -n rook-ceph get pods|grep rbdplugin|grep -v provisioner|awk '{print $1}'`; do echo $pod kubectl exec -it -n rook-ceph $pod -c csi-rbdplugin -- rbd device list | grep <csi-vol-uuid> done
Unmap the affected
csi-vol:rbd unmap -o force /dev/rbd<i>
The
/dev/rbd<i>value is a mapped RBD volume that usescsi-vol.Delete
volumeattachmentof the affected Pod:kubectl get volumeattachments | grep <csi-vol-uuid> kubectl delete volumeattacmhent <id>
Scale up the affected
StatefulSetorDeploymentback to the original number of replicas and wait until its state becomesRunning.
Fixed in 2.29.0 (17.4.0 and 16.4.0)
During the replacement of a master node on a cluster of any type, the process
may get stuck with Kubelet's NodeReady condition is Unknown in the
machine status on the remaining master nodes.
As a workaround, log in on the affected node and run the following command:
docker restart ucp-kubelet
During MariaDB operations on a management cluster, Pods may get stuck in continuous restarts with the following example error:
[ERROR] WSREP: Corrupt buffer header: \
addr: 0x7faec6f8e518, \
seqno: 3185219421952815104, \
size: 909455917, \
ctx: 0x557094f65038, \
flags: 11577. store: 49, \
type: 49
Workaround:
Create a backup of the
/var/lib/mysqldirectory on themariadb-serverPod.Verify that other replicas are up and ready.
Remove the
galera.cachefile for the affectedmariadb-serverPod.Remove the affected
mariadb-serverPod or wait until it is automatically restarted.
After Kubernetes restarts the Pod, the Pod clones the database in 1-2 minutes and restores the quorum.
Fixed in 2.29.0 (17.4.0 and 16.4.0)
On High Availability (HA) clusters that use Local Volume Provisioner (LVP), Prometheus and OpenSearch from StackLight may share the same pool of storage. In such configuration, OpenSearch may approach the 85% disk usage watermark due to the combined storage allocation and usage patterns set by the Persistent Volume Claim (PVC) size parameters for Prometheus and OpenSearch, which consume storage the most.
When the 85% threshold is reached, the affected node is transitioned to the
read-only state, preventing shard allocation and causing the OpenSearch cluster
state to transition to Warning (Yellow) or Critical (Red).
Caution
The issue and the provided workaround apply only for clusters on which OpenSearch and Prometheus utilize the same storage pool.
To verify that the cluster is affected:
Verify the result of the following formula:
0.8 × OpenSearch_PVC_Size_GB + Prometheus_PVC_Size_GB > 0.85 × Total_Storage_Capacity_GBIn the formula, define the following values:
- OpenSearch_PVC_Size_GB
Derived from
.values.elasticsearch.persistentVolumeUsableStorageSizeGB, defaulting to.values.elasticsearch.persistentVolumeClaimSizeif unspecified. To obtain the OpenSearch PVC size:kubectl -n <namespaceName> get cluster <clusterName> -o yaml |\ yq '.spec.providerSpec.value.helmReleases[] | select(.name == "stacklight") | .values.elasticsearch.persistentVolumeClaimSize '
Example of system response:
10000Gi
- Prometheus_PVC_Size_GB
Sourced from
.values.prometheusServer.persistentVolumeClaimSize. To obtain the Prometheus PVC size:kubectl -n <namespaceName> get cluster <clusterName> -o yaml |\ yq '.spec.providerSpec.value.helmReleases[] | select(.name == "stacklight") | .values.prometheusServer.persistentVolumeClaimSize '
Example of system response:
4000Gi
- Total_Storage_Capacity_GB
Total capacity of the OpenSearch PVCs. For LVP, the capacity of the storage pool. To obtain the total capacity:
kubectl get pvc -n stacklight -l app=opensearch-master \ -o custom-columns=NAME:.metadata.name,CAPACITY:.status.capacity.storage
The system response contains multiple outputs, one per
opensearch-masternode. Select the capacity for the affected node.
Note
Convert the values to GB if they are set in different units.
If the formula result is positive, it is an early indication that the cluster is affected.
Verify whether the
OpenSearchClusterStatusWarningorOpenSearchClusterStatusCriticalalert is firing. And if so, verify the following:Log in to the OpenSearch web UI.
In Management -> Dev Tools, run the following command:
GET _cluster/allocation/explainThe following system response indicates that the corresponding node is affected:
"explanation": "the node is above the low watermark cluster setting \ [cluster.routing.allocation.disk.watermark.low=85%], using more disk space \ than the maximum allowed [85.0%], actual free: [xx.xxx%]"
Note
The system response may contain even higher watermark percent than 85.0%, depending on the case.
Workaround:
Warning
The workaround implies adjustement of the retention threshold for OpenSearch. And depending on the new threshold, some old logs will be deleted.
Adjust or set
.values.elasticsearch.persistentVolumeUsableStorageSizeGBto a lower value for the affection check formula to be non-positive. For configuration details, see MOSK Operations Guide: StackLight configuration parameters - OpenSearch.Mirantis also recommends reserving some space for other PVCs using storage from the pool. Use the following formula to calculate the required space:
persistentVolumeUsableStorageSizeGB = 0.84 × ((1 - Reserved_Percentage - Filesystem_Reserve) × Total_Storage_Capacity_GB - Prometheus_PVC_Size_GB) / 0.8
In the formula, define the following values:
- Reserved_Percentage
A user-defined variable that specifies what percentage of the total storage capacity should not be used by OpenSearch or Prometheus. This is used to reserve space for other components. It should be expressed as a decimal. For example, for 5% of reservation,
Reserved_Percentageis 0.05. Mirantis recommends using 0.05 as a starting point.- Filesystem_Reserve
Percentage to deduct for filesystems that may reserve some portion of the available storage, which is marked as occupied. For example, for EXT4, it is 5% by default, so the value must be 0.05.
- Prometheus_PVC_Size_GB
Sourced from
.values.prometheusServer.persistentVolumeClaimSize.- Total_Storage_Capacity_GB
Total capacity of the OpenSearch PVCs. For LVP, the capacity of the storage pool. To obtain the total capacity:
kubectl get pvc -n stacklight -l app=opensearch-master \ -o custom-columns=NAME:.metadata.name,CAPACITY:.status.capacity.storage
The system response contains multiple outputs, one per
opensearch-masternode. Select the capacity for the affected node.
Note
Convert the values to GB if they are set in different units.
Calculation of above formula provides a maximum safe storage to allocate for
.values.elasticsearch.persistentVolumeUsableStorageSizeGB. Use this formula as a reference for setting.values.elasticsearch.persistentVolumeUsableStorageSizeGBon a cluster.Wait up to 15-20 mins for OpenSearch to perform the cleaning.
Verify that the cluster is not affected anymore using the procedure above.
Fixed in 2.30.0 (21.0.0 and 20.0.0)
A compact MOSK cluster fails to be deployed through the Container Cloud web UI
due to inability to add any label to the control plane machines along with
inability to change dedicatedControlPlane: false using the web UI.
To work around the issue, manually add the required labels using CLI. Once done, the cluster deployment resumes.
A newly created project does not display all available tabs in the Container
Cloud web UI and contains different access denied errors during first five
minutes after creation.
To work around the issue, refresh the browser in five minutes after the project creation.
This section lists the artifacts of components included in the Container Cloud patch release 2.28.5. For artifacts of the Cluster releases introduced in 2.28.5, see patch Cluster releases 17.3.5 and 16.3.5.
Note
The components that are newly added, updated, deprecated, or removed
as compared to the previous release version, are marked
with a corresponding superscript,
for example, lcm-ansible Updated.
Artifact |
Component |
Path |
|---|---|---|
Binaries |
ironic-python-agent.initramfs Updated |
https://binary.mirantis.com/bm/bin/ironic/ipa/ubuntu/initramfs-antelope-jammy-debug-20250108133235 |
ironic-python-agent.kernel Updated |
https://binary.mirantis.com/bm/bin/ironic/ipa/ubuntu/kernel-antelope-jammy-debug-20250108133235 |
|
provisioning_ansible |
https://binary.mirantis.com/bm/bin/ansible/provisioning_ansible-0.1.1-167-e7a55fd.tgz |
|
Helm charts Updated |
baremetal-api |
https://binary.mirantis.com/core/helm/baremetal-api-1.41.28.tgz |
baremetal-operator |
https://binary.mirantis.com/core/helm/baremetal-operator-1.41.28.tgz |
|
baremetal-provider |
https://binary.mirantis.com/core/helm/baremetal-provider-1.41.28.tgz |
|
baremetal-public-api |
https://binary.mirantis.com/core/helm/baremetal-public-api-1.41.28.tgz |
|
kaas-ipam |
||
Docker images |
ambassador Updated |
mirantis.azurecr.io/core/external/nginx:1.41.28 |
baremetal-dnsmasq |
mirantis.azurecr.io/bm/baremetal-dnsmasq:base-2-28-alpine-20241022121257 |
|
baremetal-operator |
mirantis.azurecr.io/bm/baremetal-operator:base-2-28-alpine-20241217153430 |
|
bm-collective |
mirantis.azurecr.io/bm/bm-collective:base-2-28-alpine-20241217153957 |
|
cluster-api-provider-baremetal Updated |
mirantis.azurecr.io/core/cluster-api-provider-baremetal:1.41.28 |
|
ironic |
mirantis.azurecr.io/openstack/ironic:antelope-jammy-20241128095555 |
|
ironic-inspector |
mirantis.azurecr.io/openstack/ironic-inspector:antelope-jammy-20241128095555 |
|
ironic-prometheus-exporter |
mirantis.azurecr.io/stacklight/ironic-prometheus-exporter:0.1-20240913123302 |
|
kaas-ipam |
mirantis.azurecr.io/bm/kaas-ipam:base-2-28-alpine-20241217153549 |
|
kubernetes-entrypoint |
mirantis.azurecr.io/openstack/extra/kubernetes-entrypoint:v1.0.1-34a4f54-20240910081335 |
|
mariadb |
mirantis.azurecr.io/general/mariadb:10.6.17-jammy-20240927170336 |
|
syslog-ng |
mirantis.azurecr.io/bm/syslog-ng:base-alpine-20241022120929 |
Artifact |
Component |
Path |
|---|---|---|
Bootstrap tarball Updated |
bootstrap-darwin |
https://binary.mirantis.com/core/bin/bootstrap-darwin-1.41.28.tgz |
bootstrap-linux |
https://binary.mirantis.com/core/bin/bootstrap-linux-1.41.28.tgz |
|
Helm charts Updated |
admission-controller |
https://binary.mirantis.com/core/helm/admission-controller-1.41.28.tgz |
agent-controller |
https://binary.mirantis.com/core/helm/agent-controller-1.41.28.tgz |
|
ceph-kcc-controller |
https://binary.mirantis.com/core/helm/ceph-kcc-controller-1.41.28.tgz |
|
cert-manager |
https://binary.mirantis.com/core/helm/cert-manager-1.41.28.tgz |
|
configuration-collector |
https://binary.mirantis.com/core/helm/configuration-collector-1.41.28.tgz |
|
credentials-controller Deprecated |
https://binary.mirantis.com/core/helm/credentials-controller-1.41.28.tgz |
|
event-controller |
https://binary.mirantis.com/core/helm/event-controller-1.41.28.tgz |
|
host-os-modules-controller |
https://binary.mirantis.com/core/helm/host-os-modules-controller-1.41.28.tgz |
|
iam-controller |
https://binary.mirantis.com/core/helm/iam-controller-1.41.28.tgz |
|
kaas-exporter |
https://binary.mirantis.com/core/helm/kaas-exporter-1.41.28.tgz |
|
kaas-public-api |
https://binary.mirantis.com/core/helm/kaas-public-api-1.41.28.tgz |
|
kaas-ui |
||
lcm-controller |
https://binary.mirantis.com/core/helm/lcm-controller-1.41.28.tgz |
|
license-controller |
https://binary.mirantis.com/core/helm/license-controller-1.41.28.tgz |
|
machinepool-controller |
https://binary.mirantis.com/core/helm/machinepool-controller-1.41.28.tgz |
|
mcc-cache |
||
mcc-cache-warmup |
https://binary.mirantis.com/core/helm/mcc-cache-warmup-1.41.28.tgz |
|
openstack-provider Deprecated |
https://binary.mirantis.com/core/helm/openstack-provider-1.41.28.tgz |
|
portforward-controller |
https://binary.mirantis.com/core/helm/portforward-controller-1.41.28.tgz |
|
rbac-controller |
https://binary.mirantis.com/core/helm/rbac-controller-1.41.28.tgz |
|
release-controller |
https://binary.mirantis.com/core/helm/release-controller-1.41.28.tgz |
|
scope-controller |
https://binary.mirantis.com/core/helm/scope-controller-1.41.28.tgz |
|
secret-controller |
https://binary.mirantis.com/core/helm/secret-controller-1.41.28.tgz |
|
user-controller |
https://binary.mirantis.com/core/helm/user-controller-1.41.28.tgz |
|
Docker images |
admission-controller Updated |
mirantis.azurecr.io/core/admission-controller:1.41.28 |
agent-controller Updated |
mirantis.azurecr.io/core/agent-controller:1.41.28 |
|
ceph-kcc-controller Updated |
mirantis.azurecr.io/core/ceph-kcc-controller:1.41.28 |
|
cert-manager-controller |
mirantis.azurecr.io/core/external/cert-manager-controller:v1.11.0-9 |
|
configuration-collector Updated |
mirantis.azurecr.io/core/configuration-collector:1.41.28 |
|
credentials-controller Deprecated |
mirantis.azurecr.io/core/credentials-controller:1.41.28 |
|
event-controller Updated |
mirantis.azurecr.io/core/event-controller:1.41.28 |
|
frontend Updated |
mirantis.azurecr.io/core/frontend:1.41.28 |
|
host-os-modules-controller Updated |
mirantis.azurecr.io/core/host-os-modules-controller:1.41.28 |
|
iam-controller Updated |
mirantis.azurecr.io/core/iam-controller:1.41.28 |
|
kaas-exporter Updated |
mirantis.azurecr.io/core/kaas-exporter:1.41.28 |
|
kproxy Updated |
mirantis.azurecr.io/core/kproxy:1.41.28 |
|
lcm-controller Updated |
mirantis.azurecr.io/core/lcm-controller:1.41.28 |
|
license-controller Updated |
mirantis.azurecr.io/core/license-controller:1.41.28 |
|
machinepool-controller Updated |
mirantis.azurecr.io/core/machinepool-controller:1.41.28 |
|
mcc-cache-warmup Updated |
mirantis.azurecr.io/core/mcc-cache-warmup:1.41.28 |
|
nginx Updated |
mirantis.azurecr.io/core/external/nginx:1.41.28 |
|
openstack-cluster-api-controller Deprecated |
mirantis.azurecr.io/core/openstack-cluster-api-controller:1.41.28 |
|
portforward-controller Updated |
mirantis.azurecr.io/core/portforward-controller:1.41.28 |
|
rbac-controller Updated |
mirantis.azurecr.io/core/rbac-controller:1.41.28 |
|
registry |
mirantis.azurecr.io/lcm/registry:v2.8.1-14 |
|
release-controller Updated |
mirantis.azurecr.io/core/release-controller:1.41.28 |
|
scope-controller Updated |
mirantis.azurecr.io/core/scope-controller:1.41.28 |
|
secret-controller Updated |
mirantis.azurecr.io/core/secret-controller:1.41.28 |
|
user-controller Updated |
mirantis.azurecr.io/core/user-controller:1.41.28 |
Artifact |
Component |
Path |
|---|---|---|
Binaries |
hash-generate-darwin |
http://binary.mirantis.com/iam/bin/hash-generate-0.0.1-268-3cf7f17-darwin |
hash-generate-linux |
http://binary.mirantis.com/iam/bin/hash-generate-0.0.1-268-3cf7f17-linux |
|
Helm charts Updated |
iam |
|
Docker images |
kubectl |
mirantis.azurecr.io/general/kubectl:20240926142019 |
kubernetes-entrypoint |
mirantis.azurecr.io/openstack/extra/kubernetes-entrypoint:v1.0.1-ba8ada4-20240405150338 |
|
mariadb |
mirantis.azurecr.io/general/mariadb:10.6.17-focal-20240909113408 |
|
mcc-keycloak |
mirantis.azurecr.io/iam/mcc-keycloak:25.0.6-20241114073807 |
2.28.4
The Container Cloud patch release 2.28.4, which is based on the 2.28.0 major release, provides the following updates:
Support for the patch Cluster release 16.3.4.
Support for the patch Cluster release 17.3.4 that represents MOSK patch release 24.3.1 patch.
Support for Mirantis Kubernetes Engine to 3.7.17 and Mirantis Container Runtime 23.0.15, which includes containerd 1.6.36.
Optional migration of container runtime from Docker to containerd.
Bare metal: update of Ubuntu mirror from ubuntu-2024-11-18-003900 to ubuntu-2024-12-05-003900 along with update of minor kernel version from 5.15.0-125-generic to 5.15.0-126-generic.
Security fixes for CVEs in images.
OpenStack provider: suspension of support for cluster deployment and update. For details, see Deprecation Notes.
This patch release also supports the latest major Cluster releases 17.3.0 and 16.3.0. And it does not support greenfield deployments based on deprecated Cluster releases. Use the latest available Cluster release instead.
For main deliverables of the parent Container Cloud release of 2.28.4, refer to 2.28.0.
This section describes the specific actions you as a cloud operator need to complete before or after your Container Cloud cluster update to the Cluster releases 17.3.4 or 16.3.4.
Important
For MOSK deployments, although MOSK 24.3.1 is classified as a patch release, as a cloud operator, you will be performing a major update regardless of the upgrade path: whether you are upgrading from patch 24.2.5 or major version 24.3. For details, see MOSK 24.3.1 release notes: Update notes.
Consider the information below as a supplement to the generic update procedures published in MOSK Operations Guide: Automatic upgrade of a management cluster and Update to a patch version.
Container Cloud 2.28.4 introduces an optional migration of container runtime from Docker to containerd, which is implemented for existing management and managed bare metal clusters. The use of containerd allows for better Kubernetes performance and component update without pod restart when applying fixes for CVEs. For the migration procedure, refer to MOSK Operations Guide: Migrate container runtime from Docker to containerd.
Note
Container runtime migration becomes mandatory in the scope of Container Cloud 2.29.x. Otherwise, the management cluster update to Container Cloud 2.30.0 will be blocked.
Note
In Containter Cloud 2.28.x series, the default container runtime remains Docker for greenfield deployments. Support for greenfield deployments based on containerd will be announced in one of the following releases.
Important
Container runtime migration involves machine cordoning and draining.
Note
If you have not upgraded the operating system distribution on your machines to Jammy yet, Mirantis recommends migrating machines from Docker to containerd on managed clusters together with distribution upgrade to minimize the maintenance window.
In this case, ensure that all cluster machines are updated at once during the same maintenance window to prevent machines from running different container runtimes.
In Container Cloud 2.29.0, Grafana will be updated to version 11 where the following deprecated Angular-based plugins will be automatically migrated to the React-based ones:
Graph (old) -> Time Series
Singlestat -> Stat
Stat (old) -> Stat
Table (old) -> Table
Worldmap -> Geomap
This migration may corrupt custom Grafana dashboards that have Angular-based panels. Therefore, if you have such dashboards, back them up and manually upgrade Angular-based panels during the course of Container Cloud 2.28.x (Cluster releases 17.3.x and 16.3.x) to prevent custom appearance issues after plugin migration in Container Cloud 2.29.0 (Cluster releases 17.4.0 and 16.4.0).
Note
All Grafana dashboards provided by StackLight are also migrated to React automatically. For the list of default dashboards, see MOSK Operations Guide: View Grafana dashboards.
Warning
For management clusters that are updated automatically, it is important to prepare the backup before Container Cloud 2.29.0 is released. Otherwise, custom dashboards using Angular-based plugins may be corrupted.
For managed clusters, you can perform the backup after the Container Cloud 2.29.0 release date but before updating them to the Cluster release 17.4.0.
In total, since Container Cloud 2.28.3, 158 Common Vulnerabilities and Exposures (CVE) have been fixed in 2.28.4: 10 of critical and 148 of high severity.
The table below includes the total numbers of addressed unique and common CVEs in images by product component since Container Cloud 2.28.3. The common CVEs are issues addressed across several images.
Product component |
CVE type |
Critical |
High |
Total |
|---|---|---|---|---|
Ceph |
Unique |
0 |
3 |
3 |
Common |
0 |
7 |
7 |
|
Kaas core |
Unique |
1 |
18 |
19 |
Common |
4 |
92 |
96 |
|
StackLight |
Unique |
3 |
19 |
22 |
Common |
6 |
49 |
55 |
Mirantis Security Portal
For the detailed list of fixed and existing CVEs across the Mirantis Container Cloud and MOSK products, refer to Mirantis Security Portal.
MOSK CVEs
For the number of fixed CVEs in the MOSK-related components including OpenStack and Tungsten Fabric, refer to MOSK 24.3.1: Security notes.
The following issues have been addressed in the Container Cloud patch release 2.28.4 along with the patch Cluster releases 16.3.4 and 17.3.4:
[30294] [LCM] Fixed the issue that prevented replacement of a manager machine during the
calico-nodePod start on a new node that has the same IP address as the node being replaced.[5782] [LCM] Fixed the issue that prevented deployment of a manager machine during node replacement.
[5568] [LCM] Fixed the issue that prevented cleaning of resources by the
calico-kube-controllersPod duringunsafeorforceddeletion of a manager machine.
This section lists known issues with workarounds for the Mirantis Container Cloud release 2.28.4 including the Cluster releases 16.3.4 and 17.3.4. For the known issues in the related MOSK release, see Known issues.
For other issues that can occur while deploying and operating a Container Cloud cluster, see Troubleshooting Guide.
Note
This section also outlines still valid known issues from previous Container Cloud releases.
Note
Moving forward, the workaround for this issue will be moved from Release Notes to MOSK Troubleshooting Guide: Inspection error on bare metal hosts after dnsmasq restart.
If the dnsmasq pod is restarted during the bootstrap of newly added
nodes, those nodes may fail to undergo inspection. That can result in
inspection error in the corresponding BareMetalHost objects.
The issue can occur when:
The
dnsmasqpod was moved to another node.DHCP subnets were changed, including addition or removal. In this case, the
dhcpdcontainer of thednsmasqpod is restarted.Caution
If changing or adding of DHCP subnets is required to bootstrap new nodes, wait after changing or adding DHCP subnets until the
dnsmasqpod becomes ready, then createBareMetalHostobjects.
To verify whether the nodes are affected:
Verify whether the
BareMetalHostobjects contain theinspection error:kubectl get bmh -n <managed-cluster-namespace-name>
Example of system response:
NAME STATE CONSUMER ONLINE ERROR AGE test-master-1 provisioned test-master-1 true 9d test-master-2 provisioned test-master-2 true 9d test-master-3 provisioned test-master-3 true 9d test-worker-1 provisioned test-worker-1 true 9d test-worker-2 provisioned test-worker-2 true 9d test-worker-3 inspecting true inspection error 19h
Verify whether the
dnsmasqpod was inReadystate when the inspection of the affected baremetal hosts (test-worker-3in the example above) was started:kubectl -n kaas get pod <dnsmasq-pod-name> -oyaml
Example of system response:
... status: conditions: - lastProbeTime: null lastTransitionTime: "2024-10-10T15:37:34Z" status: "True" type: Initialized - lastProbeTime: null lastTransitionTime: "2024-10-11T07:38:54Z" status: "True" type: Ready - lastProbeTime: null lastTransitionTime: "2024-10-11T07:38:54Z" status: "True" type: ContainersReady - lastProbeTime: null lastTransitionTime: "2024-10-10T15:37:34Z" status: "True" type: PodScheduled containerStatuses: - containerID: containerd://6dbcf2fc4b36ce4c549c9191ab01f72d0236c51d42947675302675e4bfaf4cdf image: docker-dev-kaas-virtual.artifactory-eu.mcp.mirantis.net/bm/baremetal-dnsmasq:base-2-28-alpine-20240812132650 imageID: docker-dev-kaas-virtual.artifactory-eu.mcp.mirantis.net/bm/baremetal-dnsmasq@sha256:3dad3e278add18e69b2608e462691c4823942641a0f0e25e6811e703e3c23b3b lastState: terminated: containerID: containerd://816fcf079cd544acd74e312065de5b5ed4dbf1dc6159fefffff4f644b5e45987 exitCode: 0 finishedAt: "2024-10-11T07:38:35Z" reason: Completed startedAt: "2024-10-10T15:37:45Z" name: dhcpd ready: true restartCount: 2 started: true state: running: startedAt: "2024-10-11T07:38:37Z" ...
In the system response above, the
dhcpdcontainer was not ready between"2024-10-11T07:38:35Z"and"2024-10-11T07:38:54Z".Verify the affected baremetal host. For example:
kubectl get bmh -n managed-ns test-worker-3 -oyaml
Example of system response:
... status: errorCount: 15 errorMessage: Introspection timeout errorType: inspection error ... operationHistory: deprovision: end: null start: null inspect: end: null start: "2024-10-11T07:38:19Z" provision: end: null start: null register: end: "2024-10-11T07:38:19Z" start: "2024-10-11T07:37:25Z"
In the system response above, inspection was started at
"2024-10-11T07:38:19Z", immediately before the period of thedhcpdcontainer downtime. Therefore, this node is most likely affected by the issue.
Workaround
Reboot the node using the IPMI reset or cycle command.
If the node fails to boot, remove the failed
BareMetalHostobject and create it again:Remove
BareMetalHostobject. For example:kubectl delete bmh -n managed-ns test-worker-3
Verify that the
BareMetalHostobject is removed:kubectl get bmh -n managed-ns test-worker-3
Create a
BareMetalHostobject from the template. For example:kubectl create -f bmhc-test-worker-3.yaml kubectl create -f bmh-test-worker-3.yaml
Due to the MetalLB upstream issue, a load balancer service may not obtain the external IP address.
The issue occurs when two services share the same external IP address and have
the same externalTrafficPolicy value. Initially, the services have the
external IP address assigned and are accessible. After modifying the
externalTrafficPolicy value for both services from Cluster to
Local, the first service that has been changed remains with no external IP
address assigned. Though, the second service, which was changed later, has the
external IP assigned as expected.
To work around the issue, make a dummy change to the service object where
external IP is <pending>:
Identify the service that is stuck:
kubectl get svc -A | grep pending
Example of system response:
stacklight iam-proxy-prometheus LoadBalancer 10.233.28.196 <pending> 443:30430/TCP
Add an arbitrary label to the service that is stuck. For example:
kubectl label svc -n stacklight iam-proxy-prometheus reconcile=1
Example of system response:
service/iam-proxy-prometheus labeledVerify that the external IP was allocated to the service:
kubectl get svc -n stacklight iam-proxy-prometheus
Example of system response:
NAME TYPE CLUSTER-IP EXTERNAL-IP PORT(S) AGE iam-proxy-prometheus LoadBalancer 10.233.28.196 10.0.34.108 443:30430/TCP 12d
During deletion of a manager machine running the ironic Pod from a bare
metal management cluster, the following problems occur:
All Pods are stuck in the
TerminatingstateA new
ironicPod fails to startThe related bare metal host is stuck in the
deprovisioningstate
As a workaround, before deletion of the node running the ironic Pod,
cordon and drain the node using the kubectl cordon <nodeName> and
kubectl drain <nodeName> commands.
Fixed in 2.29.3 (17.3.8, 16.3.8, and 16.4.3)
Due to the upstream Ceph issue
66717,
during CVE upgrade of the Ceph daemon image of Ceph Reef 18.2.4, OSDs may start
slow and even fail the starting probe with the following describe output in
the rook-ceph-osd-X pod:
Warning Unhealthy 57s (x16 over 3m27s) kubelet Startup probe failed:
ceph daemon health check failed with the following output:
> no valid command found; 10 closest matches:
> 0
> 1
> 2
> abort
> assert
> bluefs debug_inject_read_zeros
> bluefs files list
> bluefs stats
> bluestore bluefs device info [<alloc_size:int>]
> config diff
> admin_socket: invalid command
Workaround:
Complete the following steps during every patch or major cluster update of the Cluster releases 17.2.x, 17.3.x, and 17.4.x (until Ceph 18.2.5 becomes supported):
Plan extra time in the maintenance window for the patch cluster update.
Slow starts will still impact the update procedure, but after completing the following step, the recovery process noticeably shortens without affecting the overall cluster state and data responsiveness.
Select one of the following options:
Before the cluster update, set the
nooutflag:ceph osd set noout
Once the Ceph OSDs image upgrade is done, unset the flag:
ceph osd unset noout
Monitor the Ceph OSDs image upgrade. If the symptoms of slow start appear, set the
nooutflag as soon as possible. Once the Ceph OSDs image upgrade is done, unset the flag.
Note
The issue does not reproduce since MOSK 25.2.
Update of a managed cluster based on bare metal and Ceph enabled fails with
PersistentVolumeClaim getting stuck in the Pending state for the
prometheus-server StatefulSet and the
MountVolume.MountDevice failed for volume warning in the StackLight event
logs.
Workaround:
Verify that the description of the Pods that failed to run contain the
FailedMountevents:kubectl -n <affectedProjectName> describe pod <affectedPodName>
In the command above, replace the following values:
<affectedProjectName>is the Container Cloud project name where the Pods failed to run<affectedPodName>is a Pod name that failed to run in the specified project
In the Pod description, identify the node name where the Pod failed to run.
Verify that the
csi-rbdpluginlogs of the affected node contain therbd volume mount failed: <csi-vol-uuid> is being usederror. The<csi-vol-uuid>is a unique RBD volume name.Identify
csiPodNameof the correspondingcsi-rbdplugin:kubectl -n rook-ceph get pod -l app=csi-rbdplugin \ -o jsonpath='{.items[?(@.spec.nodeName == "<nodeName>")].metadata.name}'
Output the affected
csiPodNamelogs:kubectl -n rook-ceph logs <csiPodName> -c csi-rbdplugin
Scale down the affected
StatefulSetorDeploymentof the Pod that fails to0replicas.On every
csi-rbdpluginPod, search for stuckcsi-vol:for pod in `kubectl -n rook-ceph get pods|grep rbdplugin|grep -v provisioner|awk '{print $1}'`; do echo $pod kubectl exec -it -n rook-ceph $pod -c csi-rbdplugin -- rbd device list | grep <csi-vol-uuid> done
Unmap the affected
csi-vol:rbd unmap -o force /dev/rbd<i>
The
/dev/rbd<i>value is a mapped RBD volume that usescsi-vol.Delete
volumeattachmentof the affected Pod:kubectl get volumeattachments | grep <csi-vol-uuid> kubectl delete volumeattacmhent <id>
Scale up the affected
StatefulSetorDeploymentback to the original number of replicas and wait until its state becomesRunning.
Fixed in 2.29.0 (17.4.0 and 16.4.0)
During the replacement of a master node on a cluster of any type, the process
may get stuck with Kubelet's NodeReady condition is Unknown in the
machine status on the remaining master nodes.
As a workaround, log in on the affected node and run the following command:
docker restart ucp-kubelet
During MariaDB operations on a management cluster, Pods may get stuck in continuous restarts with the following example error:
[ERROR] WSREP: Corrupt buffer header: \
addr: 0x7faec6f8e518, \
seqno: 3185219421952815104, \
size: 909455917, \
ctx: 0x557094f65038, \
flags: 11577. store: 49, \
type: 49
Workaround:
Create a backup of the
/var/lib/mysqldirectory on themariadb-serverPod.Verify that other replicas are up and ready.
Remove the
galera.cachefile for the affectedmariadb-serverPod.Remove the affected
mariadb-serverPod or wait until it is automatically restarted.
After Kubernetes restarts the Pod, the Pod clones the database in 1-2 minutes and restores the quorum.
Fixed in 2.29.0 (17.4.0 and 16.4.0)
On High Availability (HA) clusters that use Local Volume Provisioner (LVP), Prometheus and OpenSearch from StackLight may share the same pool of storage. In such configuration, OpenSearch may approach the 85% disk usage watermark due to the combined storage allocation and usage patterns set by the Persistent Volume Claim (PVC) size parameters for Prometheus and OpenSearch, which consume storage the most.
When the 85% threshold is reached, the affected node is transitioned to the
read-only state, preventing shard allocation and causing the OpenSearch cluster
state to transition to Warning (Yellow) or Critical (Red).
Caution
The issue and the provided workaround apply only for clusters on which OpenSearch and Prometheus utilize the same storage pool.
To verify that the cluster is affected:
Verify the result of the following formula:
0.8 × OpenSearch_PVC_Size_GB + Prometheus_PVC_Size_GB > 0.85 × Total_Storage_Capacity_GBIn the formula, define the following values:
- OpenSearch_PVC_Size_GB
Derived from
.values.elasticsearch.persistentVolumeUsableStorageSizeGB, defaulting to.values.elasticsearch.persistentVolumeClaimSizeif unspecified. To obtain the OpenSearch PVC size:kubectl -n <namespaceName> get cluster <clusterName> -o yaml |\ yq '.spec.providerSpec.value.helmReleases[] | select(.name == "stacklight") | .values.elasticsearch.persistentVolumeClaimSize '
Example of system response:
10000Gi
- Prometheus_PVC_Size_GB
Sourced from
.values.prometheusServer.persistentVolumeClaimSize. To obtain the Prometheus PVC size:kubectl -n <namespaceName> get cluster <clusterName> -o yaml |\ yq '.spec.providerSpec.value.helmReleases[] | select(.name == "stacklight") | .values.prometheusServer.persistentVolumeClaimSize '
Example of system response:
4000Gi
- Total_Storage_Capacity_GB
Total capacity of the OpenSearch PVCs. For LVP, the capacity of the storage pool. To obtain the total capacity:
kubectl get pvc -n stacklight -l app=opensearch-master \ -o custom-columns=NAME:.metadata.name,CAPACITY:.status.capacity.storage
The system response contains multiple outputs, one per
opensearch-masternode. Select the capacity for the affected node.
Note
Convert the values to GB if they are set in different units.
If the formula result is positive, it is an early indication that the cluster is affected.
Verify whether the
OpenSearchClusterStatusWarningorOpenSearchClusterStatusCriticalalert is firing. And if so, verify the following:Log in to the OpenSearch web UI.
In Management -> Dev Tools, run the following command:
GET _cluster/allocation/explainThe following system response indicates that the corresponding node is affected:
"explanation": "the node is above the low watermark cluster setting \ [cluster.routing.allocation.disk.watermark.low=85%], using more disk space \ than the maximum allowed [85.0%], actual free: [xx.xxx%]"
Note
The system response may contain even higher watermark percent than 85.0%, depending on the case.
Workaround:
Warning
The workaround implies adjustement of the retention threshold for OpenSearch. And depending on the new threshold, some old logs will be deleted.
Adjust or set
.values.elasticsearch.persistentVolumeUsableStorageSizeGBto a lower value for the affection check formula to be non-positive. For configuration details, see MOSK Operations Guide: StackLight configuration parameters - OpenSearch.Mirantis also recommends reserving some space for other PVCs using storage from the pool. Use the following formula to calculate the required space:
persistentVolumeUsableStorageSizeGB = 0.84 × ((1 - Reserved_Percentage - Filesystem_Reserve) × Total_Storage_Capacity_GB - Prometheus_PVC_Size_GB) / 0.8
In the formula, define the following values:
- Reserved_Percentage
A user-defined variable that specifies what percentage of the total storage capacity should not be used by OpenSearch or Prometheus. This is used to reserve space for other components. It should be expressed as a decimal. For example, for 5% of reservation,
Reserved_Percentageis 0.05. Mirantis recommends using 0.05 as a starting point.- Filesystem_Reserve
Percentage to deduct for filesystems that may reserve some portion of the available storage, which is marked as occupied. For example, for EXT4, it is 5% by default, so the value must be 0.05.
- Prometheus_PVC_Size_GB
Sourced from
.values.prometheusServer.persistentVolumeClaimSize.- Total_Storage_Capacity_GB
Total capacity of the OpenSearch PVCs. For LVP, the capacity of the storage pool. To obtain the total capacity:
kubectl get pvc -n stacklight -l app=opensearch-master \ -o custom-columns=NAME:.metadata.name,CAPACITY:.status.capacity.storage
The system response contains multiple outputs, one per
opensearch-masternode. Select the capacity for the affected node.
Note
Convert the values to GB if they are set in different units.
Calculation of above formula provides a maximum safe storage to allocate for
.values.elasticsearch.persistentVolumeUsableStorageSizeGB. Use this formula as a reference for setting.values.elasticsearch.persistentVolumeUsableStorageSizeGBon a cluster.Wait up to 15-20 mins for OpenSearch to perform the cleaning.
Verify that the cluster is not affected anymore using the procedure above.
Fixed in 2.30.0 (21.0.0 and 20.0.0)
A compact MOSK cluster fails to be deployed through the Container Cloud web UI
due to inability to add any label to the control plane machines along with
inability to change dedicatedControlPlane: false using the web UI.
To work around the issue, manually add the required labels using CLI. Once done, the cluster deployment resumes.
A newly created project does not display all available tabs in the Container
Cloud web UI and contains different access denied errors during first five
minutes after creation.
To work around the issue, refresh the browser in five minutes after the project creation.
This section lists the artifacts of components included in the Container Cloud patch release 2.28.4. For artifacts of the Cluster releases introduced in 2.28.4, see patch Cluster releases 17.3.4 and 16.3.4.
Note
The components that are newly added, updated, deprecated, or removed
as compared to the previous release version, are marked
with a corresponding superscript,
for example, lcm-ansible Updated.
Artifact |
Component |
Path |
|---|---|---|
Binaries |
ironic-python-agent.initramfs Updated |
https://binary.mirantis.com/bm/bin/ironic/ipa/ubuntu/initramfs-antelope-jammy-debug-20241205172311 |
ironic-python-agent.kernel Updated |
https://binary.mirantis.com/bm/bin/ironic/ipa/ubuntu/kernel-antelope-jammy-debug-20241205172311 |
|
provisioning_ansible |
https://binary.mirantis.com/bm/bin/ansible/provisioning_ansible-0.1.1-167-e7a55fd.tgz |
|
Helm charts Updated |
baremetal-api |
https://binary.mirantis.com/core/helm/baremetal-api-1.41.26.tgz |
baremetal-operator |
https://binary.mirantis.com/core/helm/baremetal-operator-1.41.26.tgz |
|
baremetal-provider |
https://binary.mirantis.com/core/helm/baremetal-provider-1.41.26.tgz |
|
baremetal-public-api |
https://binary.mirantis.com/core/helm/baremetal-public-api-1.41.26.tgz |
|
kaas-ipam |
||
Docker images |
ambassador Updated |
mirantis.azurecr.io/core/external/nginx:1.41.26 |
baremetal-dnsmasq |
mirantis.azurecr.io/bm/baremetal-dnsmasq:base-2-28-alpine-20241022121257 |
|
baremetal-operator Updated |
mirantis.azurecr.io/bm/baremetal-operator:base-2-28-alpine-20241217153430 |
|
bm-collective Updated |
mirantis.azurecr.io/bm/bm-collective:base-2-28-alpine-20241217153957 |
|
cluster-api-provider-baremetal Updated |
mirantis.azurecr.io/core/cluster-api-provider-baremetal:1.41.26 |
|
ironic |
mirantis.azurecr.io/openstack/ironic:antelope-jammy-20241128095555 |
|
ironic-inspector |
mirantis.azurecr.io/openstack/ironic-inspector:antelope-jammy-20241128095555 |
|
ironic-prometheus-exporter |
mirantis.azurecr.io/stacklight/ironic-prometheus-exporter:0.1-20240913123302 |
|
kaas-ipam Updated |
mirantis.azurecr.io/bm/kaas-ipam:base-2-28-alpine-20241217153549 |
|
kubernetes-entrypoint |
mirantis.azurecr.io/openstack/extra/kubernetes-entrypoint:v1.0.1-34a4f54-20240910081335 |
|
mariadb |
mirantis.azurecr.io/general/mariadb:10.6.17-jammy-20240927170336 |
|
syslog-ng |
mirantis.azurecr.io/bm/syslog-ng:base-alpine-20241022120929 |
Artifact |
Component |
Path |
|---|---|---|
Bootstrap tarball Updated |
bootstrap-darwin |
https://binary.mirantis.com/core/bin/bootstrap-darwin-1.41.26.tgz |
bootstrap-linux |
https://binary.mirantis.com/core/bin/bootstrap-linux-1.41.26.tgz |
|
Helm charts Updated |
admission-controller |
https://binary.mirantis.com/core/helm/admission-controller-1.41.26.tgz |
agent-controller |
https://binary.mirantis.com/core/helm/agent-controller-1.41.26.tgz |
|
ceph-kcc-controller |
https://binary.mirantis.com/core/helm/ceph-kcc-controller-1.41.26.tgz |
|
cert-manager |
https://binary.mirantis.com/core/helm/cert-manager-1.41.26.tgz |
|
configuration-collector |
https://binary.mirantis.com/core/helm/configuration-collector-1.41.26.tgz |
|
credentials-controller |
https://binary.mirantis.com/core/helm/credentials-controller-1.41.26.tgz |
|
event-controller |
https://binary.mirantis.com/core/helm/event-controller-1.41.26.tgz |
|
host-os-modules-controller |
https://binary.mirantis.com/core/helm/host-os-modules-controller-1.41.26.tgz |
|
iam-controller |
https://binary.mirantis.com/core/helm/iam-controller-1.41.26.tgz |
|
kaas-exporter |
https://binary.mirantis.com/core/helm/kaas-exporter-1.41.26.tgz |
|
kaas-public-api |
https://binary.mirantis.com/core/helm/kaas-public-api-1.41.26.tgz |
|
kaas-ui |
||
lcm-controller |
https://binary.mirantis.com/core/helm/lcm-controller-1.41.26.tgz |
|
license-controller |
https://binary.mirantis.com/core/helm/license-controller-1.41.26.tgz |
|
machinepool-controller |
https://binary.mirantis.com/core/helm/machinepool-controller-1.41.26.tgz |
|
mcc-cache |
||
mcc-cache-warmup |
https://binary.mirantis.com/core/helm/mcc-cache-warmup-1.41.26.tgz |
|
openstack-provider Deprecated |
https://binary.mirantis.com/core/helm/openstack-provider-1.41.26.tgz |
|
portforward-controller |
https://binary.mirantis.com/core/helm/portforward-controller-1.41.26.tgz |
|
rbac-controller |
https://binary.mirantis.com/core/helm/rbac-controller-1.41.26.tgz |
|
release-controller |
https://binary.mirantis.com/core/helm/release-controller-1.41.26.tgz |
|
scope-controller |
https://binary.mirantis.com/core/helm/scope-controller-1.41.26.tgz |
|
secret-controller |
https://binary.mirantis.com/core/helm/secret-controller-1.41.26.tgz |
|
squid-proxy |
https://binary.mirantis.com/core/helm/squid-proxy-1.41.26.tgz |
|
user-controller |
https://binary.mirantis.com/core/helm/user-controller-1.41.26.tgz |
|
Docker images |
admission-controller Updated |
mirantis.azurecr.io/core/admission-controller:1.41.26 |
agent-controller Updated |
mirantis.azurecr.io/core/agent-controller:1.41.26 |
|
ceph-kcc-controller Updated |
mirantis.azurecr.io/core/ceph-kcc-controller:1.41.26 |
|
cert-manager-controller Updated |
mirantis.azurecr.io/core/external/cert-manager-controller:v1.11.0-9 |
|
configuration-collector Updated |
mirantis.azurecr.io/core/configuration-collector:1.41.26 |
|
credentials-controller Updated |
mirantis.azurecr.io/core/credentials-controller:1.41.26 |
|
event-controller Updated |
mirantis.azurecr.io/core/event-controller:1.41.26 |
|
frontend Updated |
mirantis.azurecr.io/core/frontend:1.41.26 |
|
host-os-modules-controller Updated |
mirantis.azurecr.io/core/host-os-modules-controller:1.41.26 |
|
iam-controller Updated |
mirantis.azurecr.io/core/iam-controller:1.41.26 |
|
kaas-exporter Updated |
mirantis.azurecr.io/core/kaas-exporter:1.41.26 |
|
kproxy Updated |
mirantis.azurecr.io/core/kproxy:1.41.26 |
|
lcm-controller Updated |
mirantis.azurecr.io/core/lcm-controller:1.41.26 |
|
license-controller Updated |
mirantis.azurecr.io/core/license-controller:1.41.26 |
|
machinepool-controller Updated |
mirantis.azurecr.io/core/machinepool-controller:1.41.26 |
|
mcc-cache-warmup Updated |
mirantis.azurecr.io/core/mcc-cache-warmup:1.41.26 |
|
nginx Updated |
mirantis.azurecr.io/core/external/nginx:1.41.26 |
|
openstack-cluster-api-controller Deprecated |
mirantis.azurecr.io/core/openstack-cluster-api-controller:1.41.26 |
|
portforward-controller Updated |
mirantis.azurecr.io/core/portforward-controller:1.41.26 |
|
rbac-controller Updated |
mirantis.azurecr.io/core/rbac-controller:1.41.26 |
|
registry |
mirantis.azurecr.io/lcm/registry:v2.8.1-14 |
|
release-controller Updated |
mirantis.azurecr.io/core/release-controller:1.41.26 |
|
scope-controller Updated |
mirantis.azurecr.io/core/scope-controller:1.41.26 |
|
secret-controller Updated |
mirantis.azurecr.io/core/secret-controller:1.41.26 |
|
user-controller Updated |
mirantis.azurecr.io/core/user-controller:1.41.26 |
Artifact |
Component |
Path |
|---|---|---|
Binaries |
hash-generate-darwin |
http://binary.mirantis.com/iam/bin/hash-generate-0.0.1-268-3cf7f17-darwin |
hash-generate-linux |
http://binary.mirantis.com/iam/bin/hash-generate-0.0.1-268-3cf7f17-linux |
|
Helm charts Updated |
iam |
|
Docker images |
kubectl |
mirantis.azurecr.io/general/kubectl:20240926142019 |
kubernetes-entrypoint |
mirantis.azurecr.io/openstack/extra/kubernetes-entrypoint:v1.0.1-ba8ada4-20240405150338 |
|
mariadb |
mirantis.azurecr.io/general/mariadb:10.6.17-focal-20240909113408 |
|
mcc-keycloak |
mirantis.azurecr.io/iam/mcc-keycloak:25.0.6-20241114073807 |
Releases delivered in 2024
This section contains historical information on the unsupported Container Cloud releases delivered in 2024. For the latest supported Container Cloud release, see Container Cloud releases.
Version |
Release date |
Summary |
|---|---|---|
Dec 09, 2024 |
Container Cloud 2.28.3 is the third patch release of the 2.28.x release series that introduces the following updates:
|
|
Nov 18, 2024 |
Container Cloud 2.28.2 is the second patch release of the 2.28.x release series that introduces the following updates:
|
|
Oct 30, 2024 |
Container Cloud 2.28.1 is the first patch release of the 2.28.x release series that introduces the following updates:
|
|
Oct 16, 2024 |
|
|
Sep 16, 2024 |
Container Cloud 2.27.4 is the fourth patch release of the 2.27.x release series that introduces the following updates:
|
|
Aug 27, 2024 |
Container Cloud 2.27.3 is the third patch release of the 2.27.x release series that introduces the following updates:
|
|
Aug 05, 2024 |
Container Cloud 2.27.2 is the second patch release of the 2.27.x release series that introduces the following updates:
|
|
Jul 16, 2024 |
Container Cloud 2.27.1 is the first patch release of the 2.27.x release series that introduces the following updates:
|
|
Jul 02, 2024 |
|
|
June 18, 2024 |
Container Cloud 2.26.5 is the fifth patch release of the 2.26.x and MOSK 24.1.x release series that introduces the following updates:
|
|
May 20, 2024 |
Container Cloud 2.26.4 is the fourth patch release of the 2.26.x and MOSK 24.1.x release series that introduces the following updates:
|
|
Apr 29, 2024 |
Container Cloud 2.26.3 is the third patch release of the 2.26.x and MOSK 24.1.x release series that introduces the following updates:
|
|
Apr 08, 2024 |
Container Cloud 2.26.2 is the second patch release of the 2.26.x and MOSK 24.1.x release series that introduces the following updates:
|
|
Mar 20, 2024 |
Container Cloud 2.26.1 is the first patch release of the 2.26.x and MOSK 24.1.x release series that introduces the following updates:
|
|
Mar 04, 2024 |
|
|
Jan 10, 2024 |
Container Cloud 2.25.4 is the fourth patch release of the 2.25.x and MOSK 23.3.x release series that introduces the following updates:
|
Important
For MOSK clusters, Container Cloud 2.28.3 is the continuation for MOSK 24.2.x series using the patch Cluster release 17.2.7. For the update path of 24.1, 24.2, and 24.3 series, see MOSK documentation: Release Compatibility Matrix - Managed cluster update schema.
The management cluster of a MOSK 24.2.x cluster is automatically updated to the latest patch Cluster release 16.3.3.
The Container Cloud patch release 2.28.3, which is based on the 2.28.0 major release, provides the following updates:
Support for the patch Cluster release 16.3.3.
Support for the patch Cluster releases 16.2.7 and 17.2.7 that represents Mirantis OpenStack for Kubernetes (MOSK) patch release 24.2.5 patch.
Bare metal: update of Ubuntu mirror from ubuntu-2024-10-28-012906 to ubuntu-2024-11-18-003900 along with update of minor kernel version from 5.15.0-124-generic to 5.15.0-125-generic.
Security fixes for CVEs in images.
This patch release also supports the latest major Cluster releases 17.3.0 and 16.3.0. And it does not support greenfield deployments based on deprecated Cluster releases. Use the latest available Cluster release instead.
For main deliverables of the parent Container Cloud release of 2.28.3, refer to 2.28.0.
In total, since Container Cloud 2.28.2, 66 Common Vulnerabilities and Exposures (CVE) have been fixed in 2.28.3: 4 of critical and 62 of high severity.
The table below includes the total numbers of addressed unique and common CVEs in images by product component since Container Cloud 2.28.2. The common CVEs are issues addressed across several images.
Product component |
CVE type |
Critical |
High |
Total |
|---|---|---|---|---|
Ceph |
Unique |
0 |
1 |
1 |
Common |
0 |
3 |
3 |
|
Kaas core |
Unique |
0 |
4 |
4 |
Common |
0 |
7 |
7 |
|
StackLight |
Unique |
4 |
21 |
25 |
Common |
4 |
52 |
56 |
Mirantis Security Portal
For the detailed list of fixed and existing CVEs across the Mirantis Container Cloud and MOSK products, refer to Mirantis Security Portal.
MOSK CVEs
For the number of fixed CVEs in the MOSK-related components including OpenStack and Tungsten Fabric, refer to MOSK 24.2.5: Security notes.
The following issues have been addressed in the Container Cloud patch release 2.28.3 along with the patch Cluster releases 16.3.3, 16.2.7, and 17.2.7:
[47594] [StackLight] Fixed the issue with Patroni pods getting stuck in the
CrashLoopBackOffstate due to thepatronicontainer being terminated withreason: OOMKilled.[47929] [LCM] Fixed the issue with incorrect restrictive permissions set for registry certificate files in
/etc/docker/certs.d, which were set to644instead of444.
This section lists known issues with workarounds for the Mirantis Container Cloud release 2.28.3 including the Cluster releases 16.2.7, 16.3.3, and 17.2.7.
For other issues that can occur while deploying and operating a Container Cloud cluster, see Troubleshooting Guide.
Note
This section also outlines still valid known issues from previous Container Cloud releases.
Note
Moving forward, the workaround for this issue will be moved from Release Notes to MOSK Troubleshooting Guide: Inspection error on bare metal hosts after dnsmasq restart.
If the dnsmasq pod is restarted during the bootstrap of newly added
nodes, those nodes may fail to undergo inspection. That can result in
inspection error in the corresponding BareMetalHost objects.
The issue can occur when:
The
dnsmasqpod was moved to another node.DHCP subnets were changed, including addition or removal. In this case, the
dhcpdcontainer of thednsmasqpod is restarted.Caution
If changing or adding of DHCP subnets is required to bootstrap new nodes, wait after changing or adding DHCP subnets until the
dnsmasqpod becomes ready, then createBareMetalHostobjects.
To verify whether the nodes are affected:
Verify whether the
BareMetalHostobjects contain theinspection error:kubectl get bmh -n <managed-cluster-namespace-name>
Example of system response:
NAME STATE CONSUMER ONLINE ERROR AGE test-master-1 provisioned test-master-1 true 9d test-master-2 provisioned test-master-2 true 9d test-master-3 provisioned test-master-3 true 9d test-worker-1 provisioned test-worker-1 true 9d test-worker-2 provisioned test-worker-2 true 9d test-worker-3 inspecting true inspection error 19h
Verify whether the
dnsmasqpod was inReadystate when the inspection of the affected baremetal hosts (test-worker-3in the example above) was started:kubectl -n kaas get pod <dnsmasq-pod-name> -oyaml
Example of system response:
... status: conditions: - lastProbeTime: null lastTransitionTime: "2024-10-10T15:37:34Z" status: "True" type: Initialized - lastProbeTime: null lastTransitionTime: "2024-10-11T07:38:54Z" status: "True" type: Ready - lastProbeTime: null lastTransitionTime: "2024-10-11T07:38:54Z" status: "True" type: ContainersReady - lastProbeTime: null lastTransitionTime: "2024-10-10T15:37:34Z" status: "True" type: PodScheduled containerStatuses: - containerID: containerd://6dbcf2fc4b36ce4c549c9191ab01f72d0236c51d42947675302675e4bfaf4cdf image: docker-dev-kaas-virtual.artifactory-eu.mcp.mirantis.net/bm/baremetal-dnsmasq:base-2-28-alpine-20240812132650 imageID: docker-dev-kaas-virtual.artifactory-eu.mcp.mirantis.net/bm/baremetal-dnsmasq@sha256:3dad3e278add18e69b2608e462691c4823942641a0f0e25e6811e703e3c23b3b lastState: terminated: containerID: containerd://816fcf079cd544acd74e312065de5b5ed4dbf1dc6159fefffff4f644b5e45987 exitCode: 0 finishedAt: "2024-10-11T07:38:35Z" reason: Completed startedAt: "2024-10-10T15:37:45Z" name: dhcpd ready: true restartCount: 2 started: true state: running: startedAt: "2024-10-11T07:38:37Z" ...
In the system response above, the
dhcpdcontainer was not ready between"2024-10-11T07:38:35Z"and"2024-10-11T07:38:54Z".Verify the affected baremetal host. For example:
kubectl get bmh -n managed-ns test-worker-3 -oyaml
Example of system response:
... status: errorCount: 15 errorMessage: Introspection timeout errorType: inspection error ... operationHistory: deprovision: end: null start: null inspect: end: null start: "2024-10-11T07:38:19Z" provision: end: null start: null register: end: "2024-10-11T07:38:19Z" start: "2024-10-11T07:37:25Z"
In the system response above, inspection was started at
"2024-10-11T07:38:19Z", immediately before the period of thedhcpdcontainer downtime. Therefore, this node is most likely affected by the issue.
Workaround
Reboot the node using the IPMI reset or cycle command.
If the node fails to boot, remove the failed
BareMetalHostobject and create it again:Remove
BareMetalHostobject. For example:kubectl delete bmh -n managed-ns test-worker-3
Verify that the
BareMetalHostobject is removed:kubectl get bmh -n managed-ns test-worker-3
Create a
BareMetalHostobject from the template. For example:kubectl create -f bmhc-test-worker-3.yaml kubectl create -f bmh-test-worker-3.yaml
Due to the MetalLB upstream issue, a load balancer service may not obtain the external IP address.
The issue occurs when two services share the same external IP address and have
the same externalTrafficPolicy value. Initially, the services have the
external IP address assigned and are accessible. After modifying the
externalTrafficPolicy value for both services from Cluster to
Local, the first service that has been changed remains with no external IP
address assigned. Though, the second service, which was changed later, has the
external IP assigned as expected.
To work around the issue, make a dummy change to the service object where
external IP is <pending>:
Identify the service that is stuck:
kubectl get svc -A | grep pending
Example of system response:
stacklight iam-proxy-prometheus LoadBalancer 10.233.28.196 <pending> 443:30430/TCP
Add an arbitrary label to the service that is stuck. For example:
kubectl label svc -n stacklight iam-proxy-prometheus reconcile=1
Example of system response:
service/iam-proxy-prometheus labeledVerify that the external IP was allocated to the service:
kubectl get svc -n stacklight iam-proxy-prometheus
Example of system response:
NAME TYPE CLUSTER-IP EXTERNAL-IP PORT(S) AGE iam-proxy-prometheus LoadBalancer 10.233.28.196 10.0.34.108 443:30430/TCP 12d
During deletion of a manager machine running the ironic Pod from a bare
metal management cluster, the following problems occur:
All Pods are stuck in the
TerminatingstateA new
ironicPod fails to startThe related bare metal host is stuck in the
deprovisioningstate
As a workaround, before deletion of the node running the ironic Pod,
cordon and drain the node using the kubectl cordon <nodeName> and
kubectl drain <nodeName> commands.
Fixed in 2.29.3 (17.3.8, 16.3.8, and 16.4.3)
Due to the upstream Ceph issue
66717,
during CVE upgrade of the Ceph daemon image of Ceph Reef 18.2.4, OSDs may start
slow and even fail the starting probe with the following describe output in
the rook-ceph-osd-X pod:
Warning Unhealthy 57s (x16 over 3m27s) kubelet Startup probe failed:
ceph daemon health check failed with the following output:
> no valid command found; 10 closest matches:
> 0
> 1
> 2
> abort
> assert
> bluefs debug_inject_read_zeros
> bluefs files list
> bluefs stats
> bluestore bluefs device info [<alloc_size:int>]
> config diff
> admin_socket: invalid command
Workaround:
Complete the following steps during every patch or major cluster update of the Cluster releases 17.2.x, 17.3.x, and 17.4.x (until Ceph 18.2.5 becomes supported):
Plan extra time in the maintenance window for the patch cluster update.
Slow starts will still impact the update procedure, but after completing the following step, the recovery process noticeably shortens without affecting the overall cluster state and data responsiveness.
Select one of the following options:
Before the cluster update, set the
nooutflag:ceph osd set noout
Once the Ceph OSDs image upgrade is done, unset the flag:
ceph osd unset noout
Monitor the Ceph OSDs image upgrade. If the symptoms of slow start appear, set the
nooutflag as soon as possible. Once the Ceph OSDs image upgrade is done, unset the flag.
Note
The issue does not reproduce since MOSK 25.2.
Update of a managed cluster based on bare metal and Ceph enabled fails with
PersistentVolumeClaim getting stuck in the Pending state for the
prometheus-server StatefulSet and the
MountVolume.MountDevice failed for volume warning in the StackLight event
logs.
Workaround:
Verify that the description of the Pods that failed to run contain the
FailedMountevents:kubectl -n <affectedProjectName> describe pod <affectedPodName>
In the command above, replace the following values:
<affectedProjectName>is the Container Cloud project name where the Pods failed to run<affectedPodName>is a Pod name that failed to run in the specified project
In the Pod description, identify the node name where the Pod failed to run.
Verify that the
csi-rbdpluginlogs of the affected node contain therbd volume mount failed: <csi-vol-uuid> is being usederror. The<csi-vol-uuid>is a unique RBD volume name.Identify
csiPodNameof the correspondingcsi-rbdplugin:kubectl -n rook-ceph get pod -l app=csi-rbdplugin \ -o jsonpath='{.items[?(@.spec.nodeName == "<nodeName>")].metadata.name}'
Output the affected
csiPodNamelogs:kubectl -n rook-ceph logs <csiPodName> -c csi-rbdplugin
Scale down the affected
StatefulSetorDeploymentof the Pod that fails to0replicas.On every
csi-rbdpluginPod, search for stuckcsi-vol:for pod in `kubectl -n rook-ceph get pods|grep rbdplugin|grep -v provisioner|awk '{print $1}'`; do echo $pod kubectl exec -it -n rook-ceph $pod -c csi-rbdplugin -- rbd device list | grep <csi-vol-uuid> done
Unmap the affected
csi-vol:rbd unmap -o force /dev/rbd<i>
The
/dev/rbd<i>value is a mapped RBD volume that usescsi-vol.Delete
volumeattachmentof the affected Pod:kubectl get volumeattachments | grep <csi-vol-uuid> kubectl delete volumeattacmhent <id>
Scale up the affected
StatefulSetorDeploymentback to the original number of replicas and wait until its state becomesRunning.
Fixed in 2.29.0 (17.4.0 and 16.4.0)
During the replacement of a master node on a cluster of any type, the process
may get stuck with Kubelet's NodeReady condition is Unknown in the
machine status on the remaining master nodes.
As a workaround, log in on the affected node and run the following command:
docker restart ucp-kubelet
During MariaDB operations on a management cluster, Pods may get stuck in continuous restarts with the following example error:
[ERROR] WSREP: Corrupt buffer header: \
addr: 0x7faec6f8e518, \
seqno: 3185219421952815104, \
size: 909455917, \
ctx: 0x557094f65038, \
flags: 11577. store: 49, \
type: 49
Workaround:
Create a backup of the
/var/lib/mysqldirectory on themariadb-serverPod.Verify that other replicas are up and ready.
Remove the
galera.cachefile for the affectedmariadb-serverPod.Remove the affected
mariadb-serverPod or wait until it is automatically restarted.
After Kubernetes restarts the Pod, the Pod clones the database in 1-2 minutes and restores the quorum.
Fixed in 2.28.4 (17.3.4 and 16.3.4)
During replacement of a master node on a cluster of any type, the
calico-node Pod fails to start on a new node that has the same IP address
as the node being replaced.
Workaround:
Log in to any
masternode.From a CLI with an MKE client bundle, create a shell alias to start calicoctl using the
mirantis/ucp-dsinfoimage:alias calicoctl="\ docker run -i --rm \ --pid host \ --net host \ -e constraint:ostype==linux \ -e ETCD_ENDPOINTS=<etcdEndpoint> \ -e ETCD_KEY_FILE=/var/lib/docker/volumes/ucp-kv-certs/_data/key.pem \ -e ETCD_CA_CERT_FILE=/var/lib/docker/volumes/ucp-kv-certs/_data/ca.pem \ -e ETCD_CERT_FILE=/var/lib/docker/volumes/ucp-kv-certs/_data/cert.pem \ -v /var/run/calico:/var/run/calico \ -v /var/lib/docker/volumes/ucp-kv-certs/_data:/var/lib/docker/volumes/ucp-kv-certs/_data:ro \ mirantis/ucp-dsinfo:<mkeVersion> \ calicoctl \ "
alias calicoctl="\ docker run -i --rm \ --pid host \ --net host \ -e constraint:ostype==linux \ -e ETCD_ENDPOINTS=<etcdEndpoint> \ -e ETCD_KEY_FILE=/ucp-node-certs/key.pem \ -e ETCD_CA_CERT_FILE=/ucp-node-certs/ca.pem \ -e ETCD_CERT_FILE=/ucp-node-certs/cert.pem \ -v /var/run/calico:/var/run/calico \ -v ucp-node-certs:/ucp-node-certs:ro \ mirantis/ucp-dsinfo:<mkeVersion> \ calicoctl --allow-version-mismatch \ "
In the above command, replace the following values with the corresponding settings of the affected cluster:
<etcdEndpoint>is the etcd endpoint defined in the Calico configuration file. For example,ETCD_ENDPOINTS=127.0.0.1:12378<mkeVersion>is the MKE version installed on your cluster. For example,mirantis/ucp-dsinfo:3.5.7.
Verify the node list on the cluster:
kubectl get node
Compare this list with the node list in Calico to identify the old node:
calicoctl get node -o wide
Remove the old node from Calico:
calicoctl delete node kaas-node-<nodeID>
Fixed in 2.28.4 (17.3.4 and 16.3.4)
During replacement of a manager machine, the following problems may occur:
The system adds the node to Docker swarm but not to Kubernetes
The node
Deploymentgets stuck with failed RethinkDB health checks
Workaround:
Delete the failed node.
Wait for the MKE cluster to become healthy. To monitor the cluster status:
Log in to the MKE web UI.
Monitor the cluster status as described in MKE Operations Guide: Monitor an MKE cluster with the MKE web UI.
Deploy a new node.
Fixed in 2.28.4 (17.3.4 and 16.3.4)
During the unsafe or forced deletion of a manager machine running the
calico-kube-controllers Pod in the kube-system namespace,
the following issues occur:
The
calico-kube-controllersPod fails to clean up resources associated with the deleted nodeThe
calico-nodePod may fail to start up on a newly created node if the machine is provisioned with the same IP address as the deleted machine had
As a workaround, before deletion of the node running the
calico-kube-controllers Pod, cordon and drain the node:
kubectl cordon <nodeName>
kubectl drain <nodeName>
Fixed in 2.29.0 (17.4.0 and 16.4.0)
On High Availability (HA) clusters that use Local Volume Provisioner (LVP), Prometheus and OpenSearch from StackLight may share the same pool of storage. In such configuration, OpenSearch may approach the 85% disk usage watermark due to the combined storage allocation and usage patterns set by the Persistent Volume Claim (PVC) size parameters for Prometheus and OpenSearch, which consume storage the most.
When the 85% threshold is reached, the affected node is transitioned to the
read-only state, preventing shard allocation and causing the OpenSearch cluster
state to transition to Warning (Yellow) or Critical (Red).
Caution
The issue and the provided workaround apply only for clusters on which OpenSearch and Prometheus utilize the same storage pool.
To verify that the cluster is affected:
Verify the result of the following formula:
0.8 × OpenSearch_PVC_Size_GB + Prometheus_PVC_Size_GB > 0.85 × Total_Storage_Capacity_GBIn the formula, define the following values:
- OpenSearch_PVC_Size_GB
Derived from
.values.elasticsearch.persistentVolumeUsableStorageSizeGB, defaulting to.values.elasticsearch.persistentVolumeClaimSizeif unspecified. To obtain the OpenSearch PVC size:kubectl -n <namespaceName> get cluster <clusterName> -o yaml |\ yq '.spec.providerSpec.value.helmReleases[] | select(.name == "stacklight") | .values.elasticsearch.persistentVolumeClaimSize '
Example of system response:
10000Gi
- Prometheus_PVC_Size_GB
Sourced from
.values.prometheusServer.persistentVolumeClaimSize. To obtain the Prometheus PVC size:kubectl -n <namespaceName> get cluster <clusterName> -o yaml |\ yq '.spec.providerSpec.value.helmReleases[] | select(.name == "stacklight") | .values.prometheusServer.persistentVolumeClaimSize '
Example of system response:
4000Gi
- Total_Storage_Capacity_GB
Total capacity of the OpenSearch PVCs. For LVP, the capacity of the storage pool. To obtain the total capacity:
kubectl get pvc -n stacklight -l app=opensearch-master \ -o custom-columns=NAME:.metadata.name,CAPACITY:.status.capacity.storage
The system response contains multiple outputs, one per
opensearch-masternode. Select the capacity for the affected node.
Note
Convert the values to GB if they are set in different units.
If the formula result is positive, it is an early indication that the cluster is affected.
Verify whether the
OpenSearchClusterStatusWarningorOpenSearchClusterStatusCriticalalert is firing. And if so, verify the following:Log in to the OpenSearch web UI.
In Management -> Dev Tools, run the following command:
GET _cluster/allocation/explainThe following system response indicates that the corresponding node is affected:
"explanation": "the node is above the low watermark cluster setting \ [cluster.routing.allocation.disk.watermark.low=85%], using more disk space \ than the maximum allowed [85.0%], actual free: [xx.xxx%]"
Note
The system response may contain even higher watermark percent than 85.0%, depending on the case.
Workaround:
Warning
The workaround implies adjustement of the retention threshold for OpenSearch. And depending on the new threshold, some old logs will be deleted.
Adjust or set
.values.elasticsearch.persistentVolumeUsableStorageSizeGBto a lower value for the affection check formula to be non-positive. For configuration details, see MOSK Operations Guide: StackLight configuration parameters - OpenSearch.Mirantis also recommends reserving some space for other PVCs using storage from the pool. Use the following formula to calculate the required space:
persistentVolumeUsableStorageSizeGB = 0.84 × ((1 - Reserved_Percentage - Filesystem_Reserve) × Total_Storage_Capacity_GB - Prometheus_PVC_Size_GB) / 0.8
In the formula, define the following values:
- Reserved_Percentage
A user-defined variable that specifies what percentage of the total storage capacity should not be used by OpenSearch or Prometheus. This is used to reserve space for other components. It should be expressed as a decimal. For example, for 5% of reservation,
Reserved_Percentageis 0.05. Mirantis recommends using 0.05 as a starting point.- Filesystem_Reserve
Percentage to deduct for filesystems that may reserve some portion of the available storage, which is marked as occupied. For example, for EXT4, it is 5% by default, so the value must be 0.05.
- Prometheus_PVC_Size_GB
Sourced from
.values.prometheusServer.persistentVolumeClaimSize.- Total_Storage_Capacity_GB
Total capacity of the OpenSearch PVCs. For LVP, the capacity of the storage pool. To obtain the total capacity:
kubectl get pvc -n stacklight -l app=opensearch-master \ -o custom-columns=NAME:.metadata.name,CAPACITY:.status.capacity.storage
The system response contains multiple outputs, one per
opensearch-masternode. Select the capacity for the affected node.
Note
Convert the values to GB if they are set in different units.
Calculation of above formula provides a maximum safe storage to allocate for
.values.elasticsearch.persistentVolumeUsableStorageSizeGB. Use this formula as a reference for setting.values.elasticsearch.persistentVolumeUsableStorageSizeGBon a cluster.Wait up to 15-20 mins for OpenSearch to perform the cleaning.
Verify that the cluster is not affected anymore using the procedure above.
Fixed in 2.30.0 (21.0.0 and 20.0.0)
A compact MOSK cluster fails to be deployed through the Container Cloud web UI
due to inability to add any label to the control plane machines along with
inability to change dedicatedControlPlane: false using the web UI.
To work around the issue, manually add the required labels using CLI. Once done, the cluster deployment resumes.
A newly created project does not display all available tabs in the Container
Cloud web UI and contains different access denied errors during first five
minutes after creation.
To work around the issue, refresh the browser in five minutes after the project creation.
This section lists the artifacts of components included in the Container Cloud patch release 2.28.3. For artifacts of the Cluster releases introduced in 2.28.3, see patch Cluster releases 17.2.7, 16.3.3, and 16.2.7.
Note
The components that are newly added, updated, deprecated, or removed
as compared to the previous release version, are marked
with a corresponding superscript,
for example, lcm-ansible Updated.
Artifact |
Component |
Path |
|---|---|---|
Binaries |
ironic-python-agent.initramfs Updated |
https://binary.mirantis.com/bm/bin/ironic/ipa/ubuntu/initramfs-antelope-jammy-debug-20241118155355 |
ironic-python-agent.kernel Updated |
https://binary.mirantis.com/bm/bin/ironic/ipa/ubuntu/kernel-antelope-jammy-debug-20241118155355 |
|
provisioning_ansible |
https://binary.mirantis.com/bm/bin/ansible/provisioning_ansible-0.1.1-167-e7a55fd.tgz |
|
Helm charts Updated |
baremetal-api |
https://binary.mirantis.com/core/helm/baremetal-api-1.41.23.tgz |
baremetal-operator |
https://binary.mirantis.com/core/helm/baremetal-operator-1.41.23.tgz |
|
baremetal-provider |
https://binary.mirantis.com/core/helm/baremetal-provider-1.41.23.tgz |
|
baremetal-public-api |
https://binary.mirantis.com/core/helm/baremetal-public-api-1.41.23.tgz |
|
kaas-ipam |
||
Docker images |
ambassador Updated |
mirantis.azurecr.io/core/external/nginx:1.41.23 |
baremetal-dnsmasq |
mirantis.azurecr.io/bm/baremetal-dnsmasq:base-2-28-alpine-20241022121257 |
|
baremetal-operator Updated |
mirantis.azurecr.io/bm/baremetal-operator:base-2-28-alpine-20241111132119 |
|
bm-collective |
mirantis.azurecr.io/bm/bm-collective:base-2-28-alpine-20241022120001 |
|
cluster-api-provider-baremetal Updated |
mirantis.azurecr.io/core/cluster-api-provider-baremetal:1.41.23 |
|
ironic Updated |
mirantis.azurecr.io/openstack/ironic:antelope-jammy-20241128095555 |
|
ironic-inspector Updated |
mirantis.azurecr.io/openstack/ironic-inspector:antelope-jammy-20241128095555 |
|
ironic-prometheus-exporter |
mirantis.azurecr.io/stacklight/ironic-prometheus-exporter:0.1-20240913123302 |
|
kaas-ipam |
mirantis.azurecr.io/bm/kaas-ipam:base-2-28-alpine-20241022122006 |
|
kubernetes-entrypoint |
mirantis.azurecr.io/openstack/extra/kubernetes-entrypoint:v1.0.1-34a4f54-20240910081335 |
|
mariadb |
mirantis.azurecr.io/general/mariadb:10.6.17-jammy-20240927170336 |
|
syslog-ng |
mirantis.azurecr.io/bm/syslog-ng:base-alpine-20241022120929 |
Artifact |
Component |
Path |
|---|---|---|
Bootstrap tarball Updated |
bootstrap-darwin |
https://binary.mirantis.com/core/bin/bootstrap-darwin-1.41.23.tgz |
bootstrap-linux |
https://binary.mirantis.com/core/bin/bootstrap-linux-1.41.23.tgz |
|
Helm charts Updated |
admission-controller |
https://binary.mirantis.com/core/helm/admission-controller-1.41.23.tgz |
agent-controller |
https://binary.mirantis.com/core/helm/agent-controller-1.41.23.tgz |
|
ceph-kcc-controller |
https://binary.mirantis.com/core/helm/ceph-kcc-controller-1.41.23.tgz |
|
cert-manager |
https://binary.mirantis.com/core/helm/cert-manager-1.41.23.tgz |
|
configuration-collector |
https://binary.mirantis.com/core/helm/configuration-collector-1.41.23.tgz |
|
credentials-controller |
https://binary.mirantis.com/core/helm/credentials-controller-1.41.23.tgz |
|
event-controller |
https://binary.mirantis.com/core/helm/event-controller-1.41.23.tgz |
|
host-os-modules-controller |
https://binary.mirantis.com/core/helm/host-os-modules-controller-1.41.23.tgz |
|
iam-controller |
https://binary.mirantis.com/core/helm/iam-controller-1.41.23.tgz |
|
kaas-exporter |
https://binary.mirantis.com/core/helm/kaas-exporter-1.41.23.tgz |
|
kaas-public-api |
https://binary.mirantis.com/core/helm/kaas-public-api-1.41.23.tgz |
|
kaas-ui |
||
lcm-controller |
https://binary.mirantis.com/core/helm/lcm-controller-1.41.23.tgz |
|
license-controller |
https://binary.mirantis.com/core/helm/license-controller-1.41.23.tgz |
|
machinepool-controller |
https://binary.mirantis.com/core/helm/machinepool-controller-1.41.23.tgz |
|
mcc-cache |
||
mcc-cache-warmup |
https://binary.mirantis.com/core/helm/mcc-cache-warmup-1.41.23.tgz |
|
openstack-provider |
https://binary.mirantis.com/core/helm/openstack-provider-1.41.23.tgz |
|
portforward-controller |
https://binary.mirantis.com/core/helm/portforward-controller-1.41.23.tgz |
|
rbac-controller |
https://binary.mirantis.com/core/helm/rbac-controller-1.41.23.tgz |
|
release-controller |
https://binary.mirantis.com/core/helm/release-controller-1.41.23.tgz |
|
scope-controller |
https://binary.mirantis.com/core/helm/scope-controller-1.41.23.tgz |
|
secret-controller |
https://binary.mirantis.com/core/helm/secret-controller-1.41.23.tgz |
|
user-controller |
https://binary.mirantis.com/core/helm/user-controller-1.41.23.tgz |
|
Docker images |
admission-controller Updated |
mirantis.azurecr.io/core/admission-controller:1.41.23 |
agent-controller Updated |
mirantis.azurecr.io/core/agent-controller:1.41.23 |
|
ceph-kcc-controller Updated |
mirantis.azurecr.io/core/ceph-kcc-controller:1.41.23 |
|
cert-manager-controller |
mirantis.azurecr.io/core/external/cert-manager-controller:v1.11.0-8 |
|
configuration-collector Updated |
mirantis.azurecr.io/core/configuration-collector:1.41.23 |
|
credentials-controller Updated |
mirantis.azurecr.io/core/credentials-controller:1.41.23 |
|
event-controller Updated |
mirantis.azurecr.io/core/event-controller:1.41.23 |
|
frontend Updated |
mirantis.azurecr.io/core/frontend:1.41.23 |
|
host-os-modules-controller Updated |
mirantis.azurecr.io/core/host-os-modules-controller:1.41.23 |
|
iam-controller Updated |
mirantis.azurecr.io/core/iam-controller:1.41.23 |
|
kaas-exporter Updated |
mirantis.azurecr.io/core/kaas-exporter:1.41.23 |
|
kproxy Updated |
mirantis.azurecr.io/core/kproxy:1.41.23 |
|
lcm-controller Updated |
mirantis.azurecr.io/core/lcm-controller:1.41.23 |
|
license-controller Updated |
mirantis.azurecr.io/core/license-controller:1.41.23 |
|
machinepool-controller Updated |
mirantis.azurecr.io/core/machinepool-controller:1.41.23 |
|
mcc-cache-warmup Updated |
mirantis.azurecr.io/core/mcc-cache-warmup:1.41.23 |
|
nginx Updated |
mirantis.azurecr.io/core/external/nginx:1.41.23 |
|
openstack-cluster-api-controller Updated |
mirantis.azurecr.io/core/openstack-cluster-api-controller:1.41.23 |
|
portforward-controller Updated |
mirantis.azurecr.io/core/portforward-controller:1.41.23 |
|
rbac-controller Updated |
mirantis.azurecr.io/core/rbac-controller:1.41.23 |
|
registry |
mirantis.azurecr.io/lcm/registry:v2.8.1-14 |
|
release-controller Updated |
mirantis.azurecr.io/core/release-controller:1.41.23 |
|
scope-controller Updated |
mirantis.azurecr.io/core/scope-controller:1.41.23 |
|
secret-controller Updated |
mirantis.azurecr.io/core/secret-controller:1.41.23 |
|
user-controller Updated |
mirantis.azurecr.io/core/user-controller:1.41.23 |
Artifact |
Component |
Path |
|---|---|---|
Binaries |
hash-generate-darwin |
http://binary.mirantis.com/iam/bin/hash-generate-0.0.1-268-3cf7f17-darwin |
hash-generate-linux |
http://binary.mirantis.com/iam/bin/hash-generate-0.0.1-268-3cf7f17-linux |
|
Helm charts Updated |
iam |
|
Docker images |
kubectl |
mirantis.azurecr.io/general/kubectl:20240926142019 |
kubernetes-entrypoint |
mirantis.azurecr.io/openstack/extra/kubernetes-entrypoint:v1.0.1-ba8ada4-20240405150338 |
|
mariadb |
mirantis.azurecr.io/general/mariadb:10.6.17-focal-20240909113408 |
|
mcc-keycloak Updated |
mirantis.azurecr.io/iam/mcc-keycloak:25.0.6-20241114073807 |
Important
For MOSK clusters, Container Cloud 2.28.2 is the continuation for MOSK 24.2.x series using the patch Cluster release 17.2.6. For the update path of 24.1, 24.2, and 24.3 series, see MOSK documentation: Release Compatibility Matrix - Managed cluster update schema.
The management cluster of a MOSK 24.2.x cluster is automatically updated to the latest patch Cluster release 16.3.2.
The Container Cloud patch release 2.28.2, which is based on the 2.28.0 major release, provides the following updates:
Support for the patch Cluster release 16.3.2.
Support for the patch Cluster releases 16.2.6 and 17.2.6 that represents Mirantis OpenStack for Kubernetes (MOSK) patch release 24.2.4 patch.
Support for MKE 3.7.16.
Bare metal: update of Ubuntu mirror from ubuntu-2024-10-14-013948 to ubuntu-2024-10-28-012906 along with update of minor kernel version from 5.15.0-122-generic to 5.15.0-124-generic.
Security fixes for CVEs in images.
This patch release also supports the latest major Cluster releases 17.3.0 and 16.3.0. And it does not support greenfield deployments based on deprecated Cluster releases. Use the latest available Cluster release instead.
For main deliverables of the parent Container Cloud release of 2.28.2, refer to 2.28.0.
In total, since Container Cloud 2.28.1, 15 Common Vulnerabilities and Exposures (CVE) of high severity have been fixed in 2.28.2.
The table below includes the total numbers of addressed unique and common CVEs in images by product component since Container Cloud 2.28.1. The common CVEs are issues addressed across several images.
Product component |
CVE type |
Critical |
High |
Total |
|---|---|---|---|---|
Kaas core |
Unique |
0 |
5 |
5 |
Common |
0 |
9 |
9 |
|
StackLight |
Unique |
0 |
1 |
1 |
Common |
0 |
6 |
6 |
Mirantis Security Portal
For the detailed list of fixed and existing CVEs across the Mirantis Container Cloud and MOSK products, refer to Mirantis Security Portal.
MOSK CVEs
For the number of fixed CVEs in the MOSK-related components including OpenStack and Tungsten Fabric, refer to MOSK 24.2.4: Security notes.
The following issues have been addressed in the Container Cloud patch release 2.28.2 along with the patch Cluster releases 16.3.2, 16.2.6, and 17.2.6.
[47741] [LCM] Fixed the issue with upgrade to MKE 3.7.15 getting stuck due to the leftover
ucp-upgrade-check-imagesservice that is part of MKE 3.7.12.[47304] [StackLight] Fixed the issue with OpenSearch not storing kubelet logs due to the JSON-based format of
ucp-kubeletlogs.
This section lists known issues with workarounds for the Mirantis Container Cloud release 2.28.2 including the Cluster releases 16.2.6, 16.3.2, and 17.2.6.
For other issues that can occur while deploying and operating a Container Cloud cluster, see Troubleshooting Guide.
Note
This section also outlines still valid known issues from previous Container Cloud releases.
Note
Moving forward, the workaround for this issue will be moved from Release Notes to MOSK Troubleshooting Guide: Inspection error on bare metal hosts after dnsmasq restart.
If the dnsmasq pod is restarted during the bootstrap of newly added
nodes, those nodes may fail to undergo inspection. That can result in
inspection error in the corresponding BareMetalHost objects.
The issue can occur when:
The
dnsmasqpod was moved to another node.DHCP subnets were changed, including addition or removal. In this case, the
dhcpdcontainer of thednsmasqpod is restarted.Caution
If changing or adding of DHCP subnets is required to bootstrap new nodes, wait after changing or adding DHCP subnets until the
dnsmasqpod becomes ready, then createBareMetalHostobjects.
To verify whether the nodes are affected:
Verify whether the
BareMetalHostobjects contain theinspection error:kubectl get bmh -n <managed-cluster-namespace-name>
Example of system response:
NAME STATE CONSUMER ONLINE ERROR AGE test-master-1 provisioned test-master-1 true 9d test-master-2 provisioned test-master-2 true 9d test-master-3 provisioned test-master-3 true 9d test-worker-1 provisioned test-worker-1 true 9d test-worker-2 provisioned test-worker-2 true 9d test-worker-3 inspecting true inspection error 19h
Verify whether the
dnsmasqpod was inReadystate when the inspection of the affected baremetal hosts (test-worker-3in the example above) was started:kubectl -n kaas get pod <dnsmasq-pod-name> -oyaml
Example of system response:
... status: conditions: - lastProbeTime: null lastTransitionTime: "2024-10-10T15:37:34Z" status: "True" type: Initialized - lastProbeTime: null lastTransitionTime: "2024-10-11T07:38:54Z" status: "True" type: Ready - lastProbeTime: null lastTransitionTime: "2024-10-11T07:38:54Z" status: "True" type: ContainersReady - lastProbeTime: null lastTransitionTime: "2024-10-10T15:37:34Z" status: "True" type: PodScheduled containerStatuses: - containerID: containerd://6dbcf2fc4b36ce4c549c9191ab01f72d0236c51d42947675302675e4bfaf4cdf image: docker-dev-kaas-virtual.artifactory-eu.mcp.mirantis.net/bm/baremetal-dnsmasq:base-2-28-alpine-20240812132650 imageID: docker-dev-kaas-virtual.artifactory-eu.mcp.mirantis.net/bm/baremetal-dnsmasq@sha256:3dad3e278add18e69b2608e462691c4823942641a0f0e25e6811e703e3c23b3b lastState: terminated: containerID: containerd://816fcf079cd544acd74e312065de5b5ed4dbf1dc6159fefffff4f644b5e45987 exitCode: 0 finishedAt: "2024-10-11T07:38:35Z" reason: Completed startedAt: "2024-10-10T15:37:45Z" name: dhcpd ready: true restartCount: 2 started: true state: running: startedAt: "2024-10-11T07:38:37Z" ...
In the system response above, the
dhcpdcontainer was not ready between"2024-10-11T07:38:35Z"and"2024-10-11T07:38:54Z".Verify the affected baremetal host. For example:
kubectl get bmh -n managed-ns test-worker-3 -oyaml
Example of system response:
... status: errorCount: 15 errorMessage: Introspection timeout errorType: inspection error ... operationHistory: deprovision: end: null start: null inspect: end: null start: "2024-10-11T07:38:19Z" provision: end: null start: null register: end: "2024-10-11T07:38:19Z" start: "2024-10-11T07:37:25Z"
In the system response above, inspection was started at
"2024-10-11T07:38:19Z", immediately before the period of thedhcpdcontainer downtime. Therefore, this node is most likely affected by the issue.
Workaround
Reboot the node using the IPMI reset or cycle command.
If the node fails to boot, remove the failed
BareMetalHostobject and create it again:Remove
BareMetalHostobject. For example:kubectl delete bmh -n managed-ns test-worker-3
Verify that the
BareMetalHostobject is removed:kubectl get bmh -n managed-ns test-worker-3
Create a
BareMetalHostobject from the template. For example:kubectl create -f bmhc-test-worker-3.yaml kubectl create -f bmh-test-worker-3.yaml
Due to the MetalLB upstream issue, a load balancer service may not obtain the external IP address.
The issue occurs when two services share the same external IP address and have
the same externalTrafficPolicy value. Initially, the services have the
external IP address assigned and are accessible. After modifying the
externalTrafficPolicy value for both services from Cluster to
Local, the first service that has been changed remains with no external IP
address assigned. Though, the second service, which was changed later, has the
external IP assigned as expected.
To work around the issue, make a dummy change to the service object where
external IP is <pending>:
Identify the service that is stuck:
kubectl get svc -A | grep pending
Example of system response:
stacklight iam-proxy-prometheus LoadBalancer 10.233.28.196 <pending> 443:30430/TCP
Add an arbitrary label to the service that is stuck. For example:
kubectl label svc -n stacklight iam-proxy-prometheus reconcile=1
Example of system response:
service/iam-proxy-prometheus labeledVerify that the external IP was allocated to the service:
kubectl get svc -n stacklight iam-proxy-prometheus
Example of system response:
NAME TYPE CLUSTER-IP EXTERNAL-IP PORT(S) AGE iam-proxy-prometheus LoadBalancer 10.233.28.196 10.0.34.108 443:30430/TCP 12d
During deletion of a manager machine running the ironic Pod from a bare
metal management cluster, the following problems occur:
All Pods are stuck in the
TerminatingstateA new
ironicPod fails to startThe related bare metal host is stuck in the
deprovisioningstate
As a workaround, before deletion of the node running the ironic Pod,
cordon and drain the node using the kubectl cordon <nodeName> and
kubectl drain <nodeName> commands.
Fixed in 2.29.3 (17.3.8, 16.3.8, and 16.4.3)
Due to the upstream Ceph issue
66717,
during CVE upgrade of the Ceph daemon image of Ceph Reef 18.2.4, OSDs may start
slow and even fail the starting probe with the following describe output in
the rook-ceph-osd-X pod:
Warning Unhealthy 57s (x16 over 3m27s) kubelet Startup probe failed:
ceph daemon health check failed with the following output:
> no valid command found; 10 closest matches:
> 0
> 1
> 2
> abort
> assert
> bluefs debug_inject_read_zeros
> bluefs files list
> bluefs stats
> bluestore bluefs device info [<alloc_size:int>]
> config diff
> admin_socket: invalid command
Workaround:
Complete the following steps during every patch or major cluster update of the Cluster releases 17.2.x, 17.3.x, and 17.4.x (until Ceph 18.2.5 becomes supported):
Plan extra time in the maintenance window for the patch cluster update.
Slow starts will still impact the update procedure, but after completing the following step, the recovery process noticeably shortens without affecting the overall cluster state and data responsiveness.
Select one of the following options:
Before the cluster update, set the
nooutflag:ceph osd set noout
Once the Ceph OSDs image upgrade is done, unset the flag:
ceph osd unset noout
Monitor the Ceph OSDs image upgrade. If the symptoms of slow start appear, set the
nooutflag as soon as possible. Once the Ceph OSDs image upgrade is done, unset the flag.
Note
The issue does not reproduce since MOSK 25.2.
Update of a managed cluster based on bare metal and Ceph enabled fails with
PersistentVolumeClaim getting stuck in the Pending state for the
prometheus-server StatefulSet and the
MountVolume.MountDevice failed for volume warning in the StackLight event
logs.
Workaround:
Verify that the description of the Pods that failed to run contain the
FailedMountevents:kubectl -n <affectedProjectName> describe pod <affectedPodName>
In the command above, replace the following values:
<affectedProjectName>is the Container Cloud project name where the Pods failed to run<affectedPodName>is a Pod name that failed to run in the specified project
In the Pod description, identify the node name where the Pod failed to run.
Verify that the
csi-rbdpluginlogs of the affected node contain therbd volume mount failed: <csi-vol-uuid> is being usederror. The<csi-vol-uuid>is a unique RBD volume name.Identify
csiPodNameof the correspondingcsi-rbdplugin:kubectl -n rook-ceph get pod -l app=csi-rbdplugin \ -o jsonpath='{.items[?(@.spec.nodeName == "<nodeName>")].metadata.name}'
Output the affected
csiPodNamelogs:kubectl -n rook-ceph logs <csiPodName> -c csi-rbdplugin
Scale down the affected
StatefulSetorDeploymentof the Pod that fails to0replicas.On every
csi-rbdpluginPod, search for stuckcsi-vol:for pod in `kubectl -n rook-ceph get pods|grep rbdplugin|grep -v provisioner|awk '{print $1}'`; do echo $pod kubectl exec -it -n rook-ceph $pod -c csi-rbdplugin -- rbd device list | grep <csi-vol-uuid> done
Unmap the affected
csi-vol:rbd unmap -o force /dev/rbd<i>
The
/dev/rbd<i>value is a mapped RBD volume that usescsi-vol.Delete
volumeattachmentof the affected Pod:kubectl get volumeattachments | grep <csi-vol-uuid> kubectl delete volumeattacmhent <id>
Scale up the affected
StatefulSetorDeploymentback to the original number of replicas and wait until its state becomesRunning.
Fixed in 2.29.0 (17.4.0 and 16.4.0)
During the replacement of a master node on a cluster of any type, the process
may get stuck with Kubelet's NodeReady condition is Unknown in the
machine status on the remaining master nodes.
As a workaround, log in on the affected node and run the following command:
docker restart ucp-kubelet
During MariaDB operations on a management cluster, Pods may get stuck in continuous restarts with the following example error:
[ERROR] WSREP: Corrupt buffer header: \
addr: 0x7faec6f8e518, \
seqno: 3185219421952815104, \
size: 909455917, \
ctx: 0x557094f65038, \
flags: 11577. store: 49, \
type: 49
Workaround:
Create a backup of the
/var/lib/mysqldirectory on themariadb-serverPod.Verify that other replicas are up and ready.
Remove the
galera.cachefile for the affectedmariadb-serverPod.Remove the affected
mariadb-serverPod or wait until it is automatically restarted.
After Kubernetes restarts the Pod, the Pod clones the database in 1-2 minutes and restores the quorum.
Fixed in 2.28.4 (17.3.4 and 16.3.4)
During replacement of a master node on a cluster of any type, the
calico-node Pod fails to start on a new node that has the same IP address
as the node being replaced.
Workaround:
Log in to any
masternode.From a CLI with an MKE client bundle, create a shell alias to start calicoctl using the
mirantis/ucp-dsinfoimage:alias calicoctl="\ docker run -i --rm \ --pid host \ --net host \ -e constraint:ostype==linux \ -e ETCD_ENDPOINTS=<etcdEndpoint> \ -e ETCD_KEY_FILE=/var/lib/docker/volumes/ucp-kv-certs/_data/key.pem \ -e ETCD_CA_CERT_FILE=/var/lib/docker/volumes/ucp-kv-certs/_data/ca.pem \ -e ETCD_CERT_FILE=/var/lib/docker/volumes/ucp-kv-certs/_data/cert.pem \ -v /var/run/calico:/var/run/calico \ -v /var/lib/docker/volumes/ucp-kv-certs/_data:/var/lib/docker/volumes/ucp-kv-certs/_data:ro \ mirantis/ucp-dsinfo:<mkeVersion> \ calicoctl \ "
alias calicoctl="\ docker run -i --rm \ --pid host \ --net host \ -e constraint:ostype==linux \ -e ETCD_ENDPOINTS=<etcdEndpoint> \ -e ETCD_KEY_FILE=/ucp-node-certs/key.pem \ -e ETCD_CA_CERT_FILE=/ucp-node-certs/ca.pem \ -e ETCD_CERT_FILE=/ucp-node-certs/cert.pem \ -v /var/run/calico:/var/run/calico \ -v ucp-node-certs:/ucp-node-certs:ro \ mirantis/ucp-dsinfo:<mkeVersion> \ calicoctl --allow-version-mismatch \ "
In the above command, replace the following values with the corresponding settings of the affected cluster:
<etcdEndpoint>is the etcd endpoint defined in the Calico configuration file. For example,ETCD_ENDPOINTS=127.0.0.1:12378<mkeVersion>is the MKE version installed on your cluster. For example,mirantis/ucp-dsinfo:3.5.7.
Verify the node list on the cluster:
kubectl get node
Compare this list with the node list in Calico to identify the old node:
calicoctl get node -o wide
Remove the old node from Calico:
calicoctl delete node kaas-node-<nodeID>
Fixed in 2.28.4 (17.3.4 and 16.3.4)
During replacement of a manager machine, the following problems may occur:
The system adds the node to Docker swarm but not to Kubernetes
The node
Deploymentgets stuck with failed RethinkDB health checks
Workaround:
Delete the failed node.
Wait for the MKE cluster to become healthy. To monitor the cluster status:
Log in to the MKE web UI.
Monitor the cluster status as described in MKE Operations Guide: Monitor an MKE cluster with the MKE web UI.
Deploy a new node.
Fixed in 2.28.4 (17.3.4 and 16.3.4)
During the unsafe or forced deletion of a manager machine running the
calico-kube-controllers Pod in the kube-system namespace,
the following issues occur:
The
calico-kube-controllersPod fails to clean up resources associated with the deleted nodeThe
calico-nodePod may fail to start up on a newly created node if the machine is provisioned with the same IP address as the deleted machine had
As a workaround, before deletion of the node running the
calico-kube-controllers Pod, cordon and drain the node:
kubectl cordon <nodeName>
kubectl drain <nodeName>
Fixed in 2.28.3 (17.2.7, 16.2.7, and 16.3.3)
The Patroni pods may get stuck in the CrashLoopBackOff state due to the
patroni container being terminated with reason: OOMKilled that you can
see in the pod status. For example:
kubectl get pod/patroni-13-0 -n stacklight -o yaml
...
- containerID: docker://<ID>`
image: mirantis.azurecr.io/stacklight/spilo:13-2.1p9-20240828023010
imageID: docker-pullable://mirantis.azurecr.io/stacklight/spilo@sha256:<ID>
lastState:
terminated:
containerID: docker://<ID>
exitCode: 137
finishedAt: "2024-10-17T14:26:25Z"
reason: OOMKilled
startedAt: "2024-10-17T14:23:25Z"
name: patroni
...
As a workaround, increase the memory limit for PostgreSQL to 20Gi in
the Cluster object:
spec:
providerSpec:
value:
helmReleases:
- name: stacklight
values:
resources:
postgresql:
limits:
memory: "20Gi"
For a detailed procedure of StackLight configuration, see MOSK Operations
Guide: Configure StackLight.
For description of the resources option, see MOSK Operations Guide:
StackLight configuration parameters - Resource limits.
Fixed in 2.29.0 (17.4.0 and 16.4.0)
On High Availability (HA) clusters that use Local Volume Provisioner (LVP), Prometheus and OpenSearch from StackLight may share the same pool of storage. In such configuration, OpenSearch may approach the 85% disk usage watermark due to the combined storage allocation and usage patterns set by the Persistent Volume Claim (PVC) size parameters for Prometheus and OpenSearch, which consume storage the most.
When the 85% threshold is reached, the affected node is transitioned to the
read-only state, preventing shard allocation and causing the OpenSearch cluster
state to transition to Warning (Yellow) or Critical (Red).
Caution
The issue and the provided workaround apply only for clusters on which OpenSearch and Prometheus utilize the same storage pool.
To verify that the cluster is affected:
Verify the result of the following formula:
0.8 × OpenSearch_PVC_Size_GB + Prometheus_PVC_Size_GB > 0.85 × Total_Storage_Capacity_GBIn the formula, define the following values:
- OpenSearch_PVC_Size_GB
Derived from
.values.elasticsearch.persistentVolumeUsableStorageSizeGB, defaulting to.values.elasticsearch.persistentVolumeClaimSizeif unspecified. To obtain the OpenSearch PVC size:kubectl -n <namespaceName> get cluster <clusterName> -o yaml |\ yq '.spec.providerSpec.value.helmReleases[] | select(.name == "stacklight") | .values.elasticsearch.persistentVolumeClaimSize '
Example of system response:
10000Gi
- Prometheus_PVC_Size_GB
Sourced from
.values.prometheusServer.persistentVolumeClaimSize. To obtain the Prometheus PVC size:kubectl -n <namespaceName> get cluster <clusterName> -o yaml |\ yq '.spec.providerSpec.value.helmReleases[] | select(.name == "stacklight") | .values.prometheusServer.persistentVolumeClaimSize '
Example of system response:
4000Gi
- Total_Storage_Capacity_GB
Total capacity of the OpenSearch PVCs. For LVP, the capacity of the storage pool. To obtain the total capacity:
kubectl get pvc -n stacklight -l app=opensearch-master \ -o custom-columns=NAME:.metadata.name,CAPACITY:.status.capacity.storage
The system response contains multiple outputs, one per
opensearch-masternode. Select the capacity for the affected node.
Note
Convert the values to GB if they are set in different units.
If the formula result is positive, it is an early indication that the cluster is affected.
Verify whether the
OpenSearchClusterStatusWarningorOpenSearchClusterStatusCriticalalert is firing. And if so, verify the following:Log in to the OpenSearch web UI.
In Management -> Dev Tools, run the following command:
GET _cluster/allocation/explainThe following system response indicates that the corresponding node is affected:
"explanation": "the node is above the low watermark cluster setting \ [cluster.routing.allocation.disk.watermark.low=85%], using more disk space \ than the maximum allowed [85.0%], actual free: [xx.xxx%]"
Note
The system response may contain even higher watermark percent than 85.0%, depending on the case.
Workaround:
Warning
The workaround implies adjustement of the retention threshold for OpenSearch. And depending on the new threshold, some old logs will be deleted.
Adjust or set
.values.elasticsearch.persistentVolumeUsableStorageSizeGBto a lower value for the affection check formula to be non-positive. For configuration details, see MOSK Operations Guide: StackLight configuration parameters - OpenSearch.Mirantis also recommends reserving some space for other PVCs using storage from the pool. Use the following formula to calculate the required space:
persistentVolumeUsableStorageSizeGB = 0.84 × ((1 - Reserved_Percentage - Filesystem_Reserve) × Total_Storage_Capacity_GB - Prometheus_PVC_Size_GB) / 0.8
In the formula, define the following values:
- Reserved_Percentage
A user-defined variable that specifies what percentage of the total storage capacity should not be used by OpenSearch or Prometheus. This is used to reserve space for other components. It should be expressed as a decimal. For example, for 5% of reservation,
Reserved_Percentageis 0.05. Mirantis recommends using 0.05 as a starting point.- Filesystem_Reserve
Percentage to deduct for filesystems that may reserve some portion of the available storage, which is marked as occupied. For example, for EXT4, it is 5% by default, so the value must be 0.05.
- Prometheus_PVC_Size_GB
Sourced from
.values.prometheusServer.persistentVolumeClaimSize.- Total_Storage_Capacity_GB
Total capacity of the OpenSearch PVCs. For LVP, the capacity of the storage pool. To obtain the total capacity:
kubectl get pvc -n stacklight -l app=opensearch-master \ -o custom-columns=NAME:.metadata.name,CAPACITY:.status.capacity.storage
The system response contains multiple outputs, one per
opensearch-masternode. Select the capacity for the affected node.
Note
Convert the values to GB if they are set in different units.
Calculation of above formula provides a maximum safe storage to allocate for
.values.elasticsearch.persistentVolumeUsableStorageSizeGB. Use this formula as a reference for setting.values.elasticsearch.persistentVolumeUsableStorageSizeGBon a cluster.Wait up to 15-20 mins for OpenSearch to perform the cleaning.
Verify that the cluster is not affected anymore using the procedure above.
Fixed in 2.30.0 (21.0.0 and 20.0.0)
A compact MOSK cluster fails to be deployed through the Container Cloud web UI
due to inability to add any label to the control plane machines along with
inability to change dedicatedControlPlane: false using the web UI.
To work around the issue, manually add the required labels using CLI. Once done, the cluster deployment resumes.
A newly created project does not display all available tabs in the Container
Cloud web UI and contains different access denied errors during first five
minutes after creation.
To work around the issue, refresh the browser in five minutes after the project creation.
This section lists the artifacts of components included in the Container Cloud patch release 2.28.2. For artifacts of the Cluster releases introduced in 2.28.2, see patch Cluster releases 17.2.6, 16.3.2, and 16.2.6.
Note
The components that are newly added, updated, deprecated, or removed
as compared to the previous release version, are marked
with a corresponding superscript,
for example, lcm-ansible Updated.
Artifact |
Component |
Path |
|---|---|---|
Binaries Updated |
ironic-python-agent.initramfs |
https://binary.mirantis.com/bm/bin/ironic/ipa/ubuntu/initramfs-antelope-jammy-debug-20241028161924 |
ironic-python-agent.kernel |
https://binary.mirantis.com/bm/bin/ironic/ipa/ubuntu/kernel-antelope-jammy-debug-20241028161924 |
|
Helm charts Updated |
baremetal-api |
https://binary.mirantis.com/core/helm/baremetal-api-1.41.22.tgz |
baremetal-operator |
https://binary.mirantis.com/core/helm/baremetal-operator-1.41.22.tgz |
|
baremetal-provider |
https://binary.mirantis.com/core/helm/baremetal-provider-1.41.22.tgz |
|
baremetal-public-api |
https://binary.mirantis.com/core/helm/baremetal-public-api-1.41.22.tgz |
|
kaas-ipam |
||
Docker images |
ambasador Updated |
mirantis.azurecr.io/core/external/nginx:1.41.22 |
baremetal-dnsmasq |
mirantis.azurecr.io/bm/baremetal-dnsmasq:base-2-28-alpine-20241022121257 |
|
baremetal-operator |
mirantis.azurecr.io/bm/baremetal-operator:base-2-28-alpine-20241022120949 |
|
bm-collective |
mirantis.azurecr.io/bm/bm-collective:base-2-28-alpine-20241022120001 |
|
cluster-api-provider-baremetal Updated |
mirantis.azurecr.io/core/cluster-api-provider-baremetal:1.41.22 |
|
ironic Updated |
mirantis.azurecr.io/openstack/ironic:antelope-jammy-20241023091304 |
|
ironic-inspector Updated |
mirantis.azurecr.io/openstack/ironic-inspector:antelope-jammy-20241023091304 |
|
ironic-prometheus-exporter Updated |
mirantis.azurecr.io/stacklight/ironic-prometheus-exporter:0.1-20240913123302 |
|
kaas-ipam |
mirantis.azurecr.io/bm/kaas-ipam:base-2-28-alpine-20241022122006 |
|
kubernetes-entrypoint |
mirantis.azurecr.io/openstack/extra/kubernetes-entrypoint:v1.0.1-34a4f54-20240910081335 |
|
mariadb |
mirantis.azurecr.io/general/mariadb:10.6.17-jammy-20240927170336 |
|
syslog-ng |
mirantis.azurecr.io/bm/syslog-ng:base-alpine-20241022120929 |
Artifact |
Component |
Path |
|---|---|---|
Bootstrap tarball Updated |
bootstrap-darwin |
https://binary.mirantis.com/core/bin/bootstrap-darwin-1.41.22.tgz |
bootstrap-linux |
https://binary.mirantis.com/core/bin/bootstrap-linux-1.41.22.tgz |
|
Helm charts Updated |
admission-controller |
https://binary.mirantis.com/core/helm/admission-controller-1.41.22.tgz |
agent-controller |
https://binary.mirantis.com/core/helm/agent-controller-1.41.22.tgz |
|
ceph-kcc-controller |
https://binary.mirantis.com/core/helm/ceph-kcc-controller-1.41.22.tgz |
|
cert-manager |
https://binary.mirantis.com/core/helm/cert-manager-1.41.22.tgz |
|
configuration-collector |
https://binary.mirantis.com/core/helm/configuration-collector-1.41.22.tgz |
|
credentials-controller |
https://binary.mirantis.com/core/helm/credentials-controller-1.41.22.tgz |
|
event-controller |
https://binary.mirantis.com/core/helm/event-controller-1.41.22.tgz |
|
host-os-modules-controller |
https://binary.mirantis.com/core/helm/host-os-modules-controller-1.41.22.tgz |
|
iam-controller |
https://binary.mirantis.com/core/helm/iam-controller-1.41.22.tgz |
|
kaas-exporter |
https://binary.mirantis.com/core/helm/kaas-exporter-1.41.22.tgz |
|
kaas-public-api |
https://binary.mirantis.com/core/helm/kaas-public-api-1.41.22.tgz |
|
kaas-ui |
||
lcm-controller |
https://binary.mirantis.com/core/helm/lcm-controller-1.41.22.tgz |
|
license-controller |
https://binary.mirantis.com/core/helm/license-controller-1.41.22.tgz |
|
machinepool-controller |
https://binary.mirantis.com/core/helm/machinepool-controller-1.41.22.tgz |
|
mcc-cache |
||
mcc-cache-warmup |
https://binary.mirantis.com/core/helm/mcc-cache-warmup-1.41.22.tgz |
|
openstack-provider |
https://binary.mirantis.com/core/helm/openstack-provider-1.41.22.tgz |
|
portforward-controller |
https://binary.mirantis.com/core/helm/portforward-controller-1.41.22.tgz |
|
rbac-controller |
https://binary.mirantis.com/core/helm/rbac-controller-1.41.22.tgz |
|
release-controller |
https://binary.mirantis.com/core/helm/release-controller-1.41.22.tgz |
|
scope-controller |
https://binary.mirantis.com/core/helm/scope-controller-1.41.22.tgz |
|
secret-controller |
https://binary.mirantis.com/core/helm/secret-controller-1.41.22.tgz |
|
user-controller |
https://binary.mirantis.com/core/helm/user-controller-1.41.22.tgz |
|
Docker images |
admission-controller Updated |
mirantis.azurecr.io/core/admission-controller:1.41.22 |
agent-controller Updated |
mirantis.azurecr.io/core/agent-controller:1.41.22 |
|
ceph-kcc-controller Updated |
mirantis.azurecr.io/core/ceph-kcc-controller:1.41.22 |
|
cert-manager-controller |
mirantis.azurecr.io/core/external/cert-manager-controller:v1.11.0-8 |
|
configuration-collector Updated |
mirantis.azurecr.io/core/configuration-collector:1.41.22 |
|
credentials-controller Updated |
mirantis.azurecr.io/core/credentials-controller:1.41.22 |
|
event-controller Updated |
mirantis.azurecr.io/core/event-controller:1.41.22 |
|
frontend Updated |
mirantis.azurecr.io/core/frontend:1.41.22 |
|
host-os-modules-controller Updated |
mirantis.azurecr.io/core/host-os-modules-controller:1.41.22 |
|
iam-controller Updated |
mirantis.azurecr.io/core/iam-controller:1.41.22 |
|
kaas-exporter Updated |
mirantis.azurecr.io/core/kaas-exporter:1.41.22 |
|
kproxy Updated |
mirantis.azurecr.io/core/kproxy:1.41.22 |
|
lcm-controller Updated |
mirantis.azurecr.io/core/lcm-controller:1.41.22 |
|
license-controller Updated |
mirantis.azurecr.io/core/license-controller:1.41.22 |
|
machinepool-controller Updated |
mirantis.azurecr.io/core/machinepool-controller:1.41.22 |
|
mcc-cache-warmup Updated |
mirantis.azurecr.io/core/mcc-cache-warmup:1.41.22 |
|
nginx Updated |
mirantis.azurecr.io/core/external/nginx:1.41.22 |
|
openstack-cluster-api-controller Updated |
mirantis.azurecr.io/core/openstack-cluster-api-controller:1.41.22 |
|
portforward-controller Updated |
mirantis.azurecr.io/core/portforward-controller:1.41.22 |
|
rbac-controller Updated |
mirantis.azurecr.io/core/rbac-controller:1.41.22 |
|
registry |
mirantis.azurecr.io/lcm/registry:v2.8.1-14 |
|
release-controller Updated |
mirantis.azurecr.io/core/release-controller:1.41.22 |
|
scope-controller Updated |
mirantis.azurecr.io/core/scope-controller:1.41.22 |
|
secret-controller Updated |
mirantis.azurecr.io/core/secret-controller:1.41.22 |
|
user-controller Updated |
mirantis.azurecr.io/core/user-controller:1.41.22 |
Artifact |
Component |
Path |
|---|---|---|
Binaries |
hash-generate-darwin |
http://binary.mirantis.com/iam/bin/hash-generate-0.0.1-268-3cf7f17-darwin |
hash-generate-linux |
http://binary.mirantis.com/iam/bin/hash-generate-0.0.1-268-3cf7f17-linux |
|
Helm charts Updated |
iam |
|
Docker images |
kubectl |
mirantis.azurecr.io/general/kubectl:20240926142019 |
kubernetes-entrypoint |
mirantis.azurecr.io/openstack/extra/kubernetes-entrypoint:v1.0.1-ba8ada4-20240405150338 |
|
mariadb |
mirantis.azurecr.io/general/mariadb:10.6.17-focal-20240909113408 |
|
mcc-keycloak |
mirantis.azurecr.io/iam/mcc-keycloak:25.0.6-20240926140203 |
Important
For MOSK clusters, Container Cloud 2.28.1 is the continuation for MOSK 24.2.x series using the patch Cluster release 17.2.5. For the update path of 24.1, 24.2, and 24.3 series, see MOSK documentation: Release Compatibility Matrix - Managed cluster update schema.
The management cluster of a MOSK 24.2.x cluster is automatically updated to the latest patch Cluster release 16.3.1.
The Container Cloud patch release 2.28.1, which is based on the 2.28.0 major release, provides the following updates:
Support for the patch Cluster release 16.3.1.
Support for the patch Cluster releases 16.2.5 and 17.2.5 that represents Mirantis OpenStack for Kubernetes (MOSK) patch release 24.2.3 patch.
Support for MKE 3.7.15.
Bare metal: update of Ubuntu mirror from 2024-09-11-014225 to ubuntu-2024-10-14-013948 along with update of minor kernel version from 5.15.0-119-generic to 5.15.0-122-generic.
Security fixes for CVEs in images.
This patch release also supports the latest major Cluster releases 17.3.0 and 16.3.0. And it does not support greenfield deployments based on deprecated Cluster releases. Use the latest available Cluster release instead.
For main deliverables of the parent Container Cloud release of 2.28.1, refer to 2.28.0.
In total, since Container Cloud 2.28.0, 400 Common Vulnerabilities and Exposures (CVE) have been fixed in 2.28.1: 46 of critical and 354 of high severity.
The table below includes the total numbers of addressed unique and common CVEs in images by product component since Container Cloud 2.28.0. The common CVEs are issues addressed across several images.
Product component |
CVE type |
Critical |
High |
Total |
|---|---|---|---|---|
Ceph |
Unique |
0 |
1 |
1 |
Common |
0 |
4 |
4 |
|
Kaas core |
Unique |
1 |
14 |
15 |
Common |
1 |
118 |
119 |
|
StackLight |
Unique |
8 |
40 |
48 |
Common |
45 |
232 |
277 |
Mirantis Security Portal
For the detailed list of fixed and existing CVEs across the Mirantis Container Cloud and MOSK products, refer to Mirantis Security Portal.
MOSK CVEs
For the number of fixed CVEs in the MOSK-related components including OpenStack and Tungsten Fabric, refer to MOSK 24.2.3: Security notes.
The following issues have been addressed in the Container Cloud patch release 2.28.1 along with the patch Cluster releases 16.3.1, 16.2.5, and 17.2.5.
[46808] [LCM] Fixed the issue with old kernel metapackages remaining on the cluster after kernel upgrade.
This section lists known issues with workarounds for the Mirantis Container Cloud release 2.28.1 including the Cluster releases 16.2.5, 16.3.1, and 17.2.5.
For other issues that can occur while deploying and operating a Container Cloud cluster, see Troubleshooting Guide.
Note
This section also outlines still valid known issues from previous Container Cloud releases.
Note
Moving forward, the workaround for this issue will be moved from Release Notes to MOSK Troubleshooting Guide: Inspection error on bare metal hosts after dnsmasq restart.
If the dnsmasq pod is restarted during the bootstrap of newly added
nodes, those nodes may fail to undergo inspection. That can result in
inspection error in the corresponding BareMetalHost objects.
The issue can occur when:
The
dnsmasqpod was moved to another node.DHCP subnets were changed, including addition or removal. In this case, the
dhcpdcontainer of thednsmasqpod is restarted.Caution
If changing or adding of DHCP subnets is required to bootstrap new nodes, wait after changing or adding DHCP subnets until the
dnsmasqpod becomes ready, then createBareMetalHostobjects.
To verify whether the nodes are affected:
Verify whether the
BareMetalHostobjects contain theinspection error:kubectl get bmh -n <managed-cluster-namespace-name>
Example of system response:
NAME STATE CONSUMER ONLINE ERROR AGE test-master-1 provisioned test-master-1 true 9d test-master-2 provisioned test-master-2 true 9d test-master-3 provisioned test-master-3 true 9d test-worker-1 provisioned test-worker-1 true 9d test-worker-2 provisioned test-worker-2 true 9d test-worker-3 inspecting true inspection error 19h
Verify whether the
dnsmasqpod was inReadystate when the inspection of the affected baremetal hosts (test-worker-3in the example above) was started:kubectl -n kaas get pod <dnsmasq-pod-name> -oyaml
Example of system response:
... status: conditions: - lastProbeTime: null lastTransitionTime: "2024-10-10T15:37:34Z" status: "True" type: Initialized - lastProbeTime: null lastTransitionTime: "2024-10-11T07:38:54Z" status: "True" type: Ready - lastProbeTime: null lastTransitionTime: "2024-10-11T07:38:54Z" status: "True" type: ContainersReady - lastProbeTime: null lastTransitionTime: "2024-10-10T15:37:34Z" status: "True" type: PodScheduled containerStatuses: - containerID: containerd://6dbcf2fc4b36ce4c549c9191ab01f72d0236c51d42947675302675e4bfaf4cdf image: docker-dev-kaas-virtual.artifactory-eu.mcp.mirantis.net/bm/baremetal-dnsmasq:base-2-28-alpine-20240812132650 imageID: docker-dev-kaas-virtual.artifactory-eu.mcp.mirantis.net/bm/baremetal-dnsmasq@sha256:3dad3e278add18e69b2608e462691c4823942641a0f0e25e6811e703e3c23b3b lastState: terminated: containerID: containerd://816fcf079cd544acd74e312065de5b5ed4dbf1dc6159fefffff4f644b5e45987 exitCode: 0 finishedAt: "2024-10-11T07:38:35Z" reason: Completed startedAt: "2024-10-10T15:37:45Z" name: dhcpd ready: true restartCount: 2 started: true state: running: startedAt: "2024-10-11T07:38:37Z" ...
In the system response above, the
dhcpdcontainer was not ready between"2024-10-11T07:38:35Z"and"2024-10-11T07:38:54Z".Verify the affected baremetal host. For example:
kubectl get bmh -n managed-ns test-worker-3 -oyaml
Example of system response:
... status: errorCount: 15 errorMessage: Introspection timeout errorType: inspection error ... operationHistory: deprovision: end: null start: null inspect: end: null start: "2024-10-11T07:38:19Z" provision: end: null start: null register: end: "2024-10-11T07:38:19Z" start: "2024-10-11T07:37:25Z"
In the system response above, inspection was started at
"2024-10-11T07:38:19Z", immediately before the period of thedhcpdcontainer downtime. Therefore, this node is most likely affected by the issue.
Workaround
Reboot the node using the IPMI reset or cycle command.
If the node fails to boot, remove the failed
BareMetalHostobject and create it again:Remove
BareMetalHostobject. For example:kubectl delete bmh -n managed-ns test-worker-3
Verify that the
BareMetalHostobject is removed:kubectl get bmh -n managed-ns test-worker-3
Create a
BareMetalHostobject from the template. For example:kubectl create -f bmhc-test-worker-3.yaml kubectl create -f bmh-test-worker-3.yaml
Due to the MetalLB upstream issue, a load balancer service may not obtain the external IP address.
The issue occurs when two services share the same external IP address and have
the same externalTrafficPolicy value. Initially, the services have the
external IP address assigned and are accessible. After modifying the
externalTrafficPolicy value for both services from Cluster to
Local, the first service that has been changed remains with no external IP
address assigned. Though, the second service, which was changed later, has the
external IP assigned as expected.
To work around the issue, make a dummy change to the service object where
external IP is <pending>:
Identify the service that is stuck:
kubectl get svc -A | grep pending
Example of system response:
stacklight iam-proxy-prometheus LoadBalancer 10.233.28.196 <pending> 443:30430/TCP
Add an arbitrary label to the service that is stuck. For example:
kubectl label svc -n stacklight iam-proxy-prometheus reconcile=1
Example of system response:
service/iam-proxy-prometheus labeledVerify that the external IP was allocated to the service:
kubectl get svc -n stacklight iam-proxy-prometheus
Example of system response:
NAME TYPE CLUSTER-IP EXTERNAL-IP PORT(S) AGE iam-proxy-prometheus LoadBalancer 10.233.28.196 10.0.34.108 443:30430/TCP 12d
During deletion of a manager machine running the ironic Pod from a bare
metal management cluster, the following problems occur:
All Pods are stuck in the
TerminatingstateA new
ironicPod fails to startThe related bare metal host is stuck in the
deprovisioningstate
As a workaround, before deletion of the node running the ironic Pod,
cordon and drain the node using the kubectl cordon <nodeName> and
kubectl drain <nodeName> commands.
Fixed in 2.29.3 (17.3.8, 16.3.8, and 16.4.3)
Due to the upstream Ceph issue
66717,
during CVE upgrade of the Ceph daemon image of Ceph Reef 18.2.4, OSDs may start
slow and even fail the starting probe with the following describe output in
the rook-ceph-osd-X pod:
Warning Unhealthy 57s (x16 over 3m27s) kubelet Startup probe failed:
ceph daemon health check failed with the following output:
> no valid command found; 10 closest matches:
> 0
> 1
> 2
> abort
> assert
> bluefs debug_inject_read_zeros
> bluefs files list
> bluefs stats
> bluestore bluefs device info [<alloc_size:int>]
> config diff
> admin_socket: invalid command
Workaround:
Complete the following steps during every patch or major cluster update of the Cluster releases 17.2.x, 17.3.x, and 17.4.x (until Ceph 18.2.5 becomes supported):
Plan extra time in the maintenance window for the patch cluster update.
Slow starts will still impact the update procedure, but after completing the following step, the recovery process noticeably shortens without affecting the overall cluster state and data responsiveness.
Select one of the following options:
Before the cluster update, set the
nooutflag:ceph osd set noout
Once the Ceph OSDs image upgrade is done, unset the flag:
ceph osd unset noout
Monitor the Ceph OSDs image upgrade. If the symptoms of slow start appear, set the
nooutflag as soon as possible. Once the Ceph OSDs image upgrade is done, unset the flag.
Note
The issue does not reproduce since MOSK 25.2.
Update of a managed cluster based on bare metal and Ceph enabled fails with
PersistentVolumeClaim getting stuck in the Pending state for the
prometheus-server StatefulSet and the
MountVolume.MountDevice failed for volume warning in the StackLight event
logs.
Workaround:
Verify that the description of the Pods that failed to run contain the
FailedMountevents:kubectl -n <affectedProjectName> describe pod <affectedPodName>
In the command above, replace the following values:
<affectedProjectName>is the Container Cloud project name where the Pods failed to run<affectedPodName>is a Pod name that failed to run in the specified project
In the Pod description, identify the node name where the Pod failed to run.
Verify that the
csi-rbdpluginlogs of the affected node contain therbd volume mount failed: <csi-vol-uuid> is being usederror. The<csi-vol-uuid>is a unique RBD volume name.Identify
csiPodNameof the correspondingcsi-rbdplugin:kubectl -n rook-ceph get pod -l app=csi-rbdplugin \ -o jsonpath='{.items[?(@.spec.nodeName == "<nodeName>")].metadata.name}'
Output the affected
csiPodNamelogs:kubectl -n rook-ceph logs <csiPodName> -c csi-rbdplugin
Scale down the affected
StatefulSetorDeploymentof the Pod that fails to0replicas.On every
csi-rbdpluginPod, search for stuckcsi-vol:for pod in `kubectl -n rook-ceph get pods|grep rbdplugin|grep -v provisioner|awk '{print $1}'`; do echo $pod kubectl exec -it -n rook-ceph $pod -c csi-rbdplugin -- rbd device list | grep <csi-vol-uuid> done
Unmap the affected
csi-vol:rbd unmap -o force /dev/rbd<i>
The
/dev/rbd<i>value is a mapped RBD volume that usescsi-vol.Delete
volumeattachmentof the affected Pod:kubectl get volumeattachments | grep <csi-vol-uuid> kubectl delete volumeattacmhent <id>
Scale up the affected
StatefulSetorDeploymentback to the original number of replicas and wait until its state becomesRunning.
Fixed in 2.28.2 (17.2.6, 16.2.6, and 16.3.2)
Upgrade from MKE 3.7.12 to 3.7.15 may get stuck due to the leftover
ucp-upgrade-check-images service that is part of MKE 3.7.12.
As a workaround, on any master node, remove the leftover service using the docker service rm ucp-upgrade-check-images command.
Fixed in 2.29.0 (17.4.0 and 16.4.0)
During the replacement of a master node on a cluster of any type, the process
may get stuck with Kubelet's NodeReady condition is Unknown in the
machine status on the remaining master nodes.
As a workaround, log in on the affected node and run the following command:
docker restart ucp-kubelet
During MariaDB operations on a management cluster, Pods may get stuck in continuous restarts with the following example error:
[ERROR] WSREP: Corrupt buffer header: \
addr: 0x7faec6f8e518, \
seqno: 3185219421952815104, \
size: 909455917, \
ctx: 0x557094f65038, \
flags: 11577. store: 49, \
type: 49
Workaround:
Create a backup of the
/var/lib/mysqldirectory on themariadb-serverPod.Verify that other replicas are up and ready.
Remove the
galera.cachefile for the affectedmariadb-serverPod.Remove the affected
mariadb-serverPod or wait until it is automatically restarted.
After Kubernetes restarts the Pod, the Pod clones the database in 1-2 minutes and restores the quorum.
Fixed in 2.28.4 (17.3.4 and 16.3.4)
During replacement of a master node on a cluster of any type, the
calico-node Pod fails to start on a new node that has the same IP address
as the node being replaced.
Workaround:
Log in to any
masternode.From a CLI with an MKE client bundle, create a shell alias to start calicoctl using the
mirantis/ucp-dsinfoimage:alias calicoctl="\ docker run -i --rm \ --pid host \ --net host \ -e constraint:ostype==linux \ -e ETCD_ENDPOINTS=<etcdEndpoint> \ -e ETCD_KEY_FILE=/var/lib/docker/volumes/ucp-kv-certs/_data/key.pem \ -e ETCD_CA_CERT_FILE=/var/lib/docker/volumes/ucp-kv-certs/_data/ca.pem \ -e ETCD_CERT_FILE=/var/lib/docker/volumes/ucp-kv-certs/_data/cert.pem \ -v /var/run/calico:/var/run/calico \ -v /var/lib/docker/volumes/ucp-kv-certs/_data:/var/lib/docker/volumes/ucp-kv-certs/_data:ro \ mirantis/ucp-dsinfo:<mkeVersion> \ calicoctl \ "
alias calicoctl="\ docker run -i --rm \ --pid host \ --net host \ -e constraint:ostype==linux \ -e ETCD_ENDPOINTS=<etcdEndpoint> \ -e ETCD_KEY_FILE=/ucp-node-certs/key.pem \ -e ETCD_CA_CERT_FILE=/ucp-node-certs/ca.pem \ -e ETCD_CERT_FILE=/ucp-node-certs/cert.pem \ -v /var/run/calico:/var/run/calico \ -v ucp-node-certs:/ucp-node-certs:ro \ mirantis/ucp-dsinfo:<mkeVersion> \ calicoctl --allow-version-mismatch \ "
In the above command, replace the following values with the corresponding settings of the affected cluster:
<etcdEndpoint>is the etcd endpoint defined in the Calico configuration file. For example,ETCD_ENDPOINTS=127.0.0.1:12378<mkeVersion>is the MKE version installed on your cluster. For example,mirantis/ucp-dsinfo:3.5.7.
Verify the node list on the cluster:
kubectl get node
Compare this list with the node list in Calico to identify the old node:
calicoctl get node -o wide
Remove the old node from Calico:
calicoctl delete node kaas-node-<nodeID>
Fixed in 2.28.4 (17.3.4 and 16.3.4)
During replacement of a manager machine, the following problems may occur:
The system adds the node to Docker swarm but not to Kubernetes
The node
Deploymentgets stuck with failed RethinkDB health checks
Workaround:
Delete the failed node.
Wait for the MKE cluster to become healthy. To monitor the cluster status:
Log in to the MKE web UI.
Monitor the cluster status as described in MKE Operations Guide: Monitor an MKE cluster with the MKE web UI.
Deploy a new node.
Fixed in 2.28.4 (17.3.4 and 16.3.4)
During the unsafe or forced deletion of a manager machine running the
calico-kube-controllers Pod in the kube-system namespace,
the following issues occur:
The
calico-kube-controllersPod fails to clean up resources associated with the deleted nodeThe
calico-nodePod may fail to start up on a newly created node if the machine is provisioned with the same IP address as the deleted machine had
As a workaround, before deletion of the node running the
calico-kube-controllers Pod, cordon and drain the node:
kubectl cordon <nodeName>
kubectl drain <nodeName>
Fixed in 2.28.3 (17.2.7, 16.2.7, and 16.3.3)
The Patroni pods may get stuck in the CrashLoopBackOff state due to the
patroni container being terminated with reason: OOMKilled that you can
see in the pod status. For example:
kubectl get pod/patroni-13-0 -n stacklight -o yaml
...
- containerID: docker://<ID>`
image: mirantis.azurecr.io/stacklight/spilo:13-2.1p9-20240828023010
imageID: docker-pullable://mirantis.azurecr.io/stacklight/spilo@sha256:<ID>
lastState:
terminated:
containerID: docker://<ID>
exitCode: 137
finishedAt: "2024-10-17T14:26:25Z"
reason: OOMKilled
startedAt: "2024-10-17T14:23:25Z"
name: patroni
...
As a workaround, increase the memory limit for PostgreSQL to 20Gi in
the Cluster object:
spec:
providerSpec:
value:
helmReleases:
- name: stacklight
values:
resources:
postgresql:
limits:
memory: "20Gi"
For a detailed procedure of StackLight configuration, see MOSK Operations
Guide: Configure StackLight.
For description of the resources option, see MOSK Operations Guide:
StackLight configuration parameters - Resource limits.
Fixed in 2.28.2 (17.2.6, 16.2.6, and 16.3.2)
Due to the JSON-based format of ucp-kubelet logs, OpenSearch does not store
kubelet logs. Mirantis is working on the issue and will deliver the resolution
in one of the nearest patch releases.
Fixed in 2.29.0 (17.4.0 and 16.4.0)
On High Availability (HA) clusters that use Local Volume Provisioner (LVP), Prometheus and OpenSearch from StackLight may share the same pool of storage. In such configuration, OpenSearch may approach the 85% disk usage watermark due to the combined storage allocation and usage patterns set by the Persistent Volume Claim (PVC) size parameters for Prometheus and OpenSearch, which consume storage the most.
When the 85% threshold is reached, the affected node is transitioned to the
read-only state, preventing shard allocation and causing the OpenSearch cluster
state to transition to Warning (Yellow) or Critical (Red).
Caution
The issue and the provided workaround apply only for clusters on which OpenSearch and Prometheus utilize the same storage pool.
To verify that the cluster is affected:
Verify the result of the following formula:
0.8 × OpenSearch_PVC_Size_GB + Prometheus_PVC_Size_GB > 0.85 × Total_Storage_Capacity_GBIn the formula, define the following values:
- OpenSearch_PVC_Size_GB
Derived from
.values.elasticsearch.persistentVolumeUsableStorageSizeGB, defaulting to.values.elasticsearch.persistentVolumeClaimSizeif unspecified. To obtain the OpenSearch PVC size:kubectl -n <namespaceName> get cluster <clusterName> -o yaml |\ yq '.spec.providerSpec.value.helmReleases[] | select(.name == "stacklight") | .values.elasticsearch.persistentVolumeClaimSize '
Example of system response:
10000Gi
- Prometheus_PVC_Size_GB
Sourced from
.values.prometheusServer.persistentVolumeClaimSize. To obtain the Prometheus PVC size:kubectl -n <namespaceName> get cluster <clusterName> -o yaml |\ yq '.spec.providerSpec.value.helmReleases[] | select(.name == "stacklight") | .values.prometheusServer.persistentVolumeClaimSize '
Example of system response:
4000Gi
- Total_Storage_Capacity_GB
Total capacity of the OpenSearch PVCs. For LVP, the capacity of the storage pool. To obtain the total capacity:
kubectl get pvc -n stacklight -l app=opensearch-master \ -o custom-columns=NAME:.metadata.name,CAPACITY:.status.capacity.storage
The system response contains multiple outputs, one per
opensearch-masternode. Select the capacity for the affected node.
Note
Convert the values to GB if they are set in different units.
If the formula result is positive, it is an early indication that the cluster is affected.
Verify whether the
OpenSearchClusterStatusWarningorOpenSearchClusterStatusCriticalalert is firing. And if so, verify the following:Log in to the OpenSearch web UI.
In Management -> Dev Tools, run the following command:
GET _cluster/allocation/explainThe following system response indicates that the corresponding node is affected:
"explanation": "the node is above the low watermark cluster setting \ [cluster.routing.allocation.disk.watermark.low=85%], using more disk space \ than the maximum allowed [85.0%], actual free: [xx.xxx%]"
Note
The system response may contain even higher watermark percent than 85.0%, depending on the case.
Workaround:
Warning
The workaround implies adjustement of the retention threshold for OpenSearch. And depending on the new threshold, some old logs will be deleted.
Adjust or set
.values.elasticsearch.persistentVolumeUsableStorageSizeGBto a lower value for the affection check formula to be non-positive. For configuration details, see MOSK Operations Guide: StackLight configuration parameters - OpenSearch.Mirantis also recommends reserving some space for other PVCs using storage from the pool. Use the following formula to calculate the required space:
persistentVolumeUsableStorageSizeGB = 0.84 × ((1 - Reserved_Percentage - Filesystem_Reserve) × Total_Storage_Capacity_GB - Prometheus_PVC_Size_GB) / 0.8
In the formula, define the following values:
- Reserved_Percentage
A user-defined variable that specifies what percentage of the total storage capacity should not be used by OpenSearch or Prometheus. This is used to reserve space for other components. It should be expressed as a decimal. For example, for 5% of reservation,
Reserved_Percentageis 0.05. Mirantis recommends using 0.05 as a starting point.- Filesystem_Reserve
Percentage to deduct for filesystems that may reserve some portion of the available storage, which is marked as occupied. For example, for EXT4, it is 5% by default, so the value must be 0.05.
- Prometheus_PVC_Size_GB
Sourced from
.values.prometheusServer.persistentVolumeClaimSize.- Total_Storage_Capacity_GB
Total capacity of the OpenSearch PVCs. For LVP, the capacity of the storage pool. To obtain the total capacity:
kubectl get pvc -n stacklight -l app=opensearch-master \ -o custom-columns=NAME:.metadata.name,CAPACITY:.status.capacity.storage
The system response contains multiple outputs, one per
opensearch-masternode. Select the capacity for the affected node.
Note
Convert the values to GB if they are set in different units.
Calculation of above formula provides a maximum safe storage to allocate for
.values.elasticsearch.persistentVolumeUsableStorageSizeGB. Use this formula as a reference for setting.values.elasticsearch.persistentVolumeUsableStorageSizeGBon a cluster.Wait up to 15-20 mins for OpenSearch to perform the cleaning.
Verify that the cluster is not affected anymore using the procedure above.
Fixed in 2.30.0 (21.0.0 and 20.0.0)
A compact MOSK cluster fails to be deployed through the Container Cloud web UI
due to inability to add any label to the control plane machines along with
inability to change dedicatedControlPlane: false using the web UI.
To work around the issue, manually add the required labels using CLI. Once done, the cluster deployment resumes.
A newly created project does not display all available tabs in the Container
Cloud web UI and contains different access denied errors during first five
minutes after creation.
To work around the issue, refresh the browser in five minutes after the project creation.
This section lists the artifacts of components included in the Container Cloud patch release 2.28.1. For artifacts of the Cluster releases introduced in 2.28.1, see patch Cluster releases 17.2.5, 16.3.1, and 16.2.5.
Note
The components that are newly added, updated, deprecated, or removed
as compared to the previous release version, are marked
with a corresponding superscript,
for example, lcm-ansible Updated.
Artifact |
Component |
Path |
|---|---|---|
Binaries Updated |
ironic-python-agent.initramfs |
https://binary.mirantis.com/bm/bin/ironic/ipa/ubuntu/initramfs-yoga-focal-debug-20241014163420 |
ironic-python-agent.kernel |
https://binary.mirantis.com/bm/bin/ironic/ipa/ubuntu/kernel-yoga-focal-debug-20241014163420 |
|
Helm charts Updated |
baremetal-api |
https://binary.mirantis.com/core/helm/baremetal-api-1.41.18.tgz |
baremetal-operator |
https://binary.mirantis.com/core/helm/baremetal-operator-1.41.18.tgz |
|
baremetal-provider |
https://binary.mirantis.com/core/helm/baremetal-provider-1.41.18.tgz |
|
baremetal-public-api |
https://binary.mirantis.com/core/helm/baremetal-public-api-1.41.18.tgz |
|
kaas-ipam |
||
Docker images |
ambasador Updated |
mirantis.azurecr.io/core/external/nginx:1.41.18 |
baremetal-dnsmasq Updated |
mirantis.azurecr.io/bm/baremetal-dnsmasq:base-2-28-alpine-20241022121257 |
|
baremetal-operator Updated |
mirantis.azurecr.io/bm/baremetal-operator:base-2-28-alpine-20241022120949 |
|
bm-collective Updated |
mirantis.azurecr.io/bm/bm-collective:base-2-28-alpine-20241022120001 |
|
cluster-api-provider-baremetal Updated |
mirantis.azurecr.io/core/cluster-api-provider-baremetal:1.41.18 |
|
ironic Updated |
mirantis.azurecr.io/openstack/ironic:antelope-jammy-20240927160001 |
|
ironic-inspector Updated |
mirantis.azurecr.io/openstack/ironic-inspector:antelope-jammy-20240927160001 |
|
ironic-prometheus-exporter |
mirantis.azurecr.io/stacklight/ironic-prometheus-exporter:0.1-20240819102310 |
|
kaas-ipam Updated |
mirantis.azurecr.io/bm/kaas-ipam:base-2-28-alpine-20241022122006 |
|
kubernetes-entrypoint Updated |
mirantis.azurecr.io/openstack/extra/kubernetes-entrypoint:v1.0.1-34a4f54-20240910081335 |
|
mariadb Updated |
mirantis.azurecr.io/general/mariadb:10.6.17-jammy-20240927170336 |
|
syslog-ng Updated |
mirantis.azurecr.io/bm/syslog-ng:base-alpine-20241022120929 |
Artifact |
Component |
Path |
|---|---|---|
Bootstrap tarball Updated |
bootstrap-darwin |
https://binary.mirantis.com/core/bin/bootstrap-darwin-1.41.18.tgz |
bootstrap-linux |
https://binary.mirantis.com/core/bin/bootstrap-linux-1.41.18.tgz |
|
Helm charts Updated |
admission-controller |
https://binary.mirantis.com/core/helm/admission-controller-1.41.18.tgz |
agent-controller |
https://binary.mirantis.com/core/helm/agent-controller-1.41.18.tgz |
|
ceph-kcc-controller |
https://binary.mirantis.com/core/helm/ceph-kcc-controller-1.41.18.tgz |
|
cert-manager |
https://binary.mirantis.com/core/helm/cert-manager-1.41.18.tgz |
|
configuration-collector |
https://binary.mirantis.com/core/helm/configuration-collector-1.41.18.tgz |
|
credentials-controller |
https://binary.mirantis.com/core/helm/credentials-controller-1.41.18.tgz |
|
event-controller |
https://binary.mirantis.com/core/helm/event-controller-1.41.18.tgz |
|
host-os-modules-controller |
https://binary.mirantis.com/core/helm/host-os-modules-controller-1.41.18.tgz |
|
iam-controller |
https://binary.mirantis.com/core/helm/iam-controller-1.41.18.tgz |
|
kaas-exporter |
https://binary.mirantis.com/core/helm/kaas-exporter-1.41.18.tgz |
|
kaas-public-api |
https://binary.mirantis.com/core/helm/kaas-public-api-1.41.18.tgz |
|
kaas-ui |
||
lcm-controller |
https://binary.mirantis.com/core/helm/lcm-controller-1.41.18.tgz |
|
license-controller |
https://binary.mirantis.com/core/helm/license-controller-1.41.18.tgz |
|
machinepool-controller |
https://binary.mirantis.com/core/helm/machinepool-controller-1.41.18.tgz |
|
mcc-cache |
||
mcc-cache-warmup |
https://binary.mirantis.com/core/helm/mcc-cache-warmup-1.41.18.tgz |
|
openstack-provider |
https://binary.mirantis.com/core/helm/openstack-provider-1.41.18.tgz |
|
portforward-controller |
https://binary.mirantis.com/core/helm/portforward-controller-1.41.18.tgz |
|
rbac-controller |
https://binary.mirantis.com/core/helm/rbac-controller-1.41.18.tgz |
|
release-controller |
https://binary.mirantis.com/core/helm/release-controller-1.41.18.tgz |
|
scope-controller |
https://binary.mirantis.com/core/helm/scope-controller-1.41.18.tgz |
|
secret-controller |
https://binary.mirantis.com/core/helm/secret-controller-1.41.18.tgz |
|
user-controller |
https://binary.mirantis.com/core/helm/user-controller-1.41.18.tgz |
|
Docker images |
admission-controller Updated |
mirantis.azurecr.io/core/admission-controller:1.41.18 |
agent-controller Updated |
mirantis.azurecr.io/core/agent-controller:1.41.18 |
|
ceph-kcc-controller Updated |
mirantis.azurecr.io/core/ceph-kcc-controller:1.41.18 |
|
cert-manager-controller |
mirantis.azurecr.io/core/external/cert-manager-controller:v1.11.0-8 |
|
configuration-collector Updated |
mirantis.azurecr.io/core/configuration-collector:1.41.18 |
|
credentials-controller Updated |
mirantis.azurecr.io/core/credentials-controller:1.41.18 |
|
event-controller Updated |
mirantis.azurecr.io/core/event-controller:1.41.18 |
|
frontend Updated |
mirantis.azurecr.io/core/frontend:1.41.18 |
|
host-os-modules-controller Updated |
mirantis.azurecr.io/core/host-os-modules-controller:1.41.18 |
|
iam-controller Updated |
mirantis.azurecr.io/core/iam-controller:1.41.18 |
|
kaas-exporter Updated |
mirantis.azurecr.io/core/kaas-exporter:1.41.18 |
|
kproxy Updated |
mirantis.azurecr.io/core/kproxy:1.41.18 |
|
lcm-controller Updated |
mirantis.azurecr.io/core/lcm-controller:1.41.18 |
|
license-controller Updated |
mirantis.azurecr.io/core/license-controller:1.41.18 |
|
machinepool-controller Updated |
mirantis.azurecr.io/core/machinepool-controller:1.41.18 |
|
mcc-cache-warmup Updated |
mirantis.azurecr.io/core/mcc-cache-warmup:1.41.18 |
|
nginx Updated |
mirantis.azurecr.io/core/external/nginx:1.41.18 |
|
openstack-cluster-api-controller Updated |
mirantis.azurecr.io/core/openstack-cluster-api-controller:1.41.18 |
|
portforward-controller Updated |
mirantis.azurecr.io/core/portforward-controller:1.41.18 |
|
rbac-controller Updated |
mirantis.azurecr.io/core/rbac-controller:1.41.18 |
|
registry Updated |
mirantis.azurecr.io/lcm/registry:v2.8.1-14 |
|
release-controller Updated |
mirantis.azurecr.io/core/release-controller:1.41.18 |
|
scope-controller Updated |
mirantis.azurecr.io/core/scope-controller:1.41.18 |
|
secret-controller Updated |
mirantis.azurecr.io/core/secret-controller:1.41.18 |
|
user-controller Updated |
mirantis.azurecr.io/core/user-controller:1.41.18 |
Artifact |
Component |
Path |
|---|---|---|
Binaries |
hash-generate-darwin |
http://binary.mirantis.com/iam/bin/hash-generate-0.0.1-268-3cf7f17-darwin |
hash-generate-linux |
http://binary.mirantis.com/iam/bin/hash-generate-0.0.1-268-3cf7f17-linux |
|
Helm charts Updated |
iam |
|
Docker images |
kubectl |
mirantis.azurecr.io/general/kubectl:20240926142019 |
kubernetes-entrypoint |
mirantis.azurecr.io/openstack/extra/kubernetes-entrypoint:v1.0.1-ba8ada4-20240405150338 |
|
mariadb |
mirantis.azurecr.io/general/mariadb:10.6.17-focal-20240909113408 |
|
mcc-keycloak |
mirantis.azurecr.io/iam/mcc-keycloak:25.0.6-20240926140203 |
The Mirantis Container Cloud major release 2.28.0:
Introduces support for the Cluster release 17.3.0 that is based on the Cluster release 16.3.0 and represents Mirantis OpenStack for Kubernetes (MOSK) 24.3.
Introduces support for the Cluster release 16.3.0 that is based on Mirantis Container Runtime (MCR) 23.0.14 and Mirantis Kubernetes Engine (MKE) 3.7.12 with Kubernetes 1.27.
Does not support greenfield deployments on deprecated Cluster releases of the 17.2.x and 16.2.x series. Use the latest available Cluster releases of the series instead.
Caution
Make sure to update the Cluster release version of your managed cluster before the current Cluster release version becomes unsupported by a new Container Cloud release version. Otherwise, Container Cloud stops auto-upgrade and eventually Container Cloud itself becomes unsupported.
This section outlines release notes for the Container Cloud release 2.28.0.
This section outlines new features and enhancements introduced in the Container Cloud release 2.28.0. For the list of enhancements delivered with the Cluster releases introduced by Container Cloud 2.28.0, see 17.3.0 and 16.3.0.
Implemented full support for Ubuntu 22.04 LTS (Jammy Jellyfish) as the default host operating system in MOSK clusters, including greenfield deployments and update from Ubuntu 20.04 to 22.04 on existing clusters.
Ubuntu 20.04 is deprecated for greenfield deployments and supported during the MOSK 24.3 release cycle only for existing clusters.
Warning
During the course of the Container Cloud 2.28.x series, Mirantis highly recommends upgrading an operating system on any nodes of all your MOSK cluster machines to Ubuntu 22.04 before the next major Cluster release becomes available.
It is not mandatory to upgrade all machines at once. You can upgrade them one by one or in small batches, for example, if the maintenance window is limited in time.
Otherwise, the Cluster release update of the Ubuntu 20.04-based MOSK clusters will become impossible as of Container Cloud 2.29.0 with Ubuntu 22.04 as the only supported version.
Management cluster update to Container Cloud 2.29.1 will be blocked if at least one node of any related MOSK cluster is running Ubuntu 20.04.
Note
Since Container Cloud 2.27.0 (Cluster release 16.2.0), existing MOSK management clusters were automatically updated to Ubuntu 22.04 during cluster upgrade. Greenfield deployments of management clusters are also based on Ubuntu 22.04.
TechPreview
Implemented the capability to update custom modules using deprecation. Once
you create a new custom module, you can use it to deprecate another module
by adding the deprecates field to metadata.yaml of the new module.
The related HostOSConfiguration and HostOSConfigurationModules objects
reflect the deprecation status of new and old modules using the corresponding
fields in spec and status sections.
Also, added monitoring of deprecated modules by implementing the StackLight
metrics for the Host Operating System Modules Controller along with the
Day2ManagementControllerTargetDown and Day2ManagementDeprecatedConfigs
alerts to notify the cloud operator about detected deprecations and issues with
host-os-modules-controller.
Note
Deprecation is soft, meaning that no actual restrictions are applied to the usage of a deprecated module.
Caution
Deprecating a version automatically deprecates all lower SemVer versions of the specified module.
TechPreview
Introduced the following configuration enhancements for custom modules:
- Module-specific Ansible configuration
Updated the Ansible execution mechanism for running any modules. The default
ansible.cfgfile is now placed in/etc/ansible/mcc.cfgand used for execution oflcm-ansibleand day-2 modules. However, if a module has its ownansible.cfgin the module root folder, such configuration is used for the module execution instead of the default one.
- Configuration of supported operating system distribution
Added the
supportedDistributionsto themetadatasection of a module custom resource to define the list of supported operating system distributions for the module. This field is informative and does not block the module execution on machines running non-supported distributions, but such execution will be most probably completed with an error.
- Separate flag for machines requiring reboot
Introduced a separate
/run/day2/reboot-requiredfile for day-2 modules to add a notification about required reboot for a machine and a reason for reboot that appear after the module execution. The feature allows for separation of the reboot reason between LCM and day-2 operations.
TechPreview
Implemented the update group for controller nodes using the UpdateGroup
resource, which is automatically generated during initial cluster creation with
the following settings:
Name:
<cluster-name>-controlIndex:
1Concurrent updates:
1
This feature decouples the concurrency settings from the global cluster level and provides update flexibility.
All control plane nodes are automatically assigned to the control update group with no possibility to change it.
Note
On existing clusters created before 2.28.0 (Cluster releases 17.2.0, 16.2.0, or earlier), the control update group is created after upgrade of the Container Cloud release to 2.28.0 (Cluster release 16.3.0) on the management cluster.
TechPreview
Implemented the rebootIfUpdateRequires parameter for the UpdateGroup
custom resource. The parameter allows for rebooting a set of controller or
worker machines added to an update group during a Cluster release update that
requires a reboot, for example, when kernel version update is available in the
target Cluster release. The feature reduces manual intervention and overall
downtime during cluster update.
Note
By default, rebootIfUpdateRequires is set to false on managed
clusters and to true on management clusters.
Implemented the Diagnostic Controller that is a tool with a set of diagnostic checks to perform self-diagnostics of any Container Cloud cluster and help the operator to easily understand, troubleshoot, and resolve potential issues against the following major subsystems: core, bare metal, Ceph, StackLight, Tungsten Fabric, and OpenStack. The Diagnostic Controller analyzes the configuration of the cluster subsystems and reports results of checks that contain useful information about cluster health.
Running self-diagnostics on both management and managed clusters is essential to ensure the overall health and optimal performance of your cluster. Mirantis recommends running self-diagnostics before cluster update, node replacement, or any other significant changes in the cluster to prevent potential issues and optimize maintenance window.
TechPreview
Simplified the default auditd configuration by implementing the preset
groups that you can use in presetRules instead of exact names or the
virtual group all. The feature allows enabling a limited set of presets
using a single keyword (group name).
Also, optimized disk usage by removing the following Docker rule that was removed from the Docker CIS Benchmark 1.3.0 due to producing excessive events:
# 1.2.4 Ensure auditing is configured for Docker files and directories - /var/lib/docker
-w /var/lib/docker -k docker
TechPreview
Enhanced the ClusterUpdatePlan object by adding a separate update step for
each UpdateGroup of worker nodes of a managed cluster. The feature allows
the operator to granularly control the update process and its impact on
workloads, with the option to pause the update after each step.
Also, added several StackLight alerts to notify the operator about the update progress and potential update issues.
Refactored the MCCUpgrade object by implementing a new mechanism to delay
Container Cloud release updates. You now have the following options for
auto-update of a management cluster:
Automatically update a cluster on the publish day of a new release (by default).
Set specific days and hours for an auto-update allowing delays of up to one week. For example, if a release becomes available on Monday, you can delay it until Sunday by setting Sunday as the only permitted day for auto-updates.
Delay auto-update for minimum 20 days for each newly discovered release. The exact number of delay days is set in the release metadata and cannot be changed by the user. It depends on the specifics of each release cycle and on optional configuration of week days and hours selected for update.
You can verify the exact date of a scheduled auto-update either in the Status section of the Management Cluster Updates page in the web UI or in the
statussection of theMCCUpgradeobject.Combine auto-update delay with the specific days and hours setting (two previous options).
Also, optimized monitoring of auto-update by implementing several StackLight
metrics for the kaas-exporter job along with the MCCUpdateBlocked and
MCCUpdateScheduled alerts to notify the cloud operator about new releases
as well as other important information about management cluster auto-update.
Refactored and improved UX visibility as well as added the following functionality for the bare metal managed clusters in the Container Cloud web UI:
Reworked the Create Subnets page:
Added the possibility to delete a subnet when it is not used by a cluster
Changed the default value of Use whole CIDR from
truetofalseAdded storage subnet types: Storage access and Storage replication
Added the MetalLB Configs tab with configuration fields for MetalLB on the Networks page
Optimized the Create new machine form
Replicated the Create Credential form on the Baremetal page for easy access
Added the Labels fields to the Create L2 template and Create host profile forms as well as optimized uploading of specification data for these objects
On top of continuous improvements delivered to the existing Container Cloud
guides, added documentation on how to run Ceph performance tests using
Kubernetes batch or cron jobs that run
fio
processes according to a predefined KaaSCephOperationRequest CR.
The following issues have been addressed in the Mirantis Container Cloud release 2.28.0 along with the Cluster releases 17.3.0 and 16.3.0.
Note
This section provides descriptions of issues addressed since the last Container Cloud patch release 2.27.4.
For details on addressed issues in earlier patch releases since 2.27.0, which are also included into the major release 2.28.0, refer to 2.27.x patch releases.
[41305] [Bare metal] Fixed the issue with newly added management cluster nodes failing to undergo provisioning if the management cluster nodes were configured with a single L2 segment used for all network traffic (PXE and LCM/management networks).
[46245] [Bare metal] Fixed the issue with lack of permissions for
serviceuserand users with theglobal-adminandoperatorroles to fetch HostOSConfigurationModules and HostOSConfiguration custom resources.[43164] [StackLight] Fixed the issue with rollover policy not being added to indicies created without a policy.
This section lists known issues with workarounds for the Mirantis Container Cloud release 2.28.0 including the Cluster releases 17.3.0 and 16.3.0.
For other issues that can occur while deploying and operating a Container Cloud cluster, see Troubleshooting Guide.
Note
This section also outlines still valid known issues from previous Container Cloud releases.
Note
Moving forward, the workaround for this issue will be moved from Release Notes to MOSK Troubleshooting Guide: Inspection error on bare metal hosts after dnsmasq restart.
If the dnsmasq pod is restarted during the bootstrap of newly added
nodes, those nodes may fail to undergo inspection. That can result in
inspection error in the corresponding BareMetalHost objects.
The issue can occur when:
The
dnsmasqpod was moved to another node.DHCP subnets were changed, including addition or removal. In this case, the
dhcpdcontainer of thednsmasqpod is restarted.Caution
If changing or adding of DHCP subnets is required to bootstrap new nodes, wait after changing or adding DHCP subnets until the
dnsmasqpod becomes ready, then createBareMetalHostobjects.
To verify whether the nodes are affected:
Verify whether the
BareMetalHostobjects contain theinspection error:kubectl get bmh -n <managed-cluster-namespace-name>
Example of system response:
NAME STATE CONSUMER ONLINE ERROR AGE test-master-1 provisioned test-master-1 true 9d test-master-2 provisioned test-master-2 true 9d test-master-3 provisioned test-master-3 true 9d test-worker-1 provisioned test-worker-1 true 9d test-worker-2 provisioned test-worker-2 true 9d test-worker-3 inspecting true inspection error 19h
Verify whether the
dnsmasqpod was inReadystate when the inspection of the affected baremetal hosts (test-worker-3in the example above) was started:kubectl -n kaas get pod <dnsmasq-pod-name> -oyaml
Example of system response:
... status: conditions: - lastProbeTime: null lastTransitionTime: "2024-10-10T15:37:34Z" status: "True" type: Initialized - lastProbeTime: null lastTransitionTime: "2024-10-11T07:38:54Z" status: "True" type: Ready - lastProbeTime: null lastTransitionTime: "2024-10-11T07:38:54Z" status: "True" type: ContainersReady - lastProbeTime: null lastTransitionTime: "2024-10-10T15:37:34Z" status: "True" type: PodScheduled containerStatuses: - containerID: containerd://6dbcf2fc4b36ce4c549c9191ab01f72d0236c51d42947675302675e4bfaf4cdf image: docker-dev-kaas-virtual.artifactory-eu.mcp.mirantis.net/bm/baremetal-dnsmasq:base-2-28-alpine-20240812132650 imageID: docker-dev-kaas-virtual.artifactory-eu.mcp.mirantis.net/bm/baremetal-dnsmasq@sha256:3dad3e278add18e69b2608e462691c4823942641a0f0e25e6811e703e3c23b3b lastState: terminated: containerID: containerd://816fcf079cd544acd74e312065de5b5ed4dbf1dc6159fefffff4f644b5e45987 exitCode: 0 finishedAt: "2024-10-11T07:38:35Z" reason: Completed startedAt: "2024-10-10T15:37:45Z" name: dhcpd ready: true restartCount: 2 started: true state: running: startedAt: "2024-10-11T07:38:37Z" ...
In the system response above, the
dhcpdcontainer was not ready between"2024-10-11T07:38:35Z"and"2024-10-11T07:38:54Z".Verify the affected baremetal host. For example:
kubectl get bmh -n managed-ns test-worker-3 -oyaml
Example of system response:
... status: errorCount: 15 errorMessage: Introspection timeout errorType: inspection error ... operationHistory: deprovision: end: null start: null inspect: end: null start: "2024-10-11T07:38:19Z" provision: end: null start: null register: end: "2024-10-11T07:38:19Z" start: "2024-10-11T07:37:25Z"
In the system response above, inspection was started at
"2024-10-11T07:38:19Z", immediately before the period of thedhcpdcontainer downtime. Therefore, this node is most likely affected by the issue.
Workaround
Reboot the node using the IPMI reset or cycle command.
If the node fails to boot, remove the failed
BareMetalHostobject and create it again:Remove
BareMetalHostobject. For example:kubectl delete bmh -n managed-ns test-worker-3
Verify that the
BareMetalHostobject is removed:kubectl get bmh -n managed-ns test-worker-3
Create a
BareMetalHostobject from the template. For example:kubectl create -f bmhc-test-worker-3.yaml kubectl create -f bmh-test-worker-3.yaml
Due to the MetalLB upstream issue, a load balancer service may not obtain the external IP address.
The issue occurs when two services share the same external IP address and have
the same externalTrafficPolicy value. Initially, the services have the
external IP address assigned and are accessible. After modifying the
externalTrafficPolicy value for both services from Cluster to
Local, the first service that has been changed remains with no external IP
address assigned. Though, the second service, which was changed later, has the
external IP assigned as expected.
To work around the issue, make a dummy change to the service object where
external IP is <pending>:
Identify the service that is stuck:
kubectl get svc -A | grep pending
Example of system response:
stacklight iam-proxy-prometheus LoadBalancer 10.233.28.196 <pending> 443:30430/TCP
Add an arbitrary label to the service that is stuck. For example:
kubectl label svc -n stacklight iam-proxy-prometheus reconcile=1
Example of system response:
service/iam-proxy-prometheus labeledVerify that the external IP was allocated to the service:
kubectl get svc -n stacklight iam-proxy-prometheus
Example of system response:
NAME TYPE CLUSTER-IP EXTERNAL-IP PORT(S) AGE iam-proxy-prometheus LoadBalancer 10.233.28.196 10.0.34.108 443:30430/TCP 12d
During deletion of a manager machine running the ironic Pod from a bare
metal management cluster, the following problems occur:
All Pods are stuck in the
TerminatingstateA new
ironicPod fails to startThe related bare metal host is stuck in the
deprovisioningstate
As a workaround, before deletion of the node running the ironic Pod,
cordon and drain the node using the kubectl cordon <nodeName> and
kubectl drain <nodeName> commands.
Fixed in 2.29.3 (17.3.8, 16.3.8, and 16.4.3)
Due to the upstream Ceph issue
66717,
during CVE upgrade of the Ceph daemon image of Ceph Reef 18.2.4, OSDs may start
slow and even fail the starting probe with the following describe output in
the rook-ceph-osd-X pod:
Warning Unhealthy 57s (x16 over 3m27s) kubelet Startup probe failed:
ceph daemon health check failed with the following output:
> no valid command found; 10 closest matches:
> 0
> 1
> 2
> abort
> assert
> bluefs debug_inject_read_zeros
> bluefs files list
> bluefs stats
> bluestore bluefs device info [<alloc_size:int>]
> config diff
> admin_socket: invalid command
Workaround:
Complete the following steps during every patch or major cluster update of the Cluster releases 17.2.x, 17.3.x, and 17.4.x (until Ceph 18.2.5 becomes supported):
Plan extra time in the maintenance window for the patch cluster update.
Slow starts will still impact the update procedure, but after completing the following step, the recovery process noticeably shortens without affecting the overall cluster state and data responsiveness.
Select one of the following options:
Before the cluster update, set the
nooutflag:ceph osd set noout
Once the Ceph OSDs image upgrade is done, unset the flag:
ceph osd unset noout
Monitor the Ceph OSDs image upgrade. If the symptoms of slow start appear, set the
nooutflag as soon as possible. Once the Ceph OSDs image upgrade is done, unset the flag.
Note
The issue does not reproduce since MOSK 25.2.
Update of a managed cluster based on bare metal and Ceph enabled fails with
PersistentVolumeClaim getting stuck in the Pending state for the
prometheus-server StatefulSet and the
MountVolume.MountDevice failed for volume warning in the StackLight event
logs.
Workaround:
Verify that the description of the Pods that failed to run contain the
FailedMountevents:kubectl -n <affectedProjectName> describe pod <affectedPodName>
In the command above, replace the following values:
<affectedProjectName>is the Container Cloud project name where the Pods failed to run<affectedPodName>is a Pod name that failed to run in the specified project
In the Pod description, identify the node name where the Pod failed to run.
Verify that the
csi-rbdpluginlogs of the affected node contain therbd volume mount failed: <csi-vol-uuid> is being usederror. The<csi-vol-uuid>is a unique RBD volume name.Identify
csiPodNameof the correspondingcsi-rbdplugin:kubectl -n rook-ceph get pod -l app=csi-rbdplugin \ -o jsonpath='{.items[?(@.spec.nodeName == "<nodeName>")].metadata.name}'
Output the affected
csiPodNamelogs:kubectl -n rook-ceph logs <csiPodName> -c csi-rbdplugin
Scale down the affected
StatefulSetorDeploymentof the Pod that fails to0replicas.On every
csi-rbdpluginPod, search for stuckcsi-vol:for pod in `kubectl -n rook-ceph get pods|grep rbdplugin|grep -v provisioner|awk '{print $1}'`; do echo $pod kubectl exec -it -n rook-ceph $pod -c csi-rbdplugin -- rbd device list | grep <csi-vol-uuid> done
Unmap the affected
csi-vol:rbd unmap -o force /dev/rbd<i>
The
/dev/rbd<i>value is a mapped RBD volume that usescsi-vol.Delete
volumeattachmentof the affected Pod:kubectl get volumeattachments | grep <csi-vol-uuid> kubectl delete volumeattacmhent <id>
Scale up the affected
StatefulSetorDeploymentback to the original number of replicas and wait until its state becomesRunning.
Fixed in 2.28.1 (17.2.5, 16.2.5, and 16.3.1)
After upgrade of kernel to the latest supported version, old kernel
metapackages may remain on the cluster. The issue occurs if the system kernel
line is changed from LTS to HWE. This setting is controlled by the
upgrade_kernel_version parameter located in the ClusterRelease object
under the deploy StateItem. As a result, the operating system has both
LTS and HWE kernel packages installed and regularly updated, but only one
kernel image is used (loaded into memory). The unused kernel images consume
minimal amount of disk space.
Therefore, you can safely disregard the issue because it does not affect cluster operability. If you still require removing unused kernel metapackages, contact Mirantis support for detailed instructions.
Fixed in 2.29.0 (17.4.0 and 16.4.0)
During the replacement of a master node on a cluster of any type, the process
may get stuck with Kubelet's NodeReady condition is Unknown in the
machine status on the remaining master nodes.
As a workaround, log in on the affected node and run the following command:
docker restart ucp-kubelet
During MariaDB operations on a management cluster, Pods may get stuck in continuous restarts with the following example error:
[ERROR] WSREP: Corrupt buffer header: \
addr: 0x7faec6f8e518, \
seqno: 3185219421952815104, \
size: 909455917, \
ctx: 0x557094f65038, \
flags: 11577. store: 49, \
type: 49
Workaround:
Create a backup of the
/var/lib/mysqldirectory on themariadb-serverPod.Verify that other replicas are up and ready.
Remove the
galera.cachefile for the affectedmariadb-serverPod.Remove the affected
mariadb-serverPod or wait until it is automatically restarted.
After Kubernetes restarts the Pod, the Pod clones the database in 1-2 minutes and restores the quorum.
Fixed in 2.28.4 (17.3.4 and 16.3.4)
During replacement of a master node on a cluster of any type, the
calico-node Pod fails to start on a new node that has the same IP address
as the node being replaced.
Workaround:
Log in to any
masternode.From a CLI with an MKE client bundle, create a shell alias to start calicoctl using the
mirantis/ucp-dsinfoimage:alias calicoctl="\ docker run -i --rm \ --pid host \ --net host \ -e constraint:ostype==linux \ -e ETCD_ENDPOINTS=<etcdEndpoint> \ -e ETCD_KEY_FILE=/var/lib/docker/volumes/ucp-kv-certs/_data/key.pem \ -e ETCD_CA_CERT_FILE=/var/lib/docker/volumes/ucp-kv-certs/_data/ca.pem \ -e ETCD_CERT_FILE=/var/lib/docker/volumes/ucp-kv-certs/_data/cert.pem \ -v /var/run/calico:/var/run/calico \ -v /var/lib/docker/volumes/ucp-kv-certs/_data:/var/lib/docker/volumes/ucp-kv-certs/_data:ro \ mirantis/ucp-dsinfo:<mkeVersion> \ calicoctl \ "
alias calicoctl="\ docker run -i --rm \ --pid host \ --net host \ -e constraint:ostype==linux \ -e ETCD_ENDPOINTS=<etcdEndpoint> \ -e ETCD_KEY_FILE=/ucp-node-certs/key.pem \ -e ETCD_CA_CERT_FILE=/ucp-node-certs/ca.pem \ -e ETCD_CERT_FILE=/ucp-node-certs/cert.pem \ -v /var/run/calico:/var/run/calico \ -v ucp-node-certs:/ucp-node-certs:ro \ mirantis/ucp-dsinfo:<mkeVersion> \ calicoctl --allow-version-mismatch \ "
In the above command, replace the following values with the corresponding settings of the affected cluster:
<etcdEndpoint>is the etcd endpoint defined in the Calico configuration file. For example,ETCD_ENDPOINTS=127.0.0.1:12378<mkeVersion>is the MKE version installed on your cluster. For example,mirantis/ucp-dsinfo:3.5.7.
Verify the node list on the cluster:
kubectl get node
Compare this list with the node list in Calico to identify the old node:
calicoctl get node -o wide
Remove the old node from Calico:
calicoctl delete node kaas-node-<nodeID>
Fixed in 2.28.4 (17.3.4 and 16.3.4)
During replacement of a manager machine, the following problems may occur:
The system adds the node to Docker swarm but not to Kubernetes
The node
Deploymentgets stuck with failed RethinkDB health checks
Workaround:
Delete the failed node.
Wait for the MKE cluster to become healthy. To monitor the cluster status:
Log in to the MKE web UI.
Monitor the cluster status as described in MKE Operations Guide: Monitor an MKE cluster with the MKE web UI.
Deploy a new node.
Fixed in 2.28.4 (17.3.4 and 16.3.4)
During the unsafe or forced deletion of a manager machine running the
calico-kube-controllers Pod in the kube-system namespace,
the following issues occur:
The
calico-kube-controllersPod fails to clean up resources associated with the deleted nodeThe
calico-nodePod may fail to start up on a newly created node if the machine is provisioned with the same IP address as the deleted machine had
As a workaround, before deletion of the node running the
calico-kube-controllers Pod, cordon and drain the node:
kubectl cordon <nodeName>
kubectl drain <nodeName>
Fixed in 2.28.3 (17.2.7, 16.2.7, and 16.3.3)
The Patroni pods may get stuck in the CrashLoopBackOff state due to the
patroni container being terminated with reason: OOMKilled that you can
see in the pod status. For example:
kubectl get pod/patroni-13-0 -n stacklight -o yaml
...
- containerID: docker://<ID>`
image: mirantis.azurecr.io/stacklight/spilo:13-2.1p9-20240828023010
imageID: docker-pullable://mirantis.azurecr.io/stacklight/spilo@sha256:<ID>
lastState:
terminated:
containerID: docker://<ID>
exitCode: 137
finishedAt: "2024-10-17T14:26:25Z"
reason: OOMKilled
startedAt: "2024-10-17T14:23:25Z"
name: patroni
...
As a workaround, increase the memory limit for PostgreSQL to 20Gi in
the Cluster object:
spec:
providerSpec:
value:
helmReleases:
- name: stacklight
values:
resources:
postgresql:
limits:
memory: "20Gi"
For a detailed procedure of StackLight configuration, see MOSK Operations
Guide: Configure StackLight.
For description of the resources option, see MOSK Operations Guide:
StackLight configuration parameters - Resource limits.
Fixed in 2.28.2 (17.2.6, 16.2.6, and 16.3.2)
Due to the JSON-based format of ucp-kubelet logs, OpenSearch does not store
kubelet logs. Mirantis is working on the issue and will deliver the resolution
in one of the nearest patch releases.
Fixed in 2.29.0 (17.4.0 and 16.4.0)
On High Availability (HA) clusters that use Local Volume Provisioner (LVP), Prometheus and OpenSearch from StackLight may share the same pool of storage. In such configuration, OpenSearch may approach the 85% disk usage watermark due to the combined storage allocation and usage patterns set by the Persistent Volume Claim (PVC) size parameters for Prometheus and OpenSearch, which consume storage the most.
When the 85% threshold is reached, the affected node is transitioned to the
read-only state, preventing shard allocation and causing the OpenSearch cluster
state to transition to Warning (Yellow) or Critical (Red).
Caution
The issue and the provided workaround apply only for clusters on which OpenSearch and Prometheus utilize the same storage pool.
To verify that the cluster is affected:
Verify the result of the following formula:
0.8 × OpenSearch_PVC_Size_GB + Prometheus_PVC_Size_GB > 0.85 × Total_Storage_Capacity_GBIn the formula, define the following values:
- OpenSearch_PVC_Size_GB
Derived from
.values.elasticsearch.persistentVolumeUsableStorageSizeGB, defaulting to.values.elasticsearch.persistentVolumeClaimSizeif unspecified. To obtain the OpenSearch PVC size:kubectl -n <namespaceName> get cluster <clusterName> -o yaml |\ yq '.spec.providerSpec.value.helmReleases[] | select(.name == "stacklight") | .values.elasticsearch.persistentVolumeClaimSize '
Example of system response:
10000Gi
- Prometheus_PVC_Size_GB
Sourced from
.values.prometheusServer.persistentVolumeClaimSize. To obtain the Prometheus PVC size:kubectl -n <namespaceName> get cluster <clusterName> -o yaml |\ yq '.spec.providerSpec.value.helmReleases[] | select(.name == "stacklight") | .values.prometheusServer.persistentVolumeClaimSize '
Example of system response:
4000Gi
- Total_Storage_Capacity_GB
Total capacity of the OpenSearch PVCs. For LVP, the capacity of the storage pool. To obtain the total capacity:
kubectl get pvc -n stacklight -l app=opensearch-master \ -o custom-columns=NAME:.metadata.name,CAPACITY:.status.capacity.storage
The system response contains multiple outputs, one per
opensearch-masternode. Select the capacity for the affected node.
Note
Convert the values to GB if they are set in different units.
If the formula result is positive, it is an early indication that the cluster is affected.
Verify whether the
OpenSearchClusterStatusWarningorOpenSearchClusterStatusCriticalalert is firing. And if so, verify the following:Log in to the OpenSearch web UI.
In Management -> Dev Tools, run the following command:
GET _cluster/allocation/explainThe following system response indicates that the corresponding node is affected:
"explanation": "the node is above the low watermark cluster setting \ [cluster.routing.allocation.disk.watermark.low=85%], using more disk space \ than the maximum allowed [85.0%], actual free: [xx.xxx%]"
Note
The system response may contain even higher watermark percent than 85.0%, depending on the case.
Workaround:
Warning
The workaround implies adjustement of the retention threshold for OpenSearch. And depending on the new threshold, some old logs will be deleted.
Adjust or set
.values.elasticsearch.persistentVolumeUsableStorageSizeGBto a lower value for the affection check formula to be non-positive. For configuration details, see MOSK Operations Guide: StackLight configuration parameters - OpenSearch.Mirantis also recommends reserving some space for other PVCs using storage from the pool. Use the following formula to calculate the required space:
persistentVolumeUsableStorageSizeGB = 0.84 × ((1 - Reserved_Percentage - Filesystem_Reserve) × Total_Storage_Capacity_GB - Prometheus_PVC_Size_GB) / 0.8
In the formula, define the following values:
- Reserved_Percentage
A user-defined variable that specifies what percentage of the total storage capacity should not be used by OpenSearch or Prometheus. This is used to reserve space for other components. It should be expressed as a decimal. For example, for 5% of reservation,
Reserved_Percentageis 0.05. Mirantis recommends using 0.05 as a starting point.- Filesystem_Reserve
Percentage to deduct for filesystems that may reserve some portion of the available storage, which is marked as occupied. For example, for EXT4, it is 5% by default, so the value must be 0.05.
- Prometheus_PVC_Size_GB
Sourced from
.values.prometheusServer.persistentVolumeClaimSize.- Total_Storage_Capacity_GB
Total capacity of the OpenSearch PVCs. For LVP, the capacity of the storage pool. To obtain the total capacity:
kubectl get pvc -n stacklight -l app=opensearch-master \ -o custom-columns=NAME:.metadata.name,CAPACITY:.status.capacity.storage
The system response contains multiple outputs, one per
opensearch-masternode. Select the capacity for the affected node.
Note
Convert the values to GB if they are set in different units.
Calculation of above formula provides a maximum safe storage to allocate for
.values.elasticsearch.persistentVolumeUsableStorageSizeGB. Use this formula as a reference for setting.values.elasticsearch.persistentVolumeUsableStorageSizeGBon a cluster.Wait up to 15-20 mins for OpenSearch to perform the cleaning.
Verify that the cluster is not affected anymore using the procedure above.
Fixed in 2.30.0 (21.0.0 and 20.0.0)
A compact MOSK cluster fails to be deployed through the Container Cloud web UI
due to inability to add any label to the control plane machines along with
inability to change dedicatedControlPlane: false using the web UI.
To work around the issue, manually add the required labels using CLI. Once done, the cluster deployment resumes.
A newly created project does not display all available tabs in the Container
Cloud web UI and contains different access denied errors during first five
minutes after creation.
To work around the issue, refresh the browser in five minutes after the project creation.
The following table lists the major components and their versions delivered in
Container Cloud 2.28.0. The components that are newly added, updated,
deprecated, or removed as compared to 2.27.0, are marked with a corresponding
superscript, for example, admission-controller Updated.
Component |
Application/Service |
Version |
|---|---|---|
Bare metal |
baremetal-dnsmasq Updated |
base-2-28-alpine-20240906160120 |
baremetal-operator Updated |
base-2-28-alpine-20240910093836 |
|
baremetal-provider Updated |
1.41.14 |
|
bm-collective Updated |
base-2-28-alpine-20240910093747 |
|
cluster-api-provider-baremetal Updated |
1.41.14 |
|
ironic Updated |
antelope-jammy-20240716113922 |
|
ironic-inspector Updated |
antelope-jammy-20240716113922 |
|
ironic-prometheus-exporter |
0.1-20240819102310 |
|
kaas-ipam Updated |
base-2-28-alpine-20240910095249 |
|
kubernetes-entrypoint |
v1.0.1-4e381cb-20240813170642 |
|
mariadb |
10.6.17-focal-20240523075821 |
|
metallb-controller Updated |
v0.14.5-ed177720-amd64 |
|
metallb-speaker Updated |
v0.14.5-ed177720-amd64 |
|
syslog-ng Updated |
base-alpine-20240906155734 |
|
Container Cloud |
admission-controller Updated |
1.41.14 |
agent-controller Updated |
1.41.14 |
|
byo-cluster-api-controller Updated |
1.41.14 |
|
byo-credentials-controller Removed |
n/a |
|
ceph-kcc-controller Updated |
1.41.14 |
|
cert-manager-controller Updated |
1.11.0-8 |
|
configuration-collector Updated |
1.41.14 |
|
event-controller Updated |
1.41.14 |
|
frontend Updated |
1.41.14 |
|
golang |
1.22.7 |
|
iam-controller Updated |
1.41.14 |
|
kaas-exporter Updated |
1.41.14 |
|
kproxy Updated |
1.41.14 |
|
lcm-controller Updated |
1.41.14 |
|
license-controller Updated |
1.41.14 |
|
machinepool-controller Updated |
1.41.14 |
|
mcc-haproxy Updated |
0.26.0-95-g95f0130 |
|
nginx Updated |
1.41.14 |
|
portforward-controller Updated |
1.41.14 |
|
proxy-controller Updated |
1.41.14 |
|
rbac-controller Updated |
1.41.14 |
|
registry Updated |
2.8.1-13 |
|
release-controller Updated |
1.41.14 |
|
rhellicense-controller Removed |
n/a |
|
scope-controller Updated |
1.41.14 |
|
secret-controller Updated |
1.41.14 |
|
storage-discovery Updated |
1.41.14 |
|
user-controller Updated |
1.41.14 |
|
IAM Updated |
iam |
1.41.14 |
mariadb |
10.6.17-focal-20240909113408 |
|
mcc-keycloak Updated |
25.0.6-20240926140203 |
|
OpenStack Updated |
host-os-modules-controller |
1.41.14 |
openstack-cluster-api-controller |
1.41.14 |
|
openstack-provider |
1.41.14 |
|
os-credentials-controller Removed |
n/a |
This section lists the artifacts of components included in the Container Cloud
release 2.27.0. The components that are newly added, updated,
deprecated, or removed as compared to 2.27.0, are marked with a corresponding
superscript, for example, admission-controller Updated.
Artifact |
Component |
Path |
|---|---|---|
Binaries Updated |
ironic-python-agent.initramfs |
https://binary.mirantis.com/bm/bin/ironic/ipa/ubuntu/initramfs-yoga-focal-debug-20240911112529 |
ironic-python-agent.kernel |
https://binary.mirantis.com/bm/bin/ironic/ipa/ubuntu/kernel-yoga-focal-debug-20240911112529 |
|
Helm charts Updated |
baremetal-api |
https://binary.mirantis.com/core/helm/baremetal-api-1.41.14.tgz |
baremetal-operator |
https://binary.mirantis.com/core/helm/baremetal-operator-1.41.14.tgz |
|
baremetal-provider |
https://binary.mirantis.com/core/helm/baremetal-provider-1.41.14.tgz |
|
baremetal-public-api |
https://binary.mirantis.com/core/helm/baremetal-public-api-1.41.14.tgz |
|
kaas-ipam |
||
metallb |
||
Docker images |
ambasador Updated |
mirantis.azurecr.io/core/external/nginx:1.41.14 |
baremetal-dnsmasq Updated |
mirantis.azurecr.io/bm/baremetal-dnsmasq:base-2-28-alpine-20240906160120 |
|
baremetal-operator Updated |
mirantis.azurecr.io/bm/baremetal-operator:base-2-28-alpine-20240910093836 |
|
bm-collective Updated |
mirantis.azurecr.io/bm/bm-collective:base-2-28-alpine-20240910093747 |
|
cluster-api-provider-baremetal Updated |
mirantis.azurecr.io/core/cluster-api-provider-baremetal:1.41.14 |
|
ironic Updated |
mirantis.azurecr.io/openstack/ironic:antelope-jammy-20240716113922 |
|
ironic-inspector Updated |
mirantis.azurecr.io/openstack/ironic-inspector:antelope-jammy-20240716113922 |
|
ironic-prometheus-exporter Updated |
mirantis.azurecr.io/stacklight/ironic-prometheus-exporter:0.1-20240819102310 |
|
kaas-ipam Updated |
mirantis.azurecr.io/bm/kaas-ipam:base-2-28-alpine-20240910095249 |
|
kubernetes-entrypoint Updated |
mirantis.azurecr.io/openstack/extra/kubernetes-entrypoint:v1.0.1-4e381cb-20240813170642 |
|
mariadb |
mirantis.azurecr.io/general/mariadb:10.6.17-focal-20240523075821 |
|
mcc-keepalived Updated |
mirantis.azurecr.io/lcm/mcc-keepalived:v0.26.0-95-g95f0130 |
|
metallb-controller Updated |
mirantis.azurecr.io/bm/metallb/controller:v0.14.5-ed177720-amd64 |
|
metallb-speaker Updated |
mirantis.azurecr.io/bm/metallb/speaker:v0.14.5-ed177720-amd64 |
|
syslog-ng Updated |
mirantis.azurecr.io/bm/syslog-ng:base-alpine-20240906155734 |
Artifact |
Component |
Path |
|---|---|---|
Bootstrap tarball Updated |
bootstrap-darwin |
https://binary.mirantis.com/core/bin/bootstrap-darwin-1.41.14.tgz |
bootstrap-linux |
https://binary.mirantis.com/core/bin/bootstrap-linux-1.41.14.tgz |
|
Helm charts Updated |
admission-controller |
https://binary.mirantis.com/core/helm/admission-controller-1.41.14.tgz |
agent-controller |
https://binary.mirantis.com/core/helm/agent-controller-1.41.14.tgz |
|
ceph-kcc-controller |
https://binary.mirantis.com/core/helm/ceph-kcc-controller-1.41.14.tgz |
|
cert-manager |
https://binary.mirantis.com/core/helm/cert-manager-1.41.14.tgz |
|
configuration-collector |
https://binary.mirantis.com/core/helm/configuration-collector-1.41.14.tgz |
|
credentials-controller New |
https://binary.mirantis.com/core/helm/credentials-controller-1.41.14.tgz |
|
event-controller |
https://binary.mirantis.com/core/helm/event-controller-1.41.14.tgz |
|
host-os-modules-controller |
https://binary.mirantis.com/core/helm/host-os-modules-controller-1.41.14.tgz |
|
iam-controller |
https://binary.mirantis.com/core/helm/iam-controller-1.41.14.tgz |
|
kaas-exporter |
https://binary.mirantis.com/core/helm/kaas-exporter-1.41.14.tgz |
|
kaas-public-api |
https://binary.mirantis.com/core/helm/kaas-public-api-1.41.14.tgz |
|
kaas-ui |
||
lcm-controller |
https://binary.mirantis.com/core/helm/lcm-controller-1.41.14.tgz |
|
license-controller |
https://binary.mirantis.com/core/helm/license-controller-1.41.14.tgz |
|
machinepool-controller |
https://binary.mirantis.com/core/helm/machinepool-controller-1.41.14.tgz |
|
mcc-cache |
||
mcc-cache-warmup |
https://binary.mirantis.com/core/helm/mcc-cache-warmup-1.41.14.tgz |
|
openstack-provider |
https://binary.mirantis.com/core/helm/openstack-provider-1.41.14.tgz |
|
os-credentials-controller Removed |
n/a |
|
portforward-controller |
https://binary.mirantis.com/core/helm/portforward-controller-1.41.14.tgz |
|
rbac-controller |
https://binary.mirantis.com/core/helm/rbac-controller-1.41.14.tgz |
|
release-controller |
https://binary.mirantis.com/core/helm/release-controller-1.41.14.tgz |
|
scope-controller |
https://binary.mirantis.com/core/helm/scope-controller-1.41.14.tgz |
|
secret-controller |
https://binary.mirantis.com/core/helm/secret-controller-1.41.14.tgz |
|
user-controller |
https://binary.mirantis.com/core/helm/user-controller-1.41.14.tgz |
|
Docker images Updated |
admission-controller |
mirantis.azurecr.io/core/admission-controller:1.41.14 |
agent-controller |
mirantis.azurecr.io/core/agent-controller:1.41.14 |
|
ceph-kcc-controller |
mirantis.azurecr.io/core/ceph-kcc-controller:1.41.14 |
|
cert-manager-controller |
mirantis.azurecr.io/core/external/cert-manager-controller:v1.11.0-8 |
|
configuration-collector |
mirantis.azurecr.io/core/configuration-collector:1.41.14 |
|
credentials-controller New |
mirantis.azurecr.io/core/credentials-controller:1.41.14 |
|
event-controller |
mirantis.azurecr.io/core/event-controller:1.41.14 |
|
frontend |
mirantis.azurecr.io/core/frontend:1.41.14 |
|
host-os-modules-controller |
mirantis.azurecr.io/core/host-os-modules-controller:1.41.14 |
|
iam-controller |
mirantis.azurecr.io/core/iam-controller:1.41.14 |
|
kaas-exporter |
mirantis.azurecr.io/core/kaas-exporter:1.41.14 |
|
kproxy |
mirantis.azurecr.io/core/kproxy:1.41.14 |
|
lcm-controller |
mirantis.azurecr.io/core/lcm-controller:1.41.14 |
|
license-controller |
mirantis.azurecr.io/core/license-controller:1.41.14 |
|
machinepool-controller |
mirantis.azurecr.io/core/machinepool-controller:1.41.14 |
|
mcc-cache-warmup |
mirantis.azurecr.io/core/mcc-cache-warmup:1.41.14 |
|
mcc-haproxy |
mirantis.azurecr.io/lcm/mcc-haproxy:v0.26.0-95-g95f0130 |
|
mcc-keepalived |
mirantis.azurecr.io/lcm/mcc-keepalived:v0.26.0-95-g95f0130 |
|
nginx |
mirantis.azurecr.io/core/external/nginx:1.41.14 |
|
openstack-cluster-api-controller |
mirantis.azurecr.io/core/openstack-cluster-api-controller:1.41.14 |
|
os-credentials-controller Removed |
n/a |
|
portforward-controller |
mirantis.azurecr.io/core/portforward-controller:1.41.14 |
|
rbac-controller |
mirantis.azurecr.io/core/rbac-controller:1.41.14 |
|
registry |
mirantis.azurecr.io/lcm/registry:v2.8.1-13 |
|
release-controller |
mirantis.azurecr.io/core/release-controller:1.41.14 |
|
scope-controller |
mirantis.azurecr.io/core/scope-controller:1.41.14 |
|
secret-controller |
mirantis.azurecr.io/core/secret-controller:1.41.14 |
|
user-controller |
mirantis.azurecr.io/core/user-controller:1.41.14 |
Artifact |
Component |
Path |
|---|---|---|
Binaries |
hash-generate-darwin |
http://binary.mirantis.com/iam/bin/hash-generate-0.0.1-268-3cf7f17-darwin |
hash-generate-linux |
http://binary.mirantis.com/iam/bin/hash-generate-0.0.1-268-3cf7f17-linux |
|
Helm charts Updated |
iam |
|
Docker images |
kubectl Updated |
mirantis.azurecr.io/general/kubectl:20240926142019 |
kubernetes-entrypoint |
mirantis.azurecr.io/openstack/extra/kubernetes-entrypoint:v1.0.1-ba8ada4-20240405150338 |
|
mariadb |
mirantis.azurecr.io/general/mariadb:10.6.17-focal-20240909113408 |
|
mcc-keycloak Updated |
mirantis.azurecr.io/iam/mcc-keycloak:25.0.6-20240926140203 |
In total, since Container Cloud 2.27.0, in 2.28.0, 2614 Common Vulnerabilities and Exposures (CVE) have been fixed: 299 of critical and 2315 of high severity.
The table below includes the total numbers of addressed unique and common vulnerabilities and exposures (CVE) by product component since the 2.27.4 patch release. The common CVEs are issues addressed across several images.
Product component |
CVE type |
Critical |
High |
Total |
|---|---|---|---|---|
Ceph |
Unique |
0 |
5 |
5 |
Common |
0 |
211 |
211 |
|
KaaS core |
Unique |
4 |
11 |
15 |
Common |
10 |
315 |
325 |
|
StackLight |
Unique |
1 |
7 |
8 |
Common |
1 |
25 |
26 |
Mirantis Security Portal
For the detailed list of fixed and existing CVEs across the Mirantis Container Cloud and MOSK products, refer to Mirantis Security Portal.
MOSK CVEs
For the number of fixed CVEs in the MOSK-related components including OpenStack and Tungsten Fabric, refer to MOSK 24.3: Security notes.
This section describes the specific actions you as a cloud operator need to complete before or after your Container Cloud cluster update to the Cluster releases 17.3.0 or 16.3.0.
Consider this information as a supplement to the generic update procedures published in Operations Guide: Automatic upgrade of a management cluster and Update a managed cluster.
Note
If you do not use Ceph metrics in any customizations, for example, custom alerts, Grafana dashboards, or queries in custom workloads, skip this section.
After deprecating the performance metric exporter that is integrated into the Ceph Manager daemon for the sake of the dedicated Ceph Exporter daemon in Container Cloud 2.27.0, you may need to update values of several labels in Ceph metrics if you use them in any customizations such as custom alerts, Grafana dashboards, or queries in custom tools. These labels are changed in Container Cloud 2.28.0 (Cluster releases 16.3.0 and 17.3.0).
Note
Names of metrics are changed, no metrics are removed.
All Ceph metrics to be collected by the Ceph Exporter daemon changed their
labels job and instance due to scraping metrics from new Ceph Exporter
daemon instead of the performance metric exporter of Ceph Manager:
Values of the
joblabels are changed fromrook-ceph-mgrtoprometheus-rook-exporterfor all Ceph metrics moved to Ceph Exporter. The full list of moved metrics is presented below.Values of the
instancelabels are changed from the metric endpoint of Ceph Manager with port9283to the metric endpoint of Ceph Exporter with port9926for all Ceph metrics moved to Ceph Exporter. The full list of moved metrics is presented below.Values of the
instance_idlabels of Ceph metrics from the RADOS Gateway (RGW) daemons are changed from the daemon GID to the daemon subname. For example, instead ofinstance_id="<RGW_PROCESS_GID>", theinstance_id="a"(ceph_rgw_qlen{instance_id="a"}) is now used. The list of moved Ceph RGW metrics is presented below.
List of affected Ceph RGW metrics
ceph_rgw_cache_.*ceph_rgw_failed_reqceph_rgw_gc_retire_objectceph_rgw_get.*ceph_rgw_keystone_.*ceph_rgw_lc_.*ceph_rgw_lua_.*ceph_rgw_pubsub_.*ceph_rgw_put.*ceph_rgw_qactiveceph_rgw_qlenceph_rgw_req
List of all metrics to be collected by Ceph Exporter instead of
Ceph Manager
ceph_bluefs_.*ceph_bluestore_.*ceph_mds_cache_.*ceph_mds_capsceph_mds_ceph_.*ceph_mds_dir_.*ceph_mds_exported_inodesceph_mds_forwardceph_mds_handle_.*ceph_mds_imported_inodesceph_mds_inodes.*ceph_mds_load_centceph_mds_log_.*ceph_mds_mem_.*ceph_mds_openino_dir_fetchceph_mds_process_request_cap_releaseceph_mds_reply_.*ceph_mds_requestceph_mds_root_.*ceph_mds_server_.*ceph_mds_sessions_.*ceph_mds_slow_replyceph_mds_subtreesceph_mon_election_.*ceph_mon_num_.*ceph_mon_session_.*ceph_objecter_.*ceph_osd_numpg.*ceph_osd_op.*ceph_osd_recovery_.*ceph_osd_stat_.*ceph_paxos.*ceph_prioritycache.*ceph_purge.*ceph_rgw_cache_.*ceph_rgw_failed_reqceph_rgw_gc_retire_objectceph_rgw_get.*ceph_rgw_keystone_.*ceph_rgw_lc_.*ceph_rgw_lua_.*ceph_rgw_pubsub_.*ceph_rgw_put.*ceph_rgw_qactiveceph_rgw_qlenceph_rgw_reqceph_rocksdb_.*
Since Container Cloud 2.28.0 (Cluster releases 17.3.0 and 16.3.0), Ceph cluster metrics are collected by the dedicated Ceph Exporter daemon. At the same time, same metrics are still available to be collected by the Ceph Manager daemon. To improve performance of the Ceph Manager daemon, you can manually disable collection of performance metrics by Ceph Manager, which are collected by the Ceph Exporter daemon.
To disable performance metrics for the Ceph Manager daemon, add the following
parameter to the KaaSCephCluster spec in the rookConfig section:
spec:
cephClusterSpec:
rookConfig:
"mgr|mgr/prometheus/exclude_perf_counters": "true"
Once you add this option, Ceph performance metrics are collected by the Ceph Exporter daemon only. For more details, see Official Ceph documentation.
In Container Cloud 2.29.0, the Cluster release update of the Ubuntu 20.04-based managed clusters will become impossible, and Ubuntu 22.04 will become the only supported version of the operating system. Therefore, ensure that every node of your managed clusters are running Ubuntu 22.04 to unblock managed cluster update in Container Cloud 2.29.0.
Warning
Management cluster update to Container Cloud 2.29.1 will be blocked if at least one node of any related managed cluster is running Ubuntu 20.04.
Therefore, if your existing cluster runs nodes on Ubuntu 20.04, prevent blocking of your cluster update by upgrading all cluster nodes to Ubuntu 22.04 during the course of the Container Cloud 2.28.x series. For the update procedure, refer to Mirantis OpenStack for Kubernetes documentation: Bare metal operations - Upgrade an operating system distribution.
It is not mandatory to upgrade all machines at once. You can upgrade them one by one or in small batches, for example, if the maintenance window is limited in time.
Note
Existing management clusters were automatically updated to Ubuntu 22.04 during cluster upgrade to the Cluster release 16.2.0 in Container Cloud 2.27.0. Greenfield deployments of management clusters are also based on Ubuntu 22.04.
Warning
Usage of third-party software, which is not part of Mirantis-supported configurations, for example, the use of custom DPDK modules, may block upgrade of an operating system distribution. Users are fully responsible for ensuring the compatibility of such custom components with the latest supported Ubuntu version.
Note
For MOSK clusters, Container Cloud 2.27.4 is the second patch release of MOSK 24.2.x series using the patch Cluster release 17.2.4. For the update path of 24.1 and 24.2 series, see MOSK documentation: Cluster update scheme.
The Container Cloud patch release 2.27.4, which is based on the 2.27.0 major release, provides the following updates:
Support for the patch Cluster releases 16.2.4 and 17.2.4 that represents Mirantis OpenStack for Kubernetes (MOSK) patch release 24.2.2 patch.
Bare metal: update of Ubuntu mirror from ubuntu-2024-08-06-014502 to ubuntu-2024-08-21-014714 along with update of the minor kernel version from 5.15.0-117-generic to 5.15.0-119-generic for Jammy and to 5.15.0-118-generic for Focal.
Security fixes for CVEs in images.
This patch release also supports the latest major Cluster releases 17.2.0 and 16.2.0. And it does not support greenfield deployments based on deprecated Cluster releases. Use the latest available Cluster release instead.
For main deliverables of the parent Container Cloud release of 2.27.4, refer to 2.27.0.
In total, since Container Cloud 2.27.3, 131 Common Vulnerabilities and Exposures (CVE) have been fixed in 2.27.4: 15 of critical and 116 of high severity.
The table below includes the total numbers of addressed unique and common CVEs in images by product component since Container Cloud 2.27.3. The common CVEs are issues addressed across several images.
Product component |
CVE type |
Critical |
High |
Total |
|---|---|---|---|---|
Ceph |
Unique |
0 |
1 |
1 |
Common |
0 |
3 |
3 |
|
Kaas core |
Unique |
3 |
19 |
22 |
Common |
14 |
105 |
119 |
|
StackLight |
Unique |
1 |
8 |
9 |
Common |
1 |
8 |
9 |
Mirantis Security Portal
For the detailed list of fixed and existing CVEs across the Mirantis Container Cloud and MOSK products, refer to Mirantis Security Portal.
MOSK CVEs
For the number of fixed CVEs in the MOSK-related components including OpenStack and Tungsten Fabric, refer to MOSK 24.2.2: Security notes.
This section lists known issues with workarounds for the Mirantis Container Cloud release 2.27.4 including the Cluster releases 16.2.4 and 17.2.4.
For other issues that can occur while deploying and operating a Container Cloud cluster, see Troubleshooting Guide.
Note
This section also outlines still valid known issues from previous Container Cloud releases.
Note
Moving forward, the workaround for this issue will be moved from Release Notes to MOSK Troubleshooting Guide: Inspection error on bare metal hosts after dnsmasq restart.
If the dnsmasq pod is restarted during the bootstrap of newly added
nodes, those nodes may fail to undergo inspection. That can result in
inspection error in the corresponding BareMetalHost objects.
The issue can occur when:
The
dnsmasqpod was moved to another node.DHCP subnets were changed, including addition or removal. In this case, the
dhcpdcontainer of thednsmasqpod is restarted.Caution
If changing or adding of DHCP subnets is required to bootstrap new nodes, wait after changing or adding DHCP subnets until the
dnsmasqpod becomes ready, then createBareMetalHostobjects.
To verify whether the nodes are affected:
Verify whether the
BareMetalHostobjects contain theinspection error:kubectl get bmh -n <managed-cluster-namespace-name>
Example of system response:
NAME STATE CONSUMER ONLINE ERROR AGE test-master-1 provisioned test-master-1 true 9d test-master-2 provisioned test-master-2 true 9d test-master-3 provisioned test-master-3 true 9d test-worker-1 provisioned test-worker-1 true 9d test-worker-2 provisioned test-worker-2 true 9d test-worker-3 inspecting true inspection error 19h
Verify whether the
dnsmasqpod was inReadystate when the inspection of the affected baremetal hosts (test-worker-3in the example above) was started:kubectl -n kaas get pod <dnsmasq-pod-name> -oyaml
Example of system response:
... status: conditions: - lastProbeTime: null lastTransitionTime: "2024-10-10T15:37:34Z" status: "True" type: Initialized - lastProbeTime: null lastTransitionTime: "2024-10-11T07:38:54Z" status: "True" type: Ready - lastProbeTime: null lastTransitionTime: "2024-10-11T07:38:54Z" status: "True" type: ContainersReady - lastProbeTime: null lastTransitionTime: "2024-10-10T15:37:34Z" status: "True" type: PodScheduled containerStatuses: - containerID: containerd://6dbcf2fc4b36ce4c549c9191ab01f72d0236c51d42947675302675e4bfaf4cdf image: docker-dev-kaas-virtual.artifactory-eu.mcp.mirantis.net/bm/baremetal-dnsmasq:base-2-28-alpine-20240812132650 imageID: docker-dev-kaas-virtual.artifactory-eu.mcp.mirantis.net/bm/baremetal-dnsmasq@sha256:3dad3e278add18e69b2608e462691c4823942641a0f0e25e6811e703e3c23b3b lastState: terminated: containerID: containerd://816fcf079cd544acd74e312065de5b5ed4dbf1dc6159fefffff4f644b5e45987 exitCode: 0 finishedAt: "2024-10-11T07:38:35Z" reason: Completed startedAt: "2024-10-10T15:37:45Z" name: dhcpd ready: true restartCount: 2 started: true state: running: startedAt: "2024-10-11T07:38:37Z" ...
In the system response above, the
dhcpdcontainer was not ready between"2024-10-11T07:38:35Z"and"2024-10-11T07:38:54Z".Verify the affected baremetal host. For example:
kubectl get bmh -n managed-ns test-worker-3 -oyaml
Example of system response:
... status: errorCount: 15 errorMessage: Introspection timeout errorType: inspection error ... operationHistory: deprovision: end: null start: null inspect: end: null start: "2024-10-11T07:38:19Z" provision: end: null start: null register: end: "2024-10-11T07:38:19Z" start: "2024-10-11T07:37:25Z"
In the system response above, inspection was started at
"2024-10-11T07:38:19Z", immediately before the period of thedhcpdcontainer downtime. Therefore, this node is most likely affected by the issue.
Workaround
Reboot the node using the IPMI reset or cycle command.
If the node fails to boot, remove the failed
BareMetalHostobject and create it again:Remove
BareMetalHostobject. For example:kubectl delete bmh -n managed-ns test-worker-3
Verify that the
BareMetalHostobject is removed:kubectl get bmh -n managed-ns test-worker-3
Create a
BareMetalHostobject from the template. For example:kubectl create -f bmhc-test-worker-3.yaml kubectl create -f bmh-test-worker-3.yaml
Fixed in 2.28.0 (17.3.0 and 16.3.0)
When trying to list the HostOSConfigurationModules and HostOSConfiguration custom resources, serviceuser or a user with
the global-admin or operator role obtains the access denied error.
For example:
kubectl --kubeconfig ~/.kube/mgmt-config get hocm
Error from server (Forbidden): hostosconfigurationmodules.kaas.mirantis.com is forbidden:
User "2d74348b-5669-4c65-af31-6c05dbedac5f" cannot list resource "hostosconfigurationmodules"
in API group "kaas.mirantis.com" at the cluster scope: access denied
Workaround:
Modify the
global-adminrole by adding a new entry with the following contents to theruleslist:kubectl edit clusterroles kaas-global-admin
- apiGroups: [kaas.mirantis.com] resources: [hostosconfigurationmodules] verbs: ['*']
For each Container Cloud project, modify the
kaas-operatorrole by adding a new entry with the following contents to theruleslist:kubectl -n <projectName> edit roles kaas-operator
- apiGroups: [kaas.mirantis.com] resources: [hostosconfigurations] verbs: ['*']
Due to the MetalLB upstream issue, a load balancer service may not obtain the external IP address.
The issue occurs when two services share the same external IP address and have
the same externalTrafficPolicy value. Initially, the services have the
external IP address assigned and are accessible. After modifying the
externalTrafficPolicy value for both services from Cluster to
Local, the first service that has been changed remains with no external IP
address assigned. Though, the second service, which was changed later, has the
external IP assigned as expected.
To work around the issue, make a dummy change to the service object where
external IP is <pending>:
Identify the service that is stuck:
kubectl get svc -A | grep pending
Example of system response:
stacklight iam-proxy-prometheus LoadBalancer 10.233.28.196 <pending> 443:30430/TCP
Add an arbitrary label to the service that is stuck. For example:
kubectl label svc -n stacklight iam-proxy-prometheus reconcile=1
Example of system response:
service/iam-proxy-prometheus labeledVerify that the external IP was allocated to the service:
kubectl get svc -n stacklight iam-proxy-prometheus
Example of system response:
NAME TYPE CLUSTER-IP EXTERNAL-IP PORT(S) AGE iam-proxy-prometheus LoadBalancer 10.233.28.196 10.0.34.108 443:30430/TCP 12d
Fixed in 2.28.0 (17.3.0 and 16.3.0)
After node maintenance of a management cluster, the newly added nodes may fail to undergo provisioning successfully. The issue relates to new nodes that are in the same L2 domain as the management cluster.
The issue was observed on environments having management cluster nodes configured with a single L2 segment used for all network traffic (PXE and LCM/management networks).
To verify whether the cluster is affected:
Verify whether the dnsmasq and dhcp-relay pods run on the same node
in the management cluster:
kubectl -n kaas get pods -o wide| grep -e "dhcp\|dnsmasq"
Example of system response:
dhcp-relay-7d85f75f76-5vdw2 2/2 Running 2 (36h ago) 36h 10.10.0.122 kaas-node-8a24b81c-76d0-4d4c-8421-962bd39df5ad <none> <none>
dnsmasq-8f4b484b4-slhbd 5/5 Running 1 (36h ago) 36h 10.233.123.75 kaas-node-8a24b81c-76d0-4d4c-8421-962bd39df5ad <none> <none>
If this is the case, proceed to the workaround below.
Workaround:
Log in to a node that contains
kubeconfigof the affected management cluster.Make sure that at least two management cluster nodes are schedulable:
kubectl get node
Example of a positive system response:
NAME STATUS ROLES AGE VERSION kaas-node-bcedb87b-b3ce-46a4-a4ca-ea3068689e40 Ready master 37h v1.27.10-mirantis-1 kaas-node-8a24b81c-76d0-4d4c-8421-962bd39df5ad Ready master 37h v1.27.10-mirantis-1 kaas-node-ad5a6f51-b98f-43c3-91d5-55fed3d0ff21 Ready master 37h v1.27.10-mirantis-1
Delete the
dhcp-relaypod:kubectl -n kaas delete pod <dhcp-relay-xxxxx>
Verify that the
dnsmasqanddhcp-relaypods are scheduled into different nodes:kubectl -n kaas get pods -o wide| grep -e "dhcp\|dnsmasq"
Example of a positive system response:
dhcp-relay-7d85f75f76-rkv03 2/2 Running 0 49s 10.10.0.121 kaas-node-bcedb87b-b3ce-46a4-a4ca-ea3068689e40 <none> <none> dnsmasq-8f4b484b4-slhbd 5/5 Running 1 (37h ago) 37h 10.233.123.75 kaas-node-8a24b81c-76d0-4d4c-8421-962bd39df5ad <none> <none>
During deletion of a manager machine running the ironic Pod from a bare
metal management cluster, the following problems occur:
All Pods are stuck in the
TerminatingstateA new
ironicPod fails to startThe related bare metal host is stuck in the
deprovisioningstate
As a workaround, before deletion of the node running the ironic Pod,
cordon and drain the node using the kubectl cordon <nodeName> and
kubectl drain <nodeName> commands.
Fixed in 2.29.0 (17.4.0 and 16.4.0)
During the replacement of a master node on a cluster of any type, the process
may get stuck with Kubelet's NodeReady condition is Unknown in the
machine status on the remaining master nodes.
As a workaround, log in on the affected node and run the following command:
docker restart ucp-kubelet
During MariaDB operations on a management cluster, Pods may get stuck in continuous restarts with the following example error:
[ERROR] WSREP: Corrupt buffer header: \
addr: 0x7faec6f8e518, \
seqno: 3185219421952815104, \
size: 909455917, \
ctx: 0x557094f65038, \
flags: 11577. store: 49, \
type: 49
Workaround:
Create a backup of the
/var/lib/mysqldirectory on themariadb-serverPod.Verify that other replicas are up and ready.
Remove the
galera.cachefile for the affectedmariadb-serverPod.Remove the affected
mariadb-serverPod or wait until it is automatically restarted.
After Kubernetes restarts the Pod, the Pod clones the database in 1-2 minutes and restores the quorum.
Fixed in 2.28.4 (17.3.4 and 16.3.4)
During replacement of a master node on a cluster of any type, the
calico-node Pod fails to start on a new node that has the same IP address
as the node being replaced.
Workaround:
Log in to any
masternode.From a CLI with an MKE client bundle, create a shell alias to start calicoctl using the
mirantis/ucp-dsinfoimage:alias calicoctl="\ docker run -i --rm \ --pid host \ --net host \ -e constraint:ostype==linux \ -e ETCD_ENDPOINTS=<etcdEndpoint> \ -e ETCD_KEY_FILE=/var/lib/docker/volumes/ucp-kv-certs/_data/key.pem \ -e ETCD_CA_CERT_FILE=/var/lib/docker/volumes/ucp-kv-certs/_data/ca.pem \ -e ETCD_CERT_FILE=/var/lib/docker/volumes/ucp-kv-certs/_data/cert.pem \ -v /var/run/calico:/var/run/calico \ -v /var/lib/docker/volumes/ucp-kv-certs/_data:/var/lib/docker/volumes/ucp-kv-certs/_data:ro \ mirantis/ucp-dsinfo:<mkeVersion> \ calicoctl \ "
alias calicoctl="\ docker run -i --rm \ --pid host \ --net host \ -e constraint:ostype==linux \ -e ETCD_ENDPOINTS=<etcdEndpoint> \ -e ETCD_KEY_FILE=/ucp-node-certs/key.pem \ -e ETCD_CA_CERT_FILE=/ucp-node-certs/ca.pem \ -e ETCD_CERT_FILE=/ucp-node-certs/cert.pem \ -v /var/run/calico:/var/run/calico \ -v ucp-node-certs:/ucp-node-certs:ro \ mirantis/ucp-dsinfo:<mkeVersion> \ calicoctl --allow-version-mismatch \ "
In the above command, replace the following values with the corresponding settings of the affected cluster:
<etcdEndpoint>is the etcd endpoint defined in the Calico configuration file. For example,ETCD_ENDPOINTS=127.0.0.1:12378<mkeVersion>is the MKE version installed on your cluster. For example,mirantis/ucp-dsinfo:3.5.7.
Verify the node list on the cluster:
kubectl get node
Compare this list with the node list in Calico to identify the old node:
calicoctl get node -o wide
Remove the old node from Calico:
calicoctl delete node kaas-node-<nodeID>
Fixed in 2.28.4 (17.3.4 and 16.3.4)
During replacement of a manager machine, the following problems may occur:
The system adds the node to Docker swarm but not to Kubernetes
The node
Deploymentgets stuck with failed RethinkDB health checks
Workaround:
Delete the failed node.
Wait for the MKE cluster to become healthy. To monitor the cluster status:
Log in to the MKE web UI.
Monitor the cluster status as described in MKE Operations Guide: Monitor an MKE cluster with the MKE web UI.
Deploy a new node.
Fixed in 2.28.4 (17.3.4 and 16.3.4)
During the unsafe or forced deletion of a manager machine running the
calico-kube-controllers Pod in the kube-system namespace,
the following issues occur:
The
calico-kube-controllersPod fails to clean up resources associated with the deleted nodeThe
calico-nodePod may fail to start up on a newly created node if the machine is provisioned with the same IP address as the deleted machine had
As a workaround, before deletion of the node running the
calico-kube-controllers Pod, cordon and drain the node:
kubectl cordon <nodeName>
kubectl drain <nodeName>
Fixed in 2.29.3 (17.3.8, 16.3.8, and 16.4.3)
Due to the upstream Ceph issue
66717,
during CVE upgrade of the Ceph daemon image of Ceph Reef 18.2.4, OSDs may start
slow and even fail the starting probe with the following describe output in
the rook-ceph-osd-X pod:
Warning Unhealthy 57s (x16 over 3m27s) kubelet Startup probe failed:
ceph daemon health check failed with the following output:
> no valid command found; 10 closest matches:
> 0
> 1
> 2
> abort
> assert
> bluefs debug_inject_read_zeros
> bluefs files list
> bluefs stats
> bluestore bluefs device info [<alloc_size:int>]
> config diff
> admin_socket: invalid command
Workaround:
Complete the following steps during every patch or major cluster update of the Cluster releases 17.2.x, 17.3.x, and 17.4.x (until Ceph 18.2.5 becomes supported):
Plan extra time in the maintenance window for the patch cluster update.
Slow starts will still impact the update procedure, but after completing the following step, the recovery process noticeably shortens without affecting the overall cluster state and data responsiveness.
Select one of the following options:
Before the cluster update, set the
nooutflag:ceph osd set noout
Once the Ceph OSDs image upgrade is done, unset the flag:
ceph osd unset noout
Monitor the Ceph OSDs image upgrade. If the symptoms of slow start appear, set the
nooutflag as soon as possible. Once the Ceph OSDs image upgrade is done, unset the flag.
Note
The issue does not reproduce since MOSK 25.2.
Update of a managed cluster based on bare metal and Ceph enabled fails with
PersistentVolumeClaim getting stuck in the Pending state for the
prometheus-server StatefulSet and the
MountVolume.MountDevice failed for volume warning in the StackLight event
logs.
Workaround:
Verify that the description of the Pods that failed to run contain the
FailedMountevents:kubectl -n <affectedProjectName> describe pod <affectedPodName>
In the command above, replace the following values:
<affectedProjectName>is the Container Cloud project name where the Pods failed to run<affectedPodName>is a Pod name that failed to run in the specified project
In the Pod description, identify the node name where the Pod failed to run.
Verify that the
csi-rbdpluginlogs of the affected node contain therbd volume mount failed: <csi-vol-uuid> is being usederror. The<csi-vol-uuid>is a unique RBD volume name.Identify
csiPodNameof the correspondingcsi-rbdplugin:kubectl -n rook-ceph get pod -l app=csi-rbdplugin \ -o jsonpath='{.items[?(@.spec.nodeName == "<nodeName>")].metadata.name}'
Output the affected
csiPodNamelogs:kubectl -n rook-ceph logs <csiPodName> -c csi-rbdplugin
Scale down the affected
StatefulSetorDeploymentof the Pod that fails to0replicas.On every
csi-rbdpluginPod, search for stuckcsi-vol:for pod in `kubectl -n rook-ceph get pods|grep rbdplugin|grep -v provisioner|awk '{print $1}'`; do echo $pod kubectl exec -it -n rook-ceph $pod -c csi-rbdplugin -- rbd device list | grep <csi-vol-uuid> done
Unmap the affected
csi-vol:rbd unmap -o force /dev/rbd<i>
The
/dev/rbd<i>value is a mapped RBD volume that usescsi-vol.Delete
volumeattachmentof the affected Pod:kubectl get volumeattachments | grep <csi-vol-uuid> kubectl delete volumeattacmhent <id>
Scale up the affected
StatefulSetorDeploymentback to the original number of replicas and wait until its state becomesRunning.
Fixed in 2.30.0 (21.0.0 and 20.0.0)
A compact MOSK cluster fails to be deployed through the Container Cloud web UI
due to inability to add any label to the control plane machines along with
inability to change dedicatedControlPlane: false using the web UI.
To work around the issue, manually add the required labels using CLI. Once done, the cluster deployment resumes.
A newly created project does not display all available tabs in the Container
Cloud web UI and contains different access denied errors during first five
minutes after creation.
To work around the issue, refresh the browser in five minutes after the project creation.
Patch update from 2.27.3 to 2.27.4 may get stuck with one or more management
cluster nodes remaining in the Prepare state and with the following error
in the lcm-controller logs on the management cluster:
failed to create cluster updater for cluster default/kaas-mgmt:
machine update group not found for machine default/master-0
To work around the issue, in the LCMMachine objects of the management
cluster, set the following annotation:
lcm.mirantis.com/update-group: <mgmt cluster name>-controlplane
Once done, patch update of the cluster resumes automatically.
This section lists the artifacts of components included in the Container Cloud patch release 2.27.4. For artifacts of the Cluster releases introduced in 2.27.4, see patch Cluster releases 16.2.4 and 17.2.4.
Note
The components that are newly added, updated, deprecated, or removed
as compared to the previous release version, are marked
with a corresponding superscript,
for example, lcm-ansible Updated.
Artifact |
Component |
Path |
|---|---|---|
Binaries Updated |
ironic-python-agent.initramfs |
https://binary.mirantis.com/bm/bin/ironic/ipa/ubuntu/initramfs-yoga-focal-debug-20240821131059 |
ironic-python-agent.kernel |
https://binary.mirantis.com/bm/bin/ironic/ipa/ubuntu/kernel-yoga-focal-debug-20240821131059 |
|
Helm charts Updated |
baremetal-api |
https://binary.mirantis.com/core/helm/baremetal-api-1.40.23.tgz |
baremetal-operator |
https://binary.mirantis.com/core/helm/baremetal-operator-1.40.23.tgz |
|
baremetal-provider |
https://binary.mirantis.com/core/helm/baremetal-provider-1.40.23.tgz |
|
baremetal-public-api |
https://binary.mirantis.com/core/helm/baremetal-public-api-1.40.23.tgz |
|
kaas-ipam |
||
metallb |
||
Docker images |
ambasador Updated |
mirantis.azurecr.io/core/external/nginx:1.40.23 |
baremetal-dnsmasq |
mirantis.azurecr.io/bm/baremetal-dnsmasq:base-2-27-alpine-20240806125028 |
|
baremetal-operator Updated |
mirantis.azurecr.io/bm/baremetal-operator:base-2-27-alpine-20240827132225 |
|
bm-collective |
mirantis.azurecr.io/bm/bm-collective:base-2-27-alpine-20240812135414 |
|
cluster-api-provider-baremetal Updated |
mirantis.azurecr.io/core/cluster-api-provider-baremetal:1.40.23 |
|
ironic |
mirantis.azurecr.io/openstack/ironic:antelope-jammy-20240716113922 |
|
ironic-inspector |
mirantis.azurecr.io/openstack/ironic-inspector:antelope-jammy-20240716113922 |
|
ironic-prometheus-exporter Updated |
mirantis.azurecr.io/stacklight/ironic-prometheus-exporter:0.1-20240819102310 |
|
kaas-ipam |
mirantis.azurecr.io/bm/kaas-ipam:base-2-27-alpine-20240812140336 |
|
kubernetes-entrypoint Updated |
mirantis.azurecr.io/openstack/extra/kubernetes-entrypoint:v1.0.1-4e381cb-20240813170642 |
|
mariadb |
mirantis.azurecr.io/general/mariadb:10.6.17-focal-20240523075821 |
|
mcc-keepalived |
mirantis.azurecr.io/lcm/mcc-keepalived:v0.25.0-42-g8710cbe |
|
metallb-controller |
mirantis.azurecr.io/bm/metallb/controller:v0.14.5-dfbd1a68-amd64 |
|
metallb-speaker |
mirantis.azurecr.io/bm/metallb/speaker:v0.14.5-dfbd1a68-amd64 |
|
syslog-ng |
mirantis.azurecr.io/bm/syslog-ng:base-alpine-20240806124545 |
Artifact |
Component |
Path |
|---|---|---|
Bootstrap tarball Updated |
bootstrap-darwin |
https://binary.mirantis.com/core/bin/bootstrap-darwin-1.40.23.tgz |
bootstrap-linux |
https://binary.mirantis.com/core/bin/bootstrap-linux-1.40.23.tgz |
|
Helm charts Updated |
admission-controller |
https://binary.mirantis.com/core/helm/admission-controller-1.40.23.tgz |
agent-controller |
https://binary.mirantis.com/core/helm/agent-controller-1.40.23.tgz |
|
ceph-kcc-controller |
https://binary.mirantis.com/core/helm/ceph-kcc-controller-1.40.23.tgz |
|
cert-manager |
https://binary.mirantis.com/core/helm/cert-manager-1.40.23.tgz |
|
configuration-collector |
https://binary.mirantis.com/core/helm/configuration-collector-1.40.23.tgz |
|
event-controller |
https://binary.mirantis.com/core/helm/event-controller-1.40.23.tgz |
|
host-os-modules-controller |
https://binary.mirantis.com/core/helm/host-os-modules-controller-1.40.23.tgz |
|
iam-controller |
https://binary.mirantis.com/core/helm/iam-controller-1.40.23.tgz |
|
kaas-exporter |
https://binary.mirantis.com/core/helm/kaas-exporter-1.40.23.tgz |
|
kaas-public-api |
https://binary.mirantis.com/core/helm/kaas-public-api-1.40.23.tgz |
|
kaas-ui |
||
lcm-controller |
https://binary.mirantis.com/core/helm/lcm-controller-1.40.23.tgz |
|
license-controller |
https://binary.mirantis.com/core/helm/license-controller-1.40.23.tgz |
|
machinepool-controller |
https://binary.mirantis.com/core/helm/machinepool-controller-1.40.23.tgz |
|
mcc-cache |
||
mcc-cache-warmup |
https://binary.mirantis.com/core/helm/mcc-cache-warmup-1.40.23.tgz |
|
openstack-provider |
https://binary.mirantis.com/core/helm/openstack-provider-1.40.23.tgz |
|
os-credentials-controller |
https://binary.mirantis.com/core/helm/os-credentials-controller-1.40.23.tgz |
|
portforward-controller |
https://binary.mirantis.com/core/helm/portforward-controller-1.40.23.tgz |
|
rbac-controller |
https://binary.mirantis.com/core/helm/rbac-controller-1.40.23.tgz |
|
release-controller |
https://binary.mirantis.com/core/helm/release-controller-1.40.23.tgz |
|
scope-controller |
https://binary.mirantis.com/core/helm/scope-controller-1.40.23.tgz |
|
secret-controller |
https://binary.mirantis.com/core/helm/secret-controller-1.40.23.tgz |
|
user-controller |
https://binary.mirantis.com/core/helm/user-controller-1.40.23.tgz |
|
Docker images |
admission-controller Updated |
mirantis.azurecr.io/core/admission-controller:1.40.23 |
agent-controller Updated |
mirantis.azurecr.io/core/agent-controller:1.40.23 |
|
byo-cluster-api-controller Updated |
mirantis.azurecr.io/core/byo-cluster-api-controller:1.40.23 |
|
ceph-kcc-controller Updated |
mirantis.azurecr.io/core/ceph-kcc-controller:1.40.23 |
|
cert-manager-controller Updated |
mirantis.azurecr.io/core/external/cert-manager-controller:v1.11.0-7 |
|
configuration-collector Updated |
mirantis.azurecr.io/core/configuration-collector:1.40.23 |
|
event-controller Updated |
mirantis.azurecr.io/core/event-controller:1.40.23 |
|
frontend Updated |
mirantis.azurecr.io/core/frontend:1.40.23 |
|
host-os-modules-controller Updated |
mirantis.azurecr.io/core/host-os-modules-controller:1.40.23 |
|
iam-controller Updated |
mirantis.azurecr.io/core/iam-controller:1.40.23 |
|
kaas-exporter Updated |
mirantis.azurecr.io/core/kaas-exporter:1.40.23 |
|
kproxy Updated |
mirantis.azurecr.io/core/kproxy:1.40.23 |
|
lcm-controller Updated |
mirantis.azurecr.io/core/lcm-controller:1.40.23 |
|
license-controller Updated |
mirantis.azurecr.io/core/license-controller:1.40.23 |
|
machinepool-controller Updated |
mirantis.azurecr.io/core/machinepool-controller:1.40.23 |
|
mcc-cache-warmup Updated |
mirantis.azurecr.io/core/mcc-cache-warmup:1.40.23 |
|
mcc-haproxy |
mirantis.azurecr.io/lcm/mcc-haproxy:v0.25.0-42-g8710cbe |
|
mcc-keepalived |
mirantis.azurecr.io/lcm/mcc-keepalived:v0.25.0-42-g8710cbe |
|
nginx Updated |
mirantis.azurecr.io/core/external/nginx:1.40.23 |
|
openstack-cluster-api-controller Updated |
mirantis.azurecr.io/core/openstack-cluster-api-controller:1.40.23 |
|
os-credentials-controller Updated |
mirantis.azurecr.io/core/os-credentials-controller:1.40.23 |
|
portforward-controller Updated |
mirantis.azurecr.io/core/portforward-controller:1.40.23 |
|
rbac-controller Updated |
mirantis.azurecr.io/core/rbac-controller:1.40.23 |
|
registry |
mirantis.azurecr.io/lcm/registry:v2.8.1-11 |
|
release-controller Updated |
mirantis.azurecr.io/core/release-controller:1.40.23 |
|
scope-controller Updated |
mirantis.azurecr.io/core/scope-controller:1.40.23 |
|
secret-controller Updated |
mirantis.azurecr.io/core/secret-controller:1.40.23 |
|
user-controller Updated |
mirantis.azurecr.io/core/user-controller:1.40.23 |
Artifact |
Component |
Path |
|---|---|---|
Binaries |
hash-generate-darwin |
http://binary.mirantis.com/iam/bin/hash-generate-0.0.1-268-3cf7f17-darwin |
hash-generate-linux |
http://binary.mirantis.com/iam/bin/hash-generate-0.0.1-268-3cf7f17-linux |
|
Helm charts Updated |
iam |
|
Docker images |
kubectl |
mirantis.azurecr.io/general/kubectl:20240711152257 |
mariadb |
mirantis.azurecr.io/general/mariadb:10.6.17-focal-20240523075821 |
|
mcc-keycloak |
mirantis.azurecr.io/iam/mcc-keycloak:24.0.5-20240802071408 |
Important
For MOSK clusters, Container Cloud 2.27.3 is the first patch release of MOSK 24.2.x series using the patch Cluster release 17.2.3. For the update path of 24.1 and 24.2 series, see MOSK documentation: Cluster update scheme.
The Container Cloud patch release 2.27.3, which is based on the 2.27.0 major release, provides the following updates:
Support for the patch Cluster releases 16.2.3 and 17.2.3 that represents Mirantis OpenStack for Kubernetes (MOSK) patch release 24.2.1 patch.
MKE:
Support for MKE 3.7.12.
Improvements in the MKE benchmark compliance (control ID 5.1.5): analyzed and fixed the majority of failed compliance checks for the following components:
Container Cloud:
iam-keycloakin thekaasnamespace andopensearch-dashboardsin thestacklightnamespaceMOSK:
opensearch-dashboardsin thestacklightnamespace
Bare metal: update of Ubuntu mirror from ubuntu-2024-07-16-014744 to ubuntu-2024-08-06-014502 along with update of the minor kernel version from 5.15.0-116-generic to 5.15.0-117-generic.
VMware vSphere: suspension of support for cluster deployment, update, and attachment. For details, see Deprecation Notes.
Security fixes for CVEs in images.
This patch release also supports the latest major Cluster releases 17.2.0 and 16.2.0. And it does not support greenfield deployments based on deprecated Cluster releases. Use the latest available Cluster release instead.
For main deliverables of the parent Container Cloud release of 2.27.3, refer to 2.27.0.
In total, since Container Cloud 2.27.2, 1559 Common Vulnerabilities and Exposures (CVE) have been fixed in 2.27.3: 253 of critical and 1306 of high severity.
The table below includes the total numbers of addressed unique and common CVEs in images by product component since Container Cloud 2.27.2. The common CVEs are issues addressed across several images.
Product component |
CVE type |
Critical |
High |
Total |
|---|---|---|---|---|
Ceph |
Unique |
3 |
14 |
17 |
Common |
142 |
736 |
878 |
|
Kaas core |
Unique |
4 |
22 |
26 |
Common |
99 |
448 |
547 |
|
StackLight |
Unique |
7 |
51 |
58 |
Common |
12 |
122 |
134 |
Mirantis Security Portal
For the detailed list of fixed and existing CVEs across the Mirantis Container Cloud and MOSK products, refer to Mirantis Security Portal.
MOSK CVEs
For the number of fixed CVEs in the MOSK-related components including OpenStack and Tungsten Fabric, refer to MOSK 24.2.1: Security notes.
This section lists known issues with workarounds for the Mirantis Container Cloud release 2.27.3 including the Cluster releases 16.2.3 and 17.2.3.
For other issues that can occur while deploying and operating a Container Cloud cluster, see Troubleshooting Guide.
Note
This section also outlines still valid known issues from previous Container Cloud releases.
Note
Moving forward, the workaround for this issue will be moved from Release Notes to MOSK Troubleshooting Guide: Inspection error on bare metal hosts after dnsmasq restart.
If the dnsmasq pod is restarted during the bootstrap of newly added
nodes, those nodes may fail to undergo inspection. That can result in
inspection error in the corresponding BareMetalHost objects.
The issue can occur when:
The
dnsmasqpod was moved to another node.DHCP subnets were changed, including addition or removal. In this case, the
dhcpdcontainer of thednsmasqpod is restarted.Caution
If changing or adding of DHCP subnets is required to bootstrap new nodes, wait after changing or adding DHCP subnets until the
dnsmasqpod becomes ready, then createBareMetalHostobjects.
To verify whether the nodes are affected:
Verify whether the
BareMetalHostobjects contain theinspection error:kubectl get bmh -n <managed-cluster-namespace-name>
Example of system response:
NAME STATE CONSUMER ONLINE ERROR AGE test-master-1 provisioned test-master-1 true 9d test-master-2 provisioned test-master-2 true 9d test-master-3 provisioned test-master-3 true 9d test-worker-1 provisioned test-worker-1 true 9d test-worker-2 provisioned test-worker-2 true 9d test-worker-3 inspecting true inspection error 19h
Verify whether the
dnsmasqpod was inReadystate when the inspection of the affected baremetal hosts (test-worker-3in the example above) was started:kubectl -n kaas get pod <dnsmasq-pod-name> -oyaml
Example of system response:
... status: conditions: - lastProbeTime: null lastTransitionTime: "2024-10-10T15:37:34Z" status: "True" type: Initialized - lastProbeTime: null lastTransitionTime: "2024-10-11T07:38:54Z" status: "True" type: Ready - lastProbeTime: null lastTransitionTime: "2024-10-11T07:38:54Z" status: "True" type: ContainersReady - lastProbeTime: null lastTransitionTime: "2024-10-10T15:37:34Z" status: "True" type: PodScheduled containerStatuses: - containerID: containerd://6dbcf2fc4b36ce4c549c9191ab01f72d0236c51d42947675302675e4bfaf4cdf image: docker-dev-kaas-virtual.artifactory-eu.mcp.mirantis.net/bm/baremetal-dnsmasq:base-2-28-alpine-20240812132650 imageID: docker-dev-kaas-virtual.artifactory-eu.mcp.mirantis.net/bm/baremetal-dnsmasq@sha256:3dad3e278add18e69b2608e462691c4823942641a0f0e25e6811e703e3c23b3b lastState: terminated: containerID: containerd://816fcf079cd544acd74e312065de5b5ed4dbf1dc6159fefffff4f644b5e45987 exitCode: 0 finishedAt: "2024-10-11T07:38:35Z" reason: Completed startedAt: "2024-10-10T15:37:45Z" name: dhcpd ready: true restartCount: 2 started: true state: running: startedAt: "2024-10-11T07:38:37Z" ...
In the system response above, the
dhcpdcontainer was not ready between"2024-10-11T07:38:35Z"and"2024-10-11T07:38:54Z".Verify the affected baremetal host. For example:
kubectl get bmh -n managed-ns test-worker-3 -oyaml
Example of system response:
... status: errorCount: 15 errorMessage: Introspection timeout errorType: inspection error ... operationHistory: deprovision: end: null start: null inspect: end: null start: "2024-10-11T07:38:19Z" provision: end: null start: null register: end: "2024-10-11T07:38:19Z" start: "2024-10-11T07:37:25Z"
In the system response above, inspection was started at
"2024-10-11T07:38:19Z", immediately before the period of thedhcpdcontainer downtime. Therefore, this node is most likely affected by the issue.
Workaround
Reboot the node using the IPMI reset or cycle command.
If the node fails to boot, remove the failed
BareMetalHostobject and create it again:Remove
BareMetalHostobject. For example:kubectl delete bmh -n managed-ns test-worker-3
Verify that the
BareMetalHostobject is removed:kubectl get bmh -n managed-ns test-worker-3
Create a
BareMetalHostobject from the template. For example:kubectl create -f bmhc-test-worker-3.yaml kubectl create -f bmh-test-worker-3.yaml
Fixed in 2.28.0 (17.3.0 and 16.3.0)
When trying to list the HostOSConfigurationModules and HostOSConfiguration custom resources, serviceuser or a user with
the global-admin or operator role obtains the access denied error.
For example:
kubectl --kubeconfig ~/.kube/mgmt-config get hocm
Error from server (Forbidden): hostosconfigurationmodules.kaas.mirantis.com is forbidden:
User "2d74348b-5669-4c65-af31-6c05dbedac5f" cannot list resource "hostosconfigurationmodules"
in API group "kaas.mirantis.com" at the cluster scope: access denied
Workaround:
Modify the
global-adminrole by adding a new entry with the following contents to theruleslist:kubectl edit clusterroles kaas-global-admin
- apiGroups: [kaas.mirantis.com] resources: [hostosconfigurationmodules] verbs: ['*']
For each Container Cloud project, modify the
kaas-operatorrole by adding a new entry with the following contents to theruleslist:kubectl -n <projectName> edit roles kaas-operator
- apiGroups: [kaas.mirantis.com] resources: [hostosconfigurations] verbs: ['*']
Due to the MetalLB upstream issue, a load balancer service may not obtain the external IP address.
The issue occurs when two services share the same external IP address and have
the same externalTrafficPolicy value. Initially, the services have the
external IP address assigned and are accessible. After modifying the
externalTrafficPolicy value for both services from Cluster to
Local, the first service that has been changed remains with no external IP
address assigned. Though, the second service, which was changed later, has the
external IP assigned as expected.
To work around the issue, make a dummy change to the service object where
external IP is <pending>:
Identify the service that is stuck:
kubectl get svc -A | grep pending
Example of system response:
stacklight iam-proxy-prometheus LoadBalancer 10.233.28.196 <pending> 443:30430/TCP
Add an arbitrary label to the service that is stuck. For example:
kubectl label svc -n stacklight iam-proxy-prometheus reconcile=1
Example of system response:
service/iam-proxy-prometheus labeledVerify that the external IP was allocated to the service:
kubectl get svc -n stacklight iam-proxy-prometheus
Example of system response:
NAME TYPE CLUSTER-IP EXTERNAL-IP PORT(S) AGE iam-proxy-prometheus LoadBalancer 10.233.28.196 10.0.34.108 443:30430/TCP 12d
Fixed in 2.28.0 (17.3.0 and 16.3.0)
After node maintenance of a management cluster, the newly added nodes may fail to undergo provisioning successfully. The issue relates to new nodes that are in the same L2 domain as the management cluster.
The issue was observed on environments having management cluster nodes configured with a single L2 segment used for all network traffic (PXE and LCM/management networks).
To verify whether the cluster is affected:
Verify whether the dnsmasq and dhcp-relay pods run on the same node
in the management cluster:
kubectl -n kaas get pods -o wide| grep -e "dhcp\|dnsmasq"
Example of system response:
dhcp-relay-7d85f75f76-5vdw2 2/2 Running 2 (36h ago) 36h 10.10.0.122 kaas-node-8a24b81c-76d0-4d4c-8421-962bd39df5ad <none> <none>
dnsmasq-8f4b484b4-slhbd 5/5 Running 1 (36h ago) 36h 10.233.123.75 kaas-node-8a24b81c-76d0-4d4c-8421-962bd39df5ad <none> <none>
If this is the case, proceed to the workaround below.
Workaround:
Log in to a node that contains
kubeconfigof the affected management cluster.Make sure that at least two management cluster nodes are schedulable:
kubectl get node
Example of a positive system response:
NAME STATUS ROLES AGE VERSION kaas-node-bcedb87b-b3ce-46a4-a4ca-ea3068689e40 Ready master 37h v1.27.10-mirantis-1 kaas-node-8a24b81c-76d0-4d4c-8421-962bd39df5ad Ready master 37h v1.27.10-mirantis-1 kaas-node-ad5a6f51-b98f-43c3-91d5-55fed3d0ff21 Ready master 37h v1.27.10-mirantis-1
Delete the
dhcp-relaypod:kubectl -n kaas delete pod <dhcp-relay-xxxxx>
Verify that the
dnsmasqanddhcp-relaypods are scheduled into different nodes:kubectl -n kaas get pods -o wide| grep -e "dhcp\|dnsmasq"
Example of a positive system response:
dhcp-relay-7d85f75f76-rkv03 2/2 Running 0 49s 10.10.0.121 kaas-node-bcedb87b-b3ce-46a4-a4ca-ea3068689e40 <none> <none> dnsmasq-8f4b484b4-slhbd 5/5 Running 1 (37h ago) 37h 10.233.123.75 kaas-node-8a24b81c-76d0-4d4c-8421-962bd39df5ad <none> <none>
During deletion of a manager machine running the ironic Pod from a bare
metal management cluster, the following problems occur:
All Pods are stuck in the
TerminatingstateA new
ironicPod fails to startThe related bare metal host is stuck in the
deprovisioningstate
As a workaround, before deletion of the node running the ironic Pod,
cordon and drain the node using the kubectl cordon <nodeName> and
kubectl drain <nodeName> commands.
Fixed in 2.29.0 (17.4.0 and 16.4.0)
During the replacement of a master node on a cluster of any type, the process
may get stuck with Kubelet's NodeReady condition is Unknown in the
machine status on the remaining master nodes.
As a workaround, log in on the affected node and run the following command:
docker restart ucp-kubelet
During MariaDB operations on a management cluster, Pods may get stuck in continuous restarts with the following example error:
[ERROR] WSREP: Corrupt buffer header: \
addr: 0x7faec6f8e518, \
seqno: 3185219421952815104, \
size: 909455917, \
ctx: 0x557094f65038, \
flags: 11577. store: 49, \
type: 49
Workaround:
Create a backup of the
/var/lib/mysqldirectory on themariadb-serverPod.Verify that other replicas are up and ready.
Remove the
galera.cachefile for the affectedmariadb-serverPod.Remove the affected
mariadb-serverPod or wait until it is automatically restarted.
After Kubernetes restarts the Pod, the Pod clones the database in 1-2 minutes and restores the quorum.
Fixed in 2.28.4 (17.3.4 and 16.3.4)
During replacement of a master node on a cluster of any type, the
calico-node Pod fails to start on a new node that has the same IP address
as the node being replaced.
Workaround:
Log in to any
masternode.From a CLI with an MKE client bundle, create a shell alias to start calicoctl using the
mirantis/ucp-dsinfoimage:alias calicoctl="\ docker run -i --rm \ --pid host \ --net host \ -e constraint:ostype==linux \ -e ETCD_ENDPOINTS=<etcdEndpoint> \ -e ETCD_KEY_FILE=/var/lib/docker/volumes/ucp-kv-certs/_data/key.pem \ -e ETCD_CA_CERT_FILE=/var/lib/docker/volumes/ucp-kv-certs/_data/ca.pem \ -e ETCD_CERT_FILE=/var/lib/docker/volumes/ucp-kv-certs/_data/cert.pem \ -v /var/run/calico:/var/run/calico \ -v /var/lib/docker/volumes/ucp-kv-certs/_data:/var/lib/docker/volumes/ucp-kv-certs/_data:ro \ mirantis/ucp-dsinfo:<mkeVersion> \ calicoctl \ "
alias calicoctl="\ docker run -i --rm \ --pid host \ --net host \ -e constraint:ostype==linux \ -e ETCD_ENDPOINTS=<etcdEndpoint> \ -e ETCD_KEY_FILE=/ucp-node-certs/key.pem \ -e ETCD_CA_CERT_FILE=/ucp-node-certs/ca.pem \ -e ETCD_CERT_FILE=/ucp-node-certs/cert.pem \ -v /var/run/calico:/var/run/calico \ -v ucp-node-certs:/ucp-node-certs:ro \ mirantis/ucp-dsinfo:<mkeVersion> \ calicoctl --allow-version-mismatch \ "
In the above command, replace the following values with the corresponding settings of the affected cluster:
<etcdEndpoint>is the etcd endpoint defined in the Calico configuration file. For example,ETCD_ENDPOINTS=127.0.0.1:12378<mkeVersion>is the MKE version installed on your cluster. For example,mirantis/ucp-dsinfo:3.5.7.
Verify the node list on the cluster:
kubectl get node
Compare this list with the node list in Calico to identify the old node:
calicoctl get node -o wide
Remove the old node from Calico:
calicoctl delete node kaas-node-<nodeID>
Fixed in 2.28.4 (17.3.4 and 16.3.4)
During replacement of a manager machine, the following problems may occur:
The system adds the node to Docker swarm but not to Kubernetes
The node
Deploymentgets stuck with failed RethinkDB health checks
Workaround:
Delete the failed node.
Wait for the MKE cluster to become healthy. To monitor the cluster status:
Log in to the MKE web UI.
Monitor the cluster status as described in MKE Operations Guide: Monitor an MKE cluster with the MKE web UI.
Deploy a new node.
Fixed in 2.28.4 (17.3.4 and 16.3.4)
During the unsafe or forced deletion of a manager machine running the
calico-kube-controllers Pod in the kube-system namespace,
the following issues occur:
The
calico-kube-controllersPod fails to clean up resources associated with the deleted nodeThe
calico-nodePod may fail to start up on a newly created node if the machine is provisioned with the same IP address as the deleted machine had
As a workaround, before deletion of the node running the
calico-kube-controllers Pod, cordon and drain the node:
kubectl cordon <nodeName>
kubectl drain <nodeName>
Fixed in 2.29.3 (17.3.8, 16.3.8, and 16.4.3)
Due to the upstream Ceph issue
66717,
during CVE upgrade of the Ceph daemon image of Ceph Reef 18.2.4, OSDs may start
slow and even fail the starting probe with the following describe output in
the rook-ceph-osd-X pod:
Warning Unhealthy 57s (x16 over 3m27s) kubelet Startup probe failed:
ceph daemon health check failed with the following output:
> no valid command found; 10 closest matches:
> 0
> 1
> 2
> abort
> assert
> bluefs debug_inject_read_zeros
> bluefs files list
> bluefs stats
> bluestore bluefs device info [<alloc_size:int>]
> config diff
> admin_socket: invalid command
Workaround:
Complete the following steps during every patch or major cluster update of the Cluster releases 17.2.x, 17.3.x, and 17.4.x (until Ceph 18.2.5 becomes supported):
Plan extra time in the maintenance window for the patch cluster update.
Slow starts will still impact the update procedure, but after completing the following step, the recovery process noticeably shortens without affecting the overall cluster state and data responsiveness.
Select one of the following options:
Before the cluster update, set the
nooutflag:ceph osd set noout
Once the Ceph OSDs image upgrade is done, unset the flag:
ceph osd unset noout
Monitor the Ceph OSDs image upgrade. If the symptoms of slow start appear, set the
nooutflag as soon as possible. Once the Ceph OSDs image upgrade is done, unset the flag.
Note
The issue does not reproduce since MOSK 25.2.
Update of a managed cluster based on bare metal and Ceph enabled fails with
PersistentVolumeClaim getting stuck in the Pending state for the
prometheus-server StatefulSet and the
MountVolume.MountDevice failed for volume warning in the StackLight event
logs.
Workaround:
Verify that the description of the Pods that failed to run contain the
FailedMountevents:kubectl -n <affectedProjectName> describe pod <affectedPodName>
In the command above, replace the following values:
<affectedProjectName>is the Container Cloud project name where the Pods failed to run<affectedPodName>is a Pod name that failed to run in the specified project
In the Pod description, identify the node name where the Pod failed to run.
Verify that the
csi-rbdpluginlogs of the affected node contain therbd volume mount failed: <csi-vol-uuid> is being usederror. The<csi-vol-uuid>is a unique RBD volume name.Identify
csiPodNameof the correspondingcsi-rbdplugin:kubectl -n rook-ceph get pod -l app=csi-rbdplugin \ -o jsonpath='{.items[?(@.spec.nodeName == "<nodeName>")].metadata.name}'
Output the affected
csiPodNamelogs:kubectl -n rook-ceph logs <csiPodName> -c csi-rbdplugin
Scale down the affected
StatefulSetorDeploymentof the Pod that fails to0replicas.On every
csi-rbdpluginPod, search for stuckcsi-vol:for pod in `kubectl -n rook-ceph get pods|grep rbdplugin|grep -v provisioner|awk '{print $1}'`; do echo $pod kubectl exec -it -n rook-ceph $pod -c csi-rbdplugin -- rbd device list | grep <csi-vol-uuid> done
Unmap the affected
csi-vol:rbd unmap -o force /dev/rbd<i>
The
/dev/rbd<i>value is a mapped RBD volume that usescsi-vol.Delete
volumeattachmentof the affected Pod:kubectl get volumeattachments | grep <csi-vol-uuid> kubectl delete volumeattacmhent <id>
Scale up the affected
StatefulSetorDeploymentback to the original number of replicas and wait until its state becomesRunning.
Fixed in 2.30.0 (21.0.0 and 20.0.0)
A compact MOSK cluster fails to be deployed through the Container Cloud web UI
due to inability to add any label to the control plane machines along with
inability to change dedicatedControlPlane: false using the web UI.
To work around the issue, manually add the required labels using CLI. Once done, the cluster deployment resumes.
A newly created project does not display all available tabs in the Container
Cloud web UI and contains different access denied errors during first five
minutes after creation.
To work around the issue, refresh the browser in five minutes after the project creation.
This section lists the artifacts of components included in the Container Cloud patch release 2.27.3. For artifacts of the Cluster releases introduced in 2.27.3, see patch Cluster releases 16.2.3 and 17.2.3.
Note
The components that are newly added, updated, deprecated, or removed
as compared to the previous release version, are marked
with a corresponding superscript,
for example, lcm-ansible Updated.
Artifact |
Component |
Path |
|---|---|---|
Binaries |
ironic-python-agent.initramfs |
https://binary.mirantis.com/bm/bin/ironic/ipa/ubuntu/initramfs-yoga-focal-debug-20240716085444 |
ironic-python-agent.kernel |
https://binary.mirantis.com/bm/bin/ironic/ipa/ubuntu/kernel-yoga-focal-debug-20240716085444 |
|
Helm charts Updated |
baremetal-api |
https://binary.mirantis.com/core/helm/baremetal-api-1.40.21.tgz |
baremetal-operator |
https://binary.mirantis.com/core/helm/baremetal-operator-1.40.21.tgz |
|
baremetal-provider |
https://binary.mirantis.com/core/helm/baremetal-provider-1.40.21.tgz |
|
baremetal-public-api |
https://binary.mirantis.com/core/helm/baremetal-public-api-1.40.21.tgz |
|
kaas-ipam |
||
metallb |
||
Docker images |
ambasador Updated |
mirantis.azurecr.io/core/external/nginx:1.40.21 |
baremetal-dnsmasq Updated |
mirantis.azurecr.io/bm/baremetal-dnsmasq:base-2-27-alpine-20240806125028 |
|
baremetal-operator Updated |
mirantis.azurecr.io/bm/baremetal-operator:base-2-27-alpine-20240812133205 |
|
bm-collective Updated |
mirantis.azurecr.io/bm/bm-collective:base-2-27-alpine-20240812135414 |
|
cluster-api-provider-baremetal Updated |
mirantis.azurecr.io/core/cluster-api-provider-baremetal:1.40.21 |
|
ironic |
mirantis.azurecr.io/openstack/ironic:antelope-jammy-20240716113922 |
|
ironic-inspector |
mirantis.azurecr.io/openstack/ironic-inspector:antelope-jammy-20240716113922 |
|
ironic-prometheus-exporter |
mirantis.azurecr.io/stacklight/ironic-prometheus-exporter:0.1-20240117102150 |
|
kaas-ipam Updated |
mirantis.azurecr.io/bm/kaas-ipam:base-2-27-alpine-20240812140336 |
|
kubernetes-entrypoint |
mirantis.azurecr.io/openstack/extra/kubernetes-entrypoint:v1.0.1-ba8ada4-20240405150338 |
|
mariadb |
mirantis.azurecr.io/general/mariadb:10.6.17-focal-20240523075821 |
|
mcc-keepalived Updated |
mirantis.azurecr.io/lcm/mcc-keepalived:v0.25.0-42-g8710cbe |
|
metallb-controller Updated |
mirantis.azurecr.io/bm/metallb/controller:v0.14.5-dfbd1a68-amd64 |
|
metallb-speaker Updated |
mirantis.azurecr.io/bm/metallb/speaker:v0.14.5-dfbd1a68-amd64 |
|
syslog-ng Updated |
mirantis.azurecr.io/bm/syslog-ng:base-alpine-20240806124545 |
Artifact |
Component |
Path |
|---|---|---|
Bootstrap tarball Updated |
bootstrap-darwin |
https://binary.mirantis.com/core/bin/bootstrap-darwin-1.40.21.tgz |
bootstrap-linux |
https://binary.mirantis.com/core/bin/bootstrap-linux-1.40.21.tgz |
|
Helm charts Updated |
admission-controller |
https://binary.mirantis.com/core/helm/admission-controller-1.40.21.tgz |
agent-controller |
https://binary.mirantis.com/core/helm/agent-controller-1.40.21.tgz |
|
byo-provider Unsupported |
https://binary.mirantis.com/core/helm/byo-provider-1.40.21.tgz |
|
ceph-kcc-controller |
https://binary.mirantis.com/core/helm/ceph-kcc-controller-1.40.21.tgz |
|
cert-manager |
https://binary.mirantis.com/core/helm/cert-manager-1.40.21.tgz |
|
configuration-collector |
https://binary.mirantis.com/core/helm/configuration-collector-1.40.21.tgz |
|
event-controller |
https://binary.mirantis.com/core/helm/event-controller-1.40.21.tgz |
|
host-os-modules-controller |
https://binary.mirantis.com/core/helm/host-os-modules-controller-1.40.21.tgz |
|
iam-controller |
https://binary.mirantis.com/core/helm/iam-controller-1.40.21.tgz |
|
kaas-exporter |
https://binary.mirantis.com/core/helm/kaas-exporter-1.40.21.tgz |
|
kaas-public-api |
https://binary.mirantis.com/core/helm/kaas-public-api-1.40.21.tgz |
|
kaas-ui |
||
lcm-controller |
https://binary.mirantis.com/core/helm/lcm-controller-1.40.21.tgz |
|
license-controller |
https://binary.mirantis.com/core/helm/license-controller-1.40.21.tgz |
|
machinepool-controller |
https://binary.mirantis.com/core/helm/machinepool-controller-1.40.21.tgz |
|
mcc-cache |
||
mcc-cache-warmup |
https://binary.mirantis.com/core/helm/mcc-cache-warmup-1.40.21.tgz |
|
openstack-provider |
https://binary.mirantis.com/core/helm/openstack-provider-1.40.21.tgz |
|
os-credentials-controller |
https://binary.mirantis.com/core/helm/os-credentials-controller-1.40.21.tgz |
|
portforward-controller |
https://binary.mirantis.com/core/helm/portforward-controller-1.40.21.tgz |
|
rbac-controller |
https://binary.mirantis.com/core/helm/rbac-controller-1.40.21.tgz |
|
release-controller |
https://binary.mirantis.com/core/helm/release-controller-1.40.21.tgz |
|
scope-controller |
https://binary.mirantis.com/core/helm/scope-controller-1.40.21.tgz |
|
secret-controller |
https://binary.mirantis.com/core/helm/secret-controller-1.40.21.tgz |
|
squid-proxy Unsupported |
https://binary.mirantis.com/core/helm/squid-proxy-1.40.21.tgz |
|
user-controller |
https://binary.mirantis.com/core/helm/user-controller-1.40.21.tgz |
|
vsphere-credentials-controller Unsupported |
https://binary.mirantis.com/core/helm/vsphere-credentials-controller-1.40.21.tgz |
|
vsphere-provider Unsupported |
https://binary.mirantis.com/core/helm/vsphere-provider-1.40.21.tgz |
|
vsphere-vm-template-controller Unsupported |
https://binary.mirantis.com/core/helm/vsphere-vm-template-controller-1.40.21.tgz |
|
Docker images |
admission-controller Updated |
mirantis.azurecr.io/core/admission-controller:1.40.21 |
agent-controller Updated |
mirantis.azurecr.io/core/agent-controller:1.40.21 |
|
byo-cluster-api-controller Unsupported |
mirantis.azurecr.io/core/byo-cluster-api-controller:1.40.21 |
|
ceph-kcc-controller Updated |
mirantis.azurecr.io/core/ceph-kcc-controller:1.40.21 |
|
cert-manager-controller |
mirantis.azurecr.io/core/external/cert-manager-controller:v1.11.0-6 |
|
configuration-collector Updated |
mirantis.azurecr.io/core/configuration-collector:1.40.21 |
|
event-controller Updated |
mirantis.azurecr.io/core/event-controller:1.40.21 |
|
frontend Updated |
mirantis.azurecr.io/core/frontend:1.40.21 |
|
host-os-modules-controller Updated |
mirantis.azurecr.io/core/host-os-modules-controller:1.40.21 |
|
iam-controller Updated |
mirantis.azurecr.io/core/iam-controller:1.40.21 |
|
kaas-exporter Updated |
mirantis.azurecr.io/core/kaas-exporter:1.40.21 |
|
kproxy Updated |
mirantis.azurecr.io/core/kproxy:1.40.21 |
|
lcm-controller Updated |
mirantis.azurecr.io/core/lcm-controller:1.40.21 |
|
license-controller Updated |
mirantis.azurecr.io/core/license-controller:1.40.21 |
|
machinepool-controller Updated |
mirantis.azurecr.io/core/machinepool-controller:1.40.21 |
|
mcc-cache-warmup Updated |
mirantis.azurecr.io/core/mcc-cache-warmup:1.40.21 |
|
mcc-haproxy Updated |
mirantis.azurecr.io/lcm/mcc-haproxy:v0.25.0-42-g8710cbe |
|
mcc-keepalived Updated |
mirantis.azurecr.io/lcm/mcc-keepalived:v0.25.0-42-g8710cbe |
|
nginx Updated |
mirantis.azurecr.io/core/external/nginx:1.40.21 |
|
openstack-cluster-api-controller Updated |
mirantis.azurecr.io/core/openstack-cluster-api-controller:1.40.21 |
|
os-credentials-controller Updated |
mirantis.azurecr.io/core/os-credentials-controller:1.40.21 |
|
portforward-controller Updated |
mirantis.azurecr.io/core/portforward-controller:1.40.21 |
|
rbac-controller Updated |
mirantis.azurecr.io/core/rbac-controller:1.40.21 |
|
registry Updated |
mirantis.azurecr.io/lcm/registry:v2.8.1-11 |
|
release-controller Updated |
mirantis.azurecr.io/core/release-controller:1.40.21 |
|
scope-controller Updated |
mirantis.azurecr.io/core/scope-controller:1.40.21 |
|
secret-controller Updated |
mirantis.azurecr.io/core/secret-controller:1.40.21 |
|
squid-proxy Unsupported |
mirantis.azurecr.io/lcm/squid-proxy:0.0.1-10-g24a0d69 |
|
user-controller Updated |
mirantis.azurecr.io/core/user-controller:1.40.21 |
|
vsphere-cluster-api-controller Unsupported |
mirantis.azurecr.io/core/vsphere-cluster-api-controller:1.40.21 |
|
vsphere-credentials-controller Unsupported |
mirantis.azurecr.io/core/vsphere-credentials-controller:1.40.21 |
|
vsphere-vm-template-controller Unsupported |
mirantis.azurecr.io/core/vsphere-vm-template-controller:1.40.21 |
Artifact |
Component |
Path |
|---|---|---|
Binaries |
hash-generate-darwin |
http://binary.mirantis.com/iam/bin/hash-generate-0.0.1-268-3cf7f17-darwin |
hash-generate-linux |
http://binary.mirantis.com/iam/bin/hash-generate-0.0.1-268-3cf7f17-linux |
|
Helm charts Updated |
iam |
|
Docker images |
kubectl |
mirantis.azurecr.io/general/kubectl:20240711152257 |
mariadb |
mirantis.azurecr.io/general/mariadb:10.6.17-focal-20240523075821 |
|
mcc-keycloak Updated |
mirantis.azurecr.io/iam/mcc-keycloak:24.0.5-20240802071408 |
Important
For MOSK clusters, Container Cloud 2.27.2 is the continuation for MOSK 24.1.x series using the patch Cluster release 17.1.7. For the update path of 24.1 and 24.2 series, see MOSK documentation: Cluster update scheme.
The management cluster of a MOSK 24.1, 24.1.5, or 24.1.6 cluster is automatically updated to the latest patch Cluster release 16.2.2.
The Container Cloud patch release 2.27.2, which is based on the 2.27.0 major release, provides the following updates:
Support for the patch Cluster release 16.2.2.
Support for the patch Cluster releases 16.1.7 and 17.1.7 that represents Mirantis OpenStack for Kubernetes (MOSK) patch release 24.1.7 patch.
Support for MKE 3.7.11.
Bare metal: update of Ubuntu mirror from ubuntu-2024-06-27-095142 to ubuntu-2024-07-16-014744 along with update of minor kernel version from 5.15.0-113-generic to 5.15.0-116-generic (Cluster release 16.2.2).
Security fixes for CVEs in images.
This patch release also supports the latest major Cluster releases 17.2.0 and 16.2.0. And it does not support greenfield deployments based on deprecated Cluster releases. Use the latest available Cluster release instead.
For main deliverables of the parent Container Cloud release of 2.27.2, refer to 2.27.0.
In total, since Container Cloud 2.27.1, 95 Common Vulnerabilities and Exposures (CVE) have been fixed in 2.27.2: 6 of critical and 89 of high severity.
The table below includes the total numbers of addressed unique and common CVEs in images by product component since Container Cloud 2.27.1. The common CVEs are issues addressed across several images.
Product component |
CVE type |
Critical |
High |
Total |
|---|---|---|---|---|
Kaas core |
Unique |
5 |
26 |
31 |
Common |
6 |
69 |
75 |
|
StackLight |
Unique |
0 |
3 |
3 |
Common |
0 |
20 |
20 |
Mirantis Security Portal
For the detailed list of fixed and existing CVEs across the Mirantis Container Cloud and MOSK products, refer to Mirantis Security Portal.
MOSK CVEs
For the number of fixed CVEs in the MOSK-related components including OpenStack and Tungsten Fabric, refer to MOSK 24.1.7: Security notes.
This section lists known issues with workarounds for the Mirantis Container Cloud release 2.27.2 including the Cluster releases 16.2.2, 16.1.7, and 17.1.7.
For other issues that can occur while deploying and operating a Container Cloud cluster, see Troubleshooting Guide.
Note
This section also outlines still valid known issues from previous Container Cloud releases.
Note
Moving forward, the workaround for this issue will be moved from Release Notes to MOSK Troubleshooting Guide: Inspection error on bare metal hosts after dnsmasq restart.
If the dnsmasq pod is restarted during the bootstrap of newly added
nodes, those nodes may fail to undergo inspection. That can result in
inspection error in the corresponding BareMetalHost objects.
The issue can occur when:
The
dnsmasqpod was moved to another node.DHCP subnets were changed, including addition or removal. In this case, the
dhcpdcontainer of thednsmasqpod is restarted.Caution
If changing or adding of DHCP subnets is required to bootstrap new nodes, wait after changing or adding DHCP subnets until the
dnsmasqpod becomes ready, then createBareMetalHostobjects.
To verify whether the nodes are affected:
Verify whether the
BareMetalHostobjects contain theinspection error:kubectl get bmh -n <managed-cluster-namespace-name>
Example of system response:
NAME STATE CONSUMER ONLINE ERROR AGE test-master-1 provisioned test-master-1 true 9d test-master-2 provisioned test-master-2 true 9d test-master-3 provisioned test-master-3 true 9d test-worker-1 provisioned test-worker-1 true 9d test-worker-2 provisioned test-worker-2 true 9d test-worker-3 inspecting true inspection error 19h
Verify whether the
dnsmasqpod was inReadystate when the inspection of the affected baremetal hosts (test-worker-3in the example above) was started:kubectl -n kaas get pod <dnsmasq-pod-name> -oyaml
Example of system response:
... status: conditions: - lastProbeTime: null lastTransitionTime: "2024-10-10T15:37:34Z" status: "True" type: Initialized - lastProbeTime: null lastTransitionTime: "2024-10-11T07:38:54Z" status: "True" type: Ready - lastProbeTime: null lastTransitionTime: "2024-10-11T07:38:54Z" status: "True" type: ContainersReady - lastProbeTime: null lastTransitionTime: "2024-10-10T15:37:34Z" status: "True" type: PodScheduled containerStatuses: - containerID: containerd://6dbcf2fc4b36ce4c549c9191ab01f72d0236c51d42947675302675e4bfaf4cdf image: docker-dev-kaas-virtual.artifactory-eu.mcp.mirantis.net/bm/baremetal-dnsmasq:base-2-28-alpine-20240812132650 imageID: docker-dev-kaas-virtual.artifactory-eu.mcp.mirantis.net/bm/baremetal-dnsmasq@sha256:3dad3e278add18e69b2608e462691c4823942641a0f0e25e6811e703e3c23b3b lastState: terminated: containerID: containerd://816fcf079cd544acd74e312065de5b5ed4dbf1dc6159fefffff4f644b5e45987 exitCode: 0 finishedAt: "2024-10-11T07:38:35Z" reason: Completed startedAt: "2024-10-10T15:37:45Z" name: dhcpd ready: true restartCount: 2 started: true state: running: startedAt: "2024-10-11T07:38:37Z" ...
In the system response above, the
dhcpdcontainer was not ready between"2024-10-11T07:38:35Z"and"2024-10-11T07:38:54Z".Verify the affected baremetal host. For example:
kubectl get bmh -n managed-ns test-worker-3 -oyaml
Example of system response:
... status: errorCount: 15 errorMessage: Introspection timeout errorType: inspection error ... operationHistory: deprovision: end: null start: null inspect: end: null start: "2024-10-11T07:38:19Z" provision: end: null start: null register: end: "2024-10-11T07:38:19Z" start: "2024-10-11T07:37:25Z"
In the system response above, inspection was started at
"2024-10-11T07:38:19Z", immediately before the period of thedhcpdcontainer downtime. Therefore, this node is most likely affected by the issue.
Workaround
Reboot the node using the IPMI reset or cycle command.
If the node fails to boot, remove the failed
BareMetalHostobject and create it again:Remove
BareMetalHostobject. For example:kubectl delete bmh -n managed-ns test-worker-3
Verify that the
BareMetalHostobject is removed:kubectl get bmh -n managed-ns test-worker-3
Create a
BareMetalHostobject from the template. For example:kubectl create -f bmhc-test-worker-3.yaml kubectl create -f bmh-test-worker-3.yaml
Fixed in 2.28.0 (17.3.0 and 16.3.0)
When trying to list the HostOSConfigurationModules and HostOSConfiguration custom resources, serviceuser or a user with
the global-admin or operator role obtains the access denied error.
For example:
kubectl --kubeconfig ~/.kube/mgmt-config get hocm
Error from server (Forbidden): hostosconfigurationmodules.kaas.mirantis.com is forbidden:
User "2d74348b-5669-4c65-af31-6c05dbedac5f" cannot list resource "hostosconfigurationmodules"
in API group "kaas.mirantis.com" at the cluster scope: access denied
Workaround:
Modify the
global-adminrole by adding a new entry with the following contents to theruleslist:kubectl edit clusterroles kaas-global-admin
- apiGroups: [kaas.mirantis.com] resources: [hostosconfigurationmodules] verbs: ['*']
For each Container Cloud project, modify the
kaas-operatorrole by adding a new entry with the following contents to theruleslist:kubectl -n <projectName> edit roles kaas-operator
- apiGroups: [kaas.mirantis.com] resources: [hostosconfigurations] verbs: ['*']
Due to the MetalLB upstream issue, a load balancer service may not obtain the external IP address.
The issue occurs when two services share the same external IP address and have
the same externalTrafficPolicy value. Initially, the services have the
external IP address assigned and are accessible. After modifying the
externalTrafficPolicy value for both services from Cluster to
Local, the first service that has been changed remains with no external IP
address assigned. Though, the second service, which was changed later, has the
external IP assigned as expected.
To work around the issue, make a dummy change to the service object where
external IP is <pending>:
Identify the service that is stuck:
kubectl get svc -A | grep pending
Example of system response:
stacklight iam-proxy-prometheus LoadBalancer 10.233.28.196 <pending> 443:30430/TCP
Add an arbitrary label to the service that is stuck. For example:
kubectl label svc -n stacklight iam-proxy-prometheus reconcile=1
Example of system response:
service/iam-proxy-prometheus labeledVerify that the external IP was allocated to the service:
kubectl get svc -n stacklight iam-proxy-prometheus
Example of system response:
NAME TYPE CLUSTER-IP EXTERNAL-IP PORT(S) AGE iam-proxy-prometheus LoadBalancer 10.233.28.196 10.0.34.108 443:30430/TCP 12d
Fixed in 2.28.0 (17.3.0 and 16.3.0)
After node maintenance of a management cluster, the newly added nodes may fail to undergo provisioning successfully. The issue relates to new nodes that are in the same L2 domain as the management cluster.
The issue was observed on environments having management cluster nodes configured with a single L2 segment used for all network traffic (PXE and LCM/management networks).
To verify whether the cluster is affected:
Verify whether the dnsmasq and dhcp-relay pods run on the same node
in the management cluster:
kubectl -n kaas get pods -o wide| grep -e "dhcp\|dnsmasq"
Example of system response:
dhcp-relay-7d85f75f76-5vdw2 2/2 Running 2 (36h ago) 36h 10.10.0.122 kaas-node-8a24b81c-76d0-4d4c-8421-962bd39df5ad <none> <none>
dnsmasq-8f4b484b4-slhbd 5/5 Running 1 (36h ago) 36h 10.233.123.75 kaas-node-8a24b81c-76d0-4d4c-8421-962bd39df5ad <none> <none>
If this is the case, proceed to the workaround below.
Workaround:
Log in to a node that contains
kubeconfigof the affected management cluster.Make sure that at least two management cluster nodes are schedulable:
kubectl get node
Example of a positive system response:
NAME STATUS ROLES AGE VERSION kaas-node-bcedb87b-b3ce-46a4-a4ca-ea3068689e40 Ready master 37h v1.27.10-mirantis-1 kaas-node-8a24b81c-76d0-4d4c-8421-962bd39df5ad Ready master 37h v1.27.10-mirantis-1 kaas-node-ad5a6f51-b98f-43c3-91d5-55fed3d0ff21 Ready master 37h v1.27.10-mirantis-1
Delete the
dhcp-relaypod:kubectl -n kaas delete pod <dhcp-relay-xxxxx>
Verify that the
dnsmasqanddhcp-relaypods are scheduled into different nodes:kubectl -n kaas get pods -o wide| grep -e "dhcp\|dnsmasq"
Example of a positive system response:
dhcp-relay-7d85f75f76-rkv03 2/2 Running 0 49s 10.10.0.121 kaas-node-bcedb87b-b3ce-46a4-a4ca-ea3068689e40 <none> <none> dnsmasq-8f4b484b4-slhbd 5/5 Running 1 (37h ago) 37h 10.233.123.75 kaas-node-8a24b81c-76d0-4d4c-8421-962bd39df5ad <none> <none>
During deletion of a manager machine running the ironic Pod from a bare
metal management cluster, the following problems occur:
All Pods are stuck in the
TerminatingstateA new
ironicPod fails to startThe related bare metal host is stuck in the
deprovisioningstate
As a workaround, before deletion of the node running the ironic Pod,
cordon and drain the node using the kubectl cordon <nodeName> and
kubectl drain <nodeName> commands.
Fixed in 2.29.0 (17.4.0 and 16.4.0)
During the replacement of a master node on a cluster of any type, the process
may get stuck with Kubelet's NodeReady condition is Unknown in the
machine status on the remaining master nodes.
As a workaround, log in on the affected node and run the following command:
docker restart ucp-kubelet
During MariaDB operations on a management cluster, Pods may get stuck in continuous restarts with the following example error:
[ERROR] WSREP: Corrupt buffer header: \
addr: 0x7faec6f8e518, \
seqno: 3185219421952815104, \
size: 909455917, \
ctx: 0x557094f65038, \
flags: 11577. store: 49, \
type: 49
Workaround:
Create a backup of the
/var/lib/mysqldirectory on themariadb-serverPod.Verify that other replicas are up and ready.
Remove the
galera.cachefile for the affectedmariadb-serverPod.Remove the affected
mariadb-serverPod or wait until it is automatically restarted.
After Kubernetes restarts the Pod, the Pod clones the database in 1-2 minutes and restores the quorum.
Fixed in 2.28.4 (17.3.4 and 16.3.4)
During replacement of a master node on a cluster of any type, the
calico-node Pod fails to start on a new node that has the same IP address
as the node being replaced.
Workaround:
Log in to any
masternode.From a CLI with an MKE client bundle, create a shell alias to start calicoctl using the
mirantis/ucp-dsinfoimage:alias calicoctl="\ docker run -i --rm \ --pid host \ --net host \ -e constraint:ostype==linux \ -e ETCD_ENDPOINTS=<etcdEndpoint> \ -e ETCD_KEY_FILE=/var/lib/docker/volumes/ucp-kv-certs/_data/key.pem \ -e ETCD_CA_CERT_FILE=/var/lib/docker/volumes/ucp-kv-certs/_data/ca.pem \ -e ETCD_CERT_FILE=/var/lib/docker/volumes/ucp-kv-certs/_data/cert.pem \ -v /var/run/calico:/var/run/calico \ -v /var/lib/docker/volumes/ucp-kv-certs/_data:/var/lib/docker/volumes/ucp-kv-certs/_data:ro \ mirantis/ucp-dsinfo:<mkeVersion> \ calicoctl \ "
alias calicoctl="\ docker run -i --rm \ --pid host \ --net host \ -e constraint:ostype==linux \ -e ETCD_ENDPOINTS=<etcdEndpoint> \ -e ETCD_KEY_FILE=/ucp-node-certs/key.pem \ -e ETCD_CA_CERT_FILE=/ucp-node-certs/ca.pem \ -e ETCD_CERT_FILE=/ucp-node-certs/cert.pem \ -v /var/run/calico:/var/run/calico \ -v ucp-node-certs:/ucp-node-certs:ro \ mirantis/ucp-dsinfo:<mkeVersion> \ calicoctl --allow-version-mismatch \ "
In the above command, replace the following values with the corresponding settings of the affected cluster:
<etcdEndpoint>is the etcd endpoint defined in the Calico configuration file. For example,ETCD_ENDPOINTS=127.0.0.1:12378<mkeVersion>is the MKE version installed on your cluster. For example,mirantis/ucp-dsinfo:3.5.7.
Verify the node list on the cluster:
kubectl get node
Compare this list with the node list in Calico to identify the old node:
calicoctl get node -o wide
Remove the old node from Calico:
calicoctl delete node kaas-node-<nodeID>
Fixed in 2.28.4 (17.3.4 and 16.3.4)
During replacement of a manager machine, the following problems may occur:
The system adds the node to Docker swarm but not to Kubernetes
The node
Deploymentgets stuck with failed RethinkDB health checks
Workaround:
Delete the failed node.
Wait for the MKE cluster to become healthy. To monitor the cluster status:
Log in to the MKE web UI.
Monitor the cluster status as described in MKE Operations Guide: Monitor an MKE cluster with the MKE web UI.
Deploy a new node.
Fixed in 2.28.4 (17.3.4 and 16.3.4)
During the unsafe or forced deletion of a manager machine running the
calico-kube-controllers Pod in the kube-system namespace,
the following issues occur:
The
calico-kube-controllersPod fails to clean up resources associated with the deleted nodeThe
calico-nodePod may fail to start up on a newly created node if the machine is provisioned with the same IP address as the deleted machine had
As a workaround, before deletion of the node running the
calico-kube-controllers Pod, cordon and drain the node:
kubectl cordon <nodeName>
kubectl drain <nodeName>
Fixed in 2.29.3 (17.3.8, 16.3.8, and 16.4.3)
Due to the upstream Ceph issue
66717,
during CVE upgrade of the Ceph daemon image of Ceph Reef 18.2.4, OSDs may start
slow and even fail the starting probe with the following describe output in
the rook-ceph-osd-X pod:
Warning Unhealthy 57s (x16 over 3m27s) kubelet Startup probe failed:
ceph daemon health check failed with the following output:
> no valid command found; 10 closest matches:
> 0
> 1
> 2
> abort
> assert
> bluefs debug_inject_read_zeros
> bluefs files list
> bluefs stats
> bluestore bluefs device info [<alloc_size:int>]
> config diff
> admin_socket: invalid command
Workaround:
Complete the following steps during every patch or major cluster update of the Cluster releases 17.2.x, 17.3.x, and 17.4.x (until Ceph 18.2.5 becomes supported):
Plan extra time in the maintenance window for the patch cluster update.
Slow starts will still impact the update procedure, but after completing the following step, the recovery process noticeably shortens without affecting the overall cluster state and data responsiveness.
Select one of the following options:
Before the cluster update, set the
nooutflag:ceph osd set noout
Once the Ceph OSDs image upgrade is done, unset the flag:
ceph osd unset noout
Monitor the Ceph OSDs image upgrade. If the symptoms of slow start appear, set the
nooutflag as soon as possible. Once the Ceph OSDs image upgrade is done, unset the flag.
Note
The issue does not reproduce since MOSK 25.2.
Update of a managed cluster based on bare metal and Ceph enabled fails with
PersistentVolumeClaim getting stuck in the Pending state for the
prometheus-server StatefulSet and the
MountVolume.MountDevice failed for volume warning in the StackLight event
logs.
Workaround:
Verify that the description of the Pods that failed to run contain the
FailedMountevents:kubectl -n <affectedProjectName> describe pod <affectedPodName>
In the command above, replace the following values:
<affectedProjectName>is the Container Cloud project name where the Pods failed to run<affectedPodName>is a Pod name that failed to run in the specified project
In the Pod description, identify the node name where the Pod failed to run.
Verify that the
csi-rbdpluginlogs of the affected node contain therbd volume mount failed: <csi-vol-uuid> is being usederror. The<csi-vol-uuid>is a unique RBD volume name.Identify
csiPodNameof the correspondingcsi-rbdplugin:kubectl -n rook-ceph get pod -l app=csi-rbdplugin \ -o jsonpath='{.items[?(@.spec.nodeName == "<nodeName>")].metadata.name}'
Output the affected
csiPodNamelogs:kubectl -n rook-ceph logs <csiPodName> -c csi-rbdplugin
Scale down the affected
StatefulSetorDeploymentof the Pod that fails to0replicas.On every
csi-rbdpluginPod, search for stuckcsi-vol:for pod in `kubectl -n rook-ceph get pods|grep rbdplugin|grep -v provisioner|awk '{print $1}'`; do echo $pod kubectl exec -it -n rook-ceph $pod -c csi-rbdplugin -- rbd device list | grep <csi-vol-uuid> done
Unmap the affected
csi-vol:rbd unmap -o force /dev/rbd<i>
The
/dev/rbd<i>value is a mapped RBD volume that usescsi-vol.Delete
volumeattachmentof the affected Pod:kubectl get volumeattachments | grep <csi-vol-uuid> kubectl delete volumeattacmhent <id>
Scale up the affected
StatefulSetorDeploymentback to the original number of replicas and wait until its state becomesRunning.
Fixed in 2.30.0 (21.0.0 and 20.0.0)
A compact MOSK cluster fails to be deployed through the Container Cloud web UI
due to inability to add any label to the control plane machines along with
inability to change dedicatedControlPlane: false using the web UI.
To work around the issue, manually add the required labels using CLI. Once done, the cluster deployment resumes.
A newly created project does not display all available tabs in the Container
Cloud web UI and contains different access denied errors during first five
minutes after creation.
To work around the issue, refresh the browser in five minutes after the project creation.
This section lists the artifacts of components included in the Container Cloud patch release 2.27.2. For artifacts of the Cluster releases introduced in 2.27.2, see patch Cluster releases 16.2.2, 16.1.7, and 17.1.7.
Note
The components that are newly added, updated, deprecated, or removed
as compared to the previous release version, are marked
with a corresponding superscript,
for example, lcm-ansible Updated.
Artifact |
Component |
Path |
|---|---|---|
Binaries Updated |
ironic-python-agent.initramfs |
https://binary.mirantis.com/bm/bin/ironic/ipa/ubuntu/initramfs-yoga-focal-debug-20240716085444 |
ironic-python-agent.kernel |
https://binary.mirantis.com/bm/bin/ironic/ipa/ubuntu/kernel-yoga-focal-debug-20240716085444 |
|
Helm charts Updated |
baremetal-api |
https://binary.mirantis.com/core/helm/baremetal-api-1.40.18.tgz |
baremetal-operator |
https://binary.mirantis.com/core/helm/baremetal-operator-1.40.18.tgz |
|
baremetal-provider |
https://binary.mirantis.com/core/helm/baremetal-provider-1.40.18.tgz |
|
baremetal-public-api |
https://binary.mirantis.com/core/helm/baremetal-public-api-1.40.18.tgz |
|
kaas-ipam |
||
metallb |
||
Docker images |
ambasador Updated |
mirantis.azurecr.io/core/external/nginx:1.40.18 |
baremetal-dnsmasq |
mirantis.azurecr.io/bm/baremetal-dnsmasq:base-2-27-alpine-20240701130209 |
|
baremetal-operator Updated |
mirantis.azurecr.io/bm/baremetal-operator:base-2-27-alpine-20240711081559 |
|
bm-collective |
mirantis.azurecr.io/bm/bm-collective:base-2-27-alpine-20240701130719 |
|
cluster-api-provider-baremetal Updated |
mirantis.azurecr.io/core/cluster-api-provider-baremetal:1.40.18 |
|
ironic Updated |
mirantis.azurecr.io/openstack/ironic:antelope-jammy-20240716113922 |
|
ironic-inspector Updated |
mirantis.azurecr.io/openstack/ironic-inspector:antelope-jammy-20240716113922 |
|
ironic-prometheus-exporter |
mirantis.azurecr.io/stacklight/ironic-prometheus-exporter:0.1-20240117102150 |
|
kaas-ipam |
mirantis.azurecr.io/bm/kaas-ipam:base-2-27-alpine-20240701133222 |
|
kubernetes-entrypoint |
mirantis.azurecr.io/openstack/extra/kubernetes-entrypoint:v1.0.1-ba8ada4-20240405150338 |
|
mariadb |
mirantis.azurecr.io/general/mariadb:10.6.17-focal-20240523075821 |
|
mcc-keepalived |
mirantis.azurecr.io/lcm/mcc-keepalived:v0.25.0-40-g890ffca |
|
metallb-controller |
mirantis.azurecr.io/bm/metallb/controller:v0.14.5-e86184d9-amd64 |
|
metallb-speaker |
mirantis.azurecr.io/bm/metallb/speaker:v0.14.5-e86184d9-amd64 |
|
syslog-ng |
mirantis.azurecr.io/bm/syslog-ng:base-alpine-20240701125905 |
Artifact |
Component |
Path |
|---|---|---|
Bootstrap tarball Updated |
bootstrap-darwin |
https://binary.mirantis.com/core/bin/bootstrap-darwin-1.40.18.tgz |
bootstrap-linux |
https://binary.mirantis.com/core/bin/bootstrap-linux-1.40.18.tgz |
|
Helm charts Updated |
admission-controller |
https://binary.mirantis.com/core/helm/admission-controller-1.40.18.tgz |
agent-controller |
https://binary.mirantis.com/core/helm/agent-controller-1.40.18.tgz |
|
byo-provider |
https://binary.mirantis.com/core/helm/byo-provider-1.40.18.tgz |
|
ceph-kcc-controller |
https://binary.mirantis.com/core/helm/ceph-kcc-controller-1.40.18.tgz |
|
cert-manager |
https://binary.mirantis.com/core/helm/cert-manager-1.40.18.tgz |
|
configuration-collector |
https://binary.mirantis.com/core/helm/configuration-collector-1.40.18.tgz |
|
event-controller |
https://binary.mirantis.com/core/helm/event-controller-1.40.18.tgz |
|
host-os-modules-controller |
https://binary.mirantis.com/core/helm/host-os-modules-controller-1.40.18.tgz |
|
iam-controller |
https://binary.mirantis.com/core/helm/iam-controller-1.40.18.tgz |
|
kaas-exporter |
https://binary.mirantis.com/core/helm/kaas-exporter-1.40.18.tgz |
|
kaas-public-api |
https://binary.mirantis.com/core/helm/kaas-public-api-1.40.18.tgz |
|
kaas-ui |
||
lcm-controller |
https://binary.mirantis.com/core/helm/lcm-controller-1.40.18.tgz |
|
license-controller |
https://binary.mirantis.com/core/helm/license-controller-1.40.18.tgz |
|
machinepool-controller |
https://binary.mirantis.com/core/helm/machinepool-controller-1.40.18.tgz |
|
mcc-cache |
||
mcc-cache-warmup |
https://binary.mirantis.com/core/helm/mcc-cache-warmup-1.40.18.tgz |
|
openstack-provider |
https://binary.mirantis.com/core/helm/openstack-provider-1.40.18.tgz |
|
os-credentials-controller |
https://binary.mirantis.com/core/helm/os-credentials-controller-1.40.18.tgz |
|
portforward-controller |
https://binary.mirantis.com/core/helm/portforward-controller-1.40.18.tgz |
|
rbac-controller |
https://binary.mirantis.com/core/helm/rbac-controller-1.40.18.tgz |
|
release-controller |
https://binary.mirantis.com/core/helm/release-controller-1.40.18.tgz |
|
scope-controller |
https://binary.mirantis.com/core/helm/scope-controller-1.40.18.tgz |
|
secret-controller |
https://binary.mirantis.com/core/helm/secret-controller-1.40.18.tgz |
|
squid-proxy |
https://binary.mirantis.com/core/helm/squid-proxy-1.40.18.tgz |
|
user-controller |
https://binary.mirantis.com/core/helm/user-controller-1.40.18.tgz |
|
vsphere-credentials-controller |
https://binary.mirantis.com/core/helm/vsphere-credentials-controller-1.40.18.tgz |
|
vsphere-provider |
https://binary.mirantis.com/core/helm/vsphere-provider-1.40.18.tgz |
|
vsphere-vm-template-controller |
https://binary.mirantis.com/core/helm/vsphere-vm-template-controller-1.40.18.tgz |
|
Docker images |
admission-controller Updated |
mirantis.azurecr.io/core/admission-controller:1.40.18 |
agent-controller Updated |
mirantis.azurecr.io/core/agent-controller:1.40.18 |
|
byo-cluster-api-controller Updated |
mirantis.azurecr.io/core/byo-cluster-api-controller:1.40.18 |
|
ceph-kcc-controller Updated |
mirantis.azurecr.io/core/ceph-kcc-controller:1.40.18 |
|
cert-manager-controller |
mirantis.azurecr.io/core/external/cert-manager-controller:v1.11.0-6 |
|
configuration-collector Updated |
mirantis.azurecr.io/core/configuration-collector:1.40.18 |
|
event-controller Updated |
mirantis.azurecr.io/core/event-controller:1.40.18 |
|
frontend Updated |
mirantis.azurecr.io/core/frontend:1.40.18 |
|
host-os-modules-controller Updated |
mirantis.azurecr.io/core/host-os-modules-controller:1.40.18 |
|
iam-controller Updated |
mirantis.azurecr.io/core/iam-controller:1.40.18 |
|
kaas-exporter Updated |
mirantis.azurecr.io/core/kaas-exporter:1.40.18 |
|
kproxy Updated |
mirantis.azurecr.io/core/kproxy:1.40.18 |
|
lcm-controller Updated |
mirantis.azurecr.io/core/lcm-controller:1.40.18 |
|
license-controller Updated |
mirantis.azurecr.io/core/license-controller:1.40.18 |
|
machinepool-controller Updated |
mirantis.azurecr.io/core/machinepool-controller:1.40.18 |
|
mcc-haproxy |
mirantis.azurecr.io/lcm/mcc-haproxy:v0.25.0-40-g890ffca |
|
mcc-keepalived |
mirantis.azurecr.io/lcm/mcc-keepalived:v0.25.0-40-g890ffca |
|
nginx Updated |
mirantis.azurecr.io/core/external/nginx:1.40.18 |
|
openstack-cluster-api-controller Updated |
mirantis.azurecr.io/core/openstack-cluster-api-controller:1.40.18 |
|
os-credentials-controller Updated |
mirantis.azurecr.io/core/os-credentials-controller:1.40.18 |
|
portforward-controller Updated |
mirantis.azurecr.io/core/portforward-controller:1.40.18 |
|
rbac-controller Updated |
mirantis.azurecr.io/core/rbac-controller:1.40.18 |
|
registry |
mirantis.azurecr.io/lcm/registry:v2.8.1-10 |
|
release-controller Updated |
mirantis.azurecr.io/core/release-controller:1.40.18 |
|
scope-controller Updated |
mirantis.azurecr.io/core/scope-controller:1.40.18 |
|
secret-controller Updated |
mirantis.azurecr.io/core/secret-controller:1.40.18 |
|
squid-proxy |
mirantis.azurecr.io/lcm/squid-proxy:0.0.1-10-g24a0d69 |
|
user-controller Updated |
mirantis.azurecr.io/core/user-controller:1.40.18 |
|
vsphere-cluster-api-controller Updated |
mirantis.azurecr.io/core/vsphere-cluster-api-controller:1.40.18 |
|
vsphere-credentials-controller Updated |
mirantis.azurecr.io/core/vsphere-credentials-controller:1.40.18 |
|
vsphere-vm-template-controller Updated |
mirantis.azurecr.io/core/vsphere-vm-template-controller:1.40.18 |
Artifact |
Component |
Path |
|---|---|---|
Binaries |
hash-generate-darwin |
http://binary.mirantis.com/iam/bin/hash-generate-0.0.1-268-3cf7f17-darwin |
hash-generate-linux |
http://binary.mirantis.com/iam/bin/hash-generate-0.0.1-268-3cf7f17-linux |
|
Helm charts Updated |
iam |
|
Docker images |
kubectl Updated |
mirantis.azurecr.io/general/kubectl:20240711152257 |
kubernetes-entrypoint Removed |
n/a |
|
mariadb |
mirantis.azurecr.io/general/mariadb:10.6.17-focal-20240523075821 |
|
mcc-keycloak |
mirantis.azurecr.io/iam/mcc-keycloak:24.0.5-20240621131831 |
Important
For MOSK clusters, Container Cloud 2.27.1 is the continuation for MOSK 24.1.x series using the patch Cluster release 17.1.6. For the update path of 24.1 and 24.2 series, see MOSK documentation: Cluster update scheme.
The management cluster of a MOSK 24.1 or 24.1.5 cluster is automatically updated to the latest patch Cluster release 16.2.1.
The Container Cloud patch release 2.27.1, which is based on the 2.27.0 major release, provides the following updates:
Support for the patch Cluster release 16.2.1.
Support for the patch Cluster releases 16.1.6 and 17.1.6 that represents Mirantis OpenStack for Kubernetes (MOSK) patch release 24.1.6 patch.
Support for MKE 3.7.10.
Support for
docker-ee-cli23.0.13 in MCR 23.0.11 to fix several CVEs.Bare metal: update of Ubuntu mirror from ubuntu-2024-05-17-013445 to ubuntu-2024-06-27-095142 along with update of minor kernel version from 5.15.0-107-generic to 5.15.0-113-generic.
Security fixes for CVEs in images.
Bug fixes.
This patch release also supports the latest major Cluster releases 17.2.0 and 16.2.0. And it does not support greenfield deployments based on deprecated Cluster releases. Use the latest available Cluster release instead.
For main deliverables of the parent Container Cloud release of 2.27.1, refer to 2.27.0.
In total, since Container Cloud 2.27.0, 270 Common Vulnerabilities and Exposures (CVE) of high severity have been fixed in 2.27.1.
The table below includes the total numbers of addressed unique and common CVEs in images by product component since Container Cloud 2.27.0. The common CVEs are issues addressed across several images.
Product component |
CVE type |
Critical |
High |
Total |
|---|---|---|---|---|
Ceph |
Unique |
0 |
6 |
6 |
Common |
0 |
29 |
29 |
|
Kaas core |
Unique |
0 |
10 |
10 |
Common |
0 |
178 |
178 |
|
StackLight |
Unique |
0 |
14 |
14 |
Common |
0 |
63 |
63 |
Mirantis Security Portal
For the detailed list of fixed and existing CVEs across the Mirantis Container Cloud and MOSK products, refer to Mirantis Security Portal.
MOSK CVEs
For the number of fixed CVEs in the MOSK-related components including OpenStack and Tungsten Fabric, refer to MOSK 24.1.6: Security notes.
The following issues have been addressed in the Container Cloud patch release 2.27.1 along with the patch Cluster releases 16.2.1, 16.1.6, and 17.1.6.
[42304] [StackLight] [Cluster releases 17.1.6, 16.1.6] Fixed the issue with failure of shard relocation in the OpenSearch cluster on large Container Cloud managed clusters.
[40020] [StackLight] [Cluster releases 17.1.6, 16.1.6] Fixed the issue with
rollover_policynot being applied to the current indices while updating the policy for the currentsystem*andaudit*data streams.
This section lists known issues with workarounds for the Mirantis Container Cloud release 2.27.1 including the Cluster releases 16.2.1, 16.1.6, and 17.1.6.
For other issues that can occur while deploying and operating a Container Cloud cluster, see Troubleshooting Guide.
Note
This section also outlines still valid known issues from previous Container Cloud releases.
Note
Moving forward, the workaround for this issue will be moved from Release Notes to MOSK Troubleshooting Guide: Inspection error on bare metal hosts after dnsmasq restart.
If the dnsmasq pod is restarted during the bootstrap of newly added
nodes, those nodes may fail to undergo inspection. That can result in
inspection error in the corresponding BareMetalHost objects.
The issue can occur when:
The
dnsmasqpod was moved to another node.DHCP subnets were changed, including addition or removal. In this case, the
dhcpdcontainer of thednsmasqpod is restarted.Caution
If changing or adding of DHCP subnets is required to bootstrap new nodes, wait after changing or adding DHCP subnets until the
dnsmasqpod becomes ready, then createBareMetalHostobjects.
To verify whether the nodes are affected:
Verify whether the
BareMetalHostobjects contain theinspection error:kubectl get bmh -n <managed-cluster-namespace-name>
Example of system response:
NAME STATE CONSUMER ONLINE ERROR AGE test-master-1 provisioned test-master-1 true 9d test-master-2 provisioned test-master-2 true 9d test-master-3 provisioned test-master-3 true 9d test-worker-1 provisioned test-worker-1 true 9d test-worker-2 provisioned test-worker-2 true 9d test-worker-3 inspecting true inspection error 19h
Verify whether the
dnsmasqpod was inReadystate when the inspection of the affected baremetal hosts (test-worker-3in the example above) was started:kubectl -n kaas get pod <dnsmasq-pod-name> -oyaml
Example of system response:
... status: conditions: - lastProbeTime: null lastTransitionTime: "2024-10-10T15:37:34Z" status: "True" type: Initialized - lastProbeTime: null lastTransitionTime: "2024-10-11T07:38:54Z" status: "True" type: Ready - lastProbeTime: null lastTransitionTime: "2024-10-11T07:38:54Z" status: "True" type: ContainersReady - lastProbeTime: null lastTransitionTime: "2024-10-10T15:37:34Z" status: "True" type: PodScheduled containerStatuses: - containerID: containerd://6dbcf2fc4b36ce4c549c9191ab01f72d0236c51d42947675302675e4bfaf4cdf image: docker-dev-kaas-virtual.artifactory-eu.mcp.mirantis.net/bm/baremetal-dnsmasq:base-2-28-alpine-20240812132650 imageID: docker-dev-kaas-virtual.artifactory-eu.mcp.mirantis.net/bm/baremetal-dnsmasq@sha256:3dad3e278add18e69b2608e462691c4823942641a0f0e25e6811e703e3c23b3b lastState: terminated: containerID: containerd://816fcf079cd544acd74e312065de5b5ed4dbf1dc6159fefffff4f644b5e45987 exitCode: 0 finishedAt: "2024-10-11T07:38:35Z" reason: Completed startedAt: "2024-10-10T15:37:45Z" name: dhcpd ready: true restartCount: 2 started: true state: running: startedAt: "2024-10-11T07:38:37Z" ...
In the system response above, the
dhcpdcontainer was not ready between"2024-10-11T07:38:35Z"and"2024-10-11T07:38:54Z".Verify the affected baremetal host. For example:
kubectl get bmh -n managed-ns test-worker-3 -oyaml
Example of system response:
... status: errorCount: 15 errorMessage: Introspection timeout errorType: inspection error ... operationHistory: deprovision: end: null start: null inspect: end: null start: "2024-10-11T07:38:19Z" provision: end: null start: null register: end: "2024-10-11T07:38:19Z" start: "2024-10-11T07:37:25Z"
In the system response above, inspection was started at
"2024-10-11T07:38:19Z", immediately before the period of thedhcpdcontainer downtime. Therefore, this node is most likely affected by the issue.
Workaround
Reboot the node using the IPMI reset or cycle command.
If the node fails to boot, remove the failed
BareMetalHostobject and create it again:Remove
BareMetalHostobject. For example:kubectl delete bmh -n managed-ns test-worker-3
Verify that the
BareMetalHostobject is removed:kubectl get bmh -n managed-ns test-worker-3
Create a
BareMetalHostobject from the template. For example:kubectl create -f bmhc-test-worker-3.yaml kubectl create -f bmh-test-worker-3.yaml
Fixed in 2.28.0 (17.3.0 and 16.3.0)
When trying to list the HostOSConfigurationModules and HostOSConfiguration custom resources, serviceuser or a user with
the global-admin or operator role obtains the access denied error.
For example:
kubectl --kubeconfig ~/.kube/mgmt-config get hocm
Error from server (Forbidden): hostosconfigurationmodules.kaas.mirantis.com is forbidden:
User "2d74348b-5669-4c65-af31-6c05dbedac5f" cannot list resource "hostosconfigurationmodules"
in API group "kaas.mirantis.com" at the cluster scope: access denied
Workaround:
Modify the
global-adminrole by adding a new entry with the following contents to theruleslist:kubectl edit clusterroles kaas-global-admin
- apiGroups: [kaas.mirantis.com] resources: [hostosconfigurationmodules] verbs: ['*']
For each Container Cloud project, modify the
kaas-operatorrole by adding a new entry with the following contents to theruleslist:kubectl -n <projectName> edit roles kaas-operator
- apiGroups: [kaas.mirantis.com] resources: [hostosconfigurations] verbs: ['*']
Due to the MetalLB upstream issue, a load balancer service may not obtain the external IP address.
The issue occurs when two services share the same external IP address and have
the same externalTrafficPolicy value. Initially, the services have the
external IP address assigned and are accessible. After modifying the
externalTrafficPolicy value for both services from Cluster to
Local, the first service that has been changed remains with no external IP
address assigned. Though, the second service, which was changed later, has the
external IP assigned as expected.
To work around the issue, make a dummy change to the service object where
external IP is <pending>:
Identify the service that is stuck:
kubectl get svc -A | grep pending
Example of system response:
stacklight iam-proxy-prometheus LoadBalancer 10.233.28.196 <pending> 443:30430/TCP
Add an arbitrary label to the service that is stuck. For example:
kubectl label svc -n stacklight iam-proxy-prometheus reconcile=1
Example of system response:
service/iam-proxy-prometheus labeledVerify that the external IP was allocated to the service:
kubectl get svc -n stacklight iam-proxy-prometheus
Example of system response:
NAME TYPE CLUSTER-IP EXTERNAL-IP PORT(S) AGE iam-proxy-prometheus LoadBalancer 10.233.28.196 10.0.34.108 443:30430/TCP 12d
Fixed in 2.28.0 (17.3.0 and 16.3.0)
After node maintenance of a management cluster, the newly added nodes may fail to undergo provisioning successfully. The issue relates to new nodes that are in the same L2 domain as the management cluster.
The issue was observed on environments having management cluster nodes configured with a single L2 segment used for all network traffic (PXE and LCM/management networks).
To verify whether the cluster is affected:
Verify whether the dnsmasq and dhcp-relay pods run on the same node
in the management cluster:
kubectl -n kaas get pods -o wide| grep -e "dhcp\|dnsmasq"
Example of system response:
dhcp-relay-7d85f75f76-5vdw2 2/2 Running 2 (36h ago) 36h 10.10.0.122 kaas-node-8a24b81c-76d0-4d4c-8421-962bd39df5ad <none> <none>
dnsmasq-8f4b484b4-slhbd 5/5 Running 1 (36h ago) 36h 10.233.123.75 kaas-node-8a24b81c-76d0-4d4c-8421-962bd39df5ad <none> <none>
If this is the case, proceed to the workaround below.
Workaround:
Log in to a node that contains
kubeconfigof the affected management cluster.Make sure that at least two management cluster nodes are schedulable:
kubectl get node
Example of a positive system response:
NAME STATUS ROLES AGE VERSION kaas-node-bcedb87b-b3ce-46a4-a4ca-ea3068689e40 Ready master 37h v1.27.10-mirantis-1 kaas-node-8a24b81c-76d0-4d4c-8421-962bd39df5ad Ready master 37h v1.27.10-mirantis-1 kaas-node-ad5a6f51-b98f-43c3-91d5-55fed3d0ff21 Ready master 37h v1.27.10-mirantis-1
Delete the
dhcp-relaypod:kubectl -n kaas delete pod <dhcp-relay-xxxxx>
Verify that the
dnsmasqanddhcp-relaypods are scheduled into different nodes:kubectl -n kaas get pods -o wide| grep -e "dhcp\|dnsmasq"
Example of a positive system response:
dhcp-relay-7d85f75f76-rkv03 2/2 Running 0 49s 10.10.0.121 kaas-node-bcedb87b-b3ce-46a4-a4ca-ea3068689e40 <none> <none> dnsmasq-8f4b484b4-slhbd 5/5 Running 1 (37h ago) 37h 10.233.123.75 kaas-node-8a24b81c-76d0-4d4c-8421-962bd39df5ad <none> <none>
During deletion of a manager machine running the ironic Pod from a bare
metal management cluster, the following problems occur:
All Pods are stuck in the
TerminatingstateA new
ironicPod fails to startThe related bare metal host is stuck in the
deprovisioningstate
As a workaround, before deletion of the node running the ironic Pod,
cordon and drain the node using the kubectl cordon <nodeName> and
kubectl drain <nodeName> commands.
Fixed in 2.29.0 (17.4.0 and 16.4.0)
During the replacement of a master node on a cluster of any type, the process
may get stuck with Kubelet's NodeReady condition is Unknown in the
machine status on the remaining master nodes.
As a workaround, log in on the affected node and run the following command:
docker restart ucp-kubelet
During MariaDB operations on a management cluster, Pods may get stuck in continuous restarts with the following example error:
[ERROR] WSREP: Corrupt buffer header: \
addr: 0x7faec6f8e518, \
seqno: 3185219421952815104, \
size: 909455917, \
ctx: 0x557094f65038, \
flags: 11577. store: 49, \
type: 49
Workaround:
Create a backup of the
/var/lib/mysqldirectory on themariadb-serverPod.Verify that other replicas are up and ready.
Remove the
galera.cachefile for the affectedmariadb-serverPod.Remove the affected
mariadb-serverPod or wait until it is automatically restarted.
After Kubernetes restarts the Pod, the Pod clones the database in 1-2 minutes and restores the quorum.
Fixed in 2.28.4 (17.3.4 and 16.3.4)
During replacement of a master node on a cluster of any type, the
calico-node Pod fails to start on a new node that has the same IP address
as the node being replaced.
Workaround:
Log in to any
masternode.From a CLI with an MKE client bundle, create a shell alias to start calicoctl using the
mirantis/ucp-dsinfoimage:alias calicoctl="\ docker run -i --rm \ --pid host \ --net host \ -e constraint:ostype==linux \ -e ETCD_ENDPOINTS=<etcdEndpoint> \ -e ETCD_KEY_FILE=/var/lib/docker/volumes/ucp-kv-certs/_data/key.pem \ -e ETCD_CA_CERT_FILE=/var/lib/docker/volumes/ucp-kv-certs/_data/ca.pem \ -e ETCD_CERT_FILE=/var/lib/docker/volumes/ucp-kv-certs/_data/cert.pem \ -v /var/run/calico:/var/run/calico \ -v /var/lib/docker/volumes/ucp-kv-certs/_data:/var/lib/docker/volumes/ucp-kv-certs/_data:ro \ mirantis/ucp-dsinfo:<mkeVersion> \ calicoctl \ "
alias calicoctl="\ docker run -i --rm \ --pid host \ --net host \ -e constraint:ostype==linux \ -e ETCD_ENDPOINTS=<etcdEndpoint> \ -e ETCD_KEY_FILE=/ucp-node-certs/key.pem \ -e ETCD_CA_CERT_FILE=/ucp-node-certs/ca.pem \ -e ETCD_CERT_FILE=/ucp-node-certs/cert.pem \ -v /var/run/calico:/var/run/calico \ -v ucp-node-certs:/ucp-node-certs:ro \ mirantis/ucp-dsinfo:<mkeVersion> \ calicoctl --allow-version-mismatch \ "
In the above command, replace the following values with the corresponding settings of the affected cluster:
<etcdEndpoint>is the etcd endpoint defined in the Calico configuration file. For example,ETCD_ENDPOINTS=127.0.0.1:12378<mkeVersion>is the MKE version installed on your cluster. For example,mirantis/ucp-dsinfo:3.5.7.
Verify the node list on the cluster:
kubectl get node
Compare this list with the node list in Calico to identify the old node:
calicoctl get node -o wide
Remove the old node from Calico:
calicoctl delete node kaas-node-<nodeID>
Fixed in 2.28.4 (17.3.4 and 16.3.4)
During replacement of a manager machine, the following problems may occur:
The system adds the node to Docker swarm but not to Kubernetes
The node
Deploymentgets stuck with failed RethinkDB health checks
Workaround:
Delete the failed node.
Wait for the MKE cluster to become healthy. To monitor the cluster status:
Log in to the MKE web UI.
Monitor the cluster status as described in MKE Operations Guide: Monitor an MKE cluster with the MKE web UI.
Deploy a new node.
Fixed in 2.28.4 (17.3.4 and 16.3.4)
During the unsafe or forced deletion of a manager machine running the
calico-kube-controllers Pod in the kube-system namespace,
the following issues occur:
The
calico-kube-controllersPod fails to clean up resources associated with the deleted nodeThe
calico-nodePod may fail to start up on a newly created node if the machine is provisioned with the same IP address as the deleted machine had
As a workaround, before deletion of the node running the
calico-kube-controllers Pod, cordon and drain the node:
kubectl cordon <nodeName>
kubectl drain <nodeName>
Fixed in 2.29.3 (17.3.8, 16.3.8, and 16.4.3)
Due to the upstream Ceph issue
66717,
during CVE upgrade of the Ceph daemon image of Ceph Reef 18.2.4, OSDs may start
slow and even fail the starting probe with the following describe output in
the rook-ceph-osd-X pod:
Warning Unhealthy 57s (x16 over 3m27s) kubelet Startup probe failed:
ceph daemon health check failed with the following output:
> no valid command found; 10 closest matches:
> 0
> 1
> 2
> abort
> assert
> bluefs debug_inject_read_zeros
> bluefs files list
> bluefs stats
> bluestore bluefs device info [<alloc_size:int>]
> config diff
> admin_socket: invalid command
Workaround:
Complete the following steps during every patch or major cluster update of the Cluster releases 17.2.x, 17.3.x, and 17.4.x (until Ceph 18.2.5 becomes supported):
Plan extra time in the maintenance window for the patch cluster update.
Slow starts will still impact the update procedure, but after completing the following step, the recovery process noticeably shortens without affecting the overall cluster state and data responsiveness.
Select one of the following options:
Before the cluster update, set the
nooutflag:ceph osd set noout
Once the Ceph OSDs image upgrade is done, unset the flag:
ceph osd unset noout
Monitor the Ceph OSDs image upgrade. If the symptoms of slow start appear, set the
nooutflag as soon as possible. Once the Ceph OSDs image upgrade is done, unset the flag.
Note
The issue does not reproduce since MOSK 25.2.
Update of a managed cluster based on bare metal and Ceph enabled fails with
PersistentVolumeClaim getting stuck in the Pending state for the
prometheus-server StatefulSet and the
MountVolume.MountDevice failed for volume warning in the StackLight event
logs.
Workaround:
Verify that the description of the Pods that failed to run contain the
FailedMountevents:kubectl -n <affectedProjectName> describe pod <affectedPodName>
In the command above, replace the following values:
<affectedProjectName>is the Container Cloud project name where the Pods failed to run<affectedPodName>is a Pod name that failed to run in the specified project
In the Pod description, identify the node name where the Pod failed to run.
Verify that the
csi-rbdpluginlogs of the affected node contain therbd volume mount failed: <csi-vol-uuid> is being usederror. The<csi-vol-uuid>is a unique RBD volume name.Identify
csiPodNameof the correspondingcsi-rbdplugin:kubectl -n rook-ceph get pod -l app=csi-rbdplugin \ -o jsonpath='{.items[?(@.spec.nodeName == "<nodeName>")].metadata.name}'
Output the affected
csiPodNamelogs:kubectl -n rook-ceph logs <csiPodName> -c csi-rbdplugin
Scale down the affected
StatefulSetorDeploymentof the Pod that fails to0replicas.On every
csi-rbdpluginPod, search for stuckcsi-vol:for pod in `kubectl -n rook-ceph get pods|grep rbdplugin|grep -v provisioner|awk '{print $1}'`; do echo $pod kubectl exec -it -n rook-ceph $pod -c csi-rbdplugin -- rbd device list | grep <csi-vol-uuid> done
Unmap the affected
csi-vol:rbd unmap -o force /dev/rbd<i>
The
/dev/rbd<i>value is a mapped RBD volume that usescsi-vol.Delete
volumeattachmentof the affected Pod:kubectl get volumeattachments | grep <csi-vol-uuid> kubectl delete volumeattacmhent <id>
Scale up the affected
StatefulSetorDeploymentback to the original number of replicas and wait until its state becomesRunning.
Fixed in 2.30.0 (21.0.0 and 20.0.0)
A compact MOSK cluster fails to be deployed through the Container Cloud web UI
due to inability to add any label to the control plane machines along with
inability to change dedicatedControlPlane: false using the web UI.
To work around the issue, manually add the required labels using CLI. Once done, the cluster deployment resumes.
A newly created project does not display all available tabs in the Container
Cloud web UI and contains different access denied errors during first five
minutes after creation.
To work around the issue, refresh the browser in five minutes after the project creation.
This section describes the specific actions you as a cloud operator need to complete before or after your Container Cloud cluster update to the Cluster releases 17.1.6, 16.2.1, or 16.1.6.
Consider this information as a supplement to the generic update procedures published in Operations Guide: Automatic upgrade of a management cluster and Update to a patch version.
Note
If you do not use Ceph metrics in any customizations, for example, custom alerts, Grafana dashboards, or queries in custom workloads, skip this section.
After deprecating the performance metric exporter that is integrated into the Ceph Manager daemon for the sake of the dedicated Ceph Exporter daemon in Container Cloud 2.27.0, you may need to prepare for updating values of several labels in Ceph metrics if you use them in any customizations such as custom alerts, Grafana dashboards, or queries in custom tools. These labels will be changed in Container Cloud 2.28.0 (Cluster releases 16.3.0 and 17.3.0).
Note
Names of metrics will not be changed, no metrics will be removed.
All Ceph metrics to be collected by the Ceph Exporter daemon will change their
labels job and instance due to scraping metrics from new Ceph Exporter
daemon instead of the performance metric exporter of Ceph Manager:
Values of the
joblabels will be changed fromrook-ceph-mgrtoprometheus-rook-exporterfor all Ceph metrics moved to Ceph Exporter. The full list of moved metrics is presented below.Values of the
instancelabels will be changed from the metric endpoint of Ceph Manager with port9283to the metric endpoint of Ceph Exporter with port9926for all Ceph metrics moved to Ceph Exporter. The full list of moved metrics is presented below.Values of the
instance_idlabels of Ceph metrics from the RADOS Gateway (RGW) daemons will be changed from the daemon GID to the daemon subname. For example, instead ofinstance_id="<RGW_PROCESS_GID>", theinstance_id="a"(ceph_rgw_qlen{instance_id="a"}) will be used. The list of moved Ceph RGW metrics is presented below.
List of affected Ceph RGW metrics
ceph_rgw_cache_.*ceph_rgw_failed_reqceph_rgw_gc_retire_objectceph_rgw_get.*ceph_rgw_keystone_.*ceph_rgw_lc_.*ceph_rgw_lua_.*ceph_rgw_pubsub_.*ceph_rgw_put.*ceph_rgw_qactiveceph_rgw_qlenceph_rgw_req
List of all metrics to be collected by Ceph Exporter instead of
Ceph Manager
ceph_bluefs_.*ceph_bluestore_.*ceph_mds_cache_.*ceph_mds_capsceph_mds_ceph_.*ceph_mds_dir_.*ceph_mds_exported_inodesceph_mds_forwardceph_mds_handle_.*ceph_mds_imported_inodesceph_mds_inodes.*ceph_mds_load_centceph_mds_log_.*ceph_mds_mem_.*ceph_mds_openino_dir_fetchceph_mds_process_request_cap_releaseceph_mds_reply_.*ceph_mds_requestceph_mds_root_.*ceph_mds_server_.*ceph_mds_sessions_.*ceph_mds_slow_replyceph_mds_subtreesceph_mon_election_.*ceph_mon_num_.*ceph_mon_session_.*ceph_objecter_.*ceph_osd_numpg.*ceph_osd_op.*ceph_osd_recovery_.*ceph_osd_stat_.*ceph_paxos.*ceph_prioritycache.*ceph_purge.*ceph_rgw_cache_.*ceph_rgw_failed_reqceph_rgw_gc_retire_objectceph_rgw_get.*ceph_rgw_keystone_.*ceph_rgw_lc_.*ceph_rgw_lua_.*ceph_rgw_pubsub_.*ceph_rgw_put.*ceph_rgw_qactiveceph_rgw_qlenceph_rgw_reqceph_rocksdb_.*
This section lists the artifacts of components included in the Container Cloud patch release 2.27.1. For artifacts of the Cluster releases introduced in 2.27.1, see patch Cluster releases 16.2.1, 16.1.6, and 17.1.6.
Note
The components that are newly added, updated, deprecated, or removed
as compared to the previous release version, are marked
with a corresponding superscript,
for example, lcm-ansible Updated.
Artifact |
Component |
Path |
|---|---|---|
Binaries Updated |
ironic-python-agent.initramfs |
https://binary.mirantis.com/bm/bin/ironic/ipa/ubuntu/initramfs-yoga-focal-debug-20240627104414 |
ironic-python-agent.kernel |
https://binary.mirantis.com/bm/bin/ironic/ipa/ubuntu/kernel-yoga-focal-debug-20240627104414 |
|
Helm charts Updated |
baremetal-api |
https://binary.mirantis.com/core/helm/baremetal-api-1.40.15.tgz |
baremetal-operator |
https://binary.mirantis.com/core/helm/baremetal-operator-1.40.15.tgz |
|
baremetal-provider |
https://binary.mirantis.com/core/helm/baremetal-provider-1.40.15.tgz |
|
baremetal-public-api |
https://binary.mirantis.com/core/helm/baremetal-public-api-1.40.15.tgz |
|
kaas-ipam |
||
metallb |
||
Docker images |
ambasador Updated |
mirantis.azurecr.io/core/external/nginx:1.40.15 |
baremetal-dnsmasq Updated |
mirantis.azurecr.io/bm/baremetal-dnsmasq:base-2-27-alpine-20240701130209 |
|
baremetal-operator Updated |
mirantis.azurecr.io/bm/baremetal-operator:base-2-27-alpine-20240701130001 |
|
bm-collective Updated |
mirantis.azurecr.io/bm/bm-collective:base-2-27-alpine-20240701130719 |
|
cluster-api-provider-baremetal Updated |
mirantis.azurecr.io/core/cluster-api-provider-baremetal:1.40.15 |
|
ironic |
mirantis.azurecr.io/openstack/ironic:antelope-jammy-20240522120643 |
|
ironic-inspector |
mirantis.azurecr.io/openstack/ironic-inspector:antelope-jammy-20240522120643 |
|
ironic-prometheus-exporter |
mirantis.azurecr.io/stacklight/ironic-prometheus-exporter:0.1-20240117102150 |
|
kaas-ipam Updated |
mirantis.azurecr.io/bm/kaas-ipam:base-2-27-alpine-20240701133222 |
|
kubernetes-entrypoint |
mirantis.azurecr.io/openstack/extra/kubernetes-entrypoint:v1.0.1-ba8ada4-20240405150338 |
|
mariadb |
mirantis.azurecr.io/general/mariadb:10.6.17-focal-20240523075821 |
|
mcc-keepalived Updated |
mirantis.azurecr.io/lcm/mcc-keepalived:v0.25.0-40-g890ffca |
|
metallb-controller |
mirantis.azurecr.io/bm/metallb/controller:v0.14.5-e86184d9-amd64 |
|
metallb-speaker |
mirantis.azurecr.io/bm/metallb/speaker:v0.14.5-e86184d9-amd64 |
|
syslog-ng Updated |
mirantis.azurecr.io/bm/syslog-ng:base-alpine-20240701125905 |
Artifact |
Component |
Path |
|---|---|---|
Bootstrap tarball Updated |
bootstrap-darwin |
https://binary.mirantis.com/core/bin/bootstrap-darwin-1.40.15.tgz |
bootstrap-linux |
https://binary.mirantis.com/core/bin/bootstrap-linux-1.40.15.tgz |
|
Helm charts Updated |
admission-controller |
https://binary.mirantis.com/core/helm/admission-controller-1.40.15.tgz |
agent-controller |
https://binary.mirantis.com/core/helm/agent-controller-1.40.15.tgz |
|
byo-provider |
https://binary.mirantis.com/core/helm/byo-provider-1.40.15.tgz |
|
ceph-kcc-controller |
https://binary.mirantis.com/core/helm/ceph-kcc-controller-1.40.15.tgz |
|
cert-manager |
https://binary.mirantis.com/core/helm/cert-manager-1.40.15.tgz |
|
configuration-collector |
https://binary.mirantis.com/core/helm/configuration-collector-1.40.15.tgz |
|
event-controller |
https://binary.mirantis.com/core/helm/event-controller-1.40.15.tgz |
|
host-os-modules-controller |
https://binary.mirantis.com/core/helm/host-os-modules-controller-1.40.15.tgz |
|
iam-controller |
https://binary.mirantis.com/core/helm/iam-controller-1.40.15.tgz |
|
kaas-exporter |
https://binary.mirantis.com/core/helm/kaas-exporter-1.40.15.tgz |
|
kaas-public-api |
https://binary.mirantis.com/core/helm/kaas-public-api-1.40.15.tgz |
|
kaas-ui |
||
lcm-controller |
https://binary.mirantis.com/core/helm/lcm-controller-1.40.15.tgz |
|
license-controller |
https://binary.mirantis.com/core/helm/license-controller-1.40.15.tgz |
|
machinepool-controller |
https://binary.mirantis.com/core/helm/machinepool-controller-1.40.15.tgz |
|
mcc-cache |
||
mcc-cache-warmup |
https://binary.mirantis.com/core/helm/mcc-cache-warmup-1.40.15.tgz |
|
openstack-provider |
https://binary.mirantis.com/core/helm/openstack-provider-1.40.15.tgz |
|
os-credentials-controller |
https://binary.mirantis.com/core/helm/os-credentials-controller-1.40.15.tgz |
|
portforward-controller |
https://binary.mirantis.com/core/helm/portforward-controller-1.40.15.tgz |
|
rbac-controller |
https://binary.mirantis.com/core/helm/rbac-controller-1.40.15.tgz |
|
release-controller |
https://binary.mirantis.com/core/helm/release-controller-1.40.15.tgz |
|
scope-controller |
https://binary.mirantis.com/core/helm/scope-controller-1.40.15.tgz |
|
secret-controller |
https://binary.mirantis.com/core/helm/secret-controller-1.40.15.tgz |
|
squid-proxy |
https://binary.mirantis.com/core/helm/squid-proxy-1.40.15.tgz |
|
user-controller |
https://binary.mirantis.com/core/helm/user-controller-1.40.15.tgz |
|
vsphere-credentials-controller |
https://binary.mirantis.com/core/helm/vsphere-credentials-controller-1.40.15.tgz |
|
vsphere-provider |
https://binary.mirantis.com/core/helm/vsphere-provider-1.40.15.tgz |
|
vsphere-vm-template-controller |
https://binary.mirantis.com/core/helm/vsphere-vm-template-controller-1.40.15.tgz |
|
Docker images |
admission-controller Updated |
mirantis.azurecr.io/core/admission-controller:1.40.15 |
agent-controller Updated |
mirantis.azurecr.io/core/agent-controller:1.40.15 |
|
byo-cluster-api-controller Updated |
mirantis.azurecr.io/core/byo-cluster-api-controller:1.40.15 |
|
ceph-kcc-controller Updated |
mirantis.azurecr.io/core/ceph-kcc-controller:1.40.15 |
|
cert-manager-controller |
mirantis.azurecr.io/core/external/cert-manager-controller:v1.11.0-6 |
|
configuration-collector Updated |
mirantis.azurecr.io/core/configuration-collector:1.40.15 |
|
event-controller Updated |
mirantis.azurecr.io/core/event-controller:1.40.15 |
|
frontend Updated |
mirantis.azurecr.io/core/frontend:1.40.15 |
|
host-os-modules-controller Updated |
mirantis.azurecr.io/core/host-os-modules-controller:1.40.15 |
|
iam-controller Updated |
mirantis.azurecr.io/core/iam-controller:1.40.15 |
|
kaas-exporter Updated |
mirantis.azurecr.io/core/kaas-exporter:1.40.15 |
|
kproxy Updated |
mirantis.azurecr.io/core/kproxy:1.40.15 |
|
lcm-controller Updated |
mirantis.azurecr.io/core/lcm-controller:1.40.15 |
|
license-controller Updated |
mirantis.azurecr.io/core/license-controller:1.40.15 |
|
machinepool-controller Updated |
mirantis.azurecr.io/core/machinepool-controller:1.40.15 |
|
mcc-haproxy Updated |
mirantis.azurecr.io/lcm/mcc-haproxy:v0.25.0-40-g890ffca |
|
mcc-keepalived Updated |
mirantis.azurecr.io/lcm/mcc-keepalived:v0.25.0-40-g890ffca |
|
nginx Updated |
mirantis.azurecr.io/core/external/nginx:1.40.15 |
|
openstack-cluster-api-controller Updated |
mirantis.azurecr.io/core/openstack-cluster-api-controller:1.40.15 |
|
os-credentials-controller Updated |
mirantis.azurecr.io/core/os-credentials-controller:1.40.15 |
|
portforward-controller Updated |
mirantis.azurecr.io/core/portforward-controller:1.40.15 |
|
rbac-controller Updated |
mirantis.azurecr.io/core/rbac-controller:1.40.15 |
|
registry Updated |
mirantis.azurecr.io/lcm/registry:v2.8.1-10 |
|
release-controller Updated |
mirantis.azurecr.io/core/release-controller:1.40.15 |
|
scope-controller Updated |
mirantis.azurecr.io/core/scope-controller:1.40.15 |
|
secret-controller Updated |
mirantis.azurecr.io/core/secret-controller:1.40.15 |
|
squid-proxy |
mirantis.azurecr.io/lcm/squid-proxy:0.0.1-10-g24a0d69 |
|
user-controller Updated |
mirantis.azurecr.io/core/user-controller:1.40.15 |
|
vsphere-cluster-api-controller Updated |
mirantis.azurecr.io/core/vsphere-cluster-api-controller:1.40.15 |
|
vsphere-credentials-controller Updated |
mirantis.azurecr.io/core/vsphere-credentials-controller:1.40.15 |
|
vsphere-vm-template-controller Updated |
mirantis.azurecr.io/core/vsphere-vm-template-controller:1.40.15 |
Artifact |
Component |
Path |
|---|---|---|
Binaries |
hash-generate-darwin |
http://binary.mirantis.com/iam/bin/hash-generate-0.0.1-268-3cf7f17-darwin |
hash-generate-linux |
http://binary.mirantis.com/iam/bin/hash-generate-0.0.1-268-3cf7f17-linux |
|
Helm charts Updated |
iam |
|
Docker images |
kubectl |
mirantis.azurecr.io/stacklight/kubectl:1.22-20240501023013 |
kubernetes-entrypoint |
mirantis.azurecr.io/openstack/extra/kubernetes-entrypoint:v1.0.1-ba8ada4-20240405150338 |
|
mariadb |
mirantis.azurecr.io/general/mariadb:10.6.17-focal-20240523075821 |
|
mcc-keycloak Updated |
mirantis.azurecr.io/iam/mcc-keycloak:24.0.5-20240621131831 |
The Mirantis Container Cloud major release 2.27.0:
Introduces support for the Cluster release 17.2.0 that is based on the Cluster release 16.2.0 and represents Mirantis OpenStack for Kubernetes (MOSK) 24.2.
Introduces support for the Cluster release 16.2.0 that is based on Mirantis Container Runtime (MCR) 23.0.11 and Mirantis Kubernetes Engine (MKE) 3.7.8 with Kubernetes 1.27.
Does not support greenfield deployments on deprecated Cluster releases of the 17.1.x and 16.1.x series. Use the latest available Cluster releases of the series instead.
Caution
Make sure to update the Cluster release version of your managed cluster before the current Cluster release version becomes unsupported by a new Container Cloud release version. Otherwise, Container Cloud stops auto-upgrade and eventually Container Cloud itself becomes unsupported.
This section outlines release notes for the Container Cloud release 2.27.0.
This section outlines new features and enhancements introduced in the Container Cloud release 2.27.0. For the list of enhancements delivered with the Cluster releases introduced by Container Cloud 2.27.0, see 17.2.0 and 16.2.0.
Implemented full support for Ubuntu 22.04 LTS (Jellyfish) as the default host operating system that now installs on non-MOSK bare metal management and managed clusters.
For MOSK:
Existing management clusters are automatically updated to Ubuntu 22.04 during cluster upgrade to Container Cloud 2.27.0 (Cluster release 16.2.0).
Greenfield deployments of management clusters are based on Ubuntu 22.04.
Existing and greenfield deployments of managed clusters are still based on Ubuntu 20.04. The support for Ubuntu 22.04 on this cluster type will be announced in one of the following releases.
Caution
Upgrading from Ubuntu 20.04 to 22.04 on existing deployments of Container Cloud managed clusters is not supported.
TechPreview
Enhanced the day-2 management API the bare metal provider with several key improvements:
Implemented the
sysctl,package, andirqbalanceconfiguration modules, which become available for usage after your management cluster upgrade to the Cluster release 16.2.0. These Container Cloud modules use the designatedHostOSConfigurationobject namedmcc-modulesto distingish them from custom modules.Configuration modules allow managing the operating system of a bare metal host granularly without rebuilding the node from scratch. Such approach prevents workload evacuation and significantly reduces configuration time.
Optimized performance for faster, more efficient operations.
Enhanced user experience for easier and more intuitive interactions.
Resolved various internal issues to ensure smoother functionality.
Added comprehensive documentation, including concepts, guidelines, and recommendations for effective use of day-2 operations.
Optimized the BareMetalHostProfile custom resource, which uses
the strict byID filtering to target system disks using the byPath,
serialNumber, and wwn reliable device options instead of the
unpredictable byName naming format.
The optimization includes changes in admission-controller that now blocks
the use of bmhp:spec:devices:by_name in new BareMetalHostProfile
objects.
As part of refactoring of the bare metal provider, deprecated the
SubnetPool and MetalLBConfigTemplate objects. The objects will be
completely removed from the product in one of the following releases.
Both objects are automatically migrated to the MetallbConfig object during
cluster update to the Cluster release 17.2.0 or 16.2.0.
Learn more
TechPreview
Implemented the ClusterUpdatePlan custom resource to enable a granular
step-by-step update of a managed cluster. The operator can control the update
process by manually launching update stages using the commence flag.
Between the update stages, a cluster remains functional from the perspective
of cloud users and workloads.
A ClusterUpdatePlan object is automatically created by the respective
Container Cloud provider when a new Cluster release becomes available for your
cluster. This object contains a list of predefined self-descriptive update
steps that are cluster-specific. These steps are defined in the spec
section of the object with information about their impact on the cluster.
Implemented the UpdateGroup custom resource for creation of update groups
for worker machines on managed clusters. The use of update groups provides
enhanced control over update of worker machines. This feature decouples the
concurrency settings from the global cluster level, providing update
flexibility based on the workload characteristics of different worker machine
sets.
Implemented the same heartbeat model for the LCM Agent as Kubernetes uses for Nodes. This model allows reflecting the actual status of the LCM Agent when it fails. For visual representation, added the corresponding LCM Agent status to the Container Cloud web UI for clusters and machines, which reflects health status of the LCM agent along with its status of update to the version from the current Cluster release.
Implemented secret-controller that runs on a management cluster and cleans
up secret leftovers of credentials that are not cleaned up automatically after
creation of new secrets. This controller replaces rhellicense-controller,
proxy-controller, and byo-credentials-controller as well as partially
replaces the functionality of license-controller and other credential
controllers.
Note
You can change memory limits for secret-controller on a
management cluster using the resources:limits parameter in the
spec:providerSpec:value:kaas:management:helmReleases: section of the
Cluster object.
Implemented the capability to back up and restore MariaDB databases on management clusters for bare metal and vSphere providers. Also, added documentation on how to change the storage node for backups on clusters of these provider types.
The following issues have been addressed in the Mirantis Container Cloud release 2.27.0 along with the Cluster releases 17.2.0 and 16.2.0.
Note
This section provides descriptions of issues addressed since the last Container Cloud patch release 2.26.5.
For details on addressed issues in earlier patch releases since 2.26.0, which are also included into the major release 2.27.0, refer to 2.26.x patch releases.
[42304] [StackLight] Fixed the issue with failure of shard relocation in the OpenSearch cluster on large Container Cloud managed clusters.
[41890] [StackLight] Fixed the issue with Patroni failing to start because of the short default timeout.
[40020] [StackLight] Fixed the issue with
rollover_policynot being applied to the current indices while updating the policy for the currentsystem*andaudit*data streams.[41819] [Ceph] Fixed the issue with the graceful cluster reboot being blocked by active Ceph
ClusterWorkloadLockobjects.[28865] [LCM] Fixed the issue with validation of the NTP configuration before cluster deployment. Now, deployment does not start until the NTP configuration is validated.
This section lists known issues with workarounds for the Mirantis Container Cloud release 2.27.0 including the Cluster releases 17.2.0 and 16.2.0.
For other issues that can occur while deploying and operating a Container Cloud cluster, see Troubleshooting Guide.
Note
This section also outlines still valid known issues from previous Container Cloud releases.
Note
Moving forward, the workaround for this issue will be moved from Release Notes to MOSK Troubleshooting Guide: Inspection error on bare metal hosts after dnsmasq restart.
If the dnsmasq pod is restarted during the bootstrap of newly added
nodes, those nodes may fail to undergo inspection. That can result in
inspection error in the corresponding BareMetalHost objects.
The issue can occur when:
The
dnsmasqpod was moved to another node.DHCP subnets were changed, including addition or removal. In this case, the
dhcpdcontainer of thednsmasqpod is restarted.Caution
If changing or adding of DHCP subnets is required to bootstrap new nodes, wait after changing or adding DHCP subnets until the
dnsmasqpod becomes ready, then createBareMetalHostobjects.
To verify whether the nodes are affected:
Verify whether the
BareMetalHostobjects contain theinspection error:kubectl get bmh -n <managed-cluster-namespace-name>
Example of system response:
NAME STATE CONSUMER ONLINE ERROR AGE test-master-1 provisioned test-master-1 true 9d test-master-2 provisioned test-master-2 true 9d test-master-3 provisioned test-master-3 true 9d test-worker-1 provisioned test-worker-1 true 9d test-worker-2 provisioned test-worker-2 true 9d test-worker-3 inspecting true inspection error 19h
Verify whether the
dnsmasqpod was inReadystate when the inspection of the affected baremetal hosts (test-worker-3in the example above) was started:kubectl -n kaas get pod <dnsmasq-pod-name> -oyaml
Example of system response:
... status: conditions: - lastProbeTime: null lastTransitionTime: "2024-10-10T15:37:34Z" status: "True" type: Initialized - lastProbeTime: null lastTransitionTime: "2024-10-11T07:38:54Z" status: "True" type: Ready - lastProbeTime: null lastTransitionTime: "2024-10-11T07:38:54Z" status: "True" type: ContainersReady - lastProbeTime: null lastTransitionTime: "2024-10-10T15:37:34Z" status: "True" type: PodScheduled containerStatuses: - containerID: containerd://6dbcf2fc4b36ce4c549c9191ab01f72d0236c51d42947675302675e4bfaf4cdf image: docker-dev-kaas-virtual.artifactory-eu.mcp.mirantis.net/bm/baremetal-dnsmasq:base-2-28-alpine-20240812132650 imageID: docker-dev-kaas-virtual.artifactory-eu.mcp.mirantis.net/bm/baremetal-dnsmasq@sha256:3dad3e278add18e69b2608e462691c4823942641a0f0e25e6811e703e3c23b3b lastState: terminated: containerID: containerd://816fcf079cd544acd74e312065de5b5ed4dbf1dc6159fefffff4f644b5e45987 exitCode: 0 finishedAt: "2024-10-11T07:38:35Z" reason: Completed startedAt: "2024-10-10T15:37:45Z" name: dhcpd ready: true restartCount: 2 started: true state: running: startedAt: "2024-10-11T07:38:37Z" ...
In the system response above, the
dhcpdcontainer was not ready between"2024-10-11T07:38:35Z"and"2024-10-11T07:38:54Z".Verify the affected baremetal host. For example:
kubectl get bmh -n managed-ns test-worker-3 -oyaml
Example of system response:
... status: errorCount: 15 errorMessage: Introspection timeout errorType: inspection error ... operationHistory: deprovision: end: null start: null inspect: end: null start: "2024-10-11T07:38:19Z" provision: end: null start: null register: end: "2024-10-11T07:38:19Z" start: "2024-10-11T07:37:25Z"
In the system response above, inspection was started at
"2024-10-11T07:38:19Z", immediately before the period of thedhcpdcontainer downtime. Therefore, this node is most likely affected by the issue.
Workaround
Reboot the node using the IPMI reset or cycle command.
If the node fails to boot, remove the failed
BareMetalHostobject and create it again:Remove
BareMetalHostobject. For example:kubectl delete bmh -n managed-ns test-worker-3
Verify that the
BareMetalHostobject is removed:kubectl get bmh -n managed-ns test-worker-3
Create a
BareMetalHostobject from the template. For example:kubectl create -f bmhc-test-worker-3.yaml kubectl create -f bmh-test-worker-3.yaml
Fixed in 2.28.0 (17.3.0 and 16.3.0)
When trying to list the HostOSConfigurationModules and HostOSConfiguration custom resources, serviceuser or a user with
the global-admin or operator role obtains the access denied error.
For example:
kubectl --kubeconfig ~/.kube/mgmt-config get hocm
Error from server (Forbidden): hostosconfigurationmodules.kaas.mirantis.com is forbidden:
User "2d74348b-5669-4c65-af31-6c05dbedac5f" cannot list resource "hostosconfigurationmodules"
in API group "kaas.mirantis.com" at the cluster scope: access denied
Workaround:
Modify the
global-adminrole by adding a new entry with the following contents to theruleslist:kubectl edit clusterroles kaas-global-admin
- apiGroups: [kaas.mirantis.com] resources: [hostosconfigurationmodules] verbs: ['*']
For each Container Cloud project, modify the
kaas-operatorrole by adding a new entry with the following contents to theruleslist:kubectl -n <projectName> edit roles kaas-operator
- apiGroups: [kaas.mirantis.com] resources: [hostosconfigurations] verbs: ['*']
Due to the MetalLB upstream issue, a load balancer service may not obtain the external IP address.
The issue occurs when two services share the same external IP address and have
the same externalTrafficPolicy value. Initially, the services have the
external IP address assigned and are accessible. After modifying the
externalTrafficPolicy value for both services from Cluster to
Local, the first service that has been changed remains with no external IP
address assigned. Though, the second service, which was changed later, has the
external IP assigned as expected.
To work around the issue, make a dummy change to the service object where
external IP is <pending>:
Identify the service that is stuck:
kubectl get svc -A | grep pending
Example of system response:
stacklight iam-proxy-prometheus LoadBalancer 10.233.28.196 <pending> 443:30430/TCP
Add an arbitrary label to the service that is stuck. For example:
kubectl label svc -n stacklight iam-proxy-prometheus reconcile=1
Example of system response:
service/iam-proxy-prometheus labeledVerify that the external IP was allocated to the service:
kubectl get svc -n stacklight iam-proxy-prometheus
Example of system response:
NAME TYPE CLUSTER-IP EXTERNAL-IP PORT(S) AGE iam-proxy-prometheus LoadBalancer 10.233.28.196 10.0.34.108 443:30430/TCP 12d
Fixed in 2.28.0 (17.3.0 and 16.3.0)
After node maintenance of a management cluster, the newly added nodes may fail to undergo provisioning successfully. The issue relates to new nodes that are in the same L2 domain as the management cluster.
The issue was observed on environments having management cluster nodes configured with a single L2 segment used for all network traffic (PXE and LCM/management networks).
To verify whether the cluster is affected:
Verify whether the dnsmasq and dhcp-relay pods run on the same node
in the management cluster:
kubectl -n kaas get pods -o wide| grep -e "dhcp\|dnsmasq"
Example of system response:
dhcp-relay-7d85f75f76-5vdw2 2/2 Running 2 (36h ago) 36h 10.10.0.122 kaas-node-8a24b81c-76d0-4d4c-8421-962bd39df5ad <none> <none>
dnsmasq-8f4b484b4-slhbd 5/5 Running 1 (36h ago) 36h 10.233.123.75 kaas-node-8a24b81c-76d0-4d4c-8421-962bd39df5ad <none> <none>
If this is the case, proceed to the workaround below.
Workaround:
Log in to a node that contains
kubeconfigof the affected management cluster.Make sure that at least two management cluster nodes are schedulable:
kubectl get node
Example of a positive system response:
NAME STATUS ROLES AGE VERSION kaas-node-bcedb87b-b3ce-46a4-a4ca-ea3068689e40 Ready master 37h v1.27.10-mirantis-1 kaas-node-8a24b81c-76d0-4d4c-8421-962bd39df5ad Ready master 37h v1.27.10-mirantis-1 kaas-node-ad5a6f51-b98f-43c3-91d5-55fed3d0ff21 Ready master 37h v1.27.10-mirantis-1
Delete the
dhcp-relaypod:kubectl -n kaas delete pod <dhcp-relay-xxxxx>
Verify that the
dnsmasqanddhcp-relaypods are scheduled into different nodes:kubectl -n kaas get pods -o wide| grep -e "dhcp\|dnsmasq"
Example of a positive system response:
dhcp-relay-7d85f75f76-rkv03 2/2 Running 0 49s 10.10.0.121 kaas-node-bcedb87b-b3ce-46a4-a4ca-ea3068689e40 <none> <none> dnsmasq-8f4b484b4-slhbd 5/5 Running 1 (37h ago) 37h 10.233.123.75 kaas-node-8a24b81c-76d0-4d4c-8421-962bd39df5ad <none> <none>
During deletion of a manager machine running the ironic Pod from a bare
metal management cluster, the following problems occur:
All Pods are stuck in the
TerminatingstateA new
ironicPod fails to startThe related bare metal host is stuck in the
deprovisioningstate
As a workaround, before deletion of the node running the ironic Pod,
cordon and drain the node using the kubectl cordon <nodeName> and
kubectl drain <nodeName> commands.
Fixed in 2.29.0 (17.4.0 and 16.4.0)
During the replacement of a master node on a cluster of any type, the process
may get stuck with Kubelet's NodeReady condition is Unknown in the
machine status on the remaining master nodes.
As a workaround, log in on the affected node and run the following command:
docker restart ucp-kubelet
During MariaDB operations on a management cluster, Pods may get stuck in continuous restarts with the following example error:
[ERROR] WSREP: Corrupt buffer header: \
addr: 0x7faec6f8e518, \
seqno: 3185219421952815104, \
size: 909455917, \
ctx: 0x557094f65038, \
flags: 11577. store: 49, \
type: 49
Workaround:
Create a backup of the
/var/lib/mysqldirectory on themariadb-serverPod.Verify that other replicas are up and ready.
Remove the
galera.cachefile for the affectedmariadb-serverPod.Remove the affected
mariadb-serverPod or wait until it is automatically restarted.
After Kubernetes restarts the Pod, the Pod clones the database in 1-2 minutes and restores the quorum.
Fixed in 2.28.4 (17.3.4 and 16.3.4)
During replacement of a master node on a cluster of any type, the
calico-node Pod fails to start on a new node that has the same IP address
as the node being replaced.
Workaround:
Log in to any
masternode.From a CLI with an MKE client bundle, create a shell alias to start calicoctl using the
mirantis/ucp-dsinfoimage:alias calicoctl="\ docker run -i --rm \ --pid host \ --net host \ -e constraint:ostype==linux \ -e ETCD_ENDPOINTS=<etcdEndpoint> \ -e ETCD_KEY_FILE=/var/lib/docker/volumes/ucp-kv-certs/_data/key.pem \ -e ETCD_CA_CERT_FILE=/var/lib/docker/volumes/ucp-kv-certs/_data/ca.pem \ -e ETCD_CERT_FILE=/var/lib/docker/volumes/ucp-kv-certs/_data/cert.pem \ -v /var/run/calico:/var/run/calico \ -v /var/lib/docker/volumes/ucp-kv-certs/_data:/var/lib/docker/volumes/ucp-kv-certs/_data:ro \ mirantis/ucp-dsinfo:<mkeVersion> \ calicoctl \ "
alias calicoctl="\ docker run -i --rm \ --pid host \ --net host \ -e constraint:ostype==linux \ -e ETCD_ENDPOINTS=<etcdEndpoint> \ -e ETCD_KEY_FILE=/ucp-node-certs/key.pem \ -e ETCD_CA_CERT_FILE=/ucp-node-certs/ca.pem \ -e ETCD_CERT_FILE=/ucp-node-certs/cert.pem \ -v /var/run/calico:/var/run/calico \ -v ucp-node-certs:/ucp-node-certs:ro \ mirantis/ucp-dsinfo:<mkeVersion> \ calicoctl --allow-version-mismatch \ "
In the above command, replace the following values with the corresponding settings of the affected cluster:
<etcdEndpoint>is the etcd endpoint defined in the Calico configuration file. For example,ETCD_ENDPOINTS=127.0.0.1:12378<mkeVersion>is the MKE version installed on your cluster. For example,mirantis/ucp-dsinfo:3.5.7.
Verify the node list on the cluster:
kubectl get node
Compare this list with the node list in Calico to identify the old node:
calicoctl get node -o wide
Remove the old node from Calico:
calicoctl delete node kaas-node-<nodeID>
Fixed in 2.28.4 (17.3.4 and 16.3.4)
During replacement of a manager machine, the following problems may occur:
The system adds the node to Docker swarm but not to Kubernetes
The node
Deploymentgets stuck with failed RethinkDB health checks
Workaround:
Delete the failed node.
Wait for the MKE cluster to become healthy. To monitor the cluster status:
Log in to the MKE web UI.
Monitor the cluster status as described in MKE Operations Guide: Monitor an MKE cluster with the MKE web UI.
Deploy a new node.
Fixed in 2.28.4 (17.3.4 and 16.3.4)
During the unsafe or forced deletion of a manager machine running the
calico-kube-controllers Pod in the kube-system namespace,
the following issues occur:
The
calico-kube-controllersPod fails to clean up resources associated with the deleted nodeThe
calico-nodePod may fail to start up on a newly created node if the machine is provisioned with the same IP address as the deleted machine had
As a workaround, before deletion of the node running the
calico-kube-controllers Pod, cordon and drain the node:
kubectl cordon <nodeName>
kubectl drain <nodeName>
Fixed in 2.29.3 (17.3.8, 16.3.8, and 16.4.3)
Due to the upstream Ceph issue
66717,
during CVE upgrade of the Ceph daemon image of Ceph Reef 18.2.4, OSDs may start
slow and even fail the starting probe with the following describe output in
the rook-ceph-osd-X pod:
Warning Unhealthy 57s (x16 over 3m27s) kubelet Startup probe failed:
ceph daemon health check failed with the following output:
> no valid command found; 10 closest matches:
> 0
> 1
> 2
> abort
> assert
> bluefs debug_inject_read_zeros
> bluefs files list
> bluefs stats
> bluestore bluefs device info [<alloc_size:int>]
> config diff
> admin_socket: invalid command
Workaround:
Complete the following steps during every patch or major cluster update of the Cluster releases 17.2.x, 17.3.x, and 17.4.x (until Ceph 18.2.5 becomes supported):
Plan extra time in the maintenance window for the patch cluster update.
Slow starts will still impact the update procedure, but after completing the following step, the recovery process noticeably shortens without affecting the overall cluster state and data responsiveness.
Select one of the following options:
Before the cluster update, set the
nooutflag:ceph osd set noout
Once the Ceph OSDs image upgrade is done, unset the flag:
ceph osd unset noout
Monitor the Ceph OSDs image upgrade. If the symptoms of slow start appear, set the
nooutflag as soon as possible. Once the Ceph OSDs image upgrade is done, unset the flag.
After a managed cluster update, the ceph-exporter pods are present in the
ceph crash ls list while rook-ceph-exporter attempts to obtain
the port that is still in use. The issue does not block the managed cluster
update. Once the port becomes available, rook-ceph-exporter obtains the
port and the issue disappears.
As a workaround, run ceph crash archive-all to remove
ceph-exporter pods from the Ceph crash list.
Note
The issue does not reproduce since MOSK 25.2.
Update of a managed cluster based on bare metal and Ceph enabled fails with
PersistentVolumeClaim getting stuck in the Pending state for the
prometheus-server StatefulSet and the
MountVolume.MountDevice failed for volume warning in the StackLight event
logs.
Workaround:
Verify that the description of the Pods that failed to run contain the
FailedMountevents:kubectl -n <affectedProjectName> describe pod <affectedPodName>
In the command above, replace the following values:
<affectedProjectName>is the Container Cloud project name where the Pods failed to run<affectedPodName>is a Pod name that failed to run in the specified project
In the Pod description, identify the node name where the Pod failed to run.
Verify that the
csi-rbdpluginlogs of the affected node contain therbd volume mount failed: <csi-vol-uuid> is being usederror. The<csi-vol-uuid>is a unique RBD volume name.Identify
csiPodNameof the correspondingcsi-rbdplugin:kubectl -n rook-ceph get pod -l app=csi-rbdplugin \ -o jsonpath='{.items[?(@.spec.nodeName == "<nodeName>")].metadata.name}'
Output the affected
csiPodNamelogs:kubectl -n rook-ceph logs <csiPodName> -c csi-rbdplugin
Scale down the affected
StatefulSetorDeploymentof the Pod that fails to0replicas.On every
csi-rbdpluginPod, search for stuckcsi-vol:for pod in `kubectl -n rook-ceph get pods|grep rbdplugin|grep -v provisioner|awk '{print $1}'`; do echo $pod kubectl exec -it -n rook-ceph $pod -c csi-rbdplugin -- rbd device list | grep <csi-vol-uuid> done
Unmap the affected
csi-vol:rbd unmap -o force /dev/rbd<i>
The
/dev/rbd<i>value is a mapped RBD volume that usescsi-vol.Delete
volumeattachmentof the affected Pod:kubectl get volumeattachments | grep <csi-vol-uuid> kubectl delete volumeattacmhent <id>
Scale up the affected
StatefulSetorDeploymentback to the original number of replicas and wait until its state becomesRunning.
Fixed in 2.29.0 (17.4.0 and 16.4.0)
On High Availability (HA) clusters that use Local Volume Provisioner (LVP), Prometheus and OpenSearch from StackLight may share the same pool of storage. In such configuration, OpenSearch may approach the 85% disk usage watermark due to the combined storage allocation and usage patterns set by the Persistent Volume Claim (PVC) size parameters for Prometheus and OpenSearch, which consume storage the most.
When the 85% threshold is reached, the affected node is transitioned to the
read-only state, preventing shard allocation and causing the OpenSearch cluster
state to transition to Warning (Yellow) or Critical (Red).
Caution
The issue and the provided workaround apply only for clusters on which OpenSearch and Prometheus utilize the same storage pool.
To verify that the cluster is affected:
Verify the result of the following formula:
0.8 × OpenSearch_PVC_Size_GB + Prometheus_PVC_Size_GB > 0.85 × Total_Storage_Capacity_GBIn the formula, define the following values:
- OpenSearch_PVC_Size_GB
Derived from
.values.elasticsearch.persistentVolumeUsableStorageSizeGB, defaulting to.values.elasticsearch.persistentVolumeClaimSizeif unspecified. To obtain the OpenSearch PVC size:kubectl -n <namespaceName> get cluster <clusterName> -o yaml |\ yq '.spec.providerSpec.value.helmReleases[] | select(.name == "stacklight") | .values.elasticsearch.persistentVolumeClaimSize '
Example of system response:
10000Gi
- Prometheus_PVC_Size_GB
Sourced from
.values.prometheusServer.persistentVolumeClaimSize. To obtain the Prometheus PVC size:kubectl -n <namespaceName> get cluster <clusterName> -o yaml |\ yq '.spec.providerSpec.value.helmReleases[] | select(.name == "stacklight") | .values.prometheusServer.persistentVolumeClaimSize '
Example of system response:
4000Gi
- Total_Storage_Capacity_GB
Total capacity of the OpenSearch PVCs. For LVP, the capacity of the storage pool. To obtain the total capacity:
kubectl get pvc -n stacklight -l app=opensearch-master \ -o custom-columns=NAME:.metadata.name,CAPACITY:.status.capacity.storage
The system response contains multiple outputs, one per
opensearch-masternode. Select the capacity for the affected node.
Note
Convert the values to GB if they are set in different units.
If the formula result is positive, it is an early indication that the cluster is affected.
Verify whether the
OpenSearchClusterStatusWarningorOpenSearchClusterStatusCriticalalert is firing. And if so, verify the following:Log in to the OpenSearch web UI.
In Management -> Dev Tools, run the following command:
GET _cluster/allocation/explainThe following system response indicates that the corresponding node is affected:
"explanation": "the node is above the low watermark cluster setting \ [cluster.routing.allocation.disk.watermark.low=85%], using more disk space \ than the maximum allowed [85.0%], actual free: [xx.xxx%]"
Note
The system response may contain even higher watermark percent than 85.0%, depending on the case.
Workaround:
Warning
The workaround implies adjustement of the retention threshold for OpenSearch. And depending on the new threshold, some old logs will be deleted.
Adjust or set
.values.elasticsearch.persistentVolumeUsableStorageSizeGBto a lower value for the affection check formula to be non-positive. For configuration details, see MOSK Operations Guide: StackLight configuration parameters - OpenSearch.Mirantis also recommends reserving some space for other PVCs using storage from the pool. Use the following formula to calculate the required space:
persistentVolumeUsableStorageSizeGB = 0.84 × ((1 - Reserved_Percentage - Filesystem_Reserve) × Total_Storage_Capacity_GB - Prometheus_PVC_Size_GB) / 0.8
In the formula, define the following values:
- Reserved_Percentage
A user-defined variable that specifies what percentage of the total storage capacity should not be used by OpenSearch or Prometheus. This is used to reserve space for other components. It should be expressed as a decimal. For example, for 5% of reservation,
Reserved_Percentageis 0.05. Mirantis recommends using 0.05 as a starting point.- Filesystem_Reserve
Percentage to deduct for filesystems that may reserve some portion of the available storage, which is marked as occupied. For example, for EXT4, it is 5% by default, so the value must be 0.05.
- Prometheus_PVC_Size_GB
Sourced from
.values.prometheusServer.persistentVolumeClaimSize.- Total_Storage_Capacity_GB
Total capacity of the OpenSearch PVCs. For LVP, the capacity of the storage pool. To obtain the total capacity:
kubectl get pvc -n stacklight -l app=opensearch-master \ -o custom-columns=NAME:.metadata.name,CAPACITY:.status.capacity.storage
The system response contains multiple outputs, one per
opensearch-masternode. Select the capacity for the affected node.
Note
Convert the values to GB if they are set in different units.
Calculation of above formula provides a maximum safe storage to allocate for
.values.elasticsearch.persistentVolumeUsableStorageSizeGB. Use this formula as a reference for setting.values.elasticsearch.persistentVolumeUsableStorageSizeGBon a cluster.Wait up to 15-20 mins for OpenSearch to perform the cleaning.
Verify that the cluster is not affected anymore using the procedure above.
Fixed in 2.28.0 (17.3.0 and 16.3.0)
The initial index for the system* and audit* data streams can be
created without any policy attached due to race condition.
One of indicators that the cluster is most likely affected is the
KubeJobFailed alert firing for the elasticsearch-curator job and one or
both of the following errors being present in elasticsearch-curator pods
that remain in the Error status:
2024-05-31 13:16:04,459 ERROR Failed to complete action: delete_indices. \
<class 'curator.exceptions.FailedExecution'>: Exception encountered. \
Rerun with loglevel DEBUG and/or check Elasticsearch logs for more information. \
Exception: RequestError(400, 'illegal_argument_exception', 'index [.ds-system-000001] \
is the write index for data stream [system] and cannot be deleted')
or
2024-05-31 13:16:04,459 ERROR Failed to complete action: delete_indices. \
<class 'curator.exceptions.FailedExecution'>: Exception encountered. \
Rerun with loglevel DEBUG and/or check Elasticsearch logs for more information. \
Exception: RequestError(400, 'illegal_argument_exception', 'index [.ds-audit-000001] \
is the write index for data stream [audit] and cannot be deleted')
If the above mentioned alert and errors are present, an immediate action is required, because it indicates that the corresponding index size has already exceeded the space allocated for the index.
To verify that the cluster is affected:
Caution
Verify and apply the workaround to both index patterns, system and audit, separately.
If one of indices is affected, the second one is most likely affected as well. Although in rare cases, only one index may be affected.
Log in to the
opensearch-master-0Pod:kubectl exec -it pod/opensearch-master-0 -n stacklight -c opensearch -- bash
Verify whether the rollover policy is attached to the index with the
000001number:system:curl localhost:9200/_plugins/_ism/explain/.ds-system-000001audit:curl localhost:9200/_plugins/_ism/explain/.ds-audit-000001
If the rollover policy is not attached, the cluster is affected. Examples of system responses in an affected cluster:
{ ".ds-system-000001": { "index.plugins.index_state_management.policy_id": null, "index.opendistro.index_state_management.policy_id": null, "enabled": null }, "total_managed_indices": 0 }
{ ".ds-audit-000001": { "index.plugins.index_state_management.policy_id": null, "index.opendistro.index_state_management.policy_id": null, "enabled": null }, "total_managed_indices": 0 }
Workaround:
Log in to the
opensearch-master-0Pod:kubectl exec -it pod/opensearch-master-0 -n stacklight -c opensearch -- bash
Add the policy:
system:curl -XPOST -H "Content-type: application/json" localhost:9200/_plugins/_ism/add/system* -d'{"policy_id":"system_rollover_policy"}'
audit:curl -XPOST -H "Content-type: application/json" localhost:9200/_plugins/_ism/add/audit* -d'{"policy_id":"audit_rollover_policy"}'
Perform again the last step of the cluster verification procedure provided above and make sure that the policy is attached to the index.
Fixed in 2.30.0 (21.0.0 and 20.0.0)
A compact MOSK cluster fails to be deployed through the Container Cloud web UI
due to inability to add any label to the control plane machines along with
inability to change dedicatedControlPlane: false using the web UI.
To work around the issue, manually add the required labels using CLI. Once done, the cluster deployment resumes.
A newly created project does not display all available tabs in the Container
Cloud web UI and contains different access denied errors during first five
minutes after creation.
To work around the issue, refresh the browser in five minutes after the project creation.
The following table lists the major components and their versions delivered in Container Cloud 2.27.0.
Note
The components that are newly added, updated, deprecated, or removed
as compared to the previous release version, are marked
with a corresponding superscript,
for example, lcm-ansible Updated.
Component |
Application/Service |
Version |
|---|---|---|
Bare metal |
baremetal-dnsmasq Updated |
base-2-27-alpine-20240523143049 |
baremetal-operator Updated |
base-2-27-alpine-20240523142757 |
|
baremetal-provider Updated |
1.40.11 |
|
bm-collective Updated |
base-2-27-alpine-20240523143803 |
|
cluster-api-provider-baremetal Updated |
1.40.11 |
|
ironic Updated |
antelope-jammy-20240522120643 |
|
ironic-inspector Updated |
antelope-jammy-20240522120643 |
|
ironic-prometheus-exporter |
0.1-20240117102150 |
|
kaas-ipam Updated |
base-2-27-alpine-20240531082457 |
|
kubernetes-entrypoint |
v1.0.1-ba8ada4-20240405150338 |
|
mariadb |
10.6.17-focal-20240523075821 |
|
metallb-controller Updated |
v0.14.5-e86184d9-amd64 |
|
metallb-speaker Updated |
v0.14.5-e86184d9-amd64 |
|
syslog-ng |
base-alpine-20240129163811 |
|
Container Cloud |
admission-controller Updated |
1.40.11 |
agent-controller Updated |
1.40.11 |
|
byo-cluster-api-controller Updated |
1.40.11 |
|
byo-credentials-controller Removed |
n/a |
|
ceph-kcc-controller Updated |
1.40.11 |
|
cert-manager-controller |
1.11.0-6 |
|
cinder-csi-plugin |
1.27.2-16 |
|
client-certificate-controller Updated |
1.40.11 |
|
configuration-collector Updated |
1.40.11 |
|
csi-attacher |
4.2.0-5 |
|
csi-node-driver-registrar |
2.7.0-5 |
|
csi-provisioner |
3.4.1-5 |
|
csi-resizer |
1.7.0-5 |
|
csi-snapshotter |
6.2.1-mcc-4 |
|
event-controller Updated |
1.40.11 |
|
frontend Updated |
1.40.12 |
|
golang |
1.21.7-alpine3.18 |
|
iam-controller Updated |
1.40.11 |
|
kaas-exporter Updated |
1.40.11 |
|
kproxy Updated |
1.40.11 |
|
lcm-controller Updated |
1.40.11 |
|
license-controller Updated |
1.40.11 |
|
livenessprobe Updated |
2.9.0-5 |
|
machinepool-controller Updated |
1.40.11 |
|
mcc-haproxy Updated |
0.25.0-37-gc15c97d |
|
metrics-server |
0.6.3-7 |
|
nginx Updated |
1.40.11 |
|
policy-controller New |
1.40.11 |
|
portforward-controller Updated |
1.40.11 |
|
proxy-controller Updated |
1.40.11 |
|
rbac-controller Updated |
1.40.11 |
|
registry |
2.8.1-9 |
|
release-controller Updated |
1.40.11 |
|
rhellicense-controller Removed |
n/a |
|
scope-controller Updated |
1.40.11 |
|
secret-controller New |
1.40.11 |
|
storage-discovery Updated |
1.40.11 |
|
user-controller Updated |
1.40.11 |
|
IAM |
iam Updated |
1.40.11 |
mariadb |
10.6.17-focal-20240523075821 |
|
mcc-keycloak Updated |
24.0.3-20240527150505 |
|
OpenStack Updated |
host-os-modules-controller Updated |
1.40.11 |
openstack-cloud-controller-manager |
v1.27.2-16 |
|
openstack-cluster-api-controller |
1.40.11 |
|
openstack-provider |
1.40.11 |
|
os-credentials-controller |
1.40.11 |
|
VMware vSphere |
mcc-keepalived Updated |
0.25.0-37-gc15c97d |
squid-proxy |
0.0.1-10-g24a0d69 |
|
vsphere-cloud-controller-manager |
v1.27.0-6 |
|
vsphere-cluster-api-controller Updated |
1.40.11 |
|
vsphere-credentials-controller Updated |
1.40.11 |
|
vsphere-csi-driver |
v3.0.2-1 |
|
vsphere-csi-syncer |
v3.0.2-1 |
|
vsphere-provider Updated |
1.40.11 |
|
vsphere-vm-template-controller Updated |
1.40.11 |
This section lists the artifacts of components included in the Container Cloud release 2.27.0.
Note
The components that are newly added, updated, deprecated, or removed
as compared to the previous release version, are marked
with a corresponding superscript,
for example, lcm-ansible Updated.
Artifact |
Component |
Path |
|---|---|---|
Binaries |
ironic-python-agent.initramfs |
https://binary.mirantis.com/bm/bin/ironic/ipa/ubuntu/initramfs-yoga-focal-debug-20240517093708 |
ironic-python-agent.kernel |
https://binary.mirantis.com/bm/bin/ironic/ipa/ubuntu/kernel-yoga-focal-debug-20240517093708 |
|
Helm charts Updated |
baremetal-api |
https://binary.mirantis.com/core/helm/baremetal-api-1.40.11.tgz |
baremetal-operator |
https://binary.mirantis.com/core/helm/baremetal-operator-1.40.11.tgz |
|
baremetal-provider |
https://binary.mirantis.com/core/helm/baremetal-provider-1.40.11.tgz |
|
baremetal-public-api |
https://binary.mirantis.com/core/helm/baremetal-public-api-1.40.11.tgz |
|
kaas-ipam |
||
local-volume-provisioner |
https://binary.mirantis.com/core/helm/local-volume-provisioner-1.40.11.tgz |
|
metallb |
||
Docker images |
ambasador Updated |
mirantis.azurecr.io/core/external/nginx:1.40.11 |
baremetal-dnsmasq Updated |
mirantis.azurecr.io/bm/baremetal-dnsmasq:base-2-27-alpine-20240523143049 |
|
baremetal-operator Updated |
mirantis.azurecr.io/bm/baremetal-operator:base-2-27-alpine-20240523142757 |
|
bm-collective Updated |
mirantis.azurecr.io/bm/bm-collective:base-2-27-alpine-20240523143803 |
|
cluster-api-provider-baremetal Updated |
mirantis.azurecr.io/core/cluster-api-provider-baremetal:1.40.11 |
|
ironic Updated |
mirantis.azurecr.io/openstack/ironic:antelope-jammy-20240522120643 |
|
ironic-inspector Updated |
mirantis.azurecr.io/openstack/ironic-inspector:antelope-jammy-20240522120643 |
|
ironic-prometheus-exporter |
mirantis.azurecr.io/stacklight/ironic-prometheus-exporter:0.1-20240117102150 |
|
kaas-ipam Updated |
mirantis.azurecr.io/bm/kaas-ipam:base-2-27-alpine-20240531082457 |
|
kubernetes-entrypoint |
mirantis.azurecr.io/openstack/extra/kubernetes-entrypoint:v1.0.1-ba8ada4-20240405150338 |
|
mariadb |
mirantis.azurecr.io/general/mariadb:10.6.17-focal-20240523075821 |
|
mcc-keepalived Updated |
mirantis.azurecr.io/lcm/mcc-keepalived:v0.25.0-37-gc15c97d |
|
metallb-controller Updated |
mirantis.azurecr.io/bm/metallb/controller:v0.14.5-e86184d9-amd64 |
|
metallb-speaker Updated |
mirantis.azurecr.io/bm/metallb/speaker:v0.14.5-e86184d9-amd64 |
|
syslog-ng |
mirantis.azurecr.io/bm/syslog-ng:base-alpine-20240129163811 |
Artifact |
Component |
Path |
|---|---|---|
Bootstrap tarball Updated |
bootstrap-darwin |
https://binary.mirantis.com/core/bin/bootstrap-darwin-1.40.11.tgz |
bootstrap-linux |
https://binary.mirantis.com/core/bin/bootstrap-linux-1.40.11.tgz |
|
Helm charts Updated |
admission-controller |
https://binary.mirantis.com/core/helm/admission-controller-1.40.11.tgz |
agent-controller |
https://binary.mirantis.com/core/helm/agent-controller-1.40.11.tgz |
|
byo-credentials-controller Removed |
n/a |
|
byo-provider |
https://binary.mirantis.com/core/helm/byo-provider-1.40.11.tgz |
|
ceph-kcc-controller |
https://binary.mirantis.com/core/helm/ceph-kcc-controller-1.40.11.tgz |
|
cert-manager |
https://binary.mirantis.com/core/helm/cert-manager-1.40.11.tgz |
|
cinder-csi-plugin |
https://binary.mirantis.com/core/helm/cinder-csi-plugin-1.40.11.tgz |
|
client-certificate-controller |
https://binary.mirantis.com/core/helm/client-certificate-controller-1.40.11.tgz |
|
configuration-collector |
https://binary.mirantis.com/core/helm/configuration-collector-1.40.11.tgz |
|
event-controller |
https://binary.mirantis.com/core/helm/event-controller-1.40.11.tgz |
|
host-os-modules-controller |
https://binary.mirantis.com/core/helm/host-os-modules-controller-1.40.11.tgz |
|
iam-controller |
https://binary.mirantis.com/core/helm/iam-controller-1.40.11.tgz |
|
kaas-exporter |
https://binary.mirantis.com/core/helm/kaas-exporter-1.40.11.tgz |
|
kaas-public-api |
https://binary.mirantis.com/core/helm/kaas-public-api-1.40.11.tgz |
|
kaas-ui |
||
lcm-controller |
https://binary.mirantis.com/core/helm/lcm-controller-1.40.11.tgz |
|
license-controller |
https://binary.mirantis.com/core/helm/license-controller-1.40.11.tgz |
|
machinepool-controller |
https://binary.mirantis.com/core/helm/machinepool-controller-1.40.11.tgz |
|
mcc-cache |
||
mcc-cache-warmup |
https://binary.mirantis.com/core/helm/mcc-cache-warmup-1.40.11.tgz |
|
metrics-server |
https://binary.mirantis.com/core/helm/metrics-server-1.40.11.tgz |
|
openstack-cloud-controller-manager |
https://binary.mirantis.com/core/helm/openstack-cloud-controller-manager-1.40.11.tgz |
|
openstack-provider |
https://binary.mirantis.com/core/helm/openstack-provider-1.40.11.tgz |
|
os-credentials-controller |
https://binary.mirantis.com/core/helm/os-credentials-controller-1.40.11.tgz |
|
policy-controller |
https://binary.mirantis.com/core/helm/policy-controller-1.40.11.tgz |
|
portforward-controller |
https://binary.mirantis.com/core/helm/portforward-controller-1.40.11.tgz |
|
proxy-controller Removed |
n/a |
|
rbac-controller |
https://binary.mirantis.com/core/helm/rbac-controller-1.40.11.tgz |
|
release-controller |
https://binary.mirantis.com/core/helm/release-controller-1.40.11.tgz |
|
rhellicense-controller Removed |
n/a |
|
scope-controller |
https://binary.mirantis.com/core/helm/scope-controller-1.40.11.tgz |
|
secret-controller New |
https://binary.mirantis.com/core/helm/secret-controller-1.40.11.tgz |
|
squid-proxy |
https://binary.mirantis.com/core/helm/squid-proxy-1.40.11.tgz |
|
user-controller |
https://binary.mirantis.com/core/helm/user-controller-1.40.11.tgz |
|
vsphere-cloud-controller-manager |
https://binary.mirantis.com/core/helm/vsphere-cloud-controller-manager-1.40.11.tgz |
|
vsphere-credentials-controller |
https://binary.mirantis.com/core/helm/vsphere-credentials-controller-1.40.11.tgz |
|
vsphere-csi-plugin |
https://binary.mirantis.com/core/helm/vsphere-csi-plugin-1.40.11.tgz |
|
vsphere-provider |
https://binary.mirantis.com/core/helm/vsphere-provider-1.40.11.tgz |
|
vsphere-vm-template-controller |
https://binary.mirantis.com/core/helm/vsphere-vm-template-controller-1.40.11.tgz |
|
Docker images |
admission-controller Updated |
mirantis.azurecr.io/core/admission-controller:1.40.11 |
agent-controller Updated |
mirantis.azurecr.io/core/agent-controller:1.40.11 |
|
byo-cluster-api-controller Updated |
mirantis.azurecr.io/core/byo-cluster-api-controller:1.40.11 |
|
byo-credentials-controller Removed |
n/a |
|
ceph-kcc-controller Updated |
mirantis.azurecr.io/core/ceph-kcc-controller:1.40.11 |
|
cert-manager-controller |
mirantis.azurecr.io/core/external/cert-manager-controller:v1.11.0-6 |
|
cinder-csi-plugin |
mirantis.azurecr.io/lcm/kubernetes/cinder-csi-plugin:v1.27.2-16 |
|
client-certificate-controller Updated |
mirantis.azurecr.io/core/client-certificate-controller:1.40.11 |
|
configuration-collector Updated |
mirantis.azurecr.io/core/configuration-collector:1.40.11 |
|
csi-attacher |
mirantis.azurecr.io/lcm/k8scsi/csi-attacher:v4.2.0-5 |
|
csi-node-driver-registrar |
mirantis.azurecr.io/lcm/k8scsi/csi-node-driver-registrar:v2.7.0-5 |
|
csi-provisioner |
mirantis.azurecr.io/lcm/k8scsi/csi-provisioner:v3.4.1-5 |
|
csi-resizer |
mirantis.azurecr.io/lcm/k8scsi/csi-resizer:v1.7.0-5 |
|
csi-snapshotter |
mirantis.azurecr.io/lcm/k8scsi/csi-snapshotter:v6.2.1-mcc-4 |
|
event-controller Updated |
mirantis.azurecr.io/core/event-controller:1.40.11 |
|
frontend Updated |
mirantis.azurecr.io/core/frontend:1.40.12 |
|
host-os-modules-controller Updated |
mirantis.azurecr.io/core/host-os-modules-controller:1.40.11 |
|
iam-controller Updated |
mirantis.azurecr.io/core/iam-controller:1.40.11 |
|
kaas-exporter Updated |
mirantis.azurecr.io/core/kaas-exporter:1.40.11 |
|
kproxy Updated |
mirantis.azurecr.io/core/kproxy:1.40.11 |
|
lcm-controller Updated |
mirantis.azurecr.io/core/lcm-controller:1.40.11 |
|
license-controller Updated |
mirantis.azurecr.io/core/license-controller:1.40.11 |
|
livenessprobe |
mirantis.azurecr.io/lcm/k8scsi/livenessprobe:v2.9.0-5 |
|
machinepool-controller Updated |
mirantis.azurecr.io/core/machinepool-controller:1.40.11 |
|
mcc-haproxy Updated |
mirantis.azurecr.io/lcm/mcc-haproxy:v0.25.0-37-gc15c97d |
|
mcc-keepalived Updated |
mirantis.azurecr.io/lcm/mcc-keepalived:v0.25.0-37-gc15c97d |
|
metrics-server |
mirantis.azurecr.io/lcm/metrics-server-amd64:v0.6.3-7 |
|
nginx Updated |
mirantis.azurecr.io/core/external/nginx:1.40.11 |
|
openstack-cloud-controller-manager |
mirantis.azurecr.io/lcm/kubernetes/openstack-cloud-controller-manager:v1.27.2-16 |
|
openstack-cluster-api-controller Updated |
mirantis.azurecr.io/core/openstack-cluster-api-controller:1.40.11 |
|
os-credentials-controller Updated |
mirantis.azurecr.io/core/os-credentials-controller:1.40.11 |
|
policy-controller Updated |
mirantis.azurecr.io/core/policy-controller:1.40.11 |
|
portforward-controller Updated |
mirantis.azurecr.io/core/portforward-controller:1.40.11 |
|
proxy-controller Removed |
n/a |
|
rbac-controller Updated |
mirantis.azurecr.io/core/rbac-controller:1.40.11 |
|
registry |
mirantis.azurecr.io/lcm/registry:v2.8.1-9 |
|
release-controller Updated |
mirantis.azurecr.io/core/release-controller:1.40.11 |
|
rhellicense-controller Removed |
n/a |
|
scope-controller Updated |
mirantis.azurecr.io/core/scope-controller:1.40.11 |
|
secret-controller New |
mirantis.azurecr.io/core/secret-controller:1.40.11 |
|
squid-proxy |
mirantis.azurecr.io/lcm/squid-proxy:0.0.1-10-g24a0d69 |
|
user-controller Updated |
mirantis.azurecr.io/core/user-controller:1.40.11 |
|
vsphere-cloud-controller-manager |
mirantis.azurecr.io/lcm/kubernetes/vsphere-cloud-controller-manager:v1.27.0-6 |
|
vsphere-cluster-api-controller Updated |
mirantis.azurecr.io/core/vsphere-cluster-api-controller:1.40.11 |
|
vsphere-credentials-controller Updated |
mirantis.azurecr.io/core/vsphere-credentials-controller:1.40.11 |
|
vsphere-csi-driver |
mirantis.azurecr.io/lcm/kubernetes/vsphere-csi-driver:v3.0.2-1 |
|
vsphere-csi-syncer |
mirantis.azurecr.io/lcm/kubernetes/vsphere-csi-syncer:v3.0.2-1 |
|
vsphere-vm-template-controller Updated |
mirantis.azurecr.io/core/vsphere-vm-template-controller:1.40.11 |
Artifact |
Component |
Path |
|---|---|---|
Binaries |
hash-generate-darwin |
http://binary.mirantis.com/iam/bin/hash-generate-0.0.1-268-3cf7f17-darwin |
hash-generate-linux |
http://binary.mirantis.com/iam/bin/hash-generate-0.0.1-268-3cf7f17-linux |
|
Helm charts Updated |
iam |
|
Docker images |
kubectl |
mirantis.azurecr.io/stacklight/kubectl:1.22-20240501023013 |
kubernetes-entrypoint |
mirantis.azurecr.io/openstack/extra/kubernetes-entrypoint:v1.0.1-ba8ada4-20240405150338 |
|
mariadb |
mirantis.azurecr.io/general/mariadb:10.6.17-focal-20240523075821 |
|
mcc-keycloak Updated |
mirantis.azurecr.io/iam/mcc-keycloak:24.0.3-20240527150505 |
In total, since Container Cloud 2.26.0, in 2.27.0, 408 Common Vulnerabilities and Exposures (CVE) have been fixed: 26 of critical and 382 of high severity.
The table below includes the total numbers of addressed unique and common vulnerabilities and exposures (CVE) by product component since the 2.26.5 patch release. The common CVEs are issues addressed across several images.
Product component |
CVE type |
Critical |
High |
Total |
|---|---|---|---|---|
Kaas core |
Unique |
0 |
7 |
7 |
Common |
0 |
13 |
13 |
|
StackLight |
Unique |
4 |
14 |
18 |
Common |
4 |
25 |
29 |
Mirantis Security Portal
For the detailed list of fixed and existing CVEs across the Mirantis Container Cloud and MOSK products, refer to Mirantis Security Portal.
MOSK CVEs
For the number of fixed CVEs in the MOSK-related components including OpenStack and Tungsten Fabric, refer to MOSK 24.2: Security notes.
This section describes the specific actions you as a cloud operator need to complete before or after your Container Cloud cluster update to the Cluster releases 17.2.0 or 16.2.0.
Consider this information as a supplement to the generic update procedures published in Operations Guide: Automatic upgrade of a management cluster and Update a managed cluster.
Starting from Container Cloud 2.26.5, Mirantis introduces a new update scheme allowing for the update path flexibility. For details, see Patch update schemes before and since 2.26.5. For details on MOSK update scheme, refer to MOSK Update notes.
For those clusters that update between only major versions, the update scheme remains unchaged.
Caution
In Container Cloud patch releases 2.27.1 and 2.27.2, only the 16.2.x patch Cluster releases will be delivered with an automatic update of management clusters and the possibility to update non-MOSK managed clusters.
In parallel, 2.27.1 and 2.27.2 will include new 16.1.x and 17.1.x patches for MOSK 24.1.x. And the first 17.2.x patch Cluster release for MOSK 24.2.x will be delivered in 2.27.3. For details, see MOSK documentation: Update path for 24.1 and 24.2 series.
Note
If you have already completed the below procedure after updating your clusters to Container Cloud 2.26.0 (Cluster releases 17.1.0 or 16.1.0), skip this subsection.
Container Cloud 2.26.0 introduced the bird daemon update from v1.6.8
to v2.0.7 on master nodes if BGP is used for BGP announcement of the cluster
API load balancer address.
Configuration files for bird v1.x are not fully compatible with those for
bird v2.x. Therefore, if you used BGP announcement of cluster API LB address
on a deployment based on Cluster releases 17.0.0 or 16.0.0, update bird
configuration files to fit bird v2.x using configuration examples provided in
the API Reference: MultirRackCluster section.
Note
If you have already completed the below procedure after updating your clusters to Container Cloud 2.26.0 (Cluster releases 17.1.0 or 16.1.0), skip this subsection.
To prevent underused or overused storage space, review your storage space parameters for OpenSearch on the StackLight cluster:
Review the value of
elasticsearch.persistentVolumeClaimSizeand the real storage available on volumes.Decide whether you have to additionally set
elasticsearch.persistentVolumeUsableStorageSizeGB.
For both parameters description, see MOSK Operations Guide: StackLight configuration parameters - OpenSearch.
Note
If you do not use Ceph metrics in any customizations, for example, custom alerts, Grafana dashboards, or queries in custom workloads, skip this section.
After deprecating the performance metric exporter that is integrated into the Ceph Manager daemon for the sake of the dedicated Ceph Exporter daemon in Container Cloud 2.27.0, you may need to prepare for updating values of several labels in Ceph metrics if you use them in any customizations such as custom alerts, Grafana dashboards, or queries in custom tools. These labels will be changed in Container Cloud 2.28.0 (Cluster releases 16.3.0 and 17.3.0).
Note
Names of metrics will not be changed, no metrics will be removed.
All Ceph metrics to be collected by the Ceph Exporter daemon will change their
labels job and instance due to scraping metrics from new Ceph Exporter
daemon instead of the performance metric exporter of Ceph Manager:
Values of the
joblabels will be changed fromrook-ceph-mgrtoprometheus-rook-exporterfor all Ceph metrics moved to Ceph Exporter. The full list of moved metrics is presented below.Values of the
instancelabels will be changed from the metric endpoint of Ceph Manager with port9283to the metric endpoint of Ceph Exporter with port9926for all Ceph metrics moved to Ceph Exporter. The full list of moved metrics is presented below.Values of the
instance_idlabels of Ceph metrics from the RADOS Gateway (RGW) daemons will be changed from the daemon GID to the daemon subname. For example, instead ofinstance_id="<RGW_PROCESS_GID>", theinstance_id="a"(ceph_rgw_qlen{instance_id="a"}) will be used. The list of moved Ceph RGW metrics is presented below.
List of affected Ceph RGW metrics
ceph_rgw_cache_.*ceph_rgw_failed_reqceph_rgw_gc_retire_objectceph_rgw_get.*ceph_rgw_keystone_.*ceph_rgw_lc_.*ceph_rgw_lua_.*ceph_rgw_pubsub_.*ceph_rgw_put.*ceph_rgw_qactiveceph_rgw_qlenceph_rgw_req
List of all metrics to be collected by Ceph Exporter instead of
Ceph Manager
ceph_bluefs_.*ceph_bluestore_.*ceph_mds_cache_.*ceph_mds_capsceph_mds_ceph_.*ceph_mds_dir_.*ceph_mds_exported_inodesceph_mds_forwardceph_mds_handle_.*ceph_mds_imported_inodesceph_mds_inodes.*ceph_mds_load_centceph_mds_log_.*ceph_mds_mem_.*ceph_mds_openino_dir_fetchceph_mds_process_request_cap_releaseceph_mds_reply_.*ceph_mds_requestceph_mds_root_.*ceph_mds_server_.*ceph_mds_sessions_.*ceph_mds_slow_replyceph_mds_subtreesceph_mon_election_.*ceph_mon_num_.*ceph_mon_session_.*ceph_objecter_.*ceph_osd_numpg.*ceph_osd_op.*ceph_osd_recovery_.*ceph_osd_stat_.*ceph_paxos.*ceph_prioritycache.*ceph_purge.*ceph_rgw_cache_.*ceph_rgw_failed_reqceph_rgw_gc_retire_objectceph_rgw_get.*ceph_rgw_keystone_.*ceph_rgw_lc_.*ceph_rgw_lua_.*ceph_rgw_pubsub_.*ceph_rgw_put.*ceph_rgw_qactiveceph_rgw_qlenceph_rgw_reqceph_rocksdb_.*
The Container Cloud patch release 2.26.5, which is based on the 2.26.0 major release, provides the following updates:
Support for the patch Cluster releases 16.1.5 and 17.1.5 that represents Mirantis OpenStack for Kubernetes (MOSK) patch release 24.1.5 patch.
Bare metal: update of Ubuntu mirror from 20.04~20240502102020 to 20.04~20240517090228 along with update of minor kernel version from 5.15.0-105-generic to 5.15.0-107-generic.
Security fixes for CVEs in images.
Bug fixes.
This patch release also supports the latest major Cluster releases 17.1.0 and 16.1.0. And it does not support greenfield deployments based on deprecated Cluster releases. Use the latest available Cluster release instead.
For main deliverables of the parent Container Cloud release of 2.26.5, refer to 2.26.0.
The table below includes the total numbers of addressed unique and common CVEs in images by product component since the Container Cloud 2.26.4 patch release. The common CVEs are issues addressed across several images.
Product component |
CVE type |
Critical |
High |
Total |
|---|---|---|---|---|
Ceph |
Unique |
0 |
1 |
1 |
Common |
0 |
3 |
3 |
|
Kaas core |
Unique |
0 |
5 |
5 |
Common |
0 |
12 |
12 |
|
StackLight |
Unique |
1 |
3 |
4 |
Common |
2 |
6 |
8 |
Mirantis Security Portal
For the detailed list of fixed and existing CVEs across the Mirantis Container Cloud and MOSK products, refer to Mirantis Security Portal.
MOSK CVEs
For the number of fixed CVEs in the MOSK-related components including OpenStack and Tungsten Fabric, refer to MOSK 24.1.5: Security notes.
The following issues have been addressed in the Container Cloud patch release 2.26.5 along with the patch Cluster releases 17.1.5 and 16.1.5.
[42408] [bare metal] Fixed the issue with old versions of system packages, including kernel, remaining on the manager nodes after cluster update.
[41540] [LCM] Fixed the issue with
lcm-agentfailing to grab storage information on a host and leavinglcmmachine.status.hostinfo.hardwareempty due to issues with managing physical NVME devices.
This section lists known issues with workarounds for the Mirantis Container Cloud release 2.26.4 including the Cluster releases 17.1.5 and 16.1.5.
For other issues that can occur while deploying and operating a Container Cloud cluster, see Troubleshooting Guide.
Note
This section also outlines still valid known issues from previous Container Cloud releases.
Fixed in 2.28.0 (17.3.0 and 16.3.0)
When trying to list the HostOSConfigurationModules and HostOSConfiguration custom resources, serviceuser or a user with
the global-admin or operator role obtains the access denied error.
For example:
kubectl --kubeconfig ~/.kube/mgmt-config get hocm
Error from server (Forbidden): hostosconfigurationmodules.kaas.mirantis.com is forbidden:
User "2d74348b-5669-4c65-af31-6c05dbedac5f" cannot list resource "hostosconfigurationmodules"
in API group "kaas.mirantis.com" at the cluster scope: access denied
Workaround:
Modify the
global-adminrole by adding a new entry with the following contents to theruleslist:kubectl edit clusterroles kaas-global-admin
- apiGroups: [kaas.mirantis.com] resources: [hostosconfigurationmodules] verbs: ['*']
For each Container Cloud project, modify the
kaas-operatorrole by adding a new entry with the following contents to theruleslist:kubectl -n <projectName> edit roles kaas-operator
- apiGroups: [kaas.mirantis.com] resources: [hostosconfigurations] verbs: ['*']
Due to the MetalLB upstream issue, a load balancer service may not obtain the external IP address.
The issue occurs when two services share the same external IP address and have
the same externalTrafficPolicy value. Initially, the services have the
external IP address assigned and are accessible. After modifying the
externalTrafficPolicy value for both services from Cluster to
Local, the first service that has been changed remains with no external IP
address assigned. Though, the second service, which was changed later, has the
external IP assigned as expected.
To work around the issue, make a dummy change to the service object where
external IP is <pending>:
Identify the service that is stuck:
kubectl get svc -A | grep pending
Example of system response:
stacklight iam-proxy-prometheus LoadBalancer 10.233.28.196 <pending> 443:30430/TCP
Add an arbitrary label to the service that is stuck. For example:
kubectl label svc -n stacklight iam-proxy-prometheus reconcile=1
Example of system response:
service/iam-proxy-prometheus labeledVerify that the external IP was allocated to the service:
kubectl get svc -n stacklight iam-proxy-prometheus
Example of system response:
NAME TYPE CLUSTER-IP EXTERNAL-IP PORT(S) AGE iam-proxy-prometheus LoadBalancer 10.233.28.196 10.0.34.108 443:30430/TCP 12d
Fixed in 2.28.0 (17.3.0 and 16.3.0)
After node maintenance of a management cluster, the newly added nodes may fail to undergo provisioning successfully. The issue relates to new nodes that are in the same L2 domain as the management cluster.
The issue was observed on environments having management cluster nodes configured with a single L2 segment used for all network traffic (PXE and LCM/management networks).
To verify whether the cluster is affected:
Verify whether the dnsmasq and dhcp-relay pods run on the same node
in the management cluster:
kubectl -n kaas get pods -o wide| grep -e "dhcp\|dnsmasq"
Example of system response:
dhcp-relay-7d85f75f76-5vdw2 2/2 Running 2 (36h ago) 36h 10.10.0.122 kaas-node-8a24b81c-76d0-4d4c-8421-962bd39df5ad <none> <none>
dnsmasq-8f4b484b4-slhbd 5/5 Running 1 (36h ago) 36h 10.233.123.75 kaas-node-8a24b81c-76d0-4d4c-8421-962bd39df5ad <none> <none>
If this is the case, proceed to the workaround below.
Workaround:
Log in to a node that contains
kubeconfigof the affected management cluster.Make sure that at least two management cluster nodes are schedulable:
kubectl get node
Example of a positive system response:
NAME STATUS ROLES AGE VERSION kaas-node-bcedb87b-b3ce-46a4-a4ca-ea3068689e40 Ready master 37h v1.27.10-mirantis-1 kaas-node-8a24b81c-76d0-4d4c-8421-962bd39df5ad Ready master 37h v1.27.10-mirantis-1 kaas-node-ad5a6f51-b98f-43c3-91d5-55fed3d0ff21 Ready master 37h v1.27.10-mirantis-1
Delete the
dhcp-relaypod:kubectl -n kaas delete pod <dhcp-relay-xxxxx>
Verify that the
dnsmasqanddhcp-relaypods are scheduled into different nodes:kubectl -n kaas get pods -o wide| grep -e "dhcp\|dnsmasq"
Example of a positive system response:
dhcp-relay-7d85f75f76-rkv03 2/2 Running 0 49s 10.10.0.121 kaas-node-bcedb87b-b3ce-46a4-a4ca-ea3068689e40 <none> <none> dnsmasq-8f4b484b4-slhbd 5/5 Running 1 (37h ago) 37h 10.233.123.75 kaas-node-8a24b81c-76d0-4d4c-8421-962bd39df5ad <none> <none>
During deletion of a manager machine running the ironic Pod from a bare
metal management cluster, the following problems occur:
All Pods are stuck in the
TerminatingstateA new
ironicPod fails to startThe related bare metal host is stuck in the
deprovisioningstate
As a workaround, before deletion of the node running the ironic Pod,
cordon and drain the node using the kubectl cordon <nodeName> and
kubectl drain <nodeName> commands.
Fixed in 2.29.0 (17.4.0 and 16.4.0)
During the replacement of a master node on a cluster of any type, the process
may get stuck with Kubelet's NodeReady condition is Unknown in the
machine status on the remaining master nodes.
As a workaround, log in on the affected node and run the following command:
docker restart ucp-kubelet
During MariaDB operations on a management cluster, Pods may get stuck in continuous restarts with the following example error:
[ERROR] WSREP: Corrupt buffer header: \
addr: 0x7faec6f8e518, \
seqno: 3185219421952815104, \
size: 909455917, \
ctx: 0x557094f65038, \
flags: 11577. store: 49, \
type: 49
Workaround:
Create a backup of the
/var/lib/mysqldirectory on themariadb-serverPod.Verify that other replicas are up and ready.
Remove the
galera.cachefile for the affectedmariadb-serverPod.Remove the affected
mariadb-serverPod or wait until it is automatically restarted.
After Kubernetes restarts the Pod, the Pod clones the database in 1-2 minutes and restores the quorum.
Fixed in 2.28.4 (17.3.4 and 16.3.4)
During replacement of a master node on a cluster of any type, the
calico-node Pod fails to start on a new node that has the same IP address
as the node being replaced.
Workaround:
Log in to any
masternode.From a CLI with an MKE client bundle, create a shell alias to start calicoctl using the
mirantis/ucp-dsinfoimage:alias calicoctl="\ docker run -i --rm \ --pid host \ --net host \ -e constraint:ostype==linux \ -e ETCD_ENDPOINTS=<etcdEndpoint> \ -e ETCD_KEY_FILE=/var/lib/docker/volumes/ucp-kv-certs/_data/key.pem \ -e ETCD_CA_CERT_FILE=/var/lib/docker/volumes/ucp-kv-certs/_data/ca.pem \ -e ETCD_CERT_FILE=/var/lib/docker/volumes/ucp-kv-certs/_data/cert.pem \ -v /var/run/calico:/var/run/calico \ -v /var/lib/docker/volumes/ucp-kv-certs/_data:/var/lib/docker/volumes/ucp-kv-certs/_data:ro \ mirantis/ucp-dsinfo:<mkeVersion> \ calicoctl \ "
alias calicoctl="\ docker run -i --rm \ --pid host \ --net host \ -e constraint:ostype==linux \ -e ETCD_ENDPOINTS=<etcdEndpoint> \ -e ETCD_KEY_FILE=/ucp-node-certs/key.pem \ -e ETCD_CA_CERT_FILE=/ucp-node-certs/ca.pem \ -e ETCD_CERT_FILE=/ucp-node-certs/cert.pem \ -v /var/run/calico:/var/run/calico \ -v ucp-node-certs:/ucp-node-certs:ro \ mirantis/ucp-dsinfo:<mkeVersion> \ calicoctl --allow-version-mismatch \ "
In the above command, replace the following values with the corresponding settings of the affected cluster:
<etcdEndpoint>is the etcd endpoint defined in the Calico configuration file. For example,ETCD_ENDPOINTS=127.0.0.1:12378<mkeVersion>is the MKE version installed on your cluster. For example,mirantis/ucp-dsinfo:3.5.7.
Verify the node list on the cluster:
kubectl get node
Compare this list with the node list in Calico to identify the old node:
calicoctl get node -o wide
Remove the old node from Calico:
calicoctl delete node kaas-node-<nodeID>
Fixed in 2.28.4 (17.3.4 and 16.3.4)
During replacement of a manager machine, the following problems may occur:
The system adds the node to Docker swarm but not to Kubernetes
The node
Deploymentgets stuck with failed RethinkDB health checks
Workaround:
Delete the failed node.
Wait for the MKE cluster to become healthy. To monitor the cluster status:
Log in to the MKE web UI.
Monitor the cluster status as described in MKE Operations Guide: Monitor an MKE cluster with the MKE web UI.
Deploy a new node.
Fixed in 2.28.4 (17.3.4 and 16.3.4)
During the unsafe or forced deletion of a manager machine running the
calico-kube-controllers Pod in the kube-system namespace,
the following issues occur:
The
calico-kube-controllersPod fails to clean up resources associated with the deleted nodeThe
calico-nodePod may fail to start up on a newly created node if the machine is provisioned with the same IP address as the deleted machine had
As a workaround, before deletion of the node running the
calico-kube-controllers Pod, cordon and drain the node:
kubectl cordon <nodeName>
kubectl drain <nodeName>
Fixed in 2.27.0 (17.2.0 and 16.2.0)
During graceful reboot of a cluster with Ceph enabled, the reboot is blocked
with the following message in the MiraCephMaintenance object status:
message: ClusterMaintenanceRequest found, Ceph Cluster is not ready to upgrade,
delaying cluster maintenance
As a workaround, add the following snippet to the cephFS section under
metadataServer in the spec section of <kcc-name>.yaml in the Ceph
cluster:
cephClusterSpec:
sharedFilesystem:
cephFS:
- name: cephfs-store
metadataServer:
activeCount: 1
healthCheck:
livenessProbe:
probe:
failureThreshold: 5
initialDelaySeconds: 30
periodSeconds: 30
successThreshold: 1
timeoutSeconds: 5
Note
The issue does not reproduce since MOSK 25.2.
Update of a managed cluster based on bare metal and Ceph enabled fails with
PersistentVolumeClaim getting stuck in the Pending state for the
prometheus-server StatefulSet and the
MountVolume.MountDevice failed for volume warning in the StackLight event
logs.
Workaround:
Verify that the description of the Pods that failed to run contain the
FailedMountevents:kubectl -n <affectedProjectName> describe pod <affectedPodName>
In the command above, replace the following values:
<affectedProjectName>is the Container Cloud project name where the Pods failed to run<affectedPodName>is a Pod name that failed to run in the specified project
In the Pod description, identify the node name where the Pod failed to run.
Verify that the
csi-rbdpluginlogs of the affected node contain therbd volume mount failed: <csi-vol-uuid> is being usederror. The<csi-vol-uuid>is a unique RBD volume name.Identify
csiPodNameof the correspondingcsi-rbdplugin:kubectl -n rook-ceph get pod -l app=csi-rbdplugin \ -o jsonpath='{.items[?(@.spec.nodeName == "<nodeName>")].metadata.name}'
Output the affected
csiPodNamelogs:kubectl -n rook-ceph logs <csiPodName> -c csi-rbdplugin
Scale down the affected
StatefulSetorDeploymentof the Pod that fails to0replicas.On every
csi-rbdpluginPod, search for stuckcsi-vol:for pod in `kubectl -n rook-ceph get pods|grep rbdplugin|grep -v provisioner|awk '{print $1}'`; do echo $pod kubectl exec -it -n rook-ceph $pod -c csi-rbdplugin -- rbd device list | grep <csi-vol-uuid> done
Unmap the affected
csi-vol:rbd unmap -o force /dev/rbd<i>
The
/dev/rbd<i>value is a mapped RBD volume that usescsi-vol.Delete
volumeattachmentof the affected Pod:kubectl get volumeattachments | grep <csi-vol-uuid> kubectl delete volumeattacmhent <id>
Scale up the affected
StatefulSetorDeploymentback to the original number of replicas and wait until its state becomesRunning.
Fixed in 17.2.0, 16.2.0, 17.1.6, 16.1.6
On large managed clusters, shard relocation may fail in the OpenSearch cluster
with the yellow or red status of the OpenSearch cluster.
The characteristic symptom of the issue is that in the stacklight
namespace, the statefulset.apps/opensearch-master containers are
experiencing throttling with the KubeContainersCPUThrottlingHigh alert
firing for the following set of labels:
{created_by_kind="StatefulSet",created_by_name="opensearch-master",namespace="stacklight"}
Caution
The throttling that OpenSearch is experiencing may be a temporary situation, which may be related, for example, to a peaky load and the ongoing shards initialization as part of disaster recovery or after node restart. In this case, Mirantis recommends waiting until initialization of all shards is finished. After that, verify the cluster state and whether throttling still exists. And only if throttling does not disappear, apply the workaround below.
To verify that the initialization of shards is ongoing:
kubectl exec -it pod/opensearch-master-0 -n stacklight -c opensearch -- bash
curl "http://localhost:9200/_cat/shards" | grep INITIALIZING
Example of system response:
.ds-system-000072 2 r INITIALIZING 10.232.182.135 opensearch-master-1
.ds-system-000073 1 r INITIALIZING 10.232.7.145 opensearch-master-2
.ds-system-000073 2 r INITIALIZING 10.232.182.135 opensearch-master-1
.ds-audit-000001 2 r INITIALIZING 10.232.7.145 opensearch-master-2
The system response above indicates that shards from the
.ds-system-000072, .ds-system-000073, and .ds-audit-000001
indicies are in the INITIALIZING state. In this case, Mirantis
recommends waiting until this process is finished, and only then consider
changing the limit.
You can additionally analyze the exact level of throttling and the current CPU usage on the Kubernetes Containers dashboard in Grafana.
Workaround:
Verify the currently configured CPU requests and limits for the
opensearchcontainers:kubectl -n stacklight get statefulset.apps/opensearch-master -o jsonpath="{.spec.template.spec.containers[?(@.name=='opensearch')].resources}"
Example of system response:
{"limits":{"cpu":"600m","memory":"8Gi"},"requests":{"cpu":"500m","memory":"6Gi"}}
In the example above, the CPU request is
500mand the CPU limit is600m.Increase the CPU limit to a reasonably high number.
For example, the default CPU limit for the clusters with the
clusterSize:largeparameter set was increased from8000mto12000mfor StackLight in Container Cloud 2.27.0 (Cluster releases 17.2.0 and 16.2.0).Note
For details, on the
clusterSizeparameter, see MOSK Operations Guide: StackLight configuration parameters - Cluster size.If the defaults are already overridden on the affected cluster using the
resourcesPerClusterSizeorresourcesparameters as described in MOSK Operations Guide: StackLight configuration parameters - Resource limits, then the exact recommended number depends on the currently set limit.Mirantis recommends increasing the limit by 50%. If it does not resolve the issue, another increase iteration will be required.
When you select the required CPU limit, increase it as described in MOSK Operations Guide: StackLight configuration parameters - Resource limits.
If the CPU limit for the
opensearchcomponent is already set, increase it in theClusterobject for theopensearchparameter. Otherwise, the default StackLight limit is used. In this case, increase the CPU limit for theopensearchcomponent using theresourcesparameter.Wait until all
opensearch-masterpods are recreated with the new CPU limits and becomerunningandready.To verify the current CPU limit for every
opensearchcontainer in everyopensearch-masterpod separately:kubectl -n stacklight get pod/opensearch-master-<podSuffixNumber> -o jsonpath="{.spec.containers[?(@.name=='opensearch')].resources}"
In the command above, replace
<podSuffixNumber>with the name of the pod suffix. For example,pod/opensearch-master-0orpod/opensearch-master-2.Example of system response:
{"limits":{"cpu":"900m","memory":"8Gi"},"requests":{"cpu":"500m","memory":"6Gi"}}
The waiting time may take up to 20 minutes depending on the cluster size.
If the issue is fixed, the KubeContainersCPUThrottlingHigh alert stops
firing immediately, while OpenSearchClusterStatusWarning or
OpenSearchClusterStatusCritical can still be firing for some time during
shard relocation.
If the KubeContainersCPUThrottlingHigh alert is still firing, proceed with
another iteration of the CPU limit increase.
Fixed in 17.2.0, 16.2.0, 17.1.6, 16.1.6
While updating rollover_policy for the current system* and audit*
data streams, the update is not applied to indices.
One of indicators that the cluster is most likely affected is the
KubeJobFailed alert firing for the elasticsearch-curator job and one or
both of the following errors being present in elasticsearch-curator pods
that remain in the Error status:
2024-05-31 13:16:04,459 ERROR Failed to complete action: delete_indices. <class 'curator.exceptions.FailedExecution'>: Exception encountered. Rerun with loglevel DEBUG and/or check Elasticsearch logs for more information. Exception: RequestError(400, 'illegal_argument_exception', 'index [.ds-audit-000001] is the write index for data stream [audit] and cannot be deleted')
or
2024-05-31 13:16:04,459 ERROR Failed to complete action: delete_indices. <class 'curator.exceptions.FailedExecution'>: Exception encountered. Rerun with loglevel DEBUG and/or check Elasticsearch logs for more information. Exception: RequestError(400, 'illegal_argument_exception', 'index [.ds-system-000001] is the write index for data stream [system] and cannot be deleted')
Note
Instead of .ds-audit-000001 or .ds-system-000001 index names,
similar names can be present with the same prefix but different suffix
numbers.
If the above mentioned alert and errors are present, an immediate action is required, because it indicates that the corresponding index size has already exceeded the space allocated for the index.
To verify that the cluster is affected:
Caution
Verify and apply the workaround to both index patterns, system and audit, separately.
If one of indices is affected, the second one is most likely affected as well. Although in rare cases, only one index may be affected.
Log in to the
opensearch-master-0Pod:kubectl exec -it pod/opensearch-master-0 -n stacklight -c opensearch -- bash
Verify that the rollover policy is present:
system:curl localhost:9200/_plugins/_ism/policies/system_rollover_policyaudit:curl localhost:9200/_plugins/_ism/policies/audit_rollover_policy
The cluster is affected if the rollover policy is missing. Otherwise, proceed to the following step.
Verify the system response from the previous step. For example:
{"_id":"system_rollover_policy","_version":7229,"_seq_no":42362,"_primary_term":28,"policy":{"policy_id":"system_rollover_policy","description":"system index rollover policy.","last_updated_time":1708505222430,"schema_version":19,"error_notification":null,"default_state":"rollover","states":[{"name":"rollover","actions":[{"retry":{"count":3,"backoff":"exponential","delay":"1m"},"rollover":{"min_size":"14746mb","copy_alias":false}}],"transitions":[]}],"ism_template":[{"index_patterns":["system*"],"priority":200,"last_updated_time":1708505222430}]}}
Verify and capture the following items separately for every policy:
The
_seq_noand_primary_termvaluesThe rollover policy threshold, which is defined in
policy.states[0].actions[0].rollover.min_size
List indices:
system:curl localhost:9200/_cat/indices | grep system
Example of system response:
[...] green open .ds-system-000001 FjglnZlcTKKfKNbosaE9Aw 2 1 1998295 0 1gb 507.9mb
audit:curl localhost:9200/_cat/indices | grep audit
Example of system response:
[...] green open .ds-audit-000001 FjglnZlcTKKfKNbosaE9Aw 2 1 1998295 0 1gb 507.9mb
Select the index with the highest number and verify the rollover policy attached to the index:
system:curl localhost:9200/_plugins/_ism/explain/.ds-system-000001audit:curl localhost:9200/_plugins/_ism/explain/.ds-audit-000001If the rollover policy is not attached, the cluster is affected.
If the rollover policy is attached but
_seq_noand_primary_termnumbers do not match the previously captured ones, the cluster is affected.If the index size drastically exceeds the defined threshold of the rollover policy (which is the previously captured
min_size), the cluster is most probably affected.
Workaround:
Log in to the
opensearch-master-0Pod:kubectl exec -it pod/opensearch-master-0 -n stacklight -c opensearch -- bash
If the policy is attached to the index but has different
_seq_noand_primary_term, remove the policy from the index:Note
Use the index with the highest number in the name, which was captured during verification procedure.
system:curl -XPOST localhost:9200/_plugins/_ism/remove/.ds-system-000001
audit:curl -XPOST localhost:9200/_plugins/_ism/remove/.ds-audit-000001
Re-add the policy:
system:curl -XPOST -H "Content-type: application/json" localhost:9200/_plugins/_ism/add/system* -d'{"policy_id":"system_rollover_policy"}'
audit:curl -XPOST -H "Content-type: application/json" localhost:9200/_plugins/_ism/add/audit* -d'{"policy_id":"audit_rollover_policy"}'
Perform again the last step of the cluster verification procedure provided above and make sure that the policy is attached to the index and has the same
_seq_noand_primary_term.If the index size drastically exceeds the defined threshold of the rollover policy (which is the previously captured
min_size), wait up to 15 minutes and verify that the additional index is created with the consecutive number in the index name. For example:system: if you applied changes to.ds-system-000001, wait until.ds-system-000002is created.audit: if you applied changes to.ds-audit-000001, wait until.ds-audit-000002is created.
If such index is not created, escalate the issue to Mirantis support.
This section describes the specific actions you as a cloud operator need to complete before or after your Container Cloud cluster update to the Cluster releases 17.1.5 or 16.1.5.
Consider this information as a supplement to the generic update procedures published in Operations Guide: Automatic upgrade of a management cluster and Update a managed cluster.
To improve user update experience and make the update path more flexible, Container Cloud is introducing a new scheme of updating between patch Cluster releases. More specifically, Container Cloud intends to ultimately provide a possibility to update to any newer patch version within single series at any point of time. The patch version downgrade is not supported.
Though, in some cases, Mirantis may request to update to some specific patch version in the series to be able to update to the next major series. This may be necessary due to the specifics of technical content already released or planned for the release. For possible update paths in MOSK in 24.1 and 24.2 series, see MOSK documentation: Cluster update scheme.
The exact number of patch releases for the 16.1.x and 17.1.x series is yet to be confirmed, but the current target is 7 releases.
Note
The management cluster update scheme remains the same. A management cluster obtains the new product version automatically after release.
See also
MOSK documentation:
If you use the HostOSConfiguration and HostOSConfigurationModules
custom resources for the bare metal provider, which are available in the
Technology Preview scope in Container Cloud 2.26.x, delete all
HostOSConfiguration objects right after update of your managed cluster to
the Cluster release 17.1.5 or 16.1.5, before automatic upgrade of the
management cluster to Container Cloud 2.27.0 (Cluster release 16.2.0).
After the upgrade, you can recreate the required objects using the updated
parameters.
This precautionary step prevents re-processing and re-applying of existing
configuration, which is defined in HostOSConfiguration objects, during
management cluster upgrade to 2.27.0. Such behavior is caused by changes in
the HostOSConfiguration API introduced in 2.27.0.
Note
Skip this procedure if you have already completed it after updating your managed cluster to Container Cloud 2.26.4 (Cluster release 17.1.4 or 16.1.4).
After the MKE update to 3.7.8, if you are going to enable or already enabled Kubernetes auditing and profiling on your managed or management cluster, keep in mind that enabling audit log rotation requires an additional step. Set the following options in the MKE configuration file after enabling auditing and profiling:
[cluster_config]
kube_api_server_audit_log_maxage=30
kube_api_server_audit_log_maxbackup=10
kube_api_server_audit_log_maxsize=10
For the configuration procedure, see MKE documentation: Configure an existing MKE cluster.
While using this procedure, replace the command to upload the newly edited MKE configuration file with the following one:
curl --silent --insecure -X PUT -H "X-UCP-Allow-Restricted-API: i-solemnly-swear-i-am-up-to-no-good" -H "accept: application/toml" -H "Authorization: Bearer $AUTHTOKEN" --upload-file 'mke-config.toml' https://$MKE_HOST/api/ucp/config-toml
The value for
MKE_HOSThas the<loadBalancerHost>:6443format, whereloadBalancerHostis the corresponding field in the cluster status.The value for
MKE_PASSWORDis taken from theucp-admin-password-<clusterName>secret in the cluster namespace of the management cluster.The value for
MKE_USERNAMEis alwaysadmin.
This section lists the artifacts of components included in the Container Cloud patch release 2.26.5. For artifacts of the Cluster releases introduced in 2.26.5, see patch Cluster releases 17.1.5 and 16.1.5.
Note
The components that are newly added, updated, deprecated, or removed
as compared to the previous release version, are marked
with a corresponding superscript,
for example, lcm-ansible Updated.
Artifact |
Component |
Path |
|---|---|---|
Binaries Updated |
ironic-python-agent.initramfs |
https://binary.mirantis.com/bm/bin/ironic/ipa/ubuntu/initramfs-yoga-focal-debug-20240517093708 |
ironic-python-agent.kernel |
https://binary.mirantis.com/bm/bin/ironic/ipa/ubuntu/kernel-yoga-focal-debug-20240517093708 |
|
Helm charts Updated |
baremetal-api |
https://binary.mirantis.com/core/helm/baremetal-api-1.39.28.tgz |
baremetal-operator |
https://binary.mirantis.com/core/helm/baremetal-operator-1.39.28.tgz |
|
baremetal-provider |
https://binary.mirantis.com/core/helm/baremetal-provider-1.39.28.tgz |
|
baremetal-public-api |
https://binary.mirantis.com/core/helm/baremetal-public-api-1.39.28.tgz |
|
kaas-ipam |
||
local-volume-provisioner |
https://binary.mirantis.com/core/helm/local-volume-provisioner-1.39.28.tgz |
|
metallb |
||
Docker images |
ambasador Updated |
mirantis.azurecr.io/core/external/nginx:1.39.28 |
baremetal-dnsmasq Updated |
mirantis.azurecr.io/bm/baremetal-dnsmasq:base-2-26-alpine-20240523095922 |
|
baremetal-operator Updated |
mirantis.azurecr.io/bm/baremetal-operator:base-2-26-alpine-20240523095601 |
|
bm-collective |
mirantis.azurecr.io/bm/bm-collective:base-2-26-alpine-20240408142218 |
|
cluster-api-provider-baremetal Updated |
mirantis.azurecr.io/core/cluster-api-provider-baremetal:1.39.28 |
|
ironic Updated |
mirantis.azurecr.io/openstack/ironic:yoga-jammy-20240522120640 |
|
ironic-inspector Updated |
mirantis.azurecr.io/openstack/ironic-inspector:yoga-jammy-20240522120640 |
|
ironic-prometheus-exporter |
mirantis.azurecr.io/stacklight/ironic-prometheus-exporter:0.1-20240117102150 |
|
kaas-ipam |
mirantis.azurecr.io/bm/kaas-ipam:base-2-26-alpine-20240408150853 |
|
kubernetes-entrypoint |
mirantis.azurecr.io/openstack/extra/kubernetes-entrypoint:v1.0.1-ba8ada4-20240405150338 |
|
mariadb Updated |
mirantis.azurecr.io/general/mariadb:10.6.17-focal-20240523075821 |
|
mcc-keepalived |
mirantis.azurecr.io/lcm/mcc-keepalived:v0.24.0-47-gf77368e |
|
metallb-controller |
mirantis.azurecr.io/bm/metallb/controller:v0.13.12-ef4c9453-amd64 |
|
metallb-speaker |
mirantis.azurecr.io/bm/metallb/speaker:v0.13.12-ef4c9453-amd64 |
|
syslog-ng |
mirantis.azurecr.io/bm/syslog-ng:base-alpine-20240129163811 |
Artifact |
Component |
Path |
|---|---|---|
Bootstrap tarball Updated |
bootstrap-darwin |
https://binary.mirantis.com/core/bin/bootstrap-darwin-1.39.28.tgz |
bootstrap-linux |
https://binary.mirantis.com/core/bin/bootstrap-linux-1.39.28.tgz |
|
Helm charts Updated |
admission-controller |
https://binary.mirantis.com/core/helm/admission-controller-1.39.28.tgz |
agent-controller |
https://binary.mirantis.com/core/helm/agent-controller-1.39.28.tgz |
|
byo-credentials-controller |
https://binary.mirantis.com/core/helm/byo-credentials-controller-1.39.28.tgz |
|
byo-provider |
https://binary.mirantis.com/core/helm/byo-provider-1.39.28.tgz |
|
ceph-kcc-controller |
https://binary.mirantis.com/core/helm/ceph-kcc-controller-1.39.28.tgz |
|
cert-manager |
https://binary.mirantis.com/core/helm/cert-manager-1.39.28.tgz |
|
cinder-csi-plugin |
https://binary.mirantis.com/core/helm/cinder-csi-plugin-1.39.28.tgz |
|
client-certificate-controller |
https://binary.mirantis.com/core/helm/client-certificate-controller-1.39.28.tgz |
|
configuration-collector |
https://binary.mirantis.com/core/helm/configuration-collector-1.39.28.tgz |
|
event-controller |
https://binary.mirantis.com/core/helm/event-controller-1.39.28.tgz |
|
host-os-modules-controller |
https://binary.mirantis.com/core/helm/host-os-modules-controller-1.39.28.tgz |
|
iam-controller |
https://binary.mirantis.com/core/helm/iam-controller-1.39.28.tgz |
|
kaas-exporter |
https://binary.mirantis.com/core/helm/kaas-exporter-1.39.28.tgz |
|
kaas-public-api |
https://binary.mirantis.com/core/helm/kaas-public-api-1.39.28.tgz |
|
kaas-ui |
||
lcm-controller |
https://binary.mirantis.com/core/helm/lcm-controller-1.39.28.tgz |
|
license-controller |
https://binary.mirantis.com/core/helm/license-controller-1.39.28.tgz |
|
machinepool-controller |
https://binary.mirantis.com/core/helm/machinepool-controller-1.39.28.tgz |
|
mcc-cache |
||
mcc-cache-warmup |
https://binary.mirantis.com/core/helm/mcc-cache-warmup-1.39.28.tgz |
|
metrics-server |
https://binary.mirantis.com/core/helm/metrics-server-1.39.28.tgz |
|
openstack-cloud-controller-manager |
https://binary.mirantis.com/core/helm/openstack-cloud-controller-manager-1.39.28.tgz |
|
openstack-provider |
https://binary.mirantis.com/core/helm/openstack-provider-1.39.28.tgz |
|
os-credentials-controller |
https://binary.mirantis.com/core/helm/os-credentials-controller-1.39.28.tgz |
|
policy-controller |
https://binary.mirantis.com/core/helm/policy-controller-1.39.28.tgz |
|
portforward-controller |
https://binary.mirantis.com/core/helm/portforward-controller-1.39.28.tgz |
|
proxy-controller |
https://binary.mirantis.com/core/helm/proxy-controller-1.39.28.tgz |
|
rbac-controller |
https://binary.mirantis.com/core/helm/rbac-controller-1.39.28.tgz |
|
release-controller |
https://binary.mirantis.com/core/helm/release-controller-1.39.28.tgz |
|
rhellicense-controller |
https://binary.mirantis.com/core/helm/rhellicense-controller-1.39.28.tgz |
|
scope-controller |
https://binary.mirantis.com/core/helm/scope-controller-1.39.28.tgz |
|
squid-proxy |
https://binary.mirantis.com/core/helm/squid-proxy-1.39.28.tgz |
|
user-controller |
https://binary.mirantis.com/core/helm/user-controller-1.39.28.tgz |
|
vsphere-cloud-controller-manager |
https://binary.mirantis.com/core/helm/vsphere-cloud-controller-manager-1.39.28.tgz |
|
vsphere-credentials-controller |
https://binary.mirantis.com/core/helm/vsphere-credentials-controller-1.39.28.tgz |
|
vsphere-csi-plugin |
https://binary.mirantis.com/core/helm/vsphere-csi-plugin-1.39.28.tgz |
|
vsphere-provider |
https://binary.mirantis.com/core/helm/vsphere-provider-1.39.28.tgz |
|
vsphere-vm-template-controller |
https://binary.mirantis.com/core/helm/vsphere-vm-template-controller-1.39.28.tgz |
|
Docker images |
admission-controller Updated |
mirantis.azurecr.io/core/admission-controller:1.39.28 |
agent-controller Updated |
mirantis.azurecr.io/core/agent-controller:1.39.28 |
|
byo-cluster-api-controller Updated |
mirantis.azurecr.io/core/byo-cluster-api-controller:1.39.28 |
|
byo-credentials-controller Updated |
mirantis.azurecr.io/core/byo-credentials-controller:1.39.28 |
|
ceph-kcc-controller Updated |
mirantis.azurecr.io/core/ceph-kcc-controller:1.39.28 |
|
cert-manager-controller |
mirantis.azurecr.io/core/external/cert-manager-controller:v1.11.0-6 |
|
cinder-csi-plugin |
mirantis.azurecr.io/lcm/kubernetes/cinder-csi-plugin:v1.27.2-16 |
|
client-certificate-controller Updated |
mirantis.azurecr.io/core/client-certificate-controller:1.39.28 |
|
configuration-collector Updated |
mirantis.azurecr.io/core/configuration-collector:1.39.28 |
|
csi-attacher |
mirantis.azurecr.io/lcm/k8scsi/csi-attacher:v4.2.0-5 |
|
csi-node-driver-registrar |
mirantis.azurecr.io/lcm/k8scsi/csi-node-driver-registrar:v2.7.0-5 |
|
csi-provisioner |
mirantis.azurecr.io/lcm/k8scsi/csi-provisioner:v3.4.1-5 |
|
csi-resizer |
mirantis.azurecr.io/lcm/k8scsi/csi-resizer:v1.7.0-5 |
|
csi-snapshotter |
mirantis.azurecr.io/lcm/k8scsi/csi-snapshotter:v6.2.1-mcc-4 |
|
event-controller Updated |
mirantis.azurecr.io/core/event-controller:1.39.28 |
|
frontend Updated |
mirantis.azurecr.io/core/frontend:1.39.28 |
|
host-os-modules-controller Updated |
mirantis.azurecr.io/core/host-os-modules-controller:1.39.28 |
|
iam-controller Updated |
mirantis.azurecr.io/core/iam-controller:1.39.28 |
|
kaas-exporter Updated |
mirantis.azurecr.io/core/kaas-exporter:1.39.28 |
|
kproxy Updated |
mirantis.azurecr.io/core/kproxy:1.39.28 |
|
lcm-controller Updated |
mirantis.azurecr.io/core/lcm-controller:1.39.28 |
|
license-controller Updated |
mirantis.azurecr.io/core/license-controller:1.39.28 |
|
livenessprobe |
mirantis.azurecr.io/lcm/k8scsi/livenessprobe:v2.9.0-5 |
|
machinepool-controller Updated |
mirantis.azurecr.io/core/machinepool-controller:1.39.28 |
|
mcc-haproxy |
mirantis.azurecr.io/lcm/mcc-haproxy:v0.24.0-47-gf77368e |
|
mcc-keepalived |
mirantis.azurecr.io/lcm/mcc-keepalived:v0.24.0-47-gf77368e |
|
metrics-server |
mirantis.azurecr.io/lcm/metrics-server-amd64:v0.6.3-7 |
|
nginx Updated |
mirantis.azurecr.io/core/external/nginx:1.39.28 |
|
openstack-cloud-controller-manager |
mirantis.azurecr.io/lcm/kubernetes/openstack-cloud-controller-manager:v1.27.2-16 |
|
openstack-cluster-api-controller Updated |
mirantis.azurecr.io/core/openstack-cluster-api-controller:1.39.28 |
|
os-credentials-controller Updated |
mirantis.azurecr.io/core/os-credentials-controller:1.39.28 |
|
policy-controller Updated |
mirantis.azurecr.io/core/policy-controller:1.39.28 |
|
portforward-controller Updated |
mirantis.azurecr.io/core/portforward-controller:1.39.28 |
|
proxy-controller Updated |
mirantis.azurecr.io/core/proxy-controller:1.39.28 |
|
rbac-controller Updated |
mirantis.azurecr.io/core/rbac-controller:1.39.28 |
|
registry |
mirantis.azurecr.io/lcm/registry:v2.8.1-9 |
|
release-controller Updated |
mirantis.azurecr.io/core/release-controller:1.39.28 |
|
rhellicense-controller Updated |
mirantis.azurecr.io/core/rhellicense-controller:1.39.28 |
|
scope-controller Updated |
mirantis.azurecr.io/core/scope-controller:1.39.28 |
|
squid-proxy |
mirantis.azurecr.io/lcm/squid-proxy:0.0.1-10-g24a0d69 |
|
user-controller Updated |
mirantis.azurecr.io/core/user-controller:1.39.28 |
|
vsphere-cloud-controller-manager |
mirantis.azurecr.io/lcm/kubernetes/vsphere-cloud-controller-manager:v1.27.0-6 |
|
vsphere-cluster-api-controller Updated |
mirantis.azurecr.io/core/vsphere-cluster-api-controller:1.39.28 |
|
vsphere-credentials-controller Updated |
mirantis.azurecr.io/core/vsphere-credentials-controller:1.39.28 |
|
vsphere-csi-driver |
mirantis.azurecr.io/lcm/kubernetes/vsphere-csi-driver:v3.0.2-1 |
|
vsphere-csi-syncer |
mirantis.azurecr.io/lcm/kubernetes/vsphere-csi-syncer:v3.0.2-1 |
|
vsphere-vm-template-controller Updated |
mirantis.azurecr.io/core/vsphere-vm-template-controller:1.39.28 |
Artifact |
Component |
Path |
|---|---|---|
Binaries |
hash-generate-darwin |
http://binary.mirantis.com/iam/bin/hash-generate-0.0.1-268-3cf7f17-darwin |
hash-generate-linux |
http://binary.mirantis.com/iam/bin/hash-generate-0.0.1-268-3cf7f17-linux |
|
Helm charts |
iam Updated |
|
Docker images |
kubectl |
mirantis.azurecr.io/stacklight/kubectl:1.22-20240501023013 |
kubernetes-entrypoint |
mirantis.azurecr.io/openstack/extra/kubernetes-entrypoint:v1.0.1-ba8ada4-20240405150338 |
|
mariadb Updated |
mirantis.azurecr.io/general/mariadb:10.6.17-focal-20240523075821 |
|
mcc-keycloak |
mirantis.azurecr.io/iam/mcc-keycloak:23.0.6-20240216125244 |
See also
The Container Cloud patch release 2.26.4, which is based on the 2.26.0 major release, provides the following updates:
Support for the patch Cluster releases 16.1.4 and 17.1.4 that represents Mirantis OpenStack for Kubernetes (MOSK) patch release 24.1.4.
Support for MKE 3.7.8.
Bare metal: update of Ubuntu mirror from 20.04~20240411171541 to 20.04~20240502102020 along with update of minor kernel version from 5.15.0-102-generic to 5.15.0-105-generic.
Security fixes for CVEs in images.
Bug fixes.
This patch release also supports the latest major Cluster releases 17.1.0 and 16.1.0. And it does not support greenfield deployments based on deprecated Cluster releases. Use the latest available Cluster release instead.
For main deliverables of the parent Container Cloud release of 2.26.4, refer to 2.26.0.
The table below includes the total numbers of addressed unique and common CVEs in images by product component since the Container Cloud 2.26.3 patch release. The common CVEs are issues addressed across several images.
Product component |
CVE type |
Critical |
High |
Total |
|---|---|---|---|---|
Ceph |
Unique |
0 |
1 |
1 |
Common |
0 |
3 |
3 |
|
StackLight |
Unique |
2 |
8 |
10 |
Common |
6 |
9 |
15 |
Mirantis Security Portal
For the detailed list of fixed and existing CVEs across the Mirantis Container Cloud and MOSK products, refer to Mirantis Security Portal.
MOSK CVEs
For the number of fixed CVEs in the MOSK-related components including OpenStack and Tungsten Fabric, refer to MOSK 24.1.4: Security notes.
The following issues have been addressed in the Container Cloud patch release 2.26.4 along with the patch Cluster releases 17.1.4 and 16.1.4.
[41806] [Container Cloud web UI] Fixed the issue with failure to configure management cluster using the Configure cluster web UI menu without updating the Keycloak Truststore settings.
This section lists known issues with workarounds for the Mirantis Container Cloud release 2.26.4 including the Cluster releases 17.1.4 and 16.1.4.
For other issues that can occur while deploying and operating a Container Cloud cluster, see Troubleshooting Guide.
Note
This section also outlines still valid known issues from previous Container Cloud releases.
Fixed in 2.28.0 (17.3.0 and 16.3.0)
When trying to list the HostOSConfigurationModules and HostOSConfiguration custom resources, serviceuser or a user with
the global-admin or operator role obtains the access denied error.
For example:
kubectl --kubeconfig ~/.kube/mgmt-config get hocm
Error from server (Forbidden): hostosconfigurationmodules.kaas.mirantis.com is forbidden:
User "2d74348b-5669-4c65-af31-6c05dbedac5f" cannot list resource "hostosconfigurationmodules"
in API group "kaas.mirantis.com" at the cluster scope: access denied
Workaround:
Modify the
global-adminrole by adding a new entry with the following contents to theruleslist:kubectl edit clusterroles kaas-global-admin
- apiGroups: [kaas.mirantis.com] resources: [hostosconfigurationmodules] verbs: ['*']
For each Container Cloud project, modify the
kaas-operatorrole by adding a new entry with the following contents to theruleslist:kubectl -n <projectName> edit roles kaas-operator
- apiGroups: [kaas.mirantis.com] resources: [hostosconfigurations] verbs: ['*']
After managed cluster update, old versions of system packages, including kernel, may remain on the manager nodes. This issue occurs because the task responsible for updating packages fails to run after updating Ubuntu mirrors.
As a workaround, manually run apt-get upgrade on every manager node after the cluster update but before rebooting the node.
Due to the MetalLB upstream issue, a load balancer service may not obtain the external IP address.
The issue occurs when two services share the same external IP address and have
the same externalTrafficPolicy value. Initially, the services have the
external IP address assigned and are accessible. After modifying the
externalTrafficPolicy value for both services from Cluster to
Local, the first service that has been changed remains with no external IP
address assigned. Though, the second service, which was changed later, has the
external IP assigned as expected.
To work around the issue, make a dummy change to the service object where
external IP is <pending>:
Identify the service that is stuck:
kubectl get svc -A | grep pending
Example of system response:
stacklight iam-proxy-prometheus LoadBalancer 10.233.28.196 <pending> 443:30430/TCP
Add an arbitrary label to the service that is stuck. For example:
kubectl label svc -n stacklight iam-proxy-prometheus reconcile=1
Example of system response:
service/iam-proxy-prometheus labeledVerify that the external IP was allocated to the service:
kubectl get svc -n stacklight iam-proxy-prometheus
Example of system response:
NAME TYPE CLUSTER-IP EXTERNAL-IP PORT(S) AGE iam-proxy-prometheus LoadBalancer 10.233.28.196 10.0.34.108 443:30430/TCP 12d
Fixed in 2.28.0 (17.3.0 and 16.3.0)
After node maintenance of a management cluster, the newly added nodes may fail to undergo provisioning successfully. The issue relates to new nodes that are in the same L2 domain as the management cluster.
The issue was observed on environments having management cluster nodes configured with a single L2 segment used for all network traffic (PXE and LCM/management networks).
To verify whether the cluster is affected:
Verify whether the dnsmasq and dhcp-relay pods run on the same node
in the management cluster:
kubectl -n kaas get pods -o wide| grep -e "dhcp\|dnsmasq"
Example of system response:
dhcp-relay-7d85f75f76-5vdw2 2/2 Running 2 (36h ago) 36h 10.10.0.122 kaas-node-8a24b81c-76d0-4d4c-8421-962bd39df5ad <none> <none>
dnsmasq-8f4b484b4-slhbd 5/5 Running 1 (36h ago) 36h 10.233.123.75 kaas-node-8a24b81c-76d0-4d4c-8421-962bd39df5ad <none> <none>
If this is the case, proceed to the workaround below.
Workaround:
Log in to a node that contains
kubeconfigof the affected management cluster.Make sure that at least two management cluster nodes are schedulable:
kubectl get node
Example of a positive system response:
NAME STATUS ROLES AGE VERSION kaas-node-bcedb87b-b3ce-46a4-a4ca-ea3068689e40 Ready master 37h v1.27.10-mirantis-1 kaas-node-8a24b81c-76d0-4d4c-8421-962bd39df5ad Ready master 37h v1.27.10-mirantis-1 kaas-node-ad5a6f51-b98f-43c3-91d5-55fed3d0ff21 Ready master 37h v1.27.10-mirantis-1
Delete the
dhcp-relaypod:kubectl -n kaas delete pod <dhcp-relay-xxxxx>
Verify that the
dnsmasqanddhcp-relaypods are scheduled into different nodes:kubectl -n kaas get pods -o wide| grep -e "dhcp\|dnsmasq"
Example of a positive system response:
dhcp-relay-7d85f75f76-rkv03 2/2 Running 0 49s 10.10.0.121 kaas-node-bcedb87b-b3ce-46a4-a4ca-ea3068689e40 <none> <none> dnsmasq-8f4b484b4-slhbd 5/5 Running 1 (37h ago) 37h 10.233.123.75 kaas-node-8a24b81c-76d0-4d4c-8421-962bd39df5ad <none> <none>
During deletion of a manager machine running the ironic Pod from a bare
metal management cluster, the following problems occur:
All Pods are stuck in the
TerminatingstateA new
ironicPod fails to startThe related bare metal host is stuck in the
deprovisioningstate
As a workaround, before deletion of the node running the ironic Pod,
cordon and drain the node using the kubectl cordon <nodeName> and
kubectl drain <nodeName> commands.
Due to issues with managing physical NVME devices, lcm-agent cannot grab
storage information on a host. As a result,
lcmmachine.status.hostinfo.hardware is empty and the following example
error is present in logs:
{"level":"error","ts":"2024-05-02T12:26:10Z","logger":"agent", \
"msg":"get hardware details", \
"host":"kaas-node-548b2861-aed0-41c9-8ff2-10c5476b000b", \
"error":"new storage info: get disk info \"nvme0c0n1\": \
invoke command: exit status 1","errorVerbose":"exit status 1
As a workaround, on the affected node, create a symlink for any device
indicated in lcm-agent logs. For example:
ln -sfn /dev/nvme0n1 /dev/nvme0c0n1
Fixed in 2.29.0 (17.4.0 and 16.4.0)
During the replacement of a master node on a cluster of any type, the process
may get stuck with Kubelet's NodeReady condition is Unknown in the
machine status on the remaining master nodes.
As a workaround, log in on the affected node and run the following command:
docker restart ucp-kubelet
During MariaDB operations on a management cluster, Pods may get stuck in continuous restarts with the following example error:
[ERROR] WSREP: Corrupt buffer header: \
addr: 0x7faec6f8e518, \
seqno: 3185219421952815104, \
size: 909455917, \
ctx: 0x557094f65038, \
flags: 11577. store: 49, \
type: 49
Workaround:
Create a backup of the
/var/lib/mysqldirectory on themariadb-serverPod.Verify that other replicas are up and ready.
Remove the
galera.cachefile for the affectedmariadb-serverPod.Remove the affected
mariadb-serverPod or wait until it is automatically restarted.
After Kubernetes restarts the Pod, the Pod clones the database in 1-2 minutes and restores the quorum.
Fixed in 2.28.4 (17.3.4 and 16.3.4)
During replacement of a master node on a cluster of any type, the
calico-node Pod fails to start on a new node that has the same IP address
as the node being replaced.
Workaround:
Log in to any
masternode.From a CLI with an MKE client bundle, create a shell alias to start calicoctl using the
mirantis/ucp-dsinfoimage:alias calicoctl="\ docker run -i --rm \ --pid host \ --net host \ -e constraint:ostype==linux \ -e ETCD_ENDPOINTS=<etcdEndpoint> \ -e ETCD_KEY_FILE=/var/lib/docker/volumes/ucp-kv-certs/_data/key.pem \ -e ETCD_CA_CERT_FILE=/var/lib/docker/volumes/ucp-kv-certs/_data/ca.pem \ -e ETCD_CERT_FILE=/var/lib/docker/volumes/ucp-kv-certs/_data/cert.pem \ -v /var/run/calico:/var/run/calico \ -v /var/lib/docker/volumes/ucp-kv-certs/_data:/var/lib/docker/volumes/ucp-kv-certs/_data:ro \ mirantis/ucp-dsinfo:<mkeVersion> \ calicoctl \ "
alias calicoctl="\ docker run -i --rm \ --pid host \ --net host \ -e constraint:ostype==linux \ -e ETCD_ENDPOINTS=<etcdEndpoint> \ -e ETCD_KEY_FILE=/ucp-node-certs/key.pem \ -e ETCD_CA_CERT_FILE=/ucp-node-certs/ca.pem \ -e ETCD_CERT_FILE=/ucp-node-certs/cert.pem \ -v /var/run/calico:/var/run/calico \ -v ucp-node-certs:/ucp-node-certs:ro \ mirantis/ucp-dsinfo:<mkeVersion> \ calicoctl --allow-version-mismatch \ "
In the above command, replace the following values with the corresponding settings of the affected cluster:
<etcdEndpoint>is the etcd endpoint defined in the Calico configuration file. For example,ETCD_ENDPOINTS=127.0.0.1:12378<mkeVersion>is the MKE version installed on your cluster. For example,mirantis/ucp-dsinfo:3.5.7.
Verify the node list on the cluster:
kubectl get node
Compare this list with the node list in Calico to identify the old node:
calicoctl get node -o wide
Remove the old node from Calico:
calicoctl delete node kaas-node-<nodeID>
Fixed in 2.28.4 (17.3.4 and 16.3.4)
During replacement of a manager machine, the following problems may occur:
The system adds the node to Docker swarm but not to Kubernetes
The node
Deploymentgets stuck with failed RethinkDB health checks
Workaround:
Delete the failed node.
Wait for the MKE cluster to become healthy. To monitor the cluster status:
Log in to the MKE web UI.
Monitor the cluster status as described in MKE Operations Guide: Monitor an MKE cluster with the MKE web UI.
Deploy a new node.
Fixed in 2.28.4 (17.3.4 and 16.3.4)
During the unsafe or forced deletion of a manager machine running the
calico-kube-controllers Pod in the kube-system namespace,
the following issues occur:
The
calico-kube-controllersPod fails to clean up resources associated with the deleted nodeThe
calico-nodePod may fail to start up on a newly created node if the machine is provisioned with the same IP address as the deleted machine had
As a workaround, before deletion of the node running the
calico-kube-controllers Pod, cordon and drain the node:
kubectl cordon <nodeName>
kubectl drain <nodeName>
Fixed in 2.27.0 (17.2.0 and 16.2.0)
During graceful reboot of a cluster with Ceph enabled, the reboot is blocked
with the following message in the MiraCephMaintenance object status:
message: ClusterMaintenanceRequest found, Ceph Cluster is not ready to upgrade,
delaying cluster maintenance
As a workaround, add the following snippet to the cephFS section under
metadataServer in the spec section of <kcc-name>.yaml in the Ceph
cluster:
cephClusterSpec:
sharedFilesystem:
cephFS:
- name: cephfs-store
metadataServer:
activeCount: 1
healthCheck:
livenessProbe:
probe:
failureThreshold: 5
initialDelaySeconds: 30
periodSeconds: 30
successThreshold: 1
timeoutSeconds: 5
Note
The issue does not reproduce since MOSK 25.2.
Update of a managed cluster based on bare metal and Ceph enabled fails with
PersistentVolumeClaim getting stuck in the Pending state for the
prometheus-server StatefulSet and the
MountVolume.MountDevice failed for volume warning in the StackLight event
logs.
Workaround:
Verify that the description of the Pods that failed to run contain the
FailedMountevents:kubectl -n <affectedProjectName> describe pod <affectedPodName>
In the command above, replace the following values:
<affectedProjectName>is the Container Cloud project name where the Pods failed to run<affectedPodName>is a Pod name that failed to run in the specified project
In the Pod description, identify the node name where the Pod failed to run.
Verify that the
csi-rbdpluginlogs of the affected node contain therbd volume mount failed: <csi-vol-uuid> is being usederror. The<csi-vol-uuid>is a unique RBD volume name.Identify
csiPodNameof the correspondingcsi-rbdplugin:kubectl -n rook-ceph get pod -l app=csi-rbdplugin \ -o jsonpath='{.items[?(@.spec.nodeName == "<nodeName>")].metadata.name}'
Output the affected
csiPodNamelogs:kubectl -n rook-ceph logs <csiPodName> -c csi-rbdplugin
Scale down the affected
StatefulSetorDeploymentof the Pod that fails to0replicas.On every
csi-rbdpluginPod, search for stuckcsi-vol:for pod in `kubectl -n rook-ceph get pods|grep rbdplugin|grep -v provisioner|awk '{print $1}'`; do echo $pod kubectl exec -it -n rook-ceph $pod -c csi-rbdplugin -- rbd device list | grep <csi-vol-uuid> done
Unmap the affected
csi-vol:rbd unmap -o force /dev/rbd<i>
The
/dev/rbd<i>value is a mapped RBD volume that usescsi-vol.Delete
volumeattachmentof the affected Pod:kubectl get volumeattachments | grep <csi-vol-uuid> kubectl delete volumeattacmhent <id>
Scale up the affected
StatefulSetorDeploymentback to the original number of replicas and wait until its state becomesRunning.
Fixed in 17.2.0, 16.2.0, 17.1.6, 16.1.6
On large managed clusters, shard relocation may fail in the OpenSearch cluster
with the yellow or red status of the OpenSearch cluster.
The characteristic symptom of the issue is that in the stacklight
namespace, the statefulset.apps/opensearch-master containers are
experiencing throttling with the KubeContainersCPUThrottlingHigh alert
firing for the following set of labels:
{created_by_kind="StatefulSet",created_by_name="opensearch-master",namespace="stacklight"}
Caution
The throttling that OpenSearch is experiencing may be a temporary situation, which may be related, for example, to a peaky load and the ongoing shards initialization as part of disaster recovery or after node restart. In this case, Mirantis recommends waiting until initialization of all shards is finished. After that, verify the cluster state and whether throttling still exists. And only if throttling does not disappear, apply the workaround below.
To verify that the initialization of shards is ongoing:
kubectl exec -it pod/opensearch-master-0 -n stacklight -c opensearch -- bash
curl "http://localhost:9200/_cat/shards" | grep INITIALIZING
Example of system response:
.ds-system-000072 2 r INITIALIZING 10.232.182.135 opensearch-master-1
.ds-system-000073 1 r INITIALIZING 10.232.7.145 opensearch-master-2
.ds-system-000073 2 r INITIALIZING 10.232.182.135 opensearch-master-1
.ds-audit-000001 2 r INITIALIZING 10.232.7.145 opensearch-master-2
The system response above indicates that shards from the
.ds-system-000072, .ds-system-000073, and .ds-audit-000001
indicies are in the INITIALIZING state. In this case, Mirantis
recommends waiting until this process is finished, and only then consider
changing the limit.
You can additionally analyze the exact level of throttling and the current CPU usage on the Kubernetes Containers dashboard in Grafana.
Workaround:
Verify the currently configured CPU requests and limits for the
opensearchcontainers:kubectl -n stacklight get statefulset.apps/opensearch-master -o jsonpath="{.spec.template.spec.containers[?(@.name=='opensearch')].resources}"
Example of system response:
{"limits":{"cpu":"600m","memory":"8Gi"},"requests":{"cpu":"500m","memory":"6Gi"}}
In the example above, the CPU request is
500mand the CPU limit is600m.Increase the CPU limit to a reasonably high number.
For example, the default CPU limit for the clusters with the
clusterSize:largeparameter set was increased from8000mto12000mfor StackLight in Container Cloud 2.27.0 (Cluster releases 17.2.0 and 16.2.0).Note
For details, on the
clusterSizeparameter, see MOSK Operations Guide: StackLight configuration parameters - Cluster size.If the defaults are already overridden on the affected cluster using the
resourcesPerClusterSizeorresourcesparameters as described in MOSK Operations Guide: StackLight configuration parameters - Resource limits, then the exact recommended number depends on the currently set limit.Mirantis recommends increasing the limit by 50%. If it does not resolve the issue, another increase iteration will be required.
When you select the required CPU limit, increase it as described in MOSK Operations Guide: StackLight configuration parameters - Resource limits.
If the CPU limit for the
opensearchcomponent is already set, increase it in theClusterobject for theopensearchparameter. Otherwise, the default StackLight limit is used. In this case, increase the CPU limit for theopensearchcomponent using theresourcesparameter.Wait until all
opensearch-masterpods are recreated with the new CPU limits and becomerunningandready.To verify the current CPU limit for every
opensearchcontainer in everyopensearch-masterpod separately:kubectl -n stacklight get pod/opensearch-master-<podSuffixNumber> -o jsonpath="{.spec.containers[?(@.name=='opensearch')].resources}"
In the command above, replace
<podSuffixNumber>with the name of the pod suffix. For example,pod/opensearch-master-0orpod/opensearch-master-2.Example of system response:
{"limits":{"cpu":"900m","memory":"8Gi"},"requests":{"cpu":"500m","memory":"6Gi"}}
The waiting time may take up to 20 minutes depending on the cluster size.
If the issue is fixed, the KubeContainersCPUThrottlingHigh alert stops
firing immediately, while OpenSearchClusterStatusWarning or
OpenSearchClusterStatusCritical can still be firing for some time during
shard relocation.
If the KubeContainersCPUThrottlingHigh alert is still firing, proceed with
another iteration of the CPU limit increase.
Fixed in 17.2.0, 16.2.0, 17.1.6, 16.1.6
While updating rollover_policy for the current system* and audit*
data streams, the update is not applied to indices.
One of indicators that the cluster is most likely affected is the
KubeJobFailed alert firing for the elasticsearch-curator job and one or
both of the following errors being present in elasticsearch-curator pods
that remain in the Error status:
2024-05-31 13:16:04,459 ERROR Failed to complete action: delete_indices. <class 'curator.exceptions.FailedExecution'>: Exception encountered. Rerun with loglevel DEBUG and/or check Elasticsearch logs for more information. Exception: RequestError(400, 'illegal_argument_exception', 'index [.ds-audit-000001] is the write index for data stream [audit] and cannot be deleted')
or
2024-05-31 13:16:04,459 ERROR Failed to complete action: delete_indices. <class 'curator.exceptions.FailedExecution'>: Exception encountered. Rerun with loglevel DEBUG and/or check Elasticsearch logs for more information. Exception: RequestError(400, 'illegal_argument_exception', 'index [.ds-system-000001] is the write index for data stream [system] and cannot be deleted')
Note
Instead of .ds-audit-000001 or .ds-system-000001 index names,
similar names can be present with the same prefix but different suffix
numbers.
If the above mentioned alert and errors are present, an immediate action is required, because it indicates that the corresponding index size has already exceeded the space allocated for the index.
To verify that the cluster is affected:
Caution
Verify and apply the workaround to both index patterns, system and audit, separately.
If one of indices is affected, the second one is most likely affected as well. Although in rare cases, only one index may be affected.
Log in to the
opensearch-master-0Pod:kubectl exec -it pod/opensearch-master-0 -n stacklight -c opensearch -- bash
Verify that the rollover policy is present:
system:curl localhost:9200/_plugins/_ism/policies/system_rollover_policyaudit:curl localhost:9200/_plugins/_ism/policies/audit_rollover_policy
The cluster is affected if the rollover policy is missing. Otherwise, proceed to the following step.
Verify the system response from the previous step. For example:
{"_id":"system_rollover_policy","_version":7229,"_seq_no":42362,"_primary_term":28,"policy":{"policy_id":"system_rollover_policy","description":"system index rollover policy.","last_updated_time":1708505222430,"schema_version":19,"error_notification":null,"default_state":"rollover","states":[{"name":"rollover","actions":[{"retry":{"count":3,"backoff":"exponential","delay":"1m"},"rollover":{"min_size":"14746mb","copy_alias":false}}],"transitions":[]}],"ism_template":[{"index_patterns":["system*"],"priority":200,"last_updated_time":1708505222430}]}}
Verify and capture the following items separately for every policy:
The
_seq_noand_primary_termvaluesThe rollover policy threshold, which is defined in
policy.states[0].actions[0].rollover.min_size
List indices:
system:curl localhost:9200/_cat/indices | grep system
Example of system response:
[...] green open .ds-system-000001 FjglnZlcTKKfKNbosaE9Aw 2 1 1998295 0 1gb 507.9mb
audit:curl localhost:9200/_cat/indices | grep audit
Example of system response:
[...] green open .ds-audit-000001 FjglnZlcTKKfKNbosaE9Aw 2 1 1998295 0 1gb 507.9mb
Select the index with the highest number and verify the rollover policy attached to the index:
system:curl localhost:9200/_plugins/_ism/explain/.ds-system-000001audit:curl localhost:9200/_plugins/_ism/explain/.ds-audit-000001If the rollover policy is not attached, the cluster is affected.
If the rollover policy is attached but
_seq_noand_primary_termnumbers do not match the previously captured ones, the cluster is affected.If the index size drastically exceeds the defined threshold of the rollover policy (which is the previously captured
min_size), the cluster is most probably affected.
Workaround:
Log in to the
opensearch-master-0Pod:kubectl exec -it pod/opensearch-master-0 -n stacklight -c opensearch -- bash
If the policy is attached to the index but has different
_seq_noand_primary_term, remove the policy from the index:Note
Use the index with the highest number in the name, which was captured during verification procedure.
system:curl -XPOST localhost:9200/_plugins/_ism/remove/.ds-system-000001
audit:curl -XPOST localhost:9200/_plugins/_ism/remove/.ds-audit-000001
Re-add the policy:
system:curl -XPOST -H "Content-type: application/json" localhost:9200/_plugins/_ism/add/system* -d'{"policy_id":"system_rollover_policy"}'
audit:curl -XPOST -H "Content-type: application/json" localhost:9200/_plugins/_ism/add/audit* -d'{"policy_id":"audit_rollover_policy"}'
Perform again the last step of the cluster verification procedure provided above and make sure that the policy is attached to the index and has the same
_seq_noand_primary_term.If the index size drastically exceeds the defined threshold of the rollover policy (which is the previously captured
min_size), wait up to 15 minutes and verify that the additional index is created with the consecutive number in the index name. For example:system: if you applied changes to.ds-system-000001, wait until.ds-system-000002is created.audit: if you applied changes to.ds-audit-000001, wait until.ds-audit-000002is created.
If such index is not created, escalate the issue to Mirantis support.
This section describes the specific actions you as a cloud operator need to complete before or after your Container Cloud cluster update to the Cluster releases 17.1.4 or 16.1.4.
Consider this information as a supplement to the generic update procedures published in Operations Guide: Automatic upgrade of a management cluster and Update to a patch version.
After the MKE update to 3.7.8, if you are going to enable or already enabled Kubernetes auditing and profiling on your managed or management cluster, keep in mind that enabling audit log rotation requires an additional step. Set the following options in the MKE configuration file after enabling auditing and profiling:
[cluster_config]
kube_api_server_audit_log_maxage=30
kube_api_server_audit_log_maxbackup=10
kube_api_server_audit_log_maxsize=10
For the configuration procedure, see MKE documentation: Configure an existing MKE cluster.
While using this procedure, replace the command to upload the newly edited MKE configuration file with the following one:
curl --silent --insecure -X PUT -H "X-UCP-Allow-Restricted-API: i-solemnly-swear-i-am-up-to-no-good" -H "accept: application/toml" -H "Authorization: Bearer $AUTHTOKEN" --upload-file 'mke-config.toml' https://$MKE_HOST/api/ucp/config-toml
The value for
MKE_HOSThas the<loadBalancerHost>:6443format, whereloadBalancerHostis the corresponding field in the cluster status.The value for
MKE_PASSWORDis taken from theucp-admin-password-<clusterName>secret in the cluster namespace of the management cluster.The value for
MKE_USERNAMEis alwaysadmin.
This section lists the artifacts of components included in the Container Cloud patch release 2.26.4. For artifacts of the Cluster releases introduced in 2.26.4, see patch Cluster releases 17.1.4 and 16.1.4.
Note
The components that are newly added, updated, deprecated, or removed
as compared to the previous release version, are marked
with a corresponding superscript,
for example, lcm-ansible Updated.
Artifact |
Component |
Path |
|---|---|---|
Binaries Updated |
ironic-python-agent.initramfs |
https://binary.mirantis.com/bm/bin/ironic/ipa/ubuntu/initramfs-yoga-focal-debug-20240502103738 |
ironic-python-agent.kernel |
https://binary.mirantis.com/bm/bin/ironic/ipa/ubuntu/kernel-yoga-focal-debug-20240502103738 |
|
Helm charts Updated |
baremetal-api |
https://binary.mirantis.com/core/helm/baremetal-api-1.39.26.tgz |
baremetal-operator |
https://binary.mirantis.com/core/helm/baremetal-operator-1.39.26.tgz |
|
baremetal-provider |
https://binary.mirantis.com/core/helm/baremetal-provider-1.39.26.tgz |
|
baremetal-public-api |
https://binary.mirantis.com/core/helm/baremetal-public-api-1.39.26.tgz |
|
kaas-ipam |
||
local-volume-provisioner |
https://binary.mirantis.com/core/helm/local-volume-provisioner-1.39.26.tgz |
|
metallb |
||
Docker images |
ambasador Updated |
mirantis.azurecr.io/core/external/nginx:1.39.26 |
baremetal-dnsmasq |
mirantis.azurecr.io/bm/baremetal-dnsmasq:base-2-26-alpine-20240408141922 |
|
baremetal-operator Updated |
mirantis.azurecr.io/bm/baremetal-operator:base-2-26-alpine-20240415095355 |
|
bm-collective |
mirantis.azurecr.io/bm/bm-collective:base-2-26-alpine-20240408142218 |
|
cluster-api-provider-baremetal Updated |
mirantis.azurecr.io/core/cluster-api-provider-baremetal:1.39.26 |
|
ironic Updated |
mirantis.azurecr.io/openstack/ironic:yoga-jammy-20240510100941 |
|
ironic-inspector Updated |
mirantis.azurecr.io/openstack/ironic-inspector:yoga-jammy-20240510100941 |
|
ironic-prometheus-exporter |
mirantis.azurecr.io/stacklight/ironic-prometheus-exporter:0.1-20240117102150 |
|
kaas-ipam |
mirantis.azurecr.io/bm/kaas-ipam:base-2-26-alpine-20240408150853 |
|
kubernetes-entrypoint Updated |
mirantis.azurecr.io/openstack/extra/kubernetes-entrypoint:v1.0.1-ba8ada4-20240405150338 |
|
mariadb |
mirantis.azurecr.io/general/mariadb:10.6.14-focal-20240311120505 |
|
mcc-keepalived |
mirantis.azurecr.io/lcm/mcc-keepalived:v0.24.0-47-gf77368e |
|
metallb-controller |
mirantis.azurecr.io/bm/metallb/controller:v0.13.12-ef4c9453-amd64 |
|
metallb-speaker |
mirantis.azurecr.io/bm/metallb/speaker:v0.13.12-ef4c9453-amd64 |
|
syslog-ng |
mirantis.azurecr.io/bm/syslog-ng:base-alpine-20240129163811 |
Artifact |
Component |
Path |
|---|---|---|
Bootstrap tarball Updated |
bootstrap-darwin |
https://binary.mirantis.com/core/bin/bootstrap-darwin-1.39.26.tgz |
bootstrap-linux |
https://binary.mirantis.com/core/bin/bootstrap-linux-1.39.26.tgz |
|
Helm charts Updated |
admission-controller |
https://binary.mirantis.com/core/helm/admission-controller-1.39.26.tgz |
agent-controller |
https://binary.mirantis.com/core/helm/agent-controller-1.39.26.tgz |
|
byo-credentials-controller |
https://binary.mirantis.com/core/helm/byo-credentials-controller-1.39.26.tgz |
|
byo-provider |
https://binary.mirantis.com/core/helm/byo-provider-1.39.26.tgz |
|
ceph-kcc-controller |
https://binary.mirantis.com/core/helm/ceph-kcc-controller-1.39.26.tgz |
|
cert-manager |
https://binary.mirantis.com/core/helm/cert-manager-1.39.26.tgz |
|
cinder-csi-plugin |
https://binary.mirantis.com/core/helm/cinder-csi-plugin-1.39.26.tgz |
|
client-certificate-controller |
https://binary.mirantis.com/core/helm/client-certificate-controller-1.39.26.tgz |
|
configuration-collector |
https://binary.mirantis.com/core/helm/configuration-collector-1.39.26.tgz |
|
event-controller |
https://binary.mirantis.com/core/helm/event-controller-1.39.26.tgz |
|
host-os-modules-controller |
https://binary.mirantis.com/core/helm/host-os-modules-controller-1.39.26.tgz |
|
iam-controller |
https://binary.mirantis.com/core/helm/iam-controller-1.39.26.tgz |
|
kaas-exporter |
https://binary.mirantis.com/core/helm/kaas-exporter-1.39.26.tgz |
|
kaas-public-api |
https://binary.mirantis.com/core/helm/kaas-public-api-1.39.26.tgz |
|
kaas-ui |
||
lcm-controller |
https://binary.mirantis.com/core/helm/lcm-controller-1.39.26.tgz |
|
license-controller |
https://binary.mirantis.com/core/helm/license-controller-1.39.26.tgz |
|
machinepool-controller |
https://binary.mirantis.com/core/helm/machinepool-controller-1.39.26.tgz |
|
mcc-cache |
||
mcc-cache-warmup |
https://binary.mirantis.com/core/helm/mcc-cache-warmup-1.39.26.tgz |
|
metrics-server |
https://binary.mirantis.com/core/helm/metrics-server-1.39.26.tgz |
|
openstack-cloud-controller-manager |
https://binary.mirantis.com/core/helm/openstack-cloud-controller-manager-1.39.26.tgz |
|
openstack-provider |
https://binary.mirantis.com/core/helm/openstack-provider-1.39.26.tgz |
|
os-credentials-controller |
https://binary.mirantis.com/core/helm/os-credentials-controller-1.39.26.tgz |
|
policy-controller |
https://binary.mirantis.com/core/helm/policy-controller-1.39.26.tgz |
|
portforward-controller |
https://binary.mirantis.com/core/helm/portforward-controller-1.39.26.tgz |
|
proxy-controller |
https://binary.mirantis.com/core/helm/proxy-controller-1.39.26.tgz |
|
rbac-controller |
https://binary.mirantis.com/core/helm/rbac-controller-1.39.26.tgz |
|
release-controller |
https://binary.mirantis.com/core/helm/release-controller-1.39.26.tgz |
|
rhellicense-controller |
https://binary.mirantis.com/core/helm/rhellicense-controller-1.39.26.tgz |
|
scope-controller |
https://binary.mirantis.com/core/helm/scope-controller-1.39.26.tgz |
|
squid-proxy |
https://binary.mirantis.com/core/helm/squid-proxy-1.39.26.tgz |
|
user-controller |
https://binary.mirantis.com/core/helm/user-controller-1.39.26.tgz |
|
vsphere-cloud-controller-manager |
https://binary.mirantis.com/core/helm/vsphere-cloud-controller-manager-1.39.26.tgz |
|
vsphere-credentials-controller |
https://binary.mirantis.com/core/helm/vsphere-credentials-controller-1.39.26.tgz |
|
vsphere-csi-plugin |
https://binary.mirantis.com/core/helm/vsphere-csi-plugin-1.39.26.tgz |
|
vsphere-provider |
https://binary.mirantis.com/core/helm/vsphere-provider-1.39.26.tgz |
|
vsphere-vm-template-controller |
https://binary.mirantis.com/core/helm/vsphere-vm-template-controller-1.39.26.tgz |
|
Docker images |
admission-controller Updated |
mirantis.azurecr.io/core/admission-controller:1.39.26 |
agent-controller Updated |
mirantis.azurecr.io/core/agent-controller:1.39.26 |
|
byo-cluster-api-controller Updated |
mirantis.azurecr.io/core/byo-cluster-api-controller:1.39.26 |
|
byo-credentials-controller Updated |
mirantis.azurecr.io/core/byo-credentials-controller:1.39.26 |
|
ceph-kcc-controller Updated |
mirantis.azurecr.io/core/ceph-kcc-controller:1.39.26 |
|
cert-manager-controller |
mirantis.azurecr.io/core/external/cert-manager-controller:v1.11.0-6 |
|
cinder-csi-plugin Updated |
mirantis.azurecr.io/lcm/kubernetes/cinder-csi-plugin:v1.27.2-16 |
|
client-certificate-controller Updated |
mirantis.azurecr.io/core/client-certificate-controller:1.39.26 |
|
configuration-collector Updated |
mirantis.azurecr.io/core/configuration-collector:1.39.26 |
|
csi-attacher |
mirantis.azurecr.io/lcm/k8scsi/csi-attacher:v4.2.0-5 |
|
csi-node-driver-registrar |
mirantis.azurecr.io/lcm/k8scsi/csi-node-driver-registrar:v2.7.0-5 |
|
csi-provisioner |
mirantis.azurecr.io/lcm/k8scsi/csi-provisioner:v3.4.1-5 |
|
csi-resizer |
mirantis.azurecr.io/lcm/k8scsi/csi-resizer:v1.7.0-5 |
|
csi-snapshotter |
mirantis.azurecr.io/lcm/k8scsi/csi-snapshotter:v6.2.1-mcc-4 |
|
event-controller Updated |
mirantis.azurecr.io/core/event-controller:1.39.26 |
|
frontend Updated |
mirantis.azurecr.io/core/frontend:1.39.26 |
|
host-os-modules-controller Updated |
mirantis.azurecr.io/core/host-os-modules-controller:1.39.26 |
|
iam-controller Updated |
mirantis.azurecr.io/core/iam-controller:1.39.26 |
|
kaas-exporter Updated |
mirantis.azurecr.io/core/kaas-exporter:1.39.26 |
|
kproxy Updated |
mirantis.azurecr.io/core/kproxy:1.39.26 |
|
lcm-controller Updated |
mirantis.azurecr.io/core/lcm-controller:1.39.26 |
|
license-controller Updated |
mirantis.azurecr.io/core/license-controller:1.39.26 |
|
livenessprobe |
mirantis.azurecr.io/lcm/k8scsi/livenessprobe:v2.9.0-5 |
|
machinepool-controller Updated |
mirantis.azurecr.io/core/machinepool-controller:1.39.26 |
|
mcc-haproxy |
mirantis.azurecr.io/lcm/mcc-haproxy:v0.24.0-47-gf77368e |
|
mcc-keepalived |
mirantis.azurecr.io/lcm/mcc-keepalived:v0.24.0-47-gf77368e |
|
metrics-server |
mirantis.azurecr.io/lcm/metrics-server-amd64:v0.6.3-7 |
|
nginx Updated |
mirantis.azurecr.io/core/external/nginx:1.39.26 |
|
openstack-cloud-controller-manager Updated |
mirantis.azurecr.io/lcm/kubernetes/openstack-cloud-controller-manager:v1.27.2-16 |
|
openstack-cluster-api-controller Updated |
mirantis.azurecr.io/core/openstack-cluster-api-controller:1.39.26 |
|
os-credentials-controller Updated |
mirantis.azurecr.io/core/os-credentials-controller:1.39.26 |
|
policy-controller Updated |
mirantis.azurecr.io/core/policy-controller:1.39.26 |
|
portforward-controller Updated |
mirantis.azurecr.io/core/portforward-controller:1.39.26 |
|
proxy-controller Updated |
mirantis.azurecr.io/core/proxy-controller:1.39.26 |
|
rbac-controller Updated |
mirantis.azurecr.io/core/rbac-controller:1.39.26 |
|
registry |
mirantis.azurecr.io/lcm/registry:v2.8.1-9 |
|
release-controller Updated |
mirantis.azurecr.io/core/release-controller:1.39.26 |
|
rhellicense-controller Updated |
mirantis.azurecr.io/core/rhellicense-controller:1.39.26 |
|
scope-controller Updated |
mirantis.azurecr.io/core/scope-controller:1.39.26 |
|
squid-proxy |
mirantis.azurecr.io/lcm/squid-proxy:0.0.1-10-g24a0d69 |
|
user-controller Updated |
mirantis.azurecr.io/core/user-controller:1.39.26 |
|
vsphere-cloud-controller-manager |
mirantis.azurecr.io/lcm/kubernetes/vsphere-cloud-controller-manager:v1.27.0-6 |
|
vsphere-cluster-api-controller Updated |
mirantis.azurecr.io/core/vsphere-cluster-api-controller:1.39.26 |
|
vsphere-credentials-controller Updated |
mirantis.azurecr.io/core/vsphere-credentials-controller:1.39.26 |
|
vsphere-csi-driver |
mirantis.azurecr.io/lcm/kubernetes/vsphere-csi-driver:v3.0.2-1 |
|
vsphere-csi-syncer |
mirantis.azurecr.io/lcm/kubernetes/vsphere-csi-syncer:v3.0.2-1 |
|
vsphere-vm-template-controller Updated |
mirantis.azurecr.io/core/vsphere-vm-template-controller:1.39.26 |
Artifact |
Component |
Path |
|---|---|---|
Binaries |
hash-generate-darwin |
http://binary.mirantis.com/iam/bin/hash-generate-0.0.1-268-3cf7f17-darwin |
hash-generate-linux |
http://binary.mirantis.com/iam/bin/hash-generate-0.0.1-268-3cf7f17-linux |
|
Helm charts |
iam Updated |
|
Docker images |
kubectl Updated |
mirantis.azurecr.io/stacklight/kubectl:1.22-20240501023013 |
kubernetes-entrypoint Updated |
mirantis.azurecr.io/openstack/extra/kubernetes-entrypoint:v1.0.1-ba8ada4-20240405150338 |
|
mariadb Updated |
mirantis.azurecr.io/general/mariadb:10.6.17-focal-20240327104027 |
|
mcc-keycloak |
mirantis.azurecr.io/iam/mcc-keycloak:23.0.6-20240216125244 |
See also
The Container Cloud patch release 2.26.3, which is based on the 2.26.0 major release, provides the following updates:
Support for the patch Cluster releases 16.1.3 and 17.1.3 that represents Mirantis OpenStack for Kubernetes (MOSK) patch release 24.1.3 patch.
Support for MKE 3.7.7.
Bare metal: update of Ubuntu mirror from 20.04~20240324172903 to 20.04~20240411171541 along with update of minor kernel version from 5.15.0-101-generic to 5.15.0-102-generic.
Security fixes for CVEs in images.
Bug fixes.
This patch release also supports the latest major Cluster releases 17.1.0 and 16.1.0. And it does not support greenfield deployments based on deprecated Cluster releases. Use the latest available Cluster release instead.
For main deliverables of the parent Container Cloud release of 2.26.3, refer to 2.26.0.
The table below includes the total numbers of addressed unique and common CVEs in images by product component since the Container Cloud 2.26.2 patch release. The common CVEs are issues addressed across several images.
Product component |
CVE type |
Critical |
High |
Total |
|---|---|---|---|---|
Ceph |
Unique |
0 |
1 |
1 |
Common |
0 |
10 |
10 |
|
Core |
Unique |
0 |
4 |
4 |
Common |
0 |
105 |
105 |
|
StackLight |
Unique |
1 |
4 |
5 |
Common |
1 |
24 |
25 |
Mirantis Security Portal
For the detailed list of fixed and existing CVEs across the Mirantis Container Cloud and MOSK products, refer to Mirantis Security Portal.
MOSK CVEs
For the number of fixed CVEs in the MOSK-related components including OpenStack and Tungsten Fabric, refer to MOSK 24.1.3: Security notes.
The following issues have been addressed in the Container Cloud patch release 2.26.3 along with the patch Cluster releases 17.1.3 and 16.1.3.
[40811] [LCM] Fixed the issue with the DaemonSet Pod remaining on the deleted node in the
Terminatingstate during machine deletion.
This section lists known issues with workarounds for the Mirantis Container Cloud release 2.26.3 including the Cluster releases 17.1.3 and 16.1.3.
For other issues that can occur while deploying and operating a Container Cloud cluster, see Troubleshooting Guide.
Note
This section also outlines still valid known issues from previous Container Cloud releases.
Fixed in 2.28.0 (17.3.0 and 16.3.0)
When trying to list the HostOSConfigurationModules and HostOSConfiguration custom resources, serviceuser or a user with
the global-admin or operator role obtains the access denied error.
For example:
kubectl --kubeconfig ~/.kube/mgmt-config get hocm
Error from server (Forbidden): hostosconfigurationmodules.kaas.mirantis.com is forbidden:
User "2d74348b-5669-4c65-af31-6c05dbedac5f" cannot list resource "hostosconfigurationmodules"
in API group "kaas.mirantis.com" at the cluster scope: access denied
Workaround:
Modify the
global-adminrole by adding a new entry with the following contents to theruleslist:kubectl edit clusterroles kaas-global-admin
- apiGroups: [kaas.mirantis.com] resources: [hostosconfigurationmodules] verbs: ['*']
For each Container Cloud project, modify the
kaas-operatorrole by adding a new entry with the following contents to theruleslist:kubectl -n <projectName> edit roles kaas-operator
- apiGroups: [kaas.mirantis.com] resources: [hostosconfigurations] verbs: ['*']
Due to the MetalLB upstream issue, a load balancer service may not obtain the external IP address.
The issue occurs when two services share the same external IP address and have
the same externalTrafficPolicy value. Initially, the services have the
external IP address assigned and are accessible. After modifying the
externalTrafficPolicy value for both services from Cluster to
Local, the first service that has been changed remains with no external IP
address assigned. Though, the second service, which was changed later, has the
external IP assigned as expected.
To work around the issue, make a dummy change to the service object where
external IP is <pending>:
Identify the service that is stuck:
kubectl get svc -A | grep pending
Example of system response:
stacklight iam-proxy-prometheus LoadBalancer 10.233.28.196 <pending> 443:30430/TCP
Add an arbitrary label to the service that is stuck. For example:
kubectl label svc -n stacklight iam-proxy-prometheus reconcile=1
Example of system response:
service/iam-proxy-prometheus labeledVerify that the external IP was allocated to the service:
kubectl get svc -n stacklight iam-proxy-prometheus
Example of system response:
NAME TYPE CLUSTER-IP EXTERNAL-IP PORT(S) AGE iam-proxy-prometheus LoadBalancer 10.233.28.196 10.0.34.108 443:30430/TCP 12d
Fixed in 2.28.0 (17.3.0 and 16.3.0)
After node maintenance of a management cluster, the newly added nodes may fail to undergo provisioning successfully. The issue relates to new nodes that are in the same L2 domain as the management cluster.
The issue was observed on environments having management cluster nodes configured with a single L2 segment used for all network traffic (PXE and LCM/management networks).
To verify whether the cluster is affected:
Verify whether the dnsmasq and dhcp-relay pods run on the same node
in the management cluster:
kubectl -n kaas get pods -o wide| grep -e "dhcp\|dnsmasq"
Example of system response:
dhcp-relay-7d85f75f76-5vdw2 2/2 Running 2 (36h ago) 36h 10.10.0.122 kaas-node-8a24b81c-76d0-4d4c-8421-962bd39df5ad <none> <none>
dnsmasq-8f4b484b4-slhbd 5/5 Running 1 (36h ago) 36h 10.233.123.75 kaas-node-8a24b81c-76d0-4d4c-8421-962bd39df5ad <none> <none>
If this is the case, proceed to the workaround below.
Workaround:
Log in to a node that contains
kubeconfigof the affected management cluster.Make sure that at least two management cluster nodes are schedulable:
kubectl get node
Example of a positive system response:
NAME STATUS ROLES AGE VERSION kaas-node-bcedb87b-b3ce-46a4-a4ca-ea3068689e40 Ready master 37h v1.27.10-mirantis-1 kaas-node-8a24b81c-76d0-4d4c-8421-962bd39df5ad Ready master 37h v1.27.10-mirantis-1 kaas-node-ad5a6f51-b98f-43c3-91d5-55fed3d0ff21 Ready master 37h v1.27.10-mirantis-1
Delete the
dhcp-relaypod:kubectl -n kaas delete pod <dhcp-relay-xxxxx>
Verify that the
dnsmasqanddhcp-relaypods are scheduled into different nodes:kubectl -n kaas get pods -o wide| grep -e "dhcp\|dnsmasq"
Example of a positive system response:
dhcp-relay-7d85f75f76-rkv03 2/2 Running 0 49s 10.10.0.121 kaas-node-bcedb87b-b3ce-46a4-a4ca-ea3068689e40 <none> <none> dnsmasq-8f4b484b4-slhbd 5/5 Running 1 (37h ago) 37h 10.233.123.75 kaas-node-8a24b81c-76d0-4d4c-8421-962bd39df5ad <none> <none>
During deletion of a manager machine running the ironic Pod from a bare
metal management cluster, the following problems occur:
All Pods are stuck in the
TerminatingstateA new
ironicPod fails to startThe related bare metal host is stuck in the
deprovisioningstate
As a workaround, before deletion of the node running the ironic Pod,
cordon and drain the node using the kubectl cordon <nodeName> and
kubectl drain <nodeName> commands.
Due to issues with managing physical NVME devices, lcm-agent cannot grab
storage information on a host. As a result,
lcmmachine.status.hostinfo.hardware is empty and the following example
error is present in logs:
{"level":"error","ts":"2024-05-02T12:26:10Z","logger":"agent", \
"msg":"get hardware details", \
"host":"kaas-node-548b2861-aed0-41c9-8ff2-10c5476b000b", \
"error":"new storage info: get disk info \"nvme0c0n1\": \
invoke command: exit status 1","errorVerbose":"exit status 1
As a workaround, on the affected node, create a symlink for any device
indicated in lcm-agent logs. For example:
ln -sfn /dev/nvme0n1 /dev/nvme0c0n1
Fixed in 2.29.0 (17.4.0 and 16.4.0)
During the replacement of a master node on a cluster of any type, the process
may get stuck with Kubelet's NodeReady condition is Unknown in the
machine status on the remaining master nodes.
As a workaround, log in on the affected node and run the following command:
docker restart ucp-kubelet
During MariaDB operations on a management cluster, Pods may get stuck in continuous restarts with the following example error:
[ERROR] WSREP: Corrupt buffer header: \
addr: 0x7faec6f8e518, \
seqno: 3185219421952815104, \
size: 909455917, \
ctx: 0x557094f65038, \
flags: 11577. store: 49, \
type: 49
Workaround:
Create a backup of the
/var/lib/mysqldirectory on themariadb-serverPod.Verify that other replicas are up and ready.
Remove the
galera.cachefile for the affectedmariadb-serverPod.Remove the affected
mariadb-serverPod or wait until it is automatically restarted.
After Kubernetes restarts the Pod, the Pod clones the database in 1-2 minutes and restores the quorum.
Fixed in 2.28.4 (17.3.4 and 16.3.4)
During replacement of a master node on a cluster of any type, the
calico-node Pod fails to start on a new node that has the same IP address
as the node being replaced.
Workaround:
Log in to any
masternode.From a CLI with an MKE client bundle, create a shell alias to start calicoctl using the
mirantis/ucp-dsinfoimage:alias calicoctl="\ docker run -i --rm \ --pid host \ --net host \ -e constraint:ostype==linux \ -e ETCD_ENDPOINTS=<etcdEndpoint> \ -e ETCD_KEY_FILE=/var/lib/docker/volumes/ucp-kv-certs/_data/key.pem \ -e ETCD_CA_CERT_FILE=/var/lib/docker/volumes/ucp-kv-certs/_data/ca.pem \ -e ETCD_CERT_FILE=/var/lib/docker/volumes/ucp-kv-certs/_data/cert.pem \ -v /var/run/calico:/var/run/calico \ -v /var/lib/docker/volumes/ucp-kv-certs/_data:/var/lib/docker/volumes/ucp-kv-certs/_data:ro \ mirantis/ucp-dsinfo:<mkeVersion> \ calicoctl \ "
alias calicoctl="\ docker run -i --rm \ --pid host \ --net host \ -e constraint:ostype==linux \ -e ETCD_ENDPOINTS=<etcdEndpoint> \ -e ETCD_KEY_FILE=/ucp-node-certs/key.pem \ -e ETCD_CA_CERT_FILE=/ucp-node-certs/ca.pem \ -e ETCD_CERT_FILE=/ucp-node-certs/cert.pem \ -v /var/run/calico:/var/run/calico \ -v ucp-node-certs:/ucp-node-certs:ro \ mirantis/ucp-dsinfo:<mkeVersion> \ calicoctl --allow-version-mismatch \ "
In the above command, replace the following values with the corresponding settings of the affected cluster:
<etcdEndpoint>is the etcd endpoint defined in the Calico configuration file. For example,ETCD_ENDPOINTS=127.0.0.1:12378<mkeVersion>is the MKE version installed on your cluster. For example,mirantis/ucp-dsinfo:3.5.7.
Verify the node list on the cluster:
kubectl get node
Compare this list with the node list in Calico to identify the old node:
calicoctl get node -o wide
Remove the old node from Calico:
calicoctl delete node kaas-node-<nodeID>
Fixed in 2.28.4 (17.3.4 and 16.3.4)
During replacement of a manager machine, the following problems may occur:
The system adds the node to Docker swarm but not to Kubernetes
The node
Deploymentgets stuck with failed RethinkDB health checks
Workaround:
Delete the failed node.
Wait for the MKE cluster to become healthy. To monitor the cluster status:
Log in to the MKE web UI.
Monitor the cluster status as described in MKE Operations Guide: Monitor an MKE cluster with the MKE web UI.
Deploy a new node.
Fixed in 2.28.4 (17.3.4 and 16.3.4)
During the unsafe or forced deletion of a manager machine running the
calico-kube-controllers Pod in the kube-system namespace,
the following issues occur:
The
calico-kube-controllersPod fails to clean up resources associated with the deleted nodeThe
calico-nodePod may fail to start up on a newly created node if the machine is provisioned with the same IP address as the deleted machine had
As a workaround, before deletion of the node running the
calico-kube-controllers Pod, cordon and drain the node:
kubectl cordon <nodeName>
kubectl drain <nodeName>
Fixed in 2.27.0 (17.2.0 and 16.2.0)
During graceful reboot of a cluster with Ceph enabled, the reboot is blocked
with the following message in the MiraCephMaintenance object status:
message: ClusterMaintenanceRequest found, Ceph Cluster is not ready to upgrade,
delaying cluster maintenance
As a workaround, add the following snippet to the cephFS section under
metadataServer in the spec section of <kcc-name>.yaml in the Ceph
cluster:
cephClusterSpec:
sharedFilesystem:
cephFS:
- name: cephfs-store
metadataServer:
activeCount: 1
healthCheck:
livenessProbe:
probe:
failureThreshold: 5
initialDelaySeconds: 30
periodSeconds: 30
successThreshold: 1
timeoutSeconds: 5
Note
The issue does not reproduce since MOSK 25.2.
Update of a managed cluster based on bare metal and Ceph enabled fails with
PersistentVolumeClaim getting stuck in the Pending state for the
prometheus-server StatefulSet and the
MountVolume.MountDevice failed for volume warning in the StackLight event
logs.
Workaround:
Verify that the description of the Pods that failed to run contain the
FailedMountevents:kubectl -n <affectedProjectName> describe pod <affectedPodName>
In the command above, replace the following values:
<affectedProjectName>is the Container Cloud project name where the Pods failed to run<affectedPodName>is a Pod name that failed to run in the specified project
In the Pod description, identify the node name where the Pod failed to run.
Verify that the
csi-rbdpluginlogs of the affected node contain therbd volume mount failed: <csi-vol-uuid> is being usederror. The<csi-vol-uuid>is a unique RBD volume name.Identify
csiPodNameof the correspondingcsi-rbdplugin:kubectl -n rook-ceph get pod -l app=csi-rbdplugin \ -o jsonpath='{.items[?(@.spec.nodeName == "<nodeName>")].metadata.name}'
Output the affected
csiPodNamelogs:kubectl -n rook-ceph logs <csiPodName> -c csi-rbdplugin
Scale down the affected
StatefulSetorDeploymentof the Pod that fails to0replicas.On every
csi-rbdpluginPod, search for stuckcsi-vol:for pod in `kubectl -n rook-ceph get pods|grep rbdplugin|grep -v provisioner|awk '{print $1}'`; do echo $pod kubectl exec -it -n rook-ceph $pod -c csi-rbdplugin -- rbd device list | grep <csi-vol-uuid> done
Unmap the affected
csi-vol:rbd unmap -o force /dev/rbd<i>
The
/dev/rbd<i>value is a mapped RBD volume that usescsi-vol.Delete
volumeattachmentof the affected Pod:kubectl get volumeattachments | grep <csi-vol-uuid> kubectl delete volumeattacmhent <id>
Scale up the affected
StatefulSetorDeploymentback to the original number of replicas and wait until its state becomesRunning.
Fixed in 17.2.0, 16.2.0, 17.1.6, 16.1.6
On large managed clusters, shard relocation may fail in the OpenSearch cluster
with the yellow or red status of the OpenSearch cluster.
The characteristic symptom of the issue is that in the stacklight
namespace, the statefulset.apps/opensearch-master containers are
experiencing throttling with the KubeContainersCPUThrottlingHigh alert
firing for the following set of labels:
{created_by_kind="StatefulSet",created_by_name="opensearch-master",namespace="stacklight"}
Caution
The throttling that OpenSearch is experiencing may be a temporary situation, which may be related, for example, to a peaky load and the ongoing shards initialization as part of disaster recovery or after node restart. In this case, Mirantis recommends waiting until initialization of all shards is finished. After that, verify the cluster state and whether throttling still exists. And only if throttling does not disappear, apply the workaround below.
To verify that the initialization of shards is ongoing:
kubectl exec -it pod/opensearch-master-0 -n stacklight -c opensearch -- bash
curl "http://localhost:9200/_cat/shards" | grep INITIALIZING
Example of system response:
.ds-system-000072 2 r INITIALIZING 10.232.182.135 opensearch-master-1
.ds-system-000073 1 r INITIALIZING 10.232.7.145 opensearch-master-2
.ds-system-000073 2 r INITIALIZING 10.232.182.135 opensearch-master-1
.ds-audit-000001 2 r INITIALIZING 10.232.7.145 opensearch-master-2
The system response above indicates that shards from the
.ds-system-000072, .ds-system-000073, and .ds-audit-000001
indicies are in the INITIALIZING state. In this case, Mirantis
recommends waiting until this process is finished, and only then consider
changing the limit.
You can additionally analyze the exact level of throttling and the current CPU usage on the Kubernetes Containers dashboard in Grafana.
Workaround:
Verify the currently configured CPU requests and limits for the
opensearchcontainers:kubectl -n stacklight get statefulset.apps/opensearch-master -o jsonpath="{.spec.template.spec.containers[?(@.name=='opensearch')].resources}"
Example of system response:
{"limits":{"cpu":"600m","memory":"8Gi"},"requests":{"cpu":"500m","memory":"6Gi"}}
In the example above, the CPU request is
500mand the CPU limit is600m.Increase the CPU limit to a reasonably high number.
For example, the default CPU limit for the clusters with the
clusterSize:largeparameter set was increased from8000mto12000mfor StackLight in Container Cloud 2.27.0 (Cluster releases 17.2.0 and 16.2.0).Note
For details, on the
clusterSizeparameter, see MOSK Operations Guide: StackLight configuration parameters - Cluster size.If the defaults are already overridden on the affected cluster using the
resourcesPerClusterSizeorresourcesparameters as described in MOSK Operations Guide: StackLight configuration parameters - Resource limits, then the exact recommended number depends on the currently set limit.Mirantis recommends increasing the limit by 50%. If it does not resolve the issue, another increase iteration will be required.
When you select the required CPU limit, increase it as described in MOSK Operations Guide: StackLight configuration parameters - Resource limits.
If the CPU limit for the
opensearchcomponent is already set, increase it in theClusterobject for theopensearchparameter. Otherwise, the default StackLight limit is used. In this case, increase the CPU limit for theopensearchcomponent using theresourcesparameter.Wait until all
opensearch-masterpods are recreated with the new CPU limits and becomerunningandready.To verify the current CPU limit for every
opensearchcontainer in everyopensearch-masterpod separately:kubectl -n stacklight get pod/opensearch-master-<podSuffixNumber> -o jsonpath="{.spec.containers[?(@.name=='opensearch')].resources}"
In the command above, replace
<podSuffixNumber>with the name of the pod suffix. For example,pod/opensearch-master-0orpod/opensearch-master-2.Example of system response:
{"limits":{"cpu":"900m","memory":"8Gi"},"requests":{"cpu":"500m","memory":"6Gi"}}
The waiting time may take up to 20 minutes depending on the cluster size.
If the issue is fixed, the KubeContainersCPUThrottlingHigh alert stops
firing immediately, while OpenSearchClusterStatusWarning or
OpenSearchClusterStatusCritical can still be firing for some time during
shard relocation.
If the KubeContainersCPUThrottlingHigh alert is still firing, proceed with
another iteration of the CPU limit increase.
Fixed in 17.2.0, 16.2.0, 17.1.6, 16.1.6
While updating rollover_policy for the current system* and audit*
data streams, the update is not applied to indices.
One of indicators that the cluster is most likely affected is the
KubeJobFailed alert firing for the elasticsearch-curator job and one or
both of the following errors being present in elasticsearch-curator pods
that remain in the Error status:
2024-05-31 13:16:04,459 ERROR Failed to complete action: delete_indices. <class 'curator.exceptions.FailedExecution'>: Exception encountered. Rerun with loglevel DEBUG and/or check Elasticsearch logs for more information. Exception: RequestError(400, 'illegal_argument_exception', 'index [.ds-audit-000001] is the write index for data stream [audit] and cannot be deleted')
or
2024-05-31 13:16:04,459 ERROR Failed to complete action: delete_indices. <class 'curator.exceptions.FailedExecution'>: Exception encountered. Rerun with loglevel DEBUG and/or check Elasticsearch logs for more information. Exception: RequestError(400, 'illegal_argument_exception', 'index [.ds-system-000001] is the write index for data stream [system] and cannot be deleted')
Note
Instead of .ds-audit-000001 or .ds-system-000001 index names,
similar names can be present with the same prefix but different suffix
numbers.
If the above mentioned alert and errors are present, an immediate action is required, because it indicates that the corresponding index size has already exceeded the space allocated for the index.
To verify that the cluster is affected:
Caution
Verify and apply the workaround to both index patterns, system and audit, separately.
If one of indices is affected, the second one is most likely affected as well. Although in rare cases, only one index may be affected.
Log in to the
opensearch-master-0Pod:kubectl exec -it pod/opensearch-master-0 -n stacklight -c opensearch -- bash
Verify that the rollover policy is present:
system:curl localhost:9200/_plugins/_ism/policies/system_rollover_policyaudit:curl localhost:9200/_plugins/_ism/policies/audit_rollover_policy
The cluster is affected if the rollover policy is missing. Otherwise, proceed to the following step.
Verify the system response from the previous step. For example:
{"_id":"system_rollover_policy","_version":7229,"_seq_no":42362,"_primary_term":28,"policy":{"policy_id":"system_rollover_policy","description":"system index rollover policy.","last_updated_time":1708505222430,"schema_version":19,"error_notification":null,"default_state":"rollover","states":[{"name":"rollover","actions":[{"retry":{"count":3,"backoff":"exponential","delay":"1m"},"rollover":{"min_size":"14746mb","copy_alias":false}}],"transitions":[]}],"ism_template":[{"index_patterns":["system*"],"priority":200,"last_updated_time":1708505222430}]}}
Verify and capture the following items separately for every policy:
The
_seq_noand_primary_termvaluesThe rollover policy threshold, which is defined in
policy.states[0].actions[0].rollover.min_size
List indices:
system:curl localhost:9200/_cat/indices | grep system
Example of system response:
[...] green open .ds-system-000001 FjglnZlcTKKfKNbosaE9Aw 2 1 1998295 0 1gb 507.9mb
audit:curl localhost:9200/_cat/indices | grep audit
Example of system response:
[...] green open .ds-audit-000001 FjglnZlcTKKfKNbosaE9Aw 2 1 1998295 0 1gb 507.9mb
Select the index with the highest number and verify the rollover policy attached to the index:
system:curl localhost:9200/_plugins/_ism/explain/.ds-system-000001audit:curl localhost:9200/_plugins/_ism/explain/.ds-audit-000001If the rollover policy is not attached, the cluster is affected.
If the rollover policy is attached but
_seq_noand_primary_termnumbers do not match the previously captured ones, the cluster is affected.If the index size drastically exceeds the defined threshold of the rollover policy (which is the previously captured
min_size), the cluster is most probably affected.
Workaround:
Log in to the
opensearch-master-0Pod:kubectl exec -it pod/opensearch-master-0 -n stacklight -c opensearch -- bash
If the policy is attached to the index but has different
_seq_noand_primary_term, remove the policy from the index:Note
Use the index with the highest number in the name, which was captured during verification procedure.
system:curl -XPOST localhost:9200/_plugins/_ism/remove/.ds-system-000001
audit:curl -XPOST localhost:9200/_plugins/_ism/remove/.ds-audit-000001
Re-add the policy:
system:curl -XPOST -H "Content-type: application/json" localhost:9200/_plugins/_ism/add/system* -d'{"policy_id":"system_rollover_policy"}'
audit:curl -XPOST -H "Content-type: application/json" localhost:9200/_plugins/_ism/add/audit* -d'{"policy_id":"audit_rollover_policy"}'
Perform again the last step of the cluster verification procedure provided above and make sure that the policy is attached to the index and has the same
_seq_noand_primary_term.If the index size drastically exceeds the defined threshold of the rollover policy (which is the previously captured
min_size), wait up to 15 minutes and verify that the additional index is created with the consecutive number in the index name. For example:system: if you applied changes to.ds-system-000001, wait until.ds-system-000002is created.audit: if you applied changes to.ds-audit-000001, wait until.ds-audit-000002is created.
If such index is not created, escalate the issue to Mirantis support.
During configuration of a management cluster settings using the Configure cluster web UI menu, updating the Keycloak Truststore settings is mandatory, despite being optional.
As a workaround, update the management cluster using the API or CLI.
This section lists the artifacts of components included in the Container Cloud patch release 2.26.3. For artifacts of the Cluster releases introduced in 2.26.3, see patch Cluster releases 17.1.3 and 16.1.3.
Note
The components that are newly added, updated, deprecated, or removed
as compared to the previous release version, are marked
with a corresponding superscript,
for example, lcm-ansible Updated.
Artifact |
Component |
Path |
|---|---|---|
Binaries Updated |
ironic-python-agent.initramfs |
https://binary.mirantis.com/bm/bin/ironic/ipa/ubuntu/initramfs-yoga-focal-debug-20240411174919 |
ironic-python-agent.kernel |
https://binary.mirantis.com/bm/bin/ironic/ipa/ubuntu/kernel-yoga-focal-debug-20240411174919 |
|
Helm charts Updated |
baremetal-api |
https://binary.mirantis.com/core/helm/baremetal-api-1.39.23.tgz |
baremetal-operator |
https://binary.mirantis.com/core/helm/baremetal-operator-1.39.23.tgz |
|
baremetal-provider |
https://binary.mirantis.com/core/helm/baremetal-provider-1.39.23.tgz |
|
baremetal-public-api |
https://binary.mirantis.com/core/helm/baremetal-public-api-1.39.23.tgz |
|
kaas-ipam |
||
local-volume-provisioner |
https://binary.mirantis.com/core/helm/local-volume-provisioner-1.39.23.tgz |
|
metallb |
||
Docker images |
ambasador Updated |
mirantis.azurecr.io/core/external/nginx:1.39.23 |
baremetal-dnsmasq Updated |
mirantis.azurecr.io/bm/baremetal-dnsmasq:base-2-26-alpine-20240408141922 |
|
baremetal-operator Updated |
mirantis.azurecr.io/bm/baremetal-operator:base-2-26-alpine-20240408141703 |
|
bm-collective Updated |
mirantis.azurecr.io/bm/bm-collective:base-2-26-alpine-20240408142218 |
|
cluster-api-provider-baremetal Updated |
mirantis.azurecr.io/core/cluster-api-provider-baremetal:1.39.23 |
|
ironic |
mirantis.azurecr.io/openstack/ironic:yoga-jammy-20240226060024 |
|
ironic-inspector |
mirantis.azurecr.io/openstack/ironic-inspector:yoga-jammy-20240226060024 |
|
ironic-prometheus-exporter |
mirantis.azurecr.io/stacklight/ironic-prometheus-exporter:0.1-20240117102150 |
|
kaas-ipam Updated |
mirantis.azurecr.io/bm/kaas-ipam:base-2-26-alpine-20240408150853 |
|
kubernetes-entrypoint |
mirantis.azurecr.io/openstack/extra/kubernetes-entrypoint:v1.0.1-55b02f7-20231019172556 |
|
mariadb |
mirantis.azurecr.io/general/mariadb:10.6.14-focal-20240311120505 |
|
mcc-keepalived |
mirantis.azurecr.io/lcm/mcc-keepalived:v0.24.0-47-gf77368e |
|
metallb-controller Updated |
mirantis.azurecr.io/bm/metallb/controller:v0.13.12-ef4c9453-amd64 |
|
metallb-speaker Updated |
mirantis.azurecr.io/bm/metallb/speaker:v0.13.12-ef4c9453-amd64 |
|
syslog-ng |
mirantis.azurecr.io/bm/syslog-ng:base-alpine-20240129163811 |
Artifact |
Component |
Path |
|---|---|---|
Bootstrap tarball Updated |
bootstrap-darwin |
https://binary.mirantis.com/core/bin/bootstrap-darwin-1.39.23.tgz |
bootstrap-linux |
https://binary.mirantis.com/core/bin/bootstrap-linux-1.39.23.tgz |
|
Helm charts Updated |
admission-controller |
https://binary.mirantis.com/core/helm/admission-controller-1.39.23.tgz |
agent-controller |
https://binary.mirantis.com/core/helm/agent-controller-1.39.23.tgz |
|
byo-credentials-controller |
https://binary.mirantis.com/core/helm/byo-credentials-controller-1.39.23.tgz |
|
byo-provider |
https://binary.mirantis.com/core/helm/byo-provider-1.39.23.tgz |
|
ceph-kcc-controller |
https://binary.mirantis.com/core/helm/ceph-kcc-controller-1.39.23.tgz |
|
cert-manager |
https://binary.mirantis.com/core/helm/cert-manager-1.39.23.tgz |
|
cinder-csi-plugin |
https://binary.mirantis.com/core/helm/cinder-csi-plugin-1.39.23.tgz |
|
client-certificate-controller |
https://binary.mirantis.com/core/helm/client-certificate-controller-1.39.23.tgz |
|
configuration-collector |
https://binary.mirantis.com/core/helm/configuration-collector-1.39.23.tgz |
|
event-controller |
https://binary.mirantis.com/core/helm/event-controller-1.39.23.tgz |
|
host-os-modules-controller |
https://binary.mirantis.com/core/helm/host-os-modules-controller-1.39.23.tgz |
|
iam-controller |
https://binary.mirantis.com/core/helm/iam-controller-1.39.23.tgz |
|
kaas-exporter |
https://binary.mirantis.com/core/helm/kaas-exporter-1.39.23.tgz |
|
kaas-public-api |
https://binary.mirantis.com/core/helm/kaas-public-api-1.39.23.tgz |
|
kaas-ui |
||
lcm-controller |
https://binary.mirantis.com/core/helm/lcm-controller-1.39.23.tgz |
|
license-controller |
https://binary.mirantis.com/core/helm/license-controller-1.39.23.tgz |
|
machinepool-controller |
https://binary.mirantis.com/core/helm/machinepool-controller-1.39.23.tgz |
|
mcc-cache |
||
mcc-cache-warmup |
https://binary.mirantis.com/core/helm/mcc-cache-warmup-1.39.23.tgz |
|
metrics-server |
https://binary.mirantis.com/core/helm/metrics-server-1.39.23.tgz |
|
openstack-cloud-controller-manager |
https://binary.mirantis.com/core/helm/openstack-cloud-controller-manager-1.39.23.tgz |
|
openstack-provider |
https://binary.mirantis.com/core/helm/openstack-provider-1.39.23.tgz |
|
os-credentials-controller |
https://binary.mirantis.com/core/helm/os-credentials-controller-1.39.23.tgz |
|
policy-controller |
https://binary.mirantis.com/core/helm/policy-controller-1.39.23.tgz |
|
portforward-controller |
https://binary.mirantis.com/core/helm/portforward-controller-1.39.23.tgz |
|
proxy-controller |
https://binary.mirantis.com/core/helm/proxy-controller-1.39.23.tgz |
|
rbac-controller |
https://binary.mirantis.com/core/helm/rbac-controller-1.39.23.tgz |
|
release-controller |
https://binary.mirantis.com/core/helm/release-controller-1.39.23.tgz |
|
rhellicense-controller |
https://binary.mirantis.com/core/helm/rhellicense-controller-1.39.23.tgz |
|
scope-controller |
https://binary.mirantis.com/core/helm/scope-controller-1.39.23.tgz |
|
squid-proxy |
https://binary.mirantis.com/core/helm/squid-proxy-1.39.23.tgz |
|
user-controller |
https://binary.mirantis.com/core/helm/user-controller-1.39.23.tgz |
|
vsphere-cloud-controller-manager |
https://binary.mirantis.com/core/helm/vsphere-cloud-controller-manager-1.39.23.tgz |
|
vsphere-credentials-controller |
https://binary.mirantis.com/core/helm/vsphere-credentials-controller-1.39.23.tgz |
|
vsphere-csi-plugin |
https://binary.mirantis.com/core/helm/vsphere-csi-plugin-1.39.23.tgz |
|
vsphere-provider |
https://binary.mirantis.com/core/helm/vsphere-provider-1.39.23.tgz |
|
vsphere-vm-template-controller |
https://binary.mirantis.com/core/helm/vsphere-vm-template-controller-1.39.23.tgz |
|
Docker images |
admission-controller Updated |
mirantis.azurecr.io/core/admission-controller:1.39.23 |
agent-controller Updated |
mirantis.azurecr.io/core/agent-controller:1.39.23 |
|
byo-cluster-api-controller Updated |
mirantis.azurecr.io/core/byo-cluster-api-controller:1.39.23 |
|
byo-credentials-controller Updated |
mirantis.azurecr.io/core/byo-credentials-controller:1.39.23 |
|
ceph-kcc-controller Updated |
mirantis.azurecr.io/core/ceph-kcc-controller:1.39.23 |
|
cert-manager-controller Updated |
mirantis.azurecr.io/core/external/cert-manager-controller:v1.11.0-6 |
|
cinder-csi-plugin Updated |
mirantis.azurecr.io/lcm/kubernetes/cinder-csi-plugin:v1.27.2-14 |
|
client-certificate-controller Updated |
mirantis.azurecr.io/core/client-certificate-controller:1.39.23 |
|
configuration-collector Updated |
mirantis.azurecr.io/core/configuration-collector:1.39.23 |
|
csi-attacher Updated |
mirantis.azurecr.io/lcm/k8scsi/csi-attacher:v4.2.0-5 |
|
csi-node-driver-registrar Updated |
mirantis.azurecr.io/lcm/k8scsi/csi-node-driver-registrar:v2.7.0-5 |
|
csi-provisioner Updated |
mirantis.azurecr.io/lcm/k8scsi/csi-provisioner:v3.4.1-5 |
|
csi-resizer Updated |
mirantis.azurecr.io/lcm/k8scsi/csi-resizer:v1.7.0-5 |
|
csi-snapshotter Updated |
mirantis.azurecr.io/lcm/k8scsi/csi-snapshotter:v6.2.1-mcc-4 |
|
event-controller Updated |
mirantis.azurecr.io/core/event-controller:1.39.23 |
|
frontend Updated |
mirantis.azurecr.io/core/frontend:1.39.23 |
|
host-os-modules-controller Updated |
mirantis.azurecr.io/core/host-os-modules-controller:1.39.23 |
|
iam-controller Updated |
mirantis.azurecr.io/core/iam-controller:1.39.23 |
|
kaas-exporter Updated |
mirantis.azurecr.io/core/kaas-exporter:1.39.23 |
|
kproxy Updated |
mirantis.azurecr.io/core/kproxy:1.39.23 |
|
lcm-controller Updated |
mirantis.azurecr.io/core/lcm-controller:1.39.23 |
|
license-controller Updated |
mirantis.azurecr.io/core/license-controller:1.39.23 |
|
livenessprobe Updated |
mirantis.azurecr.io/lcm/k8scsi/livenessprobe:v2.9.0-5 |
|
machinepool-controller Updated |
mirantis.azurecr.io/core/machinepool-controller:1.39.23 |
|
mcc-haproxy |
mirantis.azurecr.io/lcm/mcc-haproxy:v0.24.0-47-gf77368e |
|
mcc-keepalived |
mirantis.azurecr.io/lcm/mcc-keepalived:v0.24.0-47-gf77368e |
|
metrics-server Updated |
mirantis.azurecr.io/lcm/metrics-server-amd64:v0.6.3-7 |
|
nginx Updated |
mirantis.azurecr.io/core/external/nginx:1.39.23 |
|
openstack-cloud-controller-manager Updated |
mirantis.azurecr.io/lcm/kubernetes/openstack-cloud-controller-manager:v1.27.2-14 |
|
openstack-cluster-api-controller Updated |
mirantis.azurecr.io/core/openstack-cluster-api-controller:1.39.23 |
|
os-credentials-controller Updated |
mirantis.azurecr.io/core/os-credentials-controller:1.39.23 |
|
policy-controller Updated |
mirantis.azurecr.io/core/policy-controller:1.39.23 |
|
portforward-controller Updated |
mirantis.azurecr.io/core/portforward-controller:1.39.23 |
|
proxy-controller Updated |
mirantis.azurecr.io/core/proxy-controller:1.39.23 |
|
rbac-controller Updated |
mirantis.azurecr.io/core/rbac-controller:1.39.23 |
|
registry |
mirantis.azurecr.io/lcm/registry:v2.8.1-9 |
|
release-controller Updated |
mirantis.azurecr.io/core/release-controller:1.39.23 |
|
rhellicense-controller Updated |
mirantis.azurecr.io/core/rhellicense-controller:1.39.23 |
|
scope-controller Updated |
mirantis.azurecr.io/core/scope-controller:1.39.23 |
|
squid-proxy |
mirantis.azurecr.io/lcm/squid-proxy:0.0.1-10-g24a0d69 |
|
user-controller Updated |
mirantis.azurecr.io/core/user-controller:1.39.23 |
|
vsphere-cloud-controller-manager Updated |
mirantis.azurecr.io/lcm/kubernetes/vsphere-cloud-controller-manager:v1.27.0-6 |
|
vsphere-cluster-api-controller Updated |
mirantis.azurecr.io/core/vsphere-cluster-api-controller:1.39.23 |
|
vsphere-credentials-controller Updated |
mirantis.azurecr.io/core/vsphere-credentials-controller:1.39.23 |
|
vsphere-csi-driver |
mirantis.azurecr.io/lcm/kubernetes/vsphere-csi-driver:v3.0.2-1 |
|
vsphere-csi-syncer |
mirantis.azurecr.io/lcm/kubernetes/vsphere-csi-syncer:v3.0.2-1 |
|
vsphere-vm-template-controller Updated |
mirantis.azurecr.io/core/vsphere-vm-template-controller:1.39.23 |
Artifact |
Component |
Path |
|---|---|---|
Binaries |
hash-generate-darwin |
http://binary.mirantis.com/iam/bin/hash-generate-0.0.1-268-3cf7f17-darwin |
hash-generate-linux |
http://binary.mirantis.com/iam/bin/hash-generate-0.0.1-268-3cf7f17-linux |
|
Helm charts |
iam Updated |
|
Docker images |
kubectl |
mirantis.azurecr.io/stacklight/kubectl:1.22-20240221023016 |
kubernetes-entrypoint |
mirantis.azurecr.io/openstack/extra/kubernetes-entrypoint:v1.0.1-55b02f7-20231019172556 |
|
mariadb |
mirantis.azurecr.io/general/mariadb:10.6.14-focal-20240311120505 |
|
mcc-keycloak |
mirantis.azurecr.io/iam/mcc-keycloak:23.0.6-20240216125244 |
See also
The Container Cloud patch release 2.26.2, which is based on the 2.26.0 major release, provides the following updates:
Support for the patch Cluster releases 16.1.2 and 17.1.2 that represents Mirantis OpenStack for Kubernetes (MOSK) patch release 24.1.2 patch.
Support for MKE 3.7.6.
Support for
docker-ee-cli23.0.10 in MCR 23.0.9 to fix several CVEs.Bare metal: update of Ubuntu mirror from 20.04~20240302175618 to 20.04~20240324172903 along with update of minor kernel version from 5.15.0-97-generic to 5.15.0-101-generic.
Security fixes for CVEs in images.
This patch release also supports the latest major Cluster releases 17.1.0 and 16.1.0. And it does not support greenfield deployments based on deprecated Cluster releases. Use the latest available Cluster release instead.
For main deliverables of the parent Container Cloud release of 2.26.2, refer to 2.26.0.
The table below includes the total numbers of addressed unique and common CVEs in images by product component since the Container Cloud 2.26.1 patch release. The common CVEs are issues addressed across several images.
Product component |
CVE type |
Critical |
High |
Total |
|---|---|---|---|---|
Ceph |
Unique |
0 |
3 |
3 |
Common |
0 |
12 |
12 |
|
Kaas core |
Unique |
1 |
6 |
7 |
Common |
1 |
11 |
12 |
|
StackLight |
Unique |
0 |
1 |
1 |
Common |
0 |
10 |
10 |
Mirantis Security Portal
For the detailed list of fixed and existing CVEs across the Mirantis Container Cloud and MOSK products, refer to Mirantis Security Portal.
MOSK CVEs
For the number of fixed CVEs in the MOSK-related components including OpenStack and Tungsten Fabric, refer to MOSK 24.1.2: Security notes.
This section lists known issues with workarounds for the Mirantis Container Cloud release 2.26.2 including the Cluster releases 17.1.2 and 16.1.2.
For other issues that can occur while deploying and operating a Container Cloud cluster, see Troubleshooting Guide.
Note
This section also outlines still valid known issues from previous Container Cloud releases.
Fixed in 2.28.0 (17.3.0 and 16.3.0)
When trying to list the HostOSConfigurationModules and HostOSConfiguration custom resources, serviceuser or a user with
the global-admin or operator role obtains the access denied error.
For example:
kubectl --kubeconfig ~/.kube/mgmt-config get hocm
Error from server (Forbidden): hostosconfigurationmodules.kaas.mirantis.com is forbidden:
User "2d74348b-5669-4c65-af31-6c05dbedac5f" cannot list resource "hostosconfigurationmodules"
in API group "kaas.mirantis.com" at the cluster scope: access denied
Workaround:
Modify the
global-adminrole by adding a new entry with the following contents to theruleslist:kubectl edit clusterroles kaas-global-admin
- apiGroups: [kaas.mirantis.com] resources: [hostosconfigurationmodules] verbs: ['*']
For each Container Cloud project, modify the
kaas-operatorrole by adding a new entry with the following contents to theruleslist:kubectl -n <projectName> edit roles kaas-operator
- apiGroups: [kaas.mirantis.com] resources: [hostosconfigurations] verbs: ['*']
Due to the MetalLB upstream issue, a load balancer service may not obtain the external IP address.
The issue occurs when two services share the same external IP address and have
the same externalTrafficPolicy value. Initially, the services have the
external IP address assigned and are accessible. After modifying the
externalTrafficPolicy value for both services from Cluster to
Local, the first service that has been changed remains with no external IP
address assigned. Though, the second service, which was changed later, has the
external IP assigned as expected.
To work around the issue, make a dummy change to the service object where
external IP is <pending>:
Identify the service that is stuck:
kubectl get svc -A | grep pending
Example of system response:
stacklight iam-proxy-prometheus LoadBalancer 10.233.28.196 <pending> 443:30430/TCP
Add an arbitrary label to the service that is stuck. For example:
kubectl label svc -n stacklight iam-proxy-prometheus reconcile=1
Example of system response:
service/iam-proxy-prometheus labeledVerify that the external IP was allocated to the service:
kubectl get svc -n stacklight iam-proxy-prometheus
Example of system response:
NAME TYPE CLUSTER-IP EXTERNAL-IP PORT(S) AGE iam-proxy-prometheus LoadBalancer 10.233.28.196 10.0.34.108 443:30430/TCP 12d
Fixed in 2.28.0 (17.3.0 and 16.3.0)
After node maintenance of a management cluster, the newly added nodes may fail to undergo provisioning successfully. The issue relates to new nodes that are in the same L2 domain as the management cluster.
The issue was observed on environments having management cluster nodes configured with a single L2 segment used for all network traffic (PXE and LCM/management networks).
To verify whether the cluster is affected:
Verify whether the dnsmasq and dhcp-relay pods run on the same node
in the management cluster:
kubectl -n kaas get pods -o wide| grep -e "dhcp\|dnsmasq"
Example of system response:
dhcp-relay-7d85f75f76-5vdw2 2/2 Running 2 (36h ago) 36h 10.10.0.122 kaas-node-8a24b81c-76d0-4d4c-8421-962bd39df5ad <none> <none>
dnsmasq-8f4b484b4-slhbd 5/5 Running 1 (36h ago) 36h 10.233.123.75 kaas-node-8a24b81c-76d0-4d4c-8421-962bd39df5ad <none> <none>
If this is the case, proceed to the workaround below.
Workaround:
Log in to a node that contains
kubeconfigof the affected management cluster.Make sure that at least two management cluster nodes are schedulable:
kubectl get node
Example of a positive system response:
NAME STATUS ROLES AGE VERSION kaas-node-bcedb87b-b3ce-46a4-a4ca-ea3068689e40 Ready master 37h v1.27.10-mirantis-1 kaas-node-8a24b81c-76d0-4d4c-8421-962bd39df5ad Ready master 37h v1.27.10-mirantis-1 kaas-node-ad5a6f51-b98f-43c3-91d5-55fed3d0ff21 Ready master 37h v1.27.10-mirantis-1
Delete the
dhcp-relaypod:kubectl -n kaas delete pod <dhcp-relay-xxxxx>
Verify that the
dnsmasqanddhcp-relaypods are scheduled into different nodes:kubectl -n kaas get pods -o wide| grep -e "dhcp\|dnsmasq"
Example of a positive system response:
dhcp-relay-7d85f75f76-rkv03 2/2 Running 0 49s 10.10.0.121 kaas-node-bcedb87b-b3ce-46a4-a4ca-ea3068689e40 <none> <none> dnsmasq-8f4b484b4-slhbd 5/5 Running 1 (37h ago) 37h 10.233.123.75 kaas-node-8a24b81c-76d0-4d4c-8421-962bd39df5ad <none> <none>
During deletion of a manager machine running the ironic Pod from a bare
metal management cluster, the following problems occur:
All Pods are stuck in the
TerminatingstateA new
ironicPod fails to startThe related bare metal host is stuck in the
deprovisioningstate
As a workaround, before deletion of the node running the ironic Pod,
cordon and drain the node using the kubectl cordon <nodeName> and
kubectl drain <nodeName> commands.
Due to issues with managing physical NVME devices, lcm-agent cannot grab
storage information on a host. As a result,
lcmmachine.status.hostinfo.hardware is empty and the following example
error is present in logs:
{"level":"error","ts":"2024-05-02T12:26:10Z","logger":"agent", \
"msg":"get hardware details", \
"host":"kaas-node-548b2861-aed0-41c9-8ff2-10c5476b000b", \
"error":"new storage info: get disk info \"nvme0c0n1\": \
invoke command: exit status 1","errorVerbose":"exit status 1
As a workaround, on the affected node, create a symlink for any device
indicated in lcm-agent logs. For example:
ln -sfn /dev/nvme0n1 /dev/nvme0c0n1
During deletion of a machine, the related DaemonSet Pod can remain on the
deleted node in the Terminating state. As a workaround, manually
delete the Pod:
kubectl delete pod -n <podNamespace> <podName>
Fixed in 2.29.0 (17.4.0 and 16.4.0)
During the replacement of a master node on a cluster of any type, the process
may get stuck with Kubelet's NodeReady condition is Unknown in the
machine status on the remaining master nodes.
As a workaround, log in on the affected node and run the following command:
docker restart ucp-kubelet
During MariaDB operations on a management cluster, Pods may get stuck in continuous restarts with the following example error:
[ERROR] WSREP: Corrupt buffer header: \
addr: 0x7faec6f8e518, \
seqno: 3185219421952815104, \
size: 909455917, \
ctx: 0x557094f65038, \
flags: 11577. store: 49, \
type: 49
Workaround:
Create a backup of the
/var/lib/mysqldirectory on themariadb-serverPod.Verify that other replicas are up and ready.
Remove the
galera.cachefile for the affectedmariadb-serverPod.Remove the affected
mariadb-serverPod or wait until it is automatically restarted.
After Kubernetes restarts the Pod, the Pod clones the database in 1-2 minutes and restores the quorum.
Fixed in 2.28.4 (17.3.4 and 16.3.4)
During replacement of a master node on a cluster of any type, the
calico-node Pod fails to start on a new node that has the same IP address
as the node being replaced.
Workaround:
Log in to any
masternode.From a CLI with an MKE client bundle, create a shell alias to start calicoctl using the
mirantis/ucp-dsinfoimage:alias calicoctl="\ docker run -i --rm \ --pid host \ --net host \ -e constraint:ostype==linux \ -e ETCD_ENDPOINTS=<etcdEndpoint> \ -e ETCD_KEY_FILE=/var/lib/docker/volumes/ucp-kv-certs/_data/key.pem \ -e ETCD_CA_CERT_FILE=/var/lib/docker/volumes/ucp-kv-certs/_data/ca.pem \ -e ETCD_CERT_FILE=/var/lib/docker/volumes/ucp-kv-certs/_data/cert.pem \ -v /var/run/calico:/var/run/calico \ -v /var/lib/docker/volumes/ucp-kv-certs/_data:/var/lib/docker/volumes/ucp-kv-certs/_data:ro \ mirantis/ucp-dsinfo:<mkeVersion> \ calicoctl \ "
alias calicoctl="\ docker run -i --rm \ --pid host \ --net host \ -e constraint:ostype==linux \ -e ETCD_ENDPOINTS=<etcdEndpoint> \ -e ETCD_KEY_FILE=/ucp-node-certs/key.pem \ -e ETCD_CA_CERT_FILE=/ucp-node-certs/ca.pem \ -e ETCD_CERT_FILE=/ucp-node-certs/cert.pem \ -v /var/run/calico:/var/run/calico \ -v ucp-node-certs:/ucp-node-certs:ro \ mirantis/ucp-dsinfo:<mkeVersion> \ calicoctl --allow-version-mismatch \ "
In the above command, replace the following values with the corresponding settings of the affected cluster:
<etcdEndpoint>is the etcd endpoint defined in the Calico configuration file. For example,ETCD_ENDPOINTS=127.0.0.1:12378<mkeVersion>is the MKE version installed on your cluster. For example,mirantis/ucp-dsinfo:3.5.7.
Verify the node list on the cluster:
kubectl get node
Compare this list with the node list in Calico to identify the old node:
calicoctl get node -o wide
Remove the old node from Calico:
calicoctl delete node kaas-node-<nodeID>
Fixed in 2.28.4 (17.3.4 and 16.3.4)
During replacement of a manager machine, the following problems may occur:
The system adds the node to Docker swarm but not to Kubernetes
The node
Deploymentgets stuck with failed RethinkDB health checks
Workaround:
Delete the failed node.
Wait for the MKE cluster to become healthy. To monitor the cluster status:
Log in to the MKE web UI.
Monitor the cluster status as described in MKE Operations Guide: Monitor an MKE cluster with the MKE web UI.
Deploy a new node.
Fixed in 2.28.4 (17.3.4 and 16.3.4)
During the unsafe or forced deletion of a manager machine running the
calico-kube-controllers Pod in the kube-system namespace,
the following issues occur:
The
calico-kube-controllersPod fails to clean up resources associated with the deleted nodeThe
calico-nodePod may fail to start up on a newly created node if the machine is provisioned with the same IP address as the deleted machine had
As a workaround, before deletion of the node running the
calico-kube-controllers Pod, cordon and drain the node:
kubectl cordon <nodeName>
kubectl drain <nodeName>
Fixed in 2.27.0 (17.2.0 and 16.2.0)
During graceful reboot of a cluster with Ceph enabled, the reboot is blocked
with the following message in the MiraCephMaintenance object status:
message: ClusterMaintenanceRequest found, Ceph Cluster is not ready to upgrade,
delaying cluster maintenance
As a workaround, add the following snippet to the cephFS section under
metadataServer in the spec section of <kcc-name>.yaml in the Ceph
cluster:
cephClusterSpec:
sharedFilesystem:
cephFS:
- name: cephfs-store
metadataServer:
activeCount: 1
healthCheck:
livenessProbe:
probe:
failureThreshold: 5
initialDelaySeconds: 30
periodSeconds: 30
successThreshold: 1
timeoutSeconds: 5
Note
The issue does not reproduce since MOSK 25.2.
Update of a managed cluster based on bare metal and Ceph enabled fails with
PersistentVolumeClaim getting stuck in the Pending state for the
prometheus-server StatefulSet and the
MountVolume.MountDevice failed for volume warning in the StackLight event
logs.
Workaround:
Verify that the description of the Pods that failed to run contain the
FailedMountevents:kubectl -n <affectedProjectName> describe pod <affectedPodName>
In the command above, replace the following values:
<affectedProjectName>is the Container Cloud project name where the Pods failed to run<affectedPodName>is a Pod name that failed to run in the specified project
In the Pod description, identify the node name where the Pod failed to run.
Verify that the
csi-rbdpluginlogs of the affected node contain therbd volume mount failed: <csi-vol-uuid> is being usederror. The<csi-vol-uuid>is a unique RBD volume name.Identify
csiPodNameof the correspondingcsi-rbdplugin:kubectl -n rook-ceph get pod -l app=csi-rbdplugin \ -o jsonpath='{.items[?(@.spec.nodeName == "<nodeName>")].metadata.name}'
Output the affected
csiPodNamelogs:kubectl -n rook-ceph logs <csiPodName> -c csi-rbdplugin
Scale down the affected
StatefulSetorDeploymentof the Pod that fails to0replicas.On every
csi-rbdpluginPod, search for stuckcsi-vol:for pod in `kubectl -n rook-ceph get pods|grep rbdplugin|grep -v provisioner|awk '{print $1}'`; do echo $pod kubectl exec -it -n rook-ceph $pod -c csi-rbdplugin -- rbd device list | grep <csi-vol-uuid> done
Unmap the affected
csi-vol:rbd unmap -o force /dev/rbd<i>
The
/dev/rbd<i>value is a mapped RBD volume that usescsi-vol.Delete
volumeattachmentof the affected Pod:kubectl get volumeattachments | grep <csi-vol-uuid> kubectl delete volumeattacmhent <id>
Scale up the affected
StatefulSetorDeploymentback to the original number of replicas and wait until its state becomesRunning.
Fixed in 17.2.0, 16.2.0, 17.1.6, 16.1.6
On large managed clusters, shard relocation may fail in the OpenSearch cluster
with the yellow or red status of the OpenSearch cluster.
The characteristic symptom of the issue is that in the stacklight
namespace, the statefulset.apps/opensearch-master containers are
experiencing throttling with the KubeContainersCPUThrottlingHigh alert
firing for the following set of labels:
{created_by_kind="StatefulSet",created_by_name="opensearch-master",namespace="stacklight"}
Caution
The throttling that OpenSearch is experiencing may be a temporary situation, which may be related, for example, to a peaky load and the ongoing shards initialization as part of disaster recovery or after node restart. In this case, Mirantis recommends waiting until initialization of all shards is finished. After that, verify the cluster state and whether throttling still exists. And only if throttling does not disappear, apply the workaround below.
To verify that the initialization of shards is ongoing:
kubectl exec -it pod/opensearch-master-0 -n stacklight -c opensearch -- bash
curl "http://localhost:9200/_cat/shards" | grep INITIALIZING
Example of system response:
.ds-system-000072 2 r INITIALIZING 10.232.182.135 opensearch-master-1
.ds-system-000073 1 r INITIALIZING 10.232.7.145 opensearch-master-2
.ds-system-000073 2 r INITIALIZING 10.232.182.135 opensearch-master-1
.ds-audit-000001 2 r INITIALIZING 10.232.7.145 opensearch-master-2
The system response above indicates that shards from the
.ds-system-000072, .ds-system-000073, and .ds-audit-000001
indicies are in the INITIALIZING state. In this case, Mirantis
recommends waiting until this process is finished, and only then consider
changing the limit.
You can additionally analyze the exact level of throttling and the current CPU usage on the Kubernetes Containers dashboard in Grafana.
Workaround:
Verify the currently configured CPU requests and limits for the
opensearchcontainers:kubectl -n stacklight get statefulset.apps/opensearch-master -o jsonpath="{.spec.template.spec.containers[?(@.name=='opensearch')].resources}"
Example of system response:
{"limits":{"cpu":"600m","memory":"8Gi"},"requests":{"cpu":"500m","memory":"6Gi"}}
In the example above, the CPU request is
500mand the CPU limit is600m.Increase the CPU limit to a reasonably high number.
For example, the default CPU limit for the clusters with the
clusterSize:largeparameter set was increased from8000mto12000mfor StackLight in Container Cloud 2.27.0 (Cluster releases 17.2.0 and 16.2.0).Note
For details, on the
clusterSizeparameter, see MOSK Operations Guide: StackLight configuration parameters - Cluster size.If the defaults are already overridden on the affected cluster using the
resourcesPerClusterSizeorresourcesparameters as described in MOSK Operations Guide: StackLight configuration parameters - Resource limits, then the exact recommended number depends on the currently set limit.Mirantis recommends increasing the limit by 50%. If it does not resolve the issue, another increase iteration will be required.
When you select the required CPU limit, increase it as described in MOSK Operations Guide: StackLight configuration parameters - Resource limits.
If the CPU limit for the
opensearchcomponent is already set, increase it in theClusterobject for theopensearchparameter. Otherwise, the default StackLight limit is used. In this case, increase the CPU limit for theopensearchcomponent using theresourcesparameter.Wait until all
opensearch-masterpods are recreated with the new CPU limits and becomerunningandready.To verify the current CPU limit for every
opensearchcontainer in everyopensearch-masterpod separately:kubectl -n stacklight get pod/opensearch-master-<podSuffixNumber> -o jsonpath="{.spec.containers[?(@.name=='opensearch')].resources}"
In the command above, replace
<podSuffixNumber>with the name of the pod suffix. For example,pod/opensearch-master-0orpod/opensearch-master-2.Example of system response:
{"limits":{"cpu":"900m","memory":"8Gi"},"requests":{"cpu":"500m","memory":"6Gi"}}
The waiting time may take up to 20 minutes depending on the cluster size.
If the issue is fixed, the KubeContainersCPUThrottlingHigh alert stops
firing immediately, while OpenSearchClusterStatusWarning or
OpenSearchClusterStatusCritical can still be firing for some time during
shard relocation.
If the KubeContainersCPUThrottlingHigh alert is still firing, proceed with
another iteration of the CPU limit increase.
Fixed in 17.2.0, 16.2.0, 17.1.6, 16.1.6
While updating rollover_policy for the current system* and audit*
data streams, the update is not applied to indices.
One of indicators that the cluster is most likely affected is the
KubeJobFailed alert firing for the elasticsearch-curator job and one or
both of the following errors being present in elasticsearch-curator pods
that remain in the Error status:
2024-05-31 13:16:04,459 ERROR Failed to complete action: delete_indices. <class 'curator.exceptions.FailedExecution'>: Exception encountered. Rerun with loglevel DEBUG and/or check Elasticsearch logs for more information. Exception: RequestError(400, 'illegal_argument_exception', 'index [.ds-audit-000001] is the write index for data stream [audit] and cannot be deleted')
or
2024-05-31 13:16:04,459 ERROR Failed to complete action: delete_indices. <class 'curator.exceptions.FailedExecution'>: Exception encountered. Rerun with loglevel DEBUG and/or check Elasticsearch logs for more information. Exception: RequestError(400, 'illegal_argument_exception', 'index [.ds-system-000001] is the write index for data stream [system] and cannot be deleted')
Note
Instead of .ds-audit-000001 or .ds-system-000001 index names,
similar names can be present with the same prefix but different suffix
numbers.
If the above mentioned alert and errors are present, an immediate action is required, because it indicates that the corresponding index size has already exceeded the space allocated for the index.
To verify that the cluster is affected:
Caution
Verify and apply the workaround to both index patterns, system and audit, separately.
If one of indices is affected, the second one is most likely affected as well. Although in rare cases, only one index may be affected.
Log in to the
opensearch-master-0Pod:kubectl exec -it pod/opensearch-master-0 -n stacklight -c opensearch -- bash
Verify that the rollover policy is present:
system:curl localhost:9200/_plugins/_ism/policies/system_rollover_policyaudit:curl localhost:9200/_plugins/_ism/policies/audit_rollover_policy
The cluster is affected if the rollover policy is missing. Otherwise, proceed to the following step.
Verify the system response from the previous step. For example:
{"_id":"system_rollover_policy","_version":7229,"_seq_no":42362,"_primary_term":28,"policy":{"policy_id":"system_rollover_policy","description":"system index rollover policy.","last_updated_time":1708505222430,"schema_version":19,"error_notification":null,"default_state":"rollover","states":[{"name":"rollover","actions":[{"retry":{"count":3,"backoff":"exponential","delay":"1m"},"rollover":{"min_size":"14746mb","copy_alias":false}}],"transitions":[]}],"ism_template":[{"index_patterns":["system*"],"priority":200,"last_updated_time":1708505222430}]}}
Verify and capture the following items separately for every policy:
The
_seq_noand_primary_termvaluesThe rollover policy threshold, which is defined in
policy.states[0].actions[0].rollover.min_size
List indices:
system:curl localhost:9200/_cat/indices | grep system
Example of system response:
[...] green open .ds-system-000001 FjglnZlcTKKfKNbosaE9Aw 2 1 1998295 0 1gb 507.9mb
audit:curl localhost:9200/_cat/indices | grep audit
Example of system response:
[...] green open .ds-audit-000001 FjglnZlcTKKfKNbosaE9Aw 2 1 1998295 0 1gb 507.9mb
Select the index with the highest number and verify the rollover policy attached to the index:
system:curl localhost:9200/_plugins/_ism/explain/.ds-system-000001audit:curl localhost:9200/_plugins/_ism/explain/.ds-audit-000001If the rollover policy is not attached, the cluster is affected.
If the rollover policy is attached but
_seq_noand_primary_termnumbers do not match the previously captured ones, the cluster is affected.If the index size drastically exceeds the defined threshold of the rollover policy (which is the previously captured
min_size), the cluster is most probably affected.
Workaround:
Log in to the
opensearch-master-0Pod:kubectl exec -it pod/opensearch-master-0 -n stacklight -c opensearch -- bash
If the policy is attached to the index but has different
_seq_noand_primary_term, remove the policy from the index:Note
Use the index with the highest number in the name, which was captured during verification procedure.
system:curl -XPOST localhost:9200/_plugins/_ism/remove/.ds-system-000001
audit:curl -XPOST localhost:9200/_plugins/_ism/remove/.ds-audit-000001
Re-add the policy:
system:curl -XPOST -H "Content-type: application/json" localhost:9200/_plugins/_ism/add/system* -d'{"policy_id":"system_rollover_policy"}'
audit:curl -XPOST -H "Content-type: application/json" localhost:9200/_plugins/_ism/add/audit* -d'{"policy_id":"audit_rollover_policy"}'
Perform again the last step of the cluster verification procedure provided above and make sure that the policy is attached to the index and has the same
_seq_noand_primary_term.If the index size drastically exceeds the defined threshold of the rollover policy (which is the previously captured
min_size), wait up to 15 minutes and verify that the additional index is created with the consecutive number in the index name. For example:system: if you applied changes to.ds-system-000001, wait until.ds-system-000002is created.audit: if you applied changes to.ds-audit-000001, wait until.ds-audit-000002is created.
If such index is not created, escalate the issue to Mirantis support.
During configuration of a management cluster settings using the Configure cluster web UI menu, updating the Keycloak Truststore settings is mandatory, despite being optional.
As a workaround, update the management cluster using the API or CLI.
This section lists the artifacts of components included in the Container Cloud patch release 2.26.2. For artifacts of the Cluster releases introduced in 2.26.2, see patch Cluster releases 17.1.2 and 16.1.2.
Note
The components that are newly added, updated, deprecated, or removed
as compared to the previous release version, are marked
with a corresponding superscript,
for example, lcm-ansible Updated.
Artifact |
Component |
Path |
|---|---|---|
Binaries Updated |
ironic-python-agent.initramfs |
https://binary.mirantis.com/bm/bin/ironic/ipa/ubuntu/initramfs-yoga-focal-debug-20240324195604 |
ironic-python-agent.kernel |
https://binary.mirantis.com/bm/bin/ironic/ipa/ubuntu/kernel-yoga-focal-debug-20240324195604 |
|
Helm charts Updated |
baremetal-api |
https://binary.mirantis.com/core/helm/baremetal-api-1.39.19.tgz |
baremetal-operator |
https://binary.mirantis.com/core/helm/baremetal-operator-1.39.19.tgz |
|
baremetal-provider |
https://binary.mirantis.com/core/helm/baremetal-provider-1.39.19.tgz |
|
baremetal-public-api |
https://binary.mirantis.com/core/helm/baremetal-public-api-1.39.19.tgz |
|
kaas-ipam |
||
local-volume-provisioner |
https://binary.mirantis.com/core/helm/local-volume-provisioner-1.39.19.tgz |
|
metallb |
||
Docker images |
ambasador Updated |
mirantis.azurecr.io/core/external/nginx:1.39.19 |
baremetal-dnsmasq Updated |
mirantis.azurecr.io/bm/baremetal-dnsmasq:base-2-26-alpine-20240325100252 |
|
baremetal-operator Updated |
mirantis.azurecr.io/bm/baremetal-operator:base-2-26-alpine-20240325093002 |
|
bm-collective |
mirantis.azurecr.io/bm/bm-collective:base-2-26-alpine-20240129155244 |
|
cluster-api-provider-baremetal Updated |
mirantis.azurecr.io/core/cluster-api-provider-baremetal:1.39.19 |
|
ironic |
mirantis.azurecr.io/openstack/ironic:yoga-jammy-20240226060024 |
|
ironic-inspector |
mirantis.azurecr.io/openstack/ironic-inspector:yoga-jammy-20240226060024 |
|
ironic-prometheus-exporter |
mirantis.azurecr.io/stacklight/ironic-prometheus-exporter:0.1-20240117102150 |
|
kaas-ipam |
mirantis.azurecr.io/bm/kaas-ipam:base-2-26-alpine-20240129213142 |
|
kubernetes-entrypoint |
mirantis.azurecr.io/openstack/extra/kubernetes-entrypoint:v1.0.1-55b02f7-20231019172556 |
|
mariadb Updated |
mirantis.azurecr.io/general/mariadb:10.6.14-focal-20240311120505 |
|
mcc-keepalived |
mirantis.azurecr.io/lcm/mcc-keepalived:v0.24.0-47-gf77368e |
|
metallb-controller |
mirantis.azurecr.io/bm/metallb/controller:v0.13.12-31212f9e-amd64 |
|
metallb-speaker |
mirantis.azurecr.io/bm/metallb/speaker:v0.13.12-31212f9e-amd64 |
|
syslog-ng |
mirantis.azurecr.io/bm/syslog-ng:base-alpine-20240129163811 |
Artifact |
Component |
Path |
|---|---|---|
Bootstrap tarball Updated |
bootstrap-darwin |
https://binary.mirantis.com/core/bin/bootstrap-darwin-1.39.19.tgz |
bootstrap-linux |
https://binary.mirantis.com/core/bin/bootstrap-linux-1.39.19.tgz |
|
Helm charts Updated |
admission-controller |
https://binary.mirantis.com/core/helm/admission-controller-1.39.19.tgz |
agent-controller |
https://binary.mirantis.com/core/helm/agent-controller-1.39.19.tgz |
|
byo-credentials-controller |
https://binary.mirantis.com/core/helm/byo-credentials-controller-1.39.19.tgz |
|
byo-provider |
https://binary.mirantis.com/core/helm/byo-provider-1.39.19.tgz |
|
ceph-kcc-controller |
https://binary.mirantis.com/core/helm/ceph-kcc-controller-1.39.19.tgz |
|
cert-manager |
https://binary.mirantis.com/core/helm/cert-manager-1.39.19.tgz |
|
cinder-csi-plugin |
https://binary.mirantis.com/core/helm/cinder-csi-plugin-1.39.19.tgz |
|
client-certificate-controller |
https://binary.mirantis.com/core/helm/client-certificate-controller-1.39.19.tgz |
|
configuration-collector |
https://binary.mirantis.com/core/helm/configuration-collector-1.39.19.tgz |
|
event-controller |
https://binary.mirantis.com/core/helm/event-controller-1.39.19.tgz |
|
host-os-modules-controller |
https://binary.mirantis.com/core/helm/host-os-modules-controller-1.39.19.tgz |
|
iam-controller |
https://binary.mirantis.com/core/helm/iam-controller-1.39.19.tgz |
|
kaas-exporter |
https://binary.mirantis.com/core/helm/kaas-exporter-1.39.19.tgz |
|
kaas-public-api |
https://binary.mirantis.com/core/helm/kaas-public-api-1.39.19.tgz |
|
kaas-ui |
||
lcm-controller |
https://binary.mirantis.com/core/helm/lcm-controller-1.39.19.tgz |
|
license-controller |
https://binary.mirantis.com/core/helm/license-controller-1.39.19.tgz |
|
machinepool-controller |
https://binary.mirantis.com/core/helm/machinepool-controller-1.39.19.tgz |
|
mcc-cache |
||
mcc-cache-warmup |
https://binary.mirantis.com/core/helm/mcc-cache-warmup-1.39.19.tgz |
|
metrics-server |
https://binary.mirantis.com/core/helm/metrics-server-1.39.19.tgz |
|
openstack-cloud-controller-manager |
https://binary.mirantis.com/core/helm/openstack-cloud-controller-manager-1.39.19.tgz |
|
openstack-provider |
https://binary.mirantis.com/core/helm/openstack-provider-1.39.19.tgz |
|
os-credentials-controller |
https://binary.mirantis.com/core/helm/os-credentials-controller-1.39.19.tgz |
|
policy-controller |
https://binary.mirantis.com/core/helm/policy-controller-1.39.19.tgz |
|
portforward-controller |
https://binary.mirantis.com/core/helm/portforward-controller-1.39.19.tgz |
|
proxy-controller |
https://binary.mirantis.com/core/helm/proxy-controller-1.39.19.tgz |
|
rbac-controller |
https://binary.mirantis.com/core/helm/rbac-controller-1.39.19.tgz |
|
release-controller |
https://binary.mirantis.com/core/helm/release-controller-1.39.19.tgz |
|
rhellicense-controller |
https://binary.mirantis.com/core/helm/rhellicense-controller-1.39.19.tgz |
|
scope-controller |
https://binary.mirantis.com/core/helm/scope-controller-1.39.19.tgz |
|
squid-proxy |
https://binary.mirantis.com/core/helm/squid-proxy-1.39.19.tgz |
|
user-controller |
https://binary.mirantis.com/core/helm/user-controller-1.39.19.tgz |
|
vsphere-cloud-controller-manager |
https://binary.mirantis.com/core/helm/vsphere-cloud-controller-manager-1.39.19.tgz |
|
vsphere-credentials-controller |
https://binary.mirantis.com/core/helm/vsphere-credentials-controller-1.39.19.tgz |
|
vsphere-csi-plugin |
https://binary.mirantis.com/core/helm/vsphere-csi-plugin-1.39.19.tgz |
|
vsphere-provider |
https://binary.mirantis.com/core/helm/vsphere-provider-1.39.19.tgz |
|
vsphere-vm-template-controller |
https://binary.mirantis.com/core/helm/vsphere-vm-template-controller-1.39.19.tgz |
|
Docker images |
admission-controller Updated |
mirantis.azurecr.io/core/admission-controller:1.39.19 |
agent-controller Updated |
mirantis.azurecr.io/core/agent-controller:1.39.19 |
|
byo-cluster-api-controller Updated |
mirantis.azurecr.io/core/byo-cluster-api-controller:1.39.19 |
|
byo-credentials-controller Updated |
mirantis.azurecr.io/core/byo-credentials-controller:1.39.19 |
|
ceph-kcc-controller Updated |
mirantis.azurecr.io/core/ceph-kcc-controller:1.39.19 |
|
cert-manager-controller |
mirantis.azurecr.io/core/external/cert-manager-controller:v1.11.0-5 |
|
cinder-csi-plugin |
mirantis.azurecr.io/lcm/kubernetes/cinder-csi-plugin:v1.27.2-13 |
|
client-certificate-controller Updated |
mirantis.azurecr.io/core/client-certificate-controller:1.39.19 |
|
configuration-collector Updated |
mirantis.azurecr.io/core/configuration-collector:1.39.19 |
|
csi-attacher |
mirantis.azurecr.io/lcm/k8scsi/csi-attacher:v4.2.0-4 |
|
csi-node-driver-registrar |
mirantis.azurecr.io/lcm/k8scsi/csi-node-driver-registrar:v2.7.0-4 |
|
csi-provisioner |
mirantis.azurecr.io/lcm/k8scsi/csi-provisioner:v3.4.1-4 |
|
csi-resizer |
mirantis.azurecr.io/lcm/k8scsi/csi-resizer:v1.7.0-4 |
|
csi-snapshotter |
mirantis.azurecr.io/lcm/k8scsi/csi-snapshotter:v6.2.1-mcc-3 |
|
event-controller Updated |
mirantis.azurecr.io/core/event-controller:1.39.19 |
|
frontend Updated |
mirantis.azurecr.io/core/frontend:1.39.19 |
|
host-os-modules-controller Updated |
mirantis.azurecr.io/core/host-os-modules-controller:1.39.19 |
|
iam-controller Updated |
mirantis.azurecr.io/core/iam-controller:1.39.19 |
|
kaas-exporter Updated |
mirantis.azurecr.io/core/kaas-exporter:1.39.19 |
|
kproxy Updated |
mirantis.azurecr.io/core/kproxy:1.39.19 |
|
lcm-controller Updated |
mirantis.azurecr.io/core/lcm-controller:1.39.19 |
|
license-controller Updated |
mirantis.azurecr.io/core/license-controller:1.39.19 |
|
livenessprobe |
mirantis.azurecr.io/lcm/k8scsi/livenessprobe:v2.9.0-4 |
|
machinepool-controller Updated |
mirantis.azurecr.io/core/machinepool-controller:1.39.19 |
|
mcc-haproxy |
mirantis.azurecr.io/lcm/mcc-haproxy:v0.24.0-47-gf77368e |
|
mcc-keepalived |
mirantis.azurecr.io/lcm/mcc-keepalived:v0.24.0-47-gf77368e |
|
metrics-server |
mirantis.azurecr.io/lcm/metrics-server-amd64:v0.6.3-6 |
|
nginx Updated |
mirantis.azurecr.io/core/external/nginx:1.39.19 |
|
openstack-cloud-controller-manager Updated |
mirantis.azurecr.io/lcm/kubernetes/openstack-cloud-controller-manager:v1.27.2-13 |
|
openstack-cluster-api-controller Updated |
mirantis.azurecr.io/core/openstack-cluster-api-controller:1.39.19 |
|
os-credentials-controller Updated |
mirantis.azurecr.io/core/os-credentials-controller:1.39.19 |
|
policy-controller Updated |
mirantis.azurecr.io/core/policy-controller:1.39.19 |
|
portforward-controller Updated |
mirantis.azurecr.io/core/portforward-controller:1.39.19 |
|
proxy-controller Updated |
mirantis.azurecr.io/core/proxy-controller:1.39.19 |
|
rbac-controller Updated |
mirantis.azurecr.io/core/rbac-controller:1.39.19 |
|
registry |
mirantis.azurecr.io/lcm/registry:v2.8.1-9 |
|
release-controller Updated |
mirantis.azurecr.io/core/release-controller:1.39.19 |
|
rhellicense-controller Updated |
mirantis.azurecr.io/core/rhellicense-controller:1.39.19 |
|
scope-controller Updated |
mirantis.azurecr.io/core/scope-controller:1.39.19 |
|
squid-proxy |
mirantis.azurecr.io/lcm/squid-proxy:0.0.1-10-g24a0d69 |
|
user-controller Updated |
mirantis.azurecr.io/core/user-controller:1.39.19 |
|
vsphere-cloud-controller-manager |
mirantis.azurecr.io/lcm/kubernetes/vsphere-cloud-controller-manager:v1.27.0-5 |
|
vsphere-cluster-api-controller Updated |
mirantis.azurecr.io/core/vsphere-cluster-api-controller:1.39.19 |
|
vsphere-credentials-controller Updated |
mirantis.azurecr.io/core/vsphere-credentials-controller:1.39.19 |
|
vsphere-csi-driver |
mirantis.azurecr.io/lcm/kubernetes/vsphere-csi-driver:v3.0.2-1 |
|
vsphere-csi-syncer |
mirantis.azurecr.io/lcm/kubernetes/vsphere-csi-syncer:v3.0.2-1 |
|
vsphere-vm-template-controller Updated |
mirantis.azurecr.io/core/vsphere-vm-template-controller:1.39.19 |
Artifact |
Component |
Path |
|---|---|---|
Binaries |
hash-generate-darwin |
http://binary.mirantis.com/iam/bin/hash-generate-0.0.1-268-3cf7f17-darwin |
hash-generate-linux |
http://binary.mirantis.com/iam/bin/hash-generate-0.0.1-268-3cf7f17-linux |
|
Helm charts Updated |
iam |
|
Docker images |
kubectl Updated |
mirantis.azurecr.io/stacklight/kubectl:1.22-20240221023016 |
kubernetes-entrypoint |
mirantis.azurecr.io/openstack/extra/kubernetes-entrypoint:v1.0.1-55b02f7-20231019172556 |
|
mariadb |
mirantis.azurecr.io/general/mariadb:10.6.14-focal-20231127070342 |
|
mcc-keycloak Updated |
mirantis.azurecr.io/iam/mcc-keycloak:23.0.6-20240216125244 |
See also
The Container Cloud patch release 2.26.1, which is based on the 2.26.0 major release, provides the following updates:
Support for the patch Cluster releases 16.1.1 and 17.1.1 that represents Mirantis OpenStack for Kubernetes (MOSK) patch release 24.1.1 patch.
Delivery mechanism for CVE fixes on Ubuntu in bare metal clusters that includes update of Ubuntu kernel minor version. For details, see Enhancements.
Security fixes for CVEs in images.
This patch release also supports the latest major Cluster releases 17.1.0 and 16.1.0. And it does not support greenfield deployments based on deprecated Cluster releases. Use the latest available Cluster release instead.
For main deliverables of the parent Container Cloud release of 2.26.1, refer to 2.26.0.
This section outlines new features and enhancements introduced in the Container Cloud patch release 2.26.1 along with Cluster releases 17.1.1 and 16.1.1.
Introduced the ability to update Ubuntu packages including kernel minor version update, when available in a Cluster release, for both management and managed bare metal clusters to address CVE issues on a host operating system.
On management clusters, the update of Ubuntu mirror along with the update of minor kernel version occurs automatically with cordon-drain and reboot of machines.
On managed clusters, the update of Ubuntu mirror along with the update of minor kernel version applies during a manual cluster update without automatic cordon-drain and reboot of machines. After a managed cluster update, all cluster machines have the
reboot is requirednotification. You can manually handle the reboot of machines during a convenient maintenance window using GracefulRebootRequest.
This section lists the artifacts of components included in the Container Cloud patch release 2.26.1. For artifacts of the Cluster releases introduced in 2.26.1, see patch Cluster releases 17.1.1 and 16.1.1.
Note
The components that are newly added, updated, deprecated, or removed
as compared to the previous release version, are marked
with a corresponding superscript,
for example, lcm-ansible Updated.
Artifact |
Component |
Path |
|---|---|---|
Binaries Updated |
ironic-python-agent.initramfs |
https://binary.mirantis.com/bm/bin/ironic/ipa/ubuntu/initramfs-yoga-focal-debug-20240302181430 |
ironic-python-agent.kernel |
https://binary.mirantis.com/bm/bin/ironic/ipa/ubuntu/kernel-yoga-focal-debug-20240302181430 |
|
provisioning_ansible |
https://binary.mirantis.com/bm/bin/ansible/provisioning_ansible-0.1.1-155-1882779.tgz |
|
Helm charts Updated |
baremetal-api |
https://binary.mirantis.com/core/helm/baremetal-api-1.39.15.tgz |
baremetal-operator |
https://binary.mirantis.com/core/helm/baremetal-operator-1.39.15.tgz |
|
baremetal-provider |
https://binary.mirantis.com/core/helm/baremetal-provider-1.39.15.tgz |
|
baremetal-public-api |
https://binary.mirantis.com/core/helm/baremetal-public-api-1.39.15.tgz |
|
kaas-ipam |
||
local-volume-provisioner |
https://binary.mirantis.com/core/helm/local-volume-provisioner-1.39.15.tgz |
|
metallb |
||
Docker images |
ambasador Updated |
mirantis.azurecr.io/core/external/nginx:1.39.15 |
baremetal-dnsmasq Updated |
mirantis.azurecr.io/bm/baremetal-dnsmasq:base-2-26-alpine-20240226130438 |
|
baremetal-operator Updated |
mirantis.azurecr.io/bm/baremetal-operator:base-2-26-alpine-20240226130310 |
|
bm-collective |
mirantis.azurecr.io/bm/bm-collective:base-2-26-alpine-20240129155244 |
|
cluster-api-provider-baremetal Updated |
mirantis.azurecr.io/core/cluster-api-provider-baremetal:1.39.15 |
|
ironic Updated |
mirantis.azurecr.io/openstack/ironic:yoga-jammy-20240226060024 |
|
ironic-inspector Updated |
mirantis.azurecr.io/openstack/ironic-inspector:yoga-jammy-20240226060024 |
|
ironic-prometheus-exporter |
mirantis.azurecr.io/stacklight/ironic-prometheus-exporter:0.1-20240117102150 |
|
kaas-ipam |
mirantis.azurecr.io/bm/kaas-ipam:base-2-26-alpine-20240129213142 |
|
kubernetes-entrypoint |
mirantis.azurecr.io/openstack/extra/kubernetes-entrypoint:v1.0.1-55b02f7-20231019172556 |
|
mariadb |
mirantis.azurecr.io/general/mariadb:10.6.14-focal-20231127070342 |
|
mcc-keepalived Updated |
mirantis.azurecr.io/lcm/mcc-keepalived:v0.24.0-47-gf77368e |
|
metallb-controller |
mirantis.azurecr.io/bm/metallb/controller:v0.13.12-31212f9e-amd64 |
|
metallb-speaker |
mirantis.azurecr.io/bm/metallb/speaker:v0.13.12-31212f9e-amd64 |
|
syslog-ng |
mirantis.azurecr.io/bm/syslog-ng:base-alpine-20240129163811 |
Artifact |
Component |
Path |
|---|---|---|
Bootstrap tarball Updated |
bootstrap-darwin |
https://binary.mirantis.com/core/bin/bootstrap-darwin-1.39.15.tgz |
bootstrap-linux |
https://binary.mirantis.com/core/bin/bootstrap-linux-1.39.15.tgz |
|
Helm charts Updated |
admission-controller |
https://binary.mirantis.com/core/helm/admission-controller-1.39.15.tgz |
agent-controller |
https://binary.mirantis.com/core/helm/agent-controller-1.39.15.tgz |
|
byo-credentials-controller |
https://binary.mirantis.com/core/helm/byo-credentials-controller-1.39.15.tgz |
|
byo-provider |
https://binary.mirantis.com/core/helm/byo-provider-1.39.15.tgz |
|
ceph-kcc-controller |
https://binary.mirantis.com/core/helm/ceph-kcc-controller-1.39.15.tgz |
|
cert-manager |
https://binary.mirantis.com/core/helm/cert-manager-1.39.15.tgz |
|
cinder-csi-plugin |
https://binary.mirantis.com/core/helm/cinder-csi-plugin-1.39.15.tgz |
|
client-certificate-controller |
https://binary.mirantis.com/core/helm/client-certificate-controller-1.39.15.tgz |
|
configuration-collector |
https://binary.mirantis.com/core/helm/configuration-collector-1.39.15.tgz |
|
event-controller |
https://binary.mirantis.com/core/helm/event-controller-1.39.15.tgz |
|
host-os-modules-controller |
https://binary.mirantis.com/core/helm/host-os-modules-controller-1.39.15.tgz |
|
iam-controller |
https://binary.mirantis.com/core/helm/iam-controller-1.39.15.tgz |
|
kaas-exporter |
https://binary.mirantis.com/core/helm/kaas-exporter-1.39.15.tgz |
|
kaas-public-api |
https://binary.mirantis.com/core/helm/kaas-public-api-1.39.15.tgz |
|
kaas-ui |
||
lcm-controller |
https://binary.mirantis.com/core/helm/lcm-controller-1.39.15.tgz |
|
license-controller |
https://binary.mirantis.com/core/helm/license-controller-1.39.15.tgz |
|
machinepool-controller |
https://binary.mirantis.com/core/helm/machinepool-controller-1.39.15.tgz |
|
mcc-cache |
||
mcc-cache-warmup |
https://binary.mirantis.com/core/helm/mcc-cache-warmup-1.39.15.tgz |
|
metrics-server |
https://binary.mirantis.com/core/helm/metrics-server-1.39.15.tgz |
|
openstack-cloud-controller-manager |
https://binary.mirantis.com/core/helm/openstack-cloud-controller-manager-1.39.15.tgz |
|
openstack-provider |
https://binary.mirantis.com/core/helm/openstack-provider-1.39.15.tgz |
|
os-credentials-controller |
https://binary.mirantis.com/core/helm/os-credentials-controller-1.39.15.tgz |
|
policy-controller |
https://binary.mirantis.com/core/helm/policy-controller-1.39.15.tgz |
|
portforward-controller |
https://binary.mirantis.com/core/helm/portforward-controller-1.39.15.tgz |
|
proxy-controller |
https://binary.mirantis.com/core/helm/proxy-controller-1.39.15.tgz |
|
rbac-controller |
https://binary.mirantis.com/core/helm/rbac-controller-1.39.15.tgz |
|
release-controller |
https://binary.mirantis.com/core/helm/release-controller-1.39.15.tgz |
|
rhellicense-controller |
https://binary.mirantis.com/core/helm/rhellicense-controller-1.39.15.tgz |
|
scope-controller |
https://binary.mirantis.com/core/helm/scope-controller-1.39.15.tgz |
|
squid-proxy |
https://binary.mirantis.com/core/helm/squid-proxy-1.39.15.tgz |
|
user-controller |
https://binary.mirantis.com/core/helm/user-controller-1.39.15.tgz |
|
vsphere-cloud-controller-manager |
https://binary.mirantis.com/core/helm/vsphere-cloud-controller-manager-1.39.15.tgz |
|
vsphere-credentials-controller |
https://binary.mirantis.com/core/helm/vsphere-credentials-controller-1.39.15.tgz |
|
vsphere-csi-plugin |
https://binary.mirantis.com/core/helm/vsphere-csi-plugin-1.39.15.tgz |
|
vsphere-provider |
https://binary.mirantis.com/core/helm/vsphere-provider-1.39.15.tgz |
|
vsphere-vm-template-controller |
https://binary.mirantis.com/core/helm/vsphere-vm-template-controller-1.39.15.tgz |
|
Docker images |
admission-controller Updated |
mirantis.azurecr.io/core/admission-controller:1.39.15 |
agent-controller Updated |
mirantis.azurecr.io/core/agent-controller:1.39.15 |
|
byo-cluster-api-controller Updated |
mirantis.azurecr.io/core/byo-cluster-api-controller:1.39.15 |
|
byo-credentials-controller Updated |
mirantis.azurecr.io/core/byo-credentials-controller:1.39.15 |
|
ceph-kcc-controller Updated |
mirantis.azurecr.io/core/ceph-kcc-controller:1.39.15 |
|
cert-manager-controller |
mirantis.azurecr.io/core/external/cert-manager-controller:v1.11.0-5 |
|
cinder-csi-plugin Updated |
mirantis.azurecr.io/lcm/kubernetes/cinder-csi-plugin:v1.27.2-13 |
|
client-certificate-controller Updated |
mirantis.azurecr.io/core/client-certificate-controller:1.39.15 |
|
configuration-collector Updated |
mirantis.azurecr.io/core/configuration-collector:1.39.15 |
|
csi-attacher |
mirantis.azurecr.io/lcm/k8scsi/csi-attacher:v4.2.0-4 |
|
csi-node-driver-registrar |
mirantis.azurecr.io/lcm/k8scsi/csi-node-driver-registrar:v2.7.0-4 |
|
csi-provisioner |
mirantis.azurecr.io/lcm/k8scsi/csi-provisioner:v3.4.1-4 |
|
csi-resizer |
mirantis.azurecr.io/lcm/k8scsi/csi-resizer:v1.7.0-4 |
|
csi-snapshotter |
mirantis.azurecr.io/lcm/k8scsi/csi-snapshotter:v6.2.1-mcc-3 |
|
event-controller Updated |
mirantis.azurecr.io/core/event-controller:1.39.15 |
|
frontend Updated |
mirantis.azurecr.io/core/frontend:1.39.15 |
|
host-os-modules-controller Updated |
mirantis.azurecr.io/core/host-os-modules-controller:1.39.15 |
|
iam-controller Updated |
mirantis.azurecr.io/core/iam-controller:1.39.15 |
|
kaas-exporter Updated |
mirantis.azurecr.io/core/kaas-exporter:1.39.15 |
|
kproxy Updated |
mirantis.azurecr.io/core/kproxy:1.39.15 |
|
lcm-controller Updated |
mirantis.azurecr.io/core/lcm-controller:1.39.15 |
|
license-controller Updated |
mirantis.azurecr.io/core/license-controller:1.39.15 |
|
livenessprobe |
mirantis.azurecr.io/lcm/k8scsi/livenessprobe:v2.9.0-4 |
|
machinepool-controller Updated |
mirantis.azurecr.io/core/machinepool-controller:1.39.15 |
|
mcc-haproxy Updated |
mirantis.azurecr.io/lcm/mcc-haproxy:v0.24.0-47-gf77368e |
|
mcc-keepalived Updated |
mirantis.azurecr.io/lcm/mcc-keepalived:v0.24.0-47-gf77368e |
|
metrics-server |
mirantis.azurecr.io/lcm/metrics-server-amd64:v0.6.3-6 |
|
nginx Updated |
mirantis.azurecr.io/core/external/nginx:1.39.15 |
|
openstack-cloud-controller-manager Updated |
mirantis.azurecr.io/lcm/kubernetes/openstack-cloud-controller-manager:v1.27.2-13 |
|
openstack-cluster-api-controller Updated |
mirantis.azurecr.io/core/openstack-cluster-api-controller:1.39.15 |
|
os-credentials-controller Updated |
mirantis.azurecr.io/core/os-credentials-controller:1.39.15 |
|
policy-controller Updated |
mirantis.azurecr.io/core/policy-controller:1.39.15 |
|
portforward-controller Updated |
mirantis.azurecr.io/core/portforward-controller:1.39.15 |
|
proxy-controller Updated |
mirantis.azurecr.io/core/proxy-controller:1.39.15 |
|
rbac-controller Updated |
mirantis.azurecr.io/core/rbac-controller:1.39.15 |
|
registry |
mirantis.azurecr.io/lcm/registry:v2.8.1-9 |
|
release-controller Updated |
mirantis.azurecr.io/core/release-controller:1.39.15 |
|
rhellicense-controller Updated |
mirantis.azurecr.io/core/rhellicense-controller:1.39.15 |
|
scope-controller Updated |
mirantis.azurecr.io/core/scope-controller:1.39.15 |
|
squid-proxy |
mirantis.azurecr.io/lcm/squid-proxy:0.0.1-10-g24a0d69 |
|
user-controller Updated |
mirantis.azurecr.io/core/user-controller:1.39.15 |
|
vsphere-cloud-controller-manager |
mirantis.azurecr.io/lcm/kubernetes/vsphere-cloud-controller-manager:v1.27.0-5 |
|
vsphere-cluster-api-controller Updated |
mirantis.azurecr.io/core/vsphere-cluster-api-controller:1.39.15 |
|
vsphere-credentials-controller Updated |
mirantis.azurecr.io/core/vsphere-credentials-controller:1.39.15 |
|
vsphere-csi-driver |
mirantis.azurecr.io/lcm/kubernetes/vsphere-csi-driver:v3.0.2-1 |
|
vsphere-csi-syncer |
mirantis.azurecr.io/lcm/kubernetes/vsphere-csi-syncer:v3.0.2-1 |
|
vsphere-vm-template-controller Updated |
mirantis.azurecr.io/core/vsphere-vm-template-controller:1.39.15 |
Artifact |
Component |
Path |
|---|---|---|
Binaries |
hash-generate-darwin |
http://binary.mirantis.com/iam/bin/hash-generate-0.0.1-268-3cf7f17-darwin |
hash-generate-linux |
http://binary.mirantis.com/iam/bin/hash-generate-0.0.1-268-3cf7f17-linux |
|
Helm charts |
iam |
|
Docker images |
kubectl |
mirantis.azurecr.io/stacklight/kubectl:1.22-20240105023016 |
kubernetes-entrypoint |
mirantis.azurecr.io/openstack/extra/kubernetes-entrypoint:v1.0.1-55b02f7-20231019172556 |
|
mariadb |
mirantis.azurecr.io/general/mariadb:10.6.14-focal-20231127070342 |
|
mcc-keycloak |
mirantis.azurecr.io/iam/mcc-keycloak:23.0.3-1 |
The table below includes the total numbers of addressed unique and common CVEs in images by product component since the Container Cloud 2.26.0 major release. The common CVEs are issues addressed across several images.
Product component |
CVE type |
Critical |
High |
Total |
|---|---|---|---|---|
Ceph |
Unique |
0 |
1 |
1 |
Common |
0 |
3 |
3 |
|
Kaas core |
Unique |
0 |
6 |
6 |
Common |
0 |
27 |
27 |
|
StackLight |
Unique |
0 |
15 |
15 |
Common |
0 |
51 |
51 |
Mirantis Security Portal
For the detailed list of fixed and existing CVEs across the Mirantis Container Cloud and MOSK products, refer to Mirantis Security Portal.
MOSK CVEs
For the number of fixed CVEs in the MOSK-related components including OpenStack and Tungsten Fabric, refer to MOSK 24.1.1: Security notes.
The following issues have been addressed in the Container Cloud patch release 2.26.1 along with the patch Cluster releases 17.1.1 and 16.1.1.
[39330] [StackLight] Fixed the issue with the OpenSearch cluster being stuck due to initializing replica shards.
[39220] [StackLight] Fixed the issue with Patroni failure due to no limit configuration for the
max_timelines_historyparameter.[39080] [StackLight] Fixed the issue with the
OpenSearchClusterStatusWarningalert firing during cluster upgrade if StackLight is deployed in the HA mode.[38970] [StackLight] Fixed the issue with the Logs dashboard in the OpenSearch Dashboards web UI not working for the
systemindex.[38937] [StackLight] Fixed the issue with the View logs in OpenSearch Dashboards link not working in the Grafana web UI.
[40747] [vSphere] Fixed the issue with the unsupported Cluster release being available for greenfield vSphere-based managed cluster deployments in the drop-down menu of the cluster creation window in the Container Cloud web UI.
[40036] [LCM] Fixed the issue causing nodes to remain in the Kubernetes cluster when the corresponding
Machineobject isdisabledduring cluster update.
This section lists known issues with workarounds for the Mirantis Container Cloud release 2.26.1 including the Cluster releases 17.1.1 and 16.1.1.
For other issues that can occur while deploying and operating a Container Cloud cluster, see Troubleshooting Guide.
Note
This section also outlines still valid known issues from previous Container Cloud releases.
Fixed in 2.28.0 (17.3.0 and 16.3.0)
When trying to list the HostOSConfigurationModules and HostOSConfiguration custom resources, serviceuser or a user with
the global-admin or operator role obtains the access denied error.
For example:
kubectl --kubeconfig ~/.kube/mgmt-config get hocm
Error from server (Forbidden): hostosconfigurationmodules.kaas.mirantis.com is forbidden:
User "2d74348b-5669-4c65-af31-6c05dbedac5f" cannot list resource "hostosconfigurationmodules"
in API group "kaas.mirantis.com" at the cluster scope: access denied
Workaround:
Modify the
global-adminrole by adding a new entry with the following contents to theruleslist:kubectl edit clusterroles kaas-global-admin
- apiGroups: [kaas.mirantis.com] resources: [hostosconfigurationmodules] verbs: ['*']
For each Container Cloud project, modify the
kaas-operatorrole by adding a new entry with the following contents to theruleslist:kubectl -n <projectName> edit roles kaas-operator
- apiGroups: [kaas.mirantis.com] resources: [hostosconfigurations] verbs: ['*']
Due to the MetalLB upstream issue, a load balancer service may not obtain the external IP address.
The issue occurs when two services share the same external IP address and have
the same externalTrafficPolicy value. Initially, the services have the
external IP address assigned and are accessible. After modifying the
externalTrafficPolicy value for both services from Cluster to
Local, the first service that has been changed remains with no external IP
address assigned. Though, the second service, which was changed later, has the
external IP assigned as expected.
To work around the issue, make a dummy change to the service object where
external IP is <pending>:
Identify the service that is stuck:
kubectl get svc -A | grep pending
Example of system response:
stacklight iam-proxy-prometheus LoadBalancer 10.233.28.196 <pending> 443:30430/TCP
Add an arbitrary label to the service that is stuck. For example:
kubectl label svc -n stacklight iam-proxy-prometheus reconcile=1
Example of system response:
service/iam-proxy-prometheus labeledVerify that the external IP was allocated to the service:
kubectl get svc -n stacklight iam-proxy-prometheus
Example of system response:
NAME TYPE CLUSTER-IP EXTERNAL-IP PORT(S) AGE iam-proxy-prometheus LoadBalancer 10.233.28.196 10.0.34.108 443:30430/TCP 12d
Fixed in 2.28.0 (17.3.0 and 16.3.0)
After node maintenance of a management cluster, the newly added nodes may fail to undergo provisioning successfully. The issue relates to new nodes that are in the same L2 domain as the management cluster.
The issue was observed on environments having management cluster nodes configured with a single L2 segment used for all network traffic (PXE and LCM/management networks).
To verify whether the cluster is affected:
Verify whether the dnsmasq and dhcp-relay pods run on the same node
in the management cluster:
kubectl -n kaas get pods -o wide| grep -e "dhcp\|dnsmasq"
Example of system response:
dhcp-relay-7d85f75f76-5vdw2 2/2 Running 2 (36h ago) 36h 10.10.0.122 kaas-node-8a24b81c-76d0-4d4c-8421-962bd39df5ad <none> <none>
dnsmasq-8f4b484b4-slhbd 5/5 Running 1 (36h ago) 36h 10.233.123.75 kaas-node-8a24b81c-76d0-4d4c-8421-962bd39df5ad <none> <none>
If this is the case, proceed to the workaround below.
Workaround:
Log in to a node that contains
kubeconfigof the affected management cluster.Make sure that at least two management cluster nodes are schedulable:
kubectl get node
Example of a positive system response:
NAME STATUS ROLES AGE VERSION kaas-node-bcedb87b-b3ce-46a4-a4ca-ea3068689e40 Ready master 37h v1.27.10-mirantis-1 kaas-node-8a24b81c-76d0-4d4c-8421-962bd39df5ad Ready master 37h v1.27.10-mirantis-1 kaas-node-ad5a6f51-b98f-43c3-91d5-55fed3d0ff21 Ready master 37h v1.27.10-mirantis-1
Delete the
dhcp-relaypod:kubectl -n kaas delete pod <dhcp-relay-xxxxx>
Verify that the
dnsmasqanddhcp-relaypods are scheduled into different nodes:kubectl -n kaas get pods -o wide| grep -e "dhcp\|dnsmasq"
Example of a positive system response:
dhcp-relay-7d85f75f76-rkv03 2/2 Running 0 49s 10.10.0.121 kaas-node-bcedb87b-b3ce-46a4-a4ca-ea3068689e40 <none> <none> dnsmasq-8f4b484b4-slhbd 5/5 Running 1 (37h ago) 37h 10.233.123.75 kaas-node-8a24b81c-76d0-4d4c-8421-962bd39df5ad <none> <none>
During deletion of a manager machine running the ironic Pod from a bare
metal management cluster, the following problems occur:
All Pods are stuck in the
TerminatingstateA new
ironicPod fails to startThe related bare metal host is stuck in the
deprovisioningstate
As a workaround, before deletion of the node running the ironic Pod,
cordon and drain the node using the kubectl cordon <nodeName> and
kubectl drain <nodeName> commands.
Due to issues with managing physical NVME devices, lcm-agent cannot grab
storage information on a host. As a result,
lcmmachine.status.hostinfo.hardware is empty and the following example
error is present in logs:
{"level":"error","ts":"2024-05-02T12:26:10Z","logger":"agent", \
"msg":"get hardware details", \
"host":"kaas-node-548b2861-aed0-41c9-8ff2-10c5476b000b", \
"error":"new storage info: get disk info \"nvme0c0n1\": \
invoke command: exit status 1","errorVerbose":"exit status 1
As a workaround, on the affected node, create a symlink for any device
indicated in lcm-agent logs. For example:
ln -sfn /dev/nvme0n1 /dev/nvme0c0n1
During deletion of a machine, the related DaemonSet Pod can remain on the
deleted node in the Terminating state. As a workaround, manually
delete the Pod:
kubectl delete pod -n <podNamespace> <podName>
Fixed in 2.29.0 (17.4.0 and 16.4.0)
During the replacement of a master node on a cluster of any type, the process
may get stuck with Kubelet's NodeReady condition is Unknown in the
machine status on the remaining master nodes.
As a workaround, log in on the affected node and run the following command:
docker restart ucp-kubelet
During MariaDB operations on a management cluster, Pods may get stuck in continuous restarts with the following example error:
[ERROR] WSREP: Corrupt buffer header: \
addr: 0x7faec6f8e518, \
seqno: 3185219421952815104, \
size: 909455917, \
ctx: 0x557094f65038, \
flags: 11577. store: 49, \
type: 49
Workaround:
Create a backup of the
/var/lib/mysqldirectory on themariadb-serverPod.Verify that other replicas are up and ready.
Remove the
galera.cachefile for the affectedmariadb-serverPod.Remove the affected
mariadb-serverPod or wait until it is automatically restarted.
After Kubernetes restarts the Pod, the Pod clones the database in 1-2 minutes and restores the quorum.
Fixed in 2.28.4 (17.3.4 and 16.3.4)
During replacement of a master node on a cluster of any type, the
calico-node Pod fails to start on a new node that has the same IP address
as the node being replaced.
Workaround:
Log in to any
masternode.From a CLI with an MKE client bundle, create a shell alias to start calicoctl using the
mirantis/ucp-dsinfoimage:alias calicoctl="\ docker run -i --rm \ --pid host \ --net host \ -e constraint:ostype==linux \ -e ETCD_ENDPOINTS=<etcdEndpoint> \ -e ETCD_KEY_FILE=/var/lib/docker/volumes/ucp-kv-certs/_data/key.pem \ -e ETCD_CA_CERT_FILE=/var/lib/docker/volumes/ucp-kv-certs/_data/ca.pem \ -e ETCD_CERT_FILE=/var/lib/docker/volumes/ucp-kv-certs/_data/cert.pem \ -v /var/run/calico:/var/run/calico \ -v /var/lib/docker/volumes/ucp-kv-certs/_data:/var/lib/docker/volumes/ucp-kv-certs/_data:ro \ mirantis/ucp-dsinfo:<mkeVersion> \ calicoctl \ "
alias calicoctl="\ docker run -i --rm \ --pid host \ --net host \ -e constraint:ostype==linux \ -e ETCD_ENDPOINTS=<etcdEndpoint> \ -e ETCD_KEY_FILE=/ucp-node-certs/key.pem \ -e ETCD_CA_CERT_FILE=/ucp-node-certs/ca.pem \ -e ETCD_CERT_FILE=/ucp-node-certs/cert.pem \ -v /var/run/calico:/var/run/calico \ -v ucp-node-certs:/ucp-node-certs:ro \ mirantis/ucp-dsinfo:<mkeVersion> \ calicoctl --allow-version-mismatch \ "
In the above command, replace the following values with the corresponding settings of the affected cluster:
<etcdEndpoint>is the etcd endpoint defined in the Calico configuration file. For example,ETCD_ENDPOINTS=127.0.0.1:12378<mkeVersion>is the MKE version installed on your cluster. For example,mirantis/ucp-dsinfo:3.5.7.
Verify the node list on the cluster:
kubectl get node
Compare this list with the node list in Calico to identify the old node:
calicoctl get node -o wide
Remove the old node from Calico:
calicoctl delete node kaas-node-<nodeID>
Fixed in 2.28.4 (17.3.4 and 16.3.4)
During replacement of a manager machine, the following problems may occur:
The system adds the node to Docker swarm but not to Kubernetes
The node
Deploymentgets stuck with failed RethinkDB health checks
Workaround:
Delete the failed node.
Wait for the MKE cluster to become healthy. To monitor the cluster status:
Log in to the MKE web UI.
Monitor the cluster status as described in MKE Operations Guide: Monitor an MKE cluster with the MKE web UI.
Deploy a new node.
Fixed in 2.28.4 (17.3.4 and 16.3.4)
During the unsafe or forced deletion of a manager machine running the
calico-kube-controllers Pod in the kube-system namespace,
the following issues occur:
The
calico-kube-controllersPod fails to clean up resources associated with the deleted nodeThe
calico-nodePod may fail to start up on a newly created node if the machine is provisioned with the same IP address as the deleted machine had
As a workaround, before deletion of the node running the
calico-kube-controllers Pod, cordon and drain the node:
kubectl cordon <nodeName>
kubectl drain <nodeName>
Fixed in 2.27.0 (17.2.0 and 16.2.0)
During graceful reboot of a cluster with Ceph enabled, the reboot is blocked
with the following message in the MiraCephMaintenance object status:
message: ClusterMaintenanceRequest found, Ceph Cluster is not ready to upgrade,
delaying cluster maintenance
As a workaround, add the following snippet to the cephFS section under
metadataServer in the spec section of <kcc-name>.yaml in the Ceph
cluster:
cephClusterSpec:
sharedFilesystem:
cephFS:
- name: cephfs-store
metadataServer:
activeCount: 1
healthCheck:
livenessProbe:
probe:
failureThreshold: 5
initialDelaySeconds: 30
periodSeconds: 30
successThreshold: 1
timeoutSeconds: 5
Note
The issue does not reproduce since MOSK 25.2.
Update of a managed cluster based on bare metal and Ceph enabled fails with
PersistentVolumeClaim getting stuck in the Pending state for the
prometheus-server StatefulSet and the
MountVolume.MountDevice failed for volume warning in the StackLight event
logs.
Workaround:
Verify that the description of the Pods that failed to run contain the
FailedMountevents:kubectl -n <affectedProjectName> describe pod <affectedPodName>
In the command above, replace the following values:
<affectedProjectName>is the Container Cloud project name where the Pods failed to run<affectedPodName>is a Pod name that failed to run in the specified project
In the Pod description, identify the node name where the Pod failed to run.
Verify that the
csi-rbdpluginlogs of the affected node contain therbd volume mount failed: <csi-vol-uuid> is being usederror. The<csi-vol-uuid>is a unique RBD volume name.Identify
csiPodNameof the correspondingcsi-rbdplugin:kubectl -n rook-ceph get pod -l app=csi-rbdplugin \ -o jsonpath='{.items[?(@.spec.nodeName == "<nodeName>")].metadata.name}'
Output the affected
csiPodNamelogs:kubectl -n rook-ceph logs <csiPodName> -c csi-rbdplugin
Scale down the affected
StatefulSetorDeploymentof the Pod that fails to0replicas.On every
csi-rbdpluginPod, search for stuckcsi-vol:for pod in `kubectl -n rook-ceph get pods|grep rbdplugin|grep -v provisioner|awk '{print $1}'`; do echo $pod kubectl exec -it -n rook-ceph $pod -c csi-rbdplugin -- rbd device list | grep <csi-vol-uuid> done
Unmap the affected
csi-vol:rbd unmap -o force /dev/rbd<i>
The
/dev/rbd<i>value is a mapped RBD volume that usescsi-vol.Delete
volumeattachmentof the affected Pod:kubectl get volumeattachments | grep <csi-vol-uuid> kubectl delete volumeattacmhent <id>
Scale up the affected
StatefulSetorDeploymentback to the original number of replicas and wait until its state becomesRunning.
Fixed in 17.2.0, 16.2.0, 17.1.6, 16.1.6
On large managed clusters, shard relocation may fail in the OpenSearch cluster
with the yellow or red status of the OpenSearch cluster.
The characteristic symptom of the issue is that in the stacklight
namespace, the statefulset.apps/opensearch-master containers are
experiencing throttling with the KubeContainersCPUThrottlingHigh alert
firing for the following set of labels:
{created_by_kind="StatefulSet",created_by_name="opensearch-master",namespace="stacklight"}
Caution
The throttling that OpenSearch is experiencing may be a temporary situation, which may be related, for example, to a peaky load and the ongoing shards initialization as part of disaster recovery or after node restart. In this case, Mirantis recommends waiting until initialization of all shards is finished. After that, verify the cluster state and whether throttling still exists. And only if throttling does not disappear, apply the workaround below.
To verify that the initialization of shards is ongoing:
kubectl exec -it pod/opensearch-master-0 -n stacklight -c opensearch -- bash
curl "http://localhost:9200/_cat/shards" | grep INITIALIZING
Example of system response:
.ds-system-000072 2 r INITIALIZING 10.232.182.135 opensearch-master-1
.ds-system-000073 1 r INITIALIZING 10.232.7.145 opensearch-master-2
.ds-system-000073 2 r INITIALIZING 10.232.182.135 opensearch-master-1
.ds-audit-000001 2 r INITIALIZING 10.232.7.145 opensearch-master-2
The system response above indicates that shards from the
.ds-system-000072, .ds-system-000073, and .ds-audit-000001
indicies are in the INITIALIZING state. In this case, Mirantis
recommends waiting until this process is finished, and only then consider
changing the limit.
You can additionally analyze the exact level of throttling and the current CPU usage on the Kubernetes Containers dashboard in Grafana.
Workaround:
Verify the currently configured CPU requests and limits for the
opensearchcontainers:kubectl -n stacklight get statefulset.apps/opensearch-master -o jsonpath="{.spec.template.spec.containers[?(@.name=='opensearch')].resources}"
Example of system response:
{"limits":{"cpu":"600m","memory":"8Gi"},"requests":{"cpu":"500m","memory":"6Gi"}}
In the example above, the CPU request is
500mand the CPU limit is600m.Increase the CPU limit to a reasonably high number.
For example, the default CPU limit for the clusters with the
clusterSize:largeparameter set was increased from8000mto12000mfor StackLight in Container Cloud 2.27.0 (Cluster releases 17.2.0 and 16.2.0).Note
For details, on the
clusterSizeparameter, see MOSK Operations Guide: StackLight configuration parameters - Cluster size.If the defaults are already overridden on the affected cluster using the
resourcesPerClusterSizeorresourcesparameters as described in MOSK Operations Guide: StackLight configuration parameters - Resource limits, then the exact recommended number depends on the currently set limit.Mirantis recommends increasing the limit by 50%. If it does not resolve the issue, another increase iteration will be required.
When you select the required CPU limit, increase it as described in MOSK Operations Guide: StackLight configuration parameters - Resource limits.
If the CPU limit for the
opensearchcomponent is already set, increase it in theClusterobject for theopensearchparameter. Otherwise, the default StackLight limit is used. In this case, increase the CPU limit for theopensearchcomponent using theresourcesparameter.Wait until all
opensearch-masterpods are recreated with the new CPU limits and becomerunningandready.To verify the current CPU limit for every
opensearchcontainer in everyopensearch-masterpod separately:kubectl -n stacklight get pod/opensearch-master-<podSuffixNumber> -o jsonpath="{.spec.containers[?(@.name=='opensearch')].resources}"
In the command above, replace
<podSuffixNumber>with the name of the pod suffix. For example,pod/opensearch-master-0orpod/opensearch-master-2.Example of system response:
{"limits":{"cpu":"900m","memory":"8Gi"},"requests":{"cpu":"500m","memory":"6Gi"}}
The waiting time may take up to 20 minutes depending on the cluster size.
If the issue is fixed, the KubeContainersCPUThrottlingHigh alert stops
firing immediately, while OpenSearchClusterStatusWarning or
OpenSearchClusterStatusCritical can still be firing for some time during
shard relocation.
If the KubeContainersCPUThrottlingHigh alert is still firing, proceed with
another iteration of the CPU limit increase.
Fixed in 17.2.0, 16.2.0, 17.1.6, 16.1.6
While updating rollover_policy for the current system* and audit*
data streams, the update is not applied to indices.
One of indicators that the cluster is most likely affected is the
KubeJobFailed alert firing for the elasticsearch-curator job and one or
both of the following errors being present in elasticsearch-curator pods
that remain in the Error status:
2024-05-31 13:16:04,459 ERROR Failed to complete action: delete_indices. <class 'curator.exceptions.FailedExecution'>: Exception encountered. Rerun with loglevel DEBUG and/or check Elasticsearch logs for more information. Exception: RequestError(400, 'illegal_argument_exception', 'index [.ds-audit-000001] is the write index for data stream [audit] and cannot be deleted')
or
2024-05-31 13:16:04,459 ERROR Failed to complete action: delete_indices. <class 'curator.exceptions.FailedExecution'>: Exception encountered. Rerun with loglevel DEBUG and/or check Elasticsearch logs for more information. Exception: RequestError(400, 'illegal_argument_exception', 'index [.ds-system-000001] is the write index for data stream [system] and cannot be deleted')
Note
Instead of .ds-audit-000001 or .ds-system-000001 index names,
similar names can be present with the same prefix but different suffix
numbers.
If the above mentioned alert and errors are present, an immediate action is required, because it indicates that the corresponding index size has already exceeded the space allocated for the index.
To verify that the cluster is affected:
Caution
Verify and apply the workaround to both index patterns, system and audit, separately.
If one of indices is affected, the second one is most likely affected as well. Although in rare cases, only one index may be affected.
Log in to the
opensearch-master-0Pod:kubectl exec -it pod/opensearch-master-0 -n stacklight -c opensearch -- bash
Verify that the rollover policy is present:
system:curl localhost:9200/_plugins/_ism/policies/system_rollover_policyaudit:curl localhost:9200/_plugins/_ism/policies/audit_rollover_policy
The cluster is affected if the rollover policy is missing. Otherwise, proceed to the following step.
Verify the system response from the previous step. For example:
{"_id":"system_rollover_policy","_version":7229,"_seq_no":42362,"_primary_term":28,"policy":{"policy_id":"system_rollover_policy","description":"system index rollover policy.","last_updated_time":1708505222430,"schema_version":19,"error_notification":null,"default_state":"rollover","states":[{"name":"rollover","actions":[{"retry":{"count":3,"backoff":"exponential","delay":"1m"},"rollover":{"min_size":"14746mb","copy_alias":false}}],"transitions":[]}],"ism_template":[{"index_patterns":["system*"],"priority":200,"last_updated_time":1708505222430}]}}
Verify and capture the following items separately for every policy:
The
_seq_noand_primary_termvaluesThe rollover policy threshold, which is defined in
policy.states[0].actions[0].rollover.min_size
List indices:
system:curl localhost:9200/_cat/indices | grep system
Example of system response:
[...] green open .ds-system-000001 FjglnZlcTKKfKNbosaE9Aw 2 1 1998295 0 1gb 507.9mb
audit:curl localhost:9200/_cat/indices | grep audit
Example of system response:
[...] green open .ds-audit-000001 FjglnZlcTKKfKNbosaE9Aw 2 1 1998295 0 1gb 507.9mb
Select the index with the highest number and verify the rollover policy attached to the index:
system:curl localhost:9200/_plugins/_ism/explain/.ds-system-000001audit:curl localhost:9200/_plugins/_ism/explain/.ds-audit-000001If the rollover policy is not attached, the cluster is affected.
If the rollover policy is attached but
_seq_noand_primary_termnumbers do not match the previously captured ones, the cluster is affected.If the index size drastically exceeds the defined threshold of the rollover policy (which is the previously captured
min_size), the cluster is most probably affected.
Workaround:
Log in to the
opensearch-master-0Pod:kubectl exec -it pod/opensearch-master-0 -n stacklight -c opensearch -- bash
If the policy is attached to the index but has different
_seq_noand_primary_term, remove the policy from the index:Note
Use the index with the highest number in the name, which was captured during verification procedure.
system:curl -XPOST localhost:9200/_plugins/_ism/remove/.ds-system-000001
audit:curl -XPOST localhost:9200/_plugins/_ism/remove/.ds-audit-000001
Re-add the policy:
system:curl -XPOST -H "Content-type: application/json" localhost:9200/_plugins/_ism/add/system* -d'{"policy_id":"system_rollover_policy"}'
audit:curl -XPOST -H "Content-type: application/json" localhost:9200/_plugins/_ism/add/audit* -d'{"policy_id":"audit_rollover_policy"}'
Perform again the last step of the cluster verification procedure provided above and make sure that the policy is attached to the index and has the same
_seq_noand_primary_term.If the index size drastically exceeds the defined threshold of the rollover policy (which is the previously captured
min_size), wait up to 15 minutes and verify that the additional index is created with the consecutive number in the index name. For example:system: if you applied changes to.ds-system-000001, wait until.ds-system-000002is created.audit: if you applied changes to.ds-audit-000001, wait until.ds-audit-000002is created.
If such index is not created, escalate the issue to Mirantis support.
During configuration of a management cluster settings using the Configure cluster web UI menu, updating the Keycloak Truststore settings is mandatory, despite being optional.
As a workaround, update the management cluster using the API or CLI.
See also
The Mirantis Container Cloud major release 2.26.0:
Introduces support for the Cluster release 17.1.0 that is based on the Cluster release 16.1.0 and represents Mirantis OpenStack for Kubernetes (MOSK) :ref:`24.1.
Introduces support for the Cluster release 16.1.0 that is based on Mirantis Container Runtime (MCR) 23.0.9 and Mirantis Kubernetes Engine (MKE) 3.7.5 with Kubernetes 1.27.
Does not support greenfield deployments on deprecated Cluster releases of the 17.0.x and 16.0.x series. Use the latest available Cluster releases of the series instead.
Caution
Make sure to update the Cluster release version of your managed cluster before the current Cluster release version becomes unsupported by a new Container Cloud release version. Otherwise, Container Cloud stops auto-upgrade and eventually Container Cloud itself becomes unsupported.
This section outlines release notes for the Container Cloud release 2.26.0.
This section outlines new features and enhancements introduced in the Container Cloud release 2.26.0. For the list of enhancements delivered with the Cluster releases introduced by Container Cloud 2.26.0, see 17.1.0 and 16.1.0.
To ensure that Container Cloud clusters remain consistently updated with the
latest security fixes and product improvements, the Admission Controller
has been enhanced. Now, it actively prevents the utilization of pinned
custom artifacts for Container Cloud components. Specifically, it blocks
a management or managed cluster release update, or any cluster configuration
update, for example, adding public keys or proxy, if a Cluster object
contains any custom Container Cloud artifacts with global or image-related
values overwritten in the helm-releases section, until these values are
removed.
Normally, the Container Cloud clusters do not contain pinned artifacts,
which eliminates the need for any pre-update actions in most deployments.
However, if the update of your cluster is blocked with the
invalid HelmReleases configuration error, refer to
Update notes: Pre-update actions for details.
Note
In rare cases, if the image-related or global values should be
changed, you can use the ClusterRelease or KaaSRelease objects
instead. But make sure to update these values manually after every major
and patch update.
Note
The pre-update inspection applies only to images delivered by Container Cloud that are overwritten. Any custom images unrelated to the product components are not verified and do not block cluster update.
Learn more
TechPreview
Implemented the machine disabling API that allows you to seamlessly remove a worker machine from the LCM control of a managed cluster. This action isolates the affected node without impacting other machines in the cluster, effectively eliminating it from the Kubernetes cluster. This functionality proves invaluable in scenarios where a malfunctioning machine impedes cluster updates.
Learn more
TechPreview
Added initial Technology Preview support for the HostOSConfiguration and
HostOSConfigurationModules custom resources in the bare metal provider.
These resources introduce configuration modules that allow managing the
operating system of a bare metal host granularly without rebuilding the node
from scratch. Such approach prevents workload evacuation and significantly
reduces configuration time.
Configuration modules manage various settings of the operating system using Ansible playbooks, adhering to specific schemas and metadata requirements. For description of module format, schemas, and rules, contact Mirantis support.
Warning
For security reasons and to ensure safe and reliable cluster operability, contact Mirantis support to start using these custom resources.
Caution
As long as the feature is still on the development stage,
Mirantis highly recommends deleting all HostOSConfiguration objects,
if any, before automatic upgrade of the management cluster to Container Cloud
2.27.0 (Cluster release 16.2.0). After the upgrade, you can recreate the
required objects using the updated parameters.
This precautionary step prevents re-processing and re-applying of existing
configuration, which is defined in HostOSConfiguration objects, during
management cluster upgrade to 2.27.0. Such behavior is caused by changes in
the HostOSConfiguration API introduced in 2.27.0.
Implemented the strict byID filtering for targeting system disks using
specific device options: byPath, serialNumber, and wwn.
These options offer a more reliable alternative to the unpredictable
byName naming format.
Mirantis recommends adopting these new device naming options when adding new nodes and redeploying existing ones to ensure a predictable and stable device naming schema.
Learn more
Introduced a mechanism in the Container Cloud dnsmasq server to dynamically allocate IP addresses for baremetal hosts during provisioning. This new mechanism replaces sequential IP allocation that includes the ping check with dynamic IP allocation without the ping check. Such behavior significantly increases the amount of baremetal servers that you can provision in parallel, which allows you to streamline the process of setting up a large managed cluster.
Added support for the Kubernetes auditing and profiling enablement and
configuration on management clusters. The auditing option is enabled by
default. You can configure both options using Cluster object of the
management cluster.
Note
For managed clusters, you can also configure Kubernetes auditing
along with profiling using the Cluster object of a managed cluster.
Implemented automatic cleanup of LVM thin pool volumes during the provisioning stage to prevent issues with logical volume detection before removal, which could cause node cleanup failure during cluster redeployment.
Implemented the capability to erase existing data from hardware devices to be
used for a bare metal management or managed cluster deployment. Using the
new wipeDevice structure, you can either erase an existing partition or
remove all existing partitions from a physical device. For these purposes,
use the eraseMetadata or eraseDevice option that configures cleanup
behavior during configuration of a custom bare metal host profile.
Note
The wipeDevice option replaces the deprecated wipe option
that will be removed in one of the following releases. For backward
compatibility, any existing wipe: true option is automatically converted
to the following structure:
wipeDevice:
eraseMetadata:
enabled: True
TechPreview
Introduced initial Technology Preview support for the Policy Controller that validates signatures of pod images. The Policy Controller verifies that images used by the Container Cloud and Mirantis OpenStack for Kubernetes controllers are signed by a trusted authority. The Policy Controller inspects defined image policies that list Docker registries and authorities for signature validation.
Added support for configuring Keycloak truststore using the Container Cloud web UI to allow for a proper validation of client self-signed certificates. The truststore is used to ensure secured connection to identity brokers, LDAP identity providers, and others.
Added the LCM Operation condition to monitor health of all LCM operations on a cluster and its machines that is useful during cluster update. You can monitor the status of LCM operations using the the Container Cloud web UI in the status hover menus of a cluster and machine.
Learn more
Reorganized the Container Cloud web UI to optimize the baremetal-based managed cluster deployment and management:
Moved the L2 Templates and Subnets tabs from the Clusters menu to the separate Networks tab on the left sidebar.
Improved the Create Subnet menu by adding configuration for different subnet types.
Reorganized the Baremetal tab in the left sidebar that now contains Hosts, Hosts Profiles, and Credentials tabs.
Implemented the ability to add bare metal host profiles using the web UI.
Moved description of a baremetal host to Host info located in a baremetal host kebab menu on the Hosts page of the Baremetal tab.
Moved description of baremetal host credentials to Credential info located in a credential kebab menu on the Credentials page of the Baremetal tab.
Learn more
On top of continuous improvements delivered to the existing Container Cloud guides, added the documentation on how to export logs from OpenSearch dashboards to CSV.
The following issues have been addressed in the Mirantis Container Cloud release 2.26.0 along with the Cluster releases 17.1.0 and 16.1.0.
Note
This section provides descriptions of issues addressed since the last Container Cloud patch release 2.25.4.
For details on addressed issues in earlier patch releases since 2.25.0, which are also included into the major release 2.26.0, refer to 2.25.x patch releases.
[32761] [LCM] Fixed the issue with node cleanup failing on MOSK clusters due to the Ansible provisioner hanging in a loop while trying to remove LVM thin pool logical volumes, which occurred due to issues with volume detection before removal during cluster redeployment. The issue resolution comprises implementation of automatic cleanup of LVM thin pool volumes during the provisioning stage.
[36924] [LCM] Fixed the issue with Ansible starting to run on nodes of a managed cluster after the
mcc-cachecertificate is applied on a management cluster.[37268] [LCM] Fixed the issue with Container Cloud cluster being blocked by a node stuck in the
PrepareorDeploystate witherror processing package openssh-server. The issue was caused by customizations in/etc/ssh/sshd_config, such as additionalMatchstatements.[34820] [Ceph] Fixed the issue with the Ceph
rook-operatorfailing to connect to Ceph RADOS Gateway pods on clusters with the Federal Information Processing Standard mode enabled.[38340] [StackLight] Fixed the issue with Telegraf Docker Swarm timing out while collecting data by increasing its timeout from 10 to 25 seconds.
This section lists known issues with workarounds for the Mirantis Container Cloud release 2.26.0 including the Cluster releases 17.1.0 and 16.1.0.
For other issues that can occur while deploying and operating a Container Cloud cluster, see Troubleshooting Guide.
Note
This section also outlines still valid known issues from previous Container Cloud releases.
Fixed in 2.28.0 (17.3.0 and 16.3.0)
When trying to list the HostOSConfigurationModules and HostOSConfiguration custom resources, serviceuser or a user with
the global-admin or operator role obtains the access denied error.
For example:
kubectl --kubeconfig ~/.kube/mgmt-config get hocm
Error from server (Forbidden): hostosconfigurationmodules.kaas.mirantis.com is forbidden:
User "2d74348b-5669-4c65-af31-6c05dbedac5f" cannot list resource "hostosconfigurationmodules"
in API group "kaas.mirantis.com" at the cluster scope: access denied
Workaround:
Modify the
global-adminrole by adding a new entry with the following contents to theruleslist:kubectl edit clusterroles kaas-global-admin
- apiGroups: [kaas.mirantis.com] resources: [hostosconfigurationmodules] verbs: ['*']
For each Container Cloud project, modify the
kaas-operatorrole by adding a new entry with the following contents to theruleslist:kubectl -n <projectName> edit roles kaas-operator
- apiGroups: [kaas.mirantis.com] resources: [hostosconfigurations] verbs: ['*']
Due to the MetalLB upstream issue, a load balancer service may not obtain the external IP address.
The issue occurs when two services share the same external IP address and have
the same externalTrafficPolicy value. Initially, the services have the
external IP address assigned and are accessible. After modifying the
externalTrafficPolicy value for both services from Cluster to
Local, the first service that has been changed remains with no external IP
address assigned. Though, the second service, which was changed later, has the
external IP assigned as expected.
To work around the issue, make a dummy change to the service object where
external IP is <pending>:
Identify the service that is stuck:
kubectl get svc -A | grep pending
Example of system response:
stacklight iam-proxy-prometheus LoadBalancer 10.233.28.196 <pending> 443:30430/TCP
Add an arbitrary label to the service that is stuck. For example:
kubectl label svc -n stacklight iam-proxy-prometheus reconcile=1
Example of system response:
service/iam-proxy-prometheus labeledVerify that the external IP was allocated to the service:
kubectl get svc -n stacklight iam-proxy-prometheus
Example of system response:
NAME TYPE CLUSTER-IP EXTERNAL-IP PORT(S) AGE iam-proxy-prometheus LoadBalancer 10.233.28.196 10.0.34.108 443:30430/TCP 12d
Fixed in 2.28.0 (17.3.0 and 16.3.0)
After node maintenance of a management cluster, the newly added nodes may fail to undergo provisioning successfully. The issue relates to new nodes that are in the same L2 domain as the management cluster.
The issue was observed on environments having management cluster nodes configured with a single L2 segment used for all network traffic (PXE and LCM/management networks).
To verify whether the cluster is affected:
Verify whether the dnsmasq and dhcp-relay pods run on the same node
in the management cluster:
kubectl -n kaas get pods -o wide| grep -e "dhcp\|dnsmasq"
Example of system response:
dhcp-relay-7d85f75f76-5vdw2 2/2 Running 2 (36h ago) 36h 10.10.0.122 kaas-node-8a24b81c-76d0-4d4c-8421-962bd39df5ad <none> <none>
dnsmasq-8f4b484b4-slhbd 5/5 Running 1 (36h ago) 36h 10.233.123.75 kaas-node-8a24b81c-76d0-4d4c-8421-962bd39df5ad <none> <none>
If this is the case, proceed to the workaround below.
Workaround:
Log in to a node that contains
kubeconfigof the affected management cluster.Make sure that at least two management cluster nodes are schedulable:
kubectl get node
Example of a positive system response:
NAME STATUS ROLES AGE VERSION kaas-node-bcedb87b-b3ce-46a4-a4ca-ea3068689e40 Ready master 37h v1.27.10-mirantis-1 kaas-node-8a24b81c-76d0-4d4c-8421-962bd39df5ad Ready master 37h v1.27.10-mirantis-1 kaas-node-ad5a6f51-b98f-43c3-91d5-55fed3d0ff21 Ready master 37h v1.27.10-mirantis-1
Delete the
dhcp-relaypod:kubectl -n kaas delete pod <dhcp-relay-xxxxx>
Verify that the
dnsmasqanddhcp-relaypods are scheduled into different nodes:kubectl -n kaas get pods -o wide| grep -e "dhcp\|dnsmasq"
Example of a positive system response:
dhcp-relay-7d85f75f76-rkv03 2/2 Running 0 49s 10.10.0.121 kaas-node-bcedb87b-b3ce-46a4-a4ca-ea3068689e40 <none> <none> dnsmasq-8f4b484b4-slhbd 5/5 Running 1 (37h ago) 37h 10.233.123.75 kaas-node-8a24b81c-76d0-4d4c-8421-962bd39df5ad <none> <none>
During deletion of a manager machine running the ironic Pod from a bare
metal management cluster, the following problems occur:
All Pods are stuck in the
TerminatingstateA new
ironicPod fails to startThe related bare metal host is stuck in the
deprovisioningstate
As a workaround, before deletion of the node running the ironic Pod,
cordon and drain the node using the kubectl cordon <nodeName> and
kubectl drain <nodeName> commands.
The Cluster release 16.0.0, which is not supported for greenfield vSphere-based deployments, is still available in the drop-down menu of the cluster creation window in the Container Cloud web UI.
Do not select this Cluster release to prevent deployment failures. Use the latest supported version instead.
Due to issues with managing physical NVME devices, lcm-agent cannot grab
storage information on a host. As a result,
lcmmachine.status.hostinfo.hardware is empty and the following example
error is present in logs:
{"level":"error","ts":"2024-05-02T12:26:10Z","logger":"agent", \
"msg":"get hardware details", \
"host":"kaas-node-548b2861-aed0-41c9-8ff2-10c5476b000b", \
"error":"new storage info: get disk info \"nvme0c0n1\": \
invoke command: exit status 1","errorVerbose":"exit status 1
As a workaround, on the affected node, create a symlink for any device
indicated in lcm-agent logs. For example:
ln -sfn /dev/nvme0n1 /dev/nvme0c0n1
Fixed in 2.26.1 (17.1.1 and 16.1.1)
During the ClusterRelease update of a MOSK cluster, a
node cannot be removed from the Kubernetes cluster if the related
Machine object is disabled.
As a workaround, remove the finalizer from the affected Node
object.
Fixed in 2.29.0 (17.4.0 and 16.4.0)
During the replacement of a master node on a cluster of any type, the process
may get stuck with Kubelet's NodeReady condition is Unknown in the
machine status on the remaining master nodes.
As a workaround, log in on the affected node and run the following command:
docker restart ucp-kubelet
During MariaDB operations on a management cluster, Pods may get stuck in continuous restarts with the following example error:
[ERROR] WSREP: Corrupt buffer header: \
addr: 0x7faec6f8e518, \
seqno: 3185219421952815104, \
size: 909455917, \
ctx: 0x557094f65038, \
flags: 11577. store: 49, \
type: 49
Workaround:
Create a backup of the
/var/lib/mysqldirectory on themariadb-serverPod.Verify that other replicas are up and ready.
Remove the
galera.cachefile for the affectedmariadb-serverPod.Remove the affected
mariadb-serverPod or wait until it is automatically restarted.
After Kubernetes restarts the Pod, the Pod clones the database in 1-2 minutes and restores the quorum.
Fixed in 2.28.4 (17.3.4 and 16.3.4)
During replacement of a master node on a cluster of any type, the
calico-node Pod fails to start on a new node that has the same IP address
as the node being replaced.
Workaround:
Log in to any
masternode.From a CLI with an MKE client bundle, create a shell alias to start calicoctl using the
mirantis/ucp-dsinfoimage:alias calicoctl="\ docker run -i --rm \ --pid host \ --net host \ -e constraint:ostype==linux \ -e ETCD_ENDPOINTS=<etcdEndpoint> \ -e ETCD_KEY_FILE=/var/lib/docker/volumes/ucp-kv-certs/_data/key.pem \ -e ETCD_CA_CERT_FILE=/var/lib/docker/volumes/ucp-kv-certs/_data/ca.pem \ -e ETCD_CERT_FILE=/var/lib/docker/volumes/ucp-kv-certs/_data/cert.pem \ -v /var/run/calico:/var/run/calico \ -v /var/lib/docker/volumes/ucp-kv-certs/_data:/var/lib/docker/volumes/ucp-kv-certs/_data:ro \ mirantis/ucp-dsinfo:<mkeVersion> \ calicoctl \ "
alias calicoctl="\ docker run -i --rm \ --pid host \ --net host \ -e constraint:ostype==linux \ -e ETCD_ENDPOINTS=<etcdEndpoint> \ -e ETCD_KEY_FILE=/ucp-node-certs/key.pem \ -e ETCD_CA_CERT_FILE=/ucp-node-certs/ca.pem \ -e ETCD_CERT_FILE=/ucp-node-certs/cert.pem \ -v /var/run/calico:/var/run/calico \ -v ucp-node-certs:/ucp-node-certs:ro \ mirantis/ucp-dsinfo:<mkeVersion> \ calicoctl --allow-version-mismatch \ "
In the above command, replace the following values with the corresponding settings of the affected cluster:
<etcdEndpoint>is the etcd endpoint defined in the Calico configuration file. For example,ETCD_ENDPOINTS=127.0.0.1:12378<mkeVersion>is the MKE version installed on your cluster. For example,mirantis/ucp-dsinfo:3.5.7.
Verify the node list on the cluster:
kubectl get node
Compare this list with the node list in Calico to identify the old node:
calicoctl get node -o wide
Remove the old node from Calico:
calicoctl delete node kaas-node-<nodeID>
Fixed in 2.28.4 (17.3.4 and 16.3.4)
During replacement of a manager machine, the following problems may occur:
The system adds the node to Docker swarm but not to Kubernetes
The node
Deploymentgets stuck with failed RethinkDB health checks
Workaround:
Delete the failed node.
Wait for the MKE cluster to become healthy. To monitor the cluster status:
Log in to the MKE web UI.
Monitor the cluster status as described in MKE Operations Guide: Monitor an MKE cluster with the MKE web UI.
Deploy a new node.
Fixed in 2.28.4 (17.3.4 and 16.3.4)
During the unsafe or forced deletion of a manager machine running the
calico-kube-controllers Pod in the kube-system namespace,
the following issues occur:
The
calico-kube-controllersPod fails to clean up resources associated with the deleted nodeThe
calico-nodePod may fail to start up on a newly created node if the machine is provisioned with the same IP address as the deleted machine had
As a workaround, before deletion of the node running the
calico-kube-controllers Pod, cordon and drain the node:
kubectl cordon <nodeName>
kubectl drain <nodeName>
Fixed in 2.27.0 (17.2.0 and 16.2.0)
During graceful reboot of a cluster with Ceph enabled, the reboot is blocked
with the following message in the MiraCephMaintenance object status:
message: ClusterMaintenanceRequest found, Ceph Cluster is not ready to upgrade,
delaying cluster maintenance
As a workaround, add the following snippet to the cephFS section under
metadataServer in the spec section of <kcc-name>.yaml in the Ceph
cluster:
cephClusterSpec:
sharedFilesystem:
cephFS:
- name: cephfs-store
metadataServer:
activeCount: 1
healthCheck:
livenessProbe:
probe:
failureThreshold: 5
initialDelaySeconds: 30
periodSeconds: 30
successThreshold: 1
timeoutSeconds: 5
Note
The issue does not reproduce since MOSK 25.2.
Update of a managed cluster based on bare metal and Ceph enabled fails with
PersistentVolumeClaim getting stuck in the Pending state for the
prometheus-server StatefulSet and the
MountVolume.MountDevice failed for volume warning in the StackLight event
logs.
Workaround:
Verify that the description of the Pods that failed to run contain the
FailedMountevents:kubectl -n <affectedProjectName> describe pod <affectedPodName>
In the command above, replace the following values:
<affectedProjectName>is the Container Cloud project name where the Pods failed to run<affectedPodName>is a Pod name that failed to run in the specified project
In the Pod description, identify the node name where the Pod failed to run.
Verify that the
csi-rbdpluginlogs of the affected node contain therbd volume mount failed: <csi-vol-uuid> is being usederror. The<csi-vol-uuid>is a unique RBD volume name.Identify
csiPodNameof the correspondingcsi-rbdplugin:kubectl -n rook-ceph get pod -l app=csi-rbdplugin \ -o jsonpath='{.items[?(@.spec.nodeName == "<nodeName>")].metadata.name}'
Output the affected
csiPodNamelogs:kubectl -n rook-ceph logs <csiPodName> -c csi-rbdplugin
Scale down the affected
StatefulSetorDeploymentof the Pod that fails to0replicas.On every
csi-rbdpluginPod, search for stuckcsi-vol:for pod in `kubectl -n rook-ceph get pods|grep rbdplugin|grep -v provisioner|awk '{print $1}'`; do echo $pod kubectl exec -it -n rook-ceph $pod -c csi-rbdplugin -- rbd device list | grep <csi-vol-uuid> done
Unmap the affected
csi-vol:rbd unmap -o force /dev/rbd<i>
The
/dev/rbd<i>value is a mapped RBD volume that usescsi-vol.Delete
volumeattachmentof the affected Pod:kubectl get volumeattachments | grep <csi-vol-uuid> kubectl delete volumeattacmhent <id>
Scale up the affected
StatefulSetorDeploymentback to the original number of replicas and wait until its state becomesRunning.
Fixed in 2.29.0 (17.4.0 and 16.4.0)
On High Availability (HA) clusters that use Local Volume Provisioner (LVP), Prometheus and OpenSearch from StackLight may share the same pool of storage. In such configuration, OpenSearch may approach the 85% disk usage watermark due to the combined storage allocation and usage patterns set by the Persistent Volume Claim (PVC) size parameters for Prometheus and OpenSearch, which consume storage the most.
When the 85% threshold is reached, the affected node is transitioned to the
read-only state, preventing shard allocation and causing the OpenSearch cluster
state to transition to Warning (Yellow) or Critical (Red).
Caution
The issue and the provided workaround apply only for clusters on which OpenSearch and Prometheus utilize the same storage pool.
To verify that the cluster is affected:
Verify the result of the following formula:
0.8 × OpenSearch_PVC_Size_GB + Prometheus_PVC_Size_GB > 0.85 × Total_Storage_Capacity_GBIn the formula, define the following values:
- OpenSearch_PVC_Size_GB
Derived from
.values.elasticsearch.persistentVolumeUsableStorageSizeGB, defaulting to.values.elasticsearch.persistentVolumeClaimSizeif unspecified. To obtain the OpenSearch PVC size:kubectl -n <namespaceName> get cluster <clusterName> -o yaml |\ yq '.spec.providerSpec.value.helmReleases[] | select(.name == "stacklight") | .values.elasticsearch.persistentVolumeClaimSize '
Example of system response:
10000Gi
- Prometheus_PVC_Size_GB
Sourced from
.values.prometheusServer.persistentVolumeClaimSize. To obtain the Prometheus PVC size:kubectl -n <namespaceName> get cluster <clusterName> -o yaml |\ yq '.spec.providerSpec.value.helmReleases[] | select(.name == "stacklight") | .values.prometheusServer.persistentVolumeClaimSize '
Example of system response:
4000Gi
- Total_Storage_Capacity_GB
Total capacity of the OpenSearch PVCs. For LVP, the capacity of the storage pool. To obtain the total capacity:
kubectl get pvc -n stacklight -l app=opensearch-master \ -o custom-columns=NAME:.metadata.name,CAPACITY:.status.capacity.storage
The system response contains multiple outputs, one per
opensearch-masternode. Select the capacity for the affected node.
Note
Convert the values to GB if they are set in different units.
If the formula result is positive, it is an early indication that the cluster is affected.
Verify whether the
OpenSearchClusterStatusWarningorOpenSearchClusterStatusCriticalalert is firing. And if so, verify the following:Log in to the OpenSearch web UI.
In Management -> Dev Tools, run the following command:
GET _cluster/allocation/explainThe following system response indicates that the corresponding node is affected:
"explanation": "the node is above the low watermark cluster setting \ [cluster.routing.allocation.disk.watermark.low=85%], using more disk space \ than the maximum allowed [85.0%], actual free: [xx.xxx%]"
Note
The system response may contain even higher watermark percent than 85.0%, depending on the case.
Workaround:
Warning
The workaround implies adjustement of the retention threshold for OpenSearch. And depending on the new threshold, some old logs will be deleted.
Adjust or set
.values.elasticsearch.persistentVolumeUsableStorageSizeGBto a lower value for the affection check formula to be non-positive. For configuration details, see MOSK Operations Guide: StackLight configuration parameters - OpenSearch.Mirantis also recommends reserving some space for other PVCs using storage from the pool. Use the following formula to calculate the required space:
persistentVolumeUsableStorageSizeGB = 0.84 × ((1 - Reserved_Percentage - Filesystem_Reserve) × Total_Storage_Capacity_GB - Prometheus_PVC_Size_GB) / 0.8
In the formula, define the following values:
- Reserved_Percentage
A user-defined variable that specifies what percentage of the total storage capacity should not be used by OpenSearch or Prometheus. This is used to reserve space for other components. It should be expressed as a decimal. For example, for 5% of reservation,
Reserved_Percentageis 0.05. Mirantis recommends using 0.05 as a starting point.- Filesystem_Reserve
Percentage to deduct for filesystems that may reserve some portion of the available storage, which is marked as occupied. For example, for EXT4, it is 5% by default, so the value must be 0.05.
- Prometheus_PVC_Size_GB
Sourced from
.values.prometheusServer.persistentVolumeClaimSize.- Total_Storage_Capacity_GB
Total capacity of the OpenSearch PVCs. For LVP, the capacity of the storage pool. To obtain the total capacity:
kubectl get pvc -n stacklight -l app=opensearch-master \ -o custom-columns=NAME:.metadata.name,CAPACITY:.status.capacity.storage
The system response contains multiple outputs, one per
opensearch-masternode. Select the capacity for the affected node.
Note
Convert the values to GB if they are set in different units.
Calculation of above formula provides a maximum safe storage to allocate for
.values.elasticsearch.persistentVolumeUsableStorageSizeGB. Use this formula as a reference for setting.values.elasticsearch.persistentVolumeUsableStorageSizeGBon a cluster.Wait up to 15-20 mins for OpenSearch to perform the cleaning.
Verify that the cluster is not affected anymore using the procedure above.
Fixed in 17.2.0, 16.2.0, 17.1.6, 16.1.6
On large managed clusters, shard relocation may fail in the OpenSearch cluster
with the yellow or red status of the OpenSearch cluster.
The characteristic symptom of the issue is that in the stacklight
namespace, the statefulset.apps/opensearch-master containers are
experiencing throttling with the KubeContainersCPUThrottlingHigh alert
firing for the following set of labels:
{created_by_kind="StatefulSet",created_by_name="opensearch-master",namespace="stacklight"}
Caution
The throttling that OpenSearch is experiencing may be a temporary situation, which may be related, for example, to a peaky load and the ongoing shards initialization as part of disaster recovery or after node restart. In this case, Mirantis recommends waiting until initialization of all shards is finished. After that, verify the cluster state and whether throttling still exists. And only if throttling does not disappear, apply the workaround below.
To verify that the initialization of shards is ongoing:
kubectl exec -it pod/opensearch-master-0 -n stacklight -c opensearch -- bash
curl "http://localhost:9200/_cat/shards" | grep INITIALIZING
Example of system response:
.ds-system-000072 2 r INITIALIZING 10.232.182.135 opensearch-master-1
.ds-system-000073 1 r INITIALIZING 10.232.7.145 opensearch-master-2
.ds-system-000073 2 r INITIALIZING 10.232.182.135 opensearch-master-1
.ds-audit-000001 2 r INITIALIZING 10.232.7.145 opensearch-master-2
The system response above indicates that shards from the
.ds-system-000072, .ds-system-000073, and .ds-audit-000001
indicies are in the INITIALIZING state. In this case, Mirantis
recommends waiting until this process is finished, and only then consider
changing the limit.
You can additionally analyze the exact level of throttling and the current CPU usage on the Kubernetes Containers dashboard in Grafana.
Workaround:
Verify the currently configured CPU requests and limits for the
opensearchcontainers:kubectl -n stacklight get statefulset.apps/opensearch-master -o jsonpath="{.spec.template.spec.containers[?(@.name=='opensearch')].resources}"
Example of system response:
{"limits":{"cpu":"600m","memory":"8Gi"},"requests":{"cpu":"500m","memory":"6Gi"}}
In the example above, the CPU request is
500mand the CPU limit is600m.Increase the CPU limit to a reasonably high number.
For example, the default CPU limit for the clusters with the
clusterSize:largeparameter set was increased from8000mto12000mfor StackLight in Container Cloud 2.27.0 (Cluster releases 17.2.0 and 16.2.0).Note
For details, on the
clusterSizeparameter, see MOSK Operations Guide: StackLight configuration parameters - Cluster size.If the defaults are already overridden on the affected cluster using the
resourcesPerClusterSizeorresourcesparameters as described in MOSK Operations Guide: StackLight configuration parameters - Resource limits, then the exact recommended number depends on the currently set limit.Mirantis recommends increasing the limit by 50%. If it does not resolve the issue, another increase iteration will be required.
When you select the required CPU limit, increase it as described in MOSK Operations Guide: StackLight configuration parameters - Resource limits.
If the CPU limit for the
opensearchcomponent is already set, increase it in theClusterobject for theopensearchparameter. Otherwise, the default StackLight limit is used. In this case, increase the CPU limit for theopensearchcomponent using theresourcesparameter.Wait until all
opensearch-masterpods are recreated with the new CPU limits and becomerunningandready.To verify the current CPU limit for every
opensearchcontainer in everyopensearch-masterpod separately:kubectl -n stacklight get pod/opensearch-master-<podSuffixNumber> -o jsonpath="{.spec.containers[?(@.name=='opensearch')].resources}"
In the command above, replace
<podSuffixNumber>with the name of the pod suffix. For example,pod/opensearch-master-0orpod/opensearch-master-2.Example of system response:
{"limits":{"cpu":"900m","memory":"8Gi"},"requests":{"cpu":"500m","memory":"6Gi"}}
The waiting time may take up to 20 minutes depending on the cluster size.
If the issue is fixed, the KubeContainersCPUThrottlingHigh alert stops
firing immediately, while OpenSearchClusterStatusWarning or
OpenSearchClusterStatusCritical can still be firing for some time during
shard relocation.
If the KubeContainersCPUThrottlingHigh alert is still firing, proceed with
another iteration of the CPU limit increase.
Fixed in 17.2.0, 16.2.0, 17.1.6, 16.1.6
While updating rollover_policy for the current system* and audit*
data streams, the update is not applied to indices.
One of indicators that the cluster is most likely affected is the
KubeJobFailed alert firing for the elasticsearch-curator job and one or
both of the following errors being present in elasticsearch-curator pods
that remain in the Error status:
2024-05-31 13:16:04,459 ERROR Failed to complete action: delete_indices. <class 'curator.exceptions.FailedExecution'>: Exception encountered. Rerun with loglevel DEBUG and/or check Elasticsearch logs for more information. Exception: RequestError(400, 'illegal_argument_exception', 'index [.ds-audit-000001] is the write index for data stream [audit] and cannot be deleted')
or
2024-05-31 13:16:04,459 ERROR Failed to complete action: delete_indices. <class 'curator.exceptions.FailedExecution'>: Exception encountered. Rerun with loglevel DEBUG and/or check Elasticsearch logs for more information. Exception: RequestError(400, 'illegal_argument_exception', 'index [.ds-system-000001] is the write index for data stream [system] and cannot be deleted')
Note
Instead of .ds-audit-000001 or .ds-system-000001 index names,
similar names can be present with the same prefix but different suffix
numbers.
If the above mentioned alert and errors are present, an immediate action is required, because it indicates that the corresponding index size has already exceeded the space allocated for the index.
To verify that the cluster is affected:
Caution
Verify and apply the workaround to both index patterns, system and audit, separately.
If one of indices is affected, the second one is most likely affected as well. Although in rare cases, only one index may be affected.
Log in to the
opensearch-master-0Pod:kubectl exec -it pod/opensearch-master-0 -n stacklight -c opensearch -- bash
Verify that the rollover policy is present:
system:curl localhost:9200/_plugins/_ism/policies/system_rollover_policyaudit:curl localhost:9200/_plugins/_ism/policies/audit_rollover_policy
The cluster is affected if the rollover policy is missing. Otherwise, proceed to the following step.
Verify the system response from the previous step. For example:
{"_id":"system_rollover_policy","_version":7229,"_seq_no":42362,"_primary_term":28,"policy":{"policy_id":"system_rollover_policy","description":"system index rollover policy.","last_updated_time":1708505222430,"schema_version":19,"error_notification":null,"default_state":"rollover","states":[{"name":"rollover","actions":[{"retry":{"count":3,"backoff":"exponential","delay":"1m"},"rollover":{"min_size":"14746mb","copy_alias":false}}],"transitions":[]}],"ism_template":[{"index_patterns":["system*"],"priority":200,"last_updated_time":1708505222430}]}}
Verify and capture the following items separately for every policy:
The
_seq_noand_primary_termvaluesThe rollover policy threshold, which is defined in
policy.states[0].actions[0].rollover.min_size
List indices:
system:curl localhost:9200/_cat/indices | grep system
Example of system response:
[...] green open .ds-system-000001 FjglnZlcTKKfKNbosaE9Aw 2 1 1998295 0 1gb 507.9mb
audit:curl localhost:9200/_cat/indices | grep audit
Example of system response:
[...] green open .ds-audit-000001 FjglnZlcTKKfKNbosaE9Aw 2 1 1998295 0 1gb 507.9mb
Select the index with the highest number and verify the rollover policy attached to the index:
system:curl localhost:9200/_plugins/_ism/explain/.ds-system-000001audit:curl localhost:9200/_plugins/_ism/explain/.ds-audit-000001If the rollover policy is not attached, the cluster is affected.
If the rollover policy is attached but
_seq_noand_primary_termnumbers do not match the previously captured ones, the cluster is affected.If the index size drastically exceeds the defined threshold of the rollover policy (which is the previously captured
min_size), the cluster is most probably affected.
Workaround:
Log in to the
opensearch-master-0Pod:kubectl exec -it pod/opensearch-master-0 -n stacklight -c opensearch -- bash
If the policy is attached to the index but has different
_seq_noand_primary_term, remove the policy from the index:Note
Use the index with the highest number in the name, which was captured during verification procedure.
system:curl -XPOST localhost:9200/_plugins/_ism/remove/.ds-system-000001
audit:curl -XPOST localhost:9200/_plugins/_ism/remove/.ds-audit-000001
Re-add the policy:
system:curl -XPOST -H "Content-type: application/json" localhost:9200/_plugins/_ism/add/system* -d'{"policy_id":"system_rollover_policy"}'
audit:curl -XPOST -H "Content-type: application/json" localhost:9200/_plugins/_ism/add/audit* -d'{"policy_id":"audit_rollover_policy"}'
Perform again the last step of the cluster verification procedure provided above and make sure that the policy is attached to the index and has the same
_seq_noand_primary_term.If the index size drastically exceeds the defined threshold of the rollover policy (which is the previously captured
min_size), wait up to 15 minutes and verify that the additional index is created with the consecutive number in the index name. For example:system: if you applied changes to.ds-system-000001, wait until.ds-system-000002is created.audit: if you applied changes to.ds-audit-000001, wait until.ds-audit-000002is created.
If such index is not created, escalate the issue to Mirantis support.
During configuration of a management cluster settings using the Configure cluster web UI menu, updating the Keycloak Truststore settings is mandatory, despite being optional.
As a workaround, update the management cluster using the API or CLI.
The following table lists the major components and their versions delivered in the Container Cloud 2.26.0.
Note
The components that are newly added, updated, deprecated, or removed
as compared to the previous release version, are marked
with a corresponding superscript,
for example, lcm-ansible Updated.
Component |
Application/Service |
Version |
|---|---|---|
Bare metal Updated |
ambasador |
1.39.13 |
baremetal-dnsmasq |
base-2-26-alpine-20240129134230 |
|
baremetal-operator |
base-2-26-alpine-20240129135007 |
|
baremetal-provider |
1.39.13 |
|
bm-collective |
base-2-26-alpine-20240129155244 |
|
cluster-api-provider-baremetal |
1.39.13 |
|
ironic |
yoga-jammy-20240108060019 |
|
ironic-inspector |
yoga-jammy-20240108060019 |
|
ironic-prometheus-exporter |
0.1-20240117102150 |
|
kaas-ipam |
base-2-26-alpine-20240129213142 |
|
kubernetes-entrypoint |
1.0.1-55b02f7-20231019172556 |
|
mariadb |
10.6.14-focal-20231127070342 |
|
metallb-controller |
0.13.12-31212f9e-amd64 |
|
metallb-speaker |
0.13.12-31212f9e-amd64 |
|
syslog-ng |
base-alpine-20240129163811 |
|
Container Cloud |
admission-controller Updated |
1.39.13 |
agent-controller Updated |
1.39.13 |
|
byo-cluster-api-controller New |
1.39.13 |
|
byo-credentials-controller New |
1.39.13 |
|
ceph-kcc-controller Updated |
1.39.13 |
|
cert-manager-controller |
1.11.0-5 |
|
cinder-csi-plugin Updated |
1.27.2-11 |
|
client-certificate-controller Updated |
1.39.13 |
|
configuration-collector Updated |
1.39.13 |
|
csi-attacher Updated |
4.2.0-4 |
|
csi-node-driver-registrar Updated |
2.7.0-4 |
|
csi-provisioner Updated |
3.4.1-4 |
|
csi-resizer Updated |
1.7.0-4 |
|
csi-snapshotter Updated |
6.2.1-mcc-3 |
|
event-controller Updated |
1.39.13 |
|
frontend Updated |
1.39.13 |
|
golang |
1.20.4-alpine3.17 |
|
iam-controller Updated |
1.39.13 |
|
kaas-exporter Updated |
1.39.13 |
|
kproxy Updated |
1.39.13 |
|
lcm-controller Updated |
1.39.13 |
|
license-controller Updated |
1.39.13 |
|
livenessprobe Updated |
2.9.0-4 |
|
machinepool-controller Updated |
1.38.17 |
|
mcc-haproxy Updated |
0.24.0-46-gdaf7dbc |
|
metrics-server Updated |
0.6.3-6 |
|
nginx Updated |
1.39.13 |
|
policy-controller New |
1.39.13 |
|
portforward-controller Updated |
1.39.13 |
|
proxy-controller Updated |
1.39.13 |
|
rbac-controller Updated |
1.39.13 |
|
registry Updated |
2.8.1-9 |
|
release-controller Updated |
1.39.13 |
|
rhellicense-controller Updated |
1.39.13 |
|
scope-controller Updated |
1.39.13 |
|
storage-discovery Updated |
1.39.13 |
|
user-controller Updated |
1.39.13 |
|
IAM |
iam Updated |
1.39.13 |
iam-controller Updated |
1.39.13 |
|
keycloak Removed |
n/a |
|
mcc-keycloak New |
23.0.3-1 |
|
OpenStack Updated |
host-os-modules-controller New |
1.39.13 |
openstack-cloud-controller-manager |
v1.27.2-12 |
|
openstack-cluster-api-controller |
1.39.13 |
|
openstack-provider |
1.39.13 |
|
os-credentials-controller |
1.39.13 |
|
VMware vSphere |
mcc-keepalived Updated |
0.24.0-46-gdaf7dbc |
squid-proxy |
0.0.1-10-g24a0d69 |
|
vsphere-cloud-controller-manager New |
v1.27.0-5 |
|
vsphere-cluster-api-controller Updated |
1.39.13 |
|
vsphere-credentials-controller Updated |
1.39.13 |
|
vsphere-csi-driver New |
v3.0.2-1 |
|
vsphere-csi-syncer New |
v3.0.2-1 |
|
vsphere-provider Updated |
1.39.13 |
|
vsphere-vm-template-controller Updated |
1.39.13 |
This section lists the artifacts of components included in the Container Cloud release 2.26.0.
Note
The components that are newly added, updated, deprecated, or removed
as compared to the previous release version, are marked
with a corresponding superscript,
for example, lcm-ansible Updated.
Artifact |
Component |
Path |
|---|---|---|
Binaries Updated |
ironic-python-agent.initramfs |
https://binary.mirantis.com/bm/bin/ironic/ipa/ubuntu/initramfs-yoga-focal-debug-20240201183421 |
ironic-python-agent.kernel |
https://binary.mirantis.com/bm/bin/ironic/ipa/ubuntu/kernel-yoga-focal-debug-20240201183421 |
|
provisioning_ansible |
https://binary.mirantis.com/bm/bin/ansible/provisioning_ansible-0.1.1-146-1bd8e71.tgz |
|
Helm charts Updated |
baremetal-api |
https://binary.mirantis.com/core/helm/baremetal-api-1.39.13.tgz |
baremetal-operator |
https://binary.mirantis.com/core/helm/baremetal-operator-1.39.13.tgz |
|
baremetal-provider |
https://binary.mirantis.com/core/helm/baremetal-provider-1.39.13.tgz |
|
baremetal-public-api |
https://binary.mirantis.com/core/helm/baremetal-public-api-1.39.13.tgz |
|
kaas-ipam |
||
local-volume-provisioner |
https://binary.mirantis.com/core/helm/local-volume-provisioner-1.39.13.tgz |
|
metallb |
||
Docker images Updated |
ambasador |
mirantis.azurecr.io/core/external/nginx:1.39.13 |
baremetal-dnsmasq |
mirantis.azurecr.io/bm/baremetal-dnsmasq:base-2-26-alpine-20240129134230 |
|
baremetal-operator |
mirantis.azurecr.io/bm/baremetal-operator:base-2-26-alpine-20240129135007 |
|
bm-collective |
mirantis.azurecr.io/bm/bm-collective:base-2-26-alpine-20240129155244 |
|
cluster-api-provider-baremetal |
mirantis.azurecr.io/core/cluster-api-provider-baremetal:1.39.13 |
|
ironic |
mirantis.azurecr.io/openstack/ironic:yoga-jammy-20240108060019 |
|
ironic-inspector |
mirantis.azurecr.io/openstack/ironic-inspector:yoga-jammy-20240108060019 |
|
ironic-prometheus-exporter |
mirantis.azurecr.io/stacklight/ironic-prometheus-exporter:0.1-20240117102150 |
|
kaas-ipam |
mirantis.azurecr.io/bm/kaas-ipam:base-2-26-alpine-20240129213142 |
|
kubernetes-entrypoint |
mirantis.azurecr.io/openstack/extra/kubernetes-entrypoint:v1.0.1-55b02f7-20231019172556 |
|
mariadb |
mirantis.azurecr.io/general/mariadb:10.6.14-focal-20231127070342 |
|
mcc-keepalived |
mirantis.azurecr.io/lcm/mcc-keepalived:v0.24.0-46-gdaf7dbc |
|
metallb-controller |
mirantis.azurecr.io/bm/metallb/controller:v0.13.12-31212f9e-amd64 |
|
metallb-speaker |
mirantis.azurecr.io/bm/metallb/speaker:v0.13.12-31212f9e-amd64 |
|
syslog-ng |
mirantis.azurecr.io/bm/syslog-ng:base-alpine-20240129163811 |
Artifact |
Component |
Path |
|---|---|---|
Bootstrap tarball Updated |
bootstrap-darwin |
https://binary.mirantis.com/core/bin/bootstrap-darwin-1.39.13.tgz |
bootstrap-linux |
https://binary.mirantis.com/core/bin/bootstrap-linux-1.39.13.tgz |
|
Helm charts |
admission-controller Updated |
https://binary.mirantis.com/core/helm/admission-controller-1.39.13.tgz |
agent-controller Updated |
https://binary.mirantis.com/core/helm/agent-controller-1.39.13.tgz |
|
byo-credentials-controller New |
https://binary.mirantis.com/core/helm/byo-credentials-controller-1.39.13.tgz |
|
byo-provider New |
https://binary.mirantis.com/core/helm/byo-provider-1.39.13.tgz |
|
ceph-kcc-controller Updated |
https://binary.mirantis.com/core/helm/ceph-kcc-controller-1.39.13.tgz |
|
cert-manager Updated |
https://binary.mirantis.com/core/helm/cert-manager-1.39.13.tgz |
|
cinder-csi-plugin Updated |
https://binary.mirantis.com/core/helm/cinder-csi-plugin-1.39.13.tgz |
|
client-certificate-controller Updated |
https://binary.mirantis.com/core/helm/client-certificate-controller-1.39.13.tgz |
|
configuration-collector Updated |
https://binary.mirantis.com/core/helm/configuration-collector-1.39.13.tgz |
|
event-controller Updated |
https://binary.mirantis.com/core/helm/event-controller-1.39.13.tgz |
|
host-os-modules-controller New |
https://binary.mirantis.com/core/helm/host-os-modules-controller-1.39.13.tgz |
|
iam-controller Updated |
https://binary.mirantis.com/core/helm/iam-controller-1.39.13.tgz |
|
kaas-exporter Updated |
https://binary.mirantis.com/core/helm/kaas-exporter-1.39.13.tgz |
|
kaas-public-api Updated |
https://binary.mirantis.com/core/helm/kaas-public-api-1.39.13.tgz |
|
kaas-ui Updated |
||
lcm-controller Updated |
https://binary.mirantis.com/core/helm/lcm-controller-1.39.13.tgz |
|
license-controller Updated |
https://binary.mirantis.com/core/helm/license-controller-1.39.13.tgz |
|
machinepool-controller Updated |
https://binary.mirantis.com/core/helm/machinepool-controller-1.39.13.tgz |
|
mcc-cache Updated |
||
mcc-cache-warmup Updated |
https://binary.mirantis.com/core/helm/mcc-cache-warmup-1.39.13.tgz |
|
metrics-server Updated |
https://binary.mirantis.com/core/helm/metrics-server-1.39.13.tgz |
|
openstack-cloud-controller-manager Updated |
https://binary.mirantis.com/core/helm/openstack-cloud-controller-manager-1.39.13.tgz |
|
openstack-provider Updated |
https://binary.mirantis.com/core/helm/openstack-provider-1.39.13.tgz |
|
os-credentials-controller Updated |
https://binary.mirantis.com/core/helm/os-credentials-controller-1.39.13.tgz |
|
policy-controller New |
https://binary.mirantis.com/core/helm/policy-controller-1.39.13.tgz |
|
portforward-controller Updated |
https://binary.mirantis.com/core/helm/portforward-controller-1.39.13.tgz |
|
proxy-controller Updated |
https://binary.mirantis.com/core/helm/proxy-controller-1.39.13.tgz |
|
rbac-controller Updated |
https://binary.mirantis.com/core/helm/rbac-controller-1.39.13.tgz |
|
release-controller Updated |
https://binary.mirantis.com/core/helm/release-controller-1.39.13.tgz |
|
rhellicense-controller Updated |
https://binary.mirantis.com/core/helm/rhellicense-controller-1.39.13.tgz |
|
scope-controller Updated |
https://binary.mirantis.com/core/helm/scope-controller-1.39.13.tgz |
|
squid-proxy Updated |
https://binary.mirantis.com/core/helm/squid-proxy-1.39.13.tgz |
|
user-controller Updated |
https://binary.mirantis.com/core/helm/user-controller-1.39.13.tgz |
|
vsphere-cloud-controller-manager New |
https://binary.mirantis.com/core/helm/vsphere-cloud-controller-manager-1.39.13.tgz |
|
vsphere-credentials-controller Updated |
https://binary.mirantis.com/core/helm/vsphere-credentials-controller-1.39.13.tgz |
|
vsphere-csi-plugin New |
https://binary.mirantis.com/core/helm/vsphere-csi-plugin-1.39.13.tgz |
|
vsphere-provider Updated |
https://binary.mirantis.com/core/helm/vsphere-provider-1.39.13.tgz |
|
vsphere-vm-template-controller Updated |
https://binary.mirantis.com/core/helm/vsphere-vm-template-controller-1.39.13.tgz |
|
Docker images |
admission-controller Updated |
mirantis.azurecr.io/core/admission-controller:1.39.13 |
agent-controller Updated |
mirantis.azurecr.io/core/agent-controller:1.39.13 |
|
byo-cluster-api-controller New |
mirantis.azurecr.io/core/byo-cluster-api-controller:1.39.13 |
|
byo-credentials-controller New |
mirantis.azurecr.io/core/byo-credentials-controller:1.39.13 |
|
ceph-kcc-controller Updated |
mirantis.azurecr.io/core/ceph-kcc-controller:1.39.13 |
|
cert-manager-controller Updated |
mirantis.azurecr.io/core/external/cert-manager-controller:v1.11.0-5 |
|
cinder-csi-plugin Updated |
mirantis.azurecr.io/lcm/kubernetes/cinder-csi-plugin:v1.27.2-11 |
|
client-certificate-controller Updated |
mirantis.azurecr.io/core/client-certificate-controller:1.39.13 |
|
configuration-collector Updated |
mirantis.azurecr.io/core/configuration-collector:1.39.13 |
|
csi-attacher Updated |
mirantis.azurecr.io/lcm/k8scsi/csi-attacher:v4.2.0-4 |
|
csi-node-driver-registrar Updated |
mirantis.azurecr.io/lcm/k8scsi/csi-node-driver-registrar:v2.7.0-4 |
|
csi-provisioner Updated |
mirantis.azurecr.io/lcm/k8scsi/csi-provisioner:v3.4.1-4 |
|
csi-resizer Updated |
mirantis.azurecr.io/lcm/k8scsi/csi-resizer:v1.7.0-4 |
|
csi-snapshotter Updated |
mirantis.azurecr.io/lcm/k8scsi/csi-snapshotter:v6.2.1-mcc-3 |
|
event-controller Updated |
mirantis.azurecr.io/core/event-controller:1.39.13 |
|
frontend Updated |
mirantis.azurecr.io/core/frontend:1.39.13 |
|
host-os-modules-controller New |
mirantis.azurecr.io/core/host-os-modules-controller:1.39.13 |
|
iam-controller Updated |
mirantis.azurecr.io/core/iam-controller:1.39.13 |
|
kaas-exporter Updated |
mirantis.azurecr.io/core/kaas-exporter:1.39.13 |
|
kproxy Updated |
mirantis.azurecr.io/core/kproxy:1.39.13 |
|
lcm-controller Updated |
mirantis.azurecr.io/core/lcm-controller:1.39.13 |
|
license-controller Updated |
mirantis.azurecr.io/core/license-controller:1.39.13 |
|
livenessprobe Updated |
mirantis.azurecr.io/lcm/k8scsi/livenessprobe:v2.9.0-4 |
|
machinepool-controller Updated |
mirantis.azurecr.io/core/machinepool-controller:1.39.13 |
|
mcc-haproxy Updated |
mirantis.azurecr.io/lcm/mcc-haproxy:v0.24.0-46-gdaf7dbc |
|
mcc-keepalived Updated |
mirantis.azurecr.io/lcm/mcc-keepalived:v0.24.0-46-gdaf7dbc |
|
metrics-server Updated |
mirantis.azurecr.io/lcm/metrics-server-amd64:v0.6.3-6 |
|
nginx Updated |
mirantis.azurecr.io/core/external/nginx:1.39.13 |
|
openstack-cloud-controller-manager Updated |
mirantis.azurecr.io/lcm/kubernetes/openstack-cloud-controller-manager:v1.27.2-12 |
|
openstack-cluster-api-controller Updated |
mirantis.azurecr.io/core/openstack-cluster-api-controller:1.39.13 |
|
os-credentials-controller Updated |
mirantis.azurecr.io/core/os-credentials-controller:1.39.13 |
|
policy-controller New |
mirantis.azurecr.io/core/policy-controller:1.39.13 |
|
portforward-controller Updated |
mirantis.azurecr.io/core/portforward-controller:1.39.13 |
|
proxy-controller Updated |
mirantis.azurecr.io/core/proxy-controller:1.39.13 |
|
rbac-controller Updated |
mirantis.azurecr.io/core/rbac-controller:1.39.13 |
|
registry Updated |
mirantis.azurecr.io/lcm/registry:v2.8.1-9 |
|
release-controller Updated |
mirantis.azurecr.io/core/release-controller:1.39.13 |
|
rhellicense-controller Updated |
mirantis.azurecr.io/core/rhellicense-controller:1.39.13 |
|
scope-controller Updated |
mirantis.azurecr.io/core/scope-controller:1.39.13 |
|
squid-proxy |
mirantis.azurecr.io/lcm/squid-proxy:0.0.1-10-g24a0d69 |
|
user-controller Updated |
mirantis.azurecr.io/core/user-controller:1.39.13 |
|
vsphere-cloud-controller-manager New |
mirantis.azurecr.io/lcm/kubernetes/vsphere-cloud-controller-manager:v1.27.0-5 |
|
vsphere-cluster-api-controller Updated |
mirantis.azurecr.io/core/vsphere-cluster-api-controller:1.39.13 |
|
vsphere-credentials-controller Updated |
mirantis.azurecr.io/core/vsphere-credentials-controller:1.39.13 |
|
vsphere-csi-driver New |
mirantis.azurecr.io/lcm/kubernetes/vsphere-csi-driver:v3.0.2-1 |
|
vsphere-csi-syncer New |
mirantis.azurecr.io/lcm/kubernetes/vsphere-csi-syncer:v3.0.2-1 |
|
vsphere-vm-template-controller Updated |
mirantis.azurecr.io/core/vsphere-vm-template-controller:1.39.13 |
Artifact |
Component |
Path |
|---|---|---|
Binaries |
hash-generate-darwin |
http://binary.mirantis.com/iam/bin/hash-generate-0.0.1-268-3cf7f17-darwin |
hash-generate-linux |
http://binary.mirantis.com/iam/bin/hash-generate-0.0.1-268-3cf7f17-linux |
|
Helm charts Updated |
iam |
|
Docker images |
keycloak Removed |
n/a |
kubectl New |
mirantis.azurecr.io/stacklight/kubectl:1.22-20240105023016 |
|
kubernetes-entrypoint Updated |
mirantis.azurecr.io/openstack/extra/kubernetes-entrypoint:v1.0.1-55b02f7-20231019172556 |
|
mariadb Updated |
mirantis.azurecr.io/general/mariadb:10.6.14-focal-20231127070342 |
|
mcc-keycloak New |
mirantis.azurecr.io/iam/mcc-keycloak:23.0.3-1 |
The table below includes the total numbers of addressed unique and common vulnerabilities and exposures (CVE) by product component since the 2.25.4 patch release. The common CVEs are issues addressed across several images.
Product component |
CVE type |
Critical |
High |
Total |
|---|---|---|---|---|
Ceph |
Unique |
0 |
2 |
2 |
Common |
0 |
6 |
6 |
|
Kaas core |
Unique |
0 |
7 |
7 |
Common |
0 |
8 |
8 |
|
StackLight |
Unique |
3 |
7 |
10 |
Common |
5 |
19 |
24 |
Mirantis Security Portal
For the detailed list of fixed and existing CVEs across the Mirantis Container Cloud and MOSK products, refer to Mirantis Security Portal.
MOSK CVEs
For the number of fixed CVEs in the MOSK-related components including OpenStack and Tungsten Fabric, refer to MOSK 24.1: Security notes.
This section describes the specific actions you as a cloud operator need to complete before or after your Container Cloud cluster update to the Cluster releases 17.1.0 or 16.1.0.
Consider this information as a supplement to the generic update procedures published in Operations Guide: Automatic upgrade of a management cluster and Update a managed cluster.
If any pinned product artifacts are present in the Cluster object of a
management or managed cluster, the update will be blocked by the Admission
Controller with the invalid HelmReleases configuration error until such
artifacts are removed. The update process does not start and any changes in
the Cluster object are blocked by the Admission Controller except the
removal of fields with pinned product artifacts.
Therefore, verify that the following sections of the Cluster objects
do not contain any image-related (tag, name, pullPolicy,
repository) and global values inside Helm releases:
.spec.providerSpec.value.helmReleases.spec.providerSpec.value.kaas.management.helmReleases.spec.providerSpec.value.regionalHelmReleases.spec.providerSpec.value.regional
For example, a cluster configuration that contains the following highlighted lines will be blocked until you remove them:
- name: kaas-ipam
values:
kaas_ipam:
image:
tag: base-focal-20230127092754
exampleKey: exampleValue
- name: kaas-ipam
values:
global:
anyKey: anyValue
kaas_ipam:
image:
tag: base-focal-20230127092754
exampleKey: exampleValue
The custom pinned product artifacts are inspected and blocked by the Admission Controller to ensure that Container Cloud clusters remain consistently updated with the latest security fixes and product improvements
Note
The pre-update inspection applies only to images delivered by Container Cloud that are overwritten. Any custom images unrelated to the product components are not verified and do not block cluster update.
Container Cloud 2.26.0 introduces reorganized and significantly improved
StackLight logging pipeline. It involves changes in queries implemented
in the scope of the logging.metricQueries feature designed for creation
of custom log-based metrics. For the procedure, see StackLight
operations: Create logs-based metrics.
If you already have some custom log-based metrics:
Before the cluster update, save existing queries.
After the cluster update, update the queries according to the changes implemented in the scope of the
logging.metricQueriesfeature.
These steps prevent failures of queries containing fields that are renamed or removed in Container Cloud 2.26.0.
Container Cloud 2.26.0 introduces the bird daemon update from v1.6.8
to v2.0.7 on master nodes if BGP is used for BGP announcement of the cluster
API load balancer address.
Configuration files for bird v1.x are not fully compatible with those for
bird v2.x. Therefore, if you used BGP announcement of cluster API LB address
on a deployment based on Cluster releases 17.0.0 or 16.0.0, update bird
configuration files to fit bird v2.x using configuration examples provided in
the API Reference: MultirRackCluster section.
To prevent underused or overused storage space, review your storage space parameters for OpenSearch on the StackLight cluster:
Review the value of
elasticsearch.persistentVolumeClaimSizeand the real storage available on volumes.Decide whether you have to additionally set
elasticsearch.persistentVolumeUsableStorageSizeGB.
For both parameters description, see MOSK Operations Guide: StackLight configuration parameters - OpenSearch.
The Container Cloud patch release 2.25.4, which is based on the 2.25.0 major release, provides the following updates:
Support for the patch Cluster releases 16.0.4 and 17.0.4 that represents Mirantis OpenStack for Kubernetes (MOSK) patch release 23.3.4 patch.
Security fixes for CVEs in images.
This patch release also supports the latest major Cluster releases 17.0.0 and 16.0.0. And it does not support greenfield deployments based on deprecated Cluster releases. Use the latest available Cluster release instead.
For main deliverables of the parent Container Cloud release of 2.25.4, refer to 2.25.0.
This section lists the artifacts of components included in the Container Cloud patch release 2.25.4. For artifacts of the Cluster releases introduced in 2.25.4, see patch Cluster releases 17.0.4 and 16.0.4.
Note
The components that are newly added, updated, deprecated, or removed
as compared to the previous release version, are marked
with a corresponding superscript,
for example, lcm-ansible Updated.
Artifact |
Component |
Path |
|---|---|---|
Binaries |
ironic-python-agent.initramfs |
https://binary.mirantis.com/bm/bin/ironic/ipa/ubuntu/initramfs-yoga-focal-debug-20231012141354 |
ironic-python-agent.kernel |
https://binary.mirantis.com/bm/bin/ironic/ipa/ubuntu/kernel-yoga-focal-debug-20231012141354 |
|
provisioning_ansible |
https://binary.mirantis.com/bm/bin/ansible/provisioning_ansible-0.1.1-113-4f8b843.tgz |
|
Helm charts Updated |
baremetal-api |
https://binary.mirantis.com/core/helm/baremetal-api-1.38.33.tgz |
baremetal-operator |
https://binary.mirantis.com/core/helm/baremetal-operator-1.38.33.tgz |
|
baremetal-provider |
https://binary.mirantis.com/core/helm/baremetal-provider-1.38.33.tgz |
|
baremetal-public-api |
https://binary.mirantis.com/core/helm/baremetal-public-api-1.38.33.tgz |
|
kaas-ipam |
||
local-volume-provisioner |
https://binary.mirantis.com/core/helm/local-volume-provisioner-1.38.33.tgz |
|
metallb |
||
Docker images |
ambasador Updated |
mirantis.azurecr.io/core/external/nginx:1.38.33 |
baremetal-dnsmasq |
mirantis.azurecr.io/bm/baremetal-dnsmasq:base-2-25-alpine-20231128145936 |
|
baremetal-operator |
mirantis.azurecr.io/bm/baremetal-operator:base-2-25-alpine-20231204121500 |
|
bm-collective |
mirantis.azurecr.io/bm/bm-collective:base-2-25-alpine-20231121115652 |
|
cluster-api-provider-baremetal Updated |
mirantis.azurecr.io/core/cluster-api-provider-baremetal:1.38.33 |
|
ironic |
mirantis.azurecr.io/openstack/ironic:yoga-jammy-20231204153029 |
|
ironic-inspector |
mirantis.azurecr.io/openstack/ironic-inspector:yoga-jammy-20231204153029 |
|
ironic-prometheus-exporter |
mirantis.azurecr.io/stacklight/ironic-prometheus-exporter:0.1-20231204142028 |
|
kaas-ipam |
mirantis.azurecr.io/bm/kaas-ipam:base-2-25-alpine-20231121164200 |
|
kubernetes-entrypoint |
mirantis.azurecr.io/openstack/extra/kubernetes-entrypoint:v1.0.1-55b02f7-20231019172556 |
|
mariadb |
mirantis.azurecr.io/general/mariadb:10.6.14-focal-20231127070342 |
|
mcc-keepalived Updated |
mirantis.azurecr.io/lcm/mcc-keepalived:v0.23.0-88-g35be0fc |
|
metallb-controller |
mirantis.azurecr.io/bm/metallb/controller:v0.13.9-ef4faae9-amd64 |
|
metallb-speaker |
mirantis.azurecr.io/bm/metallb/speaker:v0.13.9-ef4faae9-amd64 |
|
syslog-ng |
mirantis.azurecr.io/bm/syslog-ng:base-alpine-20231121121917 |
Artifact |
Component |
Paths |
|---|---|---|
Bootstrap tarball Updated |
bootstrap-darwin |
https://binary.mirantis.com/core/bin/bootstrap-darwin-1.38.33.tgz |
bootstrap-linux |
https://binary.mirantis.com/core/bin/bootstrap-linux-1.38.33.tgz |
|
Helm charts Updated |
admission-controller |
https://binary.mirantis.com/core/helm/admission-controller-1.38.33.tgz |
agent-controller |
https://binary.mirantis.com/core/helm/agent-controller-1.38.33.tgz |
|
byo-credentials-controller |
https://binary.mirantis.com/core/helm/byo-credentials-controller-1.38.33.tgz |
|
byo-provider |
https://binary.mirantis.com/core/helm/byo-provider-1.38.33.tgz |
|
ceph-kcc-controller |
https://binary.mirantis.com/core/helm/ceph-kcc-controller-1.38.33.tgz |
|
cert-manager |
https://binary.mirantis.com/core/helm/cert-manager-1.38.33.tgz |
|
cinder-csi-plugin |
https://binary.mirantis.com/core/helm/cinder-csi-plugin-1.38.33.tgz |
|
client-certificate-controller |
https://binary.mirantis.com/core/helm/client-certificate-controller-1.38.33.tgz |
|
configuration-collector |
https://binary.mirantis.com/core/helm/configuration-collector-1.38.33.tgz |
|
event-controller |
https://binary.mirantis.com/core/helm/event-controller-1.38.33.tgz |
|
iam-controller |
https://binary.mirantis.com/core/helm/iam-controller-1.38.33.tgz |
|
kaas-exporter |
https://binary.mirantis.com/core/helm/kaas-exporter-1.38.33.tgz |
|
kaas-public-api |
https://binary.mirantis.com/core/helm/kaas-public-api-1.38.33.tgz |
|
kaas-ui |
||
lcm-controller |
https://binary.mirantis.com/core/helm/lcm-controller-1.38.33.tgz |
|
license-controller |
https://binary.mirantis.com/core/helm/license-controller-1.38.33.tgz |
|
machinepool-controller |
https://binary.mirantis.com/core/helm/machinepool-controller-1.38.33.tgz |
|
mcc-cache |
||
mcc-cache-warmup |
https://binary.mirantis.com/core/helm/mcc-cache-warmup-1.38.33.tgz |
|
metrics-server |
https://binary.mirantis.com/core/helm/metrics-server-1.38.33.tgz |
|
openstack-cloud-controller-manager |
https://binary.mirantis.com/core/helm/openstack-cloud-controller-manager-1.38.33.tgz |
|
openstack-provider |
https://binary.mirantis.com/core/helm/openstack-provider-1.38.33.tgz |
|
os-credentials-controller |
https://binary.mirantis.com/core/helm/os-credentials-controller-1.38.33.tgz |
|
portforward-controller |
https://binary.mirantis.com/core/helm/portforward-controller-1.38.33.tgz |
|
proxy-controller |
https://binary.mirantis.com/core/helm/proxy-controller-1.38.33.tgz |
|
rbac-controller |
https://binary.mirantis.com/core/helm/rbac-controller-1.38.33.tgz |
|
release-controller |
https://binary.mirantis.com/core/helm/release-controller-1.38.33.tgz |
|
rhellicense-controller |
https://binary.mirantis.com/core/helm/rhellicense-controller-1.38.33.tgz |
|
scope-controller |
https://binary.mirantis.com/core/helm/scope-controller-1.38.33.tgz |
|
squid-proxy |
https://binary.mirantis.com/core/helm/squid-proxy-1.38.33.tgz |
|
user-controller |
https://binary.mirantis.com/core/helm/user-controller-1.38.33.tgz |
|
vsphere-cloud-controller-manager |
https://binary.mirantis.com/core/helm/vsphere-cloud-controller-manager-1.38.33.tgz |
|
vsphere-credentials-controller |
https://binary.mirantis.com/core/helm/vsphere-credentials-controller-1.38.33.tgz |
|
vsphere-csi-plugin |
https://binary.mirantis.com/core/helm/vsphere-csi-plugin-1.38.33.tgz |
|
vsphere-provider |
https://binary.mirantis.com/core/helm/vsphere-provider-1.38.33.tgz |
|
vsphere-vm-template-controller |
https://binary.mirantis.com/core/helm/vsphere-vm-template-controller-1.38.33.tgz |
|
Docker images |
admission-controller Updated |
mirantis.azurecr.io/core/admission-controller:1.38.33 |
agent-controller Updated |
mirantis.azurecr.io/core/agent-controller:1.38.33 |
|
byo-cluster-api-controller Updated |
mirantis.azurecr.io/core/byo-cluster-api-controller:1.38.33 |
|
byo-credentials-controller Updated |
mirantis.azurecr.io/core/byo-credentials-controller:1.38.33 |
|
ceph-kcc-controller Updated |
mirantis.azurecr.io/core/ceph-kcc-controller:1.38.33 |
|
cert-manager-controller |
mirantis.azurecr.io/core/external/cert-manager-controller:v1.11.0-5 |
|
cinder-csi-plugin |
mirantis.azurecr.io/lcm/kubernetes/cinder-csi-plugin:v1.27.2-11 |
|
client-certificate-controller Updated |
mirantis.azurecr.io/core/client-certificate-controller:1.38.33 |
|
configuration-collector Updated |
mirantis.azurecr.io/core/configuration-collector:1.38.33 |
|
csi-attacher |
mirantis.azurecr.io/lcm/k8scsi/csi-attacher:v4.2.0-4 |
|
csi-node-driver-registrar |
mirantis.azurecr.io/lcm/k8scsi/csi-node-driver-registrar:v2.7.0-4 |
|
csi-provisioner |
mirantis.azurecr.io/lcm/k8scsi/csi-provisioner:v3.4.1-4 |
|
csi-resizer |
mirantis.azurecr.io/lcm/k8scsi/csi-resizer:v1.7.0-4 |
|
csi-snapshotter |
mirantis.azurecr.io/lcm/k8scsi/csi-snapshotter:v6.2.1-mcc-3 |
|
event-controller Updated |
mirantis.azurecr.io/core/event-controller:1.38.33 |
|
frontend Updated |
mirantis.azurecr.io/core/frontend:1.38.33 |
|
iam-controller Updated |
mirantis.azurecr.io/core/iam-controller:1.38.33 |
|
kaas-exporter Updated |
mirantis.azurecr.io/core/kaas-exporter:1.38.33 |
|
kproxy Updated |
mirantis.azurecr.io/core/kproxy:1.38.33 |
|
lcm-controller Updated |
mirantis.azurecr.io/core/lcm-controller:1.38.33 |
|
license-controller Updated |
mirantis.azurecr.io/core/license-controller:1.38.33 |
|
livenessprobe |
mirantis.azurecr.io/lcm/k8scsi/livenessprobe:v2.9.0-4 |
|
machinepool-controller Updated |
mirantis.azurecr.io/core/machinepool-controller:1.38.33 |
|
mcc-haproxy Updated |
mirantis.azurecr.io/lcm/mcc-haproxy:v0.23.0-88-g35be0fc |
|
mcc-keepalived Updated |
mirantis.azurecr.io/lcm/mcc-keepalived:v0.23.0-88-g35be0fc |
|
metrics-server |
mirantis.azurecr.io/lcm/metrics-server-amd64:v0.6.3-6 |
|
nginx Updated |
mirantis.azurecr.io/core/external/nginx:1.38.33 |
|
openstack-cloud-controller-manager |
mirantis.azurecr.io/lcm/kubernetes/openstack-cloud-controller-manager:v1.27.2-12 |
|
openstack-cluster-api-controller Updated |
mirantis.azurecr.io/core/openstack-cluster-api-controller:1.38.33 |
|
os-credentials-controller Updated |
mirantis.azurecr.io/core/os-credentials-controller:1.38.33 |
|
portforward-controller Updated |
mirantis.azurecr.io/core/portforward-controller:1.38.33 |
|
proxy-controller Updated |
mirantis.azurecr.io/core/proxy-controller:1.38.33 |
|
rbac-controller Updated |
mirantis.azurecr.io/core/rbac-controller:1.38.33 |
|
registry |
mirantis.azurecr.io/lcm/registry:v2.8.1-7 |
|
release-controller Updated |
mirantis.azurecr.io/core/release-controller:1.38.33 |
|
rhellicense-controller Updated |
mirantis.azurecr.io/core/rhellicense-controller:1.38.33 |
|
scope-controller Updated |
mirantis.azurecr.io/core/scope-controller:1.38.33 |
|
squid-proxy |
mirantis.azurecr.io/lcm/squid-proxy:0.0.1-10-g24a0d69 |
|
user-controller Updated |
mirantis.azurecr.io/core/user-controller:1.38.33 |
|
vsphere-cloud-controller-manager |
mirantis.azurecr.io/lcm/kubernetes/vsphere-cloud-controller-manager:v1.27.0-5 |
|
vsphere-cluster-api-controller Updated |
mirantis.azurecr.io/core/vsphere-cluster-api-controller:1.38.33 |
|
vsphere-credentials-controller Updated |
mirantis.azurecr.io/core/vsphere-credentials-controller:1.38.33 |
|
vsphere-csi-driver |
mirantis.azurecr.io/lcm/kubernetes/vsphere-csi-driver:v3.0.2-1 |
|
vsphere-csi-syncer |
mirantis.azurecr.io/lcm/kubernetes/vsphere-csi-syncer:v3.0.2-1 |
|
vsphere-vm-template-controller Updated |
mirantis.azurecr.io/core/vsphere-vm-template-controller:1.38.33 |
Artifact |
Component |
Path |
|---|---|---|
Binaries |
hash-generate-darwin |
http://binary.mirantis.com/iam/bin/hash-generate-0.0.1-268-3cf7f17-darwin |
hash-generate-linux |
http://binary.mirantis.com/iam/bin/hash-generate-0.0.1-268-3cf7f17-linux |
|
Helm charts Updated |
iam |
|
Docker images |
kubectl Updated |
mirantis.azurecr.io/stacklight/kubectl:1.22-20231208023019 |
kubernetes-entrypoint |
mirantis.azurecr.io/openstack/extra/kubernetes-entrypoint:v1.0.1-55b02f7-20231019172556 |
|
mariadb |
mirantis.azurecr.io/general/mariadb:10.6.14-focal-20231127070342 |
|
mcc-keycloak |
mirantis.azurecr.io/iam/mcc-keycloak:22.0.5-1 |
The table below includes the total numbers of addressed unique and common CVEs in images by product component since the Container Cloud 2.25.3 patch release. The common CVEs are issues addressed across several images.
Product component |
CVE type |
Critical |
High |
Total |
|---|---|---|---|---|
Ceph |
Unique |
0 |
1 |
1 |
Common |
0 |
5 |
5 |
|
Kaas core |
Unique |
0 |
1 |
1 |
Common |
0 |
1 |
1 |
|
StackLight |
Unique |
0 |
3 |
3 |
Common |
0 |
9 |
9 |
Mirantis Security Portal
For the detailed list of fixed and existing CVEs across the Mirantis Container Cloud and MOSK products, refer to Mirantis Security Portal.
MOSK CVEs
For the number of fixed CVEs in the MOSK-related components including OpenStack and Tungsten Fabric, refer to MOSK 23.3.4: Security notes.
The following issues have been addressed in the Container Cloud patch release 2.25.4 along with the patch Cluster releases 17.0.4 and 16.0.4.
[38259] Fixed the issue causing the failure to attach an existing MKE cluster to a Container Cloud management cluster. The issue was related to
byo-providerand prevented the attachment of MKE clusters having less than three manager nodes and two worker nodes.[38399] Fixed the issue causing the failure to deploy a management cluster in the offline mode due to the issue in the setup script.
See also
See also
Releases delivered in 2023
This section contains historical information on the unsupported Container Cloud releases delivered in 2023. For the latest supported Container Cloud release, see Container Cloud releases.
Version |
Release date |
Summary |
|---|---|---|
Dec 18, 2023 |
Container Cloud 2.25.3 is the third patch release of the 2.25.x and MOSK 23.3.x release series that introduces the following updates:
|
|
Dec 05, 2023 |
Container Cloud 2.25.2 is the second patch release of the 2.25.x and MOSK 23.3.x release series that introduces the following updates:
|
|
Nov 27, 2023 |
Container Cloud 2.25.1 is the first patch release of the 2.25.x and MOSK 23.3.x release series that introduces the following updates:
|
|
Nov 06, 2023 |
|
|
Sep 26, 2023 |
Container Cloud 2.24.4 is the third patch release of the 2.24.x and MOSK 23.2.x release series that introduces the following updates:
|
|
Sep 14, 2023 |
Container Cloud 2.24.4 is the second patch release of the 2.24.x and MOSK 23.2.x release series that introduces the following updates:
|
|
Aug 29, 2023 |
Container Cloud 2.24.3 is the first patch release of the 2.24.x and MOSK 23.2.x release series that introduces the following updates:
For details, see Patch releases. |
|
Aug 21, 2023 |
Based on 2.24.1, Container Cloud 2.24.2:
|
|
Jul 27, 2023 |
Patch release containing hot fixes for the major Container Cloud release 2.24.0. |
|
Jul 20, 2023 |
|
|
June 05, 2023 |
Container Cloud 2.23.5 is the fourth patch release of the 2.23.0 and 2.23.1 major releases that:
For details, see Patch releases. |
|
May 22, 2023 |
Container Cloud 2.23.4 is the third patch release of the 2.23.0 and 2.23.1 major releases that:
For details, see Patch releases. |
|
May 04, 2023 |
Container Cloud 2.23.3 is the second patch release of the 2.23.0 and 2.23.1 major releases that:
For details, see Patch releases. |
|
Apr 20, 2023 |
Container Cloud 2.23.2 is the first patch release of the 2.23.0 and 2.23.1 major releases that:
For details, see Patch releases. |
|
Apr 04, 2023 |
Based on 2.23.0, Container Cloud 2.23.1:
|
|
Mar 07, 2023 |
|
|
Jan 31, 2023 |
|
The Container Cloud patch release 2.25.3, which is based on the 2.25.0 major release, provides the following updates:
Support for MKE 3.7.3. For details, see MKE documentation: Release Notes.
Support for the patch Cluster releases 16.0.3 and 17.0.3 that represents Mirantis OpenStack for Kubernetes (MOSK) patch release 23.3.3 patch.
Security fixes for CVEs in images.
This patch release also supports the latest major Cluster releases 17.0.0 and 16.0.0. And it does not support greenfield deployments based on deprecated Cluster releases. Use the latest available Cluster release instead.
For main deliverables of the parent Container Cloud release of 2.25.3, refer to 2.25.0.
This section lists the artifacts of components included in the Container Cloud patch release 2.25.3. For artifacts of the Cluster releases introduced in 2.25.3, see patch Cluster releases 17.0.3 and 16.0.3.
Note
The components that are newly added, updated, deprecated, or removed
as compared to the previous release version, are marked
with a corresponding superscript,
for example, lcm-ansible Updated.
Artifact |
Component |
Path |
|---|---|---|
Binaries |
ironic-python-agent.initramfs |
https://binary.mirantis.com/bm/bin/ironic/ipa/ubuntu/initramfs-yoga-focal-debug-20231012141354 |
ironic-python-agent.kernel |
https://binary.mirantis.com/bm/bin/ironic/ipa/ubuntu/kernel-yoga-focal-debug-20231012141354 |
|
provisioning_ansible |
https://binary.mirantis.com/bm/bin/ansible/provisioning_ansible-0.1.1-113-4f8b843.tgz |
|
Helm charts Updated |
baremetal-api |
https://binary.mirantis.com/core/helm/baremetal-api-1.38.31.tgz |
baremetal-operator |
https://binary.mirantis.com/core/helm/baremetal-operator-1.38.31.tgz |
|
baremetal-provider |
https://binary.mirantis.com/core/helm/baremetal-provider-1.38.31.tgz |
|
baremetal-public-api |
https://binary.mirantis.com/core/helm/baremetal-public-api-1.38.31.tgz |
|
kaas-ipam |
||
local-volume-provisioner |
https://binary.mirantis.com/core/helm/local-volume-provisioner-1.38.31.tgz |
|
metallb |
||
Docker images |
ambasador Updated |
mirantis.azurecr.io/core/external/nginx:1.38.31 |
baremetal-dnsmasq Updated |
mirantis.azurecr.io/bm/baremetal-dnsmasq:base-2-25-alpine-20231128145936 |
|
baremetal-operator Updated |
mirantis.azurecr.io/bm/baremetal-operator:base-2-25-alpine-20231204121500 |
|
bm-collective |
mirantis.azurecr.io/bm/bm-collective:base-2-25-alpine-20231121115652 |
|
cluster-api-provider-baremetal Updated |
mirantis.azurecr.io/core/cluster-api-provider-baremetal:1.38.31 |
|
ironic Updated |
mirantis.azurecr.io/openstack/ironic:yoga-jammy-20231204153029 |
|
ironic-inspector Updated |
mirantis.azurecr.io/openstack/ironic-inspector:yoga-jammy-20231204153029 |
|
ironic-prometheus-exporter Updated |
mirantis.azurecr.io/stacklight/ironic-prometheus-exporter:0.1-20231204142028 |
|
kaas-ipam |
mirantis.azurecr.io/bm/kaas-ipam:base-2-25-alpine-20231121164200 |
|
kubernetes-entrypoint |
mirantis.azurecr.io/openstack/extra/kubernetes-entrypoint:v1.0.1-55b02f7-20231019172556 |
|
mariadb Updated |
mirantis.azurecr.io/general/mariadb:10.6.14-focal-20231127070342 |
|
mcc-keepalived Updated |
mirantis.azurecr.io/lcm/mcc-keepalived:v0.23.0-87-gc9d7d3b |
|
metallb-controller Updated |
mirantis.azurecr.io/bm/metallb/controller:v0.13.9-ef4faae9-amd64 |
|
metallb-speaker Updated |
mirantis.azurecr.io/bm/metallb/speaker:v0.13.9-ef4faae9-amd64 |
|
syslog-ng Updated |
mirantis.azurecr.io/bm/syslog-ng:base-alpine-20231121121917 |
Artifact |
Component |
Paths |
|---|---|---|
Bootstrap tarball Updated |
bootstrap-darwin |
https://binary.mirantis.com/core/bin/bootstrap-darwin-1.38.31.tgz |
bootstrap-linux |
https://binary.mirantis.com/core/bin/bootstrap-linux-1.38.31.tgz |
|
Helm charts Updated |
admission-controller |
https://binary.mirantis.com/core/helm/admission-controller-1.38.31.tgz |
agent-controller |
https://binary.mirantis.com/core/helm/agent-controller-1.38.31.tgz |
|
byo-credentials-controller |
https://binary.mirantis.com/core/helm/byo-credentials-controller-1.38.31.tgz |
|
byo-provider |
https://binary.mirantis.com/core/helm/byo-provider-1.38.31.tgz |
|
ceph-kcc-controller |
https://binary.mirantis.com/core/helm/ceph-kcc-controller-1.38.31.tgz |
|
cert-manager |
https://binary.mirantis.com/core/helm/cert-manager-1.38.31.tgz |
|
cinder-csi-plugin |
https://binary.mirantis.com/core/helm/cinder-csi-plugin-1.38.31.tgz |
|
client-certificate-controller |
https://binary.mirantis.com/core/helm/client-certificate-controller-1.38.31.tgz |
|
configuration-collector |
https://binary.mirantis.com/core/helm/configuration-collector-1.38.31.tgz |
|
event-controller |
https://binary.mirantis.com/core/helm/event-controller-1.38.31.tgz |
|
iam-controller |
https://binary.mirantis.com/core/helm/iam-controller-1.38.31.tgz |
|
kaas-exporter |
https://binary.mirantis.com/core/helm/kaas-exporter-1.38.31.tgz |
|
kaas-public-api |
https://binary.mirantis.com/core/helm/kaas-public-api-1.38.31.tgz |
|
kaas-ui |
||
lcm-controller |
https://binary.mirantis.com/core/helm/lcm-controller-1.38.31.tgz |
|
license-controller |
https://binary.mirantis.com/core/helm/license-controller-1.38.31.tgz |
|
machinepool-controller |
https://binary.mirantis.com/core/helm/machinepool-controller-1.38.31.tgz |
|
mcc-cache |
||
mcc-cache-warmup |
https://binary.mirantis.com/core/helm/mcc-cache-warmup-1.38.31.tgz |
|
metrics-server |
https://binary.mirantis.com/core/helm/metrics-server-1.38.31.tgz |
|
openstack-cloud-controller-manager |
https://binary.mirantis.com/core/helm/openstack-cloud-controller-manager-1.38.31.tgz |
|
openstack-provider |
https://binary.mirantis.com/core/helm/openstack-provider-1.38.31.tgz |
|
os-credentials-controller |
https://binary.mirantis.com/core/helm/os-credentials-controller-1.38.31.tgz |
|
portforward-controller |
https://binary.mirantis.com/core/helm/portforward-controller-1.38.31.tgz |
|
proxy-controller |
https://binary.mirantis.com/core/helm/proxy-controller-1.38.31.tgz |
|
rbac-controller |
https://binary.mirantis.com/core/helm/rbac-controller-1.38.31.tgz |
|
release-controller |
https://binary.mirantis.com/core/helm/release-controller-1.38.31.tgz |
|
rhellicense-controller |
https://binary.mirantis.com/core/helm/rhellicense-controller-1.38.31.tgz |
|
scope-controller |
https://binary.mirantis.com/core/helm/scope-controller-1.38.31.tgz |
|
squid-proxy |
https://binary.mirantis.com/core/helm/squid-proxy-1.38.31.tgz |
|
user-controller |
https://binary.mirantis.com/core/helm/user-controller-1.38.31.tgz |
|
vsphere-cloud-controller-manager |
https://binary.mirantis.com/core/helm/vsphere-cloud-controller-manager-1.38.31.tgz |
|
vsphere-credentials-controller |
https://binary.mirantis.com/core/helm/vsphere-credentials-controller-1.38.31.tgz |
|
vsphere-csi-plugin |
https://binary.mirantis.com/core/helm/vsphere-csi-plugin-1.38.31.tgz |
|
vsphere-provider |
https://binary.mirantis.com/core/helm/vsphere-provider-1.38.31.tgz |
|
vsphere-vm-template-controller |
https://binary.mirantis.com/core/helm/vsphere-vm-template-controller-1.38.31.tgz |
|
Docker images |
admission-controller Updated |
mirantis.azurecr.io/core/admission-controller:1.38.31 |
agent-controller Updated |
mirantis.azurecr.io/core/agent-controller:1.38.31 |
|
byo-cluster-api-controller Updated |
mirantis.azurecr.io/core/byo-cluster-api-controller:1.38.31 |
|
byo-credentials-controller Updated |
mirantis.azurecr.io/core/byo-credentials-controller:1.38.31 |
|
ceph-kcc-controller Updated |
mirantis.azurecr.io/core/ceph-kcc-controller:1.38.31 |
|
cert-manager-controller |
mirantis.azurecr.io/core/external/cert-manager-controller:v1.11.0-5 |
|
cinder-csi-plugin |
mirantis.azurecr.io/lcm/kubernetes/cinder-csi-plugin:v1.27.2-11 |
|
client-certificate-controller Updated |
mirantis.azurecr.io/core/client-certificate-controller:1.38.31 |
|
configuration-collector Updated |
mirantis.azurecr.io/core/configuration-collector:1.38.31 |
|
csi-attacher |
mirantis.azurecr.io/lcm/k8scsi/csi-attacher:v4.2.0-4 |
|
csi-node-driver-registrar |
mirantis.azurecr.io/lcm/k8scsi/csi-node-driver-registrar:v2.7.0-4 |
|
csi-provisioner |
mirantis.azurecr.io/lcm/k8scsi/csi-provisioner:v3.4.1-4 |
|
csi-resizer |
mirantis.azurecr.io/lcm/k8scsi/csi-resizer:v1.7.0-4 |
|
csi-snapshotter |
mirantis.azurecr.io/lcm/k8scsi/csi-snapshotter:v6.2.1-mcc-3 |
|
event-controller Updated |
mirantis.azurecr.io/core/event-controller:1.38.31 |
|
frontend Updated |
mirantis.azurecr.io/core/frontend:1.38.31 |
|
iam-controller Updated |
mirantis.azurecr.io/core/iam-controller:1.38.31 |
|
kaas-exporter Updated |
mirantis.azurecr.io/core/kaas-exporter:1.38.31 |
|
kproxy Updated |
mirantis.azurecr.io/core/kproxy:1.38.31 |
|
lcm-controller Updated |
mirantis.azurecr.io/core/lcm-controller:1.38.31 |
|
license-controller Updated |
mirantis.azurecr.io/core/license-controller:1.38.31 |
|
livenessprobe |
mirantis.azurecr.io/lcm/k8scsi/livenessprobe:v2.9.0-4 |
|
machinepool-controller Updated |
mirantis.azurecr.io/core/machinepool-controller:1.38.31 |
|
mcc-haproxy Updated |
mirantis.azurecr.io/lcm/mcc-haproxy:v0.23.0-87-gc9d7d3b |
|
mcc-keepalived Updated |
mirantis.azurecr.io/lcm/mcc-keepalived:v0.23.0-87-gc9d7d3b |
|
metrics-server |
mirantis.azurecr.io/lcm/metrics-server-amd64:v0.6.3-6 |
|
nginx Updated |
mirantis.azurecr.io/core/external/nginx:1.38.31 |
|
openstack-cloud-controller-manager |
mirantis.azurecr.io/lcm/kubernetes/openstack-cloud-controller-manager:v1.27.2-12 |
|
openstack-cluster-api-controller Updated |
mirantis.azurecr.io/core/openstack-cluster-api-controller:1.38.31 |
|
os-credentials-controller Updated |
mirantis.azurecr.io/core/os-credentials-controller:1.38.31 |
|
portforward-controller Updated |
mirantis.azurecr.io/core/portforward-controller:1.38.31 |
|
proxy-controller Updated |
mirantis.azurecr.io/core/proxy-controller:1.38.31 |
|
rbac-controller Updated |
mirantis.azurecr.io/core/rbac-controller:1.38.31 |
|
registry |
mirantis.azurecr.io/lcm/registry:v2.8.1-7 |
|
release-controller Updated |
mirantis.azurecr.io/core/release-controller:1.38.31 |
|
rhellicense-controller Updated |
mirantis.azurecr.io/core/rhellicense-controller:1.38.31 |
|
scope-controller Updated |
mirantis.azurecr.io/core/scope-controller:1.38.31 |
|
squid-proxy |
mirantis.azurecr.io/lcm/squid-proxy:0.0.1-10-g24a0d69 |
|
user-controller Updated |
mirantis.azurecr.io/core/user-controller:1.38.31 |
|
vsphere-cloud-controller-manager |
mirantis.azurecr.io/lcm/kubernetes/vsphere-cloud-controller-manager:v1.27.0-5 |
|
vsphere-cluster-api-controller Updated |
mirantis.azurecr.io/core/vsphere-cluster-api-controller:1.38.31 |
|
vsphere-credentials-controller Updated |
mirantis.azurecr.io/core/vsphere-credentials-controller:1.38.31 |
|
vsphere-csi-driver |
mirantis.azurecr.io/lcm/kubernetes/vsphere-csi-driver:v3.0.2-1 |
|
vsphere-csi-syncer |
mirantis.azurecr.io/lcm/kubernetes/vsphere-csi-syncer:v3.0.2-1 |
|
vsphere-vm-template-controller Updated |
mirantis.azurecr.io/core/vsphere-vm-template-controller:1.38.31 |
Artifact |
Component |
Path |
|---|---|---|
Binaries |
hash-generate-darwin |
http://binary.mirantis.com/iam/bin/hash-generate-0.0.1-268-3cf7f17-darwin |
hash-generate-linux |
http://binary.mirantis.com/iam/bin/hash-generate-0.0.1-268-3cf7f17-linux |
|
Helm charts Updated |
iam |
|
Docker images |
keycloak |
n/a (replaced with |
kubectl New |
mirantis.azurecr.io/stacklight/kubectl:1.22-20231201023019 |
|
kubernetes-entrypoint |
mirantis.azurecr.io/openstack/extra/kubernetes-entrypoint:v1.0.1-55b02f7-20231019172556 |
|
mariadb Updated |
mirantis.azurecr.io/general/mariadb:10.6.14-focal-20231127070342 |
|
mcc-keycloak New |
mirantis.azurecr.io/iam/mcc-keycloak:22.0.5-1 |
The table below includes the total numbers of addressed unique and common CVEs in images by product component since the Container Cloud 2.25.2 patch release. The common CVEs are issues addressed across several images.
Product component |
CVE type |
Critical |
High |
Total |
|---|---|---|---|---|
Ceph |
Unique |
0 |
1 |
1 |
Common |
0 |
3 |
3 |
|
KaaS core |
Unique |
2 |
9 |
11 |
Common |
3 |
18 |
21 |
|
StackLight |
Unique |
1 |
18 |
19 |
Common |
1 |
52 |
53 |
Mirantis Security Portal
For the detailed list of fixed and existing CVEs across the Mirantis Container Cloud and MOSK products, refer to Mirantis Security Portal.
MOSK CVEs
For the number of fixed CVEs in the MOSK-related components including OpenStack and Tungsten Fabric, refer to MOSK 23.3.3: Security notes.
The following issues have been addressed in the Container Cloud patch release 2.25.3 along with the patch Cluster releases 17.0.3 and 16.0.3.
[37634][OpenStack] Fixed the issue with a management or managed cluster deployment or upgrade being blocked by all pods being stuck in the
Pendingstate due to incorrect secrets being used to initialize the OpenStack external Cloud Provider Interface.[37766][IAM] Fixed the issue with sign-in to the MKE web UI of the management cluster using the Sign in with External Provider option, which failed with the invalid parameter: redirect_uri error.
See also
The Container Cloud patch release 2.25.2, which is based on the 2.25.0 major release, provides the following updates:
Renewed support for attachment of MKE clusters that are not originally deployed by Container Cloud for vSphere-based management clusters.
Support for the patch Cluster releases 16.0.2 and 17.0.2 that represents Mirantis OpenStack for Kubernetes (MOSK) patch release 23.3.2 patch.
Security fixes for CVEs in images.
This patch release also supports the latest major Cluster releases 17.0.0 and 16.0.0. And it does not support greenfield deployments based on deprecated Cluster releases 14.0.1, 15.0.1, 16.0.1, and 17.0.1. Use the latest available Cluster releases instead.
For main deliverables of the parent Container Cloud release of 2.25.2, refer to 2.25.0.
This section lists the artifacts of components included in the Container Cloud patch release 2.25.2. For artifacts of the Cluster releases introduced in 2.25.2, see patch Cluster releases 17.0.2 and 16.0.2.
Note
The components that are newly added, updated, deprecated, or removed
as compared to the previous release version, are marked
with a corresponding superscript,
for example, lcm-ansible Updated.
Artifact |
Component |
Path |
|---|---|---|
Binaries |
ironic-python-agent.initramfs |
https://binary.mirantis.com/bm/bin/ironic/ipa/ubuntu/initramfs-yoga-focal-debug-20231012141354 |
ironic-python-agent.kernel |
https://binary.mirantis.com/bm/bin/ironic/ipa/ubuntu/kernel-yoga-focal-debug-20231012141354 |
|
provisioning_ansible |
https://binary.mirantis.com/bm/bin/ansible/provisioning_ansible-0.1.1-113-4f8b843.tgz |
|
Helm charts Updated |
baremetal-api |
https://binary.mirantis.com/core/helm/baremetal-api-1.38.29.tgz |
baremetal-operator |
https://binary.mirantis.com/core/helm/baremetal-operator-1.38.29.tgz |
|
baremetal-provider |
https://binary.mirantis.com/core/helm/baremetal-provider-1.38.29.tgz |
|
baremetal-public-api |
https://binary.mirantis.com/core/helm/baremetal-public-api-1.38.29.tgz |
|
kaas-ipam |
||
local-volume-provisioner |
https://binary.mirantis.com/core/helm/local-volume-provisioner-1.38.29.tgz |
|
metallb |
||
Docker images |
ambasador Updated |
mirantis.azurecr.io/core/external/nginx:1.38.29 |
baremetal-dnsmasq Updated |
mirantis.azurecr.io/bm/baremetal-dnsmasq:base-2-25-alpine-20231121112823 |
|
baremetal-operator Updated |
mirantis.azurecr.io/bm/baremetal-operator:base-2-25-alpine-20231121112816 |
|
bm-collective Updated |
mirantis.azurecr.io/bm/bm-collective:base-2-25-alpine-20231121115652 |
|
cluster-api-provider-baremetal Updated |
mirantis.azurecr.io/core/cluster-api-provider-baremetal:1.38.29 |
|
ironic Updated |
mirantis.azurecr.io/openstack/ironic:yoga-jammy-20231120060019 |
|
ironic-inspector |
mirantis.azurecr.io/openstack/ironic-inspector:yoga-jammy-20231030060018 |
|
ironic-prometheus-exporter |
mirantis.azurecr.io/stacklight/ironic-prometheus-exporter:0.1-20230912104602 |
|
kaas-ipam Updated |
mirantis.azurecr.io/bm/kaas-ipam:base-2-25-alpine-20231121164200 |
|
kubernetes-entrypoint |
mirantis.azurecr.io/openstack/extra/kubernetes-entrypoint:v1.0.1-55b02f7-20231019172556 |
|
mariadb |
mirantis.azurecr.io/general/mariadb:10.6.14-focal-20231024091216 |
|
mcc-keepalived |
mirantis.azurecr.io/docker.mirantis.net/lcm/mcc-keepalived:v0.23.0-84-g8d74d7c |
|
metallb-controller Updated |
mirantis.azurecr.io/bm/metallb/controller:v0.13.9-ef4faae9-amd64 |
|
metallb-speaker Updated |
mirantis.azurecr.io/bm/metallb/speaker:v0.13.9-ef4faae9-amd64 |
|
syslog-ng Updated |
mirantis.azurecr.io/bm/syslog-ng:base-alpine-20231121121917 |
Artifact |
Component |
Paths |
|---|---|---|
Bootstrap tarball Updated |
bootstrap-darwin |
https://binary.mirantis.com/core/bin/bootstrap-darwin-1.38.29.tgz |
bootstrap-linux |
https://binary.mirantis.com/core/bin/bootstrap-linux-1.38.29.tgz |
|
Helm charts Updated |
admission-controller |
https://binary.mirantis.com/core/helm/admission-controller-1.38.29.tgz |
agent-controller |
https://binary.mirantis.com/core/helm/agent-controller-1.38.29.tgz |
|
byo-credentials-controller New |
https://binary.mirantis.com/core/helm/byo-credentials-controller-1.38.29.tgz |
|
byo-provider New |
https://binary.mirantis.com/core/helm/byo-provider-1.38.29.tgz |
|
ceph-kcc-controller |
https://binary.mirantis.com/core/helm/ceph-kcc-controller-1.38.29.tgz |
|
cert-manager |
https://binary.mirantis.com/core/helm/cert-manager-1.38.29.tgz |
|
cinder-csi-plugin |
https://binary.mirantis.com/core/helm/cinder-csi-plugin-1.38.29.tgz |
|
client-certificate-controller |
https://binary.mirantis.com/core/helm/client-certificate-controller-1.38.29.tgz |
|
configuration-collector |
https://binary.mirantis.com/core/helm/configuration-collector-1.38.29.tgz |
|
event-controller |
https://binary.mirantis.com/core/helm/event-controller-1.38.29.tgz |
|
iam-controller |
https://binary.mirantis.com/core/helm/iam-controller-1.38.29.tgz |
|
kaas-exporter |
https://binary.mirantis.com/core/helm/kaas-exporter-1.38.29.tgz |
|
kaas-public-api |
https://binary.mirantis.com/core/helm/kaas-public-api-1.38.29.tgz |
|
kaas-ui |
||
lcm-controller |
https://binary.mirantis.com/core/helm/lcm-controller-1.38.29.tgz |
|
license-controller |
https://binary.mirantis.com/core/helm/license-controller-1.38.29.tgz |
|
machinepool-controller |
https://binary.mirantis.com/core/helm/machinepool-controller-1.38.29.tgz |
|
mcc-cache |
||
mcc-cache-warmup |
https://binary.mirantis.com/core/helm/mcc-cache-warmup-1.38.29.tgz |
|
metrics-server |
https://binary.mirantis.com/core/helm/metrics-server-1.38.29.tgz |
|
openstack-cloud-controller-manager |
https://binary.mirantis.com/core/helm/openstack-cloud-controller-manager-1.38.29.tgz |
|
openstack-provider |
https://binary.mirantis.com/core/helm/openstack-provider-1.38.29.tgz |
|
os-credentials-controller |
https://binary.mirantis.com/core/helm/os-credentials-controller-1.38.29.tgz |
|
portforward-controller |
https://binary.mirantis.com/core/helm/portforward-controller-1.38.29.tgz |
|
proxy-controller |
https://binary.mirantis.com/core/helm/proxy-controller-1.38.29.tgz |
|
rbac-controller |
https://binary.mirantis.com/core/helm/rbac-controller-1.38.29.tgz |
|
release-controller |
https://binary.mirantis.com/core/helm/release-controller-1.38.29.tgz |
|
rhellicense-controller |
https://binary.mirantis.com/core/helm/rhellicense-controller-1.38.29.tgz |
|
scope-controller |
https://binary.mirantis.com/core/helm/scope-controller-1.38.29.tgz |
|
squid-proxy |
https://binary.mirantis.com/core/helm/squid-proxy-1.38.29.tgz |
|
user-controller |
https://binary.mirantis.com/core/helm/user-controller-1.38.29.tgz |
|
vsphere-cloud-controller-manager |
https://binary.mirantis.com/core/helm/vsphere-cloud-controller-manager-1.38.29.tgz |
|
vsphere-credentials-controller |
https://binary.mirantis.com/core/helm/vsphere-credentials-controller-1.38.29.tgz |
|
vsphere-csi-plugin |
https://binary.mirantis.com/core/helm/vsphere-csi-plugin-1.38.29.tgz |
|
vsphere-provider |
https://binary.mirantis.com/core/helm/vsphere-provider-1.38.29.tgz |
|
vsphere-vm-template-controller |
https://binary.mirantis.com/core/helm/vsphere-vm-template-controller-1.38.29.tgz |
|
Docker images |
admission-controller Updated |
mirantis.azurecr.io/core/admission-controller:1.38.29 |
agent-controller Updated |
mirantis.azurecr.io/core/agent-controller:1.38.29 |
|
byo-credentials-controller New |
mirantis.azurecr.io/core/byo-credentials-controller:1.38.29 |
|
byo-provider New |
mirantis.azurecr.io/core/byo-provider:1.38.29 |
|
ceph-kcc-controller Updated |
mirantis.azurecr.io/core/ceph-kcc-controller:1.38.29 |
|
cert-manager-controller Updated |
mirantis.azurecr.io/core/external/cert-manager-controller:v1.11.0-5 |
|
cinder-csi-plugin |
mirantis.azurecr.io/lcm/kubernetes/cinder-csi-plugin:v1.27.2-11 |
|
client-certificate-controller Updated |
mirantis.azurecr.io/core/client-certificate-controller:1.38.29 |
|
configuration-collector Updated |
mirantis.azurecr.io/core/configuration-collector:1.38.29 |
|
csi-attacher |
mirantis.azurecr.io/lcm/k8scsi/csi-attacher:v4.2.0-4 |
|
csi-node-driver-registrar |
mirantis.azurecr.io/lcm/k8scsi/csi-node-driver-registrar:v2.7.0-4 |
|
csi-provisioner |
mirantis.azurecr.io/lcm/k8scsi/csi-provisioner:v3.4.1-4 |
|
csi-resizer |
mirantis.azurecr.io/lcm/k8scsi/csi-resizer:v1.7.0-4 |
|
csi-snapshotter |
mirantis.azurecr.io/lcm/k8scsi/csi-snapshotter:v6.2.1-mcc-3 |
|
event-controller Updated |
mirantis.azurecr.io/core/event-controller:1.38.29 |
|
frontend Updated |
mirantis.azurecr.io/core/frontend:1.38.29 |
|
iam-controller Updated |
mirantis.azurecr.io/core/iam-controller:1.38.29 |
|
kaas-exporter Updated |
mirantis.azurecr.io/core/kaas-exporter:1.38.29 |
|
kproxy Updated |
mirantis.azurecr.io/core/kproxy:1.38.29 |
|
lcm-controller Updated |
mirantis.azurecr.io/core/lcm-controller:1.38.29 |
|
license-controller Updated |
mirantis.azurecr.io/core/license-controller:1.38.29 |
|
livenessprobe |
mirantis.azurecr.io/lcm/k8scsi/livenessprobe:v2.9.0-4 |
|
machinepool-controller Updated |
mirantis.azurecr.io/core/machinepool-controller:1.38.29 |
|
mcc-haproxy |
mirantis.azurecr.io/lcm/mcc-haproxy:v0.23.0-84-g8d74d7c |
|
mcc-keepalived |
mirantis.azurecr.io/lcm/mcc-keepalived:v0.23.0-84-g8d74d7c |
|
metrics-server Updated |
mirantis.azurecr.io/lcm/metrics-server-amd64:v0.6.3-6 |
|
nginx Updated |
mirantis.azurecr.io/core/external/nginx:1.38.29 |
|
openstack-cloud-controller-manager Updated |
mirantis.azurecr.io/lcm/kubernetes/openstack-cloud-controller-manager:v1.27.2-12 |
|
openstack-cluster-api-controller Updated |
mirantis.azurecr.io/core/openstack-cluster-api-controller:1.38.29 |
|
os-credentials-controller Updated |
mirantis.azurecr.io/core/os-credentials-controller:1.38.29 |
|
portforward-controller Updated |
mirantis.azurecr.io/core/portforward-controller:1.38.29 |
|
proxy-controller Updated |
mirantis.azurecr.io/core/proxy-controller:1.38.29 |
|
rbac-controller Updated |
mirantis.azurecr.io/core/rbac-controller:1.38.29 |
|
registry |
mirantis.azurecr.io/lcm/registry:v2.8.1-7 |
|
release-controller Updated |
mirantis.azurecr.io/core/release-controller:1.38.29 |
|
rhellicense-controller Updated |
mirantis.azurecr.io/core/rhellicense-controller:1.38.29 |
|
scope-controller Updated |
mirantis.azurecr.io/core/scope-controller:1.38.29 |
|
squid-proxy |
mirantis.azurecr.io/lcm/squid-proxy:0.0.1-10-g24a0d69 |
|
user-controller Updated |
mirantis.azurecr.io/core/user-controller:1.38.29 |
|
vsphere-cloud-controller-manager Updated |
mirantis.azurecr.io/lcm/kubernetes/vsphere-cloud-controller-manager:v1.27.0-5 |
|
vsphere-cluster-api-controller Updated |
mirantis.azurecr.io/core/vsphere-cluster-api-controller:1.38.29 |
|
vsphere-credentials-controller Updated |
mirantis.azurecr.io/core/vsphere-credentials-controller:1.38.29 |
|
vsphere-csi-driver Updated |
mirantis.azurecr.io/lcm/kubernetes/vsphere-csi-driver:v3.0.2-1 |
|
vsphere-csi-syncer Updated |
mirantis.azurecr.io/lcm/kubernetes/vsphere-csi-syncer:v3.0.2-1 |
|
vsphere-vm-template-controller Updated |
mirantis.azurecr.io/core/vsphere-vm-template-controller:1.38.29 |
Artifact |
Component |
Path |
|---|---|---|
Binaries |
hash-generate-darwin |
http://binary.mirantis.com/iam/bin/hash-generate-0.0.1-268-3cf7f17-darwin |
hash-generate-linux |
http://binary.mirantis.com/iam/bin/hash-generate-0.0.1-268-3cf7f17-linux |
|
Helm charts |
iam |
|
Docker images |
keycloak |
mirantis.azurecr.io/iam/keycloak:0.6.0-1 |
kubernetes-entrypoint |
mirantis.azurecr.io/openstack/extra/kubernetes-entrypoint:v1.0.1-55b02f7-20231019172556 |
|
mariadb |
mirantis.azurecr.io/general/mariadb:10.6.14-focal-20231024091216 |
The table below includes the total numbers of addressed unique and common CVEs in images by product component since the Container Cloud 2.25.1 patch release. The common CVEs are issues addressed across several images.
Product component |
CVE type |
Critical |
High |
Total |
|---|---|---|---|---|
Kaas core |
Unique |
0 |
6 |
6 |
Common |
0 |
20 |
20 |
|
Ceph |
Unique |
0 |
2 |
2 |
Common |
0 |
6 |
6 |
|
StackLight |
Unique |
0 |
16 |
16 |
Common |
0 |
70 |
70 |
Mirantis Security Portal
For the detailed list of fixed and existing CVEs across the Mirantis Container Cloud and MOSK products, refer to Mirantis Security Portal.
MOSK CVEs
For the number of fixed CVEs in the MOSK-related components including OpenStack and Tungsten Fabric, refer to MOSK 23.3.2: Security notes.
See also
The Container Cloud patch release 2.25.1, which is based on the 2.25.0 major release, provides the following updates:
Support for the patch Cluster releases 16.0.1 and 17.0.1 that represents Mirantis OpenStack for Kubernetes (MOSK) patch release 23.3.1.
Several product improvements. For details, see Enhancements.
Security fixes for CVEs in images.
This patch release also supports the latest major Cluster releases 17.0.0 and 16.0.0. And it does not support greenfield deployments based on deprecated Cluster releases 14.1.0, 14.0.1, and 15.0.1. Use the latest available Cluster releases instead.
For main deliverables of the parent Container Cloud release of 2.25.1, refer to 2.25.0.
This section outlines new features and enhancements introduced in the Container Cloud patch release 2.25.1 along with Cluster releases 17.0.1 and 16.0.1.
Introduced support for Mirantis Kubernetes Engine (MKE) 3.7.2 on Container Cloud management and managed clusters. On existing managed clusters, MKE is updated to the latest supported version when you update your cluster to the patch Cluster release 17.0.1 or 16.0.1.
Learn more
To simplify MKE configuration through API, moved management of MKE parameters
controlled by Container Cloud from lcm-ansible to lcm-controller.
Now, Container Cloud overrides only a set of MKE configuration parameters that
are automatically managed by Container Cloud.
Analyzed and fixed the majority of failed compliance checks in the MKE benchmark compliance for StackLight. The following controls were analyzed:
Control ID |
Control description |
Analyzed item |
|---|---|---|
5.2.7 |
Minimize the admission of containers with the |
Containers with |
5.2.6 |
Minimize the admission of root containers |
|
Introduced Kubernetes network policies for all StackLight components. The
feature is implemented using the networkPolicies parameter that is enabled
by default.
The Kubernetes NetworkPolicy resource allows controlling network connections to and from Pods within a cluster. This enhances security by restricting communication from compromised Pod applications and provides transparency into how applications communicate with each other.
Switched to the external vSphere cloud controller manager (CCM) that uses vSphere Container Storage Plug-in 3.0 for volume attachment. The feature implementation implies an automatic migration of PersistentVolume and PersistentVolumeClaim.
The external vSphere CCM supports vSphere 6.7 on Kubernetes 1.27 as compared to the in-tree vSphere CCM that does not support vSphere 6.7 since Kubernetes 1.25.
Important
The major Cluster release 14.1.0 is the last Cluster release for the vSphere provider based on MCR 20.10 and MKE 3.6.6 with Kubernetes 1.24. Therefore, Mirantis highly recommends updating your existing vSphere-based managed clusters to the Cluster release 16.0.1 that contains newer versions on MCR and MKE with Kubernetes. Otherwise, your management cluster upgrade to Container Cloud 2.25.2 will blocked.
For the update procedure, refer to Operations Guide: Update to a patch version.
Since Container Cloud 2.25.1, the major Cluster release 14.1.0 is deprecated. Greenfield vSphere-based deployments on this Cluster release are not supported. Use the patch Cluster release 16.0.1 for new deployments instead.
This section lists the artifacts of components included in the Container Cloud patch release 2.25.1. For artifacts of the Cluster releases introduced in 2.25.1, see patch Cluster releases 17.0.1 and 16.0.1.
Note
The components that are newly added, updated, deprecated, or removed
as compared to the previous release version, are marked
with a corresponding superscript,
for example, lcm-ansible Updated.
Artifact |
Component |
Path |
|---|---|---|
Binaries Updated |
ironic-python-agent.initramfs |
https://binary.mirantis.com/bm/bin/ironic/ipa/ubuntu/initramfs-yoga-focal-debug-20231012141354 |
ironic-python-agent.kernel |
https://binary.mirantis.com/bm/bin/ironic/ipa/ubuntu/kernel-yoga-focal-debug-20231012141354 |
|
provisioning_ansible |
https://binary.mirantis.com/bm/bin/ansible/provisioning_ansible-0.1.1-113-4f8b843.tgz |
|
Helm charts Updated |
baremetal-api |
https://binary.mirantis.com/core/helm/baremetal-api-1.38.22.tgz |
baremetal-operator |
https://binary.mirantis.com/core/helm/baremetal-operator-1.38.22.tgz |
|
baremetal-provider |
https://binary.mirantis.com/core/helm/baremetal-provider-1.38.22.tgz |
|
baremetal-public-api |
https://binary.mirantis.com/core/helm/baremetal-public-api-1.38.22.tgz |
|
kaas-ipam |
||
local-volume-provisioner |
https://binary.mirantis.com/core/helm/local-volume-provisioner-1.38.22.tgz |
|
metallb |
||
Docker images Updated |
ambasador |
mirantis.azurecr.io/core/external/nginx:1.38.22 |
baremetal-dnsmasq |
mirantis.azurecr.io/bm/baremetal-dnsmasq:base-alpine-20231030180650 |
|
baremetal-operator |
mirantis.azurecr.io/bm/baremetal-operator:base-alpine-20231101201729 |
|
bm-collective |
mirantis.azurecr.io/bm/bm-collective:base-alpine-20231027135748 |
|
cluster-api-provider-baremetal |
mirantis.azurecr.io/core/cluster-api-provider-baremetal:1.38.22 |
|
ironic |
mirantis.azurecr.io/openstack/ironic:yoga-jammy-20231030060018 |
|
ironic-inspector |
mirantis.azurecr.io/openstack/ironic-inspector:yoga-jammy-20231030060018 |
|
ironic-prometheus-exporter |
mirantis.azurecr.io/stacklight/ironic-prometheus-exporter:0.1-20230912104602 |
|
kaas-ipam |
mirantis.azurecr.io/bm/kaas-ipam:base-alpine-20231027151726 |
|
kubernetes-entrypoint |
mirantis.azurecr.io/openstack/extra/kubernetes-entrypoint:v1.0.1-55b02f7-20231019172556 |
|
mariadb |
mirantis.azurecr.io/general/mariadb:10.6.14-focal-20231024091216 |
|
mcc-keepalived |
mirantis.azurecr.io/lcm/mcc-keepalived:v0.23.0-84-g8d74d7c |
|
metallb-controller |
mirantis.azurecr.io/bm/metallb/controller:v0.13.9-fd3b03b0-amd64 |
|
metallb-speaker |
mirantis.azurecr.io/bm/metallb/speaker:v0.13.9-fd3b03b0-amd64 |
|
syslog-ng |
mirantis.azurecr.io/bm/syslog-ng:base-apline-20231030181839 |
Artifact |
Component |
Paths |
|---|---|---|
Bootstrap tarball Updated |
bootstrap-darwin |
https://binary.mirantis.com//core/binbootstrap-darwin-1.38.22.tgz |
bootstrap-linux |
https://binary.mirantis.com//core/binbootstrap-linux-1.38.22.tgz |
|
Helm charts Updated |
admission-controller |
https://binary.mirantis.com/core/helm/admission-controller-1.38.22.tgz |
agent-controller |
https://binary.mirantis.com/core/helm/agent-controller-1.38.22.tgz |
|
ceph-kcc-controller |
https://binary.mirantis.com/core/helm/ceph-kcc-controller-1.38.22.tgz |
|
cert-manager |
https://binary.mirantis.com/core/helm/cert-manager-1.38.22.tgz |
|
cinder-csi-plugin |
https://binary.mirantis.com/core/helm/cinder-csi-plugin-1.38.22.tgz |
|
client-certificate-controller |
https://binary.mirantis.com/core/helm/client-certificate-controller-1.38.22.tgz |
|
configuration-collector |
https://binary.mirantis.com/core/helm/configuration-collector-1.38.22.tgz |
|
event-controller |
https://binary.mirantis.com/core/helm/event-controller-1.38.22.tgz |
|
iam-controller |
https://binary.mirantis.com/core/helm/iam-controller-1.38.22.tgz |
|
kaas-exporter |
https://binary.mirantis.com/core/helm/kaas-exporter-1.38.22.tgz |
|
kaas-public-api |
https://binary.mirantis.com/core/helm/kaas-public-api-1.38.22.tgz |
|
kaas-ui |
||
lcm-controller |
https://binary.mirantis.com/core/helm/lcm-controller-1.38.22.tgz |
|
license-controller |
https://binary.mirantis.com/core/helm/license-controller-1.38.22.tgz |
|
machinepool-controller |
https://binary.mirantis.com/core/helm/machinepool-controller-1.38.22.tgz |
|
mcc-cache |
||
mcc-cache-warmup |
https://binary.mirantis.com/core/helm/mcc-cache-warmup-1.38.22.tgz |
|
metrics-server |
https://binary.mirantis.com/core/helm/metrics-server-1.38.22.tgz |
|
openstack-cloud-controller-manager |
https://binary.mirantis.com/core/helm/openstack-cloud-controller-manager-1.38.22.tgz |
|
openstack-provider |
https://binary.mirantis.com/core/helm/openstack-provider-1.38.22.tgz |
|
os-credentials-controller |
https://binary.mirantis.com/core/helm/os-credentials-controller-1.38.22.tgz |
|
portforward-controller |
https://binary.mirantis.com/core/helm/portforward-controller-1.38.22.tgz |
|
proxy-controller |
https://binary.mirantis.com/core/helm/proxy-controller-1.38.22.tgz |
|
rbac-controller |
https://binary.mirantis.com/core/helm/rbac-controller-1.38.22.tgz |
|
release-controller |
https://binary.mirantis.com/core/helm/release-controller-1.38.22.tgz |
|
rhellicense-controller |
https://binary.mirantis.com/core/helm/rhellicense-controller-1.38.22.tgz |
|
scope-controller |
https://binary.mirantis.com/core/helm/scope-controller-1.38.22.tgz |
|
squid-proxy |
https://binary.mirantis.com/core/helm/squid-proxy-1.38.22.tgz |
|
user-controller |
https://binary.mirantis.com/core/helm/user-controller-1.38.22.tgz |
|
vsphere-cloud-controller-manager New |
https://binary.mirantis.com/core/helm/vsphere-cloud-controller-manager-1.38.22.tgz |
|
vsphere-credentials-controller |
https://binary.mirantis.com/core/helm/vsphere-credentials-controller-1.38.22.tgz |
|
vsphere-csi-plugin New |
https://binary.mirantis.com/core/helm/vsphere-csi-plugin-1.38.22.tgz |
|
vsphere-provider |
https://binary.mirantis.com/core/helm/vsphere-provider-1.38.22.tgz |
|
vsphere-vm-template-controller |
https://binary.mirantis.com/core/helm/vsphere-vm-template-controller-1.38.22.tgz |
|
Docker images |
admission-controller Updated |
mirantis.azurecr.io/core/admission-controller:1.38.22 |
agent-controller Updated |
mirantis.azurecr.io/core/agent-controller:1.38.22 |
|
ceph-kcc-controller Updated |
mirantis.azurecr.io/core/ceph-kcc-controller:1.38.22 |
|
cert-manager-controller Updated |
mirantis.azurecr.io/core/external/cert-manager-controller:v1.11.0-4 |
|
cinder-csi-plugin Updated |
mirantis.azurecr.io/lcm/kubernetes/cinder-csi-plugin:v1.27.2-11 |
|
client-certificate-controller Updated |
mirantis.azurecr.io/core/client-certificate-controller:1.38.22 |
|
configuration-collector Updated |
mirantis.azurecr.io/core/configuration-collector:1.38.22 |
|
csi-attacher Updated |
mirantis.azurecr.io/lcm/k8scsi/csi-attacher:v4.2.0-4 |
|
csi-node-driver-registrar Updated |
mirantis.azurecr.io/lcm/k8scsi/csi-node-driver-registrar:v2.7.0-4 |
|
csi-provisioner Updated |
mirantis.azurecr.io/lcm/k8scsi/csi-provisioner:v3.4.1-4 |
|
csi-resizer Updated |
mirantis.azurecr.io/lcm/k8scsi/csi-resizer:v1.7.0-4 |
|
csi-snapshotter Updated |
mirantis.azurecr.io/lcm/k8scsi/csi-snapshotter:v6.2.1-mcc-3 |
|
event-controller Updated |
mirantis.azurecr.io/core/event-controller:1.38.22 |
|
frontend Updated |
mirantis.azurecr.io/core/frontend:1.38.22 |
|
iam-controller Updated |
mirantis.azurecr.io/core/iam-controller:1.38.22 |
|
kaas-exporter Updated |
mirantis.azurecr.io/core/kaas-exporter:1.38.22 |
|
kproxy Updated |
mirantis.azurecr.io/core/kproxy:1.38.22 |
|
lcm-controller Updated |
mirantis.azurecr.io/core/lcm-controller:1.38.22 |
|
license-controller Updated |
mirantis.azurecr.io/core/license-controller:1.38.22 |
|
livenessprobe Updated |
mirantis.azurecr.io/lcm/k8scsi/livenessprobe:v2.9.0-4 |
|
machinepool-controller Updated |
mirantis.azurecr.io/core/machinepool-controller:1.38.22 |
|
mcc-haproxy Updated |
mirantis.azurecr.io/lcm/mcc-haproxy:v0.23.0-84-g8d74d7c |
|
mcc-keepalived Updated |
mirantis.azurecr.io/lcm/mcc-keepalived:v0.23.0-84-g8d74d7c |
|
metrics-server Updated |
mirantis.azurecr.io/lcm/metrics-server-amd64:v0.6.3-4 |
|
nginx Updated |
mirantis.azurecr.io/core/external/nginx:1.38.22 |
|
openstack-cloud-controller-manager Updated |
mirantis.azurecr.io/lcm/kubernetes/openstack-cloud-controller-manager:v1.27.2-11 |
|
openstack-cluster-api-controller Updated |
mirantis.azurecr.io/core/openstack-cluster-api-controller:1.38.22 |
|
os-credentials-controller Updated |
mirantis.azurecr.io/core/os-credentials-controller:1.38.22 |
|
portforward-controller Updated |
mirantis.azurecr.io/core/portforward-controller:1.38.22 |
|
proxy-controller Updated |
mirantis.azurecr.io/core/proxy-controller:1.38.22 |
|
rbac-controller Updated |
mirantis.azurecr.io/core/rbac-controller:1.38.22 |
|
registry Updated |
mirantis.azurecr.io/lcm/registry:v2.8.1-7 |
|
release-controller Updated |
mirantis.azurecr.io/core/release-controller:1.38.22 |
|
rhellicense-controller Updated |
mirantis.azurecr.io/core/rhellicense-controller:1.38.22 |
|
scope-controller Updated |
mirantis.azurecr.io/core/scope-controller:1.38.22 |
|
squid-proxy |
mirantis.azurecr.io/lcm/squid-proxy:0.0.1-10-g24a0d69 |
|
user-controller Updated |
mirantis.azurecr.io/core/user-controller:1.38.22 |
|
vsphere-cloud-controller-manager New |
mirantis.azurecr.io/lcm/kubernetes/vsphere-cloud-controller-manager:v1.27.0-4 |
|
vsphere-cluster-api-controller Updated |
mirantis.azurecr.io/core/vsphere-cluster-api-controller:1.38.22 |
|
vsphere-credentials-controller Updated |
mirantis.azurecr.io/core/vsphere-credentials-controller:1.38.22 |
|
vsphere-csi-driver New |
mirantis.azurecr.io/core/external/vsphere-csi-driver:v3.0.2 |
|
vsphere-csi-syncer New |
mirantis.azurecr.io/core/external/vsphere-csi-syncer:v3.0.2 |
|
vsphere-vm-template-controller Updated |
mirantis.azurecr.io/core/vsphere-vm-template-controller:1.38.22 |
Artifact |
Component |
Path |
|---|---|---|
Binaries |
hash-generate-darwin |
http://binary.mirantis.com/iam/bin/hash-generate-0.0.1-268-3cf7f17-darwin |
hash-generate-linux |
http://binary.mirantis.com/iam/bin/hash-generate-0.0.1-268-3cf7f17-linux |
|
Helm charts Updated |
iam |
|
Docker images Updated |
keycloak |
mirantis.azurecr.io/iam/keycloak:0.6.0-1 |
kubernetes-entrypoint |
mirantis.azurecr.io/openstack/extra/kubernetes-entrypoint:v1.0.1-55b02f7-20231019172556 |
|
mariadb |
mirantis.azurecr.io/general/mariadb:10.6.14-focal-20231024091216 |
The table below includes the total numbers of addressed unique and common CVEs in images by product component since the Container Cloud 2.25.0 major release. The common CVEs are issues addressed across several images.
Container Cloud component |
CVE type |
Critical |
High |
Total |
|---|---|---|---|---|
Kaas core |
Unique |
0 |
12 |
12 |
Common |
0 |
280 |
280 |
|
Ceph |
Unique |
0 |
8 |
8 |
Common |
0 |
41 |
41 |
|
StackLight |
Unique |
4 |
33 |
37 |
Common |
18 |
130 |
148 |
Mirantis Security Portal
For the detailed list of fixed and existing CVEs across the Mirantis Container Cloud and MOSK products, refer to Mirantis Security Portal.
MOSK CVEs
For the number of fixed CVEs in the MOSK-related components including OpenStack and Tungsten Fabric, refer to MOSK 23.3.1: Security notes.
The following issues have been addressed in the Container Cloud patch release 2.25.1 along with the patch Cluster releases 17.0.1 and 16.0.1.
[35426] [StackLight] Fixed the issue with the
prometheus-libvirt-exporterPod failing to reconnect to libvirt after thelibvirtPod recovery from a failure.[35339] [LCM] Fixed the issue with the LCM Ansible task of copying
kubectlfrom theucp-hyperkubeimage failing if kubectl exec is in use, for example, during a management cluster upgrade.[35089] [bare metal, Calico] Fixed the issue with arbitrary Kubernetes pods getting stuck in an error loop due to a failed Calico networking setup for that pod.
[33936] [bare metal, Calico] Fixed the issue with deletion failure of a controller node during machine replacement due to the upstream Calico issue.
See also
The Mirantis Container Cloud major release 2.25.0:
Introduces support for the Cluster release 17.0.0 that is based on the Cluster release 16.0.0 and represents Mirantis OpenStack for Kubernetes (MOSK) 23.3.
Introduces support for the Cluster release 16.0.0 that is based on Mirantis Container Runtime (MCR) 23.0.7 and Mirantis Kubernetes Engine (MKE) 3.7.1 with Kubernetes 1.27.
Introduces support for the Cluster release 14.1.0 that is dedicated for the vSphere provider only. This is the last Cluster release for the vSphere provider based on MKE 3.6.6 with Kubernetes 1.24.
Does not support greenfield deployments on deprecated Cluster releases of the 15.x and 14.x series. Use the latest available Cluster releases of the series instead.
Caution
Make sure to update the Cluster release version of your managed cluster before the current Cluster release version becomes unsupported by a new Container Cloud release version. Otherwise, Container Cloud stops auto-upgrade and eventually Container Cloud itself becomes unsupported.
This section outlines release notes for the Container Cloud release 2.25.0.
This section outlines new features and enhancements introduced in the Container Cloud release 2.25.0. For the list of enhancements delivered with the Cluster releases introduced by Container Cloud 2.25.0, see 17.0.0, 16.0.0, and 14.1.0.
Implemented Container Cloud Bootstrap v2 that provides an exceptional user experience to set up Container Cloud. With Bootstrap v2, you also gain access to a comprehensive and user-friendly web UI for the OpenStack and vSphere providers.
Bootstrap v2 empowers you to effortlessly provision management clusters before deployment, while benefiting from a streamlined process that isolates each step. This approach not only simplifies the bootstrap process but also enhances troubleshooting capabilities for addressing any potential intermediate failures.
Note
The Bootstrap web UI support for the bare metal provider will be added in one of the following Container Cloud releases.
Completed development of the MetalLB configuration related to address
allocation and announcement for load-balanced services using the
MetalLBConfigTemplate object for bare metal and the MetalLBConfig
object for vSphere. Container Cloud uses these objects in default templates as
recommended during creation of a management or managed cluster.
At the same time, removed the possibility to use the deprecated options, such
as configInline value of the MetalLB chart and the use of Subnet
objects without new MetalLBConfigTemplate and MetalLBConfig objects.
Automated migration, which applied to these deprecated options during creation
of clusters of any type or cluster update to Container Cloud 2.24.x, is
removed automatically during your management cluster upgrade to Container
Cloud 2.25.0. After that, any changes in MetalLB configuration related to
address allocation and announcement for load-balanced services will be applied
using the MetalLBConfig, MetalLBConfigTemplate, and Subnet objects
only.
TechPreview
Implemented the following annotations for bare metal hosts that enable manual allocation of IP addresses during PXE provisioning on managed clusters:
host.dnsmasqs.metal3.io/address- assigns a specific IP address to a hostbaremetalhost.metal3.io/detached- pauses automatic host management
These annotations are helpful if you have a limited amount of free and unused IP addresses for server provisioning. Using these annotations, you can manually create bare metal hosts one by one and provision servers in small, manually managed chunks.
Implemented the Infrastructure Status condition to monitor infrastructure readiness in the Container Cloud web UI during cluster deployment for bare metal and OpenStack providers. Readiness of the following components is monitored:
Bare metal: the
MetalLBConfigobject along with MetalLB and DHCP subnetsOpenStack: cluster network, routers, load balancers, and Bastion along with their ports and floating IPs
For the bare metal provider, also implemented the
Infrastructure Status condition for machines to monitor readiness
of the IPAMHost, L2Template, BareMetalHost, and
BareMetalHostProfile objects associated with the machine.
Introduced general availability support for RHEL 8.7 on VMware vSphere-based clusters. You can install this operating system on any type of a Container Cloud cluster including the bootstrap node.
Note
RHEL 7.9 is not supported as the operating system for the bootstrap node.
Caution
A Container Cloud cluster based on mixed RHEL versions, such as RHEL 7.9 and 8.7, is not supported.
Implemented automatic cleanup of old Ubuntu kernel and other unnecessary system packages. During cleanup, Container Cloud keeps two most recent kernel versions, which is the default behavior of the Ubuntu apt autoremove command.
Mirantis recommends keeping two kernel versions with the previous kernel version as a fallback option in the event that the current kernel may become unstable at any time. However, if you absolutely require leaving only the latest version of kernel packages, you can use the cleanup-kernel-packages script after considering all possible risks.
Implemented the ability to configure a custom OpenID Connect (OIDC) provider
for MKE on managed clusters using the ClusterOIDCConfiguration custom
resource. Using this resource, you can add your own OIDC provider
configuration to authenticate user requests to Kubernetes.
Note
For OpenStack and StackLight, Container Cloud supports only Keycloak, which is configured on the management cluster, as the OIDC provider.
Implemented the management-admin OIDC role to grant full admin access
specifically to a management cluster. This role enables the user to manage
Pods and all other resources of the cluster, for example, for debugging
purposes.
Introduced general availability support for graceful machine deletion with a safe cleanup of node resources:
Changed the default deletion policy from
unsafetogracefulfor machine deletion using the Container Cloud API.Using the
deletionPolicy: gracefulparameter in theproviderSpec.valuesection of theMachineobject, the cloud provider controller prepares a machine for deletion by cordoning, draining, and removing the related node from Docker Swarm. If required, you can abort a machine deletion when usingdeletionPolicy: graceful, but only before the related node is removed from Docker Swarm.Implemented the following machine deletion methods in the Container Cloud web UI: Graceful, Unsafe, Forced.
Added support for deletion of manager machines, which is intended only for replacement or recovery of failed nodes, for MOSK-based clusters using either of deletion policies mentioned above.
Completed development of the parallel update of worker nodes during cluster update by implementing the ability to configure the required options using the Container Cloud web UI. Parallelizing of node update operations significantly optimizes the update efficiency of large clusters.
The following options are added to the Create Cluster window:
Parallel Upgrade Of Worker Machines that sets the maximum number of worker nodes to update simultaneously
Parallel Preparation For Upgrade Of Worker Machines that sets the maximum number of worker nodes for which new artifacts are downloaded at a given moment of time
The following issues have been addressed in the Mirantis Container Cloud release 2.25.0 along with the Cluster releases 17.0.0, 16.0.0, and 14.1.0.
Note
This section provides descriptions of issues addressed since the last Container Cloud patch release 2.24.5.
For details on addressed issues in earlier patch releases since 2.24.0, which are also included into the major release 2.25.0, refer to 2.24.x patch releases.
[34462] [BM] Fixed the issue with incorrect handling of the DHCP egress traffic by reconfiguring the external traffic policy for the
dhcp-lbKubernetes Service. For details about the issue, refer to the Kubernetes upstream bug.On existing clusters with multiple L2 segments using DHCP relays on the border switches, in order to successfully provision new nodes or reprovision existing ones, manually point the DHCP relays on your network infrastructure to the new IP address of the
dhcp-lbService of the Container Cloud cluster.To obtain the new IP address:
kubectl -n kaas get service dhcp-lb
[35429] [BM] Fixed the issue with the WireGuard interface not having the IPv4 address assigned. The fix implies automatic restart of the
calico-nodePod to allocate the IPv4 address on the WireGuard interface.[36131] [BM] Fixed the issue with
IpamHostobject changes not being propagated toLCMMachineduring netplan configuration after cluster deployment.[34657] [LCM] Fixed the issue with
iam-keycloakPods not starting after powering up master nodes and starting the Container Cloud upgrade right after.[34750] [LCM] Fixed the issue with
journaldgenerating a lot of log messages that already exist in the auditd log due to enabledsystemd-journald-audit.socket.[35738] [StackLight] Fixed the issue with
ucp-node-exporterbeing unable to bind the port 9100 with theucp-node-exporterfailing to start due to a conflict with the StackLightnode-exporterbinding the same port.The resolution of the issue involves an automatic change of the port for the StackLight
node-exporterfrom 9100 to 19100. No manual port update is required.If your cluster uses a firewall, add an additional firewall rule that grants the same permissions to port 19100 as those currently assigned to port 9100 on all cluster nodes.
[34296] [StackLight] Fixed the issue with the CPU over-consumption by
helm-controllerleading to theKubeContainersCPUThrottlingHighalert firing.
This section lists known issues with workarounds for the Mirantis Container Cloud release 2.25.0 including the Cluster releases 17.0.0, 16.0.0, and 14.1.0.
For other issues that can occur while deploying and operating a Container Cloud cluster, see Troubleshooting Guide.
Note
This section also outlines still valid known issues from previous Container Cloud releases.
Due to the MetalLB upstream issue, a load balancer service may not obtain the external IP address.
The issue occurs when two services share the same external IP address and have
the same externalTrafficPolicy value. Initially, the services have the
external IP address assigned and are accessible. After modifying the
externalTrafficPolicy value for both services from Cluster to
Local, the first service that has been changed remains with no external IP
address assigned. Though, the second service, which was changed later, has the
external IP assigned as expected.
To work around the issue, make a dummy change to the service object where
external IP is <pending>:
Identify the service that is stuck:
kubectl get svc -A | grep pending
Example of system response:
stacklight iam-proxy-prometheus LoadBalancer 10.233.28.196 <pending> 443:30430/TCP
Add an arbitrary label to the service that is stuck. For example:
kubectl label svc -n stacklight iam-proxy-prometheus reconcile=1
Example of system response:
service/iam-proxy-prometheus labeledVerify that the external IP was allocated to the service:
kubectl get svc -n stacklight iam-proxy-prometheus
Example of system response:
NAME TYPE CLUSTER-IP EXTERNAL-IP PORT(S) AGE iam-proxy-prometheus LoadBalancer 10.233.28.196 10.0.34.108 443:30430/TCP 12d
Fixed in 17.0.1 and 16.0.1 for MKE 3.7.2
An arbitrary Kubernetes pod may get stuck in an error loop due to a failed Calico networking setup for that pod. The pod cannot access any network resources. The issue occurs more often during cluster upgrade or node replacement, but this can sometimes happen during the new deployment as well.
You may find the following log for the failed pod IP (for example,
10.233.121.132) in calico-node logs:
felix/route_table.go 898: Syncing routes: found unexpected route; ignoring due to grace period. dest=10.233.121.132/32 ifaceName="cali9731b965838" ifaceRegex="^cali." ipVersion=0x4 tableIndex=254
felix/route_table.go 898: Syncing routes: found unexpected route; ignoring due to grace period. dest=10.233.121.132/32 ifaceName="cali9731b965838" ifaceRegex="^cali." ipVersion=0x4 tableIndex=254
...
felix/route_table.go 902: Remove old route dest=10.233.121.132/32 ifaceName="cali9731b965838" ifaceRegex="^cali.*" ipVersion=0x4 routeProblems=[]string{"unexpected route"} tableIndex=254
felix/conntrack.go 90: Removing conntrack flows ip=10.233.121.132
The workaround is to manually restart the affected pod:
kubectl delete pod <failedPodID>
Fixed in 17.0.1 and 16.0.1 for MKE 3.7.2
Due to the upstream Calico issue, a controller node
cannot be deleted if the calico-node Pod is stuck blocking node deletion.
One of the symptoms is the following warning in the baremetal-operator
logs:
Resolving dependency Service dhcp-lb in namespace kaas failed: \
the server was unable to return a response in the time allotted,\
but may still be processing the request (get endpoints dhcp-lb).
As a workaround, delete the Pod that is stuck to retrigger the node deletion.
During deletion of a manager machine running the ironic Pod from a bare
metal management cluster, the following problems occur:
All Pods are stuck in the
TerminatingstateA new
ironicPod fails to startThe related bare metal host is stuck in the
deprovisioningstate
As a workaround, before deletion of the node running the ironic Pod,
cordon and drain the node using the kubectl cordon <nodeName> and
kubectl drain <nodeName> commands.
When using OpenStackCredential with a custom CACert, a management or
managed cluster deployment or upgrade is blocked by all pods being stuck in
the Pending state. The issue is caused by incorrect secrets being used to
initialize the OpenStack external Cloud Provider Interface.
As a workaround, copy CACert from the OpenStackCredential object
to openstack-ca-secret:
kubectl --kubeconfig <pathToFailedClusterKubeconfig> patch secret -n kube-system openstack-ca-secret -p '{"data":{"ca.pem":"'$(kubectl --kubeconfig <pathToManagementClusterKubeconfig> -n <affectedProjectName> get openstackcredentials <credentialsName> -o go-template="{{.spec.CACert}}")'"}}'
If the CACert from the OpenStackCredential is not base64-encoded:
kubectl --kubeconfig <pathToFailedClusterKubeconfig> patch secret -n kube-system openstack-ca-secret -p '{"data":{"ca.pem":"'$(kubectl --kubeconfig <pathToManagementClusterKubeconfig> -n <affectedProjectName> get openstackcredentials <credentialsName> -o go-template="{{.spec.CACert}}" | base64)'"}}'
In either command above, replace the following values:
<pathToFailedClusterKubeconfig>is the file path to the affected managed or management clusterkubeconfig.<pathToManagementClusterKubeconfig>is the file path to the Container Cloud management clusterkubeconfig.<affectedProjectName>is the Container Cloud project name containing the cluster with stuck pods. For a management cluster, the value isdefault.<credentialsName>is theOpenStackCredentialname used for the deployment.
A sign-in to the MKE web UI of the management cluster using the Sign in with External Provider option can fail with the invalid parameter: redirect_uri error.
Workaround:
Log in to the Keycloak admin console.
In the sidebar menu, switch to the IAM realm.
Navigate to Clients > kaas.
On the page, navigate to Seetings > Access settings > Valid redirect URIs.
Add
https://<mgmt mke ip>:6443/*to the list of valid redirect URIs and click Save.Refresh the browser window with the sign-in URI.
During MariaDB operations on a management cluster, Pods may get stuck in continuous restarts with the following example error:
[ERROR] WSREP: Corrupt buffer header: \
addr: 0x7faec6f8e518, \
seqno: 3185219421952815104, \
size: 909455917, \
ctx: 0x557094f65038, \
flags: 11577. store: 49, \
type: 49
Workaround:
Create a backup of the
/var/lib/mysqldirectory on themariadb-serverPod.Verify that other replicas are up and ready.
Remove the
galera.cachefile for the affectedmariadb-serverPod.Remove the affected
mariadb-serverPod or wait until it is automatically restarted.
After Kubernetes restarts the Pod, the Pod clones the database in 1-2 minutes and restores the quorum.
On MOSK clusters, the Ansible provisioner may hang in a loop while trying to remove LVM thin pool logical volumes (LVs) due to issues with volume detection before removal. The Ansible provisioner cannot remove LVM thin pool LVs correctly, so it consistently detects the same volumes whenever it scans disks, leading to a repetitive cleanup process.
The following symptoms mean that a cluster can be affected:
A node was configured to use thin pool LVs. For example, it had the OpenStack Cinder role in the past.
A bare metal node deployment flaps between
provisioniniganddeprovisioningstates.In the Ansible provisioner logs, the following example warnings are growing:
88621.log:7389:2023-06-22 16:30:45.109 88621 ERROR ansible.plugins.callback.ironic_log [-] Ansible task clean : fail failed on node 14eb0dbc-c73a-4298-8912-4bb12340ff49: {'msg': 'There are more devices to clean', '_ansible_no_log': None, 'changed': False}
Important
There are more devices to cleanis a regular warning indicating some in-progress tasks. But if the number of such warnings is growing along with the node flapping betweenprovisioniniganddeprovisioningstates, the cluster is highly likely affected by the issue.
As a workaround, erase disks manually using any preferred tool.
Fixed in 2.28.4 (17.3.4 and 16.3.4)
During replacement of a master node on a cluster of any type, the
calico-node Pod fails to start on a new node that has the same IP address
as the node being replaced.
Workaround:
Log in to any
masternode.From a CLI with an MKE client bundle, create a shell alias to start calicoctl using the
mirantis/ucp-dsinfoimage:alias calicoctl="\ docker run -i --rm \ --pid host \ --net host \ -e constraint:ostype==linux \ -e ETCD_ENDPOINTS=<etcdEndpoint> \ -e ETCD_KEY_FILE=/var/lib/docker/volumes/ucp-kv-certs/_data/key.pem \ -e ETCD_CA_CERT_FILE=/var/lib/docker/volumes/ucp-kv-certs/_data/ca.pem \ -e ETCD_CERT_FILE=/var/lib/docker/volumes/ucp-kv-certs/_data/cert.pem \ -v /var/run/calico:/var/run/calico \ -v /var/lib/docker/volumes/ucp-kv-certs/_data:/var/lib/docker/volumes/ucp-kv-certs/_data:ro \ mirantis/ucp-dsinfo:<mkeVersion> \ calicoctl \ "
alias calicoctl="\ docker run -i --rm \ --pid host \ --net host \ -e constraint:ostype==linux \ -e ETCD_ENDPOINTS=<etcdEndpoint> \ -e ETCD_KEY_FILE=/ucp-node-certs/key.pem \ -e ETCD_CA_CERT_FILE=/ucp-node-certs/ca.pem \ -e ETCD_CERT_FILE=/ucp-node-certs/cert.pem \ -v /var/run/calico:/var/run/calico \ -v ucp-node-certs:/ucp-node-certs:ro \ mirantis/ucp-dsinfo:<mkeVersion> \ calicoctl --allow-version-mismatch \ "
In the above command, replace the following values with the corresponding settings of the affected cluster:
<etcdEndpoint>is the etcd endpoint defined in the Calico configuration file. For example,ETCD_ENDPOINTS=127.0.0.1:12378<mkeVersion>is the MKE version installed on your cluster. For example,mirantis/ucp-dsinfo:3.5.7.
Verify the node list on the cluster:
kubectl get node
Compare this list with the node list in Calico to identify the old node:
calicoctl get node -o wide
Remove the old node from Calico:
calicoctl delete node kaas-node-<nodeID>
Fixed in 2.28.4 (17.3.4 and 16.3.4)
During replacement of a manager machine, the following problems may occur:
The system adds the node to Docker swarm but not to Kubernetes
The node
Deploymentgets stuck with failed RethinkDB health checks
Workaround:
Delete the failed node.
Wait for the MKE cluster to become healthy. To monitor the cluster status:
Log in to the MKE web UI.
Monitor the cluster status as described in MKE Operations Guide: Monitor an MKE cluster with the MKE web UI.
Deploy a new node.
Fixed in 2.28.4 (17.3.4 and 16.3.4)
During the unsafe or forced deletion of a manager machine running the
calico-kube-controllers Pod in the kube-system namespace,
the following issues occur:
The
calico-kube-controllersPod fails to clean up resources associated with the deleted nodeThe
calico-nodePod may fail to start up on a newly created node if the machine is provisioned with the same IP address as the deleted machine had
As a workaround, before deletion of the node running the
calico-kube-controllers Pod, cordon and drain the node:
kubectl cordon <nodeName>
kubectl drain <nodeName>
Due to the upstream Ceph issue,
on clusters with the Federal Information Processing Standard (FIPS) mode
enabled, the Ceph rook-operator fails to connect to Ceph RADOS Gateway
(RGW) pods.
As a workaround, do not place Ceph RGW pods on nodes where FIPS mode is enabled.
Note
The issue does not reproduce since MOSK 25.2.
Update of a managed cluster based on bare metal and Ceph enabled fails with
PersistentVolumeClaim getting stuck in the Pending state for the
prometheus-server StatefulSet and the
MountVolume.MountDevice failed for volume warning in the StackLight event
logs.
Workaround:
Verify that the description of the Pods that failed to run contain the
FailedMountevents:kubectl -n <affectedProjectName> describe pod <affectedPodName>
In the command above, replace the following values:
<affectedProjectName>is the Container Cloud project name where the Pods failed to run<affectedPodName>is a Pod name that failed to run in the specified project
In the Pod description, identify the node name where the Pod failed to run.
Verify that the
csi-rbdpluginlogs of the affected node contain therbd volume mount failed: <csi-vol-uuid> is being usederror. The<csi-vol-uuid>is a unique RBD volume name.Identify
csiPodNameof the correspondingcsi-rbdplugin:kubectl -n rook-ceph get pod -l app=csi-rbdplugin \ -o jsonpath='{.items[?(@.spec.nodeName == "<nodeName>")].metadata.name}'
Output the affected
csiPodNamelogs:kubectl -n rook-ceph logs <csiPodName> -c csi-rbdplugin
Scale down the affected
StatefulSetorDeploymentof the Pod that fails to0replicas.On every
csi-rbdpluginPod, search for stuckcsi-vol:for pod in `kubectl -n rook-ceph get pods|grep rbdplugin|grep -v provisioner|awk '{print $1}'`; do echo $pod kubectl exec -it -n rook-ceph $pod -c csi-rbdplugin -- rbd device list | grep <csi-vol-uuid> done
Unmap the affected
csi-vol:rbd unmap -o force /dev/rbd<i>
The
/dev/rbd<i>value is a mapped RBD volume that usescsi-vol.Delete
volumeattachmentof the affected Pod:kubectl get volumeattachments | grep <csi-vol-uuid> kubectl delete volumeattacmhent <id>
Scale up the affected
StatefulSetorDeploymentback to the original number of replicas and wait until its state becomesRunning.
Container Cloud upgrade may be blocked by a node being stuck in the Prepare
or Deploy state with error processing package openssh-server.
The issue is caused by customizations in /etc/ssh/sshd_config, such as
additional Match statements. This file is managed by Container Cloud and
must not be altered manually.
As a workaround, move customizations from sshd_config to a new file
in the /etc/ssh/sshd_config.d/ directory.
During a cluster update, a Kubernetes helm-controller Deployment may
get stuck in a restarting Pod loop with Terminating and Running states
flapping. Other Deployment types may also be affected.
As a workaround, restart the Deployment that got stuck:
kubectl -n <affectedProjectName> get deploy <affectedDeployName> -o yaml
kubectl -n <affectedProjectName> scale deploy <affectedDeployName> --replicas 0
kubectl -n <affectedProjectName> scale deploy <affectedDeployName> --replicas <replicasNumber>
In the command above, replace the following values:
<affectedProjectName>is the Container Cloud project name containing the cluster with stuck Pods<affectedDeployName>is theDeploymentname that failed to run Pods in the specified project<replicasNumber>is the original number of replicas for theDeploymentthat you can obtain using the get deploy command
During cluster update of a managed bare metal cluster, the false positive
CalicoDataplaneFailuresHigh alert may be firing. Disregard this alert,
which will disappear once cluster update succeeds.
The observed behavior is typical for calico-node during upgrades,
as workload changes occur frequently. Consequently, there is a possibility
of temporary desynchronization in the Calico dataplane. This can occasionally
result in throttling when applying workload changes to the Calico dataplane.
The following table lists the major components and their versions delivered in the Container Cloud 2.25.0.
Note
The components that are newly added, updated, deprecated, or removed
as compared to the previous release version, are marked
with a corresponding superscript,
for example, lcm-ansible Updated.
Component |
Application/Service |
Version |
|---|---|---|
Bare metal Updated |
ambasador |
1.38.17 |
baremetal-dnsmasq |
base-alpine-20231013162346 |
|
baremetal-operator |
base-alpine-20231101201729 |
|
baremetal-provider |
1.38.17 |
|
bm-collective |
base-alpine-20230929115341 |
|
cluster-api-provider-baremetal |
1.38.17 |
|
ironic |
yoga-jammy-20230914091512 |
|
ironic-inspector |
yoga-jammy-20230914091512 |
|
ironic-prometheus-exporter |
0.1-20230912104602 |
|
kaas-ipam |
base-alpine-20230911165405 |
|
kubernetes-entrypoint |
1.0.1-27d64fb-20230421151539 |
|
mariadb |
10.6.14-focal-20230912121635 |
|
metallb-controller |
0.13.9-0d8e8043-amd64 |
|
metallb-speaker |
0.13.9-0d8e8043-amd64 |
|
syslog-ng |
base-apline-20230914091214 |
|
IAM |
iam Updated |
2.5.8 |
iam-controller Updated |
1.38.17 |
|
keycloak |
21.1.1 |
|
Container Cloud |
admission-controller Updated |
1.38.17 |
agent-controller Updated |
1.38.17 |
|
ceph-kcc-controller Updated |
1.38.17 |
|
cert-manager-controller |
1.11.0-2 |
|
cinder-csi-plugin New |
1.27.2-8 |
|
client-certificate-controller Updated |
1.38.17 |
|
configuration-collector New |
1.38.17 |
|
csi-attacher New |
4.2.0-2 |
|
csi-node-driver-registrar New |
2.7.0-2 |
|
csi-provisioner New |
3.4.1-2 |
|
csi-resizer New |
1.7.0-2 |
|
csi-snapshotter New |
6.2.1-mcc-1 |
|
event-controller Updated |
1.38.17 |
|
frontend Updated |
1.38.17 |
|
golang |
1.20.4-alpine3.17 |
|
iam-controller Updated |
1.38.17 |
|
kaas-exporter Updated |
1.38.17 |
|
kproxy Updated |
1.38.17 |
|
lcm-controller Updated |
1.38.17 |
|
license-controller Updated |
1.38.17 |
|
livenessprobe New |
2.9.0-2 |
|
machinepool-controller Updated |
1.38.17 |
|
mcc-haproxy |
0.23.0-73-g01aa9b3 |
|
metrics-server |
0.6.3-2 |
|
nginx Updated |
1.38.17 |
|
portforward-controller Updated |
1.38.17 |
|
proxy-controller Updated |
1.38.17 |
|
rbac-controller Updated |
1.38.17 |
|
registry |
2.8.1-5 |
|
release-controller Updated |
1.38.17 |
|
rhellicense-controller Updated |
1.38.17 |
|
scope-controller Updated |
1.38.17 |
|
storage-discovery Updated |
1.38.17 |
|
user-controller Updated |
1.38.17 |
|
OpenStack Updated |
openstack-cloud-controller-manager |
1.27.2-8 |
openstack-cluster-api-controller |
1.38.17 |
|
openstack-provider |
1.38.17 |
|
os-credentials-controller |
1.38.17 |
|
VMware vSphere |
mcc-keepalived Updated |
0.23.0-73-g01aa9b3 |
squid-proxy |
0.0.1-10-g24a0d69 |
|
vsphere-cluster-api-controller Updated |
1.38.17 |
|
vsphere-credentials-controller Updated |
1.38.17 |
|
vsphere-provider Updated |
1.38.17 |
|
vsphere-vm-template-controller Updated |
1.38.17 |
This section lists the artifacts of components included in the Container Cloud release 2.25.0.
Note
The components that are newly added, updated, deprecated, or removed
as compared to the previous release version, are marked
with a corresponding superscript,
for example, lcm-ansible Updated.
Artifact |
Component |
Path |
|---|---|---|
Binaries Updated |
ironic-python-agent.initramfs |
https://binary.mirantis.com/bm/bin/ironic/ipa/ubuntu/initramfs-yoga-focal-debug-20231012141354 |
ironic-python-agent.kernel |
https://binary.mirantis.com/bm/bin/ironic/ipa/ubuntu/kernel-yoga-focal-debug-20231012141354 |
|
provisioning_ansible |
https://binary.mirantis.com/bm/bin/ansible/provisioning_ansible-0.1.1-113-4f8b843.tgz |
|
Helm charts Updated |
baremetal-api |
https://binary.mirantis.com/core/helm/baremetal-api-1.38.17.tgz |
baremetal-operator |
https://binary.mirantis.com/core/helm/baremetal-operator-1.38.17.tgz |
|
baremetal-provider |
https://binary.mirantis.com/core/helm/baremetal-provider-1.38.17.tgz |
|
baremetal-public-api |
https://binary.mirantis.com/core/helm/baremetal-public-api-1.38.17.tgz |
|
kaas-ipam |
||
local-volume-provisioner |
https://binary.mirantis.com/core/helm/local-volume-provisioner-1.38.17.tgz |
|
metallb |
||
Docker images Updated |
ambasador |
mirantis.azurecr.io/core/external/nginx:1.38.17 |
baremetal-dnsmasq |
mirantis.azurecr.io/bm/baremetal-dnsmasq:base-alpine-20231013162346 |
|
baremetal-operator |
mirantis.azurecr.io/bm/baremetal-operator:base-alpine-20231101201729 |
|
bm-collective |
mirantis.azurecr.io/bm/bm-collective:base-alpine-20230929115341 |
|
cluster-api-provider-baremetal |
mirantis.azurecr.io/core/cluster-api-provider-baremetal:1.38.17 |
|
ironic |
mirantis.azurecr.io/openstack/ironic:yoga-jammy-20230914091512 |
|
ironic-inspector |
mirantis.azurecr.io/openstack/ironic-inspector:yoga-jammy-20230914091512 |
|
ironic-prometheus-exporter |
mirantis.azurecr.io/stacklight/ironic-prometheus-exporter:0.1-20230912104602 |
|
kaas-ipam |
mirantis.azurecr.io/bm/kaas-ipam:base-alpine-20230911165405 |
|
kubernetes-entrypoint |
mirantis.azurecr.io/openstack/extra/kubernetes-entrypoint:v1.0.1-27d64fb-20230421151539 |
|
mariadb |
mirantis.azurecr.io/general/mariadb:10.6.14-focal-20230912121635 |
|
mcc-keepalived |
mirantis.azurecr.io/lcm/mcc-keepalived:v0.23.0-73-g01aa9b3 |
|
metallb-controller |
mirantis.azurecr.io/bm/metallb/controller:v0.13.9-0d8e8043-amd64 |
|
metallb-speaker |
mirantis.azurecr.io/bm/metallb/speaker:v0.13.9-0d8e8043-amd64 |
|
syslog-ng |
mirantis.azurecr.io/bm/syslog-ng:base-apline-20230914091214 |
Artifact |
Component |
Paths |
|---|---|---|
Bootstrap tarball Updated |
bootstrap-darwin |
https://binary.mirantis.com/core/bin/bootstrap-darwin-1.38.17.tgz |
bootstrap-linux |
https://binary.mirantis.com/core/bin/bootstrap-linux-1.38.17.tgz |
|
Helm charts Updated |
admission-controller |
https://binary.mirantis.com/core/helm/admission-controller-1.38.17.tgz |
agent-controller |
https://binary.mirantis.com/core/helm/agent-controller-1.38.17.tgz |
|
ceph-kcc-controller |
https://binary.mirantis.com/core/helm/ceph-kcc-controller-1.38.17.tgz |
|
cert-manager |
https://binary.mirantis.com/core/helm/cert-manager-1.38.17.tgz |
|
cinder-csi-plugin New |
https://binary.mirantis.com/core/helm/cinder-csi-plugin-1.38.17.tgz |
|
client-certificate-controller |
https://binary.mirantis.com/core/helm/client-certificate-controller-1.38.17.tgz |
|
configuration-collector New |
https://binary.mirantis.com/core/helm/configuration-collector-1.38.17.tgz |
|
event-controller |
https://binary.mirantis.com/core/helm/event-controller-1.38.17.tgz |
|
iam-controller |
https://binary.mirantis.com/core/helm/iam-controller-1.38.17.tgz |
|
kaas-exporter |
https://binary.mirantis.com/core/helm/kaas-exporter-1.38.17.tgz |
|
kaas-public-api |
https://binary.mirantis.com/core/helm/kaas-public-api-1.38.17.tgz |
|
kaas-ui |
||
lcm-controller |
https://binary.mirantis.com/core/helm/lcm-controller-1.38.17.tgz |
|
license-controller |
https://binary.mirantis.com/core/helm/license-controller-1.38.17.tgz |
|
machinepool-controller |
https://binary.mirantis.com/core/helm/machinepool-controller-1.38.17.tgz |
|
mcc-cache |
||
mcc-cache-warmup |
https://binary.mirantis.com/core/helm/mcc-cache-warmup-1.38.17.tgz |
|
metrics-server |
https://binary.mirantis.com/core/helm/metrics-server-1.38.17.tgz |
|
openstack-cloud-controller-manager New |
https://binary.mirantis.com/core/helm/openstack-cloud-controller-manager-1.38.17.tgz |
|
openstack-provider |
https://binary.mirantis.com/core/helm/openstack-provider-1.38.17.tgz |
|
os-credentials-controller |
https://binary.mirantis.com/core/helm/os-credentials-controller-1.38.17.tgz |
|
portforward-controller |
https://binary.mirantis.com/core/helm/portforward-controller-1.38.17.tgz |
|
proxy-controller |
https://binary.mirantis.com/core/helm/proxy-controller-1.38.17.tgz |
|
rbac-controller |
https://binary.mirantis.com/core/helm/rbac-controller-1.38.17.tgz |
|
release-controller |
https://binary.mirantis.com/core/helm/release-controller-1.38.17.tgz |
|
rhellicense-controller |
https://binary.mirantis.com/core/helm/rhellicense-controller-1.38.17.tgz |
|
scope-controller |
https://binary.mirantis.com/core/helm/scope-controller-1.38.17.tgz |
|
squid-proxy |
https://binary.mirantis.com/core/helm/squid-proxy-1.38.17.tgz |
|
user-controller |
https://binary.mirantis.com/core/helm/user-controller-1.38.17.tgz |
|
vsphere-credentials-controller |
https://binary.mirantis.com/core/helm/vsphere-credentials-controller-1.38.17.tgz |
|
vsphere-provider |
https://binary.mirantis.com/core/helm/vsphere-provider-1.38.17.tgz |
|
vsphere-vm-template-controller |
https://binary.mirantis.com/core/helm/vsphere-vm-template-controller-1.38.17.tgz |
|
Docker images |
admission-controller Updated |
mirantis.azurecr.io/core/admission-controller:1.38.17 |
agent-controller Updated |
mirantis.azurecr.io/core/agent-controller:1.38.17 |
|
ceph-kcc-controller Updated |
mirantis.azurecr.io/core/ceph-kcc-controller:1.38.17 |
|
cert-manager-controller Updated |
mirantis.azurecr.io/core/external/cert-manager-controller:v1.11.0-2 |
|
cinder-csi-plugin New |
mirantis.azurecr.io/lcm/kubernetes/cinder-csi-plugin:v1.27.2-8 |
|
client-certificate-controller Updated |
mirantis.azurecr.io/core/client-certificate-controller:1.38.17 |
|
configuration-collector New |
mirantis.azurecr.io/core/configuration-collector:1.38.17 |
|
csi-attacher New |
mirantis.azurecr.io/lcm/k8scsi/csi-attacher:v4.2.0-2 |
|
csi-node-driver-registrar New |
mirantis.azurecr.io/lcm/k8scsi/csi-node-driver-registrar:v2.7.0-2 |
|
csi-provisioner New |
mirantis.azurecr.io/lcm/k8scsi/csi-provisioner:v3.4.1-2 |
|
csi-resizer New |
mirantis.azurecr.io/lcm/k8scsi/csi-resizer:v1.7.0-2 |
|
csi-snapshotter New |
mirantis.azurecr.io/lcm/k8scsi/csi-snapshotter:v6.2.1-mcc-1 |
|
event-controller Updated |
mirantis.azurecr.io/core/event-controller:1.38.17 |
|
frontend Updated |
mirantis.azurecr.io/core/frontend:1.38.17 |
|
iam-controller Updated |
mirantis.azurecr.io/core/iam-controller:1.38.17 |
|
kaas-exporter Updated |
mirantis.azurecr.io/core/kaas-exporter:1.38.17 |
|
kproxy Updated |
mirantis.azurecr.io/core/kproxy:1.38.17 |
|
lcm-controller Updated |
mirantis.azurecr.io/core/lcm-controller:1.38.17 |
|
license-controller Updated |
mirantis.azurecr.io/core/license-controller:1.38.17 |
|
livenessprobe New |
mirantis.azurecr.io/lcm/k8scsi/livenessprobe:v2.9.0-2 |
|
machinepool-controller Updated |
mirantis.azurecr.io/core/machinepool-controller:1.38.17 |
|
mcc-haproxy Updated |
mirantis.azurecr.io/lcm/mcc-haproxy:v0.23.0-73-g01aa9b3 |
|
mcc-keepalived Updated |
mirantis.azurecr.io/lcm/mcc-keepalived:v0.23.0-73-g01aa9b3 |
|
metrics-server |
mirantis.azurecr.io/lcm/metrics-server-amd64:v0.6.3-2 |
|
nginx Updated |
mirantis.azurecr.io/core/external/nginx:1.38.17 |
|
openstack-cloud-controller-manager Updated |
mirantis.azurecr.io/lcm/kubernetes/openstack-cloud-controller-manager:v1.27.2-8 |
|
openstack-cluster-api-controller Updated |
mirantis.azurecr.io/core/openstack-cluster-api-controller:1.38.17 |
|
os-credentials-controller Updated |
mirantis.azurecr.io/core/os-credentials-controller:1.38.17 |
|
portforward-controller Updated |
mirantis.azurecr.io/core/portforward-controller:1.38.17 |
|
proxy-controller Updated |
mirantis.azurecr.io/core/proxy-controller:1.38.17 |
|
rbac-controller Updated |
mirantis.azurecr.io/core/rbac-controller:1.38.17 |
|
registry Updated |
mirantis.azurecr.io/lcm/registry:v2.8.1-6 |
|
release-controller Updated |
mirantis.azurecr.io/core/release-controller:1.38.17 |
|
rhellicense-controller Updated |
mirantis.azurecr.io/core/rhellicense-controller:1.38.17 |
|
scope-controller Updated |
mirantis.azurecr.io/core/scope-controller:1.38.17 |
|
squid-proxy |
mirantis.azurecr.io/lcm/squid-proxy:0.0.1-10-g24a0d69 |
|
user-controller Updated |
mirantis.azurecr.io/core/user-controller:1.38.17 |
|
vsphere-cluster-api-controller Updated |
mirantis.azurecr.io/core/vsphere-cluster-api-controller:1.38.17 |
|
vsphere-credentials-controller Updated |
mirantis.azurecr.io/core/vsphere-credentials-controller:1.38.17 |
|
vsphere-vm-template-controller Updated |
mirantis.azurecr.io/core/vsphere-vm-template-controller:1.38.17 |
Artifact |
Component |
Path |
|---|---|---|
Binaries |
hash-generate-darwin |
http://binary.mirantis.com/iam/bin/hash-generate-0.0.1-268-3cf7f17-darwin |
hash-generate-linux |
http://binary.mirantis.com/iam/bin/hash-generate-0.0.1-268-3cf7f17-linux |
|
Helm charts Updated |
iam |
|
Docker images |
keycloak |
mirantis.azurecr.io/iam/keycloak:0.6.0 |
kubernetes-entrypoint |
mirantis.azurecr.io/openstack/extra/kubernetes-entrypoint:v1.0.1-27d64fb-20230421151539 |
|
mariadb Updated |
mirantis.azurecr.io/general/mariadb:10.6.14-focal-20230730124341 |
The table below includes the total numbers of addressed unique and common CVEs by product component since the 2.24.5 patch release. The common CVEs are issues addressed across several images.
Container Cloud component |
CVE type |
Critical |
High |
Total |
|---|---|---|---|---|
Kaas core |
Unique |
7 |
39 |
46 |
Common |
54 |
305 |
359 |
|
Ceph |
Unique |
0 |
1 |
1 |
Common |
0 |
1 |
1 |
|
StackLight |
Unique |
0 |
5 |
5 |
Common |
0 |
13 |
13 |
Mirantis Security Portal
For the detailed list of fixed and existing CVEs across the Mirantis Container Cloud and MOSK products, refer to Mirantis Security Portal.
MOSK CVEs
For the number of fixed CVEs in the MOSK-related components including OpenStack and Tungsten Fabric, refer to MOSK 23.3: Security notes.
This section describes the specific actions you as a cloud operator need to complete before or after your Container Cloud cluster update to the Cluster releases 17.0.0, 16.0.0, or 14.1.0.
Consider this information as a supplement to the generic update procedures published in Operations Guide: Automatic upgrade of a management cluster and Update a managed cluster.
The Cluster release series 14.x and 15.x are the last ones where Ubuntu 18.04 is supported on existing clusters. A Cluster release update to 17.0.0 or 16.0.0 is impossible for a cluster running on Ubuntu 18.04.
Therefore, if your cluster update is blocked, make sure that the operating system on all cluster nodes is upgraded to Ubuntu 20.04 as described in Operations Guide: Upgrade an operating system distribution.
If your cluster has custom etcd storage quota set as described in
Increase storage quota for etcd, before the management cluster upgrade to 2.25.0,
configure LCMMachine resources:
Manually set the
ucp_etcd_storage_quotaparameter inLCMMachineresources of the cluster controller nodes:spec: stateItemsOverwrites: deploy: ucp_etcd_storage_quota: "<custom_etcd_storage_quota_value>"
If the
stateItemsOverwrites.deploysection is already set, appenducp_etcd_storage_quotato the existing parameters.To obtain the list of the cluster
LCMMachineresources:kubectl -n <cluster_namespace> get lcmmachine
To patch the cluster
LCMMachineresources of theTypecontrol:kubectl -n <cluster_namespace> edit lcmmachine <control_lcmmachine_name>
After the management cluster is upgraded to 2.25.0, update your managed cluster to the Cluster release 17.0.0 or 16.0.0.
Manually remove the
ucp_etcd_storage_quotaparameter from thestateItemsOverwrites.deploysection.
The Cluster release 16.x and 17.x series are shipped with MKE 3.7.x. To ensure cluster operability after the update, verify that the TCP port 12392 is allowed in your network for the Container Cloud management cluster nodes.
For the full list of the required ports for MKE, refer to MKE Documentation: Open ports to incoming traffic.
Container Cloud uses the device by-id identifier as the default method
of addressing the underlying devices of Ceph OSDs. This is the only persistent
device identifier for a Ceph cluster that remains stable after cluster
upgrade or any other cluster maintenance.
Therefore, if your existing Ceph clusters are still utilizing the device names
or device by-path symlinks, migrate them to the by-id format as
described in Migrate Ceph cluster to address storage devices using by-id.
If your managed cluster has multiple L2 segments using DHCP relays on the
border switches, after the related management cluster automatically upgrades
to Container Cloud 2.25.0, manually point the DHCP relays on your network
infrastructure to the new IP address of the dhcp-lb service of the
Container Cloud managed cluster in order to successfully provision new nodes
or reprovision existing ones.
To obtain the new IP address:
kubectl -n kaas get service dhcp-lb
This change is required after the product has included the resolution of
the issue related to the incorrect handling of DHCP egress traffic. The fix
involves reconfiguring the external traffic policy for the dhcp-lb
Kubernetes Service. For details about the issue, refer to the
Kubernetes upstream bug.
The Container Cloud patch release 2.24.5, which is based on the 2.24.2 major release, provides the following updates:
Support for the patch Cluster releases 14.0.4 and 15.0.4 that represents Mirantis OpenStack for Kubernetes (MOSK) patch release 23.2.3.
Security fixes for CVEs of Critical and High severity
This patch release also supports the latest major Cluster releases 14.0.1 and 15.0.1. And it does not support greenfield deployments based on deprecated Cluster releases 15.0.3, 15.0.2, 14.0.3, 14.0.2 along with 12.7.x and 11.7.x series. Use the latest available Cluster releases for new deployments instead.
For main deliverables of the parent Container Cloud releases of 2.24.5, refer to 2.24.0 and 2.24.1.
This section lists the components artifacts of the Container Cloud patch release 2.24.5. For artifacts of the Cluster releases introduced in 2.24.5, see patch Cluster releases 15.0.4 and 14.0.4.
Note
The components that are newly added, updated, deprecated, or removed
as compared to the previous release version, are marked
with a corresponding superscript,
for example, lcm-ansible Updated.
Artifact |
Component |
Path |
|---|---|---|
Binaries |
ironic-python-agent.initramfs |
https://binary.mirantis.com/bm/bin/ironic/ipa/ubuntu/initramfs-yoga-focal-debug-20230606121129 |
ironic-python-agent.kernel |
https://binary.mirantis.com/bm/bin/ironic/ipa/ubuntu/kernel-yoga-focal-debug-20230606121129 |
|
provisioning_ansible |
https://binary.mirantis.com/bm/bin/ansible/provisioning_ansible-0.1.1-104-6e2e82c.tgz |
|
Helm charts Updated |
baremetal-api |
https://binary.mirantis.com/core/helm/baremetal-api-1.37.25.tgz |
baremetal-operator |
https://binary.mirantis.com/core/helm/baremetal-operator-1.37.25.tgz |
|
baremetal-provider |
https://binary.mirantis.com/core/helm/baremetal-provider-1.37.25.tgz |
|
baremetal-public-api |
https://binary.mirantis.com/core/helm/baremetal-public-api-1.37.25.tgz |
|
kaas-ipam |
||
local-volume-provisioner |
https://binary.mirantis.com/core/helm/local-volume-provisioner-1.37.25.tgz |
|
metallb |
||
Docker images |
ambasador Updated |
mirantis.azurecr.io/core/external/nginx:1.37.25 |
baremetal-dnsmasq |
mirantis.azurecr.io/bm/baremetal-dnsmasq:base-alpine-20230810152159 |
|
baremetal-operator |
mirantis.azurecr.io/bm/baremetal-operator:base-alpine-20230803175048 |
|
bm-collective |
mirantis.azurecr.io/bm/bm-collective:base-alpine-20230829084517 |
|
cluster-api-provider-baremetal Updated |
mirantis.azurecr.io/core/cluster-api-provider-baremetal:1.37.25 |
|
ironic |
mirantis.azurecr.io/openstack/ironic:yoga-focal-20230810113432 |
|
ironic-inspector |
mirantis.azurecr.io/openstack/ironic-inspector:yoga-focal-20230810113432 |
|
ironic-prometheus-exporter Updated |
mirantis.azurecr.io/stacklight/ironic-prometheus-exporter:0.1-20230912104602 |
|
kaas-ipam |
mirantis.azurecr.io/bm/kaas-ipam:base-alpine-20230810155639 |
|
kubernetes-entrypoint |
mirantis.azurecr.io/openstack/extra/kubernetes-entrypoint:v1.0.1-5359171-20230810125608 |
|
mariadb |
mirantis.azurecr.io/general/mariadb:10.6.14-focal-20230730124341 |
|
mcc-keepalived |
mirantis.azurecr.io/lcm/mcc-keepalived:v0.22.0-75-g08569a8 |
|
metallb-controller |
mirantis.azurecr.io/bm/metallb/controller:v0.13.9-53df4a9c-amd64 |
|
metallb-speaker |
mirantis.azurecr.io/bm/metallb/speaker:v0.13.9-53df4a9c-amd64 |
|
syslog-ng |
mirantis.azurecr.io/bm/syslog-ng:base-apline-20230814110635 |
Artifact |
Component |
Path |
|---|---|---|
Bootstrap tarball Updated |
bootstrap-darwin |
https://binary.mirantis.com/core/bin/bootstrap-darwin-1.37.25.tgz |
bootstrap-linux |
https://binary.mirantis.com/core/bin/bootstrap-linux-1.37.25.tgz |
|
Helm charts Updated |
admission-controller |
https://binary.mirantis.com/core/helm/admission-controller-1.37.25.tgz |
agent-controller |
https://binary.mirantis.com/core/helm/agent-controller-1.37.25.tgz |
|
ceph-kcc-controller |
https://binary.mirantis.com/core/helm/ceph-kcc-controller-1.37.25.tgz |
|
cert-manager |
https://binary.mirantis.com/core/helm/cert-manager-1.37.25.tgz |
|
client-certificate-controller |
https://binary.mirantis.com/core/helm/client-certificate-controller-1.37.25.tgz |
|
event-controller |
https://binary.mirantis.com/core/helm/event-controller-1.37.25.tgz |
|
iam-controller |
https://binary.mirantis.com/core/helm/iam-controller-1.37.25.tgz |
|
kaas-exporter |
https://binary.mirantis.com/core/helm/kaas-exporter-1.37.25.tgz |
|
kaas-public-api |
https://binary.mirantis.com/core/helm/kaas-public-api-1.37.25.tgz |
|
kaas-ui |
||
lcm-controller |
https://binary.mirantis.com/core/helm/lcm-controller-1.37.25.tgz |
|
license-controller |
https://binary.mirantis.com/core/helm/license-controller-1.37.25.tgz |
|
machinepool-controller |
https://binary.mirantis.com/core/helm/machinepool-controller-1.37.25.tgz |
|
mcc-cache |
||
mcc-cache-warmup |
https://binary.mirantis.com/core/helm/mcc-cache-warmup-1.37.25.tgz |
|
metrics-server |
https://binary.mirantis.com/core/helm/metrics-server-1.37.25.tgz |
|
openstack-provider |
https://binary.mirantis.com/core/helm/openstack-provider-1.37.25.tgz |
|
os-credentials-controller |
https://binary.mirantis.com/core/helm/os-credentials-controller-1.37.25.tgz |
|
portforward-controller |
https://binary.mirantis.com/core/helm/portforward-controller-1.37.25.tgz |
|
proxy-controller |
https://binary.mirantis.com/core/helm/proxy-controller-1.37.25.tgz |
|
rbac-controller |
https://binary.mirantis.com/core/helm/rbac-controller-1.37.25.tgz |
|
release-controller |
https://binary.mirantis.com/core/helm/release-controller-1.37.25.tgz |
|
rhellicense-controller |
https://binary.mirantis.com/core/helm/rhellicense-controller-1.37.25.tgz |
|
scope-controller |
https://binary.mirantis.com/core/helm/scope-controller-1.37.25.tgz |
|
squid-proxy |
https://binary.mirantis.com/core/helm/squid-proxy-1.37.25.tgz |
|
user-controller |
https://binary.mirantis.com/core/helm/user-controller-1.37.25.tgz |
|
vsphere-credentials-controller |
https://binary.mirantis.com/core/helm/vsphere-credentials-controller-1.37.25.tgz |
|
vsphere-provider |
https://binary.mirantis.com/core/helm/vsphere-provider-1.37.25.tgz |
|
vsphere-vm-template-controller |
https://binary.mirantis.com/core/helm/vsphere-vm-template-controller-1.37.25.tgz |
|
Docker images |
admission-controller Updated |
mirantis.azurecr.io/core/admission-controller:1.37.25 |
agent-controller Updated |
mirantis.azurecr.io/core/agent-controller:1.37.25 |
|
ceph-kcc-controller Updated |
mirantis.azurecr.io/core/ceph-kcc-controller:1.37.25 |
|
cert-manager-controller |
mirantis.azurecr.io/core/external/cert-manager-controller:v1.11.0-2 |
|
client-certificate-controller Updated |
mirantis.azurecr.io/core/client-certificate-controller:1.37.25 |
|
event-controller Updated |
mirantis.azurecr.io/core/event-controller:1.37.25 |
|
frontend Updated |
mirantis.azurecr.io/core/frontend:1.37.25 |
|
iam-controller Updated |
mirantis.azurecr.io/core/iam-controller:1.37.25 |
|
kaas-exporter Updated |
mirantis.azurecr.io/core/kaas-exporter:1.37.25 |
|
kproxy Updated |
mirantis.azurecr.io/core/kproxy:1.37.25 |
|
lcm-controller Updated |
mirantis.azurecr.io/core/lcm-controller:1.37.25 |
|
license-controller Updated |
mirantis.azurecr.io/core/license-controller:1.37.25 |
|
machinepool-controller Updated |
mirantis.azurecr.io/core/machinepool-controller:1.37.25 |
|
mcc-haproxy |
mirantis.azurecr.io/lcm/mcc-haproxy:v0.22.0-75-g08569a8 |
|
mcc-keepalived |
mirantis.azurecr.io/lcm/mcc-keepalived:v0.22.0-75-g08569a8 |
|
metrics-server |
mirantis.azurecr.io/lcm/metrics-server-amd64:v0.6.3-2 |
|
nginx Updated |
mirantis.azurecr.io/core/external/nginx:1.37.25 |
|
openstack-cloud-controller-manager |
mirantis.azurecr.io/lcm/kubernetes/openstack-cloud-controller-manager-amd64:v1.24.5-13 |
|
openstack-cluster-api-controller Updated |
mirantis.azurecr.io/core/openstack-cluster-api-controller:1.37.25 |
|
os-credentials-controller Updated |
mirantis.azurecr.io/core/os-credentials-controller:1.37.25 |
|
portforward-controller Updated |
mirantis.azurecr.io/core/portforward-controller:1.37.25 |
|
proxy-controller Updated |
mirantis.azurecr.io/core/proxy-controller:1.37.25 |
|
rbac-controller Updated |
mirantis.azurecr.io/core/rbac-controller:1.37.25 |
|
registry Updated |
mirantis.azurecr.io/lcm/registry:v2.8.1-5 |
|
release-controller Updated |
mirantis.azurecr.io/core/release-controller:1.37.25 |
|
rhellicense-controller Updated |
mirantis.azurecr.io/core/rhellicense-controller:1.37.25 |
|
scope-controller Updated |
mirantis.azurecr.io/core/scope-controller:1.37.25 |
|
squid-proxy |
mirantis.azurecr.io/lcm/squid-proxy:0.0.1-10-g24a0d69 |
|
user-controller Updated |
mirantis.azurecr.io/core/user-controller:1.37.25 |
|
vsphere-cluster-api-controller Updated |
mirantis.azurecr.io/core/vsphere-cluster-api-controller:1.37.25 |
|
vsphere-credentials-controller Updated |
mirantis.azurecr.io/core/vsphere-credentials-controller:1.37.25 |
|
vsphere-vm-template-controller Updated |
mirantis.azurecr.io/core/vsphere-vm-template-controller:1.37.25 |
Artifact |
Component |
Path |
|---|---|---|
Binaries |
hash-generate-darwin |
http://binary.mirantis.com/iam/bin/hash-generate-0.0.1-268-3cf7f17-darwin |
hash-generate-linux |
http://binary.mirantis.com/iam/bin/hash-generate-0.0.1-268-3cf7f17-linux |
|
Helm charts |
iam |
|
Docker images |
keycloak |
mirantis.azurecr.io/iam/keycloak:0.6.0 |
kubernetes-entrypoint |
mirantis.azurecr.io/openstack/extra/kubernetes-entrypoint:v1.0.1-27d64fb-20230421151539 |
|
mariadb |
mirantis.azurecr.io/general/mariadb:10.6.12-focal-20230423170220 |
In total, since Container Cloud 2.24.4, in 2.24.5, 21 Common Vulnerabilities and Exposures (CVE) have been fixed: 18 of critical and 3 of high severity.
The summary table contains the total number of unique CVEs along with the total number of issues fixed across the images.
The full list of the CVEs present in the current Container Cloud release is available at the Mirantis Security Portal.
Severity |
Critical |
High |
Total |
|---|---|---|---|
Unique CVEs |
1 |
1 |
2 |
Total issues across images |
18 |
3 |
21 |
Image |
Component name |
CVE |
|---|---|---|
core/external/nginx |
libwebp |
CVE-2023-4863 (High) |
core/frontend |
libwebp |
CVE-2023-4863 (High) |
lcm/kubernetes/openstack-cloud-controller-manager-amd64 |
busybox |
CVE-2022-48174 (Critical) |
busybox-binsh |
CVE-2022-48174 (Critical) |
|
ssl_client |
CVE-2022-48174 (Critical) |
|
lcm/registry |
busybox |
CVE-2022-48174 (Critical) |
busybox-binsh |
CVE-2022-48174 (Critical) |
|
ssl_client |
CVE-2022-48174 (Critical) |
|
scale/curl-jq |
busybox |
CVE-2022-48174 (Critical) |
busybox-binsh |
CVE-2022-48174 (Critical) |
|
ssl_client |
CVE-2022-48174 (Critical) |
|
stacklight/alertmanager-webhook-servicenow |
busybox |
CVE-2022-48174 (Critical) |
busybox-binsh |
CVE-2022-48174 (Critical) |
|
ssl_client |
CVE-2022-48174 (Critical) |
|
stacklight/grafana-image-renderer |
libwebp |
CVE-2023-4863 (High) |
stacklight/ironic-prometheus-exporter |
busybox |
CVE-2022-48174 (Critical) |
busybox-binsh |
CVE-2022-48174 (Critical) |
|
ssl_client |
CVE-2022-48174 (Critical) |
|
stacklight/sf-reporter |
busybox |
CVE-2022-48174 (Critical) |
busybox-binsh |
CVE-2022-48174 (Critical) |
|
ssl_client |
CVE-2022-48174 (Critical) |
The Container Cloud patch release 2.24.4, which is based on the 2.24.2 major release, provides the following updates:
Support for the patch Cluster releases 14.0.3 and 15.0.3 that represents Mirantis OpenStack for Kubernetes (MOSK) patch release 23.2.2.
Support for the multi-rack topology on bare metal managed clusters
Support for configuration of the etcd storage quota
Security fixes for CVEs of Critical and High severity
This patch release also supports the latest major Cluster releases 14.0.1 and 15.0.1. And it does not support greenfield deployments based on deprecated Cluster releases 15.0.2, 14.0.2, along with 12.7.x and 11.7.x series. Use the latest available Cluster releases for new deployments instead.
For main deliverables of the parent Container Cloud releases of 2.24.4, refer to 2.24.0 and 2.24.1.
This section outlines new features and enhancements introduced in the Container Cloud patch release 2.24.4.
Added the capability to configure storage quota, which is 2 GB by default. You may need to increase the default etcd storage quota if etcd runs out of space and there is no other way to clean up the storage on your management or managed cluster.
TechPreview
Added support for the multi-rack topology on bare metal managed clusters.
Implementation of the multi-rack topology implies the use of Rack and
MultiRackCluster objects that support configuration of BGP announcement
of the cluster API load balancer address.
You can now create a managed cluster where cluster nodes including Kubernetes masters are distributed across multiple racks without L2 layer extension between them, and use BGP for announcement of the cluster API load balancer address and external addresses of Kubernetes load-balanced services.
Learn more
This section lists the components artifacts of the Container Cloud patch release 2.24.4. For artifacts of the Cluster releases introduced in 2.24.4, see patch Cluster releases 15.0.3 and 14.0.3.
Note
The components that are newly added, updated, deprecated, or removed
as compared to the previous release version, are marked
with a corresponding superscript,
for example, lcm-ansible Updated.
Artifact |
Component |
Path |
|---|---|---|
Binaries |
ironic-python-agent.initramfs |
https://binary.mirantis.com/bm/bin/ironic/ipa/ubuntu/initramfs-yoga-focal-debug-20230606121129 |
ironic-python-agent.kernel |
https://binary.mirantis.com/bm/bin/ironic/ipa/ubuntu/kernel-yoga-focal-debug-20230606121129 |
|
provisioning_ansible |
https://binary.mirantis.com/bm/bin/ansible/provisioning_ansible-0.1.1-104-6e2e82c.tgz |
|
Helm charts Updated |
baremetal-api |
https://binary.mirantis.com/core/helm/baremetal-api-1.37.24.tgz |
baremetal-operator |
https://binary.mirantis.com/core/helm/baremetal-operator-1.37.24.tgz |
|
baremetal-provider |
https://binary.mirantis.com/core/helm/baremetal-provider-1.37.24.tgz |
|
baremetal-public-api |
https://binary.mirantis.com/core/helm/baremetal-public-api-1.37.24.tgz |
|
kaas-ipam |
||
local-volume-provisioner |
https://binary.mirantis.com/core/helm/local-volume-provisioner-1.37.24.tgz |
|
metallb |
||
Docker images |
ambasador Updated |
mirantis.azurecr.io/core/external/nginx:1.37.24 |
baremetal-dnsmasq |
mirantis.azurecr.io/bm/baremetal-dnsmasq:base-alpine-20230810152159 |
|
baremetal-operator |
mirantis.azurecr.io/bm/baremetal-operator:base-alpine-20230803175048 |
|
bm-collective Updated |
mirantis.azurecr.io/bm/bm-collective:base-alpine-20230829084517 |
|
cluster-api-provider-baremetal Updated |
mirantis.azurecr.io/core/cluster-api-provider-baremetal:1.37.24 |
|
ironic |
mirantis.azurecr.io/openstack/ironic:yoga-focal-20230810113432 |
|
ironic-inspector |
mirantis.azurecr.io/openstack/ironic-inspector:yoga-focal-20230810113432 |
|
ironic-prometheus-exporter |
mirantis.azurecr.io/stacklight/ironic-prometheus-exporter:0.1-20230531081117 |
|
kaas-ipam |
mirantis.azurecr.io/bm/kaas-ipam:base-alpine-20230810155639 |
|
kubernetes-entrypoint |
mirantis.azurecr.io/openstack/extra/kubernetes-entrypoint:v1.0.1-5359171-20230810125608 |
|
mariadb |
mirantis.azurecr.io/general/mariadb:10.6.14-focal-20230730124341 |
|
mcc-keepalived Updated |
mirantis.azurecr.io/lcm/mcc-keepalived:v0.22.0-66-ga855169 |
|
metallb-controller |
mirantis.azurecr.io/bm/metallb/controller:v0.13.9-53df4a9c-amd64 |
|
metallb-speaker |
mirantis.azurecr.io/bm/metallb/speaker:v0.13.9-53df4a9c-amd64 |
|
syslog-ng |
mirantis.azurecr.io/bm/syslog-ng:base-apline-20230814110635 |
Artifact |
Component |
Paths |
|---|---|---|
Bootstrap tarball Updated |
bootstrap-darwin |
https://binary.mirantis.com//core/binbootstrap-darwin-1.37.24.tgz |
bootstrap-linux |
https://binary.mirantis.com//core/binbootstrap-linux-1.37.24.tgz |
|
Helm charts Updated |
admission-controller |
https://binary.mirantis.com/core/helm/admission-controller-1.37.24.tgz |
agent-controller |
https://binary.mirantis.com/core/helm/agent-controller-1.37.24.tgz |
|
ceph-kcc-controller |
https://binary.mirantis.com/core/helm/ceph-kcc-controller-1.37.24.tgz |
|
cert-manager |
https://binary.mirantis.com/core/helm/cert-manager-1.37.24.tgz |
|
client-certificate-controller |
https://binary.mirantis.com/core/helm/client-certificate-controller-1.37.24.tgz |
|
event-controller |
https://binary.mirantis.com/core/helm/event-controller-1.37.24.tgz |
|
iam-controller |
https://binary.mirantis.com/core/helm/iam-controller-1.37.24.tgz |
|
kaas-exporter |
https://binary.mirantis.com/core/helm/kaas-exporter-1.37.24.tgz |
|
kaas-public-api |
https://binary.mirantis.com/core/helm/kaas-public-api-1.37.24.tgz |
|
kaas-ui |
||
lcm-controller |
https://binary.mirantis.com/core/helm/lcm-controller-1.37.24.tgz |
|
license-controller |
https://binary.mirantis.com/core/helm/license-controller-1.37.24.tgz |
|
machinepool-controller |
https://binary.mirantis.com/core/helm/machinepool-controller-1.37.24.tgz |
|
mcc-cache |
||
mcc-cache-warmup |
https://binary.mirantis.com/core/helm/mcc-cache-warmup-1.37.24.tgz |
|
metrics-server |
https://binary.mirantis.com/core/helm/metrics-server-1.37.24.tgz |
|
openstack-provider |
https://binary.mirantis.com/core/helm/openstack-provider-1.37.24.tgz |
|
os-credentials-controller |
https://binary.mirantis.com/core/helm/os-credentials-controller-1.37.24.tgz |
|
portforward-controller |
https://binary.mirantis.com/core/helm/portforward-controller-1.37.24.tgz |
|
proxy-controller |
https://binary.mirantis.com/core/helm/proxy-controller-1.37.24.tgz |
|
rbac-controller |
https://binary.mirantis.com/core/helm/rbac-controller-1.37.24.tgz |
|
release-controller |
https://binary.mirantis.com/core/helm/release-controller-1.37.24.tgz |
|
rhellicense-controller |
https://binary.mirantis.com/core/helm/rhellicense-controller-1.37.24.tgz |
|
scope-controller |
https://binary.mirantis.com/core/helm/scope-controller-1.37.24.tgz |
|
squid-proxy |
https://binary.mirantis.com/core/helm/squid-proxy-1.37.24.tgz |
|
user-controller |
https://binary.mirantis.com/core/helm/user-controller-1.37.24.tgz |
|
vsphere-credentials-controller |
https://binary.mirantis.com/core/helm/vsphere-credentials-controller-1.37.24.tgz |
|
vsphere-provider |
https://binary.mirantis.com/core/helm/vsphere-provider-1.37.24.tgz |
|
vsphere-vm-template-controller |
https://binary.mirantis.com/core/helm/vsphere-vm-template-controller-1.37.24.tgz |
|
Docker images |
admission-controller Updated |
mirantis.azurecr.io/core/admission-controller:1.37.24 |
agent-controller Updated |
mirantis.azurecr.io/core/agent-controller:1.37.24 |
|
ceph-kcc-controller Updated |
mirantis.azurecr.io/core/ceph-kcc-controller:1.37.24 |
|
cert-manager-controller |
mirantis.azurecr.io/core/external/cert-manager-controller:v1.11.0-2 |
|
client-certificate-controller Updated |
mirantis.azurecr.io/core/client-certificate-controller:1.37.24 |
|
event-controller Updated |
mirantis.azurecr.io/core/event-controller:1.37.24 |
|
frontend Updated |
mirantis.azurecr.io/core/frontend:1.37.24 |
|
iam-controller Updated |
mirantis.azurecr.io/core/iam-controller:1.37.24 |
|
kaas-exporter Updated |
mirantis.azurecr.io/core/kaas-exporter:1.37.24 |
|
kproxy Updated |
mirantis.azurecr.io/core/kproxy:1.37.24 |
|
lcm-controller Updated |
mirantis.azurecr.io/core/lcm-controller:1.37.24 |
|
license-controller Updated |
mirantis.azurecr.io/core/license-controller:1.37.24 |
|
machinepool-controller Updated |
mirantis.azurecr.io/core/machinepool-controller:1.37.24 |
|
mcc-haproxy Updated |
mirantis.azurecr.io/lcm/mcc-haproxy:v0.22.0-66-ga855169 |
|
mcc-keepalived Updated |
mirantis.azurecr.io/lcm/mcc-keepalived:v0.22.0-66-ga855169 |
|
metrics-server |
mirantis.azurecr.io/lcm/metrics-server-amd64:v0.6.3-2 |
|
nginx Updated |
mirantis.azurecr.io/core/external/nginx:1.37.24 |
|
openstack-cloud-controller-manager |
mirantis.azurecr.io/lcm/kubernetes/openstack-cloud-controller-manager-amd64:v1.24.5-10-g93314b86 |
|
openstack-cluster-api-controller Updated |
mirantis.azurecr.io/core/openstack-cluster-api-controller:1.37.24 |
|
os-credentials-controller Updated |
mirantis.azurecr.io/core/os-credentials-controller:1.37.24 |
|
portforward-controller Updated |
mirantis.azurecr.io/core/portforward-controller:1.37.24 |
|
proxy-controller Updated |
mirantis.azurecr.io/core/proxy-controller:1.37.24 |
|
rbac-controller Updated |
mirantis.azurecr.io/core/rbac-controller:1.37.24 |
|
registry |
mirantis.azurecr.io/lcm/registry:v2.8.1-4 |
|
release-controller Updated |
mirantis.azurecr.io/core/release-controller:1.37.24 |
|
rhellicense-controller Updated |
mirantis.azurecr.io/core/rhellicense-controller:1.37.24 |
|
scope-controller Updated |
mirantis.azurecr.io/core/scope-controller:1.37.24 |
|
squid-proxy |
mirantis.azurecr.io/lcm/squid-proxy:0.0.1-10-g24a0d69 |
|
user-controller Updated |
mirantis.azurecr.io/core/user-controller:1.37.24 |
|
vsphere-cluster-api-controller Updated |
mirantis.azurecr.io/core/vsphere-cluster-api-controller:1.37.24 |
|
vsphere-credentials-controller Updated |
mirantis.azurecr.io/core/vsphere-credentials-controller:1.37.24 |
|
vsphere-vm-template-controller Updated |
mirantis.azurecr.io/core/vsphere-vm-template-controller:1.37.24 |
Artifact |
Component |
Path |
|---|---|---|
Binaries |
hash-generate-darwin |
http://binary.mirantis.com/iam/bin/hash-generate-0.0.1-268-3cf7f17-darwin |
hash-generate-linux |
http://binary.mirantis.com/iam/bin/hash-generate-0.0.1-268-3cf7f17-linux |
|
Helm charts |
iam |
|
Docker images |
keycloak |
mirantis.azurecr.io/iam/keycloak:0.6.0 |
kubernetes-entrypoint |
mirantis.azurecr.io/openstack/extra/kubernetes-entrypoint:v1.0.1-27d64fb-20230421151539 |
|
mariadb |
mirantis.azurecr.io/general/mariadb:10.6.12-focal-20230423170220 |
In total, since Container Cloud 2.24.3, in 2.24.4, 18 Common Vulnerabilities and Exposures (CVE) have been fixed: 3 of critical and 15 of high severity.
The summary table contains the total number of unique CVEs along with the total number of issues fixed across the images.
The full list of the CVEs present in the current Container Cloud release is available at the Mirantis Security Portal.
Severity |
Critical |
High |
Total |
|---|---|---|---|
Unique CVEs |
1 |
10 |
11 |
Total issues across images |
3 |
15 |
18 |
Image |
Component name |
CVE |
|---|---|---|
iam/keycloak-gatekeeper |
golang.org/x/crypto |
CVE-2021-43565 (High) |
CVE-2022-27191 (High) |
||
CVE-2020-29652 (High) |
||
golang.org/x/net |
CVE-2022-27664 (High) |
|
CVE-2021-33194 (High) |
||
golang.org/x/text |
CVE-2021-38561 (High) |
|
CVE-2022-32149 (High) |
||
github.com/prometheus/client_golang |
CVE-2022-21698 (High) |
|
scale/psql-client |
busybox |
CVE-2022-48174 (Critical) |
busybox-binsh |
CVE-2022-48174 (Critical) |
|
ssl_client |
CVE-2022-48174 (Critical) |
|
libpq |
CVE-2023-39417 (High) |
|
postgresql13-client |
CVE-2023-39417 (High) |
|
stacklight/alerta-web |
grpcio |
CVE-2023-33953 (High) |
libpq |
CVE-2023-39417 (High) |
|
postgresql15-client |
CVE-2023-39417 (High) |
|
stacklight/pgbouncer |
libpq |
CVE-2023-39417 (High) |
postgresql-client |
CVE-2023-39417 (High) |
The following issues have been addressed in the Container Cloud patch release 2.24.4 along with the patch Cluster releases 14.0.3 and 15.0.3.
[34200][Ceph] Fixed the watch command missing in the
rook-ceph-toolsPod.[34836][Ceph] Fixed
ceph-disk-daemonspawning a lot of zombie processes.
The Container Cloud patch release 2.24.3, which is based on the 2.24.2 major release, provides the following updates:
Support for MKE 3.6.6. For details, see MKE documentation: MKE release notes.
Support for enablement of Kubernetes auditing and profiling options using the Container Cloud
Clusterobject on managed clusters. For details, see Configure Kubernetes auditing and profiling.Updated
docker-ee-clito 20.10.18 for MCR 20.10.17 to fix the following CVEs: CVE-2023-28840, CVE-2023-28642, CVE-2022-41723.Security fixes for CVEs of High severity.
Support for the patch Cluster releases 14.0.2 and 15.0.2 that represents Mirantis OpenStack for Kubernetes (MOSK) patch release. 23.2.1.
This patch release also supports the latest major Cluster releases 14.0.1 and 15.0.1. And it does not support greenfield deployments based on deprecated Cluster release 14.0.0 along with 12.7.x and 11.7.x series. Use the latest available Cluster releases instead.
For main deliverables of the parent Container Cloud releases of 2.24.3, refer to 2.24.0 and 2.24.1.
This section lists the components artifacts of the Container Cloud patch release 2.24.3. For artifacts of the Cluster releases introduced in 2.24.3, see Cluster releases 15.0.2 and 14.0.2.
Note
The components that are newly added, updated, deprecated, or removed
as compared to the previous release version, are marked
with a corresponding superscript,
for example, lcm-ansible Updated.
Artifact |
Component |
Path |
|---|---|---|
Binaries |
ironic-python-agent.initramfs |
https://binary.mirantis.com/bm/bin/ironic/ipa/ubuntu/initramfs-yoga-focal-debug-20230606121129 |
ironic-python-agent.kernel |
https://binary.mirantis.com/bm/bin/ironic/ipa/ubuntu/kernel-yoga-focal-debug-20230606121129 |
|
provisioning_ansible |
https://binary.mirantis.com/bm/bin/ansible/provisioning_ansible-0.1.1-104-6e2e82c.tgz |
|
Helm charts Updated |
baremetal-api |
https://binary.mirantis.com/core/helm/baremetal-api-1.37.23.tgz |
baremetal-operator |
https://binary.mirantis.com/core/helm/baremetal-operator-1.37.23.tgz |
|
baremetal-provider |
https://binary.mirantis.com/core/helm/baremetal-provider-1.37.23.tgz |
|
baremetal-public-api |
https://binary.mirantis.com/core/helm/baremetal-public-api-1.37.23.tgz |
|
kaas-ipam |
||
local-volume-provisioner |
https://binary.mirantis.com/core/helm/local-volume-provisioner-1.37.23.tgz |
|
metallb |
||
Docker images |
ambasador Updated |
mirantis.azurecr.io/core/external/nginx:1.37.23 |
baremetal-dnsmasq Updated |
mirantis.azurecr.io/bm/baremetal-dnsmasq:base-alpine-20230810152159 |
|
baremetal-operator Updated |
mirantis.azurecr.io/bm/baremetal-operator:base-alpine-20230803175048 |
|
bm-collective Updated |
mirantis.azurecr.io/bm/bm-collective:base-alpine-20230810134945 |
|
cluster-api-provider-baremetal Updated |
mirantis.azurecr.io/core/cluster-api-provider-baremetal:1.37.23 |
|
ironic Updated |
mirantis.azurecr.io/openstack/ironic:yoga-focal-20230810113432 |
|
ironic-inspector Updated |
mirantis.azurecr.io/openstack/ironic-inspector:yoga-focal-20230810113432 |
|
ironic-prometheus-exporter |
mirantis.azurecr.io/stacklight/ironic-prometheus-exporter:0.1-20230531081117 |
|
kaas-ipam Updated |
mirantis.azurecr.io/bm/kaas-ipam:base-alpine-20230810155639 |
|
kubernetes-entrypoint Updated |
mirantis.azurecr.io/openstack/extra/kubernetes-entrypoint:v1.0.1-5359171-20230810125608 |
|
mariadb Updated |
mirantis.azurecr.io/general/mariadb:10.6.14-focal-20230730124341 |
|
mcc-keepalived Updated |
mirantis.azurecr.io/lcm/mcc-keepalived:v0.22.0-63-g8f4f248 |
|
metallb-controller Updated |
mirantis.azurecr.io/bm/metallb/controller:v0.13.9-53df4a9c-amd64 |
|
metallb-speaker Updated |
mirantis.azurecr.io/bm/metallb/speaker:v0.13.9-53df4a9c-amd64 |
|
syslog-ng Updated |
mirantis.azurecr.io/bm/syslog-ng:base-apline-20230814110635 |
Artifact |
Component |
Paths |
|---|---|---|
Bootstrap tarball Updated |
bootstrap-darwin |
https://binary.mirantis.com//core/binbootstrap-darwin-1.37.23.tgz |
bootstrap-linux |
https://binary.mirantis.com//core/binbootstrap-linux-1.37.23.tgz |
|
Helm charts |
admission-controller Updated |
https://binary.mirantis.com/core/helm/admission-controller-1.37.23.tgz |
agent-controller Updated |
https://binary.mirantis.com/core/helm/agent-controller-1.37.23.tgz |
|
ceph-kcc-controller Updated |
https://binary.mirantis.com/core/helm/ceph-kcc-controller-1.37.23.tgz |
|
cert-manager Updated |
https://binary.mirantis.com/core/helm/cert-manager-1.37.23.tgz |
|
client-certificate-controller Updated |
https://binary.mirantis.com/core/helm/client-certificate-controller-1.37.23.tgz |
|
event-controller Updated |
https://binary.mirantis.com/core/helm/event-controller-1.37.23.tgz |
|
iam-controller Updated |
https://binary.mirantis.com/core/helm/iam-controller-1.37.23.tgz |
|
kaas-exporter Updated |
https://binary.mirantis.com/core/helm/kaas-exporter-1.37.23.tgz |
|
kaas-public-api Updated |
https://binary.mirantis.com/core/helm/kaas-public-api-1.37.23.tgz |
|
kaas-ui Updated |
||
lcm-controller Updated |
https://binary.mirantis.com/core/helm/lcm-controller-1.37.23.tgz |
|
license-controller Updated |
https://binary.mirantis.com/core/helm/license-controller-1.37.23.tgz |
|
machinepool-controller Updated |
https://binary.mirantis.com/core/helm/machinepool-controller-1.37.23.tgz |
|
mcc-cache Updated |
||
mcc-cache-warmup Updated |
https://binary.mirantis.com/core/helm/mcc-cache-warmup-1.37.23.tgz |
|
metrics-server Updated |
https://binary.mirantis.com/core/helm/metrics-server-1.37.23.tgz |
|
openstack-provider Updated |
https://binary.mirantis.com/core/helm/openstack-provider-1.37.23.tgz |
|
os-credentials-controller Updated |
https://binary.mirantis.com/core/helm/os-credentials-controller-1.37.23.tgz |
|
portforward-controller Updated |
https://binary.mirantis.com/core/helm/portforward-controller-1.37.23.tgz |
|
proxy-controller Updated |
https://binary.mirantis.com/core/helm/proxy-controller-1.37.23.tgz |
|
rbac-controller Updated |
https://binary.mirantis.com/core/helm/rbac-controller-1.37.23.tgz |
|
release-controller Updated |
https://binary.mirantis.com/core/helm/release-controller-1.37.23.tgz |
|
rhellicense-controller Updated |
https://binary.mirantis.com/core/helm/rhellicense-controller-1.37.23.tgz |
|
scope-controller Updated |
https://binary.mirantis.com/core/helm/scope-controller-1.37.23.tgz |
|
squid-proxy Updated |
https://binary.mirantis.com/core/helm/squid-proxy-1.37.23.tgz |
|
user-controller Updated |
https://binary.mirantis.com/core/helm/user-controller-1.37.23.tgz |
|
vsphere-credentials-controller Updated |
https://binary.mirantis.com/core/helm/vsphere-credentials-controller-1.37.23.tgz |
|
vsphere-provider Updated |
https://binary.mirantis.com/core/helm/vsphere-provider-1.37.23.tgz |
|
vsphere-vm-template-controller Updated |
https://binary.mirantis.com/core/helm/vsphere-vm-template-controller-1.37.23.tgz |
|
Docker images |
admission-controller Updated |
mirantis.azurecr.io/core/admission-controller:1.37.23 |
agent-controller Updated |
mirantis.azurecr.io/core/agent-controller:1.37.23 |
|
ceph-kcc-controller Updated |
mirantis.azurecr.io/core/ceph-kcc-controller:1.37.23 |
|
cert-manager-controller Updated |
mirantis.azurecr.io/core/external/cert-manager-controller:v1.11.0-2 |
|
client-certificate-controller Updated |
mirantis.azurecr.io/core/client-certificate-controller:1.37.23 |
|
event-controller Updated |
mirantis.azurecr.io/core/event-controller:1.37.23 |
|
frontend Updated |
mirantis.azurecr.io/core/frontend:1.37.23 |
|
iam-controller Updated |
mirantis.azurecr.io/core/iam-controller:1.37.23 |
|
kaas-exporter Updated |
mirantis.azurecr.io/core/kaas-exporter:1.37.23 |
|
kproxy Updated |
mirantis.azurecr.io/core/kproxy:1.37.23 |
|
lcm-controller Updated |
mirantis.azurecr.io/core/lcm-controller:1.37.23 |
|
license-controller Updated |
mirantis.azurecr.io/core/license-controller:1.37.23 |
|
machinepool-controller Updated |
mirantis.azurecr.io/core/machinepool-controller:1.37.23 |
|
mcc-haproxy Updated |
mirantis.azurecr.io/lcm/mcc-haproxy:v0.22.0-63-g8f4f248 |
|
mcc-keepalived Updated |
mirantis.azurecr.io/lcm/mcc-keepalived:v0.22.0-63-g8f4f248 |
|
metrics-server |
mirantis.azurecr.io/lcm/metrics-server-amd64:v0.6.3-2 |
|
nginx Updated |
mirantis.azurecr.io/core/external/nginx:1.37.23 |
|
openstack-cloud-controller-manager |
mirantis.azurecr.io/lcm/kubernetes/openstack-cloud-controller-manager-amd64:v1.24.5-10-g93314b86 |
|
openstack-cluster-api-controller Updated |
mirantis.azurecr.io/core/openstack-cluster-api-controller:1.37.23 |
|
os-credentials-controller Updated |
mirantis.azurecr.io/core/os-credentials-controller:1.37.23 |
|
portforward-controller Updated |
mirantis.azurecr.io/core/portforward-controller:1.37.23 |
|
proxy-controller Updated |
mirantis.azurecr.io/core/proxy-controller:1.37.23 |
|
rbac-controller Updated |
mirantis.azurecr.io/core/rbac-controller:1.37.23 |
|
registry |
mirantis.azurecr.io/lcm/registry:v2.8.1-4 |
|
release-controller Updated |
mirantis.azurecr.io/core/release-controller:1.37.23 |
|
rhellicense-controller Updated |
mirantis.azurecr.io/core/rhellicense-controller:1.37.23 |
|
scope-controller Updated |
mirantis.azurecr.io/core/scope-controller:1.37.23 |
|
squid-proxy |
mirantis.azurecr.io/lcm/squid-proxy:0.0.1-10-g24a0d69 |
|
user-controller Updated |
mirantis.azurecr.io/core/user-controller:1.37.23 |
|
vsphere-cluster-api-controller Updated |
mirantis.azurecr.io/core/vsphere-cluster-api-controller:1.37.23 |
|
vsphere-credentials-controller Updated |
mirantis.azurecr.io/core/vsphere-credentials-controller:1.37.23 |
|
vsphere-vm-template-controller Updated |
mirantis.azurecr.io/core/vsphere-vm-template-controller:1.37.23 |
Artifact |
Component |
Path |
|---|---|---|
Binaries |
hash-generate-darwin |
http://binary.mirantis.com/iam/bin/hash-generate-0.0.1-268-3cf7f17-darwin |
hash-generate-linux |
http://binary.mirantis.com/iam/bin/hash-generate-0.0.1-268-3cf7f17-linux |
|
Helm charts |
iam Updated |
|
Docker images |
keycloak |
mirantis.azurecr.io/iam/keycloak:0.6.0 |
kubernetes-entrypoint |
mirantis.azurecr.io/openstack/extra/kubernetes-entrypoint:v1.0.1-27d64fb-20230421151539 |
|
mariadb |
mirantis.azurecr.io/general/mariadb:10.6.12-focal-20230423170220 |
In total, since Container Cloud 2.24.1, in 2.24.3, 63 Common Vulnerabilities and Exposures (CVE) with high severity have been fixed.
The summary table contains the total number of unique CVEs along with the total number of issues fixed across the images.
The full list of the CVEs present in the current Container Cloud release is available at the Mirantis Security Portal.
Severity |
Critical |
High |
Total |
|---|---|---|---|
Unique CVEs |
0 |
15 |
15 |
Total issues across images |
0 |
63 |
63 |
Image |
Component name |
CVE |
|---|---|---|
bm/external/metallb/controller |
libcrypto3 |
CVE-2023-0464 (High) |
CVE-2023-2650 (High) |
||
libssl3 |
CVE-2023-2650 (High) |
|
CVE-2023-0464 (High) |
||
golang.org/x/net |
CVE-2022-41723 (High) |
|
bm/external/metallb/speaker |
libcrypto3 |
CVE-2023-2650 (High) |
CVE-2023-0464 (High) |
||
libssl3 |
CVE-2023-0464 (High) |
|
CVE-2023-2650 (High) |
||
golang.org/x/net |
CVE-2022-41723 (High) |
|
core/external/cert-manager-cainjector |
golang.org/x/net |
CVE-2022-41723 (High) |
core/external/cert-manager-controller |
golang.org/x/net |
CVE-2022-41723 (High) |
core/external/cert-manager-webhook |
golang.org/x/net |
CVE-2022-41723 (High) |
core/external/nginx |
nghttp2-libs |
CVE-2023-35945 (High) |
core/frontend |
nghttp2-libs |
CVE-2023-35945 (High) |
lcm/external/csi-attacher |
github.com/prometheus/client_golang |
CVE-2022-21698 (High) |
golang.org/x/net |
CVE-2022-27664 (High) |
|
golang.org/x/text |
CVE-2022-32149 (High) |
|
gopkg.in/yaml.v3 |
CVE-2022-28948 (High) |
|
lcm/external/csi-node-driver-registrar |
github.com/prometheus/client_golang |
CVE-2022-21698 (High) |
golang.org/x/net |
CVE-2022-27664 (High) |
|
golang.org/x/text |
CVE-2022-32149 (High) |
|
lcm/external/csi-provisioner |
golang.org/x/crypto |
CVE-2021-43565 (High) |
CVE-2022-27191 (High) |
||
github.com/prometheus/client_golang |
CVE-2022-21698 (High) |
|
golang.org/x/net |
CVE-2022-27664 (High) |
|
golang.org/x/text |
CVE-2022-32149 (High) |
|
gopkg.in/yaml.v3 |
CVE-2022-28948 (High) |
|
lcm/external/csi-resizer |
github.com/prometheus/client_golang |
CVE-2022-21698 (High) |
golang.org/x/net |
CVE-2022-27664 (High) |
|
golang.org/x/text |
CVE-2022-32149 (High) |
|
gopkg.in/yaml.v3 |
CVE-2022-28948 (High) |
|
lcm/external/csi-snapshotter |
github.com/prometheus/client_golang |
CVE-2022-21698 (High) |
golang.org/x/net |
CVE-2022-27664 (High) |
|
golang.org/x/text |
CVE-2022-32149 (High) |
|
gopkg.in/yaml.v3 |
CVE-2022-28948 (High) |
|
lcm/external/livenessprobe |
golang.org/x/text |
CVE-2021-38561 (High) |
CVE-2022-32149 (High) |
||
github.com/prometheus/client_golang |
CVE-2022-21698 (High) |
|
golang.org/x/net |
CVE-2022-27664 (High) |
|
lcm/kubernetes/cinder-csi-plugin-amd64 |
libpython3.7-minimal |
CVE-2021-3737 (High) |
CVE-2020-10735 (High) |
||
CVE-2022-45061 (High) |
||
CVE-2015-20107 (High) |
||
libpython3.7-stdlib |
CVE-2021-3737 (High) |
|
CVE-2020-10735 (High) |
||
CVE-2022-45061 (High) |
||
CVE-2015-20107 (High) |
||
python3.7 |
CVE-2021-3737 (High) |
|
CVE-2020-10735 (High) |
||
CVE-2022-45061 (High) |
||
CVE-2015-20107 (High) |
||
python3.7-minimal |
CVE-2021-3737 (High) |
|
CVE-2020-10735 (High) |
||
CVE-2022-45061 (High) |
||
CVE-2015-20107 (High) |
||
libssl1.1 |
CVE-2023-2650 (High) |
|
CVE-2023-0464 (High) |
||
openssl |
CVE-2023-2650 (High) |
|
CVE-2023-0464 (High) |
||
lcm/mcc-haproxy |
nghttp2-libs |
CVE-2023-35945 (High) |
openstack/ironic |
cryptography |
CVE-2023-2650 (High) |
openstack/ironic-inspector |
cryptography |
CVE-2023-2650 (High) |
The following issues have been addressed in the Container Cloud patch release 2.24.3 along with the patch Cluster releases 14.0.2 and 15.0.2.
[34638][BM] Fixed the issue with failure to delete a management cluster due to the issue with secrets during machine deletion.
[34220][BM] Fixed the issue with
ownerReferencesbeing lost forHardwareDataafter pivoting during a management cluster bootstrap.[34280][LCM] Fixed the issue with no cluster reconciles generated if a cluster is stuck on waiting for agents upgrade.
[33439][TLS] Fixed the issue with
client-certificate-controllersilently replacing user-provided key if PEM header and key format do not match.[33686][audit] Fixed the issue with rules provided by the
dockerauditd preset not covering the Sysdig Docker CIS benchmark.[34080][StackLight] Fixed the issue with missing events in OpenSearch that have
lastTimestampset tonullandeventTimeset to a non-nullvalue.
The Container Cloud major release 2.24.2 based on 2.24.0 and 2.24.1 provides the following:
Introduces support for the major Cluster release 15.0.1 that is based on the Cluster release 14.0.1 and represents Mirantis OpenStack for Kubernetes (MOSK) 23.2. This Cluster release is based on the updated version of Mirantis Kubernetes Engine 3.6.5 with Kubernetes 1.24 and Mirantis Container Runtime 20.10.17.
Supports the latest Cluster release 14.0.1.
Does not support greenfield deployments based on deprecated Cluster release 14.0.0 along with 12.7.x and 11.7.x series. Use the latest available Cluster releases of the series instead.
For main deliverables of the Container Cloud release 2.24.2, refer to its parent release 2.24.0:
Caution
Make sure to update the Cluster release version of your managed cluster before the current Cluster release version becomes unsupported by a new Container Cloud release version. Otherwise, Container Cloud stops auto-upgrade and eventually Container Cloud itself becomes unsupported.
The Container Cloud patch release 2.24.1 based on 2.24.0
includes updated baremetal-operator, admission-controller, and iam
artifacts and provides hot fixes for the following issues:
[34218] Fixed the issue with the
iam-keycloakPod being stuck in thePendingstate during Keycloak upgrade to version 21.1.1.[34247] Fixed the issue with MKE backup failing during cluster update due to wrong permissions in the etcd backup directory. If the issue still persists, which may occur on clusters that were originally deployed using early Container Cloud releases delivered in 2020-2021, follow the workaround steps described in Known issues: LCM.
Note
Container Cloud patch release 2.24.1 does not introduce new Cluster releases.
For main deliverables of the Container Cloud release 2.24.1, refer to its parent release 2.24.0:
Caution
Make sure to update the Cluster release version of your managed cluster before the current Cluster release version becomes unsupported by a new Container Cloud release version. Otherwise, Container Cloud stops auto-upgrade and eventually Container Cloud itself becomes unsupported.
Important
Container Cloud 2.24.0 has been successfully applied to a certain number of clusters. The 2.24.0 related documentation content fully applies to these clusters.
If your cluster started to update but was reverted to the previous product version or the update is stuck, you automatically receive the 2.24.1 patch release with the bug fixes to unblock the update to the 2.24 series.
There is no impact on the cluster workloads. For details on the patch release, see 2.24.1.
The Mirantis Container Cloud GA release 2.24.0:
Introduces support for the Cluster release 14.0.0 that is based on Mirantis Container Runtime 20.10.17 and Mirantis Kubernetes Engine 3.6.5 with Kubernetes 1.24.
Supports the latest major and patch Cluster releases of the 12.7.x series that supports Mirantis OpenStack for Kubernetes (MOSK) 23.1 series.
Does not support greenfield deployments on deprecated Cluster releases 12.7.3, 11.7.4, or earlier patch releases, 12.5.0, or 11.7.0. Use the latest available Cluster releases of the series instead.
Caution
Make sure to update the Cluster release version of your managed cluster before the current Cluster release version becomes unsupported by a new Container Cloud release version. Otherwise, Container Cloud stops auto-upgrade and eventually Container Cloud itself becomes unsupported.
This section outlines release notes for the Container Cloud release 2.24.0.
This section outlines new features and enhancements introduced in the Mirantis Container Cloud release 2.24.0. For the list of enhancements in the Cluster release 14.0.0 that is introduced by the Container Cloud release 2.24.0, see the 14.0.0.
Automated upgrade of operating system on bare metal clusters
Deletion of persistent volumes during an OpenStack-based cluster deletion
Creation and deletion of bare metal host credentials using web UI
Support status of the feature
Since MOSK 23.2, the feature is generally available for MOSK clusters.
Since Container Cloud 2.24.2, the feature is generally available for any type of bare metal clusters.
Since Container Cloud 2.24.0, the feature is available as Technology Preview for management and regional clusters only.
Implemented automatic in-place upgrade of an operating system (OS) distribution on bare metal clusters. The OS upgrade occurs as part of cluster update that requires machines reboot. The OS upgrade workflow is as follows:
The distribution ID value is taken from the
idfield of the distribution from theallowedDistributionslist in the spec of theClusterReleaseobject.The distribution that has the
default: truevalue is used during update. This distribution ID is set in thespec:providerSpec:value:distributionfield of theMachineobject during cluster update.
On management and regional clusters, the operating system upgrades automatically during cluster update. For managed clusters, an in-place OS distribution upgrade should be performed between cluster updates. This scenario implies a machine cordoning, draining, and reboot.
Warning
During the course of the Container Cloud 2.28.x series, Mirantis highly recommends upgrading an operating system on any nodes of all your MOSK cluster machines to Ubuntu 22.04 before the next major Cluster release becomes available.
It is not mandatory to upgrade all machines at once. You can upgrade them one by one or in small batches, for example, if the maintenance window is limited in time.
Otherwise, the Cluster release update of the Ubuntu 20.04-based MOSK clusters will become impossible as of Container Cloud 2.29.0 with Ubuntu 22.04 as the only supported version.
Management cluster update to Container Cloud 2.29.1 will be blocked if at least one node of any related MOSK cluster is running Ubuntu 20.04.
TechPreview
Added initial Technology Preview support for WireGuard that enables traffic
encryption on the Kubernetes workloads network. Set secureOverlay: true
in the Cluster object during deployment of management, regional, or
managed bare metal clusters to enable WireGuard encryption.
Also, added the possibility to configure the maximum transmission unit (MTU) size for Calico that is required for the WireGuard functionality and allows maximizing network performance.
Note
For MOSK-based deployments, the feature support is available since MOSK 23.2.
For management and regional clusters
Caution
For managed clusters, this object is available as Technology Preview and will become generally available in one of the following Container Cloud releases.
Introduced the following MetalLB configuration changes and objects related to address allocation and announcement of services LB for bare metal and vSphere providers:
Introduced the
MetalLBConfigTemplateobject for bare metal and theMetalLBConfigobject for vSphere to be used as default and recommended.For vSphere, during creation of clusters of any type, now a separate
MetalLBConfigobject is created instead of corresponding settings in theClusterobject.The use of either
Subnetobjects without the new MetalLB objects or theconfigInlineMetalLB value of theClusterobject is deprecated and will be removed in one of the following releases.If the
MetalLBConfigobject is not used for MetalLB configuration related to address allocation and announcement of services LB, then automated migration applies during creation of clusters of any type or cluster update to Container Cloud 2.24.0.During automated migration, the
MetalLBConfigandMetalLBConfigTemplateobjects for bare metal or theMetalLBConfigfor vSphere are created and contents of the MetalLB chartconfigInlinevalue is converted to the parameters of theMetalLBConfigTemplateobject for bare metal or of theMetalLBConfigobject for vSphere.
The following changes apply to the bare metal bootstrap procedure:
Moved the following environment variables from
cluster.yaml.templateto the dedicatedipam-objects.yaml.template:BOOTSTRAP_METALLB_ADDRESS_POOLKAAS_BM_BM_DHCP_RANGESET_METALLB_ADDR_POOLSET_LB_HOST
Modified the default network configuration. Now it includes a bond interface and separated PXE and management networks. Mirantis recommends using separate PXE and management networks for management and regional clusters.
TechPreview
Added support for RHEL 8.7 on the vSphere-based management, regional, and managed clusters.
Implemented the possibility to use custom Octavia Amphora flavors that you can
enable in spec:providerSpec section of the Cluster object using
serviceAnnotations:loadbalancer.openstack.org/flavor-id during
management or regional cluster deployment.
Note
For managed clusters, you can enable the feature through the Container Cloud API. The web UI functionality will be added in one of the following Container Cloud releases.
Completed the development of persistent volumes deletion during an OpenStack-based managed cluster deletion by implementing the Delete all volumes in the cluster check box in the cluster deletion menu of the Container Cloud web UI.
Upgraded the Keycloak major version from 18.0.0 to 21.1.1. For the list of new features and enhancements, see Keycloak Release Notes.
The upgrade path is fully automated. No data migration or custom LCM changes are required.
Important
After the Keycloak upgrade, access the Keycloak Admin Console
using the new URL format: https://<keycloak.ip>/auth instead of
https://<keycloak.ip>. Otherwise, the Resource not found
error displays in a browser.
TechPreview
Added initial Technology Preview support for custom host names of machines on
any supported provider and any cluster type. When enabled, any machine host
name in a particular region matches the related Machine object name. For
example, instead of the default kaas-node-<UID>, a machine host name will
be master-0. The custom naming format is more convenient and easier to
operate with.
You can enable the feature before or after management or regional cluster deployment. If enabled after deployment, custom host names will apply to all newly deployed machines in the region. Existing host names will remain the same.
TechPreview
Added initial Technology Preview support for parallelizing of node update
operations that significantly improves the efficiency of your cluster. To
configure the parallel node update, use the following parameters located under
spec.providerSpec of the Cluster object:
maxWorkerUpgradeCount- maximum number of worker nodes for simultaneous update to limit machine draining during updatemaxWorkerPrepareCount- maximum number of workers for artifacts downloading to limit network load during update
Note
For MOSK clusters, you can start using this feature during cluster update from 23.1 to 23.2. For details, see MOSK documentation: Parallelizing node update operations.
Implemented the CacheWarmupRequest resource to predownload, aka warm up,
a list of artifacts included in a given set of Cluster releases into the
mcc-cache service only once per release. The feature facilitates and
speeds up deployment and update of managed clusters.
After a successful cache warm-up, the object of the CacheWarmupRequest
resource is automatically deleted from the cluster and cache remains for
managed clusters deployment or update until next Container Cloud auto-upgrade
of the management or regional cluster.
Caution
If the disk space for cache runs out, the cache for the oldest object is evicted. To avoid running out of space in the cache, verify and adjust its size before each cache warm-up.
Note
For MOSK-based deployments, the feature support is available since MOSK 23.2.
TechPreview
Added initial Technology Preview support for the Linux Audit daemon auditd to monitor activity of cluster processes on any type of Container Cloud cluster. The feature is an essential requirement for many security guides that enables auditing of any cluster process to detect potential malicious activity.
You can enable and configure auditd either during or after cluster deployment
using the Cluster object.
Note
For MOSK-based deployments, the feature support is available since MOSK 23.2.
TechPreview
Enhanced TLS certificates configuration for cluster applications:
Added support for configuration of TLS certificates for MKE on management or regional clusters to the existing support on managed clusters.
Implemented the ability to configure TLS certificates using the Container Cloud web UI through the Security section located in the More > Configure cluster menu.
Expanded the capability to perform a graceful reboot on a management, regional, or managed cluster for all supported providers by adding the Reboot machines option to the cluster menu in the Container Cloud web UI. The feature allows for a rolling reboot of all cluster machines without workloads interruption. The reboot occurs in the order of cluster upgrade policy.
Note
For MOSK-based deployments, the feature support is available since MOSK 23.2.
Improved management of bare metal host credentials using the Container Cloud web UI:
Added the Add Credential menu to the Credentials tab. The feature facilitates association of credentials with bare metal hosts created using the BM Hosts tab.
Implemented automatic deletion of credentials during deletion of bare metal hosts after deletion of managed cluster.
Improved the Node Labels menu in the Container Cloud web UI by making it more intuitive. Replaced the greyed out (disabled) label names with the No labels have been assigned to this machine. message and the Add a node label button link.
Also, added the possibility to configure node labels for machine pools after deployment using the More > Configure Pool option.
On top of continuous improvements delivered to the existing Container Cloud guides, added the documentation on managing Ceph OSDs with a separate metadata device.
The following issues have been addressed in the Mirantis Container Cloud release 2.24.0 along with the Cluster release 14.0.0. For the list of hot fixes delivered in the 2.24.1 patch release, see 2.24.1.
[5981] Fixed the issue with upgrade of a cluster containing more than 120 nodes getting stuck on one node with errors about IP addresses exhaustion in the
dockerlogs. On existing clusters, after updating to the Cluster release 14.0.0 or later, you can optionally remove the abandonedmke-overlaynetwork using docker network rm mke-overlay.[29604] Fixed the issue with the false positive
failed to get kubeconfigerror occurring on theWaiting for TLS settings to be appliedstage during TLS configuration.[29762] Fixed the issue with a wrong IP address being assigned after the MetalLB controller restart.
[30635] Fixed the issue with the
pg_autoscalermodule of Ceph Manager failing with the pool <poolNumber> has overlapping roots error if a Ceph cluster contains a mix of pools withdeviceClasseither explicitly specified or not specified.[30857] Fixed the issue with irrelevant error message displaying in the
osd-preparePod during the deployment of Ceph OSDs on removable devices on AMD nodes. Now, the error message clearly states that removable devices (with hotplug enabled) are not supported for deploying Ceph OSDs. This issue has been addressed since the Cluster release 14.0.0.[30781] Fixed the issue with cAdvisor failing to collect metrics on CentOS-based deployments. Missing metrics affected the
KubeContainersCPUThrottlingHighalert and the following Grafana dashboards: Kubernetes Containers, Kubernetes Pods, and Kubernetes Namespaces.[31288] Fixed the issue with Fluentd agent failing and the
fluentd-logsPods reporting themaximum open shardslimit error, thus preventing OpenSearch to accept new logs. The fix enables the possibility to increase the limit for maximum open shards usingcluster.max_shards_per_node. For details, see Tune StackLight for long-term log retention.[31485] Fixed the issue with Elasticsearch Curator not deleting indices according to the configured retention period on any type of Container Cloud clusters.
This section lists known issues with workarounds for the Mirantis Container Cloud releases 2.24.0 and 2.24.1 including the Cluster release 14.0.0.
For other issues that can occur while deploying and operating a Container Cloud cluster, see Troubleshooting Guide.
Note
This section also outlines still valid known issues from previous Container Cloud releases.
Due to the MetalLB upstream issue, a load balancer service may not obtain the external IP address.
The issue occurs when two services share the same external IP address and have
the same externalTrafficPolicy value. Initially, the services have the
external IP address assigned and are accessible. After modifying the
externalTrafficPolicy value for both services from Cluster to
Local, the first service that has been changed remains with no external IP
address assigned. Though, the second service, which was changed later, has the
external IP assigned as expected.
To work around the issue, make a dummy change to the service object where
external IP is <pending>:
Identify the service that is stuck:
kubectl get svc -A | grep pending
Example of system response:
stacklight iam-proxy-prometheus LoadBalancer 10.233.28.196 <pending> 443:30430/TCP
Add an arbitrary label to the service that is stuck. For example:
kubectl label svc -n stacklight iam-proxy-prometheus reconcile=1
Example of system response:
service/iam-proxy-prometheus labeledVerify that the external IP was allocated to the service:
kubectl get svc -n stacklight iam-proxy-prometheus
Example of system response:
NAME TYPE CLUSTER-IP EXTERNAL-IP PORT(S) AGE iam-proxy-prometheus LoadBalancer 10.233.28.196 10.0.34.108 443:30430/TCP 12d
During netplan configuration after cluster deployment, changes in the
IpamHost object are not propagated to LCMMachine.
The workaround is to manually add any new label to the labels section
of the Machine object for the target host, which triggers machine
reconciliation and propagates network changes.
Due to the upstream Calico issue, on clusters with WireGuard enabled, the WireGuard interface on a node may not have the IPv4 address assigned. This leads to broken inter-Pod communication between the affected node and other cluster nodes.
The node is affected if the IP address is missing on the WireGuard interface:
ip a show wireguard.cali
Example of system response:
40: wireguard.cali: <POINTOPOINT,NOARP,UP,LOWER_UP> mtu 1440 qdisc noqueue state UNKNOWN group default qlen 1000 link/none
The workaround is to manually restart the calico-node Pod to allocate
the IPv4 address on the WireGuard interface:
docker restart $(docker ps -f "label=name=Calico node" -q)
The cluster update is stuck on waiting for agents to upgrade with the following message in the cluster status:
Helm charts are not installed(upgraded) yet. Not ready releases: managed-lcm-api
The workaround is to retrigger the cluster update, for example, by adding an annotation to the cluster object:
Log in to a local machine where your management cluster
kubeconfigis located and where kubectl is installed.Open the management
Clusterobject for editing:kubectl edit cluster <mgmtClusterName>
Set the annotation
force-reconcile: true.
The cluster update is blocked with the following message in the cluster status:
Helm charts are not installed(upgraded) yet.
Not ready releases: iam, managed-lcm-api, admission-controller, baremetal-operator.
Workaround:
Log in to a local machine where your management cluster
kubeconfigis located and wherekubectlis installed.Open the
baremetal-operatordeployment object for editing:kubectl edit deploy -n kaas baremetal-operator
Modify the image that the
initcontainer and the container are using tomirantis.azurecr.io/bm/baremetal-operator:base-alpine-20230721153358.
The baremetal-operator pods will be re-created, and the cluster update
will get unblocked.
Fixed in 17.0.1 and 16.0.1 for MKE 3.7.2
Due to the upstream Calico issue, a controller node
cannot be deleted if the calico-node Pod is stuck blocking node deletion.
One of the symptoms is the following warning in the baremetal-operator
logs:
Resolving dependency Service dhcp-lb in namespace kaas failed: \
the server was unable to return a response in the time allotted,\
but may still be processing the request (get endpoints dhcp-lb).
As a workaround, delete the Pod that is stuck to retrigger the node deletion.
During deletion of a manager machine running the ironic Pod from a bare
metal management cluster, the following problems occur:
All Pods are stuck in the
TerminatingstateA new
ironicPod fails to startThe related bare metal host is stuck in the
deprovisioningstate
As a workaround, before deletion of the node running the ironic Pod,
cordon and drain the node using the kubectl cordon <nodeName> and
kubectl drain <nodeName> commands.
If a baremetal-based regional cluster deployment fails before pivoting is done, the corresponding region deletion fails.
Workaround:
Using the command below, manually delete all possible traces of the failed
regional cluster deployment, including but not limited to the following
objects that contain the kaas.mirantis.com/region label of the affected
region:
clustermachinebaremetalhostbaremetalhostprofilel2templatesubnetipamhostipaddr
kubectl delete <objectName> -l kaas.mirantis.com/region=<regionName>
Warning
Do not use the same region name again after the regional cluster deployment failure since some objects that reference the region name may still exist.
During MariaDB operations on a management cluster, Pods may get stuck in continuous restarts with the following example error:
[ERROR] WSREP: Corrupt buffer header: \
addr: 0x7faec6f8e518, \
seqno: 3185219421952815104, \
size: 909455917, \
ctx: 0x557094f65038, \
flags: 11577. store: 49, \
type: 49
Workaround:
Create a backup of the
/var/lib/mysqldirectory on themariadb-serverPod.Verify that other replicas are up and ready.
Remove the
galera.cachefile for the affectedmariadb-serverPod.Remove the affected
mariadb-serverPod or wait until it is automatically restarted.
After Kubernetes restarts the Pod, the Pod clones the database in 1-2 minutes and restores the quorum.
On MOSK clusters, the Ansible provisioner may hang in a loop while trying to remove LVM thin pool logical volumes (LVs) due to issues with volume detection before removal. The Ansible provisioner cannot remove LVM thin pool LVs correctly, so it consistently detects the same volumes whenever it scans disks, leading to a repetitive cleanup process.
The following symptoms mean that a cluster can be affected:
A node was configured to use thin pool LVs. For example, it had the OpenStack Cinder role in the past.
A bare metal node deployment flaps between
provisioniniganddeprovisioningstates.In the Ansible provisioner logs, the following example warnings are growing:
88621.log:7389:2023-06-22 16:30:45.109 88621 ERROR ansible.plugins.callback.ironic_log [-] Ansible task clean : fail failed on node 14eb0dbc-c73a-4298-8912-4bb12340ff49: {'msg': 'There are more devices to clean', '_ansible_no_log': None, 'changed': False}
Important
There are more devices to cleanis a regular warning indicating some in-progress tasks. But if the number of such warnings is growing along with the node flapping betweenprovisioniniganddeprovisioningstates, the cluster is highly likely affected by the issue.
As a workaround, erase disks manually using any preferred tool.
MKE backup may fail during update of a management, regional, or managed
cluster due to wrong permissions in the etcd backup
/var/lib/docker/volumes/ucp-backup/_data directory.
The issue affects only clusters that were originally deployed using early Container Cloud releases delivered in 2020-2021.
Workaround:
Fix permissions on all affected nodes:
chown -R nobody:nogroup /var/lib/docker/volumes/ucp-backup/_data
Using the admin
kubeconfig, increase themkeUpgradeAttemptsvalue:Open the
LCMClusterobject of the management cluster for editing:kubectl edit lcmcluster <mgmtClusterName>
In the
mkeUpgradeAttemptsfield, increase the value to6. Once done, MKE backup retriggers automatically.
Fixed in 2.28.4 (17.3.4 and 16.3.4)
During replacement of a master node on a cluster of any type, the
calico-node Pod fails to start on a new node that has the same IP address
as the node being replaced.
Workaround:
Log in to any
masternode.From a CLI with an MKE client bundle, create a shell alias to start calicoctl using the
mirantis/ucp-dsinfoimage:alias calicoctl="\ docker run -i --rm \ --pid host \ --net host \ -e constraint:ostype==linux \ -e ETCD_ENDPOINTS=<etcdEndpoint> \ -e ETCD_KEY_FILE=/var/lib/docker/volumes/ucp-kv-certs/_data/key.pem \ -e ETCD_CA_CERT_FILE=/var/lib/docker/volumes/ucp-kv-certs/_data/ca.pem \ -e ETCD_CERT_FILE=/var/lib/docker/volumes/ucp-kv-certs/_data/cert.pem \ -v /var/run/calico:/var/run/calico \ -v /var/lib/docker/volumes/ucp-kv-certs/_data:/var/lib/docker/volumes/ucp-kv-certs/_data:ro \ mirantis/ucp-dsinfo:<mkeVersion> \ calicoctl \ "
alias calicoctl="\ docker run -i --rm \ --pid host \ --net host \ -e constraint:ostype==linux \ -e ETCD_ENDPOINTS=<etcdEndpoint> \ -e ETCD_KEY_FILE=/ucp-node-certs/key.pem \ -e ETCD_CA_CERT_FILE=/ucp-node-certs/ca.pem \ -e ETCD_CERT_FILE=/ucp-node-certs/cert.pem \ -v /var/run/calico:/var/run/calico \ -v ucp-node-certs:/ucp-node-certs:ro \ mirantis/ucp-dsinfo:<mkeVersion> \ calicoctl --allow-version-mismatch \ "
In the above command, replace the following values with the corresponding settings of the affected cluster:
<etcdEndpoint>is the etcd endpoint defined in the Calico configuration file. For example,ETCD_ENDPOINTS=127.0.0.1:12378<mkeVersion>is the MKE version installed on your cluster. For example,mirantis/ucp-dsinfo:3.5.7.
Verify the node list on the cluster:
kubectl get node
Compare this list with the node list in Calico to identify the old node:
calicoctl get node -o wide
Remove the old node from Calico:
calicoctl delete node kaas-node-<nodeID>
Fixed in 2.28.4 (17.3.4 and 16.3.4)
During replacement of a manager machine, the following problems may occur:
The system adds the node to Docker swarm but not to Kubernetes
The node
Deploymentgets stuck with failed RethinkDB health checks
Workaround:
Delete the failed node.
Wait for the MKE cluster to become healthy. To monitor the cluster status:
Log in to the MKE web UI.
Monitor the cluster status as described in MKE Operations Guide: Monitor an MKE cluster with the MKE web UI.
Deploy a new node.
Fixed in 2.28.4 (17.3.4 and 16.3.4)
During the unsafe or forced deletion of a manager machine running the
calico-kube-controllers Pod in the kube-system namespace,
the following issues occur:
The
calico-kube-controllersPod fails to clean up resources associated with the deleted nodeThe
calico-nodePod may fail to start up on a newly created node if the machine is provisioned with the same IP address as the deleted machine had
As a workaround, before deletion of the node running the
calico-kube-controllers Pod, cordon and drain the node:
kubectl cordon <nodeName>
kubectl drain <nodeName>
Due to the upstream Ceph issue,
on clusters with the Federal Information Processing Standard (FIPS) mode
enabled, the Ceph rook-operator fails to connect to Ceph RADOS Gateway
(RGW) pods.
As a workaround, do not place Ceph RGW pods on nodes where FIPS mode is enabled.
On management clusters based on Ubuntu 18.04, after the cluster starts upgrading from 2.23.5 to 2.24.1, all controller machines are stuck in the In Progress state with the Distribution update in progress hover message displaying in the Container Cloud web UI.
The issue is caused by clusterworkloadlock containing the outdated
release name in the status.release field, which blocks LCM Controller
to proceed with machine upgrade. This behavior is caused by a complete removal
of the ceph-controller chart from management clusters and a failed
ceph-clusterworkloadlock removal.
The workaround is to manually remove ceph-clusterworkloadlock from the
management cluster to unblock upgrade:
kubectl delete clusterworkloadlock ceph-clusterworkloadlock
Note
The issue does not reproduce since MOSK 25.2.
Update of a managed cluster based on bare metal and Ceph enabled fails with
PersistentVolumeClaim getting stuck in the Pending state for the
prometheus-server StatefulSet and the
MountVolume.MountDevice failed for volume warning in the StackLight event
logs.
Workaround:
Verify that the description of the Pods that failed to run contain the
FailedMountevents:kubectl -n <affectedProjectName> describe pod <affectedPodName>
In the command above, replace the following values:
<affectedProjectName>is the Container Cloud project name where the Pods failed to run<affectedPodName>is a Pod name that failed to run in the specified project
In the Pod description, identify the node name where the Pod failed to run.
Verify that the
csi-rbdpluginlogs of the affected node contain therbd volume mount failed: <csi-vol-uuid> is being usederror. The<csi-vol-uuid>is a unique RBD volume name.Identify
csiPodNameof the correspondingcsi-rbdplugin:kubectl -n rook-ceph get pod -l app=csi-rbdplugin \ -o jsonpath='{.items[?(@.spec.nodeName == "<nodeName>")].metadata.name}'
Output the affected
csiPodNamelogs:kubectl -n rook-ceph logs <csiPodName> -c csi-rbdplugin
Scale down the affected
StatefulSetorDeploymentof the Pod that fails to0replicas.On every
csi-rbdpluginPod, search for stuckcsi-vol:for pod in `kubectl -n rook-ceph get pods|grep rbdplugin|grep -v provisioner|awk '{print $1}'`; do echo $pod kubectl exec -it -n rook-ceph $pod -c csi-rbdplugin -- rbd device list | grep <csi-vol-uuid> done
Unmap the affected
csi-vol:rbd unmap -o force /dev/rbd<i>
The
/dev/rbd<i>value is a mapped RBD volume that usescsi-vol.Delete
volumeattachmentof the affected Pod:kubectl get volumeattachments | grep <csi-vol-uuid> kubectl delete volumeattacmhent <id>
Scale up the affected
StatefulSetorDeploymentback to the original number of replicas and wait until its state becomesRunning.
During cluster update of a managed bare metal cluster, the false positive
CalicoDataplaneFailuresHigh alert may be firing. Disregard this alert,
which will disappear once cluster update succeeds.
The observed behavior is typical for calico-node during upgrades,
as workload changes occur frequently. Consequently, there is a possibility
of temporary desynchronization in the Calico dataplane. This can occasionally
result in throttling when applying workload changes to the Calico dataplane.
The following table lists the major components and their versions delivered in the Container Cloud releases 2.24.0 - 2.24.2.
Note
The components that are newly added, updated, deprecated, or removed
as compared to the previous release version, are marked
with a corresponding superscript,
for example, lcm-ansible Updated.
Component |
Application/Service |
Version |
|---|---|---|
Bare metal Updated |
ambassador |
1.37.15 |
baremetal-operator |
base-alpine-20230607164516 2.24.0 |
|
base-alpine-20230721153358 2.24.1(2) |
||
baremetal-public-api |
1.37.15 |
|
baremetal-provider |
1.37.15 |
|
ironic |
yoga-focal-20230605060019 |
|
kaas-ipam |
base-alpine-20230614192933 |
|
keepalived |
0.22.0-49-g9618f2a |
|
local-volume-provisioner |
2.5.0-4 |
|
mariadb |
10.6.12-focal-20230606052917 |
|
IAM Updated |
iam |
2.5.1 2.24.0 |
2.5.3 2.24.1(2) |
||
iam-controller |
1.37.15 |
|
keycloak |
21.1.1 |
|
Container Cloud Updated |
admission-controller |
1.37.15 2.24.0 |
1.37.16 2.24.1 |
||
1.37.19 2.24.2 |
||
agent-controller |
1.37.15 |
|
byo-credentials-controller Removed |
n/a |
|
byo-provider Removed |
n/a |
|
ceph-kcc-controller |
1.37.15 |
|
cert-manager |
1.37.15 |
|
client-certificate-controller |
1.37.15 |
|
event-controller |
1.37.15 |
|
golang |
1.20.4-alpine3.17 |
|
kaas-public-api |
1.37.15 |
|
kaas-exporter |
1.37.15 |
|
kaas-ui |
1.37.15 |
|
license-controller |
1.37.15 |
|
lcm-controller |
1.37.15 |
|
machinepool-controller |
1.37.15 |
|
mcc-cache |
1.37.15 |
|
portforward-controller |
1.37.15 |
|
proxy-controller |
1.37.15 |
|
rbac-controller |
1.37.15 |
|
release-controller |
1.37.15 |
|
rhellicense-controller |
1.37.15 |
|
scope-controller |
1.37.15 |
|
user-controller |
1.37.15 |
|
OpenStack Updated |
openstack-provider |
1.37.15 |
os-credentials-controller |
1.37.15 |
|
VMware vSphere Updated |
vsphere-provider |
1.37.15 |
vsphere-credentials-controller |
1.37.15 |
|
keepalived |
0.22.0-49-g9618f2a |
|
squid-proxy |
0.0.1-10-g24a0d69 |
This section lists the component artifacts of the Container Cloud releases 2.24.0 - 2.24.2.
Note
The components that are newly added, updated, deprecated, or removed
as compared to the previous release version, are marked
with a corresponding superscript,
for example, lcm-ansible Updated.
Artifact |
Component |
Path |
|---|---|---|
Binaries |
ironic-python-agent.initramfs Updated |
https://binary.mirantis.com/bm/bin/ironic/ipa/ubuntu/initramfs-yoga-focal-debug-20230606121129 |
ironic-python-agent.kernel Updated |
https://binary.mirantis.com/bm/bin/ironic/ipa/ubuntu/kernel-yoga-focal-debug-20230606121129 |
|
provisioning_ansible |
https://binary.mirantis.com/bm/bin/ansible/provisioning_ansible-0.1.1-104-6e2e82c.tgz |
|
Helm charts Updated |
baremetal-api |
https://binary.mirantis.com/core/helm/baremetal-api-1.37.15.tgz |
baremetal-operator |
https://binary.mirantis.com/core/helm/baremetal-operator-1.37.15.tgz 2.24.0 |
|
https://binary.mirantis.com/core/helm/baremetal-operator-1.37.16.tgz 2.24.1(2) |
||
baremetal-provider |
https://binary.mirantis.com/core/helm/baremetal-provider-1.37.15.tgz |
|
baremetal-public-api |
https://binary.mirantis.com/core/helm/baremetal-public-api-1.37.15.tgz |
|
kaas-ipam |
||
local-volume-provisioner |
https://binary.mirantis.com/core/helm/local-volume-provisioner-1.37.15.tgz |
|
metallb |
||
Docker images |
ambasador Updated |
mirantis.azurecr.io/core/external/nginx:1.37.15 |
baremetal-dnsmasq Updated |
mirantis.azurecr.io/bm/baremetal-dnsmasq:base-alpine-20230607171021 |
|
baremetal-operator Updated |
mirantis.azurecr.io/bm/baremetal-operator:base-alpine-20230607164516 2.24.0 |
|
mirantis.azurecr.io/bm/baremetal-operator:base-alpine-20230721153358 2.24.1(2) |
||
bm-collective Updated |
mirantis.azurecr.io/bm/bm-collective:base-alpine-20230607154546 |
|
cluster-api-provider-baremetal Updated |
mirantis.azurecr.io/core/cluster-api-provider-baremetal:1.37.15 |
|
ironic Updated |
mirantis.azurecr.io/openstack/ironic:yoga-focal-20230605060019 |
|
ironic-inspector Updated |
mirantis.azurecr.io/openstack/ironic-inspector:yoga-focal-20230605060019 |
|
ironic-prometheus-exporter Updated |
mirantis.azurecr.io/stacklight/ironic-prometheus-exporter:0.1-20230531081117 |
|
kaas-ipam Updated |
mirantis.azurecr.io/bm/kaas-ipam:base-alpine-20230614192933 |
|
kubernetes-entrypoint |
mirantis.azurecr.io/openstack/extra/kubernetes-entrypoint:v1.0.1-27d64fb-20230421151539 |
|
mariadb Updated |
mirantis.azurecr.io/general/mariadb:10.6.12-focal-20230606052917 |
|
mcc-keepalived Updated |
mirantis.azurecr.io/lcm/mcc-keepalived:v0.22.0-49-g9618f2a |
|
metallb-controller Updated |
mirantis.azurecr.io/bm/external/metallb/controller:v0.13.9 |
|
metallb-speaker Updated |
mirantis.azurecr.io/bm/external/metallb/speaker:v0.13.9 |
|
syslog-ng Updated |
mirantis.azurecr.io/bm/syslog-ng:base-apline-20230607165607 |
Artifact |
Component |
Paths |
|---|---|---|
Bootstrap tarball Updated |
bootstrap-darwin |
https://binary.mirantis.com/core/bin/bootstrap-darwin-1.37.15.tgz 2.24.0(1) |
https://binary.mirantis.com/core/bin/bootstrap-darwin-1.37.19.tgz 2.24.2 |
||
bootstrap-linux |
https://binary.mirantis.com/core/bin/bootstrap-linux-1.37.15.tgz 2.24.0(1) |
|
https://binary.mirantis.com/core/bin/bootstrap-linux-1.37.19.tgz 2.24.2 |
||
Helm charts Updated |
admission-controller |
https://binary.mirantis.com/core/helm/admission-controller-1.37.15.tgz 2.24.0 |
https://binary.mirantis.com/core/helm/admission-controller-1.37.16.tgz 2.24.1(2) |
||
agent-controller |
https://binary.mirantis.com/core/helm/agent-controller-1.37.15.tgz |
|
byo-credentials-controller Removed |
n/a |
|
byo-provider Removed |
n/a |
|
ceph-kcc-controller |
https://binary.mirantis.com/core/helm/ceph-kcc-controller-1.37.15.tgz |
|
cert-manager |
https://binary.mirantis.com/core/helm/cert-manager-1.37.15.tgz |
|
client-certificate-controller |
https://binary.mirantis.com/core/helm/client-certificate-controller-1.37.15.tgz |
|
event-controller |
https://binary.mirantis.com/core/helm/event-controller-1.37.15.tgz |
|
iam-controller |
https://binary.mirantis.com/core/helm/iam-controller-1.37.15.tgz |
|
kaas-exporter |
https://binary.mirantis.com/core/helm/kaas-exporter-1.37.15.tgz |
|
kaas-public-api |
https://binary.mirantis.com/core/helm/kaas-public-api-1.37.15.tgz |
|
kaas-ui |
||
lcm-controller |
https://binary.mirantis.com/core/helm/lcm-controller-1.37.15.tgz |
|
license-controller |
https://binary.mirantis.com/core/helm/license-controller-1.37.15.tgz |
|
machinepool-controller |
https://binary.mirantis.com/core/helm/machinepool-controller-1.37.15.tgz |
|
mcc-cache |
||
mcc-cache-warmup New |
https://binary.mirantis.com/core/helm/mcc-cache-warmup-1.37.15.tgz |
|
metrics-server |
https://binary.mirantis.com/core/helm/metrics-server-1.37.15.tgz |
|
openstack-provider |
https://binary.mirantis.com/core/helm/openstack-provider-1.37.15.tgz |
|
os-credentials-controller |
https://binary.mirantis.com/core/helm/os-credentials-controller-1.37.15.tgz |
|
portforward-controller |
https://binary.mirantis.com/core/helm/portforward-controller-1.37.15.tgz |
|
proxy-controller |
https://binary.mirantis.com/core/helm/proxy-controller-1.37.15.tgz |
|
rbac-controller |
https://binary.mirantis.com/core/helm/rbac-controller-1.37.15.tgz |
|
release-controller |
https://binary.mirantis.com/core/helm/release-controller-1.37.15.tgz |
|
rhellicense-controller |
https://binary.mirantis.com/core/helm/rhellicense-controller-1.37.15.tgz |
|
scope-controller |
https://binary.mirantis.com/core/helm/scope-controller-1.37.15.tgz |
|
squid-proxy |
https://binary.mirantis.com/core/helm/squid-proxy-1.37.15.tgz |
|
user-controller |
https://binary.mirantis.com/core/helm/user-controller-1.37.15.tgz |
|
vsphere-credentials-controller |
https://binary.mirantis.com/core/helm/vsphere-credentials-controller-1.37.15.tgz |
|
vsphere-provider |
https://binary.mirantis.com/core/helm/vsphere-provider-1.37.15.tgz |
|
vsphere-vm-template-controller |
https://binary.mirantis.com/core/helm/vsphere-vm-template-controller-1.37.15.tgz |
|
Docker images Updated |
admission-controller |
mirantis.azurecr.io/core/admission-controller:1.37.15 2.24.0 |
mirantis.azurecr.io/core/admission-controller:1.37.16 2.24.1(2) |
||
agent-controller |
mirantis.azurecr.io/core/agent-controller:1.37.15 |
|
byo-cluster-api-controller Removed |
n/a |
|
byo-credentials-controller Removed |
n/a |
|
ceph-kcc-controller |
mirantis.azurecr.io/core/ceph-kcc-controller:1.37.15 |
|
cert-manager-controller |
mirantis.azurecr.io/core/external/cert-manager-controller:v1.11.0 |
|
client-certificate-controller |
mirantis.azurecr.io/core/client-certificate-controller:1.37.15 |
|
event-controller |
mirantis.azurecr.io/core/event-controller:1.37.15 |
|
frontend |
mirantis.azurecr.io/core/frontend:1.37.15 |
|
iam-controller |
mirantis.azurecr.io/core/iam-controller:1.37.15 |
|
kaas-exporter |
mirantis.azurecr.io/core/kaas-exporter:1.37.15 |
|
kproxy |
mirantis.azurecr.io/core/kproxy:1.37.15 |
|
lcm-controller |
mirantis.azurecr.io/core/lcm-controller:1.37.15 |
|
license-controller |
mirantis.azurecr.io/core/license-controller:1.37.15 |
|
machinepool-controller |
mirantis.azurecr.io/core/machinepool-controller:1.37.15 |
|
mcc-haproxy |
mirantis.azurecr.io/lcm/mcc-haproxy:v0.22.0-49-g9618f2a |
|
mcc-keepalived |
mirantis.azurecr.io/lcm/mcc-keepalived:v0.22.0-49-g9618f2a |
|
metrics-server |
mirantis.azurecr.io/lcm/metrics-server-amd64:v0.6.3-2 |
|
nginx |
mirantis.azurecr.io/core/external/nginx:1.37.15 |
|
openstack-cloud-controller-manager |
mirantis.azurecr.io/lcm/kubernetes/openstack-cloud-controller-manager-amd64:v1.24.5-10-g93314b86 |
|
openstack-cluster-api-controller |
mirantis.azurecr.io/core/openstack-cluster-api-controller:1.37.15 |
|
os-credentials-controller |
mirantis.azurecr.io/core/os-credentials-controller:1.37.15 |
|
portforward-controller |
mirantis.azurecr.io/core/portforward-controller:1.37.15 |
|
proxy-controller |
mirantis.azurecr.io/core/proxy-controller:1.37.15 |
|
rbac-controller |
mirantis.azurecr.io/core/rbac-controller:1.37.15 |
|
registry |
mirantis.azurecr.io/lcm/registry:v2.8.1-4 |
|
release-controller |
mirantis.azurecr.io/core/release-controller:1.37.15 |
|
rhellicense-controller |
mirantis.azurecr.io/core/rhellicense-controller:1.37.15 |
|
scope-controller |
mirantis.azurecr.io/core/scope-controller:1.37.15 |
|
squid-proxy |
mirantis.azurecr.io/lcm/squid-proxy:0.0.1-10-g24a0d69 |
|
user-controller |
mirantis.azurecr.io/core/user-controller:1.37.15 |
|
vsphere-cluster-api-controller |
mirantis.azurecr.io/core/vsphere-cluster-api-controller:1.37.15 |
|
vsphere-credentials-controller |
mirantis.azurecr.io/core/vsphere-credentials-controller:1.37.15 |
|
vsphere-vm-template-controller |
mirantis.azurecr.io/core/vsphere-vm-template-controller:1.37.15 |
Artifact |
Component |
Path |
|---|---|---|
Binaries |
hash-generate-darwin |
http://binary.mirantis.com/iam/bin/hash-generate-0.0.1-268-3cf7f17-darwin |
hash-generate-linux |
http://binary.mirantis.com/iam/bin/hash-generate-0.0.1-268-3cf7f17-linux |
|
Helm charts |
iam Updated |
|
https://binary.mirantis.com/iam/helm/iam-2.5.3.tgz 2.24.1(2) |
||
Docker images Updated |
keycloak |
mirantis.azurecr.io/iam/keycloak:0.6.0 |
kubernetes-entrypoint |
mirantis.azurecr.io/openstack/extra/kubernetes-entrypoint:v1.0.1-27d64fb-20230421151539 |
|
mariadb |
mirantis.azurecr.io/general/mariadb:10.6.12-focal-20230423170220 |
In total, since Container Cloud 2.23.0 major release, in 2.24.0, 2130 Common Vulnerabilities and Exposures (CVE) have been fixed: 98 of critical and 2032 of high severity.
Among them, 984 CVEs that are listed in Addressed CVEs - detailed Addressed CVEs - detailed have been fixed since the 2.23.5 patch release: 62 of critical and 922 of high severity. The remaining CVEs were addressed since Container Cloud 2.23.0 and the fixes released with the patch releases of the 2.23.x series.
The summary table contains the total number of unique CVEs along with the total number of issues fixed across the images.
The full list of the CVEs present in the current Container Cloud release is available at the Mirantis Security Portal.
Severity |
Critical |
High |
Total |
|---|---|---|---|
Unique CVEs |
18 |
88 |
106 |
Total issues across images |
62 |
922 |
984 |
Image |
Component name |
CVE |
|---|---|---|
bm/baremetal-dnsmasq |
libcrypto3 |
CVE-2023-2650 (High) |
libssl3 |
CVE-2023-2650 (High) |
|
bm/baremetal-operator |
libcrypto3 |
CVE-2023-2650 (High) |
libssl3 |
CVE-2023-2650 (High) |
|
cryptography |
CVE-2023-2650 (High) |
|
bm/bm-collective |
libcrypto3 |
CVE-2023-2650 (High) |
libssl3 |
CVE-2023-2650 (High) |
|
bm/kaas-ipam |
libcrypto3 |
CVE-2023-2650 (High) |
libssl3 |
CVE-2023-2650 (High) |
|
bm/syslog-ng |
libcrypto3 |
CVE-2023-2650 (High) |
libssl3 |
CVE-2023-2650 (High) |
|
ncurses-libs |
CVE-2023-29491 (High) |
|
ncurses-terminfo-base |
CVE-2023-29491 (High) |
|
ceph/mcp/ceph-controller |
libcrypto3 |
CVE-2023-2650 (High) |
libssl3 |
CVE-2023-2650 (High) |
|
ceph/rook |
openssl |
CVE-2022-3786 (High) |
CVE-2023-0286 (High) |
||
CVE-2022-3602 (High) |
||
openssl-libs |
CVE-2022-3602 (High) |
|
CVE-2022-3786 (High) |
||
CVE-2023-0286 (High) |
||
cryptography |
CVE-2023-2650 (High) |
|
core/admission-controller |
helm.sh/helm/v3 |
CVE-2021-32690 (High) |
CVE-2022-23525 (High) |
||
CVE-2022-23526 (High) |
||
CVE-2022-23524 (High) |
||
github.com/containerd/containerd |
CVE-2023-25173 (High) |
|
github.com/docker/docker |
CVE-2023-28840 (High) |
|
libcrypto3 |
CVE-2023-2650 (High) |
|
libssl3 |
CVE-2023-2650 (High) |
|
core/agent-controller |
helm.sh/helm/v3 |
CVE-2021-32690 (High) |
CVE-2022-23525 (High) |
||
CVE-2022-23526 (High) |
||
CVE-2022-23524 (High) |
||
github.com/containerd/containerd |
CVE-2023-25173 (High) |
|
github.com/docker/docker |
CVE-2023-28840 (High) |
|
libcrypto3 |
CVE-2023-2650 (High) |
|
libssl3 |
CVE-2023-2650 (High) |
|
core/aws-cluster-api-controller |
helm.sh/helm/v3 |
CVE-2021-32690 (High) |
CVE-2022-23525 (High) |
||
CVE-2022-23526 (High) |
||
CVE-2022-23524 (High) |
||
github.com/containerd/containerd |
CVE-2023-25173 (High) |
|
github.com/docker/docker |
CVE-2023-28840 (High) |
|
libcrypto3 |
CVE-2023-2650 (High) |
|
libssl3 |
CVE-2023-2650 (High) |
|
core/aws-credentials-controller |
github.com/containerd/containerd |
CVE-2023-25173 (High) |
github.com/docker/docker |
CVE-2023-28840 (High) |
|
libcrypto3 |
CVE-2023-2650 (High) |
|
libssl3 |
CVE-2023-2650 (High) |
|
core/azure-cluster-api-controller |
helm.sh/helm/v3 |
CVE-2022-23525 (High) |
CVE-2022-23526 (High) |
||
CVE-2022-23524 (High) |
||
CVE-2021-32690 (High) |
||
github.com/containerd/containerd |
CVE-2023-25173 (High) |
|
github.com/docker/docker |
CVE-2023-28840 (High) |
|
libcrypto3 |
CVE-2023-2650 (High) |
|
libssl3 |
CVE-2023-2650 (High) |
|
core/azure-credentials-controller |
helm.sh/helm/v3 |
CVE-2021-32690 (High) |
CVE-2022-23525 (High) |
||
CVE-2022-23526 (High) |
||
CVE-2022-23524 (High) |
||
github.com/containerd/containerd |
CVE-2023-25173 (High) |
|
github.com/docker/docker |
CVE-2023-28840 (High) |
|
libcrypto3 |
CVE-2023-2650 (High) |
|
libssl3 |
CVE-2023-2650 (High) |
|
core/bootstrap-controller |
helm.sh/helm/v3 |
CVE-2022-23525 (High) |
CVE-2022-23526 (High) |
||
CVE-2022-23524 (High) |
||
CVE-2021-32690 (High) |
||
github.com/containerd/containerd |
CVE-2023-25173 (High) |
|
github.com/docker/docker |
CVE-2023-28840 (High) |
|
libcrypto3 |
CVE-2023-2650 (High) |
|
libssl3 |
CVE-2023-2650 (High) |
|
core/byo-cluster-api-controller |
helm.sh/helm/v3 |
CVE-2021-32690 (High) |
CVE-2022-23525 (High) |
||
CVE-2022-23526 (High) |
||
CVE-2022-23524 (High) |
||
github.com/containerd/containerd |
CVE-2023-25173 (High) |
|
github.com/docker/docker |
CVE-2023-28840 (High) |
|
libcrypto3 |
CVE-2023-2650 (High) |
|
libssl3 |
CVE-2023-2650 (High) |
|
core/byo-credentials-controller |
github.com/containerd/containerd |
CVE-2023-25173 (High) |
github.com/docker/docker |
CVE-2023-28840 (High) |
|
libcrypto3 |
CVE-2023-2650 (High) |
|
libssl3 |
CVE-2023-2650 (High) |
|
core/ceph-kcc-controller |
helm.sh/helm/v3 |
CVE-2022-23525 (High) |
CVE-2022-23526 (High) |
||
CVE-2022-23524 (High) |
||
CVE-2021-32690 (High) |
||
github.com/containerd/containerd |
CVE-2023-25173 (High) |
|
github.com/docker/docker |
CVE-2023-28840 (High) |
|
libcrypto3 |
CVE-2023-2650 (High) |
|
libssl3 |
CVE-2023-2650 (High) |
|
core/cluster-api-provider-baremetal |
helm.sh/helm/v3 |
CVE-2022-23525 (High) |
CVE-2022-23526 (High) |
||
CVE-2022-23524 (High) |
||
CVE-2021-32690 (High) |
||
github.com/containerd/containerd |
CVE-2023-25173 (High) |
|
github.com/docker/docker |
CVE-2023-28840 (High) |
|
libcrypto3 |
CVE-2023-2650 (High) |
|
libssl3 |
CVE-2023-2650 (High) |
|
core/configuration-collector |
helm.sh/helm/v3 |
CVE-2021-32690 (High) |
CVE-2022-23525 (High) |
||
CVE-2022-23526 (High) |
||
CVE-2022-23524 (High) |
||
github.com/containerd/containerd |
CVE-2023-25173 (High) |
|
github.com/docker/docker |
CVE-2023-28840 (High) |
|
libcrypto3 |
CVE-2023-2650 (High) |
|
libssl3 |
CVE-2023-2650 (High) |
|
core/equinix-cluster-api-controller |
helm.sh/helm/v3 |
CVE-2021-32690 (High) |
CVE-2022-23525 (High) |
||
CVE-2022-23526 (High) |
||
CVE-2022-23524 (High) |
||
github.com/containerd/containerd |
CVE-2023-25173 (High) |
|
github.com/docker/docker |
CVE-2023-28840 (High) |
|
libcrypto3 |
CVE-2023-2650 (High) |
|
libssl3 |
CVE-2023-2650 (High) |
|
core/equinix-credentials-controller |
helm.sh/helm/v3 |
CVE-2021-32690 (High) |
CVE-2022-23525 (High) |
||
CVE-2022-23526 (High) |
||
CVE-2022-23524 (High) |
||
github.com/containerd/containerd |
CVE-2023-25173 (High) |
|
github.com/docker/docker |
CVE-2023-28840 (High) |
|
libcrypto3 |
CVE-2023-2650 (High) |
|
libssl3 |
CVE-2023-2650 (High) |
|
core/event-controller |
github.com/containerd/containerd |
CVE-2023-25173 (High) |
github.com/docker/docker |
CVE-2023-28840 (High) |
|
libcrypto3 |
CVE-2023-2650 (High) |
|
libssl3 |
CVE-2023-2650 (High) |
|
core/external/nginx |
libcrypto3 |
CVE-2023-2650 (High) |
libssl3 |
CVE-2023-2650 (High) |
|
libx11 |
CVE-2023-3138 (High) |
|
ncurses-libs |
CVE-2023-29491 (High) |
|
ncurses-terminfo-base |
CVE-2023-29491 (High) |
|
core/frontend |
libcrypto3 |
CVE-2023-2650 (High) |
libssl3 |
CVE-2023-2650 (High) |
|
libx11 |
CVE-2023-3138 (High) |
|
ncurses-libs |
CVE-2023-29491 (High) |
|
ncurses-terminfo-base |
CVE-2023-29491 (High) |
|
core/iam-controller |
github.com/containerd/containerd |
CVE-2023-25173 (High) |
github.com/docker/docker |
CVE-2023-28840 (High) |
|
libcrypto3 |
CVE-2023-2650 (High) |
|
libssl3 |
CVE-2023-2650 (High) |
|
core/kaas-exporter |
helm.sh/helm/v3 |
CVE-2021-32690 (High) |
CVE-2022-23525 (High) |
||
CVE-2022-23526 (High) |
||
CVE-2022-23524 (High) |
||
github.com/containerd/containerd |
CVE-2023-25173 (High) |
|
github.com/docker/docker |
CVE-2023-28840 (High) |
|
libcrypto3 |
CVE-2023-2650 (High) |
|
libssl3 |
CVE-2023-2650 (High) |
|
core/kproxy |
libcrypto3 |
CVE-2023-2650 (High) |
libssl3 |
CVE-2023-2650 (High) |
|
core/lcm-controller |
github.com/containerd/containerd |
CVE-2023-25173 (High) |
github.com/docker/docker |
CVE-2023-28840 (High) |
|
libcrypto3 |
CVE-2023-2650 (High) |
|
libssl3 |
CVE-2023-2650 (High) |
|
core/license-controller |
github.com/containerd/containerd |
CVE-2023-25173 (High) |
github.com/docker/docker |
CVE-2023-28840 (High) |
|
libcrypto3 |
CVE-2023-2650 (High) |
|
libssl3 |
CVE-2023-2650 (High) |
|
core/machinepool-controller |
github.com/containerd/containerd |
CVE-2023-25173 (High) |
github.com/docker/docker |
CVE-2023-28840 (High) |
|
libcrypto3 |
CVE-2023-2650 (High) |
|
libssl3 |
CVE-2023-2650 (High) |
|
core/openstack-cluster-api-controller |
helm.sh/helm/v3 |
CVE-2022-23525 (High) |
CVE-2022-23526 (High) |
||
CVE-2022-23524 (High) |
||
CVE-2021-32690 (High) |
||
github.com/containerd/containerd |
CVE-2023-25173 (High) |
|
github.com/docker/docker |
CVE-2023-28840 (High) |
|
libcrypto3 |
CVE-2023-2650 (High) |
|
libssl3 |
CVE-2023-2650 (High) |
|
core/os-credentials-controller |
github.com/containerd/containerd |
CVE-2023-25173 (High) |
github.com/docker/docker |
CVE-2023-28840 (High) |
|
libcrypto3 |
CVE-2023-2650 (High) |
|
libssl3 |
CVE-2023-2650 (High) |
|
core/portforward-controller |
helm.sh/helm/v3 |
CVE-2022-23525 (High) |
CVE-2022-23526 (High) |
||
CVE-2022-23524 (High) |
||
CVE-2021-32690 (High) |
||
github.com/containerd/containerd |
CVE-2023-25173 (High) |
|
github.com/docker/docker |
CVE-2023-28840 (High) |
|
libcrypto3 |
CVE-2023-2650 (High) |
|
libssl3 |
CVE-2023-2650 (High) |
|
core/proxy-controller |
github.com/containerd/containerd |
CVE-2023-25173 (High) |
github.com/docker/docker |
CVE-2023-28840 (High) |
|
libcrypto3 |
CVE-2023-2650 (High) |
|
libssl3 |
CVE-2023-2650 (High) |
|
core/rbac-controller |
github.com/containerd/containerd |
CVE-2023-25173 (High) |
github.com/docker/docker |
CVE-2023-28840 (High) |
|
libcrypto3 |
CVE-2023-2650 (High) |
|
libssl3 |
CVE-2023-2650 (High) |
|
core/release-controller |
helm.sh/helm/v3 |
CVE-2021-32690 (High) |
CVE-2022-23525 (High) |
||
CVE-2022-23526 (High) |
||
CVE-2022-23524 (High) |
||
github.com/containerd/containerd |
CVE-2023-25173 (High) |
|
github.com/docker/docker |
CVE-2023-28840 (High) |
|
libcrypto3 |
CVE-2023-2650 (High) |
|
libssl3 |
CVE-2023-2650 (High) |
|
core/rhellicense-controller |
github.com/containerd/containerd |
CVE-2023-25173 (High) |
github.com/docker/docker |
CVE-2023-28840 (High) |
|
libcrypto3 |
CVE-2023-2650 (High) |
|
libssl3 |
CVE-2023-2650 (High) |
|
core/scope-controller |
github.com/containerd/containerd |
CVE-2023-25173 (High) |
github.com/docker/docker |
CVE-2023-28840 (High) |
|
libcrypto3 |
CVE-2023-2650 (High) |
|
libssl3 |
CVE-2023-2650 (High) |
|
core/user-controller |
github.com/containerd/containerd |
CVE-2023-25173 (High) |
github.com/docker/docker |
CVE-2023-28840 (High) |
|
libcrypto3 |
CVE-2023-2650 (High) |
|
libssl3 |
CVE-2023-2650 (High) |
|
core/vsphere-cluster-api-controller |
helm.sh/helm/v3 |
CVE-2022-23525 (High) |
CVE-2022-23526 (High) |
||
CVE-2022-23524 (High) |
||
CVE-2021-32690 (High) |
||
github.com/containerd/containerd |
CVE-2023-25173 (High) |
|
github.com/docker/docker |
CVE-2023-28840 (High) |
|
libcrypto3 |
CVE-2023-2650 (High) |
|
libssl3 |
CVE-2023-2650 (High) |
|
core/vsphere-credentials-controller |
helm.sh/helm/v3 |
CVE-2022-23525 (High) |
CVE-2022-23526 (High) |
||
CVE-2022-23524 (High) |
||
CVE-2021-32690 (High) |
||
github.com/containerd/containerd |
CVE-2023-25173 (High) |
|
github.com/docker/docker |
CVE-2023-28840 (High) |
|
libcrypto3 |
CVE-2023-2650 (High) |
|
libssl3 |
CVE-2023-2650 (High) |
|
core/vsphere-vm-template-controller |
helm.sh/helm/v3 |
CVE-2021-32690 (High) |
CVE-2022-23525 (High) |
||
CVE-2022-23526 (High) |
||
CVE-2022-23524 (High) |
||
github.com/containerd/containerd |
CVE-2023-25173 (High) |
|
github.com/docker/docker |
CVE-2023-28840 (High) |
|
libcrypto3 |
CVE-2023-2650 (High) |
|
libssl3 |
CVE-2023-2650 (High) |
|
iam/keycloak |
io.vertx:vertx-core |
CVE-2021-4125 (High) |
CVE-2021-44228 (Critical) |
||
CVE-2021-44530 (Critical) |
||
CVE-2021-45046 (Critical) |
||
org.apache.cxf:cxf-core |
CVE-2022-46364 (Critical) |
|
CVE-2022-46363 (High) |
||
org.apache.cxf:cxf-rt-transports-http |
CVE-2022-46363 (High) |
|
CVE-2022-46364 (Critical) |
||
org.apache.santuario:xmlsec |
CVE-2022-21476 (High) |
|
CVE-2022-47966 (Critical) |
||
org.apache.kafka:kafka-clients |
CVE-2023-25194 (High) |
|
CVE-2021-46877 (High) |
||
CVE-2020-36518 (High) |
||
com.fasterxml.jackson.core:jackson-databind |
CVE-2023-35116 (High) |
|
CVE-2022-42003 (High) |
||
CVE-2022-42004 (High) |
||
CVE-2023-35116 (High) |
||
CVE-2022-42003 (High) |
||
CVE-2022-42004 (High) |
||
CVE-2023-35116 (High) |
||
CVE-2022-42003 (High) |
||
CVE-2022-42004 (High) |
||
com.google.protobuf:protobuf-java |
CVE-2022-3509 (High) |
|
CVE-2022-3510 (High) |
||
com.google.protobuf:protobuf-java-util |
CVE-2022-3509 (High) |
|
CVE-2022-3510 (High) |
||
org.yaml:snakeyaml |
CVE-2022-25857 (High) |
|
java-11-openjdk-headless |
CVE-2023-21930 (High) |
|
platform-python |
CVE-2023-24329 (High) |
|
python3-libs |
CVE-2023-24329 (High) |
|
lcm/docker/ucp |
curl |
CVE-2023-27533 (High) |
CVE-2023-27534 (High) |
||
CVE-2023-27536 (High) |
||
CVE-2023-23914 (Critical) |
||
CVE-2023-28319 (High) |
||
libcurl |
CVE-2023-28319 (High) |
|
CVE-2023-27533 (High) |
||
CVE-2023-27534 (High) |
||
CVE-2023-27536 (High) |
||
CVE-2023-23914 (Critical) |
||
github.com/crewjam/saml |
CVE-2022-41912 (Critical) |
|
CVE-2023-28119 (High) |
||
libcrypto1.1 |
CVE-2023-0464 (High) |
|
CVE-2023-2650 (High) |
||
libssl1.1 |
CVE-2023-0464 (High) |
|
CVE-2023-2650 (High) |
||
github.com/containerd/containerd |
CVE-2023-25173 (High) |
|
github.com/docker/docker |
CVE-2023-28840 (High) |
|
github.com/opencontainers/runc |
CVE-2023-28642 (High) |
|
github.com/docker/cli |
CVE-2021-41092 (High) |
|
golang.org/x/net |
CVE-2022-27664 (High) |
|
golang.org/x/text |
CVE-2022-32149 (High) |
|
ncurses-libs |
CVE-2023-29491 (High) |
|
ncurses-terminfo-base |
CVE-2023-29491 (High) |
|
lcm/docker/ucp-agent |
curl |
CVE-2023-27533 (High) |
CVE-2023-27534 (High) |
||
CVE-2023-27536 (High) |
||
CVE-2023-28319 (High) |
||
CVE-2023-23914 (Critical) |
||
libcurl |
CVE-2023-23914 (Critical) |
|
CVE-2023-28319 (High) |
||
CVE-2023-27533 (High) |
||
CVE-2023-27534 (High) |
||
CVE-2023-27536 (High) |
||
github.com/crewjam/saml |
CVE-2022-41912 (Critical) |
|
CVE-2023-28119 (High) |
||
libcrypto1.1 |
CVE-2023-2650 (High) |
|
CVE-2023-0464 (High) |
||
CVE-2022-4450 (High) |
||
CVE-2023-0215 (High) |
||
CVE-2023-0286 (High) |
||
libssl1.1 |
CVE-2023-0464 (High) |
|
CVE-2023-2650 (High) |
||
CVE-2022-4450 (High) |
||
CVE-2023-0215 (High) |
||
CVE-2023-0286 (High) |
||
github.com/containerd/containerd |
CVE-2023-25173 (High) |
|
github.com/docker/docker |
CVE-2023-28840 (High) |
|
github.com/opencontainers/runc |
CVE-2023-28642 (High) |
|
github.com/docker/cli |
CVE-2021-41092 (High) |
|
golang.org/x/net |
CVE-2022-27664 (High) |
|
golang.org/x/text |
CVE-2022-32149 (High) |
|
lcm/docker/ucp-auth |
curl |
CVE-2023-23914 (Critical) |
CVE-2023-27533 (High) |
||
CVE-2023-27534 (High) |
||
CVE-2023-27536 (High) |
||
CVE-2023-28319 (High) |
||
libcurl |
CVE-2023-27533 (High) |
|
CVE-2023-27534 (High) |
||
CVE-2023-27536 (High) |
||
CVE-2023-28319 (High) |
||
CVE-2023-23914 (Critical) |
||
github.com/crewjam/saml |
CVE-2022-41912 (Critical) |
|
CVE-2023-28119 (High) |
||
libcrypto1.1 |
CVE-2023-0464 (High) |
|
CVE-2022-4450 (High) |
||
CVE-2023-0215 (High) |
||
CVE-2023-0286 (High) |
||
CVE-2023-2650 (High) |
||
libssl1.1 |
CVE-2023-2650 (High) |
|
CVE-2022-4450 (High) |
||
CVE-2023-0215 (High) |
||
CVE-2023-0286 (High) |
||
CVE-2023-0464 (High) |
||
golang.org/x/net |
CVE-2022-27664 (High) |
|
golang.org/x/text |
CVE-2022-32149 (High) |
|
lcm/docker/ucp-auth-store |
github.com/crewjam/saml |
CVE-2023-28119 (High) |
CVE-2022-41912 (Critical) |
||
curl |
CVE-2023-28319 (High) |
|
CVE-2023-27533 (High) |
||
CVE-2023-27534 (High) |
||
CVE-2023-27536 (High) |
||
libcurl |
CVE-2023-28319 (High) |
|
CVE-2023-27533 (High) |
||
CVE-2023-27534 (High) |
||
CVE-2023-27536 (High) |
||
libcrypto1.1 |
CVE-2023-2650 (High) |
|
CVE-2023-0464 (High) |
||
libssl1.1 |
CVE-2023-0464 (High) |
|
CVE-2023-2650 (High) |
||
github.com/containerd/containerd |
CVE-2023-25173 (High) |
|
github.com/docker/docker |
CVE-2023-28840 (High) |
|
golang.org/x/net |
CVE-2022-27664 (High) |
|
golang.org/x/text |
CVE-2022-32149 (High) |
|
ncurses-libs |
CVE-2023-29491 (High) |
|
ncurses-terminfo-base |
CVE-2023-29491 (High) |
|
lcm/docker/ucp-azure-ip-allocator |
curl |
CVE-2023-27533 (High) |
CVE-2023-27534 (High) |
||
CVE-2023-27536 (High) |
||
CVE-2023-28319 (High) |
||
libcurl |
CVE-2023-27533 (High) |
|
CVE-2023-27534 (High) |
||
CVE-2023-27536 (High) |
||
CVE-2023-28319 (High) |
||
libcrypto1.1 |
CVE-2023-2650 (High) |
|
CVE-2023-0464 (High) |
||
libssl1.1 |
CVE-2023-2650 (High) |
|
CVE-2023-0464 (High) |
||
ncurses-libs |
CVE-2023-29491 (High) |
|
ncurses-terminfo-base |
CVE-2023-29491 (High) |
|
lcm/docker/ucp-calico-cni |
github.com/emicklei/go-restful |
CVE-2022-1996 (Critical) |
golang.org/x/crypto |
CVE-2022-27191 (High) |
|
CVE-2020-29652 (High) |
||
CVE-2021-43565 (High) |
||
golang.org/x/text |
CVE-2022-32149 (High) |
|
CVE-2020-14040 (High) |
||
CVE-2021-38561 (High) |
||
CVE-2022-32149 (High) |
||
golang.org/x/net |
CVE-2022-27664 (High) |
|
CVE-2021-33194 (High) |
||
CVE-2022-27664 (High) |
||
github.com/containernetworking/cni |
CVE-2021-20206 (High) |
|
github.com/gogo/protobuf |
CVE-2021-3121 (High) |
|
lcm/docker/ucp-calico-kube-controllers |
github.com/emicklei/go-restful |
CVE-2022-1996 (Critical) |
golang.org/x/net |
CVE-2022-27664 (High) |
|
golang.org/x/text |
CVE-2022-32149 (High) |
|
lcm/docker/ucp-calico-node |
github.com/emicklei/go-restful |
CVE-2022-1996 (Critical) |
openssl-libs |
CVE-2023-0286 (High) |
|
golang.org/x/net |
CVE-2022-27664 (High) |
|
golang.org/x/text |
CVE-2022-32149 (High) |
|
lcm/docker/ucp-cfssl |
curl |
CVE-2023-28319 (High) |
CVE-2023-27533 (High) |
||
CVE-2023-27534 (High) |
||
CVE-2023-27536 (High) |
||
CVE-2023-23914 (Critical) |
||
libcurl |
CVE-2023-23914 (Critical) |
|
CVE-2023-28319 (High) |
||
CVE-2023-27533 (High) |
||
CVE-2023-27534 (High) |
||
CVE-2023-27536 (High) |
||
libcrypto1.1 |
CVE-2022-4450 (High) |
|
CVE-2023-0215 (High) |
||
CVE-2023-0286 (High) |
||
CVE-2023-0464 (High) |
||
CVE-2023-2650 (High) |
||
libssl1.1 |
CVE-2022-4450 (High) |
|
CVE-2023-0215 (High) |
||
CVE-2023-0286 (High) |
||
CVE-2023-0464 (High) |
||
CVE-2023-2650 (High) |
||
golang.org/x/net |
CVE-2022-27664 (High) |
|
golang.org/x/text |
CVE-2022-32149 (High) |
|
lcm/docker/ucp-compose |
github.com/emicklei/go-restful |
CVE-2022-1996 (Critical) |
golang.org/x/crypto |
CVE-2021-43565 (High) |
|
CVE-2022-27191 (High) |
||
CVE-2021-43565 (High) |
||
CVE-2022-27191 (High) |
||
golang.org/x/net |
CVE-2021-33194 (High) |
|
CVE-2022-27664 (High) |
||
CVE-2021-33194 (High) |
||
CVE-2022-27664 (High) |
||
golang.org/x/text |
CVE-2022-32149 (High) |
|
CVE-2021-38561 (High) |
||
CVE-2022-32149 (High) |
||
CVE-2021-38561 (High) |
||
CVE-2022-32149 (High) |
||
github.com/containerd/containerd |
CVE-2023-25173 (High) |
|
github.com/docker/docker |
CVE-2023-28840 (High) |
|
github.com/prometheus/client_golang |
CVE-2022-21698 (High) |
|
lcm/docker/ucp-containerd-shim-process |
golang.org/x/net |
CVE-2021-33194 (High) |
CVE-2022-27664 (High) |
||
CVE-2021-33194 (High) |
||
github.com/containerd/containerd |
CVE-2023-25173 (High) |
|
lcm/docker/ucp-controller |
curl |
CVE-2023-27533 (High) |
CVE-2023-27534 (High) |
||
CVE-2023-27536 (High) |
||
CVE-2023-28319 (High) |
||
CVE-2023-23914 (Critical) |
||
libcurl |
CVE-2023-23914 (Critical) |
|
CVE-2023-27533 (High) |
||
CVE-2023-27534 (High) |
||
CVE-2023-27536 (High) |
||
CVE-2023-28319 (High) |
||
github.com/crewjam/saml |
CVE-2022-41912 (Critical) |
|
CVE-2023-28119 (High) |
||
libcrypto1.1 |
CVE-2023-2650 (High) |
|
CVE-2023-0464 (High) |
||
CVE-2022-4450 (High) |
||
CVE-2023-0215 (High) |
||
CVE-2023-0286 (High) |
||
libssl1.1 |
CVE-2023-2650 (High) |
|
CVE-2022-4450 (High) |
||
CVE-2023-0215 (High) |
||
CVE-2023-0286 (High) |
||
CVE-2023-0464 (High) |
||
github.com/containerd/containerd |
CVE-2023-25173 (High) |
|
github.com/docker/docker |
CVE-2023-28840 (High) |
|
github.com/opencontainers/runc |
CVE-2023-28642 (High) |
|
github.com/docker/cli |
CVE-2021-41092 (High) |
|
golang.org/x/net |
CVE-2022-27664 (High) |
|
golang.org/x/text |
CVE-2022-32149 (High) |
|
lcm/docker/ucp-coredns |
golang.org/x/net |
CVE-2022-27664 (High) |
CVE-2022-41721 (High) |
||
golang.org/x/text |
CVE-2022-32149 (High) |
|
lcm/docker/ucp-dsinfo |
github.com/emicklei/go-restful |
CVE-2022-1996 (Critical) |
golang.org/x/crypto |
CVE-2021-43565 (High) |
|
CVE-2022-27191 (High) |
||
CVE-2021-43565 (High) |
||
golang.org/x/net |
CVE-2022-27664 (High) |
|
CVE-2021-33194 (High) |
||
CVE-2022-27664 (High) |
||
golang.org/x/text |
CVE-2022-32149 (High) |
|
CVE-2021-38561 (High) |
||
CVE-2022-32149 (High) |
||
CVE-2021-38561 (High) |
||
CVE-2022-32149 (High) |
||
github.com/containerd/containerd |
CVE-2023-25173 (High) |
|
github.com/docker/docker |
CVE-2023-28840 (High) |
|
github.com/prometheus/client_golang |
CVE-2022-21698 (High) |
|
lcm/docker/ucp-etcd |
curl |
CVE-2023-28319 (High) |
CVE-2023-27533 (High) |
||
CVE-2023-27534 (High) |
||
CVE-2023-27536 (High) |
||
CVE-2023-23914 (Critical) |
||
libcurl |
CVE-2023-28319 (High) |
|
CVE-2023-23914 (Critical) |
||
CVE-2023-27533 (High) |
||
CVE-2023-27534 (High) |
||
CVE-2023-27536 (High) |
||
libcrypto1.1 |
CVE-2023-2650 (High) |
|
CVE-2022-4450 (High) |
||
CVE-2023-0215 (High) |
||
CVE-2023-0286 (High) |
||
CVE-2023-0464 (High) |
||
libssl1.1 |
CVE-2023-0464 (High) |
|
CVE-2023-2650 (High) |
||
CVE-2022-4450 (High) |
||
CVE-2023-0215 (High) |
||
CVE-2023-0286 (High) |
||
golang.org/x/text |
CVE-2022-32149 (High) |
|
CVE-2021-38561 (High) |
||
CVE-2022-32149 (High) |
||
CVE-2021-38561 (High) |
||
CVE-2022-32149 (High) |
||
golang.org/x/net |
CVE-2022-27664 (High) |
|
lcm/docker/ucp-hardware-info |
curl |
CVE-2023-28319 (High) |
CVE-2023-27533 (High) |
||
CVE-2023-27534 (High) |
||
CVE-2023-27536 (High) |
||
CVE-2023-23914 (Critical) |
||
libcurl |
CVE-2023-27533 (High) |
|
CVE-2023-27534 (High) |
||
CVE-2023-27536 (High) |
||
CVE-2023-23914 (Critical) |
||
CVE-2023-28319 (High) |
||
libcrypto1.1 |
CVE-2022-4450 (High) |
|
CVE-2023-0215 (High) |
||
CVE-2023-0286 (High) |
||
CVE-2023-2650 (High) |
||
CVE-2023-0464 (High) |
||
libssl1.1 |
CVE-2022-4450 (High) |
|
CVE-2023-0215 (High) |
||
CVE-2023-0286 (High) |
||
CVE-2023-2650 (High) |
||
CVE-2023-0464 (High) |
||
github.com/containerd/containerd |
CVE-2023-25173 (High) |
|
github.com/docker/docker |
CVE-2023-28840 (High) |
|
golang.org/x/net |
CVE-2022-27664 (High) |
|
golang.org/x/text |
CVE-2022-32149 (High) |
|
lcm/docker/ucp-interlock |
curl |
CVE-2023-27533 (High) |
CVE-2023-27534 (High) |
||
CVE-2023-27536 (High) |
||
CVE-2023-28319 (High) |
||
CVE-2023-23914 (Critical) |
||
libcurl |
CVE-2023-28319 (High) |
|
CVE-2023-23914 (Critical) |
||
CVE-2023-27533 (High) |
||
CVE-2023-27534 (High) |
||
CVE-2023-27536 (High) |
||
libcrypto1.1 |
CVE-2022-4450 (High) |
|
CVE-2023-0215 (High) |
||
CVE-2023-0286 (High) |
||
CVE-2023-2650 (High) |
||
CVE-2023-0464 (High) |
||
libssl1.1 |
CVE-2022-4450 (High) |
|
CVE-2023-0215 (High) |
||
CVE-2023-0286 (High) |
||
CVE-2023-2650 (High) |
||
CVE-2023-0464 (High) |
||
golang.org/x/net |
CVE-2022-41721 (High) |
|
CVE-2022-27664 (High) |
||
github.com/containerd/containerd |
CVE-2023-25173 (High) |
|
golang.org/x/text |
CVE-2022-32149 (High) |
|
lcm/docker/ucp-interlock-config |
curl |
CVE-2023-27533 (High) |
CVE-2023-27534 (High) |
||
CVE-2023-27536 (High) |
||
CVE-2023-28319 (High) |
||
libcurl |
CVE-2023-27533 (High) |
|
CVE-2023-27534 (High) |
||
CVE-2023-27536 (High) |
||
CVE-2023-28319 (High) |
||
libcrypto1.1 |
CVE-2023-2650 (High) |
|
CVE-2023-0464 (High) |
||
libssl1.1 |
CVE-2023-2650 (High) |
|
CVE-2023-0464 (High) |
||
libwebp |
CVE-2023-1999 (High) |
|
ncurses-libs |
CVE-2023-29491 (High) |
|
ncurses-terminfo-base |
CVE-2023-29491 (High) |
|
lcm/docker/ucp-interlock-extension |
curl |
CVE-2023-27533 (High) |
CVE-2023-27534 (High) |
||
CVE-2023-27536 (High) |
||
CVE-2023-28319 (High) |
||
CVE-2023-23914 (Critical) |
||
libcurl |
CVE-2023-27533 (High) |
|
CVE-2023-27534 (High) |
||
CVE-2023-27536 (High) |
||
CVE-2023-23914 (Critical) |
||
CVE-2023-28319 (High) |
||
libcrypto1.1 |
CVE-2023-2650 (High) |
|
CVE-2023-0464 (High) |
||
CVE-2022-4450 (High) |
||
CVE-2023-0215 (High) |
||
CVE-2023-0286 (High) |
||
libssl1.1 |
CVE-2022-4450 (High) |
|
CVE-2023-0215 (High) |
||
CVE-2023-0286 (High) |
||
CVE-2023-0464 (High) |
||
CVE-2023-2650 (High) |
||
golang.org/x/net |
CVE-2022-41721 (High) |
|
CVE-2022-27664 (High) |
||
golang.org/x/text |
CVE-2022-32149 (High) |
|
lcm/docker/ucp-interlock-proxy |
curl |
CVE-2023-27533 (High) |
CVE-2023-27534 (High) |
||
CVE-2023-27536 (High) |
||
CVE-2023-28319 (High) |
||
libcurl |
CVE-2023-27533 (High) |
|
CVE-2023-27534 (High) |
||
CVE-2023-27536 (High) |
||
CVE-2023-28319 (High) |
||
libcrypto1.1 |
CVE-2023-2650 (High) |
|
CVE-2023-0464 (High) |
||
libssl1.1 |
CVE-2023-0464 (High) |
|
CVE-2023-2650 (High) |
||
libwebp |
CVE-2023-1999 (High) |
|
ncurses-libs |
CVE-2023-29491 (High) |
|
ncurses-terminfo-base |
CVE-2023-29491 (High) |
|
lcm/docker/ucp-kube-ingress-controller |
curl |
CVE-2022-43551 (High) |
CVE-2023-27533 (High) |
||
CVE-2023-27534 (High) |
||
CVE-2023-27536 (High) |
||
CVE-2023-23914 (Critical) |
||
CVE-2022-32221 (Critical) |
||
CVE-2022-42915 (High) |
||
CVE-2022-42916 (High) |
||
CVE-2023-28319 (High) |
||
libcurl |
CVE-2022-32221 (Critical) |
|
CVE-2022-42915 (High) |
||
CVE-2022-42916 (High) |
||
CVE-2023-23914 (Critical) |
||
CVE-2023-27533 (High) |
||
CVE-2023-27534 (High) |
||
CVE-2023-27536 (High) |
||
CVE-2023-28319 (High) |
||
CVE-2022-43551 (High) |
||
libcrypto1.1 |
CVE-2023-0464 (High) |
|
CVE-2023-2650 (High) |
||
CVE-2022-4450 (High) |
||
CVE-2023-0215 (High) |
||
CVE-2023-0286 (High) |
||
libssl1.1 |
CVE-2022-4450 (High) |
|
CVE-2023-0215 (High) |
||
CVE-2023-0286 (High) |
||
CVE-2023-0464 (High) |
||
CVE-2023-2650 (High) |
||
openssl |
CVE-2022-4450 (High) |
|
CVE-2023-0215 (High) |
||
CVE-2023-0286 (High) |
||
CVE-2023-2650 (High) |
||
CVE-2023-0464 (High) |
||
golang.org/x/net |
CVE-2022-41721 (High) |
|
CVE-2022-27664 (High) |
||
libxml2 |
CVE-2022-40303 (High) |
|
CVE-2022-40304 (High) |
||
github.com/opencontainers/runc |
CVE-2023-28642 (High) |
|
golang.org/x/text |
CVE-2022-32149 (High) |
|
ncurses-libs |
CVE-2023-29491 (High) |
|
ncurses-terminfo-base |
CVE-2023-29491 (High) |
|
lcm/docker/ucp-metrics |
curl |
CVE-2023-27533 (High) |
CVE-2023-27534 (High) |
||
CVE-2023-27536 (High) |
||
CVE-2023-28319 (High) |
||
libcurl |
CVE-2023-27533 (High) |
|
CVE-2023-27534 (High) |
||
CVE-2023-27536 (High) |
||
CVE-2023-28319 (High) |
||
libcrypto1.1 |
CVE-2023-0464 (High) |
|
CVE-2023-2650 (High) |
||
libssl1.1 |
CVE-2023-2650 (High) |
|
CVE-2023-0464 (High) |
||
github.com/docker/docker |
CVE-2023-28840 (High) |
|
golang.org/x/net |
CVE-2022-41723 (High) |
|
lcm/docker/ucp-node-feature-discovery |
libssl3 |
CVE-2023-0286 (High) |
openssl |
CVE-2023-0286 (High) |
|
github.com/prometheus/client_golang |
CVE-2022-21698 (High) |
|
golang.org/x/net |
CVE-2022-27664 (High) |
|
golang.org/x/text |
CVE-2022-32149 (High) |
|
gopkg.in/yaml.v3 |
CVE-2022-28948 (High) |
|
lcm/docker/ucp-nvidia-device-plugin |
golang.org/x/net |
CVE-2022-27664 (High) |
CVE-2021-33194 (High) |
||
golang.org/x/text |
CVE-2022-32149 (High) |
|
CVE-2021-38561 (High) |
||
libssl3 |
CVE-2023-0286 (High) |
|
openssl |
CVE-2023-0286 (High) |
|
github.com/prometheus/client_golang |
CVE-2022-21698 (High) |
|
lcm/docker/ucp-nvidia-gpu-feature-discovery |
golang.org/x/net |
CVE-2022-41721 (High) |
CVE-2022-27664 (High) |
||
libssl3 |
CVE-2023-0286 (High) |
|
openssl |
CVE-2023-0286 (High) |
|
golang.org/x/text |
CVE-2022-32149 (High) |
|
lcm/docker/ucp-secureoverlay-agent |
curl |
CVE-2023-28319 (High) |
CVE-2023-23914 (Critical) |
||
CVE-2023-27533 (High) |
||
CVE-2023-27534 (High) |
||
CVE-2023-27536 (High) |
||
libcurl |
CVE-2023-28319 (High) |
|
CVE-2023-27533 (High) |
||
CVE-2023-27534 (High) |
||
CVE-2023-27536 (High) |
||
CVE-2023-23914 (Critical) |
||
libcrypto1.1 |
CVE-2022-4450 (High) |
|
CVE-2023-0215 (High) |
||
CVE-2023-0286 (High) |
||
CVE-2023-0464 (High) |
||
CVE-2023-2650 (High) |
||
libssl1.1 |
CVE-2022-4450 (High) |
|
CVE-2023-0215 (High) |
||
CVE-2023-0286 (High) |
||
CVE-2023-0464 (High) |
||
CVE-2023-2650 (High) |
||
golang.org/x/net |
CVE-2022-27664 (High) |
|
golang.org/x/text |
CVE-2022-32149 (High) |
|
lcm/docker/ucp-secureoverlay-mgr |
curl |
CVE-2023-27533 (High) |
CVE-2023-27534 (High) |
||
CVE-2023-27536 (High) |
||
CVE-2023-23914 (Critical) |
||
CVE-2023-28319 (High) |
||
libcurl |
CVE-2023-23914 (Critical) |
|
CVE-2023-28319 (High) |
||
CVE-2023-27533 (High) |
||
CVE-2023-27534 (High) |
||
CVE-2023-27536 (High) |
||
libcrypto1.1 |
CVE-2022-4450 (High) |
|
CVE-2023-0215 (High) |
||
CVE-2023-0286 (High) |
||
CVE-2023-0464 (High) |
||
CVE-2023-2650 (High) |
||
libssl1.1 |
CVE-2022-4450 (High) |
|
CVE-2023-0215 (High) |
||
CVE-2023-0286 (High) |
||
CVE-2023-0464 (High) |
||
CVE-2023-2650 (High) |
||
golang.org/x/net |
CVE-2022-27664 (High) |
|
golang.org/x/text |
CVE-2022-32149 (High) |
|
lcm/docker/ucp-sf-notifier |
Werkzeug |
CVE-2022-29361 (Critical) |
CVE-2023-25577 (High) |
||
libcrypto1.1 |
CVE-2022-4450 (High) |
|
CVE-2023-0215 (High) |
||
CVE-2023-0286 (High) |
||
CVE-2023-0464 (High) |
||
CVE-2023-2650 (High) |
||
libssl1.1 |
CVE-2022-4450 (High) |
|
CVE-2023-0215 (High) |
||
CVE-2023-0286 (High) |
||
CVE-2023-2650 (High) |
||
CVE-2023-0464 (High) |
||
openssl-dev |
CVE-2023-0464 (High) |
|
CVE-2023-2650 (High) |
||
CVE-2022-4450 (High) |
||
CVE-2023-0215 (High) |
||
CVE-2023-0286 (High) |
||
cryptography |
CVE-2023-2650 (High) |
|
Flask |
CVE-2023-30861 (High) |
|
krb5-libs |
CVE-2022-42898 (High) |
|
ncurses-libs |
CVE-2023-29491 (High) |
|
ncurses-terminfo-base |
CVE-2023-29491 (High) |
|
wheel |
CVE-2022-40898 (High) |
|
lcm/docker/ucp-swarm |
curl |
CVE-2023-23914 (Critical) |
CVE-2023-27533 (High) |
||
CVE-2023-27534 (High) |
||
CVE-2023-27536 (High) |
||
CVE-2023-28319 (High) |
||
libcurl |
CVE-2023-27533 (High) |
|
CVE-2023-27534 (High) |
||
CVE-2023-27536 (High) |
||
CVE-2023-28319 (High) |
||
CVE-2023-23914 (Critical) |
||
libcrypto1.1 |
CVE-2023-0464 (High) |
|
CVE-2022-4450 (High) |
||
CVE-2023-0215 (High) |
||
CVE-2023-0286 (High) |
||
CVE-2023-2650 (High) |
||
libssl1.1 |
CVE-2023-0464 (High) |
|
CVE-2022-4450 (High) |
||
CVE-2023-0215 (High) |
||
CVE-2023-0286 (High) |
||
CVE-2023-2650 (High) |
||
github.com/hashicorp/consul |
CVE-2022-29153 (High) |
|
CVE-2022-38149 (High) |
||
CVE-2020-7219 (High) |
||
CVE-2021-37219 (High) |
||
golang.org/x/crypto |
CVE-2022-27191 (High) |
|
CVE-2020-29652 (High) |
||
CVE-2021-43565 (High) |
||
golang.org/x/net |
CVE-2021-33194 (High) |
|
CVE-2022-27664 (High) |
||
github.com/docker/docker |
CVE-2023-28840 (High) |
|
github.com/docker/distribution |
CVE-2017-11468 (High) |
|
lcm/external/aws-cloud-controller-manager |
github.com/emicklei/go-restful |
CVE-2022-1996 (Critical) |
golang.org/x/crypto |
CVE-2021-43565 (High) |
|
CVE-2022-27191 (High) |
||
github.com/prometheus/client_golang |
CVE-2022-21698 (High) |
|
golang.org/x/net |
CVE-2022-27664 (High) |
|
golang.org/x/text |
CVE-2022-32149 (High) |
|
gopkg.in/yaml.v3 |
CVE-2022-28948 (High) |
|
lcm/external/aws-ebs-csi-driver |
ncurses-libs |
CVE-2023-29491 (High) |
systemd-libs |
CVE-2023-26604 (High) |
|
golang.org/x/net |
CVE-2022-41721 (High) |
|
golang.org/x/text |
CVE-2022-32149 (High) |
|
lcm/external/csi-attacher |
golang.org/x/crypto |
CVE-2021-43565 (High) |
CVE-2022-27191 (High) |
||
CVE-2020-29652 (High) |
||
CVE-2021-43565 (High) |
||
CVE-2022-27191 (High) |
||
CVE-2020-29652 (High) |
||
CVE-2021-43565 (High) |
||
CVE-2022-27191 (High) |
||
CVE-2020-29652 (High) |
||
golang.org/x/net |
CVE-2021-33194 (High) |
|
golang.org/x/text |
CVE-2021-38561 (High) |
|
github.com/gogo/protobuf |
CVE-2021-3121 (High) |
|
github.com/emicklei/go-restful |
CVE-2022-1996 (Critical) |
|
lcm/external/csi-provisioner |
github.com/emicklei/go-restful |
CVE-2022-1996 (Critical) |
lcm/external/csi-resizer |
github.com/emicklei/go-restful |
CVE-2022-1996 (Critical) |
lcm/helm/tiller |
libcrypto1.1 |
CVE-2021-23840 (High) |
CVE-2020-1967 (High) |
||
CVE-2021-3450 (High) |
||
CVE-2021-3711 (Critical) |
||
CVE-2021-3712 (High) |
||
libssl1.1 |
CVE-2020-1967 (High) |
|
CVE-2021-3450 (High) |
||
CVE-2021-3711 (Critical) |
||
CVE-2021-3712 (High) |
||
CVE-2021-23840 (High) |
||
apk-tools |
CVE-2021-36159 (Critical) |
|
CVE-2021-30139 (High) |
||
zlib |
CVE-2022-37434 (Critical) |
|
busybox |
CVE-2021-42378 (High) |
|
CVE-2021-42379 (High) |
||
CVE-2021-42380 (High) |
||
CVE-2021-42381 (High) |
||
CVE-2021-42382 (High) |
||
CVE-2021-42383 (High) |
||
CVE-2021-42384 (High) |
||
CVE-2021-42385 (High) |
||
CVE-2021-42386 (High) |
||
CVE-2021-28831 (High) |
||
ssl_client |
CVE-2021-28831 (High) |
|
CVE-2021-42378 (High) |
||
CVE-2021-42379 (High) |
||
CVE-2021-42380 (High) |
||
CVE-2021-42381 (High) |
||
CVE-2021-42382 (High) |
||
CVE-2021-42383 (High) |
||
CVE-2021-42384 (High) |
||
CVE-2021-42385 (High) |
||
CVE-2021-42386 (High) |
||
lcm/kubernetes/cinder-csi-plugin-amd64 |
libtasn1-6 |
CVE-2021-46848 (Critical) |
github.com/emicklei/go-restful |
CVE-2022-1996 (Critical) |
|
libssl1.1 |
CVE-2023-0286 (High) |
|
CVE-2022-4450 (High) |
||
CVE-2023-0215 (High) |
||
openssl |
CVE-2023-0286 (High) |
|
CVE-2022-4450 (High) |
||
CVE-2023-0215 (High) |
||
libsystemd0 |
CVE-2023-26604 (High) |
|
libudev1 |
CVE-2023-26604 (High) |
|
udev |
CVE-2023-26604 (High) |
|
libgnutls30 |
CVE-2023-0361 (High) |
|
golang.org/x/net |
CVE-2022-27664 (High) |
|
golang.org/x/text |
CVE-2022-32149 (High) |
|
gopkg.in/yaml.v3 |
CVE-2022-28948 (High) |
|
lcm/kubernetes/openstack-cloud-controller-manager-amd64 |
github.com/emicklei/go-restful |
CVE-2022-1996 (Critical) |
zlib |
CVE-2022-37434 (Critical) |
|
golang.org/x/crypto |
CVE-2022-27191 (High) |
|
CVE-2021-43565 (High) |
||
golang.org/x/text |
CVE-2021-38561 (High) |
|
CVE-2022-32149 (High) |
||
github.com/prometheus/client_golang |
CVE-2022-21698 (High) |
|
golang.org/x/net |
CVE-2022-27664 (High) |
|
gopkg.in/yaml.v3 |
CVE-2022-28948 (High) |
|
k8s.io/kubernetes |
CVE-2021-25741 (High) |
|
lcm/mcc-haproxy |
pcre2 |
CVE-2022-1586 (Critical) |
CVE-2022-1587 (Critical) |
||
zlib |
CVE-2022-37434 (Critical) |
|
libcrypto1.1 |
CVE-2022-4450 (High) |
|
CVE-2023-0215 (High) |
||
CVE-2023-0286 (High) |
||
CVE-2023-2650 (High) |
||
CVE-2023-0464 (High) |
||
libssl1.1 |
CVE-2022-4450 (High) |
|
CVE-2023-0215 (High) |
||
CVE-2023-0286 (High) |
||
CVE-2023-2650 (High) |
||
CVE-2023-0464 (High) |
||
busybox |
CVE-2022-30065 (High) |
|
ssl_client |
CVE-2022-30065 (High) |
|
lcm/registry |
libcrypto3 |
CVE-2023-2650 (High) |
libssl3 |
CVE-2023-2650 (High) |
|
mirantis/ceph |
openssl |
CVE-2022-3786 (High) |
CVE-2023-0286 (High) |
||
CVE-2022-3602 (High) |
||
openssl-libs |
CVE-2022-3602 (High) |
|
CVE-2022-3786 (High) |
||
CVE-2023-0286 (High) |
||
python3 |
CVE-2023-24329 (High) |
|
python3-devel |
CVE-2023-24329 (High) |
|
python3-libs |
CVE-2023-24329 (High) |
|
mirantis/cephcsi |
openssl |
CVE-2022-3786 (High) |
CVE-2023-0286 (High) |
||
CVE-2022-3602 (High) |
||
openssl-libs |
CVE-2022-3602 (High) |
|
CVE-2022-3786 (High) |
||
CVE-2023-0286 (High) |
||
cryptography |
CVE-2023-2650 (High) |
|
mirantis/fio |
libcrypto3 |
CVE-2023-2650 (High) |
libssl3 |
CVE-2023-2650 (High) |
|
stacklight/alerta-web |
libcrypto3 |
CVE-2023-2650 (High) |
libssl3 |
CVE-2023-2650 (High) |
|
stacklight/alertmanager-webhook-servicenow |
libcrypto3 |
CVE-2023-2650 (High) |
libssl3 |
CVE-2023-2650 (High) |
|
openssl-dev |
CVE-2023-2650 (High) |
|
Flask |
CVE-2023-30861 (High) |
|
stacklight/alpine-utils |
libcrypto3 |
CVE-2023-2650 (High) |
libssl3 |
CVE-2023-2650 (High) |
|
ncurses-libs |
CVE-2023-29491 (High) |
|
ncurses-terminfo-base |
CVE-2023-29491 (High) |
|
stacklight/blackbox-exporter |
golang.org/x/net |
CVE-2022-41723 (High) |
stacklight/cadvisor |
libcrypto1.1 |
CVE-2023-2650 (High) |
libssl1.1 |
CVE-2023-2650 (High) |
|
stacklight/cerebro |
org.xerial:sqlite-jdbc |
CVE-2023-32697 (Critical) |
com.fasterxml.jackson.core:jackson-databind |
CVE-2023-35116 (High) |
|
CVE-2022-42003 (High) |
||
CVE-2022-42004 (High) |
||
CVE-2020-36518 (High) |
||
CVE-2021-46877 (High) |
||
libssl1.1 |
CVE-2023-2650 (High) |
|
CVE-2023-0464 (High) |
||
openssl |
CVE-2023-2650 (High) |
|
CVE-2023-0464 (High) |
||
stacklight/ironic-prometheus-exporter |
libcrypto3 |
CVE-2023-2650 (High) |
libssl3 |
CVE-2023-2650 (High) |
|
stacklight/k8s-sidecar |
libcrypto1.1 |
CVE-2023-2650 (High) |
libssl1.1 |
CVE-2023-2650 (High) |
|
ncurses-libs |
CVE-2023-29491 (High) |
|
ncurses-terminfo-base |
CVE-2023-29491 (High) |
|
stacklight/kubectl |
libssl1.1 |
CVE-2023-2650 (High) |
CVE-2023-0464 (High) |
||
openssl |
CVE-2023-2650 (High) |
|
CVE-2023-0464 (High) |
||
stacklight/metric-collector |
libcrypto3 |
CVE-2023-2650 (High) |
libssl3 |
CVE-2023-2650 (High) |
|
stacklight/node-exporter |
golang.org/x/net |
CVE-2022-41723 (High) |
stacklight/opensearch |
org.codelibs.elasticsearch.module:ingest-common |
CVE-2019-7611 (High) |
CVE-2015-5377 (Critical) |
||
org.springframework:spring-core |
CVE-2023-20860 (High) |
|
stacklight/opensearch-dashboards |
decode-uri-component |
CVE-2022-38900 (High) |
glob-parent |
CVE-2021-35065 (High) |
|
stacklight/prometheus |
github.com/docker/docker |
CVE-2023-28840 (High) |
golang.org/x/net |
CVE-2022-41723 (High) |
|
stacklight/prometheus-es-exporter |
libcrypto1.1 |
CVE-2023-2650 (High) |
libssl1.1 |
CVE-2023-2650 (High) |
|
ncurses-libs |
CVE-2023-29491 (High) |
|
ncurses-terminfo-base |
CVE-2023-29491 (High) |
|
stacklight/prometheus-libvirt-exporter |
libcrypto3 |
CVE-2023-2650 (High) |
libssl3 |
CVE-2023-2650 (High) |
|
stacklight/prometheus-patroni-exporter |
libcrypto3 |
CVE-2023-2650 (High) |
libssl3 |
CVE-2023-2650 (High) |
|
stacklight/prometheus-relay |
libcrypto3 |
CVE-2023-2650 (High) |
libssl3 |
CVE-2023-2650 (High) |
|
stacklight/sf-notifier |
libcrypto1.1 |
CVE-2023-2650 (High) |
libssl1.1 |
CVE-2023-2650 (High) |
|
ncurses-libs |
CVE-2023-29491 (High) |
|
ncurses-terminfo-base |
CVE-2023-29491 (High) |
|
openssl-dev |
CVE-2023-2650 (High) |
|
stacklight/sf-reporter |
libcrypto3 |
CVE-2023-2650 (High) |
libssl3 |
CVE-2023-2650 (High) |
|
ncurses-libs |
CVE-2023-29491 (High) |
|
ncurses-terminfo-base |
CVE-2023-29491 (High) |
|
stacklight/stacklight-toolkit |
libcrypto3 |
CVE-2023-2650 (High) |
libssl3 |
CVE-2023-2650 (High) |
|
ncurses-libs |
CVE-2023-29491 (High) |
|
ncurses-terminfo-base |
CVE-2023-29491 (High) |
|
stacklight/telegraf |
libssl1.1 |
CVE-2023-2650 (High) |
CVE-2023-0464 (High) |
||
CVE-2023-2650 (High) |
||
CVE-2023-0464 (High) |
||
openssl |
CVE-2023-2650 (High) |
|
CVE-2023-0464 (High) |
||
CVE-2023-2650 (High) |
||
CVE-2023-0464 (High) |
||
stacklight/telemeter |
libcrypto3 |
CVE-2023-2650 (High) |
libssl3 |
CVE-2023-2650 (High) |
|
stacklight/tungstenfabric-prometheus-exporter |
libcrypto3 |
CVE-2023-2650 (High) |
libssl3 |
CVE-2023-2650 (High) |
|
stacklight/yq |
libcrypto3 |
CVE-2023-2650 (High) |
libssl3 |
CVE-2023-2650 (High) |
This section describes the specific actions you as a cloud operator need to complete before or after your Container Cloud cluster update to the Cluster release 14.0.0.
Consider this information as a supplement to the generic update procedures published in Operations Guide: Automatic upgrade of a management cluster and Update a managed cluster.
Since Container Cloud 2.24.0, the use of the l3Layout section in L2
templates is mandatory. Therefore, if your L2 templates do not contain this
section, manually add it for all existing clusters by defining all
subnets that are used in the npTemplate section of the L2 template.
Example L2 template with the l3Layout section
apiVersion: ipam.mirantis.com/v1alpha1
kind: L2Template
metadata:
labels:
bm-1490-template-controls-netplan: anymagicstring
cluster.sigs.k8s.io/cluster-name: managed-cluster
kaas.mirantis.com/provider: baremetal
kaas.mirantis.com/region: region-one
name: bm-1490-template-controls-netplan
namespace: managed-ns
spec:
ifMapping:
- enp9s0f0
- enp9s0f1
- eno1
- ens3f1
l3Layout:
- scope: namespace
subnetName: lcm-nw
- scope: namespace
subnetName: storage-frontend
- scope: namespace
subnetName: storage-backend
- scope: namespace
subnetName: metallb-public-for-extiface
npTemplate: |-
version: 2
ethernets:
{{nic 0}}:
dhcp4: false
dhcp6: false
match:
macaddress: {{mac 0}}
set-name: {{nic 0}}
mtu: 1500
{{nic 1}}:
dhcp4: false
dhcp6: false
match:
macaddress: {{mac 1}}
set-name: {{nic 1}}
mtu: 1500
{{nic 2}}:
dhcp4: false
dhcp6: false
match:
macaddress: {{mac 2}}
set-name: {{nic 2}}
mtu: 1500
{{nic 3}}:
dhcp4: false
dhcp6: false
match:
macaddress: {{mac 3}}
set-name: {{nic 3}}
mtu: 1500
bonds:
bond0:
parameters:
mode: 802.3ad
#transmit-hash-policy: layer3+4
#mii-monitor-interval: 100
interfaces:
- {{ nic 0 }}
- {{ nic 1 }}
bond1:
parameters:
mode: 802.3ad
#transmit-hash-policy: layer3+4
#mii-monitor-interval: 100
interfaces:
- {{ nic 2 }}
- {{ nic 3 }}
vlans:
stor-f:
id: 1494
link: bond1
addresses:
- {{ip "stor-f:storage-frontend"}}
stor-b:
id: 1489
link: bond1
addresses:
- {{ip "stor-b:storage-backend"}}
m-pub:
id: 1491
link: bond0
bridges:
k8s-ext:
interfaces: [m-pub]
addresses:
- {{ ip "k8s-ext:metallb-public-for-extiface" }}
k8s-lcm:
dhcp4: false
dhcp6: false
gateway4: {{ gateway_from_subnet "lcm-nw" }}
addresses:
- {{ ip "k8s-lcm:lcm-nw" }}
nameservers:
addresses: [ 172.18.176.6 ]
interfaces:
- bond0
For details on L2 template configuration, see Create L2 templates.
Caution
Partial definition of subnets is prohibited.
Container Cloud 2.23.5 is the fourth patch release of the 2.23.x release series that incorporates security fixes for CVEs of Critical and High severity. This patch release:
Introduces the patch Cluster release 12.7.4 for MOSK 23.1.4.
Introduces the patch Cluster release 11.7.4
Does not support greenfield deployments based on deprecated Cluster releases 12.7.3, 11.7.3, 12.7.2, 11.7.2, 12.7.1, 11.7.1, 12.5.0, and 11.6.0. Use the latest available Cluster releases of the series instead.
This section describes known issues and contains the lists of updated artifacts and CVE fixes for the Container Cloud release 2.23.5. For CVE fixes delivered with the previous patch release, see security notes for 2.23.4, 2.23.3, and 2.23.2.
For enhancements, addressed and known issues of the parent Container Cloud release 2.23.0, refer to 2.23.0.
This section lists the components artifacts of the Container Cloud patch release 2.23.5. For artifacts of the Cluster releases introduced in 2.23.5, see Cluster release 12.7.4 and Cluster release 11.7.4.
Note
The components that are newly added, updated, deprecated, or removed
as compared to the previous release version, are marked
with a corresponding superscript,
for example, lcm-ansible Updated.
Artifact |
Component |
Path |
|---|---|---|
Binaries |
baremetal-api Updated |
https://binary.mirantis.com/core/helm/baremetal-api-1.36.27.tgz |
baremetal-operator Updated |
https://binary.mirantis.com/core/helm/baremetal-operator-1.36.27.tgz |
|
baremetal-public-api Updated |
https://binary.mirantis.com/core/helm/baremetal-public-api-1.36.27.tgz |
|
ironic-python-agent.initramfs |
https://binary.mirantis.com/bm/bin/ironic/ipa/ubuntu/initramfs-yoga-focal-debug-20230126190304 |
|
ironic-python-agent.kernel |
https://binary.mirantis.com/bm/bin/ironic/ipa/ubuntu/kernel-yoga-focal-debug-20230126190304 |
|
kaas-ipam Updated |
||
local-volume-provisioner Updated |
https://binary.mirantis.com/core/helm/local-volume-provisioner-1.36.27.tgz |
|
metallb Updated |
||
provisioning_ansible |
https://binary.mirantis.com/bm/bin/ansible/provisioning_ansible-0.1.1-104-6e2e82c.tgz |
|
Docker images |
ambassador Updated |
mirantis.azurecr.io/core/external/nginx:1.36.27 |
baremetal-dnsmasq Updated |
mirantis.azurecr.io/bm/baremetal-dnsmasq:base-alpine-20230522161215 |
|
baremetal-operator Updated |
mirantis.azurecr.io/bm/baremetal-operator:base-focal-20230522160916 |
|
bm-collective Updated |
mirantis.azurecr.io/bm/bm-collective:base-alpine-20230522161437 |
|
ironic Updated |
mirantis.azurecr.io/openstack/ironic:yoga-focal-20230523063451 |
|
ironic-inspector Updated |
mirantis.azurecr.io/openstack/ironic-inspector:yoga-focal-20230523063451 |
|
ironic-prometheus-exporter |
mirantis.azurecr.io/stacklight/ironic-prometheus-exporter:0.1-20230330140456 |
|
kaas-ipam Updated |
mirantis.azurecr.io/bm/kaas-ipam:base-focal-20230522161025 |
|
kubernetes-entrypoint |
mirantis.azurecr.io/openstack/extra/kubernetes-entrypoint:v1.0.1-27d64fb-20230421151539 |
|
mariadb |
mirantis.azurecr.io/general/mariadb:10.6.12-focal-20230423170220 |
|
mcc-keepalived |
mirantis.azurecr.io/lcm/mcc-keepalived:v0.19.0-5-g6a7e17d |
|
metallb-controller Updated |
mirantis.azurecr.io/bm/external/metallb/controller:v0.13.7-3 |
|
metallb-speaker Updated |
mirantis.azurecr.io/bm/external/metallb/speaker:v0.13.7-3 |
|
syslog-ng |
mirantis.azurecr.io/bm/syslog-ng:base-alpine-20230424092635 |
Artifact |
Component |
Paths |
|---|---|---|
Bootstrap tarball Updated |
bootstrap-linux |
https://binary.mirantis.com/core/bin/bootstrap-linux-1.36.28.tar.gz |
bootstrap-darwin |
https://binary.mirantis.com/core/bin/bootstrap-darwin-1.36.28.tar.gz |
|
Helm charts Updated |
admission-controller |
https://binary.mirantis.com/core/helm/admission-controller-1.36.27.tgz |
agent-controller |
https://binary.mirantis.com/core/helm/agent-controller-1.36.27.tgz |
|
baremetal-provider |
https://binary.mirantis.com/core/helm/baremetal-provider-1.36.27.tgz |
|
byo-credentials-controller |
https://binary.mirantis.com/core/helm/byo-credentials-controller-1.36.27.tgz |
|
byo-provider |
https://binary.mirantis.com/core/helm/byo-provider-1.36.27.tgz |
|
ceph-kcc-controller |
https://binary.mirantis.com/core/helm/ceph-kcc-controller-1.36.27.tgz |
|
cert-manager |
https://binary.mirantis.com/core/helm/cert-manager-1.36.27.tgz |
|
client-certificate-controller |
https://binary.mirantis.com/core/helm/client-certificate-controller-1.36.27.tgz |
|
configuration-collector |
https://binary.mirantis.com/core/helm/configuration-collector-1.36.27.tgz |
|
event-controller |
https://binary.mirantis.com/core/helm/event-controller-1.36.27.tgz |
|
iam-controller |
https://binary.mirantis.com/core/helm/iam-controller-1.36.27.tgz |
|
kaas-exporter |
https://binary.mirantis.com/core/helm/kaas-exporter-1.36.27.tgz |
|
kaas-public-api |
https://binary.mirantis.com/core/helm/kaas-public-api-1.36.27.tgz |
|
kaas-ui |
||
lcm-controller |
https://binary.mirantis.com/core/helm/lcm-controller-1.36.27.tgz |
|
license-controller |
https://binary.mirantis.com/core/helm/license-controller-1.36.27.tgz |
|
machinepool-controller |
https://binary.mirantis.com/core/helm/machinepool-controller-1.36.27.tgz |
|
mcc-cache |
||
metrics-server |
https://binary.mirantis.com/core/helm/metrics-server-1.36.27.tgz |
|
openstack-provider |
https://binary.mirantis.com/core/helm/openstack-provider-1.36.27.tgz |
|
os-credentials-controller |
https://binary.mirantis.com/core/helm/os-credentials-controller-1.36.27.tgz |
|
portforward-controller |
https://binary.mirantis.com/core/helm/portforward-controller-1.36.27.tgz |
|
proxy-controller |
https://binary.mirantis.com/core/helm/proxy-controller-1.36.27.tgz |
|
rbac-controller |
https://binary.mirantis.com/core/helm/rbac-controller-1.36.27.tgz |
|
release-controller |
https://binary.mirantis.com/core/helm/release-controller-1.36.27.tgz |
|
rhellicense-controller |
https://binary.mirantis.com/core/helm/rhellicense-controller-1.36.27.tgz |
|
scope-controller |
http://binary.mirantis.com/core/helm/scope-controller-1.36.27.tgz |
|
squid-proxy |
https://binary.mirantis.com/core/helm/squid-proxy-1.36.27.tgz |
|
vsphere-credentials-controller |
https://binary.mirantis.com/core/helm/vsphere-credentials-controller-1.36.27.tgz |
|
vsphere-provider |
https://binary.mirantis.com/core/helm/vsphere-provider-1.36.27.tgz |
|
user-controller |
https://binary.mirantis.com/core/helm/user-controller-1.36.27.tgz |
|
Docker images |
admission-controller Updated |
mirantis.azurecr.io/core/admission-controller:1.36.27 |
agent-controller Updated |
mirantis.azurecr.io/core/agent-controller:1.36.27 |
|
byo-cluster-api-controller Updated |
mirantis.azurecr.io/core/byo-cluster-api-controller:1.36.27 |
|
byo-credentials-controller Updated |
mirantis.azurecr.io/core/byo-credentials-controller:1.36.27 |
|
ceph-kcc-controller Updated |
mirantis.azurecr.io/core/ceph-kcc-controller:1.36.27 |
|
cert-manager-controller |
mirantis.azurecr.io/core/external/cert-manager-controller:v1.6.1 |
|
client-certificate-controller Updated |
mirantis.azurecr.io/core/client-certificate-controller:1.36.27 |
|
cluster-api-provider-baremetal Updated |
mirantis.azurecr.io/core/cluster-api-provider-baremetal:1.36.27 |
|
configuration-collector Updated |
mirantis.azurecr.io/core/configuration-collector:1.36.27 |
|
event-controller Updated |
mirantis.azurecr.io/core/event-controller:1.36.27 |
|
frontend Updated |
mirantis.azurecr.io/core/frontend:1.36.27 |
|
iam-controller Updated |
mirantis.azurecr.io/core/iam-controller:1.36.27 |
|
kaas-exporter Updated |
mirantis.azurecr.io/core/kaas-exporter:1.36.27 |
|
kproxy Updated |
mirantis.azurecr.io/core/kproxy:1.36.27 |
|
lcm-controller Updated |
mirantis.azurecr.io/core/lcm-controller:1.36.27 |
|
license-controller Updated |
mirantis.azurecr.io/core/license-controller:1.36.27 |
|
machinepool-controller Updated |
mirantis.azurecr.io/core/machinepool-controller:1.36.27 |
|
mcc-haproxy |
mirantis.azurecr.io/lcm/mcc-haproxy:v0.17.0-8-g6ca89d5 |
|
mcc-keepalived |
mirantis.azurecr.io/lcm/mcc-keepalived:v0.19.0-5-g6a7e17d |
|
metrics-server |
mirantis.azurecr.io/core/external/metrics-server:v0.6.3-2 |
|
nginx Updated |
mirantis.azurecr.io/core/external/nginx:1.36.27 |
|
openstack-cloud-controller-manager |
mirantis.azurecr.io/lcm/kubernetes/openstack-cloud-controller-manager-amd64:v1.22.1-7-gc11024f8 |
|
openstack-cluster-api-controller Updated |
mirantis.azurecr.io/core/openstack-cluster-api-controller:1.36.27 |
|
os-credentials-controller Updated |
mirantis.azurecr.io/core/os-credentials-controller:1.36.27 |
|
portforward-controller Updated |
mirantis.azurecr.io/core/portforward-controller:1.36.27 |
|
proxy-controller Updated |
mirantis.azurecr.io/core/proxy-controller:1.36.27 |
|
rbac-controller Updated |
mirantis.azurecr.io/core/rbac-controller:1.36.27 |
|
registry |
mirantis.azurecr.io/lcm/registry:v2.8.1-3 |
|
release-controller Updated |
mirantis.azurecr.io/core/release-controller:1.36.27 |
|
rhellicense-controller Updated |
mirantis.azurecr.io/core/rhellicense-controller:1.36.27 |
|
scope-controller Updated |
mirantis.azurecr.io/core/scope-controller:1.36.27 |
|
storage-discovery Deprecated |
mirantis.azurecr.io/core/storage-discovery:1.36.27 |
|
squid-proxy |
mirantis.azurecr.io/lcm/squid-proxy:0.0.1-10-g24a0d69 |
|
user-controller Updated |
mirantis.azurecr.io/core/user-controller:1.36.27 |
|
vsphere-cluster-api-controller Updated |
mirantis.azurecr.io/core/vsphere-cluster-api-controller:1.36.27 |
|
vsphere-credentials-controller Updated |
mirantis.azurecr.io/core/vsphere-credentials-controller:1.36.27 |
Artifact |
Component |
Path |
|---|---|---|
Binaries |
hash-generate-linux |
http://binary.mirantis.com/iam/bin/hash-generate-0.0.1-268-3cf7f17-linux |
hash-generate-darwin |
http://binary.mirantis.com/iam/bin/hash-generate-0.0.1-268-3cf7f17-darwin |
|
Helm charts |
iam |
|
iam-proxy |
||
Docker images |
kubernetes-entrypoint |
mirantis.azurecr.io/openstack/extra/kubernetes-entrypoint:v1.0.0-20200311160233 |
mariadb |
mirantis.azurecr.io/general/mariadb:10.6.12-focal-20230331112513 |
|
keycloak |
mirantis.azurecr.io/iam/keycloak:0.5.16 |
|
keycloak-gatekeeper |
mirantis.azurecr.io/iam/keycloak-gatekeeper:7.1.3-4 |
In the Container Cloud patch release 2.23.5, 70 vendor-specific Common Vulnerabilities and Exposures (CVE) have been addressed: 7 of critical and 63 of high severity.
The full list of the CVEs present in the current Container Cloud release is available at the Mirantis Security Portal.
Image |
Component name |
CVE |
|---|---|---|
bm/baremetal-dnsmasq |
curl |
CVE-2023-28319 (High) |
CVE-2023-28321 (High) |
||
CVE-2023-28322 (High) |
||
libcurl |
CVE-2023-28319 (High) |
|
CVE-2023-28321 (High) |
||
CVE-2023-28322 (High) |
||
libcap2 |
CVE-2023-2603 (High) |
|
ncurses-libs |
CVE-2023-29491 (High) |
|
ncurses-terminfo-base |
CVE-2023-29491 (High) |
|
bm/baremetal-operator |
openssh-client-common |
CVE-2023-28531 (Critical) |
openssh-client-default |
CVE-2023-28531 (Critical) |
|
openssh-keygen |
CVE-2023-28531 (Critical) |
|
ncurses-libs |
CVE-2023-29491 (High) |
|
ncurses-terminfo-base |
CVE-2023-29491 (High) |
|
core/external/nginx |
libwebp |
CVE-2023-1999 (Critical) |
curl |
CVE-2023-28319 (High) |
|
CVE-2023-28321 (High) |
||
CVE-2023-28322 (High) |
||
libcurl |
CVE-2023-28319 (High) |
|
CVE-2023-28321 (High) |
||
CVE-2023-28322 (High) |
||
core/frontend |
libwebp |
CVE-2023-1999 (Critical) |
curl |
CVE-2023-28319 (High) |
|
CVE-2023-28321 (High) |
||
CVE-2023-28322 (High) |
||
libcurl |
CVE-2023-28319 (High) |
|
CVE-2023-28321 (High) |
||
CVE-2023-28322 (High) |
||
openstack/ironic |
sqlparse |
CVE-2023-30608 (High) |
openstack/ironic-inspector |
Flask |
CVE-2023-30861 (High) |
sqlparse |
CVE-2023-30608 (High) |
|
stacklight/alerta-web |
libcurl |
CVE-2023-28319 (High) |
CVE-2023-28321 (High) |
||
CVE-2023-28322 (High) |
||
libpq |
CVE-2023-2454 (High) |
|
postgresql15-client |
CVE-2023-2454 (High) |
|
Flask |
CVE-2023-30861 (High) |
|
ncurses-libs |
CVE-2023-29491 (High) |
|
ncurses-terminfo-base |
CVE-2023-29491 (High) |
|
stacklight/alertmanager-webhook-servicenow |
ncurses-libs |
CVE-2023-29491 (High) |
ncurses-terminfo-base |
CVE-2023-29491 (High) |
|
stacklight/alpine-utils |
curl |
CVE-2023-28319 (High) |
CVE-2023-28321 (High) |
||
CVE-2023-28322 (High) |
||
libcurl |
CVE-2023-28319 (High) |
|
CVE-2023-28321 (High) |
||
CVE-2023-28322 (High) |
||
stacklight/opensearch |
org.apache.santuario:xmlsec |
CVE-2022-47966 (Critical) |
CVE-2022-21476 (High) |
||
org.slf4j:slf4j-api |
CVE-2018-8088 (Critical) |
|
glib2 |
CVE-2018-16428 (High) |
|
CVE-2018-16429 (High) |
||
stacklight/opensearch-dashboards |
glib2 |
CVE-2018-16428 (High) |
CVE-2018-16429 (High) |
||
stacklight/pgbouncer |
libpq |
CVE-2023-2454 (High) |
postgresql-client |
CVE-2023-2454 (High) |
|
stacklight/prometheus-libvirt-exporter |
libcurl |
CVE-2023-28319 (High) |
CVE-2023-28321 (High) |
||
CVE-2023-28322 (High) |
||
stacklight/prometheus-patroni-exporter |
ncurses-libs |
CVE-2023-29491 (High) |
ncurses-terminfo-base |
CVE-2023-29491 (High) |
|
stacklight/sf-notifier |
flask |
CVE-2023-30861 (High) |
stacklight/stacklight-toolkit |
curl |
CVE-2023-28319 (High) |
CVE-2023-28321 (High) |
||
CVE-2023-28322 (High) |
||
libcurl |
CVE-2023-28319 (High) |
|
CVE-2023-28321 (High) |
||
CVE-2023-28322 (High) |
||
stacklight/telegraf |
github.com/docker/docker |
CVE-2023-28840 (High) |
CVE-2023-28840 (High) |
This section lists known issues with workarounds for the Mirantis Container Cloud release 2.23.5 including the Cluster releases 12.7.4 and 11.7.4.
For other issues that can occur while deploying and operating a Container Cloud cluster, see Troubleshooting Guide.
During the initial deployment of Container Cloud, some nodes may get stuck in the cleaning state. As a workaround, wipe disks manually before initializing the Container Cloud bootstrap.
Container Cloud 2.23.4 is the third patch release of the 2.23.x release series that includes several addressed issues and incorporates security fixes for CVEs of Critical and High severity. This patch release:
Introduces the patch Cluster release 12.7.3 for MOSK 23.1.3.
Introduces the patch Cluster release 11.7.3
Does not support greenfield deployments based on deprecated Cluster releases 12.7.2, 11.7.2, 12.7.1, 11.7.1, 12.5.0, and 11.6.0. Use the latest available Cluster releases of the series instead.
This section describes addressed issues and contains the lists of updated artifacts and CVE fixes for the Container Cloud release 2.23.4. For CVE fixes delivered with the previous patch release, see security notes for 2.23.3 and 2.23.2.
For enhancements, addressed and known issues of the parent Container Cloud release 2.23.0, refer to 2.23.0.
This section lists the components artifacts of the Container Cloud patch release 2.23.4. For artifacts of the Cluster releases introduced in 2.23.4, see Cluster release 12.7.3 and Cluster release 11.7.3.
Note
The components that are newly added, updated, deprecated, or removed
as compared to the previous release version, are marked
with a corresponding superscript,
for example, lcm-ansible Updated.
Artifact |
Component |
Path |
|---|---|---|
Binaries |
baremetal-api Updated |
https://binary.mirantis.com/core/helm/baremetal-api-1.36.26.tgz |
baremetal-operator Updated |
https://binary.mirantis.com/core/helm/baremetal-operator-1.36.26.tgz |
|
baremetal-public-api Updated |
https://binary.mirantis.com/core/helm/baremetal-public-api-1.36.26.tgz |
|
ironic-python-agent.initramfs |
https://binary.mirantis.com/bm/bin/ironic/ipa/ubuntu/initramfs-yoga-focal-debug-20230126190304 |
|
ironic-python-agent.kernel |
https://binary.mirantis.com/bm/bin/ironic/ipa/ubuntu/kernel-yoga-focal-debug-20230126190304 |
|
kaas-ipam Updated |
||
local-volume-provisioner Updated |
https://binary.mirantis.com/core/helm/local-volume-provisioner-1.36.26.tgz |
|
metallb Updated |
||
provisioning_ansible |
https://binary.mirantis.com/bm/bin/ansible/provisioning_ansible-0.1.1-104-6e2e82c.tgz |
|
Docker images |
ambassador Updated |
mirantis.azurecr.io/core/external/nginx:1.36.26 |
baremetal-dnsmasq |
mirantis.azurecr.io/bm/baremetal-dnsmasq:base-alpine-20230421100738 |
|
baremetal-operator |
mirantis.azurecr.io/bm/baremetal-operator:base-focal-20230421100444 |
|
bm-collective |
mirantis.azurecr.io/bm/bm-collective:base-alpine-20230421101033 |
|
ironic |
mirantis.azurecr.io/openstack/ironic:yoga-focal-20230417060018 |
|
ironic-inspector |
mirantis.azurecr.io/openstack/ironic-inspector:yoga-focal-20230417060018 |
|
ironic-prometheus-exporter |
mirantis.azurecr.io/stacklight/ironic-prometheus-exporter:0.1-20230330140456 |
|
kaas-ipam |
mirantis.azurecr.io/bm/kaas-ipam:base-focal-20230421100530 |
|
mariadb Updated |
mirantis.azurecr.io/general/mariadb:10.6.12-focal-20230423170220 |
|
mcc-keepalived |
mirantis.azurecr.io/lcm/mcc-keepalived:v0.19.0-5-g6a7e17d |
|
metallb-controller |
mirantis.azurecr.io/bm/external/metallb/controller:v0.13.7-20221130155702-refresh-2023033102 |
|
metallb-speaker |
mirantis.azurecr.io/bm/external/metallb/speaker:v0.13.7-20221130155702-refresh-2023033102 |
|
syslog-ng Updated |
mirantis.azurecr.io/bm/syslog-ng:base-alpine-20230424092635 |
Artifact |
Component |
Paths |
|---|---|---|
Bootstrap tarball Updated |
bootstrap-linux |
https://binary.mirantis.com/core/bin/bootstrap-linux-1.36.26.tar.gz |
bootstrap-darwin |
https://binary.mirantis.com/core/bin/bootstrap-darwin-1.36.26.tar.gz |
|
Helm charts Updated |
admission-controller |
https://binary.mirantis.com/core/helm/admission-controller-1.36.26.tgz |
agent-controller |
https://binary.mirantis.com/core/helm/agent-controller-1.36.26.tgz |
|
baremetal-provider |
https://binary.mirantis.com/core/helm/baremetal-provider-1.36.26.tgz |
|
byo-credentials-controller |
https://binary.mirantis.com/core/helm/byo-credentials-controller-1.36.26.tgz |
|
byo-provider |
https://binary.mirantis.com/core/helm/byo-provider-1.36.26.tgz |
|
ceph-kcc-controller |
https://binary.mirantis.com/core/helm/ceph-kcc-controller-1.36.26.tgz |
|
cert-manager |
https://binary.mirantis.com/core/helm/cert-manager-1.36.26.tgz |
|
client-certificate-controller |
https://binary.mirantis.com/core/helm/client-certificate-controller-1.36.26.tgz |
|
configuration-collector |
https://binary.mirantis.com/core/helm/configuration-collector-1.36.26.tgz |
|
event-controller |
https://binary.mirantis.com/core/helm/event-controller-1.36.26.tgz |
|
iam-controller |
https://binary.mirantis.com/core/helm/iam-controller-1.36.26.tgz |
|
kaas-exporter |
https://binary.mirantis.com/core/helm/kaas-exporter-1.36.26.tgz |
|
kaas-public-api |
https://binary.mirantis.com/core/helm/kaas-public-api-1.36.26.tgz |
|
kaas-ui |
||
lcm-controller |
https://binary.mirantis.com/core/helm/lcm-controller-1.36.26.tgz |
|
license-controller |
https://binary.mirantis.com/core/helm/license-controller-1.36.26.tgz |
|
machinepool-controller |
https://binary.mirantis.com/core/helm/machinepool-controller-1.36.26.tgz |
|
mcc-cache |
||
metrics-server |
https://binary.mirantis.com/core/helm/metrics-server-1.36.26.tgz |
|
openstack-provider |
https://binary.mirantis.com/core/helm/openstack-provider-1.36.26.tgz |
|
os-credentials-controller |
https://binary.mirantis.com/core/helm/os-credentials-controller-1.36.26.tgz |
|
portforward-controller |
https://binary.mirantis.com/core/helm/portforward-controller-1.36.26.tgz |
|
proxy-controller |
https://binary.mirantis.com/core/helm/proxy-controller-1.36.26.tgz |
|
rbac-controller |
https://binary.mirantis.com/core/helm/rbac-controller-1.36.26.tgz |
|
release-controller |
https://binary.mirantis.com/core/helm/release-controller-1.36.26.tgz |
|
rhellicense-controller |
https://binary.mirantis.com/core/helm/rhellicense-controller-1.36.26.tgz |
|
scope-controller |
http://binary.mirantis.com/core/helm/scope-controller-1.36.26.tgz |
|
squid-proxy |
https://binary.mirantis.com/core/helm/squid-proxy-1.36.26.tgz |
|
vsphere-credentials-controller |
https://binary.mirantis.com/core/helm/vsphere-credentials-controller-1.36.26.tgz |
|
vsphere-provider |
https://binary.mirantis.com/core/helm/vsphere-provider-1.36.26.tgz |
|
user-controller |
https://binary.mirantis.com/core/helm/user-controller-1.36.26.tgz |
|
Docker images |
admission-controller Updated |
mirantis.azurecr.io/core/admission-controller:1.36.26 |
agent-controller Updated |
mirantis.azurecr.io/core/agent-controller:1.36.26 |
|
byo-cluster-api-controller Updated |
mirantis.azurecr.io/core/byo-cluster-api-controller:1.36.26 |
|
byo-credentials-controller Updated |
mirantis.azurecr.io/core/byo-credentials-controller:1.36.26 |
|
ceph-kcc-controller Updated |
mirantis.azurecr.io/core/ceph-kcc-controller:1.36.26 |
|
cert-manager-controller |
mirantis.azurecr.io/core/external/cert-manager-controller:v1.6.1 |
|
client-certificate-controller Updated |
mirantis.azurecr.io/core/client-certificate-controller:1.36.26 |
|
cluster-api-provider-baremetal Updated |
mirantis.azurecr.io/core/cluster-api-provider-baremetal:1.36.26 |
|
frontend Updated |
mirantis.azurecr.io/core/frontend:1.36.26 |
|
iam-controller Updated |
mirantis.azurecr.io/core/iam-controller:1.36.26 |
|
kaas-exporter Updated |
mirantis.azurecr.io/core/kaas-exporter:1.36.26 |
|
kproxy Updated |
mirantis.azurecr.io/core/kproxy:1.36.26 |
|
lcm-controller Updated |
mirantis.azurecr.io/core/lcm-controller:1.36.26 |
|
license-controller Updated |
mirantis.azurecr.io/core/license-controller:1.36.26 |
|
machinepool-controller Updated |
mirantis.azurecr.io/core/machinepool-controller:1.36.26 |
|
mcc-haproxy |
mirantis.azurecr.io/lcm/mcc-haproxy:v0.17.0-8-g6ca89d5 |
|
mcc-keepalived |
mirantis.azurecr.io/lcm/mcc-keepalived:v0.19.0-5-g6a7e17d |
|
metrics-server |
mirantis.azurecr.io/core/external/metrics-server:v0.6.3-2 |
|
nginx Updated |
mirantis.azurecr.io/core/external/nginx:1.36.26 |
|
openstack-cloud-controller-manager |
mirantis.azurecr.io/lcm/kubernetes/openstack-cloud-controller-manager-amd64:v1.22.1-7-gc11024f8 |
|
openstack-cluster-api-controller Updated |
mirantis.azurecr.io/core/openstack-cluster-api-controller:1.36.26 |
|
os-credentials-controller Updated |
mirantis.azurecr.io/core/os-credentials-controller:1.36.26 |
|
portforward-controller Updated |
mirantis.azurecr.io/core/portforward-controller:1.36.26 |
|
proxy-controller Updated |
mirantis.azurecr.io/core/proxy-controller:1.36.26 |
|
rbac-controller Updated |
mirantis.azurecr.io/core/rbac-controller:1.36.26 |
|
registry |
mirantis.azurecr.io/lcm/registry:v2.8.1-3 |
|
release-controller Updated |
mirantis.azurecr.io/core/release-controller:1.36.26 |
|
rhellicense-controller Updated |
mirantis.azurecr.io/core/rhellicense-controller:1.36.26 |
|
scope-controller Updated |
mirantis.azurecr.io/core/scope-controller:1.36.26 |
|
storage-discovery Deprecated |
mirantis.azurecr.io/core/storage-discovery:1.36.26 |
|
squid-proxy |
mirantis.azurecr.io/lcm/squid-proxy:0.0.1-10-g24a0d69 |
|
user-controller Updated |
mirantis.azurecr.io/core/user-controller:1.36.26 |
|
vsphere-cluster-api-controller Updated |
mirantis.azurecr.io/core/vsphere-cluster-api-controller:1.36.26 |
|
vsphere-credentials-controller Updated |
mirantis.azurecr.io/core/vsphere-credentials-controller:1.36.26 |
Artifact |
Component |
Path |
|---|---|---|
Binaries |
hash-generate-linux |
http://binary.mirantis.com/iam/bin/hash-generate-0.0.1-268-3cf7f17-linux |
hash-generate-darwin |
http://binary.mirantis.com/iam/bin/hash-generate-0.0.1-268-3cf7f17-darwin |
|
Helm charts |
iam |
|
iam-proxy |
||
Docker images |
kubernetes-entrypoint |
mirantis.azurecr.io/openstack/extra/kubernetes-entrypoint:v1.0.0-20200311160233 |
mariadb |
mirantis.azurecr.io/general/mariadb:10.6.12-focal-20230331112513 |
|
keycloak |
mirantis.azurecr.io/iam/keycloak:0.5.16 |
|
keycloak-gatekeeper |
mirantis.azurecr.io/iam/keycloak-gatekeeper:7.1.3-4 |
In the Container Cloud patch release 2.23.4, 35 vendor-specific CVEs have been addressed, 1 of critical and 34 of high severity.
The full list of the CVEs present in the current Container Cloud release is available at the Mirantis Security Portal.
The following issues have been addressed in the Container Cloud patch release 2.23.4 along with the Cluster releases 12.7.3 and 11.7.3:
[31869] Fixed the issue with
agent-controllerfailing to obtain secrets due to the incorrect indexer initialization.[31810,30970] Fixed the issue with
hardware.storageflapping in the machinestatusand causing constant reconciles.[30474,28654] Fixed the issue with the
agent-controllersecrets leaking.[5771] Fixed the issue with unnecessary reconciles during compute node deployment by optimizing the
baremetal-provideroperation.
Container Cloud 2.23.3 is the second patch release of the 2.23.x release series that incorporates security fixes for CVEs of Critical and High severity. This patch release:
Introduces the patch Cluster release 12.7.2 for MOSK 23.1.2.
Introduces the patch Cluster release 11.7.2.
Does not support greenfield deployments based on deprecated Cluster releases 12.7.1, 11.7.1, 12.5.0, and 11.6.0. Use the latest available Cluster releases of the series instead.
This section contains the lists of updated artifacts and CVE fixes for the Container Cloud release 2.23.3. For CVE fixes delivered with the previous patch release, see security notes for 2.23.2. For enhancements, addressed and known issues of the parent Container Cloud release 2.23.0, refer to 2.23.0.
This section lists the components artifacts of the Container Cloud patch release 2.23.3. For artifacts of the Cluster releases introduced in 2.23.3, see Cluster release 12.7.2 and Cluster release 11.7.2.
Note
The components that are newly added, updated, deprecated, or removed
as compared to the previous release version, are marked
with a corresponding superscript,
for example, lcm-ansible Updated.
Artifact |
Component |
Path |
|---|---|---|
Binaries |
baremetal-api Updated |
https://binary.mirantis.com/core/helm/baremetal-api-1.36.23.tgz |
baremetal-operator Updated |
https://binary.mirantis.com/core/helm/baremetal-operator-1.36.23.tgz |
|
baremetal-public-api Updated |
https://binary.mirantis.com/core/helm/baremetal-public-api-1.36.23.tgz |
|
ironic-python-agent.initramfs |
https://binary.mirantis.com/bm/bin/ironic/ipa/ubuntu/initramfs-yoga-focal-debug-20230126190304 |
|
ironic-python-agent.kernel |
https://binary.mirantis.com/bm/bin/ironic/ipa/ubuntu/kernel-yoga-focal-debug-20230126190304 |
|
kaas-ipam Updated |
||
local-volume-provisioner Updated |
https://binary.mirantis.com/core/helm/local-volume-provisioner-1.36.23.tgz |
|
metallb Updated |
||
provisioning_ansible |
https://binary.mirantis.com/bm/bin/ansible/provisioning_ansible-0.1.1-104-6e2e82c.tgz |
|
Docker images |
ambassador |
mirantis.azurecr.io/core/external/nginx:1.36.23 |
baremetal-dnsmasq Updated |
mirantis.azurecr.io/bm/baremetal-dnsmasq:base-alpine-20230421100738 |
|
baremetal-operator Updated |
mirantis.azurecr.io/bm/baremetal-operator:base-focal-20230421100444 |
|
bm-collective Updated |
mirantis.azurecr.io/bm/bm-collective:base-alpine-20230421101033 |
|
ironic Updated |
mirantis.azurecr.io/openstack/ironic:yoga-focal-20230417060018 |
|
ironic-inspector Updated |
mirantis.azurecr.io/openstack/ironic-inspector:yoga-focal-20230417060018 |
|
ironic-prometheus-exporter |
mirantis.azurecr.io/stacklight/ironic-prometheus-exporter:0.1-20230330140456 |
|
kaas-ipam Updated |
mirantis.azurecr.io/bm/kaas-ipam:base-focal-20230421100530 |
|
mariadb |
mirantis.azurecr.io/general/mariadb:10.6.12-focal-20230328123811 |
|
mcc-keepalived Updated |
mirantis.azurecr.io/lcm/mcc-keepalived:v0.19.0-5-g6a7e17d |
|
metallb-controller |
mirantis.azurecr.io/bm/external/metallb/controller:v0.13.7-20221130155702-refresh-2023033102 |
|
metallb-speaker |
mirantis.azurecr.io/bm/external/metallb/speaker:v0.13.7-20221130155702-refresh-2023033102 |
|
syslog-ng |
mirantis.azurecr.io/bm/syslog-ng:base-focal-20230316094816 |
Artifact |
Component |
Paths |
|---|---|---|
Bootstrap tarball Updated |
bootstrap-linux |
https://binary.mirantis.com/core/bin/bootstrap-linux-1.36.23.tar.gz |
bootstrap-darwin |
https://binary.mirantis.com/core/bin/bootstrap-darwin-1.36.23.tar.gz |
|
Helm charts Updated |
admission-controller |
https://binary.mirantis.com/core/helm/admission-controller-1.36.23.tgz |
agent-controller |
https://binary.mirantis.com/core/helm/agent-controller-1.36.23.tgz |
|
baremetal-provider |
https://binary.mirantis.com/core/helm/baremetal-provider-1.36.23.tgz |
|
byo-credentials-controller |
https://binary.mirantis.com/core/helm/byo-credentials-controller-1.36.23.tgz |
|
byo-provider |
https://binary.mirantis.com/core/helm/byo-provider-1.36.23.tgz |
|
ceph-kcc-controller |
https://binary.mirantis.com/core/helm/ceph-kcc-controller-1.36.23.tgz |
|
cert-manager |
https://binary.mirantis.com/core/helm/cert-manager-1.36.23.tgz |
|
client-certificate-controller |
https://binary.mirantis.com/core/helm/client-certificate-controller-1.36.23.tgz |
|
configuration-collector |
https://binary.mirantis.com/core/helm/configuration-collector-1.36.23.tgz |
|
event-controller |
https://binary.mirantis.com/core/helm/event-controller-1.36.23.tgz |
|
iam-controller |
https://binary.mirantis.com/core/helm/iam-controller-1.36.23.tgz |
|
kaas-exporter |
https://binary.mirantis.com/core/helm/kaas-exporter-1.36.23.tgz |
|
kaas-public-api |
https://binary.mirantis.com/core/helm/kaas-public-api-1.36.23.tgz |
|
kaas-ui |
||
lcm-controller |
https://binary.mirantis.com/core/helm/lcm-controller-1.36.23.tgz |
|
license-controller |
https://binary.mirantis.com/core/helm/license-controller-1.36.23.tgz |
|
machinepool-controller |
https://binary.mirantis.com/core/helm/machinepool-controller-1.36.23.tgz |
|
mcc-cache |
||
metrics-server |
https://binary.mirantis.com/core/helm/metrics-server-1.36.23.tgz |
|
openstack-provider |
https://binary.mirantis.com/core/helm/openstack-provider-1.36.23.tgz |
|
os-credentials-controller |
https://binary.mirantis.com/core/helm/os-credentials-controller-1.36.23.tgz |
|
portforward-controller |
https://binary.mirantis.com/core/helm/portforward-controller-1.36.23.tgz |
|
proxy-controller |
https://binary.mirantis.com/core/helm/proxy-controller-1.36.23.tgz |
|
rbac-controller |
https://binary.mirantis.com/core/helm/rbac-controller-1.36.23.tgz |
|
release-controller |
https://binary.mirantis.com/core/helm/release-controller-1.36.23.tgz |
|
rhellicense-controller |
https://binary.mirantis.com/core/helm/rhellicense-controller-1.36.23.tgz |
|
scope-controller |
http://binary.mirantis.com/core/helm/scope-controller-1.36.23.tgz |
|
squid-proxy |
https://binary.mirantis.com/core/helm/squid-proxy-1.36.23.tgz |
|
vsphere-credentials-controller |
https://binary.mirantis.com/core/helm/vsphere-credentials-controller-1.36.23.tgz |
|
vsphere-provider |
https://binary.mirantis.com/core/helm/vsphere-provider-1.36.23.tgz |
|
user-controller |
https://binary.mirantis.com/core/helm/user-controller-1.36.23.tgz |
|
Docker images |
admission-controller Updated |
mirantis.azurecr.io/core/admission-controller:1.36.23 |
agent-controller Updated |
mirantis.azurecr.io/core/agent-controller:1.36.23 |
|
byo-cluster-api-controller Updated |
mirantis.azurecr.io/core/byo-cluster-api-controller:1.36.23 |
|
byo-credentials-controller Updated |
mirantis.azurecr.io/core/byo-credentials-controller:1.36.23 |
|
ceph-kcc-controller Updated |
mirantis.azurecr.io/core/ceph-kcc-controller:1.36.23 |
|
cert-manager-controller |
mirantis.azurecr.io/core/external/cert-manager-controller:v1.6.1 |
|
client-certificate-controller Updated |
mirantis.azurecr.io/core/client-certificate-controller:1.36.23 |
|
cluster-api-provider-baremetal Updated |
mirantis.azurecr.io/core/cluster-api-provider-baremetal:1.36.23 |
|
frontend Updated |
mirantis.azurecr.io/core/frontend:1.36.23 |
|
iam-controller Updated |
mirantis.azurecr.io/core/iam-controller:1.36.23 |
|
kaas-exporter |
mirantis.azurecr.io/core/kaas-exporter:1.36.23 |
|
kproxy Updated |
mirantis.azurecr.io/core/kproxy:1.36.23 |
|
lcm-controller Updated |
mirantis.azurecr.io/core/lcm-controller:1.36.23 |
|
license-controller Updated |
mirantis.azurecr.io/core/license-controller:1.36.23 |
|
machinepool-controller Updated |
mirantis.azurecr.io/core/machinepool-controller:1.36.23 |
|
mcc-haproxy |
mirantis.azurecr.io/lcm/mcc-haproxy:v0.17.0-8-g6ca89d5 |
|
mcc-keepalived |
mirantis.azurecr.io/lcm/mcc-keepalived:v0.19.0-5-g6a7e17d |
|
metrics-server |
mirantis.azurecr.io/core/external/metrics-server:v0.6.3-2 |
|
nginx |
mirantis.azurecr.io/core/external/nginx:1.36.23 |
|
openstack-cloud-controller-manager |
mirantis.azurecr.io/lcm/kubernetes/openstack-cloud-controller-manager-amd64:v1.22.1-7-gc11024f8 |
|
openstack-cluster-api-controller Updated |
mirantis.azurecr.io/core/openstack-cluster-api-controller:1.36.23 |
|
os-credentials-controller Updated |
mirantis.azurecr.io/core/os-credentials-controller:1.36.23 |
|
portforward-controller Updated |
mirantis.azurecr.io/core/portforward-controller:1.36.23 |
|
proxy-controller Updated |
mirantis.azurecr.io/core/proxy-controller:1.36.23 |
|
rbac-controller Updated |
mirantis.azurecr.io/core/rbac-controller:1.36.23 |
|
registry |
mirantis.azurecr.io/lcm/registry:v2.8.1-3 |
|
release-controller Updated |
mirantis.azurecr.io/core/release-controller:1.36.23 |
|
rhellicense-controller Updated |
mirantis.azurecr.io/core/rhellicense-controller:1.36.23 |
|
scope-controller Updated |
mirantis.azurecr.io/core/scope-controller:1.36.23 |
|
storage-discovery Deprecated |
mirantis.azurecr.io/core/storage-discovery:1.36.23 |
|
squid-proxy |
mirantis.azurecr.io/lcm/squid-proxy:0.0.1-10-g24a0d69 |
|
user-controller Updated |
mirantis.azurecr.io/core/user-controller:1.36.23 |
|
vsphere-cluster-api-controller Updated |
mirantis.azurecr.io/core/vsphere-cluster-api-controller:1.36.23 |
|
vsphere-credentials-controller Updated |
mirantis.azurecr.io/core/vsphere-credentials-controller:1.36.23 |
Artifact |
Component |
Path |
|---|---|---|
Binaries |
hash-generate-linux |
http://binary.mirantis.com/iam/bin/hash-generate-0.0.1-268-3cf7f17-linux |
hash-generate-darwin |
http://binary.mirantis.com/iam/bin/hash-generate-0.0.1-268-3cf7f17-darwin |
|
Helm charts Updated |
iam |
|
iam-proxy |
||
Docker images |
kubernetes-entrypoint |
mirantis.azurecr.io/openstack/extra/kubernetes-entrypoint:v1.0.0-20200311160233 |
mariadb Updated |
mirantis.azurecr.io/general/mariadb:10.6.12-focal-20230331112513 |
|
keycloak |
mirantis.azurecr.io/iam/keycloak:0.5.16 |
|
keycloak-gatekeeper |
mirantis.azurecr.io/iam/keycloak-gatekeeper:7.1.3-4 |
In the Container Cloud patch release 2.23.3, 28 vendor-specific CVEs have been addressed, 2 of critical and 26 of high severity.
The full list of the CVEs present in the current Container Cloud release is available at the Mirantis Security Portal.
Container Cloud 2.23.2 is the first patch release of the 2.23.x release series that incorporates security updates for CVEs with Critical and High severity. This patch release:
Introduces support for patch Cluster releases 12.7.1 and 11.7.1.
Supports the latest major Cluster releases 12.7.0 and 11.7.0.
Does not support greenfield deployments based on deprecated Cluster releases 12.5.0 and 11.6.0. Use the latest available Cluster releases of the series instead.
This section contains the lists of updated artifacts and CVE fixes for the Container Cloud release 2.23.2. For enhancements, addressed and known issues of the parent Container Cloud release 2.23.0, refer to 2.23.0.
This section lists the components artifacts of the Mirantis Container Cloud release 2.23.2. For artifacts of the Cluster releases introduced in 2.23.2, see Cluster release 12.7.1 and Cluster release 11.7.1.
Note
The components that are newly added, updated, deprecated, or removed
as compared to the previous release version, are marked
with a corresponding superscript,
for example, lcm-ansible Updated.
Artifact |
Component |
Path |
|---|---|---|
Binaries |
baremetal-api Updated |
https://binary.mirantis.com/core/helm/baremetal-api-1.36.14.tgz |
baremetal-operator Updated |
https://binary.mirantis.com/core/helm/baremetal-operator-1.36.15.tgz |
|
baremetal-public-api Updated |
https://binary.mirantis.com/core/helm/baremetal-public-api-1.36.14.tgz |
|
ironic-python-agent.initramfs |
https://binary.mirantis.com/bm/bin/ironic/ipa/ubuntu/initramfs-yoga-focal-debug-20230126190304 |
|
ironic-python-agent.kernel |
https://binary.mirantis.com/bm/bin/ironic/ipa/ubuntu/kernel-yoga-focal-debug-20230126190304 |
|
kaas-ipam Updated |
||
local-volume-provisioner Updated |
https://binary.mirantis.com/core/helm/local-volume-provisioner-1.36.14.tgz |
|
metallb |
||
provisioning_ansible |
https://binary.mirantis.com/bm/bin/ansible/provisioning_ansible-0.1.1-104-6e2e82c.tgz |
|
Docker images |
ambassador |
mirantis.azurecr.io/core/external/nginx:1.36.14 |
baremetal-dnsmasq Updated |
mirantis.azurecr.io/bm/baremetal-dnsmasq:base-alpine-20230406194234 |
|
baremetal-operator Updated |
mirantis.azurecr.io/bm/baremetal-operator:base-focal-20230405200004 |
|
baremetal-resource-controller |
n/a (merged to bm-collective) |
|
bm-collective New |
mirantis.azurecr.io/bm/bm-collective:base-alpine-20230405184901 |
|
dynamic_ipxe |
n/a (merged to bm-collective) |
|
dnsmasq-controller |
n/a (merged to bm-collective) |
|
ironic Updated |
mirantis.azurecr.io/openstack/ironic:yoga-focal-20230403060017 |
|
ironic-inspector Updated |
mirantis.azurecr.io/openstack/ironic-inspector:yoga-focal-20230403060017 |
|
ironic-prometheus-exporter Updated |
mirantis.azurecr.io/stacklight/ironic-prometheus-exporter:0.1-20230330140456 |
|
kaas-ipam Updated |
mirantis.azurecr.io/bm/kaas-ipam:base-focal-20230405184421 |
|
mariadb Updated |
mirantis.azurecr.io/general/mariadb:10.6.12-focal-20230328123811 |
|
mcc-keepalived Updated |
mirantis.azurecr.io/lcm/mcc-keepalived:v0.19.0-5-g6a7e17d |
|
metallb-controller |
mirantis.azurecr.io/bm/external/metallb/controller:v0.13.7-20221130155702-refresh-2023033102 |
|
metallb-speaker |
mirantis.azurecr.io/bm/external/metallb/speaker:v0.13.7-20221130155702-refresh-2023033102 |
|
syslog-ng Updated |
mirantis.azurecr.io/bm/syslog-ng:base-focal-20230316094816 |
Artifact |
Component |
Paths |
|---|---|---|
Bootstrap tarball Updated |
bootstrap-linux |
https://binary.mirantis.com/core/bin/bootstrap-linux-1.36.14.tar.gz |
bootstrap-darwin |
https://binary.mirantis.com/core/bin/bootstrap-darwin-1.36.14.tar.gz |
|
Helm charts Updated |
admission-controller |
https://binary.mirantis.com/core/helm/admission-controller-1.36.14.tgz |
agent-controller |
https://binary.mirantis.com/core/helm/agent-controller-1.36.14.tgz |
|
baremetal-provider |
https://binary.mirantis.com/core/helm/baremetal-provider-1.36.14.tgz |
|
byo-credentials-controller |
https://binary.mirantis.com/core/helm/byo-credentials-controller-1.36.14.tgz |
|
byo-provider |
https://binary.mirantis.com/core/helm/byo-provider-1.36.14.tgz |
|
ceph-kcc-controller |
https://binary.mirantis.com/core/helm/ceph-kcc-controller-1.36.14.tgz |
|
cert-manager |
https://binary.mirantis.com/core/helm/cert-manager-1.36.14.tgz |
|
client-certificate-controller |
https://binary.mirantis.com/core/helm/client-certificate-controller-1.36.14.tgz |
|
configuration-collector |
https://binary.mirantis.com/core/helm/configuration-collector-1.36.14.tgz |
|
event-controller |
https://binary.mirantis.com/core/helm/event-controller-1.36.14.tgz |
|
iam-controller |
https://binary.mirantis.com/core/helm/iam-controller-1.36.14.tgz |
|
kaas-exporter |
https://binary.mirantis.com/core/helm/kaas-exporter-1.36.14.tgz |
|
kaas-public-api |
https://binary.mirantis.com/core/helm/kaas-public-api-1.36.14.tgz |
|
kaas-ui |
||
lcm-controller |
https://binary.mirantis.com/core/helm/lcm-controller-1.36.14.tgz |
|
license-controller |
https://binary.mirantis.com/core/helm/license-controller-1.36.14.tgz |
|
machinepool-controller |
https://binary.mirantis.com/core/helm/machinepool-controller-1.36.14.tgz |
|
mcc-cache |
||
metrics-server |
https://binary.mirantis.com/core/helm/metrics-server-1.36.14.tgz |
|
openstack-provider |
https://binary.mirantis.com/core/helm/openstack-provider-1.36.14.tgz |
|
os-credentials-controller |
https://binary.mirantis.com/core/helm/os-credentials-controller-1.36.14.tgz |
|
portforward-controller |
https://binary.mirantis.com/core/helm/portforward-controller-1.36.14.tgz |
|
proxy-controller |
https://binary.mirantis.com/core/helm/proxy-controller-1.36.14.tgz |
|
rbac-controller |
https://binary.mirantis.com/core/helm/rbac-controller-1.36.14.tgz |
|
release-controller |
https://binary.mirantis.com/core/helm/release-controller-1.36.14.tgz |
|
rhellicense-controller |
https://binary.mirantis.com/core/helm/rhellicense-controller-1.36.14.tgz |
|
scope-controller |
http://binary.mirantis.com/core/helm/scope-controller-1.36.14.tgz |
|
squid-proxy |
https://binary.mirantis.com/core/helm/squid-proxy-1.36.14.tgz |
|
vsphere-credentials-controller |
https://binary.mirantis.com/core/helm/vsphere-credentials-controller-1.36.14.tgz |
|
vsphere-provider |
https://binary.mirantis.com/core/helm/vsphere-provider-1.36.14.tgz |
|
user-controller |
https://binary.mirantis.com/core/helm/user-controller-1.36.14.tgz |
|
Docker images |
admission-controller Updated |
mirantis.azurecr.io/core/admission-controller:1.36.14 |
agent-controller Updated |
mirantis.azurecr.io/core/agent-controller:1.36.14 |
|
byo-cluster-api-controller Updated |
mirantis.azurecr.io/core/byo-cluster-api-controller:1.36.14 |
|
byo-credentials-controller Updated |
mirantis.azurecr.io/core/byo-credentials-controller:1.36.14 |
|
ceph-kcc-controller Updated |
mirantis.azurecr.io/core/ceph-kcc-controller:1.36.14 |
|
cert-manager-controller |
mirantis.azurecr.io/core/external/cert-manager-controller:v1.6.1 |
|
client-certificate-controller Updated |
mirantis.azurecr.io/core/client-certificate-controller:1.36.14 |
|
cluster-api-provider-baremetal Updated |
mirantis.azurecr.io/core/cluster-api-provider-baremetal:1.36.14 |
|
frontend Updated |
mirantis.azurecr.io/core/frontend:1.36.14 |
|
iam-controller Updated |
mirantis.azurecr.io/core/iam-controller:1.36.14 |
|
kaas-exporter |
mirantis.azurecr.io/core/kaas-exporter:1.36.14 |
|
kproxy Updated |
mirantis.azurecr.io/core/kproxy:1.36.14 |
|
lcm-controller Updated |
mirantis.azurecr.io/core/lcm-controller:1.36.14 |
|
license-controller Updated |
mirantis.azurecr.io/core/license-controller:1.36.14 |
|
machinepool-controller Updated |
mirantis.azurecr.io/core/machinepool-controller:1.36.14 |
|
mcc-haproxy |
mirantis.azurecr.io/lcm/mcc-haproxy:v0.17.0-8-g6ca89d5 |
|
mcc-keepalived |
mirantis.azurecr.io/lcm/mcc-keepalived:v0.19.0-5-g6a7e17d |
|
metrics-server |
mirantis.azurecr.io/core/external/metrics-server:v0.6.3-2 |
|
nginx |
mirantis.azurecr.io/core/external/nginx:1.36.14 |
|
openstack-cloud-controller-manager |
mirantis.azurecr.io/lcm/kubernetes/openstack-cloud-controller-manager-amd64:v1.22.1-7-gc11024f8 |
|
openstack-cluster-api-controller Updated |
mirantis.azurecr.io/core/openstack-cluster-api-controller:1.36.14 |
|
os-credentials-controller Updated |
mirantis.azurecr.io/core/os-credentials-controller:1.36.14 |
|
portforward-controller Updated |
mirantis.azurecr.io/core/portforward-controller:1.36.14 |
|
proxy-controller Updated |
mirantis.azurecr.io/core/proxy-controller:1.36.14 |
|
rbac-controller Updated |
mirantis.azurecr.io/core/rbac-controller:1.36.14 |
|
registry Updated |
mirantis.azurecr.io/lcm/registry:v2.8.1-1-g7bde01d2 |
|
release-controller Updated |
mirantis.azurecr.io/core/release-controller:1.36.14 |
|
rhellicense-controller Updated |
mirantis.azurecr.io/core/rhellicense-controller:1.36.14 |
|
scope-controller Updated |
mirantis.azurecr.io/core/scope-controller:1.36.14 |
|
squid-proxy Updated |
mirantis.azurecr.io/lcm/squid-proxy:0.0.1-10-g24a0d69 |
|
storage-discovery Deprecated |
mirantis.azurecr.io/core/storage-discovery:1.36.14 |
|
user-controller Updated |
mirantis.azurecr.io/core/user-controller:1.36.14 |
|
vsphere-cluster-api-controller Updated |
mirantis.azurecr.io/core/vsphere-cluster-api-controller:1.36.14 |
|
vsphere-credentials-controller Updated |
mirantis.azurecr.io/core/vsphere-credentials-controller:1.36.14 |
Artifact |
Component |
Path |
|---|---|---|
Binaries |
hash-generate-linux |
http://binary.mirantis.com/iam/bin/hash-generate-0.0.1-268-3cf7f17-linux |
hash-generate-darwin |
http://binary.mirantis.com/iam/bin/hash-generate-0.0.1-268-3cf7f17-darwin |
|
Helm charts Updated |
iam |
|
iam-proxy |
||
Docker images |
kubernetes-entrypoint |
mirantis.azurecr.io/openstack/extra/kubernetes-entrypoint:v1.0.0-20200311160233 |
mariadb Updated |
mirantis.azurecr.io/general/mariadb:10.6.12-focal-20230227122722 |
|
keycloak Updated |
mirantis.azurecr.io/iam/keycloak:0.5.16 |
|
keycloak-gatekeeper Updated |
mirantis.azurecr.io/iam/keycloak-gatekeeper:7.1.3-4 |
In Container Cloud 2.23.2, 1087 vendor-specific CVEs have been addressed, 53 with critical and 1034 with high severity.
The full list of the CVEs present in the current Container Cloud release is available at the Mirantis Security Portal.
The Mirantis Container Cloud GA release 2.23.1 is based on 2.23.0 and:
Introduces support for the Cluster release 12.7.0 that is based on the Cluster release 11.7.0 and represents Mirantis OpenStack for Kubernetes (MOSK) 23.1.
This Cluster release is based on the updated version of Mirantis Kubernetes Engine 3.5.7 with Kubernetes 1.21 and Mirantis Container Runtime 20.10.13.
Supports the latest Cluster release 11.7.0
Does not support greenfield deployments based on deprecated Cluster releases 12.5.0 and 11.6.0. Use the latest available Cluster releases of the series instead.
For details about the Container Cloud release 2.23.1, refer to its parent releases 2.23.0 and 2.22.0:
Caution
Make sure to update the Cluster release version of your managed cluster before the current Cluster release version becomes unsupported by a new Container Cloud release version. Otherwise, Container Cloud stops auto-upgrade and eventually Container Cloud itself becomes unsupported.
The Mirantis Container Cloud GA release 2.23.0:
Introduces support for the Cluster release 11.7.0 that is based on Mirantis Container Runtime 20.10.13 and Mirantis Kubernetes Engine 3.5.7 with Kubernetes 1.21.
Supports the Cluster release 12.5.0 that is based on the Cluster release 11.5.0 and represents Mirantis OpenStack for Kubernetes (MOSK) 22.5.
Does not support greenfield deployments on deprecated Cluster releases 11.6.0, 8.10.0, and 7.11.0. Use the latest available Cluster releases of the series instead.
Caution
Make sure to update the Cluster release version of your managed cluster before the current Cluster release version becomes unsupported by a new Container Cloud release version. Otherwise, Container Cloud stops auto-upgrade and eventually Container Cloud itself becomes unsupported.
This section outlines release notes for the Container Cloud release 2.23.0.
This section outlines new features and enhancements introduced in the Mirantis Container Cloud release 2.23.0. For the list of enhancements in the Cluster release 11.7.0 that is introduced by the Container Cloud release 2.23.0, see the Cluster releases.
Deletion of persistent volumes during an OpenStack-based cluster deletion
The ‘Upgrade’ button for easy cluster update through the web UI
Implemented the capability to perform a graceful reboot on a management,
regional, or managed cluster for all supported providers using the
GracefulRebootRequest custom resource. Use this resource for a rolling
reboot of several or all cluster machines without workloads interruption.
The reboot occurs in the order of cluster upgrade policy.
The resource is also useful for a bulk reboot of machines, for example, on large clusters.
To verify the reboot status of a machine:
kubectl get machines <machineName> -o wide
Example of system response:
NAME READY LCMPHASE NODENAME UPGRADEINDEX REBOOTREQUIRED WARNINGS
demo-0 true Ready kaas-node-c6aa8ad3 1 true
Note
For MOSK-based deployments, the feature support is available since MOSK 23.1.
Enhanced Machine and Cluster objects by adding the following output
columns to the kubectl get machines -o wide and
kubectl get cluster -o wide commands to simplify
monitoring of machine and cluster states. More specifically, you can now
obtain the following machine and cluster details:
Machineobject:READYUPGRADEINDEXREBOOTREQUIREDWARNINGSLCMPHASE(renamed fromPHASE)
Clusterobject:READYRELEASEWARNINGS
Example system response of the kubectl get machines <machineName> -o wide command:
NAME READY LCMPHASE NODENAME UPGRADEINDEX REBOOTREQUIRED WARNINGS
demo-0 true Ready kaas-node-c6aa8ad3 1 true
Learn more
TechPreview
Implemented the initial Technology Preview API support for deletion of
persistent volumes during an OpenStack-based managed cluster deletion.
To enable the feature, set the boolean volumesCleanupEnabled option in the
spec.providerSpec.value section of the Cluster object before a managed
cluster deletion.
Implemented the capability to disable time sync management during a management
or regional cluster bootstrap using the ntpEnabled=false option.
The default setting remains ntpEnabled=true. The feature disables
the management of chrony configuration by Container Cloud and enables you
to use your own system for chrony management.
Note
For MOSK-based deployments, the feature support is available since MOSK 23.1.
The following issues have been addressed in the Mirantis Container Cloud release 2.23.0 along with the Cluster release 11.7.0:
[29647] Fixed the issue with the
Network preparedstage getting stuck in theNotStartedstatus during deployment of a vSphere-based management or regional cluster with IPAM disabled.[26896] Fixed the issue with the MetalLB liveness and readiness timeouts in a slow network.
[28313] Fixed the issue with the
iam-keycloakPod starting slowly because of DB errors causing timeouts while waiting for the OIDC configuration readiness.[28675] Fixed the issue with the Ceph OSD-related parameters configured using
rookConfiginKaaSCephclusterbeing not applied until OSDs are restarted. Now, parameters for Ceph OSD daemons apply during runtime instead of setting them directly inceph.conf. Therefore, no restart is required.[30040] Fixed the issue with the
HelmBundleReleaseNotDeployedalert that has therelease_name=opensearchlabel firing during the Container Cloud or Cluster release update due to issues with the claim request size in theelasticsearch.persistentVolumeClaimSizeconfiguration.[29329] Fixed the issue with recreation of the Patroni container replica being stuck in the degraded state due to the liveness probe killing the container that runs the
pg_rewindprocedure during cluster update.[28822] Fixed the issue with Reference Application triggering false-positive alerts related to Reference Application during its upgrade.
[28479] Fixed the issue with the restarts count of the
metric-collectorPod being increased in time withreason: OOMKilledincontainerStatusesof themetric-collectorPod on baremetal-based management clusters with HTTP proxy enabled.[28417] Fixed the issue with the Reports Dashboards plugin not being enabled by default preventing the use of the reporting option. For details about this plugin, see the GitHub OpenSearch documentation: OpenSearch Dashboards Reports.
[28373] Fixed the issue with Alerta getting stuck after a failed initialization during cluster creation with StackLight enabled.
This section lists known issues with workarounds for the Mirantis Container Cloud release 2.23.0 including the Cluster release 11.7.0.
For other issues that can occur while deploying and operating a Container Cloud cluster, see Troubleshooting Guide.
Note
This section also outlines still valid known issues from previous Container Cloud releases.
Due to the upstream MetalLB issue,
a race condition occurs when assigning an IP address after the MetalLB
controller restart. If a new service of the LoadBalancer type is created
during the MetalLB Controller restart, then this service can be assigned an IP
address that was already assigned to another service before the MetalLB
Controller restart.
To verify that the cluster is affected:
Verify whether IP addresses of the LoadBalancer (LB) type are duplicated
where they are not supposed to:
kubectl get svc -A|grep LoadBalancer
Note
Some services use shared IP addresses on purpose. In the example system response below, these are services using the IP address 10.0.1.141.
Example system response:
kaas dhcp-lb LoadBalancer 10.233.4.192 10.0.1.141 53:32594/UDP,67:30048/UDP,68:30464/UDP,69:31898/UDP,123:32450/UDP 13h
kaas dhcp-lb-tcp LoadBalancer 10.233.6.79 10.0.1.141 8080:31796/TCP,53:32012/TCP 11h
kaas httpd-http LoadBalancer 10.233.0.92 10.0.1.141 80:30115/TCP 13h
kaas iam-keycloak-http LoadBalancer 10.233.55.2 10.100.91.101 443:30858/TCP,9990:32301/TCP 2h
kaas ironic-kaas-bm LoadBalancer 10.233.26.176 10.0.1.141 6385:31748/TCP,8089:30604/TCP,5050:32200/TCP,9797:31988/TCP,601:31888/TCP 13h
kaas ironic-syslog LoadBalancer 10.233.59.199 10.0.1.141 514:32098/UDP 13h
kaas kaas-kaas-ui LoadBalancer 10.233.51.167 10.100.91.101 443:30976/TCP 13h
kaas mcc-cache LoadBalancer 10.233.40.68 10.100.91.102 80:32278/TCP,443:32462/TCP 12h
kaas mcc-cache-pxe LoadBalancer 10.233.10.75 10.0.1.142 80:30112/TCP,443:31559/TCP 12h
stacklight iam-proxy-alerta LoadBalancer 10.233.4.102 10.100.91.104 443:30101/TCP 12h
stacklight iam-proxy-alertmanager LoadBalancer 10.233.46.45 10.100.91.105 443:30944/TCP 12h
stacklight iam-proxy-grafana LoadBalancer 10.233.39.24 10.100.91.106 443:30953/TCP 12h
stacklight iam-proxy-prometheus LoadBalancer 10.233.12.174 10.100.91.107 443:31300/TCP 12h
stacklight telemeter-server-external LoadBalancer 10.233.56.63 10.100.91.103 443:30582/TCP 12h
In the above example, the iam-keycloak-http and kaas-kaas-ui
services erroneously use the same IP address 10.100.91.101. They both use the
same port 443 producing a collision when an application tries to access the
10.100.91.101:443 endpoint.
Workaround:
Unassign the current LB IP address for the selected service, as no LB IP address can be used for the
NodePortservice:kubectl -n kaas patch svc <serviceName> -p '{"spec":{"type":"NodePort"}}'
Assign a new LB IP address for the selected service:
kubectl -n kaas patch svc <serviceName> -p '{"spec":{"type":"LoadBalancer"}}'
The second affected service will continue using its current LB IP address.
During deletion of a manager machine running the ironic Pod from a bare
metal management cluster, the following problems occur:
All Pods are stuck in the
TerminatingstateA new
ironicPod fails to startThe related bare metal host is stuck in the
deprovisioningstate
As a workaround, before deletion of the node running the ironic Pod,
cordon and drain the node using the kubectl cordon <nodeName> and
kubectl drain <nodeName> commands.
If a baremetal-based regional cluster deployment fails before pivoting is done, the corresponding region deletion fails.
Workaround:
Using the command below, manually delete all possible traces of the failed
regional cluster deployment, including but not limited to the following
objects that contain the kaas.mirantis.com/region label of the affected
region:
clustermachinebaremetalhostbaremetalhostprofilel2templatesubnetipamhostipaddr
kubectl delete <objectName> -l kaas.mirantis.com/region=<regionName>
Warning
Do not use the same region name again after the regional cluster deployment failure since some objects that reference the region name may still exist.
Upgrade of a cluster with more than 120 nodes gets stuck with errors about
IP addresses exhaustion in the docker logs.
Note
If you plan to scale your cluster to more than 120 nodes, the cluster will be affected by the issue. Therefore, you will have to perform the workaround below.
Workaround:
Caution
If you have not run the cluster upgrade yet, simply recreate the
mke-overlay network as described in the step 6 and skip all other steps.
Note
If you successfully upgraded the cluster with less than 120 nodes but plan to scale it to more that 120 node, proceed with steps 2-9.
Verify that MKE nodes are upgraded:
On any master node, run the following command to identify
ucp-worker-agentthat has a newer version:docker service ls
Example of system response:
ID NAME MODE REPLICAS IMAGE PORTS 7jdl9m0giuso ucp-3-5-7 global 0/0 mirantis/ucp:3.5.7 uloi2ixrd0br ucp-auth-api global 3/3 mirantis/ucp-auth:3.5.7 pfub4xa17nkb ucp-auth-worker global 3/3 mirantis/ucp-auth:3.5.7 00w1kqn0x69w ucp-cluster-agent replicated 1/1 mirantis/ucp-agent:3.5.7 xjhwv1vrw9k5 ucp-kube-proxy-win global 0/0 mirantis/ucp-agent-win:3.5.7 oz28q8a7swmo ucp-kubelet-win global 0/0 mirantis/ucp-agent-win:3.5.7 ssjwonmnvk3s ucp-manager-agent global 3/3 mirantis/ucp-agent:3.5.7 ks0ttzydkxmh ucp-pod-cleaner-win global 0/0 mirantis/ucp-agent-win:3.5.7 w5d25qgneibv ucp-tigera-felix-win global 0/0 mirantis/ucp-agent-win:3.5.7 ni86z33o10n3 ucp-tigera-node-win global 0/0 mirantis/ucp-agent-win:3.5.7 iyyh1f0z6ejc ucp-worker-agent-win-x global 0/0 mirantis/ucp-agent-win:3.5.5 5z6ew4fmf2mm ucp-worker-agent-win-y global 0/0 mirantis/ucp-agent-win:3.5.7 gr52h05hcwwn ucp-worker-agent-x global 56/56 mirantis/ucp-agent:3.5.5 e8coi9bx2j7j ucp-worker-agent-y global 121/121 mirantis/ucp-agent:3.5.7
In the above example, it is
ucp-worker-agent-y.Obtain the node list:
docker service ps ucp-worker-agent-y | awk -F ' ' ‘$4 ~ /^kaas/ {print $4}’ > upgraded_nodes.txt
Identify the cluster ID. For example, run the following command on the management cluster:
kubectl -n <clusterNamespace> get cluster <clusterName> -o json | jq '.status.providerStatus.mke.clusterID'
Create a backup of MKE as described in the MKE documentation: Backup procedure.
Remove MKE services:
docker service rm ucp-cluster-agent ucp-manager-agent ucp-worker-agent-win-y ucp-worker-agent-y ucp-worker-agent-win-x ucp-worker-agent-x
Remove the
mke-overlaynetwork:docker network rm mke-overlay
Recreate the
mke-overlaynetwork with a correct CIDR that must be at least/20and have no interventions with other subnets in the cluster network. For example:docker network create -d overlay --subnet 10.1.0.0/20 mke-overlay
Create placeholder worker services:
docker service create --name ucp-worker-agent-x --mode global --constraint node.labels.foo==bar --detach busybox sleep 3d docker service create --name ucp-worker-agent-win-x --mode global --constraint node.labels.foo==bar --detach busybox sleep 3d
Recreate all MKE services using the previously obtained cluster ID. Use the target version for your cluster, for example,
3.5.7:docker container run --rm -it --name ucp -v /var/run/docker.sock:/var/run/docker.sock mirantis/ucp:3.5.7 upgrade --debug --manual-worker-upgrade --force-minimums --id <cluster ID> --interactive --force-port-check
Note
Because of interactive mode, you may need to use
Ctrl+Cwhen the command execution completes.Verify that all services are recreated:
docker service ls
The exemplary
ucp-worker-agent-yservice must have 1 replica running with a node that was previously stuck.Using the node list obtained in the first step, remove the
upgrade-holdlabels from the nodes that were previously upgraded:for i in $(cat upgraded_nodes.txt); do docker node update --label-rm com.docker.ucp.upgrade-hold $i; done
Verify that all nodes from the list obtained in the first step are present in the
ucp-worker-agent-yservice. For example:docker service ps ucp-worker-agent-y
Fixed in 2.28.4 (17.3.4 and 16.3.4)
During replacement of a manager machine, the following problems may occur:
The system adds the node to Docker swarm but not to Kubernetes
The node
Deploymentgets stuck with failed RethinkDB health checks
Workaround:
Delete the failed node.
Wait for the MKE cluster to become healthy. To monitor the cluster status:
Log in to the MKE web UI.
Monitor the cluster status as described in MKE Operations Guide: Monitor an MKE cluster with the MKE web UI.
Deploy a new node.
Fixed in 2.28.4 (17.3.4 and 16.3.4)
During the unsafe or forced deletion of a manager machine running the
calico-kube-controllers Pod in the kube-system namespace,
the following issues occur:
The
calico-kube-controllersPod fails to clean up resources associated with the deleted nodeThe
calico-nodePod may fail to start up on a newly created node if the machine is provisioned with the same IP address as the deleted machine had
As a workaround, before deletion of the node running the
calico-kube-controllers Pod, cordon and drain the node:
kubectl cordon <nodeName>
kubectl drain <nodeName>
Fixed in 2.28.4 (17.3.4 and 16.3.4)
During replacement of a master node on a cluster of any type, the
calico-node Pod fails to start on a new node that has the same IP address
as the node being replaced.
Workaround:
Log in to any
masternode.From a CLI with an MKE client bundle, create a shell alias to start calicoctl using the
mirantis/ucp-dsinfoimage:alias calicoctl="\ docker run -i --rm \ --pid host \ --net host \ -e constraint:ostype==linux \ -e ETCD_ENDPOINTS=<etcdEndpoint> \ -e ETCD_KEY_FILE=/var/lib/docker/volumes/ucp-kv-certs/_data/key.pem \ -e ETCD_CA_CERT_FILE=/var/lib/docker/volumes/ucp-kv-certs/_data/ca.pem \ -e ETCD_CERT_FILE=/var/lib/docker/volumes/ucp-kv-certs/_data/cert.pem \ -v /var/run/calico:/var/run/calico \ -v /var/lib/docker/volumes/ucp-kv-certs/_data:/var/lib/docker/volumes/ucp-kv-certs/_data:ro \ mirantis/ucp-dsinfo:<mkeVersion> \ calicoctl \ "
alias calicoctl="\ docker run -i --rm \ --pid host \ --net host \ -e constraint:ostype==linux \ -e ETCD_ENDPOINTS=<etcdEndpoint> \ -e ETCD_KEY_FILE=/ucp-node-certs/key.pem \ -e ETCD_CA_CERT_FILE=/ucp-node-certs/ca.pem \ -e ETCD_CERT_FILE=/ucp-node-certs/cert.pem \ -v /var/run/calico:/var/run/calico \ -v ucp-node-certs:/ucp-node-certs:ro \ mirantis/ucp-dsinfo:<mkeVersion> \ calicoctl --allow-version-mismatch \ "
In the above command, replace the following values with the corresponding settings of the affected cluster:
<etcdEndpoint>is the etcd endpoint defined in the Calico configuration file. For example,ETCD_ENDPOINTS=127.0.0.1:12378<mkeVersion>is the MKE version installed on your cluster. For example,mirantis/ucp-dsinfo:3.5.7.
Verify the node list on the cluster:
kubectl get node
Compare this list with the node list in Calico to identify the old node:
calicoctl get node -o wide
Remove the old node from Calico:
calicoctl delete node kaas-node-<nodeID>
During update of a Container Cloud cluster of any type, if the MKE minor
version is updated from 3.4.x to 3.5.x, access to the cluster using the
existing kubeconfig fails with the You must be logged in to the server
(Unauthorized) error due to OIDC settings being reconfigured.
As a workaround, during the cluster update process, use the admin
kubeconfig instead of the existing one. Once the update completes, you can
use the existing cluster kubeconfig again.
To obtain the admin kubeconfig:
kubectl --kubeconfig <pathToMgmtKubeconfig> get secret -n <affectedClusterNamespace> \
-o yaml <affectedClusterName>-kubeconfig | awk '/admin.conf/ {print $2}' | \
head -1 | base64 -d > clusterKubeconfig.yaml
If the related cluster is regional, replace <pathToMgmtKubeconfig> with
<pathToRegionalKubeconfig>.
When setting a new Transport Layer Security (TLS) certificate for a cluster,
the false positive failed to get kubeconfig error may occur on the
Waiting for TLS settings to be applied stage. No actions are required.
Therefore, disregard the error.
To verify the status of the TLS configuration being applied:
kubectl get cluster <ClusterName> -n <ClusterProjectName> -o jsonpath-as-json="{.status.providerStatus.tls.<Application>}"
Possible values for the <Application> parameter are as follows:
keycloakuicachemkeiamProxyAlertaiamProxyAlertManageriamProxyGrafanaiamProxyKibanaiamProxyPrometheus
Example of system response:
[
{
"expirationTime": "2024-01-06T09:37:04Z",
"hostname": "domain.com",
}
]
In this example, expirationTime equals the NotAfter field of the
server certificate. And the value of hostname contains the configured
application name.
The deployment of Ceph OSDs fails with the following messages in the status
section of the KaaSCephCluster custom resource:
shortClusterInfo:
messages:
- Not all osds are deployed
- Not all osds are in
- Not all osds are up
To find out if your cluster is affected, verify if the devices on
the AMD hosts you use for the Ceph OSDs deployment are removable.
For example, if the sdb device name is specified in
spec.cephClusterSpec.nodes.storageDevices of the KaaSCephCluster
custom resource for the affected host, run:
# cat /sys/block/sdb/removable
1
The system output shows that the reason of the above messages in status
is the enabled hotplug functionality on the AMD nodes, which marks all drives
as removable. And the hotplug functionality is not supported by Ceph in
Container Cloud.
As a workaround, disable the hotplug functionality in the BIOS settings for disks that are configured to be used as Ceph OSD data devices.
Due to the upstream Ceph issue
occurring since Ceph Pacific, the pg_autoscaler module of Ceph Manager
fails with the pool <poolNumber> has overlapping roots error if a Ceph
cluster contains a mix of pools with deviceClass either explicitly
specified or not specified.
The deviceClass parameter is required for a pool definition in the
spec section of the KaaSCephCluster object, but not required for Ceph
RADOS Gateway (RGW) and Ceph File System (CephFS).
Therefore, if sections for Ceph RGW or CephFS data or metadata pools are
defined without deviceClass, then autoscaling of placement groups is
disabled on a cluster due to overlapping roots. Overlapping roots imply that
Ceph RGW and/or CephFS pools obtained the default crush rule and have no
demarcation on a specific class to store data.
Note
If pools for Ceph RGW and CephFS already have deviceClass
specified, skip the corresponding steps of the below procedure.
Note
Perform the below procedure on the affected managed cluster using
its kubeconfig.
Workaround:
Obtain
failureDomainand required replicas for Ceph RGW and/or CephFS pools:Note
If the
KaasCephClusterspecsection does not containfailureDomain,failureDomainequalshostby default to store one replica per node.Note
The types of pools crush rules include:
An
erasureCodedpool requires thecodingChunks + dataChunksnumber of available units offailureDomain.A
replicatedpool requires thereplicated.sizenumber of available units offailureDomain.
To obtain Ceph RGW pools, use the
spec.cephClusterSpec.objectStorage.rgwsection of theKaaSCephClusterobject. For example:objectStorage: rgw: dataPool: failureDomain: host erasureCoded: codingChunks: 1 dataChunks: 2 metadataPool: failureDomain: host replicated: size: 3 gateway: allNodes: false instances: 3 port: 80 securePort: 8443 name: openstack-store preservePoolsOnDelete: false
The
dataPoolpool requires the sum ofcodingChunksanddataChunksvalues representing the number of available units offailureDomain. In the example above, forfailureDomain: host,dataPoolrequires3available nodes to store its objects.The
metadataPoolpool requires thereplicated.sizenumber of available units offailureDomain. ForfailureDomain: host,metadataPoolrequires3available nodes to store its objects.To obtain CephFS pools, use the
spec.cephClusterSpec.sharedFilesystem.cephFSsection of theKaaSCephClusterobject. For example:sharedFilesystem: cephFS: - name: cephfs-store dataPools: - name: default-pool replicated: size: 3 failureDomain: host - name: second-pool erasureCoded: dataChunks: 2 codingChunks: 1 metadataPool: replicated: size: 3 failureDomain: host ...
The
default-poolandmetadataPoolpools require thereplicated.sizenumber of available units offailureDomain. ForfailureDomain: host,default-poolrequires3available nodes to store its objects.The
second-poolpool requires the sum ofcodingChunksanddataChunksrepresenting the number of available units offailureDomain. ForfailureDomain: host,second-poolrequires3available nodes to store its objects.
Obtain the device class that meets the desired number of required replicas for the defined
failureDomain.Obtaining of the device class
Get a shell of the
ceph-toolsPod:kubectl -n rook-ceph exec -it deploy/rook-ceph-tools -- bash
Obtain the Ceph crush tree with all available crush rules of the device class:
ceph osd tree
Example output:
ID CLASS WEIGHT TYPE NAME STATUS REWEIGHT PRI-AFF -1 0.18713 root default -3 0.06238 host kaas-node-a29ecf2d-a2cc-493e-bd83-00e9639a7db8 0 hdd 0.03119 osd.0 up 1.00000 1.00000 3 ssd 0.03119 osd.3 up 1.00000 1.00000 -5 0.06238 host kaas-node-dd6826b0-fe3f-407c-ae29-6b0e4a40019d 1 hdd 0.03119 osd.1 up 1.00000 1.00000 4 ssd 0.03119 osd.4 up 1.00000 1.00000 -7 0.06238 host kaas-node-df65fa30-d657-477e-bad2-16f69596d37a 2 hdd 0.03119 osd.2 up 1.00000 1.00000 5 ssd 0.03119 osd.5 up 1.00000 1.00000
Calculate the number of the
failureDomainunits with each device class.For
failureDomain: host,hddandssddevice classes from the example output above have3units each.Select the device classes that meet the replicas requirement. In the example output above, both
hddandssdare applicable to store the pool data.Exit the
ceph-toolsPod.
Calculate potential data size for Ceph RGW and CephFS pools.
Calculation of data size
Obtain Ceph data stored by classes and pools:
kubectl -n rook-ceph exec -it deploy/rook-ceph-tools -- ceph df
Example output:
--- RAW STORAGE --- CLASS SIZE AVAIL USED RAW USED %RAW USED hdd 96 GiB 90 GiB 6.0 GiB 6.0 GiB 6.26 ssd 96 GiB 96 GiB 211 MiB 211 MiB 0.21 TOTAL 192 GiB 186 GiB 6.2 GiB 6.2 GiB 3.24 --- POOLS --- POOL ID PGS STORED OBJECTS USED %USED MAX AVAIL device_health_metrics 1 1 0 B 0 0 B 0 42 GiB kubernetes-hdd 2 32 2.3 GiB 707 4.6 GiB 5.15 42 GiB kubernetes-2-ssd 11 32 19 B 1 8 KiB 0 45 GiB openstack-store.rgw.meta 12 32 2.5 KiB 10 64 KiB 0 45 GiB openstack-store.rgw.log 13 32 23 KiB 309 1.3 MiB 0 45 GiB .rgw.root 14 32 4.8 KiB 16 120 KiB 0 45 GiB openstack-store.rgw.otp 15 32 0 B 0 0 B 0 45 GiB openstack-store.rgw.control 16 32 0 B 8 0 B 0 45 GiB openstack-store.rgw.buckets.index 17 32 2.7 KiB 22 5.3 KiB 0 45 GiB openstack-store.rgw.buckets.non-ec 18 32 0 B 0 0 B 0 45 GiB openstack-store.rgw.buckets.data 19 32 103 MiB 26 155 MiB 0.17 61 GiB
Summarize the
USEDsize of all<rgwName>.rgw.*pools and compare it with theAVAILsize of each applicable device class selected in the previous step.Note
As Ceph RGW pools lack explicit specification of
deviceClass, they may store objects on all device classes. The resulted device size can be smaller than the calculatedUSEDsize because part of data can already be stored in the desired class. Therefore, limiting pools to a single device class may result in a smaller occupied data size than the totalUSEDsize. Nonetheless, calculating theUSEDsize of all pools remains valid because the pool data may not be stored on the selected device class.For CephFS data or metadata pools, use the previous step to calculate the
USEDsize of pools and compare it with theAVAILsize.Decide which device class from applicable by required replicas and available size is more preferable to store Ceph RGW and CephFS data. In the example output above,
hddandssdare both applicable. Therefore, select any of them.Note
You can select different device classes for Ceph RGW and CephFS. For example,
hddfor Ceph RGW andssdfor CephFS. Select a device class based on performance expectations, if any.
Create the
rule-helperscript to switch Ceph RGW or CephFS pools to a device usage.Creation of the
rule-helperscriptCreate the
rule-helperscript file:Get a shell of the
ceph-toolsPod:kubectl -n rook-ceph exec -it deploy/rook-ceph-tools -- bash
Create the
/tmp/rule-helper.pyfile with the following content:cat > /tmp/rule-helper.py << EOF import argparse import json import subprocess from sys import argv, exit def get_cmd(cmd_args): output_args = ['--format', 'json'] _cmd = subprocess.Popen(cmd_args + output_args, stdout=subprocess.PIPE, stderr=subprocess.PIPE) stdout, stderr = _cmd.communicate() if stderr: error = stderr print("[ERROR] Failed to get '{0}': {1}".format(cmd_args.join(' '), stderr)) return return stdout def format_step(action, cmd_args): return "{0}:\n\t{1}".format(action, ' '.join(cmd_args)) def process_rule(rule): steps = [] new_rule_name = rule['rule_name'] + '_v2' if rule['type'] == "replicated": rule_create_args = ['ceph', 'osd', 'crush', 'create-replicated', new_rule_name, rule['root'], rule['failure_domain'], rule['device_class']] steps.append(format_step("create a new replicated rule for pool", rule_create_args)) else: new_profile_name = rule['profile_name'] + '_' + rule['device_class'] profile_create_args = ['ceph', 'osd', 'erasure-code-profile', 'set', new_profile_name] for k,v in rule['profile'].items(): profile_create_args.append("{0}={1}".format(k,v)) rule_create_args = ['ceph', 'osd', 'crush', 'create-erasure', new_rule_name, new_profile_name] steps.append(format_step("create a new erasure-coded profile", profile_create_args)) steps.append(format_step("create a new erasure-coded rule for pool", rule_create_args)) set_rule_args = ['ceph', 'osd', 'pool', 'set', 'crush_rule', rule['pool_name'], new_rule_name] revert_rule_args = ['ceph', 'osd', 'pool', 'set', 'crush_rule', new_rule_name, rule['pool_name']] rm_old_rule_args = ['ceph', 'osd', 'crush', 'rule', 'rm', rule['rule_name']] rename_rule_args = ['ceph', 'osd', 'crush', 'rule', 'rename', new_rule_name, rule['rule_name']] steps.append(format_step("set pool crush rule to new one", set_rule_args)) steps.append("check that replication is finished and status healthy: ceph -s") steps.append(format_step("in case of any problems revert step 2 and stop procedure", revert_rule_args)) steps.append(format_step("remove standard (old) pool crush rule", rm_old_rule_args)) steps.append(format_step("rename new pool crush rule to standard name", rename_rule_args)) if rule['type'] != "replicated": rm_old_profile_args = ['ceph', 'osd', 'erasure-code-profile', 'rm', rule['profile_name']] steps.append(format_step("remove standard (old) erasure-coded profile", rm_old_profile_args)) for idx, step in enumerate(steps): print(" {0}) {1}".format(idx+1, step)) def check_rules(args): extra_pools_lookup = [] if args.type == "rgw": extra_pools_lookup.append(".rgw.root") pools_str = get_cmd(['ceph', 'osd', 'pool', 'ls', 'detail']) if pools_str == '': return rules_str = get_cmd(['ceph', 'osd', 'crush', 'rule', 'dump']) if rules_str == '': return try: pools_dump = json.loads(pools_str) rules_dump = json.loads(rules_str) if len(pools_dump) == 0: print("[ERROR] No pools found") return if len(rules_dump) == 0: print("[ERROR] No crush rules found") return crush_rules_recreate = [] for pool in pools_dump: if pool['pool_name'].startswith(args.prefix) or pool['pool_name'] in extra_pools_lookup: rule_id = pool['crush_rule'] for rule in rules_dump: if rule['rule_id'] == rule_id: recreate = False new_rule = {'rule_name': rule['rule_name'], 'pool_name': pool['pool_name']} for step in rule.get('steps',[]): root = step.get('item_name', '').split('~') if root[0] != '' and len(root) == 1: new_rule['root'] = root[0] continue failure_domain = step.get('type', '') if failure_domain != '': new_rule['failure_domain'] = failure_domain if new_rule.get('root', '') == '': continue new_rule['device_class'] = args.device_class if pool['erasure_code_profile'] == "": new_rule['type'] = "replicated" else: new_rule['type'] = "erasure" profile_str = get_cmd(['ceph', 'osd', 'erasure-code-profile', 'get', pool['erasure_code_profile']]) if profile_str == '': return profile_dump = json.loads(profile_str) profile_dump['crush-device-class'] = args.device_class new_rule['profile_name'] = pool['erasure_code_profile'] new_rule['profile'] = profile_dump crush_rules_recreate.append(new_rule) break print("Found {0} pools with crush rules require device class set".format(len(crush_rules_recreate))) for new_rule in crush_rules_recreate: print("- Pool {0} requires crush rule update, device class is not set".format(new_rule['pool_name'])) process_rule(new_rule) except Exception as err: print("[ERROR] Failed to get info from Ceph: {0}".format(err)) return if __name__ == '__main__': parser = argparse.ArgumentParser( description='Ceph crush rules checker. Specify device class and service name.', prog=argv[0], usage='%(prog)s [options]') parser.add_argument('--type', type=str, help='Type of pool: rgw, cephfs', default='', required=True) parser.add_argument('--prefix', type=str, help='Pool prefix. If objectstore - use objectstore name, if CephFS - CephFS name.', default='', required=True) parser.add_argument('--device-class', type=str, help='Device class to switch on.', required=True) args = parser.parse_args() if len(argv) < 3: parser.print_help() exit(0) check_rules(args) EOF
Exit the
ceph-toolsPod.
For Ceph RGW, execute the
rule-helperscript to output the step-by-step instruction and run each step provided in the output manually.Note
The following steps include creation of crush rules with the same parameters as before but with the device class specification and switching of pools to new crush rules.
Execution of the
rule-helperscript steps for Ceph RGWGet a shell of the
ceph-toolsPod:kubectl -n rook-ceph exec -it deploy/rook-ceph-tools -- bash
Run the
/tmp/rule-helper.pyscript with the following parameters:python3 /tmp/rule-helper.py --prefix <rgwName> --type rgw --device-class <deviceClass>
Substitute the following parameters:
<rgwName>with the Ceph RGW name fromspec.cephClusterSpec.objectStorage.rgw.namein theKaaSCephClusterobject. In the example above, the name isopenstack-store.<deviceClass>with the device class selected in the previous steps.
Using the output of the command from the previous step, run manual commands step-by-step.
Example output for the
hdddevice class:Found 7 pools with crush rules require device class set - Pool openstack-store.rgw.control requires crush rule update, device class is not set 1) create a new replicated rule for pool: ceph osd crush create-replicated openstack-store.rgw.control_v2 default host hdd 2) set pool crush rule to new one: ceph osd pool set crush_rule openstack-store.rgw.control openstack-store.rgw.control_v2 3) check that replication is finished and status healthy: ceph -s 4) in case of any problems revert step 2 and stop procedure: ceph osd pool set crush_rule openstack-store.rgw.control_v2 openstack-store.rgw.control 5) remove standard (old) pool crush rule: ceph osd crush rule rm openstack-store.rgw.control 6) rename new pool crush rule to standard name: ceph osd crush rule rename openstack-store.rgw.control_v2 openstack-store.rgw.control - Pool openstack-store.rgw.log requires crush rule update, device class is not set 1) create a new replicated rule for pool: ceph osd crush create-replicated openstack-store.rgw.log_v2 default host hdd 2) set pool crush rule to new one: ceph osd pool set crush_rule openstack-store.rgw.log openstack-store.rgw.log_v2 3) check that replication is finished and status healthy: ceph -s 4) in case of any problems revert step 2 and stop procedure: ceph osd pool set crush_rule openstack-store.rgw.log_v2 openstack-store.rgw.log 5) remove standard (old) pool crush rule: ceph osd crush rule rm openstack-store.rgw.log 6) rename new pool crush rule to standard name: ceph osd crush rule rename openstack-store.rgw.log_v2 openstack-store.rgw.log - Pool openstack-store.rgw.buckets.non-ec requires crush rule update, device class is not set 1) create a new replicated rule for pool: ceph osd crush create-replicated openstack-store.rgw.buckets.non-ec_v2 default host hdd 2) set pool crush rule to new one: ceph osd pool set crush_rule openstack-store.rgw.buckets.non-ec openstack-store.rgw.buckets.non-ec_v2 3) check that replication is finished and status healthy: ceph -s 4) in case of any problems revert step 2 and stop procedure: ceph osd pool set crush_rule openstack-store.rgw.buckets.non-ec_v2 openstack-store.rgw.buckets.non-ec 5) remove standard (old) pool crush rule: ceph osd crush rule rm openstack-store.rgw.buckets.non-ec 6) rename new pool crush rule to standard name: ceph osd crush rule rename openstack-store.rgw.buckets.non-ec_v2 openstack-store.rgw.buckets.non-ec - Pool .rgw.root requires crush rule update, device class is not set 1) create a new replicated rule for pool: ceph osd crush create-replicated .rgw.root_v2 default host hdd 2) set pool crush rule to new one: ceph osd pool set crush_rule .rgw.root .rgw.root_v2 3) check that replication is finished and status healthy: ceph -s 4) in case of any problems revert step 2 and stop procedure: ceph osd pool set crush_rule .rgw.root_v2 .rgw.root 5) remove standard (old) pool crush rule: ceph osd crush rule rm .rgw.root 6) rename new pool crush rule to standard name: ceph osd crush rule rename .rgw.root_v2 .rgw.root - Pool openstack-store.rgw.meta requires crush rule update, device class is not set 1) create a new replicated rule for pool: ceph osd crush create-replicated openstack-store.rgw.meta_v2 default host hdd 2) set pool crush rule to new one: ceph osd pool set crush_rule openstack-store.rgw.meta openstack-store.rgw.meta_v2 3) check that replication is finished and status healthy: ceph -s 4) in case of any problems revert step 2 and stop procedure: ceph osd pool set crush_rule openstack-store.rgw.meta_v2 openstack-store.rgw.meta 5) remove standard (old) pool crush rule: ceph osd crush rule rm openstack-store.rgw.meta 6) rename new pool crush rule to standard name: ceph osd crush rule rename openstack-store.rgw.meta_v2 openstack-store.rgw.meta - Pool openstack-store.rgw.buckets.index requires crush rule update, device class is not set 1) create a new replicated rule for pool: ceph osd crush create-replicated openstack-store.rgw.buckets.index_v2 default host hdd 2) set pool crush rule to new one: ceph osd pool set crush_rule openstack-store.rgw.buckets.index openstack-store.rgw.buckets.index_v2 3) check that replication is finished and status healthy: ceph -s 4) in case of any problems revert step 2 and stop procedure: ceph osd pool set crush_rule openstack-store.rgw.buckets.index_v2 openstack-store.rgw.buckets.index 5) remove standard (old) pool crush rule: ceph osd crush rule rm openstack-store.rgw.buckets.index 6) rename new pool crush rule to standard name: ceph osd crush rule rename openstack-store.rgw.buckets.index_v2 openstack-store.rgw.buckets.index - Pool openstack-store.rgw.buckets.data requires crush rule update, device class is not set 1) create a new erasure-coded profile: ceph osd erasure-code-profile set openstack-store_ecprofile_hdd crush-device-class=hdd crush-failure-domain=host crush-root=default jerasure-per-chunk-alignment=false k=2 m=1 plugin=jerasure technique=reed_sol_van w=8 2) create a new erasure-coded rule for pool: ceph osd crush create-erasure openstack-store.rgw.buckets.data_v2 openstack-store_ecprofile_hdd 3) set pool crush rule to new one: ceph osd pool set crush_rule openstack-store.rgw.buckets.data openstack-store.rgw.buckets.data_v2 4) check that replication is finished and status healthy: ceph -s 5) in case of any problems revert step 2 and stop procedure: ceph osd pool set crush_rule openstack-store.rgw.buckets.data_v2 openstack-store.rgw.buckets.data 6) remove standard (old) pool crush rule: ceph osd crush rule rm openstack-store.rgw.buckets.data 7) rename new pool crush rule to standard name: ceph osd crush rule rename openstack-store.rgw.buckets.data_v2 openstack-store.rgw.buckets.data 8) remove standard (old) erasure-coded profile: ceph osd erasure-code-profile rm openstack-store_ecprofile
Verify that the Ceph cluster has rebalanced and has the
HEALTH_OKstatus:ceph -sExit the
ceph-toolsPod.
For CephFS, execute the
rule-helperscript to output the step-by-step instruction and run each step provided in the output manually.Execution of the
rule-helperscript steps for CephFSGet a shell of the
ceph-toolsPod:kubectl -n rook-ceph exec -it deploy/rook-ceph-tools -- bash
Run the
/tmp/rule-helper.pyscript with the following parameters:python3 /tmp/rule-helper.py --prefix <cephfsName> --type cephfs --device-class <deviceClass>
Substitute the following parameters:
<cephfsName>with CephFS name fromspec.cephClusterSpec.sharedFilesystem.cephFS[0].namein theKaaSCephClusterobject. In the example above, the name iscephfs-store.<deviceClass>with the device class selected in the previous steps.
Using the output of the command from the previous step, run manual commands step-by-step.
Example output for the
hdddevice class:Found 3 rules require device class set - Pool cephfs-store-metadata requires crush rule update, device class is not set 1) create a new replicated rule for pool: ceph osd crush create-replicated cephfs-store-metadata_v2 default host ssd 2) set pool crush rule to new one: ceph osd pool set crush_rule cephfs-store-metadata cephfs-store-metadata_v2 3) check that replication is finished and status healthy: ceph -s 4) in case of any problems revert step 2 and stop procedure: ceph osd pool set crush_rule cephfs-store-metadata_v2 cephfs-store-metadata 5) remove standard (old) pool crush rule: ceph osd crush rule rm cephfs-store-metadata 6) rename new pool crush rule to standard name: ceph osd crush rule rename cephfs-store-metadata_v2 cephfs-store-metadata - Pool cephfs-store-default-pool requires crush rule update, device class is not set 1) create a new replicated rule for pool: ceph osd crush create-replicated cephfs-store-default-pool_v2 default host ssd 2) set pool crush rule to new one: ceph osd pool set crush_rule cephfs-store-default-pool cephfs-store-default-pool_v2 3) check that replication is finished and status healthy: ceph -s 4) in case of any problems revert step 2 and stop procedure: ceph osd pool set crush_rule cephfs-store-default-pool_v2 cephfs-store-default-pool 5) remove standard (old) pool crush rule: ceph osd crush rule rm cephfs-store-default-pool 6) rename new pool crush rule to standard name: ceph osd crush rule rename cephfs-store-default-pool_v2 cephfs-store-default-pool - Pool cephfs-store-second-pool requires crush rule update, device class is not set 1) create a new erasure-coded profile: ceph osd erasure-code-profile set cephfs-store-second-pool_ecprofile_ssd crush-device-class=ssd crush-failure-domain=host crush-root=default jerasure-per-chunk-alignment=false k=2 m=1 plugin=jerasure technique=reed_sol_van w=8 2) create a new erasure-coded rule for pool: ceph osd crush create-erasure cephfs-store-second-pool_v2 cephfs-store-second-pool_ecprofile_ssd 3) set pool crush rule to new one: ceph osd pool set crush_rule cephfs-store-second-pool cephfs-store-second-pool_v2 4) check that replication is finished and status healthy: ceph -s 5) in case of any problems revert step 2 and stop procedure: ceph osd pool set crush_rule cephfs-store-second-pool_v2 cephfs-store-second-pool 6) remove standard (old) pool crush rule: ceph osd crush rule rm cephfs-store-second-pool 7) rename new pool crush rule to standard name: ceph osd crush rule rename cephfs-store-second-pool_v2 cephfs-store-second-pool 8) remove standard (old) erasure-coded profile: ceph osd erasure-code-profile rm cephfs-store-second-pool_ecprofile
Verify that the Ceph cluster has rebalanced and has the
HEALTH_OKstatus:ceph -sExit the
ceph-toolsPod.
Verify the
pg_autoscalermodule after switchingdeviceClassfor all required pools:ceph osd pool autoscale-status
The system response must contain all Ceph RGW and CephFS pools.
On the management cluster, edit the
KaaSCephClusterobject of the corresponding managed cluster by adding the selected device class to thedeviceClassparameter of the updated Ceph RGW and CephFS pools:kubectl -n <managedClusterProjectName> edit kaascephcluster
Example configuration
spec: cephClusterSpec: objectStorage: rgw: dataPool: failureDomain: host deviceClass: <rgwDeviceClass> erasureCoded: codingChunks: 1 dataChunks: 2 metadataPool: failureDomain: host deviceClass: <rgwDeviceClass> replicated: size: 3 gateway: allNodes: false instances: 3 port: 80 securePort: 8443 name: openstack-store preservePoolsOnDelete: false ... sharedFilesystem: cephFS: - name: cephfs-store dataPools: - name: default-pool deviceClass: <cephfsDeviceClass> replicated: size: 3 failureDomain: host - name: second-pool deviceClass: <cephfsDeviceClass> erasureCoded: dataChunks: 2 codingChunks: 1 metadataPool: deviceClass: <cephfsDeviceClass> replicated: size: 3 failureDomain: host ...
Substitute
<rgwDeviceClass>with the device class applied to Ceph RGW pools and<cephfsDeviceClass>with the device class applied to CephFS pools.You can use this configuration step for further management of Ceph RGW and/or CephFS. It does not impact the existing Ceph cluster configuration.
Note
The issue does not reproduce since MOSK 25.2.
Update of a managed cluster based on bare metal and Ceph enabled fails with
PersistentVolumeClaim getting stuck in the Pending state for the
prometheus-server StatefulSet and the
MountVolume.MountDevice failed for volume warning in the StackLight event
logs.
Workaround:
Verify that the description of the Pods that failed to run contain the
FailedMountevents:kubectl -n <affectedProjectName> describe pod <affectedPodName>
In the command above, replace the following values:
<affectedProjectName>is the Container Cloud project name where the Pods failed to run<affectedPodName>is a Pod name that failed to run in the specified project
In the Pod description, identify the node name where the Pod failed to run.
Verify that the
csi-rbdpluginlogs of the affected node contain therbd volume mount failed: <csi-vol-uuid> is being usederror. The<csi-vol-uuid>is a unique RBD volume name.Identify
csiPodNameof the correspondingcsi-rbdplugin:kubectl -n rook-ceph get pod -l app=csi-rbdplugin \ -o jsonpath='{.items[?(@.spec.nodeName == "<nodeName>")].metadata.name}'
Output the affected
csiPodNamelogs:kubectl -n rook-ceph logs <csiPodName> -c csi-rbdplugin
Scale down the affected
StatefulSetorDeploymentof the Pod that fails to0replicas.On every
csi-rbdpluginPod, search for stuckcsi-vol:for pod in `kubectl -n rook-ceph get pods|grep rbdplugin|grep -v provisioner|awk '{print $1}'`; do echo $pod kubectl exec -it -n rook-ceph $pod -c csi-rbdplugin -- rbd device list | grep <csi-vol-uuid> done
Unmap the affected
csi-vol:rbd unmap -o force /dev/rbd<i>
The
/dev/rbd<i>value is a mapped RBD volume that usescsi-vol.Delete
volumeattachmentof the affected Pod:kubectl get volumeattachments | grep <csi-vol-uuid> kubectl delete volumeattacmhent <id>
Scale up the affected
StatefulSetorDeploymentback to the original number of replicas and wait until its state becomesRunning.
Note
If you obtain patch releases, the issue is addressed in 2.23.2 for management and regional clusters and in 11.7.1 and 12.7.1 for managed clusters.
Elasticsearch Curator does not delete any indices according to the configured retention period on any type of Container Cloud clusters.
To verify whether your cluster is affected:
Identify versions of Cluster releases installed on your clusters:
kubectl get cluster --all-namespaces \
-o custom-columns=CLUSTER:.metadata.name,NAMESPACE:.metadata.namespace,VERSION:.spec.providerSpec.value.release
The following list contains all affected Cluster releases:
mke-11-7-0-3-5-7
mke-13-4-4
mke-13-5-3
mke-13-6-0
mke-13-7-0
mosk-12-7-0-23-1
As a workaround, on the affected clusters, create a temporary CronJob for
elasticsearch-curator to clean the required indices:
kubectl get cronjob elasticsearch-curator -n stacklight -o json \
| sed 's/5.7.6-[0-9]*/5.7.6-20230404082402/g' \
| jq '.spec.schedule = "30 * * * *"' \
| jq '.metadata.name = "temporary-elasticsearch-curator"' \
| jq 'del(.metadata.resourceVersion,.metadata.uid,.metadata.selfLink,.metadata.creationTimestamp,.metadata.annotations,.metadata.generation,.metadata.ownerReferences,.metadata.labels,.spec.jobTemplate.metadata.labels,.spec.jobTemplate.spec.template.metadata.creationTimestamp,.spec.jobTemplate.spec.template.metadata.labels)' \
| jq '.metadata.labels.app = "temporary-elasticsearch-curator"' \
| jq '.spec.jobTemplate.metadata.labels.app = "temporary-elasticsearch-curator"' \
| jq '.spec.jobTemplate.spec.template.metadata.labels.app = "temporary-elasticsearch-curator"' \
| kubectl create -f -
Note
This CronJob is removed automatically during upgrade to the major Container Cloud release 2.24.0 or to the patch Container Cloud release 2.23.3 if you obtain patch releases.
The following table lists the major components and their versions of the Mirantis Container Cloud release 2.23.0. For major components and versions of the Cluster release introduced in 2.23.0, see Cluster release 11.7.0.
Note
The components that are newly added, updated, deprecated, or removed
as compared to the previous release version, are marked
with a corresponding superscript,
for example, lcm-ansible Updated.
Component |
Application/Service |
Version |
|---|---|---|
Bare metal |
ambassador Updated |
1.23.3-alpine |
baremetal-operator Updated |
base-focal-20230126095055 |
|
baremetal-public-api Updated |
1.36.3 |
|
baremetal-provider Updated |
1.36.5 |
|
baremetal-resource-controller Updated |
base-focal-20230130170757 |
|
ironic Updated |
yoga-focal-20230130125656 |
|
kaas-ipam Updated |
base-focal-20230127092754 |
|
keepalived |
0.19.0-5-g6a7e17d |
|
local-volume-provisioner Updated |
2.5.0-1 |
|
mariadb |
10.6.7-focal-20221028120155 |
|
metallb-controller |
0.13.7 |
|
IAM |
iam Updated |
2.4.38 |
iam-controller Updated |
1.36.3 |
|
keycloak |
18.0.0 |
|
Container Cloud Updated |
admission-controller |
1.36.3 |
agent-controller |
1.36.3 |
|
byo-credentials-controller |
1.36.3 |
|
byo-provider |
1.36.3 |
|
ceph-kcc-controller |
1.36.3 |
|
cert-manager |
1.36.3 |
|
client-certificate-controller |
1.36.3 |
|
event-controller |
1.36.3 |
|
golang |
1.18.10 |
|
kaas-public-api |
1.36.3 |
|
kaas-exporter |
1.36.3 |
|
kaas-ui |
1.36.3 |
|
license-controller |
1.36.3 |
|
lcm-controller |
1.36.3 |
|
machinepool-controller |
1.36.3 |
|
metrics-server |
0.5.2 |
|
mcc-cache |
1.36.3 |
|
portforward-controller |
1.36.3 |
|
proxy-controller |
1.36.3 |
|
rbac-controller |
1.36.3 |
|
release-controller |
1.36.3 |
|
rhellicense-controller |
1.36.3 |
|
scope-controller |
1.36.3 |
|
user-controller |
1.36.3 |
|
OpenStack Updated |
openstack-provider |
1.36.3 |
os-credentials-controller |
1.36.3 |
|
VMware vSphere |
metallb-controller |
0.13.7 |
vsphere-provider Updated |
1.36.3 |
|
vsphere-credentials-controller Updated |
1.36.3 |
|
keepalived |
0.19.0-5-g6a7e17d |
|
squid-proxy Updated |
0.0.1-8 |
This section lists the components artifacts of the Mirantis Container Cloud release 2.23.0. For artifacts of the Cluster release introduced in 2.23.0, see Cluster release 11.7.0.
Note
The components that are newly added, updated, deprecated, or removed
as compared to the previous release version, are marked
with a corresponding superscript,
for example, lcm-ansible Updated.
Artifact |
Component |
Path |
|---|---|---|
Binaries |
baremetal-api Updated |
https://binary.mirantis.com/core/helm/baremetal-api-1.36.3.tgz |
baremetal-operator Updated |
https://binary.mirantis.com/core/helm/baremetal-operator-1.36.3.tgz |
|
baremetal-public-api Updated |
https://binary.mirantis.com/core/helm/baremetal-public-api-1.36.3.tgz |
|
ironic-python-agent.initramfs Updated |
https://binary.mirantis.com/bm/bin/ironic/ipa/ubuntu/initramfs-yoga-focal-debug-20230126190304 |
|
ironic-python-agent.kernel Updated |
https://binary.mirantis.com/bm/bin/ironic/ipa/ubuntu/kernel-yoga-focal-debug-20230126190304 |
|
kaas-ipam Updated |
||
local-volume-provisioner Updated |
https://binary.mirantis.com/core/helm/local-volume-provisioner-1.36.3.tgz |
|
metallb |
||
provisioning_ansible |
https://binary.mirantis.com/bm/bin/ansible/provisioning_ansible-0.1.1-104-6e2e82c.tgz |
|
Docker images |
ambassador Updated |
mirantis.azurecr.io/general/external/docker.io/library/nginx:1.23.3-alpine |
baremetal-operator Updated |
mirantis.azurecr.io/bm/baremetal-operator:base-focal-20230126095055 |
|
baremetal-resource-controller Updated |
mirantis.azurecr.io/bm/baremetal-resource-controller:base-focal-20230130170757 |
|
dynamic_ipxe Updated |
mirantis.azurecr.io/bm/dynamic-ipxe:base-focal-20230126202529 |
|
dnsmasq Updated |
mirantis.azurecr.io/bm/baremetal-dnsmasq:base-alpine-20230118150429 |
|
dnsmasq-controller Updated |
mirantis.azurecr.io/bm/dnsmasq-controller:base-focal-20230213185438 |
|
ironic Updated |
mirantis.azurecr.io/openstack/ironic:yoga-focal-20230130125656 |
|
ironic-inspector Updated |
mirantis.azurecr.io/openstack/ironic-inspector:yoga-focal-20230130125656 |
|
ironic-prometheus-exporter Updated |
mirantis.azurecr.io/stacklight/ironic-prometheus-exporter:0.1-20221227163037 |
|
kaas-ipam Updated |
mirantis.azurecr.io/bm/kaas-ipam:base-focal-20230127092754 |
|
mariadb |
mirantis.azurecr.io/general/mariadb:10.6.7-focal-20221028120155 |
|
metallb-controller |
mirantis.azurecr.io/bm/external/metallb/controller:v0.13.7-20221130155702 |
|
metallb-speaker |
mirantis.azurecr.io/bm/external/metallb/speaker:v0.13.7-20221130155702 |
|
mcc-keepalived |
mirantis.azurecr.io/lcm/mcc-keepalived:v0.19.0-5-g6a7e17d |
|
syslog-ng Updated |
mirantis.azurecr.io/bm/syslog-ng:base-focal-20230126094812 |
Artifact |
Component |
Paths |
|---|---|---|
Bootstrap tarball Updated |
bootstrap-linux |
https://binary.mirantis.com/core/bin/bootstrap-linux-1.36.4.tar.gz |
bootstrap-darwin |
https://binary.mirantis.com/core/bin/bootstrap-darwin-1.36.4.tar.gz |
|
Helm charts Updated |
admission-controller |
https://binary.mirantis.com/core/helm/admission-controller-1.36.3.tgz |
agent-controller |
https://binary.mirantis.com/core/helm/agent-controller-1.36.3.tgz |
|
baremetal-provider |
https://binary.mirantis.com/core/helm/baremetal-provider-1.36.5.tgz |
|
byo-credentials-controller |
https://binary.mirantis.com/core/helm/byo-credentials-controller-1.36.3.tgz |
|
byo-provider |
https://binary.mirantis.com/core/helm/byo-provider-1.36.3.tgz |
|
ceph-kcc-controller |
https://binary.mirantis.com/core/helm/ceph-kcc-controller-1.36.3.tgz |
|
cert-manager |
https://binary.mirantis.com/core/helm/cert-manager-1.36.3.tgz |
|
client-certificate-controller |
https://binary.mirantis.com/core/helm/client-certificate-controller-1.36.3.tgz |
|
configuration-collector |
https://binary.mirantis.com/core/helm/configuration-collector-1.36.3.tgz |
|
event-controller |
https://binary.mirantis.com/core/helm/event-controller-1.36.3.tgz |
|
iam-controller |
https://binary.mirantis.com/core/helm/iam-controller-1.36.3.tgz |
|
kaas-exporter |
https://binary.mirantis.com/core/helm/kaas-exporter-1.36.3.tgz |
|
kaas-public-api |
https://binary.mirantis.com/core/helm/kaas-public-api-1.36.3.tgz |
|
kaas-ui |
||
lcm-controller |
https://binary.mirantis.com/core/helm/lcm-controller-1.36.3.tgz |
|
license-controller |
https://binary.mirantis.com/core/helm/license-controller-1.36.3.tgz |
|
metrics-server |
https://binary.mirantis.com/core/helm/metrics-server-1.36.3.tgz |
|
mcc-cache |
||
openstack-provider |
https://binary.mirantis.com/core/helm/openstack-provider-1.36.3.tgz |
|
os-credentials-controller |
https://binary.mirantis.com/core/helm/os-credentials-controller-1.36.3.tgz |
|
portforward-controller |
https://binary.mirantis.com/core/helm/portforward-controller-1.36.3.tgz |
|
proxy-controller |
https://binary.mirantis.com/core/helm/proxy-controller-1.36.3.tgz |
|
rbac-controller |
https://binary.mirantis.com/core/helm/rbac-controller-1.36.3.tgz |
|
release-controller |
https://binary.mirantis.com/core/helm/release-controller-1.36.3.tgz |
|
rhellicense-controller |
https://binary.mirantis.com/core/helm/rhellicense-controller-1.36.3.tgz |
|
scope-controller |
http://binary.mirantis.com/core/helm/scope-controller-1.36.3.tgz |
|
squid-proxy |
https://binary.mirantis.com/core/helm/squid-proxy-1.36.3.tgz |
|
vsphere-credentials-controller |
https://binary.mirantis.com/core/helm/vsphere-credentials-controller-1.36.3.tgz |
|
vsphere-provider |
https://binary.mirantis.com/core/helm/vsphere-provider-1.36.3.tgz |
|
user-controller |
https://binary.mirantis.com/core/helm/user-controller-1.36.3.tgz |
|
Docker images |
admission-controller Updated |
mirantis.azurecr.io/core/admission-controller:1.36.3 |
agent-controller Updated |
mirantis.azurecr.io/core/agent-controller:1.36.3 |
|
byo-cluster-api-controller Updated |
mirantis.azurecr.io/core/byo-cluster-api-controller:1.36.3 |
|
byo-credentials-controller Updated |
mirantis.azurecr.io/core/byo-credentials-controller:1.36.3 |
|
ceph-kcc-controller Updated |
mirantis.azurecr.io/core/ceph-kcc-controller:1.36.3 |
|
cert-manager-controller |
mirantis.azurecr.io/core/external/cert-manager-controller:v1.6.1 |
|
client-certificate-controller Updated |
mirantis.azurecr.io/core/client-certificate-controller:1.36.3 |
|
cluster-api-provider-baremetal Updated |
mirantis.azurecr.io/core/cluster-api-provider-baremetal:1.36.3 |
|
frontend Updated |
mirantis.azurecr.io/core/frontend:1.36.3 |
|
haproxy |
mirantis.azurecr.io/lcm/mcc-haproxy:v0.17.0-8-g6ca89d5 |
|
iam-controller Updated |
mirantis.azurecr.io/core/iam-controller:1.36.3 |
|
kaas-exporter |
mirantis.azurecr.io/core/kaas-exporter:1.36.3 |
|
kproxy Updated |
mirantis.azurecr.io/core/kproxy:1.36.3 |
|
lcm-controller Updated |
mirantis.azurecr.io/core/lcm-controller:1.36.3 |
|
license-controller Updated |
mirantis.azurecr.io/core/license-controller:1.36.3 |
|
machinepool-controller Updated |
mirantis.azurecr.io/core/machinepool-controller:1.36.3 |
|
mcc-keepalived |
mirantis.azurecr.io/lcm/mcc-keepalived:v0.19.0-5-g6a7e17d |
|
metrics-server |
mirantis.azurecr.io/core/external/metrics-server:v0.5.2 |
|
nginx |
mirantis.azurecr.io/core/external/nginx:1.36.3 |
|
openstack-cluster-api-controller Updated |
mirantis.azurecr.io/core/openstack-cluster-api-controller:1.36.3 |
|
os-credentials-controller Updated |
mirantis.azurecr.io/core/os-credentials-controller:1.36.3 |
|
portforward-controller Updated |
mirantis.azurecr.io/core/portforward-controller:1.36.3 |
|
proxy-controller Updated |
mirantis.azurecr.io/core/proxy-controller:1.36.3 |
|
rbac-controller Updated |
mirantis.azurecr.io/core/rbac-controller:1.36.3 |
|
registry |
mirantis.azurecr.io/lcm/registry:2.8.1 |
|
release-controller Updated |
mirantis.azurecr.io/core/release-controller:1.36.3 |
|
rhellicense-controller Updated |
mirantis.azurecr.io/core/rhellicense-controller:1.36.3 |
|
scope-controller Updated |
mirantis.azurecr.io/core/scope-controller:1.36.3 |
|
squid-proxy |
mirantis.azurecr.io/lcm/squid-proxy:0.0.1-8 |
|
storage-discovery Deprecated |
mirantis.azurecr.io/core/storage-discovery:1.36.3 |
|
vsphere-cluster-api-controller Updated |
mirantis.azurecr.io/core/vsphere-cluster-api-controller:1.36.3 |
|
vsphere-credentials-controller Updated |
mirantis.azurecr.io/core/vsphere-credentials-controller:1.36.3 |
|
user-controller Updated |
mirantis.azurecr.io/core/user-controller:1.36.3 |
Artifact |
Component |
Path |
|---|---|---|
Binaries |
hash-generate-linux |
http://binary.mirantis.com/iam/bin/hash-generate-0.0.1-268-3cf7f17-linux |
hash-generate-darwin |
http://binary.mirantis.com/iam/bin/hash-generate-0.0.1-268-3cf7f17-darwin |
|
Helm charts |
iam Updated |
|
iam-proxy Updated |
||
keycloak_proxy Removed |
n/a |
|
Docker images |
kubernetes-entrypoint |
mirantis.azurecr.io/openstack/extra/kubernetes-entrypoint:v1.0.0-20200311160233 |
mariadb |
mirantis.azurecr.io/general/mariadb:10.6.7-focal-20220811085105 |
|
keycloak Updated |
mirantis.azurecr.io/iam/keycloak:0.5.14 |
|
keycloak-gatekeeper |
mirantis.azurecr.io/iam/keycloak-gatekeeper:7.1.3-3 |
The table below contains the number of vendor-specific addressed CVEs with Critical or High severity.
In total, in the current Container Cloud release, 212 CVEs have been fixed and 16 artifacts (images) updated.
Fixed CVE ID |
# of updated artifacts |
|---|---|
RHSA-2022:6206 |
20 |
RHSA-2022:4991 |
11 |
RHSA-2023:0838 |
8 |
RHSA-2022:7089 |
8 |
RHSA-2022:1065 |
8 |
RHSA-2022:0332 |
8 |
RHSA-2021:5082 |
8 |
RHSA-2021:2717 |
8 |
RHSA-2022:8638 |
7 |
RHSA-2022:6878 |
7 |
RHSA-2022:1642 |
7 |
RHSA-2022:0951 |
7 |
RHSA-2022:0658 |
7 |
RHSA-2022:1537 |
6 |
RHSA-2021:4903 |
5 |
RHSA-2020:3014 |
5 |
RHSA-2019:4114 |
5 |
RHSA-2022:6778 |
4 |
RHSA-2020:0575 |
4 |
RHSA-2022:5095 |
3 |
RHSA-2021:2359 |
3 |
RHSA-2023:0284 |
2 |
RHSA-2022:5056 |
2 |
RHSA-2022:4799 |
2 |
RHSA-2021:1206 |
2 |
RHSA-2019:0997 |
2 |
RHSA-2022:7192 |
1 |
RHSA-2021:2170 |
1 |
RHSA-2021:1989 |
1 |
RHSA-2021:1024 |
1 |
RHSA-2021:0670 |
1 |
RHSA-2020:5476 |
1 |
RHSA-2020:3658 |
1 |
RHSA-2020:2755 |
1 |
RHSA-2020:2637 |
1 |
RHSA-2020:2338 |
1 |
RHSA-2020:0902 |
1 |
RHSA-2020:0273 |
1 |
RHSA-2020:0271 |
1 |
RHSA-2019:2692 |
1 |
RHSA-2019:1714 |
1 |
RHSA-2019:1619 |
1 |
RHSA-2019:1145 |
1 |
CVE-2021-33574 |
18 |
CVE-2022-2068 |
7 |
CVE-2022-1664 |
7 |
CVE-2022-1292 |
7 |
CVE-2022-29155 |
6 |
CVE-2019-25013 |
6 |
CVE-2022-0778 |
5 |
CVE-2022-23219 |
4 |
CVE-2022-23218 |
4 |
CVE-2019-20916 |
4 |
CVE-2022-24407 |
3 |
CVE-2022-32207 |
2 |
CVE-2022-27404 |
2 |
CVE-2022-40023 |
1 |
CVE-2022-1941 |
1 |
CVE-2021-32839 |
1 |
CVE-2021-3711 |
1 |
CVE-2021-3517 |
1 |
ALAS2-2023-1915 |
1 |
ALAS2-2023-1911 |
1 |
ALAS2-2023-1908 |
1 |
ALAS2-2022-1902 |
2 |
ALAS2-2022-1885 |
1 |
The full list of the CVEs present in the current Container Cloud release is available at the Mirantis Security Portal.
The Mirantis Container Cloud GA release 2.22.0:
Introduces support for the Cluster release 11.6.0 that is based on Mirantis Container Runtime 20.10.13 and Mirantis Kubernetes Engine 3.5.5 with Kubernetes 1.21.
Supports the Cluster release 12.5.0 that is based on the Cluster release 11.5.0 and represents Mirantis OpenStack for Kubernetes (MOSK) 22.5.
Does not support greenfield deployments on deprecated Cluster releases 11.5.0 and 8.10.0. Use the latest available Cluster releases of the series instead.
Caution
Make sure to update the Cluster release version of your managed cluster before the current Cluster release version becomes unsupported by a new Container Cloud release version. Otherwise, Container Cloud stops auto-upgrade and eventually Container Cloud itself becomes unsupported.
This section outlines release notes for the Container Cloud release 2.22.0.
This section outlines new features and enhancements introduced in the Mirantis Container Cloud release 2.22.0. For the list of enhancements in the Cluster release 11.6.0 that is introduced by the Container Cloud release 2.22.0, see the Cluster releases.
The ‘rebootRequired’ notification in the baremetal-based machine status
Custom network configuration for managed clusters based on Equinix Metal with private networking
Custom TLS certificates for the StackLight ‘iam-proxy’ endpoints
Extended logging format for essential management cluster components
Added the rebootRequired field to the status of a Machine object for
the bare metal provider. This field indicates whether a manual host reboot
is required to complete the Ubuntu operating system updates, if any.
You can view this notification either using the Container Cloud API or web UI:
API:
reboot.required.trueinstatus:providerStatusof aMachineobjectWeb UI: the One or more machines require a reboot notification on the Clusters and Machines pages
Note
For MOSK-based deployments, the feature support is available since MOSK 23.1.
TechPreview
Implemented the ability to configure advanced network settings on managed
clusters that are based on Equinix Metal with private networking. Using the custom parameter in the
Cluster object, you can customize network configuration for the cluster
machines. The feature comprises usage of dedicated Subnet and
L2Template objects that contain necessary configuration for cluster
machines.
Implemented the ability to set up custom TLS certificates for the following
StackLight iam-proxy endpoints on any type of Container Cloud clusters:
iam-proxy-alertaiam-proxy-alertmanageriam-proxy-grafanaiam-proxy-kibanaiam-proxy-prometheus
Implemented the following Container Cloud objects describing the history of a cluster and machine deployment and update:
ClusterDeploymentStatusClusterUpgradeStatusMachineDeploymentStatusMachineUpgradeStatus
Using these objects, you can inspect cluster and machine deployment and update stages, their time stamps, statuses, and failure messages, if any. In the Container Cloud web UI, use the History option located under the More action icon of a cluster and machine.
For existing clusters, these objects become available after the management cluster upgrade to Container Cloud 2.22.0.
Extended the logging format for the admission-controller,
storage-discovery, and all supported <providerName>-provider services
of a management cluster. Now, log records for these services contain
the following entries:
level:<debug,info,warn,error,panic>,
ts:<YYYY-MM-DDTHH:mm:ssZ>,
logger:<providerType>.<objectName>.req:<requestID>,
caller:<lineOfCode>,
msg:<message>,
error:<errorMessage>,
stacktrace:<codeInfo>
The following issues have been addressed in the Mirantis Container Cloud release 2.22.0 along with the Cluster release 11.6.0:
[27192] Fixed the issue that prevented
portforward-controllerfrom accepting new connections correctly.[26659] Fixed the issue that caused the deployment of a regional cluster based on bare metal or Equinix Metal with private networking to fail with
mcc-cachePods being stuck in theCrashLoopBackOffstatus of restarts.[28783] Fixed the issue with Ceph condition getting stuck in absence of the Ceph cluster secrets information on the MOSK 22.3 clusters.
Caution
Starting from MOSK 22.4, the Ceph cluster version updates to 15.2.17. Therefore, if you applied the workaround for MOSK 22.3 described in Ceph known issue 28783, remove the
versionparameter definition fromKaaSCephClusterafter the managed cluster update to MOSK 22.4.[26820] Fixed the issue with the
statussection in theKaaSCephCluster.statusCR not reflecting issues during a Ceph cluster deletion.[25624] Fixed the issue with inability to specify the Ceph pool API parameters by adding the
parametersoption that specifies the key-value map for the parameters of the Ceph pool.Caution
For MKE clusters that are part of MOSK infrastructure, the feature support will become available in one of the following Container Cloud releases.
[28526] Fixed the issue with a low CPU limit
100mforkaas-exporterblocking metric collection.[28134] Fixed the issue with failure to update a cluster with nodes being stuck in the
Preparestate due toerror when evicting podsfor Patroni.[27732-1] Fixed the issue with the OpenSearch
elasticsearch.persistentVolumeClaimSizecustom setting being overwritten bylogging.persistentVolumeClaimSizeduring deployment of a Container Cloud cluster of any type and be set to the default30Gi.Depending on available resources on existing clusters that were affected by the issue, additional actions may be required after an update to Container Cloud 2.22.0. For details, see OpenSearchPVCMismatch alert raises due to the OpenSearch PVC size mismatch. New clusters deployed on top of Container Cloud 2.22.0 are not affected.
[27732-2] Fixed the issue with custom settings for the deprecated
elasticsearch.logstashRetentionTimeparameter being overwritten by the default setting set to 1 day.[20876] Fixed the issue with StackLight Pods getting stuck with the
Pod predicate NodeAffinity failederror due to the StackLight node label added to one machine and then removed from another one.[28651] Updated Telemeter for StackLight to fix the discovered vulnerabilities.
This section lists known issues with workarounds for the Mirantis Container Cloud release 2.22.0 including the Cluster release 11.6.0.
For other issues that can occur while deploying and operating a Container Cloud cluster, see Troubleshooting Guide.
Note
This section also outlines still valid known issues from previous Container Cloud releases.
During deletion of a manager machine running the ironic Pod from a bare
metal management cluster, the following problems occur:
All Pods are stuck in the
TerminatingstateA new
ironicPod fails to startThe related bare metal host is stuck in the
deprovisioningstate
As a workaround, before deletion of the node running the ironic Pod,
cordon and drain the node using the kubectl cordon <nodeName> and
kubectl drain <nodeName> commands.
If a baremetal-based regional cluster deployment fails before pivoting is done, the corresponding region deletion fails.
Workaround:
Using the command below, manually delete all possible traces of the failed
regional cluster deployment, including but not limited to the following
objects that contain the kaas.mirantis.com/region label of the affected
region:
clustermachinebaremetalhostbaremetalhostprofilel2templatesubnetipamhostipaddr
kubectl delete <objectName> -l kaas.mirantis.com/region=<regionName>
Warning
Do not use the same region name again after the regional cluster deployment failure since some objects that reference the region name may still exist.
Deployment of a managed cluster based on Equinix Metal with private networking fails during provisioning with the following error:
InspectionError: Failed to obtain hardware details.
Ensure DHCP relay is up and running
Workaround:
In
deployment/dnsmasq, udate the image tag version for thedhcpdcontainer tobase-alpine-20230118150429:kubectl -n kaas edit deployment/dnsmasq
In
dnsmasq.conf, override the defaultundionly.kpxewith theipxe.pxeone:kubectl -n kaas edit cm dnsmasq-config
Example of existing configuration:
dhcp-boot=/undionly.kpxe,httpd-http.ipxe.boot.local,dhcp-lb.ipxe.boot.localExample of new configuration:
dhcp-boot=/ipxe.pxe,httpd-http.ipxe.boot.local,dhcp-lb.ipxe.boot.local
During deployment of a vSphere-based management or regional cluster with IPAM
disabled, the Network prepared stage gets stuck in the NotStarted
status. The issue does not affect cluster deployment. Therefore, disregard
the error message.
Fixed in 2.28.4 (17.3.4 and 16.3.4)
During replacement of a manager machine, the following problems may occur:
The system adds the node to Docker swarm but not to Kubernetes
The node
Deploymentgets stuck with failed RethinkDB health checks
Workaround:
Delete the failed node.
Wait for the MKE cluster to become healthy. To monitor the cluster status:
Log in to the MKE web UI.
Monitor the cluster status as described in MKE Operations Guide: Monitor an MKE cluster with the MKE web UI.
Deploy a new node.
Fixed in 2.28.4 (17.3.4 and 16.3.4)
During the unsafe or forced deletion of a manager machine running the
calico-kube-controllers Pod in the kube-system namespace,
the following issues occur:
The
calico-kube-controllersPod fails to clean up resources associated with the deleted nodeThe
calico-nodePod may fail to start up on a newly created node if the machine is provisioned with the same IP address as the deleted machine had
As a workaround, before deletion of the node running the
calico-kube-controllers Pod, cordon and drain the node:
kubectl cordon <nodeName>
kubectl drain <nodeName>
During update of a Container Cloud cluster of any type, if the MKE minor
version is updated from 3.4.x to 3.5.x, access to the cluster using the
existing kubeconfig fails with the You must be logged in to the server
(Unauthorized) error due to OIDC settings being reconfigured.
As a workaround, during the cluster update process, use the admin
kubeconfig instead of the existing one. Once the update completes, you can
use the existing cluster kubeconfig again.
To obtain the admin kubeconfig:
kubectl --kubeconfig <pathToMgmtKubeconfig> get secret -n <affectedClusterNamespace> \
-o yaml <affectedClusterName>-kubeconfig | awk '/admin.conf/ {print $2}' | \
head -1 | base64 -d > clusterKubeconfig.yaml
If the related cluster is regional, replace <pathToMgmtKubeconfig> with
<pathToRegionalKubeconfig>.
When setting a new Transport Layer Security (TLS) certificate for a cluster,
the false positive failed to get kubeconfig error may occur on the
Waiting for TLS settings to be applied stage. No actions are required.
Therefore, disregard the error.
To verify the status of the TLS configuration being applied:
kubectl get cluster <ClusterName> -n <ClusterProjectName> -o jsonpath-as-json="{.status.providerStatus.tls.<Application>}"
Possible values for the <Application> parameter are as follows:
keycloakuicachemkeiamProxyAlertaiamProxyAlertManageriamProxyGrafanaiamProxyKibanaiamProxyPrometheus
Example of system response:
[
{
"expirationTime": "2024-01-06T09:37:04Z",
"hostname": "domain.com",
}
]
In this example, expirationTime equals the NotAfter field of the
server certificate. And the value of hostname contains the configured
application name.
Note
The issue may affect the Container Cloud or Cluster release update to the following versions:
2.22.0 for management and regional clusters
11.6.0 for management, regional, and managed clusters
13.2.5, 13.3.5, 13.4.3, and 13.5.2 for attached MKE clusters
The issue does not affect clusters originally deployed since the following Cluster releases: 11.0.0, 8.6.0, 7.6.0.
During cluster update to versions mentioned in the note above, the following OpenSearch-related error may occur on clusters that were originally deployed or attached using Container Cloud 2.15.0 or earlier, before the transition from Elasticsearch to OpenSearch:
The stacklight/opensearch release of the stacklight/stacklight-bundle HelmBundle
reconciled by the stacklight/stacklight-helm-controller Controller
is not in the "deployed" status for the last 15 minutes.
The issue affects clusters with elasticsearch.persistentVolumeClaimSize
configured for values other than 30Gi.
To verify that the cluster is affected:
Verify whether the
HelmBundleReleaseNotDeployedalert for theopensearchrelease is firing. If so, the cluster is most probably affected. Otherwise, the cluster is not affected.Verify the reason of the
HelmBundleReleaseNotDeployedalert for theopensearchrelease:kubectl get helmbundle stacklight-bundle -n stacklight -o json | jq '.status.releaseStatuses[] | select(.chart == "opensearch") | .message'
Example system response from the affected cluster:
Upgrade "opensearch" failed: cannot patch "opensearch-master" with kind StatefulSet: \ StatefulSet.apps "opensearch-master" is invalid: spec: Forbidden: \ updates to statefulset spec for fields other than 'replicas', 'template', and 'updateStrategy' are forbidden
Workaround:
Scale down the
opensearch-dashboardsandmetricbeatresources to0:kubectl -n stacklight scale --replicas 0 deployment opensearch-dashboards && \ kubectl -n stacklight get pods -l app=opensearch-dashboards | awk '{if (NR!=1) {print $1}}' | xargs -r \ kubectl -n stacklight wait --for=delete --timeout=10m pod kubectl -n stacklight scale --replicas 0 deployment metricbeat && \ kubectl -n stacklight get pods -l app=metricbeat | awk '{if (NR!=1) {print $1}}' | xargs -r \ kubectl -n stacklight wait --for=delete --timeout=10m pod
Wait for the commands in this and next step to complete. The completion time depends on the cluster size.
Disable the
elasticsearch-curatorCronJob:kubectl -n stacklight patch cronjobs elasticsearch-curator -p '{"spec": {"suspend": true}}'
Scale down the
opensearch-masterStatefulSet:kubectl -n stacklight scale --replicas 0 statefulset opensearch-master && \ kubectl -n stacklight get pods -l app=opensearch-master | awk '{if (NR!=1) {print $1}}' | xargs -r \ kubectl -n stacklight wait --for=delete --timeout=30m pod
Delete the OpenSearch Helm release:
helm uninstall --no-hooks opensearch -n stacklight
Wait up to 5 minutes for Helm Controller to retry the upgrade and properly create the
opensearch-masterStatefulSet.To verify readiness of the
opensearch-masterPods:kubectl -n stacklight wait --for=condition=Ready --timeout=30m pod -l app=opensearch-master
Example of a successful system response in an HA setup:
pod/opensearch-master-0 condition met pod/opensearch-master-1 condition met pod/opensearch-master-2 condition met
Example of a successful system response in an non-HA setup:
pod/opensearch-master-0 condition met
Scale up the
opensearch-dashboardsandmetricbeatresources:kubectl -n stacklight scale --replicas 1 deployment opensearch-dashboards && \ kubectl -n stacklight wait --for=condition=Ready --timeout=10m pod -l app=opensearch-dashboards kubectl -n stacklight scale --replicas 1 deployment metricbeat && \ kubectl -n stacklight wait --for=condition=Ready --timeout=10m pod -l app=metricbeat
Enable the
elasticsearch-curatorCronJob:kubectl -n stacklight patch cronjobs elasticsearch-curator -p '{"spec": {"suspend": false}}'
During an update of a Container Cloud cluster of any type, recreation of the
Patroni container replica is stuck in the degraded state due to the liveness
probe killing the container that runs the pg_rewind procedure. The issue
affects clusters on which the pg_rewind procedure takes more time than the
full cycle of the liveness probe.
The sample logs of the affected cluster:
INFO: doing crash recovery in a single user mode
ERROR: Crash recovery finished with code=-6
INFO: stdout=
INFO: stderr=2023-01-11 10:20:34 GMT [64]: [1-1] 63be8d72.40 0 LOG: database system was interrupted; last known up at 2023-01-10 17:00:59 GMT
[64]: [2-1] 63be8d72.40 0 LOG: could not read from log segment 00000002000000000000000F, offset 0: read 0 of 8192
[64]: [3-1] 63be8d72.40 0 LOG: invalid primary checkpoint record
[64]: [4-1] 63be8d72.40 0 PANIC: could not locate a valid checkpoint record
Workaround:
For the affected replica and PVC, run:
kubectl delete persistentvolumeclaim/storage-volume-patroni-<replica-id> -n stacklight
kubectl delete pod/patroni-<replica-id> -n stacklight
On managed clusters with enabled Reference Application, the following alerts are triggered during a managed cluster update from the Cluster release 11.5.0 to 11.6.0 or 7.11.0 to 11.5.0:
KubeDeploymentOutagefor therefappDeploymentRefAppDownRefAppProbeTooLongRefAppTargetDown
This behavior is expected, no actions are required. Therefore, disregard these alerts.
On the baremetal-based management clusters, the restarts count of the
metric-collector Pod is increased in time with reason: OOMKilled in
the containerStatuses of the metric-collector Pod. Only clusters with
HTTP proxy enabled are affected.
Such behavior is expected. Therefore, disregard these restarts.
During creation of a Container Cloud cluster of any type with StackLight
enabled, Alerta can get stuck after a failed initialization with only 1 Pod
in the READY state. For example:
kubectl get po -n stacklight -l app=alerta
NAME READY STATUS RESTARTS AGE
pod/alerta-5f96b775db-45qsz 1/1 Running 0 20h
pod/alerta-5f96b775db-xj4rl 0/1 Running 0 20h
Workaround:
Recreate the affected Alerta Pod:
kubectl --kubeconfig <affectedClusterKubeconfig> -n stacklight delete pod <stuckAlertaPodName>
Verify that both Alerta Pods are in the
READYstate:kubectl get po -n stacklight -l app=alerta
Note
Moving forward, the workaround for this issue will be moved from Release Notes to Operations Guide: Troubleshoot StackLight.
On a managed cluster, the StackLight pods may get stuck with the
Pod predicate NodeAffinity failed error in the pod status. The issue may
occur if the StackLight node label was added to one machine and
then removed from another one.
The issue does not affect the StackLight services, all required StackLight pods migrate successfully except extra pods that are created and stuck during pod migration.
As a workaround, remove the stuck pods:
kubectl --kubeconfig <managedClusterKubeconfig> -n stacklight delete pod <stuckPodName>
Note
The issue does not reproduce since MOSK 25.2.
Update of a managed cluster based on bare metal and Ceph enabled fails with
PersistentVolumeClaim getting stuck in the Pending state for the
prometheus-server StatefulSet and the
MountVolume.MountDevice failed for volume warning in the StackLight event
logs.
Workaround:
Verify that the description of the Pods that failed to run contain the
FailedMountevents:kubectl -n <affectedProjectName> describe pod <affectedPodName>
In the command above, replace the following values:
<affectedProjectName>is the Container Cloud project name where the Pods failed to run<affectedPodName>is a Pod name that failed to run in the specified project
In the Pod description, identify the node name where the Pod failed to run.
Verify that the
csi-rbdpluginlogs of the affected node contain therbd volume mount failed: <csi-vol-uuid> is being usederror. The<csi-vol-uuid>is a unique RBD volume name.Identify
csiPodNameof the correspondingcsi-rbdplugin:kubectl -n rook-ceph get pod -l app=csi-rbdplugin \ -o jsonpath='{.items[?(@.spec.nodeName == "<nodeName>")].metadata.name}'
Output the affected
csiPodNamelogs:kubectl -n rook-ceph logs <csiPodName> -c csi-rbdplugin
Scale down the affected
StatefulSetorDeploymentof the Pod that fails to0replicas.On every
csi-rbdpluginPod, search for stuckcsi-vol:for pod in `kubectl -n rook-ceph get pods|grep rbdplugin|grep -v provisioner|awk '{print $1}'`; do echo $pod kubectl exec -it -n rook-ceph $pod -c csi-rbdplugin -- rbd device list | grep <csi-vol-uuid> done
Unmap the affected
csi-vol:rbd unmap -o force /dev/rbd<i>
The
/dev/rbd<i>value is a mapped RBD volume that usescsi-vol.Delete
volumeattachmentof the affected Pod:kubectl get volumeattachments | grep <csi-vol-uuid> kubectl delete volumeattacmhent <id>
Scale up the affected
StatefulSetorDeploymentback to the original number of replicas and wait until its state becomesRunning.
The following table lists the major components and their versions of the Mirantis Container Cloud release 2.22.0. For major components and versions of the Cluster release introduced in 2.22.0, see Cluster release 11.6.0.
Note
The components that are newly added, updated, deprecated, or removed
as compared to the previous release version, are marked
with a corresponding superscript,
for example, lcm-ansible Updated.
Component |
Application/Service |
Version |
|---|---|---|
AWS Updated |
aws-provider |
1.35.11 |
aws-credentials-controller |
1.35.11 |
|
Azure Updated |
azure-provider |
1.35.11 |
azure-credentials-controller |
1.35.11 |
|
Bare metal |
ambassador |
1.20.1-alpine |
baremetal-operator Updated |
base-focal-20221130142939 |
|
baremetal-public-api Updated |
1.35.11 |
|
baremetal-provider Updated |
1.35.11 |
|
baremetal-resource-controller |
base-focal-20221219124546 |
|
ironic Updated |
yoga-focal-20221118093824 |
|
kaas-ipam |
base-focal-20221202191902 |
|
keepalived |
0.19.0-5-g6a7e17d |
|
local-volume-provisioner Updated |
2.5.0-1 |
|
mariadb Updated |
10.6.7-focal-20221028120155 |
|
metallb-controller Updated |
0.13.7 |
|
IAM |
iam Updated |
2.4.36 |
iam-controller Updated |
1.35.11 |
|
keycloak |
18.0.0 |
|
Container Cloud Updated |
admission-controller |
1.35.12 |
agent-controller |
1.35.11 |
|
byo-credentials-controller |
1.35.11 |
|
byo-provider |
1.35.11 |
|
ceph-kcc-controller |
1.35.11 |
|
cert-manager |
1.35.11 |
|
client-certificate-controller |
1.35.11 |
|
event-controller |
1.35.11 |
|
golang Updated |
1.18.8 |
|
kaas-public-api |
1.35.11 |
|
kaas-exporter |
1.35.11 |
|
kaas-ui |
1.35.11 |
|
license-controller |
1.35.11 |
|
lcm-controller |
0.3.0-352-gf55d6378 |
|
machinepool-controller |
1.35.11 |
|
mcc-cache |
1.35.11 |
|
metrics-server |
0.5.2 |
|
portforward-controller |
1.35.11 |
|
proxy-controller |
1.35.11 |
|
rbac-controller |
1.35.11 |
|
release-controller |
1.35.11 |
|
rhellicense-controller |
1.35.11 |
|
scope-controller |
1.35.11 |
|
user-controller |
1.35.11 |
|
Equinix Metal |
equinix-provider Updated |
1.35.11 |
equinix-credentials-controller Updated |
1.35.11 |
|
keepalived |
0.19.0-5-g6a7e17d |
|
OpenStack Updated |
openstack-provider |
1.35.11 |
os-credentials-controller |
1.35.11 |
|
VMware vSphere |
metallb-controller |
0.13.7 |
vsphere-provider Updated |
1.35.11 |
|
vsphere-credentials-controller Updated |
1.35.11 |
|
keepalived |
0.19.0-5-g6a7e17d |
|
squid-proxy Updated |
0.0.1-8 |
This section lists the components artifacts of the Mirantis Container Cloud release 2.22.0. For artifacts of the Cluster release introduced in 2.22.0, see Cluster release 11.6.0.
Note
The components that are newly added, updated, deprecated, or removed
as compared to the previous release version, are marked
with a corresponding superscript,
for example, lcm-ansible Updated.
Artifact |
Component |
Path |
|---|---|---|
Binaries |
baremetal-api Updated |
https://binary.mirantis.com/core/helm/baremetal-api-1.35.11.tgz |
baremetal-operator Updated |
https://binary.mirantis.com/core/helm/baremetal-operator-1.35.11.tgz |
|
baremetal-public-api Updated |
https://binary.mirantis.com/core/helm/baremetal-public-api-1.35.11.tgz |
|
ironic-python-agent.initramfs Updated |
https://binary.mirantis.com/bm/bin/ironic/ipa/ubuntu/initramfs-yoga-focal-debug-20221228205257 |
|
ironic-python-agent.kernel Updated |
https://binary.mirantis.com/bm/bin/ironic/ipa/ubuntu/kernel-yoga-focal-debug-20221228205257 |
|
kaas-ipam Updated |
||
local-volume-provisioner Updated |
https://binary.mirantis.com/core/helm/local-volume-provisioner-1.35.11.tgz |
|
metallb |
||
provisioning_ansible |
https://binary.mirantis.com/bm/bin/ansible/provisioning_ansible-0.1.1-104-6e2e82c.tgz |
|
Docker images |
ambassador |
mirantis.azurecr.io/general/external/docker.io/library/nginx:1.20.1-alpine |
baremetal-operator Updated |
mirantis.azurecr.io/bm/baremetal-operator:base-focal-20221130142939 |
|
baremetal-resource-controller Updated |
mirantis.azurecr.io/bm/baremetal-resource-controller:base-focal-20221219124546 |
|
dynamic_ipxe Updated |
mirantis.azurecr.io/bm/dynamic-ipxe:base-focal-20221219135753 |
|
dnsmasq Updated |
mirantis.azurecr.io/bm/baremetal-dnsmasq:base-alpine-20221121215534 |
|
dnsmasq-controller Updated |
mirantis.azurecr.io/bm/dnsmasq-controller:base-focal-20221219112845 |
|
ironic Updated |
mirantis.azurecr.io/openstack/ironic:yoga-focal-20221118093824 |
|
ironic-inspector Updated |
mirantis.azurecr.io/openstack/ironic-inspector:yoga-focal-20221118093824 |
|
ironic-prometheus-exporter Updated |
mirantis.azurecr.io/stacklight/ironic-prometheus-exporter:0.1-20221117115942 |
|
kaas-ipam Updated |
mirantis.azurecr.io/bm/kaas-ipam:base-focal-20221202191902 |
|
mariadb Updated |
mirantis.azurecr.io/general/mariadb:10.6.7-focal-20221028120155 |
|
mcc-keepalived |
mirantis.azurecr.io/lcm/mcc-keepalived:v0.19.0-5-g6a7e17d |
|
metallb-controller Updated |
mirantis.azurecr.io/bm/external/metallb/controller:v0.13.7-20221130155702 |
|
metallb-speaker Updated |
mirantis.azurecr.io/bm/external/metallb/speaker:v0.13.7-20221130155702 |
|
syslog-ng |
mirantis.azurecr.io/bm/syslog-ng:base-focal-20220128103433 |
Artifact |
Component |
Paths |
|---|---|---|
Bootstrap tarball Updated |
bootstrap-linux |
https://binary.mirantis.com/core/bin/bootstrap-linux-1.35.11.tar.gz |
bootstrap-darwin |
https://binary.mirantis.com/core/bin/bootstrap-darwin-1.35.11.tar.gz |
|
Helm charts Updated |
admission-controller |
https://binary.mirantis.com/core/helm/admission-controller-1.35.11.tgz |
agent-controller |
https://binary.mirantis.com/core/helm/agent-controller-1.35.11.tgz |
|
aws-credentials-controller |
https://binary.mirantis.com/core/helm/aws-credentials-controller-1.35.11.tgz |
|
aws-provider |
https://binary.mirantis.com/core/helm/aws-provider-1.35.11.tgz |
|
azure-credentials-controller |
https://binary.mirantis.com/core/helm/azure-credentials-controller-1.35.11.tgz |
|
azure-provider |
https://binary.mirantis.com/core/helm/azure-provider-1.35.11.tgz |
|
baremetal-provider |
https://binary.mirantis.com/core/helm/baremetal-provider-1.35.11.tgz |
|
byo-credentials-controller |
https://binary.mirantis.com/core/helm/byo-credentials-controller-1.35.11.tgz |
|
byo-provider |
https://binary.mirantis.com/core/helm/byo-provider-1.35.11.tgz |
|
ceph-kcc-controller |
https://binary.mirantis.com/core/helm/ceph-kcc-controller-1.35.11.tgz |
|
cert-manager |
https://binary.mirantis.com/core/helm/cert-manager-1.35.11.tgz |
|
client-certificate-controller |
https://binary.mirantis.com/core/helm/client-certificate-controller-1.35.11.tgz |
|
configuration-collector |
https://binary.mirantis.com/core/helm/configuration-collector-1.35.11.tgz |
|
equinix-credentials-controller |
https://binary.mirantis.com/core/helm/equinix-credentials-controller-1.35.11.tgz |
|
equinix-provider |
https://binary.mirantis.com/core/helm/equinix-provider-1.35.11.tgz |
|
equinixmetalv2-provider |
https://binary.mirantis.com/core/helm/equinixmetalv2-provider-1.35.11.tgz |
|
event-controller |
https://binary.mirantis.com/core/helm/event-controller-1.35.11.tgz |
|
iam-controller |
https://binary.mirantis.com/core/helm/iam-controller-1.35.11.tgz |
|
kaas-exporter |
https://binary.mirantis.com/core/helm/kaas-exporter-1.35.11.tgz |
|
kaas-public-api |
https://binary.mirantis.com/core/helm/kaas-public-api-1.35.11.tgz |
|
kaas-ui |
||
lcm-controller |
https://binary.mirantis.com/core/helm/lcm-controller-1.35.11.tgz |
|
license-controller |
https://binary.mirantis.com/core/helm/license-controller-1.35.11.tgz |
|
mcc-cache |
||
metrics-server |
https://binary.mirantis.com/core/helm/metrics-server-1.35.11.tgz |
|
openstack-provider |
https://binary.mirantis.com/core/helm/openstack-provider-1.35.11.tgz |
|
os-credentials-controller |
https://binary.mirantis.com/core/helm/os-credentials-controller-1.35.11.tgz |
|
portforward-controller |
https://binary.mirantis.com/core/helm/portforward-controller-1.35.11.tgz |
|
proxy-controller |
https://binary.mirantis.com/core/helm/proxy-controller-1.35.11.tgz |
|
rbac-controller |
https://binary.mirantis.com/core/helm/rbac-controller-1.35.11.tgz |
|
release-controller |
https://binary.mirantis.com/core/helm/release-controller-1.35.11.tgz |
|
rhellicense-controller |
https://binary.mirantis.com/core/helm/rhellicense-controller-1.35.11.tgz |
|
scope-controller |
http://binary.mirantis.com/core/helm/scope-controller-1.35.11.tgz |
|
squid-proxy |
https://binary.mirantis.com/core/helm/squid-proxy-1.35.11.tgz |
|
vsphere-credentials-controller |
https://binary.mirantis.com/core/helm/vsphere-credentials-controller-1.35.11.tgz |
|
vsphere-provider |
https://binary.mirantis.com/core/helm/vsphere-provider-1.35.11.tgz |
|
user-controller |
https://binary.mirantis.com/core/helm/user-controller-1.35.11.tgz |
|
Docker images |
admission-controller Updated |
mirantis.azurecr.io/core/admission-controller:1.35.11 |
agent-controller Updated |
mirantis.azurecr.io/core/agent-controller:1.35.11 |
|
aws-cluster-api-controller Updated |
mirantis.azurecr.io/core/aws-cluster-api-controller:1.35.11 |
|
aws-credentials-controller Updated |
mirantis.azurecr.io/core/aws-credentials-controller:1.35.11 |
|
azure-cloud-controller-manager New |
mirantis.azurecr.io/lcm/external/azure-cloud-controller-manager:v1.23.11 |
|
azure-cloud-node-manager New |
mirantis.azurecr.io/lcm/external/azure-cloud-node-manager:v1.23.11 |
|
azure-cluster-api-controller Updated |
mirantis.azurecr.io/core/azure-cluster-api-controller:1.35.11 |
|
azure-credentials-controller Updated |
mirantis.azurecr.io/core/azure-credentials-controller:1.35.11 |
|
azuredisk-csi New |
mirantis.azurecr.io/lcm/azuredisk-csi-driver:v0.20.0-25-gfaef237 |
|
byo-cluster-api-controller Updated |
mirantis.azurecr.io/core/byo-cluster-api-controller:1.35.11 |
|
byo-credentials-controller Updated |
mirantis.azurecr.io/core/byo-credentials-controller:1.35.11 |
|
ceph-kcc-controller Updated |
mirantis.azurecr.io/core/ceph-kcc-controller:1.35.11 |
|
cert-manager-controller |
mirantis.azurecr.io/core/external/cert-manager-controller:v1.6.1 |
|
client-certificate-controller Updated |
mirantis.azurecr.io/core/client-certificate-controller:1.35.11 |
|
cluster-api-provider-baremetal Updated |
mirantis.azurecr.io/core/cluster-api-provider-baremetal:1.35.11 |
|
cluster-api-provider-equinix Updated |
mirantis.azurecr.io/core/equinix-cluster-api-controller:1.35.11 |
|
equinix-credentials-controller Updated |
mirantis.azurecr.io/core/equinix-credentials-controller:1.35.11 |
|
frontend Updated |
mirantis.azurecr.io/core/frontend:1.35.11 |
|
haproxy |
mirantis.azurecr.io/lcm/mcc-haproxy:v0.17.0-8-g6ca89d5 |
|
iam-controller Updated |
mirantis.azurecr.io/core/iam-controller:1.35.11 |
|
kaas-exporter |
mirantis.azurecr.io/core/kaas-exporter:1.35.11 |
|
kproxy Updated |
mirantis.azurecr.io/core/kproxy:1.35.11 |
|
lcm-controller Updated |
mirantis.azurecr.io/lcm/lcm-controller:v0.3.0-352-gf55d6378 |
|
license-controller Updated |
mirantis.azurecr.io/core/license-controller:1.35.11 |
|
machinepool-controller Updated |
mirantis.azurecr.io/core/machinepool-controller:1.35.11 |
|
mcc-keepalived |
mirantis.azurecr.io/lcm/mcc-keepalived:v0.19.0-5-g6a7e17d |
|
metrics-server |
mirantis.azurecr.io/core/external/metrics-server:v0.5.2 |
|
nginx |
mirantis.azurecr.io/core/external/nginx:1.35.11 |
|
openstack-cluster-api-controller Updated |
mirantis.azurecr.io/core/openstack-cluster-api-controller:1.35.11 |
|
os-credentials-controller Updated |
mirantis.azurecr.io/core/os-credentials-controller:1.35.11 |
|
portforward-controller Updated |
mirantis.azurecr.io/core/portforward-controller:1.35.11 |
|
proxy-controller Updated |
mirantis.azurecr.io/core/proxy-controller:1.35.11 |
|
rbac-controller Updated |
mirantis.azurecr.io/core/rbac-controller:1.35.11 |
|
registry Updated |
mirantis.azurecr.io/lcm/registry:2.8.1 |
|
release-controller Updated |
mirantis.azurecr.io/core/release-controller:1.35.11 |
|
rhellicense-controller Updated |
mirantis.azurecr.io/core/rhellicense-controller:1.35.11 |
|
scope-controller Updated |
mirantis.azurecr.io/core/scope-controller:1.35.11 |
|
squid-proxy Updated |
mirantis.azurecr.io/lcm/squid-proxy:0.0.1-8 |
|
storage-discovery |
mirantis.azurecr.io/core/storage-discovery:1.35.11 |
|
vsphere-cluster-api-controller Updated |
mirantis.azurecr.io/core/vsphere-cluster-api-controller:1.35.11 |
|
vsphere-credentials-controller Updated |
mirantis.azurecr.io/core/vsphere-credentials-controller:1.35.11 |
|
user-controller Updated |
mirantis.azurecr.io/core/user-controller:1.35.11 |
Artifact |
Component |
Path |
|---|---|---|
Binaries |
hash-generate-linux |
http://binary.mirantis.com/iam/bin/hash-generate-0.0.1-268-3cf7f17-linux |
hash-generate-darwin |
http://binary.mirantis.com/iam/bin/hash-generate-0.0.1-268-3cf7f17-darwin |
|
Helm charts |
iam Updated |
|
iam-proxy |
||
keycloak_proxy Updated |
http://binary.mirantis.com/core/helm/keycloak_proxy-1.35.11.tgz |
|
Docker images |
kubernetes-entrypoint |
mirantis.azurecr.io/openstack/extra/kubernetes-entrypoint:v1.0.0-20200311160233 |
mariadb |
mirantis.azurecr.io/general/mariadb:10.6.7-focal-20220811085105 |
|
keycloak Updated |
mirantis.azurecr.io/iam/keycloak:0.5.13 |
|
keycloak-gatekeeper |
mirantis.azurecr.io/iam/keycloak-gatekeeper:7.1.3-3 |
The table below contains the number of vendor-specific addressed CVEs with Critical or High severity.
In total, in the current Container Cloud release, 6 CVEs have been fixed and 4 artifacts (images) updated.
Fixed CVE ID |
# of updated artifacts |
|---|---|
CVE-2022-40023 |
2 |
CVE-2022-25236 |
1 |
CVE-2022-25235 |
1 |
RHSA-2022:8638 |
1 |
RHSA-2022:7089 |
1 |
RHSA-2022:6878 |
1 |
The full list of the CVEs present in the current Container Cloud release is available at the Mirantis Security Portal.
See also
Releases delivered in 2022
This section contains historical information on the unsupported Container Cloud releases delivered in 2022. For the latest supported Container Cloud release, see Container Cloud releases.
Version |
Release date |
Summary |
|---|---|---|
Dec 19, 2022 |
Based on 2.21.0, Container Cloud 2.21.1:
|
|
Nov 22, 2022 |
|
|
Sep 29, 2022 |
Based on 2.20.0, Container Cloud 2.20.1:
|
|
Sep 5, 2022 |
|
|
July 27, 2022 |
|
|
June 30, 2022 |
Based on 2.18.0, Container Cloud 2.18.1:
|
|
June 13, 2022 |
|
|
May 11, 2022 |
|
|
Apr 14, 2022 |
Based on 2.16.0, Container Cloud 2.16.1:
|
|
Mar 31, 2022 |
|
|
Feb 23, 2022 |
Based on 2.15.0, this release introduces the Cluster release 8.5.0 that is based on 5.22.0 and supports Mirantis OpenStack for Kubernetes (MOSK) 22.1. For the list of Cluster releases 7.x and 5.x that are supported by 2.15.1 as well as for its features with addressed and known issues, refer to the parent release 2.15.0. |
|
Jan 31, 2022 |
|
The Mirantis Container Cloud GA release 2.21.1 is based on 2.21.0 and:
Introduces support for the Cluster release 12.5.0 that is based on the Cluster release 11.5.0 and represents Mirantis OpenStack for Kubernetes (MOSK) 22.5.
Introduces support for Mirantis Kubernetes Engine 3.5.5 with Kubernetes 1.21 and Mirantis Container Runtime 20.10.13 in the 12.x Cluster release series.
Does not support greenfield deployments based on deprecated Cluster releases 11.4.0, 8.10.0, and 7.10.0. Use the latest available Cluster releases of the series instead.
For details about the Container Cloud release 2.21.1, refer to its parent release 2.21.0:
Caution
Make sure to update the Cluster release version of your managed cluster before the current Cluster release version becomes unsupported by a new Container Cloud release version. Otherwise, Container Cloud stops auto-upgrade and eventually Container Cloud itself becomes unsupported.
The Mirantis Container Cloud GA release 2.21.0:
Introduces support for the Cluster release 11.5.0 that is based on Mirantis Container Runtime 20.10.13 and Mirantis Kubernetes Engine 3.5.5 with Kubernetes 1.21.
Introduces support for the Cluster release 7.11.0 that is based on Mirantis Container Runtime 20.10.13 and Mirantis Kubernetes Engine 3.4.11 with Kubernetes 1.20.
Supports the Cluster release 8.10.0 that is based on the Cluster release 7.10.0 and represents Mirantis OpenStack for Kubernetes (MOSK) 22.4.
Does not support greenfield deployments on deprecated Cluster releases 11.4.0, 8.8.0, and 7.10.0. Use the latest available Cluster releases of the series instead.
Caution
Make sure to update the Cluster release version of your managed cluster before the current Cluster release version becomes unsupported by a new Container Cloud release version. Otherwise, Container Cloud stops auto-upgrade and eventually Container Cloud itself becomes unsupported.
This section outlines release notes for the Container Cloud release 2.21.0.
Caution
Container Cloud 2.21.0 requires manual post-upgrade steps. For details, see Post-upgrade actions.
This section outlines new features and enhancements introduced in the Mirantis Container Cloud release 2.21.0. For the list of enhancements in the Cluster releases 11.5.0 and 7.11.0 that are introduced by the Container Cloud release 2.21.0, see the Cluster releases.
‘BareMetalHostCredential’ custom resource for bare metal hosts
Combining router and seed node settings on one Equinix Metal server
Add custom Docker registries using the Container Cloud web UI
Implemented the BareMetalHostCredential custom resource to simplify
permissions and roles management on a bare metal management, regional, and
managed cluster.
Note
For MOSK-based deployments, the feature support is available since MOSK 22.5.
The BareMetalHostCredential object creation triggers the following
automatic actions:
Create an underlying
Secretobject containing data aboutusernameandpasswordof thebmcaccount of the relatedBareMetalHostCredentialobject.Erase sensitive
passworddata of thebmcaccount from theBareMetalHostCredentialobject.Add the created
Secretobject name to thespec.password.namesection of the relatedBareMetalHostCredentialobject.Update
BareMetalHost.spec.bmc.credentialsNamewith theBareMetalHostCredentialobject name.
Note
When you delete a BareMetalHost object, the related
BareMetalHostCredential object is deleted automatically.
Note
On existing clusters, a BareMetalHostCredential object is
automatically created for each BareMetalHost object during a cluster
update.
Enhanced the logic of the dnsmasq server to listen on the PXE network of
the management cluster by using the dhcp-lb Kubernetes Service instead of
listening on the PXE interface of one management cluster node.
To configure the DHCP relay service, specify the external address of the
dhcp-lb Kubernetes Service as an upstream address for the relayed DHCP
requests, which is the IP helper address for DHCP. There is the dnsmasq
Deployment behind this service that can only accept relayed DHCP requests.
Container Cloud has its own DHCP relay running on one of the management cluster nodes. That DHCP relay serves for proxying DHCP requests in the same L2 domain where the management cluster nodes are located.
The enhancement comprises deprecation of the dnsmasq.dhcp_range parameter.
Use the Subnet object configuration for this purpose instead.
Note
If you configured multiple DHCP ranges before Container Cloud 2.21.0
during the management cluster bootstrap, the DHCP configuration will
automatically migrate to Subnet objects after cluster upgrade to 2.21.0.
Caution
Using of custom DNS server addresses for servers that boot over PXE is not supported.
Implemented the ability to combine configuration of a router and seed node on
the same server when preparing infrastructure for an Equinix Metal based
Container Cloud with private networking using Terraform templates.
Set router_as_seed to true in the required Metro configuration while
preparing terraform.tfvars to combine both the router and seed node roles.
Learn more
TechPreview
Implemented the possibility to safely clean up a node resources using the
Container Cloud API before deleting it from a cluster. Using the
deletionPolicy: graceful parameter in the providerSpec.value section
of the Machine object, the cloud provider controller now prepares a
machine for deletion by cordoning, draining, and removing the related node
from Docker Swarm. If required, you can abort a machine deletion when using
deletionPolicy: graceful, but only before the related node is removed
from Docker Swarm.
Caution
For MKE clusters that are part of MOSK infrastructure, the feature support will become available in one of the following Container Cloud releases.
Learn more
Enhanced support for custom Docker registries configuration in management, regional, and managed clusters by adding the Container Registries tab to the Container Cloud web UI. Using this tab, you can configure CA certificates on machines to access private Docker registries.
Note
For MOSK-based deployments, the feature support is available since MOSK 22.5.
The following issues have been addressed in the Mirantis Container Cloud release 2.21.0 along with the Cluster releases 11.5.0 and 7.11.0:
[23002] Fixed the issue with inability to set a custom value for a predefined node label using the Container Cloud web UI.
[26416] Fixed the issue with inability to automatically upload an MKE client bundle during cluster attachment using the Container Cloud web UI.
[26740] Fixed the issue with failure to upgrade a management cluster with a Keycloak or web UI TLS custom certificate.
[27193] Fixed the issue with missing permissions for the
m:kaas:<namespaceName>@memberrole that are required for the Container Cloud web UI to work properly. The issue relates to reading permissions for resources objects of all providers as well asclusterRelease,unsupportedClusterobjects, and so on.[26379] Fixed the issue with missing logs for MOSK-related namespaces when using the container-cloud collect logs command without the
--extendedflag.
This section lists known issues with workarounds for the Mirantis Container Cloud release 2.21.0 including the Cluster releases 11.5.0 and 7.11.0.
For other issues that can occur while deploying and operating a Container Cloud cluster, see Troubleshooting Guide.
Note
This section also outlines still valid known issues from previous Container Cloud releases.
A managed cluster deployment, attachment, or update to a Cluster release with
MKE versions 3.3.13, 3.4.6, 3.5.1, or earlier may fail with the
compose pods flapping (ready > terminating > pending) and with the
following error message appearing in logs:
'not ready: deployments: kube-system/compose got 0/0 replicas, kube-system/compose-api
got 0/0 replicas'
ready: false
type: Kubernetes
Workaround:
Disable Docker Content Trust (DCT):
Access the MKE web UI as admin.
Navigate to Admin > Admin Settings.
In the left navigation pane, click Docker Content Trust and disable it.
Restart the affected deployments such as
calico-kube-controllers,compose,compose-api,coredns, and so on:kubectl -n kube-system delete deployment <deploymentName>
Once done, the cluster deployment or update resumes.
Re-enable DCT.
Deployment of a regional cluster based on bare metal or Equinix Metal with
private networking fails with mcc-cache Pods being stuck in the
CrashLoopBackOff status of restarts.
As a workaround, remove failed mcc-cache Pods to restart them
automatically. For example:
kubectl -n kaas delete pod mcc-cache-0
During deletion of a manager machine running the ironic Pod from a bare
metal management cluster, the following problems occur:
All Pods are stuck in the
TerminatingstateA new
ironicPod fails to startThe related bare metal host is stuck in the
deprovisioningstate
As a workaround, before deletion of the node running the ironic Pod,
cordon and drain the node using the kubectl cordon <nodeName> and
kubectl drain <nodeName> commands.
If a baremetal-based regional cluster deployment fails before pivoting is done, the corresponding region deletion fails.
Workaround:
Using the command below, manually delete all possible traces of the failed
regional cluster deployment, including but not limited to the following
objects that contain the kaas.mirantis.com/region label of the affected
region:
clustermachinebaremetalhostbaremetalhostprofilel2templatesubnetipamhostipaddr
kubectl delete <objectName> -l kaas.mirantis.com/region=<regionName>
Warning
Do not use the same region name again after the regional cluster deployment failure since some objects that reference the region name may still exist.
Deployment of a regional cluster based on bare metal or Equinix Metal with
private networking fails with mcc-cache Pods being stuck in the
CrashLoopBackOff status of restarts.
As a workaround, remove failed mcc-cache Pods to restart them
automatically. For example:
kubectl -n kaas delete pod mcc-cache-0
Deployment of RHEL machines using the Red Hat portal registration, which requires user and password credentials, over MITM proxy fails while building the virtual machines template with the following error:
Unable to verify server's identity: [SSL: CERTIFICATE_VERIFY_FAILED]
certificate verify failed (_ssl.c:618)
The Container Cloud deployment gets stuck while applying the RHEL license
to machines with the same error in the lcm-agent logs.
As a workaround, use the internal Red Hat Satellite server that a VM can access directly without a MITM proxy.
Fixed in 2.28.4 (17.3.4 and 16.3.4)
During replacement of a manager machine, the following problems may occur:
The system adds the node to Docker swarm but not to Kubernetes
The node
Deploymentgets stuck with failed RethinkDB health checks
Workaround:
Delete the failed node.
Wait for the MKE cluster to become healthy. To monitor the cluster status:
Log in to the MKE web UI.
Monitor the cluster status as described in MKE Operations Guide: Monitor an MKE cluster with the MKE web UI.
Deploy a new node.
Fixed in 2.28.4 (17.3.4 and 16.3.4)
During the unsafe or forced deletion of a manager machine running the
calico-kube-controllers Pod in the kube-system namespace,
the following issues occur:
The
calico-kube-controllersPod fails to clean up resources associated with the deleted nodeThe
calico-nodePod may fail to start up on a newly created node if the machine is provisioned with the same IP address as the deleted machine had
As a workaround, before deletion of the node running the
calico-kube-controllers Pod, cordon and drain the node:
kubectl cordon <nodeName>
kubectl drain <nodeName>
During update of a Container Cloud cluster of any type, if the MKE minor
version is updated from 3.4.x to 3.5.x, access to the cluster using the
existing kubeconfig fails with the You must be logged in to the server
(Unauthorized) error due to OIDC settings being reconfigured.
As a workaround, during the cluster update process, use the admin
kubeconfig instead of the existing one. Once the update completes, you can
use the existing cluster kubeconfig again.
To obtain the admin kubeconfig:
kubectl --kubeconfig <pathToMgmtKubeconfig> get secret -n <affectedClusterNamespace> \
-o yaml <affectedClusterName>-kubeconfig | awk '/admin.conf/ {print $2}' | \
head -1 | base64 -d > clusterKubeconfig.yaml
If the related cluster is regional, replace <pathToMgmtKubeconfig> with
<pathToRegionalKubeconfig>.
During bootstrap of a management or regional cluster of any type,
portforward-controller ends accepting new connections after receiving the
Accept error: “EOF” error. Hence, nothing is copied between clients.
The workaround below applies only if machines are stuck in the Provision
state. Otherwise, contact Mirantis support to further assess the issue.
Workaround:
Verify that machines are stuck in the
Provisionstate for up to 20 minutes or more. For example:kubectl --kubeconfig <kindKubeconfigPath> get machines -o wide
Verify whether the
portforward-controllerPod logs contain{{Accept error: “EOF”}}and{{Stopped forwarding}}:kubectl --kubeconfig <kindKubeconfigPath> -n kaas logs -lapp.kubernetes.io/name=portforward-controller | grep 'Accept error: "EOF"' kubectl --kubeconfig <kindKubeconfigPath> -n kaas logs -lapp.kubernetes.io/name=portforward-controller | grep 'Stopped forwarding'
Select from the following options:
If the errors mentioned in the previous step are present:
Restart the
portforward-controllerDeployment:kubectl --kubeconfig <kindKubeconfigPath> -n kaas rollout restart deploy portforward-controller
Monitor the states of machines and the
portforward-controllerPod logs. If the errors recur, restart theportforward-controllerDeployment again.
If the errors mentioned in the previous step are not present, contact Mirantis support to further assess the issue.
During an update of a Container Cloud cluster of any type, recreation of the
Patroni container replica is stuck in the degraded state due to the liveness
probe killing the container that runs the pg_rewind procedure. The issue
affects clusters on which the pg_rewind procedure takes more time than the
full cycle of the liveness probe.
The sample logs of the affected cluster:
INFO: doing crash recovery in a single user mode
ERROR: Crash recovery finished with code=-6
INFO: stdout=
INFO: stderr=2023-01-11 10:20:34 GMT [64]: [1-1] 63be8d72.40 0 LOG: database system was interrupted; last known up at 2023-01-10 17:00:59 GMT
[64]: [2-1] 63be8d72.40 0 LOG: could not read from log segment 00000002000000000000000F, offset 0: read 0 of 8192
[64]: [3-1] 63be8d72.40 0 LOG: invalid primary checkpoint record
[64]: [4-1] 63be8d72.40 0 PANIC: could not locate a valid checkpoint record
Workaround:
For the affected replica and PVC, run:
kubectl delete persistentvolumeclaim/storage-volume-patroni-<replica-id> -n stacklight
kubectl delete pod/patroni-<replica-id> -n stacklight
A low CPU limit 100m for kaas-exporter blocks metric collection.
As a workaround, increase the CPU limit for kaas-exporter to 500m
on the management cluster in the
spec:providerSpec:value:kaas:management:helmReleases: section as
described in {{ mos_name_abbr }} documentation: Underlay Kubernetes operations
- Increase memory limits for cluster components.
On the baremetal-based management clusters, the restarts count of the
metric-collector Pod is increased in time with reason: OOMKilled in
the containerStatuses of the metric-collector Pod. Only clusters with
HTTP proxy enabled are affected.
Such behavior is expected. Therefore, disregard these restarts.
A Container Cloud cluster of any type fails to update with nodes being
stuck in the Prepare state and the following example error in
Conditions of the affected machine:
Error: error when evicting pods/"patroni-13-2" -n "stacklight": global timeout reached: 10m0s
Other symptoms of the issue are as follows:
One of the Patroni Pods has 2/3 of containers ready. For example:
kubectl get po -n stacklight -l app=patroni NAME READY STATUS RESTARTS AGE patroni-13-0 3/3 Running 0 32h patroni-13-1 3/3 Running 0 38h patroni-13-2 2/3 Running 0 38h
The
patroni-patroni-exportercontainer from the affected Pod is not ready. For example:kubectl get pod/patroni-13-2 -n stacklight -o jsonpath='{.status.containerStatuses[?(@.name=="patroni-patroni-exporter")].ready}' false
As a workaround, restart the patroni-patroni-exporter container of
the affected Patroni Pod:
kubectl exec <affectedPatroniPodName> -n stacklight -c patroni-patroni-exporter -- kill 1
For example:
kubectl exec patroni-13-2 -n stacklight -c patroni-patroni-exporter -- kill 1
The OpenSearch elasticsearch.persistentVolumeClaimSize custom setting is
overwritten by logging.persistentVolumeClaimSize during deployment of a
Container Cloud cluster of any type and is set to the default 30Gi.
Note
This issue does not block the OpenSearch cluster operations if the default retention time is set. The default setting is usually enough for the capacity size of this cluster.
The issue may affect the following Cluster releases:
11.2.0 - 11.5.0
7.8.0 - 7.11.0
8.8.0 - 8.10.0, 12.5.0 (MOSK clusters)
10.2.4 - 10.8.1 (attached MKE 3.4.x clusters)
13.0.2 - 13.5.1 (attached MKE 3.5.x clusters)
To verify that the cluster is affected:
Note
In the commands below, substitute parameters enclosed in angle brackets to match the affected cluster values.
kubectl --kubeconfig=<managementClusterKubeconfigPath> \
-n <affectedClusterProjectName> \
get cluster <affectedClusterName> \
-o=jsonpath='{.spec.providerSpec.value.helmReleases[*].values.elasticsearch.persistentVolumeClaimSize}' | xargs echo config size:
kubectl --kubeconfig=<affectedClusterKubeconfigPath> \
-n stacklight get pvc -l 'app=opensearch-master' \
-o=jsonpath="{.items[*].status.capacity.storage}" | xargs echo capacity sizes:
The cluster is not affected if the configuration size value matches or is less than any capacity size. For example:
config size: 30Gi capacity sizes: 30Gi 30Gi 30Gi config size: 50Gi capacity sizes: 100Gi 100Gi 100Gi
The cluster is affected if the configuration size is larger than any capacity size. For example:
config size: 200Gi capacity sizes: 100Gi 100Gi 100Gi
Workaround for a new cluster creation:
Select from the following options:
For a management or regional cluster, during the bootstrap procedure, open
cluster.yaml.templatefor editing.For a managed cluster, open the
Clusterobject for editing.Caution
For a managed cluster, use the Container Cloud API instead of the web UI for cluster creation.
In the opened
.yamlfile, addlogging.persistentVolumeClaimSizealong withelasticsearch.persistentVolumeClaimSize. For example:apiVersion: cluster.k8s.io/v1alpha1 spec: ... providerSpec: value: ... helmReleases: - name: stacklight values: elasticsearch: persistentVolumeClaimSize: 100Gi logging: enabled: true persistentVolumeClaimSize: 100Gi
Continue the cluster deployment. The system will use the custom value set in
logging.persistentVolumeClaimSize.Caution
If
elasticsearch.persistentVolumeClaimSizeis absent in the.yamlfile, the Admission Controller blocks the configuration update.
Workaround for an existing cluster:
Caution
During the application of the below workarounds, a short outage of OpenSearch and its dependent components may occur with the following alerts firing on the cluster. This behavior is expected. Therefore, disregard these alerts.
StackLight alerts list firing during cluster update
Cluster size and outage probability level |
Alert name |
Label name and component |
|---|---|---|
Any cluster with high probability |
|
|
|
|
|
Large cluster with average probability |
|
|
|
n/a |
|
|
n/a |
|
|
n/a |
|
|
n/a |
|
Any cluster with low probability |
|
|
|
|
StackLight in HA mode with LVP provisioner for OpenSearch PVCs
Warning
After applying this workaround, the existing log data will be lost. Therefore, if required, migrate log data to a new persistent volume (PV).
Move the existing log data to a new PV, if required.
Increase the disk size for local volume provisioner (LVP).
Scale down the
opensearch-masterStatefulSet with dependent resources to 0 and disable theelasticsearch-curatorCronJob:kubectl -n stacklight scale --replicas 0 statefulset opensearch-master kubectl -n stacklight scale --replicas 0 deployment opensearch-dashboards kubectl -n stacklight scale --replicas 0 deployment metricbeat kubectl -n stacklight patch cronjobs elasticsearch-curator -p '{"spec" : {"suspend" : true }}'
Recreate the
opensearch-masterStatefulSet with the updated disk size.kubectl get statefulset opensearch-master -o yaml -n stacklight | sed 's/storage: 30Gi/storage: <pvcSize>/g' > opensearch-master.yaml kubectl -n stacklight delete statefulset opensearch-master kubectl create -f opensearch-master.yaml
Replace
<pvcSize>with theelasticsearch.persistentVolumeClaimSizevalue.Delete existing PVCs:
kubectl delete pvc -l 'app=opensearch-master' -n stacklight
Warning
This command removes all existing logs data from PVCs.
In the
Clusterconfiguration, set the samelogging.persistentVolumeClaimSizeas the size ofelasticsearch.persistentVolumeClaimSize. For example:apiVersion: cluster.k8s.io/v1alpha1 kind: Cluster spec: ... providerSpec: value: ... helmReleases: - name: stacklight values: elasticsearch: persistentVolumeClaimSize: 100Gi logging: enabled: true persistentVolumeClaimSize: 100Gi
Scale up the
opensearch-masterStatefulSet with dependent resources and enable theelasticsearch-curatorCronJob:kubectl -n stacklight scale --replicas 3 statefulset opensearch-master sleep 100 kubectl -n stacklight scale --replicas 1 deployment opensearch-dashboards kubectl -n stacklight scale --replicas 1 deployment metricbeat kubectl -n stacklight patch cronjobs elasticsearch-curator -p '{"spec" : {"suspend" : false }}'
StackLight in non-HA mode with an expandable StorageClass for
OpenSearch PVCs
Note
To verify whether a StorageClass is expandable:
kubectl -n stacklight get pvc | grep opensearch-master | awk '{print $6}' | xargs -I{} kubectl get storageclass {} -o yaml | grep 'allowVolumeExpansion: true'
A positive system response is allowVolumeExpansion: true. A negative
system response is blank or false.
Scale down the
opensearch-masterStatefulSet with dependent resources to 0 and disable theelasticsearch-curatorCronJob:kubectl -n stacklight scale --replicas 0 statefulset opensearch-master kubectl -n stacklight scale --replicas 0 deployment opensearch-dashboards kubectl -n stacklight scale --replicas 0 deployment metricbeat kubectl -n stacklight patch cronjobs elasticsearch-curator -p '{"spec" : {"suspend" : true }}'
Recreate the
opensearch-masterStatefulSet with the updated disk size.kubectl -n stacklight get statefulset opensearch-master -o yaml | sed 's/storage: 30Gi/storage: <pvc_size>/g' > opensearch-master.yaml kubectl -n stacklight delete statefulset opensearch-master kubectl create -f opensearch-master.yaml
Replace
<pvcSize>with theelasticsearch.persistentVolumeClaimSizevalue.Patch the PVCs with the new
elasticsearch.persistentVolumeClaimSizevalue:kubectl -n stacklight patch pvc opensearch-master-opensearch-master-0 -p '{ "spec": { "resources": { "requests": { "storage": "<pvc_size>" }}}}'
Replace
<pvcSize>with theelasticsearch.persistentVolumeClaimSizevalue.In the
Clusterconfiguration, setlogging.persistentVolumeClaimSizethe same as the size ofelasticsearch.persistentVolumeClaimSize. For example:apiVersion: cluster.k8s.io/v1alpha1 kind: Cluster spec: ... providerSpec: value: ... helmReleases: - name: stacklight values: elasticsearch: persistentVolumeClaimSize: 100Gi logging: enabled: true persistentVolumeClaimSize: 100Gi
Scale up the
opensearch-masterStatefulSet with dependent resources to1and enable theelasticsearch-curatorCronJob:kubectl -n stacklight scale --replicas 1 statefulset opensearch-master sleep 100 kubectl -n stacklight scale --replicas 1 deployment opensearch-dashboards kubectl -n stacklight scale --replicas 1 deployment metricbeat kubectl -n stacklight patch cronjobs elasticsearch-curator -p '{"spec" : {"suspend" : false }}'
StackLight in non-HA mode with a non-expandable StorageClass
and no LVP for OpenSearch PVCs
Warning
After applying this workaround, the existing log data will be lost. Depending on your custom provisioner, you may find a third-party tool, such as pv-migrate, that provides a possibility to copy all data from one PV to another.
If data loss is acceptable, proceed with the workaround below.
Note
To verify whether a StorageClass is expandable:
kubectl -n stacklight get pvc | grep opensearch-master | awk '{print $6}' | xargs -I{} kubectl get storageclass {} -o yaml | grep 'allowVolumeExpansion: true'
A positive system response is allowVolumeExpansion: true. A negative
system response is blank or false.
Scale down the
opensearch-masterStatefulSet with dependent resources to 0 and disable theelasticsearch-curatorCronJob:kubectl -n stacklight scale --replicas 0 statefulset opensearch-master kubectl -n stacklight scale --replicas 0 deployment opensearch-dashboards kubectl -n stacklight scale --replicas 0 deployment metricbeat kubectl -n stacklight patch cronjobs elasticsearch-curator -p '{"spec" : {"suspend" : true }}'
Recreate the
opensearch-masterStatefulSet with the updated disk size:kubectl get statefulset opensearch-master -o yaml -n stacklight | sed 's/storage: 30Gi/storage: <<pvc_size>>/g' > opensearch-master.yaml kubectl -n stacklight delete statefulset opensearch-master kubectl create -f opensearch-master.yaml
Replace
<pvcSize>with theelasticsearch.persistentVolumeClaimSizevalue.Delete existing PVCs:
kubectl delete pvc -l 'app=opensearch-master' -n stacklight
Warning
This command removes all existing logs data from PVCs.
In the
Clusterconfiguration, setlogging.persistentVolumeClaimSizeto the same value as the size of theelasticsearch.persistentVolumeClaimSizeparameter. For example:apiVersion: cluster.k8s.io/v1alpha1 kind: Cluster spec: ... providerSpec: value: ... helmReleases: - name: stacklight values: elasticsearch: persistentVolumeClaimSize: 100Gi logging: enabled: true persistentVolumeClaimSize: 100Gi
Scale up the
opensearch-masterStatefulSet with dependent resources to1and enable theelasticsearch-curatorCronJob:kubectl -n stacklight scale --replicas 1 statefulset opensearch-master sleep 100 kubectl -n stacklight scale --replicas 1 deployment opensearch-dashboards kubectl -n stacklight scale --replicas 1 deployment metricbeat kubectl -n stacklight patch cronjobs elasticsearch-curator -p '{"spec" : {"suspend" : false }}'
Custom settings for the deprecated elasticsearch.logstashRetentionTime
parameter are overwritten by the default setting set to 1 day.
The issue may affect the following Cluster releases with enabled
elasticsearch.logstashRetentionTime:
11.2.0 - 11.5.0
7.8.0 - 7.11.0
8.8.0 - 8.10.0, 12.5.0 (MOSK clusters)
10.2.4 - 10.8.1 (attached MKE 3.4.x clusters)
13.0.2 - 13.5.1 (attached MKE 3.5.x clusters)
As a workaround, in the Cluster object, replace
elasticsearch.logstashRetentionTime with elasticsearch.retentionTime
that was implemented to replace the deprecated parameter. For example:
apiVersion: cluster.k8s.io/v1alpha1
kind: Cluster
spec:
...
providerSpec:
value:
...
helmReleases:
- name: stacklight
values:
elasticsearch:
retentionTime:
logstash: 10
events: 10
notifications: 10
logging:
enabled: true
For the StackLight configuration procedure and parameters description, refer to StackLight configuration procedure.
Note
Moving forward, the workaround for this issue will be moved from Release Notes to Operations Guide: Troubleshoot StackLight.
On a managed cluster, the StackLight pods may get stuck with the
Pod predicate NodeAffinity failed error in the pod status. The issue may
occur if the StackLight node label was added to one machine and
then removed from another one.
The issue does not affect the StackLight services, all required StackLight pods migrate successfully except extra pods that are created and stuck during pod migration.
As a workaround, remove the stuck pods:
kubectl --kubeconfig <managedClusterKubeconfig> -n stacklight delete pod <stuckPodName>
Ceph conditon gets stuck in absence of the Ceph cluster secrets information. The observed behaviour can be found on the MOSK 22.3 clusters running on top of Container Cloud 2.21.
The list of the symptoms includes:
The
Clusterobject contains the following condition:Failed to configure Ceph cluster: ceph cluster status info is not \ updated at least for 5 minutes, ceph cluster secrets info is not available yet
The
ceph-kcc-controllerlogs from thekaasnamespace contain the following loglines:2022-11-30 19:39:17.393595 E | ceph-spec: failed to update cluster condition to \ {Type:Ready Status:True Reason:ClusterCreated Message:Cluster created successfully \ LastHeartbeatTime:2022-11-30 19:39:17.378401993 +0000 UTC m=+2617.717554955 \ LastTransitionTime:2022-05-16 16:14:37 +0000 UTC}. failed to update object \ "rook-ceph/rook-ceph" status: Operation cannot be fulfilled on \ cephclusters.ceph.rook.io "rook-ceph": the object has been modified; please \ apply your changes to the latest version and try again
Workaround:
Edit
KaaSCephClusterof the affected managed cluster:kubectl -n <managedClusterProject> edit kaascephcluster
Substitute
<managedClusterProject>with the corresponding managed cluster namespace.Define the
versionparameter in theKaaSCephClusterspec:spec: cephClusterSpec: version: 15.2.13
Note
Starting from MOSK 22.4, the Ceph cluster version updates to 15.2.17. Therefore, remove the
versionparameter definition fromKaaSCephClusterafter the managed cluster update.Save the updated
KaaSCephClusterspec.Find the
MiraCephCustom Resource on a managed cluster and copy all annotations starting withmeta.helm.sh:kubectl --kubeconfig <managedClusterKubeconfig> get crd miracephs.lcm.mirantis.com -o yaml
Substitute
<managedClusterKubeconfig>with a corresponding managed clusterkubeconfig.Example of a system output:
apiVersion: apiextensions.k8s.io/v1 kind: CustomResourceDefinition metadata: annotations: controller-gen.kubebuilder.io/version: v0.6.0 # save all annotations with "meta.helm.sh" somewhere meta.helm.sh/release-name: ceph-controller meta.helm.sh/release-namespace: ceph ...
Create the
miracephsecretscrd.yamlfile and fill it with the following template:apiVersion: apiextensions.k8s.io/v1 kind: CustomResourceDefinition metadata: annotations: controller-gen.kubebuilder.io/version: v0.6.0 <insert all "meta.helm.sh" annotations here> labels: app.kubernetes.io/managed-by: Helm name: miracephsecrets.lcm.mirantis.com spec: conversion: strategy: None group: lcm.mirantis.com names: kind: MiraCephSecret listKind: MiraCephSecretList plural: miracephsecrets singular: miracephsecret scope: Namespaced versions: - name: v1alpha1 schema: openAPIV3Schema: description: MiraCephSecret aggregates secrets created by Ceph properties: apiVersion: type: string kind: type: string metadata: type: object status: properties: lastSecretCheck: type: string lastSecretUpdate: type: string messages: items: type: string type: array state: type: string type: object type: object served: true storage: true
Insert the copied
meta.helm.shannotations to themetadata.annotationssection of the template.Apply
miracephsecretscrd.yamlon the managed cluster:kubectl --kubeconfig <managedClusterKubeconfig> apply -f miracephsecretscrd.yaml
Substitute
<managedClusterKubeconfig>with a corresponding managed clusterkubeconfig.Obtain the
MiraCephname from the managed cluster:kubectl --kubeconfig <managedClusterKubeconfig> -n ceph-lcm-mirantis get miraceph -o name
Substitute
<managedClusterKubeconfig>with the corresponding managed clusterkubeconfig.Example of a system output:
miraceph.lcm.mirantis.com/rook-ceph
Copy the
MiraCephname after slash, therook-cephpart from the example above.Create the
mcs.yamlfile and fill it with the following template:apiVersion: lcm.mirantis.com/v1alpha1 kind: MiraCephSecret metadata: name: <miracephName> namespace: ceph-lcm-mirantis status: {}
Substitute
<miracephName>with theMiraCephname from the previous step.Apply
mcs.yamlon the managed cluster:kubectl --kubeconfig <managedClusterKubeconfig> apply -f mcs.yaml
Substitute
<managedClusterKubeconfig>with a corresponding managed clusterkubeconfig.
After some delay, the cluster condition will be updated to the health
state.
Note
The issue does not reproduce since MOSK 25.2.
Update of a managed cluster based on bare metal and Ceph enabled fails with
PersistentVolumeClaim getting stuck in the Pending state for the
prometheus-server StatefulSet and the
MountVolume.MountDevice failed for volume warning in the StackLight event
logs.
Workaround:
Verify that the description of the Pods that failed to run contain the
FailedMountevents:kubectl -n <affectedProjectName> describe pod <affectedPodName>
In the command above, replace the following values:
<affectedProjectName>is the Container Cloud project name where the Pods failed to run<affectedPodName>is a Pod name that failed to run in the specified project
In the Pod description, identify the node name where the Pod failed to run.
Verify that the
csi-rbdpluginlogs of the affected node contain therbd volume mount failed: <csi-vol-uuid> is being usederror. The<csi-vol-uuid>is a unique RBD volume name.Identify
csiPodNameof the correspondingcsi-rbdplugin:kubectl -n rook-ceph get pod -l app=csi-rbdplugin \ -o jsonpath='{.items[?(@.spec.nodeName == "<nodeName>")].metadata.name}'
Output the affected
csiPodNamelogs:kubectl -n rook-ceph logs <csiPodName> -c csi-rbdplugin
Scale down the affected
StatefulSetorDeploymentof the Pod that fails to0replicas.On every
csi-rbdpluginPod, search for stuckcsi-vol:for pod in `kubectl -n rook-ceph get pods|grep rbdplugin|grep -v provisioner|awk '{print $1}'`; do echo $pod kubectl exec -it -n rook-ceph $pod -c csi-rbdplugin -- rbd device list | grep <csi-vol-uuid> done
Unmap the affected
csi-vol:rbd unmap -o force /dev/rbd<i>
The
/dev/rbd<i>value is a mapped RBD volume that usescsi-vol.Delete
volumeattachmentof the affected Pod:kubectl get volumeattachments | grep <csi-vol-uuid> kubectl delete volumeattacmhent <id>
Scale up the affected
StatefulSetorDeploymentback to the original number of replicas and wait until its state becomesRunning.
The following table lists the major components and their versions of the Mirantis Container Cloud release 2.21.0.
Note
The components that are newly added, updated, deprecated, or removed
as compared to the previous release version, are marked
with a corresponding superscript,
for example, lcm-ansible Updated.
Component |
Application/Service |
Version |
|---|---|---|
AWS Updated |
aws-provider |
1.34.16 |
aws-credentials-controller |
1.34.16 |
|
Azure Updated |
azure-provider |
1.34.16 |
azure-credentials-controller |
1.34.16 |
|
Bare metal |
ambassador |
1.20.1-alpine |
baremetal-operator Updated |
base-focal-20220611131433 |
|
baremetal-public-api Updated |
1.34.16 |
|
baremetal-provider Updated |
1.34.16 |
|
baremetal-resource-controller |
base-focal-20220627134752 |
|
ironic |
yoga-focal-20220719132049 |
|
kaas-ipam |
base-focal-20220503165133 |
|
keepalived Updated |
0.19.0-5-g6a7e17d |
|
local-volume-provisioner Updated |
2.4.0 |
|
mariadb |
10.4.17-bionic-20220113085105 |
|
metallb-controller Updated |
0.13.4 0 |
|
IAM |
iam Updated |
2.4.35 |
iam-controller Updated |
1.34.16 |
|
keycloak |
18.0.0 |
|
Container Cloud Updated |
admission-controller |
1.34.16 |
agent-controller |
1.34.16 |
|
byo-credentials-controller |
1.34.16 |
|
byo-provider |
1.34.16 |
|
ceph-kcc-controller |
1.34.16 |
|
cert-manager |
1.34.16 |
|
client-certificate-controller |
1.34.16 |
|
event-controller |
1.34.16 |
|
golang |
1.18.5 |
|
kaas-public-api |
1.34.16 |
|
kaas-exporter |
1.34.16 |
|
kaas-ui |
1.34.16 |
|
license-controller |
1.34.16 |
|
lcm-controller |
0.3.0-327-gbc30b11b |
|
machinepool-controller |
1.34.16 |
|
mcc-cache |
1.34.16 |
|
metrics-server |
0.5.2 |
|
portforward-controller |
1.34.16 |
|
proxy-controller |
1.34.16 |
|
rbac-controller |
1.34.16 |
|
release-controller |
1.34.16 |
|
rhellicense-controller |
1.34.16 |
|
scope-controller |
1.34.16 |
|
user-controller |
1.34.16 |
|
Equinix Metal Updated |
equinix-provider |
1.34.16 |
equinix-credentials-controller |
1.34.16 |
|
keepalived |
0.19.0-5-g6a7e17d |
|
OpenStack Updated |
openstack-provider |
1.34.16 |
os-credentials-controller |
1.34.16 |
|
VMware vSphere Updated |
metallb-controller Updated |
0.13.4 |
vsphere-provider |
1.34.16 |
|
vsphere-credentials-controller |
1.34.16 |
|
keepalived |
0.19.0-5-g6a7e17d |
|
squid-proxy |
0.0.1-7 |
- 0
For MOSK-based deployments, the
metallb-controllerversion is updated from 0.12.1 to 0.13.4 in MOSK 22.5.
This section lists the components artifacts of the Mirantis Container Cloud release 2.21.0.
Note
The components that are newly added, updated, deprecated, or removed
as compared to the previous release version, are marked
with a corresponding superscript,
for example, lcm-ansible Updated.
Artifact |
Component |
Path |
|---|---|---|
Binaries |
baremetal-api Updated |
https://binary.mirantis.com/core/helm/baremetal-api-1.34.16.tgz |
baremetal-operator Updated |
https://binary.mirantis.com/core/helm/baremetal-operator-1.34.17.tgz |
|
baremetal-public-api Updated |
https://binary.mirantis.com/core/helm/baremetal-public-api-1.34.16.tgz |
|
ironic-python-agent.initramfs Updated |
https://binary.mirantis.com/bm/bin/ironic/ipa/ubuntu/initramfs-yoga-focal-debug-20220915111547 |
|
ironic-python-agent.kernel Updated |
https://binary.mirantis.com/bm/bin/ironic/ipa/ubuntu/kernel-yoga-focal-debug-20220915111547 |
|
kaas-ipam Updated |
||
metallb |
||
local-volume-provisioner Updated |
https://binary.mirantis.com/core/helm/local-volume-provisioner-1.34.16.tgz |
|
provisioning_ansible |
https://binary.mirantis.com/bm/bin/ansible/provisioning_ansible-0.1.1-104-6e2e82c.tgz |
|
Docker images |
ambassador |
mirantis.azurecr.io/general/external/docker.io/library/nginx:1.20.1-alpine |
baremetal-operator |
mirantis.azurecr.io/bm/baremetal-operator:base-focal-20220611131433 |
|
baremetal-resource-controller |
mirantis.azurecr.io/bm/baremetal-resource-controller:base-focal-20220627134752 |
|
dynamic_ipxe Updated |
mirantis.azurecr.io/bm/dynamic-ipxe:base-focal-20221018205745 |
|
dnsmasq Updated |
mirantis.azurecr.io/bm/baremetal-dnsmasq:base-alpine-20221025105458 |
|
dnsmasq-controller Updated |
mirantis.azurecr.io/bm/dnsmasq-controller:base-focal-20220811133223 |
|
ironic |
mirantis.azurecr.io/openstack/ironic:yoga-focal-20220719132049 |
|
ironic-inspector |
mirantis.azurecr.io/openstack/ironic-inspector:yoga-focal-20220719132049 |
|
ironic-prometheus-exporter |
mirantis.azurecr.io/stacklight/ironic-prometheus-exporter:0.1-20220602121226 |
|
kaas-ipam |
mirantis.azurecr.io/bm/kaas-ipam:base-focal-20220503165133 |
|
mariadb |
mirantis.azurecr.io/general/mariadb:10.4.17-bionic-20220113085105 |
|
mcc-keepalived Updated |
mirantis.azurecr.io/lcm/mcc-keepalived:v0.19.0-5-g6a7e17d |
|
metallb-controller Updated 0 |
mirantis.azurecr.io/bm/external/metallb/controller:v0.13.4 |
|
metallb-speaker Updated 0 |
mirantis.azurecr.io/bm/external/metallb/speaker:v0.13.4 |
|
syslog-ng |
mirantis.azurecr.io/bm/syslog-ng:base-focal-20220128103433 |
- 0(1,2)
For MOSK-based deployments, the
metallbversion is updated from 0.12.1 to 0.13.4 in MOSK 22.5.
Artifact |
Component |
Paths |
|---|---|---|
Bootstrap tarball Updated |
bootstrap-linux |
https://binary.mirantis.com/core/bin/bootstrap-linux-1.34.16.tar.gz |
bootstrap-darwin |
https://binary.mirantis.com/core/bin/bootstrap-darwin-1.34.16.tar.gz |
|
Helm charts Updated |
admission-controller |
https://binary.mirantis.com/core/helm/admission-controller-1.34.16.tgz |
agent-controller |
https://binary.mirantis.com/core/helm/agent-controller-1.34.16.tgz |
|
aws-credentials-controller |
https://binary.mirantis.com/core/helm/aws-credentials-controller-1.34.16.tgz |
|
aws-provider |
https://binary.mirantis.com/core/helm/aws-provider-1.34.16.tgz |
|
azure-credentials-controller |
https://binary.mirantis.com/core/helm/azure-credentials-controller-1.34.16.tgz |
|
azure-provider |
https://binary.mirantis.com/core/helm/azure-provider-1.34.16.tgz |
|
baremetal-provider |
https://binary.mirantis.com/core/helm/baremetal-provider-1.34.16.tgz |
|
byo-credentials-controller |
https://binary.mirantis.com/core/helm/byo-credentials-controller-1.34.16.tgz |
|
byo-provider |
https://binary.mirantis.com/core/helm/byo-provider-1.34.16.tgz |
|
ceph-kcc-controller |
https://binary.mirantis.com/core/helm/ceph-kcc-controller-1.34.16.tgz |
|
cert-manager |
https://binary.mirantis.com/core/helm/cert-manager-1.34.16.tgz |
|
client-certificate-controller |
https://binary.mirantis.com/core/helm/client-certificate-controller-1.34.16.tgz |
|
configuration-collector New |
https://binary.mirantis.com/core/helm/configuration-collector-1.34.16.tgz |
|
equinix-credentials-controller |
https://binary.mirantis.com/core/helm/equinix-credentials-controller-1.34.16.tgz |
|
equinix-provider |
https://binary.mirantis.com/core/helm/equinix-provider-1.34.16.tgz |
|
equinixmetalv2-provider |
https://binary.mirantis.com/core/helm/equinixmetalv2-provider-1.34.16.tgz |
|
event-controller |
https://binary.mirantis.com/core/helm/event-controller-1.34.16.tgz |
|
iam-controller |
https://binary.mirantis.com/core/helm/iam-controller-1.34.16.tgz |
|
kaas-exporter |
https://binary.mirantis.com/core/helm/kaas-exporter-1.34.16.tgz |
|
kaas-public-api |
https://binary.mirantis.com/core/helm/kaas-public-api-1.34.16.tgz |
|
kaas-ui |
||
lcm-controller |
https://binary.mirantis.com/core/helm/lcm-controller-1.34.16.tgz |
|
license-controller |
https://binary.mirantis.com/core/helm/license-controller-1.34.16.tgz |
|
mcc-cache |
||
metrics-server |
https://binary.mirantis.com/core/helm/metrics-server-1.34.16.tgz |
|
openstack-provider |
https://binary.mirantis.com/core/helm/openstack-provider-1.34.16.tgz |
|
os-credentials-controller |
https://binary.mirantis.com/core/helm/os-credentials-controller-1.34.16.tgz |
|
portforward-controller |
https://binary.mirantis.com/core/helm/portforward-controller-1.34.16.tgz |
|
proxy-controller |
https://binary.mirantis.com/core/helm/proxy-controller-1.34.16.tgz |
|
rbac-controller |
https://binary.mirantis.com/core/helm/rbac-controller-1.34.16.tgz |
|
release-controller |
https://binary.mirantis.com/core/helm/release-controller-1.34.16.tgz |
|
rhellicense-controller |
https://binary.mirantis.com/core/helm/rhellicense-controller-1.34.16.tgz |
|
scope-controller |
http://binary.mirantis.com/core/helm/scope-controller-1.34.16.tgz |
|
squid-proxy |
https://binary.mirantis.com/core/helm/squid-proxy-1.34.16.tgz |
|
vsphere-credentials-controller |
https://binary.mirantis.com/core/helm/vsphere-credentials-controller-1.34.16.tgz |
|
vsphere-provider |
https://binary.mirantis.com/core/helm/vsphere-provider-1.34.16.tgz |
|
user-controller |
https://binary.mirantis.com/core/helm/user-controller-1.34.16.tgz |
|
Docker images |
admission-controller Updated |
mirantis.azurecr.io/core/admission-controller:1.34.16 |
agent-controller Updated |
mirantis.azurecr.io/core/agent-controller:1.34.16 |
|
aws-cluster-api-controller Updated |
mirantis.azurecr.io/core/aws-cluster-api-controller:1.34.16 |
|
aws-credentials-controller Updated |
mirantis.azurecr.io/core/aws-credentials-controller:1.34.16 |
|
azure-cluster-api-controller Updated |
mirantis.azurecr.io/core/azure-cluster-api-controller:1.34.16 |
|
azure-credentials-controller Updated |
mirantis.azurecr.io/core/azure-credentials-controller:1.34.16 |
|
byo-cluster-api-controller Updated |
mirantis.azurecr.io/core/byo-cluster-api-controller:1.34.16 |
|
byo-credentials-controller Updated |
mirantis.azurecr.io/core/byo-credentials-controller:1.34.16 |
|
ceph-kcc-controller Updated |
mirantis.azurecr.io/core/ceph-kcc-controller:1.34.16 |
|
cert-manager-controller |
mirantis.azurecr.io/core/external/cert-manager-controller:v1.6.1 |
|
client-certificate-controller Updated |
mirantis.azurecr.io/core/client-certificate-controller:1.34.16 |
|
cluster-api-provider-baremetal Updated |
mirantis.azurecr.io/core/cluster-api-provider-baremetal:1.34.16 |
|
cluster-api-provider-equinix Updated |
mirantis.azurecr.io/core/equinix-cluster-api-controller:1.34.16 |
|
equinix-credentials-controller Updated |
mirantis.azurecr.io/core/equinix-credentials-controller:1.34.16 |
|
frontend Updated |
mirantis.azurecr.io/core/frontend:1.34.16 |
|
haproxy |
mirantis.azurecr.io/lcm/mcc-haproxy:v0.17.0-8-g6ca89d5 |
|
iam-controller Updated |
mirantis.azurecr.io/core/iam-controller:1.34.16 |
|
kaas-exporter |
mirantis.azurecr.io/core/kaas-exporter:1.34.16 |
|
kproxy Updated |
mirantis.azurecr.io/core/kproxy:1.34.16 |
|
lcm-controller Updated |
mirantis.azurecr.io/lcm/lcm-controller:v0.3.0-327-gbc30b11b |
|
license-controller Updated |
mirantis.azurecr.io/core/license-controller:1.34.16 |
|
machinepool-controller Updated |
mirantis.azurecr.io/core/machinepool-controller:1.34.16 |
|
mcc-keepalived Updated |
mirantis.azurecr.io/lcm/mcc-keepalived:v0.19.0-5-g6a7e17d |
|
metrics-server |
mirantis.azurecr.io/core/external/metrics-server:v0.5.2 |
|
nginx |
mirantis.azurecr.io/core/external/nginx:1.34.16 |
|
openstack-cluster-api-controller Updated |
mirantis.azurecr.io/core/openstack-cluster-api-controller:1.34.16 |
|
os-credentials-controller Updated |
mirantis.azurecr.io/core/os-credentials-controller:1.34.16 |
|
portforward-controller Updated |
mirantis.azurecr.io/core/portforward-controller:1.34.16 |
|
proxy-controller Updated |
mirantis.azurecr.io/core/proxy-controller:1.34.16 |
|
rbac-controller Updated |
mirantis.azurecr.io/core/rbac-controller:1.34.16 |
|
registry |
mirantis.azurecr.io/lcm/registry:2.7.1 |
|
release-controller Updated |
mirantis.azurecr.io/core/release-controller:1.34.16 |
|
rhellicense-controller Updated |
mirantis.azurecr.io/core/rhellicense-controller:1.34.16 |
|
scope-controller Updated |
mirantis.azurecr.io/core/scope-controller:1.34.16 |
|
squid-proxy Updated |
mirantis.azurecr.io/lcm/squid-proxy:0.0.1-7 |
|
storage-discovery |
mirantis.azurecr.io/core/storage-discovery:1.34.16 |
|
vsphere-cluster-api-controller Updated |
mirantis.azurecr.io/core/vsphere-cluster-api-controller:1.34.16 |
|
vsphere-credentials-controller Updated |
mirantis.azurecr.io/core/vsphere-credentials-controller:1.34.16 |
|
user-controller Updated |
mirantis.azurecr.io/core/user-controller:1.34.16 |
Artifact |
Component |
Path |
|---|---|---|
Binaries |
hash-generate-linux |
http://binary.mirantis.com/iam/bin/hash-generate-0.0.1-268-3cf7f17-linux |
hash-generate-darwin |
http://binary.mirantis.com/iam/bin/hash-generate-0.0.1-268-3cf7f17-darwin |
|
Helm charts Updated |
iam |
|
iam-proxy |
||
keycloak_proxy |
http://binary.mirantis.com/core/helm/keycloak_proxy-1.34.16.tgz |
|
Docker images |
kubernetes-entrypoint |
mirantis.azurecr.io/openstack/extra/kubernetes-entrypoint:v1.0.0-20200311160233 |
mariadb Updated |
mirantis.azurecr.io/general/mariadb:10.6.7-focal-20220811085105 |
|
keycloak Updated |
mirantis.azurecr.io/iam/keycloak:0.5.12 |
|
keycloak-gatekeeper Updated |
mirantis.azurecr.io/iam/keycloak-gatekeeper:7.1.3-3 |
Since Kubernetes policy does not allow updating images in existing IAM jobs, after Container Cloud automatically upgrades to 2.21.0, update the MariaDB image manually using the following steps:
Delete the existing job:
kubectl delete job -n kaas iam-cluster-wait
In the management
Clusterobject, and add following snippet:kaas: management: enabled: true helmReleases: - name: iam values: keycloak: mariadb: images: tags: mariadb_scripted_test: general/mariadb:10.6.7-focal-20220811085105
Wait until
helm-controllerapplies changes.Verify that the job was recreated and the new image was added:
kubectl describe job -n kaas iam-cluster-wait | grep -i image
The Mirantis Container Cloud GA release 2.20.1 is based on 2.20.0 and:
Introduces support for the Cluster release 8.10.0 that is based on the Cluster release 7.10.0 and represents Mirantis OpenStack for Kubernetes (MOSK) 22.4.
This Cluster release is based on the updated version of Mirantis Kubernetes Engine 3.4.10 with Kubernetes 1.20 and Mirantis Container Runtime 20.10.12.
Does not support greenfield deployments based on deprecated Cluster releases 11.3.0, 8.8.0, and 7.9.0. Use the latest available Cluster releases of the series instead.
For details about the Container Cloud release 2.20.1, refer to its parent release 2.20.0:
Caution
Make sure to update the Cluster release version of your managed cluster before the current Cluster release version becomes unsupported by a new Container Cloud release version. Otherwise, Container Cloud stops auto-upgrade and eventually Container Cloud itself becomes unsupported.
The Mirantis Container Cloud GA release 2.20.0:
Introduces support for the Cluster release 11.4.0 that is based on Mirantis Container Runtime 20.10.12 and Mirantis Kubernetes Engine 3.5.4 with Kubernetes 1.21.
Introduces support for the Cluster release 7.10.0 that is based on Mirantis Container Runtime 20.10.12 and Mirantis Kubernetes Engine 3.4.10 with Kubernetes 1.20.
Supports the Cluster release 8.8.0 that is based on the Cluster release 7.8.0 and represents Mirantis OpenStack for Kubernetes (MOSK) 22.3.
Does not support greenfield deployments on deprecated Cluster releases 11.3.0, 8.6.0, and 7.9.0. Use the latest available Cluster releases of the series instead.
Caution
Make sure to update the Cluster release version of your managed cluster before the current Cluster release version becomes unsupported by a new Container Cloud release version. Otherwise, Container Cloud stops auto-upgrade and eventually Container Cloud itself becomes unsupported.
This section outlines release notes for the Container Cloud release 2.20.0.
This section outlines new features and enhancements introduced in the Mirantis Container Cloud release 2.20.0. For the list of enhancements in the Cluster releases 11.4.0 and 7.10.0 that are introduced by the Container Cloud release 2.20.0, see the Cluster releases.
Added the IAM member role to the existing IAM roles list. The
Infrastructure Operator with the member role has the read and write
access to Container Cloud API allowing cluster operations and does not have
access to IAM objects.
Implemented the capability to configure the Bastion node on greenfield deployments of the OpenStack-based and AWS-based managed clusters using the Container Cloud web UI. Using the Create Cluster wizard, you can now configure the following parameters for the Bastion node:
OpenStack-based: flavor, image, availability zone, server metadata, booting from a volume
AWS-based: instance type, AMI ID
Note
Reconfiguration of the Bastion node on an existing cluster is not supported.
Made the ipam/SVC-k8s-lcm label mandatory for the LCM subnet on new
deployments of management and managed bare metal clusters. It allows the
LCM Agent to correctly identify IP addresses to use on multi-homed bare metal
hosts. Therefore, you must add this label explicitly on new clusters.
Each node of every cluster must now have only one IP address in the LCM
network that is allocated from one of the Subnet objects having the
ipam/SVC-k8s-lcm label defined. Therefore, all Subnet objects used
for LCM networks must have the ipam/SVC-k8s-lcm label defined.
Note
For MOSK-based deployments, the feature support is available since MOSK 22.4.
Implemented the possibility to use flexible size units throughout bare
metal host profiles for management, regional, and managed clusters. For
example, you can now use either sizeGiB: 0.1 or size: 100Mi when
specifying a device size. The size without units is counted in bytes. For
example, size: 120 means 120 bytes.
Note
For MOSK-based deployments, the feature support is available since MOSK 22.4.
Completed integration of the man-in-the-middle (MITM) proxies support for offline deployments by adding AWS, vSphere, and Equinix Metal with private networking to the list of existing supported providers: OpenStack and bare metal.
With trusted proxy CA certificates that you can now add using the CA Certificate check box in the Add new Proxy window during a managed cluster creation, the feature allows monitoring all cluster traffic for security and audit purposes.
Note
For Azure and Equinix Metal with public networking, the feature is not supported
For MOSK-based deployments, the feature support will become available in one of the following Container Cloud releases.
Implemented the ability to configure TLS certificates for mcc-cache on
management or regional clusters and for MKE on managed clusters deployed or
updated by Container Cloud using the latest Cluster release.
Note
TLS certificates configuration for MKE is not supported:
For MOSK-based clusters
For attached MKE clusters that were not originally deployed by Container Cloud
On top of continuous improvements delivered to the existing Container Cloud
guides, added a document on how to increase the overall storage size for all
Ceph pools of the same device class: hdd, ssd, or nvme. For
details, see Increase Ceph cluster storage size.
The following issues have been addressed in the Mirantis Container Cloud release 2.20.0 along with the Cluster releases 11.4.0 and 7.10.0:
[25476] Fixed the timeout behavior to avoid Keepalived and HAProxy check failures.
[25076] Fixed the
remote_syslogconfiguration. Now, you can optionally define SSL verification modes. For details, see MOSK Operations Guide: StackLight configuration parameters - Logging to syslog.[24927] Fixed the issue wherein a failure to create
lcmclusterstatedid not trigger a retry.[24852] Fixed the issue wherein the Upgrade Schedule tab in the Container Cloud web UI was displaying the NOT ALLOWED label instead of ALLOWED if the upgrade was enabled.
[24837] Fixed the issue wherein some Keycloak
iam-keycloak-*pods were in theCrashLoopBackOffstate during an update of a baremetal-based management or managed cluster with enabled FIPs.[24813] Fixed the issue wherein the
IPaddrobjects were not reconciled after theipam/SVC-*labels changed on the parent subnet. This prevented theipam/SVC-*labels from propagating toIPaddrobjects and caused theserviceMapupdate to fail in the correspondingIpamHost.[23125] Fixed the issue wherein an OpenStack-based regional cluster creation in an offline mode was failing. Adding the Kubernetes load balancer address to the
NO_PROXYenvironment variable is no longer required.[22576] Fixed the issue wherein
provisioning-ansibledid not use thewipeflags during the deployment phase.[5238] Improved the Bastion readiness checks to avoid issues with some clusters having several Bastion nodes.
This section lists known issues with workarounds for the Mirantis Container Cloud release 2.20.0 including the Cluster releases 11.4.0 and 7.10.0.
For other issues that can occur while deploying and operating a Container Cloud cluster, see Troubleshooting Guide.
Note
This section also outlines still valid known issues from previous Container Cloud releases.
A managed cluster deployment, attachment, or update to a Cluster release with
MKE versions 3.3.13, 3.4.6, 3.5.1, or earlier may fail with the
compose pods flapping (ready > terminating > pending) and with the
following error message appearing in logs:
'not ready: deployments: kube-system/compose got 0/0 replicas, kube-system/compose-api
got 0/0 replicas'
ready: false
type: Kubernetes
Workaround:
Disable Docker Content Trust (DCT):
Access the MKE web UI as admin.
Navigate to Admin > Admin Settings.
In the left navigation pane, click Docker Content Trust and disable it.
Restart the affected deployments such as
calico-kube-controllers,compose,compose-api,coredns, and so on:kubectl -n kube-system delete deployment <deploymentName>
Once done, the cluster deployment or update resumes.
Re-enable DCT.
Deployment of a regional cluster based on bare metal or Equinix Metal with
private networking fails with mcc-cache Pods being stuck in the
CrashLoopBackOff status of restarts.
As a workaround, remove failed mcc-cache Pods to restart them
automatically. For example:
kubectl -n kaas delete pod mcc-cache-0
During deletion of a manager machine running the ironic Pod from a bare
metal management cluster, the following problems occur:
All Pods are stuck in the
TerminatingstateA new
ironicPod fails to startThe related bare metal host is stuck in the
deprovisioningstate
As a workaround, before deletion of the node running the ironic Pod,
cordon and drain the node using the kubectl cordon <nodeName> and
kubectl drain <nodeName> commands.
If a baremetal-based regional cluster deployment fails before pivoting is done, the corresponding region deletion fails.
Workaround:
Using the command below, manually delete all possible traces of the failed
regional cluster deployment, including but not limited to the following
objects that contain the kaas.mirantis.com/region label of the affected
region:
clustermachinebaremetalhostbaremetalhostprofilel2templatesubnetipamhostipaddr
kubectl delete <objectName> -l kaas.mirantis.com/region=<regionName>
Warning
Do not use the same region name again after the regional cluster deployment failure since some objects that reference the region name may still exist.
Deployment of a regional cluster based on bare metal or Equinix Metal with
private networking fails with mcc-cache Pods being stuck in the
CrashLoopBackOff status of restarts.
As a workaround, remove failed mcc-cache Pods to restart them
automatically. For example:
kubectl -n kaas delete pod mcc-cache-0
Deployment of RHEL machines using the Red Hat portal registration, which requires user and password credentials, over MITM proxy fails while building the virtual machines template with the following error:
Unable to verify server's identity: [SSL: CERTIFICATE_VERIFY_FAILED]
certificate verify failed (_ssl.c:618)
The Container Cloud deployment gets stuck while applying the RHEL license
to machines with the same error in the lcm-agent logs.
As a workaround, use the internal Red Hat Satellite server that a VM can access directly without a MITM proxy.
A low CPU limit 100m for kaas-exporter blocks metric collection.
As a workaround, increase the CPU limit for kaas-exporter to 500m
on the management cluster in the
spec:providerSpec:value:kaas:management:helmReleases: section as
described in {{ mos_name_abbr }} documentation: Underlay Kubernetes operations
- Increase memory limits for cluster components.
The OpenSearch elasticsearch.persistentVolumeClaimSize custom setting is
overwritten by logging.persistentVolumeClaimSize during deployment of a
Container Cloud cluster of any type and is set to the default 30Gi.
Note
This issue does not block the OpenSearch cluster operations if the default retention time is set. The default setting is usually enough for the capacity size of this cluster.
The issue may affect the following Cluster releases:
11.2.0 - 11.5.0
7.8.0 - 7.11.0
8.8.0 - 8.10.0, 12.5.0 (MOSK clusters)
10.2.4 - 10.8.1 (attached MKE 3.4.x clusters)
13.0.2 - 13.5.1 (attached MKE 3.5.x clusters)
To verify that the cluster is affected:
Note
In the commands below, substitute parameters enclosed in angle brackets to match the affected cluster values.
kubectl --kubeconfig=<managementClusterKubeconfigPath> \
-n <affectedClusterProjectName> \
get cluster <affectedClusterName> \
-o=jsonpath='{.spec.providerSpec.value.helmReleases[*].values.elasticsearch.persistentVolumeClaimSize}' | xargs echo config size:
kubectl --kubeconfig=<affectedClusterKubeconfigPath> \
-n stacklight get pvc -l 'app=opensearch-master' \
-o=jsonpath="{.items[*].status.capacity.storage}" | xargs echo capacity sizes:
The cluster is not affected if the configuration size value matches or is less than any capacity size. For example:
config size: 30Gi capacity sizes: 30Gi 30Gi 30Gi config size: 50Gi capacity sizes: 100Gi 100Gi 100Gi
The cluster is affected if the configuration size is larger than any capacity size. For example:
config size: 200Gi capacity sizes: 100Gi 100Gi 100Gi
Workaround for a new cluster creation:
Select from the following options:
For a management or regional cluster, during the bootstrap procedure, open
cluster.yaml.templatefor editing.For a managed cluster, open the
Clusterobject for editing.Caution
For a managed cluster, use the Container Cloud API instead of the web UI for cluster creation.
In the opened
.yamlfile, addlogging.persistentVolumeClaimSizealong withelasticsearch.persistentVolumeClaimSize. For example:apiVersion: cluster.k8s.io/v1alpha1 spec: ... providerSpec: value: ... helmReleases: - name: stacklight values: elasticsearch: persistentVolumeClaimSize: 100Gi logging: enabled: true persistentVolumeClaimSize: 100Gi
Continue the cluster deployment. The system will use the custom value set in
logging.persistentVolumeClaimSize.Caution
If
elasticsearch.persistentVolumeClaimSizeis absent in the.yamlfile, the Admission Controller blocks the configuration update.
Workaround for an existing cluster:
Caution
During the application of the below workarounds, a short outage of OpenSearch and its dependent components may occur with the following alerts firing on the cluster. This behavior is expected. Therefore, disregard these alerts.
StackLight alerts list firing during cluster update
Cluster size and outage probability level |
Alert name |
Label name and component |
|---|---|---|
Any cluster with high probability |
|
|
|
|
|
Large cluster with average probability |
|
|
|
n/a |
|
|
n/a |
|
|
n/a |
|
|
n/a |
|
Any cluster with low probability |
|
|
|
|
StackLight in HA mode with LVP provisioner for OpenSearch PVCs
Warning
After applying this workaround, the existing log data will be lost. Therefore, if required, migrate log data to a new persistent volume (PV).
Move the existing log data to a new PV, if required.
Increase the disk size for local volume provisioner (LVP).
Scale down the
opensearch-masterStatefulSet with dependent resources to 0 and disable theelasticsearch-curatorCronJob:kubectl -n stacklight scale --replicas 0 statefulset opensearch-master kubectl -n stacklight scale --replicas 0 deployment opensearch-dashboards kubectl -n stacklight scale --replicas 0 deployment metricbeat kubectl -n stacklight patch cronjobs elasticsearch-curator -p '{"spec" : {"suspend" : true }}'
Recreate the
opensearch-masterStatefulSet with the updated disk size.kubectl get statefulset opensearch-master -o yaml -n stacklight | sed 's/storage: 30Gi/storage: <pvcSize>/g' > opensearch-master.yaml kubectl -n stacklight delete statefulset opensearch-master kubectl create -f opensearch-master.yaml
Replace
<pvcSize>with theelasticsearch.persistentVolumeClaimSizevalue.Delete existing PVCs:
kubectl delete pvc -l 'app=opensearch-master' -n stacklight
Warning
This command removes all existing logs data from PVCs.
In the
Clusterconfiguration, set the samelogging.persistentVolumeClaimSizeas the size ofelasticsearch.persistentVolumeClaimSize. For example:apiVersion: cluster.k8s.io/v1alpha1 kind: Cluster spec: ... providerSpec: value: ... helmReleases: - name: stacklight values: elasticsearch: persistentVolumeClaimSize: 100Gi logging: enabled: true persistentVolumeClaimSize: 100Gi
Scale up the
opensearch-masterStatefulSet with dependent resources and enable theelasticsearch-curatorCronJob:kubectl -n stacklight scale --replicas 3 statefulset opensearch-master sleep 100 kubectl -n stacklight scale --replicas 1 deployment opensearch-dashboards kubectl -n stacklight scale --replicas 1 deployment metricbeat kubectl -n stacklight patch cronjobs elasticsearch-curator -p '{"spec" : {"suspend" : false }}'
StackLight in non-HA mode with an expandable StorageClass for
OpenSearch PVCs
Note
To verify whether a StorageClass is expandable:
kubectl -n stacklight get pvc | grep opensearch-master | awk '{print $6}' | xargs -I{} kubectl get storageclass {} -o yaml | grep 'allowVolumeExpansion: true'
A positive system response is allowVolumeExpansion: true. A negative
system response is blank or false.
Scale down the
opensearch-masterStatefulSet with dependent resources to 0 and disable theelasticsearch-curatorCronJob:kubectl -n stacklight scale --replicas 0 statefulset opensearch-master kubectl -n stacklight scale --replicas 0 deployment opensearch-dashboards kubectl -n stacklight scale --replicas 0 deployment metricbeat kubectl -n stacklight patch cronjobs elasticsearch-curator -p '{"spec" : {"suspend" : true }}'
Recreate the
opensearch-masterStatefulSet with the updated disk size.kubectl -n stacklight get statefulset opensearch-master -o yaml | sed 's/storage: 30Gi/storage: <pvc_size>/g' > opensearch-master.yaml kubectl -n stacklight delete statefulset opensearch-master kubectl create -f opensearch-master.yaml
Replace
<pvcSize>with theelasticsearch.persistentVolumeClaimSizevalue.Patch the PVCs with the new
elasticsearch.persistentVolumeClaimSizevalue:kubectl -n stacklight patch pvc opensearch-master-opensearch-master-0 -p '{ "spec": { "resources": { "requests": { "storage": "<pvc_size>" }}}}'
Replace
<pvcSize>with theelasticsearch.persistentVolumeClaimSizevalue.In the
Clusterconfiguration, setlogging.persistentVolumeClaimSizethe same as the size ofelasticsearch.persistentVolumeClaimSize. For example:apiVersion: cluster.k8s.io/v1alpha1 kind: Cluster spec: ... providerSpec: value: ... helmReleases: - name: stacklight values: elasticsearch: persistentVolumeClaimSize: 100Gi logging: enabled: true persistentVolumeClaimSize: 100Gi
Scale up the
opensearch-masterStatefulSet with dependent resources to1and enable theelasticsearch-curatorCronJob:kubectl -n stacklight scale --replicas 1 statefulset opensearch-master sleep 100 kubectl -n stacklight scale --replicas 1 deployment opensearch-dashboards kubectl -n stacklight scale --replicas 1 deployment metricbeat kubectl -n stacklight patch cronjobs elasticsearch-curator -p '{"spec" : {"suspend" : false }}'
StackLight in non-HA mode with a non-expandable StorageClass
and no LVP for OpenSearch PVCs
Warning
After applying this workaround, the existing log data will be lost. Depending on your custom provisioner, you may find a third-party tool, such as pv-migrate, that provides a possibility to copy all data from one PV to another.
If data loss is acceptable, proceed with the workaround below.
Note
To verify whether a StorageClass is expandable:
kubectl -n stacklight get pvc | grep opensearch-master | awk '{print $6}' | xargs -I{} kubectl get storageclass {} -o yaml | grep 'allowVolumeExpansion: true'
A positive system response is allowVolumeExpansion: true. A negative
system response is blank or false.
Scale down the
opensearch-masterStatefulSet with dependent resources to 0 and disable theelasticsearch-curatorCronJob:kubectl -n stacklight scale --replicas 0 statefulset opensearch-master kubectl -n stacklight scale --replicas 0 deployment opensearch-dashboards kubectl -n stacklight scale --replicas 0 deployment metricbeat kubectl -n stacklight patch cronjobs elasticsearch-curator -p '{"spec" : {"suspend" : true }}'
Recreate the
opensearch-masterStatefulSet with the updated disk size:kubectl get statefulset opensearch-master -o yaml -n stacklight | sed 's/storage: 30Gi/storage: <<pvc_size>>/g' > opensearch-master.yaml kubectl -n stacklight delete statefulset opensearch-master kubectl create -f opensearch-master.yaml
Replace
<pvcSize>with theelasticsearch.persistentVolumeClaimSizevalue.Delete existing PVCs:
kubectl delete pvc -l 'app=opensearch-master' -n stacklight
Warning
This command removes all existing logs data from PVCs.
In the
Clusterconfiguration, setlogging.persistentVolumeClaimSizeto the same value as the size of theelasticsearch.persistentVolumeClaimSizeparameter. For example:apiVersion: cluster.k8s.io/v1alpha1 kind: Cluster spec: ... providerSpec: value: ... helmReleases: - name: stacklight values: elasticsearch: persistentVolumeClaimSize: 100Gi logging: enabled: true persistentVolumeClaimSize: 100Gi
Scale up the
opensearch-masterStatefulSet with dependent resources to1and enable theelasticsearch-curatorCronJob:kubectl -n stacklight scale --replicas 1 statefulset opensearch-master sleep 100 kubectl -n stacklight scale --replicas 1 deployment opensearch-dashboards kubectl -n stacklight scale --replicas 1 deployment metricbeat kubectl -n stacklight patch cronjobs elasticsearch-curator -p '{"spec" : {"suspend" : false }}'
Custom settings for the deprecated elasticsearch.logstashRetentionTime
parameter are overwritten by the default setting set to 1 day.
The issue may affect the following Cluster releases with enabled
elasticsearch.logstashRetentionTime:
11.2.0 - 11.5.0
7.8.0 - 7.11.0
8.8.0 - 8.10.0, 12.5.0 (MOSK clusters)
10.2.4 - 10.8.1 (attached MKE 3.4.x clusters)
13.0.2 - 13.5.1 (attached MKE 3.5.x clusters)
As a workaround, in the Cluster object, replace
elasticsearch.logstashRetentionTime with elasticsearch.retentionTime
that was implemented to replace the deprecated parameter. For example:
apiVersion: cluster.k8s.io/v1alpha1
kind: Cluster
spec:
...
providerSpec:
value:
...
helmReleases:
- name: stacklight
values:
elasticsearch:
retentionTime:
logstash: 10
events: 10
notifications: 10
logging:
enabled: true
For the StackLight configuration procedure and parameters description, refer to StackLight configuration procedure.
Note
Moving forward, the workaround for this issue will be moved from Release Notes to Operations Guide: Troubleshoot StackLight.
On a managed cluster, the StackLight pods may get stuck with the
Pod predicate NodeAffinity failed error in the pod status. The issue may
occur if the StackLight node label was added to one machine and
then removed from another one.
The issue does not affect the StackLight services, all required StackLight pods migrate successfully except extra pods that are created and stuck during pod migration.
As a workaround, remove the stuck pods:
kubectl --kubeconfig <managedClusterKubeconfig> -n stacklight delete pod <stuckPodName>
The status section in the KaaSCephCluster.status CR does not reflect
issues during the process of a Ceph cluster deletion.
As a workaround, inspect Ceph Controller logs on the managed cluster:
kubectl --kubeconfig <managedClusterKubeconfig> -n ceph-lcm-mirantis logs <ceph-controller-pod-name>
Note
The issue does not reproduce since MOSK 25.2.
Update of a managed cluster based on bare metal and Ceph enabled fails with
PersistentVolumeClaim getting stuck in the Pending state for the
prometheus-server StatefulSet and the
MountVolume.MountDevice failed for volume warning in the StackLight event
logs.
Workaround:
Verify that the description of the Pods that failed to run contain the
FailedMountevents:kubectl -n <affectedProjectName> describe pod <affectedPodName>
In the command above, replace the following values:
<affectedProjectName>is the Container Cloud project name where the Pods failed to run<affectedPodName>is a Pod name that failed to run in the specified project
In the Pod description, identify the node name where the Pod failed to run.
Verify that the
csi-rbdpluginlogs of the affected node contain therbd volume mount failed: <csi-vol-uuid> is being usederror. The<csi-vol-uuid>is a unique RBD volume name.Identify
csiPodNameof the correspondingcsi-rbdplugin:kubectl -n rook-ceph get pod -l app=csi-rbdplugin \ -o jsonpath='{.items[?(@.spec.nodeName == "<nodeName>")].metadata.name}'
Output the affected
csiPodNamelogs:kubectl -n rook-ceph logs <csiPodName> -c csi-rbdplugin
Scale down the affected
StatefulSetorDeploymentof the Pod that fails to0replicas.On every
csi-rbdpluginPod, search for stuckcsi-vol:for pod in `kubectl -n rook-ceph get pods|grep rbdplugin|grep -v provisioner|awk '{print $1}'`; do echo $pod kubectl exec -it -n rook-ceph $pod -c csi-rbdplugin -- rbd device list | grep <csi-vol-uuid> done
Unmap the affected
csi-vol:rbd unmap -o force /dev/rbd<i>
The
/dev/rbd<i>value is a mapped RBD volume that usescsi-vol.Delete
volumeattachmentof the affected Pod:kubectl get volumeattachments | grep <csi-vol-uuid> kubectl delete volumeattacmhent <id>
Scale up the affected
StatefulSetorDeploymentback to the original number of replicas and wait until its state becomesRunning.
An upgrade of a Container Cloud management cluster with a custom Keycloak or web UI TLS certificate fails with the following example error:
failed to update management cluster: \
admission webhook "validations.kaas.mirantis.com" denied the request: \
failed to validate TLS spec for Cluster 'default/kaas-mgmt': \
desired hostname is not set for 'ui'
Workaround:
Verify that the tls section of the management cluster contains the
hostname and certificate fields for configured applications:
Open the management
Clusterobject for editing:kubectl edit cluster <mgmtClusterName>
Verify that the
tlssection contains the following fields:tls: keycloak: certificate: name: keycloak hostname: <keycloakHostName> tlsConfigRef: “” or “keycloak” ui: certificate: name: ui hostname: <webUIHostName> tlsConfigRef: “” or “ui”
Fixed in 7.11.0, 11.5.0 and 12.5.0
During attachment of an existing MKE cluster using the Container Cloud web UI, uploading of an MKE client bundle fails with a false-positive message about a successful uploading.
Workaround:
Select from the following options:
Fill in the required fields for the MKE client bundle manually.
In the Attach Existing MKE Cluster window, use upload MKE client bundle twice to upload
ucp.bundle-admin.zipanducp-docker-bundle.ziplocated in the first archive.
Fixed in 7.11.0, 11.5.0 and 12.5.0
During machine creation using the Container Cloud web UI, a custom value for a node label cannot be set.
As a workaround, manually add the value to
spec.providerSpec.value.nodeLabels in machine.yaml.
The following table lists the major components and their versions of the Mirantis Container Cloud release 2.20.0.
Note
The components that are newly added, updated, deprecated, or removed
as compared to the previous release version, are marked
with a corresponding superscript,
for example, lcm-ansible Updated.
Component |
Application/Service |
Version |
|---|---|---|
AWS Updated |
aws-provider |
1.33.5 |
aws-credentials-controller |
1.33.5 |
|
Azure Updated |
azure-provider |
1.33.5 |
azure-credentials-controller |
1.33.5 |
|
Bare metal |
ambassador |
1.20.1-alpine |
baremetal-operator Updated |
6.3.3 |
|
baremetal-public-api Updated |
6.3.3 |
|
baremetal-provider Updated |
1.33.5 |
|
baremetal-resource-controller Updated |
base-focal-20220627134752 |
|
ironic Updated |
yoga-focal-20220719132049 |
|
ironic-operator Removed |
n/a |
|
kaas-ipam |
base-focal-20220503165133 |
|
keepalived |
2.1.5 |
|
local-volume-provisioner |
2.5.0-mcp |
|
mariadb |
10.4.17-bionic-20220113085105 |
|
IAM Updated |
iam |
2.4.31 |
iam-controller |
1.33.5 |
|
keycloak |
18.0.0 |
|
Container Cloud |
admission-controller Updated |
1.33.5 |
agent-controller Updated |
1.33.5 |
|
byo-credentials-controller Updated |
1.33.5 |
|
byo-provider Updated |
1.33.5 |
|
ceph-kcc-controller Updated |
1.33.5 |
|
cert-manager Updated |
1.33.5 |
|
client-certificate-controller Updated |
1.33.5 |
|
golang |
1.17.6 |
|
event-controller Updated |
1.33.5 |
|
kaas-public-api Updated |
1.33.5 |
|
kaas-exporter Updated |
1.33.5 |
|
kaas-ui Updated |
1.33.6 |
|
lcm-controller Updated |
0.3.0-285-g8498abe0 |
|
license-controller Updated |
1.33.5 |
|
machinepool-controller Updated |
1.33.5 |
|
mcc-cache Updated |
1.33.5 |
|
portforward-controller Updated |
1.33.5 |
|
proxy-controller Updated |
1.33.5 |
|
rbac-controller Updated |
1.33.5 |
|
release-controller Updated |
1.33.5 |
|
rhellicense-controller Updated |
1.33.5 |
|
scope-controller Updated |
1.33.5 |
|
user-controller Updated |
1.33.5 |
|
Equinix Metal |
equinix-provider Updated |
1.33.5 |
equinix-credentials-controller Updated |
1.33.5 |
|
keepalived |
2.1.5 |
|
OpenStack Updated |
openstack-provider |
1.33.5 |
os-credentials-controller |
1.33.5 |
|
VMware vSphere |
vsphere-provider Updated |
1.33.7 |
vsphere-credentials-controller Updated |
1.33.5 |
|
keepalived |
2.1.5 |
|
squid-proxy |
0.0.1-6 |
This section lists the components artifacts of the Mirantis Container Cloud release 2.20.0.
Note
The components that are newly added, updated, deprecated, or removed
as compared to the previous release version, are marked
with a corresponding superscript,
for example, lcm-ansible Updated.
Artifact |
Component |
Path |
|---|---|---|
Binaries |
baremetal-operator Updated |
https://binary.mirantis.com/bm/helm/baremetal-operator-6.3.3.tgz |
baremetal-public-api Updated |
https://binary.mirantis.com/bm/helm/baremetal-public-api-6.3.3.tgz |
|
ironic-python-agent.initramfs Updated |
https://binary.mirantis.com/bm/bin/ironic/ipa/ubuntu/initramfs-yoga-focal-debug-20220801150933 |
|
ironic-python-agent.kernel Updated |
https://binary.mirantis.com/bm/bin/ironic/ipa/ubuntu/kernel-yoga-focal-debug-20220801150933 |
|
kaas-ipam Updated |
||
local-volume-provisioner |
https://binary.mirantis.com/bm/helm/local-volume-provisioner-2.5.0-mcp.tgz |
|
provisioning_ansible |
https://binary.mirantis.com/bm/bin/ansible/provisioning_ansible-0.1.1-104-6e2e82c.tgz |
|
target ubuntu system |
https://binary.mirantis.com/bm/bin/efi/ubuntu/tgz-bionic-20210622161844 |
|
Docker images |
ambassador |
mirantis.azurecr.io/general/external/docker.io/library/nginx:1.20.1-alpine |
baremetal-operator |
mirantis.azurecr.io/bm/baremetal-operator:base-focal-20220611131433 |
|
baremetal-resource-controller Updated |
mirantis.azurecr.io/bm/baremetal-resource-controller:base-focal-20220627134752 |
|
dynamic_ipxe Updated |
mirantis.azurecr.io/bm/dynamic-ipxe:base-focal-20220805114906 |
|
dnsmasq Updated |
mirantis.azurecr.io/bm/baremetal-dnsmasq:base-focal-20220705175454 |
|
dnsmasq-controller Updated |
mirantis.azurecr.io/bm/dnsmasq-controller:base-focal-20220704102028 |
|
ironic Updated |
mirantis.azurecr.io/openstack/ironic:yoga-focal-20220719132049 |
|
ironic-inspector Updated |
mirantis.azurecr.io/openstack/ironic-inspector:yoga-focal-20220719132049 |
|
ironic-operator Removed |
n/a |
|
ironic-prometheus-exporter |
mirantis.azurecr.io/stacklight/ironic-prometheus-exporter:0.1-20220602121226 |
|
kaas-ipam |
mirantis.azurecr.io/bm/kaas-ipam:base-focal-20220503165133 |
|
mariadb |
mirantis.azurecr.io/general/mariadb:10.4.17-bionic-20220113085105 |
|
mcc-keepalived |
mirantis.azurecr.io/lcm/mcc-keepalived:v0.14.0-1-g8725814 |
|
syslog-ng |
mirantis.azurecr.io/bm/syslog-ng:base-focal-20220128103433 |
Artifact |
Component |
Paths |
|---|---|---|
Bootstrap tarball Updated |
bootstrap-linux |
https://binary.mirantis.com/core/bin/bootstrap-linux-1.33.5.tar.gz |
bootstrap-darwin |
https://binary.mirantis.com/core/bin/bootstrap-darwin-1.33.5.tar.gz |
|
Helm charts Updated |
admission-controller |
https://binary.mirantis.com/core/helm/admission-controller-1.33.5.tgz |
agent-controller |
https://binary.mirantis.com/core/helm/agent-controller-1.33.5.tgz |
|
aws-credentials-controller |
https://binary.mirantis.com/core/helm/aws-credentials-controller-1.33.5.tgz |
|
aws-provider |
https://binary.mirantis.com/core/helm/aws-provider-1.33.5.tgz |
|
azure-credentials-controller |
https://binary.mirantis.com/core/helm/azure-credentials-controller-1.33.5.tgz |
|
azure-provider |
https://binary.mirantis.com/core/helm/azure-provider-1.33.5.tgz |
|
baremetal-provider |
https://binary.mirantis.com/core/helm/baremetal-provider-1.33.5.tgz |
|
byo-credentials-controller |
https://binary.mirantis.com/core/helm/byo-credentials-controller-1.33.5.tgz |
|
byo-provider |
https://binary.mirantis.com/core/helm/byo-provider-1.33.5.tgz |
|
ceph-kcc-controller |
https://binary.mirantis.com/core/helm/ceph-kcc-controller-1.33.5.tgz |
|
cert-manager |
https://binary.mirantis.com/core/helm/cert-manager-1.33.5.tgz |
|
client-certificate-controller |
https://binary.mirantis.com/core/helm/client-certificate-controller-1.33.5.tgz |
|
equinix-credentials-controller |
https://binary.mirantis.com/core/helm/equinix-credentials-controller-1.33.5.tgz |
|
equinix-provider |
https://binary.mirantis.com/core/helm/equinix-provider-1.33.5.tgz |
|
equinixmetalv2-provider |
https://binary.mirantis.com/core/helm/equinixmetalv2-provider-1.33.5.tgz |
|
event-controller |
https://binary.mirantis.com/core/helm/event-controller-1.33.5.tgz |
|
iam-controller |
https://binary.mirantis.com/core/helm/iam-controller-1.33.5.tgz |
|
kaas-exporter |
https://binary.mirantis.com/core/helm/kaas-exporter-1.33.5.tgz |
|
kaas-public-api |
https://binary.mirantis.com/core/helm/kaas-public-api-1.33.5.tgz |
|
kaas-ui |
||
lcm-controller |
https://binary.mirantis.com/core/helm/lcm-controller-1.33.5.tgz |
|
license-controller Updated |
https://binary.mirantis.com/core/helm/license-controller-1.33.5.tgz |
|
mcc-cache |
||
openstack-provider |
https://binary.mirantis.com/core/helm/openstack-provider-1.33.5.tgz |
|
os-credentials-controller |
https://binary.mirantis.com/core/helm/os-credentials-controller-1.33.5.tgz |
|
portforward-controller |
https://binary.mirantis.com/core/helm/portforward-controller-1.33.5.tgz |
|
proxy-controller |
https://binary.mirantis.com/core/helm/proxy-controller-1.33.5.tgz |
|
rbac-controller |
https://binary.mirantis.com/core/helm/rbac-controller-1.33.5.tgz |
|
release-controller |
https://binary.mirantis.com/core/helm/release-controller-1.33.5.tgz |
|
rhellicense-controller |
https://binary.mirantis.com/core/helm/rhellicense-controller-1.33.5.tgz |
|
scope-controller |
http://binary.mirantis.com/core/helm/scope-controller-1.33.5.tgz |
|
squid-proxy |
https://binary.mirantis.com/core/helm/squid-proxy-1.33.5.tgz |
|
vsphere-credentials-controller |
https://binary.mirantis.com/core/helm/vsphere-credentials-controller-1.33.5.tgz |
|
vsphere-provider |
https://binary.mirantis.com/core/helm/vsphere-provider-1.33.7.tgz |
|
user-controller |
https://binary.mirantis.com/core/helm/user-controller-1.33.5.tgz |
|
Docker images |
admission-controller Updated |
mirantis.azurecr.io/core/admission-controller:1.33.5 |
agent-controller Updated |
mirantis.azurecr.io/core/agent-controller:1.33.5 |
|
aws-cluster-api-controller Updated |
mirantis.azurecr.io/core/aws-cluster-api-controller:1.33.5 |
|
aws-credentials-controller Updated |
mirantis.azurecr.io/core/aws-credentials-controller:1.33.5 |
|
azure-cluster-api-controller Updated |
mirantis.azurecr.io/core/azure-cluster-api-controller:1.33.5 |
|
azure-credentials-controller Updated |
mirantis.azurecr.io/core/azure-credentials-controller:1.33.5 |
|
byo-cluster-api-controller Updated |
mirantis.azurecr.io/core/byo-cluster-api-controller:1.33.5 |
|
byo-credentials-controller Updated |
mirantis.azurecr.io/core/byo-credentials-controller:1.33.5 |
|
ceph-kcc-controller Updated |
mirantis.azurecr.io/core/ceph-kcc-controller:1.33.5 |
|
cert-manager-controller |
mirantis.azurecr.io/core/external/cert-manager-controller:v1.6.1 |
|
client-certificate-controller Updated |
mirantis.azurecr.io/core/client-certificate-controller:1.33.5 |
|
cluster-api-provider-baremetal Updated |
mirantis.azurecr.io/core/cluster-api-provider-baremetal:1.33.5 |
|
cluster-api-provider-equinix Updated |
mirantis.azurecr.io/core/equinix-cluster-api-controller:1.33.5 |
|
equinix-credentials-controller Updated |
mirantis.azurecr.io/core/equinix-credentials-controller:1.33.5 |
|
frontend Updated |
mirantis.azurecr.io/core/frontend:1.33.5 |
|
haproxy |
mirantis.azurecr.io/lcm/mcc-haproxy:v0.17.0-8-g6ca89d5 |
|
iam-controller Updated |
mirantis.azurecr.io/core/iam-controller:1.33.5 |
|
kproxy Updated |
mirantis.azurecr.io/core/kproxy:1.33.5 |
|
lcm-controller Updated |
mirantis.azurecr.io/lcm/lcm-controller:v0.3.0-285-g8498abe0 |
|
license-controller Updated |
mirantis.azurecr.io/core/license-controller:1.33.5 |
|
mcc-keepalived |
mirantis.azurecr.io/lcm/mcc-keepalived:v0.14.0-1-g8725814 |
|
openstack-cluster-api-controller Updated |
mirantis.azurecr.io/core/openstack-cluster-api-controller:1.33.5 |
|
os-credentials-controller Updated |
mirantis.azurecr.io/core/os-credentials-controller:1.33.5 |
|
portforward-controller Updated |
mirantis.azurecr.io/core/portforward-controller:1.33.5 |
|
rbac-controller Updated |
mirantis.azurecr.io/core/rbac-controller:1.33.5 |
|
registry |
mirantis.azurecr.io/lcm/registry:2.7.1 |
|
release-controller Updated |
mirantis.azurecr.io/core/release-controller:1.33.5 |
|
rhellicense-controller Updated |
mirantis.azurecr.io/core/rhellicense-controller:1.33.5 |
|
scope-controller Updated |
mirantis.azurecr.io/core/scope-controller:1.33.5 |
|
squid-proxy |
mirantis.azurecr.io/lcm/squid-proxy:0.0.1-6 |
|
vsphere-cluster-api-controller Updated |
mirantis.azurecr.io/core/vsphere-cluster-api-controller:1.33.5 |
|
vsphere-credentials-controller Updated |
mirantis.azurecr.io/core/vsphere-credentials-controller:1.33.5 |
|
user-controller Updated |
mirantis.azurecr.io/core/user-controller:1.33.5 |
Artifact |
Component |
Path |
|---|---|---|
Binaries |
hash-generate-linux |
http://binary.mirantis.com/iam/bin/hash-generate-0.0.1-268-3cf7f17-linux |
hash-generate-darwin |
http://binary.mirantis.com/iam/bin/hash-generate-0.0.1-268-3cf7f17-darwin |
|
Helm charts Updated |
iam |
|
iam-proxy |
||
keycloak_proxy |
http://binary.mirantis.com/core/helm/keycloak_proxy-1.33.5.tgz |
|
Docker images |
kubernetes-entrypoint |
mirantis.azurecr.io/iam/external/kubernetes-entrypoint:v0.3.1 |
mariadb |
mirantis.azurecr.io/general/mariadb:10.4.16-bionic-20201105025052 |
|
keycloak Updated |
mirantis.azurecr.io/iam/keycloak:0.5.10 |
|
keycloak-gatekeeper |
mirantis.azurecr.io/iam/keycloak-gatekeeper:7.1.3-2 |
The Mirantis Container Cloud GA release 2.19.0:
Introduces support for the Cluster release 11.3.0 that is based on Mirantis Container Runtime 20.10.11 and Mirantis Kubernetes Engine 3.5.3 with Kubernetes 1.21.
Introduces support for the Cluster release 7.9.0 that is based on Mirantis Container Runtime 20.10.11 and Mirantis Kubernetes Engine 3.4.9 with Kubernetes 1.20.
Supports the Cluster release 8.8.0 that is based on the Cluster release 7.8.0 and represents Mirantis OpenStack for Kubernetes (MOSK) 22.3.
Does not support greenfield deployments on deprecated Cluster releases 11.2.0, 8.6.0, and 7.8.0. Use the latest Cluster releases of the series instead.
Caution
Make sure to update the Cluster release version of your managed cluster before the current Cluster release version becomes unsupported by a new Container Cloud release version. Otherwise, Container Cloud stops auto-upgrade and eventually Container Cloud itself becomes unsupported.
This section outlines release notes for the Container Cloud release 2.19.0.
This section outlines new features and enhancements introduced in the Mirantis Container Cloud release 2.19.0. For the list of enhancements in the Cluster releases 11.3.0 and 7.9.0 that are introduced by the Container Cloud release 2.19.0, see the Cluster releases.
Implemented full support for the upgrade sequence of machines that allows prioritized machines to be upgraded first. You can now set the upgrade index on an existing machine or machine pool using the Container Cloud web UI.
Consider the following upgrade index specifics:
The first machine to upgrade is always one of the control plane machines with the lowest
upgradeIndex. Other control plane machines are upgraded one by one according to their upgrade indexes.If the
ClusterspecdedicatedControlPlanefield isfalse, worker machines are upgraded only after the upgrade of all control plane machines finishes. Otherwise, they are upgraded after the first control plane machine, concurrently with other control plane machines.If several machines have the same upgrade index, they have the same priority during upgrade.
If the value is not set, the machine is automatically assigned a value of the upgrade index.
TechPreview
Implemented the Boot From Volume option for the OpenStack machine creation wizard in the Container Cloud web UI. The feature allows booting OpenStack-based machines from a block storage volume.
The feature is beneficial for clouds that do not have enough space on hypervisors. After enabling this option, the Cinder storage is used instead of the Nova storage.
TechPreview
Enabled the ability to modify existing network configuration on running bare metal clusters with a mandatory approval of new settings by an Infrastructure Operator. This validation is required to prevent accidental cluster failures due to misconfiguration.
After you make necessary network configuration changes in the required L2
template, you now need to approve the changes by setting the
spec.netconfigUpdateAllow:true flag in each affected IpamHost object.
Caution
For MKE clusters that are part of MOSK infrastructure, the feature support will become available in one of the following Container Cloud releases.
Implemented a new format of log entries for cluster and machine logs of a management cluster. Each log entry now contains a request ID that identifies chronology of actions performed on a cluster or machine. The feature applies to all supported cloud providers.
The new format is <providerType>.<objectName>.req:<requestID>.
For example, bm.machine.req:374, bm.cluster.req:172.
<providerType>- provider name, possible values:aws,azure,os,bm,vsphere,equinix.<objectName>- name of an object being processed by provider, possible values:cluster,machine.<requestID>- request ID number that increases when a provider receives a request from Kubernetes about creating, updating, deleting an object. The request ID allows combining all operations performed with an object within one request. For example, the result of a machine creation, update of its statuses, and so on.
Implemented the --extended flag for collecting the extended version of
logs that contains system and MKE logs, logs from LCM Ansible and LCM Agent
along with cluster events and Kubernetes resources description and logs.
You can use this flag to collect logs on any cluster type.
Learn more
Added the Distribution field to the bare metal machine creation wizard in the Container Cloud web UI. The default operating system in the distribution list is Ubuntu 20.04.
Caution
Do not use the outdated Ubuntu 18.04 distribution on greenfield deployments but only on existing clusters based on Ubuntu 18.04.
After switching all remaining OpenStack Helm releases from v2 to v3, dropped support for Helm v2 in Helm Controller and removed the Tiller image for all related components.
The following issues have been addressed in the Mirantis Container Cloud release 2.19.0 along with the Cluster releases 11.3.0 and 7.9.0:
[16379, 23865] Fixed the issue that caused an Equinix-based management or managed cluster update to fail with the FailedAttachVolume and FailedMount warnings.
[24286] Fixed the issue wherein creation of a new Equinix-based managed cluster failed due to failure to release a new vRouter ID.
[24722] Fixed the issue that caused Ceph clusters to be broken on Equinix-based managed clusters deployed on a Container Cloud instance with a non-default (different from
region-one) region configured.[24806] Fixed the issue wherein the
dhcp-option=tagparameters were not applied todnsmasq.confduring the bootstrap of a bare metal management cluster with a multi-rack topology.[17778] Fixed the issue wherein the Container Cloud web UI displayed the new release version while update for some nodes was still in progress.
[24676] Fixed the issue wherein the deployment of an Equinix-based management cluster failed with the following error message:
Failed waiting for OIDC configuration readiness: timed out waiting for the condition
[25050] For security reasons, disabled the deprecated TLS v1.0 and v1.1 for the
mcc-cacheandkaas-uiContainer Cloud services.[25256] Optimized the number of simultaneous connections to etcd to be open during configuration of Calico policies.
[24914] Fixed the issue wherein Helm Controller was getting stuck during readiness checks due to the timeout for
helmclientbeing not set.[24317] Fixed a number of security vulnerabilities in the Container Cloud Docker images:
Updated the following Docker images to fix CVE-2022-24407 and CVE-2022-0778:
admission-controller
agent-controller
aws-cluster-api-controller
aws-credentials-controller
azure-cluster-api-controller
azure-credentials-controller
bootstrap-controller
byo-cluster-api-controller
byo-credentials-controller
ceph-kcc-controller
cluster-api-provider-baremetal
equinix-cluster-api-controller
equinix-credentials-controller
event-controller
iam-controller
imc-sync
kaas-exporter
kproxy
license-controller
machinepool-controller
openstack-cluster-api-controller
os-credentials-controller
portforward-controller
proxy-controller
rbac-controller
release-controller
rhellicense-controller
scope-controller
storage-discovery
user-controller
vsphere-cluster-api-controller
vsphere-credentials-controller
Updated
aws-ebs-csi-driverto fix the following Amazon Linux Security Advisories:Updated
keycloakto fix the following security vulnerabilities:Updated
busybox,iam/api,iam/helm, andnginxto fix CVE-2022-28391Updated
frontendto fix CVE-2022-27404Updated
kube-proxyto fix CVE-2022-1292
This section lists known issues with workarounds for the Mirantis Container Cloud release 2.19.0 including the Cluster releases 11.3.0 and 7.9.0.
For other issues that can occur while deploying and operating a Container Cloud cluster, see Troubleshooting Guide.
Note
This section also outlines still valid known issues from previous Container Cloud releases.
A managed cluster deployment, attachment, or update to a Cluster release with
MKE versions 3.3.13, 3.4.6, 3.5.1, or earlier may fail with the
compose pods flapping (ready > terminating > pending) and with the
following error message appearing in logs:
'not ready: deployments: kube-system/compose got 0/0 replicas, kube-system/compose-api
got 0/0 replicas'
ready: false
type: Kubernetes
Workaround:
Disable Docker Content Trust (DCT):
Access the MKE web UI as admin.
Navigate to Admin > Admin Settings.
In the left navigation pane, click Docker Content Trust and disable it.
Restart the affected deployments such as
calico-kube-controllers,compose,compose-api,coredns, and so on:kubectl -n kube-system delete deployment <deploymentName>
Once done, the cluster deployment or update resumes.
Re-enable DCT.
During deletion of a manager machine running the ironic Pod from a bare
metal management cluster, the following problems occur:
All Pods are stuck in the
TerminatingstateA new
ironicPod fails to startThe related bare metal host is stuck in the
deprovisioningstate
As a workaround, before deletion of the node running the ironic Pod,
cordon and drain the node using the kubectl cordon <nodeName> and
kubectl drain <nodeName> commands.
If a baremetal-based regional cluster deployment fails before pivoting is done, the corresponding region deletion fails.
Workaround:
Using the command below, manually delete all possible traces of the failed
regional cluster deployment, including but not limited to the following
objects that contain the kaas.mirantis.com/region label of the affected
region:
clustermachinebaremetalhostbaremetalhostprofilel2templatesubnetipamhostipaddr
kubectl delete <objectName> -l kaas.mirantis.com/region=<regionName>
Warning
Do not use the same region name again after the regional cluster deployment failure since some objects that reference the region name may still exist.
The OpenSearch elasticsearch.persistentVolumeClaimSize custom setting is
overwritten by logging.persistentVolumeClaimSize during deployment of a
Container Cloud cluster of any type and is set to the default 30Gi.
Note
This issue does not block the OpenSearch cluster operations if the default retention time is set. The default setting is usually enough for the capacity size of this cluster.
The issue may affect the following Cluster releases:
11.2.0 - 11.5.0
7.8.0 - 7.11.0
8.8.0 - 8.10.0, 12.5.0 (MOSK clusters)
10.2.4 - 10.8.1 (attached MKE 3.4.x clusters)
13.0.2 - 13.5.1 (attached MKE 3.5.x clusters)
To verify that the cluster is affected:
Note
In the commands below, substitute parameters enclosed in angle brackets to match the affected cluster values.
kubectl --kubeconfig=<managementClusterKubeconfigPath> \
-n <affectedClusterProjectName> \
get cluster <affectedClusterName> \
-o=jsonpath='{.spec.providerSpec.value.helmReleases[*].values.elasticsearch.persistentVolumeClaimSize}' | xargs echo config size:
kubectl --kubeconfig=<affectedClusterKubeconfigPath> \
-n stacklight get pvc -l 'app=opensearch-master' \
-o=jsonpath="{.items[*].status.capacity.storage}" | xargs echo capacity sizes:
The cluster is not affected if the configuration size value matches or is less than any capacity size. For example:
config size: 30Gi capacity sizes: 30Gi 30Gi 30Gi config size: 50Gi capacity sizes: 100Gi 100Gi 100Gi
The cluster is affected if the configuration size is larger than any capacity size. For example:
config size: 200Gi capacity sizes: 100Gi 100Gi 100Gi
Workaround for a new cluster creation:
Select from the following options:
For a management or regional cluster, during the bootstrap procedure, open
cluster.yaml.templatefor editing.For a managed cluster, open the
Clusterobject for editing.Caution
For a managed cluster, use the Container Cloud API instead of the web UI for cluster creation.
In the opened
.yamlfile, addlogging.persistentVolumeClaimSizealong withelasticsearch.persistentVolumeClaimSize. For example:apiVersion: cluster.k8s.io/v1alpha1 spec: ... providerSpec: value: ... helmReleases: - name: stacklight values: elasticsearch: persistentVolumeClaimSize: 100Gi logging: enabled: true persistentVolumeClaimSize: 100Gi
Continue the cluster deployment. The system will use the custom value set in
logging.persistentVolumeClaimSize.Caution
If
elasticsearch.persistentVolumeClaimSizeis absent in the.yamlfile, the Admission Controller blocks the configuration update.
Workaround for an existing cluster:
Caution
During the application of the below workarounds, a short outage of OpenSearch and its dependent components may occur with the following alerts firing on the cluster. This behavior is expected. Therefore, disregard these alerts.
StackLight alerts list firing during cluster update
Cluster size and outage probability level |
Alert name |
Label name and component |
|---|---|---|
Any cluster with high probability |
|
|
|
|
|
Large cluster with average probability |
|
|
|
n/a |
|
|
n/a |
|
|
n/a |
|
|
n/a |
|
Any cluster with low probability |
|
|
|
|
StackLight in HA mode with LVP provisioner for OpenSearch PVCs
Warning
After applying this workaround, the existing log data will be lost. Therefore, if required, migrate log data to a new persistent volume (PV).
Move the existing log data to a new PV, if required.
Increase the disk size for local volume provisioner (LVP).
Scale down the
opensearch-masterStatefulSet with dependent resources to 0 and disable theelasticsearch-curatorCronJob:kubectl -n stacklight scale --replicas 0 statefulset opensearch-master kubectl -n stacklight scale --replicas 0 deployment opensearch-dashboards kubectl -n stacklight scale --replicas 0 deployment metricbeat kubectl -n stacklight patch cronjobs elasticsearch-curator -p '{"spec" : {"suspend" : true }}'
Recreate the
opensearch-masterStatefulSet with the updated disk size.kubectl get statefulset opensearch-master -o yaml -n stacklight | sed 's/storage: 30Gi/storage: <pvcSize>/g' > opensearch-master.yaml kubectl -n stacklight delete statefulset opensearch-master kubectl create -f opensearch-master.yaml
Replace
<pvcSize>with theelasticsearch.persistentVolumeClaimSizevalue.Delete existing PVCs:
kubectl delete pvc -l 'app=opensearch-master' -n stacklight
Warning
This command removes all existing logs data from PVCs.
In the
Clusterconfiguration, set the samelogging.persistentVolumeClaimSizeas the size ofelasticsearch.persistentVolumeClaimSize. For example:apiVersion: cluster.k8s.io/v1alpha1 kind: Cluster spec: ... providerSpec: value: ... helmReleases: - name: stacklight values: elasticsearch: persistentVolumeClaimSize: 100Gi logging: enabled: true persistentVolumeClaimSize: 100Gi
Scale up the
opensearch-masterStatefulSet with dependent resources and enable theelasticsearch-curatorCronJob:kubectl -n stacklight scale --replicas 3 statefulset opensearch-master sleep 100 kubectl -n stacklight scale --replicas 1 deployment opensearch-dashboards kubectl -n stacklight scale --replicas 1 deployment metricbeat kubectl -n stacklight patch cronjobs elasticsearch-curator -p '{"spec" : {"suspend" : false }}'
StackLight in non-HA mode with an expandable StorageClass for
OpenSearch PVCs
Note
To verify whether a StorageClass is expandable:
kubectl -n stacklight get pvc | grep opensearch-master | awk '{print $6}' | xargs -I{} kubectl get storageclass {} -o yaml | grep 'allowVolumeExpansion: true'
A positive system response is allowVolumeExpansion: true. A negative
system response is blank or false.
Scale down the
opensearch-masterStatefulSet with dependent resources to 0 and disable theelasticsearch-curatorCronJob:kubectl -n stacklight scale --replicas 0 statefulset opensearch-master kubectl -n stacklight scale --replicas 0 deployment opensearch-dashboards kubectl -n stacklight scale --replicas 0 deployment metricbeat kubectl -n stacklight patch cronjobs elasticsearch-curator -p '{"spec" : {"suspend" : true }}'
Recreate the
opensearch-masterStatefulSet with the updated disk size.kubectl -n stacklight get statefulset opensearch-master -o yaml | sed 's/storage: 30Gi/storage: <pvc_size>/g' > opensearch-master.yaml kubectl -n stacklight delete statefulset opensearch-master kubectl create -f opensearch-master.yaml
Replace
<pvcSize>with theelasticsearch.persistentVolumeClaimSizevalue.Patch the PVCs with the new
elasticsearch.persistentVolumeClaimSizevalue:kubectl -n stacklight patch pvc opensearch-master-opensearch-master-0 -p '{ "spec": { "resources": { "requests": { "storage": "<pvc_size>" }}}}'
Replace
<pvcSize>with theelasticsearch.persistentVolumeClaimSizevalue.In the
Clusterconfiguration, setlogging.persistentVolumeClaimSizethe same as the size ofelasticsearch.persistentVolumeClaimSize. For example:apiVersion: cluster.k8s.io/v1alpha1 kind: Cluster spec: ... providerSpec: value: ... helmReleases: - name: stacklight values: elasticsearch: persistentVolumeClaimSize: 100Gi logging: enabled: true persistentVolumeClaimSize: 100Gi
Scale up the
opensearch-masterStatefulSet with dependent resources to1and enable theelasticsearch-curatorCronJob:kubectl -n stacklight scale --replicas 1 statefulset opensearch-master sleep 100 kubectl -n stacklight scale --replicas 1 deployment opensearch-dashboards kubectl -n stacklight scale --replicas 1 deployment metricbeat kubectl -n stacklight patch cronjobs elasticsearch-curator -p '{"spec" : {"suspend" : false }}'
StackLight in non-HA mode with a non-expandable StorageClass
and no LVP for OpenSearch PVCs
Warning
After applying this workaround, the existing log data will be lost. Depending on your custom provisioner, you may find a third-party tool, such as pv-migrate, that provides a possibility to copy all data from one PV to another.
If data loss is acceptable, proceed with the workaround below.
Note
To verify whether a StorageClass is expandable:
kubectl -n stacklight get pvc | grep opensearch-master | awk '{print $6}' | xargs -I{} kubectl get storageclass {} -o yaml | grep 'allowVolumeExpansion: true'
A positive system response is allowVolumeExpansion: true. A negative
system response is blank or false.
Scale down the
opensearch-masterStatefulSet with dependent resources to 0 and disable theelasticsearch-curatorCronJob:kubectl -n stacklight scale --replicas 0 statefulset opensearch-master kubectl -n stacklight scale --replicas 0 deployment opensearch-dashboards kubectl -n stacklight scale --replicas 0 deployment metricbeat kubectl -n stacklight patch cronjobs elasticsearch-curator -p '{"spec" : {"suspend" : true }}'
Recreate the
opensearch-masterStatefulSet with the updated disk size:kubectl get statefulset opensearch-master -o yaml -n stacklight | sed 's/storage: 30Gi/storage: <<pvc_size>>/g' > opensearch-master.yaml kubectl -n stacklight delete statefulset opensearch-master kubectl create -f opensearch-master.yaml
Replace
<pvcSize>with theelasticsearch.persistentVolumeClaimSizevalue.Delete existing PVCs:
kubectl delete pvc -l 'app=opensearch-master' -n stacklight
Warning
This command removes all existing logs data from PVCs.
In the
Clusterconfiguration, setlogging.persistentVolumeClaimSizeto the same value as the size of theelasticsearch.persistentVolumeClaimSizeparameter. For example:apiVersion: cluster.k8s.io/v1alpha1 kind: Cluster spec: ... providerSpec: value: ... helmReleases: - name: stacklight values: elasticsearch: persistentVolumeClaimSize: 100Gi logging: enabled: true persistentVolumeClaimSize: 100Gi
Scale up the
opensearch-masterStatefulSet with dependent resources to1and enable theelasticsearch-curatorCronJob:kubectl -n stacklight scale --replicas 1 statefulset opensearch-master sleep 100 kubectl -n stacklight scale --replicas 1 deployment opensearch-dashboards kubectl -n stacklight scale --replicas 1 deployment metricbeat kubectl -n stacklight patch cronjobs elasticsearch-curator -p '{"spec" : {"suspend" : false }}'
Custom settings for the deprecated elasticsearch.logstashRetentionTime
parameter are overwritten by the default setting set to 1 day.
The issue may affect the following Cluster releases with enabled
elasticsearch.logstashRetentionTime:
11.2.0 - 11.5.0
7.8.0 - 7.11.0
8.8.0 - 8.10.0, 12.5.0 (MOSK clusters)
10.2.4 - 10.8.1 (attached MKE 3.4.x clusters)
13.0.2 - 13.5.1 (attached MKE 3.5.x clusters)
As a workaround, in the Cluster object, replace
elasticsearch.logstashRetentionTime with elasticsearch.retentionTime
that was implemented to replace the deprecated parameter. For example:
apiVersion: cluster.k8s.io/v1alpha1
kind: Cluster
spec:
...
providerSpec:
value:
...
helmReleases:
- name: stacklight
values:
elasticsearch:
retentionTime:
logstash: 10
events: 10
notifications: 10
logging:
enabled: true
For the StackLight configuration procedure and parameters description, refer to StackLight configuration procedure.
Note
Moving forward, the workaround for this issue will be moved from Release Notes to Operations Guide: Troubleshoot StackLight.
On a managed cluster, the StackLight pods may get stuck with the
Pod predicate NodeAffinity failed error in the pod status. The issue may
occur if the StackLight node label was added to one machine and
then removed from another one.
The issue does not affect the StackLight services, all required StackLight pods migrate successfully except extra pods that are created and stuck during pod migration.
As a workaround, remove the stuck pods:
kubectl --kubeconfig <managedClusterKubeconfig> -n stacklight delete pod <stuckPodName>
Fixed in 7.11.0, 11.5.0 and 12.5.0
During attachment of an existing MKE cluster using the Container Cloud web UI, uploading of an MKE client bundle fails with a false-positive message about a successful uploading.
Workaround:
Select from the following options:
Fill in the required fields for the MKE client bundle manually.
In the Attach Existing MKE Cluster window, use upload MKE client bundle twice to upload
ucp.bundle-admin.zipanducp-docker-bundle.ziplocated in the first archive.
Fixed in 7.11.0, 11.5.0 and 12.5.0
During machine creation using the Container Cloud web UI, a custom value for a node label cannot be set.
As a workaround, manually add the value to
spec.providerSpec.value.nodeLabels in machine.yaml.
The following table lists the major components and their versions of the Mirantis Container Cloud release 2.19.0.
Note
The components that are newly added, updated, deprecated, or removed
as compared to the previous release version, are marked
with a corresponding superscript,
for example, lcm-ansible Updated.
Component |
Application/Service |
Version |
|---|---|---|
AWS Updated |
aws-provider |
1.32.4 |
aws-credentials-controller |
1.32.4 |
|
Azure Updated |
azure-provider |
1.32.4 |
azure-credentials-controller |
1.32.4 |
|
Bare metal |
ambassador |
1.20.1-alpine |
baremetal-operator Updated |
6.2.8 |
|
baremetal-public-api Updated |
6.2.8 |
|
baremetal-provider Updated |
1.32.4 |
|
baremetal-resource-controller Updated |
base-focal-20220530195224 |
|
ironic Updated |
xena-focal-20220603085546 |
|
ironic-operator Updated |
base-focal-20220605090941 |
|
kaas-ipam Updated |
base-focal-20220503165133 |
|
keepalived |
2.1.5 |
|
local-volume-provisioner |
2.5.0-mcp |
|
mariadb |
10.4.17-bionic-20220113085105 |
|
IAM |
iam Updated |
2.4.29 |
iam-controller Updated |
1.32.4 |
|
keycloak |
16.1.1 |
|
Container Cloud |
admission-controller Updated |
1.32.10 |
agent-controller Updated |
1.32.4 |
|
byo-credentials-controller Updated |
1.32.4 |
|
byo-provider Updated |
1.32.4 |
|
ceph-kcc-controller Updated |
1.32.8 |
|
cert-manager Updated |
1.32.4 |
|
client-certificate-controller Updated |
1.32.4 |
|
event-controller Updated |
1.32.4 |
|
golang |
1.17.6 |
|
kaas-public-api Updated |
1.32.4 |
|
kaas-exporter Updated |
1.32.4 |
|
kaas-ui Updated |
1.32.10 |
|
lcm-controller Updated |
0.3.0-257-ga93244da |
|
license-controller Updated |
1.32.4 |
|
machinepool-controller Updated |
1.32.4 |
|
mcc-cache Updated |
1.32.4 |
|
portforward-controller Updated |
1.32.4 |
|
proxy-controller Updated |
1.32.4 |
|
rbac-controller Updated |
1.32.4 |
|
release-controller Updated |
1.32.4 |
|
rhellicense-controller Updated |
1.32.4 |
|
scope-controller Updated |
1.32.4 |
|
user-controller Updated |
1.32.4 |
|
Equinix Metal |
equinix-provider Updated |
1.32.4 |
equinix-credentials-controller Updated |
1.32.4 |
|
keepalived |
2.1.5 |
|
OpenStack Updated |
openstack-provider |
1.32.4 |
os-credentials-controller |
1.32.4 |
|
VMware vSphere |
vsphere-provider Updated |
1.32.4 |
vsphere-credentials-controller Updated |
1.32.4 |
|
keepalived |
2.1.5 |
|
squid-proxy |
0.0.1-6 |
This section lists the components artifacts of the Mirantis Container Cloud release 2.19.0.
Note
The components that are newly added, updated, deprecated, or removed
as compared to the previous release version, are marked
with a corresponding superscript,
for example, lcm-ansible Updated.
Artifact |
Component |
Path |
|---|---|---|
Binaries |
baremetal-operator Updated |
https://binary.mirantis.com/bm/helm/baremetal-operator-6.2.8.tgz |
baremetal-public-api Updated |
https://binary.mirantis.com/bm/helm/baremetal-public-api-6.2.8.tgz |
|
ironic-python-agent.initramfs |
https://binary.mirantis.com/bm/bin/ironic/ipa/ubuntu/initramfs-xena-focal-debug-20220512084815 |
|
ironic-python-agent.kernel |
https://binary.mirantis.com/bm/bin/ironic/ipa/ubuntu/kernel-xena-focal-debug-20220512084815 |
|
kaas-ipam Updated |
||
local-volume-provisioner |
https://binary.mirantis.com/bm/helm/local-volume-provisioner-2.5.0-mcp.tgz |
|
provisioning_ansible |
https://binary.mirantis.com/bm/bin/ansible/provisioning_ansible-0.1.1-104-6e2e82c.tgz |
|
target ubuntu system |
https://binary.mirantis.com/bm/bin/efi/ubuntu/tgz-bionic-20210622161844 |
|
Docker images |
ambassador |
mirantis.azurecr.io/general/external/docker.io/library/nginx:1.20.1-alpine |
baremetal-operator Updated |
mirantis.azurecr.io/bm/baremetal-operator:base-focal-20220611131433 |
|
baremetal-resource-controller Updated |
mirantis.azurecr.io/bm/baremetal-resource-controller:base-focal-20220530195224 |
|
dynamic_ipxe |
mirantis.azurecr.io/bm/dynamic-ipxe:base-focal-20220429170829 |
|
dnsmasq Updated |
mirantis.azurecr.io/bm/baremetal-dnsmasq:base-focal-20220518104155 |
|
dnsmasq-controller Updated |
mirantis.azurecr.io/bm/dnsmasq-controller:base-focal-20220620190158 |
|
ironic Updated |
mirantis.azurecr.io/openstack/ironic:xena-focal-20220603085546 |
|
ironic-inspector Updated |
mirantis.azurecr.io/openstack/ironic-inspector:xena-focal-20220603085546 |
|
ironic-operator Updated |
mirantis.azurecr.io/bm/ironic-operator:base-focal-20220605090941 |
|
ironic-prometheus-exporter Updated |
mirantis.azurecr.io/stacklight/ironic-prometheus-exporter:0.1-20220602121226 |
|
kaas-ipam Updated |
mirantis.azurecr.io/bm/kaas-ipam:base-focal-20220503165133 |
|
mariadb |
mirantis.azurecr.io/general/mariadb:10.4.17-bionic-20220113085105 |
|
mcc-keepalived |
mirantis.azurecr.io/lcm/mcc-keepalived:v0.14.0-1-g8725814 |
|
syslog-ng |
mirantis.azurecr.io/bm/syslog-ng:base-focal-20220128103433 |
Artifact |
Component |
Paths |
|---|---|---|
Bootstrap tarball Updated |
bootstrap-linux |
https://binary.mirantis.com/core/bin/bootstrap-linux-1.32.4.tar.gz |
bootstrap-darwin |
https://binary.mirantis.com/core/bin/bootstrap-darwin-1.32.4.tar.gz |
|
Helm charts Updated |
admission-controller |
https://binary.mirantis.com/core/helm/admission-controller-1.32.10.tgz |
agent-controller |
https://binary.mirantis.com/core/helm/agent-controller-1.32.4.tgz |
|
aws-credentials-controller |
https://binary.mirantis.com/core/helm/aws-credentials-controller-1.32.4.tgz |
|
aws-provider |
https://binary.mirantis.com/core/helm/aws-provider-1.32.4.tgz |
|
azure-credentials-controller |
https://binary.mirantis.com/core/helm/azure-credentials-controller-1.32.4.tgz |
|
azure-provider |
https://binary.mirantis.com/core/helm/azure-provider-1.32.4.tgz |
|
baremetal-provider |
https://binary.mirantis.com/core/helm/baremetal-provider-1.32.4.tgz |
|
byo-credentials-controller |
https://binary.mirantis.com/core/helm/byo-credentials-controller-1.32.4.tgz |
|
byo-provider |
https://binary.mirantis.com/core/helm/byo-provider-1.32.4.tgz |
|
ceph-kcc-controller |
https://binary.mirantis.com/core/helm/ceph-kcc-controller-1.32.4.tgz |
|
cert-manager |
https://binary.mirantis.com/core/helm/cert-manager-1.32.4.tgz |
|
client-certificate-controller |
https://binary.mirantis.com/core/helm/client-certificate-controller-1.32.4.tgz |
|
equinix-credentials-controller |
https://binary.mirantis.com/core/helm/equinix-credentials-controller-1.32.4.tgz |
|
equinix-provider |
https://binary.mirantis.com/core/helm/equinix-provider-1.32.4.tgz |
|
equinixmetalv2-provider |
https://binary.mirantis.com/core/helm/equinixmetalv2-provider-1.32.4.tgz |
|
event-controller |
https://binary.mirantis.com/core/helm/event-controller-1.32.4.tgz |
|
iam-controller |
https://binary.mirantis.com/core/helm/iam-controller-1.32.4.tgz |
|
kaas-exporter |
https://binary.mirantis.com/core/helm/kaas-exporter-1.32.4.tgz |
|
kaas-public-api |
https://binary.mirantis.com/core/helm/kaas-public-api-1.32.4.tgz |
|
kaas-ui |
||
lcm-controller |
https://binary.mirantis.com/core/helm/lcm-controller-1.32.4.tgz |
|
license-controller Updated |
https://binary.mirantis.com/core/helm/license-controller-1.32.4.tgz |
|
mcc-cache |
||
openstack-provider |
https://binary.mirantis.com/core/helm/openstack-provider-1.32.4.tgz |
|
os-credentials-controller |
https://binary.mirantis.com/core/helm/os-credentials-controller-1.32.4.tgz |
|
portforward-controller |
https://binary.mirantis.com/core/helm/portforward-controller-1.32.4.tgz |
|
proxy-controller |
https://binary.mirantis.com/core/helm/proxy-controller-1.32.4.tgz |
|
rbac-controller |
https://binary.mirantis.com/core/helm/rbac-controller-1.32.4.tgz |
|
release-controller |
https://binary.mirantis.com/core/helm/release-controller-1.32.4.tgz |
|
rhellicense-controller |
https://binary.mirantis.com/core/helm/rhellicense-controller-1.32.4.tgz |
|
scope-controller |
http://binary.mirantis.com/core/helm/scope-controller-1.32.4.tgz |
|
squid-proxy |
https://binary.mirantis.com/core/helm/squid-proxy-1.32.4.tgz |
|
vsphere-credentials-controller |
https://binary.mirantis.com/core/helm/vsphere-credentials-controller-1.32.4.tgz |
|
vsphere-provider |
https://binary.mirantis.com/core/helm/vsphere-provider-1.32.4.tgz |
|
user-controller |
https://binary.mirantis.com/core/helm/user-controller-1.32.4.tgz |
|
Docker images |
admission-controller Updated |
mirantis.azurecr.io/core/admission-controller:1.32.10 |
agent-controller Updated |
mirantis.azurecr.io/core/agent-controller:1.32.4 |
|
aws-cluster-api-controller Updated |
mirantis.azurecr.io/core/aws-cluster-api-controller:1.32.4 |
|
aws-credentials-controller Updated |
mirantis.azurecr.io/core/aws-credentials-controller:1.32.4 |
|
azure-cluster-api-controller Updated |
mirantis.azurecr.io/core/azure-cluster-api-controller:1.32.4 |
|
azure-credentials-controller Updated |
mirantis.azurecr.io/core/azure-credentials-controller:1.32.4 |
|
byo-cluster-api-controller Updated |
mirantis.azurecr.io/core/byo-cluster-api-controller:1.32.4 |
|
byo-credentials-controller Updated |
mirantis.azurecr.io/core/byo-credentials-controller:1.32.4 |
|
ceph-kcc-controller Updated |
mirantis.azurecr.io/core/ceph-kcc-controller:1.32.8 |
|
cert-manager-controller |
mirantis.azurecr.io/core/external/cert-manager-controller:v1.6.1 |
|
client-certificate-controller Updated |
mirantis.azurecr.io/core/client-certificate-controller:1.32.4 |
|
cluster-api-provider-baremetal Updated |
mirantis.azurecr.io/core/cluster-api-provider-baremetal:1.32.4 |
|
cluster-api-provider-equinix Updated |
mirantis.azurecr.io/core/equinix-cluster-api-controller:1.32.4 |
|
equinix-credentials-controller Updated |
mirantis.azurecr.io/core/equinix-credentials-controller:1.32.4 |
|
frontend Updated |
mirantis.azurecr.io/core/frontend:1.32.10 |
|
haproxy Updated |
mirantis.azurecr.io/lcm/mcc-haproxy:v0.17.0-8-g6ca89d5 |
|
iam-controller Updated |
mirantis.azurecr.io/core/iam-controller:1.32.4 |
|
kproxy Updated |
mirantis.azurecr.io/core/kproxy:1.32.4 |
|
lcm-controller Updated |
mirantis.azurecr.io/lcm/lcm-controller:v0.3.0-257-ga93244da |
|
license-controller Updated |
mirantis.azurecr.io/core/license-controller:1.32.4 |
|
mcc-keepalived |
mirantis.azurecr.io/lcm/mcc-keepalived:v0.14.0-1-g8725814 |
|
openstack-cluster-api-controller Updated |
mirantis.azurecr.io/core/openstack-cluster-api-controller:1.32.4 |
|
os-credentials-controller Updated |
mirantis.azurecr.io/core/os-credentials-controller:1.32.4 |
|
portforward-controller Updated |
mirantis.azurecr.io/core/portforward-controller:1.32.4 |
|
rbac-controller Updated |
mirantis.azurecr.io/core/rbac-controller:1.32.4 |
|
registry |
mirantis.azurecr.io/lcm/registry:2.7.1 |
|
release-controller Updated |
mirantis.azurecr.io/core/release-controller:1.32.4 |
|
rhellicense-controller Updated |
mirantis.azurecr.io/core/rhellicense-controller:1.32.4 |
|
scope-controller Updated |
mirantis.azurecr.io/core/scope-controller:1.32.4 |
|
squid-proxy |
mirantis.azurecr.io/lcm/squid-proxy:0.0.1-6 |
|
vsphere-cluster-api-controller Updated |
mirantis.azurecr.io/core/vsphere-cluster-api-controller:1.32.4 |
|
vsphere-credentials-controller Updated |
mirantis.azurecr.io/core/vsphere-credentials-controller:1.32.4 |
|
user-controller Updated |
mirantis.azurecr.io/core/user-controller:1.32.4 |
Artifact |
Component |
Path |
|---|---|---|
Binaries |
hash-generate-linux |
http://binary.mirantis.com/iam/bin/hash-generate-0.0.1-268-3cf7f17-linux |
hash-generate-darwin |
http://binary.mirantis.com/iam/bin/hash-generate-0.0.1-268-3cf7f17-darwin |
|
Helm charts |
iam Updated |
|
iam-proxy |
||
keycloak_proxy Updated |
http://binary.mirantis.com/core/helm/keycloak_proxy-1.32.4.tgz |
|
Docker images |
kubernetes-entrypoint |
mirantis.azurecr.io/iam/external/kubernetes-entrypoint:v0.3.1 |
mariadb |
mirantis.azurecr.io/general/mariadb:10.4.16-bionic-20201105025052 |
|
keycloak Updated |
mirantis.azurecr.io/iam/keycloak:0.5.8 |
|
keycloak-gatekeeper |
mirantis.azurecr.io/iam/keycloak-gatekeeper:7.1.3-2 |
The Mirantis Container Cloud GA release 2.18.1 is based on 2.18.0 and:
Introduces support for the Cluster release 8.8.0 that is based on the Cluster release 7.8.0 and represents Mirantis OpenStack for Kubernetes (MOSK) 22.3. This Cluster release is based on the updated version of Mirantis Kubernetes Engine 3.4.8 with Kubernetes 1.20 and Mirantis Container Runtime 20.10.11.
Does not support new deployments based on the deprecated Cluster releases 11.1.0, 8.6.0, and 7.7.0.
For details about the Container Cloud release 2.18.1, refer to its parent release 2.18.0:
Caution
Make sure to update the Cluster release version of your managed cluster before the current Cluster release version becomes unsupported by a new Container Cloud release version. Otherwise, Container Cloud stops auto-upgrade and eventually Container Cloud itself becomes unsupported.
The Mirantis Container Cloud GA release 2.18.0:
Introduces support for the Cluster release 11.2.0 that is based on Mirantis Container Runtime 20.10.8 and Mirantis Kubernetes Engine 3.5.1 with Kubernetes 1.21.
Introduces support for the Cluster release 7.8.0 that is based on Mirantis Container Runtime 20.10.8 and Mirantis Kubernetes Engine 3.4.7 with Kubernetes 1.20.
Supports the Cluster release 8.6.0 that is based on the Cluster release 7.6.0 and represents Mirantis OpenStack for Kubernetes (MOSK) 22.2.
Does not support greenfield deployments on deprecated Cluster releases 11.1.0, 8.5.0, and 7.7.0. Use the latest Cluster releases of the series instead.
Caution
Make sure to update the Cluster release version of your managed cluster before the current Cluster release version becomes unsupported by a new Container Cloud release version. Otherwise, Container Cloud stops auto-upgrade and eventually Container Cloud itself becomes unsupported.
This section outlines release notes for the Container Cloud release 2.18.0.
This section outlines new features and enhancements introduced in the Mirantis Container Cloud release 2.18.0. For the list of enhancements in the Cluster releases 11.2.0 and 7.8.0 that are introduced by the Container Cloud release 2.18.0, see the Cluster releases.
Booting a machine from a block storage volume for OpenStack provider
Enablement of Salesforce propagation to all clusters using web UI
Updated the Ubuntu kernel version to 5.4.0-109-generic for bare metal non-MOSK-based management, regional, and managed clusters to apply Ubuntu 18.04 or 20.04 security and system updates.
Caution
During a baremetal-based cluster update to Container Cloud 2.18 and to the latest Cluster releases 11.2.0 and 7.8.0, hosts will be restarted to apply the latest supported Ubuntu 18.04 or 20.04 packages. Therefore:
Depending on the cluster configuration, applying security updates and host restart can increase the update time for each node to up to 1 hour.
Cluster nodes are updated one by one. Therefore, for large clusters, the update may take several days to complete.
Implemented full support for Ubuntu 20.04 LTS (Focal Fossa) as the default host operating system that now installs on management, regional, and managed clusters for the vSphere cloud provider.
Caution
Upgrading from Ubuntu 18.04 to 20.04 on existing deployments is not supported.
TechPreview
Implemented initial Technology Preview support for booting of the OpenStack-based machines from a block storage volume. The feature is beneficial for clouds that do not have enough space on hypervisors. After enabling this option, the Cinder storage is used instead of the Nova storage.
Using the Container Cloud API, you can boot the Bastion node, or the required management, regional, or managed cluster nodes from a volume.
Note
The ability to enable the boot from volume option using the Container Cloud web UI for managed clusters will be implemented in one of the following Container Cloud releases.
TechPreview Experimental since 2.19.0
Implemented initial Technology Preview support for enabling IPSec encryption for the Kubernetes workloads network. The feature allows for secure communication between servers.
You can enable encryption for the Kubernetes workloads network on greenfield
deployments during initial creation of a management, regional, and managed
cluster through the Cluster object using the secureOverlay parameter.
Caution
For the Azure cloud provider, the feature is not supported. For details, see MKE documentation: Kubernetes network encryption.
For the bare metal cloud provider and MOSK-based deployments, the feature support will become available in one of the following Container Cloud releases.
For existing deployments, the feature support will become available in one of the following Container Cloud releases.
TechPreview
Implemented the initial Technology Preview support for man-in-the-middle (MITM) proxies on offline OpenStack and non-MOSK-based bare metal deployments. Using trusted proxy CA certificates, the feature allows monitoring all cluster traffic for security and audit purposes.
Implemented support for custom Docker registries configuration in the
Container Cloud management, regional, and managed clusters. Using the
ContainerRegistry custom resource, you can configure CA certificates on
machines to access private Docker registries.
Note
For MOSK-based deployments, the feature support is available since Container Cloud 2.18.1.
TechPreview
Implemented initial Technology Preview support for machines upgrade index that allows prioritized machines to be upgraded first. During a machine or a machine pool creation, you can use the Container Cloud web UI Upgrade Index option to set a positive numeral value that defines the order of machine upgrade during cluster update.
To set the upgrade order on an existing cluster, use the Container Cloud API:
For a machine that is not assigned to a machine pool, add the
upgradeIndexfield with the required value to thespec:providerSpec:valuesection in theMachineobject.For a machine pool, add the
upgradeIndexfield with the required value to thespec:machineSpec:providerSpec:valuesection of theMachinePoolobject to apply the upgrade order to all machines in the pool.
Note
The first machine to upgrade is always one of the control plane machines with the lowest
upgradeIndex. Other control plane machines are upgraded one by one according to their upgrade indexes. If theClusterspecdedicatedControlPlanefield isfalse, worker machines are upgraded only after the upgrade of all control plane machines finishes. Otherwise, they are upgraded after the first control plane machine, concurrently with other control plane machines.If two or more machines have the same value of
upgradeIndex, these machines are equally prioritized during upgrade.Changing of the machine upgrade index during an already running cluster update or maintenance is not supported.
Simplified the ability to enable automatic update and sync of the Salesforce configuration on all your clusters by adding the corresponding check box to the Salesforce settings in the Container Cloud web UI.
On top of continuous improvements delivered to the existing Container Cloud guides, added the following documentation:
The following issues have been addressed in the Mirantis Container Cloud release 2.18.0 along with the Cluster releases 11.2.0 and 7.8.0:
[24075] Fixed the issue with the Ubuntu 20.04 option not displaying in the operating systems drop-down list during machine creation for the AWS and Equinix Metal with public networking providers.
Warning
After Container Cloud is upgraded to 2.18.0, remove the values added during the workaround application from the
Clusterobject.[9339] Fixed the issue with incorrect health monitoring for Kubernetes and MKE endpoints on OpenStack-based clusters.
[21710] Fixed the issue with a too high threshold being set for the
KubeContainersCPUThrottlingHighStackLight alert.[22872] Removed the inefficient
ElasticNoNewDataClusterandElasticNoNewDataNodeStackLight alerts.[23853] Fixed the issue wherein the
KaaSCephOperationRequestresource created to remove the failed node from the Ceph cluster was stuck with theFailedstatus and an error message inerrorReason. TheFailedstatus blocked the replacement of the failed master node on regional clusters of the bare metal and Equinix Metal providers.[23841] Improved error logging for load balancers deletion:
The reason for the inability to delete an LB is now displayed in the provider logs.
If the search of an FIP associated with the LB deletion returns more than one FIP, the provider returns an error instead of deleting all found FIPs.
[18331] Fixed the issue with the Keycloak admin console menu disappearing on the Add identity provider page during configuration of an identity provider SAML.
This section lists known issues with workarounds for the Mirantis Container Cloud release 2.18.0 including the Cluster releases 11.2.0 and 7.8.0.
For other issues that can occur while deploying and operating a Container Cloud cluster, see Troubleshooting Guide.
Note
This section also outlines still valid known issues from previous Container Cloud releases.
A managed cluster deployment, attachment, or update to a Cluster release with
MKE versions 3.3.13, 3.4.6, 3.5.1, or earlier may fail with the
compose pods flapping (ready > terminating > pending) and with the
following error message appearing in logs:
'not ready: deployments: kube-system/compose got 0/0 replicas, kube-system/compose-api
got 0/0 replicas'
ready: false
type: Kubernetes
Workaround:
Disable Docker Content Trust (DCT):
Access the MKE web UI as admin.
Navigate to Admin > Admin Settings.
In the left navigation pane, click Docker Content Trust and disable it.
Restart the affected deployments such as
calico-kube-controllers,compose,compose-api,coredns, and so on:kubectl -n kube-system delete deployment <deploymentName>
Once done, the cluster deployment or update resumes.
Re-enable DCT.
During bootstrap of a bare metal management cluster with a multi-rack topology,
the dhcp-option=tag parameters are not applied to dnsmasq.conf.
Symptoms:
The dnasmq-controller service contains the following exemplary error
message:
KUBECONFIG=kaas-mgmt-kubeconfig kubectl -n kaas logs --tail 50 deployment/dnsmasq -c dnsmasq-controller
...
I0622 09:05:26.898898 8 handler.go:19] Failed to watch Object, kind:'dnsmasq': failed to list *unstructured.Unstructured: the server could not find the requested resource
E0622 09:05:26.899108 8 reflector.go:138] pkg/mod/k8s.io/client-go@v0.22.8/tools/cache/reflector.go:167: Failed to watch *unstructured.Unstructured: failed to list *unstructured.Unstructured: the server could not find the requested resource
...
Workaround:
Manually update deployment/dnsmasq with the updated image:
KUBECONFIG=kaas-mgmt-kubeconfig kubectl -n kaas set image deployment/dnsmasq dnsmasq-controller=mirantis.azurecr.io/bm/dnsmasq-controller:base-focal-2-18-issue24806-20220618085127
During deletion of a manager machine running the ironic Pod from a bare
metal management cluster, the following problems occur:
All Pods are stuck in the
TerminatingstateA new
ironicPod fails to startThe related bare metal host is stuck in the
deprovisioningstate
As a workaround, before deletion of the node running the ironic Pod,
cordon and drain the node using the kubectl cordon <nodeName> and
kubectl drain <nodeName> commands.
If a baremetal-based regional cluster deployment fails before pivoting is done, the corresponding region deletion fails.
Workaround:
Using the command below, manually delete all possible traces of the failed
regional cluster deployment, including but not limited to the following
objects that contain the kaas.mirantis.com/region label of the affected
region:
clustermachinebaremetalhostbaremetalhostprofilel2templatesubnetipamhostipaddr
kubectl delete <objectName> -l kaas.mirantis.com/region=<regionName>
Warning
Do not use the same region name again after the regional cluster deployment failure since some objects that reference the region name may still exist.
An Equinix-based management or managed cluster fails to update with the
FailedAttachVolume and FailedMount warnings.
Workaround:
Verify that the description of the pods that failed to run contain the
FailedMountevents:kubectl -n <affectedProjectName> describe pod <affectedPodName>
<affectedProjectName>is the Container Cloud project name where the pods failed to run<affectedPodName>is a pod name that failed to run in this project
In the pod description, identify the node name where the pod failed to run.
Verify that the
csi-rbdpluginlogs of the affected node contain the rbd volume mount failed: <csi-vol-uuid> is being used error. The<csi-vol-uuid>is a unique RBD volume name.Identify
csiPodNameof the correspondingcsi-rbdplugin:kubectl -n rook-ceph get pod -l app=csi-rbdplugin \ -o jsonpath='{.items[?(@.spec.nodeName == "<nodeName>")].metadata.name}'
Output the affected
csiPodNamelogs:kubectl -n rook-ceph logs <csiPodName> -c csi-rbdplugin
Scale down the affected
StatefulSetorDeploymentof the pod that fails to init to0replicas.On every
csi-rbdpluginpod, search for stuckcsi-vol:for pod in `kubectl -n rook-ceph get pods|grep rbdplugin|grep -v provisioner|awk '{print $1}'`; do echo $pod kubectl exec -it -n rook-ceph $pod -c csi-rbdplugin -- rbd device list | grep <csi-vol-uuid> done
Unmap the affected
csi-vol:rbd unmap -o force /dev/rbd<i>
The
/dev/rbd<i>value is a mapped RBD volume that usescsi-vol.Delete
volumeattachmentof the affected pod:kubectl get volumeattachments | grep <csi-vol-uuid> kubectl delete volumeattacmhent <id>
Scale up the affected
StatefulSetorDeploymentback to the original number of replicas and wait until its state isRunning.
The OpenSearch elasticsearch.persistentVolumeClaimSize custom setting is
overwritten by logging.persistentVolumeClaimSize during deployment of a
Container Cloud cluster of any type and is set to the default 30Gi.
Note
This issue does not block the OpenSearch cluster operations if the default retention time is set. The default setting is usually enough for the capacity size of this cluster.
The issue may affect the following Cluster releases:
11.2.0 - 11.5.0
7.8.0 - 7.11.0
8.8.0 - 8.10.0, 12.5.0 (MOSK clusters)
10.2.4 - 10.8.1 (attached MKE 3.4.x clusters)
13.0.2 - 13.5.1 (attached MKE 3.5.x clusters)
To verify that the cluster is affected:
Note
In the commands below, substitute parameters enclosed in angle brackets to match the affected cluster values.
kubectl --kubeconfig=<managementClusterKubeconfigPath> \
-n <affectedClusterProjectName> \
get cluster <affectedClusterName> \
-o=jsonpath='{.spec.providerSpec.value.helmReleases[*].values.elasticsearch.persistentVolumeClaimSize}' | xargs echo config size:
kubectl --kubeconfig=<affectedClusterKubeconfigPath> \
-n stacklight get pvc -l 'app=opensearch-master' \
-o=jsonpath="{.items[*].status.capacity.storage}" | xargs echo capacity sizes:
The cluster is not affected if the configuration size value matches or is less than any capacity size. For example:
config size: 30Gi capacity sizes: 30Gi 30Gi 30Gi config size: 50Gi capacity sizes: 100Gi 100Gi 100Gi
The cluster is affected if the configuration size is larger than any capacity size. For example:
config size: 200Gi capacity sizes: 100Gi 100Gi 100Gi
Workaround for a new cluster creation:
Select from the following options:
For a management or regional cluster, during the bootstrap procedure, open
cluster.yaml.templatefor editing.For a managed cluster, open the
Clusterobject for editing.Caution
For a managed cluster, use the Container Cloud API instead of the web UI for cluster creation.
In the opened
.yamlfile, addlogging.persistentVolumeClaimSizealong withelasticsearch.persistentVolumeClaimSize. For example:apiVersion: cluster.k8s.io/v1alpha1 spec: ... providerSpec: value: ... helmReleases: - name: stacklight values: elasticsearch: persistentVolumeClaimSize: 100Gi logging: enabled: true persistentVolumeClaimSize: 100Gi
Continue the cluster deployment. The system will use the custom value set in
logging.persistentVolumeClaimSize.Caution
If
elasticsearch.persistentVolumeClaimSizeis absent in the.yamlfile, the Admission Controller blocks the configuration update.
Workaround for an existing cluster:
Caution
During the application of the below workarounds, a short outage of OpenSearch and its dependent components may occur with the following alerts firing on the cluster. This behavior is expected. Therefore, disregard these alerts.
StackLight alerts list firing during cluster update
Cluster size and outage probability level |
Alert name |
Label name and component |
|---|---|---|
Any cluster with high probability |
|
|
|
|
|
Large cluster with average probability |
|
|
|
n/a |
|
|
n/a |
|
|
n/a |
|
|
n/a |
|
Any cluster with low probability |
|
|
|
|
StackLight in HA mode with LVP provisioner for OpenSearch PVCs
Warning
After applying this workaround, the existing log data will be lost. Therefore, if required, migrate log data to a new persistent volume (PV).
Move the existing log data to a new PV, if required.
Increase the disk size for local volume provisioner (LVP).
Scale down the
opensearch-masterStatefulSet with dependent resources to 0 and disable theelasticsearch-curatorCronJob:kubectl -n stacklight scale --replicas 0 statefulset opensearch-master kubectl -n stacklight scale --replicas 0 deployment opensearch-dashboards kubectl -n stacklight scale --replicas 0 deployment metricbeat kubectl -n stacklight patch cronjobs elasticsearch-curator -p '{"spec" : {"suspend" : true }}'
Recreate the
opensearch-masterStatefulSet with the updated disk size.kubectl get statefulset opensearch-master -o yaml -n stacklight | sed 's/storage: 30Gi/storage: <pvcSize>/g' > opensearch-master.yaml kubectl -n stacklight delete statefulset opensearch-master kubectl create -f opensearch-master.yaml
Replace
<pvcSize>with theelasticsearch.persistentVolumeClaimSizevalue.Delete existing PVCs:
kubectl delete pvc -l 'app=opensearch-master' -n stacklight
Warning
This command removes all existing logs data from PVCs.
In the
Clusterconfiguration, set the samelogging.persistentVolumeClaimSizeas the size ofelasticsearch.persistentVolumeClaimSize. For example:apiVersion: cluster.k8s.io/v1alpha1 kind: Cluster spec: ... providerSpec: value: ... helmReleases: - name: stacklight values: elasticsearch: persistentVolumeClaimSize: 100Gi logging: enabled: true persistentVolumeClaimSize: 100Gi
Scale up the
opensearch-masterStatefulSet with dependent resources and enable theelasticsearch-curatorCronJob:kubectl -n stacklight scale --replicas 3 statefulset opensearch-master sleep 100 kubectl -n stacklight scale --replicas 1 deployment opensearch-dashboards kubectl -n stacklight scale --replicas 1 deployment metricbeat kubectl -n stacklight patch cronjobs elasticsearch-curator -p '{"spec" : {"suspend" : false }}'
StackLight in non-HA mode with an expandable StorageClass for
OpenSearch PVCs
Note
To verify whether a StorageClass is expandable:
kubectl -n stacklight get pvc | grep opensearch-master | awk '{print $6}' | xargs -I{} kubectl get storageclass {} -o yaml | grep 'allowVolumeExpansion: true'
A positive system response is allowVolumeExpansion: true. A negative
system response is blank or false.
Scale down the
opensearch-masterStatefulSet with dependent resources to 0 and disable theelasticsearch-curatorCronJob:kubectl -n stacklight scale --replicas 0 statefulset opensearch-master kubectl -n stacklight scale --replicas 0 deployment opensearch-dashboards kubectl -n stacklight scale --replicas 0 deployment metricbeat kubectl -n stacklight patch cronjobs elasticsearch-curator -p '{"spec" : {"suspend" : true }}'
Recreate the
opensearch-masterStatefulSet with the updated disk size.kubectl -n stacklight get statefulset opensearch-master -o yaml | sed 's/storage: 30Gi/storage: <pvc_size>/g' > opensearch-master.yaml kubectl -n stacklight delete statefulset opensearch-master kubectl create -f opensearch-master.yaml
Replace
<pvcSize>with theelasticsearch.persistentVolumeClaimSizevalue.Patch the PVCs with the new
elasticsearch.persistentVolumeClaimSizevalue:kubectl -n stacklight patch pvc opensearch-master-opensearch-master-0 -p '{ "spec": { "resources": { "requests": { "storage": "<pvc_size>" }}}}'
Replace
<pvcSize>with theelasticsearch.persistentVolumeClaimSizevalue.In the
Clusterconfiguration, setlogging.persistentVolumeClaimSizethe same as the size ofelasticsearch.persistentVolumeClaimSize. For example:apiVersion: cluster.k8s.io/v1alpha1 kind: Cluster spec: ... providerSpec: value: ... helmReleases: - name: stacklight values: elasticsearch: persistentVolumeClaimSize: 100Gi logging: enabled: true persistentVolumeClaimSize: 100Gi
Scale up the
opensearch-masterStatefulSet with dependent resources to1and enable theelasticsearch-curatorCronJob:kubectl -n stacklight scale --replicas 1 statefulset opensearch-master sleep 100 kubectl -n stacklight scale --replicas 1 deployment opensearch-dashboards kubectl -n stacklight scale --replicas 1 deployment metricbeat kubectl -n stacklight patch cronjobs elasticsearch-curator -p '{"spec" : {"suspend" : false }}'
StackLight in non-HA mode with a non-expandable StorageClass
and no LVP for OpenSearch PVCs
Warning
After applying this workaround, the existing log data will be lost. Depending on your custom provisioner, you may find a third-party tool, such as pv-migrate, that provides a possibility to copy all data from one PV to another.
If data loss is acceptable, proceed with the workaround below.
Note
To verify whether a StorageClass is expandable:
kubectl -n stacklight get pvc | grep opensearch-master | awk '{print $6}' | xargs -I{} kubectl get storageclass {} -o yaml | grep 'allowVolumeExpansion: true'
A positive system response is allowVolumeExpansion: true. A negative
system response is blank or false.
Scale down the
opensearch-masterStatefulSet with dependent resources to 0 and disable theelasticsearch-curatorCronJob:kubectl -n stacklight scale --replicas 0 statefulset opensearch-master kubectl -n stacklight scale --replicas 0 deployment opensearch-dashboards kubectl -n stacklight scale --replicas 0 deployment metricbeat kubectl -n stacklight patch cronjobs elasticsearch-curator -p '{"spec" : {"suspend" : true }}'
Recreate the
opensearch-masterStatefulSet with the updated disk size:kubectl get statefulset opensearch-master -o yaml -n stacklight | sed 's/storage: 30Gi/storage: <<pvc_size>>/g' > opensearch-master.yaml kubectl -n stacklight delete statefulset opensearch-master kubectl create -f opensearch-master.yaml
Replace
<pvcSize>with theelasticsearch.persistentVolumeClaimSizevalue.Delete existing PVCs:
kubectl delete pvc -l 'app=opensearch-master' -n stacklight
Warning
This command removes all existing logs data from PVCs.
In the
Clusterconfiguration, setlogging.persistentVolumeClaimSizeto the same value as the size of theelasticsearch.persistentVolumeClaimSizeparameter. For example:apiVersion: cluster.k8s.io/v1alpha1 kind: Cluster spec: ... providerSpec: value: ... helmReleases: - name: stacklight values: elasticsearch: persistentVolumeClaimSize: 100Gi logging: enabled: true persistentVolumeClaimSize: 100Gi
Scale up the
opensearch-masterStatefulSet with dependent resources to1and enable theelasticsearch-curatorCronJob:kubectl -n stacklight scale --replicas 1 statefulset opensearch-master sleep 100 kubectl -n stacklight scale --replicas 1 deployment opensearch-dashboards kubectl -n stacklight scale --replicas 1 deployment metricbeat kubectl -n stacklight patch cronjobs elasticsearch-curator -p '{"spec" : {"suspend" : false }}'
Custom settings for the deprecated elasticsearch.logstashRetentionTime
parameter are overwritten by the default setting set to 1 day.
The issue may affect the following Cluster releases with enabled
elasticsearch.logstashRetentionTime:
11.2.0 - 11.5.0
7.8.0 - 7.11.0
8.8.0 - 8.10.0, 12.5.0 (MOSK clusters)
10.2.4 - 10.8.1 (attached MKE 3.4.x clusters)
13.0.2 - 13.5.1 (attached MKE 3.5.x clusters)
As a workaround, in the Cluster object, replace
elasticsearch.logstashRetentionTime with elasticsearch.retentionTime
that was implemented to replace the deprecated parameter. For example:
apiVersion: cluster.k8s.io/v1alpha1
kind: Cluster
spec:
...
providerSpec:
value:
...
helmReleases:
- name: stacklight
values:
elasticsearch:
retentionTime:
logstash: 10
events: 10
notifications: 10
logging:
enabled: true
For the StackLight configuration procedure and parameters description, refer to StackLight configuration procedure.
Note
Moving forward, the workaround for this issue will be moved from Release Notes to Operations Guide: Troubleshoot StackLight.
On a managed cluster, the StackLight pods may get stuck with the
Pod predicate NodeAffinity failed error in the pod status. The issue may
occur if the StackLight node label was added to one machine and
then removed from another one.
The issue does not affect the StackLight services, all required StackLight pods migrate successfully except extra pods that are created and stuck during pod migration.
As a workaround, remove the stuck pods:
kubectl --kubeconfig <managedClusterKubeconfig> -n stacklight delete pod <stuckPodName>
Affects only Container Cloud 2.18.0
On clusters with enabled proxy and the NO_PROXY settings containing
localhost/127.0.0.1 or matching the automatically added Container Cloud
internal endpoints, the Container Cloud release upgrade from 2.17.0 to 2.18.0
triggers automatic update of managed clusters to the latest available Cluster
releases in their respective series.
For the issue workaround, contact Mirantis support.
Affects Ubuntu-based clusters deployed after Feb 10, 2022
If you deploy an Ubuntu-based cluster using the deprecated Cluster release
7.4.0 (and earlier) or 5.21.0 (and earlier) starting from February 10, 2022,
the cluster update to the Cluster releases 7.5.0 and 5.22.0 may get stuck
while applying the Deploy state to the cluster machines. The issue
affects all cluster types: management, regional, and managed.
To verify that the cluster is affected:
Log in to the Container Cloud web UI.
In the Clusters tab, capture the RELEASE and AGE values of the required Ubuntu-based cluster. If the values match the ones from the issue description, the cluster may be affected.
Using SSH, log in to the manager or worker node that got stuck while applying the
Deploystate and identify the containerd package version:containerd --versionIf the version is 1.5.9, the cluster is affected.
In
/var/log/lcm/runners/<nodeName>/deploy/, verify whether the Ansible deployment logs contain the following errors that indicate that the cluster is affected:The following packages will be upgraded: docker-ee docker-ee-cli The following packages will be DOWNGRADED: containerd.io STDERR: E: Packages were downgraded and -y was used without --allow-downgrades.
Workaround:
Warning
Apply the steps below to the affected nodes one-by-one and
only after each consecutive node gets stuck on the Deploy phase with the
Ansible log errors. Such sequence ensures that each node is cordon-drained
and Docker is properly stopped. Therefore, no workloads are affected.
Using SSH, log in to the first affected node and install containerd 1.5.8:
apt-get install containerd.io=1.5.8-1 -y --allow-downgrades --allow-change-held-packages
Wait for Ansible to reconcile. The node should become
Readyin several minutes.Wait for the next node of the cluster to get stuck on the
Deployphase with the Ansible log errors. Only after that, apply the steps above on the next node.Patch the remaining nodes one-by-one using the steps above.
Fixed in 7.11.0, 11.5.0 and 12.5.0
During machine creation using the Container Cloud web UI, a custom value for a node label cannot be set.
As a workaround, manually add the value to
spec.providerSpec.value.nodeLabels in machine.yaml.
Affects only Container Cloud 2.18.0 and earlier
A project that is newly created in the Container Cloud web UI does not display in the Projects list even after refreshing the page. The issue occurs due to the token missing the necessary role for the new project. As a workaround, relogin to the Container Cloud web UI.
The following table lists the major components and their versions of the Mirantis Container Cloud release 2.18.0.
Note
The components that are newly added, updated, deprecated, or removed
as compared to the previous release version, are marked
with a corresponding superscript,
for example, lcm-ansible Updated.
Component |
Application/Service |
Version |
|---|---|---|
AWS Updated |
aws-provider |
1.31.9 |
aws-credentials-controller |
1.31.9 |
|
Azure Updated |
azure-provider |
1.31.9 |
azure-credentials-controller |
1.31.9 |
|
Bare metal |
ambassador |
1.20.1-alpine |
baremetal-operator Updated |
6.1.9 |
|
baremetal-public-api Updated |
6.1.9 |
|
baremetal-provider Updated |
1.31.9 |
|
baremetal-resource-controller |
base-focal-20220429170738 |
|
ironic Updated |
xena-focal-20220513073431 |
|
ironic-operator Updated |
base-focal-20220501190529 |
|
kaas-ipam |
base-focal-20220310095439 |
|
keepalived |
2.1.5 |
|
local-volume-provisioner |
2.5.0-mcp |
|
mariadb |
10.4.17-bionic-20220113085105 |
|
IAM |
iam Updated |
2.4.25 |
iam-controller Updated |
1.31.9 |
|
keycloak Updated |
16.1.1 |
|
Container Cloud |
admission-controller Updated |
1.31.11 |
agent-controller Updated |
1.31.9 |
|
byo-credentials-controller Updated |
1.31.9 |
|
byo-provider Updated |
1.31.9 |
|
ceph-kcc-controller Updated |
1.31.9 |
|
cert-manager Updated |
1.31.9 |
|
client-certificate-controller Updated |
1.31.9 |
|
event-controller Updated |
1.31.9 |
|
golang |
1.17.6 |
|
kaas-public-api Updated |
1.31.9 |
|
kaas-exporter Updated |
1.31.9 |
|
kaas-ui Updated |
1.31.12 |
|
lcm-controller Updated |
0.3.0-239-gae7218ea |
|
license-controller Updated |
1.31.9 |
|
machinepool-controller Updated |
1.31.9 |
|
mcc-cache Updated |
1.31.9 |
|
portforward-controller Updated |
1.31.9 |
|
proxy-controller Updated |
1.31.9 |
|
rbac-controller Updated |
1.31.9 |
|
release-controller Updated |
1.31.9 |
|
rhellicense-controller Updated |
1.31.9 |
|
scope-controller Updated |
1.31.9 |
|
squid-proxy |
0.0.1-6 |
|
user-controller Updated |
1.31.9 |
|
Equinix Metal |
equinix-provider Updated |
1.31.9 |
equinix-credentials-controller Updated |
1.31.9 |
|
keepalived |
2.1.5 |
|
OpenStack Updated |
openstack-provider |
1.31.9 |
os-credentials-controller |
1.31.9 |
|
VMware vSphere |
vsphere-provider Updated |
1.31.9 |
vsphere-credentials-controller Updated |
1.31.9 |
|
keepalived |
2.1.5 |
This section lists the components artifacts of the Mirantis Container Cloud release 2.18.0.
Note
The components that are newly added, updated, deprecated, or removed
as compared to the previous release version, are marked
with a corresponding superscript,
for example, lcm-ansible Updated.
Artifact |
Component |
Path |
|---|---|---|
Binaries |
baremetal-operator Updated |
https://binary.mirantis.com/bm/helm/baremetal-operator-6.1.9.tgz |
baremetal-public-api Updated |
https://binary.mirantis.com/bm/helm/baremetal-public-api-6.1.9.tgz |
|
ironic-python-agent.initramfs |
https://binary.mirantis.com/bm/bin/ironic/ipa/ubuntu/initramfs-xena-focal-debug-20220512084815 |
|
ironic-python-agent.kernel |
https://binary.mirantis.com/bm/bin/ironic/ipa/ubuntu/kernel-xena-focal-debug-20220512084815 |
|
kaas-ipam Updated |
||
local-volume-provisioner |
https://binary.mirantis.com/bm/helm/local-volume-provisioner-2.5.0-mcp.tgz |
|
provisioning_ansible |
https://binary.mirantis.com/bm/bin/ansible/provisioning_ansible-0.1.1-104-6e2e82c.tgz |
|
target ubuntu system |
https://binary.mirantis.com/bm/bin/efi/ubuntu/tgz-bionic-20210622161844 |
|
Docker images |
ambassador |
mirantis.azurecr.io/general/external/docker.io/library/nginx:1.20.1-alpine |
baremetal-operator |
mirantis.azurecr.io/bm/baremetal-operator:base-focal-20220208045851 |
|
baremetal-resource-controller Updated |
mirantis.azurecr.io/bm/baremetal-resource-controller:base-focal-20220429170738 |
|
dynamic_ipxe Updated |
mirantis.azurecr.io/bm/dnsmasq/dynamic-ipxe:base-focal-20220429170829 |
|
dnsmasq Updated |
mirantis.azurecr.io/general/dnsmasq:focal-20220429170747 |
|
ironic Updated |
mirantis.azurecr.io/openstack/ironic:xena-focal-20220513073431 |
|
ironic-inspector Updated |
mirantis.azurecr.io/openstack/ironic-inspector:xena-focal-20220513073431 |
|
ironic-operator Updated |
mirantis.azurecr.io/bm/ironic-operator:base-focal-20220501190529 |
|
ironic-prometheus-exporter |
mirantis.azurecr.io/stacklight/ironic-prometheus-exporter:0.1-20210608113804 |
|
kaas-ipam |
mirantis.azurecr.io/bm/kaas-ipam:base-focal-20220310095439 |
|
mariadb |
mirantis.azurecr.io/general/mariadb:10.4.17-bionic-20220113085105 |
|
mcc-keepalived |
mirantis.azurecr.io/lcm/mcc-keepalived:v0.14.0-1-g8725814 |
|
syslog-ng |
mirantis.azurecr.io/bm/syslog-ng:base-focal-20220128103433 |
Artifact |
Component |
Paths |
|---|---|---|
Bootstrap tarball Updated |
bootstrap-linux |
https://binary.mirantis.com/core/bin/bootstrap-linux-1.31.9.tar.gz |
bootstrap-darwin |
https://binary.mirantis.com/core/bin/bootstrap-darwin-1.31.9.tar.gz |
|
Helm charts Updated |
admission-controller |
https://binary.mirantis.com/core/helm/admission-controller-1.31.11.tgz |
agent-controller |
https://binary.mirantis.com/core/helm/agent-controller-1.31.9.tgz |
|
aws-credentials-controller |
https://binary.mirantis.com/core/helm/aws-credentials-controller-1.31.9.tgz |
|
aws-provider |
https://binary.mirantis.com/core/helm/aws-provider-1.31.9.tgz |
|
azure-credentials-controller |
https://binary.mirantis.com/core/helm/azure-credentials-controller-1.31.9.tgz |
|
azure-provider |
https://binary.mirantis.com/core/helm/azure-provider-1.31.9.tgz |
|
baremetal-provider |
https://binary.mirantis.com/core/helm/baremetal-provider-1.31.9.tgz |
|
byo-credentials-controller |
https://binary.mirantis.com/core/helm/byo-credentials-controller-1.31.9.tgz |
|
byo-provider |
https://binary.mirantis.com/core/helm/byo-provider-1.31.9.tgz |
|
ceph-kcc-controller |
https://binary.mirantis.com/core/helm/ceph-kcc-controller-1.31.9.tgz |
|
cert-manager |
https://binary.mirantis.com/core/helm/cert-manager-1.31.9.tgz |
|
client-certificate-controller |
https://binary.mirantis.com/core/helm/client-certificate-controller-1.31.9.tgz |
|
equinix-credentials-controller |
https://binary.mirantis.com/core/helm/equinix-credentials-controller-1.31.9.tgz |
|
equinix-provider |
https://binary.mirantis.com/core/helm/equinix-provider-1.31.9.tgz |
|
equinixmetalv2-provider |
https://binary.mirantis.com/core/helm/equinixmetalv2-provider-1.31.9.tgz |
|
event-controller |
https://binary.mirantis.com/core/helm/event-controller-1.31.9.tgz |
|
iam-controller |
https://binary.mirantis.com/core/helm/iam-controller-1.31.9.tgz |
|
kaas-exporter |
https://binary.mirantis.com/core/helm/kaas-exporter-1.31.9.tgz |
|
kaas-public-api |
https://binary.mirantis.com/core/helm/kaas-public-api-1.31.9.tgz |
|
kaas-ui |
||
lcm-controller |
https://binary.mirantis.com/core/helm/lcm-controller-1.31.9.tgz |
|
license-controller Updated |
https://binary.mirantis.com/core/helm/license-controller-1.31.9.tgz |
|
mcc-cache |
||
openstack-provider |
https://binary.mirantis.com/core/helm/openstack-provider-1.31.9.tgz |
|
os-credentials-controller |
https://binary.mirantis.com/core/helm/os-credentials-controller-1.31.9.tgz |
|
portforward-controller |
https://binary.mirantis.com/core/helm/portforward-controller-1.31.9.tgz |
|
proxy-controller |
https://binary.mirantis.com/core/helm/proxy-controller-1.31.9.tgz |
|
rbac-controller |
https://binary.mirantis.com/core/helm/rbac-controller-1.31.9.tgz |
|
release-controller |
https://binary.mirantis.com/core/helm/release-controller-1.31.9.tgz |
|
rhellicense-controller |
https://binary.mirantis.com/core/helm/rhellicense-controller-1.31.9.tgz |
|
scope-controller |
http://binary.mirantis.com/core/helm/scope-controller-1.31.9.tgz |
|
squid-proxy |
https://binary.mirantis.com/core/helm/squid-proxy-1.31.9.tgz |
|
vsphere-credentials-controller |
https://binary.mirantis.com/core/helm/vsphere-credentials-controller-1.31.9.tgz |
|
vsphere-provider |
https://binary.mirantis.com/core/helm/vsphere-provider-1.31.9.tgz |
|
user-controller |
https://binary.mirantis.com/core/helm/user-controller-1.31.9.tgz |
|
Docker images |
admission-controller Updated |
mirantis.azurecr.io/core/admission-controller:1.31.11 |
agent-controller Updated |
mirantis.azurecr.io/core/agent-controller:1.31.9 |
|
aws-cluster-api-controller Updated |
mirantis.azurecr.io/core/aws-cluster-api-controller:1.31.9 |
|
aws-credentials-controller Updated |
mirantis.azurecr.io/core/aws-credentials-controller:1.31.9 |
|
azure-cluster-api-controller Updated |
mirantis.azurecr.io/core/azure-cluster-api-controller:1.31.9 |
|
azure-credentials-controller Updated |
mirantis.azurecr.io/core/azure-credentials-controller:1.31.9 |
|
byo-cluster-api-controller Updated |
mirantis.azurecr.io/core/byo-cluster-api-controller:1.31.9 |
|
byo-credentials-controller Updated |
mirantis.azurecr.io/core/byo-credentials-controller:1.31.9 |
|
ceph-kcc-controller Updated |
mirantis.azurecr.io/core/ceph-kcc-controller:v1.31.9 |
|
cert-manager-controller |
mirantis.azurecr.io/core/external/cert-manager-controller:v1.6.1 |
|
client-certificate-controller Updated |
mirantis.azurecr.io/core/client-certificate-controller:1.31.9 |
|
cluster-api-provider-baremetal Updated |
mirantis.azurecr.io/core/cluster-api-provider-baremetal:1.31.9 |
|
cluster-api-provider-equinix Updated |
mirantis.azurecr.io/core/cluster-api-provider-equinix:1.31.9 |
|
equinix-credentials-controller Updated |
mirantis.azurecr.io/core/equinix-credentials-controller:1.31.9 |
|
frontend Updated |
mirantis.azurecr.io/core/frontend:1.31.12 |
|
haproxy |
mirantis.azurecr.io/lcm/mcc-haproxy:v0.12.0-8-g6fabf1c |
|
iam-controller Updated |
mirantis.azurecr.io/core/iam-controller:1.31.9 |
|
kproxy Updated |
mirantis.azurecr.io/lcm/kproxy:1.31.9 |
|
lcm-controller Updated |
mirantis.azurecr.io/core/lcm-controller:v0.3.0-239-gae7218ea |
|
license-controller Updated |
mirantis.azurecr.io/core/license-controller:1.31.9 |
|
mcc-keepalived |
mirantis.azurecr.io/lcm/mcc-keepalived:v0.14.0-1-g8725814 |
|
openstack-cluster-api-controller Updated |
mirantis.azurecr.io/core/openstack-cluster-api-controller:1.31.9 |
|
os-credentials-controller Updated |
mirantis.azurecr.io/core/os-credentials-controller:1.31.9 |
|
portforward-controller Updated |
mirantis.azurecr.io/core/portforward-controller:1.31.9 |
|
rbac-controller Updated |
mirantis.azurecr.io/core/rbac-controller:1.31.9 |
|
registry |
mirantis.azurecr.io/lcm/registry:2.7.1 |
|
release-controller Updated |
mirantis.azurecr.io/core/release-controller:1.31.9 |
|
rhellicense-controller Updated |
mirantis.azurecr.io/core/rhellicense-controller:1.31.9 |
|
scope-controller Updated |
mirantis.azurecr.io/core/scope-controller:1.31.9 |
|
squid-proxy |
mirantis.azurecr.io/core/squid-proxy:0.0.1-6 |
|
vsphere-cluster-api-controller Updated |
mirantis.azurecr.io/core/vsphere-api-controller:1.31.9 |
|
vsphere-credentials-controller Updated |
mirantis.azurecr.io/core/vsphere-credentials-controller:1.31.9 |
|
user-controller Updated |
mirantis.azurecr.io/core/user-controller:1.31.9 |
Artifact |
Component |
Path |
|---|---|---|
Binaries |
hash-generate-linux |
http://binary.mirantis.com/iam/bin/hash-generate-0.0.1-268-3cf7f17-linux |
hash-generate-darwin |
http://binary.mirantis.com/iam/bin/hash-generate-0.0.1-268-3cf7f17-darwin |
|
iamctl-linux Removed |
n/a |
|
iamctl-darwin Removed |
n/a |
|
iamctl-windows Removed |
n/a |
|
Helm charts |
iam Updated |
|
iam-proxy |
||
keycloak_proxy Updated |
http://binary.mirantis.com/core/helm/keycloak_proxy-1.31.9.tgz |
|
Docker images |
api Removed |
n/a |
auxiliary Removed |
n/a |
|
kubernetes-entrypoint |
mirantis.azurecr.io/iam/external/kubernetes-entrypoint:v0.3.1 |
|
mariadb |
mirantis.azurecr.io/general/mariadb:10.4.16-bionic-20201105025052 |
|
keycloak Updated |
mirantis.azurecr.io/iam/keycloak:0.5.7 |
|
keycloak-gatekeeper |
mirantis.azurecr.io/iam/keycloak-gatekeeper:7.1.3-2 |
The Mirantis Container Cloud GA release 2.17.0:
Introduces support for the Cluster release 11.1.0 that is based on Mirantis Container Runtime 20.10.8 and Mirantis Kubernetes Engine 3.5.1 with Kubernetes 1.21.
Introduces support for the Cluster release 7.7.0 that is based on Mirantis Container Runtime 20.10.8 and Mirantis Kubernetes Engine 3.4.7 with Kubernetes 1.20.
Supports the Cluster release 8.6.0 that is based on the Cluster release 7.6.0 and represents Mirantis OpenStack for Kubernetes (MOSK) 22.2.
Does not support greenfield deployments on deprecated Cluster releases 11.0.0, 8.5.0, and 7.6.0. Use the latest Cluster releases of the series instead.
Caution
Make sure to update the Cluster release version of your managed cluster before the current Cluster release version becomes unsupported by a new Container Cloud release version. Otherwise, Container Cloud stops auto-upgrade and eventually Container Cloud itself becomes unsupported.
This section outlines release notes for the Container Cloud release 2.17.0.
This section outlines new features and enhancements introduced in the Mirantis Container Cloud release 2.17.0. For the list of enhancements in the Cluster releases 11.1.0 and 7.7.0 that are introduced by the Container Cloud release 2.17.0, see the Cluster releases.
General availability for Ubuntu 20.04 on greenfield deployments
Container Cloud on top of MOSK Victoria with Tungsten Fabric
EBS instead of NVMe as persistent storage for AWS-based nodes
Automatic propagation of Salesforce configuration to all clusters
Implemented full support for Ubuntu 20.04 LTS (Focal Fossa) as the default host operating system that now installs on management, regional, and managed clusters for the following cloud providers: AWS, Azure, OpenStack, Equinix Metal with public or private networking, and non-MOSK-based bare metal.
For the vSphere and MOSK-based (managed) deployments, support for Ubuntu 20.04 will be announced in one of the following Container Cloud releases.
Note
The management or regional bare metal cluster dedicated for managed clusters running MOSK is based on Ubuntu 20.04.
Caution
Upgrading from Ubuntu 18.04 to 20.04 on existing deployments is not supported.
Implemented the capability to deploy Container Cloud management, regional, and managed clusters based on OpenStack Victoria with Tungsten Fabric networking on top of Mirantis OpenStack for Kubernetes (MOSK) Victoria with Tungsten Fabric.
Note
On the MOSK Victoria with Tungsten Fabric clusters of Container Cloud deployed before MOSK 22.3, Octavia enables a default security group for newly created load balancers. To change this configuration, refer to MOSK Operations Guide: Configure load balancing. To use the default security group, configure ingress rules.
Replaced the Non-Volatile Memory Express (NVMe) drive type with the Amazon Elastic Block Store (EBS) one as the persistent storage requirement for AWS-based nodes. This change prevents cluster nodes from becoming unusable after instances are stopped and NVMe drives are erased.
Previously, the /var/lib/docker Docker data was located on local NVMe SSDs
by default. Now, this data is located on the same EBS volume drive as the
operating system.
TechPreview
Implemented the capability to delete manager nodes with the purpose of replacement or recovery. Consider the following precautions:
Create a new manager machine to replace the deleted one as soon as possible. This is necessary since after a machine removal, the cluster has limited capabilities to tolerate faults. Deletion of manager machines is intended only for replacement or recovery of failed nodes.
You can delete a manager machine only if your cluster has at least two manager machines in the
Readystate.Do not delete more than one manager machine at once to prevent cluster failure and data loss.
For MOSK-based clusters, after a manager machine deletion, proceed with additional manual steps described in Mirantis OpenStack for Kubernetes Operations Guide: Replace a failed controller node.
For the Equinix Metal and bare metal providers:
Ensure that the machine to delete is not a Ceph Monitor. If it is, migrate the Ceph Monitor to keep the odd number quorum of Ceph Monitors after the machine deletion. For details, see Migrate a Ceph Monitor before machine replacement.
If you delete a machine on the regional cluster, refer to the known issue 23853 to complete the deletion.
For the sake of HA, limited a managed cluster size to have only an odd number
of manager machines. In an even-sized cluster, an additional machine remains
in the Pending state until an extra manager machine is added.
Learn more
Extended the use of node labels for all supported cloud providers with the
ability to set custom values. Especially from the MOSK
standpoint, this feature makes it easy to schedule overrides for OpenStack
services using API. For example, now you can set the node-type label to
define the node purpose such as hpc-compute, compute-lvm, or
storage-ssd in its value.
The list of allowed node labels is located in the Cluster object status
providerStatus.releaseRef.current.allowedNodeLabels field. Before or after
a machine deployment, add the required label from the allowed node labels list
with the corresponding value to spec.providerSpec.value.nodeLabels in
machine.yaml.
Note
Due to the known issue 23002, it is not possible to set a custom value for a predefined node label using the Container Cloud web UI. For a workaround, refer to the issue description.
Introduced the MachinePool custom resource. A machine pool is a template
that allows managing a set of machines with the same provider spec as a
single unit. You can create different sets of machine pools with required
specs during machines creation on a new or existing cluster using the
Create machine wizard in the Container Cloud web UI. You can
assign or unassign machines from a pool, if required. You can also increase
or decrease replicas count. In case of replicas count increasing, new
machines will be added automatically.
Implemented the capability to enable automatic propagation of the Salesforce
configuration of your management cluster to the related regional and managed
clusters using the autoSyncSalesForceConfig=true flag added to the
Cluster object of the management cluster. This option allows for
automatic update and sync of the Salesforce settings on all your clusters
after you update your management cluster configuration.
You can also set custom settings for regional and managed clusters that always override automatically propagated Salesforce values.
Note
The capability to enable this option using the Container Cloud web UI will be announced in one of the following releases.
The following issues have been addressed in the Mirantis Container Cloud release 2.17.0 along with the Cluster releases 11.1.0 and 7.7.0:
Bare metal:
[22563] Fixed the issue wherein a deployment of a bare metal node with an LVM volume on top of a mdadm-based
raid10failed during provisioning due to insufficient cleanup of RAID devices.
Equinix Metal:
[22264] Fixed the issue wherein the
KubeContainersCPUThrottlingHighalerts for Equinix Metal and AWS deployments raised due to low default deployment limits set for Equinix Metal and AWS controller containers.
StackLight:
[23006] Fixed the issue that caused StackLight endpoints to crash on start with the private key does not match public key error message.
[22626] Fixed the issue that caused constant restarts of the
kaas-exporterpod. Increased the memory forkaas-exporterrequests and limits.[22337] Improved the certificate expiration alerts by enhancing the alert severities.
[20856] Fixed the issue wherein variables values in the PostgreSQL Grafana dashboard were not calculated.
[20855] Fixed the issue wherein the Cluster > Health panel showed N/A in the Elasticsearch Grafana dashboard.
Ceph:
[19014] Updated the Rook Docker image and fixed the following security vulnerabilities:
LCM:
[22341] Fixed the issue wherein the cordon-drain states were not removed after unsetting the maintenance mode for a machine.
Cluster health:
[21494] Fixed the issue wherein controller pods were killed by OOM after a successful deployment of a management or regional cluster.
This section lists known issues with workarounds for the Mirantis Container Cloud release 2.17.0 including the Cluster releases 11.1.0 and 7.7.0.
For other issues that can occur while deploying and operating a Container Cloud cluster, see Troubleshooting Guide.
Note
This section also outlines still valid known issues from previous Container Cloud releases.
A managed cluster deployment, attachment, or update to a Cluster release with
MKE versions 3.3.13, 3.4.6, 3.5.1, or earlier may fail with the
compose pods flapping (ready > terminating > pending) and with the
following error message appearing in logs:
'not ready: deployments: kube-system/compose got 0/0 replicas, kube-system/compose-api
got 0/0 replicas'
ready: false
type: Kubernetes
Workaround:
Disable Docker Content Trust (DCT):
Access the MKE web UI as admin.
Navigate to Admin > Admin Settings.
In the left navigation pane, click Docker Content Trust and disable it.
Restart the affected deployments such as
calico-kube-controllers,compose,compose-api,coredns, and so on:kubectl -n kube-system delete deployment <deploymentName>
Once done, the cluster deployment or update resumes.
Re-enable DCT.
If a baremetal-based regional cluster deployment fails before pivoting is done, the corresponding region deletion fails.
Workaround:
Using the command below, manually delete all possible traces of the failed
regional cluster deployment, including but not limited to the following
objects that contain the kaas.mirantis.com/region label of the affected
region:
clustermachinebaremetalhostbaremetalhostprofilel2templatesubnetipamhostipaddr
kubectl delete <objectName> -l kaas.mirantis.com/region=<regionName>
Warning
Do not use the same region name again after the regional cluster deployment failure since some objects that reference the region name may still exist.
An Equinix-based management or managed cluster fails to update with the
FailedAttachVolume and FailedMount warnings.
Workaround:
Verify that the description of the pods that failed to run contain the
FailedMountevents:kubectl -n <affectedProjectName> describe pod <affectedPodName>
<affectedProjectName>is the Container Cloud project name where the pods failed to run<affectedPodName>is a pod name that failed to run in this project
In the pod description, identify the node name where the pod failed to run.
Verify that the
csi-rbdpluginlogs of the affected node contain the rbd volume mount failed: <csi-vol-uuid> is being used error. The<csi-vol-uuid>is a unique RBD volume name.Identify
csiPodNameof the correspondingcsi-rbdplugin:kubectl -n rook-ceph get pod -l app=csi-rbdplugin \ -o jsonpath='{.items[?(@.spec.nodeName == "<nodeName>")].metadata.name}'
Output the affected
csiPodNamelogs:kubectl -n rook-ceph logs <csiPodName> -c csi-rbdplugin
Scale down the affected
StatefulSetorDeploymentof the pod that fails to init to0replicas.On every
csi-rbdpluginpod, search for stuckcsi-vol:for pod in `kubectl -n rook-ceph get pods|grep rbdplugin|grep -v provisioner|awk '{print $1}'`; do echo $pod kubectl exec -it -n rook-ceph $pod -c csi-rbdplugin -- rbd device list | grep <csi-vol-uuid> done
Unmap the affected
csi-vol:rbd unmap -o force /dev/rbd<i>
The
/dev/rbd<i>value is a mapped RBD volume that usescsi-vol.Delete
volumeattachmentof the affected pod:kubectl get volumeattachments | grep <csi-vol-uuid> kubectl delete volumeattacmhent <id>
Scale up the affected
StatefulSetorDeploymentback to the original number of replicas and wait until its state isRunning.
During replacement of a failed master node on regional clusters of the
bare metal and Equinix Metal providers, the KaaSCephOperationRequest
resource created to remove the failed node from the Ceph cluster is stuck with
the Failed status and an error message in errorReason. For example:
status:
removeStatus:
osdRemoveStatus:
errorReason: Timeout (30m0s) reached for waiting pg rebalance for osd 2
status: Failed
The Failed status blocks the replacement of the failed master node.
Workaround:
On the management cluster, obtain
metadata.name,metadata.namespace, and thespecsection ofKaaSCephOperationRequestbeing stuck:kubectl get kaascephoperationrequest <kcorName> -o yaml
Replace
<kcorName>with the name ofKaaSCephOperationRequestthat has theFailedstatus.Create a new
KaaSCephOperationRequesttemplate and save it as.yaml. For example,kcor-stuck-regional.yaml.apiVersion: kaas.mirantis.com/v1alpha1 kind: KaaSCephOperationRequest metadata: name: <newKcorName> namespace: <kcorNamespace> spec: <kcorSpec>
<newKcorName>Name of new
KaaSCephOperationRequestthat differs from the failed one. Usually a failedKaaSCephOperationRequestresource is calleddelete-request-for-<masterMachineName>. Therefore, you can name the new resource asdelete-request-for-<masterMachineName>-new.
<kcorNamespace>Namespace of the failed
KaaSCephOperationRequestresource.
<kcorSpec>Spec of the failed
KaaSCephOperationRequestresource.
Apply the created template to the management cluster. For example:
kubectl apply -f kcor-stuck-regional.yaml
Remove the failed
KaaSCephOperationRequestresource from the management cluster:kubectl delete kaascephoperationrequest <kcorName>
Replace
<kcorName>with the name ofKaaSCephOperationRequestthat has theFailedstatus.
Note
Moving forward, the workaround for this issue will be moved from Release Notes to Operations Guide: Troubleshoot StackLight.
On a managed cluster, the StackLight pods may get stuck with the
Pod predicate NodeAffinity failed error in the pod status. The issue may
occur if the StackLight node label was added to one machine and
then removed from another one.
The issue does not affect the StackLight services, all required StackLight pods migrate successfully except extra pods that are created and stuck during pod migration.
As a workaround, remove the stuck pods:
kubectl --kubeconfig <managedClusterKubeconfig> -n stacklight delete pod <stuckPodName>
Affects Ubuntu-based clusters deployed after Feb 10, 2022
If you deploy an Ubuntu-based cluster using the deprecated Cluster release
7.4.0 (and earlier) or 5.21.0 (and earlier) starting from February 10, 2022,
the cluster update to the Cluster releases 7.5.0 and 5.22.0 may get stuck
while applying the Deploy state to the cluster machines. The issue
affects all cluster types: management, regional, and managed.
To verify that the cluster is affected:
Log in to the Container Cloud web UI.
In the Clusters tab, capture the RELEASE and AGE values of the required Ubuntu-based cluster. If the values match the ones from the issue description, the cluster may be affected.
Using SSH, log in to the manager or worker node that got stuck while applying the
Deploystate and identify the containerd package version:containerd --versionIf the version is 1.5.9, the cluster is affected.
In
/var/log/lcm/runners/<nodeName>/deploy/, verify whether the Ansible deployment logs contain the following errors that indicate that the cluster is affected:The following packages will be upgraded: docker-ee docker-ee-cli The following packages will be DOWNGRADED: containerd.io STDERR: E: Packages were downgraded and -y was used without --allow-downgrades.
Workaround:
Warning
Apply the steps below to the affected nodes one-by-one and
only after each consecutive node gets stuck on the Deploy phase with the
Ansible log errors. Such sequence ensures that each node is cordon-drained
and Docker is properly stopped. Therefore, no workloads are affected.
Using SSH, log in to the first affected node and install containerd 1.5.8:
apt-get install containerd.io=1.5.8-1 -y --allow-downgrades --allow-change-held-packages
Wait for Ansible to reconcile. The node should become
Readyin several minutes.Wait for the next node of the cluster to get stuck on the
Deployphase with the Ansible log errors. Only after that, apply the steps above on the next node.Patch the remaining nodes one-by-one using the steps above.
During creation of a machine for AWS or Equinix Metal provider with public networking, the Ubuntu 20.04 option does not display in the drop-down list of operating systems in the Container Cloud UI. Only Ubuntu 18.04 displays in the list.
Workaround:
Identify the parent management or regional cluster of the affected managed cluster located in the same region.
For example, if the affected managed cluster was deployed in
region-one, identify its parent cluster by running:kubectl --kubeconfig <pathToManagementClusterKubeconfig> -n default get cluster -l kaas.mirantis.com/region=region-one
Replace
region-onewith the corresponding value.Example of system response:
NAME AGE test-cluster 19d
Modify the related management or regional
Clusterobject with the correct values for thecredentials-controllerHelm releases:kubectl --kubeconfig <pathToManagementClusterKubeconfig> -n default edit cluster <managementOrRegionalClusterName>
In the system response, the editor displays the current state of the cluster. Find the
spec.providerSpec.value.kaas.regionalsection.Example of the
regionalsection in theClusterobject:spec: providerSpec: value: kaas: regional: - provider: aws helmReleases: - name: aws-credentials-controller values: region: region-one ... - provider: equinixmetal ...
For the
awsandequinixmetalproviders (if available), modify thecredentials-controllervalues as follows:Warning
Do not overwrite existing values. For example, if one of Helm releases already has
region: region-one, do not modify or remove it.For
aws-credentials-controller:values: config: allowedAMIs: - - name: name values: - "ubuntu/images/hvm-ssd/ubuntu-focal-20.04-amd64-server-20211129" - name: owner-id values: - "099720109477"
For
equinixmetal-credentials-controller:values: config: allowedOperatingSystems: - distro: ubuntu version: 20.04
If the
aws-credentials-controllerorequinixmetal-credentials-controllerHelm releases are missing in thespec.providerSpec.value.kaas.regionalsection or thehelmReleasesarray is missing for the corresponding provider, add the releases with the overwritten values.Example of the
helmReleasesarray for AWS:- provider: aws helmReleases: - name: aws-credentials-controller values: config: allowedAMIs: - - name: name values: - "ubuntu/images/hvm-ssd/ubuntu-focal-20.04-amd64-server-20211129" - name: owner-id values: - "099720109477" ...
Example of the
helmReleasesarray for Equinix Metal:- provider: equinixmetal helmReleases: - name: equinixmetal-credentials-controller values: config: allowedOperatingSystems: - distro: ubuntu version: 20.04
Wait for approximately 2 minutes for the AWS and/or Equinix
credentials-controllerto be restarted.Log out and log in again to the Container Cloud web UI.
Restart the machine addition procedure.
Warning
After Container Cloud is upgraded to 2.18.0, remove the values
added during the workaround application from the Cluster object.
Fixed in 7.11.0, 11.5.0 and 12.5.0
During machine creation using the Container Cloud web UI, a custom value for a node label cannot be set.
As a workaround, manually add the value to
spec.providerSpec.value.nodeLabels in machine.yaml.
Affects only Container Cloud 2.18.0 and earlier
A project that is newly created in the Container Cloud web UI does not display in the Projects list even after refreshing the page. The issue occurs due to the token missing the necessary role for the new project. As a workaround, relogin to the Container Cloud web UI.
The following table lists the major components and their versions of the Mirantis Container Cloud release 2.17.0.
Note
The components that are newly added, updated, deprecated, or removed
as compared to the previous release version, are marked
with a corresponding superscript,
for example, lcm-ansible Updated.
Component |
Application/Service |
Version |
|---|---|---|
AWS Updated |
aws-provider |
1.30.6 |
aws-credentials-controller |
1.30.6 |
|
Azure Updated |
azure-provider |
1.30.6 |
azure-credentials-controller |
1.30.6 |
|
Bare metal |
ambassador |
1.20.1-alpine |
baremetal-operator Updated |
6.1.4 |
|
baremetal-public-api Updated |
6.1.4 |
|
baremetal-provider Updated |
1.30.6 |
|
baremetal-resource-controller |
base-focal-20220128182941 |
|
ironic Updated |
victoria-bionic-20220328060019 |
|
ironic-operator Updated |
base-focal-20220310095139 |
|
kaas-ipam Updated |
base-focal-20220310095439 |
|
keepalived |
2.1.5 |
|
local-volume-provisioner |
2.5.0-mcp |
|
mariadb |
10.4.17-bionic-20220113085105 |
|
IAM |
iam |
2.4.14 |
iam-controller Updated |
1.30.6 |
|
keycloak |
15.0.2 |
|
Container Cloud |
admission-controller Updated |
1.30.6 |
agent-controller Updated |
1.30.6 |
|
byo-credentials-controller Updated |
1.30.6 |
|
byo-provider Updated |
1.30.6 |
|
ceph-kcc-controller New |
1.30.6 |
|
cert-manager Updated |
1.30.6 |
|
client-certificate-controller Updated |
1.30.6 |
|
event-controller Updated |
1.30.6 |
|
golang |
1.17.6 |
|
kaas-public-api Updated |
1.30.6 |
|
kaas-exporter Updated |
1.30.6 |
|
kaas-ui Updated |
1.30.9 |
|
lcm-controller Updated |
0.3.0-230-gdc7efe1c |
|
license-controller Updated |
1.30.6 |
|
machinepool-controller New |
1.30.6 |
|
mcc-cache Updated |
1.30.6 |
|
portforward-controller Updated |
1.30.6 |
|
proxy-controller Updated |
1.30.6 |
|
rbac-controller Updated |
1.30.6 |
|
release-controller Updated |
1.30.8 |
|
rhellicense-controller Updated |
1.30.6 |
|
scope-controller Updated |
1.30.6 |
|
squid-proxy |
0.0.1-6 |
|
user-controller Updated |
1.30.6 |
|
Equinix Metal |
equinix-provider Updated |
1.30.6 |
equinix-credentials-controller Updated |
1.30.6 |
|
keepalived |
2.1.5 |
|
OpenStack Updated |
openstack-provider |
1.30.6 |
os-credentials-controller |
1.30.6 |
|
VMware vSphere |
vsphere-provider Updated |
1.30.6 |
vsphere-credentials-controller Updated |
1.30.6 |
|
keepalived |
2.1.5 |
This section lists the components artifacts of the Mirantis Container Cloud release 2.17.0.
Note
The components that are newly added, updated, deprecated, or removed
as compared to the previous release version, are marked
with a corresponding superscript,
for example, lcm-ansible Updated.
Artifact |
Component |
Path |
|---|---|---|
Binaries |
baremetal-operator Updated |
https://binary.mirantis.com/bm/helm/baremetal-operator-6.1.4.tgz |
baremetal-public-api Updated |
https://binary.mirantis.com/bm/helm/baremetal-public-api-6.1.4.tgz |
|
ironic-python-agent.initramfs |
https://binary.mirantis.com/bm/bin/ironic/ipa/ubuntu/initramfs-victoria-focal-debug-20220208120746 |
|
ironic-python-agent.kernel |
https://binary.mirantis.com/bm/bin/ironic/ipa/ubuntu/kernel-victoria-focal-debug-20220208120746 |
|
kaas-ipam Updated |
||
local-volume-provisioner |
https://binary.mirantis.com/bm/helm/local-volume-provisioner-2.5.0-mcp.tgz |
|
provisioning_ansible Updated |
https://binary.mirantis.com/bm/bin/ansible/provisioning_ansible-0.1.1-104-6e2e82c.tgz |
|
target ubuntu system |
https://binary.mirantis.com/bm/bin/efi/ubuntu/tgz-bionic-20210622161844 |
|
Docker images |
ambassador |
mirantis.azurecr.io/general/external/docker.io/library/nginx:1.20.1-alpine |
baremetal-operator |
mirantis.azurecr.io/bm/baremetal-operator:base-focal-20220208045851 |
|
baremetal-resource-controller |
mirantis.azurecr.io/bm/baremetal-resource-controller:base-focal-20220128182941 |
|
dynamic_ipxe Updated |
mirantis.azurecr.io/bm/dnsmasq/dynamic-ipxe:base-focal-20220310100410 |
|
dnsmasq |
mirantis.azurecr.io/general/dnsmasq:focal-20210617094827 |
|
ironic Updated |
mirantis.azurecr.io/openstack/ironic:victoria-bionic-20220328060019 |
|
ironic-inspector Updated |
mirantis.azurecr.io/openstack/ironic-inspector:victoria-bionic-20220328060019 |
|
ironic-operator Updated |
mirantis.azurecr.io/bm/ironic-operator:base-focal-20220310095139 |
|
ironic-prometheus-exporter |
mirantis.azurecr.io/stacklight/ironic-prometheus-exporter:0.1-20210608113804 |
|
kaas-ipam Updated |
mirantis.azurecr.io/bm/kaas-ipam:base-focal-20220310095439 |
|
mariadb |
mirantis.azurecr.io/general/mariadb:10.4.17-bionic-20220113085105 |
|
mcc-keepalived |
mirantis.azurecr.io/lcm/mcc-keepalived:v0.14.0-1-g8725814 |
|
syslog-ng |
mirantis.azurecr.io/bm/syslog-ng:base-focal-20220128103433 |
Artifact |
Component |
Paths |
|---|---|---|
Bootstrap tarball Updated |
bootstrap-linux |
https://binary.mirantis.com/core/bin/bootstrap-linux-1.30.6.tar.gz |
bootstrap-darwin |
https://binary.mirantis.com/core/bin/bootstrap-darwin-1.30.6.tar.gz |
|
Helm charts Updated |
admission-controller |
https://binary.mirantis.com/core/helm/admission-controller-1.30.6.tgz |
agent-controller |
https://binary.mirantis.com/core/helm/agent-controller-1.30.6.tgz |
|
aws-credentials-controller |
https://binary.mirantis.com/core/helm/aws-credentials-controller-1.30.6.tgz |
|
aws-provider |
https://binary.mirantis.com/core/helm/aws-provider-1.30.6.tgz |
|
azure-credentials-controller |
https://binary.mirantis.com/core/helm/azure-credentials-controller-1.30.6.tgz |
|
azure-provider |
https://binary.mirantis.com/core/helm/azure-provider-1.30.6.tgz |
|
baremetal-provider |
https://binary.mirantis.com/core/helm/baremetal-provider-1.30.6.tgz |
|
byo-credentials-controller |
https://binary.mirantis.com/core/helm/byo-credentials-controller-1.30.6.tgz |
|
byo-provider |
https://binary.mirantis.com/core/helm/byo-provider-1.30.6.tgz |
|
ceph-kcc-controller New |
https://binary.mirantis.com/core/helm/ceph-kcc-controller-1.30.6.tgz |
|
cert-manager |
https://binary.mirantis.com/core/helm/cert-manager-1.30.6.tgz |
|
client-certificate-controller |
https://binary.mirantis.com/core/helm/client-certificate-controller-1.30.6.tgz |
|
equinix-credentials-controller |
https://binary.mirantis.com/core/helm/equinix-credentials-controller-1.30.6.tgz |
|
equinix-provider |
https://binary.mirantis.com/core/helm/equinix-provider-1.30.6.tgz |
|
equinixmetalv2-provider |
https://binary.mirantis.com/core/helm/equinixmetalv2-provider-1.30.6.tgz |
|
event-controller |
https://binary.mirantis.com/core/helm/event-controller-1.30.6.tgz |
|
iam-controller |
https://binary.mirantis.com/core/helm/iam-controller-1.30.6.tgz |
|
kaas-exporter |
https://binary.mirantis.com/core/helm/kaas-exporter-1.30.6.tgz |
|
kaas-public-api |
https://binary.mirantis.com/core/helm/kaas-public-api-1.30.6.tgz |
|
kaas-ui |
||
lcm-controller |
https://binary.mirantis.com/core/helm/lcm-controller-1.30.6.tgz |
|
license-controller Updated |
https://binary.mirantis.com/core/helm/license-controller-1.30.6.tgz |
|
mcc-cache |
||
openstack-provider |
https://binary.mirantis.com/core/helm/openstack-provider-1.30.6.tgz |
|
os-credentials-controller |
https://binary.mirantis.com/core/helm/os-credentials-controller-1.30.6.tgz |
|
portforward-controller |
https://binary.mirantis.com/core/helm/portforward-controller-1.30.6.tgz |
|
proxy-controller |
https://binary.mirantis.com/core/helm/proxy-controller-1.30.6.tgz |
|
rbac-controller |
https://binary.mirantis.com/core/helm/rbac-controller-1.30.6.tgz |
|
release-controller |
https://binary.mirantis.com/core/helm/release-controller-1.30.8.tgz |
|
rhellicense-controller |
https://binary.mirantis.com/core/helm/rhellicense-controller-1.30.6.tgz |
|
scope-controller |
http://binary.mirantis.com/core/helm/scope-controller-1.30.6.tgz |
|
squid-proxy |
https://binary.mirantis.com/core/helm/squid-proxy-1.30.6.tgz |
|
vsphere-credentials-controller |
https://binary.mirantis.com/core/helm/vsphere-credentials-controller-1.30.6.tgz |
|
vsphere-provider |
https://binary.mirantis.com/core/helm/vsphere-provider-1.30.6.tgz |
|
user-controller |
https://binary.mirantis.com/core/helm/user-controller-1.30.6.tgz |
|
Docker images |
admission-controller Updated |
mirantis.azurecr.io/core/admission-controller:1.30.6 |
agent-controller Updated |
mirantis.azurecr.io/core/agent-controller:1.30.6 |
|
aws-cluster-api-controller Updated |
mirantis.azurecr.io/core/aws-cluster-api-controller:1.30.6 |
|
aws-credentials-controller Updated |
mirantis.azurecr.io/core/aws-credentials-controller:1.30.6 |
|
azure-cluster-api-controller Updated |
mirantis.azurecr.io/core/azure-cluster-api-controller:1.30.6 |
|
azure-credentials-controller Updated |
mirantis.azurecr.io/core/azure-credentials-controller:1.30.6 |
|
byo-cluster-api-controller Updated |
mirantis.azurecr.io/core/byo-cluster-api-controller:1.30.6 |
|
byo-credentials-controller Updated |
mirantis.azurecr.io/core/byo-credentials-controller:1.30.6 |
|
ceph-kcc-controller New |
mirantis.azurecr.io/core/ceph-kcc-controller:v1.30.6 |
|
cert-manager-controller Updated |
mirantis.azurecr.io/core/external/cert-manager-controller:v1.6.1 |
|
client-certificate-controller Updated |
mirantis.azurecr.io/core/client-certificate-controller:1.30.6 |
|
cluster-api-provider-baremetal Updated |
mirantis.azurecr.io/core/cluster-api-provider-baremetal:1.30.6 |
|
cluster-api-provider-equinix Updated |
mirantis.azurecr.io/core/cluster-api-provider-equinix:1.30.6 |
|
equinix-credentials-controller Updated |
mirantis.azurecr.io/core/equinix-credentials-controller:1.30.6 |
|
frontend Updated |
mirantis.azurecr.io/core/frontend:1.30.6 |
|
haproxy |
mirantis.azurecr.io/lcm/mcc-haproxy:v0.12.0-8-g6fabf1c |
|
iam-controller Updated |
mirantis.azurecr.io/core/iam-controller:1.30.6 |
|
kproxy Updated |
mirantis.azurecr.io/lcm/kproxy:1.30.6 |
|
lcm-controller Updated |
mirantis.azurecr.io/core/lcm-controller:v0.3.0-230-gdc7efe1c |
|
license-controller Updated |
mirantis.azurecr.io/core/license-controller:1.30.6 |
|
mcc-keepalived |
mirantis.azurecr.io/lcm/mcc-keepalived:v0.14.0-1-g8725814 |
|
openstack-cluster-api-controller Updated |
mirantis.azurecr.io/core/openstack-cluster-api-controller:1.30.6 |
|
os-credentials-controller Updated |
mirantis.azurecr.io/core/os-credentials-controller:1.30.6 |
|
portforward-controller Updated |
mirantis.azurecr.io/core/portforward-controller:1.30.6 |
|
rbac-controller Updated |
mirantis.azurecr.io/core/rbac-controller:1.30.6 |
|
registry |
mirantis.azurecr.io/lcm/registry:2.7.1 |
|
release-controller Updated |
mirantis.azurecr.io/core/release-controller:1.30.8 |
|
rhellicense-controller Updated |
mirantis.azurecr.io/core/rhellicense-controller:1.30.6 |
|
scope-controller Updated |
mirantis.azurecr.io/core/scope-controller:1.30.6 |
|
squid-proxy |
mirantis.azurecr.io/core/squid-proxy:0.0.1-6 |
|
vsphere-cluster-api-controller Updated |
mirantis.azurecr.io/core/vsphere-api-controller:1.30.6 |
|
vsphere-credentials-controller Updated |
mirantis.azurecr.io/core/vsphere-credentials-controller:1.30.6 |
|
user-controller Updated |
mirantis.azurecr.io/core/user-controller:1.30.6 |
Artifact |
Component |
Path |
|---|---|---|
Binaries |
hash-generate-linux |
http://binary.mirantis.com/iam/bin/hash-generate-0.0.1-268-3cf7f17-linux |
hash-generate-darwin |
http://binary.mirantis.com/iam/bin/hash-generate-0.0.1-268-3cf7f17-darwin |
|
iamctl-linux Updated |
||
iamctl-darwin Updated |
||
iamctl-windows Updated |
||
Helm charts |
iam |
|
iam-proxy |
||
keycloak_proxy Updated |
http://binary.mirantis.com/core/helm/keycloak_proxy-1.30.9.tgz |
|
Docker images |
api Deprecated |
mirantis.azurecr.io/iam/api:0.5.5 |
auxiliary |
mirantis.azurecr.io/iam/auxiliary:0.5.5 |
|
kubernetes-entrypoint |
mirantis.azurecr.io/iam/external/kubernetes-entrypoint:v0.3.1 |
|
mariadb |
mirantis.azurecr.io/general/mariadb:10.4.16-bionic-20201105025052 |
|
keycloak |
mirantis.azurecr.io/iam/keycloak:0.5.4 |
|
keycloak-gatekeeper |
mirantis.azurecr.io/iam/keycloak-gatekeeper:7.1.3-2 |
The Mirantis Container Cloud GA release 2.16.1 is based on 2.16.0 and:
Introduces support for the Cluster release 8.6.0 that is based on the Cluster release 7.6.0 and represents Mirantis OpenStack for Kubernetes (MOSK) 22.2. This Cluster release is based on the updated version of Mirantis Kubernetes Engine 3.4.7 with Kubernetes 1.20 and Mirantis Container Runtime 20.10.8.
Does not support new deployments based on the deprecated Cluster releases 8.5.0, 7.5.0, 6.20.0, and 5.22.0 that were deprecated in 2.16.0.
For details about the Container Cloud release 2.16.1, refer to its parent release 2.16.0:
Caution
Make sure to update the Cluster release version of your managed cluster before the current Cluster release version becomes unsupported by a new Container Cloud release version. Otherwise, Container Cloud stops auto-upgrade and eventually Container Cloud itself becomes unsupported.
The Mirantis Container Cloud GA release 2.16.0:
Introduces support for the Cluster release 11.0.0 for managed clusters that is based on Mirantis Container Runtime 20.10.8 and the updated version of Mirantis Kubernetes Engine 3.5.1 with Kubernetes 1.21.
Introduces support for the Cluster release 7.6.0 for all types of clusters that is based on Mirantis Container Runtime 20.10.8 and the updated version of Mirantis Kubernetes Engine 3.4.7 with Kubernetes 1.20.
Supports the Cluster release 8.5.0 that is based on the Cluster release 7.5.0 and represents Mirantis OpenStack for Kubernetes (MOSK) 22.1.
Does not support greenfield deployments on deprecated Cluster releases 7.5.0, 6.20.0, and 5.22.0. Use the latest Cluster releases of the series instead.
Caution
Make sure to update the Cluster release version of your managed cluster before the current Cluster release version becomes unsupported by a new Container Cloud release version. Otherwise, Container Cloud stops auto-upgrade and eventually Container Cloud itself becomes unsupported.
This section outlines release notes for the Container Cloud release 2.16.0.
This section outlines new features and enhancements introduced in the Mirantis Container Cloud release 2.16.0. For the list of enhancements in the Cluster releases 11.0.0 and 7.6.0 that are introduced by the Container Cloud release 2.16.0, see the Cluster releases.
Implemented a mechanism for the Container Cloud and MKE license update using the Container Cloud web UI. During the automatic license update, machines are not cordoned and drained and user workloads are not interrupted for all clusters starting from Cluster releases 7.6.0, 8.6.0, and 11.0.0. Therefore, after your management cluster upgrades to Container Cloud 2.16.0, make sure to update your managed clusters to the latest available Cluster releases.
Caution
Only the Container Cloud web UI users with the
m:kaas@global-admin role can update the Container Cloud license.
TechPreview
Implemented initial Technology Preview support for management cluster upgrade scheduling through the Container Cloud web UI. Also, added full support for management cluster upgrade scheduling through CLI.
Learn more
Implemented automatic renewal of self-signed TLS certificates for internal Container Cloud services that are generated and managed by the Container Cloud provider.
Note
Custom certificates still require manual renewal. If applicable, the information about expiring custom certificates is available in the Container Cloud web UI.
TechPreview
Implemented initial Technology Preview support for Ubuntu 20.04 (Focal Fossa) on bare metal non-MOSK-based greenfield deployments of managed clusters. Now, you can optionally deploy Kubernetes machines with Ubuntu 20.04 on bare metal hosts. By default, Ubuntu 18.04 is used.
Caution
Upgrading to Ubuntu 20.04 on existing deployments initially created before Container Cloud 2.16.0 is not supported.
Note
Support for Ubuntu 20.04 on MOSK-based Cluster releases will be added in one of the following Container Cloud releases.
Learn more
Extended the regional clusters support by implementing the ability to deploy an additional regional cluster on bare metal. This provides an ability to create baremetal-based managed clusters in bare metal regions in parallel with managed clusters of other private-based regional clusters within a single Container Cloud deployment.
TechPreview
Implemented the initial Technology Preview support for Mirantis OpenStack for Kubernetes (MOSK) deployment on local software-based Redundant Array of Independent Disks (RAID) devices to withstand failure of one device at a time. The feature is available in the Cluster release 8.5.0 after the Container Cloud upgrade to 2.16.0.
Using a custom bare metal host profile, you can configure and create
an mdadm-based software RAID device of type raid10 if you have
an even number of devices available on your servers. At least four
storage devices are required for such RAID device.
Implemented the ability to use any interface name instead of the k8s-lcm
bridge for the LCM network traffic on a bare metal cluster. The Subnet
objects for the LCM network must have the ipam/SVC-k8s-lcm label.
For details, see Service labels and their life cycle.
For the Container Cloud managed clusters that are based on vSphere, Equinix Metal, or bare metal, moved Keepalived for the built-in load balancer to run in standalone Docker containers managed by systemd as a service. This change ensures version consistency of crucial infrastructure services and reduces dependency on a host operating system version and configuration.
Learn more
Reworked the Reconfigure phase applicable to LCMMachine that now can
apply to all nodes. This phase runs after the Deploy phase to apply
stateItems that relate to this phase without affecting workloads
running on the machine.
Learn more
The following issues have been addressed in the Mirantis Container Cloud release 2.16.0 along with the Cluster releases 11.0.0 and 7.6.0:
Bare metal:
[15989] Fixed the issue wherein removal of a bare metal-based management cluster failed with a timeout.
[20189] Fixed the issue with the Container Cloud web UI reporting a successful upgrade of a baremetal-based management cluster while running the previous release.
OpenStack:
[20992] Fixed the issue that caused inability to deploy an OpenStack-based managed cluster if DVR was enabled.
[20549] Fixed the CVE-2021-3520 security vulnerability in the
cinder-csi-plugin imageDocker image.
Equinix Metal:
[20467] Fixed the issue that caused deployment of an Equinix Metal based management cluster with private networking to fail with the following error message during the Ironic deployment:
0/3 nodes are available: 3 pod has unbound immediate PersistentVolumeClaims.
[21324] Fixed the issue wherein the bare metal host was trying to configure an Equinix node as UEFI even for nodes with UEFI disabled.
[21326] Fixed the issue wherein the Ironic agent could not properly determine which disk will be the first disk on the node. As a result, some Equinix servers failed to boot from the proper disk.
[21338] Fixed the issue wherein some Equinix servers were configured in BIOS to always boot from PXE, which caused the operation system to fail to start from disk after provisioning.
StackLight:
[21646] Adjusted the
kaas-exporterresource requests and limits to avoid issues with thekaas-exportercontainer being occassionally throttled and OOMKilled, preventing the Container Cloud metrics gathering.[20591] Adjusted the RAM usage limit and disabled indices monitoring for
prometheus-es-exporterto avoidprometheus-es-exporterpod crash looping due to low memory issues.[17493] Fixed the following security vulnerabilities in the
fluentdandspiloDocker images:
Ceph:
[20745] Fixed the issue wherein namespace deletion failed after removal of a managed cluster.
[7073] Fixed the issue with inability to automatically remove a Ceph node when removing a worker node.
IAM:
[20157] Fixed the CVE-2019-20916 security vulnerability in IAM.
This section lists known issues with workarounds for the Mirantis Container Cloud release 2.16.0 including the Cluster releases 11.0.0 and 7.6.0.
For other issues that can occur while deploying and operating a Container Cloud cluster, see Troubleshooting Guide.
Note
This section also outlines still valid known issues from previous Container Cloud releases.
A managed cluster deployment, attachment, or update to a Cluster release with
MKE versions 3.3.13, 3.4.6, 3.5.1, or earlier may fail with the
compose pods flapping (ready > terminating > pending) and with the
following error message appearing in logs:
'not ready: deployments: kube-system/compose got 0/0 replicas, kube-system/compose-api
got 0/0 replicas'
ready: false
type: Kubernetes
Workaround:
Disable Docker Content Trust (DCT):
Access the MKE web UI as admin.
Navigate to Admin > Admin Settings.
In the left navigation pane, click Docker Content Trust and disable it.
Restart the affected deployments such as
calico-kube-controllers,compose,compose-api,coredns, and so on:kubectl -n kube-system delete deployment <deploymentName>
Once done, the cluster deployment or update resumes.
Re-enable DCT.
The default deployment limits for Equinix and AWS controller containers
set to 400m may be lower than the consumed amount of resources leading
to KubeContainersCPUThrottlingHigh alerts in StackLight.
As a workaround, increase the default resource limits for the affected
equinix-controllers or aws-controllers to 700m. For example:
kubectl edit deployment -n kaas aws-controllers
spec:
...
resources:
limits:
cpu: 700m
...
An Equinix-based management or managed cluster fails to update with the
FailedAttachVolume and FailedMount warnings.
Workaround:
Verify that the description of the pods that failed to run contain the
FailedMountevents:kubectl -n <affectedProjectName> describe pod <affectedPodName>
<affectedProjectName>is the Container Cloud project name where the pods failed to run<affectedPodName>is a pod name that failed to run in this project
In the pod description, identify the node name where the pod failed to run.
Verify that the
csi-rbdpluginlogs of the affected node contain the rbd volume mount failed: <csi-vol-uuid> is being used error. The<csi-vol-uuid>is a unique RBD volume name.Identify
csiPodNameof the correspondingcsi-rbdplugin:kubectl -n rook-ceph get pod -l app=csi-rbdplugin \ -o jsonpath='{.items[?(@.spec.nodeName == "<nodeName>")].metadata.name}'
Output the affected
csiPodNamelogs:kubectl -n rook-ceph logs <csiPodName> -c csi-rbdplugin
Scale down the affected
StatefulSetorDeploymentof the pod that fails to init to0replicas.On every
csi-rbdpluginpod, search for stuckcsi-vol:for pod in `kubectl -n rook-ceph get pods|grep rbdplugin|grep -v provisioner|awk '{print $1}'`; do echo $pod kubectl exec -it -n rook-ceph $pod -c csi-rbdplugin -- rbd device list | grep <csi-vol-uuid> done
Unmap the affected
csi-vol:rbd unmap -o force /dev/rbd<i>
The
/dev/rbd<i>value is a mapped RBD volume that usescsi-vol.Delete
volumeattachmentof the affected pod:kubectl get volumeattachments | grep <csi-vol-uuid> kubectl delete volumeattacmhent <id>
Scale up the affected
StatefulSetorDeploymentback to the original number of replicas and wait until its state isRunning.
If a baremetal-based regional cluster deployment fails before pivoting is done, the corresponding region deletion fails.
Workaround:
Using the command below, manually delete all possible traces of the failed
regional cluster deployment, including but not limited to the following
objects that contain the kaas.mirantis.com/region label of the affected
region:
clustermachinebaremetalhostbaremetalhostprofilel2templatesubnetipamhostipaddr
kubectl delete <objectName> -l kaas.mirantis.com/region=<regionName>
Warning
Do not use the same region name again after the regional cluster deployment failure since some objects that reference the region name may still exist.
Deployment of a bare metal node with an mdadm-based raid10 with LVM
enabled fails during provisioning due to insufficient cleanup of RAID devices.
Workaround:
Boot the affected node from any LiveCD, preferably Ubuntu.
Obtain details about the mdadm RAID devices:
sudo mdadm --detail --scan --verbose
Stop all mdadm RAID devices listed in the output of the above command. For example:
sudo mdadm --stop /dev/md0
Clean up the metadata on partitions with the mdadm RAID device(s) enabled. For example:
sudo mdadm --zero-superblock /dev/sda1
In the above example, replace
/dev/sda1with partitions listed in the output of the command provided in the step 2.
If you run bootstrap.sh preflight with
KAAS_BM_FULL_PREFLIGHT=true, the script fails with the following message:
preflight check failed: preflight full check failed: \
error waiting for BareMetalHosts to power on: \
timed out waiting for the condition
Workaround:
Unset full preflight using the
unset KAAS_BM_FULL_PREFLIGHTenvironment variable.Rerun bootstrap.sh preflight that executes fast preflight instead.
Note
Moving forward, the workaround for this issue will be moved from Release Notes to Operations Guide: Troubleshoot StackLight.
On a managed cluster, the StackLight pods may get stuck with the
Pod predicate NodeAffinity failed error in the pod status. The issue may
occur if the StackLight node label was added to one machine and
then removed from another one.
The issue does not affect the StackLight services, all required StackLight pods migrate successfully except extra pods that are created and stuck during pod migration.
As a workaround, remove the stuck pods:
kubectl --kubeconfig <managedClusterKubeconfig> -n stacklight delete pod <stuckPodName>
In rare cases, StackLight applications may receive the wrong TLS certificates, which prevents them to start correctly.
As a workaround, delete the old secret for the affected StackLight
component. For example, for iam-proxy-alerta:
kubectl -n stacklight delete secret iam-proxy-alerta-tls-certs
The cordon-drain states are not removed after the maintenance mode is unset
for a machine. This issue may occur due to the maintenance transition
being stuck on the NodeWorkloadLock object.
Workaround:
Select from the following options:
Disable the maintenance mode on the affected cluster as described in Enable cluster and machine maintenance mode.
Edit
LCMClusterStatein thespecsection by settingvalueto"false":kubectl edit lcmclusterstates -n <projectName> <LCMCLusterStateName>
apiVersion: lcm.mirantis.com/v1alpha1 kind: LCMClusterState metadata: ... spec: ... value: "false"
Affects Ubuntu-based clusters deployed after Feb 10, 2022
If you deploy an Ubuntu-based cluster using the deprecated Cluster release
7.4.0 (and earlier) or 5.21.0 (and earlier) starting from February 10, 2022,
the cluster update to the Cluster releases 7.5.0 and 5.22.0 may get stuck
while applying the Deploy state to the cluster machines. The issue
affects all cluster types: management, regional, and managed.
To verify that the cluster is affected:
Log in to the Container Cloud web UI.
In the Clusters tab, capture the RELEASE and AGE values of the required Ubuntu-based cluster. If the values match the ones from the issue description, the cluster may be affected.
Using SSH, log in to the manager or worker node that got stuck while applying the
Deploystate and identify the containerd package version:containerd --versionIf the version is 1.5.9, the cluster is affected.
In
/var/log/lcm/runners/<nodeName>/deploy/, verify whether the Ansible deployment logs contain the following errors that indicate that the cluster is affected:The following packages will be upgraded: docker-ee docker-ee-cli The following packages will be DOWNGRADED: containerd.io STDERR: E: Packages were downgraded and -y was used without --allow-downgrades.
Workaround:
Warning
Apply the steps below to the affected nodes one-by-one and
only after each consecutive node gets stuck on the Deploy phase with the
Ansible log errors. Such sequence ensures that each node is cordon-drained
and Docker is properly stopped. Therefore, no workloads are affected.
Using SSH, log in to the first affected node and install containerd 1.5.8:
apt-get install containerd.io=1.5.8-1 -y --allow-downgrades --allow-change-held-packages
Wait for Ansible to reconcile. The node should become
Readyin several minutes.Wait for the next node of the cluster to get stuck on the
Deployphase with the Ansible log errors. Only after that, apply the steps above on the next node.Patch the remaining nodes one-by-one using the steps above.
Affects only Container Cloud 2.18.0 and earlier
A project that is newly created in the Container Cloud web UI does not display in the Projects list even after refreshing the page. The issue occurs due to the token missing the necessary role for the new project. As a workaround, relogin to the Container Cloud web UI.
After a successful deployment of a management or regional cluster, controller
pods may be OOMkilled and get stuck in CrashLoopBackOff state due to
incorrect memory limits.
Workaround:
Increase memory resources limits on the affected Deployment:
Open the affected
Deploymentconfiguration for editing:kubectl --kubeconfig <mgmtOrRegionalKubeconfig> -n kaas edit deployment <deploymentName>
Update the value of
spec.template.spec.containers.resources.limitsby 100-200 Mi. For example:spec: template: spec: containers: - ... resources: limits: cpu: "3" memory: 500Mi requests: cpu: "1" memory: 300Mi
The following table lists the major components and their versions of the Mirantis Container Cloud release 2.16.0.
Note
The components that are newly added, updated, deprecated, or removed
as compared to the previous release version, are marked
with a corresponding superscript,
for example, lcm-ansible Updated.
Component |
Application/Service |
Version |
|---|---|---|
AWS Updated |
aws-provider |
1.29.6 |
aws-credentials-controller |
1.29.6 |
|
Azure Updated |
azure-provider |
1.29.6 |
azure-credentials-controller |
1.29.6 |
|
Bare metal |
ambassador |
1.20.1-alpine |
baremetal-operator Updated |
6.1.2 |
|
baremetal-public-api Updated |
6.1.3 |
|
baremetal-provider Updated |
1.29.9 |
|
baremetal-resource-controller Updated |
base-focal-20220128182941 |
|
ironic Updated |
victoria-bionic-20220208100053 |
|
ironic-operator Updated |
base-focal-20220217095047 |
|
kaas-ipam Updated |
base-focal-20220131093130 |
|
keepalived Updated |
2.1.5 |
|
local-volume-provisioner |
2.5.0-mcp |
|
mariadb Updated |
10.4.17-bionic-20220113085105 |
|
IAM |
iam Updated |
2.4.14 |
iam-controller Updated |
1.29.6 |
|
keycloak |
15.0.2 |
|
Container Cloud |
admission-controller Updated |
1.29.7 |
agent-controller Updated |
1.29.6 |
|
byo-credentials-controller Updated |
1.29.6 |
|
byo-provider Updated |
1.29.6 |
|
cert-manager New |
1.29.6 |
|
client-certificate-controller New |
1.29.6 |
|
event-controller New |
1.29.6 |
|
golang Updated |
1.17.6 |
|
kaas-public-api Updated |
1.29.6 |
|
kaas-exporter Updated |
1.29.6 |
|
kaas-ui Updated |
1.29.6 |
|
lcm-controller Updated |
0.3.0-187-gba894556 |
|
license-controller New |
1.29.6 |
|
mcc-cache Updated |
1.29.6 |
|
portforward-controller Updated |
1.29.6 |
|
proxy-controller Updated |
1.29.6 |
|
rbac-controller Updated |
1.29.6 |
|
release-controller Updated |
1.29.7 |
|
rhellicense-controller Updated |
1.29.6 |
|
scope-controller Updated |
1.29.6 |
|
squid-proxy |
0.0.1-6 |
|
user-controller Updated |
1.29.6 |
|
Equinix Metal Updated |
equinix-provider |
1.29.6 |
equinix-credentials-controller |
1.29.6 |
|
keepalived |
2.1.5 |
|
OpenStack Updated |
openstack-provider |
1.29.6 |
os-credentials-controller |
1.29.6 |
|
VMware vSphere Updated |
vsphere-provider |
1.29.6 |
vsphere-credentials-controller |
1.29.6 |
|
keepalived |
2.1.5 |
This section lists the components artifacts of the Mirantis Container Cloud release 2.16.0.
Note
The components that are newly added, updated, deprecated, or removed
as compared to the previous release version, are marked
with a corresponding superscript,
for example, lcm-ansible Updated.
Artifact |
Component |
Path |
|---|---|---|
Binaries |
baremetal-operator Updated |
https://binary.mirantis.com/bm/helm/baremetal-operator-6.1.2.tgz |
baremetal-public-api Updated |
https://binary.mirantis.com/bm/helm/baremetal-public-api-6.1.3.tgz |
|
ironic-python-agent-bionic.kernel Removed |
Replaced with |
|
ironic-python-agent-bionic.initramfs Removed |
Replaced with |
|
ironic-python-agent.initramfs New |
https://binary.mirantis.com/bm/bin/ironic/ipa/ubuntu/initramfs-victoria-focal-debug-20220208120746 |
|
ironic-python-agent.kernel New |
https://binary.mirantis.com/bm/bin/ironic/ipa/ubuntu/kernel-victoria-focal-debug-20220208120746 |
|
kaas-ipam Updated |
||
local-volume-provisioner |
https://binary.mirantis.com/bm/helm/local-volume-provisioner-2.5.0-mcp.tgz |
|
provisioning_ansible Updated |
https://binary.mirantis.com/bm/bin/ansible/provisioning_ansible-0.1.1-102-08af94e.tgz |
|
target ubuntu system |
https://binary.mirantis.com/bm/bin/efi/ubuntu/tgz-bionic-20210622161844 |
|
Docker images |
ambassador |
mirantis.azurecr.io/general/external/docker.io/library/nginx:1.20.1-alpine |
baremetal-operator Updated |
mirantis.azurecr.io/bm/baremetal-operator:base-focal-20220208045851 |
|
baremetal-resource-controller Updated |
mirantis.azurecr.io/bm/baremetal-resource-controller:base-focal-20220128182941 |
|
dynamic_ipxe New |
mirantis.azurecr.io/bm/dnsmasq/dynamic-ipxe:base-focal-20220126144549 |
|
dnsmasq Updated |
mirantis.azurecr.io/general/dnsmasq:focal-20210617094827 |
|
ironic Updated |
mirantis.azurecr.io/openstack/ironic:victoria-bionic-20220208100053 |
|
ironic-inspector Updated |
mirantis.azurecr.io/openstack/ironic-inspector:victoria-bionic-20220208100053 |
|
ironic-operator Updated |
mirantis.azurecr.io/bm/ironic-operator:base-focal-20220217095047 |
|
ironic-prometheus-exporter |
mirantis.azurecr.io/stacklight/ironic-prometheus-exporter:0.1-20210608113804 |
|
kaas-ipam Updated |
mirantis.azurecr.io/bm/kaas-ipam:base-focal-20220131093130 |
|
mariadb Updated |
mirantis.azurecr.io/general/mariadb:10.4.17-bionic-20220113085105 |
|
mcc-keepalived New |
mirantis.azurecr.io/lcm/mcc-keepalived:v0.14.0-1-g8725814 |
|
syslog-ng Updated |
mirantis.azurecr.io/bm/syslog-ng:base-focal-20220128103433 |
Artifact |
Component |
Paths |
|---|---|---|
Bootstrap tarball Updated |
bootstrap-linux |
https://binary.mirantis.com/core/bin/bootstrap-linux-1.29.6.tar.gz |
bootstrap-darwin |
https://binary.mirantis.com/core/bin/bootstrap-darwin-1.29.6.tar.gz |
|
Helm charts Updated |
admission-controller |
https://binary.mirantis.com/core/helm/admission-controller-1.29.7.tgz |
agent-controller |
https://binary.mirantis.com/core/helm/agent-controller-1.29.6.tgz |
|
aws-credentials-controller |
https://binary.mirantis.com/core/helm/aws-credentials-controller-1.29.6.tgz |
|
aws-provider |
https://binary.mirantis.com/core/helm/aws-provider-1.29.6.tgz |
|
azure-credentials-controller |
https://binary.mirantis.com/core/helm/azure-credentials-controller-1.29.6.tgz |
|
azure-provider |
https://binary.mirantis.com/core/helm/azure-provider-1.29.6.tgz |
|
baremetal-provider |
https://binary.mirantis.com/core/helm/baremetal-provider-1.29.9.tgz |
|
byo-credentials-controller |
https://binary.mirantis.com/core/helm/byo-credentials-controller-1.29.6.tgz |
|
byo-provider |
https://binary.mirantis.com/core/helm/byo-provider-1.29.6.tgz |
|
cert-manager New |
https://binary.mirantis.com/core/helm/cert-manager-1.29.6.tgz |
|
client-certificate-controller New |
https://binary.mirantis.com/core/helm/client-certificate-controller-1.29.6.tgz |
|
equinix-credentials-controller |
https://binary.mirantis.com/core/helm/equinix-credentials-controller-1.29.6.tgz |
|
equinix-provider |
https://binary.mirantis.com/core/helm/equinix-provider-1.29.6.tgz |
|
equinixmetalv2-provider |
https://binary.mirantis.com/core/helm/equinixmetalv2-provider-1.29.6.tgz |
|
event-controller New |
https://binary.mirantis.com/core/helm/event-controller-1.29.6.tgz |
|
iam-controller |
https://binary.mirantis.com/core/helm/iam-controller-1.29.6.tgz |
|
kaas-exporter |
https://binary.mirantis.com/core/helm/kaas-exporter-1.29.6.tgz |
|
kaas-public-api |
https://binary.mirantis.com/core/helm/kaas-public-api-1.29.6.tgz |
|
kaas-ui |
||
lcm-controller |
https://binary.mirantis.com/core/helm/lcm-controller-1.29.6.tgz |
|
license-controller New |
https://binary.mirantis.com/core/helm/license-controller-1.29.6.tgz |
|
mcc-cache |
||
openstack-provider |
https://binary.mirantis.com/core/helm/openstack-provider-1.29.6.tgz |
|
os-credentials-controller |
https://binary.mirantis.com/core/helm/os-credentials-controller-1.29.6.tgz |
|
portforward-controller |
https://binary.mirantis.com/core/helm/portforward-controller-1.29.6.tgz |
|
proxy-controller |
https://binary.mirantis.com/core/helm/proxy-controller-1.29.6.tgz |
|
rbac-controller |
https://binary.mirantis.com/core/helm/rbac-controller-1.29.6.tgz |
|
release-controller |
https://binary.mirantis.com/core/helm/release-controller-1.29.7.tgz |
|
rhellicense-controller |
https://binary.mirantis.com/core/helm/rhellicense-controller-1.29.6.tgz |
|
scope-controller |
http://binary.mirantis.com/core/helm/scope-controller-1.29.6.tgz |
|
squid-proxy |
https://binary.mirantis.com/core/helm/squid-proxy-1.29.6.tgz |
|
vsphere-credentials-controller |
https://binary.mirantis.com/core/helm/vsphere-credentials-controller-1.29.6.tgz |
|
vsphere-provider |
https://binary.mirantis.com/core/helm/vsphere-provider-1.29.6.tgz |
|
user-controller |
https://binary.mirantis.com/core/helm/user-controller-1.29.6.tgz |
|
Docker images |
admission-controller Updated |
mirantis.azurecr.io/core/admission-controller:1.29.7 |
agent-controller Updated |
mirantis.azurecr.io/core/agent-controller:1.29.6 |
|
aws-cluster-api-controller Updated |
mirantis.azurecr.io/core/aws-cluster-api-controller:1.29.6 |
|
aws-credentials-controller Updated |
mirantis.azurecr.io/core/aws-credentials-controller:1.29.6 |
|
azure-cluster-api-controller Updated |
mirantis.azurecr.io/core/azure-cluster-api-controller:1.29.6 |
|
azure-credentials-controller Updated |
mirantis.azurecr.io/core/azure-credentials-controller:1.29.6 |
|
byo-cluster-api-controller Updated |
mirantis.azurecr.io/core/byo-cluster-api-controller:1.29.6 |
|
byo-credentials-controller Updated |
mirantis.azurecr.io/core/byo-credentials-controller:1.29.6 |
|
cert-manager-controller New |
mirantis.azurecr.io/core/external/cert-manager-controller:v1.6.1 |
|
client-certificate-controller New |
mirantis.azurecr.io/core/client-certificate-controller:1.29.6 |
|
cluster-api-provider-baremetal Updated |
mirantis.azurecr.io/core/cluster-api-provider-baremetal:1.29.6 |
|
cluster-api-provider-equinix Updated |
mirantis.azurecr.io/core/cluster-api-provider-equinix:1.29.6 |
|
equinix-credentials-controller Updated |
mirantis.azurecr.io/core/equinix-credentials-controller:1.29.6 |
|
frontend Updated |
mirantis.azurecr.io/core/frontend:1.29.6 |
|
haproxy |
mirantis.azurecr.io/lcm/mcc-haproxy:v0.12.0-8-g6fabf1c |
|
iam-controller Updated |
mirantis.azurecr.io/core/iam-controller:1.29.6 |
|
kproxy Updated |
mirantis.azurecr.io/lcm/kproxy:1.29.6 |
|
lcm-controller Updated |
mirantis.azurecr.io/core/lcm-controller:v0.3.0-187-gba894556 |
|
license-controller New |
mirantis.azurecr.io/core/license-controller:1.29.6 |
|
mcc-keepalived New |
mirantis.azurecr.io/lcm/mcc-keepalived:v0.14.0-1-g8725814 |
|
openstack-cluster-api-controller Updated |
mirantis.azurecr.io/core/openstack-cluster-api-controller:1.29.6 |
|
os-credentials-controller Updated |
mirantis.azurecr.io/core/os-credentials-controller:1.29.6 |
|
portforward-controller Updated |
mirantis.azurecr.io/core/portforward-controller:1.29.6 |
|
rbac-controller Updated |
mirantis.azurecr.io/core/rbac-controller:1.29.6 |
|
registry |
mirantis.azurecr.io/lcm/registry:2.7.1 |
|
release-controller Updated |
mirantis.azurecr.io/core/release-controller:1.29.7 |
|
rhellicense-controller Updated |
mirantis.azurecr.io/core/rhellicense-controller:1.29.6 |
|
scope-controller Updated |
mirantis.azurecr.io/core/scope-controller:1.29.6 |
|
squid-proxy |
mirantis.azurecr.io/core/squid-proxy:0.0.1-6 |
|
vsphere-cluster-api-controller Updated |
mirantis.azurecr.io/core/vsphere-api-controller:1.29.6 |
|
vsphere-credentials-controller Updated |
mirantis.azurecr.io/core/vsphere-credentials-controller:1.29.6 |
|
user-controller Updated |
mirantis.azurecr.io/core/user-controller:1.29.6 |
Artifact |
Component |
Path |
|---|---|---|
Binaries |
hash-generate-linux |
http://binary.mirantis.com/iam/bin/hash-generate-0.0.1-268-3cf7f17-linux |
hash-generate-darwin |
http://binary.mirantis.com/iam/bin/hash-generate-0.0.1-268-3cf7f17-darwin |
|
iamctl-linux Updated |
||
iamctl-darwin Updated |
||
iamctl-windows Updated |
||
Helm charts |
iam Updated |
|
iam-proxy Updated |
||
keycloak_proxy Updated |
http://binary.mirantis.com/core/helm/keycloak_proxy-1.29.8.tgz |
|
Docker images |
api Deprecated |
mirantis.azurecr.io/iam/api:0.5.5 |
auxiliary Updated |
mirantis.azurecr.io/iam/auxiliary:0.5.5 |
|
kubernetes-entrypoint |
mirantis.azurecr.io/iam/external/kubernetes-entrypoint:v0.3.1 |
|
mariadb |
mirantis.azurecr.io/general/mariadb:10.4.16-bionic-20201105025052 |
|
keycloak |
mirantis.azurecr.io/iam/keycloak:0.5.4 |
|
keycloak-gatekeeper |
mirantis.azurecr.io/iam/keycloak-gatekeeper:7.1.3-2 |
The Mirantis Container Cloud GA release 2.15.1 is based on 2.15.0 and:
Introduces support for the Cluster release 8.5.0 that is based on the Cluster release 7.5.0 and represents Mirantis OpenStack for Kubernetes (MOSK) 22.1. This Cluster release is based on Mirantis Kubernetes Engine 3.4.6 with Kubernetes 1.20 and Mirantis Container Runtime 20.10.8.
Does not support new deployments based on the Cluster releases 7.4.0 and 5.21.0 that were deprecated in 2.15.0.
For details about the Container Cloud release 2.15.1, refer to its parent release 2.15.0:
Caution
Make sure to update the Cluster release version of your managed cluster before the current Cluster release version becomes unsupported by a new Container Cloud release version. Otherwise, Container Cloud stops auto-upgrade and eventually Container Cloud itself becomes unsupported.
The Mirantis Container Cloud GA release 2.15.0:
Introduces support for the Cluster release 7.5.0 that is based on Mirantis Container Runtime 20.10.8 and the updated version of Mirantis Kubernetes Engine 3.4.6 with Kubernetes 1.20.
Introduces support for the Cluster release 5.22.0 that is based on the updated version of Mirantis Kubernetes Engine 3.3.13 with Kubernetes 1.18 and Mirantis Container Runtime 20.10.8.
Supports the Cluster release 6.20.0 that is based on the Cluster release 5.20.0 and represents Mirantis OpenStack for Kubernetes (MOS) 21.6.
Does not support greenfield deployments on deprecated Cluster releases 7.4.0, 6.19.0, and 5.21.0. Use the latest Cluster releases of the series instead.
Caution
Make sure to update the Cluster release version of your managed cluster before the current Cluster release version becomes unsupported by a new Container Cloud release version. Otherwise, Container Cloud stops auto-upgrade and eventually Container Cloud itself becomes unsupported.
This section outlines release notes for the Container Cloud release 2.15.0.
This section outlines new features and enhancements introduced in the Mirantis Container Cloud release 2.15.0. For the list of enhancements in the Cluster releases 7.5.0 and 5.22.0 that are supported by the Container Cloud release 2.15.0, see the Cluster releases.
Automatic upgrade of bare metal host operating system during cluster update
Dedicated subnet for externally accessible Kubernetes API endpoint
HAProxy instead of NGINX for vSphere, Equinix Metal, and bare metal providers
Additional regional cluster on Equinix Metal with private networking
Improvements for monitoring of machine deployment live status
Introduced automatic upgrade of Ubuntu 18.04 packages on the bare metal hosts during a management or managed cluster update.
Mirantis Container Cloud uses life cycle management tools to update the operating system packages on the bare metal hosts. Container Cloud may also trigger restart of the bare metal hosts to apply the updates, when applicable.
Warning
During managed cluster update to the latest Cluster releases available in Container Cloud 2.15.0, hosts are restarted to apply the latest supported Ubuntu 18.04 packages and update kernel to version 5.4.0-90.101.
If Ceph is installed in the cluster, the Container Cloud orchestration securely pauses the Ceph OSDs on the node before restart. This allows avoiding degradation of the storage service.
TechPreview
Implemented a capability to add a dedicated subnet for the externally accessible Kubernetes API endpoint of a baremetal-based managed cluster.
Implemented a health check mechanism to verify target server availability by reworking the high availability setup for the Container Cloud manager nodes of the vSphere, Equinix Metal, and bare metal providers to use HAProxy instead of NGINX. This change affects only the Ansible part. HAproxy deploys as a container managed directly by containerd.
Learn more
Extended the regional clusters support by implementing the capability to deploy an additional regional cluster on Equinix Metal with private networking. This provides the capability to create managed clusters in the Equinix Metal regions with private networking in parallel with managed clusters of other supported providers within a single Container Cloud deployment.
TechPreview
Introduced the initial Technology Preview support for a scheduled Container
Cloud auto-upgrade using the MCCUpgrade object named mcc-upgrade
in Kubernetes API.
An Operator can delay or reschedule Container Cloud auto-upgrade that allows:
Blocking Container Cloud upgrade process for up to 7 days from the current date and up to 30 days from the latest Container Cloud release
Limiting hours and weekdays when Container Cloud upgrade can run
Caution
Only the management cluster admin has access to the MCCUpgrade object.
You must use kubeconfig generated during the management cluster
bootstrap to access this object.
Note
Scheduling of the Container Cloud auto-upgrade using the Container Cloud web UI will be implemented in one of the following releases.
Implemented the maintenance mode for management and managed clusters and machines to prepare workloads for maintenance operations.
To enable maintenance mode on a machine, first enable maintenance mode on a related cluster.
To disable maintenance mode on a cluster, first disable maintenance mode on all machines of the cluster.
Warning
Cluster upgrades and configuration changes (except of the SSH keys setting) are unavailable while a cluster is under maintenance. Make sure you disable maintenance mode on the cluster after maintenance is complete.
Implemented the following improvements to the live status of a machine deployment that you can monitor using the Container Cloud web UI:
Increased the events coverage
Added information about cordon and drain (if a node is being cordoned, drained, or uncordoned) to the Kubelet and Swarm machine components statuses.
These improvements are implemented for all supported Container Cloud providers.
Deprecated the iam-api service and IAM CLI (the iamctl command).
The logic of the iam-api service required for Container Cloud is moved
to scope-controller.
The iam-api service is used by IAM CLI only to manage users and
permissions. Instead of IAM CLI, Mirantis recommends using the Keycloak web UI
to perform necessary IAM operations.
The iam-api service and IAM CLI will be removed in one of the following
Container Cloud releases.
Upgraded the Ceph Helm releases in the ClusterRelease object from v2 to v3.
Switching of the remaining OpenStack Helm releases for Mirantis OpenStack for
Kubernetes to v3 will be implemented in one of the following Container Cloud
releases.
On top of continuous improvements delivered to the existing Container Cloud guides, added the following procedures:
Expand IP addresses capacity in an existing cluster for the bare metal provider
The following issues have been addressed in the Mirantis Container Cloud release 2.15.0 along with the Cluster releases 7.5.0 and 5.22.0:
vSphere:
[19737] Fixed the issue with the vSphere VM template build hanging with an empty kickstart file on the vSphere deployments with the RHEL 8.4 seed node.
[19468] Fixed the issue with the ‘Failed to remove finalizer from machine’ error during cluster deletion if a RHEL license is removed before the related managed cluster was deleted.
IAM:
[5025] Updated the Keycloak version from 12.0.0 to 15.0.2 to fix the CVE-2020-2757.
[21024][Custom certificates] Fixed the issue with the readiness check failure during addition of a custom certificate for Keycloak that hung with the failed to wait for OIDC certificate to be updated timeout warning.
StackLight:
[20193] Updated the Grafana Docker image from 8.2.2 to 8.2.7 to fix the high-severity CVE-2021-43798.
[18933] Fixed the issue with the Alerta pods failing to pass the readiness check even if Patroni, the Alerta backend, operated correctly.
[19682] Fixed the issue with the Prometheus web UI URLs in notifications sent to Salesforce using the HTTP protocol instead of HTTPS on deployments with TLS enabled for IAM.
Ceph:
[19645] Fixed the issue with the Ceph OSD removal request failure during the
Processingstage.[19574] Fixed the issue with the Ceph OSD removal not cleaning up the device used for multiple OSDs.
[20298] Fixed the issue with spec validation failing during creation of
KaaSCephOperationRequest.[20355] Fixed the issue with
KaaSCephOperationRequestbeing cached after recreation with the same name, specified inmetadata.name, as the previousKaaSCephOperationRequestCR. The issue caused no removal to be performed upon applying the newKaaSCephOperationRequestCR.
Bare metal:
[19786] Fixed the issue with managed cluster deployment failing on long-running management clusters with
BareMetalHostbeing stuck in thePreparingstate and theironic-conductorandironic-apipods reporting the not enough disk space error due to thednsmasq-dhcpdlogs overflow.
Upgrade:
[20459] Fixed the issue with failure to upgrade a management or regional cluster originally deployed using the Container Cloud release earlier than 2.8.0. The failure occurred during Ansible update if a machine contained
/usr/local/share/ca-certificates/mcc.crt, which was either empty or invalid.
This section lists known issues with workarounds for the Mirantis Container Cloud release 2.15.0 including the Cluster releases 7.5.0 and 5.22.0.
For other issues that can occur while deploying and operating a Container Cloud cluster, see Troubleshooting Guide.
Note
This section also outlines still valid known issues from previous Container Cloud releases.
A managed cluster deployment, attachment, or update to a Cluster release with
MKE versions 3.3.13, 3.4.6, 3.5.1, or earlier may fail with the
compose pods flapping (ready > terminating > pending) and with the
following error message appearing in logs:
'not ready: deployments: kube-system/compose got 0/0 replicas, kube-system/compose-api
got 0/0 replicas'
ready: false
type: Kubernetes
Workaround:
Disable Docker Content Trust (DCT):
Access the MKE web UI as admin.
Navigate to Admin > Admin Settings.
In the left navigation pane, click Docker Content Trust and disable it.
Restart the affected deployments such as
calico-kube-controllers,compose,compose-api,coredns, and so on:kubectl -n kube-system delete deployment <deploymentName>
Once done, the cluster deployment or update resumes.
Re-enable DCT.
Deployment of an Equinix Metal based management cluster with private networking
may fail with the following error message during the Ironic deployment. The
issue is caused by csi-rbdplugin provisioner pods that got stuck.
0/3 nodes are available: 3 pod has unbound immediate PersistentVolumeClaims.
The workaround is to restart the csi-rbdplugin provisioner pods:
kubectl -n rook-ceph delete pod -l app=csi-rbdplugin-provisioner
After removal of a managed cluster, the namespace is not deleted due to
KaaSCephOperationRequest CRs blocking the deletion. The workaround is to
manually remove finalizers and delete the KaaSCephOperationRequest CRs.
Workaround:
Remove finalizers from all
KaaSCephOperationRequestresources:kubectl -n <managed-ns> get kaascephoperationrequest -o name | xargs -I % kubectl -n <managed-ns> patch % -p '{"metadata":{"finalizers":{}}}' --type=merge
Delete all
KaaSCephOperationRequestresources:kubectl -n <managed-ns> delete kaascephoperationrequest --all
If you run bootstrap.sh preflight with
KAAS_BM_FULL_PREFLIGHT=true, the script fails with the following message:
preflight check failed: preflight full check failed: \
error waiting for BareMetalHosts to power on: \
timed out waiting for the condition
Workaround:
Unset full preflight using the
unset KAAS_BM_FULL_PREFLIGHTenvironment variable.Rerun bootstrap.sh preflight that executes fast preflight instead.
The cordon-drain states are not removed after the maintenance mode is unset
for a machine. This issue may occur due to the maintenance transition
being stuck on the NodeWorkloadLock object.
Workaround:
Select from the following options:
Disable the maintenance mode on the affected cluster as described in Enable cluster and machine maintenance mode.
Edit
LCMClusterStatein thespecsection by settingvalueto"false":kubectl edit lcmclusterstates -n <projectName> <LCMCLusterStateName>
apiVersion: lcm.mirantis.com/v1alpha1 kind: LCMClusterState metadata: ... spec: ... value: "false"
Note
Moving forward, the workaround for this issue will be moved from Release Notes to Operations Guide: Troubleshoot StackLight.
On a managed cluster, the StackLight pods may get stuck with the
Pod predicate NodeAffinity failed error in the pod status. The issue may
occur if the StackLight node label was added to one machine and
then removed from another one.
The issue does not affect the StackLight services, all required StackLight pods migrate successfully except extra pods that are created and stuck during pod migration.
As a workaround, remove the stuck pods:
kubectl --kubeconfig <managedClusterKubeconfig> -n stacklight delete pod <stuckPodName>
On the highly loaded clusters, the kaas-exporter resource limits for CPU
and RAM are lower than the consumed amount of resources. As a result, the
kaas-exporter container is periodically throttled and OOMKilled preventing
the Container Cloud metrics gathering.
As a workaround, increase the default resource limits for kaas-exporter
in the Cluster object of the management cluster. For example:
spec:
...
providerSpec:
...
value:
...
kaas:
management:
helmReleases:
...
- name: kaas-exporter
values:
resources:
limits:
cpu: 100m
memory: 200Mi
Affects Ubuntu-based clusters deployed after Feb 10, 2022
If you deploy an Ubuntu-based cluster using the deprecated Cluster release
7.4.0 (and earlier) or 5.21.0 (and earlier) starting from February 10, 2022,
the cluster update to the Cluster releases 7.5.0 and 5.22.0 may get stuck
while applying the Deploy state to the cluster machines. The issue
affects all cluster types: management, regional, and managed.
To verify that the cluster is affected:
Log in to the Container Cloud web UI.
In the Clusters tab, capture the RELEASE and AGE values of the required Ubuntu-based cluster. If the values match the ones from the issue description, the cluster may be affected.
Using SSH, log in to the manager or worker node that got stuck while applying the
Deploystate and identify the containerd package version:containerd --versionIf the version is 1.5.9, the cluster is affected.
In
/var/log/lcm/runners/<nodeName>/deploy/, verify whether the Ansible deployment logs contain the following errors that indicate that the cluster is affected:The following packages will be upgraded: docker-ee docker-ee-cli The following packages will be DOWNGRADED: containerd.io STDERR: E: Packages were downgraded and -y was used without --allow-downgrades.
Workaround:
Warning
Apply the steps below to the affected nodes one-by-one and
only after each consecutive node gets stuck on the Deploy phase with the
Ansible log errors. Such sequence ensures that each node is cordon-drained
and Docker is properly stopped. Therefore, no workloads are affected.
Using SSH, log in to the first affected node and install containerd 1.5.8:
apt-get install containerd.io=1.5.8-1 -y --allow-downgrades --allow-change-held-packages
Wait for Ansible to reconcile. The node should become
Readyin several minutes.Wait for the next node of the cluster to get stuck on the
Deployphase with the Ansible log errors. Only after that, apply the steps above on the next node.Patch the remaining nodes one-by-one using the steps above.
Under certain conditions, the upgrade of the baremetal-based management
cluster may get stuck even though the Container Cloud web UI reports a
successful upgrade. The issue is caused by inconsistent metadata in IPAM that
prevents automatic allocation of the Ceph network. It happens when IPAddr
objects associated with the management cluster nodes refer to a non-existent
Subnet object by the resource UID.
To verify whether the cluster is affected:
Inspect the
baremetal-providerlogs:kubectl -n kaas logs deployments/baremetal-provider
If the logs contain the following entries, the cluster may be affected:
Ceph public network address validation failed for cluster default/kaas-mgmt: invalid address '0.0.0.0/0' \ Ceph cluster network address validation failed for cluster default/kaas-mgmt: invalid address '0.0.0.0/0' \ 'default/kaas-mgmt' cluster nodes internal (LCM) IP addresses: 10.64.96.171,10.64.96.172,10.64.96.173 \ failed to configure ceph network for cluster default/kaas-mgmt: \ Ceph network addresses auto-assignment error: validation failed for Ceph network addresses: \ error parsing address '': invalid CIDR address:
Empty values of the network parameters in the last entry indicate that the provider cannot locate the
Subnetobject based on the data from theIPAddrobject.Note
In the logs, capture the
internal (LCM) IP addressesof the cluster nodes to use them later in this procedure.Validate the network address used for Ceph by inspecting the
MiraCephobject:kubectl -n ceph-lcm-mirantis get miraceph -o yaml | egrep "^ +clusterNet:" kubectl -n ceph-lcm-mirantis get miraceph -o yaml | egrep "^ +publicNet:"
In the system response, verify that the
clusterNetandpublicNetvalues do not contain the0.0.0.0/0range.Example of the system response on the affected cluster:
clusterNet: 0.0.0.0/0 publicNet: 0.0.0.0/0
Workaround:
Add a label to the
Subnetobject:Note
To obtain the correct name of the label, use one of the cluster nodes internal (LCM) IP addresses from the
baremetal-providerlogs.Add
SUBNETIDas an environment variable to theIPAddrobject. For example:SUBNETID=$(kubectl get ipaddr -n default --selector=ipam/IP=10.64.96.171 -o custom-columns=":metadata.labels.ipam/SubnetID" | tr -d '\n')
Use the
SUBNETIDvariable to restore the required label in theSubnetobject:kubectl -n default label subnet master-region-one ipam/UID-${SUBNETID}="1"
Verify that the
cluster.sigs.k8s.io/cluster-namelabel exists forIPaddrobjects:kubectl -n default get ipaddr --show-labels|grep "cluster.sigs.k8s.io/cluster-name"
Skip the next step if all
IPaddrobjects corresponding to the management cluster nodes have this label.Add the
cluster.sigs.k8s.io/cluster-namelabel toIPaddrobjects:IPADDRNAMES=$(kubectl -n default get ipaddr -o custom-columns=":metadata.name") for IP in $IPADDRNAMES; do kubectl -n default label ipaddr $IP cluster.sigs.k8s.io/cluster-name=<managementClusterName>; done
In the command above, substitute
<managementClusterName>with the corresponding value.
An Equinix-based management or managed cluster fails to update with the
FailedAttachVolume and FailedMount warnings.
Workaround:
Verify that the description of the pods that failed to run contain the
FailedMountevents:kubectl -n <affectedProjectName> describe pod <affectedPodName>
<affectedProjectName>is the Container Cloud project name where the pods failed to run<affectedPodName>is a pod name that failed to run in this project
In the pod description, identify the node name where the pod failed to run.
Verify that the
csi-rbdpluginlogs of the affected node contain the rbd volume mount failed: <csi-vol-uuid> is being used error. The<csi-vol-uuid>is a unique RBD volume name.Identify
csiPodNameof the correspondingcsi-rbdplugin:kubectl -n rook-ceph get pod -l app=csi-rbdplugin \ -o jsonpath='{.items[?(@.spec.nodeName == "<nodeName>")].metadata.name}'
Output the affected
csiPodNamelogs:kubectl -n rook-ceph logs <csiPodName> -c csi-rbdplugin
Scale down the affected
StatefulSetorDeploymentof the pod that fails to init to0replicas.On every
csi-rbdpluginpod, search for stuckcsi-vol:for pod in `kubectl -n rook-ceph get pods|grep rbdplugin|grep -v provisioner|awk '{print $1}'`; do echo $pod kubectl exec -it -n rook-ceph $pod -c csi-rbdplugin -- rbd device list | grep <csi-vol-uuid> done
Unmap the affected
csi-vol:rbd unmap -o force /dev/rbd<i>
The
/dev/rbd<i>value is a mapped RBD volume that usescsi-vol.Delete
volumeattachmentof the affected pod:kubectl get volumeattachments | grep <csi-vol-uuid> kubectl delete volumeattacmhent <id>
Scale up the affected
StatefulSetorDeploymentback to the original number of replicas and wait until its state isRunning.
Affects only Container Cloud 2.18.0 and earlier
A project that is newly created in the Container Cloud web UI does not display in the Projects list even after refreshing the page. The issue occurs due to the token missing the necessary role for the new project. As a workaround, relogin to the Container Cloud web UI.
The following table lists the major components and their versions of the Mirantis Container Cloud release 2.15.0.
Note
The components that are newly added, updated, deprecated, or removed
as compared to the previous release version, are marked
with a corresponding superscript,
for example, lcm-ansible Updated.
Component |
Application/Service |
Version |
|---|---|---|
AWS Updated |
aws-provider |
1.28.7 |
aws-credentials-controller |
1.28.7 |
|
Azure Updated |
azure-provider |
1.28.7 |
azure-credentials-controller |
1.28.7 |
|
Bare metal |
ambassador |
1.20.1-alpine |
baremetal-operator Updated |
6.0.4 |
|
baremetal-public-api Updated |
6.0.4 |
|
baremetal-provider Updated |
1.28.7 |
|
baremetal-resource-controller Updated |
base-bionic-20211224163705 |
|
ironic Updated |
victoria-bionic-20211213142623 |
|
ironic-operator |
base-bionic-20210930105000 |
|
kaas-ipam Updated |
base-bionic-20211213150212 |
|
local-volume-provisioner |
2.5.0-mcp |
|
mariadb |
10.4.17-bionic-20210617085111 |
|
IAM |
iam |
2.4.10 |
iam-controller Updated |
1.28.7 |
|
keycloak Updated |
15.0.2 |
|
Container Cloud Updated |
admission-controller |
1.28.7 (1.28.18 for 2.15.1) |
agent-controller |
1.28.7 |
|
byo-credentials-controller |
1.28.7 |
|
byo-provider |
1.28.7 |
|
kaas-public-api |
1.28.7 |
|
kaas-exporter |
1.28.7 |
|
kaas-ui |
1.28.8 |
|
lcm-controller |
0.3.0-132-g83a348fa |
|
mcc-cache |
1.28.7 |
|
portforward-controller |
1.28.12 |
|
proxy-controller |
1.28.7 |
|
rbac-controller |
1.28.7 |
|
release-controller |
1.28.7 |
|
rhellicense-controller |
1.28.7 |
|
scope-controller New |
1.28.7 |
|
squid-proxy |
0.0.1-6 |
|
user-controller |
1.28.7 |
|
Equinix Metal Updated |
equinix-provider |
1.28.11 |
equinix-credentials-controller |
1.28.7 |
|
OpenStack Updated |
openstack-provider |
1.28.7 |
os-credentials-controller |
1.28.7 |
|
VMware vSphere Updated |
vsphere-provider |
1.28.7 |
vsphere-credentials-controller |
1.28.7 |
This section lists the components artifacts of the Mirantis Container Cloud release 2.15.0.
Note
The components that are newly added, updated, deprecated, or removed
as compared to the previous release version, are marked
with a corresponding superscript,
for example, lcm-ansible Updated.
Artifact |
Component |
Path |
|---|---|---|
Binaries |
baremetal-operator Updated |
https://binary.mirantis.com/bm/helm/baremetal-operator-6.0.4.tgz |
baremetal-public-api Updated |
https://binary.mirantis.com/bm/helm/baremetal-public-api-6.0.4.tgz |
|
ironic-python-agent-bionic.kernel Updated |
https://binary.mirantis.com/bm/bin/ironic/ipa/ubuntu/kernel-victoria-bionic-5.4-debug-20211126120723 |
|
ironic-python-agent-bionic.initramfs Updated |
||
kaas-ipam Updated |
||
local-volume-provisioner |
https://binary.mirantis.com/bm/helm/local-volume-provisioner-2.5.0-mcp.tgz |
|
provisioning_ansible Updated |
https://binary.mirantis.com/bm/bin/ansible/provisioning_ansible-0.1.1-88-02063c4.tgz |
|
target ubuntu system |
https://binary.mirantis.com/bm/bin/efi/ubuntu/tgz-bionic-20210622161844 |
|
Docker images |
ambassador |
mirantis.azurecr.io/general/external/docker.io/library/nginx:1.20.1-alpine |
baremetal-operator |
mirantis.azurecr.io/bm/baremetal-operator:base-bionic-20211005112459 |
|
baremetal-resource-controller Updated |
mirantis.azurecr.io/bm/baremetal-resource-controller:base-bionic-20211224163705 |
|
dnsmasq |
mirantis.azurecr.io/general/dnsmasq:focal-20210617094827 |
|
ironic Updated |
mirantis.azurecr.io/openstack/ironic:victoria-bionic-20211213142623 |
|
ironic-inspector Updated |
mirantis.azurecr.io/openstack/ironic-inspector:victoria-bionic-20211213142623 |
|
ironic-operator |
mirantis.azurecr.io/bm/ironic-operator:base-bionic-20210930105000 |
|
ironic-prometheus-exporter |
mirantis.azurecr.io/stacklight/ironic-prometheus-exporter:0.1-20210608113804 |
|
kaas-ipam Updated |
mirantis.azurecr.io/bm/kaas-ipam:base-bionic-20211213150212 |
|
mariadb |
mirantis.azurecr.io/general/mariadb:10.4.17-bionic-20210617085111 |
|
syslog-ng |
mirantis.azurecr.io/bm/syslog-ng:base-bionic-20210617094817 |
Artifact |
Component |
Paths |
|---|---|---|
Bootstrap tarball Updated |
bootstrap-linux |
https://binary.mirantis.com/core/bin/bootstrap-linux-1.28.7.tar.gz |
bootstrap-darwin |
https://binary.mirantis.com/core/bin/bootstrap-darwin-1.28.7.tar.gz |
|
Helm charts Updated |
admission-controller 0 |
https://binary.mirantis.com/core/helm/admission-controller-1.28.7.tgz |
agent-controller |
https://binary.mirantis.com/core/helm/agent-controller-1.28.7.tgz |
|
aws-credentials-controller |
https://binary.mirantis.com/core/helm/aws-credentials-controller-1.28.7.tgz |
|
aws-provider |
https://binary.mirantis.com/core/helm/aws-provider-1.28.7.tgz |
|
azure-credentials-controller |
https://binary.mirantis.com/core/helm/azure-credentials-controller-1.28.7.tgz |
|
azure-provider |
https://binary.mirantis.com/core/helm/azure-provider-1.28.7.tgz |
|
baremetal-provider |
https://binary.mirantis.com/core/helm/baremetal-provider-1.28.7.tgz |
|
byo-credentials-controller |
https://binary.mirantis.com/core/helm/byo-credentials-controller-1.28.7.tgz |
|
byo-provider |
https://binary.mirantis.com/core/helm/byo-provider-1.28.7.tgz |
|
equinix-credentials-controller |
https://binary.mirantis.com/core/helm/equinix-credentials-controller-1.28.7.tgz |
|
equinix-provider |
https://binary.mirantis.com/core/helm/equinix-provider-1.28.11.tgz |
|
equinixmetalv2-provider |
https://binary.mirantis.com/core/helm/equinixmetalv2-provider-1.28.7.tgz |
|
iam-controller |
https://binary.mirantis.com/core/helm/iam-controller-1.28.7.tgz |
|
kaas-exporter |
https://binary.mirantis.com/core/helm/kaas-exporter-1.28.7.tgz |
|
kaas-public-api |
https://binary.mirantis.com/core/helm/kaas-public-api-1.28.7.tgz |
|
kaas-ui |
||
lcm-controller |
https://binary.mirantis.com/core/helm/lcm-controller-1.28.7.tgz |
|
mcc-cache |
||
openstack-provider |
https://binary.mirantis.com/core/helm/openstack-provider-1.28.7.tgz |
|
os-credentials-controller |
https://binary.mirantis.com/core/helm/os-credentials-controller-1.28.7.tgz |
|
portforward-controller |
https://binary.mirantis.com/core/helm/portforward-controller-1.28.7.tgz |
|
proxy-controller |
https://binary.mirantis.com/core/helm/proxy-controller-1.28.7.tgz |
|
rbac-controller |
https://binary.mirantis.com/core/helm/rbac-controller-1.28.7.tgz |
|
release-controller |
https://binary.mirantis.com/core/helm/release-controller-1.28.7.tgz |
|
rhellicense-controller |
https://binary.mirantis.com/core/helm/rhellicense-controller-1.28.7.tgz |
|
scope-controller New |
http://binary.mirantis.com/core/helm/scope-controller-1.28.7.tgz |
|
squid-proxy |
https://binary.mirantis.com/core/helm/squid-proxy-1.28.7.tgz |
|
vsphere-credentials-controller |
https://binary.mirantis.com/core/helm/vsphere-credentials-controller-1.28.7.tgz |
|
vsphere-provider |
https://binary.mirantis.com/core/helm/vsphere-provider-1.28.7.tgz |
|
user-controller |
https://binary.mirantis.com/core/helm/user-controller-1.28.7.tgz |
|
Docker images |
admission-controller 0 Updated |
mirantis.azurecr.io/core/admission-controller:1.28.7 |
agent-controller Updated |
mirantis.azurecr.io/core/agent-controller:1.28.7 |
|
aws-cluster-api-controller Updated |
mirantis.azurecr.io/core/aws-cluster-api-controller:1.28.7 |
|
aws-credentials-controller Updated |
mirantis.azurecr.io/core/aws-credentials-controller:1.28.7 |
|
azure-cluster-api-controller Updated |
mirantis.azurecr.io/core/azure-cluster-api-controller:1.28.7 |
|
azure-credentials-controller Updated |
mirantis.azurecr.io/core/azure-credentials-controller:1.28.7 |
|
byo-cluster-api-controller Updated |
mirantis.azurecr.io/core/byo-cluster-api-controller:1.28.7 |
|
byo-credentials-controller Updated |
mirantis.azurecr.io/core/byo-credentials-controller:1.28.7 |
|
cluster-api-provider-baremetal Updated |
mirantis.azurecr.io/core/cluster-api-provider-baremetal:1.28.7 |
|
cluster-api-provider-equinix Updated |
mirantis.azurecr.io/core/cluster-api-provider-equinix:1.28.7 |
|
equinix-credentials-controller Updated |
mirantis.azurecr.io/core/equinix-credentials-controller:1.28.7 |
|
frontend Updated |
mirantis.azurecr.io/core/frontend:1.28.8 |
|
haproxy |
mirantis.azurecr.io/lcm/mcc-haproxy:v0.12.0-8-g6fabf1c |
|
iam-controller Updated |
mirantis.azurecr.io/core/iam-controller:1.28.7 |
|
kproxy Updated |
mirantis.azurecr.io/lcm/kproxy:1.28.7 |
|
lcm-controller Updated |
mirantis.azurecr.io/core/lcm-controller:v0.3.0-132-g83a348fa |
|
openstack-cluster-api-controller Updated |
mirantis.azurecr.io/core/openstack-cluster-api-controller:1.28.7 |
|
os-credentials-controller Updated |
mirantis.azurecr.io/core/os-credentials-controller:1.28.7 |
|
portforward-controller Updated |
mirantis.azurecr.io/core/portforward-controller:1.28.12 |
|
rbac-controller Updated |
mirantis.azurecr.io/core/rbac-controller:1.28.7 |
|
registry |
mirantis.azurecr.io/lcm/registry:2.7.1 |
|
release-controller Updated |
mirantis.azurecr.io/core/release-controller:1.28.7 |
|
rhellicense-controller Updated |
mirantis.azurecr.io/core/rhellicense-controller:1.28.7 |
|
scope-controller New |
mirantis.azurecr.io/core/scope-controller:1.28.7 |
|
squid-proxy Updated |
mirantis.azurecr.io/core/squid-proxy:0.0.1-6 |
|
vsphere-cluster-api-controller Updated |
mirantis.azurecr.io/core/vsphere-api-controller:1.28.7 |
|
vsphere-credentials-controller Updated |
mirantis.azurecr.io/core/vsphere-credentials-controller:1.28.7 |
|
user-controller Updated |
mirantis.azurecr.io/core/user-controller:1.28.7 |
Artifact |
Component |
Path |
|---|---|---|
Binaries |
hash-generate-linux |
http://binary.mirantis.com/iam/bin/hash-generate-0.0.1-268-3cf7f17-linux |
hash-generate-darwin |
http://binary.mirantis.com/iam/bin/hash-generate-0.0.1-268-3cf7f17-darwin |
|
iamctl-linux |
||
iamctl-darwin |
||
iamctl-windows |
||
Helm charts |
iam |
|
iam-proxy Updated |
||
keycloak_proxy Updated |
http://binary.mirantis.com/core/helm/keycloak_proxy-1.28.9.tgz |
|
Docker images |
api Deprecated |
mirantis.azurecr.io/iam/api:0.5.4 |
auxiliary |
mirantis.azurecr.io/iam/auxiliary:0.5.4 |
|
kubernetes-entrypoint |
mirantis.azurecr.io/iam/external/kubernetes-entrypoint:v0.3.1 |
|
mariadb |
mirantis.azurecr.io/general/mariadb:10.4.16-bionic-20201105025052 |
|
keycloak |
mirantis.azurecr.io/iam/keycloak:0.5.4 |
|
keycloak-gatekeeper |
mirantis.azurecr.io/iam/keycloak-gatekeeper:7.1.3-2 |
See also
Releases delivered in 2020-2021
This section contains historical information on the unsupported Container Cloud releases delivered in 2020-2021. For the latest supported Container Cloud release, see Container Cloud releases.
Version |
Release date |
Supported Cluster releases |
Summary |
|---|---|---|---|
Dec 07, 2021 |
|
||
Nov 11, 2021 |
Based on 2.13.0, this release introduces the Cluster release 6.20.0 that is based on 5.20.0 and supports Mirantis OpenStack for Kubernetes (MOS) 21.6. For the list of Cluster releases 7.x and 5.x that are supported by 2.13.1 as well as for its features with addressed and known issues, refer to the parent release 2.13.0. |
||
Oct 28, 2021 |
|
||
Oct 5, 2021 |
|
||
August 31, 2021 |
|
||
July 21, 2021 |
|
||
June 15, 2021 |
|
||
May 18, 2021 |
|
||
April 22, 2021 |
|
||
March 24, 2021 |
|
||
March 1, 2021 |
|
||
February 2, 2021 |
|
||
December 23, 2020 |
|
||
November 5, 2020 |
|
||
October 19, 2020 |
|
||
September 16, 2020 |
First GA release of Container Cloud with the following key features:
|
** - the Cluster release supports only attachment of existing MKE 3.3.4 clusters. For the deployment of new or attachment of existing clusters based on other supported MKE versions, the latest available Cluster releases are used.
The Mirantis Container Cloud GA release 2.14.0:
Introduces support for the Cluster release 7.4.0 that is based on Mirantis Container Runtime 20.10.6 and the updated version of Mirantis Kubernetes Engine 3.4.6 with Kubernetes 1.20.
Introduces support for the Cluster release 5.21.0 that is based on the updated version of Mirantis Kubernetes Engine 3.3.13 with Kubernetes 1.18 and Mirantis Container Runtime 20.10.6.
Supports the Cluster release 6.20.0 that is based on the Cluster release 5.20.0 and represents Mirantis OpenStack for Kubernetes (MOS) 21.6.
Supports deprecated Cluster releases 5.20.0, 6.19.0, and 7.3.0 that will become unsupported in the following Container Cloud releases.
Caution
Make sure to update the Cluster release version of your managed cluster before the current Cluster release version becomes unsupported by a new Container Cloud release version. Otherwise, Container Cloud stops auto-upgrade and eventually Container Cloud itself becomes unsupported.
This section outlines release notes for the Container Cloud release 2.14.0.
This section outlines new features and enhancements introduced in the Mirantis Container Cloud release 2.14.0. For the list of enhancements in the Cluster releases 7.4.0 and 5.21.0 that are supported by the Container Cloud release 2.14.0, see the Cluster releases.
Support of the Equinix Metal provider with private networking
Support of the community CentOS 7.9 version for the OpenStack provider
Configuration of server metadata for OpenStack machines in web UI
Visualization of service mapping in the bare metal IpamHost object
Separation of PXE and management networks for bare metal clusters
User access management through the Container Cloud API or web UI
The ‘Interface Guided Tour’ button in the Container Cloud web UI
Switch of bare metal and StackLight Helm releases from v2 to v3
TechPreview
Introduced the Technology Preview support of Container Cloud deployments that are based on the Equinix Metal infrastructure with private networking.
Private networks are required for the following use cases:
Connect the Container Cloud to the on-premises corporate networks without exposing it to the Internet. This can be required by corporate security policies.
Reduce ingress and egress bandwidth costs and the number of public IP addresses utilized by the deployment. Public IP addresses are a scarce and valuable resource, and Container Cloud should only expose the necessary services in that address space.
Testing and staging environments typically do not require accepting connections from the outside of the cluster. Such Container Cloud clusters should be isolated in private VLANs.
Caution
The feature is supported starting from the Cluster releases 7.4.0 and 5.21.0.
Note
Support of the regional clusters that are based on Equinix Metal with private networking will be announced in one of the following Container Cloud releases.
Introduced support of the community version of the CentOS 7.9 operating system for the management, regional, and managed clusters machines deployed with the OpenStack provider. The following CentOS resources are used:
Latest upstream CentOS 7.9 image: CentOS-7-x86_64-GenericCloud-2009.qcow2
Latest CentOS 7.9
.yumrepositories: mirror.centos.org
Implemented the possibility to specify the cloud-init metadata
during the OpenStack machines creation through the Container Cloud web UI.
Server metadata is a set of string key-value pairs that you can configure
in the meta_data field of cloud-init.
TechPreview
Introduced the initial Technology Preview support of the RHEL 8.4 operating system for the vSphere-based management, regional, and managed clusters.
Caution
Deployment of a Container Cloud cluster based on both RHEL and CentOS operating systems or on mixed RHEL versions is not supported.
Implemented the possibility to configure the following settings during a vSphere machine creation using the Container Cloud web UI:
VM memory size that defaults to 16 GB
VM CPUs number that defaults to 8
Implemented the following amendments to the ipam/SVC-* labels to simplify
visualization of service mapping in the bare metal IpamHost object:
All IP addresses allocated from the Subnet` object that has the
ipam/SVC-*service labels defined will inherit those labelsThe new
ServiceMapfield inIpamHost.Statuscontains information about which IPs and interfaces correspond to which Container Cloud services.
Learn more
Added the capability to configure a dedicated PXE network that is separated from the management network on management or regional bare metal clusters. A separate PXE network allows isolating sensitive bare metal provisioning process from the end users. The users still have access to Container Cloud services, such as Keycloak, to authenticate workloads in managed clusters, such as Horizon in a Mirantis OpenStack for Kubernetes cluster.
Learn more
Implemented the capability to manage user access through the Container Cloud API or web UI by introducing the following objects to manage user role bindings:
IAMUserIAMRoleIAMGlobalRoleBindingIAMRoleBindingIAMClusterRoleBinding
Also, updated the role naming used in Keycloak by introducing the following IAM roles with the possibility to upgrade the old-style role names with the new-style ones:
global-adminbm-pool-operatoroperatoruserstacklight-admin
Caution
User management for the MOSK
m:osroles through API or web UI is on the final development stage and will be announced in one of the following Container Cloud releases. Meanwhile, continue managing these roles using Keycloak.The possibility to manage the
IAM*RoleBindingobjects through the Container Cloud web UI is available for theglobal-adminrole only. The possibility to manage project role bindings using theoperatorrole will become available in one of the following Container Cloud releases.
Updated the matrix of supported MKE versions for cluster attachment to improve the upgrade and testing procedures:
Implemented separate Cluster release series to support 2 series of MKE versions for cluster attachment:
Cluster release series 9.x for the 3.3.x version series
Cluster release series 10.x for the 3.4.x version series
Added a requirement to update an existing MKE cluster to the latest available supported MKE version in a series to trigger the Container Cloud upgrade that allows updating its components, such as StackLight, to the latest versions.
When a new MKE version for cluster attachment is released in a series, the oldest supported version of the previous Container Cloud release is dropped.
Upgraded the bare metal and StackLight Helm releases in the ClusterRelease
and KaasRelease objects from v2 to v3. Switching of the remaining Ceph and
OpenStack Helm releases to v3 will be implemented in one of the following
Container Cloud releases.
The following issues have been addressed in the Mirantis Container Cloud release 2.14.0 along with the Cluster releases 7.4.0 and 5.21.0.
[18429][StackLight] Increased the default resource requirements for Prometheus Elasticsearch Exporter to prevent the
KubeContainersCPUThrottlingHighfiring too often.[18879][Ceph] Fixed the issue with the RADOS Gateway (RGW) pod overriding the global CA bundle located at
/etc/pki/tls/certswith an incorrect self-signed CA bundle during deployment of a Ceph cluster.[9899][Upgrade] Fixed the issue with Helm releases getting stuck in the
PENDING_UPGRADEstate during a management or managed cluster upgrade.[18708][LCM] Fixed the issue with the
Pendingstate of machines during deployment of any Container Cloud cluster or attachment of an existing MKE cluster due to some project being stuck in theTerminatingstate.
This section lists known issues with workarounds for the Mirantis Container Cloud release 2.14.0 including the Cluster releases 7.4.0, 6.20.0, and 5.21.0.
For other issues that can occur while deploying and operating a Container Cloud cluster, see Troubleshooting Guide.
Note
This section also outlines still valid known issues from previous Container Cloud releases.
After removal of a managed cluster, the namespace is not deleted due to
KaaSCephOperationRequest CRs blocking the deletion. The workaround is to
manually remove finalizers and delete the KaaSCephOperationRequest CRs.
Workaround:
Remove finalizers from all
KaaSCephOperationRequestresources:kubectl -n <managed-ns> get kaascephoperationrequest -o name | xargs -I % kubectl -n <managed-ns> patch % -p '{"metadata":{"finalizers":{}}}' --type=merge
Delete all
KaaSCephOperationRequestresources:kubectl -n <managed-ns> delete kaascephoperationrequest --all
A managed cluster deployment fails on long-running management clusters with
BareMetalHost being stuck in the Preparing state and the
ironic-conductor and ironic-api pods reporting the
not enough disk space error due to the dnsmasq-dhcpd logs overflow.
Workaround:
Log in to the
ironic-conductorpod.Verify the free space in
/volume/log/dnsmasq.If the free space on a volume is less than 10%:
Manually delete log files in
/volume/log/dnsmasq/.Scale down the
dnsmasqpod to 0 replicas:kubectl -n kaas scale deployment dnsmasq --replicas=0
Scale up the
dnsmasqpod to 1 replica:kubectl -n kaas scale deployment dnsmasq --replicas=1
If the volume has enough space, assess the Ironic logs to identify the root cause of the issue.
If you run bootstrap.sh preflight with
KAAS_BM_FULL_PREFLIGHT=true, the script fails with the following message:
preflight check failed: preflight full check failed: \
error waiting for BareMetalHosts to power on: \
timed out waiting for the condition
Workaround:
Unset full preflight using the
unset KAAS_BM_FULL_PREFLIGHTenvironment variable.Rerun bootstrap.sh preflight that executes fast preflight instead.
On the vSphere deployments with the RHEL 8.4 seed node, the VM template build for deployment hangs because of an empty kickstart file provided to the VM. In this case, the VMware web console displays the following error for the affected VM:
Kickstart file /run/install/ks.cfg is missing
The fix for the issue is implemented in the latest version of the Packer image for the VM template build.
Workaround:
Open
bootstrap.shin thekaas-bootstrapfolder for editing.Update the Docker image tag for the
VSPHERE_PACKER_DOCKER_IMAGEvariable tov1.0-39.Save edits and restart the VM template build:
./bootstrap.sh vsphere_template
If a RHEL license is removed before the related managed cluster is deleted,
the cluster deletion hangs with the following Machine object error:
Failed to remove finalizer from machine ...
failed to get RHELLicense object
As a workaround, recreate the removed RHEL license object with the same name using the Container Cloud web UI or API.
Warning
The kubectl apply command automatically saves the
applied data as plain text into the
kubectl.kubernetes.io/last-applied-configuration annotation of the
corresponding object. This may result in revealing sensitive data in this
annotation when creating or modifying the object.
Therefore, do not use kubectl apply on this object. Use kubectl create, kubectl patch, or kubectl edit instead.
If you used kubectl apply on this object, you
can remove the kubectl.kubernetes.io/last-applied-configuration
annotation from the object using kubectl edit.
Note
Moving forward, the workaround for this issue will be moved from Release Notes to Troubleshooting Guide.
A vSphere-based management cluster bootstrap fails due to a node leaving the cluster after an accidental IP address change.
The issue may affect a vSphere-based cluster only when IPAM is not enabled and IP addresses assignment to the vSphere virtual machines is done by a DHCP server present in the vSphere network.
By default, a DHCP server keeps lease of the IP address for 30 minutes.
Usually, a VM dhclient prolongs such lease by frequent DHCP requests
to the server before the lease period ends.
The DHCP prolongation request period is always less than the default lease time
on the DHCP server, so prolongation usually works.
But in case of network issues, for example, when dhclient from the
VM cannot reach the DHCP server, or the VM is being slowly powered on
for more than the lease time, such VM may lose its assigned IP address.
As a result, it obtains a new IP address.
Container Cloud does not support network reconfiguration after the IP of the VM has been changed. Therefore, such issue may lead to a VM leaving the cluster.
Symptoms:
One of the nodes is in the
NodeNotReadyordownstate:kubectl get nodes -o wide docker node ls
The UCP Swarm manager logs on the healthy manager node contain the following example error:
docker logs -f ucp-swarm-manager level=debug msg="Engine refresh failed" id="<docker node ID>|<node IP>: 12376"
If the affected node is manager:
The output of the docker info command contains the following example error:
Error: rpc error: code = Unknown desc = The swarm does not have a leader. \ It's possible that too few managers are online. \ Make sure more than half of the managers are online.
The UCP controller logs contain the following example error:
docker logs -f ucp-controller "warning","msg":"Node State Active check error: \ Swarm Mode Manager health check error: \ info: Cannot connect to the Docker daemon at tcp://<node IP>:12376. \ Is the docker daemon running?
On the affected node, the IP address on the first interface
eth0does not match the IP address configured in Docker. Verify theNode Addressfield in the output of the docker info command.The following lines are present in
/var/log/messages:dhclient[<pid>]: bound to <node IP> -- renewal in 1530 seconds
If there are several lines where the IP is different, the node is affected.
Workaround:
Select from the following options:
Bind IP addresses for all machines to their MAC addresses on the DHCP server for the dedicated vSphere network. In this case, VMs receive only specified IP addresses that never change.
Remove the Container Cloud node IPs from the IP range on the DHCP server for the dedicated vSphere network and configure the first interface
eth0on VMs with a static IP address.If a managed cluster is affected, redeploy it with IPAM enabled for new machines to be created and IPs to be assigned properly.
Note
The issue affects only Helm v2 releases and is addressed for Helm v3. Starting from Container Cloud 2.19.0, all Helm releases are switched to v3.
During a management, regional, or managed cluster deployment,
Helm releases may get stuck in the FAILED or UNKNOWN state
although the corresponding machines statuses are Ready
in the Container Cloud web UI. For example, if the StackLight Helm release
fails, the links to its endpoints are grayed out in the web UI.
In the cluster status, providerStatus.helm.ready and
providerStatus.helm.releaseStatuses.<releaseName>.success are false.
HelmBundle cannot recover from such states and requires manual actions.
The workaround below describes the recovery steps for the stacklight
release that got stuck during a cluster deployment.
Use this procedure as an example for other Helm releases as required.
Workaround:
Verify the failed release has the
UNKNOWNorFAILEDstatus in the HelmBundle object:kubectl --kubeconfig <regionalClusterKubeconfigPath> get helmbundle <clusterName> -n <clusterProjectName> -o=jsonpath={.status.releaseStatuses.stacklight} In the command above and in the steps below, replace the parameters enclosed in angle brackets with the corresponding values of your cluster.
Example of system response:
stacklight: attempt: 2 chart: "" finishedAt: "2021-02-05T09:41:05Z" hash: e314df5061bd238ac5f060effdb55e5b47948a99460c02c2211ba7cb9aadd623 message: '[{"occurrence":1,"lastOccurrenceDate":"2021-02-05 09:41:05","content":"error updating the release: rpc error: code = Unknown desc = customresourcedefinitions.apiextensions.k8s.io \"helmbundles.lcm.mirantis.com\" already exists"}]' notes: "" status: UNKNOWN success: false version: 0.1.2-mcp-398
Log in to the
helm-controllerpod console:kubectl --kubeconfig <affectedClusterKubeconfigPath> exec -n kube-system -it helm-controller-0 sh -c tiller
Download the Helm v3 binary. For details, see official Helm documentation.
Remove the failed release:
helm delete <failed-release-name>
For example:
helm delete stacklight
Once done, the release triggers for redeployment.
Adding a custom certificate for Keycloak using the container-cloud binary hangs with the failed to wait for OIDC certificate to be updated timeout warning. The readiness check fails due to a wrong condition.
Ignore the timeout warning. If you can log in to the Container Cloud web UI, the certificate has been applied successfully.
Occasionally, an Alerta pod may be not Ready even if Patroni, the Alerta
backend, operates correctly. In this case, some of the following errors may
appear in the Alerta logs:
2021-10-25 13:10:55,865 DEBG 'nginx' stdout output:
2021/10/25 13:10:55 [crit] 25#25: *17408 connect() to unix:/tmp/uwsgi.sock failed (2: No such file or directory) while connecting to upstream, client: 127.0.0.1, server: , request: "GET /api/config HTTP/1.1", upstream: "uwsgi://unix:/tmp/uwsgi.sock:", host: "127.0.0.1:8080"
ip=\- [\25/Oct/2021:13:10:55 +0000] "\GET /api/config HTTP/1.1" \502 \157 "\-" "\python-requests/2.24.0"
/web | /api/config | > GET /api/config HTTP/1.1
2021-11-11 00:02:23,969 DEBG 'nginx' stdout output:
2021/11/11 00:02:23 [error] 23#23: *2014 connect() to unix:/tmp/uwsgi.sock failed (11: Resource temporarily unavailable) while connecting to upstream, client: 172.16.37.243, server: , request: "GET /api/services HTTP/1.1", upstream: "uwsgi://unix:/tmp/uwsgi.sock:", host: "10.233.113.143:8080"
ip=\- [\11/Nov/2021:00:02:23 +0000] "\GET /api/services HTTP/1.1" \502 \157 "\-" "\kube-probe/1.20+"
/web | /api/services | > GET /api/services HTTP/1.1
As a workaround, manually restart the affected Alerta pods:
kubectl delete pod -n stacklight <POD_NAME>
Prometheus web UI URLs in StackLight notifications sent to Salesforce use a wrong protocol: HTTP instead of HTTPS. The issue affects deployments with TLS enabled for IAM.
The workaround is to manually change the URL protocol in the web browser.
The csi-rbdplugin-provisioner pod (csi-provisioner container) may show
constant retries attempting to create a PV if the csi-rbdplugin-provisioner
pod was scheduled and started on a node with no connectivity to the Ceph
storage. As a result, creation of a Ceph-based persistent volume (PV) may get
stuck in the Pending state.
As a workaround manually specify the affinity or toleration rules for the
csi-rbdplugin-provisioner pod.
Workaround:
On the managed cluster, open the
rook-ceph-operator-configmap for editing:kubectl edit configmap -n rook-ceph rook-ceph-operator-config
To avoid spawning pods on the nodes where this is not needed, set the provisioner node affinity specifying the required node labels. For example:
CSI_PROVISIONER_NODE_AFFINITY: "role=storage-node; storage=rook, ceph"
Note
If needed, you can also specify CSI_PROVISIONER_TOLERATIONS
tolerations. For example:
CSI_PROVISIONER_TOLERATIONS: |
- effect: NoSchedule
key: node-role.kubernetes.io/controlplane
operator: Exists
- effect: NoExecute
key: node-role.kubernetes.io/etcd
operator: Exists
When creating a new KaaSCephOperationRequest CR with the same name
specified in metadata.name as in the previous KaaSCephOperationRequest
CR, even if the previous request was deleted manually, the new request includes
information about the previous actions and is in the Completed phase. In
this case, no removal is performed.
Workaround:
On the management cluster, manually delete the old
KaasCephOperationRequestCR with the samemetadata.name:kubectl -n ceph-lcm-mirantis delete KaasCephOperationRequest <name>
On the managed cluster, manually delete the old
CephOsdRemoveRequestwith the samemetadata.name:kubectl -n ceph-lcm-mirantis delete CephOsdRemoveRequest <name>
Spec validation may fail with the following error when creating a
KaaSCephOperationRequest CR:
The KaaSCephOperationRequest "test-remove-osd" is invalid: spec: Invalid value: 1:
spec in body should have at most 1 properties
Workaround:
On the management cluster, open the
kaascephoperationrequests.kaas.mirantis.comCRD for editing:kubectl edit crd kaascephoperationrequests.kaas.mirantis.com
Remove
maxProperties: 1andminProperties: 1fromspec.versions[0].schema.openAPIV3Schema.properties.spec:spec: maxProperties: 1 minProperties: 1
Ocassionally, when Processing a Ceph OSD removal request,
KaaSCephOperationRequest retries the osd stop command without an
interval, which leads to removal request failure.
As a workaround create a new request to proceed with the Ceph OSD removal.
When executing a Ceph OSD removal request to remove Ceph OSDs placed on one disk, the request completes without errors but the device itself still keeps the old LVM partitions. As a result, Rook cannot use such device.
The workaround is to manually clean up the affected device as described in Rook documentation: Zapping Devices.
An upgrade of a management or regional cluster originally deployed using
the Container Cloud release earlier than 2.8.0 fails with
error setting certificate verify locations during Ansible update if a
machine contains /usr/local/share/ca-certificates/mcc.crt, which is
either empty or invalid. Managed clusters are not affected.
Workaround:
On every machine of the affected management or regional cluster:
Delete
/usr/local/share/ca-certificates/mcc.crt.In
/etc/lcm/environment, remove the following line:export SSL_CERT_FILE="/usr/local/share/ca-certificates/mcc.crt"
Restart
lcm-agent:systemctl restart lcm-agent-v0.3.0-104-gb7f5e8d8
An upgrade of a management or regional cluster originally deployed using the Container Cloud release earlier than 2.8.0 fails with:
The LCM Agent version not updating from v0.3.0-67-g25ab9f1a to v0.3.0-105-g6fb89599
The following error message appearing in the events of the related
LCMMachine:kubectl describe lcmmachine <machineName> Failed to upgrade agent: failed to update agent upgrade status: \ LCMMachine.lcm.mirantis.com "master-0" is invalid: \ status.lcmAgentUpgradeStatus.finishedAt: Invalid value: "null": \ status.lcmAgentUpgradeStatus.finishedAt in body must be of type string: "null"
As a workaround, change the preserveUnknownFields value for the
LCMMachine CRD to false:
kubectl patch crd lcmmachines.lcm.mirantis.com -p '{"spec":{"preserveUnknownFields":false}}'
Note
Moving forward, the workaround for this issue will be moved from Release Notes to Troubleshooting Guide.
The Equinix Metal and MOS-based managed clusters may fail to update to the latest Cluster release with kubelet being stuck and reporting authorization errors.
The cluster is affected by the issue if you see the Failed to make webhook authorizer request: context canceled error in the kubelet logs:
docker logs ucp-kubelet --since 5m 2>&1 | grep 'Failed to make webhook authorizer request: context canceled'
As a workaround, restart the ucp-kubelet container on the affected
node(s):
ctr -n com.docker.ucp snapshot rm ucp-kubelet
docker rm -f ucp-kubelet
Note
Ignore failures in the output of the first command, if any.
An Equinix-based management or managed cluster fails to update with the
FailedAttachVolume and FailedMount warnings.
Workaround:
Verify that the description of the pods that failed to run contain the
FailedMountevents:kubectl -n <affectedProjectName> describe pod <affectedPodName>
<affectedProjectName>is the Container Cloud project name where the pods failed to run<affectedPodName>is a pod name that failed to run in this project
In the pod description, identify the node name where the pod failed to run.
Verify that the
csi-rbdpluginlogs of the affected node contain the rbd volume mount failed: <csi-vol-uuid> is being used error. The<csi-vol-uuid>is a unique RBD volume name.Identify
csiPodNameof the correspondingcsi-rbdplugin:kubectl -n rook-ceph get pod -l app=csi-rbdplugin \ -o jsonpath='{.items[?(@.spec.nodeName == "<nodeName>")].metadata.name}'
Output the affected
csiPodNamelogs:kubectl -n rook-ceph logs <csiPodName> -c csi-rbdplugin
Scale down the affected
StatefulSetorDeploymentof the pod that fails to init to0replicas.On every
csi-rbdpluginpod, search for stuckcsi-vol:for pod in `kubectl -n rook-ceph get pods|grep rbdplugin|grep -v provisioner|awk '{print $1}'`; do echo $pod kubectl exec -it -n rook-ceph $pod -c csi-rbdplugin -- rbd device list | grep <csi-vol-uuid> done
Unmap the affected
csi-vol:rbd unmap -o force /dev/rbd<i>
The
/dev/rbd<i>value is a mapped RBD volume that usescsi-vol.Delete
volumeattachmentof the affected pod:kubectl get volumeattachments | grep <csi-vol-uuid> kubectl delete volumeattacmhent <id>
Scale up the affected
StatefulSetorDeploymentback to the original number of replicas and wait until its state isRunning.
Affects only Container Cloud 2.18.0 and earlier
A project that is newly created in the Container Cloud web UI does not display in the Projects list even after refreshing the page. The issue occurs due to the token missing the necessary role for the new project. As a workaround, relogin to the Container Cloud web UI.
The following table lists the major components and their versions of the Mirantis Container Cloud release 2.14.0.
Note
The components that are newly added, updated, deprecated, or removed
as compared to the previous release version, are marked
with a corresponding superscript,
for example, lcm-ansible Updated.
Component |
Application/Service |
Version |
|---|---|---|
AWS Updated |
aws-provider |
1.27.6 |
aws-credentials-controller |
1.27.6 |
|
Azure Updated |
azure-provider |
1.27.6 |
azure-credentials-controller |
1.27.6 |
|
Bare metal |
ambassador Updated |
1.20.1-alpine |
baremetal-operator Updated |
5.2.7 |
|
baremetal-public-api Updated |
5.2.7 |
|
baremetal-provider Updated |
1.27.6 |
|
ironic Updated |
victoria-bionic-20211103083724 |
|
ironic-operator |
base-bionic-20210930105000 |
|
kaas-ipam Updated |
base-bionic-20211028140230 |
|
local-volume-provisioner Updated |
2.5.0-mcp |
|
mariadb |
10.4.17-bionic-20210617085111 |
|
IAM |
iam Updated |
2.4.10 |
iam-controller Updated |
1.27.6 |
|
keycloak |
12.0.0 |
|
Container Cloud |
admission-controller Updated |
1.27.6 |
agent-controller Updated |
1.27.6 |
|
byo-credentials-controller Updated |
1.27.6 |
|
byo-provider Updated |
1.27.6 |
|
kaas-public-api Updated |
1.27.6 |
|
kaas-exporter Updated |
1.27.6 |
|
kaas-ui Updated |
1.27.8 |
|
lcm-controller Updated |
0.3.0-105-g6fb89599 |
|
mcc-cache Updated |
1.27.6 |
|
portforward-controller Updated |
1.27.6 |
|
proxy-controller Updated |
1.27.6 |
|
rbac-controller Updated |
1.27.6 |
|
release-controller Updated |
1.27.6 |
|
rhellicense-controller Updated |
1.27.6 |
|
squid-proxy |
0.0.1-5 |
|
user-controller New |
1.27.9 |
|
Equinix Metal Updated |
equinix-provider |
1.27.6 |
equinix-credentials-controller |
1.27.6 |
|
OpenStack Updated |
openstack-provider |
1.27.6 |
os-credentials-controller |
1.27.6 |
|
VMware vSphere Updated |
vsphere-provider |
1.27.6 |
vsphere-credentials-controller |
1.27.6 |
This section lists the components artifacts of the Mirantis Container Cloud release 2.14.0.
Note
The components that are newly added, updated, deprecated, or removed
as compared to the previous release version, are marked
with a corresponding superscript,
for example, lcm-ansible Updated.
Artifact |
Component |
Path |
|---|---|---|
Binaries |
baremetal-operator Updated |
https://binary.mirantis.com/bm/helm/baremetal-operator-5.2.7.tgz |
baremetal-public-api Updated |
https://binary.mirantis.com/bm/helm/baremetal-public-api-5.2.7.tgz |
|
ironic-python-agent-bionic.kernel |
https://binary.mirantis.com/bm/bin/ironic/ipa/ubuntu/kernel-victoria-bionic-debug-20210817124316 |
|
ironic-python-agent-bionic.initramfs |
https://binary.mirantis.com/bm/bin/ironic/ipa/ubuntu/initramfs-victoria-bionic-debug-20210817124316 |
|
kaas-ipam Updated |
||
local-volume-provisioner Updated |
https://binary.mirantis.com/bm/helm/local-volume-provisioner-2.5.0-mcp.tgz |
|
provisioning_ansible |
https://binary.mirantis.com/bm/bin/ansible/provisioning_ansible-0.1.1-82-342bd22.tgz |
|
target ubuntu system |
https://binary.mirantis.com/bm/bin/efi/ubuntu/tgz-bionic-20210622161844 |
|
Docker images |
ambassador Updated |
mirantis.azurecr.io/lcm/nginx:1.20.1-alpine |
baremetal-operator |
mirantis.azurecr.io/bm/baremetal-operator:base-bionic-20211005112459 |
|
dnsmasq |
mirantis.azurecr.io/general/dnsmasq:focal-20210617094827 |
|
ironic Updated |
mirantis.azurecr.io/openstack/ironic:victoria-bionic-20211103083724 |
|
ironic-inspector Updated |
mirantis.azurecr.io/openstack/ironic-inspector:victoria-bionic-20211103083724 |
|
ironic-operator |
mirantis.azurecr.io/bm/ironic-operator:base-bionic-20210930105000 |
|
ironic-prometheus-exporter |
mirantis.azurecr.io/stacklight/ironic-prometheus-exporter:0.1-20210608113804 |
|
kaas-ipam Updated |
mirantis.azurecr.io/bm/kaas-ipam:base-bionic-20211028140230 |
|
mariadb |
mirantis.azurecr.io/general/mariadb:10.4.17-bionic-20210617085111 |
|
syslog-ng |
mirantis.azurecr.io/bm/syslog-ng:base-bionic-20210617094817 |
Artifact |
Component |
Paths |
|---|---|---|
Bootstrap tarball Updated |
bootstrap-linux |
https://binary.mirantis.com/core/bin/bootstrap-linux-1.27.6.tar.gz |
bootstrap-darwin |
https://binary.mirantis.com/core/bin/bootstrap-darwin-1.27.6.tar.gz |
|
Helm charts Updated |
admission-controller |
https://binary.mirantis.com/core/helm/admission-controller-1.27.6.tgz |
agent-controller |
https://binary.mirantis.com/core/helm/agent-controller-1.27.6.tgz |
|
aws-credentials-controller |
https://binary.mirantis.com/core/helm/aws-credentials-controller-1.27.6.tgz |
|
aws-provider |
https://binary.mirantis.com/core/helm/aws-provider-1.27.6.tgz |
|
azure-credentials-controller |
https://binary.mirantis.com/core/helm/azure-credentials-controller-1.27.6.tgz |
|
azure-provider |
https://binary.mirantis.com/core/helm/azure-provider-1.27.6.tgz |
|
baremetal-provider |
https://binary.mirantis.com/core/helm/baremetal-provider-1.27.6.tgz |
|
byo-credentials-controller |
https://binary.mirantis.com/core/helm/byo-credentials-controller-1.27.6.tgz |
|
byo-provider |
https://binary.mirantis.com/core/helm/byo-provider-1.27.6.tgz |
|
equinix-credentials-controller |
https://binary.mirantis.com/core/helm/equinix-credentials-controller-1.27.6.tgz |
|
equinix-provider |
https://binary.mirantis.com/core/helm/equinix-provider-1.27.6.tgz |
|
equinixmetalv2-provider New |
https://binary.mirantis.com/core/helm/equinixmetalv2-provider-1.27.6.tgz |
|
iam-controller |
https://binary.mirantis.com/core/helm/iam-controller-1.27.6.tgz |
|
kaas-exporter |
https://binary.mirantis.com/core/helm/kaas-exporter-1.27.6.tgz |
|
kaas-public-api |
https://binary.mirantis.com/core/helm/kaas-public-api-1.27.6.tgz |
|
kaas-ui |
||
lcm-controller |
https://binary.mirantis.com/core/helm/lcm-controller-1.27.6.tgz |
|
mcc-cache |
||
openstack-provider |
https://binary.mirantis.com/core/helm/openstack-provider-1.27.6.tgz |
|
os-credentials-controller |
https://binary.mirantis.com/core/helm/os-credentials-controller-1.27.6.tgz |
|
portforward-controller |
https://binary.mirantis.com/core/helm/portforward-controller-1.27.6.tgz |
|
proxy-controller |
https://binary.mirantis.com/core/helm/proxy-controller-1.27.6.tgz |
|
rbac-controller |
https://binary.mirantis.com/core/helm/rbac-controller-1.27.6.tgz |
|
release-controller |
https://binary.mirantis.com/core/helm/release-controller-1.27.6.tgz |
|
rhellicense-controller |
https://binary.mirantis.com/core/helm/rhellicense-controller-1.27.6.tgz |
|
squid-proxy |
https://binary.mirantis.com/core/helm/squid-proxy-1.27.6.tgz |
|
vsphere-credentials-controller |
https://binary.mirantis.com/core/helm/vsphere-credentials-controller-1.27.6.tgz |
|
vsphere-provider |
https://binary.mirantis.com/core/helm/vsphere-provider-1.27.6.tgz |
|
user-controller New |
https://binary.mirantis.com/core/helm/user-controller-1.27.9.tgz |
|
Docker images |
admission-controller Updated |
mirantis.azurecr.io/core/admission-controller:1.27.6 |
agent-controller Updated |
mirantis.azurecr.io/core/agent-controller:1.27.6 |
|
aws-cluster-api-controller Updated |
mirantis.azurecr.io/core/aws-cluster-api-controller:1.27.6 |
|
aws-credentials-controller Updated |
mirantis.azurecr.io/core/aws-credentials-controller:1.27.6 |
|
azure-cluster-api-controller Updated |
mirantis.azurecr.io/core/azure-cluster-api-controller:1.27.6 |
|
azure-credentials-controller Updated |
mirantis.azurecr.io/core/azure-credentials-controller:1.27.6 |
|
byo-cluster-api-controller Updated |
mirantis.azurecr.io/core/byo-cluster-api-controller:1.27.6 |
|
byo-credentials-controller Updated |
mirantis.azurecr.io/core/byo-credentials-controller:1.27.6 |
|
cluster-api-provider-baremetal Updated |
mirantis.azurecr.io/core/cluster-api-provider-baremetal:1.27.6 |
|
cluster-api-provider-equinix Updated |
mirantis.azurecr.io/core/cluster-api-provider-equinix:1.27.6 |
|
equinix-credentials-controller Updated |
mirantis.azurecr.io/core/equinix-credentials-controller:1.27.6 |
|
frontend Updated |
mirantis.azurecr.io/core/frontend:1.27.8 |
|
iam-controller Updated |
mirantis.azurecr.io/core/iam-controller:1.27.6 |
|
kproxy Updated |
mirantis.azurecr.io/lcm/kproxy:1.27.6 |
|
lcm-controller Updated |
mirantis.azurecr.io/core/lcm-controller:v0.3.0-105-g6fb89599 |
|
nginx |
mirantis.azurecr.io/lcm/nginx:1.20.1-alpine |
|
openstack-cluster-api-controller Updated |
mirantis.azurecr.io/core/openstack-cluster-api-controller:1.27.6 |
|
os-credentials-controller Updated |
mirantis.azurecr.io/core/os-credentials-controller:1.27.6 |
|
portforward-controller Updated |
mirantis.azurecr.io/core/portforward-controller:1.27.6 |
|
rbac-controller Updated |
mirantis.azurecr.io/core/rbac-controller:1.27.6 |
|
registry |
mirantis.azurecr.io/lcm/registry:2.7.1 |
|
release-controller Updated |
mirantis.azurecr.io/core/release-controller:1.27.6 |
|
rhellicense-controller Updated |
mirantis.azurecr.io/core/rhellicense-controller:1.27.6 |
|
squid-proxy |
mirantis.azurecr.io/core/squid-proxy:0.0.1-5 |
|
vsphere-cluster-api-controller Updated |
mirantis.azurecr.io/core/vsphere-api-controller:1.27.6 |
|
vsphere-credentials-controller Updated |
mirantis.azurecr.io/core/vsphere-credentials-controller:1.27.6 |
|
user-controller New |
mirantis.azurecr.io/core/user-controller:1.27.9 |
Artifact |
Component |
Path |
|---|---|---|
Binaries |
hash-generate-linux |
http://binary.mirantis.com/iam/bin/hash-generate-0.0.1-268-3cf7f17-linux |
hash-generate-darwin |
http://binary.mirantis.com/iam/bin/hash-generate-0.0.1-268-3cf7f17-darwin |
|
iamctl-linux Updated |
||
iamctl-darwin Updated |
||
iamctl-windows Updated |
||
Helm charts |
iam Updated |
|
iam-proxy |
||
keycloak_proxy |
http://binary.mirantis.com/core/helm/keycloak_proxy-1.26.6.tgz |
|
Docker images |
api Updated |
mirantis.azurecr.io/iam/api:0.5.4 |
auxiliary Updated |
mirantis.azurecr.io/iam/auxiliary:0.5.4 |
|
kubernetes-entrypoint |
mirantis.azurecr.io/iam/external/kubernetes-entrypoint:v0.3.1 |
|
mariadb |
mirantis.azurecr.io/general/mariadb:10.4.16-bionic-20201105025052 |
|
keycloak Updated |
mirantis.azurecr.io/iam/keycloak:0.5.4 |
|
keycloak-gatekeeper |
mirantis.azurecr.io/iam/keycloak-gatekeeper:7.1.3-2 |
The Mirantis Container Cloud GA release 2.13.1 is based on 2.13.0 and:
Introduces support for the Cluster release 6.20.0 that is based on the Cluster release 5.20.0 and represents Mirantis OpenStack for Kubernetes (MOS) 21.6. This Cluster release is based on Mirantis Kubernetes Engine 3.3.12 with Kubernetes 1.18 and Mirantis Container Runtime 20.10.6.
Supports deprecated Cluster releases 7.2.0, 6.19.0, and 5.19.0 that will become unsupported in the following Container Cloud releases.
Caution
Make sure to update the Cluster release version of your managed cluster before the current Cluster release version becomes unsupported by a new Container Cloud release version. Otherwise, Container Cloud stops auto-upgrade and eventually Container Cloud itself becomes unsupported.
For details about the Container Cloud release 2.13.1, refer to its parent release 2.13.0.
The Mirantis Container Cloud GA release 2.13.0:
Introduces support for the Cluster release 7.3.0 that is based on Mirantis Container Runtime 20.10.6 and Mirantis Kubernetes Engine 3.4.5 with Kubernetes 1.20.
Introduces support for the Cluster release 5.20.0 that is based on Mirantis Kubernetes Engine 3.3.12 with Kubernetes 1.18 and Mirantis Container Runtime 20.10.6.
Supports the Cluster release 6.19.0 that is based on the Cluster release 5.19.0 and represents Mirantis OpenStack for Kubernetes (MOS) 21.5.
Supports deprecated Cluster releases 5.19.0, 6.18.0, and 7.2.0 that will become unsupported in the following Container Cloud releases.
Caution
Make sure to update the Cluster release version of your managed cluster before the current Cluster release version becomes unsupported by a new Container Cloud release version. Otherwise, Container Cloud stops auto-upgrade and eventually Container Cloud itself becomes unsupported.
This section outlines release notes for the Container Cloud release 2.13.0.
This section outlines new features and enhancements introduced in the Mirantis Container Cloud release 2.13.0. For the list of enhancements in the Cluster releases 7.3.0 and 5.20.0 that are supported by the Container Cloud release 2.13.0, see the Cluster releases.
Configuration of multiple DHCP ranges for bare metal clusters
Updated RAM requirements for management and regional clusters
Implemented the possibility to configure multiple DHCP ranges using the
bare metal Subnet resources to facilitate multi-rack and other
types of distributed bare metal datacenter topologies.
The dnsmasq DHCP server used for host provisioning in Container Cloud now
supports working with multiple L2 segments through DHCP relay capable
network routers.
To configure DHCP ranges for dnsmasq, create the Subnet objects
tagged with the ipam/SVC-dhcp-range label while setting up subnets
for a managed cluster using Container Cloud CLI.
Learn more
To improve the Container Cloud performance and stability, increased RAM requirements for management and regional clusters from 16 to 24 GB for all supported cloud providers except bare metal, with the corresponding flavor changes for the AWS and Azure providers:
AWS: updated the instance type from
c5d.2xlargetoc5d.4xlargeAzure: updated the VM size from
Standard_F8s_v2toStandard_F16s_v2
For the Container Cloud managed clusters, requirements remain the same.
The following issues have been addressed in the Mirantis Container Cloud release 2.13.0 along with the Cluster releases 7.3.0 and 5.20.0.
[17705][Azure] Fixed the issue with the failure to deploy more than 62 Azure worker nodes.
[17938][bare metal] Fixed the issue with the bare metal host profile being stuck in the
match profilestate during bootstrap.[17960][bare metal] Fixed the issue with overflow of the Ironic storage volume causing a StackLight alert being triggered for the
ironic-aio-pvcvolume filling up.[17981][bare metal] Fixed the issue with failure to redeploy a bare metal node with an mdadm-based
raid1enabled due to insufficient cleanup of RAID devices.[17359][regional cluster] Fixed the issue with failure to delete an AWS-based regional cluster due to the issue with the cluster credential deletion.
[18193][upgrade] Fixed the issue with failure to upgrade an Equinix Metal or baremetal-based management cluster with Ceph cluster being not ready.
[18076][upgrade] Fixed the issue with StackLight update failure on managed cluster with logging disabled after changing
NodeSelector.[17771][StackLight] Fixed the issue with the Watchdog alert not routing to Salesforce by default.
If you have applied the workaround as described in StackLight known issues: 17771, revert it after updating the Cluster releases to 5.20.0, 6.20.0, or 7.3.0:
Open the StackLight configuration manifest as described in Configure StackLight.
In
alertmanagerSimpleConfig.salesForce:remove the
matchandmarch_reparameters since they are deprecatedremove the
matchersparameter since it changes the default settings
This section lists known issues with workarounds for the Mirantis Container Cloud release 2.13.0 including the Cluster releases 7.3.0, 6.19.0, and 5.20.0.
For other issues that can occur while deploying and operating a Container Cloud cluster, see Troubleshooting Guide.
Note
This section also outlines still valid known issues from previous Container Cloud releases.
Note
Moving forward, the workaround for this issue will be moved from Release Notes to Operations Guide: Troubleshooting.
After update of a management or managed cluster created using the Container
Cloud release earlier than 2.6.0, a bare metal host state is
Provisioned in the Container Cloud web UI while having the error state
in logs with the following message:
status:
errorCount: 1
errorMessage: 'Host adoption failed: Error while attempting to adopt node 7a8d8aa7-e39d-48ec-98c1-ed05eacc354f:
Validation of image href http://10.10.10.10/images/stub_image.qcow2 failed,
reason: Got HTTP code 404 instead of 200 in response to HEAD request..'
errorType: provisioned registration error
The issue is caused by the image URL pointing to an unavailable resource due to the URI IP change during update. As a workaround, update URLs for the bare metal host status and spec with the correct values that use a stable DNS record as a host.
Workaround:
Note
In the commands below, we update master-2 as an example.
Replace it with the corresponding value to fit your deployment.
Exit Lens.
In a new terminal, configure access to the affected cluster.
Start
kube-proxy:kubectl proxy &
Pause the reconcile:
kubectl patch bmh master-2 --type=merge --patch '{"metadata":{"annotations":{"baremetalhost.metal3.io/paused": "true"}}}'
Create the payload data with the following content:
For
status_payload.json:{ "status": { "errorCount": 0, "errorMessage": "", "provisioning": { "image": { "checksum": "http://httpd-http/images/stub_image.qcow2.md5sum", "url": "http://httpd-http/images/stub_image.qcow2" }, "state": "provisioned" } } }
For
status_payload.json:{ "spec": { "image": { "checksum": "http://httpd-http/images/stub_image.qcow2.md5sum", "url": "http://httpd-http/images/stub_image.qcow2" } } }
Verify that the payload data is valid:
cat status_payload.json | jq cat spec_payload.json | jq
The system response must contain the data added in the previous step.
Patch the bare metal host status with payload:
curl -k -v -XPATCH -H "Accept: application/json" -H "Content-Type: application/merge-patch+json" --data-binary "@status_payload.json" 127.0.0.1:8001/apis/metal3.io/v1alpha1/namespaces/default/baremetalhosts/master-2/status
Patch the bare metal host spec with payload:
kubectl patch bmh master-2 --type=merge --patch "$(cat spec_payload.json)"
Resume the reconcile:
kubectl patch bmh master-2 --type=merge --patch '{"metadata":{"annotations":{"baremetalhost.metal3.io/paused":null}}}'
Close the terminal to quit
kube-proxyand resume Lens.
If you run bootstrap.sh preflight with
KAAS_BM_FULL_PREFLIGHT=true, the script fails with the following message:
preflight check failed: preflight full check failed: \
error waiting for BareMetalHosts to power on: \
timed out waiting for the condition
Workaround:
Unset full preflight using the
unset KAAS_BM_FULL_PREFLIGHTenvironment variable.Rerun bootstrap.sh preflight that executes fast preflight instead.
An OpenStack-based regional cluster cleanup fails with the timeout error.
Workaround:
Wait for the
Clusterobject to be deleted in the bootstrap cluster:kubectl --kubeconfig <(./bin/kind get kubeconfig --name clusterapi) get cluster
The system output must be empty.
Remove the bootstrap cluster manually:
./bin/kind delete cluster --name clusterapi
If a RHEL license is removed before the related managed cluster is deleted,
the cluster deletion hangs with the following Machine object error:
Failed to remove finalizer from machine ...
failed to get RHELLicense object
As a workaround, recreate the removed RHEL license object with the same name using the Container Cloud web UI or API.
Warning
The kubectl apply command automatically saves the
applied data as plain text into the
kubectl.kubernetes.io/last-applied-configuration annotation of the
corresponding object. This may result in revealing sensitive data in this
annotation when creating or modifying the object.
Therefore, do not use kubectl apply on this object. Use kubectl create, kubectl patch, or kubectl edit instead.
If you used kubectl apply on this object, you
can remove the kubectl.kubernetes.io/last-applied-configuration
annotation from the object using kubectl edit.
Note
Moving forward, the workaround for this issue will be moved from Release Notes to Troubleshooting Guide.
A vSphere-based management cluster bootstrap fails due to a node leaving the cluster after an accidental IP address change.
The issue may affect a vSphere-based cluster only when IPAM is not enabled and IP addresses assignment to the vSphere virtual machines is done by a DHCP server present in the vSphere network.
By default, a DHCP server keeps lease of the IP address for 30 minutes.
Usually, a VM dhclient prolongs such lease by frequent DHCP requests
to the server before the lease period ends.
The DHCP prolongation request period is always less than the default lease time
on the DHCP server, so prolongation usually works.
But in case of network issues, for example, when dhclient from the
VM cannot reach the DHCP server, or the VM is being slowly powered on
for more than the lease time, such VM may lose its assigned IP address.
As a result, it obtains a new IP address.
Container Cloud does not support network reconfiguration after the IP of the VM has been changed. Therefore, such issue may lead to a VM leaving the cluster.
Symptoms:
One of the nodes is in the
NodeNotReadyordownstate:kubectl get nodes -o wide docker node ls
The UCP Swarm manager logs on the healthy manager node contain the following example error:
docker logs -f ucp-swarm-manager level=debug msg="Engine refresh failed" id="<docker node ID>|<node IP>: 12376"
If the affected node is manager:
The output of the docker info command contains the following example error:
Error: rpc error: code = Unknown desc = The swarm does not have a leader. \ It's possible that too few managers are online. \ Make sure more than half of the managers are online.
The UCP controller logs contain the following example error:
docker logs -f ucp-controller "warning","msg":"Node State Active check error: \ Swarm Mode Manager health check error: \ info: Cannot connect to the Docker daemon at tcp://<node IP>:12376. \ Is the docker daemon running?
On the affected node, the IP address on the first interface
eth0does not match the IP address configured in Docker. Verify theNode Addressfield in the output of the docker info command.The following lines are present in
/var/log/messages:dhclient[<pid>]: bound to <node IP> -- renewal in 1530 seconds
If there are several lines where the IP is different, the node is affected.
Workaround:
Select from the following options:
Bind IP addresses for all machines to their MAC addresses on the DHCP server for the dedicated vSphere network. In this case, VMs receive only specified IP addresses that never change.
Remove the Container Cloud node IPs from the IP range on the DHCP server for the dedicated vSphere network and configure the first interface
eth0on VMs with a static IP address.If a managed cluster is affected, redeploy it with IPAM enabled for new machines to be created and IPs to be assigned properly.
During deployment of any Container Cloud cluster or attachment of an existing
MKE cluster that is not deployed by Container Cloud, the machines are stuck
in the Pending state with no lcmcluster-controller entries from the
lcm-controller logs except the following ones:
kubectl --kubeconfig <pathToMgmtOrRegionalClusterKubeconfig> logs lcm-lcm-controller-<controllerID> -n kaas | grep lcmcluster-controller
{"level":"info","ts":1634808016.777575,"logger":"controller-runtime.manager.controller.lcmcluster-controller","msg":"Starting EventSource","source":"kind source: /, Kind="}
{"level":"info","ts":1634808016.8779392,"logger":"controller-runtime.manager.controller.lcmcluster-controller","msg":"Starting EventSource","source":"kind source: /, Kind="}
The issue affects only clusters with the Container Cloud projects (Kubernetes
namespaces) in the Terminating state.
Workaround:
Verify the state of the Container Cloud projects:
kubectl --kubeconfig <pathToMgmtOrRegionalClusterKubeconfig> get ns
If any project is in the
Terminatingstate, proceed to the next step. Otherwise, further assess the cluster logs to identify the root cause of the issue.Clean up the project that is stuck in the
Terminatingstate:Identify the objects that are stuck in the project:
kubectl --kubeconfig <pathToMgmtOrRegionalClusterKubeconfig> get ns <projectName> -o yaml
Example of system response:
... status: conditions: ... - lastTransitionTime: "2021-10-19T17:05:23Z" message: 'Some resources are remaining: pods. has 1 resource instances' reason: SomeResourcesRemain status: "True" type: NamespaceContentRemaining
Remove the
metadata.finalizersfield from the affected objects:kubectl --kubeconfig <pathToMgmtOrRegionalClusterKubeconfig> edit <objectType>/<objecName> -n <objectProjectName>
Restart
lcm-controlleron the affected management or regional cluster:kubectl --kubeconfig <pathToMgmtOrRegionalClusterKubeconfig> get pod -n kaas | awk '/lcm-controller/ {print $1}' | xargs kubectl --kubeconfig <pathToMgmtOrRegionalClusterKubeconfig> delete pod -n kaas
Note
The issue affects only Helm v2 releases and is addressed for Helm v3. Starting from Container Cloud 2.19.0, all Helm releases are switched to v3.
During a management, regional, or managed cluster deployment,
Helm releases may get stuck in the FAILED or UNKNOWN state
although the corresponding machines statuses are Ready
in the Container Cloud web UI. For example, if the StackLight Helm release
fails, the links to its endpoints are grayed out in the web UI.
In the cluster status, providerStatus.helm.ready and
providerStatus.helm.releaseStatuses.<releaseName>.success are false.
HelmBundle cannot recover from such states and requires manual actions.
The workaround below describes the recovery steps for the stacklight
release that got stuck during a cluster deployment.
Use this procedure as an example for other Helm releases as required.
Workaround:
Verify the failed release has the
UNKNOWNorFAILEDstatus in the HelmBundle object:kubectl --kubeconfig <regionalClusterKubeconfigPath> get helmbundle <clusterName> -n <clusterProjectName> -o=jsonpath={.status.releaseStatuses.stacklight} In the command above and in the steps below, replace the parameters enclosed in angle brackets with the corresponding values of your cluster.
Example of system response:
stacklight: attempt: 2 chart: "" finishedAt: "2021-02-05T09:41:05Z" hash: e314df5061bd238ac5f060effdb55e5b47948a99460c02c2211ba7cb9aadd623 message: '[{"occurrence":1,"lastOccurrenceDate":"2021-02-05 09:41:05","content":"error updating the release: rpc error: code = Unknown desc = customresourcedefinitions.apiextensions.k8s.io \"helmbundles.lcm.mirantis.com\" already exists"}]' notes: "" status: UNKNOWN success: false version: 0.1.2-mcp-398
Log in to the
helm-controllerpod console:kubectl --kubeconfig <affectedClusterKubeconfigPath> exec -n kube-system -it helm-controller-0 sh -c tiller
Download the Helm v3 binary. For details, see official Helm documentation.
Remove the failed release:
helm delete <failed-release-name>
For example:
helm delete stacklight
Once done, the release triggers for redeployment.
Prometheus web UI URLs in StackLight notifications sent to Salesforce use a wrong protocol: HTTP instead of HTTPS. The issue affects deployments with TLS enabled for IAM.
The workaround is to manually change the URL protocol in the web browser.
The csi-rbdplugin-provisioner pod (csi-provisioner container) may show
constant retries attempting to create a PV if the csi-rbdplugin-provisioner
pod was scheduled and started on a node with no connectivity to the Ceph
storage. As a result, creation of a Ceph-based persistent volume (PV) may get
stuck in the Pending state.
As a workaround manually specify the affinity or toleration rules for the
csi-rbdplugin-provisioner pod.
Workaround:
On the managed cluster, open the
rook-ceph-operator-configmap for editing:kubectl edit configmap -n rook-ceph rook-ceph-operator-config
To avoid spawning pods on the nodes where this is not needed, set the provisioner node affinity specifying the required node labels. For example:
CSI_PROVISIONER_NODE_AFFINITY: "role=storage-node; storage=rook, ceph"
Note
If needed, you can also specify CSI_PROVISIONER_TOLERATIONS
tolerations. For example:
CSI_PROVISIONER_TOLERATIONS: |
- effect: NoSchedule
key: node-role.kubernetes.io/controlplane
operator: Exists
- effect: NoExecute
key: node-role.kubernetes.io/etcd
operator: Exists
During deployment of a Ceph cluster, the RADOS Gateway (RGW) pod overrides
the global CA bundle located at /etc/pki/tls/certs with an incorrect
self-signed CA bundle. The issue affects only clusters with public
certificates.
Workaround:
Open the
KaasCephClusterCR of a managed cluster for editing:kubectl edit kaascephcluster -n <managedClusterProjectName>
Substitute
<managedClusterProjectName>with a corresponding value.Select from the following options:
If you are using the GoDaddy certificates, in the
cephClusterSpec.objectStorage.rgwsection, replace thecacertparameters with your public CA certificate that already contains both the root CA certificate and intermediate CA certificate:cephClusterSpec: objectStorage: rgw: SSLCert: cacert: | -----BEGIN CERTIFICATE----- ca-certificate here -----END CERTIFICATE----- tlsCert: | -----BEGIN CERTIFICATE----- private TLS certificate here -----END CERTIFICATE----- tlsKey: | -----BEGIN RSA PRIVATE KEY----- private TLS key here -----END RSA PRIVATE KEY-----
If you are using the DigiCert certificates:
Download the
<root_CA>from DigiCert.In the
cephClusterSpec.objectStorage.rgwsection, replace thecacertparameters with your public intermediate CA certificate along with the root one:cephClusterSpec: objectStorage: rgw: SSLCert: cacert: | -----BEGIN CERTIFICATE----- <root CA here> <intermediate CA here> -----END CERTIFICATE----- tlsCert: | -----BEGIN CERTIFICATE----- private TLS certificate here -----END CERTIFICATE----- tlsKey: | -----BEGIN RSA PRIVATE KEY----- private TLS key here -----END RSA PRIVATE KEY-----
Affects only Container Cloud 2.11,0, 2.12,0, 2.13.0, and 2.13.1
Ceph LCM automatic operations such as Ceph OSD or Ceph node removal are
unstable for the new Rook 1.6.8 and Ceph 15.2.13 (Ceph Octopus) versions and
may cause data corruption. Therefore, manageOsds is disabled until further
notice.
As a workaround, to safely remove a Ceph OSD or node from a Ceph cluster, perform the steps described in Remove Ceph OSD manually.
Note
Moving forward, the workaround for this issue will be moved from Release Notes to Troubleshooting Guide.
The Equinix Metal and MOS-based managed clusters may fail to update to the latest Cluster release with kubelet being stuck and reporting authorization errors.
The cluster is affected by the issue if you see the Failed to make webhook authorizer request: context canceled error in the kubelet logs:
docker logs ucp-kubelet --since 5m 2>&1 | grep 'Failed to make webhook authorizer request: context canceled'
As a workaround, restart the ucp-kubelet container on the affected
node(s):
ctr -n com.docker.ucp snapshot rm ucp-kubelet
docker rm -f ucp-kubelet
Note
Ignore failures in the output of the first command, if any.
An Equinix-based management or managed cluster fails to update with the
FailedAttachVolume and FailedMount warnings.
Workaround:
Verify that the description of the pods that failed to run contain the
FailedMountevents:kubectl -n <affectedProjectName> describe pod <affectedPodName>
<affectedProjectName>is the Container Cloud project name where the pods failed to run<affectedPodName>is a pod name that failed to run in this project
In the pod description, identify the node name where the pod failed to run.
Verify that the
csi-rbdpluginlogs of the affected node contain the rbd volume mount failed: <csi-vol-uuid> is being used error. The<csi-vol-uuid>is a unique RBD volume name.Identify
csiPodNameof the correspondingcsi-rbdplugin:kubectl -n rook-ceph get pod -l app=csi-rbdplugin \ -o jsonpath='{.items[?(@.spec.nodeName == "<nodeName>")].metadata.name}'
Output the affected
csiPodNamelogs:kubectl -n rook-ceph logs <csiPodName> -c csi-rbdplugin
Scale down the affected
StatefulSetorDeploymentof the pod that fails to init to0replicas.On every
csi-rbdpluginpod, search for stuckcsi-vol:for pod in `kubectl -n rook-ceph get pods|grep rbdplugin|grep -v provisioner|awk '{print $1}'`; do echo $pod kubectl exec -it -n rook-ceph $pod -c csi-rbdplugin -- rbd device list | grep <csi-vol-uuid> done
Unmap the affected
csi-vol:rbd unmap -o force /dev/rbd<i>
The
/dev/rbd<i>value is a mapped RBD volume that usescsi-vol.Delete
volumeattachmentof the affected pod:kubectl get volumeattachments | grep <csi-vol-uuid> kubectl delete volumeattacmhent <id>
Scale up the affected
StatefulSetorDeploymentback to the original number of replicas and wait until its state isRunning.
Helm releases may get stuck in the PENDING_UPGRADE status
during a management or managed cluster upgrade. The HelmBundle Controller
cannot recover from this state and requires manual actions. The workaround
below describes the recovery process for the openstack-operator release
that stuck during a managed cluster update. Use it as an example for other
Helm releases as required.
Workaround:
Log in to the
helm-controllerpod console:kubectl exec -n kube-system -it helm-controller-0 sh -c tiller
Identify the release that stuck in the
PENDING_UPGRADEstatus. For example:./helm --host=localhost:44134 history openstack-operator
Example of system response:
REVISION UPDATED STATUS CHART DESCRIPTION 1 Tue Dec 15 12:30:41 2020 SUPERSEDED openstack-operator-0.3.9 Install complete 2 Tue Dec 15 12:32:05 2020 SUPERSEDED openstack-operator-0.3.9 Upgrade complete 3 Tue Dec 15 16:24:47 2020 PENDING_UPGRADE openstack-operator-0.3.18 Preparing upgrade
Roll back the failed release to the previous revision:
Download the Helm v3 binary. For details, see official Helm documentation.
Roll back the failed release:
helm rollback <failed-release-name>
For example:
helm rollback openstack-operator 2
Once done, the release will be reconciled.
Affects only Container Cloud 2.18.0 and earlier
A project that is newly created in the Container Cloud web UI does not display in the Projects list even after refreshing the page. The issue occurs due to the token missing the necessary role for the new project. As a workaround, relogin to the Container Cloud web UI.
The following table lists the major components and their versions of the Mirantis Container Cloud release 2.13.0.
Note
The components that are newly added, updated, deprecated, or removed
as compared to the previous release version, are marked
with a corresponding superscript,
for example, lcm-ansible Updated.
Component |
Application/Service |
Version |
|---|---|---|
AWS Updated |
aws-provider |
1.26.6 |
aws-credentials-controller |
1.26.6 |
|
Azure Updated |
azure-provider |
1.26.6 |
azure-credentials-controller |
1.26.6 |
|
Bare metal |
ambassador New |
1.18.0 |
Bare metal |
baremetal-operator Updated |
5.2.3 |
baremetal-public-api Updated |
5.2.3 |
|
baremetal-provider Updated |
1.26.6 |
|
httpd Replaced with ambassador |
n/a |
|
ironic Updated |
victoria-bionic-20211006090712 |
|
ironic-operator Updated |
base-bionic-20210930105000 |
|
kaas-ipam Updated |
base-bionic-20210930121606 |
|
local-volume-provisioner |
1.0.6-mcp |
|
mariadb |
10.4.17-bionic-20210617085111 |
|
IAM |
iam |
2.4.8 |
iam-controller Updated |
1.26.6 |
|
keycloak |
12.0.0 |
|
Container Cloud |
admission-controller Updated |
1.26.6 |
agent-controller Updated |
1.26.6 |
|
byo-credentials-controller Updated |
1.26.6 |
|
byo-provider Updated |
1.26.6 |
|
kaas-public-api Updated |
1.26.6 |
|
kaas-exporter Updated |
1.26.6 |
|
kaas-ui Updated |
1.26.6 |
|
lcm-controller Updated |
0.3.0-76-g3a45ff9e |
|
mcc-cache Updated |
1.26.6 |
|
portforward-controller New |
1.26.6 |
|
proxy-controller Updated |
1.26.6 |
|
rbac-controller Updated |
1.26.6 |
|
release-controller Updated |
1.26.6 |
|
rhellicense-controller Updated |
1.26.6 |
|
squid-proxy |
0.0.1-5 |
|
Equinix Metal Updated |
equinix-provider |
1.26.6 |
equinix-credentials-controller |
1.26.6 |
|
OpenStack Updated |
openstack-provider |
1.26.6 |
os-credentials-controller |
1.26.6 |
|
VMware vSphere Updated |
vsphere-provider |
1.26.6 |
vsphere-credentials-controller |
1.26.6 |
This section lists the components artifacts of the Mirantis Container Cloud release 2.13.0.
Note
The components that are newly added, updated, deprecated, or removed
as compared to the previous release version, are marked
with a corresponding superscript,
for example, lcm-ansible Updated.
Artifact |
Component |
Path |
|---|---|---|
Binaries |
baremetal-operator Updated |
https://binary.mirantis.com/bm/helm/baremetal-operator-5.2.3.tgz |
baremetal-public-api Updated |
https://binary.mirantis.com/bm/helm/baremetal-public-api-5.2.3.tgz |
|
ironic-python-agent-bionic.kernel |
https://binary.mirantis.com/bm/bin/ironic/ipa/ubuntu/kernel-victoria-bionic-debug-20210817124316 |
|
ironic-python-agent-bionic.initramfs |
https://binary.mirantis.com/bm/bin/ironic/ipa/ubuntu/initramfs-victoria-bionic-debug-20210817124316 |
|
kaas-ipam Updated |
||
local-volume-provisioner |
https://binary.mirantis.com/bm/helm/local-volume-provisioner-1.0.6-mcp.tgz |
|
provisioning_ansible Updated |
https://binary.mirantis.com/bm/bin/ansible/provisioning_ansible-0.1.1-82-342bd22.tgz |
|
target ubuntu system |
https://binary.mirantis.com/bm/bin/efi/ubuntu/tgz-bionic-20210622161844 |
|
Docker images |
ambassador New |
mirantis.azurecr.io/lcm/nginx:1.18.0 |
baremetal-operator Updated |
mirantis.azurecr.io/bm/baremetal-operator:base-bionic-20211005112459 |
|
dnsmasq |
mirantis.azurecr.io/general/dnsmasq:focal-20210617094827 |
|
httpd |
n/a (replaced with ambassador) |
|
ironic Updated |
mirantis.azurecr.io/openstack/ironic:victoria-bionic-20211006090712 |
|
ironic-inspector Updated |
mirantis.azurecr.io/openstack/ironic-inspector:victoria-bionic-20211006090712 |
|
ironic-operator Updated |
mirantis.azurecr.io/bm/ironic-operator:base-bionic-20210930105000 |
|
ironic-prometheus-exporter |
mirantis.azurecr.io/stacklight/ironic-prometheus-exporter:0.1-20210608113804 |
|
kaas-ipam Updated |
mirantis.azurecr.io/bm/kaas-ipam:base-bionic-20210930121606 |
|
mariadb |
mirantis.azurecr.io/general/mariadb:10.4.17-bionic-20210617085111 |
|
syslog-ng |
mirantis.azurecr.io/bm/syslog-ng:base-bionic-20210617094817 |
Artifact |
Component |
Paths |
|---|---|---|
Bootstrap tarball Updated |
bootstrap-linux |
https://binary.mirantis.com/core/bin/bootstrap-linux-1.26.6.tar.gz |
bootstrap-darwin |
https://binary.mirantis.com/core/bin/bootstrap-darwin-1.26.6.tar.gz |
|
Helm charts Updated |
admission-controller |
https://binary.mirantis.com/core/helm/admission-controller-1.26.6.tgz |
agent-controller |
https://binary.mirantis.com/core/helm/agent-controller-1.26.6.tgz |
|
aws-credentials-controller |
https://binary.mirantis.com/core/helm/aws-credentials-controller-1.26.6.tgz |
|
aws-provider |
https://binary.mirantis.com/core/helm/aws-provider-1.26.6.tgz |
|
azure-credentials-controller |
https://binary.mirantis.com/core/helm/azure-credentials-controller-1.26.6.tgz |
|
azure-provider |
https://binary.mirantis.com/core/helm/azure-provider-1.26.6.tgz |
|
baremetal-provider |
https://binary.mirantis.com/core/helm/baremetal-provider-1.26.6.tgz |
|
byo-credentials-controller |
https://binary.mirantis.com/core/helm/byo-credentials-controller-1.26.6.tgz |
|
byo-provider |
https://binary.mirantis.com/core/helm/byo-provider-1.26.6.tgz |
|
equinix-credentials-controller |
https://binary.mirantis.com/core/helm/equinix-credentials-controller-1.26.6.tgz |
|
equinix-provider |
https://binary.mirantis.com/core/helm/equinix-provider-1.26.6.tgz |
|
iam-controller |
https://binary.mirantis.com/core/helm/iam-controller-1.26.6.tgz |
|
kaas-exporter |
https://binary.mirantis.com/core/helm/kaas-exporter-1.26.6.tgz |
|
kaas-public-api |
https://binary.mirantis.com/core/helm/kaas-public-api-1.26.6.tgz |
|
kaas-ui |
||
lcm-controller |
https://binary.mirantis.com/core/helm/lcm-controller-1.26.6.tgz |
|
mcc-cache |
||
openstack-provider |
https://binary.mirantis.com/core/helm/openstack-provider-1.26.6.tgz |
|
os-credentials-controller |
https://binary.mirantis.com/core/helm/os-credentials-controller-1.26.6.tgz |
|
portforward-controller New |
https://binary.mirantis.com/core/helm/portforward-controller-1.26.6.tgz |
|
proxy-controller |
https://binary.mirantis.com/core/helm/proxy-controller-1.26.6.tgz |
|
rbac-controller |
https://binary.mirantis.com/core/helm/rbac-controller-1.26.6.tgz |
|
release-controller |
https://binary.mirantis.com/core/helm/release-controller-1.26.6.tgz |
|
rhellicense-controller |
https://binary.mirantis.com/core/helm/rhellicense-controller-1.26.6.tgz |
|
squid-proxy |
https://binary.mirantis.com/core/helm/squid-proxy-1.26.6.tgz |
|
vsphere-credentials-controller |
https://binary.mirantis.com/core/helm/vsphere-credentials-controller-1.26.6.tgz |
|
vsphere-provider |
https://binary.mirantis.com/core/helm/vsphere-provider-1.26.6.tgz |
|
Docker images |
admission-controller Updated |
mirantis.azurecr.io/core/admission-controller:1.26.6 |
agent-controller Updated |
mirantis.azurecr.io/core/agent-controller:1.26.6 |
|
aws-cluster-api-controller Updated |
mirantis.azurecr.io/core/aws-cluster-api-controller:1.26.6 |
|
aws-credentials-controller Updated |
mirantis.azurecr.io/core/aws-credentials-controller:1.26.6 |
|
azure-cluster-api-controller Updated |
mirantis.azurecr.io/core/azure-cluster-api-controller:1.26.6 |
|
azure-credentials-controller Updated |
mirantis.azurecr.io/core/azure-credentials-controller:1.26.6 |
|
byo-cluster-api-controller Updated |
mirantis.azurecr.io/core/byo-cluster-api-controller:1.26.6 |
|
byo-credentials-controller Updated |
mirantis.azurecr.io/core/byo-credentials-controller:1.26.6 |
|
cluster-api-provider-baremetal Updated |
mirantis.azurecr.io/core/cluster-api-provider-baremetal:1.26.6 |
|
cluster-api-provider-equinix Updated |
mirantis.azurecr.io/core/cluster-api-provider-equinix:1.26.6 |
|
equinix-credentials-controller Updated |
mirantis.azurecr.io/core/equinix-credentials-controller:1.26.6 |
|
frontend Updated |
mirantis.azurecr.io/core/frontend:1.26.6 |
|
iam-controller Updated |
mirantis.azurecr.io/core/iam-controller:1.26.6 |
|
kproxy Updated |
mirantis.azurecr.io/lcm/kproxy:1.26.6 |
|
lcm-controller Updated |
mirantis.azurecr.io/core/lcm-controller:v0.3.0-76-g3a45ff9e |
|
nginx Updated |
mirantis.azurecr.io/lcm/nginx:1.20.1-alpine |
|
openstack-cluster-api-controller Updated |
mirantis.azurecr.io/core/openstack-cluster-api-controller:1.26.6 |
|
os-credentials-controller Updated |
mirantis.azurecr.io/core/os-credentials-controller:1.26.6 |
|
portforward-controller New |
mirantis.azurecr.io/core/portforward-controller:1.26.6 |
|
rbac-controller Updated |
mirantis.azurecr.io/core/rbac-controller:1.26.6 |
|
registry |
mirantis.azurecr.io/lcm/registry:2.7.1 |
|
release-controller Updated |
mirantis.azurecr.io/core/release-controller:1.26.6 |
|
rhellicense-controller Updated |
mirantis.azurecr.io/core/rhellicense-controller:1.26.6 |
|
squid-proxy |
mirantis.azurecr.io/core/squid-proxy:0.0.1-5 |
|
vsphere-cluster-api-controller Updated |
mirantis.azurecr.io/core/vsphere-api-controller:1.26.6 |
|
vsphere-credentials-controller Updated |
mirantis.azurecr.io/core/vsphere-credentials-controller:1.26.6 |
Artifact |
Component |
Path |
|---|---|---|
Binaries |
hash-generate-linux |
http://binary.mirantis.com/iam/bin/hash-generate-0.0.1-268-3cf7f17-linux |
hash-generate-darwin |
http://binary.mirantis.com/iam/bin/hash-generate-0.0.1-268-3cf7f17-darwin |
|
iamctl-linux |
||
iamctl-darwin |
||
iamctl-windows |
||
Helm charts |
iam |
|
iam-proxy Updated |
||
keycloak_proxy Updated |
http://binary.mirantis.com/core/helm/keycloak_proxy-1.26.6.tgz |
|
Docker images |
api |
mirantis.azurecr.io/iam/api:0.5.3 |
auxiliary |
mirantis.azurecr.io/iam/auxiliary:0.5.3 |
|
kubernetes-entrypoint Updated |
mirantis.azurecr.io/iam/external/kubernetes-entrypoint:v0.3.1 |
|
mariadb |
mirantis.azurecr.io/general/mariadb:10.4.16-bionic-20201105025052 |
|
keycloak |
mirantis.azurecr.io/iam/keycloak:0.5.3 |
|
keycloak-gatekeeper |
mirantis.azurecr.io/iam/keycloak-gatekeeper:7.1.3-2 |
The Mirantis Container Cloud GA release 2.12.0:
Introduces support for the Cluster release 7.2.0 that is based on Mirantis Container Runtime 20.10.6 and Mirantis Kubernetes Engine 3.4.5 with Kubernetes 1.20.
Introduces support for the Cluster release 5.19.0 that is based on Mirantis Kubernetes Engine 3.3.12 with Kubernetes 1.18 and Mirantis Container Runtime 20.10.6.
Introduces support for the Cluster release 6.19.0 that is based on the Cluster release 5.19.0 and represents Mirantis OpenStack for Kubernetes (MOS) 21.5.
Supports deprecated Cluster releases 5.18.0, 6.18.0, and 7.1.0 that will become unsupported in the following Container Cloud releases.
Caution
Make sure to update the Cluster release version of your managed cluster before the current Cluster release version becomes unsupported by a new Container Cloud release version. Otherwise, Container Cloud stops auto-upgrade and eventually Container Cloud itself becomes unsupported.
This section outlines release notes for the Container Cloud release 2.12.0.
This section outlines new features and enhancements introduced in the Mirantis Container Cloud release 2.12.0. For the list of enhancements in the Cluster releases 7.2.0, 6.19.0, and 5.19.0 that are supported by the Container Cloud release 2.12.0, see the Cluster releases.
Introduced official support for the Microsoft Azure cloud provider, including support for creating and operating of management, regional, and managed clusters.
Implemented the possibility to deploy Container Cloud management, regional, and managed clusters on top of Mirantis OpenStack for Kubernetes (MOS) Victoria that is based on the Open vSwitch networking.
Learn more
TECHNOLOGY PREVIEW
Added the Technology Preview support for configuration of software-based
Redundant Array of Independent Disks (RAID) using BareMetalHosProfile
to set up LVM or mdadm-based RAID level 1 (raid1).
If required, you can further configure RAID in the same profile,
for example, to install a cluster operating system onto a RAID device.
You can configure RAID during a baremetal-based management or managed cluster creation. RAID configuration on already provisioned bare metal machines or on an existing cluster is not supported.
Note
This feature is available as technical preview. Use such configuration for testing and evaluation purposes only.
Learn more
Added the Preparing state to the provisioning workflow of bare metal hosts.
Bare Metal Operator inspects a bare metal host and moves it to the
Preparing state. In this state, the host becomes ready to be linked
to a bare metal machine.
Added the Transport Layer Security (TLS) configuration to all Container Cloud endpoints for all supported cloud providers. The Container Cloud web UI and StackLight endpoints are now available through TLS with self-signed certificates generated by the Container Cloud provider. If required, you can also add your own TLS certificates to the Container Cloud web UI and Keycloak.
Caution
After the Container Cloud upgrade from 2.11.0 to 2.12.0, all Container Cloud endpoints are available only through HTTPS.
Migrated iam-proxy from the deprecated Louketo Proxy, formerly known as
keycloak-proxy to OAuth2 Proxy.
To apply the migration, all iam-proxy services in the StackLight namespace
are restarted during a management cluster upgrade or managed cluster update.
This causes a short downtime for the web UI access to StackLight services,
although all services themselves, such as Kibana or Grafana, continue working.
Implemented the possibility to customize the default backup configuration for a MariaDB database on a management cluster. You can customize the default configuration either during a management cluster bootstrap or on an existing management cluster. The Kubernetes cron job responsible for the MariaDB backup is enabled by default for the OpenStack and AWS cloud providers and is disabled for other supported providers.
In the scope of continuous improvement of the product,
renamed the Container Cloud binary from kaas to container-cloud.
On top of continuous improvements delivered to the existing Container Cloud guides, added a procedure on how to back up and restore an OpenStack or AWS-based management cluster. The procedure consists of the MariaDB and MKE backup and restore steps.
The following issues have been addressed in the Mirantis Container Cloud release 2.12.0 along with the Cluster releases 7.2.0, 6.19.0, and 5.19.0.
[16718][Equinix Metal] Fixed the issue with the Equinix Metal provider failing to create machines with an SSH key error if an Equinix Metal based cluster was being deployed in an Equinix Metal project with no SSH keys.
[17118][bare metal] Fixed the issue with failure to add a new machine to a baremetal-based managed cluster after the management cluster upgrade.
[16959][OpenStack] Fixed the issue with failure to create a proxy-based OpenStack regional cluster due to the issue with the proxy secret creation.
[13385][IAM] Fixed the issue with MariaDB pods failing to start after MariaDB blocked itself during the State Snapshot Transfers sync.
[8367][LCM] Fixed the issue with joining etcd from a new node to an existing etcd cluster. The issue caused the new managed node to hang in the
Deploystate when adding it to a managed cluster.[16873][bootstrap] Fixed the issue with a management cluster bootstrap failing with failed to establish connection with tiller error due to kind 0.9.0 delivered with the bootstrap script being not compatible with the latest Ubuntu 18.04 image that requires kind 0.11.1.
[16964][Ceph] Fixed the issue with a bare metal or Equinix Metal management cluster upgrade getting stuck and then failing with some Ceph daemons being stuck on upgrade to Octopus and with the
insecure global_id reclaimhealth warning in Ceph logs.[16843][StackLight] Fixed the issue causing inability to override default route matchers for Salesforce notifier.
If you have applied the workaround as described in StackLight known issues: 16843 after updating the cluster releases to 5.19.0, 7.2.0, or 6.19.0 and if you need to define custom matchers, replace the deprecated
matchandmatch_reparameters withmatchersas required. For details, see Deprecation Notes and StackLight configuration parameters.[17477][Update][StackLight] Fixed the issue with StackLight in HA mode placed on controller nodes being not deployed or cluster update being blocked. Once you update your Mirantis OpenStack for Kubernetes cluster from the Cluster release 6.18.0 to 6.19.0, roll back the workaround applied as described in Upgrade known issues: 17477:
Remove
stacklightlabels from worker nodes. Wait for the labels to be removed.Remove the custom
nodeSelectorsection from the cluster spec.
[16777][Update][StackLight] Fixed the issue causing the Cluster release update from 7.0.0 to 7.1.0 to fail due to failed Patroni pod. The issue affected the Container Cloud management, regional, or managed cluster of any cloud provider.
[17069][Update][Ceph] Fixed the issue with upgrade of a bare metal or Equinix Metal based management or managed cluster failing with the Failed to configure Ceph cluster error due to different versions of the
rook-ceph-osddeployments.[17007][Update] Fixed the issue with the false-positive release: “squid-proxy” not found error during a management cluster upgrade of any supported cloud provider except vSphere.
This section lists known issues with workarounds for the Mirantis Container Cloud release 2.12.0 including the Cluster releases 7.2.0, 6.19.0, and 5.19.0.
For other issues that can occur while deploying and operating a Container Cloud cluster, see Troubleshooting Guide.
Note
This section also outlines still valid known issues from previous Container Cloud releases.
Fixed in the Cluster release 7.0.0
Note
The issue below affects only the Kubernetes 1.18 deployments. Moving forward, the workaround for this issue will be moved from Release Notes to Troubleshooting Guide.
On a management cluster with multiple AWS-based managed
clusters, some clusters fail to complete the deployments that require
persistent volumes (PVs), for example, Elasticsearch.
Some of the affected pods get stuck in the Pending state
with the pod has unbound immediate PersistentVolumeClaims and
node(s) had volume node affinity conflict errors.
Warning
The workaround below applies to HA deployments where data can be rebuilt from replicas. If you have a non-HA deployment, back up any existing data before proceeding, since all data will be lost while applying the workaround.
Workaround:
Obtain the persistent volume claims related to the storage mounts of the affected pods:
kubectl get pod/<pod_name1> pod/<pod_name2> \ -o jsonpath='{.spec.volumes[?(@.persistentVolumeClaim)].persistentVolumeClaim.claimName}'
Note
In the command above and in the subsequent steps, substitute the parameters enclosed in angle brackets with the corresponding values.
Delete the affected
PodsandPersistentVolumeClaimsto reschedule them: For example, for StackLight:kubectl -n stacklight delete \ pod/<pod_name1> pod/<pod_name2> ... pvc/<pvc_name2> pvc/<pvc_name2> ...
Fixed in 2.13.0
The default value of the Ports per instance load balancer
outbound NAT setting that is 1024 prevents from deploying
more than 62 Azure worker nodes on a managed cluster. To workaround the issue,
set the Ports per instance parameter to 256.
Workaround:
Log in to the Azure portal.
Navigate to Home > Load Balancing.
Find and click the load balancer called mcc-<uniqueClusterID>. You can obtain
<uniqueClusterID>in the Cluster info field in the Container Cloud web UI.In the load balancer Settings left-side menu, click Outbound rules > OutboundNATAllProtocols.
In the Outbound ports > Choose by menu, select Ports per instance.
In the Ports per instance field, replace the default 1024 value with 256.
Click Save to apply the new setting.
Note
Moving forward, the workaround for this issue will be moved from Release Notes to Operations Guide: Troubleshooting.
After update of a management or managed cluster created using the Container
Cloud release earlier than 2.6.0, a bare metal host state is
Provisioned in the Container Cloud web UI while having the error state
in logs with the following message:
status:
errorCount: 1
errorMessage: 'Host adoption failed: Error while attempting to adopt node 7a8d8aa7-e39d-48ec-98c1-ed05eacc354f:
Validation of image href http://10.10.10.10/images/stub_image.qcow2 failed,
reason: Got HTTP code 404 instead of 200 in response to HEAD request..'
errorType: provisioned registration error
The issue is caused by the image URL pointing to an unavailable resource due to the URI IP change during update. As a workaround, update URLs for the bare metal host status and spec with the correct values that use a stable DNS record as a host.
Workaround:
Note
In the commands below, we update master-2 as an example.
Replace it with the corresponding value to fit your deployment.
Exit Lens.
In a new terminal, configure access to the affected cluster.
Start
kube-proxy:kubectl proxy &
Pause the reconcile:
kubectl patch bmh master-2 --type=merge --patch '{"metadata":{"annotations":{"baremetalhost.metal3.io/paused": "true"}}}'
Create the payload data with the following content:
For
status_payload.json:{ "status": { "errorCount": 0, "errorMessage": "", "provisioning": { "image": { "checksum": "http://httpd-http/images/stub_image.qcow2.md5sum", "url": "http://httpd-http/images/stub_image.qcow2" }, "state": "provisioned" } } }
For
status_payload.json:{ "spec": { "image": { "checksum": "http://httpd-http/images/stub_image.qcow2.md5sum", "url": "http://httpd-http/images/stub_image.qcow2" } } }
Verify that the payload data is valid:
cat status_payload.json | jq cat spec_payload.json | jq
The system response must contain the data added in the previous step.
Patch the bare metal host status with payload:
curl -k -v -XPATCH -H "Accept: application/json" -H "Content-Type: application/merge-patch+json" --data-binary "@status_payload.json" 127.0.0.1:8001/apis/metal3.io/v1alpha1/namespaces/default/baremetalhosts/master-2/status
Patch the bare metal host spec with payload:
kubectl patch bmh master-2 --type=merge --patch "$(cat spec_payload.json)"
Resume the reconcile:
kubectl patch bmh master-2 --type=merge --patch '{"metadata":{"annotations":{"baremetalhost.metal3.io/paused":null}}}'
Close the terminal to quit
kube-proxyand resume Lens.
Fixed in 2.13.0
Redeployment of a bare metal node with an mdadm-based raid1 enabled
fails due to insufficient cleanup of RAID devices.
Workaround:
Boot the affected node from any LiveCD, preferably Ubuntu.
Obtain details about the mdadm RAID devices:
sudo mdadm --detail --scan --verbose
Stop all mdadm RAID devices listed in the output of the above command. For example:
sudo mdadm --stop /dev/md0
Clean up the metadata on partitions with the mdadm RAID device(s) enabled. For example:
sudo mdadm --zero-superblock /dev/sda1
In the above example, replace
/dev/sda1with partitions listed in the output of the command provided in the step 2.
Fixed in 2.13.0
On the baremetal-based management clusters with the Container Cloud version
2.12.0 or earlier, the storage volume used by Ironic can run out of free space.
As a result, a StackLight alert is triggered for the ironic-aio-pvc volume
filling up.
Symptoms
One or more of the following symptoms are observed:
The StackLight KubePersistentVolumeUsageCritical alert is firing for the volume
ironic-aio-pvc.The
ironicanddnsmasqDeploymentsare not in theOKstatus:kubectl -n kaas get deployments
One or multiple
ironicanddnsmasqpods fail to start:For
dnsmasq:kubectl get pods -n kaas -o wide | grep dnsmasq
If the number of ready containers for the pod is not 2/2, the management cluster can be affected by the issue.
For
ironic:kubectl get pods -n kaas -o wide | grep ironic
If the number of ready containers for the pod is not 6/6, the management cluster can be affected by the issue.
The free space on a volume is less than 10%. To verify space usage on a volume:
kubectl -n kaas exec -ti deployment/ironic -c ironic-api -- /bin/bash -c 'df -h |grep -i "volume\|size"'
Example of system response where
14%is the used space of a volume:Filesystem Size Used Avail Use% Mounted on /dev/rbd0 4.9G 686M 4.2G 14% /volume
As a workaround, truncate the log files on the storage volume:
kubectl -n kaas exec -ti deployment/dnsmasq -- /bin/bash -c 'truncate -s 0 /volume/log/ironic/ironic-api.log'
kubectl -n kaas exec -ti deployment/dnsmasq -- /bin/bash -c 'truncate -s 0 /volume/log/ironic/ironic-conductor.log'
kubectl -n kaas exec -ti deployment/dnsmasq -- /bin/bash -c 'truncate -s 0 /volume/log/ironic/ansible-playbook.log'
kubectl -n kaas exec -ti deployment/dnsmasq -- /bin/bash -c 'truncate -s 0 /volume/log/ironic-inspector/ironic-inspector.log'
kubectl -n kaas exec -ti deployment/dnsmasq -- /bin/bash -c 'truncate -s 0 /volume/log/dnsmasq/dnsmasq-dhcpd.log'
kubectl -n kaas exec -ti deployment/dnsmasq -- /bin/bash -c 'truncate -s 0 /volume/log/ambassador/access.log
kubectl -n kaas exec -ti deployment/dnsmasq -- /bin/bash -c 'truncate -s 0 /volume/log/ambassador/error.log
If you run bootstrap.sh preflight with
KAAS_BM_FULL_PREFLIGHT=true, the script fails with the following message:
preflight check failed: preflight full check failed: \
error waiting for BareMetalHosts to power on: \
timed out waiting for the condition
Workaround:
Unset full preflight using the
unset KAAS_BM_FULL_PREFLIGHTenvironment variable.Rerun bootstrap.sh preflight that executes fast preflight instead.
An OpenStack-based regional cluster cleanup fails with the timeout error.
Workaround:
Wait for the
Clusterobject to be deleted in the bootstrap cluster:kubectl --kubeconfig <(./bin/kind get kubeconfig --name clusterapi) get cluster
The system output must be empty.
Remove the bootstrap cluster manually:
./bin/kind delete cluster --name clusterapi
Note
Moving forward, the workaround for this issue will be moved from Release Notes to Troubleshooting Guide.
A vSphere-based management cluster bootstrap fails due to a node leaving the cluster after an accidental IP address change.
The issue may affect a vSphere-based cluster only when IPAM is not enabled and IP addresses assignment to the vSphere virtual machines is done by a DHCP server present in the vSphere network.
By default, a DHCP server keeps lease of the IP address for 30 minutes.
Usually, a VM dhclient prolongs such lease by frequent DHCP requests
to the server before the lease period ends.
The DHCP prolongation request period is always less than the default lease time
on the DHCP server, so prolongation usually works.
But in case of network issues, for example, when dhclient from the
VM cannot reach the DHCP server, or the VM is being slowly powered on
for more than the lease time, such VM may lose its assigned IP address.
As a result, it obtains a new IP address.
Container Cloud does not support network reconfiguration after the IP of the VM has been changed. Therefore, such issue may lead to a VM leaving the cluster.
Symptoms:
One of the nodes is in the
NodeNotReadyordownstate:kubectl get nodes -o wide docker node ls
The UCP Swarm manager logs on the healthy manager node contain the following example error:
docker logs -f ucp-swarm-manager level=debug msg="Engine refresh failed" id="<docker node ID>|<node IP>: 12376"
If the affected node is manager:
The output of the docker info command contains the following example error:
Error: rpc error: code = Unknown desc = The swarm does not have a leader. \ It's possible that too few managers are online. \ Make sure more than half of the managers are online.
The UCP controller logs contain the following example error:
docker logs -f ucp-controller "warning","msg":"Node State Active check error: \ Swarm Mode Manager health check error: \ info: Cannot connect to the Docker daemon at tcp://<node IP>:12376. \ Is the docker daemon running?
On the affected node, the IP address on the first interface
eth0does not match the IP address configured in Docker. Verify theNode Addressfield in the output of the docker info command.The following lines are present in
/var/log/messages:dhclient[<pid>]: bound to <node IP> -- renewal in 1530 seconds
If there are several lines where the IP is different, the node is affected.
Workaround:
Select from the following options:
Bind IP addresses for all machines to their MAC addresses on the DHCP server for the dedicated vSphere network. In this case, VMs receive only specified IP addresses that never change.
Remove the Container Cloud node IPs from the IP range on the DHCP server for the dedicated vSphere network and configure the first interface
eth0on VMs with a static IP address.If a managed cluster is affected, redeploy it with IPAM enabled for new machines to be created and IPs to be assigned properly.
Note
Moving forward, the workaround for this issue will be moved from Release Notes to Troubleshooting Guide.
Occasionally, kubelet may get stuck on the Cluster release 5.x.x series
with different errors in the ucp-kubelet containers leading to the nodes
failures. The following error occurs every time when accessing
the Kubernetes API server:
an error on the server ("") has prevented the request from succeeding
As a workaround, restart ucp-kubelet on the failed node:
ctr -n com.docker.ucp snapshot rm ucp-kubelet
docker rm -f ucp-kubelet
Note
The issue affects only Helm v2 releases and is addressed for Helm v3. Starting from Container Cloud 2.19.0, all Helm releases are switched to v3.
During a management, regional, or managed cluster deployment,
Helm releases may get stuck in the FAILED or UNKNOWN state
although the corresponding machines statuses are Ready
in the Container Cloud web UI. For example, if the StackLight Helm release
fails, the links to its endpoints are grayed out in the web UI.
In the cluster status, providerStatus.helm.ready and
providerStatus.helm.releaseStatuses.<releaseName>.success are false.
HelmBundle cannot recover from such states and requires manual actions.
The workaround below describes the recovery steps for the stacklight
release that got stuck during a cluster deployment.
Use this procedure as an example for other Helm releases as required.
Workaround:
Verify the failed release has the
UNKNOWNorFAILEDstatus in the HelmBundle object:kubectl --kubeconfig <regionalClusterKubeconfigPath> get helmbundle <clusterName> -n <clusterProjectName> -o=jsonpath={.status.releaseStatuses.stacklight} In the command above and in the steps below, replace the parameters enclosed in angle brackets with the corresponding values of your cluster.
Example of system response:
stacklight: attempt: 2 chart: "" finishedAt: "2021-02-05T09:41:05Z" hash: e314df5061bd238ac5f060effdb55e5b47948a99460c02c2211ba7cb9aadd623 message: '[{"occurrence":1,"lastOccurrenceDate":"2021-02-05 09:41:05","content":"error updating the release: rpc error: code = Unknown desc = customresourcedefinitions.apiextensions.k8s.io \"helmbundles.lcm.mirantis.com\" already exists"}]' notes: "" status: UNKNOWN success: false version: 0.1.2-mcp-398
Log in to the
helm-controllerpod console:kubectl --kubeconfig <affectedClusterKubeconfigPath> exec -n kube-system -it helm-controller-0 sh -c tiller
Download the Helm v3 binary. For details, see official Helm documentation.
Remove the failed release:
helm delete <failed-release-name>
For example:
helm delete stacklight
Once done, the release triggers for redeployment.
Fixed in 2.13.0
The Watchdog alert is not routed to Salesforce by default.
Note
After applying the workaround, you may notice the following warning message. It is expected and does not affect configuration rendering:
Warning: Merging destination map for chart 'stacklight'. Overwriting table
item 'match', with non table value: []
Workaround:
Open the StackLight configuration manifest as described in Configure StackLight.
In
alertmanagerSimpleConfig.salesForce, specify the following configuration:alertmanagerSimpleConfig: salesForce: route: match: [] match_re: severity: "informational|critical" matchers: - severity=~"informational|critical"
Prometheus web UI URLs in StackLight notifications sent to Salesforce use a wrong protocol: HTTP instead of HTTPS. The issue affects deployments with TLS enabled for IAM.
The workaround is to manually change the URL protocol in the web browser.
The csi-rbdplugin-provisioner pod (csi-provisioner container) may show
constant retries attempting to create a PV if the csi-rbdplugin-provisioner
pod was scheduled and started on a node with no connectivity to the Ceph
storage. As a result, creation of a Ceph-based persistent volume (PV) may get
stuck in the Pending state.
As a workaround manually specify the affinity or toleration rules for the
csi-rbdplugin-provisioner pod.
Workaround:
On the managed cluster, open the
rook-ceph-operator-configmap for editing:kubectl edit configmap -n rook-ceph rook-ceph-operator-config
To avoid spawning pods on the nodes where this is not needed, set the provisioner node affinity specifying the required node labels. For example:
CSI_PROVISIONER_NODE_AFFINITY: "role=storage-node; storage=rook, ceph"
Note
If needed, you can also specify CSI_PROVISIONER_TOLERATIONS
tolerations. For example:
CSI_PROVISIONER_TOLERATIONS: |
- effect: NoSchedule
key: node-role.kubernetes.io/controlplane
operator: Exists
- effect: NoExecute
key: node-role.kubernetes.io/etcd
operator: Exists
During deployment of a Ceph cluster, the RADOS Gateway (RGW) pod overrides
the global CA bundle located at /etc/pki/tls/certs with an incorrect
self-signed CA bundle. The issue affects only clusters with public
certificates.
Workaround:
Open the
KaasCephClusterCR of a managed cluster for editing:kubectl edit kaascephcluster -n <managedClusterProjectName>
Substitute
<managedClusterProjectName>with a corresponding value.Select from the following options:
If you are using the GoDaddy certificates, in the
cephClusterSpec.objectStorage.rgwsection, replace thecacertparameters with your public CA certificate that already contains both the root CA certificate and intermediate CA certificate:cephClusterSpec: objectStorage: rgw: SSLCert: cacert: | -----BEGIN CERTIFICATE----- ca-certificate here -----END CERTIFICATE----- tlsCert: | -----BEGIN CERTIFICATE----- private TLS certificate here -----END CERTIFICATE----- tlsKey: | -----BEGIN RSA PRIVATE KEY----- private TLS key here -----END RSA PRIVATE KEY-----
If you are using the DigiCert certificates:
Download the
<root_CA>from DigiCert.In the
cephClusterSpec.objectStorage.rgwsection, replace thecacertparameters with your public intermediate CA certificate along with the root one:cephClusterSpec: objectStorage: rgw: SSLCert: cacert: | -----BEGIN CERTIFICATE----- <root CA here> <intermediate CA here> -----END CERTIFICATE----- tlsCert: | -----BEGIN CERTIFICATE----- private TLS certificate here -----END CERTIFICATE----- tlsKey: | -----BEGIN RSA PRIVATE KEY----- private TLS key here -----END RSA PRIVATE KEY-----
Affects only Container Cloud 2.11,0, 2.12,0, 2.13.0, and 2.13.1
Ceph LCM automatic operations such as Ceph OSD or Ceph node removal are
unstable for the new Rook 1.6.8 and Ceph 15.2.13 (Ceph Octopus) versions and
may cause data corruption. Therefore, manageOsds is disabled until further
notice.
As a workaround, to safely remove a Ceph OSD or node from a Ceph cluster, perform the steps described in Remove Ceph OSD manually.
Fixed in 2.13.0
During deletion of an AWS-based regional cluster, deletion of the cluster credential fails with error deleting regional credential: error waiting for credential deletion: timed out waiting for the condition.
Workaround:
Change the directory to
kaas-bootstrap.Scale up the
aws-credentials-controller-aws-credentials-controllerdeployment:./bin/kind get kubeconfig --name clusterapi > kubeconfig-bootstrap kubectl --kubeconfig kubeconfig-bootstrap scale deployment \ aws-credentials-controller-aws-credentials-controller \ --namespace kaas --replicas=1
Wait until the affected credential is deleted:
kubectl --kubeconfig <pathToMgmtClusterKubeconfig> \ get awscredentials.kaas.mirantis.com -A -l kaas.mirantis.com/region=<regionName>
In the above command, replace:
<regionName>with the name of the region where the regional cluster is located.<pathToMgmtClusterKubeconfig>with the path to the correspondingmanagement cluster
kubeconfig.
Example of a positive system response:
No resources found
Delete the bootstrap cluster:
./bin/kind delete cluster --name clusterapi
Fixed in 2.13.0
An Equinix Metal or baremetal-based management cluster upgrade may fail with the following error message:
Reconcile MiraCeph 'ceph-lcm-mirantis/rook-ceph' failed with error:
failed to ensure cephcluster: failed to ensure cephcluster rook-ceph/rook-ceph:
ceph cluster rook-ceph/rook-ceph is not ready to be updated
Your cluster is affected if:
The
rook-ceph/rook-ceph-operatorlogs contain the following errors:Failed to update lock: Internal error occurred: unable to unmarshal response in forceLegacy: json: cannot unmarshal number into Go value of type bool Failed to update lock: Internal error occurred: unable to perform request for determining if legacy behavior should be forced
The kubectl -n rook-ceph get cephcluster command returns the
cephclusterresource with theProgressingstate.
As a workaround, restart the rook-ceph-operator pod:
kubectl -n rook-ceph delete pod -l app=rook-ceph-operator
Note
Moving forward, the workaround for this issue will be moved from Release Notes to Troubleshooting Guide.
The Equinix Metal and MOS-based managed clusters may fail to update to the latest Cluster release with kubelet being stuck and reporting authorization errors.
The cluster is affected by the issue if you see the Failed to make webhook authorizer request: context canceled error in the kubelet logs:
docker logs ucp-kubelet --since 5m 2>&1 | grep 'Failed to make webhook authorizer request: context canceled'
As a workaround, restart the ucp-kubelet container on the affected
node(s):
ctr -n com.docker.ucp snapshot rm ucp-kubelet
docker rm -f ucp-kubelet
Note
Ignore failures in the output of the first command, if any.
An Equinix-based management or managed cluster fails to update with the
FailedAttachVolume and FailedMount warnings.
Workaround:
Verify that the description of the pods that failed to run contain the
FailedMountevents:kubectl -n <affectedProjectName> describe pod <affectedPodName>
<affectedProjectName>is the Container Cloud project name where the pods failed to run<affectedPodName>is a pod name that failed to run in this project
In the pod description, identify the node name where the pod failed to run.
Verify that the
csi-rbdpluginlogs of the affected node contain the rbd volume mount failed: <csi-vol-uuid> is being used error. The<csi-vol-uuid>is a unique RBD volume name.Identify
csiPodNameof the correspondingcsi-rbdplugin:kubectl -n rook-ceph get pod -l app=csi-rbdplugin \ -o jsonpath='{.items[?(@.spec.nodeName == "<nodeName>")].metadata.name}'
Output the affected
csiPodNamelogs:kubectl -n rook-ceph logs <csiPodName> -c csi-rbdplugin
Scale down the affected
StatefulSetorDeploymentof the pod that fails to init to0replicas.On every
csi-rbdpluginpod, search for stuckcsi-vol:for pod in `kubectl -n rook-ceph get pods|grep rbdplugin|grep -v provisioner|awk '{print $1}'`; do echo $pod kubectl exec -it -n rook-ceph $pod -c csi-rbdplugin -- rbd device list | grep <csi-vol-uuid> done
Unmap the affected
csi-vol:rbd unmap -o force /dev/rbd<i>
The
/dev/rbd<i>value is a mapped RBD volume that usescsi-vol.Delete
volumeattachmentof the affected pod:kubectl get volumeattachments | grep <csi-vol-uuid> kubectl delete volumeattacmhent <id>
Scale up the affected
StatefulSetorDeploymentback to the original number of replicas and wait until its state isRunning.
Helm releases may get stuck in the PENDING_UPGRADE status
during a management or managed cluster upgrade. The HelmBundle Controller
cannot recover from this state and requires manual actions. The workaround
below describes the recovery process for the openstack-operator release
that stuck during a managed cluster update. Use it as an example for other
Helm releases as required.
Workaround:
Log in to the
helm-controllerpod console:kubectl exec -n kube-system -it helm-controller-0 sh -c tiller
Identify the release that stuck in the
PENDING_UPGRADEstatus. For example:./helm --host=localhost:44134 history openstack-operator
Example of system response:
REVISION UPDATED STATUS CHART DESCRIPTION 1 Tue Dec 15 12:30:41 2020 SUPERSEDED openstack-operator-0.3.9 Install complete 2 Tue Dec 15 12:32:05 2020 SUPERSEDED openstack-operator-0.3.9 Upgrade complete 3 Tue Dec 15 16:24:47 2020 PENDING_UPGRADE openstack-operator-0.3.18 Preparing upgrade
Roll back the failed release to the previous revision:
Download the Helm v3 binary. For details, see official Helm documentation.
Roll back the failed release:
helm rollback <failed-release-name>
For example:
helm rollback openstack-operator 2
Once done, the release will be reconciled.
Fixed in 2.13.0
On a managed cluster with logging disabled, changing NodeSelector can
cause StackLight update failure with the following message in the StackLight
Helm Controller logs:
Upgrade "stacklight" failed: Job.batch "stacklight-delete-logging-pvcs-*" is invalid: spec.template: Invalid value: ...
As a workaround, disable the stacklight-delete-logging-pvcs-* job.
Workaround:
Open the affected
Clusterobject for editing:kubectl edit cluster <affectedManagedClusterName> -n <affectedManagedClusterProjectName>
Set
deleteVolumestofalse:spec: ... providerSpec: ... value: ... helmReleases: ... - name: stacklight values: ... logging: deleteVolumes: false ...
Affects only Container Cloud 2.18.0 and earlier
A project that is newly created in the Container Cloud web UI does not display in the Projects list even after refreshing the page. The issue occurs due to the token missing the necessary role for the new project. As a workaround, relogin to the Container Cloud web UI.
The following table lists the major components and their versions of the Mirantis Container Cloud release 2.12.0.
Note
The components that are newly added, updated, deprecated, or removed
as compared to the previous release version, are marked
with a corresponding superscript,
for example, lcm-ansible Updated.
Component |
Application/Service |
Version |
|---|---|---|
AWS Updated |
aws-provider |
1.25.6 |
aws-credentials-controller |
1.25.6 |
|
Azure Updated |
azure-provider |
1.25.6 |
azure-credentials-controller |
1.25.6 |
|
Bare metal |
baremetal-operator Updated |
5.2.1 |
baremetal-public-api Updated |
5.2.1 |
|
baremetal-provider Updated |
1.25.6 |
|
httpd |
1.18.0 |
|
ironic |
victoria-bionic-20210719060025 |
|
ironic-operator Updated |
base-bionic-20210908110402 |
|
kaas-ipam Updated |
base-bionic-20210819150000 |
|
local-volume-provisioner |
1.0.6-mcp |
|
mariadb |
10.4.17-bionic-20210617085111 |
|
IAM |
iam Updated |
2.4.8 |
iam-controller Updated |
1.25.6 |
|
keycloak |
12.0.0 |
|
Container Cloud |
admission-controller Updated |
1.25.6 |
agent-controller New |
1.25.6 |
|
byo-credentials-controller Updated |
1.25.6 |
|
byo-provider Updated |
1.25.6 |
|
kaas-public-api Updated |
1.25.6 |
|
kaas-exporter Updated |
1.25.6 |
|
kaas-ui Updated |
1.25.8 |
|
lcm-controller Updated |
0.3.0-41-g6ecc1974 |
|
mcc-cache Updated |
1.25.6 |
|
proxy-controller Updated |
1.25.6 |
|
rbac-controller New |
1.25.7 |
|
release-controller Updated |
1.25.6 |
|
rhellicense-controller Updated |
1.25.6 |
|
squid-proxy |
0.0.1-5 |
|
Equinix Metal Updated |
equinix-provider |
1.25.6 |
equinix-credentials-controller |
1.25.6 |
|
OpenStack Updated |
openstack-provider |
1.25.6 |
os-credentials-controller |
1.25.6 |
|
VMware vSphere Updated |
vsphere-provider |
1.25.6 |
vsphere-credentials-controller |
1.25.6 |
This section lists the components artifacts of the Mirantis Container Cloud release 2.12.0.
Note
The components that are newly added, updated, deprecated, or removed
as compared to the previous release version, are marked
with a corresponding superscript,
for example, lcm-ansible Updated.
Artifact |
Component |
Path |
|---|---|---|
Binaries |
baremetal-operator Updated |
https://binary.mirantis.com/bm/helm/baremetal-operator-5.2.1.tgz |
baremetal-public-api Updated |
https://binary.mirantis.com/bm/helm/baremetal-public-api-5.2.1.tgz |
|
ironic-python-agent-bionic.kernel Updated |
https://binary.mirantis.com/bm/bin/ironic/ipa/ubuntu/kernel-victoria-bionic-debug-20210817124316 |
|
ironic-python-agent-bionic.initramfs Updated |
https://binary.mirantis.com/bm/bin/ironic/ipa/ubuntu/initramfs-victoria-bionic-debug-20210817124316 |
|
kaas-ipam Updated |
||
local-volume-provisioner |
https://binary.mirantis.com/bm/helm/local-volume-provisioner-1.0.6-mcp.tgz |
|
provisioning_ansible Updated |
https://binary.mirantis.com/bm/bin/ansible/provisioning_ansible-0.1.1-79-41e503a.tgz |
|
target ubuntu system |
https://binary.mirantis.com/bm/bin/efi/ubuntu/tgz-bionic-20210622161844 |
|
Docker images |
baremetal-operator Updated |
mirantis.azurecr.io/bm/baremetal-operator:base-bionic-20210908111623 |
dnsmasq |
mirantis.azurecr.io/general/dnsmasq:focal-20210617094827 |
|
httpd |
mirantis.azurecr.io/lcm/nginx:1.18.0 |
|
ironic |
mirantis.azurecr.io/openstack/ironic:victoria-bionic-20210719060025 |
|
ironic-inspector |
mirantis.azurecr.io/openstack/ironic-inspector:victoria-bionic-20210719060025 |
|
ironic-operator Updated |
mirantis.azurecr.io/bm/ironic-operator:base-bionic-20210908110402 |
|
ironic-prometheus-exporter |
mirantis.azurecr.io/stacklight/ironic-prometheus-exporter:0.1-20210608113804 |
|
kaas-ipam Updated |
mirantis.azurecr.io/bm/kaas-ipam:base-bionic-20210819150000 |
|
mariadb |
mirantis.azurecr.io/general/mariadb:10.4.17-bionic-20210617085111 |
|
syslog-ng |
mirantis.azurecr.io/bm/syslog-ng:base-bionic-20210617094817 |
Artifact |
Component |
Paths |
|---|---|---|
Bootstrap tarball Updated |
bootstrap-linux |
https://binary.mirantis.com/core/bin/bootstrap-linux-1.25.6.tar.gz |
bootstrap-darwin |
https://binary.mirantis.com/core/bin/bootstrap-darwin-1.25.6.tar.gz |
|
Helm charts Updated |
admission-controller |
https://binary.mirantis.com/core/helm/admission-controller-1.25.6.tgz |
agent-controller New |
https://binary.mirantis.com/core/helm/agent-controller-1.25.6.tgz |
|
aws-credentials-controller |
https://binary.mirantis.com/core/helm/aws-credentials-controller-1.25.6.tgz |
|
aws-provider |
https://binary.mirantis.com/core/helm/aws-provider-1.25.6.tgz |
|
azure-credentials-controller Updated |
https://binary.mirantis.com/core/helm/azure-credentials-controller-1.25.6.tgz |
|
azure-provider Updated |
https://binary.mirantis.com/core/helm/azure-provider-1.25.6.tgz |
|
baremetal-provider |
https://binary.mirantis.com/core/helm/baremetal-provider-1.25.6.tgz |
|
byo-credentials-controller |
https://binary.mirantis.com/core/helm/byo-credentials-controller-1.25.6.tgz |
|
byo-provider |
https://binary.mirantis.com/core/helm/byo-provider-1.25.6.tgz |
|
equinix-credentials-controller |
https://binary.mirantis.com/core/helm/equinix-credentials-controller-1.25.6.tgz |
|
equinix-provider |
https://binary.mirantis.com/core/helm/equinix-provider-1.25.6.tgz |
|
iam-controller |
https://binary.mirantis.com/core/helm/iam-controller-1.25.6.tgz |
|
kaas-exporter |
https://binary.mirantis.com/core/helm/kaas-exporter-1.25.6.tgz |
|
kaas-public-api |
https://binary.mirantis.com/core/helm/kaas-public-api-1.25.6.tgz |
|
kaas-ui |
||
lcm-controller |
https://binary.mirantis.com/core/helm/lcm-controller-1.25.6.tgz |
|
mcc-cache |
||
openstack-provider |
https://binary.mirantis.com/core/helm/openstack-provider-1.25.6.tgz |
|
os-credentials-controller |
https://binary.mirantis.com/core/helm/os-credentials-controller-1.25.6.tgz |
|
proxy-controller |
https://binary.mirantis.com/core/helm/proxy-controller-1.25.6.tgz |
|
rbac-controller New |
https://binary.mirantis.com/core/helm/rbac-controller-1.25.7.tgz |
|
release-controller |
https://binary.mirantis.com/core/helm/release-controller-1.25.6.tgz |
|
rhellicense-controller |
https://binary.mirantis.com/core/helm/rhellicense-controller-1.25.6.tgz |
|
squid-proxy |
https://binary.mirantis.com/core/helm/squid-proxy-1.25.6.tgz |
|
vsphere-credentials-controller |
https://binary.mirantis.com/core/helm/vsphere-credentials-controller-1.25.6.tgz |
|
vsphere-provider |
https://binary.mirantis.com/core/helm/vsphere-provider-1.25.6.tgz |
|
Docker images |
admission-controller Updated |
mirantis.azurecr.io/core/admission-controller:1.25.6 |
agent-controller New |
mirantis.azurecr.io/core/agent-controller:1.25.6 |
|
aws-cluster-api-controller Updated |
mirantis.azurecr.io/core/aws-cluster-api-controller:1.25.6 |
|
aws-credentials-controller Updated |
mirantis.azurecr.io/core/aws-credentials-controller:1.25.6 |
|
azure-cluster-api-controller Updated |
mirantis.azurecr.io/core/azure-cluster-api-controller:1.25.6 |
|
azure-credentials-controller Updated |
mirantis.azurecr.io/core/azure-credentials-controller:1.25.6 |
|
byo-cluster-api-controller Updated |
mirantis.azurecr.io/core/byo-cluster-api-controller:1.25.6 |
|
byo-credentials-controller Updated |
mirantis.azurecr.io/core/byo-credentials-controller:1.25.6 |
|
cluster-api-provider-baremetal Updated |
mirantis.azurecr.io/core/cluster-api-provider-baremetal:1.25.6 |
|
cluster-api-provider-equinix Updated |
mirantis.azurecr.io/core/cluster-api-provider-equinix:1.25.6 |
|
equinix-credentials-controller Updated |
mirantis.azurecr.io/core/equinix-credentials-controller:1.25.6 |
|
frontend Updated |
mirantis.azurecr.io/core/frontend:1.25.8 |
|
iam-controller Updated |
mirantis.azurecr.io/core/iam-controller:1.25.6 |
|
kproxy Updated |
mirantis.azurecr.io/lcm/kproxy:1.25.6 |
|
lcm-controller Updated |
mirantis.azurecr.io/core/lcm-controller:v0.3.0-41-g6ecc1974 |
|
nginx |
mirantis.azurecr.io/lcm/nginx:1.18.0 |
|
openstack-cluster-api-controller Updated |
mirantis.azurecr.io/core/openstack-cluster-api-controller:1.25.6 |
|
os-credentials-controller Updated |
mirantis.azurecr.io/core/os-credentials-controller:1.25.6 |
|
rbac-controller New |
mirantis.azurecr.io/core/rbac-controller:1.25.7 |
|
registry |
mirantis.azurecr.io/lcm/registry:2.7.1 |
|
release-controller Updated |
mirantis.azurecr.io/core/release-controller:1.25.6 |
|
rhellicense-controller Updated |
mirantis.azurecr.io/core/rhellicense-controller:1.25.6 |
|
squid-proxy Updated |
mirantis.azurecr.io/core/squid-proxy:0.0.1-5 |
|
vsphere-cluster-api-controller Updated |
mirantis.azurecr.io/core/vsphere-api-controller:1.25.6 |
|
vsphere-credentials-controller Updated |
mirantis.azurecr.io/core/vsphere-credentials-controller:1.25.6 |
Artifact |
Component |
Path |
|---|---|---|
Binaries |
hash-generate-linux |
http://binary.mirantis.com/iam/bin/hash-generate-0.0.1-268-3cf7f17-linux |
hash-generate-darwin |
http://binary.mirantis.com/iam/bin/hash-generate-0.0.1-268-3cf7f17-darwin |
|
iamctl-linux Updated |
||
iamctl-darwin Updated |
||
iamctl-windows Updated |
||
Helm charts Updated |
iam |
|
iam-proxy |
||
keycloak_proxy |
http://binary.mirantis.com/core/helm/keycloak_proxy-1.26.1.tgz |
|
Docker images |
api Updated |
mirantis.azurecr.io/iam/api:0.5.3 |
auxiliary Updated |
mirantis.azurecr.io/iam/auxiliary:0.5.3 |
|
kubernetes-entrypoint Updated |
mirantis.azurecr.io/openstack/extra/kubernetes-entrypoint:v1.0.0-20200311160233 |
|
mariadb |
mirantis.azurecr.io/general/mariadb:10.4.16-bionic-20201105025052 |
|
keycloak Updated |
mirantis.azurecr.io/iam/keycloak:0.5.3 |
|
keycloak-gatekeeper Updated |
mirantis.azurecr.io/iam/keycloak-gatekeeper:7.1.3-2 |
The Mirantis Container Cloud GA release 2.11.0:
Introduces support for the Cluster release 7.1.0 that is based on Mirantis Container Runtime 20.10.5 and Mirantis Kubernetes Engine 3.4.0 with Kubernetes 1.20.
Introduces support for the Cluster release 5.18.0 that is based on Mirantis Kubernetes Engine 3.3.6 with Kubernetes 1.18 and Mirantis Container Runtime 20.10.5.
Introduces support for the Cluster release 6.18.0 that is based on the Cluster release 5.18.0 and represents Mirantis OpenStack for Kubernetes (MOS) 21.4.
Continues supporting the Cluster release 6.16.0 that is based on the Cluster release 5.16.0 and represents Mirantis OpenStack for Kubernetes (MOS) 21.3.
Supports deprecated Cluster releases 5.17.0, 6.16.0, and 7.0.0 that will become unsupported in the following Container Cloud releases.
Supports the Cluster release 5.11.0 only for attachment of existing MKE 3.3.4 clusters. For the deployment of new or attachment of existing MKE 3.3.6 clusters, the latest available Cluster release is used.
Caution
Make sure to update the Cluster release version of your managed cluster before the current Cluster release version becomes unsupported by a new Container Cloud release version. Otherwise, Container Cloud stops auto-upgrade and eventually Container Cloud itself becomes unsupported.
Caution
Before upgrading an existing managed cluster with StackLight deployed in HA mode to the latest Cluster release, add the StackLight node label to at least 3 worker machines as described in Upgrade managed clusters with StackLight deployed in HA mode. Otherwise, the cluster upgrade will fail.
This section outlines release notes for the Container Cloud release 2.11.0.
This section outlines new features and enhancements introduced in the Mirantis Container Cloud release 2.11.0. For the list of enhancements in the Cluster releases 7.1.0, 6.18.0, and 5.18.0 that are supported by the Container Cloud release 2.11.0, see the Cluster releases.
TECHNOLOGY PREVIEW
Introduced the Technology Preview support for the Microsoft Azure cloud provider, including support for creating and operating of management, regional, and managed clusters.
Note
For the Technology Preview feature definition, refer to Technology Preview features.
Implemented the capability to bootstrap the vSphere provider clusters on the bootstrap node that is based on RHEL 7.9.
Implemented validation labels for the vSphere-based VM templates in the Container Cloud web UI. If a VM template was initially created using the built-in Packer mechanism, the Container Cloud version has a green label on the right side of the drop-down list with VM templates. Otherwise, a template is marked with the Unknown label.
Mirantis recommends using only green-labeled templates for production deployments.
Implemented automatic migration of Docker data located at /var/lib/docker
and local provisioner volumes from existing EBS to local NVMe SSDs during
the AWS-based management and managed clusters upgrade. On new clusters,
the /var/lib/docker Docker data is now located on local NVMe SSDs
by default.
The migration allows moving heavy workloads such as etcd and MariaDB to local NVMe SSDs that significantly improves cluster performance.
Upgraded all core Helm releases in the ClusterRelease and KaasRelease
objects from v2 to v3. Switching of the remaining Helm releases to v3 will
be implemented in one of the following Container Cloud releases.
Added the possibility to configure L2 templates for the baremetal-based management cluster to set up a bond network interface to the PXE/Management network.
Apply this configuration to the bootstrap templates before you run the bootstrap script to deploy the management cluster.
Caution
Using this configuration requires that every host in your management cluster has at least two physical interfaces.
Connect at least two interfaces per host to an Ethernet switch that supports Link Aggregation Control Protocol (LACP) port groups and LACP fallback.
Configure an LACP group on the ports connected to the NICs of a host.
Configure the LACP fallback on the port group to ensure that the host can boot over the PXE network before the bond interface is set up on the host operating system.
Configure server BIOS for both NICs of a bond to be PXE-enabled.
If the server does not support booting from multiple NICs, configure the port of the LACP group that is connected to the PXE-enabled NIC of a server to be primary port. With this setting, the port becomes active in the fallback mode.
Learn more
Implemented the following amendments for bare metal advanced configuration in the Container Cloud web UI:
On the Cluster page, added the Subnets section with a list of available subnets.
Added the Add new subnet wizard.
Renamed the BareMetal tab to BM Hosts.
Added the BM Host Profiles tab that contains a list of custom bare metal host profiles, if any.
Added the BM Host Profile drop-down list to the Create new machine wizard.
Learn more
Implemented the verification mechanism for the actual capacity of the Equinix Metal facilities before machines deployment. Now, you can see the following labels in the Equinix Metal Create a machine wizard of the Container Cloud web UI:
Normal - the facility has a lot of available machines. Prioritize this machine type over others.
Limited - the facility has a limited number of machines. Do not request many machines of this type.
Unknown - Container Cloud cannot fetch information about the capacity level since the feature is disabled.
On top of continuous improvements delivered to the existing Container Cloud guides, added a procedure on how to update the Keycloak IP address on bare metal clusters.
The following issues have been addressed in the Mirantis Container Cloud release 2.11.0 along with the Cluster releases 7.1.0, 6.18.0, and 5.18.0.
For more issues addressed for the Cluster release 6.18.0, see also addressed issues 2.10.0.
[15698][vSphere] Fixed the issue with a load balancer virtual IP address (VIP) being assigned to each manager node on any type of the vSphere-based cluster.
[7573][Ceph] To avoid the Rook community issue with updating Rook to version 1.6, added the
rgw_data_log_backingconfiguration option set toomapby default.[10050][Ceph] Fixed the issue with Ceph OSD pod being stuck in the
CrashLoopBackOffstate due to the Ceph OSD authorization key failing to be created properly after disk replacement if a customBareMetalHostProfilewas used.[16233][Ceph][Upgrade] Fixed the issue with
ironicanddnsmasqpods failing during a baremetal-based management cluster upgrade due to Ceph not unmounting RBD volumes.[7655][BM] Fixed the issue with a bare metal cluster to be deployed successfully but with the runtime errors in the
IpamHostobject if an L2 template was configured incorrectly.[15348][StackLight] Fixed the issue with some panels of the Alertmanager and Prometheus Grafana dashboards not displaying data due to an invalid query.
[15834][StackLight] Removed the CPU resource limit from the
elasticsearch-curatorcontainer to avoid issues with theCPUThrottlingHighalert false-positively firing for Elasticsearch Curator.[16141][StackLight] Fixed the issue with the Alertmanager pod getting stuck in
CrashLoopBackOffduring upgrade of a management, regional, or managed cluster and thus causing upgrade failure with the Loading configuration file failed error message in logs.[15766][StackLight][Upgrade] Fixed the issue with management or regional cluster upgrade failure from version 2.9.0 to 2.10.0 and managed cluster from 5.16.0 to 5.17.0 with the Cannot evict pod error for the
patroni-12-0,patroni-12-1, orpatroni-12-2pod.[16398][StackLight] Fixed the issue with inability to set
require_tlstofalsefor Alertmanager email notifications.[13303] [LCM] Fixed the issue with managed clusters update from the Cluster release 6.12.0 to 6.14.0 failing with worker nodes being stuck in the
Deploystate with theNetwork is unreachableerror.[13845] [LCM] Fixed the issue with the LCM Agent upgrade failing with x509 error during managed clusters update from the Cluster release 6.12.0 to 6.14.0.
This section lists known issues with workarounds for the Mirantis Container Cloud release 2.11.0 including the Cluster releases 7.1.0, 6.18.0, and 5.18.0.
Note
This section also outlines still valid known issues from previous Container Cloud releases.
Fixed in the Cluster release 7.0.0
Note
The issue below affects only the Kubernetes 1.18 deployments. Moving forward, the workaround for this issue will be moved from Release Notes to Troubleshooting Guide.
On a management cluster with multiple AWS-based managed
clusters, some clusters fail to complete the deployments that require
persistent volumes (PVs), for example, Elasticsearch.
Some of the affected pods get stuck in the Pending state
with the pod has unbound immediate PersistentVolumeClaims and
node(s) had volume node affinity conflict errors.
Warning
The workaround below applies to HA deployments where data can be rebuilt from replicas. If you have a non-HA deployment, back up any existing data before proceeding, since all data will be lost while applying the workaround.
Workaround:
Obtain the persistent volume claims related to the storage mounts of the affected pods:
kubectl get pod/<pod_name1> pod/<pod_name2> \ -o jsonpath='{.spec.volumes[?(@.persistentVolumeClaim)].persistentVolumeClaim.claimName}'
Note
In the command above and in the subsequent steps, substitute the parameters enclosed in angle brackets with the corresponding values.
Delete the affected
PodsandPersistentVolumeClaimsto reschedule them: For example, for StackLight:kubectl -n stacklight delete \ pod/<pod_name1> pod/<pod_name2> ... pvc/<pvc_name2> pvc/<pvc_name2> ...
Fixed in 2.12.0
If an Equinix Metal based cluster is being deployed in an Equinix Metal project with no SSH keys, the Equinix Metal provider fails to create machines with the following error:
Failed to create machine "kaas-mgmt-controlplane-0"...
failed to create device: POST https://api.equinix.com/metal/v1/projects/...
<deviceID> must have at least one SSH key or explicitly send no_ssh_keys option
Workaround:
Create a new SSH key.
Log in to the Equinix Metal console.
In Project Settings, click Project SSH Keys.
Click Add New Key and add details of the newly created SSH key.
Click Add.
Restart the cluster deployment.
Fixed in 2.12.0
Adding a new machine to a baremetal-based
managed cluster may fail after the baremetal-based management cluster upgrade.
The issue occurs because the PXE boot is not working for the new node.
In this case, file /volume/tftpboot/ipxe.efi not found logs appear on
dnsmasq-tftp.
Workaround:
Log in to a local machine where your management cluster
kubeconfigis located and where kubectl is installed.Scale the Ironic deployment down to
0replicas.kubectl -n kaas scale deployments/ironic --replicas=0
Scale the Ironic deployment up to
1replica:kubectl -n kaas scale deployments/ironic --replicas=1
Fixed in 2.12.0
An OpenStack-based regional cluster being deployed using proxy fails with the Not ready objects: not ready: statefulSets: kaas/mcc-cache got 0/1 replicas error message due to the issue with the proxy secret creation.
Workaround:
Run the following command:
kubectl get secret -n kube-system mke-proxy-secret -o yaml | sed '/namespace.*/d' | kubectl create -n kaas -f -
Rerun the bootstrap script:
./bootstrap.sh deploy_regional
An OpenStack-based regional cluster cleanup fails with the timeout error.
Workaround:
Wait for the
Clusterobject to be deleted in the bootstrap cluster:kubectl --kubeconfig <(./bin/kind get kubeconfig --name clusterapi) get cluster
The system output must be empty.
Remove the bootstrap cluster manually:
./bin/kind delete cluster --name clusterapi
Fixed in 2.9.0 for new clusters
Newly created pods may fail to run and have the CrashLoopBackOff status
on long-living Container Cloud clusters deployed on RHEL 7.8 using the VMware
vSphere provider. The following is an example output of the
kubectl describe pod <pod-name> -n <projectName> command:
State: Waiting
Reason: CrashLoopBackOff
Last State: Terminated
Reason: ContainerCannotRun
Message: OCI runtime create failed: container_linux.go:349:
starting container process caused "process_linux.go:297:
applying cgroup configuration for process caused
"mkdir /sys/fs/cgroup/memory/kubepods/burstable/<pod-id>/<container-id>>:
cannot allocate memory": unknown
The issue occurs due to the Kubernetes and Docker community issues.
According to the RedHat solution,
the workaround is to disable the kernel memory accounting feature
by appending cgroup.memory=nokmem to the kernel command line.
Note
The workaround below applies to the existing clusters only. The issue is resolved for new Container Cloud 2.9.0 deployments since the workaround below automatically applies to the VM template built during the vSphere-based management cluster bootstrap.
Apply the following workaround on each machine of the affected cluster.
Workaround
SSH to any machine of the affected cluster using
mcc-userand the SSH key provided during the cluster creation to proceed as therootuser.In
/etc/default/grub, setcgroup.memory=nokmemforGRUB_CMDLINE_LINUX.Update kernel:
yum install kernel kernel-headers kernel-tools kernel-tools-libs kexec-tools
Update the grub configuration:
grub2-mkconfig -o /boot/grub2/grub.cfg
Reboot the machine.
Wait for the machine to become available.
Wait for 5 minutes for Docker and Kubernetes services to start.
Verify that the machine is
Ready:docker node ls kubectl get nodes
Repeat the steps above on the remaining machines of the affected cluster.
Note
Moving forward, the workaround for this issue will be moved from Release Notes to Troubleshooting Guide.
A vSphere-based management cluster bootstrap fails due to a node leaving the cluster after an accidental IP address change.
The issue may affect a vSphere-based cluster only when IPAM is not enabled and IP addresses assignment to the vSphere virtual machines is done by a DHCP server present in the vSphere network.
By default, a DHCP server keeps lease of the IP address for 30 minutes.
Usually, a VM dhclient prolongs such lease by frequent DHCP requests
to the server before the lease period ends.
The DHCP prolongation request period is always less than the default lease time
on the DHCP server, so prolongation usually works.
But in case of network issues, for example, when dhclient from the
VM cannot reach the DHCP server, or the VM is being slowly powered on
for more than the lease time, such VM may lose its assigned IP address.
As a result, it obtains a new IP address.
Container Cloud does not support network reconfiguration after the IP of the VM has been changed. Therefore, such issue may lead to a VM leaving the cluster.
Symptoms:
One of the nodes is in the
NodeNotReadyordownstate:kubectl get nodes -o wide docker node ls
The UCP Swarm manager logs on the healthy manager node contain the following example error:
docker logs -f ucp-swarm-manager level=debug msg="Engine refresh failed" id="<docker node ID>|<node IP>: 12376"
If the affected node is manager:
The output of the docker info command contains the following example error:
Error: rpc error: code = Unknown desc = The swarm does not have a leader. \ It's possible that too few managers are online. \ Make sure more than half of the managers are online.
The UCP controller logs contain the following example error:
docker logs -f ucp-controller "warning","msg":"Node State Active check error: \ Swarm Mode Manager health check error: \ info: Cannot connect to the Docker daemon at tcp://<node IP>:12376. \ Is the docker daemon running?
On the affected node, the IP address on the first interface
eth0does not match the IP address configured in Docker. Verify theNode Addressfield in the output of the docker info command.The following lines are present in
/var/log/messages:dhclient[<pid>]: bound to <node IP> -- renewal in 1530 seconds
If there are several lines where the IP is different, the node is affected.
Workaround:
Select from the following options:
Bind IP addresses for all machines to their MAC addresses on the DHCP server for the dedicated vSphere network. In this case, VMs receive only specified IP addresses that never change.
Remove the Container Cloud node IPs from the IP range on the DHCP server for the dedicated vSphere network and configure the first interface
eth0on VMs with a static IP address.If a managed cluster is affected, redeploy it with IPAM enabled for new machines to be created and IPs to be assigned properly.
Note
Moving forward, the workaround for this issue will be moved from Release Notes to Troubleshooting Guide.
Occasionally, kubelet may get stuck on the Cluster release 5.x.x series
with different errors in the ucp-kubelet containers leading to the nodes
failures. The following error occurs every time when accessing
the Kubernetes API server:
an error on the server ("") has prevented the request from succeeding
As a workaround, restart ucp-kubelet on the failed node:
ctr -n com.docker.ucp snapshot rm ucp-kubelet
docker rm -f ucp-kubelet
Fixed in 2.12.0
Adding of a new manager node to a managed cluster may hang due to
issues with joining etcd from a new node to the existing etcd cluster.
The new manager node hangs in the Deploy stage.
Symptoms:
The Ansible run tries executing the
Wait for Docker UCP to be accessiblestep and fails with the following error message:Status code was -1 and not [200]: Request failed: <urlopen error [Errno 111] Connection refused>
The etcd logs on the leader etcd node contain the following example error message occurring every 1-2 minutes:
2021-06-10 03:21:53.196677 W | etcdserver: not healthy for reconfigure, rejecting member add {ID:22bb1d4275f1c5b0 RaftAttributes:{PeerURLs:[https://<new manager IP>:12380] IsLearner:false} Attributes:{Name: ClientURLs:[]}}
To determine the etcd leader, run on any manager node:
docker exec -it ucp-kv sh # From the inside of the container: ETCDCTL_API=3 etcdctl -w table --endpoints=https://<1st manager IP>:12379,https://<2nd manager IP>:12379,https://<3rd manager IP>:12379 endpoint status
To verify logs on the leader node:
docker logs ucp-kv
Root cause:
In case of an unlucky network partition, the leader may lose quorum and members are not able to perform the election. For more details, see Official etcd documentation: Learning, figure 5.
Workaround:
Restart etcd on the leader node:
docker rm -f ucp-kv
Wait several minutes until the etcd cluster starts and reconciles.
The deployment of the new manager node will proceed and it will join the etcd cluster. After that, other MKE components will be configured and the node deployment will be finished successfully.
Note
The issue affects only Helm v2 releases and is addressed for Helm v3. Starting from Container Cloud 2.19.0, all Helm releases are switched to v3.
During a management, regional, or managed cluster deployment,
Helm releases may get stuck in the FAILED or UNKNOWN state
although the corresponding machines statuses are Ready
in the Container Cloud web UI. For example, if the StackLight Helm release
fails, the links to its endpoints are grayed out in the web UI.
In the cluster status, providerStatus.helm.ready and
providerStatus.helm.releaseStatuses.<releaseName>.success are false.
HelmBundle cannot recover from such states and requires manual actions.
The workaround below describes the recovery steps for the stacklight
release that got stuck during a cluster deployment.
Use this procedure as an example for other Helm releases as required.
Workaround:
Verify the failed release has the
UNKNOWNorFAILEDstatus in the HelmBundle object:kubectl --kubeconfig <regionalClusterKubeconfigPath> get helmbundle <clusterName> -n <clusterProjectName> -o=jsonpath={.status.releaseStatuses.stacklight} In the command above and in the steps below, replace the parameters enclosed in angle brackets with the corresponding values of your cluster.
Example of system response:
stacklight: attempt: 2 chart: "" finishedAt: "2021-02-05T09:41:05Z" hash: e314df5061bd238ac5f060effdb55e5b47948a99460c02c2211ba7cb9aadd623 message: '[{"occurrence":1,"lastOccurrenceDate":"2021-02-05 09:41:05","content":"error updating the release: rpc error: code = Unknown desc = customresourcedefinitions.apiextensions.k8s.io \"helmbundles.lcm.mirantis.com\" already exists"}]' notes: "" status: UNKNOWN success: false version: 0.1.2-mcp-398
Log in to the
helm-controllerpod console:kubectl --kubeconfig <affectedClusterKubeconfigPath> exec -n kube-system -it helm-controller-0 sh -c tiller
Download the Helm v3 binary. For details, see official Helm documentation.
Remove the failed release:
helm delete <failed-release-name>
For example:
helm delete stacklight
Once done, the release triggers for redeployment.
Fixed in 2.12.0
The MariaDB pods fail to start after MariaDB blocks itself during the State Snapshot Transfers sync.
Workaround:
Verify the failed pod readiness:
kubectl describe pod -n kaas <failedMariadbPodName>
If the readiness probe failed with the WSREP not synced message, proceed to the next step. Otherwise, assess the MariaDB pod logs to identify the failure root cause.
Obtain the MariaDB admin password:
kubectl get secret -n kaas mariadb-dbadmin-password -o jsonpath='{.data.MYSQL_DBADMIN_PASSWORD}' | base64 -d ; echo
Verify that
wsrep_local_state_commentisDonororDesynced:kubectl exec -it -n kaas <failedMariadbPodName> -- mysql -uroot -p<mariadbAdminPassword> -e "SHOW status LIKE \"wsrep_local_state_comment\";"
Restart the failed pod:
kubectl delete pod -n kaas <failedMariadbPodName>
Fixed in 2.12.0
It may be impossible to override the default route matchers for Salesforce notifier.
Note
After applying the workaround, you may notice the following warning message. It is expected and does not affect configuration rendering:
Warning: Merging destination map for chart 'stacklight'. Overwriting table
item 'match', with non table value: []
Workaround:
Open the StackLight configuration manifest as described in Configure StackLight.
In
alertmanagerSimpleConfig.salesForce, specify the following configuration:alertmanagerSimpleConfig: salesForce: route: match: [] match_re: your_matcher_key1: your_matcher_value1 your_matcher_key2: your_matcher_value2 ...
Fixed in 2.13.0
The Watchdog alert is not routed to Salesforce by default.
Note
After applying the workaround, you may notice the following warning message. It is expected and does not affect configuration rendering:
Warning: Merging destination map for chart 'stacklight'. Overwriting table
item 'match', with non table value: []
Workaround:
Open the StackLight configuration manifest as described in Configure StackLight.
In
alertmanagerSimpleConfig.salesForce, specify the following configuration:alertmanagerSimpleConfig: salesForce: route: match: [] match_re: severity: "informational|critical" matchers: - severity=~"informational|critical"
Affects only Container Cloud 2.11,0, 2.12,0, 2.13.0, and 2.13.1
Ceph LCM automatic operations such as Ceph OSD or Ceph node removal are
unstable for the new Rook 1.6.8 and Ceph 15.2.13 (Ceph Octopus) versions and
may cause data corruption. Therefore, manageOsds is disabled until further
notice.
As a workaround, to safely remove a Ceph OSD or node from a Ceph cluster, perform the steps described in Remove Ceph OSD manually.
Fixed in 2.12.0
If the latest Ubuntu 18.04 image, for example, with kernel 4.15.0-153-generic, is installed on the bootstrap node, a management cluster bootstrap fails during the setup of the Kubernetes cluster by kind.
The issue occurs since the kind version 0.9.0 delivered with the bootstrap script is not compatible with the latest Ubuntu 18.04 image that requires kind version 0.11.1.
To verify that the bootstrap node is affected by the issue:
In the bootstrap script stdout, verify the connection to Tiller.
Example of system response extract on an affected bootstrap node:
clusterdeployer.go:164] Initialize Tiller in bootstrap cluster. bootstrap_create.go:64] unable to initialize Tiller in bootstrap cluster: \ failed to establish connection with tiller
In the bootstrap script stdout, identify the step after which the bootstrap process fails.
Example of system response extract on an affected bootstrap node:
clusterdeployer.go:128] Connecting to bootstrap cluster
In the kind cluster, verify the
kube-proxyservice readiness:./bin/kind get kubeconfig --name clusterapi > /tmp/kind_kubeconfig.yaml ./bin/kubectl --kubeconfig /tmp/kind_kubeconfig.yaml get po -n kube-system | grep kube-proxy ./bin/kubectl --kubeconfig /tmp/kind_kubeconfig.yaml-n kube-system logs kube-proxy-<podPostfixID>
Example of the
kube-proxyservice stdout extract on an affected bootstrap node:I0831 11:56:16.139300 1 conntrack.go:100] Set sysctl 'net/netfilter/nf_conntrack_max' to 131072 F0831 11:56:16.139313 1 server.go:497] open /proc/sys/net/netfilter/nf_conntrack_max: permission denied
If the verification steps below are positive, proceed with the workaround below.
Workaround:
Clean up the bootstrap cluster:
./bin/kind delete cluster --name clusterapi
Upgrade the kind binary to version 0.11.1:
curl -L https://github.com/kubernetes-sigs/kind/releases/download/v0.11.1/kind-linux-amd64 -o bin/kind chmod a+x bin/kind
Restart the bootstrap script:
./bootstrap.sh all
Fixed in 2.12.0
The deployment of new managed clusters using the Cluster release 6.18.0 with StackLight enabled in the HA mode on control plane nodes does not have StackLight deployed. The update of existing clusters with such StackLight configuration that were created using the Cluster release 6.16.0 is blocked with the following error message:
cluster release version upgrade is forbidden: \
Minimum number of worker machines with StackLight label is 3
Workaround:
On the affected managed cluster:
Create a key-value pair that will be used as a unique label on the cluster nodes. In our example, it is
forcedRole: stacklight.To verify the labels names that already exist on the cluster nodes:
kubectl get nodes --show-labels
Add the new label to the target nodes for StackLight. For example, to the Kubernetes master nodes:
kubectl label nodes --selector=node-role.kubernetes.io/master forcedRole=stacklight
Verify that the new label is added:
kubectl get nodes --show-labels
On the related management cluster:
Configure
nodeSelectorfor the StackLight components by modifying the affectedClusterobject:kubectl edit cluster <affectedManagedClusterName> -n <affectedManagedClusterProjectName>
For example:
spec: ... providerSpec: ... value: ... helmReleases: ... - name: stacklight values: ... nodeSelector: default: forcedRole: stacklight
Select from the following options:
If you faced the issue during a managed cluster deployment, skip this step.
If you faced the issue during a managed cluster update, wait until all StackLight components resources are recreated on the target nodes with updated node selectors.
To monitor the cluster status:
kubectl get cluster <affectedManagedClusterName> -n <affectedManagedClusterProjectName> -o jsonpath='{.status.providerStatus.conditions[?(@.type=="StackLight")]}' | jq
In the cluster status, verify that the
elasticsearch-masterandprometheus-serverresources are ready. The process can take up to 30 minutes.Example of a negative system response:
{ "message": "not ready: statefulSets: stacklight/elasticsearch-master got 2/3 replicas", "ready": false, "type": "StackLight" }
In the Container Cloud web UI, add a fake StackLight label to any 3 worker nodes to satisfy the deployment requirement as described in Create a machine using web UI. Eventually, StackLight will be still placed on the target nodes with the
forcedRole: stacklightlabel.Once done, the StackLight deployment or update proceeds.
An upgrade of a bare metal or Equinix metal based management cluster originally deployed using the Container Cloud release earlier than 2.8.0 fails with the following error message:
Upgrade "kaas-public-api" failed: \
cannot patch "kaascephclusters.kaas.mirantis.com" with kind \
CustomResourceDefinition: CustomResourceDefinition.apiextensions.k8s.io \
kaascephclusters.kaas.mirantis.com" is invalid: \
spec.preserveUnknownFields: Invalid value: true: \
must be false in order to use defaults in the schema
Workaround:
Change the
preserveUnknownFieldsvalue for theKaaSCephClusterCRD tofalse:kubectl patch crd kaascephclusters.kaas.mirantis.com -p '{"spec":{"preserveUnknownFields":false}}'
Upgrade
kaas-public-api:helm -n kaas upgrade kaas-public-api https://binary.mirantis.com/core/helm/kaas-public-api-1.24.6.tgz --reuse-values
Fixed in 2.12.0
An upgrade of a bare metal or Equinix Metal based management or managed cluster fails with the following exemplary error messages:
- message: 'Failed to configure Ceph cluster: ceph cluster verification is failed:
[PG_AVAILABILITY: Reduced data availability: 33 pgs inactive, OSD_DOWN: 3 osds
down, OSD_HOST_DOWN: 3 hosts (3 osds) down, OSD_ROOT_DOWN: 1 root (3 osds) down,
Not all Osds are up]'
- message: 'not ready: deployments: kaas/dnsmasq got 0/1 replicas, kaas/ironic got
0/1 replicas, rook-ceph/rook-ceph-osd-0 got 0/1 replicas, rook-ceph/rook-ceph-osd-1
got 0/1 replicas, rook-ceph/rook-ceph-osd-2 got 0/1 replicas; statefulSets: kaas/httpd
got 0/1 replicas, kaas/mariadb got 0/1 replicas'
ready: false
type: Kubernetes
The cluster is affected by the issue if it has different Ceph versions installed:
kubectl -n rook-ceph exec -it $(kubectl -n rook-ceph get pod -l app=rook-ceph-tools -o name) -- ceph versions
Example of system response:
"mon": {
"ceph version 15.2.13 (c44bc49e7a57a87d84dfff2a077a2058aa2172e2) octopus (stable)": 3
},
"mgr": {
"ceph version 15.2.13 (c44bc49e7a57a87d84dfff2a077a2058aa2172e2) octopus (stable)": 1
},
"osd": {
"ceph version 14.2.19 (bb796b9b5bab9463106022eef406373182465d11) nautilus (stable)": 3
},
"mds": {},
"overall": {
"ceph version 15.2.13 (c44bc49e7a57a87d84dfff2a077a2058aa2172e2) octopus (stable)": 4
"ceph version 14.2.19 (bb796b9b5bab9463106022eef406373182465d11) nautilus (stable)": 3
}
Additionally, the output may display no Ceph OSDs:
"mon": {
"ceph version 15.2.13 (c44bc49e7a57a87d84dfff2a077a2058aa2172e2) octopus (stable)": 3
},
"mgr": {
"ceph version 15.2.13 (c44bc49e7a57a87d84dfff2a077a2058aa2172e2) octopus (stable)": 1
},
"osd": {},
"mds": {},
"overall": {
"ceph version 15.2.13 (c44bc49e7a57a87d84dfff2a077a2058aa2172e2) octopus (stable)": 4
}
Workaround:
Manually update the image of each
rook-ceph-osddeployment tohttp://mirantis.azurecr.io/ceph/ceph:v15.2.13:kubectl -n rook-ceph edit deploy rook-ceph-osd-<i>
In the system output, grep
14.2.19and replace with15.2.13.Verify that all OSDs for all
rook-ceph-osddeployments have the 15.2.13 image version:kubectl -n rook-ceph get pod -l app=rook-ceph-osd -o jsonpath='{range .items[*]}{@.metadata.name}{" "}{@.spec.containers[0].image}{"\n"}{end}'
Restart the
rook-ceph-operatorpod:kubectl -n rook-ceph delete pod -l app=rook-ceph-operator
Fixed in 2.12.0
During a management cluster upgrade of any supported cloud provider except
vSphere, you may notice the following false-positive messages for the
squid-proxy Helm release that is disabled in Container Cloud 2.11.0:
Helm charts not installed yet: squid-proxy
Error: release: "squid-proxy" not found
Ignore these errors for any cloud provider except vSphere that continues
using squid-proxy in Container Cloud 2.11.0.
Fixed in 2.12.0
Management cluster upgrade may get stuck and then fail with the following error message: ClusterWorkloadLocks in cluster default/kaas-mgmt are still active - ceph-clusterworkloadlock.
To verify that the cluster is affected:
Enter the
ceph-toolspod.Verify that some Ceph daemons were not upgraded to Octopus:
ceph versionsRun ceph -s and verify that the output contains the following health warning:
mons are allowing insecure global_id reclaim clients are allowing insecure global_id reclaim
If the upgrade is stuck, some Ceph daemons are stuck on upgrade to Octopus, and the health warning above is present, perform the following steps.
Workaround:
Run the following commands:
ceph config set global mon_warn_on_insecure_global_id_reclaim false ceph config set global mon_warn_on_insecure_global_id_reclaim_allowed false
Exit the
ceph-toolspod.Restart the
rook-ceph-operatorpod:kubectl -n rook-ceph delete app=rook-ceph-operator
Fixed in 2.12.0
An update of the Container Cloud management, regional, or managed cluster of any cloud provider type from the Cluster release 7.0.0 to 7.1.0 fails due to the failed Patroni pod.
As a workaround, increase the default resource requests and limits
for PostgreSQL as follows:
resources:
postgresql:
requests:
cpu: "256m"
memory: "1Gi"
limits:
cpu: "512m"
memory: "2Gi"
For details, see MOSK Operations Guide: StackLight configuration parameters - Resource limits.
An Equinix-based management or managed cluster fails to update with the
FailedAttachVolume and FailedMount warnings.
Workaround:
Verify that the description of the pods that failed to run contain the
FailedMountevents:kubectl -n <affectedProjectName> describe pod <affectedPodName>
<affectedProjectName>is the Container Cloud project name where the pods failed to run<affectedPodName>is a pod name that failed to run in this project
In the pod description, identify the node name where the pod failed to run.
Verify that the
csi-rbdpluginlogs of the affected node contain the rbd volume mount failed: <csi-vol-uuid> is being used error. The<csi-vol-uuid>is a unique RBD volume name.Identify
csiPodNameof the correspondingcsi-rbdplugin:kubectl -n rook-ceph get pod -l app=csi-rbdplugin \ -o jsonpath='{.items[?(@.spec.nodeName == "<nodeName>")].metadata.name}'
Output the affected
csiPodNamelogs:kubectl -n rook-ceph logs <csiPodName> -c csi-rbdplugin
Scale down the affected
StatefulSetorDeploymentof the pod that fails to init to0replicas.On every
csi-rbdpluginpod, search for stuckcsi-vol:for pod in `kubectl -n rook-ceph get pods|grep rbdplugin|grep -v provisioner|awk '{print $1}'`; do echo $pod kubectl exec -it -n rook-ceph $pod -c csi-rbdplugin -- rbd device list | grep <csi-vol-uuid> done
Unmap the affected
csi-vol:rbd unmap -o force /dev/rbd<i>
The
/dev/rbd<i>value is a mapped RBD volume that usescsi-vol.Delete
volumeattachmentof the affected pod:kubectl get volumeattachments | grep <csi-vol-uuid> kubectl delete volumeattacmhent <id>
Scale up the affected
StatefulSetorDeploymentback to the original number of replicas and wait until its state isRunning.
Helm releases may get stuck in the PENDING_UPGRADE status
during a management or managed cluster upgrade. The HelmBundle Controller
cannot recover from this state and requires manual actions. The workaround
below describes the recovery process for the openstack-operator release
that stuck during a managed cluster update. Use it as an example for other
Helm releases as required.
Workaround:
Log in to the
helm-controllerpod console:kubectl exec -n kube-system -it helm-controller-0 sh -c tiller
Identify the release that stuck in the
PENDING_UPGRADEstatus. For example:./helm --host=localhost:44134 history openstack-operator
Example of system response:
REVISION UPDATED STATUS CHART DESCRIPTION 1 Tue Dec 15 12:30:41 2020 SUPERSEDED openstack-operator-0.3.9 Install complete 2 Tue Dec 15 12:32:05 2020 SUPERSEDED openstack-operator-0.3.9 Upgrade complete 3 Tue Dec 15 16:24:47 2020 PENDING_UPGRADE openstack-operator-0.3.18 Preparing upgrade
Roll back the failed release to the previous revision:
Download the Helm v3 binary. For details, see official Helm documentation.
Roll back the failed release:
helm rollback <failed-release-name>
For example:
helm rollback openstack-operator 2
Once done, the release will be reconciled.
Fixed in 2.13.0
On a managed cluster with logging disabled, changing NodeSelector can
cause StackLight update failure with the following message in the StackLight
Helm Controller logs:
Upgrade "stacklight" failed: Job.batch "stacklight-delete-logging-pvcs-*" is invalid: spec.template: Invalid value: ...
As a workaround, disable the stacklight-delete-logging-pvcs-* job.
Workaround:
Open the affected
Clusterobject for editing:kubectl edit cluster <affectedManagedClusterName> -n <affectedManagedClusterProjectName>
Set
deleteVolumestofalse:spec: ... providerSpec: ... value: ... helmReleases: ... - name: stacklight values: ... logging: deleteVolumes: false ...
Affects only Container Cloud 2.18.0 and earlier
A project that is newly created in the Container Cloud web UI does not display in the Projects list even after refreshing the page. The issue occurs due to the token missing the necessary role for the new project. As a workaround, relogin to the Container Cloud web UI.
The following table lists the major components and their versions of the Mirantis Container Cloud release 2.11.0.
Note
The components that are newly added, updated, deprecated, or removed
as compared to the previous release version, are marked
with a corresponding superscript,
for example, lcm-ansible Updated.
Component |
Application/Service |
Version |
|---|---|---|
AWS Updated |
aws-provider |
1.24.6 |
aws-credentials-controller |
1.24.6 |
|
Azure New |
azure-provider |
1.24.6 |
azure-credentials-controller |
1.24.6 |
|
Bare metal |
baremetal-operator Updated |
5.1.0 |
baremetal-public-api Updated |
5.1.0 |
|
baremetal-provider Updated |
1.24.6 |
|
httpd |
1.18.0 |
|
ironic Updated |
victoria-bionic-20210719060025 |
|
ironic-operator Updated |
base-bionic-20210726193746 |
|
kaas-ipam Updated |
base-bionic-20210729185610 |
|
local-volume-provisioner |
1.0.6-mcp |
|
mariadb |
10.4.17-bionic-20210617085111 |
|
IAM |
iam |
2.4.2 |
iam-controller Updated |
1.24.6 |
|
keycloak |
12.0.0 |
|
Container Cloud |
admission-controller Updated |
1.24.8 |
byo-credentials-controller Updated |
1.24.6 |
|
byo-provider Updated |
1.24.6 |
|
kaas-public-api Updated |
1.24.6 |
|
kaas-exporter Updated |
1.24.6 |
|
kaas-ui Updated |
1.24.7 |
|
lcm-controller Updated |
0.2.0-404-g7f77e62c |
|
mcc-cache Updated |
1.24.6 |
|
proxy-controller Updated |
1.24.6 |
|
release-controller Updated |
1.24.6 |
|
rhellicense-controller Updated |
1.24.6 |
|
squid-proxy |
0.0.1-5 |
|
Equinix Metal Updated |
equinix-provider |
1.24.6 |
equinix-credentials-controller |
1.24.6 |
|
OpenStack Updated |
openstack-provider |
1.24.6 |
os-credentials-controller |
1.24.6 |
|
VMware vSphere Updated |
vsphere-provider |
1.24.6 |
vsphere-credentials-controller |
1.24.6 |
This section lists the components artifacts of the Mirantis Container Cloud release 2.11.0.
Note
The components that are newly added, updated, deprecated, or removed
as compared to the previous release version, are marked
with a corresponding superscript,
for example, lcm-ansible Updated.
Artifact |
Component |
Path |
|---|---|---|
Binaries |
baremetal-operator Updated |
https://binary.mirantis.com/bm/helm/baremetal-operator-5.1.0.tgz |
baremetal-public-api Updated |
https://binary.mirantis.com/bm/helm/baremetal-public-api-5.1.0.tgz |
|
ironic-python-agent-bionic.kernel |
https://binary.mirantis.com/bm/bin/ironic/ipa/ubuntu/kernel-victoria-bionic-debug-20210622161844 |
|
ironic-python-agent-bionic.initramfs |
https://binary.mirantis.com/bm/bin/ironic/ipa/ubuntu/initramfs-victoria-bionic-debug-20210622161844 |
|
kaas-ipam Updated |
||
local-volume-provisioner |
https://binary.mirantis.com/bm/helm/local-volume-provisioner-1.0.6-mcp.tgz |
|
provisioning_ansible Updated |
https://binary.mirantis.com/bm/bin/ansible/provisioning_ansible-0.1.1-74-8ab0bf0.tgz |
|
target ubuntu system |
https://binary.mirantis.com/bm/bin/efi/ubuntu/tgz-bionic-20210622161844 |
|
Docker images |
baremetal-operator |
mirantis.azurecr.io/bm/baremetal-operator:base-bionic-20210623143347 |
dnsmasq |
mirantis.azurecr.io/general/dnsmasq:focal-20210617094827 |
|
httpd |
mirantis.azurecr.io/lcm/nginx:1.18.0 |
|
ironic Updated |
mirantis.azurecr.io/openstack/ironic:victoria-bionic-20210719060025 |
|
ironic-inspector Updated |
mirantis.azurecr.io/openstack/ironic-inspector:victoria-bionic-20210719060025 |
|
ironic-operator Updated |
mirantis.azurecr.io/bm/ironic-operator:base-bionic-20210726193746 |
|
ironic-prometheus-exporter |
mirantis.azurecr.io/stacklight/ironic-prometheus-exporter:0.1-20210608113804 |
|
kaas-ipam Updated |
mirantis.azurecr.io/bm/kaas-ipam:base-bionic-20210729185610 |
|
mariadb |
mirantis.azurecr.io/general/mariadb:10.4.17-bionic-20210617085111 |
|
syslog-ng |
mirantis.azurecr.io/bm/syslog-ng:base-bionic-20210617094817 |
Artifact |
Component |
Paths |
|---|---|---|
Bootstrap tarball Updated |
bootstrap-linux |
https://binary.mirantis.com/core/bin/bootstrap-linux-1.24.6.tar.gz |
bootstrap-darwin |
https://binary.mirantis.com/core/bin/bootstrap-darwin-1.24.6.tar.gz |
|
Helm charts Updated |
admission-controller |
https://binary.mirantis.com/core/helm/admission-controller-1.24.6.tgz |
aws-credentials-controller |
https://binary.mirantis.com/core/helm/aws-credentials-controller-1.24.6.tgz |
|
aws-provider |
https://binary.mirantis.com/core/helm/aws-provider-1.24.6.tgz |
|
azure-credentials-controller New |
https://binary.mirantis.com/core/helm/azure-credentials-controller-1.24.6.tgz |
|
azure-provider New |
https://binary.mirantis.com/core/helm/azure-provider-1.24.6.tgz |
|
baremetal-provider |
https://binary.mirantis.com/core/helm/baremetal-provider-1.24.6.tgz |
|
byo-credentials-controller |
https://binary.mirantis.com/core/helm/byo-credentials-controller-1.24.6.tgz |
|
byo-provider |
https://binary.mirantis.com/core/helm/byo-provider-1.24.6.tgz |
|
equinix-credentials-controller |
https://binary.mirantis.com/core/helm/equinix-credentials-controller-1.24.6.tgz |
|
equinix-provider |
https://binary.mirantis.com/core/helm/equinix-provider-1.24.6.tgz |
|
iam-controller |
https://binary.mirantis.com/core/helm/iam-controller-1.24.6.tgz |
|
kaas-exporter |
https://binary.mirantis.com/core/helm/kaas-exporter-1.24.6.tgz |
|
kaas-public-api |
https://binary.mirantis.com/core/helm/kaas-public-api-1.24.6.tgz |
|
kaas-ui |
||
lcm-controller |
https://binary.mirantis.com/core/helm/lcm-controller-1.24.6.tgz |
|
mcc-cache |
||
openstack-provider |
https://binary.mirantis.com/core/helm/openstack-provider-1.24.6.tgz |
|
os-credentials-controller |
https://binary.mirantis.com/core/helm/os-credentials-controller-1.24.6.tgz |
|
proxy-controller |
https://binary.mirantis.com/core/helm/proxy-controller-1.24.6.tgz |
|
release-controller |
https://binary.mirantis.com/core/helm/release-controller-1.24.6.tgz |
|
rhellicense-controller |
https://binary.mirantis.com/core/helm/rhellicense-controller-1.24.6.tgz |
|
squid-proxy |
https://binary.mirantis.com/core/helm/squid-proxy-1.24.6.tgz |
|
vsphere-credentials-controller |
https://binary.mirantis.com/core/helm/vsphere-credentials-controller-1.24.6.tgz |
|
vsphere-provider |
https://binary.mirantis.com/core/helm/vsphere-provider-1.24.6.tgz |
|
Docker images |
admission-controller Updated |
mirantis.azurecr.io/core/admission-controller:1.24.8 |
aws-cluster-api-controller Updated |
mirantis.azurecr.io/core/aws-cluster-api-controller:1.24.6 |
|
aws-credentials-controller Updated |
mirantis.azurecr.io/core/aws-credentials-controller:1.24.6 |
|
azure-cluster-api-controller New |
mirantis.azurecr.io/core/azure-cluster-api-controller:1.24.6 |
|
azure-credentials-controller New |
mirantis.azurecr.io/core/azure-credentials-controller:1.24.6 |
|
byo-cluster-api-controller Updated |
mirantis.azurecr.io/core/byo-cluster-api-controller:1.24.6 |
|
byo-credentials-controller Updated |
mirantis.azurecr.io/core/byo-credentials-controller:1.24.6 |
|
cluster-api-provider-baremetal Updated |
mirantis.azurecr.io/core/cluster-api-provider-baremetal:1.24.6 |
|
cluster-api-provider-equinix Updated |
mirantis.azurecr.io/core/cluster-api-provider-equinix:1.24.6 |
|
equinix-credentials-controller Updated |
mirantis.azurecr.io/core/equinix-credentials-controller:1.24.6 |
|
frontend Updated |
mirantis.azurecr.io/core/frontend:1.24.7 |
|
iam-controller Updated |
mirantis.azurecr.io/core/iam-controller:1.24.6 |
|
kproxy Updated |
mirantis.azurecr.io/lcm/kproxy:1.24.6 |
|
lcm-controller Updated |
mirantis.azurecr.io/core/lcm-controller:v0.2.0-404-g7f77e62c |
|
nginx |
mirantis.azurecr.io/lcm/nginx:1.18.0 |
|
openstack-cluster-api-controller Updated |
mirantis.azurecr.io/core/openstack-cluster-api-controller:1.24.6 |
|
os-credentials-controller Updated |
mirantis.azurecr.io/core/os-credentials-controller:1.24.6 |
|
registry |
mirantis.azurecr.io/lcm/registry:2.7.1 |
|
release-controller Updated |
mirantis.azurecr.io/core/release-controller:1.24.6 |
|
rhellicense-controller Updated |
mirantis.azurecr.io/core/rhellicense-controller:1.24.6 |
|
squid-proxy Updated |
mirantis.azurecr.io/core/squid-proxy:0.0.1-5 |
|
vsphere-cluster-api-controller Updated |
mirantis.azurecr.io/core/vsphere-api-controller:1.24.6 |
|
vsphere-credentials-controller Updated |
mirantis.azurecr.io/core/vsphere-credentials-controller:1.24.6 |
Artifact |
Component |
Path |
|---|---|---|
Binaries |
hash-generate-linux |
http://binary.mirantis.com/iam/bin/hash-generate-0.0.1-268-3cf7f17-linux |
hash-generate-darwin |
http://binary.mirantis.com/iam/bin/hash-generate-0.0.1-268-3cf7f17-darwin |
|
iamctl-linux Updated |
||
iamctl-darwin Updated |
||
iamctl-windows Updated |
||
Helm charts |
iam Updated |
|
iam-proxy Updated |
||
keycloak_proxy Updated |
http://binary.mirantis.com/core/helm/keycloak_proxy-1.25.0.tgz |
|
Docker images |
api |
mirantis.azurecr.io/iam/api:0.5.2 |
auxiliary |
mirantis.azurecr.io/iam/auxiliary:0.5.2 |
|
kubernetes-entrypoint Updated |
mirantis.azurecr.io/openstack/extra/kubernetes-entrypoint:v0.3.1 |
|
mariadb |
mirantis.azurecr.io/general/mariadb:10.4.16-bionic-20201105025052 |
|
keycloak Updated |
mirantis.azurecr.io/iam/keycloak:0.5.2 |
|
keycloak-gatekeeper Updated |
mirantis.azurecr.io/iam/keycloak-gatekeeper:7.1.3 |
Starting from Container Cloud 2.11.0, the StackLight node label is required for managed clusters deployed in HA mode. The StackLight node label allows running StackLight components on specific worker nodes with corresponding resources.
Before upgrading an existing managed cluster with StackLight deployed in HA mode to the latest Cluster release, add the StackLight node label to at least 3 worker machines. Otherwise, the cluster upgrade will fail.
To add the StackLight node label to a worker machine:
Log in to the Container Cloud web UI.
On the Machines page, click the More action icon in the last column of the required machine field and select Configure machine.
In the window that opens, select the StackLight node label.
Caution
If your managed cluster contains more than 3 worker nodes, select from the following options:
If you have a small cluster, add the StackLight label to all worker nodes.
If you have a large cluster, identify the exact nodes that run StackLight and add the label to these specific nodes only.
Otherwise, some of the StackLight components may become inaccessible after the cluster update.
To identify the worker machines where StackLight is deployed:
Log in to the Container Cloud web UI.
Download the required cluster
kubeconfig:On the Clusters page, click the More action icon in the last column of the required cluster and select Download Kubeconfig.
Not recommended. Select Offline Token to generate an offline IAM token. Otherwise, for security reasons, the
kubeconfigtoken expires every 30 minutes of the Container Cloud API idle time and you have to downloadkubeconfigagain with a newly generated token.Click Download.
Export the
kubeconfigparameters to your local machine with access to kubectl. For example:export KUBECONFIG=~/Downloads/kubeconfig-test-cluster.yml
Obtain the list of machines with the StackLight local volumes attached.
Note
In the command below, substitute
<mgmtKubeconfig>with the path to your management clusterkubeconfigandprojectNamewith the project name where your cluster is located.kubectl get persistentvolumes -o=json | \ jq '.items[]|select(.spec.claimRef.namespace=="stacklight")|.spec.nodeAffinity.required.nodeSelectorTerms[].matchExpressions[].values[]| sub("^kaas-node-"; "")' | \ sort -u | xargs -I {} kubectl --kubeconfig <mgmtKubeconfig> -n <projectName> get machines -o=jsonpath='{.items[?(@.metadata.annotations.kaas\.mirantis\.com/uid=="{}")].metadata.name}{"\n"}'
In the Container Cloud web UI, add the StackLight node label to every machine from the list obtained in the previous step.
See also
The Mirantis Container Cloud GA release 2.10.0:
Introduces support for the Cluster release 7.0.0 that is based on the updated versions of Mirantis Container Runtime 20.10.5, and Mirantis Kubernetes Engine 3.4.0 with Kubernetes 1.20.
Introduces support for the Cluster release 5.17.0 that is based on Mirantis Kubernetes Engine 3.3.6 with Kubernetes 1.18 and the updated version of Mirantis Container Runtime 20.10.5.
Continues supporting the Cluster release 6.16.0 that is based on the Cluster release 5.16.0 and represents Mirantis OpenStack for Kubernetes (MOS) 21.3.
Supports deprecated Cluster releases 5.16.0 and 6.14.0 that will become unsupported in one of the following Container Cloud releases.
Supports the Cluster release 5.11.0 only for attachment of existing MKE 3.3.4 clusters. For the deployment of new or attachment of existing MKE 3.3.6 clusters, the latest available Cluster release is used.
Caution
Make sure to update the Cluster release version of your managed cluster before the current Cluster release version becomes unsupported by a new Container Cloud release version. Otherwise, Container Cloud stops auto-upgrade and eventually Container Cloud itself becomes unsupported.
This section outlines release notes for the Container Cloud release 2.10.0.
This section outlines new features and enhancements introduced in the Mirantis Container Cloud release 2.10.0. For the list of enhancements in the Cluster releases 7.0.0, 5.17.0, and 6.16.0 that are supported by the Container Cloud release 2.10.0, see the Cluster releases.
7.x Cluster release series with updated versions of MCR, MKE, and Kubernetes
Removal of IAM and Keycloak IPs configuration for the vSphere provider
Support of MKE 3.3.x series and 3.4.0 for cluster attachment
Implemented the 7.x Cluster release series that contains updated versions of:
Mirantis Container Runtime (MCR) 20.10.5
Mirantis Kubernetes Engine (MKE) 3.4.0
Kubernetes 1.20.1
Learn more
Added support of several Mirantis Kubernetes Engine (MKE) versions of the 3.3.x series and 3.4.0 for attaching or detaching of existing MKE 3.3.3 - 3.3.6 and 3.4.0 clusters as well as updating them to the latest supported version.
This feature allows for visualization of all your MKE clusters details on one management cluster including clusters health, capacity, and usage.
Learn more
Technology Preview
Introduced the initial Technology Preview support of the CentOS 7.9 operating system for the vSphere-based management, regional, and managed clusters.
Note
Deployment of a Container Cloud cluster that is based on both RHEL and CentOS operating systems is not supported.
To deploy a vSphere-based managed cluster on CentOS with custom or additional mirrors configured in the VM template, the
squid-proxyconfiguration on the management or regional cluster is required. It is done automatically if you use the Container Cloud script for the VM template creation.
Added support of RHEL 7.9 for the vSphere provider. This operating system is now installed by default on any type of the vSphere-based Container Cloud clusters.
RHEL 7.8 deployment is still possible with allowed access to the
rhel-7-server-rpms repository provided by the Red Hat Enterprise
Linux Server 7 x86_64.
Verify that your RHEL license or activation key meets this requirement.
Implemented the guided tour in the Container Cloud web UI to help you get oriented with the multi-cluster multi-cloud Container Cloud platform. This brief guided tour will step you through the key features of Container Cloud that can be performed using the Container Cloud web UI.
Removed the following Keycloak and IAM services variables that were used during a vSphere-based management cluster bootstrap for the MetalLB configuration:
KEYCLOAK_FLOATING_IPIAM_FLOATING_IP
Now, these IPs are automatically generated in the MetalLB range for certificates creation.
Learn more
Implemented the container-cloud bootstrap user add command that allows creating Keycloak users with specific permissions to access the Container Cloud web UI and manage the Container Cloud clusters.
For security reasons, removed the default password password for Keycloak
that was generated during a management cluster bootstrap to access
the Container Cloud web UI.
On top of continuous improvements delivered to the existing Container Cloud guides, added documentation about the Container Cloud user roles management through the Keycloak Admin Console. The section outlines the IAM roles and scopes structure in Container Cloud as well as role assignment to users using the Keycloak Admin Console.
The following issues have been addressed in the Mirantis Container Cloud release 2.10.0 along with the Cluster releases 7.0.0 and 5.17.0.
For more issues addressed for the Cluster release 6.16.0, see also addressed issues 2.8.0 and 2.9.0.
[8013][AWS] Fixed the issue with managed clusters deployment, that requires persistent volumes (PVs), failing with pods being stuck in the
Pendingstate and having thepod has unbound immediate PersistentVolumeClaimsandnode(s) had volume node affinity conflicterrors.Note
The issue affects only the MKE deployments with Kubernetes 1.18 and is fixed for MKE 3.4.x with Kubernetes 1.20 that is available since the Cluster release 7.0.0.
[14981] [Equinix Metal] Fixed the issue with a manager machine deployment failing if the cluster contained at least one manager machine that was stuck in the
Provisioningstate due to the capacity limits in the selected Equinix Metal data center.[13402] [LCM] Fixed the issue with the existing clusters failing with the no space left on device error due to an excessive amount of core dumps produced by applications that fail frequently.
[14125] [LCM] Fixed the issue with managed clusters deployed or updated on a regional cluster of another provider type displaying inaccurate Nodes readiness live status in the Container Cloud web UI.
[14040][StackLight] Fixed the issue with the Tiller container of the
stacklight-helm-controllerpods switching toCrashLoopBackOffand then being OOMKilled. Limited the releases number in history to3to prevent RAM overconsumption by Tiller.[14152] [Upgrade] Fixed the issue with managed cluster release upgrade failing and the DNS names of the Kubernetes services on the affected pod not being resolved due to DNS issues on pods with host networking.
This section lists known issues with workarounds for the Mirantis Container Cloud release 2.10.0 including the Cluster releases 7.0.0, 6.16.0, and 5.16.0.
Note
This section also outlines still valid known issues from previous Container Cloud releases.
Fixed in the Cluster release 7.0.0
Note
The issue below affects only the Kubernetes 1.18 deployments. Moving forward, the workaround for this issue will be moved from Release Notes to Troubleshooting Guide.
On a management cluster with multiple AWS-based managed
clusters, some clusters fail to complete the deployments that require
persistent volumes (PVs), for example, Elasticsearch.
Some of the affected pods get stuck in the Pending state
with the pod has unbound immediate PersistentVolumeClaims and
node(s) had volume node affinity conflict errors.
Warning
The workaround below applies to HA deployments where data can be rebuilt from replicas. If you have a non-HA deployment, back up any existing data before proceeding, since all data will be lost while applying the workaround.
Workaround:
Obtain the persistent volume claims related to the storage mounts of the affected pods:
kubectl get pod/<pod_name1> pod/<pod_name2> \ -o jsonpath='{.spec.volumes[?(@.persistentVolumeClaim)].persistentVolumeClaim.claimName}'
Note
In the command above and in the subsequent steps, substitute the parameters enclosed in angle brackets with the corresponding values.
Delete the affected
PodsandPersistentVolumeClaimsto reschedule them: For example, for StackLight:kubectl -n stacklight delete \ pod/<pod_name1> pod/<pod_name2> ... pvc/<pvc_name2> pvc/<pvc_name2> ...
Fixed in 2.12.0
If an Equinix Metal based cluster is being deployed in an Equinix Metal project with no SSH keys, the Equinix Metal provider fails to create machines with the following error:
Failed to create machine "kaas-mgmt-controlplane-0"...
failed to create device: POST https://api.equinix.com/metal/v1/projects/...
<deviceID> must have at least one SSH key or explicitly send no_ssh_keys option
Workaround:
Create a new SSH key.
Log in to the Equinix Metal console.
In Project Settings, click Project SSH Keys.
Click Add New Key and add details of the newly created SSH key.
Click Add.
Restart the cluster deployment.
Fixed in 2.12.0
Adding a new machine to a baremetal-based
managed cluster may fail after the baremetal-based management cluster upgrade.
The issue occurs because the PXE boot is not working for the new node.
In this case, file /volume/tftpboot/ipxe.efi not found logs appear on
dnsmasq-tftp.
Workaround:
Log in to a local machine where your management cluster
kubeconfigis located and where kubectl is installed.Scale the Ironic deployment down to
0replicas.kubectl -n kaas scale deployments/ironic --replicas=0
Scale the Ironic deployment up to
1replica:kubectl -n kaas scale deployments/ironic --replicas=1
Fixed in 2.11.0
If an L2 template is configured incorrectly, a bare metal cluster is deployed
successfully but with the runtime errors in the IpamHost object.
Workaround:
If you suspect that the machine is not working properly because
of incorrect network configuration, verify the status of the corresponding
IpamHost object. Inspect the l2RenderResult and ipAllocationResult
object fields for error messages.
An OpenStack-based regional cluster cleanup fails with the timeout error.
Workaround:
Wait for the
Clusterobject to be deleted in the bootstrap cluster:kubectl --kubeconfig <(./bin/kind get kubeconfig --name clusterapi) get cluster
The system output must be empty.
Remove the bootstrap cluster manually:
./bin/kind delete cluster --name clusterapi
Fixed in 2.11.0
A load balancer virtual IP address (VIP) is assigned to each manager
node on any type of the vSphere-based cluster. The issue occurs because
the Keepalived instances cannot set up a cluster due to the blocked
vrrp protocol traffic in the firewall configuration on the Container Cloud
nodes.
Note
Before applying the workaround below, verify that the dedicated
vSphere network does not have any other virtual machines with the
keepalived instance running with the same vrouter_id.
You can verify the vrouter_id value of the cluster
in /etc/keepalived/keepalived.conf on the manager nodes.
Workaround
Update the firewalld configuration on each manager node of the affected
cluster to allow the vrrp protocol traffic between the nodes:
SSH to any manager node using
mcc-user.Apply the
firewalldconfiguration:firewall-cmd --add-rich-rule='rule protocol value="vrrp" accept' --permanent firewall-cmd --reload
Apply the procedure to the remaining manager nodes of the cluster.
Fixed in 2.9.0 for new clusters
Newly created pods may fail to run and have the CrashLoopBackOff status
on long-living Container Cloud clusters deployed on RHEL 7.8 using the VMware
vSphere provider. The following is an example output of the
kubectl describe pod <pod-name> -n <projectName> command:
State: Waiting
Reason: CrashLoopBackOff
Last State: Terminated
Reason: ContainerCannotRun
Message: OCI runtime create failed: container_linux.go:349:
starting container process caused "process_linux.go:297:
applying cgroup configuration for process caused
"mkdir /sys/fs/cgroup/memory/kubepods/burstable/<pod-id>/<container-id>>:
cannot allocate memory": unknown
The issue occurs due to the Kubernetes and Docker community issues.
According to the RedHat solution,
the workaround is to disable the kernel memory accounting feature
by appending cgroup.memory=nokmem to the kernel command line.
Note
The workaround below applies to the existing clusters only. The issue is resolved for new Container Cloud 2.9.0 deployments since the workaround below automatically applies to the VM template built during the vSphere-based management cluster bootstrap.
Apply the following workaround on each machine of the affected cluster.
Workaround
SSH to any machine of the affected cluster using
mcc-userand the SSH key provided during the cluster creation to proceed as therootuser.In
/etc/default/grub, setcgroup.memory=nokmemforGRUB_CMDLINE_LINUX.Update kernel:
yum install kernel kernel-headers kernel-tools kernel-tools-libs kexec-tools
Update the grub configuration:
grub2-mkconfig -o /boot/grub2/grub.cfg
Reboot the machine.
Wait for the machine to become available.
Wait for 5 minutes for Docker and Kubernetes services to start.
Verify that the machine is
Ready:docker node ls kubectl get nodes
Repeat the steps above on the remaining machines of the affected cluster.
Note
Moving forward, the workaround for this issue will be moved from Release Notes to Troubleshooting Guide.
A vSphere-based management cluster bootstrap fails due to a node leaving the cluster after an accidental IP address change.
The issue may affect a vSphere-based cluster only when IPAM is not enabled and IP addresses assignment to the vSphere virtual machines is done by a DHCP server present in the vSphere network.
By default, a DHCP server keeps lease of the IP address for 30 minutes.
Usually, a VM dhclient prolongs such lease by frequent DHCP requests
to the server before the lease period ends.
The DHCP prolongation request period is always less than the default lease time
on the DHCP server, so prolongation usually works.
But in case of network issues, for example, when dhclient from the
VM cannot reach the DHCP server, or the VM is being slowly powered on
for more than the lease time, such VM may lose its assigned IP address.
As a result, it obtains a new IP address.
Container Cloud does not support network reconfiguration after the IP of the VM has been changed. Therefore, such issue may lead to a VM leaving the cluster.
Symptoms:
One of the nodes is in the
NodeNotReadyordownstate:kubectl get nodes -o wide docker node ls
The UCP Swarm manager logs on the healthy manager node contain the following example error:
docker logs -f ucp-swarm-manager level=debug msg="Engine refresh failed" id="<docker node ID>|<node IP>: 12376"
If the affected node is manager:
The output of the docker info command contains the following example error:
Error: rpc error: code = Unknown desc = The swarm does not have a leader. \ It's possible that too few managers are online. \ Make sure more than half of the managers are online.
The UCP controller logs contain the following example error:
docker logs -f ucp-controller "warning","msg":"Node State Active check error: \ Swarm Mode Manager health check error: \ info: Cannot connect to the Docker daemon at tcp://<node IP>:12376. \ Is the docker daemon running?
On the affected node, the IP address on the first interface
eth0does not match the IP address configured in Docker. Verify theNode Addressfield in the output of the docker info command.The following lines are present in
/var/log/messages:dhclient[<pid>]: bound to <node IP> -- renewal in 1530 seconds
If there are several lines where the IP is different, the node is affected.
Workaround:
Select from the following options:
Bind IP addresses for all machines to their MAC addresses on the DHCP server for the dedicated vSphere network. In this case, VMs receive only specified IP addresses that never change.
Remove the Container Cloud node IPs from the IP range on the DHCP server for the dedicated vSphere network and configure the first interface
eth0on VMs with a static IP address.If a managed cluster is affected, redeploy it with IPAM enabled for new machines to be created and IPs to be assigned properly.
Note
Moving forward, the workaround for this issue will be moved from Release Notes to Troubleshooting Guide.
Occasionally, kubelet may get stuck on the Cluster release 5.x.x series
with different errors in the ucp-kubelet containers leading to the nodes
failures. The following error occurs every time when accessing
the Kubernetes API server:
an error on the server ("") has prevented the request from succeeding
As a workaround, restart ucp-kubelet on the failed node:
ctr -n com.docker.ucp snapshot rm ucp-kubelet
docker rm -f ucp-kubelet
Fixed in 2.12.0
Adding of a new manager node to a managed cluster may hang due to
issues with joining etcd from a new node to the existing etcd cluster.
The new manager node hangs in the Deploy stage.
Symptoms:
The Ansible run tries executing the
Wait for Docker UCP to be accessiblestep and fails with the following error message:Status code was -1 and not [200]: Request failed: <urlopen error [Errno 111] Connection refused>
The etcd logs on the leader etcd node contain the following example error message occurring every 1-2 minutes:
2021-06-10 03:21:53.196677 W | etcdserver: not healthy for reconfigure, rejecting member add {ID:22bb1d4275f1c5b0 RaftAttributes:{PeerURLs:[https://<new manager IP>:12380] IsLearner:false} Attributes:{Name: ClientURLs:[]}}
To determine the etcd leader, run on any manager node:
docker exec -it ucp-kv sh # From the inside of the container: ETCDCTL_API=3 etcdctl -w table --endpoints=https://<1st manager IP>:12379,https://<2nd manager IP>:12379,https://<3rd manager IP>:12379 endpoint status
To verify logs on the leader node:
docker logs ucp-kv
Root cause:
In case of an unlucky network partition, the leader may lose quorum and members are not able to perform the election. For more details, see Official etcd documentation: Learning, figure 5.
Workaround:
Restart etcd on the leader node:
docker rm -f ucp-kv
Wait several minutes until the etcd cluster starts and reconciles.
The deployment of the new manager node will proceed and it will join the etcd cluster. After that, other MKE components will be configured and the node deployment will be finished successfully.
Fixed in 2.11
A managed cluster update from the Cluster release 6.12.0 to
6.14.0 fails with worker nodes being stuck in the Deploy state with
the Network is unreachable error.
Workaround:
Verify the state of the loopback network interface:
ip l show lo
If the interface is not in the
UNKNOWNorUPstate, enable it manually:ip l set lo up
If the interface is in the
UNKNOWNorUPstate, assess the cluster logs to identify the failure root cause.Repeat the cluster update procedure.
Fixed in 2.11.0
During update of a managed cluster from the Cluster releases 6.12.0 to 6.14.0, the LCM Agent upgrade fails with the following error in logs:
lcmAgentUpgradeStatus:
error: 'failed to download agent binary: Get https://<mcc-cache-address>/bin/lcm/bin/lcm-agent/v0.2.0-289-gd7e9fa9c/lcm-agent:
x509: certificate signed by unknown authority'
Only clusters initially deployed using Container Cloud 2.4.0 or earlier are affected.
As a workaround, restart lcm-agent using the
service lcm-agent-* restart command on the affected nodes.
Note
The issue affects only Helm v2 releases and is addressed for Helm v3. Starting from Container Cloud 2.19.0, all Helm releases are switched to v3.
During a management, regional, or managed cluster deployment,
Helm releases may get stuck in the FAILED or UNKNOWN state
although the corresponding machines statuses are Ready
in the Container Cloud web UI. For example, if the StackLight Helm release
fails, the links to its endpoints are grayed out in the web UI.
In the cluster status, providerStatus.helm.ready and
providerStatus.helm.releaseStatuses.<releaseName>.success are false.
HelmBundle cannot recover from such states and requires manual actions.
The workaround below describes the recovery steps for the stacklight
release that got stuck during a cluster deployment.
Use this procedure as an example for other Helm releases as required.
Workaround:
Verify the failed release has the
UNKNOWNorFAILEDstatus in the HelmBundle object:kubectl --kubeconfig <regionalClusterKubeconfigPath> get helmbundle <clusterName> -n <clusterProjectName> -o=jsonpath={.status.releaseStatuses.stacklight} In the command above and in the steps below, replace the parameters enclosed in angle brackets with the corresponding values of your cluster.
Example of system response:
stacklight: attempt: 2 chart: "" finishedAt: "2021-02-05T09:41:05Z" hash: e314df5061bd238ac5f060effdb55e5b47948a99460c02c2211ba7cb9aadd623 message: '[{"occurrence":1,"lastOccurrenceDate":"2021-02-05 09:41:05","content":"error updating the release: rpc error: code = Unknown desc = customresourcedefinitions.apiextensions.k8s.io \"helmbundles.lcm.mirantis.com\" already exists"}]' notes: "" status: UNKNOWN success: false version: 0.1.2-mcp-398
Log in to the
helm-controllerpod console:kubectl --kubeconfig <affectedClusterKubeconfigPath> exec -n kube-system -it helm-controller-0 sh -c tiller
Download the Helm v3 binary. For details, see official Helm documentation.
Remove the failed release:
helm delete <failed-release-name>
For example:
helm delete stacklight
Once done, the release triggers for redeployment.
Fixed in 2.12.0
The MariaDB pods fail to start after MariaDB blocks itself during the State Snapshot Transfers sync.
Workaround:
Verify the failed pod readiness:
kubectl describe pod -n kaas <failedMariadbPodName>
If the readiness probe failed with the WSREP not synced message, proceed to the next step. Otherwise, assess the MariaDB pod logs to identify the failure root cause.
Obtain the MariaDB admin password:
kubectl get secret -n kaas mariadb-dbadmin-password -o jsonpath='{.data.MYSQL_DBADMIN_PASSWORD}' | base64 -d ; echo
Verify that
wsrep_local_state_commentisDonororDesynced:kubectl exec -it -n kaas <failedMariadbPodName> -- mysql -uroot -p<mariadbAdminPassword> -e "SHOW status LIKE \"wsrep_local_state_comment\";"
Restart the failed pod:
kubectl delete pod -n kaas <failedMariadbPodName>
Fixed in 2.12.0
It may be impossible to override the default route matchers for Salesforce notifier.
Note
After applying the workaround, you may notice the following warning message. It is expected and does not affect configuration rendering:
Warning: Merging destination map for chart 'stacklight'. Overwriting table
item 'match', with non table value: []
Workaround:
Open the StackLight configuration manifest as described in Configure StackLight.
In
alertmanagerSimpleConfig.salesForce, specify the following configuration:alertmanagerSimpleConfig: salesForce: route: match: [] match_re: your_matcher_key1: your_matcher_value1 your_matcher_key2: your_matcher_value2 ...
Fixed in 2.13.0
The Watchdog alert is not routed to Salesforce by default.
Note
After applying the workaround, you may notice the following warning message. It is expected and does not affect configuration rendering:
Warning: Merging destination map for chart 'stacklight'. Overwriting table
item 'match', with non table value: []
Workaround:
Open the StackLight configuration manifest as described in Configure StackLight.
In
alertmanagerSimpleConfig.salesForce, specify the following configuration:alertmanagerSimpleConfig: salesForce: route: match: [] match_re: severity: "informational|critical" matchers: - severity=~"informational|critical"
Fixed in 2.11.0
If you use a custom BareMetalHostProfile, after disk replacement
on a Ceph OSD, the Ceph OSD pod switches to the CrashLoopBackOff state
due to the Ceph OSD authorization key failing to be created properly.
Workaround:
Export
kubeconfigof your managed cluster. For example:export KUBECONFIG=~/Downloads/kubeconfig-test-cluster.yml
Log in to the
ceph-toolspod:kubectl -n rook-ceph exec -it $(kubectl -n rook-ceph get pod -l "app=rook-ceph-tools" -o jsonpath='{.items[0].metadata.name}') bash
Delete the authorization key for the failed Ceph OSD:
ceph auth del osd.<ID>
SSH to the node on which the Ceph OSD cannot be created.
Clean up the disk that will be a base for the failed Ceph OSD. For details, see official Rook documentation.
Note
Ignore failures of the sgdisk --zap-all $DISK and blkdiscard $DISK commands if any.
On the managed cluster, restart Rook Operator:
kubectl -n rook-ceph delete pod -l app=rook-ceph-operator
Fixed in 2.12.0
If the latest Ubuntu 18.04 image, for example, with kernel 4.15.0-153-generic, is installed on the bootstrap node, a management cluster bootstrap fails during the setup of the Kubernetes cluster by kind.
The issue occurs since the kind version 0.9.0 delivered with the bootstrap script is not compatible with the latest Ubuntu 18.04 image that requires kind version 0.11.1.
To verify that the bootstrap node is affected by the issue:
In the bootstrap script stdout, verify the connection to Tiller.
Example of system response extract on an affected bootstrap node:
clusterdeployer.go:164] Initialize Tiller in bootstrap cluster. bootstrap_create.go:64] unable to initialize Tiller in bootstrap cluster: \ failed to establish connection with tiller
In the bootstrap script stdout, identify the step after which the bootstrap process fails.
Example of system response extract on an affected bootstrap node:
clusterdeployer.go:128] Connecting to bootstrap cluster
In the kind cluster, verify the
kube-proxyservice readiness:./bin/kind get kubeconfig --name clusterapi > /tmp/kind_kubeconfig.yaml ./bin/kubectl --kubeconfig /tmp/kind_kubeconfig.yaml get po -n kube-system | grep kube-proxy ./bin/kubectl --kubeconfig /tmp/kind_kubeconfig.yaml-n kube-system logs kube-proxy-<podPostfixID>
Example of the
kube-proxyservice stdout extract on an affected bootstrap node:I0831 11:56:16.139300 1 conntrack.go:100] Set sysctl 'net/netfilter/nf_conntrack_max' to 131072 F0831 11:56:16.139313 1 server.go:497] open /proc/sys/net/netfilter/nf_conntrack_max: permission denied
If the verification steps below are positive, proceed with the workaround below.
Workaround:
Clean up the bootstrap cluster:
./bin/kind delete cluster --name clusterapi
Upgrade the kind binary to version 0.11.1:
curl -L https://github.com/kubernetes-sigs/kind/releases/download/v0.11.1/kind-linux-amd64 -o bin/kind chmod a+x bin/kind
Restart the bootstrap script:
./bootstrap.sh all
Fixed in 2.11.0
A baremetal-based management cluster upgrade can fail with stuck ironic
and dnsmasq pods. The issue may occur due to the Ceph pre-upgraded
persistent volumes being unmapped incorrectly. As a result, the RBD volumes
mounts on nodes are without any real RBD volumes.
Symptoms:
The
ironicanddnsmasqdeployments fail:kubectl -n kaas get deploy
Example of system response:
NAME READY UP-TO-DATE AVAILABLE AGE ironic 0/1 0 0 6d10h dnsmasq 0/1 0 0 6d10h
The bare metal
mariadbandhttpdstatefulSetsfail:kubectl -n kaas get statefulset
Example output:
NAME READY AGE httpd 0/1 6d10h mariadb 0/1 6d10h
On the failed deployments pods, the ll /volume command hangs or outputs the
input/output error:Enter any pod of the failed deployment:
kubectl -n kaas exec -it <podName> -- bash
Replace
<podName>with the affected pod name. For example,httpd-0.Obtain the list of files in the
/volumedirectory:ll /volumeExample of system response:
ls: reading directory '.': Input/output error
If the above command gets stuck or outputs the
Input/output errorerror, the issue relates to theceph-csiunmounted RBD devices.
Workaround:
Identify the names of nodes with the affected pods:
kubectl -n kaas get pod <podName> -o jsonpath='{.spec.nodeName}'
Replace
<podName>with the affected pod name.Identify which
csi-rbdpluginpod is assigned to which node:kubectl -n rook-ceph get pod -l app=csi-rbdplugin -o jsonpath='{range .items[*]}{.metadata.name}{" "}{.spec.nodeName}{"\n"}'
Enter any affected
csi-rbdpluginpod.kubectl -n rook-ceph exec -it <csiPodName> -c csi-rbdplugin -- bash
Identify the mapped device classes on this pod:
rbd device list
Identify which devices are mounted on this pod:
mount | grep rbd
Unmount all devices that are not included into the rbd device list command output:
umount <rbdDeviceName>Replace
<rbdDeviceName>with a mounted RBD device name that is not included into the rbd device list output. For example,/dev/rbd0.Exit the
csi-rbdpluginpod:exitRepeat the steps above for the remaining affected
csi-rbdpluginpods on every affected node.Once all nonexistent mounts are unmounted on all nodes, restart the stuck deployments:
kubectl -n kaas get deploy kubectl -n kaas scale deploy <deploymentName> --replicas 0 kubectl -n kaas scale deploy <deploymentName> --replicas <replicasNumber>
<deploymentName>is a stuck bare metal deployment name, for example,ironic<replicasNumber>is the original number of replicas for the deployment that you can obtain using the get deploy command
Restart the failed bare metal
statefulSets:kubectl -n kaas get statefulset kubectl -n kaas scale statefulset <statefulSetName> --replicas 0 kubectl -n kaas scale statefulset <statefulSetName> --replicas <replicasNumber>
<statefulSetName>is a failed bare metalstatefulSetname, for example,mariadb<replicasNumber>is the original number of replicas for thestatefulSetthat you can obtain using the get statefulset command
An Equinix-based management or managed cluster fails to update with the
FailedAttachVolume and FailedMount warnings.
Workaround:
Verify that the description of the pods that failed to run contain the
FailedMountevents:kubectl -n <affectedProjectName> describe pod <affectedPodName>
<affectedProjectName>is the Container Cloud project name where the pods failed to run<affectedPodName>is a pod name that failed to run in this project
In the pod description, identify the node name where the pod failed to run.
Verify that the
csi-rbdpluginlogs of the affected node contain the rbd volume mount failed: <csi-vol-uuid> is being used error. The<csi-vol-uuid>is a unique RBD volume name.Identify
csiPodNameof the correspondingcsi-rbdplugin:kubectl -n rook-ceph get pod -l app=csi-rbdplugin \ -o jsonpath='{.items[?(@.spec.nodeName == "<nodeName>")].metadata.name}'
Output the affected
csiPodNamelogs:kubectl -n rook-ceph logs <csiPodName> -c csi-rbdplugin
Scale down the affected
StatefulSetorDeploymentof the pod that fails to init to0replicas.On every
csi-rbdpluginpod, search for stuckcsi-vol:for pod in `kubectl -n rook-ceph get pods|grep rbdplugin|grep -v provisioner|awk '{print $1}'`; do echo $pod kubectl exec -it -n rook-ceph $pod -c csi-rbdplugin -- rbd device list | grep <csi-vol-uuid> done
Unmap the affected
csi-vol:rbd unmap -o force /dev/rbd<i>
The
/dev/rbd<i>value is a mapped RBD volume that usescsi-vol.Delete
volumeattachmentof the affected pod:kubectl get volumeattachments | grep <csi-vol-uuid> kubectl delete volumeattacmhent <id>
Scale up the affected
StatefulSetorDeploymentback to the original number of replicas and wait until its state isRunning.
Helm releases may get stuck in the PENDING_UPGRADE status
during a management or managed cluster upgrade. The HelmBundle Controller
cannot recover from this state and requires manual actions. The workaround
below describes the recovery process for the openstack-operator release
that stuck during a managed cluster update. Use it as an example for other
Helm releases as required.
Workaround:
Log in to the
helm-controllerpod console:kubectl exec -n kube-system -it helm-controller-0 sh -c tiller
Identify the release that stuck in the
PENDING_UPGRADEstatus. For example:./helm --host=localhost:44134 history openstack-operator
Example of system response:
REVISION UPDATED STATUS CHART DESCRIPTION 1 Tue Dec 15 12:30:41 2020 SUPERSEDED openstack-operator-0.3.9 Install complete 2 Tue Dec 15 12:32:05 2020 SUPERSEDED openstack-operator-0.3.9 Upgrade complete 3 Tue Dec 15 16:24:47 2020 PENDING_UPGRADE openstack-operator-0.3.18 Preparing upgrade
Roll back the failed release to the previous revision:
Download the Helm v3 binary. For details, see official Helm documentation.
Roll back the failed release:
helm rollback <failed-release-name>
For example:
helm rollback openstack-operator 2
Once done, the release will be reconciled.
Fixed in 2.11.0
Upgrade of a Container Cloud management or regional cluster from version 2.9.0
to 2.10.0 and managed cluster from 5.16.0 to 5.17.0 may fail with the following
error message for the patroni-12-0, patroni-12-1 or patroni-12-2
pod.
error when evicting pods/"patroni-12-2" -n "stacklight" (will retry after 5s):
Cannot evict pod as it would violate the pod's disruption budget.
As a workaround, reinitialize the Patroni pod that got stuck:
kubectl -n stacklight exec -ti -c patroni $(kubectl -n stacklight \
get ep/patroni-12 -o jsonpath='{.metadata.annotations.leader}') -- \
patronictl reinit patroni-12 <POD_NAME> --force --wait
Substitute <POD_NAME> with the name of the Patroni pod from the error
message. For example:
kubectl -n stacklight exec -ti -c patroni $(kubectl -n stacklight \
get ep/patroni-12 -o jsonpath='{.metadata.annotations.leader}') -- \
patronictl reinit patroni-12 patroni-12-2
If the command above fails, reinitialize the affected pod with a new volume by
deleting the pod itself and the associated PersistentVolumeClaim (PVC):
Obtain the PVC of the affected pod:
kubectl -n stacklight get "pod/<POD_NAME>" -o jsonpath='{.spec.volumes[?(@.name=="storage-volume")].persistentVolumeClaim.claimName}'
Delete the affected pod and its PVC:
kubectl -n stacklight delete "pod/<POD_NAME>" "pvc/<POD_PVC>" sleep 3 # wait for StatefulSet to reschedule the pod, but miss dependent PVC creation kubectl -n stacklight delete "pod/<POD_NAME>"
Fixed in 2.11.0
An Alertmanager pod may get stuck in the CrashLoopBackOff state during
upgrade of a management, regional, or managed cluster and thus cause upgrade
failure with the Loading configuration file failed error message in logs.
Workaround:
Delete the Alertmanager pod that is stuck in the
CrashLoopBackOffstate. For example:kubectl delete pod/prometheus-alertmanager-1 -n stacklight
Wait for several minutes and verify that Alertmanager and its pods are up and running:
kubectl get all -n stacklight -l app=prometheus,component=alertmanager
Affects only Container Cloud 2.18.0 and earlier
A project that is newly created in the Container Cloud web UI does not display in the Projects list even after refreshing the page. The issue occurs due to the token missing the necessary role for the new project. As a workaround, relogin to the Container Cloud web UI.
The following table lists the major components and their versions of the Mirantis Container Cloud release 2.10.0.
Note
The components that are newly added, updated, deprecated, or removed
as compared to the previous release version, are marked
with a corresponding superscript,
for example, lcm-ansible Updated.
Component |
Application/Service |
Version |
|---|---|---|
AWS Updated |
aws-provider |
1.23.2 |
aws-credentials-controller |
1.23.2 |
|
Bare metal |
baremetal-operator Updated |
5.0.5 |
baremetal-public-api Updated |
5.0.4 |
|
baremetal-provider Updated |
1.23.2 |
|
httpd |
1.18.0 |
|
ironic Updated |
victoria-bionic-20210615143607 |
|
ironic-operator Updated |
base-bionic-20210622124940 |
|
kaas-ipam Updated |
base-bionic-20210617150226 |
|
local-volume-provisioner |
1.0.6-mcp |
|
mariadb Updated |
10.4.17-bionic-20210617085111 |
|
IAM |
iam Updated |
2.4.2 |
iam-controller Updated |
1.23.2 |
|
keycloak |
12.0.0 |
|
Container Cloud Updated |
admission-controller |
1.23.3 |
byo-credentials-controller |
1.23.2 |
|
byo-provider |
1.23.2 |
|
kaas-public-api |
1.23.2 |
|
kaas-exporter |
1.23.2 |
|
kaas-ui |
1.23.4 |
|
lcm-controller |
0.2.0-372-g7e042f4d |
|
mcc-cache |
1.23.2 |
|
proxy-controller |
1.23.2 |
|
release-controller |
1.23.2 |
|
rhellicense-controller |
1.23.2 |
|
squid-proxy |
0.0.1-5 |
|
Equinix Metal Updated |
equinix-provider |
1.23.2 |
equinix-credentials-controller |
1.23.2 |
|
OpenStack Updated |
openstack-provider |
1.23.2 |
os-credentials-controller |
1.23.2 |
|
VMware vSphere Updated |
vsphere-provider |
1.23.2 |
vsphere-credentials-controller |
1.23.2 |
This section lists the components artifacts of the Mirantis Container Cloud release 2.10.0.
Note
The components that are newly added, updated, deprecated, or removed
as compared to the previous release version, are marked
with a corresponding superscript,
for example, lcm-ansible Updated.
Artifact |
Component |
Path |
|---|---|---|
Binaries |
baremetal-operator Updated |
https://binary.mirantis.com/bm/helm/baremetal-operator-5.0.5.tgz |
baremetal-public-api Updated |
https://binary.mirantis.com/bm/helm/baremetal-public-api-5.0.4.tgz |
|
ironic-python-agent-bionic.kernel Updated |
https://binary.mirantis.com/bm/bin/ironic/ipa/ubuntu/kernel-victoria-bionic-debug-20210622161844 |
|
ironic-python-agent-bionic.initramfs Updated |
https://binary.mirantis.com/bm/bin/ironic/ipa/ubuntu/initramfs-victoria-bionic-debug-20210622161844 |
|
kaas-ipam Updated |
||
local-volume-provisioner |
https://binary.mirantis.com/bm/helm/local-volume-provisioner-1.0.6-mcp.tgz |
|
provisioning_ansible Updated |
https://binary.mirantis.com/bm/bin/ansible/provisioning_ansible-0.1.1-72-3120eae.tgz |
|
target ubuntu system Updated |
https://binary.mirantis.com/bm/bin/efi/ubuntu/tgz-bionic-20210622161844 |
|
Docker images |
baremetal-operator Updated |
mirantis.azurecr.io/bm/baremetal-operator:base-bionic-20210623143347 |
dnsmasq Updated |
mirantis.azurecr.io/general/dnsmasq:focal-20210617094827 |
|
httpd |
mirantis.azurecr.io/lcm/nginx:1.18.0 |
|
ironic Updated |
mirantis.azurecr.io/openstack/ironic:victoria-bionic-20210615143607 |
|
ironic-inspector Updated |
mirantis.azurecr.io/openstack/ironic-inspector:victoria-bionic-20210615143607 |
|
ironic-operator Updated |
mirantis.azurecr.io/bm/ironic-operator:base-bionic-20210622124940 |
|
ironic-prometheus-exporter Updated |
mirantis.azurecr.io/stacklight/ironic-prometheus-exporter:0.1-20210608113804 |
|
kaas-ipam Updated |
mirantis.azurecr.io/bm/kaas-ipam:base-bionic-20210617150226 |
|
mariadb Updated |
mirantis.azurecr.io/general/mariadb:10.4.17-bionic-20210617085111 |
|
syslog-ng Updated |
mirantis.azurecr.io/bm/syslog-ng:base-bionic-20210617094817 |
Artifact |
Component |
Paths |
|---|---|---|
Bootstrap tarball Updated |
bootstrap-linux |
https://binary.mirantis.com/core/bin/bootstrap-linux-1.23.2.tar.gz |
bootstrap-darwin |
https://binary.mirantis.com/core/bin/bootstrap-darwin-1.23.2.tar.gz |
|
Helm charts Updated |
admission-controller |
https://binary.mirantis.com/core/helm/admission-controller-1.23.2.tgz |
aws-credentials-controller |
https://binary.mirantis.com/core/helm/aws-credentials-controller-1.23.2.tgz |
|
aws-provider |
https://binary.mirantis.com/core/helm/aws-provider-1.23.2.tgz |
|
baremetal-provider |
https://binary.mirantis.com/core/helm/baremetal-provider-1.23.2.tgz |
|
byo-credentials-controller |
https://binary.mirantis.com/core/helm/byo-credentials-controller-1.23.2.tgz |
|
byo-provider |
https://binary.mirantis.com/core/helm/byo-provider-1.23.2.tgz |
|
equinix-credentials-controller |
https://binary.mirantis.com/core/helm/equinix-credentials-controller-1.23.2.tgz |
|
equinix-provider |
https://binary.mirantis.com/core/helm/equinix-provider-1.23.2.tgz |
|
iam-controller |
https://binary.mirantis.com/core/helm/iam-controller-1.23.2.tgz |
|
kaas-exporter |
https://binary.mirantis.com/core/helm/kaas-exporter-1.23.2.tgz |
|
kaas-public-api |
https://binary.mirantis.com/core/helm/kaas-public-api-1.23.2.tgz |
|
kaas-ui |
||
lcm-controller |
https://binary.mirantis.com/core/helm/lcm-controller-1.23.2.tgz |
|
mcc-cache |
||
openstack-provider |
https://binary.mirantis.com/core/helm/openstack-provider-1.23.2.tgz |
|
os-credentials-controller |
https://binary.mirantis.com/core/helm/os-credentials-controller-1.23.2.tgz |
|
proxy-controller |
https://binary.mirantis.com/core/helm/proxy-controller-1.23.2.tgz |
|
release-controller |
https://binary.mirantis.com/core/helm/release-controller-1.23.2.tgz |
|
rhellicense-controller |
https://binary.mirantis.com/core/helm/rhellicense-controller-1.23.2.tgz |
|
squid-proxy |
https://binary.mirantis.com/core/helm/squid-proxy-1.23.2.tgz |
|
vsphere-credentials-controller |
https://binary.mirantis.com/core/helm/vsphere-credentials-controller-1.23.2.tgz |
|
vsphere-provider |
https://binary.mirantis.com/core/helm/vsphere-provider-1.23.2.tgz |
|
Docker images |
admission-controller Updated |
mirantis.azurecr.io/core/admission-controller:1.23.3 |
aws-cluster-api-controller Updated |
mirantis.azurecr.io/core/aws-cluster-api-controller:1.23.2 |
|
aws-credentials-controller Updated |
mirantis.azurecr.io/core/aws-credentials-controller:1.23.2 |
|
byo-cluster-api-controller Updated |
mirantis.azurecr.io/core/byo-cluster-api-controller:1.23.2 |
|
byo-credentials-controller Updated |
mirantis.azurecr.io/core/byo-credentials-controller:1.23.2 |
|
cluster-api-provider-baremetal Updated |
mirantis.azurecr.io/core/cluster-api-provider-baremetal:1.23.2 |
|
cluster-api-provider-equinix Updated |
mirantis.azurecr.io/core/cluster-api-provider-equinix:1.23.2 |
|
equinix-credentials-controller Updated |
mirantis.azurecr.io/core/equinix-credentials-controller:1.23.2 |
|
frontend Updated |
mirantis.azurecr.io/core/frontend:1.23.4 |
|
iam-controller Updated |
mirantis.azurecr.io/core/iam-controller:1.23.2 |
|
kproxy Updated |
mirantis.azurecr.io/lcm/kproxy:1.23.2 |
|
lcm-controller Updated |
mirantis.azurecr.io/core/lcm-controller:v0.2.0-372-g7e042f4d |
|
nginx |
mirantis.azurecr.io/lcm/nginx:1.18.0 |
|
openstack-cluster-api-controller Updated |
mirantis.azurecr.io/core/openstack-cluster-api-controller:1.23.2 |
|
os-credentials-controller Updated |
mirantis.azurecr.io/core/os-credentials-controller:1.23.2 |
|
registry |
mirantis.azurecr.io/lcm/registry:2.7.1 |
|
release-controller Updated |
mirantis.azurecr.io/core/release-controller:1.23.2 |
|
rhellicense-controller Updated |
mirantis.azurecr.io/core/rhellicense-controller:1.23.2 |
|
squid-proxy Updated |
mirantis.azurecr.io/core/squid-proxy:0.0.1-5 |
|
vsphere-cluster-api-controller Updated |
mirantis.azurecr.io/core/vsphere-api-controller:1.23.2 |
|
vsphere-credentials-controller Updated |
mirantis.azurecr.io/core/vsphere-credentials-controller:1.23.2 |
Artifact |
Component |
Path |
|---|---|---|
Binaries |
hash-generate-linux |
http://binary.mirantis.com/iam/bin/hash-generate-0.0.1-268-3cf7f17-linux |
hash-generate-darwin |
http://binary.mirantis.com/iam/bin/hash-generate-0.0.1-268-3cf7f17-darwin |
|
iamctl-linux Updated |
||
iamctl-darwin Updated |
||
iamctl-windows Updated |
||
Helm charts |
iam Updated |
|
iam-proxy |
||
keycloak-proxy Updated |
http://binary.mirantis.com/core/helm/keycloak_proxy-1.23.2.tgz |
|
Docker images |
api Updated |
mirantis.azurecr.io/iam/api:0.5.2 |
auxiliary Updated |
mirantis.azurecr.io/iam/auxiliary:0.5.2 |
|
kubernetes-entrypoint |
mirantis.azurecr.io/openstack/extra/kubernetes-entrypoint:v1.0.0-20200311160233 |
|
mariadb |
mirantis.azurecr.io/general/mariadb:10.4.16-bionic-20201105025052 |
|
keycloak |
mirantis.azurecr.io/iam/keycloak:0.4.0 |
|
keycloak-gatekeeper |
mirantis.azurecr.io/iam/keycloak-gatekeeper:6.0.1 |
See also
The Mirantis Container Cloud GA release 2.9.0:
Introduces support for the Cluster release 5.16.0 that is based on Kubernetes 1.18, Mirantis Container Runtime 19.03.14, and Mirantis Kubernetes Engine 3.3.6.
Introduces support for the Cluster release 6.16.0 that is based on the Cluster release 5.16.0 and represents Mirantis OpenStack for Kubernetes (MOS) 21.3.
Supports deprecated Cluster releases 5.15.0 and 6.14.0 that will become unsupported in one of the following Container Cloud releases.
Supports the Cluster release 5.11.0 only for attachment of existing MKE 3.3.4 clusters. For the deployment of new or attachment of existing MKE 3.3.6 clusters, the latest available Cluster release is used.
Caution
Make sure to update the Cluster release version of your managed cluster before the current Cluster release version becomes unsupported by a new Container Cloud release version. Otherwise, Container Cloud stops auto-upgrade and eventually Container Cloud itself becomes unsupported.
This section outlines release notes for the Container Cloud release 2.9.0.
This section outlines new features and enhancements introduced in the Mirantis Container Cloud release 2.9.0. For the list of enhancements in the Cluster release 5.16.0 and Cluster release 6.16.0 that are supported by the Container Cloud release 2.9.0, see the 5.16.0 and 6.16.0 sections.
Introduced support for the Equinix Metal cloud provider. Equinix Metal integrates a fully automated bare metal infrastructure at software speed.
Now, you can deploy managed clusters that are based on the Equinix Metal management or regional clusters or on top of the AWS-based management cluster.
Using the Equinix Metal management cluster, you can also deploy additional regional clusters that are based the OpenStack, AWS, vSphere, or Equinix Metal cloud providers to deploy and operate managed clusters of different provider types or configurations from a single Container Cloud management plane.
The Equinix Metal based managed clusters also include a Ceph cluster that can be configured either automatically or manually before or after the cluster deployment.
Learn more
Implemented the Container Cloud integration to Lens. Using the Container Cloud web UI and the Lens extension, you can now add any type of Container Cloud clusters to Lens for further inspection and monitoring.
The following options are now available in the More action icon menu of each deployed cluster:
Add cluster to Lens
Open cluster in Lens
Added the possibility to use a new bootstrap node for deployment of additional regional clusters. You can now deploy regional clusters not only on the bootstrap node where you originally deployed the related management cluster, but also on a new node.
Implemented the possibility to configure TLS certificates for Keycloak and Container Cloud web UI on new management clusters.
Caution
Adding of TLS certificates for Keycloak is not supported on existing clusters deployed using the Container Cloud release earlier than 2.9.0.
Implemented management of SSH keys only for the universal mcc-user that is
now applicable to any Container Cloud provider and node type,
including Bastion. All existing SSH user names, such as ubuntu,
cloud-user for the vSphere-based clusters, are replaced with the universal
mcc-user user name.
Learn more
Implemented the vsphereResources controller to represent the vSphere
resources as Kubernetes objects and manage them using the Container Cloud
web UI.
You can now use the drop-down list fields to filter results by a short resource name during a cluster and machine creation. The drop-down lists for the following vSphere resources paths are added to the Container Cloud web UI:
|
|
Updated the L2 templates format for baremetal-based deployments.
In the new format, l2template:status:npTemplate is used
directly during provisioning. Therefore, a hardware node obtains and applies
a complete network configuration during the first system boot.
Before the Container Cloud 2.9.0, you were able to configure any network
interface except the default provisioning NIC for the PXE and LCM
managed to manager connection.
Since Container Cloud 2.9.0, you can configure any interface if required.
Caution
Deploy any new node using the L2 template of the new format.
Replace all deprecated L2 templates created before Container Cloud 2.9.0 with the L2 templates of new format.
Learn more
The following issues have been addressed in the Mirantis Container Cloud release 2.9.0 along with the Cluster releases 6.16.0 and 5.16.0.
For more issues addressed for the Cluster release 6.16.0, see also 2.8.0 addressed issues.
[14682][StackLight] Reduced the amount of
KubePodNotReadyandKubePodCrashLoopingalerts. Reworked these alerts and renamed toKubePodsNotReadyandKubePodsCrashLooping.[14663][StackLight] Removed the inefficient Kubernetes API and etcd latency alerts.
[14458][vSphere] Fixed the issue with newly created pods failing to run and having the
CrashLoopBackOffstatus on long-living vSphere-based clusters.The issue is fixed for new clusters deployed using Container Cloud 2.9.0. For existing clusters, apply the workaround described in vSphere known issues.
[14051][Ceph] Fixed the issue with the
CephClustercreation failure ifmanageOsdswas enabled before deploy.
This section lists known issues with workarounds for the Mirantis Container Cloud release 2.9.0 including the Cluster release 5.16.0 and 6.16.0.
Note
This section also outlines still valid known issues from previous Container Cloud releases.
Fixed in the Cluster release 7.0.0
Note
The issue below affects only the Kubernetes 1.18 deployments. Moving forward, the workaround for this issue will be moved from Release Notes to Troubleshooting Guide.
On a management cluster with multiple AWS-based managed
clusters, some clusters fail to complete the deployments that require
persistent volumes (PVs), for example, Elasticsearch.
Some of the affected pods get stuck in the Pending state
with the pod has unbound immediate PersistentVolumeClaims and
node(s) had volume node affinity conflict errors.
Warning
The workaround below applies to HA deployments where data can be rebuilt from replicas. If you have a non-HA deployment, back up any existing data before proceeding, since all data will be lost while applying the workaround.
Workaround:
Obtain the persistent volume claims related to the storage mounts of the affected pods:
kubectl get pod/<pod_name1> pod/<pod_name2> \ -o jsonpath='{.spec.volumes[?(@.persistentVolumeClaim)].persistentVolumeClaim.claimName}'
Note
In the command above and in the subsequent steps, substitute the parameters enclosed in angle brackets with the corresponding values.
Delete the affected
PodsandPersistentVolumeClaimsto reschedule them: For example, for StackLight:kubectl -n stacklight delete \ pod/<pod_name1> pod/<pod_name2> ... pvc/<pvc_name2> pvc/<pvc_name2> ...
Fixed in 2.11.0
A load balancer virtual IP address (VIP) is assigned to each manager
node on any type of the vSphere-based cluster. The issue occurs because
the Keepalived instances cannot set up a cluster due to the blocked
vrrp protocol traffic in the firewall configuration on the Container Cloud
nodes.
Note
Before applying the workaround below, verify that the dedicated
vSphere network does not have any other virtual machines with the
keepalived instance running with the same vrouter_id.
You can verify the vrouter_id value of the cluster
in /etc/keepalived/keepalived.conf on the manager nodes.
Workaround
Update the firewalld configuration on each manager node of the affected
cluster to allow the vrrp protocol traffic between the nodes:
SSH to any manager node using
mcc-user.Apply the
firewalldconfiguration:firewall-cmd --add-rich-rule='rule protocol value="vrrp" accept' --permanent firewall-cmd --reload
Apply the procedure to the remaining manager nodes of the cluster.
Note
Moving forward, the workaround for this issue will be moved from Release Notes to Troubleshooting Guide.
A vSphere-based management cluster bootstrap fails due to a node leaving the cluster after an accidental IP address change.
The issue may affect a vSphere-based cluster only when IPAM is not enabled and IP addresses assignment to the vSphere virtual machines is done by a DHCP server present in the vSphere network.
By default, a DHCP server keeps lease of the IP address for 30 minutes.
Usually, a VM dhclient prolongs such lease by frequent DHCP requests
to the server before the lease period ends.
The DHCP prolongation request period is always less than the default lease time
on the DHCP server, so prolongation usually works.
But in case of network issues, for example, when dhclient from the
VM cannot reach the DHCP server, or the VM is being slowly powered on
for more than the lease time, such VM may lose its assigned IP address.
As a result, it obtains a new IP address.
Container Cloud does not support network reconfiguration after the IP of the VM has been changed. Therefore, such issue may lead to a VM leaving the cluster.
Symptoms:
One of the nodes is in the
NodeNotReadyordownstate:kubectl get nodes -o wide docker node ls
The UCP Swarm manager logs on the healthy manager node contain the following example error:
docker logs -f ucp-swarm-manager level=debug msg="Engine refresh failed" id="<docker node ID>|<node IP>: 12376"
If the affected node is manager:
The output of the docker info command contains the following example error:
Error: rpc error: code = Unknown desc = The swarm does not have a leader. \ It's possible that too few managers are online. \ Make sure more than half of the managers are online.
The UCP controller logs contain the following example error:
docker logs -f ucp-controller "warning","msg":"Node State Active check error: \ Swarm Mode Manager health check error: \ info: Cannot connect to the Docker daemon at tcp://<node IP>:12376. \ Is the docker daemon running?
On the affected node, the IP address on the first interface
eth0does not match the IP address configured in Docker. Verify theNode Addressfield in the output of the docker info command.The following lines are present in
/var/log/messages:dhclient[<pid>]: bound to <node IP> -- renewal in 1530 seconds
If there are several lines where the IP is different, the node is affected.
Workaround:
Select from the following options:
Bind IP addresses for all machines to their MAC addresses on the DHCP server for the dedicated vSphere network. In this case, VMs receive only specified IP addresses that never change.
Remove the Container Cloud node IPs from the IP range on the DHCP server for the dedicated vSphere network and configure the first interface
eth0on VMs with a static IP address.If a managed cluster is affected, redeploy it with IPAM enabled for new machines to be created and IPs to be assigned properly.
Fixed in 2.9.0 for new clusters
Newly created pods may fail to run and have the CrashLoopBackOff status
on long-living Container Cloud clusters deployed on RHEL 7.8 using the VMware
vSphere provider. The following is an example output of the
kubectl describe pod <pod-name> -n <projectName> command:
State: Waiting
Reason: CrashLoopBackOff
Last State: Terminated
Reason: ContainerCannotRun
Message: OCI runtime create failed: container_linux.go:349:
starting container process caused "process_linux.go:297:
applying cgroup configuration for process caused
"mkdir /sys/fs/cgroup/memory/kubepods/burstable/<pod-id>/<container-id>>:
cannot allocate memory": unknown
The issue occurs due to the Kubernetes and Docker community issues.
According to the RedHat solution,
the workaround is to disable the kernel memory accounting feature
by appending cgroup.memory=nokmem to the kernel command line.
Note
The workaround below applies to the existing clusters only. The issue is resolved for new Container Cloud 2.9.0 deployments since the workaround below automatically applies to the VM template built during the vSphere-based management cluster bootstrap.
Apply the following workaround on each machine of the affected cluster.
Workaround
SSH to any machine of the affected cluster using
mcc-userand the SSH key provided during the cluster creation to proceed as therootuser.In
/etc/default/grub, setcgroup.memory=nokmemforGRUB_CMDLINE_LINUX.Update kernel:
yum install kernel kernel-headers kernel-tools kernel-tools-libs kexec-tools
Update the grub configuration:
grub2-mkconfig -o /boot/grub2/grub.cfg
Reboot the machine.
Wait for the machine to become available.
Wait for 5 minutes for Docker and Kubernetes services to start.
Verify that the machine is
Ready:docker node ls kubectl get nodes
Repeat the steps above on the remaining machines of the affected cluster.
An OpenStack-based regional cluster cleanup fails with the timeout error.
Workaround:
Wait for the
Clusterobject to be deleted in the bootstrap cluster:kubectl --kubeconfig <(./bin/kind get kubeconfig --name clusterapi) get cluster
The system output must be empty.
Remove the bootstrap cluster manually:
./bin/kind delete cluster --name clusterapi
Fixed in 2.10.0
An Equinix Metal manager machine deployment may fail if the cluster contains
at least one manager machine that is stuck in the Provisioning state
due to the capacity limits in the selected Equinix Metal data center.
In this case, other machines that were successfully created in Equinix Metal
may also fail to finalize the deployment and get stuck on the Deploy stage.
If this is the case, remove all manager machines that are stuck in the
Provisioning state.
Workaround:
Export the
kubeconfigof the management cluster. For example:export KUBECONFIG=~/Downloads/kubeconfig-test-mgmt.yml
Add the
kaas.mirantis.com/validate: "false"annotation to all machines that are stuck in theProvisioningstate.Note
In the commands below, replace
$MACHINE_PROJECT_NAMEand$MACHINE_NAMEwith the cluster project name and name of the affected machine respectively:kubectl -n $MACHINE_PROJECT_NAME annotate machine $MACHINE_NAME kaas.mirantis.com/validate="false"
Remove the machine that is stuck in the
Provisioningstate using the Container Cloud web UI or using the following command:kubectl -n $MACHINE_PROJECT_NAME delete machine $MACHINE_NAME
After all machines that are stuck in the Provisioning state are removed,
the deployment of the manager machine that is stuck on the Deploy stage
restores.
On the baremetal-based management clusters with the Cluster version 2.9.0 or earlier, the storage volume used by Ironic can run out of free space. As a result, an automatic upgrade of the management cluster fails with the no space left on device error in the Ironic logs.
Symptoms:
The
httpdDeploymentand theironicanddnsmasqstatefulSetsare not in theOKstatus:kubectl -n kaas get deployments kubectl -n kaas get statefulsets
One or more of the
httpd,ironic, anddnsmasqpods fail to start:kubectl get pods -n kaas -o wide | grep httpd-0
If the number of ready containers for the pod is 0/1, the management cluster can be affected by the issue.
kubectl get pods -n kaas -o wide | grep ironic
If the number of ready containers for the pod is not 6/6, the management cluster can be affected by the issue.
Logs of the affected pods contain the no space left on device error:
kubectl -n kaas logs httpd-0 | grep -i 'no space left on device'
As a workaround, truncate the Ironic log files on the storage volume:
kubectl -n kaas exec -ti sts/httpd -- /bin/bash -c 'truncate -s 0 /volume/log/ironic/ironic-api.log'
kubectl -n kaas exec -ti sts/httpd -- /bin/bash -c 'truncate -s 0 /volume/log/ironic/ironic-conductor.log'
kubectl -n kaas exec -ti sts/httpd -- /bin/bash -c 'truncate -s 0 /volume/log/ironic/ansible-playbook.log'
kubectl -n kaas exec -ti sts/httpd -- /bin/bash -c 'truncate -s 0 /volume/log/ironic-inspector/ironic-inspector.log'
kubectl -n kaas exec -ti sts/httpd -- /bin/bash -c 'truncate -s 0 /volume/log/dnsmasq/dnsmasq-dhcpd.log'
Fixed in 2.11.0
If an L2 template is configured incorrectly, a bare metal cluster is deployed
successfully but with the runtime errors in the IpamHost object.
Workaround:
If you suspect that the machine is not working properly because
of incorrect network configuration, verify the status of the corresponding
IpamHost object. Inspect the l2RenderResult and ipAllocationResult
object fields for error messages.
Fixed in 2.11.0
If you use a custom BareMetalHostProfile, after disk replacement
on a Ceph OSD, the Ceph OSD pod switches to the CrashLoopBackOff state
due to the Ceph OSD authorization key failing to be created properly.
Workaround:
Export
kubeconfigof your managed cluster. For example:export KUBECONFIG=~/Downloads/kubeconfig-test-cluster.yml
Log in to the
ceph-toolspod:kubectl -n rook-ceph exec -it $(kubectl -n rook-ceph get pod -l "app=rook-ceph-tools" -o jsonpath='{.items[0].metadata.name}') bash
Delete the authorization key for the failed Ceph OSD:
ceph auth del osd.<ID>
SSH to the node on which the Ceph OSD cannot be created.
Clean up the disk that will be a base for the failed Ceph OSD. For details, see official Rook documentation.
Note
Ignore failures of the sgdisk --zap-all $DISK and blkdiscard $DISK commands if any.
On the managed cluster, restart Rook Operator:
kubectl -n rook-ceph delete pod -l app=rook-ceph-operator
Fixed in 2.12.0
The MariaDB pods fail to start after MariaDB blocks itself during the State Snapshot Transfers sync.
Workaround:
Verify the failed pod readiness:
kubectl describe pod -n kaas <failedMariadbPodName>
If the readiness probe failed with the WSREP not synced message, proceed to the next step. Otherwise, assess the MariaDB pod logs to identify the failure root cause.
Obtain the MariaDB admin password:
kubectl get secret -n kaas mariadb-dbadmin-password -o jsonpath='{.data.MYSQL_DBADMIN_PASSWORD}' | base64 -d ; echo
Verify that
wsrep_local_state_commentisDonororDesynced:kubectl exec -it -n kaas <failedMariadbPodName> -- mysql -uroot -p<mariadbAdminPassword> -e "SHOW status LIKE \"wsrep_local_state_comment\";"
Restart the failed pod:
kubectl delete pod -n kaas <failedMariadbPodName>
Fixed in 2.8.0 for new clusters and in 2.10.0 for existing clusters
If an application running on a Container Cloud management or managed cluster fails frequently, for example, PostgreSQL, it may produce an excessive amount of core dumps. This leads to the no space left on device error on the cluster nodes and, as a result, to the broken Docker Swarm and the entire cluster.
Core dumps are disabled by default on the operating system of the Container Cloud nodes. But since Docker does not inherit the operating system settings, disable core dumps in Docker using the workaround below.
Warning
The workaround below does not apply to the baremetal-based clusters, including MOS deployments, since Docker restart may destroy the Ceph cluster.
Workaround:
SSH to any machine of the affected cluster using
mcc-userand the SSH key provided during the cluster creation.In
/etc/docker/daemon.json, add the following parameters:{ ... "default-ulimits": { "core": { "Hard": 0, "Name": "core", "Soft": 0 } } }
Restart the Docker daemon:
systemctl restart docker
Repeat the steps above on each machine of the affected cluster one by one.
Fixed in 2.12.0
Adding of a new manager node to a managed cluster may hang due to
issues with joining etcd from a new node to the existing etcd cluster.
The new manager node hangs in the Deploy stage.
Symptoms:
The Ansible run tries executing the
Wait for Docker UCP to be accessiblestep and fails with the following error message:Status code was -1 and not [200]: Request failed: <urlopen error [Errno 111] Connection refused>
The etcd logs on the leader etcd node contain the following example error message occurring every 1-2 minutes:
2021-06-10 03:21:53.196677 W | etcdserver: not healthy for reconfigure, rejecting member add {ID:22bb1d4275f1c5b0 RaftAttributes:{PeerURLs:[https://<new manager IP>:12380] IsLearner:false} Attributes:{Name: ClientURLs:[]}}
To determine the etcd leader, run on any manager node:
docker exec -it ucp-kv sh # From the inside of the container: ETCDCTL_API=3 etcdctl -w table --endpoints=https://<1st manager IP>:12379,https://<2nd manager IP>:12379,https://<3rd manager IP>:12379 endpoint status
To verify logs on the leader node:
docker logs ucp-kv
Root cause:
In case of an unlucky network partition, the leader may lose quorum and members are not able to perform the election. For more details, see Official etcd documentation: Learning, figure 5.
Workaround:
Restart etcd on the leader node:
docker rm -f ucp-kv
Wait several minutes until the etcd cluster starts and reconciles.
The deployment of the new manager node will proceed and it will join the etcd cluster. After that, other MKE components will be configured and the node deployment will be finished successfully.
Fixed in 2.11
A managed cluster update from the Cluster release 6.12.0 to
6.14.0 fails with worker nodes being stuck in the Deploy state with
the Network is unreachable error.
Workaround:
Verify the state of the loopback network interface:
ip l show lo
If the interface is not in the
UNKNOWNorUPstate, enable it manually:ip l set lo up
If the interface is in the
UNKNOWNorUPstate, assess the cluster logs to identify the failure root cause.Repeat the cluster update procedure.
Fixed in 2.11.0
During update of a managed cluster from the Cluster releases 6.12.0 to 6.14.0, the LCM Agent upgrade fails with the following error in logs:
lcmAgentUpgradeStatus:
error: 'failed to download agent binary: Get https://<mcc-cache-address>/bin/lcm/bin/lcm-agent/v0.2.0-289-gd7e9fa9c/lcm-agent:
x509: certificate signed by unknown authority'
Only clusters initially deployed using Container Cloud 2.4.0 or earlier are affected.
As a workaround, restart lcm-agent using the
service lcm-agent-* restart command on the affected nodes.
Note
The issue affects only Helm v2 releases and is addressed for Helm v3. Starting from Container Cloud 2.19.0, all Helm releases are switched to v3.
During a management, regional, or managed cluster deployment,
Helm releases may get stuck in the FAILED or UNKNOWN state
although the corresponding machines statuses are Ready
in the Container Cloud web UI. For example, if the StackLight Helm release
fails, the links to its endpoints are grayed out in the web UI.
In the cluster status, providerStatus.helm.ready and
providerStatus.helm.releaseStatuses.<releaseName>.success are false.
HelmBundle cannot recover from such states and requires manual actions.
The workaround below describes the recovery steps for the stacklight
release that got stuck during a cluster deployment.
Use this procedure as an example for other Helm releases as required.
Workaround:
Verify the failed release has the
UNKNOWNorFAILEDstatus in the HelmBundle object:kubectl --kubeconfig <regionalClusterKubeconfigPath> get helmbundle <clusterName> -n <clusterProjectName> -o=jsonpath={.status.releaseStatuses.stacklight} In the command above and in the steps below, replace the parameters enclosed in angle brackets with the corresponding values of your cluster.
Example of system response:
stacklight: attempt: 2 chart: "" finishedAt: "2021-02-05T09:41:05Z" hash: e314df5061bd238ac5f060effdb55e5b47948a99460c02c2211ba7cb9aadd623 message: '[{"occurrence":1,"lastOccurrenceDate":"2021-02-05 09:41:05","content":"error updating the release: rpc error: code = Unknown desc = customresourcedefinitions.apiextensions.k8s.io \"helmbundles.lcm.mirantis.com\" already exists"}]' notes: "" status: UNKNOWN success: false version: 0.1.2-mcp-398
Log in to the
helm-controllerpod console:kubectl --kubeconfig <affectedClusterKubeconfigPath> exec -n kube-system -it helm-controller-0 sh -c tiller
Download the Helm v3 binary. For details, see official Helm documentation.
Remove the failed release:
helm delete <failed-release-name>
For example:
helm delete stacklight
Once done, the release triggers for redeployment.
Fixed in 2.10.0
A managed cluster deployed or updated on a regional cluster of another provider type may display inaccurate Nodes readiness live status in the Container Cloud web UI. While all nodes are ready, the Nodes status indicates that some nodes are still not ready.
The issue occurs due to the cordon-drain desynchronization between
the LCMClusterState objects and the actual state of the cluster.
Note
The workaround below must be applied only by users with
the writer or cluster-admin access role
assigned by the Infrastructure Operator.
To verify that the cluster is affected:
Export the regional cluster
kubeconfigcreated during the regional cluster deployment:export KUBECONFIG=<PathToRegionalClusterKubeconfig>
Verify that all Kubernetes nodes of the affected managed cluster are in the
readystate:kubectl --kubeconfig <managedClusterKubeconfigPath> get nodes
Verify that all Swarm nodes of the managed cluster are in the
readystate:ssh -i <sshPrivateKey> root@<controlPlaneNodeIP> docker node ls
Replace the parameters enclosed in angle brackets with the SSH key that was used for the managed cluster deployment and the private IP address of any control plane node of the cluster.
If the status of the Kubernetes and Swarm nodes is
ready, proceed with the next steps. Otherwise, assess the cluster logs to identify the issue with not ready nodes.Obtain the
LCMClusterStateitems related to theswarm-drainandcordon-draintype:kubectl get lcmlusterstates -n <managedClusterProjectName>
The command above outputs the list of all
LCMClusterStateitems. Verify only theLCMClusterStateitems names that start with theswarm-drain-andcordon-drain-prefix.Verify the status of each
LCMClusterStateitem of theswarm-drainandcordon-draintype:kubectl -n <clusterProjectName> get lcmlusterstates <lcmlusterstatesItemNameOfSwarmDrainOrCordonDrainType> -o=yaml
Example of system response extract for the
LCMClusterStateitems of thecordon-draintype:spec: arg: kaas-node-4c026e7a-8acd-48b2-bf5c-cdeaf99d812f clusterName: test-child-namespace type: cordon-drain value: "false" status: attempt: 0 value: "false"
Example of system response extract for the
LCMClusterStateitems of theswarm-draintype:spec: arg: kaas-node-4c026e7a-8acd-48b2-bf5c-cdeaf99d812f clusterName: test-child-namespace type: swarm-drain value: "true" status: attempt: 334 message: 'Error: waiting for kubernetes node kaas-node-4c026e7a-8acd-48b2-bf5c-cdeaf99d812f to be drained first'
The cluster is affected if:
For
cordon-drain,spec.valueandstatus.valueare"false"For
swarm-drain,spec.valueis"true"and thestatus.messagecontains an error related to waiting for the Kubernetes cordon-drain to finish
Workaround:
For each LCMClusterState item of the swarm-drain type with
spec.value == "true" and the status.message described above,
replace "true" with "false" in spec.value:
kubectl -n <clusterProjectName> edit lcmclusterstate <lcmlusterstatesItemNameOfSwarmDrainType>
The iam-api pods are in the Not Ready state on the management cluster
after the Container Cloud upgrade to 2.9.0 since they cannot reach Keycloak
due to the CA certificate issue.
The issue affects only the clusters originally deployed using the Container Cloud release earlier than 2.6.0.
Workaround:
Replace the
tls.crtandtls.keyfields in themcc-ca-certsecret in thekaasnamespace with the certificate and key generated during the management cluster bootstrap. These credentials are stored in thekaas-bootstrap/tlsdirectory.kubectl -n kaas delete secret mcc-ca-cert && kubectl create secret generic mcc-ca-cert -n kaas --dry-run=client --from-file=tls.key=./kaas-bootstrap/tls/ca-key.pem --from-file=tls.crt=./kaas-bootstrap/tls/ca.pem -o yaml | kubectl apply -f -
Wait for the
oidc-ca-certsecret in thekaasnamespace to be updated with the certificate from themcc-ca-certsecret in thekaasnamespace.Restart the
iam-apipods:kubectl -n kaas rollout restart deployment iam-api
Helm releases may get stuck in the PENDING_UPGRADE status
during a management or managed cluster upgrade. The HelmBundle Controller
cannot recover from this state and requires manual actions. The workaround
below describes the recovery process for the openstack-operator release
that stuck during a managed cluster update. Use it as an example for other
Helm releases as required.
Workaround:
Log in to the
helm-controllerpod console:kubectl exec -n kube-system -it helm-controller-0 sh -c tiller
Identify the release that stuck in the
PENDING_UPGRADEstatus. For example:./helm --host=localhost:44134 history openstack-operator
Example of system response:
REVISION UPDATED STATUS CHART DESCRIPTION 1 Tue Dec 15 12:30:41 2020 SUPERSEDED openstack-operator-0.3.9 Install complete 2 Tue Dec 15 12:32:05 2020 SUPERSEDED openstack-operator-0.3.9 Upgrade complete 3 Tue Dec 15 16:24:47 2020 PENDING_UPGRADE openstack-operator-0.3.18 Preparing upgrade
Roll back the failed release to the previous revision:
Download the Helm v3 binary. For details, see official Helm documentation.
Roll back the failed release:
helm rollback <failed-release-name>
For example:
helm rollback openstack-operator 2
Once done, the release will be reconciled.
Fixed in 2.10.0
A managed cluster release upgrade may fail due to DNS issues on pods with host networking. If this is the case, the DNS names of the Kubernetes services on the affected pod cannot be resolved.
Workaround:
Export kubeconfig of the affected managed cluster. For example:
export KUBECONFIG=~/Downloads/kubeconfig-test-cluster.yml
Identify any existing pod with host networking. For example,
tf-config-xxxxxx:kubectl get pods -n tf -l app=tf-config
Verify the DNS names resolution of the Kubernetes services from this pod. For example:
kubectl -n tf exec -it tf-config-vl4mh -c svc-monitor -- curl -k https://kubernetes.default.svc
The system output must not contain DNS errors.
If the DNS name cannot be resolved, restart all
calico-nodepods:kubectl delete pods -l k8s-app=calico-node -n kube-system
Affects only Container Cloud 2.18.0 and earlier
A project that is newly created in the Container Cloud web UI does not display in the Projects list even after refreshing the page. The issue occurs due to the token missing the necessary role for the new project. As a workaround, relogin to the Container Cloud web UI.
The following table lists the major components and their versions of the Mirantis Container Cloud release 2.9.0.
Note
The components that are newly added, updated, deprecated, or removed
as compared to the previous release version, are marked
with a corresponding superscript,
for example, lcm-ansible Updated.
Component |
Application/Service |
Version |
|---|---|---|
AWS Updated |
aws-provider |
1.22.4 |
aws-credentials-controller |
1.22.4 |
|
Bare metal |
baremetal-operator Updated |
5.0.2 |
baremetal-public-api Updated |
5.0.2 |
|
baremetal-provider Updated |
1.22.4 |
|
httpd |
1.18.0 |
|
ironic |
victoria-bionic-20210408180013 |
|
ironic-operator Updated |
base-bionic-20210513142132 |
|
kaas-ipam |
base-bionic-20210427213631 |
|
local-volume-provisioner Updated |
1.0.6-mcp |
|
mariadb |
10.4.17-bionic-20210203155435 |
|
IAM |
iam Updated |
2.4.0 |
iam-controller Updated |
1.22.4 |
|
keycloak |
12.0.0 |
|
Container Cloud |
admission-controller Updated |
1.22.4 |
byo-credentials-controller Updated |
1.22.4 |
|
byo-provider Updated |
1.22.4 |
|
kaas-public-api Updated |
1.22.4 |
|
kaas-exporter Updated |
1.22.4 |
|
kaas-ui Updated |
1.22.4 |
|
lcm-controller Updated |
0.2.0-351-g3151d0cd |
|
mcc-cache Updated |
1.22.4 |
|
proxy-controller Updated |
1.22.4 |
|
release-controller Updated |
1.22.4 |
|
rhellicense-controller Updated |
1.22.4 |
|
squid-proxy |
0.0.1-3 |
|
Equinix Metal New |
equinix-provider |
1.22.5 |
equinix-credentials-controller |
1.22.4 |
|
OpenStack Updated |
openstack-provider |
1.22.4 |
os-credentials-controller |
1.22.4 |
|
VMware vSphere Updated |
vsphere-provider |
1.22.4 |
vsphere-credentials-controller |
1.22.4 |
This section lists the components artifacts of the Mirantis Container Cloud release 2.9.0.
Note
The components that are newly added, updated, deprecated, or removed
as compared to the previous release version, are marked
with a corresponding superscript,
for example, lcm-ansible Updated.
Artifact |
Component |
Path |
|---|---|---|
Binaries |
baremetal-operator Updated |
https://binary.mirantis.com/bm/helm/baremetal-operator-5.0.2.tgz |
baremetal-public-api Updated |
https://binary.mirantis.com/bm/helm/baremetal-public-api-5.0.2.tgz |
|
ironic-python-agent-bionic.kernel |
https://binary.mirantis.com/bm/bin/ironic/ipa/ubuntu/kernel-victoria-bionic-debug-20210226182519 |
|
ironic-python-agent-bionic.initramfs |
https://binary.mirantis.com/bm/bin/ironic/ipa/ubuntu/initramfs-victoria-bionic-debug-20210226182519 |
|
kaas-ipam Updated |
||
local-volume-provisioner Updated |
https://binary.mirantis.com/bm/helm/local-volume-provisioner-1.0.6-mcp.tgz |
|
Docker images |
baremetal-operator Updated |
mirantis.azurecr.io/bm/baremetal-operator:base-bionic-20210513173947 |
httpd |
mirantis.azurecr.io/lcm/nginx:1.18.0 |
|
ironic |
mirantis.azurecr.io/openstack/ironic:victoria-bionic-20210408180013 |
|
ironic-inspector |
mirantis.azurecr.io/openstack/ironic-inspector:victoria-bionic-20210408180013 |
|
ironic-operator Updated |
mirantis.azurecr.io/bm/ironic-operator:base-bionic-20210513142132 |
|
kaas-ipam |
mirantis.azurecr.io/bm/kaas-ipam:base-bionic-20210427213631 |
|
mariadb |
mirantis.azurecr.io/general/mariadb:10.4.17-bionic-20210203155435 |
Artifact |
Component |
Path |
|---|---|---|
Bootstrap tarball Updated |
bootstrap-linux |
https://binary.mirantis.com/core/bin/bootstrap-linux-1.22.4.tar.gz |
bootstrap-darwin |
https://binary.mirantis.com/core/bin/bootstrap-darwin-1.22.4.tar.gz |
|
Helm charts Updated |
admission-controller |
https://binary.mirantis.com/core/helm/admission-controller-1.22.4.tgz |
aws-credentials-controller |
https://binary.mirantis.com/core/helm/aws-credentials-controller-1.22.4.tgz |
|
aws-provider |
https://binary.mirantis.com/core/helm/aws-provider-1.22.4.tgz |
|
baremetal-provider |
https://binary.mirantis.com/core/helm/baremetal-provider-1.22.4.tgz |
|
byo-credentials-controller |
https://binary.mirantis.com/core/helm/byo-credentials-controller-1.22.4.tgz |
|
byo-provider |
https://binary.mirantis.com/core/helm/byo-provider-1.22.4.tgz |
|
equinix-credentials-controller New |
https://binary.mirantis.com/core/helm/equinix-credentials-controller-1.22.4.tgz |
|
equinix-provider New |
https://binary.mirantis.com/core/helm/equinix-provider-1.22.5.tgz |
|
iam-controller |
https://binary.mirantis.com/core/helm/iam-controller-1.22.4.tgz |
|
kaas-exporter |
https://binary.mirantis.com/core/helm/kaas-exporter-1.22.4.tgz |
|
kaas-public-api |
https://binary.mirantis.com/core/helm/kaas-public-api-1.22.4.tgz |
|
kaas-ui |
||
lcm-controller |
https://binary.mirantis.com/core/helm/lcm-controller-1.22.4.tgz |
|
mcc-cache |
||
openstack-provider |
https://binary.mirantis.com/core/helm/openstack-provider-1.22.4.tgz |
|
os-credentials-controller |
https://binary.mirantis.com/core/helm/os-credentials-controller-1.22.4.tgz |
|
proxy-controller |
https://binary.mirantis.com/core/helm/proxy-controller-1.22.4.tgz |
|
release-controller |
https://binary.mirantis.com/core/helm/release-controller-1.22.4.tgz |
|
rhellicense-controller |
https://binary.mirantis.com/core/helm/rhellicense-controller-1.22.4.tgz |
|
squid-proxy |
https://binary.mirantis.com/core/helm/squid-proxy-1.22.4.tgz |
|
vsphere-credentials-controller |
https://binary.mirantis.com/core/helm/vsphere-credentials-controller-1.22.4.tgz |
|
vsphere-provider |
https://binary.mirantis.com/core/helm/vsphere-provider-1.22.4.tgz |
|
Docker images |
admission-controller Updated |
mirantis.azurecr.io/core/admission-controller:1.22.4 |
aws-cluster-api-controller Updated |
mirantis.azurecr.io/core/aws-cluster-api-controller:1.22.4 |
|
aws-credentials-controller Updated |
mirantis.azurecr.io/core/aws-credentials-controller:1.22.4 |
|
byo-cluster-api-controller Updated |
mirantis.azurecr.io/core/byo-cluster-api-controller:1.22.4 |
|
byo-credentials-controller Updated |
mirantis.azurecr.io/core/byo-credentials-controller:1.22.4 |
|
cluster-api-provider-baremetal Updated |
mirantis.azurecr.io/core/cluster-api-provider-baremetal:1.22.4 |
|
cluster-api-provider-equinix New |
mirantis.azurecr.io/core/cluster-api-provider-equinix:1.22.5 |
|
equinix-credentials-controller New |
mirantis.azurecr.io/core/equinix-credentials-controller:1.22.4 |
|
frontend Updated |
mirantis.azurecr.io/core/frontend:1.22.4 |
|
iam-controller Updated |
mirantis.azurecr.io/core/iam-controller:1.22.4 |
|
kproxy Updated |
mirantis.azurecr.io/lcm/kproxy:1.22.4 |
|
lcm-controller Updated |
mirantis.azurecr.io/core/lcm-controller:v0.2.0-351-g3151d0cd |
|
nginx |
mirantis.azurecr.io/lcm/nginx:1.18.0 |
|
openstack-cluster-api-controller Updated |
mirantis.azurecr.io/core/openstack-cluster-api-controller:1.22.4 |
|
os-credentials-controller Updated |
mirantis.azurecr.io/core/os-credentials-controller:1.22.4 |
|
registry |
mirantis.azurecr.io/lcm/registry:2.7.1 |
|
release-controller Updated |
mirantis.azurecr.io/core/release-controller:1.22.4 |
|
rhellicense-controller Updated |
mirantis.azurecr.io/core/rhellicense-controller:1.22.4 |
|
squid-proxy |
mirantis.azurecr.io/core/squid-proxy:0.0.1-3 |
|
vsphere-cluster-api-controller Updated |
mirantis.azurecr.io/core/vsphere-api-controller:1.22.4 |
|
vsphere-credentials-controller Updated |
mirantis.azurecr.io/core/vsphere-credentials-controller:1.22.4 |
Artifact |
Component |
Path |
|---|---|---|
Binaries |
hash-generate-linux |
http://binary.mirantis.com/iam/bin/hash-generate-0.0.1-268-3cf7f17-linux |
hash-generate-darwin |
http://binary.mirantis.com/iam/bin/hash-generate-0.0.1-268-3cf7f17-darwin |
|
iamctl-linux |
||
iamctl-darwin |
||
iamctl-windows |
||
Helm charts |
iam Updated |
|
iam-proxy |
||
keycloak-proxy Updated |
http://binary.mirantis.com/core/helm/keycloak_proxy-1.22.4.tgz |
|
Docker images |
api |
mirantis.azurecr.io/iam/api:0.5.1 |
auxiliary |
mirantis.azurecr.io/iam/auxiliary:0.5.1 |
|
kubernetes-entrypoint |
mirantis.azurecr.io/openstack/extra/kubernetes-entrypoint:v1.0.0-20200311160233 |
|
mariadb |
mirantis.azurecr.io/general/mariadb:10.4.16-bionic-20201105025052 |
|
keycloak |
mirantis.azurecr.io/iam/keycloak:0.4.0 |
|
keycloak-gatekeeper |
mirantis.azurecr.io/iam/keycloak-gatekeeper:6.0.1 |
Before the Container Cloud 2.9.0, you were able to configure any network
interface except the default provisioning NIC for the PXE and LCM
managed to manager connection.
Since Container Cloud 2.9.0, you can configure any interface if required.
Caution
Deploy any new node using the updated L2 template format.
All L2 templates created before Container Cloud 2.9.0 are now deprecated and must not be used.
In the old L2 templates format, ipamhost spawns 2 structures after
processing l2template for machines:
l2template:status:osMetadataNetworkthat renders automatically using thedefaultsubnet from the management cluster and is used during thecloud-initdeployment phase after provisioning is donel2template:status:npTemplatethat is used during thelcm-agentdeployment phase and applied afterlcmmachinestarts deployment
In the new L2 templates format, l2template:status:npTemplate is used
directly during provisioning. Therefore, a hardware node obtains and applies
a complete network configuration during the first system boot.
To switch to the new L2 template format:
If you do not have a subnet for connection to the
managementLCM cluster network (lcm-nw), manually create one. For details, see Operations Guide: Create subnets.Manually create a new L2 template that is based on your existing one. For details, see Operations Guide: Create L2 templates.
In the
npTemplatesection, add the{{ nic 0}}parameters for thelcm-nwnetwork.Configuration example:
apiVersion: ipam.mirantis.com/v1alpha1 kind: L2Template metadata: labels: bm-1490-template-controls-netplan: anymagicstring cluster.sigs.k8s.io/cluster-name: child-cluster kaas.mirantis.com/provider: baremetal kaas.mirantis.com/region: region-one name: bm-1490-template-controls-netplan namespace: child-ns spec: l3Layout: - subnetName: lcm-nw scope: namespace ifMapping: - enp9s0f0 - enp9s0f1 - eno1 - ens3f1 npTemplate: |- version: 2 ethernets: {{nic 0}}: dhcp4: false dhcp6: false match: macaddress: {{mac 0}} mtu: 1500 nameservers: addresses: [ 172.18.176.6 ] # Name if mandatory set-name: "k8s-lcm" gateway4: {{ gateway_from_subnet "lcm-nw" }} addresses: - {{ ip "0:lcm-nw" }} {{nic 1}}: dhcp4: false dhcp6: false match: macaddress: {{mac 1}} set-name: {{nic 1}} mtu: 1500 .... ....
Note
In the previous L2 template format,
{{ nic 0}}for the PXE interface was not defined.
After switching to the new l2template format, the following info
message appears in the ipamhost status and indicates that bmh
successfully migrated to the new format of L2 templates:
KUBECONFIG=kubeconfig kubectl -n managed-ns get ipamhosts
NAME STATUS AGE REGION
cz7700-bmh L2Template + L3Layout used, osMetadataNetwork is unacceptable in this mode 49m region-one
See also
The Mirantis Container Cloud GA release 2.8.0:
Introduces support for the Cluster release 5.15.0 that is based on Kubernetes 1.18, Mirantis Container Runtime 19.03.14, and Mirantis Kubernetes Engine 3.3.6.
Supports the Cluster release 6.14.0 that is based on the Cluster release 5.14.0 and represents Mirantis OpenStack for Kubernetes (MOS) 21.2.
Supports deprecated Cluster releases 5.14.0 and 6.12.0 that will become unsupported in one of the following Container Cloud releases.
Supports the Cluster release 5.11.0 only for attachment of existing MKE 3.3.4 clusters. For the deployment of new or attachment of existing MKE 3.3.6 clusters, the latest available Cluster release is used.
Caution
Make sure to update the Cluster release version of your managed cluster before the current Cluster release version becomes unsupported by a new Container Cloud release version. Otherwise, Container Cloud stops auto-upgrade and eventually Container Cloud itself becomes unsupported.
This section outlines release notes for the Container Cloud release 2.8.0.
This section outlines new features and enhancements introduced in the Mirantis Container Cloud release 2.8.0. For the list of enhancements in the Cluster release 5.15.0 and Cluster release 6.14.0 that are supported by the Container Cloud release 2.8.0, see the 5.15.0 and 6.14.0 sections.
Updated notification about outdated cluster version in web UI
LoadBalancer and ProviderInstance monitoring for cluster and machine statuses
Updated the Keycloak major version from 9.0 to 12.0. For the list of highlights and enhancements, see Official Keycloak documentation.
TECHNOLOGY PREVIEW
Implemented the possibility to collect logs of the syslog container that runs in the Ironic pod on the bare metal bootstrap, management, and managed clusters.
You can collect Ironic pod logs using the standard Container Cloud
container-cloud collect logs command. The output is located in
/objects/namespaced/<namespaceName>/core/pods/<ironicPodId>/syslog.log.
To simplify operations with logs, the syslog container generates output
in the JSON format.
Note
Logs collected by the syslog container during the bootstrap phase
are not transferred to the management cluster during pivoting.
These logs are located in
/volume/log/ironic/ansible_conductor.log inside the Ironic pod.
Improved monitoring of the cluster and machine live statuses in the Container Cloud web UI:
Added the
LoadBalancerandProviderInstancefields.Added the
providerInstanceStatefield for an AWS machine status that includes the AWS VM ID, state, and readiness. The analogous fieldsinstanceStateandinstanceIDare deprecated as of Container Cloud 2.8.0 and will be removed in one of the following releases. For details, see Deprecation Notes.
Updated the notification about outdated cluster version in the Container Cloud web UI. Now, you will be notified about any outdated managed cluster that must be updated to unblock the upgrade of the management cluster and Container Cloud to the latest version.
Caution
Make sure to update the Cluster release version of your managed cluster before the current Cluster release version becomes unsupported by a new Container Cloud release version. Otherwise, Container Cloud stops auto-upgrade and eventually Container Cloud itself becomes unsupported.
Learn more
The following issues have been addressed in the Mirantis Container Cloud release 2.8.0 along with the Cluster release 5.15.0:
[12723] [Ceph] Fixed the issue with the
ceph_role_monandceph_role_mgrlabels remaining after deletion of a node fromKaaSCephCluster.[13381] [LCM] Fixed the issue with requests to
apiserverfailing after bootstrap on the management and regional clusters with enabled proxy.[13402] [LCM] Fixed the issue with the cluster failing with the no space left on device error due to an excessive amount of core dumps produced by applications that fail frequently.
Note
The issue is addressed only for new clusters created using Container Cloud 2.8.0. To workaround the issue on existing clusters created using the Container Cloud version below 2.8.0, see LCM known issues: 13402.
This section lists known issues with workarounds for the Mirantis Container Cloud release 2.8.0 including the Cluster release 5.15.0 and 6.14.0.
Note
This section also outlines still valid known issues from previous Container Cloud releases.
Fixed in the Cluster release 7.0.0
Note
The issue below affects only the Kubernetes 1.18 deployments. Moving forward, the workaround for this issue will be moved from Release Notes to Troubleshooting Guide.
On a management cluster with multiple AWS-based managed
clusters, some clusters fail to complete the deployments that require
persistent volumes (PVs), for example, Elasticsearch.
Some of the affected pods get stuck in the Pending state
with the pod has unbound immediate PersistentVolumeClaims and
node(s) had volume node affinity conflict errors.
Warning
The workaround below applies to HA deployments where data can be rebuilt from replicas. If you have a non-HA deployment, back up any existing data before proceeding, since all data will be lost while applying the workaround.
Workaround:
Obtain the persistent volume claims related to the storage mounts of the affected pods:
kubectl get pod/<pod_name1> pod/<pod_name2> \ -o jsonpath='{.spec.volumes[?(@.persistentVolumeClaim)].persistentVolumeClaim.claimName}'
Note
In the command above and in the subsequent steps, substitute the parameters enclosed in angle brackets with the corresponding values.
Delete the affected
PodsandPersistentVolumeClaimsto reschedule them: For example, for StackLight:kubectl -n stacklight delete \ pod/<pod_name1> pod/<pod_name2> ... pvc/<pvc_name2> pvc/<pvc_name2> ...
Fixed in 2.11.0
A load balancer virtual IP address (VIP) is assigned to each manager
node on any type of the vSphere-based cluster. The issue occurs because
the Keepalived instances cannot set up a cluster due to the blocked
vrrp protocol traffic in the firewall configuration on the Container Cloud
nodes.
Note
Before applying the workaround below, verify that the dedicated
vSphere network does not have any other virtual machines with the
keepalived instance running with the same vrouter_id.
You can verify the vrouter_id value of the cluster
in /etc/keepalived/keepalived.conf on the manager nodes.
Workaround
Update the firewalld configuration on each manager node of the affected
cluster to allow the vrrp protocol traffic between the nodes:
SSH to any manager node using
mcc-user.Apply the
firewalldconfiguration:firewall-cmd --add-rich-rule='rule protocol value="vrrp" accept' --permanent firewall-cmd --reload
Apply the procedure to the remaining manager nodes of the cluster.
Note
Moving forward, the workaround for this issue will be moved from Release Notes to Troubleshooting Guide.
A vSphere-based management cluster bootstrap fails due to a node leaving the cluster after an accidental IP address change.
The issue may affect a vSphere-based cluster only when IPAM is not enabled and IP addresses assignment to the vSphere virtual machines is done by a DHCP server present in the vSphere network.
By default, a DHCP server keeps lease of the IP address for 30 minutes.
Usually, a VM dhclient prolongs such lease by frequent DHCP requests
to the server before the lease period ends.
The DHCP prolongation request period is always less than the default lease time
on the DHCP server, so prolongation usually works.
But in case of network issues, for example, when dhclient from the
VM cannot reach the DHCP server, or the VM is being slowly powered on
for more than the lease time, such VM may lose its assigned IP address.
As a result, it obtains a new IP address.
Container Cloud does not support network reconfiguration after the IP of the VM has been changed. Therefore, such issue may lead to a VM leaving the cluster.
Symptoms:
One of the nodes is in the
NodeNotReadyordownstate:kubectl get nodes -o wide docker node ls
The UCP Swarm manager logs on the healthy manager node contain the following example error:
docker logs -f ucp-swarm-manager level=debug msg="Engine refresh failed" id="<docker node ID>|<node IP>: 12376"
If the affected node is manager:
The output of the docker info command contains the following example error:
Error: rpc error: code = Unknown desc = The swarm does not have a leader. \ It's possible that too few managers are online. \ Make sure more than half of the managers are online.
The UCP controller logs contain the following example error:
docker logs -f ucp-controller "warning","msg":"Node State Active check error: \ Swarm Mode Manager health check error: \ info: Cannot connect to the Docker daemon at tcp://<node IP>:12376. \ Is the docker daemon running?
On the affected node, the IP address on the first interface
eth0does not match the IP address configured in Docker. Verify theNode Addressfield in the output of the docker info command.The following lines are present in
/var/log/messages:dhclient[<pid>]: bound to <node IP> -- renewal in 1530 seconds
If there are several lines where the IP is different, the node is affected.
Workaround:
Select from the following options:
Bind IP addresses for all machines to their MAC addresses on the DHCP server for the dedicated vSphere network. In this case, VMs receive only specified IP addresses that never change.
Remove the Container Cloud node IPs from the IP range on the DHCP server for the dedicated vSphere network and configure the first interface
eth0on VMs with a static IP address.If a managed cluster is affected, redeploy it with IPAM enabled for new machines to be created and IPs to be assigned properly.
Fixed in 2.9.0 for new clusters
Newly created pods may fail to run and have the CrashLoopBackOff status
on long-living Container Cloud clusters deployed on RHEL 7.8 using the VMware
vSphere provider. The following is an example output of the
kubectl describe pod <pod-name> -n <projectName> command:
State: Waiting
Reason: CrashLoopBackOff
Last State: Terminated
Reason: ContainerCannotRun
Message: OCI runtime create failed: container_linux.go:349:
starting container process caused "process_linux.go:297:
applying cgroup configuration for process caused
"mkdir /sys/fs/cgroup/memory/kubepods/burstable/<pod-id>/<container-id>>:
cannot allocate memory": unknown
The issue occurs due to the Kubernetes and Docker community issues.
According to the RedHat solution,
the workaround is to disable the kernel memory accounting feature
by appending cgroup.memory=nokmem to the kernel command line.
Note
The workaround below applies to the existing clusters only. The issue is resolved for new Container Cloud 2.9.0 deployments since the workaround below automatically applies to the VM template built during the vSphere-based management cluster bootstrap.
Apply the following workaround on each machine of the affected cluster.
Workaround
SSH to any machine of the affected cluster using
mcc-userand the SSH key provided during the cluster creation to proceed as therootuser.In
/etc/default/grub, setcgroup.memory=nokmemforGRUB_CMDLINE_LINUX.Update kernel:
yum install kernel kernel-headers kernel-tools kernel-tools-libs kexec-tools
Update the grub configuration:
grub2-mkconfig -o /boot/grub2/grub.cfg
Reboot the machine.
Wait for the machine to become available.
Wait for 5 minutes for Docker and Kubernetes services to start.
Verify that the machine is
Ready:docker node ls kubectl get nodes
Repeat the steps above on the remaining machines of the affected cluster.
An OpenStack-based regional cluster cleanup fails with the timeout error.
Workaround:
Wait for the
Clusterobject to be deleted in the bootstrap cluster:kubectl --kubeconfig <(./bin/kind get kubeconfig --name clusterapi) get cluster
The system output must be empty.
Remove the bootstrap cluster manually:
./bin/kind delete cluster --name clusterapi
Fixed in 2.11.0
If an L2 template is configured incorrectly, a bare metal cluster is deployed
successfully but with the runtime errors in the IpamHost object.
Workaround:
If you suspect that the machine is not working properly because
of incorrect network configuration, verify the status of the corresponding
IpamHost object. Inspect the l2RenderResult and ipAllocationResult
object fields for error messages.
Fixed in 2.9.0
If manageOsds is enabled in the pre-deployment KaaSCephCluster
template, the bare metal management or managed cluster fails to deploy
due to the CephCluster creation failure.
As a workaround, disable manageOsds in the KaaSCephCluster
template before the cluster deployment.
You can enable this parameter after deployment as described in
Ceph advanced configuration.
Fixed in 2.11.0
If you use a custom BareMetalHostProfile, after disk replacement
on a Ceph OSD, the Ceph OSD pod switches to the CrashLoopBackOff state
due to the Ceph OSD authorization key failing to be created properly.
Workaround:
Export
kubeconfigof your managed cluster. For example:export KUBECONFIG=~/Downloads/kubeconfig-test-cluster.yml
Log in to the
ceph-toolspod:kubectl -n rook-ceph exec -it $(kubectl -n rook-ceph get pod -l "app=rook-ceph-tools" -o jsonpath='{.items[0].metadata.name}') bash
Delete the authorization key for the failed Ceph OSD:
ceph auth del osd.<ID>
SSH to the node on which the Ceph OSD cannot be created.
Clean up the disk that will be a base for the failed Ceph OSD. For details, see official Rook documentation.
Note
Ignore failures of the sgdisk --zap-all $DISK and blkdiscard $DISK commands if any.
On the managed cluster, restart Rook Operator:
kubectl -n rook-ceph delete pod -l app=rook-ceph-operator
Fixed in 2.12.0
The MariaDB pods fail to start after MariaDB blocks itself during the State Snapshot Transfers sync.
Workaround:
Verify the failed pod readiness:
kubectl describe pod -n kaas <failedMariadbPodName>
If the readiness probe failed with the WSREP not synced message, proceed to the next step. Otherwise, assess the MariaDB pod logs to identify the failure root cause.
Obtain the MariaDB admin password:
kubectl get secret -n kaas mariadb-dbadmin-password -o jsonpath='{.data.MYSQL_DBADMIN_PASSWORD}' | base64 -d ; echo
Verify that
wsrep_local_state_commentisDonororDesynced:kubectl exec -it -n kaas <failedMariadbPodName> -- mysql -uroot -p<mariadbAdminPassword> -e "SHOW status LIKE \"wsrep_local_state_comment\";"
Restart the failed pod:
kubectl delete pod -n kaas <failedMariadbPodName>
Fixed in 2.8.0 for new clusters and in 2.10.0 for existing clusters
If an application running on a Container Cloud management or managed cluster fails frequently, for example, PostgreSQL, it may produce an excessive amount of core dumps. This leads to the no space left on device error on the cluster nodes and, as a result, to the broken Docker Swarm and the entire cluster.
Core dumps are disabled by default on the operating system of the Container Cloud nodes. But since Docker does not inherit the operating system settings, disable core dumps in Docker using the workaround below.
Warning
The workaround below does not apply to the baremetal-based clusters, including MOS deployments, since Docker restart may destroy the Ceph cluster.
Workaround:
SSH to any machine of the affected cluster using
mcc-userand the SSH key provided during the cluster creation.In
/etc/docker/daemon.json, add the following parameters:{ ... "default-ulimits": { "core": { "Hard": 0, "Name": "core", "Soft": 0 } } }
Restart the Docker daemon:
systemctl restart docker
Repeat the steps above on each machine of the affected cluster one by one.
Fixed in 2.11.0
During update of a managed cluster from the Cluster releases 6.12.0 to 6.14.0, the LCM Agent upgrade fails with the following error in logs:
lcmAgentUpgradeStatus:
error: 'failed to download agent binary: Get https://<mcc-cache-address>/bin/lcm/bin/lcm-agent/v0.2.0-289-gd7e9fa9c/lcm-agent:
x509: certificate signed by unknown authority'
Only clusters initially deployed using Container Cloud 2.4.0 or earlier are affected.
As a workaround, restart lcm-agent using the
service lcm-agent-* restart command on the affected nodes.
Note
The issue affects only Helm v2 releases and is addressed for Helm v3. Starting from Container Cloud 2.19.0, all Helm releases are switched to v3.
During a management, regional, or managed cluster deployment,
Helm releases may get stuck in the FAILED or UNKNOWN state
although the corresponding machines statuses are Ready
in the Container Cloud web UI. For example, if the StackLight Helm release
fails, the links to its endpoints are grayed out in the web UI.
In the cluster status, providerStatus.helm.ready and
providerStatus.helm.releaseStatuses.<releaseName>.success are false.
HelmBundle cannot recover from such states and requires manual actions.
The workaround below describes the recovery steps for the stacklight
release that got stuck during a cluster deployment.
Use this procedure as an example for other Helm releases as required.
Workaround:
Verify the failed release has the
UNKNOWNorFAILEDstatus in the HelmBundle object:kubectl --kubeconfig <regionalClusterKubeconfigPath> get helmbundle <clusterName> -n <clusterProjectName> -o=jsonpath={.status.releaseStatuses.stacklight} In the command above and in the steps below, replace the parameters enclosed in angle brackets with the corresponding values of your cluster.
Example of system response:
stacklight: attempt: 2 chart: "" finishedAt: "2021-02-05T09:41:05Z" hash: e314df5061bd238ac5f060effdb55e5b47948a99460c02c2211ba7cb9aadd623 message: '[{"occurrence":1,"lastOccurrenceDate":"2021-02-05 09:41:05","content":"error updating the release: rpc error: code = Unknown desc = customresourcedefinitions.apiextensions.k8s.io \"helmbundles.lcm.mirantis.com\" already exists"}]' notes: "" status: UNKNOWN success: false version: 0.1.2-mcp-398
Log in to the
helm-controllerpod console:kubectl --kubeconfig <affectedClusterKubeconfigPath> exec -n kube-system -it helm-controller-0 sh -c tiller
Download the Helm v3 binary. For details, see official Helm documentation.
Remove the failed release:
helm delete <failed-release-name>
For example:
helm delete stacklight
Once done, the release triggers for redeployment.
Fixed in 2.10.0
A managed cluster deployed or updated on a regional cluster of another provider type may display inaccurate Nodes readiness live status in the Container Cloud web UI. While all nodes are ready, the Nodes status indicates that some nodes are still not ready.
The issue occurs due to the cordon-drain desynchronization between
the LCMClusterState objects and the actual state of the cluster.
Note
The workaround below must be applied only by users with
the writer or cluster-admin access role
assigned by the Infrastructure Operator.
To verify that the cluster is affected:
Export the regional cluster
kubeconfigcreated during the regional cluster deployment:export KUBECONFIG=<PathToRegionalClusterKubeconfig>
Verify that all Kubernetes nodes of the affected managed cluster are in the
readystate:kubectl --kubeconfig <managedClusterKubeconfigPath> get nodes
Verify that all Swarm nodes of the managed cluster are in the
readystate:ssh -i <sshPrivateKey> root@<controlPlaneNodeIP> docker node ls
Replace the parameters enclosed in angle brackets with the SSH key that was used for the managed cluster deployment and the private IP address of any control plane node of the cluster.
If the status of the Kubernetes and Swarm nodes is
ready, proceed with the next steps. Otherwise, assess the cluster logs to identify the issue with not ready nodes.Obtain the
LCMClusterStateitems related to theswarm-drainandcordon-draintype:kubectl get lcmlusterstates -n <managedClusterProjectName>
The command above outputs the list of all
LCMClusterStateitems. Verify only theLCMClusterStateitems names that start with theswarm-drain-andcordon-drain-prefix.Verify the status of each
LCMClusterStateitem of theswarm-drainandcordon-draintype:kubectl -n <clusterProjectName> get lcmlusterstates <lcmlusterstatesItemNameOfSwarmDrainOrCordonDrainType> -o=yaml
Example of system response extract for the
LCMClusterStateitems of thecordon-draintype:spec: arg: kaas-node-4c026e7a-8acd-48b2-bf5c-cdeaf99d812f clusterName: test-child-namespace type: cordon-drain value: "false" status: attempt: 0 value: "false"
Example of system response extract for the
LCMClusterStateitems of theswarm-draintype:spec: arg: kaas-node-4c026e7a-8acd-48b2-bf5c-cdeaf99d812f clusterName: test-child-namespace type: swarm-drain value: "true" status: attempt: 334 message: 'Error: waiting for kubernetes node kaas-node-4c026e7a-8acd-48b2-bf5c-cdeaf99d812f to be drained first'
The cluster is affected if:
For
cordon-drain,spec.valueandstatus.valueare"false"For
swarm-drain,spec.valueis"true"and thestatus.messagecontains an error related to waiting for the Kubernetes cordon-drain to finish
Workaround:
For each LCMClusterState item of the swarm-drain type with
spec.value == "true" and the status.message described above,
replace "true" with "false" in spec.value:
kubectl -n <clusterProjectName> edit lcmclusterstate <lcmlusterstatesItemNameOfSwarmDrainType>
After upgrade of Container Cloud from 2.6.0 to 2.7.0, the local
volume provisioner pod in the default project is stuck in the
Terminating status, even after upgrade to 2.8.0.
This issue does not affect functioning of the management, regional, or managed clusters. The issue does not prevent the successful upgrade of the cluster.
Workaround:
Verify that the cluster is affected:
kubectl get pods -n default | grep local-volume-provisioner
If the output contains a pod with the
Terminatingstatus, the cluster is affected.Capture the affected pod name, if any.
Delete the affected pod:
kuebctl -n default delete pod <LVPPodName> --force
Helm releases may get stuck in the PENDING_UPGRADE status
during a management or managed cluster upgrade. The HelmBundle Controller
cannot recover from this state and requires manual actions. The workaround
below describes the recovery process for the openstack-operator release
that stuck during a managed cluster update. Use it as an example for other
Helm releases as required.
Workaround:
Log in to the
helm-controllerpod console:kubectl exec -n kube-system -it helm-controller-0 sh -c tiller
Identify the release that stuck in the
PENDING_UPGRADEstatus. For example:./helm --host=localhost:44134 history openstack-operator
Example of system response:
REVISION UPDATED STATUS CHART DESCRIPTION 1 Tue Dec 15 12:30:41 2020 SUPERSEDED openstack-operator-0.3.9 Install complete 2 Tue Dec 15 12:32:05 2020 SUPERSEDED openstack-operator-0.3.9 Upgrade complete 3 Tue Dec 15 16:24:47 2020 PENDING_UPGRADE openstack-operator-0.3.18 Preparing upgrade
Roll back the failed release to the previous revision:
Download the Helm v3 binary. For details, see official Helm documentation.
Roll back the failed release:
helm rollback <failed-release-name>
For example:
helm rollback openstack-operator 2
Once done, the release will be reconciled.
Fixed in 2.10.0
A managed cluster release upgrade may fail due to DNS issues on pods with host networking. If this is the case, the DNS names of the Kubernetes services on the affected pod cannot be resolved.
Workaround:
Export kubeconfig of the affected managed cluster. For example:
export KUBECONFIG=~/Downloads/kubeconfig-test-cluster.yml
Identify any existing pod with host networking. For example,
tf-config-xxxxxx:kubectl get pods -n tf -l app=tf-config
Verify the DNS names resolution of the Kubernetes services from this pod. For example:
kubectl -n tf exec -it tf-config-vl4mh -c svc-monitor -- curl -k https://kubernetes.default.svc
The system output must not contain DNS errors.
If the DNS name cannot be resolved, restart all
calico-nodepods:kubectl delete pods -l k8s-app=calico-node -n kube-system
Affects only Container Cloud 2.18.0 and earlier
A project that is newly created in the Container Cloud web UI does not display in the Projects list even after refreshing the page. The issue occurs due to the token missing the necessary role for the new project. As a workaround, relogin to the Container Cloud web UI.
The following table lists the major components and their versions of the Mirantis Container Cloud release 2.8.0.
Note
The components that are newly added, updated, deprecated, or removed
as compared to the previous release version, are marked
with a corresponding superscript,
for example, lcm-ansible Updated.
Component |
Application/Service |
Version |
|---|---|---|
AWS Updated |
aws-provider |
1.20.2 |
aws-credentials-controller |
1.20.2 |
|
Bare metal |
baremetal-operator Updated |
4.1.3 |
baremetal-public-api Updated |
4.1.3 |
|
baremetal-provider Updated |
1.20.2 |
|
httpd |
1.18.0 |
|
ironic Updated |
victoria-bionic-20210408180013 |
|
ironic-operator Updated |
base-bionic-20210409133604 |
|
kaas-ipam Updated |
base-bionic-20210427213631 |
|
local-volume-provisioner |
1.0.5-mcp |
|
mariadb |
10.4.17-bionic-20210203155435 |
|
IAM |
iam Updated |
2.3.2 |
iam-controller Updated |
1.20.2 |
|
keycloak |
12.0.0 |
|
Container Cloud Updated |
admission-controller |
1.20.2 |
byo-credentials-controller |
1.20.2 |
|
byo-provider |
1.20.2 |
|
kaas-public-api |
1.20.2 |
|
kaas-exporter |
1.20.2 |
|
kaas-ui |
1.20.2 |
|
lcm-controller |
0.2.0-327-g5676f4e3 |
|
mcc-cache |
1.20.2 |
|
proxy-controller |
1.20.2 |
|
release-controller |
1.20.2 |
|
rhellicense-controller |
1.20.2 |
|
squid-proxy |
0.0.1-3 |
|
OpenStack Updated |
openstack-provider |
1.20.2 |
os-credentials-controller |
1.20.2 |
|
VMware vSphere Updated |
vsphere-provider |
1.20.2 |
vsphere-credentials-controller |
1.20.2 |
This section lists the components artifacts of the Mirantis Container Cloud release 2.8.0.
Note
The components that are newly added, updated, deprecated, or removed
as compared to the previous release version, are marked
with a corresponding superscript,
for example, lcm-ansible Updated.
Artifact |
Component |
Path |
|---|---|---|
Binaries |
baremetal-operator Updated |
https://binary.mirantis.com/bm/helm/baremetal-operator-4.1.3.tgz |
baremetal-public-api Updated |
https://binary.mirantis.com/bm/helm/baremetal-public-api-4.1.3.tgz |
|
ironic-python-agent-bionic.kernel |
https://binary.mirantis.com/bm/bin/ironic/ipa/ubuntu/kernel-victoria-bionic-debug-20210226182519 |
|
ironic-python-agent-bionic.initramfs |
https://binary.mirantis.com/bm/bin/ironic/ipa/ubuntu/initramfs-victoria-bionic-debug-20210226182519 |
|
kaas-ipam Updated |
||
local-volume-provisioner |
https://binary.mirantis.com/bm/helm/local-volume-provisioner-1.0.5-mcp.tgz |
|
Docker images |
baremetal-operator |
mirantis.azurecr.io/bm/baremetal-operator:base-bionic-20210317164614 |
httpd |
mirantis.azurecr.io/lcm/nginx:1.18.0 |
|
ironic Updated |
mirantis.azurecr.io/openstack/ironic:victoria-bionic-20210408180013 |
|
ironic-inspector Updated |
mirantis.azurecr.io/openstack/ironic-inspector:victoria-bionic-20210408180013 |
|
ironic-operator Updated |
mirantis.azurecr.io/bm/ironic-operator:base-bionic-20210409133604 |
|
kaas-ipam Updated |
mirantis.azurecr.io/bm/kaas-ipam:base-bionic-20210427213631 |
|
mariadb |
mirantis.azurecr.io/general/mariadb:10.4.17-bionic-20210203155435 |
Artifact |
Component |
Path |
|---|---|---|
Bootstrap tarball Updated |
bootstrap-linux |
https://binary.mirantis.com/core/bin/bootstrap-linux-1.20.2.tar.gz |
bootstrap-darwin |
https://binary.mirantis.com/core/bin/bootstrap-darwin-1.20.2.tar.gz |
|
Helm charts Updated |
admission-controller |
https://binary.mirantis.com/core/helm/admission-controller-1.20.2.tgz |
aws-credentials-controller |
https://binary.mirantis.com/core/helm/aws-credentials-controller-1.20.2.tgz |
|
aws-provider |
https://binary.mirantis.com/core/helm/aws-provider-1.20.2.tgz |
|
baremetal-provider |
https://binary.mirantis.com/core/helm/baremetal-provider-1.20.2.tgz |
|
byo-credentials-controller |
https://binary.mirantis.com/core/helm/byo-credentials-controller-1.20.2.tgz |
|
byo-provider |
https://binary.mirantis.com/core/helm/byo-provider-1.20.2.tgz |
|
iam-controller |
https://binary.mirantis.com/core/helm/iam-controller-1.20.2.tgz |
|
kaas-exporter |
https://binary.mirantis.com/core/helm/kaas-exporter-1.20.2.tgz |
|
kaas-public-api |
https://binary.mirantis.com/core/helm/kaas-public-api-1.20.2.tgz |
|
kaas-ui |
||
lcm-controller |
https://binary.mirantis.com/core/helm/lcm-controller-1.20.2.tgz |
|
mcc-cache |
||
openstack-provider |
https://binary.mirantis.com/core/helm/openstack-provider-1.20.2.tgz |
|
os-credentials-controller |
https://binary.mirantis.com/core/helm/os-credentials-controller-1.20.2.tgz |
|
proxy-controller |
https://binary.mirantis.com/core/helm/proxy-controller-1.20.2.tgz |
|
release-controller |
https://binary.mirantis.com/core/helm/release-controller-1.20.2.tgz |
|
rhellicense-controller |
https://binary.mirantis.com/core/helm/rhellicense-controller-1.20.2.tgz |
|
squid-proxy |
https://binary.mirantis.com/core/helm/squid-proxy-1.20.2.tgz |
|
vsphere-credentials-controller |
https://binary.mirantis.com/core/helm/vsphere-credentials-controller-1.20.2.tgz |
|
vsphere-provider |
https://binary.mirantis.com/core/helm/vsphere-provider-1.20.2.tgz |
|
Docker images |
admission-controller Updated |
mirantis.azurecr.io/core/admission-controller:1.20.2 |
aws-cluster-api-controller Updated |
mirantis.azurecr.io/core/aws-cluster-api-controller:1.20.2 |
|
aws-credentials-controller Updated |
mirantis.azurecr.io/core/aws-credentials-controller:1.20.2 |
|
byo-cluster-api-controller Updated |
mirantis.azurecr.io/core/byo-cluster-api-controller:1.20.2 |
|
byo-credentials-controller Updated |
mirantis.azurecr.io/core/byo-credentials-controller:1.20.2 |
|
cluster-api-provider-baremetal Updated |
mirantis.azurecr.io/core/cluster-api-provider-baremetal:1.20.2 |
|
frontend Updated |
mirantis.azurecr.io/core/frontend:1.20.2 |
|
iam-controller Updated |
mirantis.azurecr.io/core/iam-controller:1.20.2 |
|
kproxy Updated |
mirantis.azurecr.io/lcm/kproxy:1.20.2 |
|
lcm-controller Updated |
mirantis.azurecr.io/core/lcm-controller:v0.2.0-327-g5676f4e3 |
|
nginx |
mirantis.azurecr.io/lcm/nginx:1.18.0 |
|
openstack-cluster-api-controller Updated |
mirantis.azurecr.io/core/openstack-cluster-api-controller:1.20.2 |
|
os-credentials-controller Updated |
mirantis.azurecr.io/core/os-credentials-controller:1.20.2 |
|
registry |
mirantis.azurecr.io/lcm/registry:2.7.1 |
|
release-controller Updated |
mirantis.azurecr.io/core/release-controller:1.20.2 |
|
rhellicense-controller Updated |
mirantis.azurecr.io/core/rhellicense-controller:1.20.2 |
|
squid-proxy Updated |
mirantis.azurecr.io/core/squid-proxy:0.0.1-3 |
|
vsphere-cluster-api-controller Updated |
mirantis.azurecr.io/core/vsphere-api-controller:1.20.2 |
|
vsphere-credentials-controller Updated |
mirantis.azurecr.io/core/vsphere-credentials-controller:1.20.2 |
Artifact |
Component |
Path |
|---|---|---|
Binaries |
hash-generate-linux |
http://binary.mirantis.com/iam/bin/hash-generate-0.0.1-268-3cf7f17-linux |
hash-generate-darwin |
http://binary.mirantis.com/iam/bin/hash-generate-0.0.1-268-3cf7f17-darwin |
|
iamctl-linux Updated |
||
iamctl-darwin Updated |
||
iamctl-windows Updated |
||
Helm charts Updated |
iam |
|
iam-proxy |
||
keycloak-proxy Updated |
http://binary.mirantis.com/core/helm/keycloak_proxy-1.20.2.tgz |
|
Docker images |
api Updated |
mirantis.azurecr.io/iam/api:0.5.1 |
auxiliary Updated |
mirantis.azurecr.io/iam/auxiliary:0.5.1 |
|
kubernetes-entrypoint Updated |
mirantis.azurecr.io/openstack/extra/kubernetes-entrypoint:v1.0.0-20200311160233 |
|
mariadb |
mirantis.azurecr.io/general/mariadb:10.4.16-bionic-20201105025052 |
|
keycloak |
mirantis.azurecr.io/iam/keycloak:0.4.0 |
|
keycloak-gatekeeper |
mirantis.azurecr.io/iam/keycloak-gatekeeper:6.0.1 |
See also
The Mirantis Container Cloud GA release 2.7.0:
Introduces support for the Cluster release 5.14.0 that is based on Kubernetes 1.18, Mirantis Container Runtime 19.03.14, and Mirantis Kubernetes Engine 3.3.6.
Supports the Cluster release 6.14.0 that is based on the Cluster release 5.14.0 and represents Mirantis OpenStack for Kubernetes (MOS) 21.2.
Supports deprecated Cluster releases 5.13.0 and 6.12.0 that will become unsupported in one of the following Container Cloud releases.
Supports the Cluster release 5.11.0 only for attachment of existing MKE 3.3.4 clusters. For the deployment of new or attachment of existing MKE 3.3.6 clusters, the latest available Cluster release is used.
Caution
Make sure to update the Cluster release version of your managed cluster before the current Cluster release version becomes unsupported by a new Container Cloud release version. Otherwise, Container Cloud stops auto-upgrade and eventually Container Cloud itself becomes unsupported.
This section outlines release notes for the Container Cloud release 2.7.0.
This section outlines new features and enhancements introduced in the Mirantis Container Cloud release 2.7.0. For the list of enhancements in the Cluster release 5.14.0 and Cluster release 6.14.0 that are supported by the Container Cloud release 2.7.0, see the 5.14.0 and 6.14.0 sections.
Introduced general availability support for the VMware vSphere provider after completing full integration of the vSphere provider on RHEL with Container Cloud.
During the Container Cloud 2.6.0 - 2.7.0 release cycle, added the following improvements:
Removed the StackLight limitations
Completed the integration of proxy support for the vSphere-based managed clusters
Completed the integration of the non-DHCP support for regional clusters
Addressed a number of critical and major issues
Implemented a universal SSH user mcc-user to replace the existing
default SSH user names. The mcc-user user name is applicable
to any Container Cloud provider and node type, including Bastion.
The existing SSH user names are deprecated as of Container Cloud 2.7.0.
SSH keys will be managed only for mcc-user as of one of the following
Container Cloud releases.
Implemented the possibility to configure SSH keys on existing clusters using the Container Cloud web UI. You can now add or remove SSH keys on running managed clusters using the Configure cluster web UI menu.
After the update of your Cluster release to the latest version supported by 2.7.0 for the OpenStack and AWS-based managed clusters, a one-time redeployment of the Bastion node is required to apply the first configuration change of SSH keys. For this purpose, the Allow Bastion Redeploy one-time check box is added to the Configure Cluster wizard in the Container Cloud web UI.
Note
After the Bastion node redeploys on the AWS-based clusters, its public IP address changes.
Implemented the possibility to monitor live status of a cluster and machine deployment or update using the Container Cloud web UI. You can now follow the deployment readiness and health of essential cluster components, such as Helm, Kubernetes, kubelet, Swarm, OIDC, StackLight, and others. For machines, you can monitor nodes readiness reported by kubelet and nodes health reported by Swarm.
Learn more
Extended the Container Cloud web UI with the parameters that enable proxy access on managed clusters for the remaining cloud providers: vSphere, AWS, and bare metal.
The following issues have been addressed in the Mirantis Container Cloud release 2.7.0 along with the Cluster releases 5.14.0 and 6.14.0:
[13176] [vSphere] Fixed the issue with the cluster network settings related to IPAM disappearing from the cluster provider spec and leading to invalid metadata provided to virtual machines.
[12683] [vSphere] Fixed the issue with the
kaas-ipampods being installed and continuously restarted even if IPAM was disabled on the vSphere-based regional cluster deployed on top of an AWS-based management cluster.
[12305] [Ceph] Fixed the issue with inability to define the CRUSH map rules through the
KaaSCephClustercustom resource. For details, see Operations Guide: Ceph advanced configuration.[10060] [Ceph] Fixed the issue with a Ceph OSD node removal not being triggered properly and failing after updating the
KaasCephClustercustom resource (CR).
[13078] [StackLight] Fixed the issue with Elasticsearch not receiving data from Fluentd due to the limit of open index shards per node.
This section lists known issues with workarounds for the Mirantis Container Cloud release 2.7.0 including the Cluster release 5.14.0 and 6.14.0.
Note
This section also outlines still valid known issues from previous Container Cloud releases.
Fixed in the Cluster release 7.0.0
Note
The issue below affects only the Kubernetes 1.18 deployments. Moving forward, the workaround for this issue will be moved from Release Notes to Troubleshooting Guide.
On a management cluster with multiple AWS-based managed
clusters, some clusters fail to complete the deployments that require
persistent volumes (PVs), for example, Elasticsearch.
Some of the affected pods get stuck in the Pending state
with the pod has unbound immediate PersistentVolumeClaims and
node(s) had volume node affinity conflict errors.
Warning
The workaround below applies to HA deployments where data can be rebuilt from replicas. If you have a non-HA deployment, back up any existing data before proceeding, since all data will be lost while applying the workaround.
Workaround:
Obtain the persistent volume claims related to the storage mounts of the affected pods:
kubectl get pod/<pod_name1> pod/<pod_name2> \ -o jsonpath='{.spec.volumes[?(@.persistentVolumeClaim)].persistentVolumeClaim.claimName}'
Note
In the command above and in the subsequent steps, substitute the parameters enclosed in angle brackets with the corresponding values.
Delete the affected
PodsandPersistentVolumeClaimsto reschedule them: For example, for StackLight:kubectl -n stacklight delete \ pod/<pod_name1> pod/<pod_name2> ... pvc/<pvc_name2> pvc/<pvc_name2> ...
Fixed in 2.9.0 for new clusters
Newly created pods may fail to run and have the CrashLoopBackOff status
on long-living Container Cloud clusters deployed on RHEL 7.8 using the VMware
vSphere provider. The following is an example output of the
kubectl describe pod <pod-name> -n <projectName> command:
State: Waiting
Reason: CrashLoopBackOff
Last State: Terminated
Reason: ContainerCannotRun
Message: OCI runtime create failed: container_linux.go:349:
starting container process caused "process_linux.go:297:
applying cgroup configuration for process caused
"mkdir /sys/fs/cgroup/memory/kubepods/burstable/<pod-id>/<container-id>>:
cannot allocate memory": unknown
The issue occurs due to the Kubernetes and Docker community issues.
According to the RedHat solution,
the workaround is to disable the kernel memory accounting feature
by appending cgroup.memory=nokmem to the kernel command line.
Note
The workaround below applies to the existing clusters only. The issue is resolved for new Container Cloud 2.9.0 deployments since the workaround below automatically applies to the VM template built during the vSphere-based management cluster bootstrap.
Apply the following workaround on each machine of the affected cluster.
Workaround
SSH to any machine of the affected cluster using
mcc-userand the SSH key provided during the cluster creation to proceed as therootuser.In
/etc/default/grub, setcgroup.memory=nokmemforGRUB_CMDLINE_LINUX.Update kernel:
yum install kernel kernel-headers kernel-tools kernel-tools-libs kexec-tools
Update the grub configuration:
grub2-mkconfig -o /boot/grub2/grub.cfg
Reboot the machine.
Wait for the machine to become available.
Wait for 5 minutes for Docker and Kubernetes services to start.
Verify that the machine is
Ready:docker node ls kubectl get nodes
Repeat the steps above on the remaining machines of the affected cluster.
An OpenStack-based regional cluster cleanup fails with the timeout error.
Workaround:
Wait for the
Clusterobject to be deleted in the bootstrap cluster:kubectl --kubeconfig <(./bin/kind get kubeconfig --name clusterapi) get cluster
The system output must be empty.
Remove the bootstrap cluster manually:
./bin/kind delete cluster --name clusterapi
Fixed in 2.11.0
If an L2 template is configured incorrectly, a bare metal cluster is deployed
successfully but with the runtime errors in the IpamHost object.
Workaround:
If you suspect that the machine is not working properly because
of incorrect network configuration, verify the status of the corresponding
IpamHost object. Inspect the l2RenderResult and ipAllocationResult
object fields for error messages.
When removing a worker node, it is not possible to automatically remove a Ceph node. The workaround is to manually remove the Ceph node from the Ceph cluster as described in Operations Guide: Add, remove, or reconfigure Ceph nodes before removing the worker node from your deployment.
Fixed in 2.11.0
If you use a custom BareMetalHostProfile, after disk replacement
on a Ceph OSD, the Ceph OSD pod switches to the CrashLoopBackOff state
due to the Ceph OSD authorization key failing to be created properly.
Workaround:
Export
kubeconfigof your managed cluster. For example:export KUBECONFIG=~/Downloads/kubeconfig-test-cluster.yml
Log in to the
ceph-toolspod:kubectl -n rook-ceph exec -it $(kubectl -n rook-ceph get pod -l "app=rook-ceph-tools" -o jsonpath='{.items[0].metadata.name}') bash
Delete the authorization key for the failed Ceph OSD:
ceph auth del osd.<ID>
SSH to the node on which the Ceph OSD cannot be created.
Clean up the disk that will be a base for the failed Ceph OSD. For details, see official Rook documentation.
Note
Ignore failures of the sgdisk --zap-all $DISK and blkdiscard $DISK commands if any.
On the managed cluster, restart Rook Operator:
kubectl -n rook-ceph delete pod -l app=rook-ceph-operator
Fixed in 2.8.0
The ceph_role_mon and ceph_role_mgr labels that Ceph Controller
assigns to a node during a Ceph cluster creation are not automatically
removed after deleting a node from KaaSCephCluster.
As a workaround, manually remove the labels using the following commands:
kubectl unlabel node <nodeName> ceph_role_mon
kubectl unlabel node <nodeName> ceph_role_mgr
Fixed in 2.12.0
The MariaDB pods fail to start after MariaDB blocks itself during the State Snapshot Transfers sync.
Workaround:
Verify the failed pod readiness:
kubectl describe pod -n kaas <failedMariadbPodName>
If the readiness probe failed with the WSREP not synced message, proceed to the next step. Otherwise, assess the MariaDB pod logs to identify the failure root cause.
Obtain the MariaDB admin password:
kubectl get secret -n kaas mariadb-dbadmin-password -o jsonpath='{.data.MYSQL_DBADMIN_PASSWORD}' | base64 -d ; echo
Verify that
wsrep_local_state_commentisDonororDesynced:kubectl exec -it -n kaas <failedMariadbPodName> -- mysql -uroot -p<mariadbAdminPassword> -e "SHOW status LIKE \"wsrep_local_state_comment\";"
Restart the failed pod:
kubectl delete pod -n kaas <failedMariadbPodName>
Fixed in 2.11.0
During update of a managed cluster from the Cluster releases 6.12.0 to 6.14.0, the LCM Agent upgrade fails with the following error in logs:
lcmAgentUpgradeStatus:
error: 'failed to download agent binary: Get https://<mcc-cache-address>/bin/lcm/bin/lcm-agent/v0.2.0-289-gd7e9fa9c/lcm-agent:
x509: certificate signed by unknown authority'
Only clusters initially deployed using Container Cloud 2.4.0 or earlier are affected.
As a workaround, restart lcm-agent using the
service lcm-agent-* restart command on the affected nodes.
Fixed in 2.8.0
After bootstrap, requests to apiserver fail
on the management and regional clusters with enabled proxy.
As a workaround, before running bootstrap.sh,
add the entire range of IP addresses that will be used for floating IPs
to the NO_PROXY environment variable.
Fixed in 2.8.0 for new clusters and in 2.10.0 for existing clusters
If an application running on a Container Cloud management or managed cluster fails frequently, for example, PostgreSQL, it may produce an excessive amount of core dumps. This leads to the no space left on device error on the cluster nodes and, as a result, to the broken Docker Swarm and the entire cluster.
Core dumps are disabled by default on the operating system of the Container Cloud nodes. But since Docker does not inherit the operating system settings, disable core dumps in Docker using the workaround below.
Warning
The workaround below does not apply to the baremetal-based clusters, including MOS deployments, since Docker restart may destroy the Ceph cluster.
Workaround:
SSH to any machine of the affected cluster using
mcc-userand the SSH key provided during the cluster creation.In
/etc/docker/daemon.json, add the following parameters:{ ... "default-ulimits": { "core": { "Hard": 0, "Name": "core", "Soft": 0 } } }
Restart the Docker daemon:
systemctl restart docker
Repeat the steps above on each machine of the affected cluster one by one.
On long-running Container Cloud clusters, one or more nodes may occasionally
become Not Ready with different errors in the ucp-kubelet containers
of failed nodes.
As a workaround, restart ucp-kubelet on the failed node:
ctr -n com.docker.ucp snapshot rm ucp-kubelet
docker rm -f ucp-kubelet
Note
Moving forward, the workaround for this issue will be moved from Release Notes to Troubleshooting Guide.
Note
The issue affects only Helm v2 releases and is addressed for Helm v3. Starting from Container Cloud 2.19.0, all Helm releases are switched to v3.
During a management, regional, or managed cluster deployment,
Helm releases may get stuck in the FAILED or UNKNOWN state
although the corresponding machines statuses are Ready
in the Container Cloud web UI. For example, if the StackLight Helm release
fails, the links to its endpoints are grayed out in the web UI.
In the cluster status, providerStatus.helm.ready and
providerStatus.helm.releaseStatuses.<releaseName>.success are false.
HelmBundle cannot recover from such states and requires manual actions.
The workaround below describes the recovery steps for the stacklight
release that got stuck during a cluster deployment.
Use this procedure as an example for other Helm releases as required.
Workaround:
Verify the failed release has the
UNKNOWNorFAILEDstatus in the HelmBundle object:kubectl --kubeconfig <regionalClusterKubeconfigPath> get helmbundle <clusterName> -n <clusterProjectName> -o=jsonpath={.status.releaseStatuses.stacklight} In the command above and in the steps below, replace the parameters enclosed in angle brackets with the corresponding values of your cluster.
Example of system response:
stacklight: attempt: 2 chart: "" finishedAt: "2021-02-05T09:41:05Z" hash: e314df5061bd238ac5f060effdb55e5b47948a99460c02c2211ba7cb9aadd623 message: '[{"occurrence":1,"lastOccurrenceDate":"2021-02-05 09:41:05","content":"error updating the release: rpc error: code = Unknown desc = customresourcedefinitions.apiextensions.k8s.io \"helmbundles.lcm.mirantis.com\" already exists"}]' notes: "" status: UNKNOWN success: false version: 0.1.2-mcp-398
Log in to the
helm-controllerpod console:kubectl --kubeconfig <affectedClusterKubeconfigPath> exec -n kube-system -it helm-controller-0 sh -c tiller
Download the Helm v3 binary. For details, see official Helm documentation.
Remove the failed release:
helm delete <failed-release-name>
For example:
helm delete stacklight
Once done, the release triggers for redeployment.
After upgrade of Container Cloud from 2.6.0 to 2.7.0, the local
volume provisioner pod in the default project is stuck in the
Terminating status, even after upgrade to 2.8.0.
This issue does not affect functioning of the management, regional, or managed clusters. The issue does not prevent the successful upgrade of the cluster.
Workaround:
Verify that the cluster is affected:
kubectl get pods -n default | grep local-volume-provisioner
If the output contains a pod with the
Terminatingstatus, the cluster is affected.Capture the affected pod name, if any.
Delete the affected pod:
kuebctl -n default delete pod <LVPPodName> --force
Helm releases may get stuck in the PENDING_UPGRADE status
during a management or managed cluster upgrade. The HelmBundle Controller
cannot recover from this state and requires manual actions. The workaround
below describes the recovery process for the openstack-operator release
that stuck during a managed cluster update. Use it as an example for other
Helm releases as required.
Workaround:
Log in to the
helm-controllerpod console:kubectl exec -n kube-system -it helm-controller-0 sh -c tiller
Identify the release that stuck in the
PENDING_UPGRADEstatus. For example:./helm --host=localhost:44134 history openstack-operator
Example of system response:
REVISION UPDATED STATUS CHART DESCRIPTION 1 Tue Dec 15 12:30:41 2020 SUPERSEDED openstack-operator-0.3.9 Install complete 2 Tue Dec 15 12:32:05 2020 SUPERSEDED openstack-operator-0.3.9 Upgrade complete 3 Tue Dec 15 16:24:47 2020 PENDING_UPGRADE openstack-operator-0.3.18 Preparing upgrade
Roll back the failed release to the previous revision:
Download the Helm v3 binary. For details, see official Helm documentation.
Roll back the failed release:
helm rollback <failed-release-name>
For example:
helm rollback openstack-operator 2
Once done, the release will be reconciled.
Affects only Container Cloud 2.18.0 and earlier
A project that is newly created in the Container Cloud web UI does not display in the Projects list even after refreshing the page. The issue occurs due to the token missing the necessary role for the new project. As a workaround, relogin to the Container Cloud web UI.
The following table lists the major components and their versions of the Mirantis Container Cloud release 2.7.0.
Note
The components that are newly added, updated, deprecated, or removed
as compared to the previous release version, are marked
with a corresponding superscript,
for example, lcm-ansible Updated.
Component |
Application/Service |
Version |
|---|---|---|
AWS Updated |
aws-provider |
1.19.10 |
aws-credentials-controller |
1.19.10 |
|
Bare metal |
baremetal-operator Updated |
4.0.7 |
baremetal-public-api Updated |
4.0.7 |
|
baremetal-provider Updated |
1.19.10 |
|
httpd |
1.18.0 |
|
ironic |
victoria-bionic-20210302180018 |
|
ironic-operator Updated |
base-bionic-20210326130922 |
|
kaas-ipam Updated |
base-bionic-20210329201651 |
|
local-volume-provisioner Updated |
1.0.5-mcp |
|
mariadb |
10.4.17-bionic-20210203155435 |
|
IAM |
iam Updated |
2.2.0 |
iam-controller Updated |
1.19.10 |
|
keycloak |
9.0.0 |
|
Container Cloud |
admission-controller Updated |
1.19.10 |
byo-credentials-controller Updated |
1.19.10 |
|
byo-provider Updated |
1.19.10 |
|
kaas-public-api Updated |
1.19.10 |
|
kaas-exporter Updated |
1.19.10 |
|
kaas-ui Updated |
1.19.10 |
|
lcm-controller Updated |
0.2.0-299-g32c0398a |
|
mcc-cache Updated |
1.19.10 |
|
proxy-controller Updated |
1.19.10 |
|
release-controller Updated |
1.19.10 |
|
rhellicense-controller Updated |
1.19.10 |
|
squid-proxy |
0.0.1-1 |
|
OpenStack Updated |
openstack-provider |
1.19.10 |
os-credentials-controller |
1.19.10 |
|
VMware vSphere Updated |
vsphere-provider |
1.19.10 |
vsphere-credentials-controller |
1.19.10 |
This section lists the components artifacts of the Mirantis Container Cloud release 2.7.0.
Note
The components that are newly added, updated, deprecated, or removed
as compared to the previous release version, are marked
with a corresponding superscript,
for example, lcm-ansible Updated.
Artifact |
Component |
Path |
|---|---|---|
Binaries |
baremetal-operator Updated |
https://binary.mirantis.com/bm/helm/baremetal-operator-4.0.7.tgz |
baremetal-public-api Updated |
https://binary.mirantis.com/bm/helm/baremetal-public-api-4.0.7.tgz |
|
ironic-python-agent-bionic.kernel |
https://binary.mirantis.com/bm/bin/ironic/ipa/ubuntu/kernel-victoria-bionic-debug-20210226182519 |
|
ironic-python-agent-bionic.initramfs |
https://binary.mirantis.com/bm/bin/ironic/ipa/ubuntu/initramfs-victoria-bionic-debug-20210226182519 |
|
kaas-ipam Updated |
||
local-volume-provisioner Updated |
https://binary.mirantis.com/bm/helm/local-volume-provisioner-1.0.5-mcp.tgz |
|
Docker images |
baremetal-operator Updated |
mirantis.azurecr.io/bm/baremetal-operator:base-bionic-20210317164614 |
httpd |
mirantis.azurecr.io/lcm/nginx:1.18.0 |
|
ironic |
mirantis.azurecr.io/openstack/ironic:victoria-bionic-20210302180018 |
|
ironic-inspector |
mirantis.azurecr.io/openstack/ironic-inspector:victoria-bionic-20210302180018 |
|
ironic-operator |
mirantis.azurecr.io/bm/ironic-operator:base-bionic-20210301104323 |
|
kaas-ipam Updated |
mirantis.azurecr.io/bm/kaas-ipam:base-bionic-20210329201651 |
|
mariadb |
mirantis.azurecr.io/general/mariadb:10.4.17-bionic-20210203155435 |
Artifact |
Component |
Path |
|---|---|---|
Bootstrap tarball Updated |
bootstrap-linux |
https://binary.mirantis.com/core/bin/bootstrap-linux-1.19.10.tar.gz |
bootstrap-darwin |
https://binary.mirantis.com/core/bin/bootstrap-darwin-1.19.10.tar.gz |
|
Helm charts Updated |
admission-controller |
https://binary.mirantis.com/core/helm/admission-controller-1.19.10.tgz |
aws-credentials-controller |
https://binary.mirantis.com/core/helm/aws-credentials-controller-1.19.10.tgz |
|
aws-provider |
https://binary.mirantis.com/core/helm/aws-provider-1.19.10.tgz |
|
baremetal-provider |
https://binary.mirantis.com/core/helm/baremetal-provider-1.19.10.tgz |
|
byo-credentials-controller |
https://binary.mirantis.com/core/helm/byo-credentials-controller-1.19.10.tgz |
|
byo-provider |
https://binary.mirantis.com/core/helm/byo-provider-1.19.10.tgz |
|
iam-controller |
https://binary.mirantis.com/core/helm/iam-controller-1.19.10.tgz |
|
kaas-exporter |
https://binary.mirantis.com/core/helm/kaas-exporter-1.19.10.tgz |
|
kaas-public-api |
https://binary.mirantis.com/core/helm/kaas-public-api-1.19.10.tgz |
|
kaas-ui |
||
lcm-controller |
https://binary.mirantis.com/core/helm/lcm-controller-1.19.10.tgz |
|
mcc-cache |
||
openstack-provider |
https://binary.mirantis.com/core/helm/openstack-provider-1.19.10.tgz |
|
os-credentials-controller |
https://binary.mirantis.com/core/helm/os-credentials-controller-1.19.10.tgz |
|
proxy-controller |
https://binary.mirantis.com/core/helm/proxy-controller-1.19.10.tgz |
|
release-controller |
https://binary.mirantis.com/core/helm/release-controller-1.19.10.tgz |
|
rhellicense-controller Updated |
https://binary.mirantis.com/core/helm/rhellicense-controller-1.19.10.tgz |
|
squid-proxy |
https://binary.mirantis.com/core/helm/squid-proxy-1.19.10.tgz |
|
vsphere-credentials-controller |
https://binary.mirantis.com/core/helm/vsphere-credentials-controller-1.19.10.tgz |
|
vsphere-provider |
https://binary.mirantis.com/core/helm/vsphere-provider-1.19.10.tgz |
|
Docker images |
admission-controller Updated |
mirantis.azurecr.io/core/admission-controller:1.19.10 |
aws-cluster-api-controller Updated |
mirantis.azurecr.io/core/aws-cluster-api-controller:1.19.10 |
|
aws-credentials-controller Updated |
mirantis.azurecr.io/core/aws-credentials-controller:1.19.10 |
|
byo-cluster-api-controller Updated |
mirantis.azurecr.io/core/byo-cluster-api-controller:1.19.10 |
|
byo-credentials-controller Updated |
mirantis.azurecr.io/core/byo-credentials-controller:1.19.10 |
|
cluster-api-provider-baremetal Updated |
mirantis.azurecr.io/core/cluster-api-provider-baremetal:1.19.10 |
|
frontend Updated |
mirantis.azurecr.io/core/frontend:1.19.10 |
|
iam-controller Updated |
mirantis.azurecr.io/core/iam-controller:1.19.10 |
|
kproxy Updated |
mirantis.azurecr.io/lcm/kproxy:1.19.10 |
|
lcm-controller Updated |
mirantis.azurecr.io/core/lcm-controller:v0.2.0-299-g32c0398a |
|
nginx |
mirantis.azurecr.io/lcm/nginx:1.18.0 |
|
openstack-cluster-api-controller Updated |
mirantis.azurecr.io/core/openstack-cluster-api-controller:1.19.10 |
|
os-credentials-controller Updated |
mirantis.azurecr.io/core/os-credentials-controller:1.19.10 |
|
registry |
mirantis.azurecr.io/lcm/registry:2.7.1 |
|
release-controller Updated |
mirantis.azurecr.io/core/release-controller:1.19.10 |
|
rhellicense-controller Updated |
mirantis.azurecr.io/core/rhellicense-controller:1.19.10 |
|
squid-proxy |
mirantis.azurecr.io/core/squid-proxy:0.0.1-1 |
|
vsphere-cluster-api-controller Updated |
mirantis.azurecr.io/core/vsphere-api-controller:1.19.10 |
|
vsphere-credentials-controller Updated |
mirantis.azurecr.io/core/vsphere-credentials-controller:1.19.10 |
Artifact |
Component |
Path |
|---|---|---|
Binaries |
hash-generate-linux |
http://binary.mirantis.com/iam/bin/hash-generate-0.0.1-268-3cf7f17-linux |
hash-generate-darwin |
http://binary.mirantis.com/iam/bin/hash-generate-0.0.1-268-3cf7f17-darwin |
|
iamctl-linux |
||
iamctl-darwin |
||
iamctl-windows |
||
Helm charts Updated |
iam |
|
iam-proxy |
||
keycloak-proxy Updated |
http://binary.mirantis.com/core/helm/keycloak_proxy-1.19.10.tgz |
|
Docker images |
api |
mirantis.azurecr.io/iam/api:0.4.0 |
auxiliary |
mirantis.azurecr.io/iam/auxiliary:0.4.0 |
|
kubernetes-entrypoint |
mirantis.azurecr.io/iam/external/kubernetes-entrypoint:v0.3.1 |
|
mariadb |
mirantis.azurecr.io/general/mariadb:10.4.16-bionic-20201105025052 |
|
keycloak |
mirantis.azurecr.io/iam/keycloak:0.4.0 |
|
keycloak-gatekeeper |
mirantis.azurecr.io/iam/keycloak-gatekeeper:6.0.1 |
See also
The Mirantis Container Cloud GA release 2.6.0:
Introduces support for the Cluster release 5.13.0 that is based on Kubernetes 1.18, Mirantis Container Runtime 19.03.14, and Mirantis Kubernetes Engine 3.3.6.
Supports the Cluster release 6.12.0 that is based on the Cluster release 5.12.0 and represents Mirantis OpenStack for Kubernetes (MOS) 21.1.
Still supports deprecated Cluster releases 5.12.0 and 6.10.0 that will become unsupported in one of the following Container Cloud releases.
Supports the Cluster release 5.11.0 only for attachment of existing MKE 3.3.4 clusters. For the deployment of new or attachment of existing MKE 3.3.6 clusters, the latest available Cluster release is used.
Caution
Make sure to update the Cluster release version of your managed cluster before the current Cluster release version becomes unsupported by a new Container Cloud release version. Otherwise, Container Cloud stops auto-upgrade and eventually Container Cloud itself becomes unsupported.
This section outlines release notes for the Container Cloud release 2.6.0.
This section outlines new features and enhancements introduced in the Mirantis Container Cloud release 2.6.0. For the list of enhancements in the Cluster release 5.13.0 and Cluster release 6.12.0 that are supported by the Container Cloud release 2.6.0, see the 5.13.0 and 6.12.0 sections.
Technology Preview
In the scope of Technology Preview support for the VMware vSphere cloud provider on RHEL, added an additional RHEL license activation method that uses the activation key through RedHat Customer Portal or RedHat Satellite server.
The Satellite configuration on the hosts is done by installing a specific pre-generated RPM package from the Satellite package URL provided by the user through API. The activation key is provided by the user through API.
Along with the new activation method, you can still use the existing method that is adding of your RHEL subscription with the user name and password of your RedHat Customer Portal account associated with your RHEL license for Virtual Datacenters.
Technology Preview
In the scope of Technology Preview support for the VMware vSphere cloud
provider on RHEL, added support for VMware vSphere Distributed Switch (VDS)
to provide networking to the vSphere virtual machines.
This is an alternative to the vSphere Standard Switch with network on top of
it. A VM is attached to a VDS port group. You can specify the path
to the port group using the NetworkPath parameter in
VsphereClusterProviderSpec.
Technology Preview
In the scope of Technology Preview support for the VMware vSphere cloud provider on RHEL, enabled the vSphere provider to use IPAM controller to assign IP addresses to VMs automatically, without an external DHCP server. If the IPAM controller is not enabled in the bootstrap template, the vSphere provider must rely on external provisioning of the IP addresses by a DHCP server of the user infrastructure.
Extended proxy support by enabling the feature for the remaining supported AWS and bare metal cloud providers. If you require all Internet access to go through a proxy server for security and audit purposes, you can now bootstrap management and regional clusters of any cloud provider type using proxy.
You can also enable a separate proxy access on the OpenStack-based managed clusters using the Container Cloud web UI. This proxy is intended for the end user needs and is not used for a managed cluster deployment or for access to the Mirantis resources.
Caution
Enabling of proxy access using the Container Cloud web UI for the vSphere, AWS, and baremetal-based managed clusters is on the final development stage and will become available in the next release.
Expanded and restructured the bare metal networking documentation that now contains the following subsections with a detailed description of every bare metal network type:
IPAM network
Management network
Cluster network
Host network
The following issues have been addressed in the Mirantis Container Cloud release 2.6.0 and the Cluster release 5.13.0:
[11302] [LCM] Fixed the issue with inability to delete a Container Cloud project with attached MKE clusters that failed to be cleaned up properly.
[11967] [LCM] Added
vrrp_script chk_myscriptto the Keepalived configuration to prevent issues with VIP (Virtual IP) pointing to a node with broken Kubernetes API.[10491] [LCM] Fixed the issue with
kubeletbeing randomly stuck, for example, after a management cluster upgrade. The fix enables automatic restart ofkubeletin case of failures.[7782] [bootstrap] Renamed the SSH key used during bootstrap for every cloud provider from
openstack_tmpto an accurate and clearssh_key.[11927] [StackLight] Fixed the issue with StackLight failing to integrate with an external proxy with authentication handled by a proxy server and ignoring the HTTP
Authorizationheader for basic authentication passed by Prometheus Alertmanager.[11001] [StackLight] Fixed the issue with Patroni pod failing to start and remaining in the
CrashLoopBackOffstatus after the management cluster update.[10829] [IAM] Fixed the issue with the Keycloak pods failing to start during a management cluster bootstrap with the Failed to update database exception in logs.
[11468] [BM] Fixed the issue with the persistent volumes (PVs) that are created using local volume provisioner (LVP) not being mounted on the dedicated disk labeled as
local-volumeand using the root volume instead.[9875] [BM] Fixed the issue with the bootstrap.sh preflight script failing with a timeout waiting for
BareMetalHostifKAAS_BM_FULL_PREFLIGHTwas enabled.[11633] [vSphere] Fixed the issue with the vSphere-based managed cluster projects failing to be cleaned up because of stale secret(s) related to the RHEL license object(s).
This section lists known issues with workarounds for the Mirantis Container Cloud release 2.6.0 including the Cluster release 5.13.0 and 6.12.0.
Note
This section also outlines still valid known issues from previous Container Cloud releases.
Fixed in the Cluster release 7.0.0
Note
The issue below affects only the Kubernetes 1.18 deployments. Moving forward, the workaround for this issue will be moved from Release Notes to Troubleshooting Guide.
On a management cluster with multiple AWS-based managed
clusters, some clusters fail to complete the deployments that require
persistent volumes (PVs), for example, Elasticsearch.
Some of the affected pods get stuck in the Pending state
with the pod has unbound immediate PersistentVolumeClaims and
node(s) had volume node affinity conflict errors.
Warning
The workaround below applies to HA deployments where data can be rebuilt from replicas. If you have a non-HA deployment, back up any existing data before proceeding, since all data will be lost while applying the workaround.
Workaround:
Obtain the persistent volume claims related to the storage mounts of the affected pods:
kubectl get pod/<pod_name1> pod/<pod_name2> \ -o jsonpath='{.spec.volumes[?(@.persistentVolumeClaim)].persistentVolumeClaim.claimName}'
Note
In the command above and in the subsequent steps, substitute the parameters enclosed in angle brackets with the corresponding values.
Delete the affected
PodsandPersistentVolumeClaimsto reschedule them: For example, for StackLight:kubectl -n stacklight delete \ pod/<pod_name1> pod/<pod_name2> ... pvc/<pvc_name2> pvc/<pvc_name2> ...
Fixed in Container Cloud 2.7.0
Even though IPAM is disabled on the vSphere-based regional cluster deployed
on top of an AWS-based management cluster, the regional cluster still has
the kaas-ipam pods installed and continuously restarts them.
In this case, the pods logs contain the following exemplary errors:
Waiting for CRDs. [baremetalhosts.metal3.io clusters.cluster.k8s.io machines.cluster.k8s.io
ipamhosts.ipam.mirantis.com ipaddrs.ipam.mirantis.com subnets.ipam.mirantis.com subnetpools.ipam.mirantis.com \
l2templates.ipam.mirantis.com] not found yet
E0318 11:58:21.067502 1 main.go:240] Fetch CRD list failed: \
Object 'Kind' is missing in 'unstructured object has no kind'
As a result, the KubePodCrashLooping StackLight alerts are firing
in Alertmanager for kaas-ipam. Disregard these alerts.
Fixed in Container Cloud 2.7.0
A vSphere-based cluster with IPAM enabled may lose cluster network settings related to IPAM leading to invalid metadata provided to virtual machines. As a result, virtual machines can not obtain assigned IP addresses. The issue occurs during a management cluster bootstrap or a managed cluster creation.
Workaround:
If the management cluster with IPAM enabled is not deployed yet, follow the steps below before launching the
bootstrap.shscript:Open
kaas-bootstrap/releases/kaas/2.6.0.yamlfor editing.Change the
release-controllerversion from 1.18.1 to 1.18.3:- name: release-controller version: 1.18.3 chart: kaas-release/release-controller namespace: kaas values: image: tag: 1.18.3
Now, proceed with the management cluster bootstrap.
If the management cluster is already deployed, and you want to create a vSphere-based managed cluster with IPAM enabled:
Log in to a local machine where your management or regional cluster
kubeconfigis located and export it:export KUBECONFIG=kaas-bootstrap/kubeconfig
Edit the
kaasreleaseobject by updating therelease-controllerchart and image version from 1.18.1 to 1.18.3:kubectl edit kaasrelease kaas-2-6-0
- chart: kaas-release/release-controller name: release-controller namespace: kaas values: image: tag: 1.18.3 version: 1.18.3
Verify that the
release-controllerdeployment is ready with3/3replicas:kubectl get deployment release-controller-release-controller -n kaas -o=jsonpath='{.status.readyReplicas}/{.status.replicas}'
Now, you can deploy managed clusters with IPAM enabled.
Fixed in 2.11.0
If an L2 template is configured incorrectly, a bare metal cluster is deployed
successfully but with the runtime errors in the IpamHost object.
Workaround:
If you suspect that the machine is not working properly because
of incorrect network configuration, verify the status of the corresponding
IpamHost object. Inspect the l2RenderResult and ipAllocationResult
object fields for error messages.
Fixed in Container Cloud 2.7.0
Elasticsearch may stop receiving new data from Fluentd. In such case, error
messages similar to the following will be present in
fluentd-elasticsearch logs:
ElasticsearchError error="400 - Rejected by Elasticsearch [error type]:
illegal_argument_exception [reason]: 'Validation Failed: 1: this action would
add [15] total shards, but this cluster currently has [2989]/[3000] maximum
shards open;'" location=nil tag="ucp-kubelet"
The workaround is to manually increase the limit of open index shards per node:
kubectl -n stacklight exec -ti elasticsearch-master-0 -- \
curl -XPUT -H "content-type: application/json" \
-d '{"persistent":{"cluster.max_shards_per_node": 20000}}' \
http://127.0.0.1:9200/_cluster/settings
Fixed in Container Cloud 2.7.0
A Ceph node removal is not being triggered properly after updating
the KaasCephCluster custom resource (CR). Both management and managed
clusters are affected.
Workaround:
Remove the parameters for a Ceph OSD from the
KaasCephClusterCR as described in Operations Guide: Add, remove, or reconfigure Ceph nodes.Obtain the IDs of the
osdandmonservices that are located on the old node:Obtain the UID of the affected machine:
kubectl get machine <CephOSDNodeName> -n <ManagedClusterProjectName> -o jsonpath='{.metadata.annotations.kaas\.mirantis\.com\/uid}'
Export
kubeconfigof your managed cluster. For example:export KUBECONFIG=~/Downloads/kubeconfig-test-cluster.yml
Identify the pods IDs that run the
osdandmonservices:kubectl get pods -o wide -n rook-ceph | grep <affectedMachineUID> | grep -E "mon|osd"
Example of the system response extract:
rook-ceph-mon-c-7bbc5d757d-5bpws 1/1 Running 1 6h1m rook-ceph-osd-2-58775d5568-5lklw 1/1 Running 4 44h rook-ceph-osd-prepare-705ae6c647cfdac928c63b63e2e2e647-qn4m9 0/1 Completed 0 94s
The pods IDs include the
osdormonservices IDs. In the example system response above, theosdID is2and themonID isc.
Delete the deployments of the
osdandmonservices obtained in the previous step:kubectl delete deployment rook-ceph-osd(mon)-<ID> -n rook-ceph
For example:
kubectl delete deployment rook-ceph-mon-c -n rook-ceph kubectl delete deployment rook-ceph-osd-2 -n rook-ceph
Log in to the
ceph-toolspod:kubectl -n rook-ceph exec -it $(kubectl -n rook-ceph get pod -l "app=rook-ceph-tools" -o jsonpath='{.items[0].metadata.name}') bash
Rebalance the Ceph OSDs:
ceph osd out osd(s).ID
Wait for the rebalance to complete.
Rebalance the Ceph data:
ceph osd purge osd(s).ID
Wait for the Ceph data to rebalance.
Remove the old node from the Ceph OSD tree:
ceph osd crush rm <NodeName>
If the removed node contained
monservices, remove them:ceph mon rm <monID>
When removing a worker node, it is not possible to automatically remove a Ceph node. The workaround is to manually remove the Ceph node from the Ceph cluster as described in Operations Guide: Add, remove, or reconfigure Ceph nodes before removing the worker node from your deployment.
Fixed in 2.11.0
If you use a custom BareMetalHostProfile, after disk replacement
on a Ceph OSD, the Ceph OSD pod switches to the CrashLoopBackOff state
due to the Ceph OSD authorization key failing to be created properly.
Workaround:
Export
kubeconfigof your managed cluster. For example:export KUBECONFIG=~/Downloads/kubeconfig-test-cluster.yml
Log in to the
ceph-toolspod:kubectl -n rook-ceph exec -it $(kubectl -n rook-ceph get pod -l "app=rook-ceph-tools" -o jsonpath='{.items[0].metadata.name}') bash
Delete the authorization key for the failed Ceph OSD:
ceph auth del osd.<ID>
SSH to the node on which the Ceph OSD cannot be created.
Clean up the disk that will be a base for the failed Ceph OSD. For details, see official Rook documentation.
Note
Ignore failures of the sgdisk --zap-all $DISK and blkdiscard $DISK commands if any.
On the managed cluster, restart Rook Operator:
kubectl -n rook-ceph delete pod -l app=rook-ceph-operator
Fixed in 2.8.0
The ceph_role_mon and ceph_role_mgr labels that Ceph Controller
assigns to a node during a Ceph cluster creation are not automatically
removed after deleting a node from KaaSCephCluster.
As a workaround, manually remove the labels using the following commands:
kubectl unlabel node <nodeName> ceph_role_mon
kubectl unlabel node <nodeName> ceph_role_mgr
Fixed in 2.8.0 for new clusters and in 2.10.0 for existing clusters
If an application running on a Container Cloud management or managed cluster fails frequently, for example, PostgreSQL, it may produce an excessive amount of core dumps. This leads to the no space left on device error on the cluster nodes and, as a result, to the broken Docker Swarm and the entire cluster.
Core dumps are disabled by default on the operating system of the Container Cloud nodes. But since Docker does not inherit the operating system settings, disable core dumps in Docker using the workaround below.
Warning
The workaround below does not apply to the baremetal-based clusters, including MOS deployments, since Docker restart may destroy the Ceph cluster.
Workaround:
SSH to any machine of the affected cluster using
mcc-userand the SSH key provided during the cluster creation.In
/etc/docker/daemon.json, add the following parameters:{ ... "default-ulimits": { "core": { "Hard": 0, "Name": "core", "Soft": 0 } } }
Restart the Docker daemon:
systemctl restart docker
Repeat the steps above on each machine of the affected cluster one by one.
Note
The issue affects only Helm v2 releases and is addressed for Helm v3. Starting from Container Cloud 2.19.0, all Helm releases are switched to v3.
During a management, regional, or managed cluster deployment,
Helm releases may get stuck in the FAILED or UNKNOWN state
although the corresponding machines statuses are Ready
in the Container Cloud web UI. For example, if the StackLight Helm release
fails, the links to its endpoints are grayed out in the web UI.
In the cluster status, providerStatus.helm.ready and
providerStatus.helm.releaseStatuses.<releaseName>.success are false.
HelmBundle cannot recover from such states and requires manual actions.
The workaround below describes the recovery steps for the stacklight
release that got stuck during a cluster deployment.
Use this procedure as an example for other Helm releases as required.
Workaround:
Verify the failed release has the
UNKNOWNorFAILEDstatus in the HelmBundle object:kubectl --kubeconfig <regionalClusterKubeconfigPath> get helmbundle <clusterName> -n <clusterProjectName> -o=jsonpath={.status.releaseStatuses.stacklight} In the command above and in the steps below, replace the parameters enclosed in angle brackets with the corresponding values of your cluster.
Example of system response:
stacklight: attempt: 2 chart: "" finishedAt: "2021-02-05T09:41:05Z" hash: e314df5061bd238ac5f060effdb55e5b47948a99460c02c2211ba7cb9aadd623 message: '[{"occurrence":1,"lastOccurrenceDate":"2021-02-05 09:41:05","content":"error updating the release: rpc error: code = Unknown desc = customresourcedefinitions.apiextensions.k8s.io \"helmbundles.lcm.mirantis.com\" already exists"}]' notes: "" status: UNKNOWN success: false version: 0.1.2-mcp-398
Log in to the
helm-controllerpod console:kubectl --kubeconfig <affectedClusterKubeconfigPath> exec -n kube-system -it helm-controller-0 sh -c tiller
Download the Helm v3 binary. For details, see official Helm documentation.
Remove the failed release:
helm delete <failed-release-name>
For example:
helm delete stacklight
Once done, the release triggers for redeployment.
Helm releases may get stuck in the PENDING_UPGRADE status
during a management or managed cluster upgrade. The HelmBundle Controller
cannot recover from this state and requires manual actions. The workaround
below describes the recovery process for the openstack-operator release
that stuck during a managed cluster update. Use it as an example for other
Helm releases as required.
Workaround:
Log in to the
helm-controllerpod console:kubectl exec -n kube-system -it helm-controller-0 sh -c tiller
Identify the release that stuck in the
PENDING_UPGRADEstatus. For example:./helm --host=localhost:44134 history openstack-operator
Example of system response:
REVISION UPDATED STATUS CHART DESCRIPTION 1 Tue Dec 15 12:30:41 2020 SUPERSEDED openstack-operator-0.3.9 Install complete 2 Tue Dec 15 12:32:05 2020 SUPERSEDED openstack-operator-0.3.9 Upgrade complete 3 Tue Dec 15 16:24:47 2020 PENDING_UPGRADE openstack-operator-0.3.18 Preparing upgrade
Roll back the failed release to the previous revision:
Download the Helm v3 binary. For details, see official Helm documentation.
Roll back the failed release:
helm rollback <failed-release-name>
For example:
helm rollback openstack-operator 2
Once done, the release will be reconciled.
An OpenStack-based regional cluster cleanup fails with the timeout error.
Workaround:
Wait for the
Clusterobject to be deleted in the bootstrap cluster:kubectl --kubeconfig <(./bin/kind get kubeconfig --name clusterapi) get cluster
The system output must be empty.
Remove the bootstrap cluster manually:
./bin/kind delete cluster --name clusterapi
Affects only Container Cloud 2.18.0 and earlier
A project that is newly created in the Container Cloud web UI does not display in the Projects list even after refreshing the page. The issue occurs due to the token missing the necessary role for the new project. As a workaround, relogin to the Container Cloud web UI.
The following table lists the major components and their versions of the Mirantis Container Cloud release 2.6.0.
Note
The components that are newly added, updated, deprecated, or removed
as compared to the previous release version, are marked
with a corresponding superscript,
for example, lcm-ansible Updated.
Component |
Application/Service |
Version |
|---|---|---|
AWS Updated |
aws-provider |
1.18.4 |
aws-credentials-controller |
1.18.1 |
|
Bare metal |
baremetal-operator Updated |
4.0.4 |
baremetal-public-api Updated |
4.0.4 |
|
baremetal-provider Updated |
1.18.6 |
|
httpd |
1.18.0 |
|
ironic Updated |
victoria-bionic-20210302180018 |
|
ironic-operator Updated |
base-bionic-20210301104323 |
|
kaas-ipam Updated |
base-bionic-20210304134548 |
|
local-volume-provisioner |
1.0.4-mcp |
|
mariadb |
10.4.17-bionic-20210203155435 |
|
IAM |
iam Updated |
2.0.0 |
iam-controller Updated |
1.18.1 |
|
keycloak |
9.0.0 |
|
Container Cloud |
admission-controller Updated |
1.18.1 |
byo-credentials-controller Updated |
1.18.1 |
|
byo-provider Updated |
1.18.4 |
|
kaas-public-api Updated |
1.18.1 |
|
kaas-exporter Updated |
1.18.1 |
|
kaas-ui Updated |
1.18.3 |
|
lcm-controller Updated |
0.2.0-289-gd7e9fa9c |
|
mcc-cache Updated |
1.18.1 |
|
proxy-controller Updated |
1.18.1 |
|
release-controller Updated |
1.18.1 |
|
rhellicense-controller New |
1.18.1 |
|
squid-proxy |
0.0.1-1 |
|
OpenStack Updated |
openstack-provider |
1.18.4 |
os-credentials-controller |
1.18.1 |
|
VMware vSphere Updated |
vsphere-provider |
1.18.7 |
vsphere-credentials-controller |
1.18.1 |
This section lists the components artifacts of the Mirantis Container Cloud release 2.6.0.
Note
The components that are newly added, updated, deprecated, or removed
as compared to the previous release version, are marked
with a corresponding superscript,
for example, lcm-ansible Updated.
Artifact |
Component |
Path |
|---|---|---|
Binaries |
baremetal-operator Updated |
https://binary.mirantis.com/bm/helm/baremetal-operator-4.0.4.tgz |
baremetal-public-api Updated |
https://binary.mirantis.com/bm/helm/baremetal-public-api-4.0.4.tgz |
|
ironic-python-agent-bionic.kernel Updated |
https://binary.mirantis.com/bm/bin/ironic/ipa/ubuntu/kernel-victoria-bionic-debug-20210226182519 |
|
ironic-python-agent-bionic.initramfs Updated |
https://binary.mirantis.com/bm/bin/ironic/ipa/ubuntu/initramfs-victoria-bionic-debug-20210226182519 |
|
kaas-ipam Updated |
||
local-volume-provisioner |
https://binary.mirantis.com/bm/helm/local-volume-provisioner-1.0.4-mcp.tgz |
|
Docker images |
baremetal-operator Updated |
mirantis.azurecr.io/bm/baremetal-operator:base-bionic-20210216135743 |
httpd |
mirantis.azurecr.io/lcm/nginx:1.18.0 |
|
ironic Updated |
mirantis.azurecr.io/openstack/ironic:victoria-bionic-20210302180018 |
|
ironic-inspector Updated |
mirantis.azurecr.io/openstack/ironic-inspector:victoria-bionic-20210302180018 |
|
ironic-operator Updated |
mirantis.azurecr.io/bm/ironic-operator:base-bionic-20210301104323 |
|
kaas-ipam Updated |
mirantis.azurecr.io/bm/kaas-ipam:base-bionic-20210304134548 |
|
mariadb |
mirantis.azurecr.io/general/mariadb:10.4.17-bionic-20210203155435 |
Artifact |
Component |
Path |
|---|---|---|
Bootstrap tarball Updated |
bootstrap-linux |
https://binary.mirantis.com/core/bin/bootstrap-linux-1.18.6.tar.gz |
bootstrap-darwin |
https://binary.mirantis.com/core/bin/bootstrap-darwin-1.18.6.tar.gz |
|
Helm charts Updated |
admission-controller |
https://binary.mirantis.com/core/helm/admission-controller-1.18.1.tgz |
aws-credentials-controller |
https://binary.mirantis.com/core/helm/aws-credentials-controller-1.18.1.tgz |
|
aws-provider |
https://binary.mirantis.com/core/helm/aws-provider-1.18.4.tgz |
|
baremetal-provider |
https://binary.mirantis.com/core/helm/baremetal-provider-1.18.6.tgz |
|
byo-credentials-controller |
https://binary.mirantis.com/core/helm/byo-credentials-controller-1.18.1.tgz |
|
byo-provider |
https://binary.mirantis.com/core/helm/byo-provider-1.18.4.tgz |
|
iam-controller |
https://binary.mirantis.com/core/helm/iam-controller-1.18.1.tgz |
|
kaas-exporter |
https://binary.mirantis.com/core/helm/kaas-exporter-1.18.1.tgz |
|
kaas-public-api |
https://binary.mirantis.com/core/helm/kaas-public-api-1.18.1.tgz |
|
kaas-ui |
||
lcm-controller |
https://binary.mirantis.com/core/helm/lcm-controller-1.18.1.tgz |
|
mcc-cache |
||
openstack-provider |
https://binary.mirantis.com/core/helm/openstack-provider-1.18.4.tgz |
|
os-credentials-controller |
https://binary.mirantis.com/core/helm/os-credentials-controller-1.18.1.tgz |
|
proxy-controller |
https://binary.mirantis.com/core/helm/proxy-controller-1.18.1.tgz |
|
release-controller |
https://binary.mirantis.com/core/helm/release-controller-1.18.1.tgz |
|
rhellicense-controller New |
https://binary.mirantis.com/core/helm/rhellicense-controller-1.18.1.tgz |
|
squid-proxy |
https://binary.mirantis.com/core/helm/squid-proxy-1.18.1.tgz |
|
vsphere-credentials-controller |
https://binary.mirantis.com/core/helm/vsphere-credentials-controller-1.18.1.tgz |
|
vsphere-provider |
https://binary.mirantis.com/core/helm/vsphere-provider-1.18.7.tgz |
|
Docker images |
admission-controller Updated |
mirantis.azurecr.io/core/admission-controller:1.18.1 |
aws-cluster-api-controller Updated |
mirantis.azurecr.io/core/aws-cluster-api-controller:1.18.4 |
|
aws-credentials-controller Updated |
mirantis.azurecr.io/core/aws-credentials-controller:1.18.1 |
|
byo-cluster-api-controller Updated |
mirantis.azurecr.io/core/byo-cluster-api-controller:1.18.4 |
|
byo-credentials-controller Updated |
mirantis.azurecr.io/core/byo-credentials-controller:1.18.1 |
|
cluster-api-provider-baremetal Updated |
mirantis.azurecr.io/core/cluster-api-provider-baremetal:1.18.6 |
|
frontend Updated |
mirantis.azurecr.io/core/frontend:1.18.3 |
|
iam-controller Updated |
mirantis.azurecr.io/core/iam-controller:1.18.1 |
|
kproxy Updated |
mirantis.azurecr.io/lcm/kproxy:1.18.1 |
|
lcm-controller Updated |
mirantis.azurecr.io/core/lcm-controller:v0.2.0-289-gd7e9fa9c |
|
nginx |
mirantis.azurecr.io/lcm/nginx:1.18.0 |
|
openstack-cluster-api-controller Updated |
mirantis.azurecr.io/core/openstack-cluster-api-controller:1.18.4 |
|
os-credentials-controller Updated |
mirantis.azurecr.io/core/os-credentials-controller:1.18.1 |
|
registry |
mirantis.azurecr.io/lcm/registry:2.7.1 |
|
release-controller Updated |
mirantis.azurecr.io/core/release-controller:1.18.1 |
|
rhellicense-controller New |
mirantis.azurecr.io/core/rhellicense-controller:1.18.1 |
|
squid-proxy |
mirantis.azurecr.io/core/squid-proxy:0.0.1-1 |
|
vsphere-cluster-api-controller Updated |
mirantis.azurecr.io/core/vsphere-api-controller:1.18.7 |
|
vsphere-credentials-controller Updated |
mirantis.azurecr.io/core/vsphere-credentials-controller:1.18.1 |
Artifact |
Component |
Path |
|---|---|---|
Binaries |
hash-generate-linux |
http://binary.mirantis.com/iam/bin/hash-generate-0.0.1-268-3cf7f17-linux |
hash-generate-darwin |
http://binary.mirantis.com/iam/bin/hash-generate-0.0.1-268-3cf7f17-darwin |
|
iamctl-linux Updated |
||
iamctl-darwin Updated |
||
iamctl-windows Updated |
||
Helm charts Updated |
iam |
|
iam-proxy |
||
keycloak-proxy Updated |
http://binary.mirantis.com/core/helm/keycloak_proxy-1.18.7.tgz |
|
Docker images |
api |
mirantis.azurecr.io/iam/api:0.4.0 |
auxiliary |
mirantis.azurecr.io/iam/auxiliary:0.4.0 |
|
kubernetes-entrypoint |
mirantis.azurecr.io/iam/external/kubernetes-entrypoint:v0.3.1 |
|
mariadb |
mirantis.azurecr.io/general/mariadb:10.4.16-bionic-20201105025052 |
|
keycloak |
mirantis.azurecr.io/iam/keycloak:0.4.0 |
|
keycloak-gatekeeper |
mirantis.azurecr.io/iam/keycloak-gatekeeper:6.0.1 |
See also
The Mirantis Container Cloud GA release 2.5.0:
Introduces support for the Cluster release 5.12.0 that is based on Kubernetes 1.18, Mirantis Container Runtime 19.03.14, and the updated version of Mirantis Kubernetes Engine 3.3.6.
Introduces support for the Cluster release 6.12.0 that is based on the Cluster release 5.12.0 and supports Mirantis OpenStack for Kubernetes (MOS) 21.1.
Still supports previous Cluster releases 5.11.0 and 6.10.0 that are now deprecated and will become unsupported in one of the following Container Cloud releases.
Caution
Make sure to update the Cluster release version of your managed cluster before the current Cluster release version becomes unsupported by a new Container Cloud release version. Otherwise, Container Cloud stops auto-upgrade and eventually Container Cloud itself becomes unsupported.
This section outlines release notes for the Container Cloud release 2.5.0.
This section outlines new features and enhancements introduced in the Mirantis Container Cloud release 2.5.0. For the list of enhancements in the Cluster release 5.12.0 and Cluster release 6.12.0 that are supported by the Container Cloud release 2.5.0, see the 5.12.0 and 6.12.0 sections.
Updated the Mirantis Kubernetes Engine (MKE) version to 3.3.6 for the Container Cloud management and managed clusters.
For the MKE release highlights and components versions, see MKE documentation: MKE release notes.
Implemented proxy support for OpenStack-based and vSphere-based Technology Preview clusters. If you require all Internet access to go through a proxy server for security and audit purposes, you can now bootstrap management and regional clusters using proxy.
You can also enable a separate proxy access on an OpenStack-based managed cluster using the Container Cloud web UI. This proxy is intended for the end user needs and is not used for a managed cluster deployment or for access to the Mirantis resources.
Note
The proxy support for:
The OpenStack provider is generally available.
The VMware vSphere provider is available as Technology Preview. For the Technology Preview feature definition, refer to Technology Preview features.
The AWS and bare metal providers is in the development stage and will become available in the future Container Cloud releases.
Introduced artifacts caching support for all Container Cloud providers to enable deployment of managed clusters without direct Internet access. The Mirantis artifacts used during managed clusters deployment are downloaded through a cache running on a regional cluster.
The feature is enabled by default on new managed clusters based on the Cluster releases 5.12.0 and 6.12.0 and will be automatically enabled on existing clusters during upgrade to the latest version.
Implemented the possibility to configure regional NTP server parameters to be applied to all machines of regional and managed clusters in the specified region. The feature is applicable to all supported cloud providers. The NTP server parameters can be added before or after management and regional clusters deployment.
Optimized the ClusterRelease upgrade process by enabling the Container Cloud provider to upgrade the LCMCluster components, such as MKE, before the HelmBundle components, such as StackLight or Ceph.
Technology Preview
Implemented the k8s-ext bridge in L2 templates that allows you to use
a dedicated network for external connection to the Kubernetes services
exposed by the cluster. When using such bridge, the MetalLB ranges and the
IP addresses provided by the subnet that is associated with the bridge
must fit in the same CIDR.
If enabled, MetalLB will listen and respond on the dedicated virtual bridge. Also, you can create additional subnets to configure additional address ranges for MetalLB.
Caution
Use of a dedicated network for Kubernetes pods traffic, for external connection to the Kubernetes services exposed by the cluster, and for the Ceph cluster access and replication traffic is available as Technology Preview. Use such configurations for testing and evaluation purposes only. For the Technology Preview feature definition, refer to Technology Preview features.
The following issues have been addressed in the Mirantis Container Cloud release 2.5.0 and the Cluster releases 5.12.0 and 6.12.0:
[10453] [LCM] Fixed the issue with time synchronization on nodes that could cause networking issues.
[9748] [LCM] Fixed the issue with the false-positive
helmReleasesuccess status inHelmBundleduring Helm upgrade operations.[9748] [LCM] Fixed the issue with the false-positive
helmReleasesuccess status inHelmBundleduring Helm upgrade operations.[8464] Fixed the issue with Helm controller and OIDC integration failing to be deleted during detach of an MKE cluster.
[9928] [Ceph] Fixed the issue with Ceph rebalance leading to data loss during a managed cluster update by implementing the
maintenancelabel to be set before and unset after the cluster update.[9892] [Ceph] Fixed the issue with Ceph being locked during a managed cluster update by adding the
PodDisruptionBudgetobject that enables minimum 2 Ceph OSD nodes running without rescheduling during update.
[6988] [BM] Fixed the issue with LVM failing to deploy on a new disk if an old volume group with the same name already existed on the target hardware node but on the different disk.
[8560] [BM] Fixed the issue with manual deletion of
BareMetalHostfrom a managed cluster leading to its silent removal without a power-off and deprovision. The fix adds the admission controller webhook to validate the oldBareMetalHostwhen the deletion is requested.[11102] [BM] Fixed the issue with Keepalived not detecting and restoring a VIP of a managed cluster node after running the netplan apply command.
[9905] [9906] [9909] [9914] [9921] [BM] Fixed the following Ubuntu CVEs in the bare metal Docker images:
CVE-2019-20477 and CVE-2020-1747 for PyYAML in
vbmc:latest-20201029CVE-2020-1971 for OpenSSL in the following images:
dnsmasq:bionic-20201105044831rabbitmq-management:3.7.15-bionic-20200812044813kaas-ipam:base-bionic-20201208153852ironic-operator:base-bionic-20201106182102
This section lists known issues with workarounds for the Mirantis Container Cloud release 2.5.0 including the Cluster release 5.12.0 and 6.12.0.
Note
This section also outlines still valid known issues from previous Container Cloud releases.
Fixed in the Cluster release 7.0.0
Note
The issue below affects only the Kubernetes 1.18 deployments. Moving forward, the workaround for this issue will be moved from Release Notes to Troubleshooting Guide.
On a management cluster with multiple AWS-based managed
clusters, some clusters fail to complete the deployments that require
persistent volumes (PVs), for example, Elasticsearch.
Some of the affected pods get stuck in the Pending state
with the pod has unbound immediate PersistentVolumeClaims and
node(s) had volume node affinity conflict errors.
Warning
The workaround below applies to HA deployments where data can be rebuilt from replicas. If you have a non-HA deployment, back up any existing data before proceeding, since all data will be lost while applying the workaround.
Workaround:
Obtain the persistent volume claims related to the storage mounts of the affected pods:
kubectl get pod/<pod_name1> pod/<pod_name2> \ -o jsonpath='{.spec.volumes[?(@.persistentVolumeClaim)].persistentVolumeClaim.claimName}'
Note
In the command above and in the subsequent steps, substitute the parameters enclosed in angle brackets with the corresponding values.
Delete the affected
PodsandPersistentVolumeClaimsto reschedule them: For example, for StackLight:kubectl -n stacklight delete \ pod/<pod_name1> pod/<pod_name2> ... pvc/<pvc_name2> pvc/<pvc_name2> ...
Fixed in Container Cloud 2.6.0
A vSphere-based managed cluster project can fail to be cleaned up because of stale secret(s) related to the RHEL license object(s). Before you can successfully clean up such project, manually delete the secret using the steps below.
Workaround:
Log in to a local machine where your management cluster
kubeconfigis located and where kubectl is installed.Obtain the list of stale secrets:
kubectl --kubeconfig <kubeconfigPath> get secrets -n <projectName>
Open each secret for editing:
kubectl --kubeconfig <kubeconfigPath> edit secret <secret name> -n <projectName>
Remove the following lines:
finalizers: - kaas.mirantis.com/credentials-secretRemove stale secrets:
kubectl --kubeconfig <kubeconfigPath> delete secret <secretName> -n <projectName>
Fixed in 2.11.0
If an L2 template is configured incorrectly, a bare metal cluster is deployed
successfully but with the runtime errors in the IpamHost object.
Workaround:
If you suspect that the machine is not working properly because
of incorrect network configuration, verify the status of the corresponding
IpamHost object. Inspect the l2RenderResult and ipAllocationResult
object fields for error messages.
Fixed in Container Cloud 2.6.0
If you run bootstrap.sh preflight with
KAAS_BM_FULL_PREFLIGHT=true, the script fails with the following message:
failed to create BareMetal objects: failed to wait for objects of kinds BareMetalHost
to become available: timed out waiting for the condition
As a workaround, unset full preflight using unset KAAS_BM_FULL_PREFLIGHT
to run fast preflight instead.
Fixed in Container Cloud 2.6.0
The persistent volumes (PVs) that are created using local volume provisioner
(LVP), are not mounted on the dedicated disk labeled as local-volume
and use the root volume instead. In the workaround below, we use StackLight
volumes as an example.
Workaround:
Identify whether your cluster is affected:
Log in to any control plane node on the management cluster.
Run the following command:
findmnt /mnt/local-volumes/stacklight/elasticsearch-data/vol00In the output, inspect the
SOURCEcolumn. If the path starts with/dev/mapper/lvm_root-root, the host is affected by the issue.Example of system response:
TARGET SOURCE FSTYPE OPTIONS /mnt/local-volumes/stacklight/elasticsearch-data/vol00 /dev/mapper/lvm_root-root[/var/lib/local-volumes/stacklight/elasticsearch-data/vol00] ext4 rw,relatime,errors=remount-ro,data=ordered
Verify other StackLight directories by replacing
elasticsearch-datain the command above with the corresponding folders names.If your cluster is affected, follow the steps below to manually move all data for volumes that must be on the dedicated disk to the mounted device.
Identify all nodes that run the
elasticsearch-masterpod:kubectl -n stacklight get pods -o wide | grep elasticsearch-master
Apply the steps below to all nodes provided in the output.
Identify the mount point for the dedicated device
/dev/mapper/lvm_lvp-lvp. Typically, this device is mounted as/mnt/local-volumes.findmnt /mnt/local-volumesVerify that
SOURCEfor the/mnt/local-volumes mounttarget is/dev/mapper/lvm_lvp-lvpon all the nodes.Create new source directories for the volumes on the dedicated device
/dev/mapper/lvm_lvp-lvp:mkdir -p /mnt/local-volumes/src/stacklight/elasticsearch-data/vol00
Stop the pods that use the volumes to ensure that the data is not corrupted during the switch. Set the number of replicas in
StatefulSetto0:kubectl -n stacklight edit statefulset elasticsearch-master
Wait until all
elasticsearch-masterpods are stopped.Move the Elasticsearch data from the current location to the new directory:
cp -pR /var/lib/local-volumes/stacklight/elasticsearch-data/vol00/** /mnt/local-volumes/src/stacklight/elasticsearch-data/vol00/
Unmount the old source directory from the volume mount point:
umount /mnt/local-volumes/stacklight/elasticsearch-data/vol00Apply this step and the next one to every node with the
/mnt/local-volumes/stacklight/elasticsearch-data/vol00volume.Remount the new source directory to the volume mount point:
mount --bind /mnt/local-volumes/src/stacklight/elasticsearch-data/vol00 /mnt/local-volumes/stacklight/elasticsearch-data/vol00
Edit the
Clusterobject by adding the highlighted parameters below for the StackLight Helm chart:kubectl --kubeconfig <mgmtClusterKubeconfig> edit -n <projectName> cluster <managedClusterName>
spec: helmReleases: - name: stacklight values: ... elasticsearch: clusterHealthCheckParams: wait_for_status=red&timeout=1s
Start the Elasticsearch pods by setting the number of replicas in
StatefulSetto3:kubectl -n stacklight edit statefulset elasticsearch-master
Wait until all
elasticsearch-masterpods are up and running.Remove the previously added
clusterHealthCheckParamsparameters from theClusterobject.In
/etc/fstabon every node that has the volume/mnt/local-volumes/stacklight/elasticsearch-data/vol00, edit the following entry:/var/lib/local-volumes/stacklight/elasticsearch-data/vol00 /mnt/local-volumes/stacklight/elasticsearch-data/vol00 none bind 0 0
In this entry, replace the old directory
/var/lib/local-volumes/stacklight/elasticsearch-data/vol00with the new one:/mnt/local-volumes/src/stacklight/elasticsearch-data/vol00.
Fixed in Container Cloud 2.7.0
A Ceph node removal is not being triggered properly after updating
the KaasCephCluster custom resource (CR). Both management and managed
clusters are affected.
Workaround:
Remove the parameters for a Ceph OSD from the
KaasCephClusterCR as described in Operations Guide: Add, remove, or reconfigure Ceph nodes.Obtain the IDs of the
osdandmonservices that are located on the old node:Obtain the UID of the affected machine:
kubectl get machine <CephOSDNodeName> -n <ManagedClusterProjectName> -o jsonpath='{.metadata.annotations.kaas\.mirantis\.com\/uid}'
Export
kubeconfigof your managed cluster. For example:export KUBECONFIG=~/Downloads/kubeconfig-test-cluster.yml
Identify the pods IDs that run the
osdandmonservices:kubectl get pods -o wide -n rook-ceph | grep <affectedMachineUID> | grep -E "mon|osd"
Example of the system response extract:
rook-ceph-mon-c-7bbc5d757d-5bpws 1/1 Running 1 6h1m rook-ceph-osd-2-58775d5568-5lklw 1/1 Running 4 44h rook-ceph-osd-prepare-705ae6c647cfdac928c63b63e2e2e647-qn4m9 0/1 Completed 0 94s
The pods IDs include the
osdormonservices IDs. In the example system response above, theosdID is2and themonID isc.
Delete the deployments of the
osdandmonservices obtained in the previous step:kubectl delete deployment rook-ceph-osd(mon)-<ID> -n rook-ceph
For example:
kubectl delete deployment rook-ceph-mon-c -n rook-ceph kubectl delete deployment rook-ceph-osd-2 -n rook-ceph
Log in to the
ceph-toolspod:kubectl -n rook-ceph exec -it $(kubectl -n rook-ceph get pod -l "app=rook-ceph-tools" -o jsonpath='{.items[0].metadata.name}') bash
Rebalance the Ceph OSDs:
ceph osd out osd(s).ID
Wait for the rebalance to complete.
Rebalance the Ceph data:
ceph osd purge osd(s).ID
Wait for the Ceph data to rebalance.
Remove the old node from the Ceph OSD tree:
ceph osd crush rm <NodeName>
If the removed node contained
monservices, remove them:ceph mon rm <monID>
When removing a worker node, it is not possible to automatically remove a Ceph node. The workaround is to manually remove the Ceph node from the Ceph cluster as described in Operations Guide: Add, remove, or reconfigure Ceph nodes before removing the worker node from your deployment.
Fixed in 2.11.0
If you use a custom BareMetalHostProfile, after disk replacement
on a Ceph OSD, the Ceph OSD pod switches to the CrashLoopBackOff state
due to the Ceph OSD authorization key failing to be created properly.
Workaround:
Export
kubeconfigof your managed cluster. For example:export KUBECONFIG=~/Downloads/kubeconfig-test-cluster.yml
Log in to the
ceph-toolspod:kubectl -n rook-ceph exec -it $(kubectl -n rook-ceph get pod -l "app=rook-ceph-tools" -o jsonpath='{.items[0].metadata.name}') bash
Delete the authorization key for the failed Ceph OSD:
ceph auth del osd.<ID>
SSH to the node on which the Ceph OSD cannot be created.
Clean up the disk that will be a base for the failed Ceph OSD. For details, see official Rook documentation.
Note
Ignore failures of the sgdisk --zap-all $DISK and blkdiscard $DISK commands if any.
On the managed cluster, restart Rook Operator:
kubectl -n rook-ceph delete pod -l app=rook-ceph-operator
Fixed in Container Cloud 2.6.0
The Keycloak pods may fail to start during a management cluster bootstrap with the Failed to update database exception in logs.
Caution
The following workaround is applicable only to deployments
where mariadb-server has started successfully. Otherwise,
fix the issues with MariaDB first.
Workaround:
Verify that
mariadb-serverhas started:kubectl get po -n kaas | grep mariadb-server
Scale down the Keycloak instances:
kubectl scale sts iam-keycloak --replicas=0 -n kaas
Open the
iam-keycloak-shconfigmap for editing:kubectl edit cm -n kaas iam-keycloak-sh
On the last line of the configmap, before the
$MIGRATION_ARGSvariable, add the following parameter:-Djboss.as.management.blocking.timeout=<RequiredValue>The recommended timeout value is minimum 15 minutes set in seconds. For example,
-Djboss.as.management.blocking.timeout=900.Open the
iam-keycloak-startupconfigmap for editing:kubectl edit cm -n kaas iam-keycloak-startup
In the
iam-keycloak-startupconfigmap, add the following line:/subsystem=transactions/:write-attribute(name=default-timeout,value=<RequiredValue>)
The recommended timeout value is minimum 15 minutes set in seconds.
In the Keycloak
StatefulSet, adjust liveness probe timeouts:kubectl edit sts -n kaas iam-keycloak
Scale up the Keycloak instances:
kubectl scale sts iam-keycloak --replicas=3 -n kaas
Note
The issue affects only Helm v2 releases and is addressed for Helm v3. Starting from Container Cloud 2.19.0, all Helm releases are switched to v3.
During a management, regional, or managed cluster deployment,
Helm releases may get stuck in the FAILED or UNKNOWN state
although the corresponding machines statuses are Ready
in the Container Cloud web UI. For example, if the StackLight Helm release
fails, the links to its endpoints are grayed out in the web UI.
In the cluster status, providerStatus.helm.ready and
providerStatus.helm.releaseStatuses.<releaseName>.success are false.
HelmBundle cannot recover from such states and requires manual actions.
The workaround below describes the recovery steps for the stacklight
release that got stuck during a cluster deployment.
Use this procedure as an example for other Helm releases as required.
Workaround:
Verify the failed release has the
UNKNOWNorFAILEDstatus in the HelmBundle object:kubectl --kubeconfig <regionalClusterKubeconfigPath> get helmbundle <clusterName> -n <clusterProjectName> -o=jsonpath={.status.releaseStatuses.stacklight} In the command above and in the steps below, replace the parameters enclosed in angle brackets with the corresponding values of your cluster.
Example of system response:
stacklight: attempt: 2 chart: "" finishedAt: "2021-02-05T09:41:05Z" hash: e314df5061bd238ac5f060effdb55e5b47948a99460c02c2211ba7cb9aadd623 message: '[{"occurrence":1,"lastOccurrenceDate":"2021-02-05 09:41:05","content":"error updating the release: rpc error: code = Unknown desc = customresourcedefinitions.apiextensions.k8s.io \"helmbundles.lcm.mirantis.com\" already exists"}]' notes: "" status: UNKNOWN success: false version: 0.1.2-mcp-398
Log in to the
helm-controllerpod console:kubectl --kubeconfig <affectedClusterKubeconfigPath> exec -n kube-system -it helm-controller-0 sh -c tiller
Download the Helm v3 binary. For details, see official Helm documentation.
Remove the failed release:
helm delete <failed-release-name>
For example:
helm delete stacklight
Once done, the release triggers for redeployment.
Fixed in Container Cloud 2.6.0
After the management cluster update, a Patroni pod may fail to start and remain
in the CrashLoopBackOff status. Messages similar to the following ones may
be present in Patroni logs:
Local timeline=4 lsn=0/A000000
master_timeline=6
master: history=1 0/1ADEB48 no recovery target specified
2 0/8044500 no recovery target specified
3 0/A0000A0 no recovery target specified
4 0/A1B6CB0 no recovery target specified
5 0/A2C0C80 no recovery target specified
As a workaround, reinitialize the affected pod with a new volume by deleting
the pod itself and the associated PersistentVolumeClaim (PVC).
Workaround:
Obtain the PVC of the affected pod:
kubectl -n stacklight get "pod/${POD_NAME}" -o jsonpath='{.spec.volumes[?(@.name=="storage-volume")].persistentVolumeClaim.claimName}'
Delete the affected pod and its PVC:
kubectl -n stacklight delete "pod/${POD_NAME}" "pvc/${POD_PVC}" sleep 3 # wait for StatefulSet to reschedule the pod, but miss dependent PVC creation kubectl -n stacklight delete "pod/${POD_NAME}"
Helm releases may get stuck in the PENDING_UPGRADE status
during a management or managed cluster upgrade. The HelmBundle Controller
cannot recover from this state and requires manual actions. The workaround
below describes the recovery process for the openstack-operator release
that stuck during a managed cluster update. Use it as an example for other
Helm releases as required.
Workaround:
Log in to the
helm-controllerpod console:kubectl exec -n kube-system -it helm-controller-0 sh -c tiller
Identify the release that stuck in the
PENDING_UPGRADEstatus. For example:./helm --host=localhost:44134 history openstack-operator
Example of system response:
REVISION UPDATED STATUS CHART DESCRIPTION 1 Tue Dec 15 12:30:41 2020 SUPERSEDED openstack-operator-0.3.9 Install complete 2 Tue Dec 15 12:32:05 2020 SUPERSEDED openstack-operator-0.3.9 Upgrade complete 3 Tue Dec 15 16:24:47 2020 PENDING_UPGRADE openstack-operator-0.3.18 Preparing upgrade
Roll back the failed release to the previous revision:
Download the Helm v3 binary. For details, see official Helm documentation.
Roll back the failed release:
helm rollback <failed-release-name>
For example:
helm rollback openstack-operator 2
Once done, the release will be reconciled.
An OpenStack-based regional cluster cleanup fails with the timeout error.
Workaround:
Wait for the
Clusterobject to be deleted in the bootstrap cluster:kubectl --kubeconfig <(./bin/kind get kubeconfig --name clusterapi) get cluster
The system output must be empty.
Remove the bootstrap cluster manually:
./bin/kind delete cluster --name clusterapi
Affects only Container Cloud 2.18.0 and earlier
A project that is newly created in the Container Cloud web UI does not display in the Projects list even after refreshing the page. The issue occurs due to the token missing the necessary role for the new project. As a workaround, relogin to the Container Cloud web UI.
The following table lists the major components and their versions of the Mirantis Container Cloud release 2.5.0.
Note
The components that are newly added, updated, deprecated, or removed
as compared to the previous release version, are marked
with a corresponding superscript,
for example, lcm-ansible Updated.
Component |
Application/Service |
Version |
|---|---|---|
AWS Updated |
aws-provider |
1.17.4 |
aws-credentials-controller |
1.17.4 |
|
Bare metal |
baremetal-operator Updated |
3.2.1 |
baremetal-public-api Updated |
3.2.1 |
|
baremetal-provider Updated |
1.17.6 |
|
httpd Updated |
1.18.0 |
|
ironic Updated |
ussuri-bionic-20210202180025 |
|
ironic-operator |
base-bionic-20210106163336 |
|
kaas-ipam Updated |
base-bionic-20210218141033 |
|
local-volume-provisioner |
1.0.4-mcp |
|
mariadb Updated |
10.4.17-bionic-20210203155435 |
|
IAM |
iam Updated |
1.3.0 |
iam-controller Updated |
1.17.4 |
|
keycloak |
9.0.0 |
|
Container Cloud Updated |
admission-controller |
1.17.5 |
byo-credentials-controller |
1.17.4 |
|
byo-provider |
1.17.4 |
|
kaas-public-api |
1.17.4 |
|
kaas-exporter |
1.17.4 |
|
kaas-ui |
1.17.4 |
|
lcm-controller |
0.2.0-259-g71792430 |
|
mcc-cache New |
1.17.4 |
|
proxy-controller New |
1.17.4 |
|
release-controller |
1.17.4 |
|
squid-proxy New |
0.0.1-1 |
|
OpenStack Updated |
openstack-provider |
1.17.4 |
os-credentials-controller |
1.17.4 |
|
VMware vSphere Updated |
vsphere-provider |
1.17.6 |
vsphere-credentials-controller |
1.17.4 |
This section lists the components artifacts of the Mirantis Container Cloud release 2.5.0.
Note
The components that are newly added, updated, deprecated, or removed
as compared to the previous release version, are marked
with a corresponding superscript,
for example, lcm-ansible Updated.
Artifact |
Component |
Path |
|---|---|---|
Binaries |
baremetal-operator Updated |
https://binary.mirantis.com/bm/helm/baremetal-operator-3.2.1.tgz |
baremetal-public-api Updated |
https://binary.mirantis.com/bm/helm/baremetal-public-api-3.2.1.tgz |
|
ironic-python-agent-bionic.kernel Updated |
https://binary.mirantis.com/bm/bin/ironic/ipa/ubuntu/kernel-ussuri-bionic-debug-20210204084827 |
|
ironic-python-agent-bionic.initramfs Updated |
https://binary.mirantis.com/bm/bin/ironic/ipa/ubuntu/initramfs-ussuri-bionic-debug-20210204084827 |
|
kaas-ipam Updated |
||
local-volume-provisioner |
https://binary.mirantis.com/bm/helm/local-volume-provisioner-1.0.4-mcp.tgz |
|
Docker images |
baremetal-operator |
mirantis.azurecr.io/bm/baremetal-operator:base-bionic-20201113171304 |
httpd Updated |
mirantis.azurecr.io/lcm/nginx:1.18.0 |
|
ironic Updated |
mirantis.azurecr.io/openstack/ironic:ussuri-bionic-20210202180025 |
|
ironic-inspector Updated |
mirantis.azurecr.io/openstack/ironic-inspector:ussuri-bionic-20210202180025 |
|
ironic-operator |
mirantis.azurecr.io/bm/ironic-operator:base-bionic-20210106163336 |
|
kaas-ipam Updated |
mirantis.azurecr.io/bm/kaas-ipam:base-bionic-20210218141033 |
|
mariadb Updated |
mirantis.azurecr.io/general/mariadb:10.4.17-bionic-20210203155435 |
Artifact |
Component |
Path |
|---|---|---|
Bootstrap tarball Updated |
bootstrap-linux |
https://binary.mirantis.com/core/bin/bootstrap-linux-1.17.5.tar.gz |
bootstrap-darwin |
https://binary.mirantis.com/core/bin/bootstrap-darwin-1.17.5.tar.gz |
|
Helm charts Updated |
admission-controller |
https://binary.mirantis.com/core/helm/admission-controller-1.17.4.tgz |
aws-credentials-controller |
https://binary.mirantis.com/core/helm/aws-credentials-controller-1.17.4.tgz |
|
aws-provider |
https://binary.mirantis.com/core/helm/aws-provider-1.17.4.tgz |
|
baremetal-provider |
https://binary.mirantis.com/core/helm/baremetal-provider-1.17.4.tgz |
|
byo-credentials-controller |
https://binary.mirantis.com/core/helm/byo-credentials-controller-1.17.4.tgz |
|
byo-provider |
https://binary.mirantis.com/core/helm/byo-provider-1.17.4.tgz |
|
iam-controller |
https://binary.mirantis.com/core/helm/iam-controller-1.17.4.tgz |
|
kaas-exporter |
https://binary.mirantis.com/core/helm/kaas-exporter-1.17.4.tgz |
|
kaas-public-api |
https://binary.mirantis.com/core/helm/kaas-public-api-1.17.4.tgz |
|
kaas-ui |
||
lcm-controller |
https://binary.mirantis.com/core/helm/lcm-controller-1.17.4.tgz |
|
mcc-cache New |
||
openstack-provider |
https://binary.mirantis.com/core/helm/openstack-provider-1.17.4.tgz |
|
os-credentials-controller |
https://binary.mirantis.com/core/helm/os-credentials-controller-1.17.4.tgz |
|
proxy-controller New |
https://binary.mirantis.com/core/helm/proxy-controller-1.17.4.tgz |
|
release-controller |
https://binary.mirantis.com/core/helm/release-controller-1.17.4.tgz |
|
squid-proxy New |
https://binary.mirantis.com/core/helm/squid-proxy-1.17.4.tgz |
|
vsphere-credentials-controller |
https://binary.mirantis.com/core/helm/vsphere-credentials-controller-1.17.4.tgz |
|
vsphere-provider |
https://binary.mirantis.com/core/helm/vsphere-provider-1.17.4.tgz |
|
Docker images Updated |
admission-controller |
mirantis.azurecr.io/core/admission-controller:1.17.5 |
aws-cluster-api-controller |
mirantis.azurecr.io/core/aws-cluster-api-controller:1.17.4 |
|
aws-credentials-controller |
mirantis.azurecr.io/core/aws-credentials-controller:1.17.4 |
|
byo-cluster-api-controller |
mirantis.azurecr.io/core/byo-cluster-api-controller:1.17.4 |
|
byo-credentials-controller |
mirantis.azurecr.io/core/byo-credentials-controller:1.17.4 |
|
cluster-api-provider-baremetal |
mirantis.azurecr.io/core/cluster-api-provider-baremetal:1.17.6 |
|
frontend |
mirantis.azurecr.io/core/frontend:1.17.4 |
|
iam-controller |
mirantis.azurecr.io/core/iam-controller:1.17.4 |
|
kproxy New |
mirantis.azurecr.io/lcm/kproxy:1.17.4 |
|
lcm-controller |
mirantis.azurecr.io/core/lcm-controller:v0.2.0-259-g71792430 |
|
nginx New |
mirantis.azurecr.io/lcm/nginx:1.18.0 |
|
openstack-cluster-api-controller |
mirantis.azurecr.io/core/openstack-cluster-api-controller:1.17.4 |
|
os-credentials-controller |
mirantis.azurecr.io/core/os-credentials-controller:1.17.4 |
|
registry New |
mirantis.azurecr.io/lcm/registry:2.7.1 |
|
release-controller |
mirantis.azurecr.io/core/release-controller:1.17.4 |
|
squid-proxy New |
mirantis.azurecr.io/core/squid-proxy:0.0.1-1 |
|
vsphere-cluster-api-controller |
mirantis.azurecr.io/core/vsphere-api-controller:1.17.6 |
|
vsphere-credentials-controller |
mirantis.azurecr.io/core/vsphere-credentials-controller:1.17.6 |
Artifact |
Component |
Path |
|---|---|---|
Binaries |
hash-generate-linux |
http://binary.mirantis.com/iam/bin/hash-generate-0.0.1-268-3cf7f17-linux |
hash-generate-darwin |
http://binary.mirantis.com/iam/bin/hash-generate-0.0.1-268-3cf7f17-darwin |
|
iamctl-linux |
||
iamctl-darwin |
||
iamctl-windows |
||
Helm charts Updated |
iam |
|
iam-proxy |
||
keycloak-proxy |
http://binary.mirantis.com/core/helm/keycloak_proxy-1.17.4.tgz |
|
Docker images |
api Updated |
mirantis.azurecr.io/iam/api:0.4.0 |
auxiliary Updated |
mirantis.azurecr.io/iam/auxiliary:0.4.0 |
|
kubernetes-entrypoint Updated |
mirantis.azurecr.io/iam/external/kubernetes-entrypoint:v0.3.1 |
|
mariadb |
mirantis.azurecr.io/general/mariadb:10.4.16-bionic-20201105025052 |
|
keycloak Updated |
mirantis.azurecr.io/iam/keycloak:0.4.0 |
|
keycloak-gatekeeper |
mirantis.azurecr.io/iam/keycloak-gatekeeper:6.0.1 |
See also
The Mirantis Container Cloud GA release 2.4.0:
Introduces support for the Cluster release 5.11.0 that is based on Kubernetes 1.18, Mirantis Kubernetes Engine 3.3.4, and the updated version of Mirantis Container Runtime 19.03.14.
Supports the Cluster release 6.10.0 that is based on the Cluster release 5.10.0 and supports Mirantis OpenStack for Kubernetes (MOSK) Ussuri.
Still supports previous Cluster releases 5.10.0 and 6.8.1 that are now deprecated and will become unsupported in one of the following Container Cloud releases.
Caution
Make sure to update the Cluster release version of your managed cluster before the current Cluster release version becomes unsupported by a new Container Cloud release version. Otherwise, Container Cloud stops auto-upgrade and eventually Container Cloud itself becomes unsupported.
This section outlines release notes for the Container Cloud release 2.4.0.
This section outlines new features and enhancements introduced in the Mirantis Container Cloud release 2.4.0. For the list of enhancements in the Cluster release 5.11.0 and Cluster release 6.10.0 that are supported by the Container Cloud release 2.4.0, see the 5.11.0 and 6.10.0 sections.
Support for the updated version of Mirantis Container Runtime
Dedicated network for Kubernetes pods traffic on bare metal clusters
Updated the Mirantis Container Runtime (MCR) version to 19.03.14 for all types of Container Cloud clusters.
For the MCR release highlights, see MCR documentation: MCR release notes.
Caution
Due to the development limitations, the MCR upgrade to version 19.03.13 or 19.03.14 on existing Container Cloud clusters is not supported.
Technology Preview
Implemented the k8s-pods bridge in L2 templates that allows you to use
a dedicated network for Kubernetes pods traffic.
When the k8s-pods bridge is defined in an L2 template,
Calico CNI uses that network for routing the pods traffic between nodes.
Caution
Using of a dedicated network for Kubernetes pods traffic described above is available as Technology Preview. Use such configuration for testing and evaluation purposes only. For the Technology Preview feature definition, refer to Technology Preview features.
The following features are still under development and will be announced in one of the following Container Cloud releases:
Switching Kubernetes API to listen to the specified IP address on the node
Enable MetalLB to listen and respond on the dedicated virtual bridge.
Learn more
Extended the functionality of the feedback form for the Container Cloud web UI. Using the Feedback button, you can now provide 5-star product rating and feedback about Container Cloud. If you have an idea or found a bug in Container Cloud, you can create a ticket for the Mirantis support team to help us improve the product.
This section lists known issues with workarounds for the Mirantis Container Cloud release 2.4.0 including the Cluster release 5.11.0 and 6.10.0.
Note
This section also outlines still valid known issues from previous Container Cloud releases.
Fixed in the Cluster release 7.0.0
Note
The issue below affects only the Kubernetes 1.18 deployments. Moving forward, the workaround for this issue will be moved from Release Notes to Troubleshooting Guide.
On a management cluster with multiple AWS-based managed
clusters, some clusters fail to complete the deployments that require
persistent volumes (PVs), for example, Elasticsearch.
Some of the affected pods get stuck in the Pending state
with the pod has unbound immediate PersistentVolumeClaims and
node(s) had volume node affinity conflict errors.
Warning
The workaround below applies to HA deployments where data can be rebuilt from replicas. If you have a non-HA deployment, back up any existing data before proceeding, since all data will be lost while applying the workaround.
Workaround:
Obtain the persistent volume claims related to the storage mounts of the affected pods:
kubectl get pod/<pod_name1> pod/<pod_name2> \ -o jsonpath='{.spec.volumes[?(@.persistentVolumeClaim)].persistentVolumeClaim.claimName}'
Note
In the command above and in the subsequent steps, substitute the parameters enclosed in angle brackets with the corresponding values.
Delete the affected
PodsandPersistentVolumeClaimsto reschedule them: For example, for StackLight:kubectl -n stacklight delete \ pod/<pod_name1> pod/<pod_name2> ... pvc/<pvc_name2> pvc/<pvc_name2> ...
Fixed in Container Cloud 2.6.0
If you run bootstrap.sh preflight with
KAAS_BM_FULL_PREFLIGHT=true, the script fails with the following message:
failed to create BareMetal objects: failed to wait for objects of kinds BareMetalHost
to become available: timed out waiting for the condition
As a workaround, unset full preflight using unset KAAS_BM_FULL_PREFLIGHT
to run fast preflight instead.
Fixed in Container Cloud 2.5.0
This issue may occur on the baremetal-based managed clusters that are created using L2 templates when network configuration is changed by the user or when Container Cloud is updated from version 2.3.0 to 2.4.0.
Due to the community issue, Keepalived 1.3.9 does not detect and restore a VIP of a managed cluster node after running the netplan apply command. The command is used to apply network configuration changes.
As a result, the Kubernetes API on the affected managed clusters becomes inaccessible.
As a workaround, log in to all nodes of the affected managed clusters and restart Keepalived using systemctl restart keepalived.
Fixed in Container Cloud 2.5.0
During a management or managed cluster deployment, LVM cannot be deployed on a new disk if an old volume group with the same name already exists on the target hardware node but on the different disk.
Workaround:
In the bare metal host profile specific to your hardware configuration,
add the wipe: true parameter to the device that fails to be deployed.
For the procedure details,
see Operations Guide: Create a custom host profile.
Fixed in 2.11.0
If an L2 template is configured incorrectly, a bare metal cluster is deployed
successfully but with the runtime errors in the IpamHost object.
Workaround:
If you suspect that the machine is not working properly because
of incorrect network configuration, verify the status of the corresponding
IpamHost object. Inspect the l2RenderResult and ipAllocationResult
object fields for error messages.
Fixed in Container Cloud 2.5.0
If BareMetalHost is manually removed from a managed cluster, it is
silently removed without a power-off and deprovision that leads to a managed
cluster failures.
Workaround:
Do not manually delete a BareMetalHost that has the Provisioned status.
Fixed in Container Cloud 2.7.0
A Ceph node removal is not being triggered properly after updating
the KaasCephCluster custom resource (CR). Both management and managed
clusters are affected.
Workaround:
Remove the parameters for a Ceph OSD from the
KaasCephClusterCR as described in Operations Guide: Add, remove, or reconfigure Ceph nodes.Obtain the IDs of the
osdandmonservices that are located on the old node:Obtain the UID of the affected machine:
kubectl get machine <CephOSDNodeName> -n <ManagedClusterProjectName> -o jsonpath='{.metadata.annotations.kaas\.mirantis\.com\/uid}'
Export
kubeconfigof your managed cluster. For example:export KUBECONFIG=~/Downloads/kubeconfig-test-cluster.yml
Identify the pods IDs that run the
osdandmonservices:kubectl get pods -o wide -n rook-ceph | grep <affectedMachineUID> | grep -E "mon|osd"
Example of the system response extract:
rook-ceph-mon-c-7bbc5d757d-5bpws 1/1 Running 1 6h1m rook-ceph-osd-2-58775d5568-5lklw 1/1 Running 4 44h rook-ceph-osd-prepare-705ae6c647cfdac928c63b63e2e2e647-qn4m9 0/1 Completed 0 94s
The pods IDs include the
osdormonservices IDs. In the example system response above, theosdID is2and themonID isc.
Delete the deployments of the
osdandmonservices obtained in the previous step:kubectl delete deployment rook-ceph-osd(mon)-<ID> -n rook-ceph
For example:
kubectl delete deployment rook-ceph-mon-c -n rook-ceph kubectl delete deployment rook-ceph-osd-2 -n rook-ceph
Log in to the
ceph-toolspod:kubectl -n rook-ceph exec -it $(kubectl -n rook-ceph get pod -l "app=rook-ceph-tools" -o jsonpath='{.items[0].metadata.name}') bash
Rebalance the Ceph OSDs:
ceph osd out osd(s).ID
Wait for the rebalance to complete.
Rebalance the Ceph data:
ceph osd purge osd(s).ID
Wait for the Ceph data to rebalance.
Remove the old node from the Ceph OSD tree:
ceph osd crush rm <NodeName>
If the removed node contained
monservices, remove them:ceph mon rm <monID>
Fixed in Container Cloud 2.5.0
During a managed cluster update, Ceph rebalance leading to data loss may occur.
Workaround:
Before updating a managed cluster:
Log in to the
ceph-toolspod:kubectl -n rook-ceph exec -it <ceph-tools-pod-name> bash
Set the
nooutflag:ceph osd set noout
After updating a managed cluster:
Log in to the
ceph-toolspod:kubectl -n rook-ceph exec -it <ceph-tools-pod-name> bash
Unset the
nooutflag:ceph osd unset noout
When removing a worker node, it is not possible to automatically remove a Ceph node. The workaround is to manually remove the Ceph node from the Ceph cluster as described in Operations Guide: Add, remove, or reconfigure Ceph nodes before removing the worker node from your deployment.
Fixed in 2.11.0
If you use a custom BareMetalHostProfile, after disk replacement
on a Ceph OSD, the Ceph OSD pod switches to the CrashLoopBackOff state
due to the Ceph OSD authorization key failing to be created properly.
Workaround:
Export
kubeconfigof your managed cluster. For example:export KUBECONFIG=~/Downloads/kubeconfig-test-cluster.yml
Log in to the
ceph-toolspod:kubectl -n rook-ceph exec -it $(kubectl -n rook-ceph get pod -l "app=rook-ceph-tools" -o jsonpath='{.items[0].metadata.name}') bash
Delete the authorization key for the failed Ceph OSD:
ceph auth del osd.<ID>
SSH to the node on which the Ceph OSD cannot be created.
Clean up the disk that will be a base for the failed Ceph OSD. For details, see official Rook documentation.
Note
Ignore failures of the sgdisk --zap-all $DISK and blkdiscard $DISK commands if any.
On the managed cluster, restart Rook Operator:
kubectl -n rook-ceph delete pod -l app=rook-ceph-operator
Note
The issue affects only Helm v2 releases and is addressed for Helm v3. Starting from Container Cloud 2.19.0, all Helm releases are switched to v3.
During a management, regional, or managed cluster deployment,
Helm releases may get stuck in the FAILED or UNKNOWN state
although the corresponding machines statuses are Ready
in the Container Cloud web UI. For example, if the StackLight Helm release
fails, the links to its endpoints are grayed out in the web UI.
In the cluster status, providerStatus.helm.ready and
providerStatus.helm.releaseStatuses.<releaseName>.success are false.
HelmBundle cannot recover from such states and requires manual actions.
The workaround below describes the recovery steps for the stacklight
release that got stuck during a cluster deployment.
Use this procedure as an example for other Helm releases as required.
Workaround:
Verify the failed release has the
UNKNOWNorFAILEDstatus in the HelmBundle object:kubectl --kubeconfig <regionalClusterKubeconfigPath> get helmbundle <clusterName> -n <clusterProjectName> -o=jsonpath={.status.releaseStatuses.stacklight} In the command above and in the steps below, replace the parameters enclosed in angle brackets with the corresponding values of your cluster.
Example of system response:
stacklight: attempt: 2 chart: "" finishedAt: "2021-02-05T09:41:05Z" hash: e314df5061bd238ac5f060effdb55e5b47948a99460c02c2211ba7cb9aadd623 message: '[{"occurrence":1,"lastOccurrenceDate":"2021-02-05 09:41:05","content":"error updating the release: rpc error: code = Unknown desc = customresourcedefinitions.apiextensions.k8s.io \"helmbundles.lcm.mirantis.com\" already exists"}]' notes: "" status: UNKNOWN success: false version: 0.1.2-mcp-398
Log in to the
helm-controllerpod console:kubectl --kubeconfig <affectedClusterKubeconfigPath> exec -n kube-system -it helm-controller-0 sh -c tiller
Download the Helm v3 binary. For details, see official Helm documentation.
Remove the failed release:
helm delete <failed-release-name>
For example:
helm delete stacklight
Once done, the release triggers for redeployment.
Fixed in Container Cloud 2.6.0
After the management cluster update, a Patroni pod may fail to start and remain
in the CrashLoopBackOff status. Messages similar to the following ones may
be present in Patroni logs:
Local timeline=4 lsn=0/A000000
master_timeline=6
master: history=1 0/1ADEB48 no recovery target specified
2 0/8044500 no recovery target specified
3 0/A0000A0 no recovery target specified
4 0/A1B6CB0 no recovery target specified
5 0/A2C0C80 no recovery target specified
As a workaround, reinitialize the affected pod with a new volume by deleting
the pod itself and the associated PersistentVolumeClaim (PVC).
Workaround:
Obtain the PVC of the affected pod:
kubectl -n stacklight get "pod/${POD_NAME}" -o jsonpath='{.spec.volumes[?(@.name=="storage-volume")].persistentVolumeClaim.claimName}'
Delete the affected pod and its PVC:
kubectl -n stacklight delete "pod/${POD_NAME}" "pvc/${POD_PVC}" sleep 3 # wait for StatefulSet to reschedule the pod, but miss dependent PVC creation kubectl -n stacklight delete "pod/${POD_NAME}"
Helm releases may get stuck in the PENDING_UPGRADE status
during a management or managed cluster upgrade. The HelmBundle Controller
cannot recover from this state and requires manual actions. The workaround
below describes the recovery process for the openstack-operator release
that stuck during a managed cluster update. Use it as an example for other
Helm releases as required.
Workaround:
Log in to the
helm-controllerpod console:kubectl exec -n kube-system -it helm-controller-0 sh -c tiller
Identify the release that stuck in the
PENDING_UPGRADEstatus. For example:./helm --host=localhost:44134 history openstack-operator
Example of system response:
REVISION UPDATED STATUS CHART DESCRIPTION 1 Tue Dec 15 12:30:41 2020 SUPERSEDED openstack-operator-0.3.9 Install complete 2 Tue Dec 15 12:32:05 2020 SUPERSEDED openstack-operator-0.3.9 Upgrade complete 3 Tue Dec 15 16:24:47 2020 PENDING_UPGRADE openstack-operator-0.3.18 Preparing upgrade
Roll back the failed release to the previous revision:
Download the Helm v3 binary. For details, see official Helm documentation.
Roll back the failed release:
helm rollback <failed-release-name>
For example:
helm rollback openstack-operator 2
Once done, the release will be reconciled.
Affects only Container Cloud 2.18.0 and earlier
A project that is newly created in the Container Cloud web UI does not display in the Projects list even after refreshing the page. The issue occurs due to the token missing the necessary role for the new project. As a workaround, relogin to the Container Cloud web UI.
The following issues have been addressed in the Mirantis Container Cloud release 2.4.0 and the Cluster releases 5.11.0 and 6.10.0:
[10351] [BM] [IPAM] Fixed the issue with the automatically allocated subnet having the ability to requeue allocation from a
SubnetPoolin theerrorstate.[10104] [BM] [Ceph] Fixed the issue with OpenStack services failing to access
rook-ceph-mon-*pods due to the changed metadata for connection after pods restart if Ceph was deployed withouthostNetwork: true.
[2757] [IAM] Fixed the issue with IAM failing to start with the IAM pods being in the
CrashLoopBackOffstate during a management cluster deployment.[7562] [IAM] Disabled the
httpport in Keycloak to prevent security vulnerabilities.
[10108] [LCM] Fixed the issue with accidental upgrade of the
docker-ee,docker-ee-cli, andcontainerd.iopackages that must be pinned during the host OS upgrade.[10094] [LCM] Fixed the issue with error handling in the
manage-taintsAnsible script.[9676] [LCM] Fixed the issue with Keepalived and NGINX being installed on worker nodes instead of being installed on control plane nodes only.
[10323] [UI] Fixed the issue with offline tokens being expired over time if fetched using the Container Cloud web UI. The issue occurred if the Log in with Keycloak option was used.
[8966] [UI] Fixed the issue with the “invalid_grant”,”error_description”: “Session doesn’t have required client” error occurring over time after logging in to the Container Cloud web UI through Log in with Keycloak.
[10180] [UI] Fixed the issue with the SSH Keys dialog becoming blank after the token expiration.
[7781] [UI] Fixed the issue with the previously selected Ceph cluster machines disappearing from the drop-down menu of the Create New Ceph Cluster dialog.
[7843] [UI] Fixed the issue with Provider Credentials being stuck in the
Processingstate if created using the Add new credential option of the Create New Cluster dialog.
The following table lists the major components and their versions of the Mirantis Container Cloud release 2.4.0.
Note
The components that are newly added, updated, deprecated, or removed
as compared to the previous release version, are marked
with a corresponding superscript,
for example, lcm-ansible Updated.
Component |
Application/Service |
Version |
|---|---|---|
AWS Updated |
aws-provider |
1.16.1 |
aws-credentials-controller |
1.16.1 |
|
Bare metal |
baremetal-operator Updated |
3.1.7 |
baremetal-public-api Updated |
3.1.7 |
|
baremetal-provider Updated |
1.16.4 |
|
httpd |
2.4.46-20201001171500 |
|
ironic Updated |
ussuri-bionic-20210113180016 |
|
ironic-operator Updated |
base-bionic-20210106163336 |
|
kaas-ipam Updated |
base-bionic-20210106163449 |
|
local-volume-provisioner |
1.0.4-mcp |
|
mariadb Updated |
10.4.17-bionic-20210106145941 |
|
IAM |
iam Updated |
1.2.1 |
iam-controller Updated |
1.16.1 |
|
keycloak |
9.0.0 |
|
Container Cloud |
admission-controller Updated |
1.16.1 |
byo-credentials-controller Updated |
1.16.1 |
|
byo-provider Updated |
1.16.1 |
|
kaas-public-api Updated |
1.16.1 |
|
kaas-exporter Updated |
1.16.1 |
|
kaas-ui Updated |
1.16.2 |
|
lcm-controller |
0.2.0-224-g5c413d37 |
|
release-controller Updated |
1.16.1 |
|
OpenStack Updated |
openstack-provider |
1.16.1 |
os-credentials-controller |
1.16.1 |
|
VMware vSphere Updated |
vsphere-provider |
1.16.1 |
vsphere-credentials-controller |
1.16.4 |
This section lists the components artifacts of the Mirantis Container Cloud release 2.4.0.
Note
The components that are newly added, updated, deprecated, or removed
as compared to the previous release version, are marked
with a corresponding superscript,
for example, lcm-ansible Updated.
Artifact |
Component |
Path |
|---|---|---|
Binaries |
baremetal-operator Updated |
https://binary.mirantis.com/bm/helm/baremetal-operator-3.1.7.tgz |
baremetal-public-api Updated |
https://binary.mirantis.com/bm/helm/baremetal-public-api-3.1.7.tgz |
|
ironic-python-agent-bionic.kernel Updated |
https://binary.mirantis.com/bm/bin/ironic/ipa/ubuntu/kernel-ussuri-bionic-debug-20210108095808 |
|
ironic-python-agent-bionic.initramfs Updated |
https://binary.mirantis.com/bm/bin/ironic/ipa/ubuntu/initramfs-ussuri-bionic-debug-20210108095808 |
|
kaas-ipam Updated |
||
local-volume-provisioner |
https://binary.mirantis.com/bm/helm/local-volume-provisioner-1.0.4-mcp.tgz |
|
Docker images |
baremetal-operator |
mirantis.azurecr.io/bm/baremetal-operator:base-bionic-20201113171304 |
httpd |
mirantis.azurecr.io/bm/external/httpd:2.4.46-20201001171500 |
|
ironic Updated |
mirantis.azurecr.io/openstack/ironic:ussuri-bionic-20210113180016 |
|
ironic-inspector Updated |
mirantis.azurecr.io/openstack/ironic-inspector:ussuri-bionic-20210113180016 |
|
ironic-operator Updated |
mirantis.azurecr.io/bm/ironic-operator:base-bionic-20210106163336 |
|
kaas-ipam Updated |
mirantis.azurecr.io/bm/kaas-ipam:base-bionic-20210106163449 |
|
mariadb Updated |
mirantis.azurecr.io/general/mariadb:10.4.17-bionic-20210106145941 |
Artifact |
Component |
Path |
|---|---|---|
Bootstrap tarball Updated |
bootstrap-linux |
https://binary.mirantis.com/core/bin/bootstrap-linux-1.16.1.tar.gz |
bootstrap-darwin |
https://binary.mirantis.com/core/bin/bootstrap-darwin-1.16.1.tar.gz |
|
Helm charts Updated |
admission-controller |
https://binary.mirantis.com/core/helm/admission-controller-1.16.1.tgz |
aws-credentials-controller |
https://binary.mirantis.com/core/helm/aws-credentials-controller-1.16.1.tgz |
|
aws-provider |
https://binary.mirantis.com/core/helm/aws-provider-1.16.1.tgz |
|
baremetal-provider |
https://binary.mirantis.com/core/helm/baremetal-provider-1.16.1.tgz |
|
byo-credentials-controller |
https://binary.mirantis.com/core/helm/byo-credentials-controller-1.16.1.tgz |
|
byo-provider |
https://binary.mirantis.com/core/helm/byo-provider-1.16.1.tgz |
|
iam-controller |
https://binary.mirantis.com/core/helm/iam-controller-1.16.1.tgz |
|
kaas-exporter |
https://binary.mirantis.com/core/helm/kaas-exporter-1.16.1.tgz |
|
kaas-public-api |
https://binary.mirantis.com/core/helm/kaas-public-api-1.16.1.tgz |
|
kaas-ui |
||
lcm-controller |
https://binary.mirantis.com/core/helm/lcm-controller-1.16.1.tgz |
|
openstack-provider |
https://binary.mirantis.com/core/helm/openstack-provider-1.16.1.tgz |
|
os-credentials-controller |
https://binary.mirantis.com/core/helm/os-credentials-controller-1.16.1.tgz |
|
release-controller |
https://binary.mirantis.com/core/helm/release-controller-1.16.1.tgz |
|
vsphere-credentials-controller |
https://binary.mirantis.com/core/helm/vsphere-credentials-controller-1.16.1.tgz |
|
vsphere-provider |
https://binary.mirantis.com/core/helm/vsphere-provider-1.16.1.tgz |
|
Docker images Updated |
admission-controller |
mirantis.azurecr.io/core/admission-controller:1.16.1 |
aws-cluster-api-controller |
mirantis.azurecr.io/core/aws-cluster-api-controller:1.16.1 |
|
aws-credentials-controller |
mirantis.azurecr.io/core/aws-credentials-controller:1.16.1 |
|
byo-cluster-api-controller |
mirantis.azurecr.io/core/byo-cluster-api-controller:1.16.1 |
|
byo-credentials-controller |
mirantis.azurecr.io/core/byo-credentials-controller:1.16.1 |
|
cluster-api-provider-baremetal |
mirantis.azurecr.io/core/cluster-api-provider-baremetal:1.16.1 |
|
frontend |
mirantis.azurecr.io/core/frontend:1.16.1 |
|
iam-controller |
mirantis.azurecr.io/core/iam-controller:1.16.1 |
|
lcm-controller |
mirantis.azurecr.io/core/lcm-controller:v0.2.0-224-g5c413d37 |
|
openstack-cluster-api-controller |
mirantis.azurecr.io/core/openstack-cluster-api-controller:1.16.1 |
|
os-credentials-controller |
mirantis.azurecr.io/core/os-credentials-controller:1.16.1 |
|
release-controller |
mirantis.azurecr.io/core/release-controller:1.16.1 |
|
vsphere-cluster-api-controller |
mirantis.azurecr.io/core/vsphere-api-controller:1.16.1 |
|
vsphere-credentials-controller |
mirantis.azurecr.io/core/vsphere-credentials-controller:1.16.4 |
Artifact |
Component |
Path |
|---|---|---|
Binaries |
hash-generate-linux |
http://binary.mirantis.com/iam/bin/hash-generate-0.0.1-268-3cf7f17-linux |
hash-generate-darwin |
http://binary.mirantis.com/iam/bin/hash-generate-0.0.1-268-3cf7f17-darwin |
|
iamctl-linux Updated |
||
iamctl-darwin Updated |
||
iamctl-windows Updated |
||
Helm charts |
iam Updated |
|
iam-proxy |
||
keycloak-proxy Updated |
http://binary.mirantis.com/core/helm/keycloak_proxy-1.16.3.tgz |
|
Docker images |
api |
mirantis.azurecr.io/iam/api:0.3.18 |
auxiliary |
mirantis.azurecr.io/iam/auxiliary:0.3.18 |
|
kubernetes-entrypoint Updated |
mirantis.azurecr.io/openstack/extra/kubernetes-entrypoint:v1.0.0-20200311160233 |
|
mariadb Updated |
mirantis.azurecr.io/general/mariadb:10.4.16-bionic-20201105025052 |
|
keycloak |
mirantis.azurecr.io/iam/keycloak:0.3.19 |
|
keycloak-gatekeeper |
mirantis.azurecr.io/iam/keycloak-gatekeeper:6.0.1 |
See also
The Mirantis Container Cloud GA release 2.3.0:
Introduces support for the Cluster release 5.10.0 that is based on Kubernetes 1.18 and the updated versions of Mirantis Kubernetes Engine 3.3.4 and Mirantis Container Runtime 19.03.13.
Introduces support for the Cluster release 6.10.0 that is based on the Cluster release 5.10.0 and supports Mirantis OpenStack for Kubernetes (MOSK) Ussuri.
Still supports previous Cluster releases 5.9.0 and 6.8.1 that are now deprecated and will become unsupported in one of the following Container Cloud releases.
Caution
Make sure to update the Cluster release version of your managed cluster before the current Cluster release version becomes unsupported by a new Container Cloud release version. Otherwise, Container Cloud stops auto-upgrade and eventually Container Cloud itself becomes unsupported.
This section outlines release notes for the Container Cloud release 2.3.0.
This section outlines new features and enhancements introduced in the Mirantis Container Cloud release 2.3.0. For the list of enhancements in the Cluster release 5.10.0 and Cluster release 6.10.0 introduced by the Container Cloud release 2.3.0, see the 5.10.0 and 6.10.0 sections.
Updated versions of Mirantis Kubernetes Engine and Container Runtime
Automated setup of a VM template for the VMware vSphere provider
Support of multiple host-specific L2 templates per a bare metal cluster
Updated the Mirantis Kubernetes Engine (MKE) version to 3.3.4 and the Mirantis Container Runtime (MCR) version to 19.03.13 for the Container Cloud management and managed clusters.
For the MKE release highlights and components versions, see MKE documentation: MKE release notes.
For the MCR release highlights, see MCR documentation: MCR release notes.
Caution
Due to the development limitations, the MCR upgrade to version 19.03.13 or 19.03.14 on existing Container Cloud clusters is not supported.
Technical Preview
In scope of Technology Preview support for the VMware vSphere provider, added the capability to deploy an additional regional vSphere-based cluster on top of the vSphere management cluster to create managed clusters with different configurations if required.
Technical Preview
Automated the process of a VM template setup for the vSphere-based
management and managed clusters deployments.
The VM template is now set up by Packer using the vsphere_template flag
that is integrated into bootstrap.sh.
Technical Preview
Added the capability to deploy StackLight on management clusters. However, such deployment has the following limitations:
The Kubernetes Nodes and Kubernetes Cluster Grafana dashboards may have empty panels.
The
DockerNetworkUnhealthyandetcdGRPCRequestsSlowalerts may fail to raise.The
CPUThrottlingHigh,CalicoDatapaneIfaceMsgBatchSizeHigh,KubeCPUOvercommitPods,KubeMemOvercommitPodsalerts, and theTargetDownalert for theprometheus-node-exporterandcalico-nodepods may be constantly firing.
Added support of multiple host-specific L2 templates to be applied to different nodes of the same bare metal cluster. Now, you can use several independent host-specific L2 templates on a cluster to support different hardware configurations. For example, you can create L2 templates with a different number and layout of NICs to be applied to the specific machines of a cluster.
Learn more
Improved user experience with the Container Cloud resources logs collection by implementing collecting of logs on the Mirantis Kubernetes Engine cluster and on all Kubernetes pods, including the ones that were previously removed or failed.
This section lists known issues with workarounds for the Mirantis Container Cloud release 2.3.0 including the Cluster release 5.10.0.
Note
This section also outlines still valid known issues from previous Container Cloud releases.
Fixed in the Cluster release 7.0.0
Note
The issue below affects only the Kubernetes 1.18 deployments. Moving forward, the workaround for this issue will be moved from Release Notes to Troubleshooting Guide.
On a management cluster with multiple AWS-based managed
clusters, some clusters fail to complete the deployments that require
persistent volumes (PVs), for example, Elasticsearch.
Some of the affected pods get stuck in the Pending state
with the pod has unbound immediate PersistentVolumeClaims and
node(s) had volume node affinity conflict errors.
Warning
The workaround below applies to HA deployments where data can be rebuilt from replicas. If you have a non-HA deployment, back up any existing data before proceeding, since all data will be lost while applying the workaround.
Workaround:
Obtain the persistent volume claims related to the storage mounts of the affected pods:
kubectl get pod/<pod_name1> pod/<pod_name2> \ -o jsonpath='{.spec.volumes[?(@.persistentVolumeClaim)].persistentVolumeClaim.claimName}'
Note
In the command above and in the subsequent steps, substitute the parameters enclosed in angle brackets with the corresponding values.
Delete the affected
PodsandPersistentVolumeClaimsto reschedule them: For example, for StackLight:kubectl -n stacklight delete \ pod/<pod_name1> pod/<pod_name2> ... pvc/<pvc_name2> pvc/<pvc_name2> ...
Fixed in Container Cloud 2.5.0
During a management or managed cluster deployment, LVM cannot be deployed on a new disk if an old volume group with the same name already exists on the target hardware node but on the different disk.
Workaround:
In the bare metal host profile specific to your hardware configuration,
add the wipe: true parameter to the device that fails to be deployed.
For the procedure details,
see Operations Guide: Create a custom host profile.
Fixed in 2.11.0
If an L2 template is configured incorrectly, a bare metal cluster is deployed
successfully but with the runtime errors in the IpamHost object.
Workaround:
If you suspect that the machine is not working properly because
of incorrect network configuration, verify the status of the corresponding
IpamHost object. Inspect the l2RenderResult and ipAllocationResult
object fields for error messages.
Fixed in Container Cloud 2.5.0
If BareMetalHost is manually removed from a managed cluster, it is
silently removed without a power-off and deprovision that leads to a managed
cluster failures.
Workaround:
Do not manually delete a BareMetalHost that has the Provisioned status.
Fixed in Container Cloud 2.6.0
If you run bootstrap.sh preflight with
KAAS_BM_FULL_PREFLIGHT=true, the script fails with the following message:
failed to create BareMetal objects: failed to wait for objects of kinds BareMetalHost
to become available: timed out waiting for the condition
As a workaround, unset full preflight using unset KAAS_BM_FULL_PREFLIGHT
to run fast preflight instead.
Fixed in Container Cloud 2.4.0
During a management cluster deployment, IAM fails to start with the IAM
pods being in the CrashLoopBackOff status.
Workaround:
Log in to the bootstrap node.
Remove the
iam-mariadb-stateconfigmap:kubectl delete cm -n kaas iam-mariadb-state
Manually delete the
mariadbpods:kubectl delete po -n kaas mariadb-server-{0,1,2}
Wait for the pods to start. If the
mariadbpod does not start with the connection to peer timed out exception, repeat the step 2.Obtain the MariaDB database admin password:
kubectl get secrets -n kaas mariadb-dbadmin-password \ -o jsonpath='{.data.MYSQL_DBADMIN_PASSWORD}' | base64 -d ; echo
Log in to MariaDB:
kubectl exec -it -n kaas mariadb-server-0 -- bash -c 'mysql -uroot -p<mysqlDbadminPassword>'
Substitute
<mysqlDbadminPassword>with the corresponding value obtained in the previous step.Run the following command:
DROP DATABASE IF EXISTS keycloak;
Manually delete the Keycloak pods:
kubectl delete po -n kaas iam-keycloak-{0,1,2}
Helm releases may get stuck in the PENDING_UPGRADE status
during a management or managed cluster upgrade. The HelmBundle Controller
cannot recover from this state and requires manual actions. The workaround
below describes the recovery process for the openstack-operator release
that stuck during a managed cluster update. Use it as an example for other
Helm releases as required.
Workaround:
Log in to the
helm-controllerpod console:kubectl exec -n kube-system -it helm-controller-0 sh -c tiller
Identify the release that stuck in the
PENDING_UPGRADEstatus. For example:./helm --host=localhost:44134 history openstack-operator
Example of system response:
REVISION UPDATED STATUS CHART DESCRIPTION 1 Tue Dec 15 12:30:41 2020 SUPERSEDED openstack-operator-0.3.9 Install complete 2 Tue Dec 15 12:32:05 2020 SUPERSEDED openstack-operator-0.3.9 Upgrade complete 3 Tue Dec 15 16:24:47 2020 PENDING_UPGRADE openstack-operator-0.3.18 Preparing upgrade
Roll back the failed release to the previous revision:
Download the Helm v3 binary. For details, see official Helm documentation.
Roll back the failed release:
helm rollback <failed-release-name>
For example:
helm rollback openstack-operator 2
Once done, the release will be reconciled.
Fixed in Container Cloud 2.7.0
A Ceph node removal is not being triggered properly after updating
the KaasCephCluster custom resource (CR). Both management and managed
clusters are affected.
Workaround:
Remove the parameters for a Ceph OSD from the
KaasCephClusterCR as described in Operations Guide: Add, remove, or reconfigure Ceph nodes.Obtain the IDs of the
osdandmonservices that are located on the old node:Obtain the UID of the affected machine:
kubectl get machine <CephOSDNodeName> -n <ManagedClusterProjectName> -o jsonpath='{.metadata.annotations.kaas\.mirantis\.com\/uid}'
Export
kubeconfigof your managed cluster. For example:export KUBECONFIG=~/Downloads/kubeconfig-test-cluster.yml
Identify the pods IDs that run the
osdandmonservices:kubectl get pods -o wide -n rook-ceph | grep <affectedMachineUID> | grep -E "mon|osd"
Example of the system response extract:
rook-ceph-mon-c-7bbc5d757d-5bpws 1/1 Running 1 6h1m rook-ceph-osd-2-58775d5568-5lklw 1/1 Running 4 44h rook-ceph-osd-prepare-705ae6c647cfdac928c63b63e2e2e647-qn4m9 0/1 Completed 0 94s
The pods IDs include the
osdormonservices IDs. In the example system response above, theosdID is2and themonID isc.
Delete the deployments of the
osdandmonservices obtained in the previous step:kubectl delete deployment rook-ceph-osd(mon)-<ID> -n rook-ceph
For example:
kubectl delete deployment rook-ceph-mon-c -n rook-ceph kubectl delete deployment rook-ceph-osd-2 -n rook-ceph
Log in to the
ceph-toolspod:kubectl -n rook-ceph exec -it $(kubectl -n rook-ceph get pod -l "app=rook-ceph-tools" -o jsonpath='{.items[0].metadata.name}') bash
Rebalance the Ceph OSDs:
ceph osd out osd(s).ID
Wait for the rebalance to complete.
Rebalance the Ceph data:
ceph osd purge osd(s).ID
Wait for the Ceph data to rebalance.
Remove the old node from the Ceph OSD tree:
ceph osd crush rm <NodeName>
If the removed node contained
monservices, remove them:ceph mon rm <monID>
Fixed in Container Cloud 2.5.0
During a managed cluster update, Ceph rebalance leading to data loss may occur.
Workaround:
Before updating a managed cluster:
Log in to the
ceph-toolspod:kubectl -n rook-ceph exec -it <ceph-tools-pod-name> bash
Set the
nooutflag:ceph osd set noout
After updating a managed cluster:
Log in to the
ceph-toolspod:kubectl -n rook-ceph exec -it <ceph-tools-pod-name> bash
Unset the
nooutflag:ceph osd unset noout
When removing a worker node, it is not possible to automatically remove a Ceph node. The workaround is to manually remove the Ceph node from the Ceph cluster as described in Operations Guide: Add, remove, or reconfigure Ceph nodes before removing the worker node from your deployment.
Fixed in 2.11.0
If you use a custom BareMetalHostProfile, after disk replacement
on a Ceph OSD, the Ceph OSD pod switches to the CrashLoopBackOff state
due to the Ceph OSD authorization key failing to be created properly.
Workaround:
Export
kubeconfigof your managed cluster. For example:export KUBECONFIG=~/Downloads/kubeconfig-test-cluster.yml
Log in to the
ceph-toolspod:kubectl -n rook-ceph exec -it $(kubectl -n rook-ceph get pod -l "app=rook-ceph-tools" -o jsonpath='{.items[0].metadata.name}') bash
Delete the authorization key for the failed Ceph OSD:
ceph auth del osd.<ID>
SSH to the node on which the Ceph OSD cannot be created.
Clean up the disk that will be a base for the failed Ceph OSD. For details, see official Rook documentation.
Note
Ignore failures of the sgdisk --zap-all $DISK and blkdiscard $DISK commands if any.
On the managed cluster, restart Rook Operator:
kubectl -n rook-ceph delete pod -l app=rook-ceph-operator
Affects only Container Cloud 2.18.0 and earlier
A project that is newly created in the Container Cloud web UI does not display in the Projects list even after refreshing the page. The issue occurs due to the token missing the necessary role for the new project. As a workaround, relogin to the Container Cloud web UI.
The following issues have been addressed in the Mirantis Container Cloud release 2.3.0 and the Cluster releases 5.10.0 and 6.10.0:
[8869] Upgraded
kindfrom version 0.3.0 to 0.9.0 and thekindest/nodeimage version from 1.14.2 to 1.18.8 to enhance the Container Cloud performance and prevent compatibility issues.[8220] Fixed the issue with failure to switch the
defaultlabel from oneBareMetalHostProfileto another.[7255] Fixed the issue with slow creation of the OpenStack clients and pools by redesigning as well as increasing efficiency and speed of
ceph-controller.[8618] Fixed the issue with missing pools during a Ceph cluster deployment.
[8111] Fixed the issue with a Ceph cluster being available after deleting it using the Container Cloud web UI or deleting the
KaaSCephClusterobject from the Kubernetes namespace using CLI.[8409, 3836] Refactored and stabilized the upgrade procedure to prevent locks during the upgrade operations.
[8925] Fixed improper handling of errors in
lcm-controllerthat may lead to its panic.[8361] Fixed the issue with
admission-controllerallowing addition of duplicated node labels per machine.[8402] Fixed the issue with the AWS provider failing during node labeling with the Observed a panic: “invalid memory address or nil pointer dereference” error if
privateIPis not set for a machine.[7673] Moved logs collection of the bootstrap cluster to the
/bootstrapsubdirectory to prevent unintentional erasure of the management and regional cluster logs.
The following table lists the major components and their versions of the Mirantis Container Cloud release 2.3.0.
Note
The components that are newly added, updated, deprecated, or removed
as compared to the previous release version, are marked
with a corresponding superscript,
for example, lcm-ansible Updated.
Component |
Application/Service |
Version |
|---|---|---|
AWS Updated |
aws-provider |
1.15.4 |
aws-credentials-controller |
1.15.4 |
|
Bare metal |
baremetal-operator Updated |
3.1.6 |
baremetal-public-api Updated |
3.1.6 |
|
baremetal-provider Updated |
1.15.4 |
|
httpd |
2.4.46-20201001171500 |
|
ironic Updated |
ussuri-bionic-20201111180110 |
|
ironic-operator Updated |
base-bionic-20201106182102 |
|
kaas-ipam Updated |
20201210175212 |
|
local-volume-provisioner |
1.0.4-mcp |
|
mariadb |
10.4.14-bionic-20200812025059 |
|
IAM |
iam |
1.1.22 |
iam-controller Updated |
1.15.4 |
|
keycloak |
9.0.0 |
|
Container Cloud Updated |
admission-controller |
1.15.4 |
byo-credentials-controller |
1.15.4 |
|
byo-provider |
1.15.4 |
|
kaas-public-api |
1.15.4 |
|
kaas-exporter |
1.15.4 |
|
kaas-ui |
1.15.4 |
|
lcm-controller |
0.2.0-224-g5c413d37 |
|
release-controller |
1.15.4 |
|
OpenStack Updated |
openstack-provider |
1.15.4 |
os-credentials-controller |
1.15.4 |
|
VMware vSphere Updated |
vsphere-provider |
1.15.4 |
vsphere-credentials-controller |
1.15.4 |
This section lists the components artifacts of the Mirantis Container Cloud release 2.3.0.
Note
The components that are newly added, updated, deprecated, or removed
as compared to the previous release version, are marked
with a corresponding superscript,
for example, lcm-ansible Updated.
Artifact |
Component |
Path |
|---|---|---|
Binaries |
baremetal-operator Updated |
https://binary.mirantis.com/bm/helm/baremetal-operator-3.1.6.tgz |
baremetal-public-api Updated |
https://binary.mirantis.com/bm/helm/baremetal-public-api-3.1.6.tgz |
|
ironic-python-agent.kernel Updated |
https://binary.mirantis.com/bm/bin/ironic/ipa/ubuntu/kernel-ussuri-bionic-debug-20201119132200 |
|
ironic-python-agent.initramfs Updated |
https://binary.mirantis.com/bm/bin/ironic/ipa/ubuntu/initramfs-ussuri-bionic-debug-20201119132200 |
|
kaas-ipam Updated |
||
local-volume-provisioner |
https://binary.mirantis.com/bm/helm/local-volume-provisioner-1.0.4-mcp.tgz |
|
Docker images |
baremetal-operator Updated |
mirantis.azurecr.io/bm/baremetal-operator:base-bionic-20201113171304 |
httpd |
mirantis.azurecr.io/bm/external/httpd:2.4.46-20201001171500 |
|
ironic Updated |
mirantis.azurecr.io/openstack/ironic:ussuri-bionic-20201111180110 |
|
ironic-inspector Updated |
mirantis.azurecr.io/openstack/ironic-inspector:ussuri-bionic-20201111180110 |
|
ironic-operator Updated |
mirantis.azurecr.io/bm/ironic-operator:base-bionic-20201106182102 |
|
kaas-ipam Updated |
mirantis.azurecr.io/bm/kaas-ipam:base-bionic-20201210175212 |
|
mariadb |
mirantis.azurecr.io/general/mariadb:10.4.14-bionic-20200812025059 |
Artifact |
Component |
Path |
|---|---|---|
Bootstrap tarball Updated |
bootstrap-linux |
https://binary.mirantis.com/core/bin/bootstrap-linux-1.15.4.tar.gz |
bootstrap-darwin |
https://binary.mirantis.com/core/bin/bootstrap-darwin-1.15.4.tar.gz |
|
Helm charts Updated |
admission-controller |
https://binary.mirantis.com/core/helm/admission-controller-1.15.4.tgz |
aws-credentials-controller |
https://binary.mirantis.com/core/helm/aws-credentials-controller-1.15.4.tgz |
|
aws-provider |
https://binary.mirantis.com/core/helm/aws-provider-1.15.4.tgz |
|
baremetal-provider |
https://binary.mirantis.com/core/helm/baremetal-provider-1.15.4.tgz |
|
byo-credentials-controller |
https://binary.mirantis.com/core/helm/byo-credentials-controller-1.15.4.tgz |
|
byo-provider |
https://binary.mirantis.com/core/helm/byo-provider-1.15.4.tgz |
|
iam-controller |
https://binary.mirantis.com/core/helm/iam-controller-1.15.4.tgz |
|
kaas-exporter |
https://binary.mirantis.com/core/helm/kaas-exporter-1.15.4.tgz |
|
kaas-public-api |
https://binary.mirantis.com/core/helm/kaas-public-api-1.15.4.tgz |
|
kaas-ui |
||
lcm-controller |
https://binary.mirantis.com/core/helm/lcm-controller-1.15.4.tgz |
|
openstack-provider |
https://binary.mirantis.com/core/helm/openstack-provider-1.15.4.tgz |
|
os-credentials-controller |
https://binary.mirantis.com/core/helm/os-credentials-controller-1.15.4.tgz |
|
release-controller |
https://binary.mirantis.com/core/helm/release-controller-1.15.4.tgz |
|
vsphere-credentials-controller |
https://binary.mirantis.com/core/helm/vsphere-credentials-controller-1.15.4.tgz |
|
vsphere-provider |
https://binary.mirantis.com/core/helm/vsphere-provider-1.15.4.tgz |
|
Docker images Updated |
admission-controller |
mirantis.azurecr.io/core/admission-controller:1.15.4 |
aws-cluster-api-controller |
mirantis.azurecr.io/core/aws-cluster-api-controller:1.15.4 |
|
aws-credentials-controller |
mirantis.azurecr.io/core/aws-credentials-controller:1.15.4 |
|
byo-cluster-api-controller |
mirantis.azurecr.io/core/byo-cluster-api-controller:1.15.4 |
|
byo-credentials-controller |
mirantis.azurecr.io/core/byo-credentials-controller:1.15.4 |
|
cluster-api-provider-baremetal |
mirantis.azurecr.io/core/cluster-api-provider-baremetal:1.15.4 |
|
frontend |
mirantis.azurecr.io/core/frontend:1.15.4 |
|
iam-controller |
mirantis.azurecr.io/core/iam-controller:1.15.4 |
|
lcm-controller |
mirantis.azurecr.io/core/lcm-controller:v0.2.0-224-g5c413d37 |
|
openstack-cluster-api-controller |
mirantis.azurecr.io/core/openstack-cluster-api-controller:1.15.4 |
|
os-credentials-controller |
mirantis.azurecr.io/core/os-credentials-controller:1.15.4 |
|
release-controller |
mirantis.azurecr.io/core/release-controller:1.15.4 |
|
vsphere-cluster-api-controller |
mirantis.azurecr.io/core/vsphere-api-controller:1.15.4 |
|
vsphere-credentials-controller |
mirantis.azurecr.io/core/vsphere-credentials-controller:1.15.4 |
Artifact |
Component |
Path |
|---|---|---|
Binaries |
hash-generate-linux |
http://binary.mirantis.com/iam/bin/hash-generate-0.0.1-268-3cf7f17-linux |
hash-generate-darwin |
http://binary.mirantis.com/iam/bin/hash-generate-0.0.1-268-3cf7f17-darwin |
|
iamctl-linux |
||
iamctl-darwin |
||
iamctl-windows |
||
Helm charts |
iam Updated |
|
iam-proxy |
||
keycloak-proxy Updated |
http://binary.mirantis.com/core/helm/keycloak_proxy-1.14.3.tgz |
|
Docker images |
api |
mirantis.azurecr.io/iam/api:0.3.18 |
auxiliary |
mirantis.azurecr.io/iam/auxiliary:0.3.18 |
|
kubernetes-entrypoint |
mirantis.azurecr.io/iam/external/kubernetes-entrypoint:v0.3.1 |
|
mariadb |
mirantis.azurecr.io/iam/external/mariadb:10.2.18 |
|
keycloak Updated |
mirantis.azurecr.io/iam/keycloak:0.3.19 |
|
keycloak-gatekeeper |
mirantis.azurecr.io/iam/keycloak-gatekeeper:6.0.1 |
See also
This section outlines release notes for the Mirantis Container Cloud GA release 2.2.0. This release introduces support for the Cluster release 5.9.0 that is based on Mirantis Kubernetes Engine 3.3.3, Mirantis Container Runtime 19.03.12, and Kubernetes 1.18. This release also introduces support for the Cluster release 6.8.1 that introduces the support of the Mirantis OpenStack for Kubernetes (MOSK) product.
This section outlines new features and enhancements introduced in the Mirantis Container Cloud release 2.2.0. For the list of enhancements in the Cluster release 5.9.0 and Cluster release 6.8.1 introduced by the Container Cloud release 2.2.0, see 5.9.0 and 6.8.1.
TECHNICAL PREVIEW
Introduced the Technology Preview support for the VMware vSphere cloud provider on RHEL, including support for creation and operating of managed clusters using the Container Cloud web UI.
Deployment of an additional regional vSphere-based cluster or attaching an existing Mirantis Kubernetes Engine (MKE) cluster to a vSphere-based management cluster is on the development stage and will be announced in one of the following Container Cloud releases.
Note
For the Technology Preview feature definition, refer to Technology Preview features.
Implemented the API for managing kernel parameters typically managed by
sysctl for bare metal hosts through the BareMetalHost and
BareMetalHostProfile objects fields.
Implemented support of multiple subnets per a Container Cloud cluster with
an ability to specify a different network type for each subnet.
Introduced the SubnetPool object that allows for automatic creation of the
Subnet objects. Also, added the L3Layout section to
L2Template.spec. The L3Layout configuration allows defining the
subnets scopes to be used and to enable auto-creation of subnets
from a subnet pool.
Optimized user experience with the Container Cloud resources logs collection:
Added a separate file with a human-readable table that contains information about cluster events
Implemented collecting of system logs from cluster nodes
On top of continuous improvements delivered to the existing Container Cloud guides, added the Mirantis Container Cloud API section to the Operations Guide. This section is intended only for advanced Infrastructure Operators who are familiar with Kubernetes Cluster API.
Currently, this section contains descriptions and examples of the Container Cloud API resources for the bare metal cloud provider. The API documentation for the OpenStack, AWS, and VMware vSphere API resources will be added in the upcoming Container Cloud releases.
Learn more
This section lists known issues with workarounds for the Mirantis Container Cloud release 2.2.0 including the Cluster release 5.9.0.
Note
This section also outlines still valid known issues from previous Container Cloud releases.
Fixed in the Cluster release 7.0.0
Note
The issue below affects only the Kubernetes 1.18 deployments. Moving forward, the workaround for this issue will be moved from Release Notes to Troubleshooting Guide.
On a management cluster with multiple AWS-based managed
clusters, some clusters fail to complete the deployments that require
persistent volumes (PVs), for example, Elasticsearch.
Some of the affected pods get stuck in the Pending state
with the pod has unbound immediate PersistentVolumeClaims and
node(s) had volume node affinity conflict errors.
Warning
The workaround below applies to HA deployments where data can be rebuilt from replicas. If you have a non-HA deployment, back up any existing data before proceeding, since all data will be lost while applying the workaround.
Workaround:
Obtain the persistent volume claims related to the storage mounts of the affected pods:
kubectl get pod/<pod_name1> pod/<pod_name2> \ -o jsonpath='{.spec.volumes[?(@.persistentVolumeClaim)].persistentVolumeClaim.claimName}'
Note
In the command above and in the subsequent steps, substitute the parameters enclosed in angle brackets with the corresponding values.
Delete the affected
PodsandPersistentVolumeClaimsto reschedule them: For example, for StackLight:kubectl -n stacklight delete \ pod/<pod_name1> pod/<pod_name2> ... pvc/<pvc_name2> pvc/<pvc_name2> ...
Fixed in Container Cloud 2.5.0
During a management or managed cluster deployment, LVM cannot be deployed on a new disk if an old volume group with the same name already exists on the target hardware node but on the different disk.
Workaround:
In the bare metal host profile specific to your hardware configuration,
add the wipe: true parameter to the device that fails to be deployed.
For the procedure details,
see Operations Guide: Create a custom host profile.
Fixed in 2.11.0
If an L2 template is configured incorrectly, a bare metal cluster is deployed
successfully but with the runtime errors in the IpamHost object.
Workaround:
If you suspect that the machine is not working properly because
of incorrect network configuration, verify the status of the corresponding
IpamHost object. Inspect the l2RenderResult and ipAllocationResult
object fields for error messages.
Fixed in Container Cloud 2.5.0
If BareMetalHost is manually removed from a managed cluster, it is
silently removed without a power-off and deprovision that leads to a managed
cluster failures.
Workaround:
Do not manually delete a BareMetalHost that has the Provisioned status.
Fixed in Container Cloud 2.4.0
During a management cluster deployment, IAM fails to start with the IAM
pods being in the CrashLoopBackOff status.
Workaround:
Log in to the bootstrap node.
Remove the
iam-mariadb-stateconfigmap:kubectl delete cm -n kaas iam-mariadb-state
Manually delete the
mariadbpods:kubectl delete po -n kaas mariadb-server-{0,1,2}
Wait for the pods to start. If the
mariadbpod does not start with the connection to peer timed out exception, repeat the step 2.Obtain the MariaDB database admin password:
kubectl get secrets -n kaas mariadb-dbadmin-password \ -o jsonpath='{.data.MYSQL_DBADMIN_PASSWORD}' | base64 -d ; echo
Log in to MariaDB:
kubectl exec -it -n kaas mariadb-server-0 -- bash -c 'mysql -uroot -p<mysqlDbadminPassword>'
Substitute
<mysqlDbadminPassword>with the corresponding value obtained in the previous step.Run the following command:
DROP DATABASE IF EXISTS keycloak;
Manually delete the Keycloak pods:
kubectl delete po -n kaas iam-keycloak-{0,1,2}
When removing a worker node, it is not possible to automatically remove a Ceph node. The workaround is to manually remove the Ceph node from the Ceph cluster as described in Operations Guide: Add, remove, or reconfigure Ceph nodes before removing the worker node from your deployment.
Affects only Container Cloud 2.18.0 and earlier
A project that is newly created in the Container Cloud web UI does not display in the Projects list even after refreshing the page. The issue occurs due to the token missing the necessary role for the new project. As a workaround, relogin to the Container Cloud web UI.
The following issues have been addressed in the Mirantis Container Cloud release 2.2.0 including the Cluster release 5.9.0:
[8012] Fixed the issue with
helm-controllerpod being stuck in theCrashLoopBackOffstate after reattaching of a Mirantis Kubernetes Engine (MKE) cluster.[7131] Fixed the issue with the deployment of a managed cluster failing during the Ceph Monitor or Manager deployment.
[6164] Fixed the issue with the number of placement groups (PGs) per Ceph OSD being too small and the Ceph cluster having the
HEALTH_WARNstatus.[8302] Fixed the issue with deletion of a regional cluster leading to the deletion of the related management cluster.
[7722] Fixed the issue with the Internal Server Error or similar errors appearing in the
HelmBundlecontroller logs after bootstrapping the management cluster.
The following table lists the major components and their versions of the Mirantis Container Cloud release 2.2.0.
Note
The components that are newly added, updated, deprecated, or removed
as compared to the previous release version, are marked
with a corresponding superscript,
for example, lcm-ansible Updated.
Component |
Application/Service |
Version |
|---|---|---|
AWS Updated |
aws-provider |
1.14.0 |
aws-credentials-controller |
1.14.0 |
|
Bare metal |
baremetal-operator Updated |
3.1.3 |
baremetal-public-api Updated |
3.1.3 |
|
baremetal-provider Updated |
1.14.0 |
|
httpd |
2.4.46-20201001171500 |
|
ironic Updated |
ussuri-bionic-20201021180016 |
|
ironic-operator Updated |
base-bionic-20201023172943 |
|
kaas-ipam Updated |
20201026094912 |
|
local-volume-provisioner |
1.0.4-mcp |
|
mariadb |
10.4.14-bionic-20200812025059 |
|
IAM |
iam Updated |
1.1.22 |
iam-controller Updated |
1.14.0 |
|
keycloak |
9.0.0 |
|
Container Cloud Updated |
admission-controller |
1.14.0 |
byo-credentials-controller |
1.14.0 |
|
byo-provider |
1.14.3 |
|
kaas-public-api |
1.14.0 |
|
kaas-exporter |
1.14.0 |
|
kaas-ui |
1.14.2 |
|
lcm-controller |
0.2.0-178-g8cc488f8 |
|
release-controller |
1.14.0 |
|
OpenStack Updated |
openstack-provider |
1.14.0 |
os-credentials-controller |
1.14.0 |
|
VMware vSphere New |
vsphere-provider |
1.14.1 |
vsphere-credentials-controller |
1.14.1 |
This section lists the components artifacts of the Mirantis Container Cloud release 2.2.0.
Note
The components that are newly added, updated, deprecated, or removed
as compared to the previous release version, are marked
with a corresponding superscript,
for example, lcm-ansible Updated.
Artifact |
Component |
Path |
|---|---|---|
Binaries |
Target system image (ubuntu-bionic) |
https://binary.mirantis.com/bm/bin/efi/ubuntu/qcow2-bionic-debug-20200730084816 |
baremetal-operator Updated |
https://binary.mirantis.com/bm/helm/baremetal-operator-3.1.3.tgz |
|
baremetal-public-api Updated |
https://binary.mirantis.com/bm/helm/baremetal-public-api-3.1.3.tgz |
|
ironic-python-agent.kernel Updated |
https://binary.mirantis.com/bm/bin/ironic/ipa/ubuntu/kernel-ussuri-bionic-debug-20201022084817 |
|
ironic-python-agent.initramfs Updated |
https://binary.mirantis.com/bm/bin/ironic/ipa/ubuntu/initramfs-ussuri-bionic-debug-20201022084817 |
|
kaas-ipam Updated |
||
local-volume-provisioner |
https://binary.mirantis.com/bm/helm/local-volume-provisioner-1.0.4-mcp.tgz |
|
Docker images |
baremetal-operator Updated |
mirantis.azurecr.io/bm/baremetal-operator:base-bionic-20201028131325 |
httpd |
mirantis.azurecr.io/bm/external/httpd:2.4.46-20201001171500 |
|
ironic Updated |
mirantis.azurecr.io/openstack/ironic:ussuri-bionic-20201021180016 |
|
ironic-inspector Updated |
mirantis.azurecr.io/openstack/ironic-inspector:ussuri-bionic-20201021180016 |
|
ironic-operator Updated |
mirantis.azurecr.io/bm/ironic-operator:base-bionic-20201023172943 |
|
kaas-ipam Updated |
mirantis.azurecr.io/bm/kaas-ipam:base-bionic-20201026094912 |
|
mariadb |
mirantis.azurecr.io/general/mariadb:10.4.14-bionic-20200812025059 |
Artifact |
Component |
Path |
|---|---|---|
Bootstrap tarball Updated |
bootstrap-linux |
https://binary.mirantis.com/core/bin/bootstrap-linux-1.14.0.tar.gz |
bootstrap-darwin |
https://binary.mirantis.com/core/bin/bootstrap-darwin-1.14.0.tar.gz |
|
Helm charts Updated |
admission-controller |
https://binary.mirantis.com/core/helm/admission-controller-1.14.0.tgz |
aws-credentials-controller |
https://binary.mirantis.com/core/helm/aws-credentials-controller-1.14.0.tgz |
|
aws-provider |
https://binary.mirantis.com/core/helm/aws-provider-1.14.0.tgz |
|
baremetal-provider |
https://binary.mirantis.com/core/helm/baremetal-provider-1.14.0.tgz |
|
byo-credentials-controller |
https://binary.mirantis.com/core/helm/byo-credentials-controller-1.14.0.tgz |
|
byo-provider |
https://binary.mirantis.com/core/helm/byo-provider-1.14.3.tgz |
|
iam-controller |
https://binary.mirantis.com/core/helm/iam-controller-1.14.0.tgz |
|
kaas-exporter |
https://binary.mirantis.com/core/helm/kaas-exporter-1.14.0.tgz |
|
kaas-public-api |
https://binary.mirantis.com/core/helm/kaas-public-api-1.14.0.tgz |
|
kaas-ui |
||
lcm-controller |
https://binary.mirantis.com/core/helm/lcm-controller-1.14.0.tgz |
|
openstack-provider |
https://binary.mirantis.com/core/helm/openstack-provider-1.14.0.tgz |
|
os-credentials-controller |
https://binary.mirantis.com/core/helm/os-credentials-controller-1.14.0.tgz |
|
release-controller |
https://binary.mirantis.com/core/helm/release-controller-1.14.0.tgz |
|
vsphere-credentials-controller New |
https://binary.mirantis.com/core/helm/vsphere-credentials-controller-1.14.1.tgz |
|
vsphere-provider New |
https://binary.mirantis.com/core/helm/vsphere-provider-1.14.1.tgz |
|
Docker images for Container Cloud deployment |
admission-controller Updated |
mirantis.azurecr.io/core/admission-controller:1.14.0 |
aws-cluster-api-controller |
mirantis.azurecr.io/core/aws-cluster-api-controller:1.14.0 |
|
aws-credentials-controller Updated |
mirantis.azurecr.io/core/aws-credentials-controller:1.14.0 |
|
byo-cluster-api-controller |
mirantis.azurecr.io/core/byo-cluster-api-controller:1.14.3 |
|
byo-credentials-controller Updated |
mirantis.azurecr.io/core/byo-credentials-controller:1.14.0 |
|
cluster-api-provider-baremetal Updated |
mirantis.azurecr.io/core/cluster-api-provider-baremetal:1.14.0 |
|
frontend |
mirantis.azurecr.io/core/frontend:1.14.2 |
|
iam-controller Updated |
mirantis.azurecr.io/core/iam-controller:1.14.0 |
|
lcm-controller Updated |
mirantis.azurecr.io/core/lcm-controller:v0.2.0-178-g8cc488f8 |
|
openstack-cluster-api-controller |
mirantis.azurecr.io/core/openstack-cluster-api-controller:1.14.0 |
|
os-credentials-controller Updated |
mirantis.azurecr.io/core/os-credentials-controller:1.14.0 |
|
release-controller Updated |
mirantis.azurecr.io/core/release-controller:1.14.0 |
|
vsphere-cluster-api-controller New |
mirantis.azurecr.io/core/vsphere-api-controller:1.14.1 |
|
vsphere-credentials-controller New |
mirantis.azurecr.io/core/vsphere-credentials-controller:1.14.1 |
Artifact |
Component |
Path |
|---|---|---|
Binaries |
hash-generate-linux |
http://binary.mirantis.com/iam/bin/hash-generate-0.0.1-268-3cf7f17-linux |
hash-generate-darwin |
http://binary.mirantis.com/iam/bin/hash-generate-0.0.1-268-3cf7f17-darwin |
|
iamctl-linux |
||
iamctl-darwin |
||
iamctl-windows |
||
Helm charts |
iam Updated |
|
iam-proxy |
||
keycloak-proxy Updated |
http://binary.mirantis.com/core/helm/keycloak_proxy-1.14.3.tgz |
|
Docker images |
api |
mirantis.azurecr.io/iam/api:0.3.18 |
auxiliary |
mirantis.azurecr.io/iam/auxiliary:0.3.18 |
|
kubernetes-entrypoint |
mirantis.azurecr.io/iam/external/kubernetes-entrypoint:v0.3.1 |
|
mariadb |
mirantis.azurecr.io/iam/external/mariadb:10.2.18 |
|
keycloak Updated |
mirantis.azurecr.io/iam/keycloak:0.3.19 |
|
keycloak-gatekeeper |
mirantis.azurecr.io/iam/keycloak-gatekeeper:6.0.1 |
See also
This section outlines release notes for the Mirantis Container Cloud GA release 2.1.0. This release introduces support for the Cluster release 5.8.0 that is based on Mirantis Kubernetes Engine 3.3.3, Mirantis Container Runtime 19.03.12, and Kubernetes 1.18.
This section outlines new features and enhancements introduced in the Mirantis Container Cloud release 2.1.0. For the list of enhancements in the Cluster release 5.8.0 introduced by the KaaS release 2.1.0, see 5.8.0.
Implemented the possibility to assign labels to specific machines with
dedicated system and hardware resources through the Container Cloud web UI.
For example, you can label the StackLight nodes that run Elasticsearch and
require more resources than a standard node to run the StackLight components
services on the dedicated nodes.
You can label a machine before or after it is deployed.
The list of available labels is taken from the current Cluster release.
Node labeling greatly improves cluster performance and prevents pods from being quickly exhausted.
Improved the user experience during a managed cluster creation using the Container Cloud web UI by implementing drop-down menus with available supported values for the following AWS resources:
AWS region
AWS AMI ID
AWS instance type
To apply the feature to existing deployments, update the IAM policies for AWS.
Implemented the following statuses for the OpenStack-based and AWS-based credentials in the Container Cloud web UI:
- Ready
Credentials are valid and ready to be used for a managed cluster creation.
- In Use
Credentials are being used by a managed cluster.
- Error
Credentials are invalid. You can hover over the Error status to determine the reason of the issue.
This section lists known issues with workarounds for the Mirantis Container Cloud release 2.1.0.
Note
This section also outlines still valid known issues from previous Container Cloud releases.
Fixed in the Cluster release 7.0.0
Note
The issue below affects only the Kubernetes 1.18 deployments. Moving forward, the workaround for this issue will be moved from Release Notes to Troubleshooting Guide.
On a management cluster with multiple AWS-based managed
clusters, some clusters fail to complete the deployments that require
persistent volumes (PVs), for example, Elasticsearch.
Some of the affected pods get stuck in the Pending state
with the pod has unbound immediate PersistentVolumeClaims and
node(s) had volume node affinity conflict errors.
Warning
The workaround below applies to HA deployments where data can be rebuilt from replicas. If you have a non-HA deployment, back up any existing data before proceeding, since all data will be lost while applying the workaround.
Workaround:
Obtain the persistent volume claims related to the storage mounts of the affected pods:
kubectl get pod/<pod_name1> pod/<pod_name2> \ -o jsonpath='{.spec.volumes[?(@.persistentVolumeClaim)].persistentVolumeClaim.claimName}'
Note
In the command above and in the subsequent steps, substitute the parameters enclosed in angle brackets with the corresponding values.
Delete the affected
PodsandPersistentVolumeClaimsto reschedule them: For example, for StackLight:kubectl -n stacklight delete \ pod/<pod_name1> pod/<pod_name2> ... pvc/<pvc_name2> pvc/<pvc_name2> ...
Fixed in Container Cloud 2.5.0
During a management or managed cluster deployment, LVM cannot be deployed on a new disk if an old volume group with the same name already exists on the target hardware node but on the different disk.
Workaround:
In the bare metal host profile specific to your hardware configuration,
add the wipe: true parameter to the device that fails to be deployed.
For the procedure details,
see Operations Guide: Create a custom host profile.
Fixed in Container Cloud 2.4.0
During a management cluster deployment, IAM fails to start with the IAM
pods being in the CrashLoopBackOff status.
Workaround:
Log in to the bootstrap node.
Remove the
iam-mariadb-stateconfigmap:kubectl delete cm -n kaas iam-mariadb-state
Manually delete the
mariadbpods:kubectl delete po -n kaas mariadb-server-{0,1,2}
Wait for the pods to start. If the
mariadbpod does not start with the connection to peer timed out exception, repeat the step 2.Obtain the MariaDB database admin password:
kubectl get secrets -n kaas mariadb-dbadmin-password \ -o jsonpath='{.data.MYSQL_DBADMIN_PASSWORD}' | base64 -d ; echo
Log in to MariaDB:
kubectl exec -it -n kaas mariadb-server-0 -- bash -c 'mysql -uroot -p<mysqlDbadminPassword>'
Substitute
<mysqlDbadminPassword>with the corresponding value obtained in the previous step.Run the following command:
DROP DATABASE IF EXISTS keycloak;
Manually delete the Keycloak pods:
kubectl delete po -n kaas iam-keycloak-{0,1,2}
Fixed in 2.2.0
After deploying a managed cluster with Ceph, the number of placement groups
(PGs) per Ceph OSD may be too small and the Ceph cluster may have the
HEALTH_WARN status:
health: HEALTH_WARN
too few PGs per OSD (3 < min 30)
The workaround is to enable the PG balancer to properly manage the number of PGs:
kexec -it $(k get pod -l "app=rook-ceph-tools" --all-namespaces -o jsonpath='{.items[0].metadata.name}') -n rook-ceph bash
ceph mgr module enable pg_autoscaler
Fixed in 2.2.0
Occasionally, the deployment of a managed cluster may fail during the Ceph Monitor or Manager deployment. In this case, the Ceph cluster may be down and and a stack trace similar to the following one may be present in Ceph Manager logs:
kubectl -n rook-ceph logs rook-ceph-mgr-a-c5dc846f8-k68rs
/home/jenkins-build/build/workspace/ceph-build/ARCH/x86_64/AVAILABLE_ARCH/x86_64/AVAILABLE_DIST/centos7/DIST/centos7/MACHINE_SIZE/gigantic/release/14.2.9/rpm/el7/BUILD/ceph-14.2.9/src/mon/MonMap.h: In function 'void MonMap::add(const mon_info_t&)' thread 7fd3d3744b80 time 2020-09-03 10:16:46.586388
/home/jenkins-build/build/workspace/ceph-build/ARCH/x86_64/AVAILABLE_ARCH/x86_64/AVAILABLE_DIST/centos7/DIST/centos7/MACHINE_SIZE/gigantic/release/14.2.9/rpm/el7/BUILD/ceph-14.2.9/src/mon/MonMap.h: 195: FAILED ceph_assert(addr_mons.count(a) == 0)
ceph version 14.2.9 (581f22da52345dba46ee232b73b990f06029a2a0) nautilus (stable)
1: (ceph::__ceph_assert_fail(char const*, char const*, int, char const*)+0x14a) [0x7fd3ca9b2875]
2: (()+0x253a3d) [0x7fd3ca9b2a3d]
3: (MonMap::add(mon_info_t const&)+0x80) [0x7fd3cad49190]
4: (MonMap::add(std::string const&, entity_addrvec_t const&, int)+0x110) [0x7fd3cad493a0]
5: (MonMap::init_with_ips(std::string const&, bool, std::string const&)+0xc9) [0x7fd3cad43849]
6: (MonMap::build_initial(CephContext*, bool, std::ostream&)+0x314) [0x7fd3cad45af4]
7: (MonClient::build_initial_monmap()+0x130) [0x7fd3cad2e140]
8: (MonClient::get_monmap_and_config()+0x5f) [0x7fd3cad365af]
9: (global_pre_init(std::map<std::string, std::string, std::less<std::string>, std::allocator<std::pair<std::string const, std::string> > > const*, std::vector<char const*, std::allocator<char const*> >&, unsigned int, code_environment_t, int)+0x524) [0x55ce86711444]
10: (global_init(std::map<std::string, std::string, std::less<std::string>, std::allocator<std::pair<std::string const, std::string> > > const*, std::vector<char const*, std::allocator<char const*> >&, unsigned int, code_environment_t, int, char const*, bool)+0x76) [0x55ce86711b56]
11: (main()+0x136) [0x55ce864ff9a6]
12: (__libc_start_main()+0xf5) [0x7fd3c6e73555]
13: (()+0xfc010) [0x55ce86505010]
The workaround is to start the managed cluster deployment from scratch.
When removing a worker node, it is not possible to automatically remove a Ceph node. The workaround is to manually remove the Ceph node from the Ceph cluster as described in Operations Guide: Add, remove, or reconfigure Ceph nodes before removing the worker node from your deployment.
Affects only Container Cloud 2.18.0 and earlier
A project that is newly created in the Container Cloud web UI does not display in the Projects list even after refreshing the page. The issue occurs due to the token missing the necessary role for the new project. As a workaround, relogin to the Container Cloud web UI.
In the Mirantis Container Cloud release 2.1.0, the following issues have been addressed:
[7281] Fixed the issue with a management cluster bootstrap script failing if there was a space in the
PATHenvironment variable.[7205] Fixed the issue with some cluster objects being stuck during deletion of an AWS-based managed cluster due to unresolved VPC dependencies.
[7304] Fixed the issue with failure to reattach a Mirantis Kubernetes Engine (MKE) cluster with the same name.
[7101] Fixed the issue with the monitoring of Ceph and Ironic being enabled when Ceph and Ironic are disabled on the baremetal-based clusters.
[7324] Fixed the issue with the monitoring of Ceph being disabled on the baremetal-based managed clusters due to the missing
provider: BareMetalparameter.[7180] Fixed the issue with
lcm-controllerperiodically failing with the invalid memory address or nil pointer dereference runtime error.[7251] Fixed the issue with setting up the OIDC integration on the MKE side.
[7326] Fixed the issue with the missing entry for the host itself in
etc/hostscausing failure of services that require node FQDN.[6989] Fixed the issue with
baremetal-operatorignoring theclean failedprovisioning state if a node fails to deploy on a baremetal-based managed cluster.[7231] Fixed the issue with the
baremetal-providerpod not restarting after theConfigMapchanges and causing thetelemeter-clientpod to fail during deployment.
The following table lists the major components and their versions of the Mirantis Container Cloud release 2.1.0.
Note
The components that are newly added, updated, deprecated, or removed
as compared to the previous release version, are marked
with a corresponding superscript,
for example, lcm-ansible Updated.
Component |
Application/Service |
Version |
|---|---|---|
AWS Updated |
aws-provider |
1.12.2 |
aws-credentials-controller |
1.12.2 |
|
Bare metal |
baremetal-operator Updated |
3.1.0 |
baremetal-public-api New |
3.1.0 |
|
baremetal-provider Updated |
1.12.2 |
|
httpd Updated |
2.4.46-20201001171500 |
|
ironic |
train-bionic-20200803180020 |
|
ironic-operator |
base-bionic-20200805144858 |
|
kaas-ipam Updated |
20201007180518 |
|
local-volume-provisioner |
1.0.4-mcp |
|
mariadb Updated |
10.4.14-bionic-20200812025059 |
|
IAM |
iam Updated |
1.1.18 |
iam-controller Updated |
1.12.2 |
|
keycloak |
9.0.0 |
|
Container Cloud Updated |
admission-controller |
1.12.3 |
byo-credentials-controller |
1.12.2 |
|
byo-provider |
1.12.2 |
|
kaas-public-api |
1.12.2 |
|
kaas-exporter |
1.12.2 |
|
kaas-ui |
1.12.2 |
|
lcm-controller |
0.2.0-169-g5668304d |
|
release-controller |
1.12.2 |
|
OpenStack Updated |
openstack-provider |
1.12.2 |
os-credentials-controller |
1.12.2 |
This section lists the components artifacts of the Mirantis Container Cloud release 2.1.0.
Note
The components that are newly added, updated, deprecated, or removed
as compared to the previous release version, are marked
with a corresponding superscript,
for example, lcm-ansible Updated.
Artifact |
Component |
Path |
|---|---|---|
Binaries |
Target system image (ubuntu-bionic) |
https://binary.mirantis.com/bm/bin/efi/ubuntu/qcow2-bionic-debug-20200730084816 |
baremetal-operator Updated |
https://binary.mirantis.com/bm/helm/baremetal-operator-3.1.0.tgz |
|
baremetal-public-api New |
https://binary.mirantis.com/bm/helm/baremetal-public-api-3.1.0.tgz |
|
ironic-python-agent.kernel |
https://binary.mirantis.com/bm/bin/ironic/ipa/ubuntu/kernel-train-bionic-debug-20200730084816 |
|
ironic-python-agent.initramfs |
https://binary.mirantis.com/bm/bin/ironic/ipa/ubuntu/initramfs-train-bionic-debug-20200730084816 |
|
kaas-ipam Updated |
||
local-volume-provisioner |
https://binary.mirantis.com/bm/helm/local-volume-provisioner-1.0.4-mcp.tgz |
|
Docker images |
baremetal-operator Updated |
mirantis.azurecr.io/bm/baremetal-operator:base-bionic-20201005150946 |
httpd Updated |
mirantis.azurecr.io/bm/external/httpd:2.4.46-20201001171500 |
|
ironic |
mirantis.azurecr.io/openstack/ironic:train-bionic-20200803180020 |
|
ironic-inspector |
mirantis.azurecr.io/openstack/ironic-inspector:train-bionic-20200803180020 |
|
ironic-operator |
mirantis.azurecr.io/bm/ironic-operator:base-bionic-20200805144858 |
|
kaas-ipam Updated |
mirantis.azurecr.io/bm/kaas-ipam:base-bionic-20201007180518 |
|
mariadb Updated |
mirantis.azurecr.io/general/mariadb:10.4.14-bionic-20200812025059 |
Artifact |
Component |
Path |
|---|---|---|
Bootstrap tarball Updated |
bootstrap-linux |
https://binary.mirantis.com/core/bin/bootstrap-linux-1.12.2.tar.gz |
bootstrap-darwin |
https://binary.mirantis.com/core/bin/bootstrap-darwin-1.12.2.tar.gz |
|
Helm charts Updated |
admission-controller |
https://binary.mirantis.com/core/helm/admission-controller-1.12.3.tgz |
aws-credentials-controller |
https://binary.mirantis.com/core/helm/aws-credentials-controller-1.12.2.tgz |
|
aws-provider |
https://binary.mirantis.com/core/helm/aws-provider-1.12.2.tgz |
|
baremetal-provider |
https://binary.mirantis.com/core/helm/baremetal-provider-1.12.2.tgz |
|
byo-credentials-controller |
https://binary.mirantis.com/core/helm/byo-credentials-controller-1.12.2.tgz |
|
byo-provider |
https://binary.mirantis.com/core/helm/byo-provider-1.12.2.tgz |
|
iam-controller |
https://binary.mirantis.com/core/helm/iam-controller-1.12.2.tgz |
|
kaas-exporter |
https://binary.mirantis.com/core/helm/kaas-exporter-1.12.2.tgz |
|
kaas-public-api |
https://binary.mirantis.com/core/helm/kaas-public-api-1.12.2.tgz |
|
kaas-ui |
||
lcm-controller |
https://binary.mirantis.com/core/helm/lcm-controller-1.12.2.tgz |
|
openstack-provider |
https://binary.mirantis.com/core/helm/openstack-provider-1.12.2.tgz |
|
os-credentials-controller |
https://binary.mirantis.com/core/helm/os-credentials-controller-1.12.2.tgz |
|
release-controller |
https://binary.mirantis.com/core/helm/release-controller-1.12.2.tgz |
|
Docker images for Container Cloud deployment Updated |
admission-controller |
mirantis.azurecr.io/core/admission-controller:1.12.3 |
aws-cluster-api-controller |
mirantis.azurecr.io/core/aws-cluster-api-controller:1.12.2 |
|
byo-cluster-api-controller |
mirantis.azurecr.io/core/byo-cluster-api-controller:1.12.2 |
|
aws-credentials-controller |
mirantis.azurecr.io/core/aws-credentials-controller:1.12.2 |
|
byo-credentials-controller |
mirantis.azurecr.io/core/byo-credentials-controller:1.12.2 |
|
cluster-api-provider-baremetal |
mirantis.azurecr.io/core/cluster-api-provider-baremetal:1.12.2 |
|
frontend |
mirantis.azurecr.io/core/frontend:1.12.2 |
|
iam-controller |
mirantis.azurecr.io/core/iam-controller:1.12.2 |
|
lcm-controller |
mirantis.azurecr.io/core/lcm-controller:v0.2.0-169-g5668304d |
|
openstack-cluster-api-controller |
mirantis.azurecr.io/core/openstack-cluster-api-controller:1.12.2 |
|
os-credentials-controller |
mirantis.azurecr.io/core/os-credentials-controller:1.12.2 |
|
release-controller |
mirantis.azurecr.io/core/release-controller:1.12.2 |
Artifact |
Component |
Path |
|---|---|---|
Binaries |
hash-generate-linux |
http://binary.mirantis.com/iam/bin/hash-generate-0.0.1-236-9cea809-linux |
hash-generate-darwin |
http://binary.mirantis.com/iam/bin/hash-generate-0.0.1-236-9cea809-darwin |
|
iamctl-linux |
||
iamctl-darwin |
||
iamctl-windows |
||
Helm charts |
iam Updated |
|
iam-proxy |
||
keycloak-proxy Updated |
http://binary.mirantis.com/core/helm/keycloak_proxy-1.12.2.tgz |
|
Docker images |
api |
mirantis.azurecr.io/iam/api:0.3.18 |
auxiliary |
mirantis.azurecr.io/iam/auxiliary:0.3.18 |
|
kubernetes-entrypoint |
mirantis.azurecr.io/iam/external/kubernetes-entrypoint:v0.3.1 |
|
mariadb |
mirantis.azurecr.io/iam/external/mariadb:10.2.18 |
|
keycloak |
mirantis.azurecr.io/iam/keycloak:0.3.18 |
|
keycloak-gatekeeper |
mirantis.azurecr.io/iam/keycloak-gatekeeper:6.0.1 |
To complete the AWS-based management cluster upgrade to version 2.1.0, manually update the IAM policies for AWS before updating your AWS-based managed clusters.
To update the IAM policies for AWS:
Choose from the following options:
Update the IAM policies using
get_container_cloud.sh:On any local machine, download and run the latest version of the Container Cloud bootstrap script:
wget https://binary.mirantis.com/releases/get_container_cloud.sh chmod 0755 get_container_cloud.sh ./get_container_cloud.sh
Change the directory to the
kaas-bootstrapfolder created by theget_container_cloud.shscript.Export the following parameters by adding the corresponding values for the AWS
admincredentials:export AWS_SECRET_ACCESS_KEY=XXXXXXX export AWS_ACCESS_KEY_ID=XXXXXXX export AWS_DEFAULT_REGION=us-east-2
Update the AWS
CloudFormationtemplate for IAM policy:./container-cloud bootstrap aws policy
Update the IAM policies using the AWS Management Console:
Log in to your AWS Management Console.
Verify that the
controllers.cluster-api-provider-aws.kaas.mirantis.comrole or another AWS role that you use for Container Cloud users contains the following permissions:"ec2:DescribeRegions", "ec2:DescribeInstanceTypes"
Otherwise, add these permissions manually.
Proceed to updating your AWS-based managed clusters as described in Operations Guide: Update a managed cluster.
See also
This section outlines release notes for the initial Mirantis Container Cloud GA release 2.0.0. This release introduces support for the Cluster release 5.7.0 that is based on Mirantis Kubernetes Engine 3.3.3, Mirantis Container Runtime 19.03.12, and Kubernetes 1.18.
This section lists known issues with workarounds for the Mirantis Container Cloud release 2.0.0.
Fixed in the Cluster release 7.0.0
Note
The issue below affects only the Kubernetes 1.18 deployments. Moving forward, the workaround for this issue will be moved from Release Notes to Troubleshooting Guide.
On a management cluster with multiple AWS-based managed
clusters, some clusters fail to complete the deployments that require
persistent volumes (PVs), for example, Elasticsearch.
Some of the affected pods get stuck in the Pending state
with the pod has unbound immediate PersistentVolumeClaims and
node(s) had volume node affinity conflict errors.
Warning
The workaround below applies to HA deployments where data can be rebuilt from replicas. If you have a non-HA deployment, back up any existing data before proceeding, since all data will be lost while applying the workaround.
Workaround:
Obtain the persistent volume claims related to the storage mounts of the affected pods:
kubectl get pod/<pod_name1> pod/<pod_name2> \ -o jsonpath='{.spec.volumes[?(@.persistentVolumeClaim)].persistentVolumeClaim.claimName}'
Note
In the command above and in the subsequent steps, substitute the parameters enclosed in angle brackets with the corresponding values.
Delete the affected
PodsandPersistentVolumeClaimsto reschedule them: For example, for StackLight:kubectl -n stacklight delete \ pod/<pod_name1> pod/<pod_name2> ... pvc/<pvc_name2> pvc/<pvc_name2> ...
Fixed in Container Cloud 2.5.0
During a management or managed cluster deployment, LVM cannot be deployed on a new disk if an old volume group with the same name already exists on the target hardware node but on the different disk.
Workaround:
In the bare metal host profile specific to your hardware configuration,
add the wipe: true parameter to the device that fails to be deployed.
For the procedure details,
see Operations Guide: Create a custom host profile.
Fixed in Container Cloud 2.4.0
During a management cluster deployment, IAM fails to start with the IAM
pods being in the CrashLoopBackOff status.
Workaround:
Log in to the bootstrap node.
Remove the
iam-mariadb-stateconfigmap:kubectl delete cm -n kaas iam-mariadb-state
Manually delete the
mariadbpods:kubectl delete po -n kaas mariadb-server-{0,1,2}
Wait for the pods to start. If the
mariadbpod does not start with the connection to peer timed out exception, repeat the step 2.Obtain the MariaDB database admin password:
kubectl get secrets -n kaas mariadb-dbadmin-password \ -o jsonpath='{.data.MYSQL_DBADMIN_PASSWORD}' | base64 -d ; echo
Log in to MariaDB:
kubectl exec -it -n kaas mariadb-server-0 -- bash -c 'mysql -uroot -p<mysqlDbadminPassword>'
Substitute
<mysqlDbadminPassword>with the corresponding value obtained in the previous step.Run the following command:
DROP DATABASE IF EXISTS keycloak;
Manually delete the Keycloak pods:
kubectl delete po -n kaas iam-keycloak-{0,1,2}
Fixed in 2.1.0
On the baremetal-based clusters, the monitoring of Ceph and Ironic is enabled when Ceph and Ironic are disabled. The issue with Ceph relates to both management or managed clusters, the issue with Ironic relates to managed clusters only.
Workaround:
Open the StackLight configuration manifest as described in Operations Guide: Configure StackLight.
Add the following parameter to the StackLight
helmReleasesvalues of the Cluster object to explicitly disable the required component monitoring:For Ceph:
helmReleases: - name: stacklight values: ... ceph: disabledOnBareMetal: true ...
For Ironic:
helmReleases: - name: stacklight values: ... ironic: disabledOnBareMetal: true ...
Fixed in 2.1.0
Ceph monitoring may be disabled on the baremetal-based managed clusters due
to a missing provider: BareMetal parameter.
Workaround:
Open the StackLight configuration manifest as described in Operations Guide: Configure StackLight.
Add the
provider: BareMetalparameter to the StackLighthelmReleasesvalues of the Cluster object:spec: providerSpec: value: helmReleases: - name: stacklight values: ... provider: BareMetal ...
Fixed in 2.2.0
After deploying a managed cluster with Ceph, the number of placement groups
(PGs) per Ceph OSD may be too small and the Ceph cluster may have the
HEALTH_WARN status:
health: HEALTH_WARN
too few PGs per OSD (3 < min 30)
The workaround is to enable the PG balancer to properly manage the number of PGs:
kexec -it $(k get pod -l "app=rook-ceph-tools" --all-namespaces -o jsonpath='{.items[0].metadata.name}') -n rook-ceph bash
ceph mgr module enable pg_autoscaler
Fixed in 2.2.0
Occasionally, the deployment of a managed cluster may fail during the Ceph Monitor or Manager deployment. In this case, the Ceph cluster may be down and and a stack trace similar to the following one may be present in Ceph Manager logs:
kubectl -n rook-ceph logs rook-ceph-mgr-a-c5dc846f8-k68rs
/home/jenkins-build/build/workspace/ceph-build/ARCH/x86_64/AVAILABLE_ARCH/x86_64/AVAILABLE_DIST/centos7/DIST/centos7/MACHINE_SIZE/gigantic/release/14.2.9/rpm/el7/BUILD/ceph-14.2.9/src/mon/MonMap.h: In function 'void MonMap::add(const mon_info_t&)' thread 7fd3d3744b80 time 2020-09-03 10:16:46.586388
/home/jenkins-build/build/workspace/ceph-build/ARCH/x86_64/AVAILABLE_ARCH/x86_64/AVAILABLE_DIST/centos7/DIST/centos7/MACHINE_SIZE/gigantic/release/14.2.9/rpm/el7/BUILD/ceph-14.2.9/src/mon/MonMap.h: 195: FAILED ceph_assert(addr_mons.count(a) == 0)
ceph version 14.2.9 (581f22da52345dba46ee232b73b990f06029a2a0) nautilus (stable)
1: (ceph::__ceph_assert_fail(char const*, char const*, int, char const*)+0x14a) [0x7fd3ca9b2875]
2: (()+0x253a3d) [0x7fd3ca9b2a3d]
3: (MonMap::add(mon_info_t const&)+0x80) [0x7fd3cad49190]
4: (MonMap::add(std::string const&, entity_addrvec_t const&, int)+0x110) [0x7fd3cad493a0]
5: (MonMap::init_with_ips(std::string const&, bool, std::string const&)+0xc9) [0x7fd3cad43849]
6: (MonMap::build_initial(CephContext*, bool, std::ostream&)+0x314) [0x7fd3cad45af4]
7: (MonClient::build_initial_monmap()+0x130) [0x7fd3cad2e140]
8: (MonClient::get_monmap_and_config()+0x5f) [0x7fd3cad365af]
9: (global_pre_init(std::map<std::string, std::string, std::less<std::string>, std::allocator<std::pair<std::string const, std::string> > > const*, std::vector<char const*, std::allocator<char const*> >&, unsigned int, code_environment_t, int)+0x524) [0x55ce86711444]
10: (global_init(std::map<std::string, std::string, std::less<std::string>, std::allocator<std::pair<std::string const, std::string> > > const*, std::vector<char const*, std::allocator<char const*> >&, unsigned int, code_environment_t, int, char const*, bool)+0x76) [0x55ce86711b56]
11: (main()+0x136) [0x55ce864ff9a6]
12: (__libc_start_main()+0xf5) [0x7fd3c6e73555]
13: (()+0xfc010) [0x55ce86505010]
The workaround is to start the managed cluster deployment from scratch.
When removing a worker node, it is not possible to automatically remove a Ceph node. The workaround is to manually remove the Ceph node from the Ceph cluster as described in Operations Guide: Add, remove, or reconfigure Ceph nodes before removing the worker node from your deployment.
Fixed in 2.1.0
A management cluster bootstrap script fails if there is a space
in the PATH environment variable. As a workaround, before running the
bootstrap.sh script, verify that there are no spaces in the PATH
environment variable.
Affects only Container Cloud 2.18.0 and earlier
A project that is newly created in the Container Cloud web UI does not display in the Projects list even after refreshing the page. The issue occurs due to the token missing the necessary role for the new project. As a workaround, relogin to the Container Cloud web UI.
The following table lists the major components and their versions of the Mirantis Container Cloud release 2.0.0.
Component |
Application/Service |
Version |
|---|---|---|
AWS |
aws-provider |
1.10.12 |
aws-credentials-controller |
1.10.12 |
|
Bare metal |
baremetal-operator |
3.0.7 |
baremetal-provider |
1.10.12 |
|
httpd |
2.4.43-20200710111500 |
|
ironic |
train-bionic-20200803180020 |
|
ironic-operator |
base-bionic-20200805144858 |
|
kaas-ipam |
20200807130953 |
|
local-volume-provisioner |
1.0.4-mcp |
|
mariadb |
10.4.12-bionic-20200803130834 |
|
IAM |
iam |
1.1.16 |
iam-controller |
1.10.12 |
|
keycloak |
9.0.0 |
|
Container Cloud |
admission-controller |
1.10.12 |
byo-credentials-controller |
1.10.12 |
|
byo-provider |
1.10.12 |
|
kaas-public-api |
1.10.12 |
|
kaas-exporter |
1.10.12 |
|
kaas-ui |
1.10.12 |
|
lcm-controller |
0.2.0-149-g412c5a05 |
|
release-controller |
1.10.12 |
|
OpenStack |
openstack-provider |
1.10.12 |
os-credentials-controller |
1.10.12 |
This section lists the components artifacts of the Mirantis Container Cloud release 2.0.0.
Artifact |
Component |
Path |
|---|---|---|
Binaries |
Target system image (ubuntu-bionic) |
https://binary.mirantis.com/bm/bin/efi/ubuntu/qcow2-bionic-debug-20200730084816 |
baremetal-operator |
https://binary.mirantis.com/bm/helm/baremetal-operator-3.0.7.tgz |
|
ironic-python-agent.kernel |
https://binary.mirantis.com/bm/bin/ironic/ipa/ubuntu/kernel-train-bionic-debug-20200730084816 |
|
ironic-python-agent.initramfs |
https://binary.mirantis.com/bm/bin/ironic/ipa/ubuntu/initramfs-train-bionic-debug-20200730084816 |
|
kaas-ipam |
||
local-volume-provisioner |
https://binary.mirantis.com/bm/helm/local-volume-provisioner-1.0.4-mcp.tgz |
|
Docker images |
baremetal-operator |
mirantis.azurecr.io/bm/baremetal-operator:base-bionic-20200812172956 |
httpd |
mirantis.azurecr.io/bm/external/httpd:2.4.43-20200710111500 |
|
ironic |
mirantis.azurecr.io/openstack/ironic:train-bionic-20200803180020 |
|
ironic-inspector |
mirantis.azurecr.io/openstack/ironic-inspector:train-bionic-20200803180020 |
|
ironic-operator |
mirantis.azurecr.io/bm/ironic-operator:base-bionic-20200805144858 |
|
kaas-ipam |
mirantis.azurecr.io/bm/kaas-ipam:base-bionic-20200807130953 |
|
mariadb |
mirantis.azurecr.io/general/mariadb:10.4.12-bionic-20200803130834 |
Artifact |
Component |
Path |
|---|---|---|
Bootstrap tarball |
bootstrap-linux |
https://binary.mirantis.com/core/bin/bootstrap-linux-1.10.12.tar.gz |
bootstrap-darwin |
https://binary.mirantis.com/core/bin/bootstrap-darwin-1.10.12.tar.gz |
|
Helm charts |
admission-controller |
https://binary.mirantis.com/core/helm/admission-controller-1.10.12.tgz |
aws-credentials-controller |
https://binary.mirantis.com/core/helm/aws-credentials-controller-1.10.12.tgz |
|
aws-provider |
https://binary.mirantis.com/core/helm/aws-provider-1.10.12.tgz |
|
baremetal-provider |
https://binary.mirantis.com/core/helm/baremetal-provider-1.10.12.tgz |
|
byo-credentials-controller |
https://binary.mirantis.com/core/helm/byo-credentials-controller-1.10.12.tgz |
|
byo-provider |
https://binary.mirantis.com/core/helm/byo-provider-1.10.12.tgz |
|
iam-controller |
https://binary.mirantis.com/core/helm/iam-controller-1.10.12.tgz |
|
kaas-exporter |
https://binary.mirantis.com/core/helm/kaas-exporter-1.10.12.tgz |
|
kaas-public-api |
https://binary.mirantis.com/core/helm/kaas-public-api-1.10.12.tgz |
|
kaas-ui |
||
lcm-controller |
https://binary.mirantis.com/core/helm/lcm-controller-1.10.12.tgz |
|
openstack-provider |
https://binary.mirantis.com/core/helm/openstack-provider-1.10.12.tgz |
|
os-credentials-controller |
https://binary.mirantis.com/core/helm/os-credentials-controller-1.10.12.tgz |
|
release-controller |
https://binary.mirantis.com/core/helm/release-controller-1.10.12.tgz |
|
Docker images for Container Cloud deployment |
aws-cluster-api-controller |
mirantis.azurecr.io/core/aws-cluster-api-controller:1.10.12 |
aws-credentials-controller |
mirantis.azurecr.io/core/aws-credentials-controller:1.10.12 |
|
byo-cluster-api-controller |
mirantis.azurecr.io/core/byo-cluster-api-controller:1.10.12 |
|
byo-credentials-controller |
mirantis.azurecr.io/core/byo-credentials-controller:1.10.12 |
|
cluster-api-provider-baremetal |
mirantis.azurecr.io/core/cluster-api-provider-baremetal:1.10.12 |
|
frontend |
mirantis.azurecr.io/core/frontend:1.10.12 |
|
iam-controller |
mirantis.azurecr.io/core/iam-controller:1.10.12 |
|
lcm-controller |
mirantis.azurecr.io/core/lcm-controller:v0.2.0-149-g412c5a05 |
|
openstack-cluster-api-controller |
mirantis.azurecr.io/core/openstack-cluster-api-controller:1.10.12 |
|
os-credentials-controller |
mirantis.azurecr.io/core/os-credentials-controller:1.10.12 |
|
release-controller |
mirantis.azurecr.io/core/release-controller:1.10.12 |
Artifact |
Component |
Path |
|---|---|---|
Binaries |
hash-generate-linux |
http://binary.mirantis.com/iam/bin/hash-generate-0.0.1-236-9cea809-linux |
hash-generate-darwin |
http://binary.mirantis.com/iam/bin/hash-generate-0.0.1-236-9cea809-darwin |
|
iamctl-linux |
||
iamctl-darwin |
||
iamctl-windows |
||
Helm charts |
iam |
|
iam-proxy |
||
keycloak-proxy |
http://binary.mirantis.com/core/helm/keycloak_proxy-1.10.12.tgz |
|
Docker images |
api |
mirantis.azurecr.io/iam/api:0.3.18 |
auxiliary |
mirantis.azurecr.io/iam/auxiliary:0.3.18 |
|
kubernetes-entrypoint |
mirantis.azurecr.io/iam/external/kubernetes-entrypoint:v0.3.1 |
|
mariadb |
mirantis.azurecr.io/iam/external/mariadb:10.2.18 |
|
keycloak |
mirantis.azurecr.io/iam/keycloak:0.3.18 |
|
keycloak-gatekeeper |
mirantis.azurecr.io/iam/keycloak-gatekeeper:6.0.1 |
See also
See also
Cluster releases
This section outlines the release notes for major and patch Cluster releases that are supported by specific Container Cloud releases. For details about the Container Cloud releases, see: Container Cloud releases.
Major and patch versions update path
The primary distinction between major and patch product versions lies in the fact that major release versions introduce new functionalities, whereas patch release versions predominantly offer minor product enhancements, mostly CVE resolutions for your clusters.
Depending on your deployment needs, you can either update only between major Cluster releases or apply patch updates between major releases. Choosing the latter option ensures you receive security fixes as soon as they become available. Though, be prepared to update your cluster frequently, approximately once every three weeks. Otherwise, you can update only between major Cluster releases as each subsequent major Cluster release includes patch Cluster release updates of the previous major Cluster release.
Deprecated Cluster releases
This section describes the release notes for the deprecated major Cluster releases that will become unsupported in one of the following Container Cloud releases. Make sure to update your managed clusters to the latest supported version as described in Cluster update.
Major and patch versions update path
The primary distinction between major and patch product versions lies in the fact that major release versions introduce new functionalities, whereas patch release versions predominantly offer minor product enhancements, mostly CVE resolutions for your clusters.
Depending on your deployment needs, you can either update only between major Cluster releases or apply patch updates between major releases. Choosing the latter option ensures you receive security fixes as soon as they become available. Though, be prepared to update your cluster frequently, approximately once every three weeks. Otherwise, you can update only between major Cluster releases as each subsequent major Cluster release includes patch Cluster release updates of the previous major Cluster release.
This section outlines release notes for major and patch Cluster releases of the 17.4.x series dedicated for Mirantis OpenStack for Kubernetes (MOSK).
This section includes release notes for the patch Cluster release 17.4.6 that is introduced in the Container Cloud patch release 2.29.6 and is based on the Cluster releases 17.4.0 and 16.4.6.
This patch Cluster release introduces MOSK 25.1.1 that is
based on Mirantis Kubernetes Engine 3.7.24 with Kubernetes 1.27 and Mirantis
Container Runtime 25.0.8 with docker-ee-cli updated to 25.0.10.
For details on MOSK 25.1.1, see 25.1.1 patch
For the list of CVE fixes delivered with this patch Cluster release, see 2.29.6
For details on patch release delivery, see MOSK cluster components compatibility
This section lists the artifacts of components included in the Cluster release 17.4.6.
Note
The components that are newly added, updated, deprecated, or removed
as compared to the previous release version, are marked
with a corresponding superscript,
for example, lcm-ansible Updated.
Artifact |
Component |
Path |
|---|---|---|
Helm charts Updated |
local-volume-provisioner |
https://binary.mirantis.com/core/helm/local-volume-provisioner-1.42.26.tgz |
metallb |
||
Docker images Updated |
ironic |
mirantis.azurecr.io/openstack/ironic:antelope-jammy-20250716073925 |
metallb-controller |
mirantis.azurecr.io/bm/metallb/controller:v0.14.5-6716f869-amd64 |
|
metallb-speaker |
mirantis.azurecr.io/bm/metallb/speaker:v0.14.5-6716f869-amd64 |
Artifact |
Component |
Path |
|---|---|---|
Helm charts Updated |
ceph-controller |
https://binary.mirantis.com/ceph/helm/ceph-operator-1.0.0-mcc-2.29.6-1.tgz |
Docker images Updated |
ceph |
mirantis.azurecr.io/mirantis/ceph:v18.2.7-3.cve |
ceph-controller |
mirantis.azurecr.io/ceph/mcp/ceph-controller:2.29.6-0 |
|
cephcsi |
mirantis.azurecr.io/mirantis/cephcsi:v3.11.0-11.cve |
|
cephcsi-attacher |
mirantis.azurecr.io/mirantis/cephcsi-attacher:v4.7.0-4.cve |
|
cephcsi-provisioner |
mirantis.azurecr.io/mirantis/cephcsi-provisioner:v4.0.1-4.cve |
|
cephcsi-registrar |
mirantis.azurecr.io/mirantis/cephcsi-registrar:v2.12.0-4.cve |
|
cephcsi-resizer |
mirantis.azurecr.io/mirantis/cephcsi-resizer:v1.10.1-4.cve |
|
cephcsi-snapshotter |
mirantis.azurecr.io/mirantis/cephcsi-snapshotter:v8.1.0-4.cve |
|
rook |
mirantis.azurecr.io/ceph/rook:v1.14.10-31 |
|
snapshot-controller |
mirantis.azurecr.io/mirantis/snapshot-controller:v8.1.0-4.cve |
Artifact |
Component |
Path |
|---|---|---|
Helm charts |
cinder-csi-plugin Updated |
https://binary.mirantis.com/core/helm/cinder-csi-plugin-1.42.26.tgz |
client-certificate-controller Updated |
https://binary.mirantis.com/core/helm/client-certificate-controller-1.42.26.tgz |
|
metrics-server Updated |
https://binary.mirantis.com/core/helm/metrics-server-1.42.26.tgz |
|
openstack-cloud-controller-manager Deprecated |
https://binary.mirantis.com/core/helm/openstack-cloud-controller-manager-1.42.26.tgz |
|
pause-update-controller Updated |
https://binary.mirantis.com/core/helm/pause-update-controller-1.42.26.tgz |
|
policy-controller Updated |
https://binary.mirantis.com/core/helm/policy-controller-1.42.26.tgz |
|
Docker images |
cinder-csi-plugin Updated |
mirantis.azurecr.io/lcm/kubernetes/cinder-csi-plugin:v1.27.2-28 |
client-certificate-controller Updated |
mirantis.azurecr.io/core/client-certificate-controller:1.42.26 |
|
csi-attacher Deprecated |
mirantis.azurecr.io/lcm/k8scsi/csi-attacher:v4.2.0-10 |
|
csi-node-driver-registrar Deprecated |
mirantis.azurecr.io/lcm/k8scsi/csi-node-driver-registrar:v2.7.0-9 |
|
csi-provisioner Deprecated |
mirantis.azurecr.io/lcm/k8scsi/csi-provisioner:v3.4.1-10 |
|
csi-resizer Deprecated |
mirantis.azurecr.io/lcm/k8scsi/csi-resizer:v1.7.0-10 |
|
csi-snapshotter Deprecated |
mirantis.azurecr.io/lcm/k8scsi/csi-snapshotter:v6.2.1-mcc-9 |
|
livenessprobe Deprecated |
mirantis.azurecr.io/lcm/k8scsi/livenessprobe:v2.9.0-9 |
|
metrics-server Updated |
mirantis.azurecr.io/lcm/metrics-server-amd64:v0.6.3-13 |
|
openstack-cloud-controller-manager Deprecated |
mirantis.azurecr.io/lcm/kubernetes/openstack-cloud-controller-manager:v1.27.2-28 |
|
pause-update-controller Updated |
mirantis.azurecr.io/core/pause-update-controller:1.42.26 |
|
policy-controller Updated |
mirantis.azurecr.io/core/policy-controller:1.42.26 |
Artifact |
Component |
Path |
|---|---|---|
Binaries Updated |
lcm-agent |
mirantis.azurecr.io/core/bin/lcm-agent-1.42.26 |
lcm-ansible |
mirantis.azurecr.io/lcm/bin/lcm-ansible/v0.27.0-45-g62835a8/lcm-ansible.tar.gz |
|
Helm charts Updated |
helm-controller |
https://binary.mirantis.com/core/helm/helm-controller-1.42.26.tgz |
managed-lcm-api |
https://binary.mirantis.com/core/helm/managed-lcm-api-1.42.26.tgz |
|
Docker images Updated |
helm-controller |
mirantis.azurecr.io/core/helm-controller:1.42.26 |
mcc-haproxy |
mirantis.azurecr.io/lcm/mcc-haproxy:v0.27.0-45-g62835a8 |
|
mcc-keepalived |
mirantis.azurecr.io/lcm/mcc-keepalived:v0.27.0-45-g62835a8 |
Artifact |
Component |
Path |
|---|---|---|
Helm charts |
alerta |
https://binary.mirantis.com/stacklight/helm/alerta-0.1.0-mcp-33.tgz |
alertmanager-webhook-servicenow |
https://binary.mirantis.com/stacklight/helm/alertmanager-webhook-servicenow-0.2.0-mcp-8.tgz |
|
cadvisor |
https://binary.mirantis.com/stacklight/helm/cadvisor-0.1.0-mcp-7.tgz |
|
elasticsearch-curator |
https://binary.mirantis.com/stacklight/helm/elasticsearch-curator-1.5.0-mcp-15.tgz |
|
elasticsearch-exporter |
https://binary.mirantis.com/stacklight/helm/elasticsearch-exporter-1.2.0-mcp-10.tgz |
|
fluentd-logs Updated |
https://binary.mirantis.com/stacklight/helm/fluentd-logs-0.1.0-mcp-249.tgz |
|
grafana |
https://binary.mirantis.com/stacklight/helm/grafana-3.3.10-mcp-354.tgz |
|
iam-proxy |
||
metric-collector |
https://binary.mirantis.com/stacklight/helm/metric-collector-0.3.0-mcp-18.tgz |
|
metricbeat |
https://binary.mirantis.com/stacklight/helm/metricbeat-1.7.1-mcp-25.tgz |
|
opensearch Updated |
https://binary.mirantis.com/stacklight/helm/opensearch-0.1.0-mcp-90.tgz |
|
opensearch-dashboards |
https://binary.mirantis.com/stacklight/helm/opensearch-dashboards-0.1.0-mcp-57.tgz |
|
patroni |
https://binary.mirantis.com/stacklight/helm/patroni-0.15.1-mcp-62.tgz |
|
prometheus |
https://binary.mirantis.com/stacklight/helm/prometheus-8.11.4-mcp-259.tgz |
|
prometheus-blackbox-exporter |
https://binary.mirantis.com/stacklight/helm/prometheus-blackbox-exporter-0.3.0-mcp-19.tgz |
|
prometheus-es-exporter |
https://binary.mirantis.com/stacklight/helm/prometheus-es-exporter-1.0.0-mcp-18.tgz |
|
prometheus-msteams |
https://binary.mirantis.com/stacklight/helm/prometheus-msteams-0.1.0-mcp-12.tgz |
|
sf-notifier |
https://binary.mirantis.com/stacklight/helm/sf-notifier-0.2.0-mcp-10.tgz |
|
sf-reporter |
https://binary.mirantis.com/stacklight/helm/sf-reporter-0.2.0-mcp-10.tgz |
|
stacklight Updated |
https://binary.mirantis.com/stacklight/helm/stacklight-0.17.15.tgz |
|
telegraf-ds |
https://binary.mirantis.com/stacklight/helm/telegraf-ds-1.1.5-mcp-42.tgz |
|
telegraf-s |
https://binary.mirantis.com/stacklight/helm/telegraf-s-1.1.5-mcp-42.tgz |
|
telemeter-client |
https://binary.mirantis.com/stacklight/helm/telemeter-client-0.2.0-mcp-14.tgz |
|
telemeter-server |
https://binary.mirantis.com/stacklight/helm/telemeter-server-0.2.0-mcp-14.tgz |
|
Docker images |
alerta-web Updated |
mirantis.azurecr.io/stacklight/alerta-web:9-20250804010011 |
alertmanager Updated |
mirantis.azurecr.io/stacklight/alertmanager:v0.25-20250804010015 |
|
alertmanager-webhook-servicenow Updated |
mirantis.azurecr.io/stacklight/alertmanager-webhook-servicenow:v0.1-20250411082209 |
|
alpine-utils Updated |
mirantis.azurecr.io/stacklight/alpine-utils:1-20250804010017 |
|
blackbox-exporter Updated |
mirantis.azurecr.io/stacklight/blackbox-exporter:0-20250305095821 |
|
cadvisor Updated |
mirantis.azurecr.io/stacklight/cadvisor:v0.49.1-20250804010013 |
|
configmap-reload |
mirantis.azurecr.io/stacklight/configmap-reload:v0.14.0 |
|
curator |
mirantis.azurecr.io/stacklight/curator:5.7.6-20230404082402 |
|
elasticsearch-exporter |
mirantis.azurecr.io/stacklight/elasticsearch-exporter:v1.8.0 |
|
fluentd Updated |
mirantis.azurecr.io/stacklight/fluentd:1.18-plugin-os-1.0-20250804010010 |
|
grafana Updated |
mirantis.azurecr.io/stacklight/grafana:11.2.9 |
|
k8s-sidecar Updated |
mirantis.azurecr.io/stacklight/k8s-sidecar:1-20250801064311 |
|
kube-state-metrics |
mirantis.azurecr.io/stacklight/kube-state-metrics:v2.13.0 |
|
metric-collector Updated |
mirantis.azurecr.io/stacklight/metric-collector:v0.1-20250804010016 |
|
metricbeat Updated |
mirantis.azurecr.io/stacklight/metricbeat:7.12.1-20250804010014 |
|
node-exporter |
mirantis.azurecr.io/stacklight/node-exporter:v1.8.2 |
|
oauth2-proxy Updated |
mirantis.azurecr.io/iam/oauth2-proxy:v7.1.3-15 |
|
opensearch Updated |
mirantis.azurecr.io/stacklight/opensearch:2.19-20250804010015 |
|
opensearch-dashboards Updated |
mirantis.azurecr.io/stacklight/opensearch-dashboards:2.19-20250804010012 |
|
prometheus Updated |
mirantis.azurecr.io/stacklight/prometheus:v3.2.1 |
|
prometheus-es-exporter Updated |
mirantis.azurecr.io/stacklight/prometheus-es-exporter:v0.14-20250804010016 |
|
prometheus-msteams Updated |
mirantis.azurecr.io/stacklight/prometheus-msteams:v1.5-20250804010015 |
|
prometheus-patroni-exporter Updated |
mirantis.azurecr.io/stacklight/prometheus-patroni-exporter:0.0.1-20250804010016 |
|
prometheus-postgres-exporter |
mirantis.azurecr.io/stacklight/prometheus-postgres-exporter:v0.16.0 |
|
prometheus-relay Updated |
mirantis.azurecr.io/stacklight/prometheus-relay:v0.4-20250304085150 |
|
sf-notifier Updated |
mirantis.azurecr.io/stacklight/sf-notifier:v0.4-20250804010016 |
|
sf-reporter Updated |
mirantis.azurecr.io/stacklight/sf-reporter:v0.1-20250411082229 |
|
spilo Updated |
mirantis.azurecr.io/stacklight/spilo:13-3.3-p2-20250804010014 |
|
telegraf Updated |
mirantis.azurecr.io/stacklight/telegraf:1-20250411114904 |
|
telemeter Updated |
mirantis.azurecr.io/stacklight/telemeter:4.4-20250804010016 |
|
telemeter-token-auth Updated |
mirantis.azurecr.io/stacklight/telemeter-token-auth:v0.1-20250804010015 |
Artifact |
Component |
Path |
|---|---|---|
Configuration management |
Ansible |
|
Debian repositories |
System packages |
|
https://mirror.mirantis.com/kaas/ubuntu-2025-07-16-003900/ Updated |
||
https://mirror.mirantis.com/kaas/ubuntu-2025-07-16-003900.target.txt Updated |
||
MCR repositories |
MCR |
https://repos.mirantis.com/ubuntu/dists/jammy/pool/stable-25.0/ |
Target ubuntu system |
Ubuntu |
https://binary.mirantis.com/bm/bin/efi/ubuntu/tgz-jammy-20250716120729 Updated |
This section outlines release notes for the major Cluster release 17.4.0 that is introduced in the Container Cloud release 2.29.0. This Cluster release is based on the Cluster release 16.4.0. The Cluster release 17.4.0 supports:
Mirantis OpenStack for Kubernetes (MOSK) 25.1. For details, see release notes 25.1.
Mirantis Kubernetes Engine (MKE) 3.7.19. For details, see MKE Release Notes.
Mirantis Container Runtime (MCR) 25.0.8. For details, see MCR Release Notes.
Kubernetes 1.27.
For the list of known and addressed issues, refer to the Container Cloud release 2.29.0 section.
This section outlines new features implemented in the Cluster release 17.4.0 that is introduced in the Container Cloud release 2.29.0. For MOSK enhancements, see New features 25.1.
Introduced support for Mirantis Container Runtime (MCR) 25.0.8 and Mirantis Kubernetes Engine (MKE) 3.7.19 that includes Kubernetes 1.27.16.
On existing clusters, MKE and MCR are updated to the latest supported version when you update your managed cluster to the Cluster release 17.4.0.
Added the following improvments in the CIS Benchmark compliance for Ubuntu, MKE, and Docker:
Introduced new password policies for local (Linux) user accounts. These policies match the rules described in CIS Benchmark compliance checks (executed by the Nessus scanner) for Ubuntu Linux 22.04 LTS v2.0.0 L1 Server, revision 1.1.
The rules are applied automatically to all cluster nodes during cluster update. Therefore, if you use custom Linux accounts protected by passwords, pay attention to the following rules, as you may be forced to update uncompliant password during login:
Password expiration interval: 365 days
Minimum password length: 14 symbols
Required symbols are capital letters, lower case letters, and digits
At least 2 characters of the new password must not be present in the old password
Maximum identical consecutive characters: 3 (allowed: aaa123, not allowed: aaaa123)
Maximum sequential characters: 3 (allowed: abc1xyz, not allowed: abcd123)
Dictionary check is enabled
You must not reuse old password
After 3 failed password input attempts, the account is disabled for 15 minutes
Analyzed and reached 87% of pass rate in the CIS Benchmark compliance checks (executed by the Nessus scanner) for Ubuntu Linux 22.04 LTS v2.0.0 L1 Server, revision 1.1.
Note
Compliance results can vary between clusters due to configuration-dependent tests, such as server disk partitioning.
If you require a detailed report of analyzed and fixed compliance checks, contact Mirantis support.
Analyzed and fixed the following checks (where possible, to reduce the number of failed components) in the Docker and MKE CIS benchmarks compliances:
MKE¶ Control ID
Description
5.1.3
Minimize wildcard use in Roles and ClusterRoles: Over permissive access to resource types in Group
5.2.8
Minimize the admission of containers with added capabilities: Container with ANY capability
5.7.3
Apply Security Context to Your Pods and Containers: Policies - Defined Pods Security Context
Docker¶ Control ID
Description
5.26
Ensure that container health is checked at runtime: No containers without health checks
Note
The control IDs may differ depending on the scanning tool.
Note
Some security scanners may produce false-negative results for some resources because native Docker containers and Kubernetes pods have different configuration mechanisms.
The following table lists the components versions of the Cluster release
17.4.0. The components that are newly added, updated, deprecated, or removed as
compared to 17.3.0, are marked with a corresponding superscript, for example,
lcm-ansible Updated.
Component |
Application/Service |
Version |
|---|---|---|
Cluster orchestration Updated |
Mirantis Kubernetes Engine |
3.7.19 |
Container runtime Updated |
Mirantis Container Runtime |
25.0.8 |
Core Updated |
cinder-csi-plugin |
1.27.2-26 |
client-certificate-controller |
1.42.9 |
|
csi-attacher Deprecated |
4.2.0-9 |
|
csi-node-driver-registrar Deprecated |
2.7.0-9 |
|
csi-provisioner Deprecated |
3.4.1-9 |
|
csi-resizer Deprecated |
1.7.0-9 |
|
csi-snapshotter Deprecated |
6.2.1-mcc-6 |
|
livenessprobe Deprecated |
2.9.0-9 |
|
metrics-server |
0.6.3-12 |
|
policy-controller |
1.42.9 |
|
Distributed storage Updated |
Ceph |
18.2.4-12.cve (Reef) |
Rook |
1.14.10-26 |
|
LCM Updated |
helm-controller |
1.42.9 |
lcm-ansible |
0.27.0-35-g95a1b94 |
|
lcm-agent |
1.42.9 |
|
StackLight |
Alerta Updated |
9.0.4 |
Alertmanager |
0.25.0 |
|
Alertmanager Webhook ServiceNow |
0.1 |
|
Blackbox Exporter Updated |
0.25.0 |
|
cAdvisor Updated |
0.49.1 |
|
Elasticsearch Curator |
5.7.6 |
|
Elasticsearch Exporter Updated |
1.8.0 |
|
Fluentd Updated |
1.18.0 |
|
Grafana Updated |
11.2.6 |
|
kube-state-metrics Updated |
2.13.0 |
|
Metric Collector |
0.1 |
|
Metricbeat |
7.12.1 |
|
Node Exporter |
1.8.2 |
|
OAuth2 Proxy |
7.1.3 |
|
OpenSearch Updated |
2.17.1 |
|
OpenSearch Dashboards Updated |
2.17.1 |
|
Prometheus Updated |
3.0.1 |
|
Prometheus ES Exporter Updated |
0.14.1 |
|
Prometheus MS Teams |
1.5.2 |
|
Prometheus Patroni Exporter |
0.0.1 |
|
Prometheus Postgres Exporter Updated |
0.16.0 |
|
Prometheus Relay |
0.4 |
|
sf-notifier |
0.4 |
|
sf-reporter |
0.1 |
|
Spilo Updated |
13-3.3-p2 |
|
Telegraf |
n/a Removed |
|
1.33.2 Updated |
||
Telemeter |
4.4 |
This section lists the artifacts of components included in the Cluster release
17.4.0. The components that are newly added, updated, deprecated, or removed as
compared to 17.3.0, are marked with a corresponding superscript, for example,
lcm-ansible Updated.
Artifact |
Component |
Path |
|---|---|---|
Helm charts Updated |
local-volume-provisioner |
https://binary.mirantis.com/core/helm/local-volume-provisioner-1.42.9.tgz |
metallb |
||
Docker images |
ironic |
mirantis.azurecr.io/openstack/ironic:antelope-jammy-20240716113922 |
metallb-controller Updated |
mirantis.azurecr.io/bm/metallb/controller:v0.14.5-96d6c3a2-amd64 |
|
metallb-speaker Updated |
mirantis.azurecr.io/bm/metallb/speaker:v0.14.5-96d6c3a2-amd64 |
Artifact |
Component |
Path |
|---|---|---|
Helm charts |
ceph-controller Updated |
https://binary.mirantis.com/ceph/helm/ceph-operator-1.0.0-mcc-2.29.0-7.tgz |
Docker images Updated |
ceph |
mirantis.azurecr.io/mirantis/ceph:v18.2.4-12.cve |
ceph-controller |
mirantis.azurecr.io/ceph/mcp/ceph-controller:2.29.0-6 |
|
cephcsi |
mirantis.azurecr.io/mirantis/cephcsi:v3.11.0-7.cve |
|
cephcsi-attacher |
mirantis.azurecr.io/mirantis/cephcsi-attacher:v4.7.0-2.release |
|
cephcsi-provisioner |
mirantis.azurecr.io/mirantis/cephcsi-provisioner:v4.0.1-2.release |
|
cephcsi-registrar |
mirantis.azurecr.io/mirantis/cephcsi-registrar:v2.12.0-2.release |
|
cephcsi-resizer |
mirantis.azurecr.io/mirantis/cephcsi-resizer:v1.10.1-2.release |
|
cephcsi-snapshotter |
mirantis.azurecr.io/mirantis/cephcsi-snapshotter:v8.1.0-2.release |
|
rook |
mirantis.azurecr.io/ceph/rook:v1.14.10-26 |
|
snapshot-controller |
mirantis.azurecr.io/mirantis/snapshot-controller:v8.1.0-2.release |
Artifact |
Component |
Path |
|---|---|---|
Helm charts Updated |
cinder-csi-plugin Deprecated |
https://binary.mirantis.com/core/helm/cinder-csi-plugin-1.42.9.tgz |
client-certificate-controller |
https://binary.mirantis.com/core/helm/client-certificate-controller-1.42.9.tgz |
|
metrics-server |
https://binary.mirantis.com/core/helm/metrics-server-1.42.9.tgz |
|
openstack-cloud-controller-manager Deprecated |
https://binary.mirantis.com/core/helm/openstack-cloud-controller-manager-1.42.9.tgz |
|
pause-update-controller New |
https://binary.mirantis.com/core/helm/pause-update-controller-1.42.9.tgz |
|
policy-controller |
https://binary.mirantis.com/core/helm/policy-controller-1.42.9.tgz |
|
Docker images |
cinder-csi-plugin Deprecated |
mirantis.azurecr.io/lcm/kubernetes/cinder-csi-plugin:v1.27.2-26 |
client-certificate-controller Updated |
mirantis.azurecr.io/core/client-certificate-controller:1.42.9 |
|
csi-attacher Deprecated |
mirantis.azurecr.io/lcm/k8scsi/csi-attacher:v4.2.0-9 |
|
csi-node-driver-registrar Deprecated |
mirantis.azurecr.io/lcm/k8scsi/csi-node-driver-registrar:v2.7.0-9 |
|
csi-provisioner Deprecated |
mirantis.azurecr.io/lcm/k8scsi/csi-provisioner:v3.4.1-9 |
|
csi-resizer Deprecated |
mirantis.azurecr.io/lcm/k8scsi/csi-resizer:v1.7.0-9 |
|
csi-snapshotter Deprecated |
mirantis.azurecr.io/lcm/k8scsi/csi-snapshotter:v6.2.1-mcc-8 |
|
livenessprobe Deprecated |
mirantis.azurecr.io/lcm/k8scsi/livenessprobe:v2.9.0-9 |
|
metrics-server Updated |
mirantis.azurecr.io/lcm/metrics-server-amd64:v0.6.3-12 |
|
openstack-cloud-controller-manager Deprecated |
mirantis.azurecr.io/lcm/kubernetes/openstack-cloud-controller-manager:v1.27.2-26 |
|
pause-update-controller New |
mirantis.azurecr.io/core/pause-update-controller:1.42.9 |
|
policy-controller Updated |
mirantis.azurecr.io/core/policy-controller:1.42.9 |
Artifact |
Component |
Path |
|---|---|---|
Binaries Updated |
lcm-agent |
mirantis.azurecr.io/core/bin/lcm-agent-1.42.9 |
lcm-ansible |
mirantis.azurecr.io/lcm/bin/lcm-ansible/v0.27.0-35-g95a1b94/lcm-ansible.tar.gz |
|
Helm charts Updated |
helm-controller |
https://binary.mirantis.com/core/helm/helm-controller-1.42.9.tgz |
managed-lcm-api |
https://binary.mirantis.com/core/helm/managed-lcm-api-1.42.9.tgz |
|
Docker images Updated |
helm-controller |
mirantis.azurecr.io/core/helm-controller:1.42.9 |
mcc-haproxy |
mirantis.azurecr.io/lcm/mcc-haproxy:v0.27.0-35-g95a1b94 |
|
mcc-keepalived |
mirantis.azurecr.io/lcm/mcc-keepalived:v0.27.0-35-g95a1b94 |
Artifact |
Component |
Path |
|---|---|---|
Helm charts |
alerta |
https://binary.mirantis.com/stacklight/helm/alerta-0.1.0-mcp-33.tgz |
alertmanager-webhook-servicenow |
https://binary.mirantis.com/stacklight/helm/alertmanager-webhook-servicenow-0.2.0-mcp-8.tgz |
|
cadvisor |
https://binary.mirantis.com/stacklight/helm/cadvisor-0.1.0-mcp-7.tgz |
|
elasticsearch-curator |
https://binary.mirantis.com/stacklight/helm/elasticsearch-curator-1.5.0-mcp-15.tgz |
|
elasticsearch-exporter |
https://binary.mirantis.com/stacklight/helm/elasticsearch-exporter-1.2.0-mcp-10.tgz |
|
fluentd-logs Updated |
https://binary.mirantis.com/stacklight/helm/fluentd-logs-0.1.0-mcp-246.tgz |
|
grafana Updated |
https://binary.mirantis.com/stacklight/helm/grafana-3.3.10-mcp-354.tgz |
|
iam-proxy |
||
metric-collector Updated |
https://binary.mirantis.com/stacklight/helm/metric-collector-0.3.0-mcp-18.tgz |
|
metricbeat |
https://binary.mirantis.com/stacklight/helm/metricbeat-1.7.1-mcp-25.tgz |
|
opensearch |
https://binary.mirantis.com/stacklight/helm/opensearch-0.1.0-mcp-88.tgz |
|
opensearch-dashboards Updated |
https://binary.mirantis.com/stacklight/helm/opensearch-dashboards-0.1.0-mcp-57.tgz |
|
patroni Updated |
https://binary.mirantis.com/stacklight/helm/patroni-0.15.1-mcp-62.tgz |
|
prometheus Updated |
https://binary.mirantis.com/stacklight/helm/prometheus-8.11.4-mcp-259.tgz |
|
prometheus-blackbox-exporter |
https://binary.mirantis.com/stacklight/helm/prometheus-blackbox-exporter-0.3.0-mcp-19.tgz |
|
prometheus-es-exporter |
https://binary.mirantis.com/stacklight/helm/prometheus-es-exporter-1.0.0-mcp-18.tgz |
|
prometheus-msteams |
https://binary.mirantis.com/stacklight/helm/prometheus-msteams-0.1.0-mcp-12.tgz |
|
sf-notifier |
https://binary.mirantis.com/stacklight/helm/sf-notifier-0.2.0-mcp-10.tgz |
|
sf-reporter |
https://binary.mirantis.com/stacklight/helm/sf-reporter-0.2.0-mcp-10.tgz |
|
stacklight Updated |
https://binary.mirantis.com/stacklight/helm/stacklight-0.17.2.tgz |
|
telegraf-ds |
https://binary.mirantis.com/stacklight/helm/telegraf-ds-1.1.5-mcp-42.tgz |
|
telegraf-s |
https://binary.mirantis.com/stacklight/helm/telegraf-s-1.1.5-mcp-42.tgz |
|
telemeter-client |
https://binary.mirantis.com/stacklight/helm/telemeter-client-0.2.0-mcp-14.tgz |
|
telemeter-server |
https://binary.mirantis.com/stacklight/helm/telemeter-server-0.2.0-mcp-14.tgz |
|
Docker images |
alerta-web Updated |
mirantis.azurecr.io/stacklight/alerta-web:9-20250217023014 |
alertmanager Updated |
mirantis.azurecr.io/stacklight/alertmanager:v0-20250217023014 |
|
alertmanager-webhook-servicenow Updated |
mirantis.azurecr.io/stacklight/alertmanager-webhook-servicenow:v0.1-20250214153133 |
|
alpine-utils Updated |
mirantis.azurecr.io/stacklight/alpine-utils:1-20250217023019 |
|
blackbox-exporter Updated |
mirantis.azurecr.io/stacklight/blackbox-exporter:0-20250207134744 |
|
cadvisor Updated |
mirantis.azurecr.io/stacklight/cadvisor:v0.49.1-20250217023014 |
|
configmap-reload Updated |
mirantis.azurecr.io/stacklight/configmap-reload:v0.14.0 |
|
curator |
mirantis.azurecr.io/stacklight/curator:5.7.6-20230404082402 |
|
elasticsearch-exporter Updated |
mirantis.azurecr.io/stacklight/elasticsearch-exporter:v1.8.0 |
|
fluentd Updated |
mirantis.azurecr.io/stacklight/fluentd:1.18-20250217023014 |
|
grafana Updated |
mirantis.azurecr.io/stacklight/grafana:11.2.6 |
|
k8s-sidecar Updated |
mirantis.azurecr.io/stacklight/k8s-sidecar:1-20250214112745 |
|
kube-state-metrics Updated |
mirantis.azurecr.io/stacklight/kube-state-metrics:v2.13.0 |
|
kubectl Removed |
n/a |
|
metric-collector Updated |
mirantis.azurecr.io/stacklight/metric-collector:v0.1-20250217023013 |
|
metricbeat Updated |
mirantis.azurecr.io/stacklight/metricbeat:7.12.1-20250217023013 |
|
node-exporter |
mirantis.azurecr.io/stacklight/node-exporter:v1.8.2 |
|
oauth2-proxy Updated |
mirantis.azurecr.io/iam/oauth2-proxy:v7.1.3-14 |
|
opensearch Updated |
mirantis.azurecr.io/stacklight/opensearch:2.17-20250217023013 |
|
opensearch-dashboards Updated |
mirantis.azurecr.io/stacklight/opensearch-dashboards:2.17-20250217023013 |
|
pgbouncer Removed |
n/a |
|
prometheus Updated |
mirantis.azurecr.io/stacklight/prometheus:v3.0.1 |
|
prometheus-es-exporter Updated |
mirantis.azurecr.io/stacklight/prometheus-es-exporter:v0.14-20250217023019 |
|
prometheus-msteams Updated |
mirantis.azurecr.io/stacklight/prometheus-msteams:v1.5-20250217023014 |
|
prometheus-patroni-exporter Updated |
mirantis.azurecr.io/stacklight/prometheus-patroni-exporter:0.0.1-20250217023013 |
|
prometheus-postgres-exporter Updated |
mirantis.azurecr.io/stacklight/prometheus-postgres-exporter:v0.16.0 |
|
prometheus-relay Updated |
mirantis.azurecr.io/stacklight/prometheus-relay:v0.4-20250207134705 |
|
psql-client Removed |
n/a |
|
sf-notifier Updated |
mirantis.azurecr.io/stacklight/sf-notifier:v0.4-20250217023014 |
|
sf-reporter Updated |
mirantis.azurecr.io/stacklight/sf-reporter:v0.1-20250214110717 |
|
spilo Updated |
mirantis.azurecr.io/stacklight/spilo:13-3.3-p2-20250217081737 |
|
telegraf |
n/a Removed |
|
mirantis.azurecr.io/stacklight/telegraf:1-20250217113112 Updated |
||
telemeter Updated |
mirantis.azurecr.io/stacklight/telemeter:4.4-20250217023013 |
|
telemeter-token-auth Updated |
mirantis.azurecr.io/stacklight/telemeter-token-auth:v0.1-20250217023013 |
Artifact |
Component |
Path |
|---|---|---|
Configuration management |
Ansible |
|
Debian repositories |
System packages |
|
https://mirror.mirantis.com/kaas/ubuntu-2025-02-17-003900/ Updated |
||
https://mirror.mirantis.com/kaas/ubuntu-2025-02-17-003900.target.txt Updated |
||
MCR repositories Updated |
MCR |
https://repos.mirantis.com/ubuntu/dists/jammy/pool/stable-25.0/ |
Target ubuntu system Updated |
Ubuntu |
https://binary.mirantis.com/bm/bin/efi/ubuntu/tgz-jammy-20250217095805 |
Major and patch versions update path
The primary distinction between major and patch product versions lies in the fact that major release versions introduce new functionalities, whereas patch release versions predominantly offer minor product enhancements, mostly CVE resolutions for your clusters.
Depending on your deployment needs, you can either update only between major Cluster releases or apply patch updates between major releases. Choosing the latter option ensures you receive security fixes as soon as they become available. Though, be prepared to update your cluster frequently, approximately once every three weeks. Otherwise, you can update only between major Cluster releases as each subsequent major Cluster release includes patch Cluster release updates of the previous major Cluster release.
This section outlines release notes for supported major and patch Cluster releases of the 16.4.x series.
This section outlines release notes for the patch Cluster release 16.4.6 that is introduced in the Container Cloud release 2.29.6 and is based on the previous Cluster releases of the 16.4.x series.
The Cluster release 16.4.6 supports Mirantis Kubernetes Engine 3.7.24 with
Kubernetes 1.27 and Mirantis Container Runtime 25.0.8 with
docker-ee-cli updated to 25.0.10.
For details on patch release delivery, see MOSK cluster components compatibility. This section lists the artifacts of components included in the Cluster release 16.4.6.
Note
The components that are newly added, updated, deprecated, or removed
as compared to the previous release version, are marked
with a corresponding superscript,
for example, lcm-ansible Updated.
Artifact |
Component |
Path |
|---|---|---|
Helm charts Updated |
local-volume-provisioner |
https://binary.mirantis.com/core/helm/local-volume-provisioner-1.42.26.tgz |
metallb |
||
Docker images |
ironic Updated |
mirantis.azurecr.io/openstack/ironic:antelope-jammy-20250716073925 |
metallb-controller |
mirantis.azurecr.io/bm/metallb/controller:v0.14.5-6716f869-amd64 |
|
metallb-speaker |
mirantis.azurecr.io/bm/metallb/speaker:v0.14.5-6716f869-amd64 |
Artifact |
Component |
Path |
|---|---|---|
Helm charts Updated |
ceph-controller |
https://binary.mirantis.com/ceph/helm/ceph-operator-1.0.0-mcc-2.29.6-1.tgz |
Docker images Updated |
ceph |
mirantis.azurecr.io/mirantis/ceph:v18.2.7-3.cve |
ceph-controller |
mirantis.azurecr.io/ceph/mcp/ceph-controller:2.29.6-0 |
|
cephcsi |
mirantis.azurecr.io/mirantis/cephcsi:v3.11.0-11.cve |
|
cephcsi-attacher |
mirantis.azurecr.io/mirantis/cephcsi-attacher:v4.7.0-4.cve |
|
cephcsi-provisioner |
mirantis.azurecr.io/mirantis/cephcsi-provisioner:v4.0.1-4.cve |
|
cephcsi-registrar |
mirantis.azurecr.io/mirantis/cephcsi-registrar:v2.12.0-4.cve |
|
cephcsi-resizer |
mirantis.azurecr.io/mirantis/cephcsi-resizer:v1.10.1-4.cve |
|
cephcsi-snapshotter |
mirantis.azurecr.io/mirantis/cephcsi-snapshotter:v8.1.0-4.cve |
|
rook |
mirantis.azurecr.io/ceph/rook:v1.14.10-31 |
|
snapshot-controller |
mirantis.azurecr.io/mirantis/snapshot-controller:v8.1.0-4.cve |
Artifact |
Component |
Path |
|---|---|---|
Helm charts |
cinder-csi-plugin Updated |
https://binary.mirantis.com/core/helm/cinder-csi-plugin-1.42.26.tgz |
client-certificate-controller Updated |
https://binary.mirantis.com/core/helm/client-certificate-controller-1.42.26.tgz |
|
metrics-server Updated |
https://binary.mirantis.com/core/helm/metrics-server-1.42.26.tgz |
|
openstack-cloud-controller-manager Deprecated |
https://binary.mirantis.com/core/helm/openstack-cloud-controller-manager-1.42.26.tgz |
|
pause-update-controller Updated |
https://binary.mirantis.com/core/helm/pause-update-controller-1.42.26.tgz |
|
policy-controller Updated |
https://binary.mirantis.com/core/helm/policy-controller-1.42.26.tgz |
|
Docker images |
cinder-csi-plugin |
mirantis.azurecr.io/lcm/kubernetes/cinder-csi-plugin:v1.27.2-28 |
client-certificate-controller Updated |
mirantis.azurecr.io/core/client-certificate-controller:1.42.26 |
|
csi-attacher Deprecated |
mirantis.azurecr.io/lcm/k8scsi/csi-attacher:v4.2.0-10 |
|
csi-node-driver-registrar Deprecated |
mirantis.azurecr.io/lcm/k8scsi/csi-node-driver-registrar:v2.7.0-9 |
|
csi-provisioner Deprecated |
mirantis.azurecr.io/lcm/k8scsi/csi-provisioner:v3.4.1-10 |
|
csi-resizer Deprecated |
mirantis.azurecr.io/lcm/k8scsi/csi-resizer:v1.7.0-10 |
|
csi-snapshotter Deprecated |
mirantis.azurecr.io/lcm/k8scsi/csi-snapshotter:v6.2.1-mcc-9 |
|
livenessprobe Deprecated |
mirantis.azurecr.io/lcm/k8scsi/livenessprobe:v2.9.0-9 |
|
metrics-server |
mirantis.azurecr.io/lcm/metrics-server-amd64:v0.6.3-13 |
|
openstack-cloud-controller-manager Deprecated |
mirantis.azurecr.io/lcm/kubernetes/openstack-cloud-controller-manager:v1.27.2-28 |
|
pause-update-controller Updated |
mirantis.azurecr.io/core/pause-update-controller:1.42.26 |
|
policy-controller Updated |
mirantis.azurecr.io/core/policy-controller:1.42.26 |
Artifact |
Component |
Path |
|---|---|---|
Binaries Updated |
lcm-agent |
mirantis.azurecr.io/core/bin/lcm-agent-1.42.26 |
lcm-ansible |
mirantis.azurecr.io/lcm/bin/lcm-ansible/v0.27.0-45-g62835a8/lcm-ansible.tar.gz |
|
Helm charts Updated |
helm-controller |
https://binary.mirantis.com/core/helm/helm-controller-1.42.26.tgz |
managed-lcm-api |
https://binary.mirantis.com/core/helm/managed-lcm-api-1.42.26.tgz |
|
Docker images Updated |
helm-controller |
mirantis.azurecr.io/core/helm-controller:1.42.26 |
mcc-haproxy |
mirantis.azurecr.io/lcm/mcc-haproxy:v0.27.0-45-g62835a8 |
|
mcc-keepalived |
mirantis.azurecr.io/lcm/mcc-keepalived:v0.27.0-45-g62835a8 |
Artifact |
Component |
Path |
|---|---|---|
Helm charts |
alerta |
https://binary.mirantis.com/stacklight/helm/alerta-0.1.0-mcp-33.tgz |
alertmanager-webhook-servicenow |
https://binary.mirantis.com/stacklight/helm/alertmanager-webhook-servicenow-0.2.0-mcp-8.tgz |
|
cadvisor |
https://binary.mirantis.com/stacklight/helm/cadvisor-0.1.0-mcp-7.tgz |
|
elasticsearch-curator |
https://binary.mirantis.com/stacklight/helm/elasticsearch-curator-1.5.0-mcp-15.tgz |
|
elasticsearch-exporter |
https://binary.mirantis.com/stacklight/helm/elasticsearch-exporter-1.2.0-mcp-10.tgz |
|
fluentd-logs |
https://binary.mirantis.com/stacklight/helm/fluentd-logs-0.1.0-mcp-249.tgz |
|
grafana |
https://binary.mirantis.com/stacklight/helm/grafana-3.3.10-mcp-354.tgz |
|
iam-proxy |
||
metric-collector |
https://binary.mirantis.com/stacklight/helm/metric-collector-0.3.0-mcp-18.tgz |
|
metricbeat |
https://binary.mirantis.com/stacklight/helm/metricbeat-1.7.1-mcp-25.tgz |
|
opensearch Updated |
https://binary.mirantis.com/stacklight/helm/opensearch-0.1.0-mcp-90.tgz |
|
opensearch-dashboards |
https://binary.mirantis.com/stacklight/helm/opensearch-dashboards-0.1.0-mcp-57.tgz |
|
patroni |
https://binary.mirantis.com/stacklight/helm/patroni-0.15.1-mcp-62.tgz |
|
prometheus |
https://binary.mirantis.com/stacklight/helm/prometheus-8.11.4-mcp-259.tgz |
|
prometheus-blackbox-exporter |
https://binary.mirantis.com/stacklight/helm/prometheus-blackbox-exporter-0.3.0-mcp-19.tgz |
|
prometheus-es-exporter |
https://binary.mirantis.com/stacklight/helm/prometheus-es-exporter-1.0.0-mcp-18.tgz |
|
prometheus-msteams |
https://binary.mirantis.com/stacklight/helm/prometheus-msteams-0.1.0-mcp-12.tgz |
|
sf-notifier |
https://binary.mirantis.com/stacklight/helm/sf-notifier-0.2.0-mcp-10.tgz |
|
sf-reporter |
https://binary.mirantis.com/stacklight/helm/sf-reporter-0.2.0-mcp-10.tgz |
|
stacklight Updated |
https://binary.mirantis.com/stacklight/helm/stacklight-0.17.15.tgz |
|
telegraf-ds |
https://binary.mirantis.com/stacklight/helm/telegraf-ds-1.1.5-mcp-42.tgz |
|
telegraf-s |
https://binary.mirantis.com/stacklight/helm/telegraf-s-1.1.5-mcp-42.tgz |
|
telemeter-client |
https://binary.mirantis.com/stacklight/helm/telemeter-client-0.2.0-mcp-14.tgz |
|
telemeter-server |
https://binary.mirantis.com/stacklight/helm/telemeter-server-0.2.0-mcp-14.tgz |
|
Docker images |
alerta-web Updated |
mirantis.azurecr.io/stacklight/alerta-web:9-20250804010011 |
alertmanager Updated |
mirantis.azurecr.io/stacklight/alertmanager:v0.25-20250804010015 |
|
alertmanager-webhook-servicenow |
mirantis.azurecr.io/stacklight/alertmanager-webhook-servicenow:v0.1-20250411082209 |
|
alpine-utils Updated |
mirantis.azurecr.io/stacklight/alpine-utils:1-20250804010017 |
|
blackbox-exporter |
mirantis.azurecr.io/stacklight/blackbox-exporter:0-20250305095821 |
|
cadvisor Updated |
mirantis.azurecr.io/stacklight/cadvisor:v0.49.1-20250804010013 |
|
configmap-reload |
mirantis.azurecr.io/stacklight/configmap-reload:v0.14.0 |
|
curator |
mirantis.azurecr.io/stacklight/curator:5.7.6-20230404082402 |
|
elasticsearch-exporter |
mirantis.azurecr.io/stacklight/elasticsearch-exporter:v1.8.0 |
|
fluentd Updated |
mirantis.azurecr.io/stacklight/fluentd:1.18-plugin-os-1.0-20250804010010 |
|
grafana |
mirantis.azurecr.io/stacklight/grafana:11.2.9 |
|
k8s-sidecar Updated |
mirantis.azurecr.io/stacklight/k8s-sidecar:1-20250801064311 |
|
kube-state-metrics |
mirantis.azurecr.io/stacklight/kube-state-metrics:v2.13.0 |
|
metric-collector Updated |
mirantis.azurecr.io/stacklight/metric-collector:v0.1-20250804010016 |
|
metricbeat Updated |
mirantis.azurecr.io/stacklight/metricbeat:7.12.1-20250804010014 |
|
node-exporter |
mirantis.azurecr.io/stacklight/node-exporter:v1.8.2 |
|
oauth2-proxy |
mirantis.azurecr.io/iam/oauth2-proxy:v7.1.3-15 |
|
opensearch Updated |
mirantis.azurecr.io/stacklight/opensearch:2.19-20250804010015 |
|
opensearch-dashboards Updated |
mirantis.azurecr.io/stacklight/opensearch-dashboards:2.19-20250804010012 |
|
prometheus |
mirantis.azurecr.io/stacklight/prometheus:v3.2.1 |
|
prometheus-es-exporter Updated |
mirantis.azurecr.io/stacklight/prometheus-es-exporter:v0.14-20250804010016 |
|
prometheus-msteams Updated |
mirantis.azurecr.io/stacklight/prometheus-msteams:v1.5-20250804010015 |
|
prometheus-patroni-exporter Updated |
mirantis.azurecr.io/stacklight/prometheus-patroni-exporter:0.0.1-20250804010016 |
|
prometheus-postgres-exporter |
mirantis.azurecr.io/stacklight/prometheus-postgres-exporter:v0.16.0 |
|
prometheus-relay |
mirantis.azurecr.io/stacklight/prometheus-relay:v0.4-20250304085150 |
|
sf-notifier Updated |
mirantis.azurecr.io/stacklight/sf-notifier:v0.4-20250804010016 |
|
sf-reporter |
mirantis.azurecr.io/stacklight/sf-reporter:v0.1-20250411082229 |
|
spilo Updated |
mirantis.azurecr.io/stacklight/spilo:13-3.3-p2-20250804010014 |
|
telegraf |
mirantis.azurecr.io/stacklight/telegraf:1-20250411114904 |
|
telemeter Updated |
mirantis.azurecr.io/stacklight/telemeter:4.4-20250804010016 |
|
telemeter-token-auth Updated |
mirantis.azurecr.io/stacklight/telemeter-token-auth:v0.1-20250804010015 |
Artifact |
Component |
Path |
|---|---|---|
Configuration management |
Ansible |
|
Debian repositories |
System packages |
|
https://mirror.mirantis.com/kaas/ubuntu-2025-07-16-003900/ Updated |
||
https://mirror.mirantis.com/kaas/ubuntu-2025-07-16-003900.target.txt Updated |
||
MCR repositories |
MCR |
https://repos.mirantis.com/ubuntu/dists/jammy/pool/stable-25.0/ |
Target ubuntu system |
Ubuntu |
https://binary.mirantis.com/bm/bin/efi/ubuntu/tgz-jammy-20250716120729 Updated |
This section outlines release notes for the major Cluster release 16.4.0 that is introduced in the Container Cloud release 2.29.0. The Cluster release 16.4.0 supports:
Mirantis Kubernetes Engine (MKE) 3.7.19. For details, see MKE Release Notes.
Mirantis Container Runtime (MCR) 25.0.8. For details, see MCR Release Notes.
Kubernetes 1.27.
For the list of known and addressed issues, refer to the Container Cloud release 2.29.0 section.
This section outlines new features implemented in the Cluster release 16.4.0 that is introduced in the Container Cloud release 2.29.0.
Introduced support for Mirantis Container Runtime (MCR) 25.0.8 and Mirantis Kubernetes Engine (MKE) 3.7.19 that includes Kubernetes 1.27.16.
On existing clusters, MKE and MCR are updated to the latest supported version when you update your managed cluster to the Cluster release 17.4.0.
Added the following improvments in the CIS Benchmark compliance for Ubuntu, MKE, and Docker:
Introduced new password policies for local (Linux) user accounts. These policies match the rules described in CIS Benchmark compliance checks (executed by the Nessus scanner) for Ubuntu Linux 22.04 LTS v2.0.0 L1 Server, revision 1.1.
The rules are applied automatically to all cluster nodes during cluster update. Therefore, if you use custom Linux accounts protected by passwords, pay attention to the following rules, as you may be forced to update uncompliant password during login:
Password expiration interval: 365 days
Minimum password length: 14 symbols
Required symbols are capital letters, lower case letters, and digits
At least 2 characters of the new password must not be present in the old password
Maximum identical consecutive characters: 3 (allowed: aaa123, not allowed: aaaa123)
Maximum sequential characters: 3 (allowed: abc1xyz, not allowed: abcd123)
Dictionary check is enabled
You must not reuse old password
After 3 failed password input attempts, the account is disabled for 15 minutes
Analyzed and reached 87% of pass rate in the CIS Benchmark compliance checks (executed by the Nessus scanner) for Ubuntu Linux 22.04 LTS v2.0.0 L1 Server, revision 1.1.
Note
Compliance results can vary between clusters due to configuration-dependent tests, such as server disk partitioning.
If you require a detailed report of analyzed and fixed compliance checks, contact Mirantis support.
Analyzed and fixed the following checks (where possible, to reduce the number of failed components) in the Docker and MKE CIS benchmarks compliances:
MKE¶ Control ID
Description
5.1.3
Minimize wildcard use in Roles and ClusterRoles: Over permissive access to resource types in Group
5.2.8
Minimize the admission of containers with added capabilities: Container with ANY capability
5.7.3
Apply Security Context to Your Pods and Containers: Policies - Defined Pods Security Context
Docker¶ Control ID
Description
5.26
Ensure that container health is checked at runtime: No containers without health checks
Note
The control IDs may differ depending on the scanning tool.
Note
Some security scanners may produce false-negative results for some resources because native Docker containers and Kubernetes pods have different configuration mechanisms.
The following table lists the components versions of the Cluster release
16.4.0. The components that are newly added, updated, deprecated, or removed as
compared to 16.3.0, are marked with a corresponding superscript, for example,
lcm-ansible Updated.
Component |
Application/Service |
Version |
|---|---|---|
Cluster orchestration Updated |
Mirantis Kubernetes Engine |
3.7.19 |
Container runtime Updated |
Mirantis Container Runtime |
25.0.8 |
Core Updated |
cinder-csi-plugin |
1.27.2-26 |
client-certificate-controller |
1.42.9 |
|
csi-attacher Deprecated |
4.2.0-9 |
|
csi-node-driver-registrar Deprecated |
2.7.0-9 |
|
csi-provisioner Deprecated |
3.4.1-9 |
|
csi-resizer Deprecated |
1.7.0-9 |
|
csi-snapshotter Deprecated |
6.2.1-mcc-6 |
|
livenessprobe Deprecated |
2.9.0-9 |
|
metrics-server |
0.6.3-12 |
|
policy-controller |
1.42.9 |
|
Distributed storage Updated |
Ceph |
18.2.4-12.cve (Reef) |
Rook |
1.14.10-26 |
|
LCM Updated |
helm-controller |
1.42.9 |
lcm-ansible |
0.27.0-35-g95a1b94 |
|
lcm-agent |
1.42.9 |
|
StackLight |
Alerta Updated |
9.0.4 |
Alertmanager |
0.25.0 |
|
Alertmanager Webhook ServiceNow |
0.1 |
|
Blackbox Exporter Updated |
0.25.0 |
|
cAdvisor Updated |
0.49.1 |
|
Elasticsearch Curator |
5.7.6 |
|
Elasticsearch Exporter Updated |
1.8.0 |
|
Fluentd Updated |
1.18.0 |
|
Grafana Updated |
11.2.6 |
|
kube-state-metrics Updated |
2.13.0 |
|
Metric Collector |
0.1 |
|
Metricbeat |
7.12.1 |
|
Node Exporter |
1.8.2 |
|
OAuth2 Proxy |
7.1.3 |
|
OpenSearch Updated |
2.17.1 |
|
OpenSearch Dashboards Updated |
2.17.1 |
|
Prometheus Updated |
3.0.1 |
|
Prometheus ES Exporter Updated |
0.14.1 |
|
Prometheus MS Teams |
1.5.2 |
|
Prometheus Patroni Exporter |
0.0.1 |
|
Prometheus Postgres Exporter Updated |
0.16.0 |
|
Prometheus Relay |
0.4 |
|
sf-notifier |
0.4 |
|
sf-reporter |
0.1 |
|
Spilo Updated |
13-3.3-p2 |
|
Telegraf |
n/a Removed |
|
1.33.2 Updated |
||
Telemeter |
4.4 |
This section lists the artifacts of components included in the Cluster release
16.4.0. The components that are newly added, updated, deprecated, or removed as
compared to 16.3.0, are marked with a corresponding superscript, for example,
lcm-ansible Updated.
Artifact |
Component |
Path |
|---|---|---|
Helm charts Updated |
local-volume-provisioner |
https://binary.mirantis.com/core/helm/local-volume-provisioner-1.42.9.tgz |
metallb |
||
Docker images |
ironic |
mirantis.azurecr.io/openstack/ironic:antelope-jammy-20240716113922 |
metallb-controller Updated |
mirantis.azurecr.io/bm/metallb/controller:v0.14.5-96d6c3a2-amd64 |
|
metallb-speaker Updated |
mirantis.azurecr.io/bm/metallb/speaker:v0.14.5-96d6c3a2-amd64 |
Artifact |
Component |
Path |
|---|---|---|
Helm charts |
ceph-controller Updated |
https://binary.mirantis.com/ceph/helm/ceph-operator-1.0.0-mcc-2.29.0-7.tgz |
Docker images Updated |
ceph |
mirantis.azurecr.io/mirantis/ceph:v18.2.4-12.cve |
ceph-controller |
mirantis.azurecr.io/ceph/mcp/ceph-controller:2.29.0-6 |
|
cephcsi |
mirantis.azurecr.io/mirantis/cephcsi:v3.11.0-7.cve |
|
cephcsi-attacher |
mirantis.azurecr.io/mirantis/cephcsi-attacher:v4.7.0-2.release |
|
cephcsi-provisioner |
mirantis.azurecr.io/mirantis/cephcsi-provisioner:v4.0.1-2.release |
|
cephcsi-registrar |
mirantis.azurecr.io/mirantis/cephcsi-registrar:v2.12.0-2.release |
|
cephcsi-resizer |
mirantis.azurecr.io/mirantis/cephcsi-resizer:v1.10.1-2.release |
|
cephcsi-snapshotter |
mirantis.azurecr.io/mirantis/cephcsi-snapshotter:v8.1.0-2.release |
|
rook |
mirantis.azurecr.io/ceph/rook:v1.14.10-26 |
|
snapshot-controller |
mirantis.azurecr.io/mirantis/snapshot-controller:v8.1.0-2.release |
Artifact |
Component |
Path |
|---|---|---|
Helm charts Updated |
cinder-csi-plugin Deprecated |
https://binary.mirantis.com/core/helm/cinder-csi-plugin-1.42.9.tgz |
client-certificate-controller |
https://binary.mirantis.com/core/helm/client-certificate-controller-1.42.9.tgz |
|
metrics-server |
https://binary.mirantis.com/core/helm/metrics-server-1.42.9.tgz |
|
openstack-cloud-controller-manager Deprecated |
https://binary.mirantis.com/core/helm/openstack-cloud-controller-manager-1.42.9.tgz |
|
pause-update-controller New |
https://binary.mirantis.com/core/helm/pause-update-controller-1.42.9.tgz |
|
policy-controller |
https://binary.mirantis.com/core/helm/policy-controller-1.42.9.tgz |
|
Docker images |
cinder-csi-plugin Deprecated |
mirantis.azurecr.io/lcm/kubernetes/cinder-csi-plugin:v1.27.2-26 |
client-certificate-controller Updated |
mirantis.azurecr.io/core/client-certificate-controller:1.42.9 |
|
csi-attacher Deprecated |
mirantis.azurecr.io/lcm/k8scsi/csi-attacher:v4.2.0-9 |
|
csi-node-driver-registrar Deprecated |
mirantis.azurecr.io/lcm/k8scsi/csi-node-driver-registrar:v2.7.0-9 |
|
csi-provisioner Deprecated |
mirantis.azurecr.io/lcm/k8scsi/csi-provisioner:v3.4.1-9 |
|
csi-resizer Deprecated |
mirantis.azurecr.io/lcm/k8scsi/csi-resizer:v1.7.0-9 |
|
csi-snapshotter Deprecated |
mirantis.azurecr.io/lcm/k8scsi/csi-snapshotter:v6.2.1-mcc-8 |
|
livenessprobe Deprecated |
mirantis.azurecr.io/lcm/k8scsi/livenessprobe:v2.9.0-9 |
|
metrics-server Updated |
mirantis.azurecr.io/lcm/metrics-server-amd64:v0.6.3-12 |
|
openstack-cloud-controller-manager Deprecated |
mirantis.azurecr.io/lcm/kubernetes/openstack-cloud-controller-manager:v1.27.2-26 |
|
pause-update-controller New |
mirantis.azurecr.io/core/pause-update-controller:1.42.9 |
|
policy-controller Updated |
mirantis.azurecr.io/core/policy-controller:1.42.9 |
Artifact |
Component |
Path |
|---|---|---|
Binaries Updated |
lcm-agent |
mirantis.azurecr.io/core/bin/lcm-agent-1.42.9 |
lcm-ansible |
mirantis.azurecr.io/lcm/bin/lcm-ansible/v0.27.0-35-g95a1b94/lcm-ansible.tar.gz |
|
Helm charts Updated |
helm-controller |
https://binary.mirantis.com/core/helm/helm-controller-1.42.9.tgz |
managed-lcm-api |
https://binary.mirantis.com/core/helm/managed-lcm-api-1.42.9.tgz |
|
Docker images Updated |
helm-controller |
mirantis.azurecr.io/core/helm-controller:1.42.9 |
mcc-haproxy |
mirantis.azurecr.io/lcm/mcc-haproxy:v0.27.0-35-g95a1b94 |
|
mcc-keepalived |
mirantis.azurecr.io/lcm/mcc-keepalived:v0.27.0-35-g95a1b94 |
Artifact |
Component |
Path |
|---|---|---|
Helm charts |
alerta |
https://binary.mirantis.com/stacklight/helm/alerta-0.1.0-mcp-33.tgz |
alertmanager-webhook-servicenow |
https://binary.mirantis.com/stacklight/helm/alertmanager-webhook-servicenow-0.2.0-mcp-8.tgz |
|
cadvisor |
https://binary.mirantis.com/stacklight/helm/cadvisor-0.1.0-mcp-7.tgz |
|
elasticsearch-curator |
https://binary.mirantis.com/stacklight/helm/elasticsearch-curator-1.5.0-mcp-15.tgz |
|
elasticsearch-exporter |
https://binary.mirantis.com/stacklight/helm/elasticsearch-exporter-1.2.0-mcp-10.tgz |
|
fluentd-logs Updated |
https://binary.mirantis.com/stacklight/helm/fluentd-logs-0.1.0-mcp-246.tgz |
|
grafana Updated |
https://binary.mirantis.com/stacklight/helm/grafana-3.3.10-mcp-354.tgz |
|
iam-proxy |
||
metric-collector Updated |
https://binary.mirantis.com/stacklight/helm/metric-collector-0.3.0-mcp-18.tgz |
|
metricbeat |
https://binary.mirantis.com/stacklight/helm/metricbeat-1.7.1-mcp-25.tgz |
|
opensearch |
https://binary.mirantis.com/stacklight/helm/opensearch-0.1.0-mcp-88.tgz |
|
opensearch-dashboards Updated |
https://binary.mirantis.com/stacklight/helm/opensearch-dashboards-0.1.0-mcp-57.tgz |
|
patroni Updated |
https://binary.mirantis.com/stacklight/helm/patroni-0.15.1-mcp-62.tgz |
|
prometheus Updated |
https://binary.mirantis.com/stacklight/helm/prometheus-8.11.4-mcp-259.tgz |
|
prometheus-blackbox-exporter |
https://binary.mirantis.com/stacklight/helm/prometheus-blackbox-exporter-0.3.0-mcp-19.tgz |
|
prometheus-es-exporter |
https://binary.mirantis.com/stacklight/helm/prometheus-es-exporter-1.0.0-mcp-18.tgz |
|
prometheus-msteams |
https://binary.mirantis.com/stacklight/helm/prometheus-msteams-0.1.0-mcp-12.tgz |
|
refapp Removed |
n/a |
|
sf-notifier |
https://binary.mirantis.com/stacklight/helm/sf-notifier-0.2.0-mcp-10.tgz |
|
sf-reporter |
https://binary.mirantis.com/stacklight/helm/sf-reporter-0.2.0-mcp-10.tgz |
|
stacklight Updated |
https://binary.mirantis.com/stacklight/helm/stacklight-0.17.2.tgz |
|
telegraf-ds |
https://binary.mirantis.com/stacklight/helm/telegraf-ds-1.1.5-mcp-42.tgz |
|
telegraf-s |
https://binary.mirantis.com/stacklight/helm/telegraf-s-1.1.5-mcp-42.tgz |
|
telemeter-client |
https://binary.mirantis.com/stacklight/helm/telemeter-client-0.2.0-mcp-14.tgz |
|
telemeter-server |
https://binary.mirantis.com/stacklight/helm/telemeter-server-0.2.0-mcp-14.tgz |
|
Docker images |
alerta-web Updated |
mirantis.azurecr.io/stacklight/alerta-web:9-20250217023014 |
alertmanager Updated |
mirantis.azurecr.io/stacklight/alertmanager:v0-20250217023014 |
|
alertmanager-webhook-servicenow Updated |
mirantis.azurecr.io/stacklight/alertmanager-webhook-servicenow:v0.1-20250214153133 |
|
alpine-utils Updated |
mirantis.azurecr.io/stacklight/alpine-utils:1-20250217023019 |
|
blackbox-exporter Updated |
mirantis.azurecr.io/stacklight/blackbox-exporter:0-20250207134744 |
|
cadvisor Updated |
mirantis.azurecr.io/stacklight/cadvisor:v0.49.1-20250217023014 |
|
configmap-reload Updated |
mirantis.azurecr.io/stacklight/configmap-reload:v0.14.0 |
|
curator |
mirantis.azurecr.io/stacklight/curator:5.7.6-20230404082402 |
|
elasticsearch-exporter Updated |
mirantis.azurecr.io/stacklight/elasticsearch-exporter:v1.8.0 |
|
fluentd Updated |
mirantis.azurecr.io/stacklight/fluentd:1.18-20250217023014 |
|
grafana Updated |
mirantis.azurecr.io/stacklight/grafana:11.2.6 |
|
k8s-sidecar Updated |
mirantis.azurecr.io/stacklight/k8s-sidecar:1-20250214112745 |
|
kube-state-metrics Updated |
mirantis.azurecr.io/stacklight/kube-state-metrics:v2.13.0 |
|
kubectl Removed |
n/a |
|
metric-collector Updated |
mirantis.azurecr.io/stacklight/metric-collector:v0.1-20250217023013 |
|
metricbeat Updated |
mirantis.azurecr.io/stacklight/metricbeat:7.12.1-20250217023013 |
|
node-exporter |
mirantis.azurecr.io/stacklight/node-exporter:v1.8.2 |
|
oauth2-proxy Updated |
mirantis.azurecr.io/iam/oauth2-proxy:v7.1.3-14 |
|
opensearch Updated |
mirantis.azurecr.io/stacklight/opensearch:2.17-20250217023013 |
|
opensearch-dashboards Updated |
mirantis.azurecr.io/stacklight/opensearch-dashboards:2.17-20250217023013 |
|
openstack-refapp Removed |
n/a |
|
pgbouncer Removed |
n/a |
|
prometheus Updated |
mirantis.azurecr.io/stacklight/prometheus:v3.0.1 |
|
prometheus-es-exporter Updated |
mirantis.azurecr.io/stacklight/prometheus-es-exporter:v0.14-20250217023019 |
|
prometheus-msteams Updated |
mirantis.azurecr.io/stacklight/prometheus-msteams:v1.5-20250217023014 |
|
prometheus-patroni-exporter Updated |
mirantis.azurecr.io/stacklight/prometheus-patroni-exporter:0.0.1-20250217023013 |
|
prometheus-postgres-exporter Updated |
mirantis.azurecr.io/stacklight/prometheus-postgres-exporter:v0.16.0 |
|
prometheus-relay Updated |
mirantis.azurecr.io/stacklight/prometheus-relay:v0.4-20250207134705 |
|
psql-client Removed |
n/a |
|
sf-notifier Updated |
mirantis.azurecr.io/stacklight/sf-notifier:v0.4-20250217023014 |
|
sf-reporter Updated |
mirantis.azurecr.io/stacklight/sf-reporter:v0.1-20250214110717 |
|
spilo Updated |
mirantis.azurecr.io/stacklight/spilo:13-3.3-p2-20250217081737 |
|
telegraf |
n/a Removed |
|
mirantis.azurecr.io/stacklight/telegraf:1-20250217113112 Updated |
||
telemeter Updated |
mirantis.azurecr.io/stacklight/telemeter:4.4-20250217023013 |
|
telemeter-token-auth Updated |
mirantis.azurecr.io/stacklight/telemeter-token-auth:v0.1-20250217023013 |
Artifact |
Component |
Path |
|---|---|---|
Configuration management |
Ansible |
|
Debian repositories |
System packages |
|
https://mirror.mirantis.com/kaas/ubuntu-2025-02-17-003900/ Updated |
||
https://mirror.mirantis.com/kaas/ubuntu-2025-02-17-003900.target.txt Updated |
||
MCR repositories Updated |
MCR |
https://repos.mirantis.com/ubuntu/dists/jammy/pool/stable-25.0/ |
Target ubuntu system Updated |
Ubuntu |
https://binary.mirantis.com/bm/bin/efi/ubuntu/tgz-jammy-20250217095805 |
Unsupported Cluster releases
This section describes the release notes for the unsupported Cluster releases. For details about supported Cluster releases, see Cluster releases.
Major and patch versions update path
The primary distinction between major and patch product versions lies in the fact that major release versions introduce new functionalities, whereas patch release versions predominantly offer minor product enhancements, mostly CVE resolutions for your clusters.
Depending on your deployment needs, you can either update only between major Cluster releases or apply patch updates between major releases. Choosing the latter option ensures you receive security fixes as soon as they become available. Though, be prepared to update your cluster frequently, approximately once every three weeks. Otherwise, you can update only between major Cluster releases as each subsequent major Cluster release includes patch Cluster release updates of the previous major Cluster release.
This section outlines release notes for major and patch Cluster releases of the 17.3.x series dedicated for Mirantis OpenStack for Kubernetes (MOSK).
This section includes release notes for the patch Cluster release 17.3.10 that is introduced in the Container Cloud patch release 2.29.5 and is based on the previous Cluster releases of the 17.3.x series and on 16.3.10.
This patch Cluster release introduces MOSK 24.3.7 that
is based on Mirantis Kubernetes Engine 3.7.23 with Kubernetes 1.27 and Mirantis
Container Runtime 23.0.15 with docker-ee-cli updated to 23.0.18.
For details on MOSK 24.3.7, see release notes 24.3.7
For the list of CVE fixes delivered with this patch Cluster release, see 2.29.5
For details on patch release delivery, see Patch releases
This section lists the artifacts of components included in the Cluster release 17.3.10.
Note
The components that are newly added, updated, deprecated, or removed
as compared to the previous release version, are marked
with a corresponding superscript,
for example, lcm-ansible Updated.
Artifact |
Component |
Path |
|---|---|---|
Helm charts Updated |
local-volume-provisioner |
https://binary.mirantis.com/core/helm/local-volume-provisioner-1.41.35.tgz |
metallb |
||
Docker images Updated |
ironic |
mirantis.azurecr.io/openstack/ironic:antelope-jammy-20250704140945 |
metallb-controller |
mirantis.azurecr.io/bm/metallb/controller:v0.14.5-6716f869-amd64 |
|
metallb-speaker |
mirantis.azurecr.io/bm/metallb/speaker:v0.14.5-6716f869-amd64 |
Artifact |
Component |
Path |
|---|---|---|
Helm charts |
ceph-controller |
https://binary.mirantis.com/ceph/helm/ceph-operator-1.0.0-mcc-2.29.4-2.tgz |
Docker images |
ceph |
mirantis.azurecr.io/mirantis/ceph:v18.2.7-2.cve |
ceph-controller |
mirantis.azurecr.io/ceph/mcp/ceph-controller:2.29.4-1 |
|
cephcsi |
mirantis.azurecr.io/mirantis/cephcsi:v3.9.0-29.cve |
|
cephcsi-attacher |
mirantis.azurecr.io/mirantis/cephcsi-attacher:v4.4.2-7.cve |
|
cephcsi-provisioner |
mirantis.azurecr.io/mirantis/cephcsi-provisioner:v3.6.2-7.cve |
|
cephcsi-registrar |
mirantis.azurecr.io/mirantis/cephcsi-registrar:v2.9.2-7.cve |
|
cephcsi-resizer |
mirantis.azurecr.io/mirantis/cephcsi-resizer:v1.9.2-7.cve |
|
cephcsi-snapshotter |
mirantis.azurecr.io/mirantis/cephcsi-snapshotter:v6.3.2-7.cve |
|
rook |
mirantis.azurecr.io/ceph/rook:v1.13.5-31 |
|
snapshot-controller |
mirantis.azurecr.io/mirantis/snapshot-controller:v6.3.2-7.cve |
Artifact |
Component |
Path |
|---|---|---|
Helm charts |
cinder-csi-plugin Updated |
https://binary.mirantis.com/core/helm/cinder-csi-plugin-1.41.35.tgz |
client-certificate-controller Updated |
https://binary.mirantis.com/core/helm/client-certificate-controller-1.41.35.tgz |
|
metrics-server Updated |
https://binary.mirantis.com/core/helm/metrics-server-1.41.35.tgz |
|
openstack-cloud-controller-manager Deprecated |
https://binary.mirantis.com/core/helm/openstack-cloud-controller-manager-1.41.35.tgz |
|
policy-controller Updated |
https://binary.mirantis.com/core/helm/policy-controller-1.41.35.tgz |
|
Docker images |
cinder-csi-plugin |
mirantis.azurecr.io/lcm/kubernetes/cinder-csi-plugin:v1.27.2-28 |
client-certificate-controller Updated |
mirantis.azurecr.io/core/client-certificate-controller:1.41.35 |
|
csi-attacher Deprecated |
mirantis.azurecr.io/lcm/k8scsi/csi-attacher:v4.2.0-10 |
|
csi-node-driver-registrar Deprecated |
mirantis.azurecr.io/lcm/k8scsi/csi-node-driver-registrar:v2.7.0-9 |
|
csi-provisioner Deprecated |
mirantis.azurecr.io/lcm/k8scsi/csi-provisioner:v3.4.1-10 |
|
csi-resizer Deprecated |
mirantis.azurecr.io/lcm/k8scsi/csi-resizer:v1.7.0-10 |
|
csi-snapshotter Deprecated |
mirantis.azurecr.io/lcm/k8scsi/csi-snapshotter:v6.2.1-mcc-9 |
|
livenessprobe Deprecated |
mirantis.azurecr.io/lcm/k8scsi/livenessprobe:v2.9.0-9 |
|
metrics-server |
mirantis.azurecr.io/lcm/metrics-server-amd64:v0.6.3-13 |
|
openstack-cloud-controller-manager Deprecated |
mirantis.azurecr.io/lcm/kubernetes/openstack-cloud-controller-manager:v1.27.2-28 |
|
policy-controller Updated |
mirantis.azurecr.io/core/policy-controller:1.41.35 |
Artifact |
Component |
Path |
|---|---|---|
Binaries Updated |
lcm-agent |
mirantis.azurecr.io/core/bin/lcm-agent-1.41.35 |
lcm-ansible |
mirantis.azurecr.io/lcm/bin/lcm-ansible/v0.26.0-116-g388553f/lcm-ansible.tar.gz |
|
Helm charts Updated |
helm-controller |
https://binary.mirantis.com/core/helm/helm-controller-1.41.35.tgz |
managed-lcm-api |
https://binary.mirantis.com/core/helm/managed-lcm-api-1.41.35.tgz |
|
Docker images Updated |
helm-controller |
mirantis.azurecr.io/core/helm-controller:1.41.35 |
mcc-haproxy |
mirantis.azurecr.io/lcm/mcc-haproxy:v0.26.0-116-g388553f |
|
mcc-keepalived |
mirantis.azurecr.io/lcm/mcc-keepalived:v0.26.0-116-g388553f |
Artifact |
Component |
Path |
|---|---|---|
Helm charts |
alerta |
https://binary.mirantis.com/stacklight/helm/alerta-0.1.0-mcp-33.tgz |
alertmanager-webhook-servicenow |
https://binary.mirantis.com/stacklight/helm/alertmanager-webhook-servicenow-0.2.0-mcp-8.tgz |
|
cadvisor |
https://binary.mirantis.com/stacklight/helm/cadvisor-0.1.0-mcp-7.tgz |
|
elasticsearch-curator |
https://binary.mirantis.com/stacklight/helm/elasticsearch-curator-1.5.0-mcp-15.tgz |
|
elasticsearch-exporter |
https://binary.mirantis.com/stacklight/helm/elasticsearch-exporter-1.2.0-mcp-10.tgz |
|
fluentd-logs |
https://binary.mirantis.com/stacklight/helm/fluentd-logs-0.1.0-mcp-248.tgz |
|
grafana |
https://binary.mirantis.com/stacklight/helm/grafana-3.3.10-mcp-317.tgz |
|
iam-proxy |
||
metric-collector |
https://binary.mirantis.com/stacklight/helm/metric-collector-0.3.0-mcp-18.tgz |
|
metricbeat |
https://binary.mirantis.com/stacklight/helm/metricbeat-1.7.1-mcp-25.tgz |
|
opensearch |
https://binary.mirantis.com/stacklight/helm/opensearch-0.1.0-mcp-88.tgz |
|
opensearch-dashboards |
https://binary.mirantis.com/stacklight/helm/opensearch-dashboards-0.1.0-mcp-57.tgz |
|
patroni |
https://binary.mirantis.com/stacklight/helm/patroni-0.15.1-mcp-62.tgz |
|
prometheus |
https://binary.mirantis.com/stacklight/helm/prometheus-8.11.4-mcp-258.tgz |
|
prometheus-blackbox-exporter |
https://binary.mirantis.com/stacklight/helm/prometheus-blackbox-exporter-0.3.0-mcp-19.tgz |
|
prometheus-es-exporter |
https://binary.mirantis.com/stacklight/helm/prometheus-es-exporter-1.0.0-mcp-18.tgz |
|
prometheus-msteams |
https://binary.mirantis.com/stacklight/helm/prometheus-msteams-0.1.0-mcp-12.tgz |
|
sf-notifier |
https://binary.mirantis.com/stacklight/helm/sf-notifier-0.2.0-mcp-10.tgz |
|
sf-reporter |
https://binary.mirantis.com/stacklight/helm/sf-reporter-0.2.0-mcp-10.tgz |
|
stacklight Updated |
https://binary.mirantis.com/stacklight/helm/stacklight-0.16.18.tgz |
|
telegraf-ds |
https://binary.mirantis.com/stacklight/helm/telegraf-ds-1.1.5-mcp-42.tgz |
|
telegraf-s |
https://binary.mirantis.com/stacklight/helm/telegraf-s-1.1.5-mcp-42.tgz |
|
telemeter-client |
https://binary.mirantis.com/stacklight/helm/telemeter-client-0.2.0-mcp-14.tgz |
|
telemeter-server |
https://binary.mirantis.com/stacklight/helm/telemeter-server-0.2.0-mcp-14.tgz |
|
Docker images |
alerta-web Updated |
mirantis.azurecr.io/stacklight/alerta-web:9-20250707023011 |
alertmanager Updated |
mirantis.azurecr.io/stacklight/alertmanager:v0.25-20250707023018 |
|
alertmanager-webhook-servicenow |
mirantis.azurecr.io/stacklight/alertmanager-webhook-servicenow:v0.1-20250411082209 |
|
alpine-utils Updated |
mirantis.azurecr.io/stacklight/alpine-utils:1-20250707023018 |
|
blackbox-exporter |
mirantis.azurecr.io/stacklight/blackbox-exporter:0-20250305095821 |
|
cadvisor Updated |
mirantis.azurecr.io/stacklight/cadvisor:v0.49.1-20250707023011 |
|
configmap-reload |
mirantis.azurecr.io/stacklight/configmap-reload:v0.8.0 |
|
curator |
mirantis.azurecr.io/stacklight/curator:5.7.6-20230404082402 |
|
elasticsearch-exporter |
mirantis.azurecr.io/stacklight/elasticsearch-exporter:v1.5.0 |
|
fluentd Updated |
mirantis.azurecr.io/stacklight/fluentd:1.18-plugin-os-1.0-20250707023011 |
|
grafana |
mirantis.azurecr.io/stacklight/grafana:10.4.15 |
|
k8s-sidecar |
mirantis.azurecr.io/stacklight/k8s-sidecar:1-20250411124723 |
|
kube-state-metrics |
mirantis.azurecr.io/stacklight/kube-state-metrics:v2.10.1 |
|
metric-collector Updated |
mirantis.azurecr.io/stacklight/metric-collector:v0.1-20250707023018 |
|
metricbeat Updated |
mirantis.azurecr.io/stacklight/metricbeat:7.12.1-20250707023019 |
|
node-exporter |
mirantis.azurecr.io/stacklight/node-exporter:v1.8.2 |
|
oauth2-proxy |
mirantis.azurecr.io/iam/oauth2-proxy:v7.1.3-15 |
|
opensearch Updated |
mirantis.azurecr.io/stacklight/opensearch:2.19-20250707023019 |
|
opensearch-dashboards Updated |
mirantis.azurecr.io/stacklight/opensearch-dashboards:2.19-20250707023011 |
|
prometheus |
mirantis.azurecr.io/stacklight/prometheus:v2.48.0 |
|
prometheus-es-exporter Updated |
mirantis.azurecr.io/stacklight/prometheus-es-exporter:v0.14-20250707023018 |
|
prometheus-msteams Updated |
mirantis.azurecr.io/stacklight/prometheus-msteams:v1.5-20250707023011 |
|
prometheus-patroni-exporter Updated |
mirantis.azurecr.io/stacklight/prometheus-patroni-exporter:0.0.1-20250707023019 |
|
prometheus-postgres-exporter |
mirantis.azurecr.io/stacklight/prometheus-postgres-exporter:v0.15.0 |
|
prometheus-relay |
mirantis.azurecr.io/stacklight/prometheus-relay:v0.4-20250304085150 |
|
sf-notifier Updated |
mirantis.azurecr.io/stacklight/sf-notifier:v0.4-20250707023018 |
|
sf-reporter |
mirantis.azurecr.io/stacklight/sf-reporter:v0.1-20250411082229 |
|
spilo Updated |
mirantis.azurecr.io/stacklight/spilo:13-3.3-p2-20250707023018 |
|
telegraf |
mirantis.azurecr.io/stacklight/telegraf:v1.9.1-20241202023010 |
|
mirantis.azurecr.io/stacklight/telegraf:1-20250411114904 |
||
telemeter Updated |
mirantis.azurecr.io/stacklight/telemeter:4.4-20250707023019 |
|
telemeter-token-auth Updated |
mirantis.azurecr.io/stacklight/telemeter-token-auth:v0.1-20250707023019 |
Artifact |
Component |
Path |
|---|---|---|
Configuration management |
Ansible |
|
Debian repositories |
System packages |
|
https://mirror.mirantis.com/kaas/ubuntu-2025-06-23-003900/ Updated |
||
https://mirror.mirantis.com/kaas/ubuntu-2025-06-23-003900.target.txt Updated |
||
MCR repositories |
MCR |
https://repos.mirantis.com/ubuntu/dists/jammy/pool/stable-23.0/ |
Target ubuntu system |
Ubuntu |
https://binary.mirantis.com/bm/bin/efi/ubuntu/tgz-jammy-20250624161133 Updated |
This section includes release notes for the patch Cluster release 17.3.9 that is introduced in the Container Cloud patch release 2.29.4 and is based on the previous Cluster releases of the 17.3.x series and on 16.3.9.
This patch Cluster release introduces MOSK 24.3.6 that
is based on Mirantis Kubernetes Engine 3.7.23 with Kubernetes 1.27 and Mirantis
Container Runtime 23.0.15 with docker-ee-cli updated to 23.0.18.
For details on MOSK 24.3.6, see release notes 24.3.6
For the list of CVE fixes delivered with this patch Cluster release, see 2.29.4
For details on patch release delivery, see Patch releases
This section lists the artifacts of components included in the Cluster release 17.3.9.
Note
The components that are newly added, updated, deprecated, or removed
as compared to the previous release version, are marked
with a corresponding superscript,
for example, lcm-ansible Updated.
Artifact |
Component |
Path |
|---|---|---|
Helm charts |
local-volume-provisioner |
https://binary.mirantis.com/core/helm/local-volume-provisioner-1.41.32.tgz |
metallb |
||
Docker images |
ironic |
mirantis.azurecr.io/openstack/ironic:antelope-jammy-20250307062615 |
metallb-controller |
mirantis.azurecr.io/bm/metallb/controller:v0.14.5-747c4ca9-amd64 |
|
metallb-speaker |
mirantis.azurecr.io/bm/metallb/speaker:v0.14.5-747c4ca9-amd64 |
Artifact |
Component |
Path |
|---|---|---|
Helm charts Updated |
ceph-controller |
https://binary.mirantis.com/ceph/helm/ceph-operator-1.0.0-mcc-2.29.4-2.tgz |
Docker images |
ceph Updated |
mirantis.azurecr.io/mirantis/ceph:v18.2.7-2.cve |
ceph-controller Updated |
mirantis.azurecr.io/ceph/mcp/ceph-controller:2.29.4-1 |
|
cephcsi Updated |
mirantis.azurecr.io/mirantis/cephcsi:v3.9.0-29.cve |
|
cephcsi-attacher |
mirantis.azurecr.io/mirantis/cephcsi-attacher:v4.4.2-7.cve |
|
cephcsi-provisioner |
mirantis.azurecr.io/mirantis/cephcsi-provisioner:v3.6.2-7.cve |
|
cephcsi-registrar |
mirantis.azurecr.io/mirantis/cephcsi-registrar:v2.9.2-7.cve |
|
cephcsi-resizer |
mirantis.azurecr.io/mirantis/cephcsi-resizer:v1.9.2-7.cve |
|
cephcsi-snapshotter |
mirantis.azurecr.io/mirantis/cephcsi-snapshotter:v6.3.2-7.cve |
|
rook Updated |
mirantis.azurecr.io/ceph/rook:v1.13.5-31 |
|
snapshot-controller |
mirantis.azurecr.io/mirantis/snapshot-controller:v6.3.2-7.cve |
Artifact |
Component |
Path |
|---|---|---|
Helm charts |
cinder-csi-plugin Deprecated |
https://binary.mirantis.com/core/helm/cinder-csi-plugin-1.41.32.tgz |
client-certificate-controller |
https://binary.mirantis.com/core/helm/client-certificate-controller-1.41.32.tgz |
|
metrics-server |
https://binary.mirantis.com/core/helm/metrics-server-1.41.32.tgz |
|
openstack-cloud-controller-manager Deprecated |
https://binary.mirantis.com/core/helm/openstack-cloud-controller-manager-1.41.32.tgz |
|
policy-controller |
https://binary.mirantis.com/core/helm/policy-controller-1.41.32.tgz |
|
Docker images |
cinder-csi-plugin Deprecated |
mirantis.azurecr.io/lcm/kubernetes/cinder-csi-plugin:v1.27.2-28 |
client-certificate-controller |
mirantis.azurecr.io/core/client-certificate-controller:1.41.32 |
|
csi-attacher Deprecated |
mirantis.azurecr.io/lcm/k8scsi/csi-attacher:v4.2.0-10 |
|
csi-node-driver-registrar Deprecated |
mirantis.azurecr.io/lcm/k8scsi/csi-node-driver-registrar:v2.7.0-9 |
|
csi-provisioner Deprecated |
mirantis.azurecr.io/lcm/k8scsi/csi-provisioner:v3.4.1-10 |
|
csi-resizer Deprecated |
mirantis.azurecr.io/lcm/k8scsi/csi-resizer:v1.7.0-10 |
|
csi-snapshotter Deprecated |
mirantis.azurecr.io/lcm/k8scsi/csi-snapshotter:v6.2.1-mcc-9 |
|
livenessprobe Deprecated |
mirantis.azurecr.io/lcm/k8scsi/livenessprobe:v2.9.0-9 |
|
metrics-server |
mirantis.azurecr.io/lcm/metrics-server-amd64:v0.6.3-13 |
|
openstack-cloud-controller-manager Deprecated |
mirantis.azurecr.io/lcm/kubernetes/openstack-cloud-controller-manager:v1.27.2-28 |
|
policy-controller |
mirantis.azurecr.io/core/policy-controller:1.41.32 |
Artifact |
Component |
Path |
|---|---|---|
Binaries |
lcm-agent |
mirantis.azurecr.io/core/bin/lcm-agent-1.41.32 |
lcm-ansible |
mirantis.azurecr.io/lcm/bin/lcm-ansible/v0.26.0-115-g2cedbea/lcm-ansible.tar.gz |
|
Helm charts |
helm-controller |
https://binary.mirantis.com/core/helm/helm-controller-1.41.32.tgz |
managed-lcm-api |
https://binary.mirantis.com/core/helm/managed-lcm-api-1.41.32.tgz |
|
Docker images |
helm-controller |
mirantis.azurecr.io/core/helm-controller:1.41.32 |
mcc-haproxy |
mirantis.azurecr.io/lcm/mcc-haproxy:v0.26.0-115-g2cedbea |
|
mcc-keepalived |
mirantis.azurecr.io/lcm/mcc-keepalived:v0.26.0-115-g2cedbea |
Artifact |
Component |
Path |
|---|---|---|
Helm charts |
alerta |
https://binary.mirantis.com/stacklight/helm/alerta-0.1.0-mcp-33.tgz |
alertmanager-webhook-servicenow |
https://binary.mirantis.com/stacklight/helm/alertmanager-webhook-servicenow-0.2.0-mcp-8.tgz |
|
cadvisor |
https://binary.mirantis.com/stacklight/helm/cadvisor-0.1.0-mcp-7.tgz |
|
elasticsearch-curator |
https://binary.mirantis.com/stacklight/helm/elasticsearch-curator-1.5.0-mcp-15.tgz |
|
elasticsearch-exporter |
https://binary.mirantis.com/stacklight/helm/elasticsearch-exporter-1.2.0-mcp-10.tgz |
|
fluentd-logs |
https://binary.mirantis.com/stacklight/helm/fluentd-logs-0.1.0-mcp-248.tgz |
|
grafana |
https://binary.mirantis.com/stacklight/helm/grafana-3.3.10-mcp-317.tgz |
|
iam-proxy |
||
metric-collector |
https://binary.mirantis.com/stacklight/helm/metric-collector-0.3.0-mcp-18.tgz |
|
metricbeat |
https://binary.mirantis.com/stacklight/helm/metricbeat-1.7.1-mcp-25.tgz |
|
opensearch |
https://binary.mirantis.com/stacklight/helm/opensearch-0.1.0-mcp-88.tgz |
|
opensearch-dashboards |
https://binary.mirantis.com/stacklight/helm/opensearch-dashboards-0.1.0-mcp-57.tgz |
|
patroni |
https://binary.mirantis.com/stacklight/helm/patroni-0.15.1-mcp-62.tgz |
|
prometheus |
https://binary.mirantis.com/stacklight/helm/prometheus-8.11.4-mcp-258.tgz |
|
prometheus-blackbox-exporter |
https://binary.mirantis.com/stacklight/helm/prometheus-blackbox-exporter-0.3.0-mcp-19.tgz |
|
prometheus-es-exporter |
https://binary.mirantis.com/stacklight/helm/prometheus-es-exporter-1.0.0-mcp-18.tgz |
|
prometheus-msteams |
https://binary.mirantis.com/stacklight/helm/prometheus-msteams-0.1.0-mcp-12.tgz |
|
sf-notifier |
https://binary.mirantis.com/stacklight/helm/sf-notifier-0.2.0-mcp-10.tgz |
|
sf-reporter |
https://binary.mirantis.com/stacklight/helm/sf-reporter-0.2.0-mcp-10.tgz |
|
stacklight Updated |
https://binary.mirantis.com/stacklight/helm/stacklight-0.16.16.tgz |
|
telegraf-ds |
https://binary.mirantis.com/stacklight/helm/telegraf-ds-1.1.5-mcp-42.tgz |
|
telegraf-s |
https://binary.mirantis.com/stacklight/helm/telegraf-s-1.1.5-mcp-42.tgz |
|
telemeter-client |
https://binary.mirantis.com/stacklight/helm/telemeter-client-0.2.0-mcp-14.tgz |
|
telemeter-server |
https://binary.mirantis.com/stacklight/helm/telemeter-server-0.2.0-mcp-14.tgz |
|
Docker images |
alerta-web Updated |
mirantis.azurecr.io/stacklight/alerta-web:9-20250526023008 |
alertmanager Updated |
mirantis.azurecr.io/stacklight/alertmanager:v0.25-20250526023014 |
|
alertmanager-webhook-servicenow |
mirantis.azurecr.io/stacklight/alertmanager-webhook-servicenow:v0.1-20250411082209 |
|
alpine-utils Updated |
mirantis.azurecr.io/stacklight/alpine-utils:1-20250526023015 |
|
blackbox-exporter |
mirantis.azurecr.io/stacklight/blackbox-exporter:0-20250305095821 |
|
cadvisor Updated |
mirantis.azurecr.io/stacklight/cadvisor:v0.49.1-20250526023013 |
|
configmap-reload |
mirantis.azurecr.io/stacklight/configmap-reload:v0.8.0 |
|
curator |
mirantis.azurecr.io/stacklight/curator:5.7.6-20230404082402 |
|
elasticsearch-exporter |
mirantis.azurecr.io/stacklight/elasticsearch-exporter:v1.5.0 |
|
fluentd Updated |
mirantis.azurecr.io/stacklight/fluentd:1.18-plugin-os-1.0-20250526023008 |
|
grafana |
mirantis.azurecr.io/stacklight/grafana:10.4.15 |
|
k8s-sidecar |
mirantis.azurecr.io/stacklight/k8s-sidecar:1-20250411124723 |
|
kube-state-metrics |
mirantis.azurecr.io/stacklight/kube-state-metrics:v2.10.1 |
|
metric-collector Updated |
mirantis.azurecr.io/stacklight/metric-collector:v0.1-20250526023013 |
|
metricbeat Updated |
mirantis.azurecr.io/stacklight/metricbeat:7.12.1-20250526023013 |
|
node-exporter |
mirantis.azurecr.io/stacklight/node-exporter:v1.8.2 |
|
oauth2-proxy |
mirantis.azurecr.io/iam/oauth2-proxy:v7.1.3-15 |
|
opensearch Updated |
mirantis.azurecr.io/stacklight/opensearch:2.17-20250526023013 |
|
opensearch-dashboards Updated |
mirantis.azurecr.io/stacklight/opensearch-dashboards:2.17-20250526023010 |
|
prometheus |
mirantis.azurecr.io/stacklight/prometheus:v2.48.0 |
|
prometheus-es-exporter Updated |
mirantis.azurecr.io/stacklight/prometheus-es-exporter:v0.14-20250526023015 |
|
prometheus-msteams Updated |
mirantis.azurecr.io/stacklight/prometheus-msteams:v1.5-20250526023013 |
|
prometheus-patroni-exporter Updated |
mirantis.azurecr.io/stacklight/prometheus-patroni-exporter:0.0.1-20250526023015 |
|
prometheus-postgres-exporter |
mirantis.azurecr.io/stacklight/prometheus-postgres-exporter:v0.15.0 |
|
prometheus-relay |
mirantis.azurecr.io/stacklight/prometheus-relay:v0.4-20250304085150 |
|
sf-notifier Updated |
mirantis.azurecr.io/stacklight/sf-notifier:v0.4-20250526023014 |
|
sf-reporter |
mirantis.azurecr.io/stacklight/sf-reporter:v0.1-20250411082229 |
|
spilo Updated |
mirantis.azurecr.io/stacklight/spilo:13-3.3-p2-20250526023013 |
|
telegraf |
mirantis.azurecr.io/stacklight/telegraf:v1.9.1-20241202023010 |
|
mirantis.azurecr.io/stacklight/telegraf:1-20250411114904 |
||
telemeter Updated |
mirantis.azurecr.io/stacklight/telemeter:4.4-20250526023014 |
|
telemeter-token-auth Updated |
mirantis.azurecr.io/stacklight/telemeter-token-auth:v0.1-20250526023014 |
Artifact |
Component |
Path |
|---|---|---|
Configuration management |
Ansible |
|
Debian repositories |
System packages |
|
https://mirror.mirantis.com/kaas/ubuntu-2025-05-26-003900/ Updated |
||
https://mirror.mirantis.com/kaas/ubuntu-2025-05-26-003900.target.txt Updated |
||
MCR repositories |
MCR |
https://repos.mirantis.com/ubuntu/dists/jammy/pool/stable-23.0/ |
Target ubuntu system |
Ubuntu |
https://binary.mirantis.com/bm/bin/efi/ubuntu/tgz-jammy-20250526092812 Updated |
This section includes release notes for the patch Cluster release 17.3.8 that is introduced in the Container Cloud patch release 2.29.3 and is based on the previous Cluster releases of the 17.3.x series and on 16.3.8.
This patch Cluster release introduces MOSK 24.3.5 that
is based on Mirantis Kubernetes Engine 3.7.22 with Kubernetes 1.27 and Mirantis
Container Runtime 23.0.15 with docker-ee-cli updated to 23.0.18.
For details on MOSK 24.3.5, see release notes 24.3.5
For the list of CVE fixes delivered with this patch Cluster release, see 2.29.3
For details on patch release delivery, see Patch releases
This section lists the artifacts of components included in the Cluster release 17.3.8.
Note
The components that are newly added, updated, deprecated, or removed
as compared to the previous release version, are marked
with a corresponding superscript,
for example, lcm-ansible Updated.
Artifact |
Component |
Path |
|---|---|---|
Helm charts |
local-volume-provisioner |
https://binary.mirantis.com/core/helm/local-volume-provisioner-1.41.32.tgz |
metallb |
||
Docker images |
ironic |
mirantis.azurecr.io/openstack/ironic:antelope-jammy-20250307062615 |
metallb-controller |
mirantis.azurecr.io/bm/metallb/controller:v0.14.5-747c4ca9-amd64 |
|
metallb-speaker |
mirantis.azurecr.io/bm/metallb/speaker:v0.14.5-747c4ca9-amd64 |
Artifact |
Component |
Path |
|---|---|---|
Helm charts Updated |
ceph-controller |
https://binary.mirantis.com/ceph/helm/ceph-operator-1.0.0-mcc-2.29.3-6.tgz |
Docker images |
ceph Updated |
mirantis.azurecr.io/mirantis/ceph:v18.2.7-1.cve |
ceph-controller Updated |
mirantis.azurecr.io/ceph/mcp/ceph-controller:2.29.3-5 |
|
cephcsi Updated |
mirantis.azurecr.io/mirantis/cephcsi:v3.9.0-28.cve |
|
cephcsi-attacher |
mirantis.azurecr.io/mirantis/cephcsi-attacher:v4.4.2-7.cve |
|
cephcsi-provisioner |
mirantis.azurecr.io/mirantis/cephcsi-provisioner:v3.6.2-7.cve |
|
cephcsi-registrar |
mirantis.azurecr.io/mirantis/cephcsi-registrar:v2.9.2-7.cve |
|
cephcsi-resizer |
mirantis.azurecr.io/mirantis/cephcsi-resizer:v1.9.2-7.cve |
|
cephcsi-snapshotter |
mirantis.azurecr.io/mirantis/cephcsi-snapshotter:v6.3.2-7.cve |
|
rook Updated |
mirantis.azurecr.io/ceph/rook:v1.13.5-30 |
|
snapshot-controller |
mirantis.azurecr.io/mirantis/snapshot-controller:v6.3.2-7.cve |
Artifact |
Component |
Path |
|---|---|---|
Helm charts |
cinder-csi-plugin Deprecated |
https://binary.mirantis.com/core/helm/cinder-csi-plugin-1.41.32.tgz |
client-certificate-controller |
https://binary.mirantis.com/core/helm/client-certificate-controller-1.41.32.tgz |
|
metrics-server |
https://binary.mirantis.com/core/helm/metrics-server-1.41.32.tgz |
|
openstack-cloud-controller-manager Deprecated |
https://binary.mirantis.com/core/helm/openstack-cloud-controller-manager-1.41.32.tgz |
|
policy-controller |
https://binary.mirantis.com/core/helm/policy-controller-1.41.32.tgz |
|
Docker images |
cinder-csi-plugin Deprecated |
mirantis.azurecr.io/lcm/kubernetes/cinder-csi-plugin:v1.27.2-28 |
client-certificate-controller |
mirantis.azurecr.io/core/client-certificate-controller:1.41.32 |
|
csi-attacher Deprecated |
mirantis.azurecr.io/lcm/k8scsi/csi-attacher:v4.2.0-10 |
|
csi-node-driver-registrar Deprecated |
mirantis.azurecr.io/lcm/k8scsi/csi-node-driver-registrar:v2.7.0-9 |
|
csi-provisioner Deprecated |
mirantis.azurecr.io/lcm/k8scsi/csi-provisioner:v3.4.1-10 |
|
csi-resizer Deprecated |
mirantis.azurecr.io/lcm/k8scsi/csi-resizer:v1.7.0-10 |
|
csi-snapshotter Deprecated |
mirantis.azurecr.io/lcm/k8scsi/csi-snapshotter:v6.2.1-mcc-9 |
|
livenessprobe Deprecated |
mirantis.azurecr.io/lcm/k8scsi/livenessprobe:v2.9.0-9 |
|
metrics-server |
mirantis.azurecr.io/lcm/metrics-server-amd64:v0.6.3-13 |
|
openstack-cloud-controller-manager Deprecated |
mirantis.azurecr.io/lcm/kubernetes/openstack-cloud-controller-manager:v1.27.2-28 |
|
policy-controller |
mirantis.azurecr.io/core/policy-controller:1.41.32 |
Artifact |
Component |
Path |
|---|---|---|
Binaries |
lcm-agent |
mirantis.azurecr.io/core/bin/lcm-agent-1.41.32 |
lcm-ansible |
mirantis.azurecr.io/lcm/bin/lcm-ansible/v0.26.0-115-g2cedbea/lcm-ansible.tar.gz |
|
Helm charts |
helm-controller |
https://binary.mirantis.com/core/helm/helm-controller-1.41.32.tgz |
managed-lcm-api |
https://binary.mirantis.com/core/helm/managed-lcm-api-1.41.32.tgz |
|
Docker images |
helm-controller |
mirantis.azurecr.io/core/helm-controller:1.41.32 |
mcc-haproxy |
mirantis.azurecr.io/lcm/mcc-haproxy:v0.26.0-115-g2cedbea |
|
mcc-keepalived |
mirantis.azurecr.io/lcm/mcc-keepalived:v0.26.0-115-g2cedbea |
Artifact |
Component |
Path |
|---|---|---|
Helm charts |
alerta |
https://binary.mirantis.com/stacklight/helm/alerta-0.1.0-mcp-33.tgz |
alertmanager-webhook-servicenow |
https://binary.mirantis.com/stacklight/helm/alertmanager-webhook-servicenow-0.2.0-mcp-8.tgz |
|
cadvisor |
https://binary.mirantis.com/stacklight/helm/cadvisor-0.1.0-mcp-7.tgz |
|
elasticsearch-curator |
https://binary.mirantis.com/stacklight/helm/elasticsearch-curator-1.5.0-mcp-15.tgz |
|
elasticsearch-exporter |
https://binary.mirantis.com/stacklight/helm/elasticsearch-exporter-1.2.0-mcp-10.tgz |
|
fluentd-logs Updated |
https://binary.mirantis.com/stacklight/helm/fluentd-logs-0.1.0-mcp-248.tgz |
|
grafana |
https://binary.mirantis.com/stacklight/helm/grafana-3.3.10-mcp-317.tgz |
|
iam-proxy |
||
metric-collector |
https://binary.mirantis.com/stacklight/helm/metric-collector-0.3.0-mcp-18.tgz |
|
metricbeat |
https://binary.mirantis.com/stacklight/helm/metricbeat-1.7.1-mcp-25.tgz |
|
opensearch |
https://binary.mirantis.com/stacklight/helm/opensearch-0.1.0-mcp-88.tgz |
|
opensearch-dashboards |
https://binary.mirantis.com/stacklight/helm/opensearch-dashboards-0.1.0-mcp-57.tgz |
|
patroni |
https://binary.mirantis.com/stacklight/helm/patroni-0.15.1-mcp-62.tgz |
|
prometheus |
https://binary.mirantis.com/stacklight/helm/prometheus-8.11.4-mcp-258.tgz |
|
prometheus-blackbox-exporter |
https://binary.mirantis.com/stacklight/helm/prometheus-blackbox-exporter-0.3.0-mcp-19.tgz |
|
prometheus-es-exporter |
https://binary.mirantis.com/stacklight/helm/prometheus-es-exporter-1.0.0-mcp-18.tgz |
|
prometheus-msteams |
https://binary.mirantis.com/stacklight/helm/prometheus-msteams-0.1.0-mcp-12.tgz |
|
sf-notifier |
https://binary.mirantis.com/stacklight/helm/sf-notifier-0.2.0-mcp-10.tgz |
|
sf-reporter |
https://binary.mirantis.com/stacklight/helm/sf-reporter-0.2.0-mcp-10.tgz |
|
stacklight Updated |
https://binary.mirantis.com/stacklight/helm/stacklight-0.16.15.tgz |
|
telegraf-ds |
https://binary.mirantis.com/stacklight/helm/telegraf-ds-1.1.5-mcp-42.tgz |
|
telegraf-s |
https://binary.mirantis.com/stacklight/helm/telegraf-s-1.1.5-mcp-42.tgz |
|
telemeter-client |
https://binary.mirantis.com/stacklight/helm/telemeter-client-0.2.0-mcp-14.tgz |
|
telemeter-server |
https://binary.mirantis.com/stacklight/helm/telemeter-server-0.2.0-mcp-14.tgz |
|
Docker images |
alerta-web Updated |
mirantis.azurecr.io/stacklight/alerta-web:9-20250512023009 |
alertmanager Updated |
mirantis.azurecr.io/stacklight/alertmanager:v0.25-20250512023015 |
|
alertmanager-webhook-servicenow |
mirantis.azurecr.io/stacklight/alertmanager-webhook-servicenow:v0.1-20250411082209 |
|
alpine-utils Updated |
mirantis.azurecr.io/stacklight/alpine-utils:1-20250512023016 |
|
blackbox-exporter |
mirantis.azurecr.io/stacklight/blackbox-exporter:0-20250305095821 |
|
cadvisor Updated |
mirantis.azurecr.io/stacklight/cadvisor:v0.49.1-20250512023015 |
|
configmap-reload |
mirantis.azurecr.io/stacklight/configmap-reload:v0.8.0 |
|
curator |
mirantis.azurecr.io/stacklight/curator:5.7.6-20230404082402 |
|
elasticsearch-exporter |
mirantis.azurecr.io/stacklight/elasticsearch-exporter:v1.5.0 |
|
fluentd Updated |
mirantis.azurecr.io/stacklight/fluentd:1.18-20250512023009 |
|
grafana |
mirantis.azurecr.io/stacklight/grafana:10.4.15 |
|
k8s-sidecar |
mirantis.azurecr.io/stacklight/k8s-sidecar:1-20250411124723 |
|
kube-state-metrics |
mirantis.azurecr.io/stacklight/kube-state-metrics:v2.10.1 |
|
metric-collector Updated |
mirantis.azurecr.io/stacklight/metric-collector:v0.1-20250512023015 |
|
metricbeat Updated |
mirantis.azurecr.io/stacklight/metricbeat:7.12.1-20250512023015 |
|
node-exporter |
mirantis.azurecr.io/stacklight/node-exporter:v1.8.2 |
|
oauth2-proxy |
mirantis.azurecr.io/iam/oauth2-proxy:v7.1.3-15 |
|
opensearch Updated |
mirantis.azurecr.io/stacklight/opensearch:2.17-20250512023015 |
|
opensearch-dashboards Updated |
mirantis.azurecr.io/stacklight/opensearch-dashboards:2.17-20250512023015 |
|
prometheus |
mirantis.azurecr.io/stacklight/prometheus:v2.48.0 |
|
prometheus-es-exporter Updated |
mirantis.azurecr.io/stacklight/prometheus-es-exporter:v0.14-20250512023016 |
|
prometheus-msteams Updated |
mirantis.azurecr.io/stacklight/prometheus-msteams:v1.5-20250512023015 |
|
prometheus-patroni-exporter Updated |
mirantis.azurecr.io/stacklight/prometheus-patroni-exporter:0.0.1-20250512023015 |
|
prometheus-postgres-exporter |
mirantis.azurecr.io/stacklight/prometheus-postgres-exporter:v0.15.0 |
|
prometheus-relay |
mirantis.azurecr.io/stacklight/prometheus-relay:v0.4-20250304085150 |
|
sf-notifier Updated |
mirantis.azurecr.io/stacklight/sf-notifier:v0.4-20250512023015 |
|
sf-reporter |
mirantis.azurecr.io/stacklight/sf-reporter:v0.1-20250411082229 |
|
spilo Updated |
mirantis.azurecr.io/stacklight/spilo:13-3.3-p2-20250512023015 |
|
telegraf |
mirantis.azurecr.io/stacklight/telegraf:v1.9.1-20241202023010 |
|
mirantis.azurecr.io/stacklight/telegraf:1-20250411114904 |
||
telemeter Updated |
mirantis.azurecr.io/stacklight/telemeter:4.4-20250512023015 |
|
telemeter-token-auth Updated |
mirantis.azurecr.io/stacklight/telemeter-token-auth:v0.1-20250512023015 |
Artifact |
Component |
Path |
|---|---|---|
Configuration management |
Ansible |
|
Debian repositories |
System packages |
|
https://mirror.mirantis.com/kaas/ubuntu-2025-03-31-003900.target.txt |
||
MCR repositories |
MCR |
https://repos.mirantis.com/ubuntu/dists/jammy/pool/stable-23.0/ |
Target ubuntu system |
Ubuntu |
https://binary.mirantis.com/bm/bin/efi/ubuntu/tgz-jammy-20250331141854 |
This section includes release notes for the patch Cluster release 17.3.7 that is introduced in the Container Cloud patch release 2.29.2 and is based on the previous Cluster releases of the 17.3.x series and on 16.3.7.
This patch Cluster release introduces MOSK 24.3.4 that
is based on Mirantis Kubernetes Engine 3.7.20 with Kubernetes 1.27 and Mirantis
Container Runtime 23.0.15 with docker-ee-cli updated to 23.0.17.
For details on MOSK 24.3.4, see release notes 24.3.4
For the list of CVE fixes delivered with this patch Cluster release, see 2.29.2
For details on patch release delivery, see Patch releases
This section lists the artifacts of components included in the Cluster release 17.3.7.
Note
The components that are newly added, updated, deprecated, or removed
as compared to the previous release version, are marked
with a corresponding superscript,
for example, lcm-ansible Updated.
Artifact |
Component |
Path |
|---|---|---|
Helm charts Updated |
local-volume-provisioner |
https://binary.mirantis.com/core/helm/local-volume-provisioner-1.41.32.tgz |
metallb |
||
Docker images |
ironic |
mirantis.azurecr.io/openstack/ironic:antelope-jammy-20250307062615 |
metallb-controller |
mirantis.azurecr.io/bm/metallb/controller:v0.14.5-747c4ca9-amd64 |
|
metallb-speaker |
mirantis.azurecr.io/bm/metallb/speaker:v0.14.5-747c4ca9-amd64 |
Artifact |
Component |
Path |
|---|---|---|
Helm chart Updated |
ceph-controller |
https://binary.mirantis.com/ceph/helm/ceph-operator-1.0.0-mcc-2.29.2-3.tgz |
Docker images |
ceph |
mirantis.azurecr.io/mirantis/ceph:v18.2.4-13.cve |
ceph-controller Updated |
mirantis.azurecr.io/ceph/mcp/ceph-controller:2.29.2-0 |
|
cephcsi |
mirantis.azurecr.io/mirantis/cephcsi:v3.9.0-27.cve |
|
cephcsi-attacher |
mirantis.azurecr.io/mirantis/cephcsi-attacher:v4.4.2-7.cve |
|
cephcsi-provisioner |
mirantis.azurecr.io/mirantis/cephcsi-provisioner:v3.6.2-7.cve |
|
cephcsi-registrar |
mirantis.azurecr.io/mirantis/cephcsi-registrar:v2.9.2-7.cve |
|
cephcsi-resizer |
mirantis.azurecr.io/mirantis/cephcsi-resizer:v1.9.2-7.cve |
|
cephcsi-snapshotter |
mirantis.azurecr.io/mirantis/cephcsi-snapshotter:v6.3.2-7.cve |
|
rook |
mirantis.azurecr.io/ceph/rook:v1.13.5-29 |
|
snapshot-controller |
mirantis.azurecr.io/mirantis/snapshot-controller:v6.3.2-7.cve |
Artifact |
Component |
Path |
|---|---|---|
Helm charts Updated |
cinder-csi-plugin Updated |
https://binary.mirantis.com/core/helm/cinder-csi-plugin-1.41.32.tgz |
client-certificate-controller |
https://binary.mirantis.com/core/helm/client-certificate-controller-1.41.32.tgz |
|
metrics-server |
https://binary.mirantis.com/core/helm/metrics-server-1.41.32.tgz |
|
openstack-cloud-controller-manager Deprecated |
https://binary.mirantis.com/core/helm/openstack-cloud-controller-manager-1.41.32.tgz |
|
policy-controller |
https://binary.mirantis.com/core/helm/policy-controller-1.41.32.tgz |
|
Docker images |
cinder-csi-plugin Updated |
mirantis.azurecr.io/lcm/kubernetes/cinder-csi-plugin:v1.27.2-28 |
client-certificate-controller Updated |
mirantis.azurecr.io/core/client-certificate-controller:1.41.32 |
|
csi-attacher Deprecated |
mirantis.azurecr.io/lcm/k8scsi/csi-attacher:v4.2.0-10 |
|
csi-node-driver-registrar Deprecated |
mirantis.azurecr.io/lcm/k8scsi/csi-node-driver-registrar:v2.7.0-9 |
|
csi-provisioner Deprecated |
mirantis.azurecr.io/lcm/k8scsi/csi-provisioner:v3.4.1-10 |
|
csi-resizer Deprecated |
mirantis.azurecr.io/lcm/k8scsi/csi-resizer:v1.7.0-10 |
|
csi-snapshotter Deprecated |
mirantis.azurecr.io/lcm/k8scsi/csi-snapshotter:v6.2.1-mcc-9 |
|
livenessprobe Deprecated |
mirantis.azurecr.io/lcm/k8scsi/livenessprobe:v2.9.0-9 |
|
metrics-server |
mirantis.azurecr.io/lcm/metrics-server-amd64:v0.6.3-13 |
|
openstack-cloud-controller-manager Deprecated |
mirantis.azurecr.io/lcm/kubernetes/openstack-cloud-controller-manager:v1.27.2-28 |
|
policy-controller Updated |
mirantis.azurecr.io/core/policy-controller:1.41.32 |
Artifact |
Component |
Path |
|---|---|---|
Binaries Updated |
lcm-agent |
mirantis.azurecr.io/core/bin/lcm-agent-1.41.32 |
lcm-ansible |
mirantis.azurecr.io/lcm/bin/lcm-ansible/v0.26.0-115-g2cedbea/lcm-ansible.tar.gz |
|
Helm charts Updated |
helm-controller |
https://binary.mirantis.com/core/helm/helm-controller-1.41.32.tgz |
managed-lcm-api |
https://binary.mirantis.com/core/helm/managed-lcm-api-1.41.32.tgz |
|
Docker images Updated |
helm-controller |
mirantis.azurecr.io/core/helm-controller:1.41.32 |
mcc-haproxy |
mirantis.azurecr.io/lcm/mcc-haproxy:v0.26.0-115-g2cedbea |
|
mcc-keepalived |
mirantis.azurecr.io/lcm/mcc-keepalived:v0.26.0-115-g2cedbea |
Artifact |
Component |
Path |
|---|---|---|
Helm charts |
alerta |
https://binary.mirantis.com/stacklight/helm/alerta-0.1.0-mcp-33.tgz |
alertmanager-webhook-servicenow |
https://binary.mirantis.com/stacklight/helm/alertmanager-webhook-servicenow-0.2.0-mcp-8.tgz |
|
cadvisor |
https://binary.mirantis.com/stacklight/helm/cadvisor-0.1.0-mcp-7.tgz |
|
elasticsearch-curator |
https://binary.mirantis.com/stacklight/helm/elasticsearch-curator-1.5.0-mcp-15.tgz |
|
elasticsearch-exporter |
https://binary.mirantis.com/stacklight/helm/elasticsearch-exporter-1.2.0-mcp-10.tgz |
|
fluentd-logs |
https://binary.mirantis.com/stacklight/helm/fluentd-logs-0.1.0-mcp-242.tgz |
|
grafana |
https://binary.mirantis.com/stacklight/helm/grafana-3.3.10-mcp-317.tgz |
|
iam-proxy |
||
metric-collector |
https://binary.mirantis.com/stacklight/helm/metric-collector-0.3.0-mcp-18.tgz |
|
metricbeat |
https://binary.mirantis.com/stacklight/helm/metricbeat-1.7.1-mcp-25.tgz |
|
opensearch |
https://binary.mirantis.com/stacklight/helm/opensearch-0.1.0-mcp-88.tgz |
|
opensearch-dashboards |
https://binary.mirantis.com/stacklight/helm/opensearch-dashboards-0.1.0-mcp-57.tgz |
|
patroni |
https://binary.mirantis.com/stacklight/helm/patroni-0.15.1-mcp-62.tgz |
|
prometheus |
https://binary.mirantis.com/stacklight/helm/prometheus-8.11.4-mcp-258.tgz |
|
prometheus-blackbox-exporter |
https://binary.mirantis.com/stacklight/helm/prometheus-blackbox-exporter-0.3.0-mcp-19.tgz |
|
prometheus-es-exporter |
https://binary.mirantis.com/stacklight/helm/prometheus-es-exporter-1.0.0-mcp-18.tgz |
|
prometheus-msteams |
https://binary.mirantis.com/stacklight/helm/prometheus-msteams-0.1.0-mcp-12.tgz |
|
sf-notifier |
https://binary.mirantis.com/stacklight/helm/sf-notifier-0.2.0-mcp-10.tgz |
|
sf-reporter |
https://binary.mirantis.com/stacklight/helm/sf-reporter-0.2.0-mcp-10.tgz |
|
stacklight Updated |
https://binary.mirantis.com/stacklight/helm/stacklight-0.16.13.tgz |
|
telegraf-ds |
https://binary.mirantis.com/stacklight/helm/telegraf-ds-1.1.5-mcp-42.tgz |
|
telegraf-s |
https://binary.mirantis.com/stacklight/helm/telegraf-s-1.1.5-mcp-42.tgz |
|
telemeter-client |
https://binary.mirantis.com/stacklight/helm/telemeter-client-0.2.0-mcp-14.tgz |
|
telemeter-server |
https://binary.mirantis.com/stacklight/helm/telemeter-server-0.2.0-mcp-14.tgz |
|
Docker images |
alerta-web Updated |
mirantis.azurecr.io/stacklight/alerta-web:9-20250414023017 |
alertmanager Updated |
mirantis.azurecr.io/stacklight/alertmanager:v0-20250414023017 |
|
alertmanager-webhook-servicenow Updated |
mirantis.azurecr.io/stacklight/alertmanager-webhook-servicenow:v0.1-20250411082209 |
|
alpine-utils Updated |
mirantis.azurecr.io/stacklight/alpine-utils:1-20250414023016 |
|
blackbox-exporter |
mirantis.azurecr.io/stacklight/blackbox-exporter:0-20250305095821 |
|
cadvisor Updated |
mirantis.azurecr.io/stacklight/cadvisor:v0.49.1-20250414023016 |
|
configmap-reload |
mirantis.azurecr.io/stacklight/configmap-reload:v0.8.0 |
|
curator |
mirantis.azurecr.io/stacklight/curator:5.7.6-20230404082402 |
|
elasticsearch-exporter |
mirantis.azurecr.io/stacklight/elasticsearch-exporter:v1.5.0 |
|
fluentd Updated |
mirantis.azurecr.io/stacklight/fluentd:1.18-20250414023016 |
|
grafana |
mirantis.azurecr.io/stacklight/grafana:10.4.15 |
|
k8s-sidecar Updated |
mirantis.azurecr.io/stacklight/k8s-sidecar:1-20250411124723 |
|
kube-state-metrics |
mirantis.azurecr.io/stacklight/kube-state-metrics:v2.10.1 |
|
metric-collector Updated |
mirantis.azurecr.io/stacklight/metric-collector:v0.1-20250414023016 |
|
metricbeat Updated |
mirantis.azurecr.io/stacklight/metricbeat:7.12.1-20250414023016 |
|
node-exporter |
mirantis.azurecr.io/stacklight/node-exporter:v1.8.2 |
|
oauth2-proxy |
mirantis.azurecr.io/iam/oauth2-proxy:v7.1.3-15 |
|
opensearch Updated |
mirantis.azurecr.io/stacklight/opensearch:2.17-20250414023016 |
|
opensearch-dashboards Updated |
mirantis.azurecr.io/stacklight/opensearch-dashboards:2.17-20250414023017 |
|
prometheus |
mirantis.azurecr.io/stacklight/prometheus:v2.48.0 |
|
prometheus-es-exporter Updated |
mirantis.azurecr.io/stacklight/prometheus-es-exporter:v0.14-20250414023016 |
|
prometheus-msteams Updated |
mirantis.azurecr.io/stacklight/prometheus-msteams:v1.5-20250414023016 |
|
prometheus-patroni-exporter Updated |
mirantis.azurecr.io/stacklight/prometheus-patroni-exporter:0.0.1-20250414023016 |
|
prometheus-postgres-exporter |
mirantis.azurecr.io/stacklight/prometheus-postgres-exporter:v0.15.0 |
|
prometheus-relay |
mirantis.azurecr.io/stacklight/prometheus-relay:v0.4-20250304085150 |
|
sf-notifier Updated |
mirantis.azurecr.io/stacklight/sf-notifier:v0.4-20250414023016 |
|
sf-reporter Updated |
mirantis.azurecr.io/stacklight/sf-reporter:v0.1-20250411082229 |
|
spilo Updated |
mirantis.azurecr.io/stacklight/spilo:13-3.3-p2-20250414023016 |
|
telegraf |
mirantis.azurecr.io/stacklight/telegraf:v1.9.1-20241202023010 |
|
mirantis.azurecr.io/stacklight/telegraf:1-20250411114904 Updated |
||
telemeter Updated |
mirantis.azurecr.io/stacklight/telemeter:4.4-20250414023016 |
|
telemeter-token-auth Updated |
mirantis.azurecr.io/stacklight/telemeter-token-auth:v0.1-20250414023016 |
Artifact |
Component |
Path |
|---|---|---|
Configuration management |
Ansible |
|
Debian repositories |
System packages |
|
https://mirror.mirantis.com/kaas/ubuntu-2025-03-31-003900/ Updated |
||
https://mirror.mirantis.com/kaas/ubuntu-2025-03-31-003900.target.txt Updated |
||
MCR repositories |
MCR |
https://repos.mirantis.com/ubuntu/dists/jammy/pool/stable-23.0/ |
Target ubuntu system |
Ubuntu |
https://binary.mirantis.com/bm/bin/efi/ubuntu/tgz-jammy-20250331141854 Updated |
This section includes release notes for the patch Cluster release 17.3.6 that is introduced in the Container Cloud patch release 2.29.1 and is based on the previous Cluster releases of the 17.3.x series and on 16.3.6.
This patch Cluster release introduces MOSK 24.3.3 that
is based on Mirantis Kubernetes Engine 3.7.20 with Kubernetes 1.27 and Mirantis
Container Runtime 23.0.15 with docker-ee-cli updated to 23.0.17.
For details on MOSK 24.3.3, see release notes 24.3.3
For the list of CVE fixes delivered with this patch Cluster release, see 2.29.1
For details on patch release delivery, see Patch releases
This section lists the artifacts of components included in the Cluster release 17.3.6.
Note
The components that are newly added, updated, deprecated, or removed
as compared to the previous release version, are marked
with a corresponding superscript,
for example, lcm-ansible Updated.
Artifact |
Component |
Path |
|---|---|---|
Helm charts Updated |
local-volume-provisioner |
https://binary.mirantis.com/core/helm/local-volume-provisioner-1.41.31.tgz |
metallb |
||
Docker images Updated |
ironic |
mirantis.azurecr.io/openstack/ironic:antelope-jammy-20250307062615 |
metallb-controller |
mirantis.azurecr.io/bm/metallb/controller:v0.14.5-747c4ca9-amd64 |
|
metallb-speaker |
mirantis.azurecr.io/bm/metallb/speaker:v0.14.5-747c4ca9-amd64 |
Artifact |
Component |
Path |
|---|---|---|
Helm chart Updated |
ceph-controller |
https://binary.mirantis.com/ceph/helm/ceph-operator-1.0.0-mcc-2.29.1-1.tgz |
Docker images Updated |
ceph |
mirantis.azurecr.io/mirantis/ceph:v18.2.4-13.cve |
ceph-controller |
mirantis.azurecr.io/ceph/mcp/ceph-controller:2.29.1-0 |
|
cephcsi |
mirantis.azurecr.io/mirantis/cephcsi:v3.9.0-27.cve |
|
cephcsi-attacher |
mirantis.azurecr.io/mirantis/cephcsi-attacher:v4.4.2-7.cve |
|
cephcsi-provisioner |
mirantis.azurecr.io/mirantis/cephcsi-provisioner:v3.6.2-7.cve |
|
cephcsi-registrar |
mirantis.azurecr.io/mirantis/cephcsi-registrar:v2.9.2-7.cve |
|
cephcsi-resizer |
mirantis.azurecr.io/mirantis/cephcsi-resizer:v1.9.2-7.cve |
|
cephcsi-snapshotter |
mirantis.azurecr.io/mirantis/cephcsi-snapshotter:v6.3.2-7.cve |
|
rook |
mirantis.azurecr.io/ceph/rook:v1.13.5-29 |
|
snapshot-controller |
mirantis.azurecr.io/mirantis/snapshot-controller:v6.3.2-7.cve |
Artifact |
Component |
Path |
|---|---|---|
Helm charts Updated |
cinder-csi-plugin Deprecated |
https://binary.mirantis.com/core/helm/cinder-csi-plugin-1.41.31.tgz |
client-certificate-controller |
https://binary.mirantis.com/core/helm/client-certificate-controller-1.41.31.tgz |
|
metrics-server |
https://binary.mirantis.com/core/helm/metrics-server-1.41.31.tgz |
|
openstack-cloud-controller-manager Deprecated |
https://binary.mirantis.com/core/helm/openstack-cloud-controller-manager-1.41.31.tgz |
|
policy-controller |
https://binary.mirantis.com/core/helm/policy-controller-1.41.31.tgz |
|
Docker images |
cinder-csi-plugin Deprecated |
mirantis.azurecr.io/lcm/kubernetes/cinder-csi-plugin:v1.27.2-27 |
client-certificate-controller Updated |
mirantis.azurecr.io/core/client-certificate-controller:1.41.31 |
|
csi-attacher Deprecated |
mirantis.azurecr.io/lcm/k8scsi/csi-attacher:v4.2.0-10 |
|
csi-node-driver-registrar Deprecated |
mirantis.azurecr.io/lcm/k8scsi/csi-node-driver-registrar:v2.7.0-9 |
|
csi-provisioner Deprecated |
mirantis.azurecr.io/lcm/k8scsi/csi-provisioner:v3.4.1-10 |
|
csi-resizer Deprecated |
mirantis.azurecr.io/lcm/k8scsi/csi-resizer:v1.7.0-10 |
|
csi-snapshotter Deprecated |
mirantis.azurecr.io/lcm/k8scsi/csi-snapshotter:v6.2.1-mcc-9 |
|
livenessprobe Deprecated |
mirantis.azurecr.io/lcm/k8scsi/livenessprobe:v2.9.0-9 |
|
metrics-server Updated |
mirantis.azurecr.io/lcm/metrics-server-amd64:v0.6.3-13 |
|
openstack-cloud-controller-manager Deprecated |
mirantis.azurecr.io/lcm/kubernetes/openstack-cloud-controller-manager:v1.27.2-27 |
|
policy-controller Updated |
mirantis.azurecr.io/core/policy-controller:1.41.31 |
Artifact |
Component |
Path |
|---|---|---|
Binaries Updated |
lcm-agent |
mirantis.azurecr.io/core/bin/lcm-agent-1.41.31 |
lcm-ansible |
mirantis.azurecr.io/lcm/bin/lcm-ansible/v0.26.0-114-gf1e92be/lcm-ansible.tar.gz |
|
Helm charts Updated |
helm-controller |
https://binary.mirantis.com/core/helm/helm-controller-1.41.31.tgz |
managed-lcm-api |
https://binary.mirantis.com/core/helm/managed-lcm-api-1.41.31.tgz |
|
Docker images Updated |
helm-controller |
mirantis.azurecr.io/core/helm-controller:1.41.31 |
mcc-haproxy |
mirantis.azurecr.io/lcm/mcc-haproxy:v0.26.0-114-gf1e92be |
|
mcc-keepalived |
mirantis.azurecr.io/lcm/mcc-keepalived:v0.26.0-114-gf1e92be |
Artifact |
Component |
Path |
|---|---|---|
Helm charts |
alerta |
https://binary.mirantis.com/stacklight/helm/alerta-0.1.0-mcp-33.tgz |
alertmanager-webhook-servicenow |
https://binary.mirantis.com/stacklight/helm/alertmanager-webhook-servicenow-0.2.0-mcp-8.tgz |
|
cadvisor |
https://binary.mirantis.com/stacklight/helm/cadvisor-0.1.0-mcp-7.tgz |
|
elasticsearch-curator |
https://binary.mirantis.com/stacklight/helm/elasticsearch-curator-1.5.0-mcp-15.tgz |
|
elasticsearch-exporter |
https://binary.mirantis.com/stacklight/helm/elasticsearch-exporter-1.2.0-mcp-10.tgz |
|
fluentd-logs |
https://binary.mirantis.com/stacklight/helm/fluentd-logs-0.1.0-mcp-242.tgz |
|
grafana |
https://binary.mirantis.com/stacklight/helm/grafana-3.3.10-mcp-317.tgz |
|
iam-proxy |
||
metric-collector |
https://binary.mirantis.com/stacklight/helm/metric-collector-0.3.0-mcp-18.tgz |
|
metricbeat |
https://binary.mirantis.com/stacklight/helm/metricbeat-1.7.1-mcp-25.tgz |
|
opensearch |
https://binary.mirantis.com/stacklight/helm/opensearch-0.1.0-mcp-88.tgz |
|
opensearch-dashboards |
https://binary.mirantis.com/stacklight/helm/opensearch-dashboards-0.1.0-mcp-57.tgz |
|
patroni |
https://binary.mirantis.com/stacklight/helm/patroni-0.15.1-mcp-62.tgz |
|
prometheus |
https://binary.mirantis.com/stacklight/helm/prometheus-8.11.4-mcp-258.tgz |
|
prometheus-blackbox-exporter |
https://binary.mirantis.com/stacklight/helm/prometheus-blackbox-exporter-0.3.0-mcp-19.tgz |
|
prometheus-es-exporter |
https://binary.mirantis.com/stacklight/helm/prometheus-es-exporter-1.0.0-mcp-18.tgz |
|
prometheus-msteams |
https://binary.mirantis.com/stacklight/helm/prometheus-msteams-0.1.0-mcp-12.tgz |
|
sf-notifier |
https://binary.mirantis.com/stacklight/helm/sf-notifier-0.2.0-mcp-10.tgz |
|
sf-reporter |
https://binary.mirantis.com/stacklight/helm/sf-reporter-0.2.0-mcp-10.tgz |
|
stacklight Updated |
https://binary.mirantis.com/stacklight/helm/stacklight-0.16.11.tgz |
|
telegraf-ds |
https://binary.mirantis.com/stacklight/helm/telegraf-ds-1.1.5-mcp-42.tgz |
|
telegraf-s |
https://binary.mirantis.com/stacklight/helm/telegraf-s-1.1.5-mcp-42.tgz |
|
telemeter-client |
https://binary.mirantis.com/stacklight/helm/telemeter-client-0.2.0-mcp-14.tgz |
|
telemeter-server |
https://binary.mirantis.com/stacklight/helm/telemeter-server-0.2.0-mcp-14.tgz |
|
Docker images |
alerta-web Updated |
mirantis.azurecr.io/stacklight/alerta-web:9-20250317104943 |
alertmanager Updated |
mirantis.azurecr.io/stacklight/alertmanager:v0-20250317023015 |
|
alertmanager-webhook-servicenow Updated |
mirantis.azurecr.io/stacklight/alertmanager-webhook-servicenow:v0.1-20250317092402 |
|
alpine-utils Updated |
mirantis.azurecr.io/stacklight/alpine-utils:1-20250317023016 |
|
blackbox-exporter Updated |
mirantis.azurecr.io/stacklight/blackbox-exporter:0-20250305095821 |
|
cadvisor Updated |
mirantis.azurecr.io/stacklight/cadvisor:v0.49.1-20250317023016 |
|
configmap-reload |
mirantis.azurecr.io/stacklight/configmap-reload:v0.8.0 |
|
curator |
mirantis.azurecr.io/stacklight/curator:5.7.6-20230404082402 |
|
elasticsearch-exporter |
mirantis.azurecr.io/stacklight/elasticsearch-exporter:v1.5.0 |
|
fluentd Updated |
mirantis.azurecr.io/stacklight/fluentd:1.18-20250317023010 |
|
grafana Updated |
mirantis.azurecr.io/stacklight/grafana:10.4.15 |
|
k8s-sidecar Updated |
mirantis.azurecr.io/stacklight/k8s-sidecar:1-20250214112745 |
|
kube-state-metrics |
mirantis.azurecr.io/stacklight/kube-state-metrics:v2.10.1 |
|
metric-collector Updated |
mirantis.azurecr.io/stacklight/metric-collector:v0.1-20250317023016 |
|
metricbeat Updated |
mirantis.azurecr.io/stacklight/metricbeat:7.12.1-20250317023010 |
|
node-exporter |
mirantis.azurecr.io/stacklight/node-exporter:v1.8.2 |
|
oauth2-proxy Updated |
mirantis.azurecr.io/iam/oauth2-proxy:v7.1.3-15 |
|
opensearch Updated |
mirantis.azurecr.io/stacklight/opensearch:2.17-20250317023016 |
|
opensearch-dashboards Updated |
mirantis.azurecr.io/stacklight/opensearch-dashboards:2.17-20250317023010 |
|
prometheus |
mirantis.azurecr.io/stacklight/prometheus:v2.48.0 |
|
prometheus-es-exporter Updated |
mirantis.azurecr.io/stacklight/prometheus-es-exporter:v0.14-20250317023015 |
|
prometheus-msteams Updated |
mirantis.azurecr.io/stacklight/prometheus-msteams:v1.5-20250317023015 |
|
prometheus-patroni-exporter Updated |
mirantis.azurecr.io/stacklight/prometheus-patroni-exporter:0.0.1-20250317023016 |
|
prometheus-postgres-exporter |
mirantis.azurecr.io/stacklight/prometheus-postgres-exporter:v0.15.0 |
|
prometheus-relay Updated |
mirantis.azurecr.io/stacklight/prometheus-relay:v0.4-20250304085150 |
|
sf-notifier Updated |
mirantis.azurecr.io/stacklight/sf-notifier:v0.4-20250317092322 |
|
sf-reporter Updated |
mirantis.azurecr.io/stacklight/sf-reporter:v0.1-20250214110717 |
|
spilo Updated |
mirantis.azurecr.io/stacklight/spilo:13-3.3-p2-20250317023016 |
|
telegraf |
mirantis.azurecr.io/stacklight/telegraf:v1.9.1-20241202023010 |
|
mirantis.azurecr.io/stacklight/telegraf:1-20241115074302 |
||
telemeter Updated |
mirantis.azurecr.io/stacklight/telemeter:4.4-20250317023016 |
|
telemeter-token-auth Updated |
mirantis.azurecr.io/stacklight/telemeter-token-auth:v0.1-20250317023016 |
Artifact |
Component |
Path |
|---|---|---|
Configuration management |
Ansible |
|
Debian repositories |
System packages |
|
https://mirror.mirantis.com/kaas/ubuntu-2025-03-05-003900/ Updated |
||
https://mirror.mirantis.com/kaas/ubuntu-2025-03-05-003900.target.txt Updated |
||
MCR repositories |
MCR |
https://repos.mirantis.com/ubuntu/dists/jammy/pool/stable-23.0/ |
Target ubuntu system |
Ubuntu |
https://binary.mirantis.com/bm/bin/efi/ubuntu/tgz-jammy-20250305162411 Updated |
This section includes release notes for the patch Cluster release 17.3.5 that is introduced in the Container Cloud patch release 2.28.5 and is based on the Cluster releases 17.3.0, 17.3.4, and 16.3.4.
This patch Cluster release introduces MOSK 24.3.2 that is based on Mirantis Kubernetes Engine 3.7.18 with Kubernetes 1.27 and Mirantis Container Runtime 23.0.15.
For details on MOSK 24.3.2, see release notes 24.3.2
For the list of CVE fixes delivered with this patch Cluster release, see 2.28.5
For details on patch release delivery, see Patch releases
This section lists the artifacts of components included in the Cluster release 17.3.5.
Note
The components that are newly added, updated, deprecated, or removed
as compared to the previous release version, are marked
with a corresponding superscript,
for example, lcm-ansible Updated.
Artifact |
Component |
Path |
|---|---|---|
Helm charts Updated |
local-volume-provisioner |
https://binary.mirantis.com/core/helm/local-volume-provisioner-1.41.28.tgz |
metallb |
||
Docker images |
ironic |
mirantis.azurecr.io/openstack/ironic:antelope-jammy-20240716113922 |
metallb-controller |
mirantis.azurecr.io/bm/metallb/controller:v0.14.5-a68c7101-amd64 |
|
metallb-speaker |
mirantis.azurecr.io/bm/metallb/speaker:v0.14.5-a68c7101-amd64 |
Artifact |
Component |
Path |
|---|---|---|
Helm chart |
ceph-controller |
https://binary.mirantis.com/ceph/helm/ceph-operator-1.0.0-mcc-2.28.4-3.tgz |
Docker images |
ceph |
mirantis.azurecr.io/mirantis/ceph:v18.2.4-11.cve |
ceph-controller |
mirantis.azurecr.io/ceph/mcp/ceph-controller:2.28.4-2 |
|
cephcsi |
mirantis.azurecr.io/mirantis/cephcsi:v3.9.0-26.cve |
|
cephcsi-registrar |
mirantis.azurecr.io/mirantis/cephcsi-registrar:v2.9.2-6.cve |
|
cephcsi-provisioner |
mirantis.azurecr.io/mirantis/cephcsi-provisioner:v3.6.2-6.cve |
|
cephcsi-snapshotter |
mirantis.azurecr.io/mirantis/cephcsi-snapshotter:v6.3.2-6.cve |
|
cephcsi-attacher |
mirantis.azurecr.io/mirantis/cephcsi-attacher:v4.4.2-6.cve |
|
cephcsi-resizer |
mirantis.azurecr.io/mirantis/cephcsi-resizer:v1.9.2-6.cve |
|
rook |
mirantis.azurecr.io/ceph/rook:v1.13.5-28 |
|
snapshot-controller |
mirantis.azurecr.io/mirantis/snapshot-controller:v6.3.2-6.cve |
Artifact |
Component |
Path |
|---|---|---|
Helm charts Updated |
cinder-csi-plugin Deprecated |
https://binary.mirantis.com/core/helm/cinder-csi-plugin-1.41.28.tgz |
client-certificate-controller |
https://binary.mirantis.com/core/helm/client-certificate-controller-1.41.28.tgz |
|
metrics-server |
https://binary.mirantis.com/core/helm/metrics-server-1.41.28.tgz |
|
openstack-cloud-controller-manager Deprecated |
https://binary.mirantis.com/core/helm/openstack-cloud-controller-manager-1.41.28.tgz |
|
policy-controller |
https://binary.mirantis.com/core/helm/policy-controller-1.41.28.tgz |
|
Docker images |
cinder-csi-plugin Deprecated |
mirantis.azurecr.io/lcm/kubernetes/cinder-csi-plugin:v1.27.2-24 |
client-certificate-controller Updated |
mirantis.azurecr.io/core/client-certificate-controller:1.41.28 |
|
csi-attacher Deprecated |
mirantis.azurecr.io/lcm/k8scsi/csi-attacher:v4.2.0-7 |
|
csi-node-driver-registrar Deprecated |
mirantis.azurecr.io/lcm/k8scsi/csi-node-driver-registrar:v2.7.0-7 |
|
csi-provisioner Deprecated |
mirantis.azurecr.io/lcm/k8scsi/csi-provisioner:v3.4.1-7 |
|
csi-resizer Deprecated |
mirantis.azurecr.io/lcm/k8scsi/csi-resizer:v1.7.0-7 |
|
csi-snapshotter Deprecated |
mirantis.azurecr.io/lcm/k8scsi/csi-snapshotter:v6.2.1-mcc-6 |
|
livenessprobe Deprecated |
mirantis.azurecr.io/lcm/k8scsi/livenessprobe:v2.9.0-7 |
|
metrics-server |
mirantis.azurecr.io/lcm/metrics-server-amd64:v0.6.3-10 |
|
openstack-cloud-controller-manager Deprecated |
mirantis.azurecr.io/lcm/kubernetes/openstack-cloud-controller-manager:v1.27.2-24 |
|
policy-controller Updated |
mirantis.azurecr.io/core/policy-controller:1.41.28 |
Artifact |
Component |
Path |
|---|---|---|
Binaries Updated |
lcm-agent |
mirantis.azurecr.io/core/bin/lcm-agent-1.41.28 |
lcm-ansible |
mirantis.azurecr.io/lcm/bin/lcm-ansible/v0.26.0-112-g26f96e1/lcm-ansible.tar.gz |
|
Helm charts Updated |
helm-controller |
https://binary.mirantis.com/core/helm/helm-controller-1.41.28.tgz |
managed-lcm-api |
https://binary.mirantis.com/core/helm/managed-lcm-api-1.41.28.tgz |
|
Docker images Updated |
helm-controller |
mirantis.azurecr.io/core/helm-controller:1.41.28 |
mcc-haproxy |
mirantis.azurecr.io/lcm/mcc-haproxy:v0.26.0-112-g26f96e1 |
|
mcc-keepalived |
mirantis.azurecr.io/lcm/mcc-keepalived:v0.26.0-112-g26f96e1 |
Artifact |
Component |
Path |
|---|---|---|
Helm charts |
alerta |
https://binary.mirantis.com/stacklight/helm/alerta-0.1.0-mcp-33.tgz |
alertmanager-webhook-servicenow |
https://binary.mirantis.com/stacklight/helm/alertmanager-webhook-servicenow-0.2.0-mcp-8.tgz |
|
cadvisor |
https://binary.mirantis.com/stacklight/helm/cadvisor-0.1.0-mcp-7.tgz |
|
elasticsearch-curator |
https://binary.mirantis.com/stacklight/helm/elasticsearch-curator-1.5.0-mcp-15.tgz |
|
elasticsearch-exporter |
https://binary.mirantis.com/stacklight/helm/elasticsearch-exporter-1.2.0-mcp-10.tgz |
|
fluentd-logs |
https://binary.mirantis.com/stacklight/helm/fluentd-logs-0.1.0-mcp-242.tgz |
|
grafana |
https://binary.mirantis.com/stacklight/helm/grafana-3.3.10-mcp-317.tgz |
|
iam-proxy |
||
metric-collector |
https://binary.mirantis.com/stacklight/helm/metric-collector-0.3.0-mcp-18.tgz |
|
metricbeat |
https://binary.mirantis.com/stacklight/helm/metricbeat-1.7.1-mcp-25.tgz |
|
opensearch |
https://binary.mirantis.com/stacklight/helm/opensearch-0.1.0-mcp-88.tgz |
|
opensearch-dashboards |
https://binary.mirantis.com/stacklight/helm/opensearch-dashboards-0.1.0-mcp-57.tgz |
|
patroni |
https://binary.mirantis.com/stacklight/helm/patroni-0.15.1-mcp-62.tgz |
|
prometheus |
https://binary.mirantis.com/stacklight/helm/prometheus-8.11.4-mcp-258.tgz |
|
prometheus-blackbox-exporter |
https://binary.mirantis.com/stacklight/helm/prometheus-blackbox-exporter-0.3.0-mcp-19.tgz |
|
prometheus-es-exporter |
https://binary.mirantis.com/stacklight/helm/prometheus-es-exporter-1.0.0-mcp-18.tgz |
|
prometheus-msteams |
https://binary.mirantis.com/stacklight/helm/prometheus-msteams-0.1.0-mcp-12.tgz |
|
sf-notifier |
https://binary.mirantis.com/stacklight/helm/sf-notifier-0.2.0-mcp-10.tgz |
|
sf-reporter |
https://binary.mirantis.com/stacklight/helm/sf-reporter-0.2.0-mcp-10.tgz |
|
stacklight Updated |
https://binary.mirantis.com/stacklight/helm/stacklight-0.16.9.tgz |
|
telegraf-ds |
https://binary.mirantis.com/stacklight/helm/telegraf-ds-1.1.5-mcp-42.tgz |
|
telegraf-s |
https://binary.mirantis.com/stacklight/helm/telegraf-s-1.1.5-mcp-42.tgz |
|
telemeter-client |
https://binary.mirantis.com/stacklight/helm/telemeter-client-0.2.0-mcp-14.tgz |
|
telemeter-server |
https://binary.mirantis.com/stacklight/helm/telemeter-server-0.2.0-mcp-14.tgz |
|
Docker images |
alerta-web Updated |
mirantis.azurecr.io/stacklight/alerta-web:9-20250113023008 |
alertmanager Updated |
mirantis.azurecr.io/stacklight/alertmanager:v0-20250113023013 |
|
alertmanager-webhook-servicenow |
mirantis.azurecr.io/stacklight/alertmanager-webhook-servicenow:v0.1-20241022074315 |
|
alpine-utils Updated |
mirantis.azurecr.io/stacklight/alpine-utils:1-20250113023014 |
|
blackbox-exporter |
mirantis.azurecr.io/stacklight/blackbox-exporter:0-20241217061716 |
|
cadvisor Updated |
mirantis.azurecr.io/stacklight/cadvisor:v0.49.1-20250113023012 |
|
configmap-reload |
mirantis.azurecr.io/stacklight/configmap-reload:v0.8.0 |
|
curator |
mirantis.azurecr.io/stacklight/curator:5.7.6-20230404082402 |
|
elasticsearch-exporter |
mirantis.azurecr.io/stacklight/elasticsearch-exporter:v1.5.0 |
|
fluentd Updated |
mirantis.azurecr.io/stacklight/fluentd:1.18-20250114114547 |
|
grafana |
mirantis.azurecr.io/stacklight/grafana:10.4.3 |
|
k8s-sidecar |
mirantis.azurecr.io/stacklight/k8s-sidecar:1-20241115071117 |
|
kube-state-metrics |
mirantis.azurecr.io/stacklight/kube-state-metrics:v2.10.1 |
|
metric-collector Updated |
mirantis.azurecr.io/stacklight/metric-collector:v0.1-20250113023012 |
|
metricbeat Updated |
mirantis.azurecr.io/stacklight/metricbeat:7.12.1-20250113023013 |
|
node-exporter |
mirantis.azurecr.io/stacklight/node-exporter:v1.8.2 |
|
oauth2-proxy |
mirantis.azurecr.io/iam/oauth2-proxy:v7.1.3-13 |
|
opensearch Updated |
mirantis.azurecr.io/stacklight/opensearch:2.17-20250113023014 |
|
opensearch-dashboards Updated |
mirantis.azurecr.io/stacklight/opensearch-dashboards:2.17-20250113023013 |
|
prometheus |
mirantis.azurecr.io/stacklight/prometheus:v2.48.0 |
|
prometheus-es-exporter Updated |
mirantis.azurecr.io/stacklight/prometheus-es-exporter:v0.14-20250113023014 |
|
prometheus-msteams Updated |
mirantis.azurecr.io/stacklight/prometheus-msteams:v1.5-20250113023013 |
|
prometheus-patroni-exporter Updated |
mirantis.azurecr.io/stacklight/prometheus-patroni-exporter:0.0.1-20250113023014 |
|
prometheus-postgres-exporter |
mirantis.azurecr.io/stacklight/prometheus-postgres-exporter:v0.15.0 |
|
prometheus-relay |
mirantis.azurecr.io/stacklight/prometheus-relay:v0.4-20240925023019 |
|
sf-notifier Updated |
mirantis.azurecr.io/stacklight/sf-notifier:v0.4-20250113023013 |
|
sf-reporter |
mirantis.azurecr.io/stacklight/sf-reporter:v0.1-20241021111607 |
|
spilo Updated |
mirantis.azurecr.io/stacklight/spilo:13-3.3-p2-20250113023013 |
|
telegraf |
mirantis.azurecr.io/stacklight/telegraf:v1.9.1-20241202023010 |
|
mirantis.azurecr.io/stacklight/telegraf:1-20241115074302 |
||
telemeter Updated |
mirantis.azurecr.io/stacklight/telemeter:4.4-20250113023014 |
|
telemeter-token-auth Updated |
mirantis.azurecr.io/stacklight/telemeter-token-auth:v0.1-20250113023012 |
Artifact |
Component |
Path |
|---|---|---|
Configuration management |
Ansible |
|
Debian repositories |
System packages |
|
https://mirror.mirantis.com/kaas/ubuntu-2025-01-08-003900/ Updated |
||
https://mirror.mirantis.com/kaas/ubuntu-2025-01-08-003900.target.txt Updated |
||
MCR repositories |
MCR |
https://repos.mirantis.com/ubuntu/dists/focal/pool/stable-23.0/ |
Target ubuntu system |
Ubuntu |
https://binary.mirantis.com/bm/bin/efi/ubuntu/tgz-focal-20250108121626 Updated |
https://binary.mirantis.com/bm/bin/efi/ubuntu/tgz-jammy-20250108121533 Updated |
This section includes release notes for the patch Cluster release 17.3.4 that is introduced in the Container Cloud patch release 2.28.4 and is based on the Cluster releases 17.3.0 and 16.3.4.
This patch Cluster release introduces MOSK 24.3.1 that is based on Mirantis Kubernetes Engine 3.7.17 with Kubernetes 1.27 and Mirantis Container Runtime 23.0.15, which includes containerd 1.6.36.
For details on MOSK 24.3.1, see release notes 24.3.1
For the list of CVE fixes delivered with this patch Cluster release, see 2.28.4
For details on patch release delivery, see Patch releases
This section lists the artifacts of components included in the Cluster release 17.3.4.
Note
The components that are newly added, updated, deprecated, or removed
as compared to the previous release version, are marked
with a corresponding superscript,
for example, lcm-ansible Updated.
Artifact |
Component |
Path |
|---|---|---|
Helm charts Updated |
local-volume-provisioner |
https://binary.mirantis.com/core/helm/local-volume-provisioner-1.41.26.tgz |
metallb |
||
Docker images |
ironic |
mirantis.azurecr.io/openstack/ironic:antelope-jammy-20240716113922 |
metallb-controller Updated |
mirantis.azurecr.io/bm/metallb/controller:v0.14.5-a68c7101-amd64 |
|
metallb-speaker Updated |
mirantis.azurecr.io/bm/metallb/speaker:v0.14.5-a68c7101-amd64 |
Artifact |
Component |
Path |
|---|---|---|
Helm chart Updated |
ceph-controller |
https://binary.mirantis.com/ceph/helm/ceph-operator-1.0.0-mcc-2.28.4-3.tgz |
Docker images |
ceph Updated |
mirantis.azurecr.io/mirantis/ceph:v18.2.4-11.cve |
ceph-controller Updated |
mirantis.azurecr.io/ceph/mcp/ceph-controller:2.28.4-2 |
|
cephcsi Updated |
mirantis.azurecr.io/mirantis/cephcsi:v3.9.0-26.cve |
|
cephcsi-registrar |
mirantis.azurecr.io/mirantis/cephcsi-registrar:v2.9.2-6.cve |
|
cephcsi-provisioner |
mirantis.azurecr.io/mirantis/cephcsi-provisioner:v3.6.2-6.cve |
|
cephcsi-snapshotter |
mirantis.azurecr.io/mirantis/cephcsi-snapshotter:v6.3.2-6.cve |
|
cephcsi-attacher |
mirantis.azurecr.io/mirantis/cephcsi-attacher:v4.4.2-6.cve |
|
cephcsi-resizer |
mirantis.azurecr.io/mirantis/cephcsi-resizer:v1.9.2-6.cve |
|
rook Updated |
mirantis.azurecr.io/ceph/rook:v1.13.5-28 |
|
snapshot-controller |
mirantis.azurecr.io/mirantis/snapshot-controller:v6.3.2-6.cve |
Artifact |
Component |
Path |
|---|---|---|
Helm charts Updated |
cinder-csi-plugin Deprecated |
https://binary.mirantis.com/core/helm/cinder-csi-plugin-1.41.26.tgz |
client-certificate-controller |
https://binary.mirantis.com/core/helm/client-certificate-controller-1.41.26.tgz |
|
metrics-server |
https://binary.mirantis.com/core/helm/metrics-server-1.41.26.tgz |
|
openstack-cloud-controller-manager Deprecated |
https://binary.mirantis.com/core/helm/openstack-cloud-controller-manager-1.41.26.tgz |
|
policy-controller |
https://binary.mirantis.com/core/helm/policy-controller-1.41.26.tgz |
|
Docker images |
cinder-csi-plugin Deprecated |
mirantis.azurecr.io/lcm/kubernetes/cinder-csi-plugin:v1.27.2-24 |
client-certificate-controller Updated |
mirantis.azurecr.io/core/client-certificate-controller:1.41.26 |
|
csi-attacher Deprecated |
mirantis.azurecr.io/lcm/k8scsi/csi-attacher:v4.2.0-7 |
|
csi-node-driver-registrar Deprecated |
mirantis.azurecr.io/lcm/k8scsi/csi-node-driver-registrar:v2.7.0-7 |
|
csi-provisioner Deprecated |
mirantis.azurecr.io/lcm/k8scsi/csi-provisioner:v3.4.1-7 |
|
csi-resizer Deprecated |
mirantis.azurecr.io/lcm/k8scsi/csi-resizer:v1.7.0-7 |
|
csi-snapshotter Deprecated |
mirantis.azurecr.io/lcm/k8scsi/csi-snapshotter:v6.2.1-mcc-6 |
|
livenessprobe Deprecated |
mirantis.azurecr.io/lcm/k8scsi/livenessprobe:v2.9.0-7 |
|
metrics-server Updated |
mirantis.azurecr.io/lcm/metrics-server-amd64:v0.6.3-10 |
|
openstack-cloud-controller-manager Deprecated |
mirantis.azurecr.io/lcm/kubernetes/openstack-cloud-controller-manager:v1.27.2-24 |
|
policy-controller Updated |
mirantis.azurecr.io/core/policy-controller:1.41.26 |
Artifact |
Component |
Path |
|---|---|---|
Binaries Updated |
lcm-ansible |
https://binary.mirantis.com/lcm/bin/lcm-ansible/v0.26.0-111-g8632985/lcm-ansible.tar.gz |
lcm-agent |
||
Helm charts Updated |
helm-controller |
https://binary.mirantis.com/core/helm/helm-controller-1.41.26.tgz |
managed-lcm-api |
https://binary.mirantis.com/core/helm/managed-lcm-api-1.41.26.tgz |
|
Docker images Updated |
helm-controller |
mirantis.azurecr.io/core/lcm-controller:1.41.26 |
mcc-haproxy |
mirantis.azurecr.io/lcm/mcc-haproxy:v0.26.0-111-g8632985 |
|
mcc-keepalived |
mirantis.azurecr.io/lcm/mcc-keepalived:v0.26.0-111-g8632985 |
Artifact |
Component |
Path |
|---|---|---|
Helm charts |
alerta |
https://binary.mirantis.com/stacklight/helm/alerta-0.1.0-mcp-33.tgz |
alertmanager-webhook-servicenow |
https://binary.mirantis.com/stacklight/helm/alertmanager-webhook-servicenow-0.2.0-mcp-8.tgz |
|
cadvisor |
https://binary.mirantis.com/stacklight/helm/cadvisor-0.1.0-mcp-7.tgz |
|
elasticsearch-curator |
https://binary.mirantis.com/stacklight/helm/elasticsearch-curator-1.5.0-mcp-15.tgz |
|
elasticsearch-exporter |
https://binary.mirantis.com/stacklight/helm/elasticsearch-exporter-1.2.0-mcp-10.tgz |
|
fluentd-logs Updated |
https://binary.mirantis.com/stacklight/helm/fluentd-logs-0.1.0-mcp-242.tgz |
|
grafana Updated |
https://binary.mirantis.com/stacklight/helm/grafana-3.3.10-mcp-317.tgz |
|
iam-proxy |
||
metric-collector Updated |
https://binary.mirantis.com/stacklight/helm/metric-collector-0.3.0-mcp-18.tgz |
|
metricbeat |
https://binary.mirantis.com/stacklight/helm/metricbeat-1.7.1-mcp-25.tgz |
|
opensearch |
https://binary.mirantis.com/stacklight/helm/opensearch-0.1.0-mcp-88.tgz |
|
opensearch-dashboards Updated |
https://binary.mirantis.com/stacklight/helm/opensearch-dashboards-0.1.0-mcp-57.tgz |
|
patroni Updated |
https://binary.mirantis.com/stacklight/helm/patroni-0.15.1-mcp-62.tgz |
|
prometheus |
https://binary.mirantis.com/stacklight/helm/prometheus-8.11.4-mcp-258.tgz |
|
prometheus-blackbox-exporter |
https://binary.mirantis.com/stacklight/helm/prometheus-blackbox-exporter-0.3.0-mcp-19.tgz |
|
prometheus-es-exporter |
https://binary.mirantis.com/stacklight/helm/prometheus-es-exporter-1.0.0-mcp-18.tgz |
|
prometheus-msteams |
https://binary.mirantis.com/stacklight/helm/prometheus-msteams-0.1.0-mcp-12.tgz |
|
sf-notifier |
https://binary.mirantis.com/stacklight/helm/sf-notifier-0.2.0-mcp-10.tgz |
|
sf-reporter |
https://binary.mirantis.com/stacklight/helm/sf-reporter-0.2.0-mcp-10.tgz |
|
stacklight Updated |
https://binary.mirantis.com/stacklight/helm/stacklight-0.16.8.tgz |
|
telegraf-ds |
https://binary.mirantis.com/stacklight/helm/telegraf-ds-1.1.5-mcp-42.tgz |
|
telegraf-s |
https://binary.mirantis.com/stacklight/helm/telegraf-s-1.1.5-mcp-42.tgz |
|
telemeter-client |
https://binary.mirantis.com/stacklight/helm/telemeter-client-0.2.0-mcp-14.tgz |
|
telemeter-server |
https://binary.mirantis.com/stacklight/helm/telemeter-server-0.2.0-mcp-14.tgz |
|
Docker images |
alerta-web Updated |
mirantis.azurecr.io/stacklight/alerta-web:9-20241216023012 |
alertmanager Updated |
mirantis.azurecr.io/stacklight/alertmanager:v0-20241216023016 |
|
alertmanager-webhook-servicenow |
mirantis.azurecr.io/stacklight/alertmanager-webhook-servicenow:v0.1-20241022074315 |
|
alpine-utils Updated |
mirantis.azurecr.io/stacklight/alpine-utils:1-20241216023016 |
|
blackbox-exporter Updated |
mirantis.azurecr.io/stacklight/blackbox-exporter:0-20241217061716 |
|
cadvisor Updated |
mirantis.azurecr.io/stacklight/cadvisor:v0.49.1-20241216023012 |
|
configmap-reload |
mirantis.azurecr.io/stacklight/configmap-reload:v0.8.0 |
|
curator |
mirantis.azurecr.io/stacklight/curator:5.7.6-20230404082402 |
|
elasticsearch-exporter |
mirantis.azurecr.io/stacklight/elasticsearch-exporter:v1.5.0 |
|
fluentd Updated |
mirantis.azurecr.io/stacklight/fluentd:1.17-20241216023012 |
|
grafana Updated |
mirantis.azurecr.io/stacklight/grafana:10.4.3 |
|
k8s-sidecar |
mirantis.azurecr.io/stacklight/k8s-sidecar:1-20241115071117 |
|
kube-state-metrics |
mirantis.azurecr.io/stacklight/kube-state-metrics:v2.10.1 |
|
kubectl Removed |
n/a |
|
metric-collector Updated |
mirantis.azurecr.io/stacklight/metric-collector:v0.1-20241216023016 |
|
metricbeat Updated |
mirantis.azurecr.io/stacklight/metricbeat:7.12.1-20241217093320 |
|
node-exporter |
mirantis.azurecr.io/stacklight/node-exporter:v1.8.2 |
|
oauth2-proxy Updated |
mirantis.azurecr.io/iam/oauth2-proxy:v7.1.3-13 |
|
opensearch Updated |
mirantis.azurecr.io/stacklight/opensearch:2.17-20241216023012 |
|
opensearch-dashboards Updated |
mirantis.azurecr.io/stacklight/opensearch-dashboards:2.17-20241216023012 |
|
pgbouncer Removed |
n/a |
|
prometheus |
mirantis.azurecr.io/stacklight/prometheus:v2.48.0 |
|
prometheus-es-exporter Updated |
mirantis.azurecr.io/stacklight/prometheus-es-exporter:v0.14-20241216023016 |
|
prometheus-msteams Updated |
mirantis.azurecr.io/stacklight/prometheus-msteams:v1.5-20241209023016 |
|
prometheus-patroni-exporter Updated |
mirantis.azurecr.io/stacklight/prometheus-patroni-exporter:0.0.1-20241216023016 |
|
prometheus-postgres-exporter |
mirantis.azurecr.io/stacklight/prometheus-postgres-exporter:v0.15.0 |
|
prometheus-relay Updated |
mirantis.azurecr.io/stacklight/prometheus-relay:v0.4-20240925023019 |
|
sf-notifier Updated |
mirantis.azurecr.io/stacklight/sf-notifier:v0.4-20241216023012 |
|
sf-reporter Updated |
mirantis.azurecr.io/stacklight/sf-reporter:v0.1-20241021111607 |
|
spilo Updated |
mirantis.azurecr.io/stacklight/spilo:13-3.3-p2-20241216023012 |
|
telegraf |
mirantis.azurecr.io/stacklight/telegraf:v1.9.1-20241202023010 Updated |
|
mirantis.azurecr.io/stacklight/telegraf:1-20241115074302 Updated |
||
telemeter Updated |
mirantis.azurecr.io/stacklight/telemeter:4.4-20241216023016 |
|
telemeter-token-auth Updated |
mirantis.azurecr.io/stacklight/telemeter-token-auth:v0.1-20241216023012 |
Artifact |
Component |
Path |
|---|---|---|
Configuration management |
Ansible |
|
Debian repositories |
System packages |
|
https://mirror.mirantis.com/kaas/ubuntu-2024-12-05-003900/ Updated |
||
https://mirror.mirantis.com/kaas/ubuntu-2024-12-05-003900.target.txt Updated |
||
MCR repositories |
MCR |
https://repos.mirantis.com/ubuntu/dists/focal/pool/stable-23.0/ |
Target ubuntu system |
Ubuntu |
https://binary.mirantis.com/bm/bin/efi/ubuntu/tgz-focal-20241205163940 Updated |
https://binary.mirantis.com/bm/bin/efi/ubuntu/tgz-jammy-20241205163925 Updated |
This section outlines release notes for the major Cluster release 17.3.0 that is introduced in the Container Cloud release 2.28.0. This Cluster release is based on the Cluster release 16.3.0. The Cluster release 17.3.0 supports:
Mirantis OpenStack for Kubernetes (MOSK) 24.3. For details, see 24.3 release notes.
Mirantis Kubernetes Engine (MKE) 3.7.12. For details, see MKE Release Notes.
Mirantis Container Runtime (MCR) 23.0.14. For details, see MCR Release Notes.
Kubernetes 1.27.
For the list of known and addressed issues, refer to the Container Cloud release 2.28.0 section.
This section outlines new features implemented in the Cluster release 17.3.0 that is introduced in the Container Cloud release 2.28.0.
Introduced support for Mirantis Container Runtime (MCR) 23.0.14 and Mirantis Kubernetes Engine (MKE) 3.7.12 that includes Kubernetes 1.27.14.
On existing clusters, MKE and MCR are updated to the latest supported version when you update your managed cluster to the Cluster release 17.3.0.
Note
The 3.7.12 update applies to users who follow the update train using major releases. Users who install patch releases, have already obtained MKE 3.7.12 in Container Cloud 2.27.3 (Cluster release 17.1.4).
Analyzed and reached 80% of pass rate in the CIS Benchmark compliance checks (executed by the Nessus scanner) for Ubuntu Linux 22.04 LTS v2.0.0 L1 Server, revision 1.1.
Note
Compliance results can vary between clusters due to configuration-dependent tests, such as server disk partitioning.
If you require a detailed report of analyzed and fixed compliance checks, contact Mirantis support.
Implemented proactive monitoring that allows the operator to quickly detect
and resolve LCM health issues in a cluster. The implementation includes the
dedicated MCCClusterLCMUnhealthy alert along with the
kaas_cluster_lcm_healthy and kaas_cluster_ready metrics that are
collected on the kaas-exporter side.
Refactored all certificate and license expiration alerts in StackLight that now
display the exact number of remaining days before expiration using
{{ $value | humanizeTimestamp }}. This optimization replaces vague wording
such as less than 10 days, which indicated a range from 0 to 9 days before
expiration.
Learn more
The following table lists the components versions of the Cluster release
17.3.0. The components that are newly added, updated, deprecated, or removed as
compared to 17.2.0, are marked with a corresponding superscript, for example,
lcm-ansible Updated.
Component |
Application/Service |
Version |
|---|---|---|
Cluster orchestration Updated |
Mirantis Kubernetes Engine |
3.7.12 0 |
Container runtime Updated |
Mirantis Container Runtime |
23.0.14 1 |
Core Updated |
cinder-csi-plugin |
1.27.2-19 |
client-certificate-controller |
1.41.14 |
|
csi-attacher |
4.2.0-7 |
|
csi-node-driver-registrar |
2.7.0-7 |
|
csi-provisioner |
3.4.1-7 |
|
csi-resizer |
1.7.0-7 |
|
csi-snapshotter |
6.2.1-mcc-6 |
|
livenessprobe |
2.9.0-7 |
|
metrics-server |
0.6.3-9 |
|
policy-controller |
1.41.14 |
|
Distributed storage Updated |
Ceph |
18.2.4-6.cve (Reef) |
Rook |
1.13.5-21 |
|
LCM Updated |
helm-controller |
1.41.14 |
lcm-ansible |
0.26.0-95-g95f0130 |
|
lcm-agent |
1.41.14 |
|
StackLight |
Alerta |
9.0.1 |
Alertmanager |
0.25.0 |
|
Alertmanager Webhook ServiceNow |
0.1 |
|
Blackbox Exporter |
0.24.0 |
|
cAdvisor |
0.47.2 |
|
Elasticsearch Curator |
5.7.6 |
|
Elasticsearch Exporter |
1.5.0 |
|
Fluentd |
1.15.3 |
|
Grafana Updated |
10.4.3 |
|
kube-state-metrics |
2.10.1 |
|
Metric Collector |
0.1 |
|
Metricbeat |
7.12.1 |
|
Node Exporter Updated |
1.8.2 |
|
OAuth2 Proxy |
7.1.3 |
|
OpenSearch |
2.12.0 |
|
OpenSearch Dashboards |
2.12.0 |
|
Prometheus |
2.48.0 |
|
Prometheus ES Exporter |
0.14.0 |
|
Prometheus MS Teams |
1.5.2 |
|
Prometheus Patroni Exporter |
0.0.1 |
|
Prometheus Postgres Exporter |
0.15.0 |
|
Prometheus Relay |
0.4 |
|
sf-notifier |
0.4 |
|
sf-reporter |
0.1 |
|
Spilo |
13-2.1p9 |
|
Telegraf |
1.9.1 |
|
1.30.2 |
||
Telemeter |
4.4 |
- 0
For the Mirantis Kubernetes Engine (MKE) release highlights and components versions, see MKE documentation: MKE release notes.
- 1
For the Mirantis Container Runtime (MCR) release highlights, see MCR documentation: MCR release notes.
This section lists the artifacts of components included in the Cluster release
17.3.0. The components that are newly added, updated, deprecated, or removed as
compared to 17.2.0, are marked with a corresponding superscript, for example,
lcm-ansible Updated.
Artifact |
Component |
Path |
|---|---|---|
Helm chart Updated |
ceph-controller |
https://binary.mirantis.com/ceph/helm/ceph-operator-1.0.0-mcc-2.28.0-15.tgz |
Docker images Updated |
ceph |
mirantis.azurecr.io/mirantis/ceph:v18.2.4-6.cve |
ceph-controller |
mirantis.azurecr.io/ceph/mcp/ceph-controller:2.28.0-14 |
|
cephcsi |
mirantis.azurecr.io/mirantis/cephcsi:v3.9.0-20.cve |
|
cephcsi-registrar |
mirantis.azurecr.io/mirantis/cephcsi-registrar:v2.9.2-6.cve |
|
cephcsi-provisioner |
mirantis.azurecr.io/mirantis/cephcsi-provisioner:v3.6.2-6.cve |
|
cephcsi-snapshotter |
mirantis.azurecr.io/mirantis/cephcsi-snapshotter:v6.3.2-6.cve |
|
cephcsi-attacher |
mirantis.azurecr.io/mirantis/cephcsi-attacher:v4.4.2-6.cve |
|
cephcsi-resizer |
mirantis.azurecr.io/mirantis/cephcsi-resizer:v1.9.2-6.cve |
|
rook |
mirantis.azurecr.io/ceph/rook:v1.13.5-21 |
|
snapshot-controller |
mirantis.azurecr.io/mirantis/snapshot-controller:v6.3.2-6.cve |
Artifact |
Component |
Path |
|---|---|---|
Helm charts Updated |
cinder-csi-plugin |
https://binary.mirantis.com/core/helm/cinder-csi-plugin-1.41.14.tgz |
client-certificate-controller |
https://binary.mirantis.com/core/helm/client-certificate-controller-1.41.14.tgz |
|
local-volume-provisioner |
https://binary.mirantis.com/core/helm/local-volume-provisioner-1.41.14.tgz |
|
metrics-server |
https://binary.mirantis.com/core/helm/metrics-server-1.41.14.tgz |
|
openstack-cloud-controller-manager |
https://binary.mirantis.com/core/helm/openstack-cloud-controller-manager-1.41.14.tgz |
|
policy-controller |
https://binary.mirantis.com/core/helm/policy-controller-1.41.14.tgz |
|
Docker images Updated |
cinder-csi-plugin |
mirantis.azurecr.io/lcm/kubernetes/cinder-csi-plugin:v1.27.2-20 |
client-certificate-controller |
mirantis.azurecr.io/core/client-certificate-controller:1.41.14 |
|
csi-attacher |
mirantis.azurecr.io/lcm/k8scsi/csi-attacher:v4.2.0-7 |
|
csi-node-driver-registrar |
mirantis.azurecr.io/lcm/k8scsi/csi-node-driver-registrar:v2.7.0-7 |
|
csi-provisioner |
mirantis.azurecr.io/lcm/k8scsi/csi-provisioner:v3.4.1-7 |
|
csi-resizer |
mirantis.azurecr.io/lcm/k8scsi/csi-resizer:v1.7.0-7 |
|
csi-snapshotter |
mirantis.azurecr.io/lcm/k8scsi/csi-snapshotter:v6.2.1-mcc-6 |
|
livenessprobe |
mirantis.azurecr.io/lcm/k8scsi/livenessprobe:v2.9.0-7 |
|
metrics-server |
mirantis.azurecr.io/lcm/metrics-server-amd64:v0.6.3-9 |
|
openstack-cloud-controller-manager |
mirantis.azurecr.io/lcm/kubernetes/openstack-cloud-controller-manager:v1.27.2-20 |
|
policy-controller |
mirantis.azurecr.io/core/policy-controller:1.41.14 |
Artifact |
Component |
Path |
|---|---|---|
Binaries Updated |
lcm-ansible |
https://binary.mirantis.com/lcm/bin/lcm-ansible/v0.26.0-95-g95f0130/lcm-ansible.tar.gz |
lcm-agent |
||
Helm charts Updated |
helm-controller |
https://binary.mirantis.com/core/helm/helm-controller-1.41.14.tgz |
managed-lcm-api |
https://binary.mirantis.com/core/helm/managed-lcm-api-1.41.14.tgz |
|
Docker images Updated |
helm-controller |
mirantis.azurecr.io/core/lcm-controller:1.41.14 |
Artifact |
Component |
Path |
|---|---|---|
Helm charts |
alerta |
https://binary.mirantis.com/stacklight/helm/alerta-0.1.0-mcp-33.tgz |
alertmanager-webhook-servicenow |
https://binary.mirantis.com/stacklight/helm/alertmanager-webhook-servicenow-0.2.0-mcp-8.tgz |
|
cadvisor |
https://binary.mirantis.com/stacklight/helm/cadvisor-0.1.0-mcp-7.tgz |
|
elasticsearch-curator |
https://binary.mirantis.com/stacklight/helm/elasticsearch-curator-1.5.0-mcp-15.tgz |
|
elasticsearch-exporter |
https://binary.mirantis.com/stacklight/helm/elasticsearch-exporter-1.2.0-mcp-10.tgz |
|
fluentd-logs Updated |
https://binary.mirantis.com/stacklight/helm/fluentd-logs-0.1.0-mcp-240.tgz |
|
grafana Updated |
https://binary.mirantis.com/stacklight/helm/grafana-3.3.10-mcp-305.tgz |
|
iam-proxy |
||
metric-collector |
https://binary.mirantis.com/stacklight/helm/metric-collector-0.3.0-mcp-17.tgz |
|
metricbeat |
https://binary.mirantis.com/stacklight/helm/metricbeat-1.7.1-mcp-25.tgz |
|
opensearch Updated |
https://binary.mirantis.com/stacklight/helm/opensearch-0.1.0-mcp-88.tgz |
|
opensearch-dashboards Updated |
https://binary.mirantis.com/stacklight/helm/opensearch-dashboards-0.1.0-mcp-56.tgz |
|
patroni |
https://binary.mirantis.com/stacklight/helm/patroni-0.15.1-mcp-59.tgz |
|
prometheus |
https://binary.mirantis.com/stacklight/helm/prometheus-8.11.4-mcp-258.tgz |
|
prometheus-blackbox-exporter |
https://binary.mirantis.com/stacklight/helm/prometheus-blackbox-exporter-0.3.0-mcp-19.tgz |
|
prometheus-es-exporter |
https://binary.mirantis.com/stacklight/helm/prometheus-es-exporter-1.0.0-mcp-18.tgz |
|
prometheus-msteams |
https://binary.mirantis.com/stacklight/helm/prometheus-msteams-0.1.0-mcp-12.tgz |
|
sf-notifier |
https://binary.mirantis.com/stacklight/helm/sf-notifier-0.2.0-mcp-10.tgz |
|
sf-reporter |
https://binary.mirantis.com/stacklight/helm/sf-reporter-0.2.0-mcp-10.tgz |
|
stacklight Updated |
https://binary.mirantis.com/stacklight/helm/stacklight-0.16.2.tgz |
|
telegraf-ds |
https://binary.mirantis.com/stacklight/helm/telegraf-ds-1.1.5-mcp-42.tgz |
|
telegraf-s |
https://binary.mirantis.com/stacklight/helm/telegraf-s-1.1.5-mcp-42.tgz |
|
telemeter-client |
https://binary.mirantis.com/stacklight/helm/telemeter-client-0.2.0-mcp-14.tgz |
|
telemeter-server |
https://binary.mirantis.com/stacklight/helm/telemeter-server-0.2.0-mcp-14.tgz |
|
Docker images |
alerta-web Updated |
mirantis.azurecr.io/stacklight/alerta-web:9-20240828023009 |
alertmanager Updated |
mirantis.azurecr.io/stacklight/alertmanager:v0-20240828023017 |
|
alertmanager-webhook-servicenow |
mirantis.azurecr.io/stacklight/alertmanager-webhook-servicenow:v0.1-20240318145925 |
|
alpine-utils Updated |
mirantis.azurecr.io/stacklight/alpine-utils:1-20240828023020 |
|
blackbox-exporter |
mirantis.azurecr.io/stacklight/blackbox-exporter:0-20240408080237 |
|
cadvisor Updated |
mirantis.azurecr.io/stacklight/cadvisor:v0.47-20240828023011 |
|
configmap-reload |
mirantis.azurecr.io/stacklight/configmap-reload:v0.8.0 |
|
curator |
mirantis.azurecr.io/stacklight/curator:5.7.6-20230404082402 |
|
elasticsearch-exporter |
mirantis.azurecr.io/stacklight/elasticsearch-exporter:v1.5.0 |
|
fluentd Updated |
mirantis.azurecr.io/stacklight/fluentd:1.15-20240828023010 |
|
grafana Updated |
mirantis.azurecr.io/stacklight/grafana:10.4.3 |
|
k8s-sidecar Updated |
mirantis.azurecr.io/stacklight/k8s-sidecar:1-20240828023017 |
|
kube-state-metrics |
mirantis.azurecr.io/stacklight/kube-state-metrics:v2.10.1 |
|
kubectl Updated |
mirantis.azurecr.io/stacklight/kubectl:1.27-20240828023016 |
|
metric-collector Updated |
mirantis.azurecr.io/stacklight/metric-collector:v0.1-20240828023014 |
|
metricbeat Updated |
mirantis.azurecr.io/stacklight/metricbeat:7.12.1-20240626023010 |
|
node-exporter Updated |
mirantis.azurecr.io/stacklight/node-exporter:v1.8.2 |
|
oauth2-proxy Updated |
mirantis.azurecr.io/iam/oauth2-proxy:v7.1.3-10 |
|
opensearch Updated |
mirantis.azurecr.io/stacklight/opensearch:2-20240828023015 |
|
opensearch-dashboards Updated |
mirantis.azurecr.io/stacklight/opensearch-dashboards:2-20240828023010 |
|
pgbouncer Updated |
mirantis.azurecr.io/stacklight/pgbouncer:1-20240828023016 |
|
prometheus |
mirantis.azurecr.io/stacklight/prometheus:v2.48.0 |
|
prometheus-es-exporter Updated |
mirantis.azurecr.io/stacklight/prometheus-es-exporter:v0.14.0-20240828023017 |
|
prometheus-msteams |
mirantis.azurecr.io/stacklight/prometheus-msteams:v1.5-20240408080322 |
|
prometheus-patroni-exporter Updated |
mirantis.azurecr.io/stacklight/prometheus-patroni-exporter:0.0.1-20240828023018 |
|
prometheus-postgres-exporter |
mirantis.azurecr.io/stacklight/prometheus-postgres-exporter:v0.15.0 |
|
prometheus-relay Updated |
mirantis.azurecr.io/stacklight/prometheus-relay:v0.4-20240828023016 |
|
psql-client Updated |
mirantis.azurecr.io/scale/psql-client:v13-20240701095027 |
|
sf-notifier Updated |
mirantis.azurecr.io/stacklight/sf-notifier:v0.4-20240828023015 |
|
sf-reporter |
mirantis.azurecr.io/stacklight/sf-reporter:v0.1-20240318145903 |
|
spilo Updated |
mirantis.azurecr.io/stacklight/spilo:13-2.1p9-20240828023010 |
|
stacklight-toolkit Removed |
n/a |
|
telegraf |
mirantis.azurecr.io/stacklight/telegraf:v1.9.1-20240828023009 Updated |
|
mirantis.azurecr.io/stacklight/telegraf:1-20240426131156 |
||
telemeter Updated |
mirantis.azurecr.io/stacklight/telemeter:4.4-20240828023013 |
|
telemeter-token-auth Updated |
mirantis.azurecr.io/stacklight/telemeter-token-auth:v0.1-20240828023017 |
Artifact |
Component |
Path |
|---|---|---|
Configuration management |
Ansible |
|
Debian repositories |
System packages |
|
https://mirror.mirantis.com/kaas/ubuntu-2024-09-11-014225/ Updated |
||
https://mirror.mirantis.com/kaas/ubuntu-2024-09-11-014225.target.txt Updated |
||
MCR repositories |
MCR |
https://repos.mirantis.com/ubuntu/dists/focal/pool/stable-23.0/ |
Target ubuntu system |
Ubuntu |
https://binary.mirantis.com/bm/bin/efi/ubuntu/tgz-focal-20240911103121 Updated |
https://binary.mirantis.com/bm/bin/efi/ubuntu/tgz-jammy-20240911103059 New |
Major and patch versions update path
The primary distinction between major and patch product versions lies in the fact that major release versions introduce new functionalities, whereas patch release versions predominantly offer minor product enhancements, mostly CVE resolutions for your clusters.
Depending on your deployment needs, you can either update only between major Cluster releases or apply patch updates between major releases. Choosing the latter option ensures you receive security fixes as soon as they become available. Though, be prepared to update your cluster frequently, approximately once every three weeks. Otherwise, you can update only between major Cluster releases as each subsequent major Cluster release includes patch Cluster release updates of the previous major Cluster release.
This section outlines release notes for major and patch Cluster releases of the 17.2.x series dedicated for Mirantis OpenStack for Kubernetes (MOSK).
This section includes release notes for the patch Cluster release 17.2.7 that is introduced in the Container Cloud patch release 2.28.3 and is based on the previous Cluster releases of the 17.2.x series.
This patch Cluster release introduces MOSK 24.2.5 that is based on Mirantis Kubernetes Engine 3.7.16 with Kubernetes 1.27 and Mirantis Container Runtime 23.0.11.
For details on MOSK 24.2.5, see Release Notes 24.2.5.
For the list of CVE fixes delivered with this patch Cluster release, see 2.28.3
For details on patch release delivery, see Patch releases
This section lists the artifacts of components included in the Cluster release 17.2.7.
Note
The components that are newly added, updated, deprecated, or removed
as compared to the previous release version, are marked
with a corresponding superscript,
for example, lcm-ansible Updated.
Artifact |
Component |
Path |
|---|---|---|
Helm charts Updated |
local-volume-provisioner |
https://binary.mirantis.com/core/helm/local-volume-provisioner-1.40.29.tgz |
metallb |
||
Docker images |
ironic |
mirantis.azurecr.io/openstack/ironic:antelope-jammy-20240716113922 |
metallb-controller |
mirantis.azurecr.io/bm/metallb/controller:v0.14.5-a68c7101-amd64 |
|
metallb-speaker |
mirantis.azurecr.io/bm/metallb/speaker:v0.14.5-a68c7101-amd64 |
Artifact |
Component |
Path |
|---|---|---|
Helm chart Updated |
ceph-controller |
https://binary.mirantis.com/ceph/helm/ceph-operator-1.0.0-mcc-2.28.3-2.tgz |
Docker images |
ceph Updated |
mirantis.azurecr.io/mirantis/ceph:v18.2.4-10.cve |
ceph-controller Updated |
mirantis.azurecr.io/ceph/mcp/ceph-controller:2.28.3-0 |
|
cephcsi Updated |
mirantis.azurecr.io/mirantis/cephcsi:v3.9.0-24.cve |
|
cephcsi-registrar |
mirantis.azurecr.io/mirantis/cephcsi-registrar:v2.9.2-6.cve |
|
cephcsi-provisioner |
mirantis.azurecr.io/mirantis/cephcsi-provisioner:v3.6.2-6.cve |
|
cephcsi-snapshotter |
mirantis.azurecr.io/mirantis/cephcsi-snapshotter:v6.3.2-6.cve |
|
cephcsi-attacher |
mirantis.azurecr.io/mirantis/cephcsi-attacher:v4.4.2-6.cve |
|
cephcsi-resizer |
mirantis.azurecr.io/mirantis/cephcsi-resizer:v1.9.2-6.cve |
|
rook Updated |
mirantis.azurecr.io/ceph/rook:v1.13.5-26 |
|
snapshot-controller |
mirantis.azurecr.io/mirantis/snapshot-controller:v6.3.2-6.cve |
Artifact |
Component |
Path |
|---|---|---|
Helm charts |
cinder-csi-plugin |
https://binary.mirantis.com/core/helm/cinder-csi-plugin-1.40.29.tgz |
client-certificate-controller |
https://binary.mirantis.com/core/helm/client-certificate-controller-1.40.29.tgz |
|
metrics-server |
https://binary.mirantis.com/core/helm/metrics-server-1.40.29.tgz |
|
openstack-cloud-controller-manager |
https://binary.mirantis.com/core/helm/openstack-cloud-controller-manager-1.40.29.tgz |
|
policy-controller |
https://binary.mirantis.com/core/helm/policy-controller-1.40.29.tgz |
|
Docker images |
cinder-csi-plugin |
mirantis.azurecr.io/lcm/kubernetes/cinder-csi-plugin:v1.27.2-22 |
client-certificate-controller |
mirantis.azurecr.io/core/client-certificate-controller:1.40.29 |
|
csi-attacher |
mirantis.azurecr.io/lcm/k8scsi/csi-attacher:v4.2.0-7 |
|
csi-node-driver-registrar |
mirantis.azurecr.io/lcm/k8scsi/csi-node-driver-registrar:v2.7.0-7 |
|
csi-provisioner |
mirantis.azurecr.io/lcm/k8scsi/csi-provisioner:v3.4.1-7 |
|
csi-resizer |
mirantis.azurecr.io/lcm/k8scsi/csi-resizer:v1.7.0-7 |
|
csi-snapshotter |
mirantis.azurecr.io/lcm/k8scsi/csi-snapshotter:v6.2.1-mcc-6 |
|
livenessprobe |
mirantis.azurecr.io/lcm/k8scsi/livenessprobe:v2.9.0-7 |
|
metrics-server |
mirantis.azurecr.io/lcm/metrics-server-amd64:v0.6.3-9 |
|
openstack-cloud-controller-manager |
mirantis.azurecr.io/lcm/kubernetes/openstack-cloud-controller-manager:v1.27.2-22 |
|
policy-controller |
mirantis.azurecr.io/core/policy-controller:1.40.29 |
Artifact |
Component |
Path |
|---|---|---|
Binaries |
lcm-agent |
mirantis.azurecr.io/core/bin/lcm-agent-1.40.29 |
lcm-ansible Updated |
mirantis.azurecr.io/lcm/bin/lcm-ansible/v0.25.0-45-g957de77/lcm-ansible.tar.gz |
|
Helm charts |
helm-controller |
https://binary.mirantis.com/core/helm/helm-controller-1.40.29.tgz |
managed-lcm-api |
https://binary.mirantis.com/core/helm/managed-lcm-api-1.40.29.tgz |
|
Docker images |
helm-controller |
mirantis.azurecr.io/core/helm-controller:1.40.29 |
mcc-haproxy Updated |
mirantis.azurecr.io/lcm/mcc-haproxy:v0.25.0-45-g957de77 |
|
mcc-keepalived Updated |
mirantis.azurecr.io/lcm/mcc-keepalived:v0.25.0-45-g957de77 |
Artifact |
Component |
Path |
|---|---|---|
Helm charts |
alerta |
https://binary.mirantis.com/stacklight/helm/alerta-0.1.0-mcp-33.tgz |
alertmanager-webhook-servicenow |
https://binary.mirantis.com/stacklight/helm/alertmanager-webhook-servicenow-0.2.0-mcp-8.tgz |
|
cadvisor |
https://binary.mirantis.com/stacklight/helm/cadvisor-0.1.0-mcp-7.tgz |
|
elasticsearch-curator |
https://binary.mirantis.com/stacklight/helm/elasticsearch-curator-1.5.0-mcp-15.tgz |
|
elasticsearch-exporter |
https://binary.mirantis.com/stacklight/helm/elasticsearch-exporter-1.2.0-mcp-10.tgz |
|
fluentd-logs |
https://binary.mirantis.com/stacklight/helm/fluentd-logs-0.1.0-mcp-238.tgz |
|
grafana Updated |
https://binary.mirantis.com/stacklight/helm/grafana-3.3.10-mcp-317.tgz |
|
iam-proxy |
||
metric-collector |
https://binary.mirantis.com/stacklight/helm/metric-collector-0.3.0-mcp-17.tgz |
|
metricbeat |
https://binary.mirantis.com/stacklight/helm/metricbeat-1.7.1-mcp-25.tgz |
|
opensearch |
https://binary.mirantis.com/stacklight/helm/opensearch-0.1.0-mcp-88.tgz |
|
opensearch-dashboards Updated |
https://binary.mirantis.com/stacklight/helm/opensearch-dashboards-0.1.0-mcp-57.tgz |
|
patroni |
https://binary.mirantis.com/stacklight/helm/patroni-0.15.1-mcp-61.tgz |
|
prometheus |
https://binary.mirantis.com/stacklight/helm/prometheus-8.11.4-mcp-258.tgz |
|
prometheus-blackbox-exporter |
https://binary.mirantis.com/stacklight/helm/prometheus-blackbox-exporter-0.3.0-mcp-19.tgz |
|
prometheus-es-exporter |
https://binary.mirantis.com/stacklight/helm/prometheus-es-exporter-1.0.0-mcp-18.tgz |
|
prometheus-msteams |
https://binary.mirantis.com/stacklight/helm/prometheus-msteams-0.1.0-mcp-12.tgz |
|
sf-notifier |
https://binary.mirantis.com/stacklight/helm/sf-notifier-0.2.0-mcp-10.tgz |
|
sf-reporter |
https://binary.mirantis.com/stacklight/helm/sf-reporter-0.2.0-mcp-10.tgz |
|
stacklight Updated |
https://binary.mirantis.com/stacklight/helm/stacklight-0.15.14.tgz |
|
telegraf-ds |
https://binary.mirantis.com/stacklight/helm/telegraf-ds-1.1.5-mcp-42.tgz |
|
telegraf-s |
https://binary.mirantis.com/stacklight/helm/telegraf-s-1.1.5-mcp-42.tgz |
|
telemeter-client |
https://binary.mirantis.com/stacklight/helm/telemeter-client-0.2.0-mcp-14.tgz |
|
telemeter-server |
https://binary.mirantis.com/stacklight/helm/telemeter-server-0.2.0-mcp-14.tgz |
|
Docker images |
alerta-web Updated |
mirantis.azurecr.io/stacklight/alerta-web:9-20241118023015 |
alertmanager Updated |
mirantis.azurecr.io/stacklight/alertmanager:v0-20241118023015 |
|
alertmanager-webhook-servicenow |
mirantis.azurecr.io/stacklight/alertmanager-webhook-servicenow:v0.1-20241022074315 |
|
alpine-utils Updated |
mirantis.azurecr.io/stacklight/alpine-utils:1-20241119091011 |
|
blackbox-exporter |
mirantis.azurecr.io/stacklight/blackbox-exporter:0-20240408080237 |
|
cadvisor Updated |
mirantis.azurecr.io/stacklight/cadvisor:v0.47-20241118023015 |
|
configmap-reload |
mirantis.azurecr.io/stacklight/configmap-reload:v0.8.0 |
|
curator |
mirantis.azurecr.io/stacklight/curator:5.7.6-20230404082402 |
|
elasticsearch-exporter |
mirantis.azurecr.io/stacklight/elasticsearch-exporter:v1.5.0 |
|
fluentd Updated |
mirantis.azurecr.io/stacklight/fluentd:1.15-20241118023015 |
|
grafana |
mirantis.azurecr.io/stacklight/grafana:10.3.1 |
|
k8s-sidecar Updated |
mirantis.azurecr.io/stacklight/k8s-sidecar:1-20241115071117 |
|
kube-state-metrics |
mirantis.azurecr.io/stacklight/kube-state-metrics:v2.10.1 |
|
kubectl Updated |
mirantis.azurecr.io/stacklight/kubectl:1.27-20241118023017 |
|
metric-collector Updated |
mirantis.azurecr.io/stacklight/metric-collector:v0.1-20241118023015 |
|
metricbeat Updated |
mirantis.azurecr.io/stacklight/metricbeat:7.12.1-20241118023015 |
|
node-exporter |
mirantis.azurecr.io/stacklight/node-exporter:v1.7.0 |
|
oauth2-proxy |
mirantis.azurecr.io/iam/oauth2-proxy:v7.1.3-13 |
|
opensearch Updated |
mirantis.azurecr.io/stacklight/opensearch:2.17-20241118023016 |
|
opensearch-dashboards Updated |
mirantis.azurecr.io/stacklight/opensearch-dashboards:2.17-20241118023015 |
|
pgbouncer |
mirantis.azurecr.io/stacklight/pgbouncer:1-20240925023021 |
|
prometheus |
mirantis.azurecr.io/stacklight/prometheus:v2.48.0 |
|
prometheus-es-exporter Updated |
mirantis.azurecr.io/stacklight/prometheus-es-exporter:v0.14-20241118023016 |
|
prometheus-msteams Updated |
mirantis.azurecr.io/stacklight/prometheus-msteams:v1.5-20241118023015 |
|
prometheus-patroni-exporter Updated |
mirantis.azurecr.io/stacklight/prometheus-patroni-exporter:0.0.1-20241118023015 |
|
prometheus-postgres-exporter |
mirantis.azurecr.io/stacklight/prometheus-postgres-exporter:v0.15.0 |
|
prometheus-relay |
mirantis.azurecr.io/stacklight/prometheus-relay:v0.4-20240925023019 |
|
psql-client Removed |
n/a |
|
sf-notifier Updated |
mirantis.azurecr.io/stacklight/sf-notifier:v0.4-20241118023015 |
|
sf-reporter |
mirantis.azurecr.io/stacklight/sf-reporter:v0.1-20241021111607 |
|
spilo Updated |
mirantis.azurecr.io/stacklight/spilo:13-2.1p9-20241118023015 |
|
telegraf |
mirantis.azurecr.io/stacklight/telegraf:v1.9.1-20241118023015 Updated |
|
mirantis.azurecr.io/stacklight/telegraf:1-20241115074302 Updated |
||
telemeter Updated |
mirantis.azurecr.io/stacklight/telemeter:4.4-20241118023015 |
|
telemeter-token-auth Updated |
mirantis.azurecr.io/stacklight/telemeter-token-auth:v0.1-20241118023015 |
Artifact |
Component |
Path |
|---|---|---|
Configuration management |
Ansible |
|
Debian repositories |
System packages |
|
https://mirror.mirantis.com/kaas/ubuntu-2024-11-18-003900/ Updated |
||
https://mirror.mirantis.com/kaas/ubuntu-2024-11-18-003900.target.txt Updated |
||
MCR repositories |
MCR |
https://repos.mirantis.com/ubuntu/dists/focal/pool/stable-23.0/ |
Target ubuntu system |
Ubuntu |
https://binary.mirantis.com/bm/bin/efi/ubuntu/tgz-focal-20241118151351 Updated |
This section includes release notes for the patch Cluster release 17.2.6 that is introduced in the Container Cloud patch release 2.28.2 and is based on the previous Cluster releases of the 17.2.x series.
This patch Cluster release introduces MOSK 24.2.4 that is based on Mirantis Kubernetes Engine 3.7.16 with Kubernetes 1.27 and Mirantis Container Runtime 23.0.11.
For details on MOSK 24.2.4, see Release Notes 24.2.4.
For the list of CVE fixes delivered with this patch Cluster release, see 2.28.2
For details on patch release delivery, see Patch releases
This section lists the artifacts of components included in the Cluster release 17.2.6.
Note
The components that are newly added, updated, deprecated, or removed
as compared to the previous release version, are marked
with a corresponding superscript,
for example, lcm-ansible Updated.
Artifact |
Component |
Path |
|---|---|---|
Helm charts Updated |
local-volume-provisioner |
https://binary.mirantis.com/core/helm/local-volume-provisioner-1.40.29.tgz |
metallb |
||
Docker images |
ironic |
mirantis.azurecr.io/openstack/ironic:antelope-jammy-20240716113922 |
metallb-controller |
mirantis.azurecr.io/bm/metallb/controller:v0.14.5-a68c7101-amd64 |
|
metallb-speaker |
mirantis.azurecr.io/bm/metallb/speaker:v0.14.5-a68c7101-amd64 |
Artifact |
Component |
Path |
|---|---|---|
Helm chart Updated |
ceph-controller |
https://binary.mirantis.com/ceph/helm/ceph-operator-1.0.0-mcc-2.28.2-1.tgz |
Docker images |
ceph Updated |
mirantis.azurecr.io/mirantis/ceph:v18.2.4-8.cve |
ceph-controller Updated |
mirantis.azurecr.io/ceph/mcp/ceph-controller:2.28.2-0 |
|
cephcsi Updated |
mirantis.azurecr.io/mirantis/cephcsi:v3.9.0-22.cve |
|
cephcsi-registrar |
mirantis.azurecr.io/mirantis/cephcsi-registrar:v2.9.2-6.cve |
|
cephcsi-provisioner |
mirantis.azurecr.io/mirantis/cephcsi-provisioner:v3.6.2-6.cve |
|
cephcsi-snapshotter |
mirantis.azurecr.io/mirantis/cephcsi-snapshotter:v6.3.2-6.cve |
|
cephcsi-attacher |
mirantis.azurecr.io/mirantis/cephcsi-attacher:v4.4.2-6.cve |
|
cephcsi-resizer |
mirantis.azurecr.io/mirantis/cephcsi-resizer:v1.9.2-6.cve |
|
rook Updated |
mirantis.azurecr.io/ceph/rook:v1.13.5-23 |
|
snapshot-controller |
mirantis.azurecr.io/mirantis/snapshot-controller:v6.3.2-6.cve |
Artifact |
Component |
Path |
|---|---|---|
Helm charts Updated |
cinder-csi-plugin |
https://binary.mirantis.com/core/helm/cinder-csi-plugin-1.40.29.tgz |
client-certificate-controller |
https://binary.mirantis.com/core/helm/client-certificate-controller-1.40.29.tgz |
|
metrics-server |
https://binary.mirantis.com/core/helm/metrics-server-1.40.29.tgz |
|
openstack-cloud-controller-manager |
https://binary.mirantis.com/core/helm/openstack-cloud-controller-manager-1.40.29.tgz |
|
policy-controller |
https://binary.mirantis.com/core/helm/policy-controller-1.40.29.tgz |
|
Docker images |
cinder-csi-plugin |
mirantis.azurecr.io/lcm/kubernetes/cinder-csi-plugin:v1.27.2-22 |
client-certificate-controller Updated |
mirantis.azurecr.io/core/client-certificate-controller:1.40.29 |
|
csi-attacher |
mirantis.azurecr.io/lcm/k8scsi/csi-attacher:v4.2.0-7 |
|
csi-node-driver-registrar |
mirantis.azurecr.io/lcm/k8scsi/csi-node-driver-registrar:v2.7.0-7 |
|
csi-provisioner |
mirantis.azurecr.io/lcm/k8scsi/csi-provisioner:v3.4.1-7 |
|
csi-resizer |
mirantis.azurecr.io/lcm/k8scsi/csi-resizer:v1.7.0-7 |
|
csi-snapshotter |
mirantis.azurecr.io/lcm/k8scsi/csi-snapshotter:v6.2.1-mcc-6 |
|
livenessprobe |
mirantis.azurecr.io/lcm/k8scsi/livenessprobe:v2.9.0-7 |
|
metrics-server |
mirantis.azurecr.io/lcm/metrics-server-amd64:v0.6.3-9 |
|
openstack-cloud-controller-manager |
mirantis.azurecr.io/lcm/kubernetes/openstack-cloud-controller-manager:v1.27.2-22 |
|
policy-controller Updated |
mirantis.azurecr.io/core/policy-controller:1.40.29 |
Artifact |
Component |
Path |
|---|---|---|
Binaries |
lcm-ansible |
https://binary.mirantis.com/lcm/bin/lcm-ansible/v0.25.0-44-g561405b/lcm-ansible.tar.gz |
lcm-agent Updated |
||
Helm charts Updated |
helm-controller |
https://binary.mirantis.com/core/helm/helm-controller-1.40.29.tgz |
managed-lcm-api |
https://binary.mirantis.com/core/helm/managed-lcm-api-1.40.29.tgz |
|
Docker images Updated |
helm-controller |
mirantis.azurecr.io/core/lcm-controller:1.40.29 |
mcc-haproxy |
mirantis.azurecr.io/lcm/mcc-haproxy:v0.25.0-44-g561405b |
|
mcc-keepalived |
mirantis.azurecr.io/lcm/mcc-keepalived:v0.25.0-44-g561405b |
Artifact |
Component |
Path |
|---|---|---|
Helm charts |
alerta |
https://binary.mirantis.com/stacklight/helm/alerta-0.1.0-mcp-33.tgz |
alertmanager-webhook-servicenow |
https://binary.mirantis.com/stacklight/helm/alertmanager-webhook-servicenow-0.2.0-mcp-8.tgz |
|
cadvisor |
https://binary.mirantis.com/stacklight/helm/cadvisor-0.1.0-mcp-7.tgz |
|
elasticsearch-curator |
https://binary.mirantis.com/stacklight/helm/elasticsearch-curator-1.5.0-mcp-15.tgz |
|
elasticsearch-exporter |
https://binary.mirantis.com/stacklight/helm/elasticsearch-exporter-1.2.0-mcp-10.tgz |
|
fluentd-logs |
https://binary.mirantis.com/stacklight/helm/fluentd-logs-0.1.0-mcp-238.tgz |
|
grafana |
https://binary.mirantis.com/stacklight/helm/grafana-3.3.10-mcp-309.tgz |
|
iam-proxy |
||
metric-collector |
https://binary.mirantis.com/stacklight/helm/metric-collector-0.3.0-mcp-17.tgz |
|
metricbeat |
https://binary.mirantis.com/stacklight/helm/metricbeat-1.7.1-mcp-25.tgz |
|
opensearch |
https://binary.mirantis.com/stacklight/helm/opensearch-0.1.0-mcp-88.tgz |
|
opensearch-dashboards |
https://binary.mirantis.com/stacklight/helm/opensearch-dashboards-0.1.0-mcp-54.tgz |
|
patroni Updated |
https://binary.mirantis.com/stacklight/helm/patroni-0.15.1-mcp-61.tgz |
|
prometheus |
https://binary.mirantis.com/stacklight/helm/prometheus-8.11.4-mcp-258.tgz |
|
prometheus-blackbox-exporter |
https://binary.mirantis.com/stacklight/helm/prometheus-blackbox-exporter-0.3.0-mcp-19.tgz |
|
prometheus-es-exporter |
https://binary.mirantis.com/stacklight/helm/prometheus-es-exporter-1.0.0-mcp-18.tgz |
|
prometheus-msteams |
https://binary.mirantis.com/stacklight/helm/prometheus-msteams-0.1.0-mcp-12.tgz |
|
sf-notifier |
https://binary.mirantis.com/stacklight/helm/sf-notifier-0.2.0-mcp-10.tgz |
|
sf-reporter |
https://binary.mirantis.com/stacklight/helm/sf-reporter-0.2.0-mcp-10.tgz |
|
stacklight Updated |
https://binary.mirantis.com/stacklight/helm/stacklight-0.15.13.tgz |
|
telegraf-ds |
https://binary.mirantis.com/stacklight/helm/telegraf-ds-1.1.5-mcp-42.tgz |
|
telegraf-s |
https://binary.mirantis.com/stacklight/helm/telegraf-s-1.1.5-mcp-42.tgz |
|
telemeter-client |
https://binary.mirantis.com/stacklight/helm/telemeter-client-0.2.0-mcp-14.tgz |
|
telemeter-server |
https://binary.mirantis.com/stacklight/helm/telemeter-server-0.2.0-mcp-14.tgz |
|
Docker images |
alerta-web Updated |
mirantis.azurecr.io/stacklight/alerta-web:9-20241028023014 |
alertmanager Updated |
mirantis.azurecr.io/stacklight/alertmanager:v0-20241028023014 |
|
alertmanager-webhook-servicenow |
mirantis.azurecr.io/stacklight/alertmanager-webhook-servicenow:v0.1-20241022074315 |
|
alpine-utils Updated |
mirantis.azurecr.io/stacklight/alpine-utils:1-20241028023016 |
|
blackbox-exporter |
mirantis.azurecr.io/stacklight/blackbox-exporter:0-20240408080237 |
|
cadvisor Updated |
mirantis.azurecr.io/stacklight/cadvisor:v0.47-20241028023014 |
|
configmap-reload |
mirantis.azurecr.io/stacklight/configmap-reload:v0.8.0 |
|
curator |
mirantis.azurecr.io/stacklight/curator:5.7.6-20230404082402 |
|
elasticsearch-exporter |
mirantis.azurecr.io/stacklight/elasticsearch-exporter:v1.5.0 |
|
fluentd Updated |
mirantis.azurecr.io/stacklight/fluentd:1.15-20241028023014 |
|
grafana |
mirantis.azurecr.io/stacklight/grafana:10.3.1 |
|
k8s-sidecar |
mirantis.azurecr.io/stacklight/k8s-sidecar:1-20241021111512 |
|
kube-state-metrics |
mirantis.azurecr.io/stacklight/kube-state-metrics:v2.10.1 |
|
kubectl |
mirantis.azurecr.io/stacklight/kubectl:1.27-20240925023021 |
|
metric-collector Updated |
mirantis.azurecr.io/stacklight/metric-collector:v0.1-20241028023016 |
|
metricbeat Updated |
mirantis.azurecr.io/stacklight/metricbeat:7.12.1-20241028023014 |
|
node-exporter |
mirantis.azurecr.io/stacklight/node-exporter:v1.7.0 |
|
oauth2-proxy Updated |
mirantis.azurecr.io/iam/oauth2-proxy:v7.1.3-13 |
|
opensearch Updated |
mirantis.azurecr.io/stacklight/opensearch:2-20241028023015 |
|
opensearch-dashboards Updated |
mirantis.azurecr.io/stacklight/opensearch-dashboards:2-20241028023015 |
|
pgbouncer |
mirantis.azurecr.io/stacklight/pgbouncer:1-20240925023021 |
|
prometheus |
mirantis.azurecr.io/stacklight/prometheus:v2.48.0 |
|
prometheus-es-exporter Updated |
mirantis.azurecr.io/stacklight/prometheus-es-exporter:v0.14-20241028023016 |
|
prometheus-msteams Updated |
mirantis.azurecr.io/stacklight/prometheus-msteams:v1.5-20241028023015 |
|
prometheus-patroni-exporter Updated |
mirantis.azurecr.io/stacklight/prometheus-patroni-exporter:0.0.1-20241028023016 |
|
prometheus-postgres-exporter |
mirantis.azurecr.io/stacklight/prometheus-postgres-exporter:v0.15.0 |
|
prometheus-relay |
mirantis.azurecr.io/stacklight/prometheus-relay:v0.4-20240925023019 |
|
psql-client Deprecated |
mirantis.azurecr.io/scale/psql-client:v13-20241029083652 |
|
sf-notifier Updated |
mirantis.azurecr.io/stacklight/sf-notifier:v0.4-20241028023015 |
|
sf-reporter |
mirantis.azurecr.io/stacklight/sf-reporter:v0.1-20241021111607 |
|
spilo Updated |
mirantis.azurecr.io/stacklight/spilo:13-2.1p9-20241028023014 |
|
telegraf |
mirantis.azurecr.io/stacklight/telegraf:v1.9.1-20241028023014 Updated |
|
mirantis.azurecr.io/stacklight/telegraf:1-20241018175310 |
||
telemeter Updated |
mirantis.azurecr.io/stacklight/telemeter:4.4-20241028023014 |
|
telemeter-token-auth Updated |
mirantis.azurecr.io/stacklight/telemeter-token-auth:v0.1-20241028023014 |
Artifact |
Component |
Path |
|---|---|---|
Configuration management |
Ansible |
|
Debian repositories |
System packages |
|
https://mirror.mirantis.com/kaas/ubuntu-2024-10-28-012906/ Updated |
||
https://mirror.mirantis.com/kaas/ubuntu-2024-10-28-012906.target.txt Updated |
||
MCR repositories |
MCR |
https://repos.mirantis.com/ubuntu/dists/focal/pool/stable-23.0/ |
Target ubuntu system |
Ubuntu |
https://binary.mirantis.com/bm/bin/efi/ubuntu/tgz-focal-20241028153631 Updated |
This section includes release notes for the patch Cluster release 17.2.5 that is introduced in the Container Cloud patch release 2.28.1 and is based on the previous Cluster releases of the 17.2.x series.
This patch Cluster release introduces MOSK 24.2.3 that is based on Mirantis Kubernetes Engine 3.7.15 with Kubernetes 1.27 and Mirantis Container Runtime 23.0.11.
For details on MOSK 24.2.3, see Release Notes 24.2.3.
For the list of CVE fixes delivered with this patch Cluster release, see 2.28.1
For details on patch release delivery, see Patch releases
This section lists the artifacts of components included in the Cluster release 17.2.5.
Note
The components that are newly added, updated, deprecated, or removed
as compared to the previous release version, are marked
with a corresponding superscript,
for example, lcm-ansible Updated.
Artifact |
Component |
Path |
|---|---|---|
Helm charts Updated |
local-volume-provisioner |
https://binary.mirantis.com/core/helm/local-volume-provisioner-1.40.28.tgz |
metallb |
||
Docker images |
ironic |
mirantis.azurecr.io/openstack/ironic:antelope-jammy-20240716113922 |
metallb-controller Updated |
mirantis.azurecr.io/bm/metallb/controller:v0.14.5-a68c7101-amd64 |
|
metallb-speaker Updated |
mirantis.azurecr.io/bm/metallb/speaker:v0.14.5-a68c7101-amd64 |
Artifact |
Component |
Path |
|---|---|---|
Helm chart Updated |
ceph-controller |
https://binary.mirantis.com/ceph/helm/ceph-operator-1.0.0-mcc-2.28.1-5.tgz |
Docker images Updated |
ceph |
mirantis.azurecr.io/mirantis/ceph:v18.2.4-7.cve |
ceph-controller |
mirantis.azurecr.io/ceph/mcp/ceph-controller:2.28.1-4 |
|
cephcsi |
mirantis.azurecr.io/mirantis/cephcsi:v3.9.0-21.cve |
|
cephcsi-registrar |
mirantis.azurecr.io/mirantis/cephcsi-registrar:v2.9.2-6.cve |
|
cephcsi-provisioner |
mirantis.azurecr.io/mirantis/cephcsi-provisioner:v3.6.2-6.cve |
|
cephcsi-snapshotter |
mirantis.azurecr.io/mirantis/cephcsi-snapshotter:v6.3.2-6.cve |
|
cephcsi-attacher |
mirantis.azurecr.io/mirantis/cephcsi-attacher:v4.4.2-6.cve |
|
cephcsi-resizer |
mirantis.azurecr.io/mirantis/cephcsi-resizer:v1.9.2-6.cve |
|
rook |
mirantis.azurecr.io/ceph/rook:v1.13.5-22 |
|
snapshot-controller |
mirantis.azurecr.io/mirantis/snapshot-controller:v6.3.2-6.cve |
Artifact |
Component |
Path |
|---|---|---|
Helm charts Updated |
cinder-csi-plugin |
https://binary.mirantis.com/core/helm/cinder-csi-plugin-1.40.28.tgz |
client-certificate-controller |
https://binary.mirantis.com/core/helm/client-certificate-controller-1.40.28.tgz |
|
metrics-server |
https://binary.mirantis.com/core/helm/metrics-server-1.40.28.tgz |
|
openstack-cloud-controller-manager |
https://binary.mirantis.com/core/helm/openstack-cloud-controller-manager-1.40.28.tgz |
|
policy-controller |
https://binary.mirantis.com/core/helm/policy-controller-1.40.28.tgz |
|
Docker images Updated |
cinder-csi-plugin |
mirantis.azurecr.io/lcm/kubernetes/cinder-csi-plugin:v1.27.2-22 |
client-certificate-controller |
mirantis.azurecr.io/core/client-certificate-controller:1.40.28 |
|
csi-attacher |
mirantis.azurecr.io/lcm/k8scsi/csi-attacher:v4.2.0-7 |
|
csi-node-driver-registrar |
mirantis.azurecr.io/lcm/k8scsi/csi-node-driver-registrar:v2.7.0-7 |
|
csi-provisioner |
mirantis.azurecr.io/lcm/k8scsi/csi-provisioner:v3.4.1-7 |
|
csi-resizer |
mirantis.azurecr.io/lcm/k8scsi/csi-resizer:v1.7.0-7 |
|
csi-snapshotter |
mirantis.azurecr.io/lcm/k8scsi/csi-snapshotter:v6.2.1-mcc-6 |
|
livenessprobe |
mirantis.azurecr.io/lcm/k8scsi/livenessprobe:v2.9.0-7 |
|
metrics-server |
mirantis.azurecr.io/lcm/metrics-server-amd64:v0.6.3-9 |
|
openstack-cloud-controller-manager |
mirantis.azurecr.io/lcm/kubernetes/openstack-cloud-controller-manager:v1.27.2-22 |
|
policy-controller |
mirantis.azurecr.io/core/policy-controller:1.40.28 |
Artifact |
Component |
Path |
|---|---|---|
Binaries |
lcm-ansible |
https://binary.mirantis.com/lcm/bin/lcm-ansible/v0.25.0-44-g561405b/lcm-ansible.tar.gz |
lcm-agent Updated |
||
Helm charts Updated |
helm-controller |
https://binary.mirantis.com/core/helm/helm-controller-1.40.28.tgz |
managed-lcm-api |
https://binary.mirantis.com/core/helm/managed-lcm-api-1.40.28.tgz |
|
Docker images Updated |
helm-controller |
mirantis.azurecr.io/core/lcm-controller:1.40.28 |
mcc-haproxy |
mirantis.azurecr.io/lcm/mcc-haproxy:v0.25.0-44-g561405b |
|
mcc-keepalived |
mirantis.azurecr.io/lcm/mcc-keepalived:v0.25.0-44-g561405b |
Artifact |
Component |
Path |
|---|---|---|
Helm charts |
alerta |
https://binary.mirantis.com/stacklight/helm/alerta-0.1.0-mcp-33.tgz |
alertmanager-webhook-servicenow |
https://binary.mirantis.com/stacklight/helm/alertmanager-webhook-servicenow-0.2.0-mcp-8.tgz |
|
cadvisor |
https://binary.mirantis.com/stacklight/helm/cadvisor-0.1.0-mcp-7.tgz |
|
elasticsearch-curator |
https://binary.mirantis.com/stacklight/helm/elasticsearch-curator-1.5.0-mcp-15.tgz |
|
elasticsearch-exporter |
https://binary.mirantis.com/stacklight/helm/elasticsearch-exporter-1.2.0-mcp-10.tgz |
|
fluentd-logs |
https://binary.mirantis.com/stacklight/helm/fluentd-logs-0.1.0-mcp-238.tgz |
|
grafana Updated |
https://binary.mirantis.com/stacklight/helm/grafana-3.3.10-mcp-309.tgz |
|
iam-proxy |
||
metric-collector |
https://binary.mirantis.com/stacklight/helm/metric-collector-0.3.0-mcp-17.tgz |
|
metricbeat |
https://binary.mirantis.com/stacklight/helm/metricbeat-1.7.1-mcp-25.tgz |
|
opensearch |
https://binary.mirantis.com/stacklight/helm/opensearch-0.1.0-mcp-88.tgz |
|
opensearch-dashboards |
https://binary.mirantis.com/stacklight/helm/opensearch-dashboards-0.1.0-mcp-54.tgz |
|
patroni |
https://binary.mirantis.com/stacklight/helm/patroni-0.15.1-mcp-59.tgz |
|
prometheus |
https://binary.mirantis.com/stacklight/helm/prometheus-8.11.4-mcp-258.tgz |
|
prometheus-blackbox-exporter |
https://binary.mirantis.com/stacklight/helm/prometheus-blackbox-exporter-0.3.0-mcp-19.tgz |
|
prometheus-es-exporter |
https://binary.mirantis.com/stacklight/helm/prometheus-es-exporter-1.0.0-mcp-18.tgz |
|
prometheus-msteams |
https://binary.mirantis.com/stacklight/helm/prometheus-msteams-0.1.0-mcp-12.tgz |
|
sf-notifier |
https://binary.mirantis.com/stacklight/helm/sf-notifier-0.2.0-mcp-10.tgz |
|
sf-reporter |
https://binary.mirantis.com/stacklight/helm/sf-reporter-0.2.0-mcp-10.tgz |
|
stacklight Updated |
https://binary.mirantis.com/stacklight/helm/stacklight-0.15.12.tgz |
|
telegraf-ds |
https://binary.mirantis.com/stacklight/helm/telegraf-ds-1.1.5-mcp-42.tgz |
|
telegraf-s |
https://binary.mirantis.com/stacklight/helm/telegraf-s-1.1.5-mcp-42.tgz |
|
telemeter-client |
https://binary.mirantis.com/stacklight/helm/telemeter-client-0.2.0-mcp-14.tgz |
|
telemeter-server |
https://binary.mirantis.com/stacklight/helm/telemeter-server-0.2.0-mcp-14.tgz |
|
Docker images |
alerta-web Updated |
mirantis.azurecr.io/stacklight/alerta-web:9-20241021023014 |
alertmanager Updated |
mirantis.azurecr.io/stacklight/alertmanager:v0-20241021023014 |
|
alertmanager-webhook-servicenow Updated |
mirantis.azurecr.io/stacklight/alertmanager-webhook-servicenow:v0.1-20241022074315 |
|
alpine-utils Updated |
mirantis.azurecr.io/stacklight/alpine-utils:1-20241021023015 |
|
blackbox-exporter |
mirantis.azurecr.io/stacklight/blackbox-exporter:0-20240408080237 |
|
cadvisor Updated |
mirantis.azurecr.io/stacklight/cadvisor:v0.47-20241021023014 |
|
configmap-reload |
mirantis.azurecr.io/stacklight/configmap-reload:v0.8.0 |
|
curator |
mirantis.azurecr.io/stacklight/curator:5.7.6-20230404082402 |
|
elasticsearch-exporter |
mirantis.azurecr.io/stacklight/elasticsearch-exporter:v1.5.0 |
|
fluentd Updated |
mirantis.azurecr.io/stacklight/fluentd:1.15-20241022103051 |
|
grafana |
mirantis.azurecr.io/stacklight/grafana:10.3.1 |
|
k8s-sidecar Updated |
mirantis.azurecr.io/stacklight/k8s-sidecar:1-20241021111512 |
|
kube-state-metrics |
mirantis.azurecr.io/stacklight/kube-state-metrics:v2.10.1 |
|
kubectl Updated |
mirantis.azurecr.io/stacklight/kubectl:1.27-20240925023021 |
|
metric-collector Updated |
mirantis.azurecr.io/stacklight/metric-collector:v0.1-20241021023015 |
|
metricbeat Updated |
mirantis.azurecr.io/stacklight/metricbeat:7.12.1-20241021023014 |
|
node-exporter |
mirantis.azurecr.io/stacklight/node-exporter:v1.7.0 |
|
oauth2-proxy Updated |
mirantis.azurecr.io/iam/oauth2-proxy:v7.1.3-12 |
|
opensearch Updated |
mirantis.azurecr.io/stacklight/opensearch:2-20241021023014 |
|
opensearch-dashboards Updated |
mirantis.azurecr.io/stacklight/opensearch-dashboards:2-20241021023014 |
|
pgbouncer Updated |
mirantis.azurecr.io/stacklight/pgbouncer:1-20240925023021 |
|
prometheus |
mirantis.azurecr.io/stacklight/prometheus:v2.48.0 |
|
prometheus-es-exporter Updated |
mirantis.azurecr.io/stacklight/prometheus-es-exporter:v0.14-20241021023015 |
|
prometheus-msteams Updated |
mirantis.azurecr.io/stacklight/prometheus-msteams:v1.5-20241021023014 |
|
prometheus-patroni-exporter Updated |
mirantis.azurecr.io/stacklight/prometheus-patroni-exporter:0.0.1-20241021023015 |
|
prometheus-postgres-exporter |
mirantis.azurecr.io/stacklight/prometheus-postgres-exporter:v0.15.0 |
|
prometheus-relay Updated |
mirantis.azurecr.io/stacklight/prometheus-relay:v0.4-20240925023019 |
|
psql-client Updated |
mirantis.azurecr.io/scale/psql-client:v13-20240924065857 |
|
sf-notifier Updated |
mirantis.azurecr.io/stacklight/sf-notifier:v0.4-20241021023015 |
|
sf-reporter Updated |
mirantis.azurecr.io/stacklight/sf-reporter:v0.1-20241021111607 |
|
spilo Updated |
mirantis.azurecr.io/stacklight/spilo:13-2.1p9-20241021023014 |
|
telegraf |
mirantis.azurecr.io/stacklight/telegraf:v1.9.1-20241021023014 Updated |
|
mirantis.azurecr.io/stacklight/telegraf:1-20241018175310 Updated |
||
telemeter Updated |
mirantis.azurecr.io/stacklight/telemeter:4.4-20241021023014 |
|
telemeter-token-auth Updated |
mirantis.azurecr.io/stacklight/telemeter-token-auth:v0.1-20241021023014 |
Artifact |
Component |
Path |
|---|---|---|
Configuration management |
Ansible |
|
Debian repositories |
System packages |
|
https://mirror.mirantis.com/kaas/ubuntu-2024-10-14-013948/ Updated |
||
https://mirror.mirantis.com/kaas/ubuntu-2024-10-14-013948.target.txt Updated |
||
MCR repositories |
MCR |
https://repos.mirantis.com/ubuntu/dists/focal/pool/stable-23.0/ |
Target ubuntu system |
Ubuntu |
https://binary.mirantis.com/bm/bin/efi/ubuntu/tgz-focal-20241014155041 Updated |
This section includes release notes for the patch Cluster release 17.2.4 that is introduced in the Container Cloud patch release 2.27.4 and is based on the previous Cluster releases of the 17.2.x series.
This patch Cluster release introduces MOSK 24.2.2 that is based on Mirantis Kubernetes Engine 3.7.12 with Kubernetes 1.27 and Mirantis Container Runtime 23.0.11.
For details on MOSK 24.2.2, see Release Notes 24.2.2.
For the list of CVE fixes delivered with this patch Cluster release, see 2.27.4
For details on patch release delivery, see Patch releases
This section lists the artifacts of components included in the Cluster release 17.2.4.
Note
The components that are newly added, updated, deprecated, or removed
as compared to the previous release version, are marked
with a corresponding superscript,
for example, lcm-ansible Updated.
Artifact |
Component |
Path |
|---|---|---|
Helm chart Updated |
ceph-controller |
https://binary.mirantis.com/ceph/helm/ceph-operator-1.0.0-mcc-2.27.3-10.tgz |
Docker images Updated |
ceph |
mirantis.azurecr.io/mirantis/ceph:v18.2.4-4.cve |
ceph-controller |
mirantis.azurecr.io/ceph/mcp/ceph-controller:2.27.3-9 |
|
cephcsi |
mirantis.azurecr.io/mirantis/cephcsi:v3.9.0-18.cve |
|
cephcsi-registrar |
mirantis.azurecr.io/mirantis/cephcsi-registrar:v2.9.2-5.cve |
|
cephcsi-provisioner |
mirantis.azurecr.io/mirantis/cephcsi-provisioner:v3.6.2-5.cve |
|
cephcsi-snapshotter |
mirantis.azurecr.io/mirantis/cephcsi-snapshotter:v6.3.2-5.cve |
|
cephcsi-attacher |
mirantis.azurecr.io/mirantis/cephcsi-attacher:v4.4.2-5.cve |
|
cephcsi-resizer |
mirantis.azurecr.io/mirantis/cephcsi-resizer:v1.9.2-5.cve |
|
rook |
mirantis.azurecr.io/ceph/rook:v1.13.5-19 |
|
snapshot-controller |
mirantis.azurecr.io/mirantis/snapshot-controller:v6.3.2-5.cve |
Artifact |
Component |
Path |
|---|---|---|
Helm charts Updated |
cinder-csi-plugin |
https://binary.mirantis.com/core/helm/cinder-csi-plugin-1.40.23.tgz |
client-certificate-controller |
https://binary.mirantis.com/core/helm/client-certificate-controller-1.40.23.tgz |
|
local-volume-provisioner |
https://binary.mirantis.com/core/helm/local-volume-provisioner-1.40.23.tgz |
|
metrics-server |
https://binary.mirantis.com/core/helm/metrics-server-1.40.23.tgz |
|
openstack-cloud-controller-manager |
https://binary.mirantis.com/core/helm/openstack-cloud-controller-manager-1.40.23.tgz |
|
policy-controller |
https://binary.mirantis.com/core/helm/policy-controller-1.40.23.tgz |
|
Docker images |
cinder-csi-plugin |
mirantis.azurecr.io/lcm/kubernetes/cinder-csi-plugin:v1.27.2-18 |
client-certificate-controller Updated |
mirantis.azurecr.io/core/client-certificate-controller:1.40.23 |
|
csi-attacher Updated |
mirantis.azurecr.io/lcm/k8scsi/csi-attacher:v4.2.0-6 |
|
csi-node-driver-registrar Updated |
mirantis.azurecr.io/lcm/k8scsi/csi-node-driver-registrar:v2.7.0-6 |
|
csi-provisioner Updated |
mirantis.azurecr.io/lcm/k8scsi/csi-provisioner:v3.4.1-6 |
|
csi-resizer Updated |
mirantis.azurecr.io/lcm/k8scsi/csi-resizer:v1.7.0-6 |
|
csi-snapshotter Updated |
mirantis.azurecr.io/lcm/k8scsi/csi-snapshotter:v6.2.1-mcc-5 |
|
livenessprobe Updated |
mirantis.azurecr.io/lcm/k8scsi/livenessprobe:v2.9.0-6 |
|
metrics-server Updated |
mirantis.azurecr.io/lcm/metrics-server-amd64:v0.6.3-8 |
|
openstack-cloud-controller-manager Updated |
mirantis.azurecr.io/lcm/kubernetes/openstack-cloud-controller-manager:v1.27.2-18 |
|
policy-controller Updated |
mirantis.azurecr.io/core/policy-controller:1.40.23 |
Artifact |
Component |
Path |
|---|---|---|
Binaries |
lcm-ansible |
https://binary.mirantis.com/lcm/bin/lcm-ansible/v0.25.0-42-g8710cbe/lcm-ansible.tar.gz |
lcm-agent Updated |
||
Helm charts Updated |
helm-controller |
https://binary.mirantis.com/core/helm/helm-controller-1.40.23.tgz |
managed-lcm-api |
https://binary.mirantis.com/core/helm/managed-lcm-api-1.40.23.tgz |
|
Docker images Updated |
helm-controller |
mirantis.azurecr.io/core/lcm-controller:1.40.23 |
Artifact |
Component |
Path |
|---|---|---|
Helm charts |
alerta |
https://binary.mirantis.com/stacklight/helm/alerta-0.1.0-mcp-33.tgz |
alertmanager-webhook-servicenow |
https://binary.mirantis.com/stacklight/helm/alertmanager-webhook-servicenow-0.2.0-mcp-8.tgz |
|
cadvisor |
https://binary.mirantis.com/stacklight/helm/cadvisor-0.1.0-mcp-7.tgz |
|
elasticsearch-curator |
https://binary.mirantis.com/stacklight/helm/elasticsearch-curator-1.5.0-mcp-15.tgz |
|
elasticsearch-exporter |
https://binary.mirantis.com/stacklight/helm/elasticsearch-exporter-1.2.0-mcp-10.tgz |
|
fluentd-logs |
https://binary.mirantis.com/stacklight/helm/fluentd-logs-0.1.0-mcp-238.tgz |
|
grafana |
https://binary.mirantis.com/stacklight/helm/grafana-3.3.10-mcp-300.tgz |
|
iam-proxy |
||
metric-collector |
https://binary.mirantis.com/stacklight/helm/metric-collector-0.3.0-mcp-17.tgz |
|
metricbeat |
https://binary.mirantis.com/stacklight/helm/metricbeat-1.7.1-mcp-25.tgz |
|
opensearch |
https://binary.mirantis.com/stacklight/helm/opensearch-0.1.0-mcp-88.tgz |
|
opensearch-dashboards |
https://binary.mirantis.com/stacklight/helm/opensearch-dashboards-0.1.0-mcp-54.tgz |
|
patroni |
https://binary.mirantis.com/stacklight/helm/patroni-0.15.1-mcp-59.tgz |
|
prometheus |
https://binary.mirantis.com/stacklight/helm/prometheus-8.11.4-mcp-258.tgz |
|
prometheus-blackbox-exporter |
https://binary.mirantis.com/stacklight/helm/prometheus-blackbox-exporter-0.3.0-mcp-19.tgz |
|
prometheus-es-exporter |
https://binary.mirantis.com/stacklight/helm/prometheus-es-exporter-1.0.0-mcp-18.tgz |
|
prometheus-msteams |
https://binary.mirantis.com/stacklight/helm/prometheus-msteams-0.1.0-mcp-12.tgz |
|
sf-notifier |
https://binary.mirantis.com/stacklight/helm/sf-notifier-0.2.0-mcp-10.tgz |
|
sf-reporter |
https://binary.mirantis.com/stacklight/helm/sf-reporter-0.2.0-mcp-10.tgz |
|
stacklight Updated |
https://binary.mirantis.com/stacklight/helm/stacklight-0.15.9.tgz |
|
telegraf-ds |
https://binary.mirantis.com/stacklight/helm/telegraf-ds-1.1.5-mcp-42.tgz |
|
telegraf-s |
https://binary.mirantis.com/stacklight/helm/telegraf-s-1.1.5-mcp-42.tgz |
|
telemeter-client |
https://binary.mirantis.com/stacklight/helm/telemeter-client-0.2.0-mcp-14.tgz |
|
telemeter-server |
https://binary.mirantis.com/stacklight/helm/telemeter-server-0.2.0-mcp-14.tgz |
|
Docker images |
alerta-web Updated |
mirantis.azurecr.io/stacklight/alerta-web:9-20240821023009 |
alertmanager Updated |
mirantis.azurecr.io/stacklight/alertmanager:v0-20240821023016 |
|
alertmanager-webhook-servicenow |
mirantis.azurecr.io/stacklight/alertmanager-webhook-servicenow:v0.1-20240318145925 |
|
alpine-utils Updated |
mirantis.azurecr.io/stacklight/alpine-utils:1-20240821023017 |
|
blackbox-exporter |
mirantis.azurecr.io/stacklight/blackbox-exporter:0-20240408080237 |
|
cadvisor Updated |
mirantis.azurecr.io/stacklight/cadvisor:v0.47-20240821023015 |
|
configmap-reload |
mirantis.azurecr.io/stacklight/configmap-reload:v0.8.0 |
|
curator |
mirantis.azurecr.io/stacklight/curator:5.7.6-20230404082402 |
|
elasticsearch-exporter |
mirantis.azurecr.io/stacklight/elasticsearch-exporter:v1.5.0 |
|
fluentd Updated |
mirantis.azurecr.io/stacklight/fluentd:1.15-20240821023009 |
|
grafana |
mirantis.azurecr.io/stacklight/grafana:10.3.1 |
|
k8s-sidecar Updated |
mirantis.azurecr.io/stacklight/k8s-sidecar:1-20240821023018 |
|
kube-state-metrics |
mirantis.azurecr.io/stacklight/kube-state-metrics:v2.10.1 |
|
kubectl Updated |
mirantis.azurecr.io/stacklight/kubectl:1.27-20240821023018 |
|
metric-collector Updated |
mirantis.azurecr.io/stacklight/metric-collector:v0.1-20240821023015 |
|
metricbeat |
mirantis.azurecr.io/stacklight/metricbeat:7.12.1-20240626023010 |
|
node-exporter |
mirantis.azurecr.io/stacklight/node-exporter:v1.7.0 |
|
oauth2-proxy Updated |
mirantis.azurecr.io/iam/oauth2-proxy:v7.1.3-10 |
|
opensearch Updated |
mirantis.azurecr.io/stacklight/opensearch:2-20240821023015 |
|
opensearch-dashboards Updated |
mirantis.azurecr.io/stacklight/opensearch-dashboards:2-20240821023010 |
|
pgbouncer Updated |
mirantis.azurecr.io/stacklight/pgbouncer:1-20240821023018 |
|
prometheus |
mirantis.azurecr.io/stacklight/prometheus:v2.48.0 |
|
prometheus-es-exporter Updated |
mirantis.azurecr.io/stacklight/prometheus-es-exporter:v0.14.0-20240821023016 |
|
prometheus-msteams |
mirantis.azurecr.io/stacklight/prometheus-msteams:v1.5-20240408080322 |
|
prometheus-patroni-exporter Updated |
mirantis.azurecr.io/stacklight/prometheus-patroni-exporter:0.0.1-20240821023016 |
|
prometheus-postgres-exporter |
mirantis.azurecr.io/stacklight/prometheus-postgres-exporter:v0.15.0 |
|
prometheus-relay Updated |
mirantis.azurecr.io/stacklight/prometheus-relay:v0.4-20240821023015 |
|
psql-client |
mirantis.azurecr.io/scale/psql-client:v13-20240701095027 |
|
sf-notifier Updated |
mirantis.azurecr.io/stacklight/sf-notifier:v0.4-20240821023015 |
|
sf-reporter |
mirantis.azurecr.io/stacklight/sf-reporter:v0.1-20240318145903 |
|
spilo Updated |
mirantis.azurecr.io/stacklight/spilo:13-2.1p9-20240822083023 |
|
telegraf |
mirantis.azurecr.io/stacklight/telegraf:v1.9.1-20240821023009 Updated |
|
mirantis.azurecr.io/stacklight/telegraf:1-20240426131156 |
||
telemeter Updated |
mirantis.azurecr.io/stacklight/telemeter:4.4-20240821023015 |
|
telemeter-token-auth Updated |
mirantis.azurecr.io/stacklight/telemeter-token-auth:v0.1-20240821023021 |
Artifact |
Component |
Path |
|---|---|---|
Configuration management |
Ansible |
|
Debian repositories |
System packages |
|
https://mirror.mirantis.com/kaas/ubuntu-2024-08-21-014714/ Updated |
||
https://mirror.mirantis.com/kaas/ubuntu-2024-08-21-014714.target.txt Updated |
||
MCR repositories |
MCR |
https://repos.mirantis.com/ubuntu/dists/focal/pool/stable-23.0/ |
Target ubuntu system |
Ubuntu |
https://binary.mirantis.com/bm/bin/efi/ubuntu/tgz-focal-20240821124609 Updated |
This section includes release notes for the patch Cluster release 17.2.3 that is introduced in the Container Cloud patch release 2.27.3 and is based on the Cluster releases 17.2.0 and 16.2.3.
This patch Cluster release introduces MOSK 24.2.1 that is based on Mirantis Kubernetes Engine 3.7.12 with Kubernetes 1.27 and Mirantis Container Runtime 23.0.11.
For details on MOSK 24.2.1, see Release Notes 24.2.1.
For the list of CVE fixes delivered with this patch Cluster release, see 2.27.3
For details on patch release delivery, see Patch releases
This section lists the artifacts of components included in the Cluster release 17.2.3.
Note
The components that are newly added, updated, deprecated, or removed
as compared to the previous release version, are marked
with a corresponding superscript,
for example, lcm-ansible Updated.
Artifact |
Component |
Path |
|---|---|---|
Helm chart Updated |
ceph-controller |
https://binary.mirantis.com/ceph/helm/ceph-operator-1.0.0-mcc-2.27.3-8.tgz |
Docker images Updated |
ceph |
mirantis.azurecr.io/mirantis/ceph:v18.2.4-3.cve |
ceph-controller |
mirantis.azurecr.io/ceph/mcp/ceph-controller:2.27.3-7 |
|
cephcsi |
mirantis.azurecr.io/mirantis/cephcsi:v3.9.0-17.release |
|
cephcsi-registrar |
mirantis.azurecr.io/mirantis/cephcsi-registrar:v2.9.2-5.release |
|
cephcsi-provisioner |
mirantis.azurecr.io/mirantis/cephcsi-provisioner:v3.6.2-5.release |
|
cephcsi-snapshotter |
mirantis.azurecr.io/mirantis/cephcsi-snapshotter:v6.3.2-5.release |
|
cephcsi-attacher |
mirantis.azurecr.io/mirantis/cephcsi-attacher:v4.4.2-5.release |
|
cephcsi-resizer |
mirantis.azurecr.io/mirantis/cephcsi-resizer:v1.9.2-5.release |
|
rook |
mirantis.azurecr.io/ceph/rook:v1.13.5-18 |
|
snapshot-controller |
mirantis.azurecr.io/mirantis/snapshot-controller:v6.3.2-5.cve |
Artifact |
Component |
Path |
|---|---|---|
Helm charts Updated |
cinder-csi-plugin |
https://binary.mirantis.com/core/helm/cinder-csi-plugin-1.40.21.tgz |
client-certificate-controller |
https://binary.mirantis.com/core/helm/client-certificate-controller-1.40.21.tgz |
|
local-volume-provisioner |
https://binary.mirantis.com/core/helm/local-volume-provisioner-1.40.21.tgz |
|
metrics-server |
https://binary.mirantis.com/core/helm/metrics-server-1.40.21.tgz |
|
openstack-cloud-controller-manager |
https://binary.mirantis.com/core/helm/openstack-cloud-controller-manager-1.40.21.tgz |
|
policy-controller |
https://binary.mirantis.com/core/helm/policy-controller-1.40.21.tgz |
|
Docker images |
cinder-csi-plugin Updated |
mirantis.azurecr.io/lcm/kubernetes/cinder-csi-plugin:v1.27.2-18 |
client-certificate-controller Updated |
mirantis.azurecr.io/core/client-certificate-controller:1.40.21 |
|
csi-attacher |
mirantis.azurecr.io/lcm/k8scsi/csi-attacher:v4.2.0-5 |
|
csi-node-driver-registrar |
mirantis.azurecr.io/lcm/k8scsi/csi-node-driver-registrar:v2.7.0-5 |
|
csi-provisioner |
mirantis.azurecr.io/lcm/k8scsi/csi-provisioner:v3.4.1-5 |
|
csi-resizer |
mirantis.azurecr.io/lcm/k8scsi/csi-resizer:v1.7.0-5 |
|
csi-snapshotter |
mirantis.azurecr.io/lcm/k8scsi/csi-snapshotter:v6.2.1-mcc-4 |
|
livenessprobe |
mirantis.azurecr.io/lcm/k8scsi/livenessprobe:v2.9.0-5 |
|
metrics-server |
mirantis.azurecr.io/lcm/metrics-server-amd64:v0.6.3-7 |
|
openstack-cloud-controller-manager Updated |
mirantis.azurecr.io/lcm/kubernetes/openstack-cloud-controller-manager:v1.27.2-18 |
|
policy-controller Updated |
mirantis.azurecr.io/core/policy-controller:1.40.21 |
Artifact |
Component |
Path |
|---|---|---|
Binaries Updated |
lcm-ansible |
https://binary.mirantis.com/lcm/bin/lcm-ansible/v0.25.0-42-g8710cbe/lcm-ansible.tar.gz |
lcm-agent |
||
Helm charts Updated |
helm-controller |
https://binary.mirantis.com/core/helm/helm-controller-1.40.21.tgz |
managed-lcm-api |
https://binary.mirantis.com/core/helm/managed-lcm-api-1.40.21.tgz |
|
Docker images Updated |
helm-controller |
mirantis.azurecr.io/core/lcm-controller:1.40.21 |
Artifact |
Component |
Path |
|---|---|---|
Helm charts |
alerta |
https://binary.mirantis.com/stacklight/helm/alerta-0.1.0-mcp-33.tgz |
alertmanager-webhook-servicenow |
https://binary.mirantis.com/stacklight/helm/alertmanager-webhook-servicenow-0.2.0-mcp-8.tgz |
|
cadvisor |
https://binary.mirantis.com/stacklight/helm/cadvisor-0.1.0-mcp-7.tgz |
|
elasticsearch-curator |
https://binary.mirantis.com/stacklight/helm/elasticsearch-curator-1.5.0-mcp-15.tgz |
|
elasticsearch-exporter |
https://binary.mirantis.com/stacklight/helm/elasticsearch-exporter-1.2.0-mcp-10.tgz |
|
fluentd-logs |
https://binary.mirantis.com/stacklight/helm/fluentd-logs-0.1.0-mcp-238.tgz |
|
grafana |
https://binary.mirantis.com/stacklight/helm/grafana-3.3.10-mcp-300.tgz |
|
iam-proxy |
||
metric-collector |
https://binary.mirantis.com/stacklight/helm/metric-collector-0.3.0-mcp-17.tgz |
|
metricbeat |
https://binary.mirantis.com/stacklight/helm/metricbeat-1.7.1-mcp-25.tgz |
|
opensearch Updated |
https://binary.mirantis.com/stacklight/helm/opensearch-0.1.0-mcp-88.tgz |
|
opensearch-dashboards |
https://binary.mirantis.com/stacklight/helm/opensearch-dashboards-0.1.0-mcp-54.tgz |
|
patroni |
https://binary.mirantis.com/stacklight/helm/patroni-0.15.1-mcp-59.tgz |
|
prometheus |
https://binary.mirantis.com/stacklight/helm/prometheus-8.11.4-mcp-258.tgz |
|
prometheus-blackbox-exporter |
https://binary.mirantis.com/stacklight/helm/prometheus-blackbox-exporter-0.3.0-mcp-19.tgz |
|
prometheus-es-exporter |
https://binary.mirantis.com/stacklight/helm/prometheus-es-exporter-1.0.0-mcp-18.tgz |
|
prometheus-msteams |
https://binary.mirantis.com/stacklight/helm/prometheus-msteams-0.1.0-mcp-12.tgz |
|
sf-notifier |
https://binary.mirantis.com/stacklight/helm/sf-notifier-0.2.0-mcp-10.tgz |
|
sf-reporter |
https://binary.mirantis.com/stacklight/helm/sf-reporter-0.2.0-mcp-10.tgz |
|
stacklight Updated |
https://binary.mirantis.com/stacklight/helm/stacklight-0.15.8.tgz |
|
telegraf-ds |
https://binary.mirantis.com/stacklight/helm/telegraf-ds-1.1.5-mcp-42.tgz |
|
telegraf-s |
https://binary.mirantis.com/stacklight/helm/telegraf-s-1.1.5-mcp-42.tgz |
|
telemeter-client |
https://binary.mirantis.com/stacklight/helm/telemeter-client-0.2.0-mcp-14.tgz |
|
telemeter-server |
https://binary.mirantis.com/stacklight/helm/telemeter-server-0.2.0-mcp-14.tgz |
|
Docker images |
alerta-web Updated |
mirantis.azurecr.io/stacklight/alerta-web:9-20240807023009 |
alertmanager Updated |
mirantis.azurecr.io/stacklight/alertmanager:v0-20240807023013 |
|
alertmanager-webhook-servicenow |
mirantis.azurecr.io/stacklight/alertmanager-webhook-servicenow:v0.1-20240318145925 |
|
alpine-utils Updated |
mirantis.azurecr.io/stacklight/alpine-utils:1-20240807023018 |
|
blackbox-exporter |
mirantis.azurecr.io/stacklight/blackbox-exporter:0-20240408080237 |
|
cadvisor Updated |
mirantis.azurecr.io/stacklight/cadvisor:v0.47-20240807023010 |
|
configmap-reload |
mirantis.azurecr.io/stacklight/configmap-reload:v0.8.0 |
|
curator |
mirantis.azurecr.io/stacklight/curator:5.7.6-20230404082402 |
|
elasticsearch-exporter |
mirantis.azurecr.io/stacklight/elasticsearch-exporter:v1.5.0 |
|
fluentd Updated |
mirantis.azurecr.io/stacklight/fluentd:1.15-20240807023010 |
|
grafana |
mirantis.azurecr.io/stacklight/grafana:10.3.1 |
|
k8s-sidecar Updated |
mirantis.azurecr.io/stacklight/k8s-sidecar:1-20240807023017 |
|
kube-state-metrics |
mirantis.azurecr.io/stacklight/kube-state-metrics:v2.10.1 |
|
kubectl Updated |
mirantis.azurecr.io/stacklight/kubectl:1.27-20240812134116 |
|
metric-collector Updated |
mirantis.azurecr.io/stacklight/metric-collector:v0.1-20240807023014 |
|
metricbeat Updated |
mirantis.azurecr.io/stacklight/metricbeat:7.12.1-20240626023010 |
|
node-exporter |
mirantis.azurecr.io/stacklight/node-exporter:v1.7.0 |
|
oauth2-proxy Updated |
mirantis.azurecr.io/iam/oauth2-proxy:v7.1.3-9 |
|
opensearch Updated |
mirantis.azurecr.io/stacklight/opensearch:2-20240807023012 |
|
opensearch-dashboards Updated |
mirantis.azurecr.io/stacklight/opensearch-dashboards:2-20240807023009 |
|
pgbouncer Updated |
mirantis.azurecr.io/stacklight/pgbouncer:1-20240807023019 |
|
prometheus |
mirantis.azurecr.io/stacklight/prometheus:v2.48.0 |
|
prometheus-es-exporter Updated |
mirantis.azurecr.io/stacklight/prometheus-es-exporter:v0.14.0-20240807023016 |
|
prometheus-msteams |
mirantis.azurecr.io/stacklight/prometheus-msteams:v1.5-20240408080322 |
|
prometheus-patroni-exporter Updated |
mirantis.azurecr.io/stacklight/prometheus-patroni-exporter:0.0.1-20240807023017 |
|
prometheus-postgres-exporter |
mirantis.azurecr.io/stacklight/prometheus-postgres-exporter:v0.15.0 |
|
prometheus-relay Updated |
mirantis.azurecr.io/stacklight/prometheus-relay:v0.4-20240807023018 |
|
psql-client Updated |
mirantis.azurecr.io/scale/psql-client:v13-20240701095027 |
|
sf-notifier Updated |
mirantis.azurecr.io/stacklight/sf-notifier:v0.4-20240807023014 |
|
sf-reporter |
mirantis.azurecr.io/stacklight/sf-reporter:v0.1-20240318145903 |
|
spilo Updated |
mirantis.azurecr.io/stacklight/spilo:13-2.1p9-20240807023011 |
|
stacklight-toolkit Removed |
n/a |
|
telegraf |
mirantis.azurecr.io/stacklight/telegraf:v1.9.1-20240605023010 Updated |
|
mirantis.azurecr.io/stacklight/telegraf:1-20240426131156 |
||
telemeter Updated |
mirantis.azurecr.io/stacklight/telemeter:4.4-20240812121935 |
|
telemeter-token-auth Updated |
mirantis.azurecr.io/stacklight/telemeter-token-auth:v0.1-20240807023014 |
Artifact |
Component |
Path |
|---|---|---|
Configuration management |
Ansible |
|
Debian repositories |
System packages |
|
https://mirror.mirantis.com/kaas/ubuntu-2024-08-06-014502/ Updated |
||
https://mirror.mirantis.com/kaas/ubuntu-2024-08-06-014502.target.txt Updated |
||
MCR repositories |
MCR |
https://repos.mirantis.com/ubuntu/dists/focal/pool/stable-23.0/ |
Target ubuntu system |
Ubuntu |
https://binary.mirantis.com/bm/bin/efi/ubuntu/tgz-focal-20240806090224 Updated |
This section outlines release notes for the major Cluster release 17.2.0 that is introduced in the Container Cloud release 2.27.0. This Cluster release is based on the Cluster release 16.2.0. The Cluster release 17.2.0 supports:
Mirantis OpenStack for Kubernetes (MOSK) 24.2. For details, see Release Notes 24.2.
Mirantis Kubernetes Engine (MKE) 3.7.8. For details, see MKE Release Notes.
Mirantis Container Runtime (MCR) 23.0.11. For details, see MCR Release Notes.
Kubernetes 1.27.
For the list of known and addressed issues, refer to the Container Cloud release 2.27.0 section.
This section outlines new features implemented in the Cluster release 17.2.0 that is introduced in the Container Cloud release 2.27.0.
Introduced support for Mirantis Kubernetes Engine (MKE) 3.7.8 that supports Kubernetes 1.27. On existing clusters, MKE is updated to the latest supported version when you update your managed cluster to the Cluster release 17.2.0.
Note
This enhancement applies to users who follow the update train using major releases. Users who install patch releases, have already obtained MKE 3.7.8 in Container Cloud 2.26.4 (Cluster release 17.1.4).
Learn more
Analyzed and fixed the majority of failed compliance checks in the MKE benchmark compliance for Container Cloud core components and StackLight. The following controls were analyzed:
Control ID |
Component |
Control description |
Analyzed item |
|---|---|---|---|
5.1.2 |
client-certificate-controller
helm-controller
local-volume-provisioner
|
Minimize access to secrets |
|
5.1.4 |
local-volume-provisioner |
Minimize access to create pods |
|
5.2.5 |
client-certificate-controller
helm-controller
policy-controller
stacklight
|
Minimize the admission of containers with |
Containers with |
Upgraded Ceph major version from Quincy 17.2.7 (17.2.7-12.cve in the patch release train) to Reef 18.2.3 with an automatic upgrade of Ceph components on existing managed clusters during the Cluster version update.
Ceph Reef delivers new version of RocksDB which provides better IO performance. Also, this version supports RGW multisite re-sharding and contains overall security improvements.
Added support for Rook v1.13 that contains the Ceph CSI plugin 3.10.x as the default supported version. For a complete list of features and breaking changes, refer to official Rook documentation.
Learn more
Implemented the section option for the rookConfig parameter that
enables you to specify the section where a Rook parameter must be placed.
The use of this option enables restart of only specific daemons related to the
corresponding section instead of restarting all Ceph daemons except Ceph OSD.
Implemented monitoring of disk along with I/O errors in kernel logs to detect
hardware and software issues. The implementation includes the dedicated
KernelIOErrorsDetected alert, the kernel_io_errors_total metric that
is collected on the Fluentd side using the I/O error patterns, and general
refactoring of metrics created in Fluentd.
Added documentation describing usage examples of alert rules based on S.M.A.R.T. metrics to monitor disk information on bare metal clusters.
The StackLight telegraf-ds-smart exporter uses the
S.M.A.R.T. plugin to
obtain detailed disk information and export it as metrics. S.M.A.R.T. is a
commonly used system across vendors with performance data provided as
attributes.
Improved performance and UX visibility of the OpenSearch and OpenSearch Indices Grafana dashboards as well as added the capability to minimize the number of indices to be displayed on dashboards.
Learn more
As part of StackLight refactoring, removed grafana-image-renderer from the
Grafana installation in Container Cloud. StackLight uses this component only
for image generation in the Grafana web UI, which can be easily replaced with
standard screenshots.
The improvement optimizes resources usage and prevents potential CVEs that frequently affect this component.
The following table lists the components versions of the Cluster release 17.2.0.
Note
The components that are newly added, updated, deprecated, or removed
as compared to the previous release version, are marked
with a corresponding superscript,
for example, lcm-ansible Updated.
Component |
Application/Service |
Version |
|---|---|---|
Cluster orchestration |
Mirantis Kubernetes Engine |
3.7.8 0 |
Container runtime Updated |
Mirantis Container Runtime |
23.0.11 1 |
Distributed storage |
Ceph |
18.2.3-1.release (Reef) |
Rook |
1.13.5-15 |
|
LCM Updated |
helm-controller |
1.40.11 |
lcm-ansible |
0.25.0-37-gc15c97d |
|
lcm-agent |
1.40.11 |
|
StackLight |
Alerta |
9.0.1 |
Alertmanager |
0.25.0 |
|
Alertmanager Webhook ServiceNow |
0.1 |
|
Blackbox Exporter |
0.24.0 |
|
cAdvisor |
0.47.2 |
|
Elasticsearch Curator |
5.7.6 |
|
Elasticsearch Exporter |
1.5.0 |
|
Fluentd |
1.15.3 |
|
Grafana |
10.3.1 |
|
Grafana Image Renderer Removed |
n/a |
|
kube-state-metrics |
2.10.1 |
|
Metric Collector |
0.1 |
|
Metricbeat |
7.12.1 |
|
Node Exporter |
1.7.0 |
|
OAuth2 Proxy |
7.1.3 |
|
OpenSearch |
2.12.0 |
|
OpenSearch Dashboards |
2.12.0 |
|
Prometheus |
2.48.0 |
|
Prometheus ES Exporter |
0.14.0 |
|
Prometheus MS Teams |
1.5.2 |
|
Prometheus Patroni Exporter |
0.0.1 |
|
Prometheus Postgres Exporter |
0.15.0 |
|
Prometheus Relay |
0.4 |
|
sf-notifier |
0.4 |
|
sf-reporter |
0.1 |
|
Spilo |
13-2.1p9 |
|
Telegraf |
1.9.1 |
|
1.30.2 |
||
Telemeter |
4.4 |
- 0
For the Mirantis Kubernetes Engine (MKE) release highlights and components versions, see MKE documentation: MKE release notes.
- 1
For the Mirantis Container Runtime (MCR) release highlights, see MCR documentation: MCR release notes.
This section lists the artifacts of components included in the Cluster release 17.2.0.
Artifact |
Component |
Path |
|---|---|---|
Helm chart Updated |
ceph-controller |
https://binary.mirantis.com/ceph/helm/ceph-operator-1.0.0-mcc-2.27.0-7.tgz |
Docker images Updated |
ceph |
mirantis.azurecr.io/mirantis/ceph:v18.2.3-1.release |
ceph-controller |
mirantis.azurecr.io/ceph/mcp/ceph-controller:2.27.0-6 |
|
cephcsi |
mirantis.azurecr.io/mirantis/cephcsi:v3.9.0-12.release |
|
cephcsi-registrar |
mirantis.azurecr.io/mirantis/cephcsi-registrar:v2.9.2-4.release |
|
cephcsi-provisioner |
mirantis.azurecr.io/mirantis/cephcsi-provisioner:v3.6.2-4.release |
|
cephcsi-snapshotter |
mirantis.azurecr.io/mirantis/cephcsi-snapshotter:v6.3.2-4.release |
|
cephcsi-attacher |
mirantis.azurecr.io/mirantis/cephcsi-attacher:v4.4.2-4.release |
|
cephcsi-resizer |
mirantis.azurecr.io/mirantis/cephcsi-resizer:v1.9.2-4.release |
|
rook |
mirantis.azurecr.io/ceph/rook:v1.13.5-15 |
|
snapshot-controller New |
mirantis.azurecr.io/mirantis/snapshot-controller:v6.3.2-4.release |
Artifact |
Component |
Path |
|---|---|---|
Binaries Updated |
lcm-ansible |
https://binary.mirantis.com/lcm/bin/lcm-ansible/v0.25.0-37-gc15c97d/lcm-ansible.tar.gz |
lcm-agent |
||
Helm charts Updated |
helm-controller |
https://binary.mirantis.com/core/helm/helm-controller-1.40.11.tgz |
managed-lcm-api |
https://binary.mirantis.com/core/helm/managed-lcm-api-1.40.11.tgz |
|
Docker images Updated |
helm-controller |
mirantis.azurecr.io/core/lcm-controller:1.40.11 |
Artifact |
Component |
Path |
|---|---|---|
Helm charts |
alerta |
https://binary.mirantis.com/stacklight/helm/alerta-0.1.0-mcp-33.tgz |
alertmanager-webhook-servicenow |
https://binary.mirantis.com/stacklight/helm/alertmanager-webhook-servicenow-0.2.0-mcp-8.tgz |
|
cadvisor |
https://binary.mirantis.com/stacklight/helm/cadvisor-0.1.0-mcp-7.tgz |
|
elasticsearch-curator |
https://binary.mirantis.com/stacklight/helm/elasticsearch-curator-1.5.0-mcp-15.tgz |
|
elasticsearch-exporter |
https://binary.mirantis.com/stacklight/helm/elasticsearch-exporter-1.2.0-mcp-10.tgz |
|
fluentd-logs Updated |
https://binary.mirantis.com/stacklight/helm/fluentd-logs-0.1.0-mcp-238.tgz |
|
grafana Updated |
https://binary.mirantis.com/stacklight/helm/grafana-3.3.10-mcp-300.tgz |
|
iam-proxy |
||
metric-collector |
https://binary.mirantis.com/stacklight/helm/metric-collector-0.3.0-mcp-17.tgz |
|
metricbeat |
https://binary.mirantis.com/stacklight/helm/metricbeat-1.7.1-mcp-25.tgz |
|
opensearch Updated |
https://binary.mirantis.com/stacklight/helm/opensearch-0.1.0-mcp-87.tgz |
|
opensearch-dashboards |
https://binary.mirantis.com/stacklight/helm/opensearch-dashboards-0.1.0-mcp-54.tgz |
|
patroni |
https://binary.mirantis.com/stacklight/helm/patroni-0.15.1-mcp-59.tgz |
|
prometheus |
https://binary.mirantis.com/stacklight/helm/prometheus-8.11.4-mcp-258.tgz |
|
prometheus-blackbox-exporter |
https://binary.mirantis.com/stacklight/helm/prometheus-blackbox-exporter-0.3.0-mcp-19.tgz |
|
prometheus-es-exporter |
https://binary.mirantis.com/stacklight/helm/prometheus-es-exporter-1.0.0-mcp-18.tgz |
|
prometheus-msteams |
https://binary.mirantis.com/stacklight/helm/prometheus-msteams-0.1.0-mcp-12.tgz |
|
sf-notifier |
https://binary.mirantis.com/stacklight/helm/sf-notifier-0.2.0-mcp-10.tgz |
|
sf-reporter |
https://binary.mirantis.com/stacklight/helm/sf-reporter-0.2.0-mcp-10.tgz |
|
stacklight Updated |
https://binary.mirantis.com/stacklight/helm/stacklight-0.15.3.tgz |
|
telegraf-ds |
https://binary.mirantis.com/stacklight/helm/telegraf-ds-1.1.5-mcp-42.tgz |
|
telegraf-s |
https://binary.mirantis.com/stacklight/helm/telegraf-s-1.1.5-mcp-42.tgz |
|
telemeter-client |
https://binary.mirantis.com/stacklight/helm/telemeter-client-0.2.0-mcp-14.tgz |
|
telemeter-server |
https://binary.mirantis.com/stacklight/helm/telemeter-server-0.2.0-mcp-14.tgz |
|
Docker images |
alerta-web |
mirantis.azurecr.io/stacklight/alerta-web:9-20240515023009 |
alertmanager |
mirantis.azurecr.io/stacklight/alertmanager:v0-20240515023012 |
|
alertmanager-webhook-servicenow |
mirantis.azurecr.io/stacklight/alertmanager-webhook-servicenow:v0.1-20240318145925 |
|
alpine-utils |
mirantis.azurecr.io/stacklight/alpine-utils:1-20240515023017 |
|
blackbox-exporter |
mirantis.azurecr.io/stacklight/blackbox-exporter:0-20240408080237 |
|
cadvisor |
mirantis.azurecr.io/stacklight/cadvisor:v0.47-20240515023012 |
|
configmap-reload |
mirantis.azurecr.io/stacklight/configmap-reload:v0.8.0 |
|
curator |
mirantis.azurecr.io/stacklight/curator:5.7.6-20230404082402 |
|
elasticsearch-exporter |
mirantis.azurecr.io/stacklight/elasticsearch-exporter:v1.5.0 |
|
fluentd Updated |
mirantis.azurecr.io/stacklight/fluentd:1.15-20240611084259 |
|
grafana |
mirantis.azurecr.io/stacklight/grafana:10.3.1 |
|
grafana-image-renderer Removed |
n/a |
|
k8s-sidecar |
mirantis.azurecr.io/stacklight/k8s-sidecar:1-20240515023018 |
|
kube-state-metrics |
mirantis.azurecr.io/stacklight/kube-state-metrics:v2.10.1 |
|
kubectl |
mirantis.azurecr.io/stacklight/kubectl:1.22-20240515023015 |
|
metric-collector |
mirantis.azurecr.io/stacklight/metric-collector:v0.1-20240515023016 |
|
metricbeat |
mirantis.azurecr.io/stacklight/metricbeat:7.12.1-20240515023009 |
|
node-exporter |
mirantis.azurecr.io/stacklight/node-exporter:v1.7.0 |
|
oauth2-proxy |
mirantis.azurecr.io/iam/oauth2-proxy:v7.1.3-8 |
|
opensearch |
mirantis.azurecr.io/stacklight/opensearch:2-20240515023012 |
|
opensearch-dashboards |
mirantis.azurecr.io/stacklight/opensearch-dashboards:2-20240515023010 |
|
pgbouncer |
mirantis.azurecr.io/stacklight/pgbouncer:1-20240515023018 |
|
prometheus |
mirantis.azurecr.io/stacklight/prometheus:v2.48.0 |
|
prometheus-es-exporter |
mirantis.azurecr.io/stacklight/prometheus-es-exporter:v0.14.0-20240515023016 |
|
prometheus-msteams |
mirantis.azurecr.io/stacklight/prometheus-msteams:v1.5-20240408080322 |
|
prometheus-patroni-exporter |
mirantis.azurecr.io/stacklight/prometheus-patroni-exporter:0.0.1-20240515023017 |
|
prometheus-postgres-exporter |
mirantis.azurecr.io/stacklight/prometheus-postgres-exporter:v0.15.0 |
|
prometheus-relay |
mirantis.azurecr.io/stacklight/prometheus-relay:v0.4-20240515023017 |
|
psql-client |
mirantis.azurecr.io/scale/psql-client:v13-20240222083402 |
|
sf-notifier |
mirantis.azurecr.io/stacklight/sf-notifier:v0.4-20240515023012 |
|
sf-reporter |
mirantis.azurecr.io/stacklight/sf-reporter:v0.1-20240318145903 |
|
spilo |
mirantis.azurecr.io/stacklight/spilo:13-2.1p9-20240515023010 |
|
stacklight-toolkit |
mirantis.azurecr.io/stacklight/stacklight-toolkit:20240515023016 |
|
telegraf |
mirantis.azurecr.io/stacklight/telegraf:v1.9.1-20240515023008 |
|
mirantis.azurecr.io/stacklight/telegraf:1-20240426131156 |
||
telemeter |
mirantis.azurecr.io/stacklight/telemeter:4.4-20240515023015 |
|
telemeter-token-auth |
mirantis.azurecr.io/stacklight/telemeter-token-auth:v0.1-20240515023012 |
Artifact |
Component |
Path |
|---|---|---|
Configuration management Updated |
Ansible |
|
Debian repositories Updated |
System packages |
|
https://mirror.mirantis.com/kaas/ubuntu-2024-05-17-013445.target.txt |
||
MCR repositories |
MCR |
https://repos.mirantis.com/ubuntu/dists/focal/pool/stable-23.0/ |
Target ubuntu system |
Ubuntu |
https://binary.mirantis.com/bm/bin/efi/ubuntu/tgz-focal-20240517090228 Updated |
Major and patch versions update path
The primary distinction between major and patch product versions lies in the fact that major release versions introduce new functionalities, whereas patch release versions predominantly offer minor product enhancements, mostly CVE resolutions for your clusters.
Depending on your deployment needs, you can either update only between major Cluster releases or apply patch updates between major releases. Choosing the latter option ensures you receive security fixes as soon as they become available. Though, be prepared to update your cluster frequently, approximately once every three weeks. Otherwise, you can update only between major Cluster releases as each subsequent major Cluster release includes patch Cluster release updates of the previous major Cluster release.
This section outlines release notes for deprecated major and patch Cluster releases of the 17.1.x series dedicated for Mirantis OpenStack for Kubernetes (MOSK).
This section includes release notes for the patch Cluster release 17.1.7 that is introduced in the Container Cloud patch release 2.27.2 and is based on the previous Cluster releases of the 17.1.x series series.
This patch Cluster release introduces MOSK 24.1.7 that is based on Mirantis Kubernetes Engine 3.7.11 with Kubernetes 1.27 and Mirantis Container Runtime 23.0.9.
For details on MOSK 24.1.7, see Release notes 24.1.7.
For the list of CVE fixes delivered with this patch Cluster release, see 2.27.2
For details on patch release delivery, see Patch releases
This section lists the artifacts of components included in the Cluster release 17.1.7.
Note
The components that are newly added, updated, deprecated, or removed
as compared to the previous release version, are marked
with a corresponding superscript,
for example, lcm-ansible Updated.
Artifact |
Component |
Path |
|---|---|---|
Helm chart |
ceph-controller |
https://binary.mirantis.com/ceph/helm/ceph-operator-1.0.0-mcc-2.27.1-6.tgz |
Docker images |
ceph |
mirantis.azurecr.io/mirantis/ceph:v17.2.7-15.cve |
ceph-controller |
mirantis.azurecr.io/ceph/mcp/ceph-controller:2.27.1-5 |
|
cephcsi |
mirantis.azurecr.io/mirantis/cephcsi:v3.9.0-15.cve |
|
cephcsi-registrar |
mirantis.azurecr.io/mirantis/cephcsi-registrar:v2.9.2-3.cve |
|
cephcsi-provisioner |
mirantis.azurecr.io/mirantis/cephcsi-provisioner:v3.6.2-3.cve |
|
cephcsi-snapshotter |
mirantis.azurecr.io/mirantis/cephcsi-snapshotter:v6.3.2-3.cve |
|
cephcsi-attacher |
mirantis.azurecr.io/mirantis/cephcsi-attacher:v4.4.2-3.cve |
|
cephcsi-resizer |
mirantis.azurecr.io/mirantis/cephcsi-resizer:v1.9.2-3.cve |
|
rook |
mirantis.azurecr.io/ceph/rook:v1.12.10-21 |
Artifact |
Component |
Path |
|---|---|---|
Helm charts Updated |
cinder-csi-plugin |
https://binary.mirantis.com/core/helm/cinder-csi-plugin-1.39.31.tgz |
client-certificate-controller |
https://binary.mirantis.com/core/helm/client-certificate-controller-1.39.31.tgz |
|
local-volume-provisioner |
https://binary.mirantis.com/core/helm/local-volume-provisioner-1.39.31.tgz |
|
metrics-server |
https://binary.mirantis.com/core/helm/metrics-server-1.39.31.tgz |
|
openstack-cloud-controller-manager |
https://binary.mirantis.com/core/helm/openstack-cloud-controller-manager-1.39.31.tgz |
|
policy-controller |
https://binary.mirantis.com/core/helm/policy-controller-1.39.31.tgz |
|
vsphere-cloud-controller-manager |
https://binary.mirantis.com/core/helm/vsphere-cloud-controller-manager-1.39.31.tgz |
|
vsphere-csi-plugin |
https://binary.mirantis.com/core/helm/vsphere-csi-plugin-1.39.31.tgz |
|
Docker images |
cinder-csi-plugin Updated |
mirantis.azurecr.io/lcm/kubernetes/cinder-csi-plugin:v1.27.2-17 |
client-certificate-controller Updated |
mirantis.azurecr.io/core/client-certificate-controller:1.39.31 |
|
csi-attacher |
mirantis.azurecr.io/lcm/k8scsi/csi-attacher:v4.2.0-5 |
|
csi-node-driver-registrar |
mirantis.azurecr.io/lcm/k8scsi/csi-node-driver-registrar:v2.7.0-5 |
|
csi-provisioner |
mirantis.azurecr.io/lcm/k8scsi/csi-provisioner:v3.4.1-5 |
|
csi-resizer |
mirantis.azurecr.io/lcm/k8scsi/csi-resizer:v1.7.0-5 |
|
csi-snapshotter |
mirantis.azurecr.io/lcm/k8scsi/csi-snapshotter:v6.2.1-mcc-4 |
|
livenessprobe |
mirantis.azurecr.io/lcm/k8scsi/livenessprobe:v2.9.0-5 |
|
metrics-server |
mirantis.azurecr.io/lcm/metrics-server-amd64:v0.6.3-7 |
|
openstack-cloud-controller-manager Updated |
mirantis.azurecr.io/lcm/kubernetes/openstack-cloud-controller-manager:v1.27.2-17 |
|
policy-controller Updated |
mirantis.azurecr.io/core/policy-controller:1.39.31 |
|
vsphere-cloud-controller-manager |
mirantis.azurecr.io/lcm/kubernetes/vsphere-cloud-controller-manager:v1.27.0-6 |
|
vsphere-csi-driver |
mirantis.azurecr.io/lcm/kubernetes/vsphere-csi-driver:v3.0.2-1 |
|
vsphere-csi-syncer |
mirantis.azurecr.io/lcm/kubernetes/vsphere-csi-syncer:v3.0.2-1 |
Artifact |
Component |
Path |
|---|---|---|
Binaries |
lcm-ansible |
https://binary.mirantis.com/lcm/bin/lcm-ansible/v0.24.0-52-gd8adaba/lcm-ansible.tar.gz |
lcm-agent Updated |
||
Helm charts Updated |
helm-controller |
https://binary.mirantis.com/core/helm/helm-controller-1.39.31.tgz |
managed-lcm-api |
https://binary.mirantis.com/core/helm/managed-lcm-api-1.39.31.tgz |
|
Docker images Updated |
helm-controller |
mirantis.azurecr.io/core/lcm-controller:1.39.31 |
Artifact |
Component |
Path |
|---|---|---|
Helm charts |
alerta |
https://binary.mirantis.com/stacklight/helm/alerta-0.1.0-mcp-33.tgz |
alertmanager-webhook-servicenow |
https://binary.mirantis.com/stacklight/helm/alertmanager-webhook-servicenow-0.2.0-mcp-8.tgz |
|
cadvisor |
https://binary.mirantis.com/stacklight/helm/cadvisor-0.1.0-mcp-7.tgz |
|
elasticsearch-curator |
https://binary.mirantis.com/stacklight/helm/elasticsearch-curator-1.5.0-mcp-15.tgz |
|
elasticsearch-exporter |
https://binary.mirantis.com/stacklight/helm/elasticsearch-exporter-1.2.0-mcp-10.tgz |
|
fluentd-logs |
https://binary.mirantis.com/stacklight/helm/fluentd-logs-0.1.0-mcp-223.tgz |
|
grafana |
https://binary.mirantis.com/stacklight/helm/grafana-3.3.10-mcp-290.tgz |
|
iam-proxy |
||
metric-collector |
https://binary.mirantis.com/stacklight/helm/metric-collector-0.3.0-mcp-17.tgz |
|
metricbeat |
https://binary.mirantis.com/stacklight/helm/metricbeat-1.7.1-mcp-25.tgz |
|
opensearch |
https://binary.mirantis.com/stacklight/helm/opensearch-0.1.0-mcp-88.tgz |
|
opensearch-dashboards |
https://binary.mirantis.com/stacklight/helm/opensearch-dashboards-0.1.0-mcp-54.tgz |
|
patroni |
https://binary.mirantis.com/stacklight/helm/patroni-0.15.1-mcp-59.tgz |
|
prometheus |
https://binary.mirantis.com/stacklight/helm/prometheus-8.11.4-mcp-258.tgz |
|
prometheus-blackbox-exporter |
https://binary.mirantis.com/stacklight/helm/prometheus-blackbox-exporter-0.3.0-mcp-19.tgz |
|
prometheus-es-exporter |
https://binary.mirantis.com/stacklight/helm/prometheus-es-exporter-1.0.0-mcp-18.tgz |
|
prometheus-msteams |
https://binary.mirantis.com/stacklight/helm/prometheus-msteams-0.1.0-mcp-12.tgz |
|
sf-notifier |
https://binary.mirantis.com/stacklight/helm/sf-notifier-0.2.0-mcp-10.tgz |
|
sf-reporter |
https://binary.mirantis.com/stacklight/helm/sf-reporter-0.2.0-mcp-10.tgz |
|
stacklight Updated |
https://binary.mirantis.com/stacklight/helm/stacklight-0.14.15.tgz |
|
telegraf-ds |
https://binary.mirantis.com/stacklight/helm/telegraf-ds-1.1.5-mcp-42.tgz |
|
telegraf-s |
https://binary.mirantis.com/stacklight/helm/telegraf-s-1.1.5-mcp-42.tgz |
|
telemeter-client |
https://binary.mirantis.com/stacklight/helm/telemeter-client-0.2.0-mcp-14.tgz |
|
telemeter-server |
https://binary.mirantis.com/stacklight/helm/telemeter-server-0.2.0-mcp-14.tgz |
|
Docker images |
alerta-web Updated |
mirantis.azurecr.io/stacklight/alerta-web:9-20240710023009 |
alertmanager Updated |
mirantis.azurecr.io/stacklight/alertmanager:v0-20240710023018 |
|
alertmanager-webhook-servicenow |
mirantis.azurecr.io/stacklight/alertmanager-webhook-servicenow:v0.1-20240318145925 |
|
alpine-utils Updated |
mirantis.azurecr.io/stacklight/alpine-utils:1-20240710023020 |
|
blackbox-exporter |
mirantis.azurecr.io/stacklight/blackbox-exporter:0-20240408080237 |
|
cadvisor Updated |
mirantis.azurecr.io/stacklight/cadvisor:v0.47-20240710023011 |
|
configmap-reload |
mirantis.azurecr.io/stacklight/configmap-reload:v0.8.0 |
|
curator |
mirantis.azurecr.io/stacklight/curator:5.7.6-20230404082402 |
|
elasticsearch-exporter |
mirantis.azurecr.io/stacklight/elasticsearch-exporter:v1.5.0 |
|
fluentd Updated |
mirantis.azurecr.io/stacklight/fluentd:1.15-20240710023010 |
|
grafana |
mirantis.azurecr.io/stacklight/grafana:10.3.1 |
|
grafana-image-renderer |
mirantis.azurecr.io/stacklight/grafana-image-renderer:3-20240318142141 |
|
k8s-sidecar Updated |
mirantis.azurecr.io/stacklight/k8s-sidecar:1-20240710023020 |
|
kube-state-metrics |
mirantis.azurecr.io/stacklight/kube-state-metrics:v2.10.1 |
|
kubectl Updated |
mirantis.azurecr.io/stacklight/kubectl:1.22-20240710023014 |
|
metric-collector Updated |
mirantis.azurecr.io/stacklight/metric-collector:v0.1-20240710023014 |
|
metricbeat |
mirantis.azurecr.io/stacklight/metricbeat:7.12.1-20240626023010 |
|
node-exporter |
mirantis.azurecr.io/stacklight/node-exporter:v1.7.0 |
|
oauth2-proxy Updated |
mirantis.azurecr.io/iam/oauth2-proxy:v7.1.3-9 |
|
opensearch Updated |
mirantis.azurecr.io/stacklight/opensearch:2-20240710023013 |
|
opensearch-dashboards Updated |
mirantis.azurecr.io/stacklight/opensearch-dashboards:2-20240710023010 |
|
pgbouncer Updated |
mirantis.azurecr.io/stacklight/pgbouncer:1-20240710023020 |
|
prometheus |
mirantis.azurecr.io/stacklight/prometheus:v2.48.0 |
|
prometheus-es-exporter Updated |
mirantis.azurecr.io/stacklight/prometheus-es-exporter:v0.14.0-20240710023017 |
|
prometheus-msteams |
mirantis.azurecr.io/stacklight/prometheus-msteams:v1.5-20240408080322 |
|
prometheus-patroni-exporter Updated |
mirantis.azurecr.io/stacklight/prometheus-patroni-exporter:0.0.1-20240710023019 |
|
prometheus-postgres-exporter |
mirantis.azurecr.io/stacklight/prometheus-postgres-exporter:v0.15.0 |
|
prometheus-relay Updated |
mirantis.azurecr.io/stacklight/prometheus-relay:v0.4-20240710023019 |
|
psql-client Updated |
mirantis.azurecr.io/scale/psql-client:v13-20240701095027 |
|
sf-notifier Updated |
mirantis.azurecr.io/stacklight/sf-notifier:v0.4-20240710023015 |
|
sf-reporter |
mirantis.azurecr.io/stacklight/sf-reporter:v0.1-20240318145903 |
|
spilo Updated |
mirantis.azurecr.io/stacklight/spilo:13-2.1p9-20240710023011 |
|
stacklight-toolkit Updated |
mirantis.azurecr.io/stacklight/stacklight-toolkit:20240710023015 |
|
telegraf |
mirantis.azurecr.io/stacklight/telegraf:v1.9.1-20240605023010 |
|
mirantis.azurecr.io/stacklight/telegraf:1-20240426131156 |
||
telemeter Updated |
mirantis.azurecr.io/stacklight/telemeter:4.4-20240710023015 |
|
telemeter-token-auth Updated |
mirantis.azurecr.io/stacklight/telemeter-token-auth:v0.1-20240710023019 |
Artifact |
Component |
Path |
|---|---|---|
Debian repositories |
System packages |
|
https://mirror.mirantis.com/kaas/ubuntu-2024-07-16-014744/ Updated |
||
https://mirror.mirantis.com/kaas/ubuntu-2024-07-16-014744.target.txt Updated |
||
MCR repositories |
MCR |
https://repos.mirantis.com/ubuntu/dists/focal/pool/stable-23.0/ |
Target ubuntu system |
Ubuntu |
https://binary.mirantis.com/bm/bin/efi/ubuntu/tgz-focal-20240716073842 Updated |
This section includes release notes for the patch Cluster release 17.1.6 that is introduced in the Container Cloud patch release 2.27.1 and is based on the previous Cluster releases of the 17.1.x series series.
This patch Cluster release introduces MOSK 24.1.6 that
is based on Mirantis Kubernetes Engine 3.7.10 with Kubernetes 1.27 and Mirantis
Container Runtime 23.0.9, in which docker-ee-cli was updated to version
23.0.13 to fix several CVEs.
For details on MOSK 24.1.6, see Release notes 24.1.6.
For the list of CVE fixes delivered with this patch Cluster release, see 2.27.1
For details on patch release delivery, see Patch releases
This section lists the artifacts of components included in the Cluster release 17.1.6.
Note
The components that are newly added, updated, deprecated, or removed
as compared to the previous release version, are marked
with a corresponding superscript,
for example, lcm-ansible Updated.
Artifact |
Component |
Path |
|---|---|---|
Helm chart Updated |
ceph-controller |
https://binary.mirantis.com/ceph/helm/ceph-operator-1.0.0-mcc-2.27.1-6.tgz |
Docker images |
ceph Updated |
mirantis.azurecr.io/mirantis/ceph:v17.2.7-15.cve |
ceph-controller Updated |
mirantis.azurecr.io/ceph/mcp/ceph-controller:2.27.1-5 |
|
cephcsi Updated |
mirantis.azurecr.io/mirantis/cephcsi:v3.9.0-15.cve |
|
cephcsi-registrar |
mirantis.azurecr.io/mirantis/cephcsi-registrar:v2.9.2-3.cve |
|
cephcsi-provisioner |
mirantis.azurecr.io/mirantis/cephcsi-provisioner:v3.6.2-3.cve |
|
cephcsi-snapshotter |
mirantis.azurecr.io/mirantis/cephcsi-snapshotter:v6.3.2-3.cve |
|
cephcsi-attacher |
mirantis.azurecr.io/mirantis/cephcsi-attacher:v4.4.2-3.cve |
|
cephcsi-resizer |
mirantis.azurecr.io/mirantis/cephcsi-resizer:v1.9.2-3.cve |
|
rook Updated |
mirantis.azurecr.io/ceph/rook:v1.12.10-21 |
Artifact |
Component |
Path |
|---|---|---|
Helm charts Updated |
cinder-csi-plugin |
https://binary.mirantis.com/core/helm/cinder-csi-plugin-1.39.29.tgz |
client-certificate-controller |
https://binary.mirantis.com/core/helm/client-certificate-controller-1.39.29.tgz |
|
local-volume-provisioner |
https://binary.mirantis.com/core/helm/local-volume-provisioner-1.39.29.tgz |
|
metrics-server |
https://binary.mirantis.com/core/helm/metrics-server-1.39.29.tgz |
|
openstack-cloud-controller-manager |
https://binary.mirantis.com/core/helm/openstack-cloud-controller-manager-1.39.29.tgz |
|
policy-controller |
https://binary.mirantis.com/core/helm/policy-controller-1.39.29.tgz |
|
vsphere-cloud-controller-manager |
https://binary.mirantis.com/core/helm/vsphere-cloud-controller-manager-1.39.29.tgz |
|
vsphere-csi-plugin |
https://binary.mirantis.com/core/helm/vsphere-csi-plugin-1.39.29.tgz |
|
Docker images |
cinder-csi-plugin |
mirantis.azurecr.io/lcm/kubernetes/cinder-csi-plugin:v1.27.2-16 |
client-certificate-controller Updated |
mirantis.azurecr.io/core/client-certificate-controller:1.39.29 |
|
csi-attacher |
mirantis.azurecr.io/lcm/k8scsi/csi-attacher:v4.2.0-5 |
|
csi-node-driver-registrar |
mirantis.azurecr.io/lcm/k8scsi/csi-node-driver-registrar:v2.7.0-5 |
|
csi-provisioner |
mirantis.azurecr.io/lcm/k8scsi/csi-provisioner:v3.4.1-5 |
|
csi-resizer |
mirantis.azurecr.io/lcm/k8scsi/csi-resizer:v1.7.0-5 |
|
csi-snapshotter |
mirantis.azurecr.io/lcm/k8scsi/csi-snapshotter:v6.2.1-mcc-4 |
|
livenessprobe |
mirantis.azurecr.io/lcm/k8scsi/livenessprobe:v2.9.0-5 |
|
metrics-server |
mirantis.azurecr.io/lcm/metrics-server-amd64:v0.6.3-7 |
|
openstack-cloud-controller-manager |
mirantis.azurecr.io/lcm/kubernetes/openstack-cloud-controller-manager:v1.27.2-16 |
|
policy-controller Updated |
mirantis.azurecr.io/core/policy-controller:1.39.29 |
|
vsphere-cloud-controller-manager |
mirantis.azurecr.io/lcm/kubernetes/vsphere-cloud-controller-manager:v1.27.0-6 |
|
vsphere-csi-driver |
mirantis.azurecr.io/lcm/kubernetes/vsphere-csi-driver:v3.0.2-1 |
|
vsphere-csi-syncer |
mirantis.azurecr.io/lcm/kubernetes/vsphere-csi-syncer:v3.0.2-1 |
Artifact |
Component |
Path |
|---|---|---|
Binaries Updated |
lcm-ansible |
https://binary.mirantis.com/lcm/bin/lcm-ansible/v0.24.0-52-gd8adaba/lcm-ansible.tar.gz |
lcm-agent |
||
Helm charts Updated |
helm-controller |
https://binary.mirantis.com/core/helm/helm-controller-1.39.29.tgz |
managed-lcm-api |
https://binary.mirantis.com/core/helm/managed-lcm-api-1.39.29.tgz |
|
Docker images Updated |
helm-controller |
mirantis.azurecr.io/core/lcm-controller:1.39.29 |
Artifact |
Component |
Path |
|---|---|---|
Helm charts |
alerta |
https://binary.mirantis.com/stacklight/helm/alerta-0.1.0-mcp-33.tgz |
alertmanager-webhook-servicenow |
https://binary.mirantis.com/stacklight/helm/alertmanager-webhook-servicenow-0.2.0-mcp-8.tgz |
|
cadvisor |
https://binary.mirantis.com/stacklight/helm/cadvisor-0.1.0-mcp-7.tgz |
|
elasticsearch-curator |
https://binary.mirantis.com/stacklight/helm/elasticsearch-curator-1.5.0-mcp-15.tgz |
|
elasticsearch-exporter |
https://binary.mirantis.com/stacklight/helm/elasticsearch-exporter-1.2.0-mcp-10.tgz |
|
fluentd-logs |
https://binary.mirantis.com/stacklight/helm/fluentd-logs-0.1.0-mcp-223.tgz |
|
grafana |
https://binary.mirantis.com/stacklight/helm/grafana-3.3.10-mcp-290.tgz |
|
iam-proxy |
||
metric-collector |
https://binary.mirantis.com/stacklight/helm/metric-collector-0.3.0-mcp-17.tgz |
|
metricbeat |
https://binary.mirantis.com/stacklight/helm/metricbeat-1.7.1-mcp-25.tgz |
|
opensearch Updated |
https://binary.mirantis.com/stacklight/helm/opensearch-0.1.0-mcp-88.tgz |
|
opensearch-dashboards |
https://binary.mirantis.com/stacklight/helm/opensearch-dashboards-0.1.0-mcp-54.tgz |
|
patroni |
https://binary.mirantis.com/stacklight/helm/patroni-0.15.1-mcp-59.tgz |
|
prometheus |
https://binary.mirantis.com/stacklight/helm/prometheus-8.11.4-mcp-258.tgz |
|
prometheus-blackbox-exporter |
https://binary.mirantis.com/stacklight/helm/prometheus-blackbox-exporter-0.3.0-mcp-19.tgz |
|
prometheus-es-exporter |
https://binary.mirantis.com/stacklight/helm/prometheus-es-exporter-1.0.0-mcp-18.tgz |
|
prometheus-msteams |
https://binary.mirantis.com/stacklight/helm/prometheus-msteams-0.1.0-mcp-12.tgz |
|
sf-notifier |
https://binary.mirantis.com/stacklight/helm/sf-notifier-0.2.0-mcp-10.tgz |
|
sf-reporter |
https://binary.mirantis.com/stacklight/helm/sf-reporter-0.2.0-mcp-10.tgz |
|
stacklight Updated |
https://binary.mirantis.com/stacklight/helm/stacklight-0.14.14.tgz |
|
telegraf-ds |
https://binary.mirantis.com/stacklight/helm/telegraf-ds-1.1.5-mcp-42.tgz |
|
telegraf-s |
https://binary.mirantis.com/stacklight/helm/telegraf-s-1.1.5-mcp-42.tgz |
|
telemeter-client |
https://binary.mirantis.com/stacklight/helm/telemeter-client-0.2.0-mcp-14.tgz |
|
telemeter-server |
https://binary.mirantis.com/stacklight/helm/telemeter-server-0.2.0-mcp-14.tgz |
|
Docker images |
alerta-web Updated |
mirantis.azurecr.io/stacklight/alerta-web:9-20240701140358 |
alertmanager Updated |
mirantis.azurecr.io/stacklight/alertmanager:v0-20240701140403 |
|
alertmanager-webhook-servicenow |
mirantis.azurecr.io/stacklight/alertmanager-webhook-servicenow:v0.1-20240318145925 |
|
alpine-utils Updated |
mirantis.azurecr.io/stacklight/alpine-utils:1-20240701140404 |
|
blackbox-exporter |
mirantis.azurecr.io/stacklight/blackbox-exporter:0-20240408080237 |
|
cadvisor Updated |
mirantis.azurecr.io/stacklight/cadvisor:v0.47-20240701140359 |
|
configmap-reload |
mirantis.azurecr.io/stacklight/configmap-reload:v0.8.0 |
|
curator |
mirantis.azurecr.io/stacklight/curator:5.7.6-20230404082402 |
|
elasticsearch-exporter |
mirantis.azurecr.io/stacklight/elasticsearch-exporter:v1.5.0 |
|
fluentd Updated |
mirantis.azurecr.io/stacklight/fluentd:1.15-20240701140357 |
|
grafana |
mirantis.azurecr.io/stacklight/grafana:10.3.1 |
|
grafana-image-renderer |
mirantis.azurecr.io/stacklight/grafana-image-renderer:3-20240318142141 |
|
k8s-sidecar Updated |
mirantis.azurecr.io/stacklight/k8s-sidecar:1-20240701140403 |
|
kube-state-metrics |
mirantis.azurecr.io/stacklight/kube-state-metrics:v2.10.1 |
|
kubectl Updated |
mirantis.azurecr.io/stacklight/kubectl:1.22-20240701140401 |
|
metric-collector Updated |
mirantis.azurecr.io/stacklight/metric-collector:v0.1-20240701140400 |
|
metricbeat Updated |
mirantis.azurecr.io/stacklight/metricbeat:7.12.1-20240626023010 |
|
node-exporter |
mirantis.azurecr.io/stacklight/node-exporter:v1.7.0 |
|
oauth2-proxy |
mirantis.azurecr.io/iam/oauth2-proxy:v7.1.3-8 |
|
opensearch Updated |
mirantis.azurecr.io/stacklight/opensearch:2-20240701140359 |
|
opensearch-dashboards Updated |
mirantis.azurecr.io/stacklight/opensearch-dashboards:2-20240701140352 |
|
pgbouncer Updated |
mirantis.azurecr.io/stacklight/pgbouncer:1-20240701140404 |
|
prometheus |
mirantis.azurecr.io/stacklight/prometheus:v2.48.0 |
|
prometheus-es-exporter Updated |
mirantis.azurecr.io/stacklight/prometheus-es-exporter:v0.14.0-20240701140403 |
|
prometheus-msteams |
mirantis.azurecr.io/stacklight/prometheus-msteams:v1.5-20240408080322 |
|
prometheus-patroni-exporter Updated |
mirantis.azurecr.io/stacklight/prometheus-patroni-exporter:0.0.1-20240701140402 |
|
prometheus-postgres-exporter |
mirantis.azurecr.io/stacklight/prometheus-postgres-exporter:v0.15.0 |
|
prometheus-relay Updated |
mirantis.azurecr.io/stacklight/prometheus-relay:v0.4-20240701140404 |
|
psql-client |
mirantis.azurecr.io/scale/psql-client:v13-20240222083402 |
|
sf-notifier Updated |
mirantis.azurecr.io/stacklight/sf-notifier:v0.4-20240701140403 |
|
sf-reporter |
mirantis.azurecr.io/stacklight/sf-reporter:v0.1-20240318145903 |
|
spilo Updated |
mirantis.azurecr.io/stacklight/spilo:13-2.1p9-20240701140359 |
|
stacklight-toolkit Updated |
mirantis.azurecr.io/stacklight/stacklight-toolkit:20240701140402 |
|
telegraf |
mirantis.azurecr.io/stacklight/telegraf:v1.9.1-20240605023010 Updated |
|
mirantis.azurecr.io/stacklight/telegraf:1-20240426131156 |
||
telemeter Updated |
mirantis.azurecr.io/stacklight/telemeter:4.4-20240701140401 |
|
telemeter-token-auth Updated |
mirantis.azurecr.io/stacklight/telemeter-token-auth:v0.1-20240701140402 |
Artifact |
Component |
Path |
|---|---|---|
Debian repositories |
System packages |
|
https://mirror.mirantis.com/kaas/ubuntu-2024-06-27-014654/ Updated |
||
https://mirror.mirantis.com/kaas/ubuntu-2024-06-27-014654.target.txt Updated |
||
MCR repositories |
MCR |
https://repos.mirantis.com/ubuntu/dists/focal/pool/stable-23.0/ |
Target ubuntu system |
Ubuntu |
https://binary.mirantis.com/bm/bin/efi/ubuntu/tgz-focal-20240627095142 Updated |
This section includes release notes for the patch Cluster release 17.1.5 that is introduced in the Container Cloud patch release 2.26.5 and is based on the previous Cluster releases of the 17.1.x series series.
This patch Cluster release introduces MOSK 24.1.5 that is based on Mirantis Kubernetes Engine 3.7.8 with Kubernetes 1.27 and Mirantis Container Runtime 23.0.9.
For details on MOSK 24.1.5, see Release notes 24.1.5.
For the list of CVE fixes delivered with this patch Cluster release, see 2.26.5
For details on patch release delivery, see Patch releases
This section lists the artifacts of components included in the Cluster release 17.1.5.
Note
The components that are newly added, updated, deprecated, or removed
as compared to the previous release version, are marked
with a corresponding superscript,
for example, lcm-ansible Updated.
Artifact |
Component |
Path |
|---|---|---|
Helm chart Updated |
ceph-controller |
https://binary.mirantis.com/ceph/helm/ceph-operator-1.0.0-mcc-2.26.5-1.tgz |
Docker images |
ceph Updated |
mirantis.azurecr.io/mirantis/ceph:v17.2.7-13.cve |
ceph-controller Updated |
mirantis.azurecr.io/ceph/mcp/ceph-controller:2.26.5-0 |
|
cephcsi Updated |
mirantis.azurecr.io/mirantis/cephcsi:v3.9.0-10.cve |
|
cephcsi-registrar |
mirantis.azurecr.io/mirantis/cephcsi-registrar:v2.9.2-3.cve |
|
cephcsi-provisioner |
mirantis.azurecr.io/mirantis/cephcsi-provisioner:v3.6.2-3.cve |
|
cephcsi-snapshotter |
mirantis.azurecr.io/mirantis/cephcsi-snapshotter:v6.3.2-3.cve |
|
cephcsi-attacher |
mirantis.azurecr.io/mirantis/cephcsi-attacher:v4.4.2-3.cve |
|
cephcsi-resizer |
mirantis.azurecr.io/mirantis/cephcsi-resizer:v1.9.2-3.cve |
|
rook Updated |
mirantis.azurecr.io/ceph/rook:v1.12.10-19 |
Artifact |
Component |
Path |
|---|---|---|
Binaries |
lcm-ansible |
https://binary.mirantis.com/lcm/bin/lcm-ansible/v0.24.0-47-gf77368e/lcm-ansible.tar.gz |
lcm-agent Updated |
||
Helm charts Updated |
helm-controller |
https://binary.mirantis.com/core/helm/helm-controller-1.39.28.tgz |
managed-lcm-api |
https://binary.mirantis.com/core/helm/managed-lcm-api-1.39.28.tgz |
|
Docker images Updated |
helm-controller |
mirantis.azurecr.io/core/lcm-controller:1.39.28 |
Artifact |
Component |
Path |
|---|---|---|
Helm charts |
alerta |
https://binary.mirantis.com/stacklight/helm/alerta-0.1.0-mcp-33.tgz |
alertmanager-webhook-servicenow |
https://binary.mirantis.com/stacklight/helm/alertmanager-webhook-servicenow-0.2.0-mcp-8.tgz |
|
cadvisor |
https://binary.mirantis.com/stacklight/helm/cadvisor-0.1.0-mcp-7.tgz |
|
elasticsearch-curator |
https://binary.mirantis.com/stacklight/helm/elasticsearch-curator-1.5.0-mcp-15.tgz |
|
elasticsearch-exporter |
https://binary.mirantis.com/stacklight/helm/elasticsearch-exporter-1.2.0-mcp-10.tgz |
|
fluentd-logs |
https://binary.mirantis.com/stacklight/helm/fluentd-logs-0.1.0-mcp-223.tgz |
|
grafana |
https://binary.mirantis.com/stacklight/helm/grafana-3.3.10-mcp-290.tgz |
|
iam-proxy |
||
metric-collector |
https://binary.mirantis.com/stacklight/helm/metric-collector-0.3.0-mcp-17.tgz |
|
metricbeat |
https://binary.mirantis.com/stacklight/helm/metricbeat-1.7.1-mcp-25.tgz |
|
opensearch |
https://binary.mirantis.com/stacklight/helm/opensearch-0.1.0-mcp-86.tgz |
|
opensearch-dashboards |
https://binary.mirantis.com/stacklight/helm/opensearch-dashboards-0.1.0-mcp-54.tgz |
|
patroni |
https://binary.mirantis.com/stacklight/helm/patroni-0.15.1-mcp-59.tgz |
|
prometheus |
https://binary.mirantis.com/stacklight/helm/prometheus-8.11.4-mcp-258.tgz |
|
prometheus-blackbox-exporter |
https://binary.mirantis.com/stacklight/helm/prometheus-blackbox-exporter-0.3.0-mcp-19.tgz |
|
prometheus-es-exporter |
https://binary.mirantis.com/stacklight/helm/prometheus-es-exporter-1.0.0-mcp-18.tgz |
|
prometheus-msteams |
https://binary.mirantis.com/stacklight/helm/prometheus-msteams-0.1.0-mcp-12.tgz |
|
sf-notifier |
https://binary.mirantis.com/stacklight/helm/sf-notifier-0.2.0-mcp-10.tgz |
|
sf-reporter |
https://binary.mirantis.com/stacklight/helm/sf-reporter-0.2.0-mcp-10.tgz |
|
stacklight Updated |
https://binary.mirantis.com/stacklight/helm/stacklight-0.14.11.tgz |
|
telegraf-ds |
https://binary.mirantis.com/stacklight/helm/telegraf-ds-1.1.5-mcp-42.tgz |
|
telegraf-s |
https://binary.mirantis.com/stacklight/helm/telegraf-s-1.1.5-mcp-42.tgz |
|
telemeter-client |
https://binary.mirantis.com/stacklight/helm/telemeter-client-0.2.0-mcp-14.tgz |
|
telemeter-server |
https://binary.mirantis.com/stacklight/helm/telemeter-server-0.2.0-mcp-14.tgz |
|
Docker images |
alerta-web Updated |
mirantis.azurecr.io/stacklight/alerta-web:9-20240515023009 |
alertmanager Updated |
mirantis.azurecr.io/stacklight/alertmanager:v0-20240515023012 |
|
alertmanager-webhook-servicenow |
mirantis.azurecr.io/stacklight/alertmanager-webhook-servicenow:v0.1-20240318145925 |
|
alpine-utils Updated |
mirantis.azurecr.io/stacklight/alpine-utils:1-20240515023017 |
|
blackbox-exporter |
mirantis.azurecr.io/stacklight/blackbox-exporter:0-20240408080237 |
|
cadvisor Updated |
mirantis.azurecr.io/stacklight/cadvisor:v0.47-20240515023012 |
|
configmap-reload |
mirantis.azurecr.io/stacklight/configmap-reload:v0.8.0 |
|
curator |
mirantis.azurecr.io/stacklight/curator:5.7.6-20230404082402 |
|
elasticsearch-exporter |
mirantis.azurecr.io/stacklight/elasticsearch-exporter:v1.5.0 |
|
fluentd Updated |
mirantis.azurecr.io/stacklight/fluentd:1.15-20240515023009 |
|
grafana |
mirantis.azurecr.io/stacklight/grafana:10.3.1 |
|
grafana-image-renderer |
mirantis.azurecr.io/stacklight/grafana-image-renderer:3-20240318142141 |
|
k8s-sidecar Updated |
mirantis.azurecr.io/stacklight/k8s-sidecar:1-20240515023018 |
|
kube-state-metrics |
mirantis.azurecr.io/stacklight/kube-state-metrics:v2.10.1 |
|
kubectl Updated |
mirantis.azurecr.io/stacklight/kubectl:1.22-20240515023015 |
|
metric-collector Updated |
mirantis.azurecr.io/stacklight/metric-collector:v0.1-20240515023016 |
|
metricbeat Updated |
mirantis.azurecr.io/stacklight/metricbeat:7.12.1-20240515023009 |
|
node-exporter |
mirantis.azurecr.io/stacklight/node-exporter:v1.7.0 |
|
oauth2-proxy |
mirantis.azurecr.io/iam/oauth2-proxy:v7.1.3-8 |
|
opensearch Updated |
mirantis.azurecr.io/stacklight/opensearch:2-20240515023012 |
|
opensearch-dashboards Updated |
mirantis.azurecr.io/stacklight/opensearch-dashboards:2-20240515023010 |
|
pgbouncer Updated |
mirantis.azurecr.io/stacklight/pgbouncer:1-20240515023018 |
|
prometheus |
mirantis.azurecr.io/stacklight/prometheus:v2.48.0 |
|
prometheus-es-exporter Updated |
mirantis.azurecr.io/stacklight/prometheus-es-exporter:v0.14.0-20240515023016 |
|
prometheus-msteams |
mirantis.azurecr.io/stacklight/prometheus-msteams:v1.5-20240408080322 |
|
prometheus-patroni-exporter Updated |
mirantis.azurecr.io/stacklight/prometheus-patroni-exporter:0.0.1-20240515023017 |
|
prometheus-postgres-exporter |
mirantis.azurecr.io/stacklight/prometheus-postgres-exporter:v0.15.0 |
|
prometheus-relay Updated |
mirantis.azurecr.io/stacklight/prometheus-relay:v0.4-20240515023017 |
|
psql-client |
mirantis.azurecr.io/scale/psql-client:v13-20240222083402 |
|
sf-notifier Updated |
mirantis.azurecr.io/stacklight/sf-notifier:v0.4-20240515023012 |
|
sf-reporter |
mirantis.azurecr.io/stacklight/sf-reporter:v0.1-20240318145903 |
|
spilo Updated |
mirantis.azurecr.io/stacklight/spilo:13-2.1p9-20240515023010 |
|
stacklight-toolkit Updated |
mirantis.azurecr.io/stacklight/stacklight-toolkit:20240515023016 |
|
telegraf |
mirantis.azurecr.io/stacklight/telegraf:v1.9.1-20240515023008 Updated |
|
mirantis.azurecr.io/stacklight/telegraf:1-20240426131156 |
||
telemeter Updated |
mirantis.azurecr.io/stacklight/telemeter:4.4-20240515023015 |
|
telemeter-token-auth Updated |
mirantis.azurecr.io/stacklight/telemeter-token-auth:v0.1-20240515023012 |
Artifact |
Component |
Path |
|---|---|---|
Debian repositories |
System packages |
|
https://mirror.mirantis.com/kaas/ubuntu-2024-05-17-013445/ Updated |
||
https://mirror.mirantis.com/kaas/ubuntu-2024-05-17-013445.target.txt Updated |
||
MCR repositories |
MCR |
https://repos.mirantis.com/ubuntu/dists/focal/pool/stable-23.0/ |
Target ubuntu system |
Ubuntu |
https://binary.mirantis.com/bm/bin/efi/ubuntu/tgz-focal-20240517090228 Updated |
This section includes release notes for the patch Cluster release 17.1.4 that is introduced in the Container Cloud patch release 2.26.4 and is based on the previous Cluster releases of the 17.1.x series series.
This patch Cluster release introduces MOSK 24.1.4 that is based on Mirantis Kubernetes Engine 3.7.8 with Kubernetes 1.27 and Mirantis Container Runtime 23.0.9.
For details on MOSK 24.1.4, see Release notes 24.1.4.
For the list of enhancements and CVE fixes delivered with this patch Cluster release, see 2.26.4
For details on patch release delivery, see Patch releases
This section lists the artifacts of components included in the Cluster release 17.1.4.
Note
The components that are newly added, updated, deprecated, or removed
as compared to the previous release version, are marked
with a corresponding superscript,
for example, lcm-ansible Updated.
Artifact |
Component |
Path |
|---|---|---|
Helm chart Updated |
ceph-controller |
https://binary.mirantis.com/ceph/helm/ceph-operator-1.0.0-mcc-2.26.4-1.tgz |
Docker images |
ceph Updated |
mirantis.azurecr.io/mirantis/ceph:v17.2.7-12.cve |
ceph-controller Updated |
mirantis.azurecr.io/ceph/mcp/ceph-controller:2.26.4-0 |
|
cephcsi Updated |
mirantis.azurecr.io/mirantis/cephcsi:v3.9.0-9.cve |
|
cephcsi-registrar |
mirantis.azurecr.io/mirantis/cephcsi-registrar:v2.9.2-3.cve |
|
cephcsi-provisioner |
mirantis.azurecr.io/mirantis/cephcsi-provisioner:v3.6.2-3.cve |
|
cephcsi-snapshotter |
mirantis.azurecr.io/mirantis/cephcsi-snapshotter:v6.3.2-3.cve |
|
cephcsi-attacher |
mirantis.azurecr.io/mirantis/cephcsi-attacher:v4.4.2-3.cve |
|
cephcsi-resizer |
mirantis.azurecr.io/mirantis/cephcsi-resizer:v1.9.2-3.cve |
|
rook Updated |
mirantis.azurecr.io/ceph/rook:v1.12.10-18 |
Artifact |
Component |
Path |
|---|---|---|
Binaries |
lcm-ansible |
https://binary.mirantis.com/lcm/bin/lcm-ansible/v0.24.0-47-gf77368e/lcm-ansible.tar.gz |
lcm-agent Updated |
||
Helm charts Updated |
helm-controller |
https://binary.mirantis.com/core/helm/helm-controller-1.39.26.tgz |
managed-lcm-api |
https://binary.mirantis.com/core/helm/managed-lcm-api-1.39.26.tgz |
|
Docker images Updated |
helm-controller |
mirantis.azurecr.io/core/lcm-controller:1.39.26 |
Artifact |
Component |
Path |
|---|---|---|
Helm charts |
alerta |
https://binary.mirantis.com/stacklight/helm/alerta-0.1.0-mcp-33.tgz |
alertmanager-webhook-servicenow |
https://binary.mirantis.com/stacklight/helm/alertmanager-webhook-servicenow-0.2.0-mcp-8.tgz |
|
cadvisor |
https://binary.mirantis.com/stacklight/helm/cadvisor-0.1.0-mcp-7.tgz |
|
elasticsearch-curator |
https://binary.mirantis.com/stacklight/helm/elasticsearch-curator-1.5.0-mcp-15.tgz |
|
elasticsearch-exporter |
https://binary.mirantis.com/stacklight/helm/elasticsearch-exporter-1.2.0-mcp-10.tgz |
|
fluentd-logs |
https://binary.mirantis.com/stacklight/helm/fluentd-logs-0.1.0-mcp-223.tgz |
|
grafana |
https://binary.mirantis.com/stacklight/helm/grafana-3.3.10-mcp-290.tgz |
|
iam-proxy |
||
metric-collector |
https://binary.mirantis.com/stacklight/helm/metric-collector-0.3.0-mcp-17.tgz |
|
metricbeat |
https://binary.mirantis.com/stacklight/helm/metricbeat-1.7.1-mcp-25.tgz |
|
opensearch |
https://binary.mirantis.com/stacklight/helm/opensearch-0.1.0-mcp-86.tgz |
|
opensearch-dashboards |
https://binary.mirantis.com/stacklight/helm/opensearch-dashboards-0.1.0-mcp-54.tgz |
|
patroni |
https://binary.mirantis.com/stacklight/helm/patroni-0.15.1-mcp-59.tgz |
|
prometheus |
https://binary.mirantis.com/stacklight/helm/prometheus-8.11.4-mcp-258.tgz |
|
prometheus-blackbox-exporter |
https://binary.mirantis.com/stacklight/helm/prometheus-blackbox-exporter-0.3.0-mcp-19.tgz |
|
prometheus-es-exporter |
https://binary.mirantis.com/stacklight/helm/prometheus-es-exporter-1.0.0-mcp-18.tgz |
|
prometheus-msteams |
https://binary.mirantis.com/stacklight/helm/prometheus-msteams-0.1.0-mcp-12.tgz |
|
sf-notifier |
https://binary.mirantis.com/stacklight/helm/sf-notifier-0.2.0-mcp-10.tgz |
|
sf-reporter |
https://binary.mirantis.com/stacklight/helm/sf-reporter-0.2.0-mcp-10.tgz |
|
stacklight Updated |
https://binary.mirantis.com/stacklight/helm/stacklight-0.14.10.tgz |
|
telegraf-ds |
https://binary.mirantis.com/stacklight/helm/telegraf-ds-1.1.5-mcp-42.tgz |
|
telegraf-s |
https://binary.mirantis.com/stacklight/helm/telegraf-s-1.1.5-mcp-42.tgz |
|
telemeter-client |
https://binary.mirantis.com/stacklight/helm/telemeter-client-0.2.0-mcp-14.tgz |
|
telemeter-server |
https://binary.mirantis.com/stacklight/helm/telemeter-server-0.2.0-mcp-14.tgz |
|
Docker images |
alerta-web Updated |
mirantis.azurecr.io/stacklight/alerta-web:9-20240424023010 |
alertmanager Updated |
mirantis.azurecr.io/stacklight/alertmanager:v0-20240424023016 |
|
alertmanager-webhook-servicenow |
mirantis.azurecr.io/stacklight/alertmanager-webhook-servicenow:v0.1-20240318145925 |
|
alpine-utils Updated |
mirantis.azurecr.io/stacklight/alpine-utils:1-20240424023018 |
|
blackbox-exporter |
mirantis.azurecr.io/stacklight/blackbox-exporter:0-20240408080237 |
|
cadvisor Updated |
mirantis.azurecr.io/stacklight/cadvisor:v0.47-20240424023015 |
|
configmap-reload |
mirantis.azurecr.io/stacklight/configmap-reload:v0.8.0 |
|
curator |
mirantis.azurecr.io/stacklight/curator:5.7.6-20230404082402 |
|
elasticsearch-exporter |
mirantis.azurecr.io/stacklight/elasticsearch-exporter:v1.5.0 |
|
fluentd Updated |
mirantis.azurecr.io/stacklight/fluentd:1.15-20240424023010 |
|
grafana |
mirantis.azurecr.io/stacklight/grafana:10.3.1 |
|
grafana-image-renderer |
mirantis.azurecr.io/stacklight/grafana-image-renderer:3-20240318142141 |
|
k8s-sidecar Updated |
mirantis.azurecr.io/stacklight/k8s-sidecar:1-20240424023020 |
|
kube-state-metrics |
mirantis.azurecr.io/stacklight/kube-state-metrics:v2.10.1 |
|
kubectl Updated |
mirantis.azurecr.io/stacklight/kubectl:1.22-20240424023017 |
|
metric-collector Updated |
mirantis.azurecr.io/stacklight/metric-collector:v0.1-20240424023015 |
|
metricbeat Updated |
mirantis.azurecr.io/stacklight/metricbeat:7.12.1-20240424023010 |
|
node-exporter |
mirantis.azurecr.io/stacklight/node-exporter:v1.7.0 |
|
oauth2-proxy |
mirantis.azurecr.io/iam/oauth2-proxy:v7.1.3-8 |
|
opensearch Updated |
mirantis.azurecr.io/stacklight/opensearch:2-20240424023015 |
|
opensearch-dashboards Updated |
mirantis.azurecr.io/stacklight/opensearch-dashboards:2-20240424023010 |
|
pgbouncer Updated |
mirantis.azurecr.io/stacklight/pgbouncer:1-20240424023020 |
|
prometheus |
mirantis.azurecr.io/stacklight/prometheus:v2.48.0 |
|
prometheus-es-exporter Updated |
mirantis.azurecr.io/stacklight/prometheus-es-exporter:v0.14.0-20240424023018 |
|
prometheus-msteams |
mirantis.azurecr.io/stacklight/prometheus-msteams:v1.5-20240408080322 |
|
prometheus-patroni-exporter Updated |
mirantis.azurecr.io/stacklight/prometheus-patroni-exporter:0.0.1-20240424023018 |
|
prometheus-postgres-exporter |
mirantis.azurecr.io/stacklight/prometheus-postgres-exporter:v0.15.0 |
|
prometheus-relay Updated |
mirantis.azurecr.io/stacklight/prometheus-relay:v0.4-20240424023017 |
|
psql-client |
mirantis.azurecr.io/scale/psql-client:v13-20240222083402 |
|
sf-notifier Updated |
mirantis.azurecr.io/stacklight/sf-notifier:v0.4-20240424023015 |
|
sf-reporter |
mirantis.azurecr.io/stacklight/sf-reporter:v0.1-20240318145903 |
|
spilo Updated |
mirantis.azurecr.io/stacklight/spilo:13-2.1p9-20240424023015 |
|
stacklight-toolkit Updated |
mirantis.azurecr.io/stacklight/stacklight-toolkit:20240424023017 |
|
telegraf |
mirantis.azurecr.io/stacklight/telegraf:v1.9.1-20240424023009 Updated |
|
mirantis.azurecr.io/stacklight/telegraf:1-20240426131156 Updated |
||
telemeter Updated |
mirantis.azurecr.io/stacklight/telemeter:4.4-20240424023014 |
|
telemeter-token-auth Updated |
mirantis.azurecr.io/stacklight/telemeter-token-auth:v0.1-20240424023015 |
Artifact |
Component |
Path |
|---|---|---|
Debian repositories |
System packages |
|
https://mirror.mirantis.com/kaas/ubuntu-2024-05-02-014050/ Updated |
||
https://mirror.mirantis.com/kaas/ubuntu-2024-05-02-014050.target.txt Updated |
||
MCR repositories |
MCR |
https://repos.mirantis.com/ubuntu/dists/focal/pool/stable-23.0/ |
Target ubuntu system |
Ubuntu |
https://binary.mirantis.com/bm/bin/efi/ubuntu/tgz-focal-20240502102020 Updated |
This section includes release notes for the patch Cluster release 17.1.3 that is introduced in the Container Cloud patch release 2.26.3 and is based on the previous Cluster releases of the 17.1.x series series.
This patch Cluster release introduces MOSK 24.1.3 that is based on Mirantis Kubernetes Engine 3.7.7 with Kubernetes 1.27 and Mirantis Container Runtime 23.0.9.
For details on MOSK 24.1.3, see Release notes 24.1.3.
For the list of enhancements and CVE fixes delivered with this patch Cluster release, see 2.26.3
For details on patch release delivery, see Patch releases
This section lists the artifacts of components included in the Cluster release 17.1.3.
Note
The components that are newly added, updated, deprecated, or removed
as compared to the previous release version, are marked
with a corresponding superscript,
for example, lcm-ansible Updated.
Artifact |
Component |
Path |
|---|---|---|
Helm chart Updated |
ceph-controller |
https://binary.mirantis.com/ceph/helm/ceph-operator-1.0.0-mcc-2.26.3-1.tgz |
Docker images Updated |
ceph |
mirantis.azurecr.io/mirantis/ceph:v17.2.7-11.cve |
ceph-controller |
mirantis.azurecr.io/ceph/mcp/ceph-controller:2.26.3-0 |
|
cephcsi |
mirantis.azurecr.io/mirantis/cephcsi:v3.9.0-8.cve |
|
cephcsi-registrar |
mirantis.azurecr.io/mirantis/cephcsi-registrar:v2.9.2-3.cve |
|
cephcsi-provisioner |
mirantis.azurecr.io/mirantis/cephcsi-provisioner:v3.6.2-3.cve |
|
cephcsi-snapshotter |
mirantis.azurecr.io/mirantis/cephcsi-snapshotter:v6.3.2-3.cve |
|
cephcsi-attacher |
mirantis.azurecr.io/mirantis/cephcsi-attacher:v4.4.2-3.cve |
|
cephcsi-resizer |
mirantis.azurecr.io/mirantis/cephcsi-resizer:v1.9.2-3.cve |
|
rook |
mirantis.azurecr.io/ceph/rook:v1.12.10-17 |
Artifact |
Component |
Path |
|---|---|---|
Binaries |
lcm-ansible |
https://binary.mirantis.com/lcm/bin/lcm-ansible/v0.24.0-47-gf77368e/lcm-ansible.tar.gz |
lcm-agent Updated |
||
Helm charts Updated |
helm-controller |
https://binary.mirantis.com/core/helm/helm-controller-1.39.23.tgz |
managed-lcm-api |
https://binary.mirantis.com/core/helm/managed-lcm-api-1.39.23.tgz |
|
Docker images Updated |
helm-controller |
mirantis.azurecr.io/core/lcm-controller:1.39.23 |
Artifact |
Component |
Path |
|---|---|---|
Helm charts |
alerta |
https://binary.mirantis.com/stacklight/helm/alerta-0.1.0-mcp-33.tgz |
alertmanager-webhook-servicenow |
https://binary.mirantis.com/stacklight/helm/alertmanager-webhook-servicenow-0.2.0-mcp-8.tgz |
|
cadvisor |
https://binary.mirantis.com/stacklight/helm/cadvisor-0.1.0-mcp-7.tgz |
|
elasticsearch-curator |
https://binary.mirantis.com/stacklight/helm/elasticsearch-curator-1.5.0-mcp-15.tgz |
|
elasticsearch-exporter |
https://binary.mirantis.com/stacklight/helm/elasticsearch-exporter-1.2.0-mcp-10.tgz |
|
fluentd-logs |
https://binary.mirantis.com/stacklight/helm/fluentd-logs-0.1.0-mcp-223.tgz |
|
grafana |
https://binary.mirantis.com/stacklight/helm/grafana-3.3.10-mcp-290.tgz |
|
iam-proxy |
||
metric-collector |
https://binary.mirantis.com/stacklight/helm/metric-collector-0.3.0-mcp-17.tgz |
|
metricbeat |
https://binary.mirantis.com/stacklight/helm/metricbeat-1.7.1-mcp-25.tgz |
|
opensearch |
https://binary.mirantis.com/stacklight/helm/opensearch-0.1.0-mcp-86.tgz |
|
opensearch-dashboards |
https://binary.mirantis.com/stacklight/helm/opensearch-dashboards-0.1.0-mcp-54.tgz |
|
patroni |
https://binary.mirantis.com/stacklight/helm/patroni-0.15.1-mcp-59.tgz |
|
prometheus |
https://binary.mirantis.com/stacklight/helm/prometheus-8.11.4-mcp-258.tgz |
|
prometheus-blackbox-exporter |
https://binary.mirantis.com/stacklight/helm/prometheus-blackbox-exporter-0.3.0-mcp-19.tgz |
|
prometheus-es-exporter |
https://binary.mirantis.com/stacklight/helm/prometheus-es-exporter-1.0.0-mcp-18.tgz |
|
prometheus-msteams |
https://binary.mirantis.com/stacklight/helm/prometheus-msteams-0.1.0-mcp-12.tgz |
|
sf-notifier |
https://binary.mirantis.com/stacklight/helm/sf-notifier-0.2.0-mcp-10.tgz |
|
sf-reporter |
https://binary.mirantis.com/stacklight/helm/sf-reporter-0.2.0-mcp-10.tgz |
|
stacklight Updated |
https://binary.mirantis.com/stacklight/helm/stacklight-0.14.9.tgz |
|
telegraf-ds |
https://binary.mirantis.com/stacklight/helm/telegraf-ds-1.1.5-mcp-42.tgz |
|
telegraf-s |
https://binary.mirantis.com/stacklight/helm/telegraf-s-1.1.5-mcp-42.tgz |
|
telemeter-client |
https://binary.mirantis.com/stacklight/helm/telemeter-client-0.2.0-mcp-14.tgz |
|
telemeter-server |
https://binary.mirantis.com/stacklight/helm/telemeter-server-0.2.0-mcp-14.tgz |
|
Docker images |
alerta-web Updated |
mirantis.azurecr.io/stacklight/alerta-web:9-20240403023008 |
alertmanager Updated |
mirantis.azurecr.io/stacklight/alertmanager:v0-20240408080051 |
|
alertmanager-webhook-servicenow |
mirantis.azurecr.io/stacklight/alertmanager-webhook-servicenow:v0.1-20240318145925 |
|
alpine-utils Updated |
mirantis.azurecr.io/stacklight/alpine-utils:1-20240403023017 |
|
blackbox-exporter Updated |
mirantis.azurecr.io/stacklight/blackbox-exporter:0-20240408080237 |
|
cadvisor Updated |
mirantis.azurecr.io/stacklight/cadvisor:v0.47-20240408140050 |
|
configmap-reload |
mirantis.azurecr.io/stacklight/configmap-reload:v0.8.0 |
|
curator |
mirantis.azurecr.io/stacklight/curator:5.7.6-20230404082402 |
|
elasticsearch-exporter |
mirantis.azurecr.io/stacklight/elasticsearch-exporter:v1.5.0 |
|
fluentd Updated |
mirantis.azurecr.io/stacklight/fluentd:1.15-20240403023009 |
|
grafana |
mirantis.azurecr.io/stacklight/grafana:10.3.1 |
|
grafana-image-renderer |
mirantis.azurecr.io/stacklight/grafana-image-renderer:3-20240318142141 |
|
k8s-sidecar Updated |
mirantis.azurecr.io/stacklight/k8s-sidecar:1-20240403023017 |
|
kube-state-metrics |
mirantis.azurecr.io/stacklight/kube-state-metrics:v2.10.1 |
|
kubectl Updated |
mirantis.azurecr.io/stacklight/kubectl:1.22-20240403023014 |
|
metric-collector Updated |
mirantis.azurecr.io/stacklight/metric-collector:v0.1-20240408155718 |
|
metricbeat Updated |
mirantis.azurecr.io/stacklight/metricbeat:7.12.1-20240408135717 |
|
node-exporter |
mirantis.azurecr.io/stacklight/node-exporter:v1.7.0 |
|
oauth2-proxy Updated |
mirantis.azurecr.io/iam/oauth2-proxy:v7.1.3-8 |
|
opensearch Updated |
mirantis.azurecr.io/stacklight/opensearch:2-20240403023014 |
|
opensearch-dashboards Updated |
mirantis.azurecr.io/stacklight/opensearch-dashboards:2-20240403023009 |
|
pgbouncer Updated |
mirantis.azurecr.io/stacklight/pgbouncer:1-20240403023017 |
|
prometheus |
mirantis.azurecr.io/stacklight/prometheus:v2.48.0 |
|
prometheus-es-exporter Updated |
mirantis.azurecr.io/stacklight/prometheus-es-exporter:v0.14.0-20240403023016 |
|
prometheus-msteams Updated |
mirantis.azurecr.io/stacklight/prometheus-msteams:v1.5-20240408080322 |
|
prometheus-patroni-exporter Updated |
mirantis.azurecr.io/stacklight/prometheus-patroni-exporter:0.0.1-20240403023017 |
|
prometheus-postgres-exporter |
mirantis.azurecr.io/stacklight/prometheus-postgres-exporter:v0.15.0 |
|
prometheus-relay Updated |
mirantis.azurecr.io/stacklight/prometheus-relay:v0.4-20240408135804 |
|
psql-client |
mirantis.azurecr.io/scale/psql-client:v13-20240222083402 |
|
sf-notifier Updated |
mirantis.azurecr.io/stacklight/sf-notifier:v0.4-20240403023015 |
|
sf-reporter |
mirantis.azurecr.io/stacklight/sf-reporter:v0.1-20240318145903 |
|
spilo Updated |
mirantis.azurecr.io/stacklight/spilo:13-2.1p9-20240403023013 |
|
stacklight-toolkit Updated |
mirantis.azurecr.io/stacklight/stacklight-toolkit:20240403023016 |
|
telegraf |
mirantis.azurecr.io/stacklight/telegraf:v1.9.1-20240403023008 Updated |
|
mirantis.azurecr.io/stacklight/telegraf:1-20240306130859 |
||
telemeter Updated |
mirantis.azurecr.io/stacklight/telemeter:4.4-20240408155750 |
|
telemeter-token-auth Updated |
mirantis.azurecr.io/stacklight/telemeter-token-auth:v0.1-20240408155738 |
Artifact |
Component |
Path |
|---|---|---|
Debian repositories |
System packages |
|
https://mirror.mirantis.com/kaas/ubuntu-2024-04-11-013237/ Updated |
||
https://mirror.mirantis.com/kaas/ubuntu-2024-04-11-013237.target.txt Updated |
||
MCR repositories |
MCR |
https://repos.mirantis.com/ubuntu/dists/focal/pool/stable-23.0/ |
Target ubuntu system |
Ubuntu |
https://binary.mirantis.com/bm/bin/efi/ubuntu/tgz-focal-20240411171541 Updated |
This section includes release notes for the patch Cluster release 17.1.2 that is introduced in the Container Cloud patch release 2.26.2 and is based on the Cluster releases 17.1.1 and 17.1.0.
This patch Cluster release introduces MOSK 24.1.2 that
is based on Mirantis Kubernetes Engine 3.7.6 with Kubernetes 1.27 and Mirantis
Container Runtime 23.0.9, in which docker-ee-cli was updated to version
23.0.10 to fix several CVEs.
For details on MOSK 24.1.2, see Release notes 24.1.2.
For the list of enhancements and CVE fixes delivered with this patch Cluster release, see 2.26.2
For details on patch release delivery, see Patch releases
This section lists the artifacts of components included in the Cluster release 17.1.2.
Note
The components that are newly added, updated, deprecated, or removed
as compared to the previous release version, are marked
with a corresponding superscript,
for example, lcm-ansible Updated.
Artifact |
Component |
Path |
|---|---|---|
Helm chart Updated |
ceph-controller |
https://binary.mirantis.com/ceph/helm/ceph-operator-1.0.0-mcc-2.26.2-4.tgz |
Docker images Updated |
ceph |
mirantis.azurecr.io/mirantis/ceph:v17.2.7-10.release |
ceph-controller |
mirantis.azurecr.io/ceph/mcp/ceph-controller:2.26.2-3 |
|
cephcsi |
mirantis.azurecr.io/mirantis/cephcsi:v3.9.0-7.release |
|
cephcsi-registrar |
mirantis.azurecr.io/mirantis/cephcsi-registrar:v2.9.2-2.release |
|
cephcsi-provisioner |
mirantis.azurecr.io/mirantis/cephcsi-provisioner:v3.6.2-2.release |
|
cephcsi-snapshotter |
mirantis.azurecr.io/mirantis/cephcsi-snapshotter:v6.3.2-2.release |
|
cephcsi-attacher |
mirantis.azurecr.io/mirantis/cephcsi-attacher:v4.4.2-2.release |
|
cephcsi-resizer |
mirantis.azurecr.io/mirantis/cephcsi-resizer:v1.9.2-2.release |
|
rook |
mirantis.azurecr.io/ceph/rook:v1.12.10-16 |
Artifact |
Component |
Path |
|---|---|---|
Binaries |
lcm-ansible |
https://binary.mirantis.com/lcm/bin/lcm-ansible/v0.24.0-47-gf77368e/lcm-ansible.tar.gz |
lcm-agent Updated |
||
Helm charts Updated |
helm-controller |
https://binary.mirantis.com/core/helm/helm-controller-1.39.19.tgz |
managed-lcm-api |
https://binary.mirantis.com/core/helm/managed-lcm-api-1.39.19.tgz |
|
Docker images Updated |
helm-controller |
mirantis.azurecr.io/core/lcm-controller:1.39.19 |
Artifact |
Component |
Path |
|---|---|---|
Helm charts |
alerta |
https://binary.mirantis.com/stacklight/helm/alerta-0.1.0-mcp-33.tgz |
alertmanager-webhook-servicenow |
https://binary.mirantis.com/stacklight/helm/alertmanager-webhook-servicenow-0.2.0-mcp-8.tgz |
|
cadvisor |
https://binary.mirantis.com/stacklight/helm/cadvisor-0.1.0-mcp-7.tgz |
|
elasticsearch-curator |
https://binary.mirantis.com/stacklight/helm/elasticsearch-curator-1.5.0-mcp-15.tgz |
|
elasticsearch-exporter |
https://binary.mirantis.com/stacklight/helm/elasticsearch-exporter-1.2.0-mcp-10.tgz |
|
fluentd-logs |
https://binary.mirantis.com/stacklight/helm/fluentd-logs-0.1.0-mcp-223.tgz |
|
grafana Updated |
https://binary.mirantis.com/stacklight/helm/grafana-3.3.10-mcp-290.tgz |
|
iam-proxy |
||
metric-collector |
https://binary.mirantis.com/stacklight/helm/metric-collector-0.3.0-mcp-17.tgz |
|
metricbeat |
https://binary.mirantis.com/stacklight/helm/metricbeat-1.7.1-mcp-25.tgz |
|
opensearch |
https://binary.mirantis.com/stacklight/helm/opensearch-0.1.0-mcp-86.tgz |
|
opensearch-dashboards |
https://binary.mirantis.com/stacklight/helm/opensearch-dashboards-0.1.0-mcp-54.tgz |
|
patroni |
https://binary.mirantis.com/stacklight/helm/patroni-0.15.1-mcp-59.tgz |
|
prometheus |
https://binary.mirantis.com/stacklight/helm/prometheus-8.11.4-mcp-258.tgz |
|
prometheus-blackbox-exporter |
https://binary.mirantis.com/stacklight/helm/prometheus-blackbox-exporter-0.3.0-mcp-19.tgz |
|
prometheus-es-exporter |
https://binary.mirantis.com/stacklight/helm/prometheus-es-exporter-1.0.0-mcp-18.tgz |
|
prometheus-msteams |
https://binary.mirantis.com/stacklight/helm/prometheus-msteams-0.1.0-mcp-12.tgz |
|
sf-notifier |
https://binary.mirantis.com/stacklight/helm/sf-notifier-0.2.0-mcp-10.tgz |
|
sf-reporter |
https://binary.mirantis.com/stacklight/helm/sf-reporter-0.2.0-mcp-10.tgz |
|
stacklight Updated |
https://binary.mirantis.com/stacklight/helm/stacklight-0.14.8.tgz |
|
telegraf-ds Updated |
https://binary.mirantis.com/stacklight/helm/telegraf-ds-1.1.5-mcp-42.tgz |
|
telegraf-s Updated |
https://binary.mirantis.com/stacklight/helm/telegraf-s-1.1.5-mcp-42.tgz |
|
telemeter-client |
https://binary.mirantis.com/stacklight/helm/telemeter-client-0.2.0-mcp-14.tgz |
|
telemeter-server |
https://binary.mirantis.com/stacklight/helm/telemeter-server-0.2.0-mcp-14.tgz |
|
Docker images |
alerta-web Updated |
mirantis.azurecr.io/stacklight/alerta-web:9-20240318062240 |
alertmanager Updated |
mirantis.azurecr.io/stacklight/alertmanager:v0-20240318062244 |
|
alertmanager-webhook-servicenow Updated |
mirantis.azurecr.io/stacklight/alertmanager-webhook-servicenow:v0.1-20240318145925 |
|
alpine-utils Updated |
mirantis.azurecr.io/stacklight/alpine-utils:1-20240318062249 |
|
blackbox-exporter |
mirantis.azurecr.io/stacklight/blackbox-exporter:0-20231204053401 |
|
cadvisor Updated |
mirantis.azurecr.io/stacklight/cadvisor:v0.47-20240318062245 |
|
configmap-reload |
mirantis.azurecr.io/stacklight/configmap-reload:v0.8.0 |
|
curator |
mirantis.azurecr.io/stacklight/curator:5.7.6-20230404082402 |
|
elasticsearch-exporter |
mirantis.azurecr.io/stacklight/elasticsearch-exporter:v1.5.0 |
|
fluentd Updated |
mirantis.azurecr.io/stacklight/fluentd:1.15-20240318062244 |
|
grafana |
mirantis.azurecr.io/stacklight/grafana:10.3.1 |
|
grafana-image-renderer Updated |
mirantis.azurecr.io/stacklight/grafana-image-renderer:3-20240318142141 |
|
k8s-sidecar Updated |
mirantis.azurecr.io/stacklight/k8s-sidecar:1-20240318062249 |
|
kube-state-metrics |
mirantis.azurecr.io/stacklight/kube-state-metrics:v2.10.1 |
|
kubectl Updated |
mirantis.azurecr.io/stacklight/kubectl:1.22-20240318062246 |
|
metric-collector Updated |
mirantis.azurecr.io/stacklight/metric-collector:v0.1-20240318062249 |
|
metricbeat Updated |
mirantis.azurecr.io/stacklight/metricbeat:7.12.1-20240318062240 |
|
node-exporter |
mirantis.azurecr.io/stacklight/node-exporter:v1.7.0 |
|
oauth2-proxy |
mirantis.azurecr.io/iam/oauth2-proxy:v7.1.3-7 |
|
opensearch Updated |
mirantis.azurecr.io/stacklight/opensearch:2-20240318062244 |
|
opensearch-dashboards Updated |
mirantis.azurecr.io/stacklight/opensearch-dashboards:2-20240318062241 |
|
pgbouncer Updated |
mirantis.azurecr.io/stacklight/pgbouncer:1-20240318062240 |
|
prometheus |
mirantis.azurecr.io/stacklight/prometheus:v2.48.0 |
|
prometheus-es-exporter Updated |
mirantis.azurecr.io/stacklight/prometheus-es-exporter:v0.14.0-20240318062248 |
|
prometheus-msteams |
mirantis.azurecr.io/stacklight/prometheus-msteams:v1.5-20231204064415 |
|
prometheus-patroni-exporter Updated |
mirantis.azurecr.io/stacklight/prometheus-patroni-exporter:0.0.1-20240318062250 |
|
prometheus-postgres-exporter |
mirantis.azurecr.io/stacklight/prometheus-postgres-exporter:v0.15.0 |
|
prometheus-relay Updated |
mirantis.azurecr.io/stacklight/prometheus-relay:v0.4-20240318062249 |
|
psql-client |
mirantis.azurecr.io/scale/psql-client:v13-20240222083402 |
|
sf-notifier Updated |
mirantis.azurecr.io/stacklight/sf-notifier:v0.4-20240318062246 |
|
sf-reporter Updated |
mirantis.azurecr.io/stacklight/sf-reporter:v0.1-20240318145903 |
|
spilo Updated |
mirantis.azurecr.io/stacklight/spilo:13-2.1p9-20240318062245 |
|
stacklight-toolkit Updated |
mirantis.azurecr.io/stacklight/stacklight-toolkit:20240318062247 |
|
telegraf |
mirantis.azurecr.io/stacklight/telegraf:v1.9.1-20240318062240 Updated |
|
mirantis.azurecr.io/stacklight/telegraf:1-20240306130859 Updated |
||
telemeter Updated |
mirantis.azurecr.io/stacklight/telemeter:4.4-20240318062245 |
|
telemeter-token-auth Updated |
mirantis.azurecr.io/stacklight/telemeter-token-auth:v0.1-20240318062247 |
Artifact |
Component |
Path |
|---|---|---|
Debian repositories |
System packages |
|
http://mirror.mirantis.com/kaas/kubernetes-extra-rhel7-0.0.8/ |
||
https://mirror.mirantis.com/kaas/ubuntu-2024-03-24-012650/ Updated |
||
https://mirror.mirantis.com/kaas/ubuntu-2024-03-24-012650.target.txt Updated |
||
MCR repositories |
MCR |
https://repos.mirantis.com/ubuntu/dists/focal/pool/stable-23.0/ |
Target ubuntu system |
Ubuntu |
https://binary.mirantis.com/bm/bin/efi/ubuntu/tgz-focal-20240324172903 Updated |
This section includes release notes for the patch Cluster release 17.1.1 that is introduced in the Container Cloud patch release 2.26.1 and is based on the Cluster release 17.1.0.
This patch Cluster release introduces MOSK 24.1.1 that is based on Mirantis Kubernetes Engine 3.7.5 with Kubernetes 1.27 and Mirantis Container Runtime 23.0.9.
For details on MOSK 24.1.1, see Release notes 24.1.1.
For the list of enhancements and CVE fixes delivered with this patch Cluster release, see 2.26.1
For details on patch release delivery, see Patch releases
This section lists the artifacts of components included in the Cluster release 17.1.1.
Note
The components that are newly added, updated, deprecated, or removed
as compared to the previous release version, are marked
with a corresponding superscript,
for example, lcm-ansible Updated.
Artifact |
Component |
Path |
|---|---|---|
Helm chart Updated |
ceph-controller |
https://binary.mirantis.com/ceph/helm/ceph-operator-1.0.0-mcc-2.26.1-1.tgz |
Docker images |
ceph Updated |
mirantis.azurecr.io/mirantis/ceph:v17.2.7-9.release |
ceph-controller Updated |
mirantis.azurecr.io/ceph/mcp/ceph-controller:2.26.1-0 |
|
cephcsi Updated |
mirantis.azurecr.io/mirantis/cephcsi:v3.9.0-5.release |
|
cephcsi-registrar |
mirantis.azurecr.io/mirantis/cephcsi-registrar:v2.9.2-1.release |
|
cephcsi-provisioner |
mirantis.azurecr.io/mirantis/cephcsi-provisioner:v3.6.2-1.release |
|
cephcsi-snapshotter |
mirantis.azurecr.io/mirantis/cephcsi-snapshotter:v6.3.2-1.release |
|
cephcsi-attacher |
mirantis.azurecr.io/mirantis/cephcsi-attacher:v4.4.2-1.release |
|
cephcsi-resizer |
mirantis.azurecr.io/mirantis/cephcsi-resizer:v1.9.2-1.release |
|
rook Updated |
mirantis.azurecr.io/ceph/rook:v1.12.10-14 |
Artifact |
Component |
Path |
|---|---|---|
Binaries Updated |
lcm-ansible |
https://binary.mirantis.com/lcm/bin/lcm-ansible/v0.24.0-47-gf77368e/lcm-ansible.tar.gz |
lcm-agent |
||
Helm charts Updated |
helm-controller |
https://binary.mirantis.com/core/helm/helm-controller-1.39.15.tgz |
managed-lcm-api |
https://binary.mirantis.com/core/helm/managed-lcm-api-1.39.15.tgz |
|
Docker images Updated |
helm-controller |
mirantis.azurecr.io/core/lcm-controller:1.39.15 |
Artifact |
Component |
Path |
|---|---|---|
Helm charts |
alerta |
https://binary.mirantis.com/stacklight/helm/alerta-0.1.0-mcp-33.tgz |
alertmanager-webhook-servicenow |
https://binary.mirantis.com/stacklight/helm/alertmanager-webhook-servicenow-0.2.0-mcp-8.tgz |
|
cadvisor |
https://binary.mirantis.com/stacklight/helm/cadvisor-0.1.0-mcp-7.tgz |
|
elasticsearch-curator |
https://binary.mirantis.com/stacklight/helm/elasticsearch-curator-1.5.0-mcp-15.tgz |
|
elasticsearch-exporter |
https://binary.mirantis.com/stacklight/helm/elasticsearch-exporter-1.2.0-mcp-10.tgz |
|
fluentd-logs Updated |
https://binary.mirantis.com/stacklight/helm/fluentd-logs-0.1.0-mcp-223.tgz |
|
grafana Updated |
https://binary.mirantis.com/stacklight/helm/grafana-3.3.10-mcp-285.tgz |
|
iam-proxy |
||
metric-collector |
https://binary.mirantis.com/stacklight/helm/metric-collector-0.3.0-mcp-17.tgz |
|
metricbeat |
https://binary.mirantis.com/stacklight/helm/metricbeat-1.7.1-mcp-25.tgz |
|
opensearch Updated |
https://binary.mirantis.com/stacklight/helm/opensearch-0.1.0-mcp-86.tgz |
|
opensearch-dashboards Updated |
https://binary.mirantis.com/stacklight/helm/opensearch-dashboards-0.1.0-mcp-54.tgz |
|
patroni |
https://binary.mirantis.com/stacklight/helm/patroni-0.15.1-mcp-59.tgz |
|
prometheus |
https://binary.mirantis.com/stacklight/helm/prometheus-8.11.4-mcp-258.tgz |
|
prometheus-blackbox-exporter |
https://binary.mirantis.com/stacklight/helm/prometheus-blackbox-exporter-0.3.0-mcp-19.tgz |
|
prometheus-es-exporter |
https://binary.mirantis.com/stacklight/helm/prometheus-es-exporter-1.0.0-mcp-18.tgz |
|
prometheus-msteams |
https://binary.mirantis.com/stacklight/helm/prometheus-msteams-0.1.0-mcp-12.tgz |
|
sf-notifier |
https://binary.mirantis.com/stacklight/helm/sf-notifier-0.2.0-mcp-10.tgz |
|
sf-reporter |
https://binary.mirantis.com/stacklight/helm/sf-reporter-0.2.0-mcp-10.tgz |
|
stacklight Updated |
https://binary.mirantis.com/stacklight/helm/stacklight-0.14.7.tgz |
|
telegraf-ds |
https://binary.mirantis.com/stacklight/helm/telegraf-ds-1.1.5-mcp-40.tgz |
|
telegraf-s |
https://binary.mirantis.com/stacklight/helm/telegraf-s-1.1.5-mcp-41.tgz |
|
telemeter-client |
https://binary.mirantis.com/stacklight/helm/telemeter-client-0.2.0-mcp-14.tgz |
|
telemeter-server |
https://binary.mirantis.com/stacklight/helm/telemeter-server-0.2.0-mcp-14.tgz |
|
Docker images |
alerta-web Updated |
mirantis.azurecr.io/stacklight/alerta-web:9-20240228023009 |
alertmanager Updated |
mirantis.azurecr.io/stacklight/alertmanager:v0-20240228023011 |
|
alertmanager-webhook-servicenow Updated |
mirantis.azurecr.io/stacklight/alertmanager-webhook-servicenow:v0.1-20240226135626 |
|
alpine-utils Updated |
mirantis.azurecr.io/stacklight/alpine-utils:1-20240228023020 |
|
blackbox-exporter |
mirantis.azurecr.io/stacklight/blackbox-exporter:0-20231204053401 |
|
cadvisor Updated |
mirantis.azurecr.io/stacklight/cadvisor:v0.47-20240228023015 |
|
configmap-reload |
mirantis.azurecr.io/stacklight/configmap-reload:v0.8.0 |
|
curator |
mirantis.azurecr.io/stacklight/curator:5.7.6-20230404082402 |
|
elasticsearch-exporter |
mirantis.azurecr.io/stacklight/elasticsearch-exporter:v1.5.0 |
|
fluentd Updated |
mirantis.azurecr.io/stacklight/fluentd:1.15-20240228023011 |
|
grafana |
mirantis.azurecr.io/stacklight/grafana:10.3.1 |
|
grafana-image-renderer Updated |
mirantis.azurecr.io/stacklight/grafana-image-renderer:3-20240228060359 |
|
k8s-sidecar Updated |
mirantis.azurecr.io/stacklight/k8s-sidecar:1-20240228023018 |
|
kube-state-metrics |
mirantis.azurecr.io/stacklight/kube-state-metrics:v2.10.1 |
|
kubectl Updated |
mirantis.azurecr.io/stacklight/kubectl:1.22-20240228023017 |
|
metric-collector Updated |
mirantis.azurecr.io/stacklight/metric-collector:v0.1-20240228023015 |
|
metricbeat Updated |
mirantis.azurecr.io/stacklight/metricbeat:7.12.1-20240228023010 |
|
node-exporter |
mirantis.azurecr.io/stacklight/node-exporter:v1.7.0 |
|
oauth2-proxy |
mirantis.azurecr.io/iam/oauth2-proxy:v7.1.3-7 |
|
opensearch Updated |
mirantis.azurecr.io/stacklight/opensearch:2-20240228023015 |
|
opensearch-dashboards Updated |
mirantis.azurecr.io/stacklight/opensearch-dashboards:2-20240228023009 |
|
pgbouncer Updated |
mirantis.azurecr.io/stacklight/pgbouncer:1-20240228023020 |
|
prometheus |
mirantis.azurecr.io/stacklight/prometheus:v2.48.0 |
|
prometheus-es-exporter Updated |
mirantis.azurecr.io/stacklight/prometheus-es-exporter:v0.14.0-20240228023015 |
|
prometheus-msteams |
mirantis.azurecr.io/stacklight/prometheus-msteams:v1.5-20231204064415 |
|
prometheus-patroni-exporter Updated |
mirantis.azurecr.io/stacklight/prometheus-patroni-exporter:0.0.1-20240228023020 |
|
prometheus-postgres-exporter |
mirantis.azurecr.io/stacklight/prometheus-postgres-exporter:v0.15.0 |
|
prometheus-relay Updated |
mirantis.azurecr.io/stacklight/prometheus-relay:v0.4-20240228023015 |
|
psql-client Updated |
mirantis.azurecr.io/scale/psql-client:v13-20240222083402 |
|
sf-notifier Updated |
mirantis.azurecr.io/stacklight/sf-notifier:v0.4-20240228023016 |
|
sf-reporter Updated |
mirantis.azurecr.io/stacklight/sf-reporter:v0.1-20240226135743 |
|
spilo Updated |
mirantis.azurecr.io/stacklight/spilo:13-2.1p9-20240228023016 |
|
stacklight-toolkit Updated |
mirantis.azurecr.io/stacklight/stacklight-toolkit:20240228023017 |
|
telegraf |
mirantis.azurecr.io/stacklight/telegraf:v1.9.1-20240228023008 Updated |
|
mirantis.azurecr.io/stacklight/telegraf:1-20240219105842 Updated |
||
telemeter Updated |
mirantis.azurecr.io/stacklight/telemeter:4.4-20240228023013 |
|
telemeter-token-auth Updated |
mirantis.azurecr.io/stacklight/telemeter-token-auth:v0.1-20240228023014 |
Artifact |
Component |
Path |
|---|---|---|
Debian repositories |
System packages |
|
http://mirror.mirantis.com/kaas/kubernetes-extra-rhel7-0.0.8/ |
||
https://mirror.mirantis.com/kaas/ubuntu-2024-03-02-014158/ Updated |
||
https://mirror.mirantis.com/kaas/ubuntu-2024-03-02-014158.target.txt Updated |
||
MCR repositories |
MCR |
https://repos.mirantis.com/ubuntu/dists/focal/pool/stable-23.0/ |
Target ubuntu system |
Ubuntu |
https://binary.mirantis.com/bm/bin/efi/ubuntu/tgz-focal-20240302175618 Updated |
This section outlines release notes for the major Cluster release 17.1.0 that is introduced in the Container Cloud release 2.26.0. This Cluster release is based on the Cluster release 16.1.0. The Cluster release 17.1.0 supports:
Mirantis OpenStack for Kubernetes (MOSK) 24.1. For details, see Release notes 24.1.
Mirantis Kubernetes Engine (MKE) 3.7.5. For details, see MKE Release Notes.
Mirantis Container Runtime (MCR) 23.0.9. For details, see MCR Release Notes.
Kubernetes 1.27.
For the list of known and addressed issues, refer to the Container Cloud release 2.26.0 section.
This section outlines new features implemented in the Cluster release 17.1.0 that is introduced in the Container Cloud release 2.26.0.
Introduced support for Mirantis Container Runtime (MCR) 23.0.9 and Mirantis Kubernetes Engine (MKE) 3.7.5 that supports Kubernetes 1.27.
On existing MOSK clusters, MKE and MCR are updated to the latest supported version when you update your cluster to the Cluster release 17.1.0.
Added support for Rook v1.12 that contains the Ceph CSI plugin 3.9.x and introduces automated recovery of RBD (RWO) volumes from a failed node onto a new one, ensuring uninterrupted operations.
For a complete list of features introduced in the new Rook version, refer to official Rook documentation.
Learn more
TechPreview
Implemented the customDeviceClasses parameter that enables you to specify
the custom names different from the default ones, which include ssd,
hdd, and nvme, and use them in nodes and pools definitions.
Using this parameter, you can, for example, separate storage of large snapshots without touching the rest of Ceph cluster storage.
To enhance network security, added NetworkPolicy objects for all types of
Ceph daemons. These policies allow only specified ports to be used by the
corresponding Ceph daemon pods.
Completely reorganized and significantly improved the StackLight logging pipeline by implementing the following changes:
Switched to the storage-based log retention strategy that optimizes storage utilization and ensures effective data retention. This approach ensures that storage resources are efficiently allocated based on the importance and volume of different data types. The logging index management implies the following advantages:
Storage-based rollover mechanism
Consistent shard allocation
Minimal size of cluster state
Storage compression
No filter by logging level (filtering by tag is still available)
Control over disk space to be taken by indices types:
Logs
OpenStack notifications
Kubernetes events
Introduced new system and audit indices that are managed by OpenSearch data streams. It is a convenient way to manage insert-only pipelines such as log message collection.
Introduced the
OpenSearchStorageUsageCriticalandOpenSearchStorageUsageMajoralerts to monitor OpenSearch used and free space from the file system perspective.Introduced the following parameters:
persistentVolumeUsableStorageSizeGBto define exclusive OpenSearch node usageoutput_kindto define the type of logs to be forwarded to external outputs
Important
Changes in the StackLight logging pipeline require the following actions before and after the manged cluster update:
Added the alertsCommonLabels parameter for Prometheus server that defines
the list of custom labels to be injected to firing alerts while they are sent
to Alertmanager.
Caution
When new labels are injected, Prometheus sends alert updates with a new set of labels, which can potentially cause Alertmanager to have duplicated alerts for a short period of time if the cluster currently has firing alerts.
The following table lists the components versions of the Cluster release 17.1.0.
Component |
Application/Service |
Version |
|---|---|---|
Cluster orchestration Updated |
Mirantis Kubernetes Engine |
3.7.5 0 |
Container runtime Updated |
Mirantis Container Runtime |
23.0.9 1 |
Distributed storage Updated |
Ceph |
17.2.7 (Quincy) |
Rook |
1.12.10 |
|
StackLight |
Alerta Updated |
9.0.1 |
Alertmanager |
0.25.0 |
|
Alertmanager Webhook ServiceNow |
0.1 |
|
Blackbox Exporter |
0.24.0 |
|
cAdvisor |
0.47.2 |
|
Elasticsearch Curator |
5.7.6 |
|
Elasticsearch Exporter |
1.5.0 |
|
Fluentd |
1.15.3 |
|
Grafana Updated |
10.3.1 |
|
Grafana Image Renderer Updated |
3.8.4 |
|
kube-state-metrics Updated |
2.10.1 |
|
Metric Collector |
0.1 |
|
Metricbeat |
7.12.1 |
|
Node Exporter Updated |
1.7.0 |
|
OAuth2 Proxy |
7.1.3 |
|
OpenSearch Updated |
2.11.0 |
|
OpenSearch Dashboards Updated |
2.11.1 |
|
Prometheus Updated |
2.48.0 |
|
Prometheus ES Exporter |
0.14.0 |
|
Prometheus MS Teams |
1.5.2 |
|
Prometheus Patroni Exporter |
0.0.1 |
|
Prometheus Postgres Exporter Updated |
0.15.0 |
|
Prometheus Relay |
0.4 |
|
sf-notifier |
0.4 |
|
sf-reporter |
0.1 |
|
Spilo |
13-2.1p9 |
|
Telegraf |
1.9.1 |
|
1.28.5 Updated |
||
Telemeter |
4.4 |
- 0
For the Mirantis Kubernetes Engine (MKE) release highlights and components versions, see MKE documentation: MKE release notes.
- 1
For the Mirantis Container Runtime (MCR) release highlights, see MCR documentation: MCR release notes.
This section lists the artifacts of components included in the Cluster release 17.1.0.
Note
The components that are newly added, updated, deprecated, or removed
as compared to the previous release version, are marked
with a corresponding superscript,
for example, lcm-ansible Updated.
Artifact |
Component |
Path |
|---|---|---|
Helm chart Updated |
ceph-controller |
https://binary.mirantis.com/ceph/helm/ceph-operator-1.0.0-mcc-2.26.0-16.tgz |
Docker images Updated |
ceph |
mirantis.azurecr.io/mirantis/ceph:v17.2.7-8.release |
ceph-controller |
mirantis.azurecr.io/ceph/mcp/ceph-controller:2.26.0-15 |
|
cephcsi |
mirantis.azurecr.io/mirantis/cephcsi:v3.9.0-4.release |
|
cephcsi-registrar |
mirantis.azurecr.io/mirantis/cephcsi-registrar:v2.9.2-1.release |
|
cephcsi-provisioner |
mirantis.azurecr.io/mirantis/cephcsi-provisioner:v3.6.2-1.release |
|
cephcsi-snapshotter |
mirantis.azurecr.io/mirantis/cephcsi-snapshotter:v6.3.2-1.release |
|
cephcsi-attacher |
mirantis.azurecr.io/mirantis/cephcsi-attacher:v4.4.2-1.release |
|
cephcsi-resizer |
mirantis.azurecr.io/mirantis/cephcsi-resizer:v1.9.2-1.release |
|
rook |
mirantis.azurecr.io/ceph/rook:v1.12.10-13 |
Artifact |
Component |
Path |
|---|---|---|
Binaries Updated |
lcm-ansible |
https://binary.mirantis.com/lcm/bin/lcm-ansible/v0.24.0-46-gdaf7dbc/lcm-ansible.tar.gz |
lcm-agent |
||
Helm charts Updated |
helm-controller |
https://binary.mirantis.com/core/helm/helm-controller-1.39.13.tgz |
managed-lcm-api |
https://binary.mirantis.com/core/helm/managed-lcm-api-1.39.13.tgz |
|
Docker images Updated |
helm-controller |
mirantis.azurecr.io/core/lcm-controller:1.39.13 |
Artifact |
Component |
Path |
|---|---|---|
Helm charts |
alerta Updated |
https://binary.mirantis.com/stacklight/helm/alerta-0.1.0-mcp-33.tgz |
alertmanager-webhook-servicenow Updated |
https://binary.mirantis.com/stacklight/helm/alertmanager-webhook-servicenow-0.2.0-mcp-8.tgz |
|
cadvisor Updated |
https://binary.mirantis.com/stacklight/helm/cadvisor-0.1.0-mcp-7.tgz |
|
elasticsearch-curator Updated |
https://binary.mirantis.com/stacklight/helm/elasticsearch-curator-1.5.0-mcp-15.tgz |
|
elasticsearch-exporter Updated |
https://binary.mirantis.com/stacklight/helm/elasticsearch-exporter-1.2.0-mcp-10.tgz |
|
fluentd-logs Updated |
https://binary.mirantis.com/stacklight/helm/fluentd-logs-0.1.0-mcp-219.tgz |
|
grafana Updated |
https://binary.mirantis.com/stacklight/helm/grafana-3.3.10-mcp-278.tgz |
|
iam-proxy Updated |
||
metric-collector Updated |
https://binary.mirantis.com/stacklight/helm/metric-collector-0.3.0-mcp-17.tgz |
|
metricbeat Updated |
https://binary.mirantis.com/stacklight/helm/metricbeat-1.7.1-mcp-25.tgz |
|
opensearch Updated |
https://binary.mirantis.com/stacklight/helm/opensearch-0.1.0-mcp-80.tgz |
|
opensearch-dashboards Updated |
https://binary.mirantis.com/stacklight/helm/opensearch-dashboards-0.1.0-mcp-53.tgz |
|
patroni Updated |
https://binary.mirantis.com/stacklight/helm/patroni-0.15.1-mcp-59.tgz |
|
prometheus Updated |
https://binary.mirantis.com/stacklight/helm/prometheus-8.11.4-mcp-258.tgz |
|
prometheus-blackbox-exporter Updated |
https://binary.mirantis.com/stacklight/helm/prometheus-blackbox-exporter-0.3.0-mcp-19.tgz |
|
prometheus-es-exporter Updated |
https://binary.mirantis.com/stacklight/helm/prometheus-es-exporter-1.0.0-mcp-18.tgz |
|
prometheus-msteams Updated |
https://binary.mirantis.com/stacklight/helm/prometheus-msteams-0.1.0-mcp-12.tgz |
|
refapp Updated |
https://binary.mirantis.com/scale/helm/refapp-0.2.1-mcp-16.tgz |
|
sf-notifier Updated |
https://binary.mirantis.com/stacklight/helm/sf-notifier-0.2.0-mcp-10.tgz |
|
sf-reporter Updated |
https://binary.mirantis.com/stacklight/helm/sf-reporter-0.2.0-mcp-10.tgz |
|
stacklight Updated |
https://binary.mirantis.com/stacklight/helm/stacklight-0.14.2.tgz |
|
telegraf-ds Updated |
https://binary.mirantis.com/stacklight/helm/telegraf-ds-1.1.5-mcp-40.tgz |
|
telegraf-s Updated |
https://binary.mirantis.com/stacklight/helm/telegraf-s-1.1.5-mcp-41.tgz |
|
telemeter-client Updated |
https://binary.mirantis.com/stacklight/helm/telemeter-client-0.2.0-mcp-14.tgz |
|
telemeter-server Updated |
https://binary.mirantis.com/stacklight/helm/telemeter-server-0.2.0-mcp-14.tgz |
|
Docker images |
alerta-web Updated |
mirantis.azurecr.io/stacklight/alerta-web:9-20240201074016 |
alertmanager Updated |
mirantis.azurecr.io/stacklight/alertmanager:v0-20240201074016 |
|
alertmanager-webhook-servicenow Updated |
mirantis.azurecr.io/stacklight/alertmanager-webhook-servicenow:v0.1-20240119023014 |
|
alpine-utils Updated |
mirantis.azurecr.io/stacklight/alpine-utils:1-20240201074025 |
|
blackbox-exporter Updated |
mirantis.azurecr.io/stacklight/blackbox-exporter:0-20231204053401 |
|
cadvisor Updated |
mirantis.azurecr.io/stacklight/cadvisor:v0.47-20240201074020 |
|
configmap-reload |
mirantis.azurecr.io/stacklight/configmap-reload:v0.8.0 |
|
curator |
mirantis.azurecr.io/stacklight/curator:5.7.6-20230404082402 |
|
curl-jq Removed |
n/a |
|
elasticsearch-exporter |
mirantis.azurecr.io/stacklight/elasticsearch-exporter:v1.5.0 |
|
fluentd Updated |
mirantis.azurecr.io/stacklight/fluentd:1.15-20231215023011 |
|
grafana Updated |
mirantis.azurecr.io/stacklight/grafana:10.3.1 |
|
grafana-image-renderer Updated |
mirantis.azurecr.io/stacklight/grafana-image-renderer:3-20231124023009 |
|
k8s-sidecar Updated |
mirantis.azurecr.io/stacklight/k8s-sidecar:1-20240201074025 |
|
kube-state-metrics Updated |
mirantis.azurecr.io/stacklight/kube-state-metrics:v2.10.1 |
|
kubectl Updated |
mirantis.azurecr.io/stacklight/kubectl:1.22-20240201074022 |
|
metric-collector Updated |
mirantis.azurecr.io/stacklight/metric-collector:v0.1-20240201074019 |
|
metricbeat Updated |
mirantis.azurecr.io/stacklight/metricbeat:7.12.1-20240201074016 |
|
node-exporter Updated |
mirantis.azurecr.io/stacklight/node-exporter:v1.7.0 |
|
oauth2-proxy Updated |
mirantis.azurecr.io/iam/oauth2-proxy:v7.1.3-7 |
|
opensearch Updated |
mirantis.azurecr.io/stacklight/opensearch:2-20240201074019 |
|
opensearch-dashboards Updated |
mirantis.azurecr.io/stacklight/opensearch-dashboards:2-20240201074016 |
|
pgbouncer Updated |
mirantis.azurecr.io/stacklight/pgbouncer:1-20240201074024 |
|
prometheus Updated |
mirantis.azurecr.io/stacklight/prometheus:v2.48.0 |
|
prometheus-es-exporter Updated |
mirantis.azurecr.io/stacklight/prometheus-es-exporter:v0.14.0-20240201074023 |
|
prometheus-msteams Updated |
mirantis.azurecr.io/stacklight/prometheus-msteams:v1.5-20231204064415 |
|
prometheus-patroni-exporter Updated |
mirantis.azurecr.io/stacklight/prometheus-patroni-exporter:0.0.1-20240201074021 |
|
prometheus-postgres-exporter Updated |
mirantis.azurecr.io/stacklight/prometheus-postgres-exporter:v0.15.0 |
|
prometheus-relay Updated |
mirantis.azurecr.io/stacklight/prometheus-relay:v0.4-20240201074019 |
|
psql-client Updated |
mirantis.azurecr.io/scale/psql-client:v13-20240117093252 |
|
sf-notifier Updated |
mirantis.azurecr.io/stacklight/sf-notifier:v0.4-20240201074022 |
|
sf-reporter Updated |
mirantis.azurecr.io/stacklight/sf-reporter:v0.1-20240119124536 |
|
spilo Updated |
mirantis.azurecr.io/stacklight/spilo:13-2.1p9-20240201074020 |
|
stacklight-toolkit Updated |
mirantis.azurecr.io/stacklight/stacklight-toolkit:20240201074021 |
|
telegraf |
mirantis.azurecr.io/stacklight/telegraf:v1.9.1-20240201074016 Updated |
|
mirantis.azurecr.io/stacklight/telegraf:1-20240201074023 Updated |
||
telemeter Updated |
mirantis.azurecr.io/stacklight/telemeter:4.4-20240201074019 |
|
telemeter-token-auth Updated |
mirantis.azurecr.io/stacklight/telemeter-token-auth:v0.1-20240201074020 |
Artifact |
Component |
Path |
|---|---|---|
Debian repositories |
System packages |
https://mirror.mirantis.com/kaas/kubernetes-extra-0.0.9/ Updated |
http://mirror.mirantis.com/kaas/kubernetes-extra-rhel7-0.0.8/ |
||
https://mirror.mirantis.com/kaas/ubuntu-2024-02-01-020317/ Updated |
||
https://mirror.mirantis.com/kaas/ubuntu-2024-02-01-020317.target.txt Updated |
||
MCR repositories |
MCR Updated |
https://repos.mirantis.com/ubuntu/dists/focal/pool/stable-23.0/ |
Target ubuntu system |
Ubuntu Updated |
https://binary.mirantis.com/bm/bin/efi/ubuntu/tgz-focal-20240201171126 |
See also
Major and patch versions update path
The primary distinction between major and patch product versions lies in the fact that major release versions introduce new functionalities, whereas patch release versions predominantly offer minor product enhancements, mostly CVE resolutions for your clusters.
Depending on your deployment needs, you can either update only between major Cluster releases or apply patch updates between major releases. Choosing the latter option ensures you receive security fixes as soon as they become available. Though, be prepared to update your cluster frequently, approximately once every three weeks. Otherwise, you can update only between major Cluster releases as each subsequent major Cluster release includes patch Cluster release updates of the previous major Cluster release.
This section outlines release notes for unsupported major and patch Cluster 17.0.x series dedicated for Mirantis OpenStack for Kubernetes (MOSK).
This section includes release notes for the patch Cluster release 17.0.4 that is introduced in the Container Cloud patch release 2.25.4 and is based on Cluster releases 17.0.0, 17.0.1, 17.0.2, and 17.0.3.
This patch Cluster release introduces MOSK 23.3.4 that is based on Mirantis Kubernetes Engine 3.7.3 with Kubernetes 1.27 and Mirantis Container Runtime 23.0.7.
For details on MOSK 23.3.4, see Release notes 23.3.4
For the list of enhancements and CVE fixes delivered with this patch Cluster release, see 2.25.4
For details on patch release delivery, see Patch releases
This section lists the artifacts of components included in the Cluster release 17.0.4.
Note
The components that are newly added, updated, deprecated, or removed
as compared to the previous release version, are marked
with a corresponding superscript,
for example, lcm-ansible Updated.
Artifact |
Component |
Path |
|---|---|---|
Helm chart Updated |
ceph-controller |
https://binary.mirantis.com/ceph/helm/ceph-operator-1.0.0-mcc-2.25.4-1 |
Docker images |
ceph |
mirantis.azurecr.io/mirantis/ceph:v17.2.6-8.cve |
ceph-controller Updated |
mirantis.azurecr.io/ceph/mcp/ceph-controller:2.25.4-0 |
|
cephcsi Updated |
mirantis.azurecr.io/mirantis/cephcsi:v3.8.1-9.cve |
|
cephcsi-registrar |
mirantis.azurecr.io/mirantis/cephcsi-registrar:v2.8.0-2.cve |
|
cephcsi-provisioner |
mirantis.azurecr.io/mirantis/cephcsi-provisioner:v3.5.0-2.cve |
|
cephcsi-snapshotter |
mirantis.azurecr.io/mirantis/cephcsi-snapshotter:v6.2.1-2.cve |
|
cephcsi-attacher |
mirantis.azurecr.io/mirantis/cephcsi-attacher:v4.3.0-2.cve |
|
cephcsi-resizer |
mirantis.azurecr.io/mirantis/cephcsi-resizer:v1.8.0-2.cve |
|
rook Updated |
mirantis.azurecr.io/ceph/rook:v1.11.11-22 |
Artifact |
Component |
Path |
|---|---|---|
Binaries Updated |
lcm-ansible |
https://binary.mirantis.com/lcm/bin/lcm-ansible/v0.23.0-88-g35be0fc/lcm-ansible.tar.gz |
lcm-agent |
||
Helm charts Updated |
helm-controller |
https://binary.mirantis.com/core/helm/helm-controller-1.38.33.tgz |
managed-lcm-api |
https://binary.mirantis.com/core/helm/managed-lcm-api-1.38.33.tgz |
|
Docker images Updated |
helm-controller |
mirantis.azurecr.io/core/lcm-controller:1.38.33 |
Artifact |
Component |
Path |
|---|---|---|
Helm charts |
alerta |
https://binary.mirantis.com/stacklight/helm/alerta-0.1.0-mcp-33.tgz |
alertmanager-webhook-servicenow |
https://binary.mirantis.com/stacklight/helm/alertmanager-webhook-servicenow-0.2.0-mcp-8.tgz |
|
cadvisor |
https://binary.mirantis.com/stacklight/helm/cadvisor-0.1.0-mcp-6.tgz |
|
elasticsearch-curator |
https://binary.mirantis.com/stacklight/helm/elasticsearch-curator-1.5.0-mcp-15.tgz |
|
elasticsearch-exporter |
https://binary.mirantis.com/stacklight/helm/elasticsearch-exporter-1.2.0-mcp-10.tgz |
|
fluentd-logs |
https://binary.mirantis.com/stacklight/helm/fluentd-logs-0.1.0-mcp-196.tgz |
|
grafana |
https://binary.mirantis.com/stacklight/helm/grafana-3.3.10-mcp-254.tgz |
|
iam-proxy |
||
metric-collector |
https://binary.mirantis.com/stacklight/helm/metric-collector-0.3.0-mcp-17.tgz |
|
metricbeat |
https://binary.mirantis.com/stacklight/helm/metricbeat-1.7.1-mcp-25.tgz |
|
opensearch |
https://binary.mirantis.com/stacklight/helm/opensearch-0.1.0-mcp-63.tgz |
|
opensearch-dashboards |
https://binary.mirantis.com/stacklight/helm/opensearch-dashboards-0.1.0-mcp-49.tgz |
|
patroni |
https://binary.mirantis.com/stacklight/helm/patroni-0.15.1-mcp-59.tgz |
|
prometheus |
https://binary.mirantis.com/stacklight/helm/prometheus-8.11.4-mcp-257.tgz |
|
prometheus-blackbox-exporter |
https://binary.mirantis.com/stacklight/helm/prometheus-blackbox-exporter-0.3.0-mcp-19.tgz |
|
prometheus-es-exporter |
https://binary.mirantis.com/stacklight/helm/prometheus-es-exporter-1.0.0-mcp-18.tgz |
|
prometheus-msteams |
https://binary.mirantis.com/stacklight/helm/prometheus-msteams-0.1.0-mcp-12.tgz |
|
sf-notifier |
https://binary.mirantis.com/stacklight/helm/sf-notifier-0.2.0-mcp-10.tgz |
|
sf-reporter |
https://binary.mirantis.com/stacklight/helm/sf-reporter-0.2.0-mcp-10.tgz |
|
stacklight Updated |
https://binary.mirantis.com/stacklight/helm/stacklight-0.13.12.tgz |
|
telegraf-ds |
https://binary.mirantis.com/stacklight/helm/telegraf-ds-1.1.5-mcp-40.tgz |
|
telegraf-s |
https://binary.mirantis.com/stacklight/helm/telegraf-s-1.1.5-mcp-40.tgz |
|
telemeter-client |
https://binary.mirantis.com/stacklight/helm/telemeter-client-0.2.0-mcp-14.tgz |
|
telemeter-server |
https://binary.mirantis.com/stacklight/helm/telemeter-server-0.2.0-mcp-14.tgz |
|
Docker images |
alerta-web Updated |
mirantis.azurecr.io/stacklight/alerta-web:9-20231215023009 |
alertmanager Updated |
mirantis.azurecr.io/stacklight/alertmanager:v0-20231215023011 |
|
alertmanager-webhook-servicenow Updated |
mirantis.azurecr.io/stacklight/alertmanager-webhook-servicenow:v0.1-20231211141923 |
|
alpine-utils Updated |
mirantis.azurecr.io/stacklight/alpine-utils:1-20231215023021 |
|
blackbox-exporter |
mirantis.azurecr.io/stacklight/blackbox-exporter:0-20231204053401 |
|
cadvisor Updated |
mirantis.azurecr.io/stacklight/cadvisor:v0.47-20231215023012 |
|
configmap-reload |
mirantis.azurecr.io/stacklight/configmap-reload:v0.8.0 |
|
curator |
mirantis.azurecr.io/stacklight/curator:5.7.6-20230404082402 |
|
curl-jq |
mirantis.azurecr.io/scale/curl-jq:alpine-20231127081128 |
|
elasticsearch-exporter |
mirantis.azurecr.io/stacklight/elasticsearch-exporter:v1.5.0 |
|
fluentd Updated |
mirantis.azurecr.io/stacklight/fluentd:1.15-20231215023011 |
|
grafana |
mirantis.azurecr.io/stacklight/grafana:10.2.2 |
|
grafana-image-renderer |
mirantis.azurecr.io/stacklight/grafana-image-renderer:3-20231124023009 |
|
k8s-sidecar Updated |
mirantis.azurecr.io/stacklight/k8s-sidecar:1-20231215023018 |
|
kube-state-metrics |
mirantis.azurecr.io/stacklight/kube-state-metrics:v2.10.1 |
|
kubectl Updated |
mirantis.azurecr.io/stacklight/kubectl:1.22-20231226150248 |
|
metric-collector Updated |
mirantis.azurecr.io/stacklight/metric-collector:v0.1-20231215023013 |
|
metricbeat Updated |
mirantis.azurecr.io/stacklight/metricbeat:7.12.1-20231215023009 |
|
node-exporter |
mirantis.azurecr.io/stacklight/node-exporter:v1.7.0 |
|
oauth2-proxy |
mirantis.azurecr.io/iam/oauth2-proxy:v7.1.3-6 |
|
opensearch Updated |
mirantis.azurecr.io/stacklight/opensearch:2-20231215023014 |
|
opensearch-dashboards Updated |
mirantis.azurecr.io/stacklight/opensearch-dashboards:2-20231215023009 |
|
pgbouncer Updated |
mirantis.azurecr.io/stacklight/pgbouncer:1-20231215023019 |
|
prometheus |
mirantis.azurecr.io/stacklight/prometheus:v2.48.0 |
|
prometheus-es-exporter Updated |
mirantis.azurecr.io/stacklight/prometheus-es-exporter:v0.14.0-20231215023018 |
|
prometheus-msteams |
mirantis.azurecr.io/stacklight/prometheus-msteams:v1.5-20231204064415 |
|
prometheus-patroni-exporter Updated |
mirantis.azurecr.io/stacklight/prometheus-patroni-exporter:0.0.1-20231215023018 |
|
prometheus-postgres-exporter |
mirantis.azurecr.io/stacklight/prometheus-postgres-exporter:v0.15.0 |
|
prometheus-relay Updated |
mirantis.azurecr.io/stacklight/prometheus-relay:v0.4-20231215023011 |
|
psql-client |
mirantis.azurecr.io/scale/psql-client:v13-20231116082249 |
|
sf-notifier Updated |
mirantis.azurecr.io/stacklight/sf-notifier:v0.4-20231215023014 |
|
sf-reporter Updated |
mirantis.azurecr.io/stacklight/sf-reporter:v0.1-20231211141939 |
|
spilo Updated |
mirantis.azurecr.io/stacklight/spilo:13-2.1p9-20231215023013 |
|
stacklight-toolkit Updated |
mirantis.azurecr.io/stacklight/stacklight-toolkit:20231215023015 |
|
telegraf |
mirantis.azurecr.io/stacklight/telegraf:v1.9.1-20231215023009 Updated |
|
mirantis.azurecr.io/stacklight/telegraf:1-20231204142011 |
||
telemeter Updated |
mirantis.azurecr.io/stacklight/telemeter:4.4-20231215023013 |
|
telemeter-token-auth Updated |
mirantis.azurecr.io/stacklight/telemeter-token-auth:v0.1-20231215023013 |
Unchanged as compared to 17.0.0
Artifact |
Component |
Path |
|---|---|---|
Debian repositories |
System packages |
|
http://mirror.mirantis.com/kaas/kubernetes-extra-rhel7-0.0.8/ |
||
https://mirror.mirantis.com/kaas/ubuntu-2023-10-11-015021.target.txt |
||
MCR repositories |
MCR |
https://repos.mirantis.com/ubuntu/dists/bionic/pool/stable-23.10/ |
Target ubuntu system |
Ubuntu |
https://binary.mirantis.com/bm/bin/efi/ubuntu/tgz-focal-20231011091340 |
This section includes release notes for the patch Cluster release 17.0.3 that is introduced in the Container Cloud patch release 2.25.3 and is based on Cluster releases 17.0.0, 17.0.1, and 17.0.2.
This patch Cluster release introduces MOSK 23.3.3 that is based on Mirantis Kubernetes Engine 3.7.3 with Kubernetes 1.27 and Mirantis Container Runtime 23.0.7.
For details on MOSK 23.3.3, see Release notes 23.3.3
For the list of enhancements and CVE fixes delivered with this patch Cluster release, see 2.25.3
For details on patch release delivery, see Patch releases
This section lists the artifacts of components included in the Cluster release 17.0.3.
Note
The components that are newly added, updated, deprecated, or removed
as compared to the previous release version, are marked
with a corresponding superscript,
for example, lcm-ansible Updated.
Artifact |
Component |
Path |
|---|---|---|
Helm chart Updated |
ceph-controller |
https://binary.mirantis.com/ceph/helm/ceph-operator-1.0.0-mcc-2.25.3-3 |
Docker images |
ceph Updated |
mirantis.azurecr.io/mirantis/ceph:v17.2.6-8.cve |
ceph-controller Updated |
mirantis.azurecr.io/ceph/mcp/ceph-controller:2.25.3-0 |
|
cephcsi Updated |
mirantis.azurecr.io/mirantis/cephcsi:v3.8.1-8.cve |
|
cephcsi-registrar |
mirantis.azurecr.io/mirantis/cephcsi-registrar:v2.8.0-2.cve |
|
cephcsi-provisioner |
mirantis.azurecr.io/mirantis/cephcsi-provisioner:v3.5.0-2.cve |
|
cephcsi-snapshotter |
mirantis.azurecr.io/mirantis/cephcsi-snapshotter:v6.2.1-2.cve |
|
cephcsi-attacher |
mirantis.azurecr.io/mirantis/cephcsi-attacher:v4.3.0-2.cve |
|
cephcsi-resizer |
mirantis.azurecr.io/mirantis/cephcsi-resizer:v1.8.0-2.cve |
|
rook Updated |
mirantis.azurecr.io/ceph/rook:v1.11.11-21 |
Artifact |
Component |
Path |
|---|---|---|
Binaries Updated |
lcm-ansible |
https://binary.mirantis.com/lcm/bin/lcm-ansible/v0.23.0-87-gc9d7d3b/lcm-ansible.tar.gz |
lcm-agent |
||
Helm charts Updated |
helm-controller |
https://binary.mirantis.com/core/helm/helm-controller-1.38.31.tgz |
managed-lcm-api |
https://binary.mirantis.com/core/helm/managed-lcm-api-1.38.31.tgz |
|
Docker images Updated |
helm-controller |
mirantis.azurecr.io/core/lcm-controller:1.38.31 |
Artifact |
Component |
Path |
|---|---|---|
Helm charts |
alerta |
https://binary.mirantis.com/stacklight/helm/alerta-0.1.0-mcp-33.tgz |
alertmanager-webhook-servicenow |
https://binary.mirantis.com/stacklight/helm/alertmanager-webhook-servicenow-0.2.0-mcp-8.tgz |
|
cadvisor |
https://binary.mirantis.com/stacklight/helm/cadvisor-0.1.0-mcp-6.tgz |
|
elasticsearch-curator |
https://binary.mirantis.com/stacklight/helm/elasticsearch-curator-1.5.0-mcp-15.tgz |
|
elasticsearch-exporter |
https://binary.mirantis.com/stacklight/helm/elasticsearch-exporter-1.2.0-mcp-10.tgz |
|
fluentd-logs |
https://binary.mirantis.com/stacklight/helm/fluentd-logs-0.1.0-mcp-196.tgz |
|
grafana |
https://binary.mirantis.com/stacklight/helm/grafana-3.3.10-mcp-254.tgz |
|
iam-proxy |
||
metric-collector |
https://binary.mirantis.com/stacklight/helm/metric-collector-0.3.0-mcp-17.tgz |
|
metricbeat |
https://binary.mirantis.com/stacklight/helm/metricbeat-1.7.1-mcp-25.tgz |
|
opensearch |
https://binary.mirantis.com/stacklight/helm/opensearch-0.1.0-mcp-63.tgz |
|
opensearch-dashboards |
https://binary.mirantis.com/stacklight/helm/opensearch-dashboards-0.1.0-mcp-49.tgz |
|
patroni Updated |
https://binary.mirantis.com/stacklight/helm/patroni-0.15.1-mcp-59.tgz |
|
prometheus |
https://binary.mirantis.com/stacklight/helm/prometheus-8.11.4-mcp-257.tgz |
|
prometheus-blackbox-exporter |
https://binary.mirantis.com/stacklight/helm/prometheus-blackbox-exporter-0.3.0-mcp-19.tgz |
|
prometheus-es-exporter |
https://binary.mirantis.com/stacklight/helm/prometheus-es-exporter-1.0.0-mcp-18.tgz |
|
prometheus-msteams |
https://binary.mirantis.com/stacklight/helm/prometheus-msteams-0.1.0-mcp-12.tgz |
|
sf-notifier |
https://binary.mirantis.com/stacklight/helm/sf-notifier-0.2.0-mcp-10.tgz |
|
sf-reporter |
https://binary.mirantis.com/stacklight/helm/sf-reporter-0.2.0-mcp-10.tgz |
|
stacklight Updated |
https://binary.mirantis.com/stacklight/helm/stacklight-0.13.10.tgz |
|
telegraf-ds |
https://binary.mirantis.com/stacklight/helm/telegraf-ds-1.1.5-mcp-40.tgz |
|
telegraf-s |
https://binary.mirantis.com/stacklight/helm/telegraf-s-1.1.5-mcp-40.tgz |
|
telemeter-client |
https://binary.mirantis.com/stacklight/helm/telemeter-client-0.2.0-mcp-14.tgz |
|
telemeter-server |
https://binary.mirantis.com/stacklight/helm/telemeter-server-0.2.0-mcp-14.tgz |
|
Docker images |
alerta-web Updated |
mirantis.azurecr.io/stacklight/alerta-web:9-20231201023009 |
alertmanager Updated |
mirantis.azurecr.io/stacklight/alertmanager:v0-20231201023012 |
|
alertmanager-webhook-servicenow |
mirantis.azurecr.io/stacklight/alertmanager-webhook-servicenow:v0.1-20231114075954 |
|
alpine-utils Updated |
mirantis.azurecr.io/stacklight/alpine-utils:1-20231201023019 |
|
blackbox-exporter Updated |
mirantis.azurecr.io/stacklight/blackbox-exporter:0-20231204053401 |
|
cadvisor Updated |
mirantis.azurecr.io/stacklight/cadvisor:v0.47-20231201023011 |
|
configmap-reload |
mirantis.azurecr.io/stacklight/configmap-reload:v0.8.0 |
|
curator |
mirantis.azurecr.io/stacklight/curator:5.7.6-20230404082402 |
|
curl-jq Updated |
mirantis.azurecr.io/scale/curl-jq:alpine-20231127081128 |
|
elasticsearch-exporter |
mirantis.azurecr.io/stacklight/elasticsearch-exporter:v1.5.0 |
|
fluentd Updated |
mirantis.azurecr.io/stacklight/fluentd:1.15-20231204142422 |
|
grafana Updated |
mirantis.azurecr.io/stacklight/grafana:10.2.2 |
|
grafana-image-renderer Updated |
mirantis.azurecr.io/stacklight/grafana-image-renderer:3-20231124023009 |
|
k8s-sidecar Updated |
mirantis.azurecr.io/stacklight/k8s-sidecar:1-20231201023018 |
|
kube-state-metrics |
mirantis.azurecr.io/stacklight/kube-state-metrics:v2.10.1 |
|
kubectl Updated |
mirantis.azurecr.io/stacklight/kubectl:1.22-20231201023019 |
|
metric-collector Updated |
mirantis.azurecr.io/stacklight/metric-collector:v0.1-20231201023014 |
|
metricbeat Updated |
mirantis.azurecr.io/stacklight/metricbeat:7.12.1-20231201023010 |
|
node-exporter |
mirantis.azurecr.io/stacklight/node-exporter:v1.7.0 |
|
oauth2-proxy |
mirantis.azurecr.io/iam/oauth2-proxy:v7.1.3-6 |
|
opensearch Updated |
mirantis.azurecr.io/stacklight/opensearch:2-20231201023011 |
|
opensearch-dashboards Updated |
mirantis.azurecr.io/stacklight/opensearch-dashboards:2-20231201023009 |
|
pgbouncer Updated |
mirantis.azurecr.io/stacklight/pgbouncer:1-20231201023014 |
|
prometheus Updated |
mirantis.azurecr.io/stacklight/prometheus:v2.48.0 |
|
prometheus-es-exporter Updated |
mirantis.azurecr.io/stacklight/prometheus-es-exporter:v0.14.0-20231201023015 |
|
prometheus-msteams Updated |
mirantis.azurecr.io/stacklight/prometheus-msteams:v1.5-20231204064415 |
|
prometheus-patroni-exporter Updated |
mirantis.azurecr.io/stacklight/prometheus-patroni-exporter:0.0.1-20231201023016 |
|
prometheus-postgres-exporter Updated |
mirantis.azurecr.io/stacklight/prometheus-postgres-exporter:v0.15.0 |
|
prometheus-relay Updated |
mirantis.azurecr.io/stacklight/prometheus-relay:v0.4-20231201023016 |
|
psql-client |
mirantis.azurecr.io/scale/psql-client:v13-20231116082249 |
|
sf-notifier Updated |
mirantis.azurecr.io/stacklight/sf-notifier:v0.4-20231201023011 |
|
sf-reporter |
mirantis.azurecr.io/stacklight/sf-reporter:v0.1-20231110023016 |
|
spilo Updated |
mirantis.azurecr.io/stacklight/spilo:13-2.1p9-20231207134103 |
|
stacklight-toolkit Updated |
mirantis.azurecr.io/stacklight/stacklight-toolkit:20231201023015 |
|
telegraf |
mirantis.azurecr.io/stacklight/telegraf:v1.9.1-20231207133615 Updated |
|
mirantis.azurecr.io/stacklight/telegraf:1-20231204142011 Updated |
||
telemeter Updated |
mirantis.azurecr.io/stacklight/telemeter:4.4-20231201023015 |
|
telemeter-token-auth Updated |
mirantis.azurecr.io/stacklight/telemeter-token-auth:v0.1-20231201023012 |
Unchanged as compared to 17.0.0
Artifact |
Component |
Path |
|---|---|---|
Debian repositories |
System packages |
|
http://mirror.mirantis.com/kaas/kubernetes-extra-rhel7-0.0.8/ |
||
https://mirror.mirantis.com/kaas/ubuntu-2023-10-11-015021.target.txt |
||
MCR repositories |
MCR |
https://repos.mirantis.com/ubuntu/dists/bionic/pool/stable-23.10/ |
Target ubuntu system |
Ubuntu |
https://binary.mirantis.com/bm/bin/efi/ubuntu/tgz-focal-20231011091340 |
This section includes release notes for the patch Cluster release 17.0.2 that is introduced in the Container Cloud patch release 2.25.2 and is based on Cluster releases 17.0.0 and 17.0.1.
This patch Cluster release introduces MOSK 23.3.2 that is based on Mirantis Kubernetes Engine 3.7.2 with Kubernetes 1.27 and Mirantis Container Runtime 23.0.7.
For details on MOSK 23.3.2, see Release notes 23.3.2
For the list of enhancements and CVE fixes delivered with this patch Cluster release, see 2.25.2
For details on patch release delivery, see Patch releases
This section lists the artifacts of components included in the Cluster release 17.0.2.
Note
The components that are newly added, updated, deprecated, or removed
as compared to the previous release version, are marked
with a corresponding superscript,
for example, lcm-ansible Updated.
Artifact |
Component |
Path |
|---|---|---|
Helm chart Updated |
ceph-controller |
https://binary.mirantis.com/ceph/helm/ceph-operator-1.0.0-mcc-2.25.2-3 |
Docker images |
ceph Updated |
mirantis.azurecr.io/mirantis/ceph:v17.2.6-5.cve |
ceph-controller Updated |
mirantis.azurecr.io/ceph/mcp/ceph-controller:2.25.2-0 |
|
cephcsi Updated |
mirantis.azurecr.io/mirantis/cephcsi:v3.8.1-6.cve |
|
cephcsi-registrar |
mirantis.azurecr.io/mirantis/cephcsi-registrar:v2.8.0-2.cve |
|
cephcsi-provisioner |
mirantis.azurecr.io/mirantis/cephcsi-provisioner:v3.5.0-2.cve |
|
cephcsi-snapshotter |
mirantis.azurecr.io/mirantis/cephcsi-snapshotter:v6.2.1-2.cve |
|
cephcsi-attacher |
mirantis.azurecr.io/mirantis/cephcsi-attacher:v4.3.0-2.cve |
|
cephcsi-resizer |
mirantis.azurecr.io/mirantis/cephcsi-resizer:v1.8.0-2.cve |
|
rook Updated |
mirantis.azurecr.io/ceph/rook:v1.11.11-17 |
Artifact |
Component |
Path |
|---|---|---|
Binaries |
lcm-ansible |
https://binary.mirantis.com/lcm/bin/lcm-ansible/v0.23.0-84-g8d74d7c/lcm-ansible.tar.gz |
lcm-agent Updated |
||
Helm charts Updated |
helm-controller |
https://binary.mirantis.com/core/helm/helm-controller-1.38.29.tgz |
managed-lcm-api |
https://binary.mirantis.com/core/helm/managed-lcm-api-1.38.29.tgz |
|
Docker images Updated |
helm-controller |
mirantis.azurecr.io/core/lcm-controller:1.38.29 |
Artifact |
Component |
Path |
|---|---|---|
Helm charts |
alerta |
https://binary.mirantis.com/stacklight/helm/alerta-0.1.0-mcp-33.tgz |
alertmanager-webhook-servicenow |
https://binary.mirantis.com/stacklight/helm/alertmanager-webhook-servicenow-0.2.0-mcp-8.tgz |
|
cadvisor |
https://binary.mirantis.com/stacklight/helm/cadvisor-0.1.0-mcp-6.tgz |
|
elasticsearch-curator |
https://binary.mirantis.com/stacklight/helm/elasticsearch-curator-1.5.0-mcp-15.tgz |
|
elasticsearch-exporter |
https://binary.mirantis.com/stacklight/helm/elasticsearch-exporter-1.2.0-mcp-10.tgz |
|
fluentd-logs |
https://binary.mirantis.com/stacklight/helm/fluentd-logs-0.1.0-mcp-196.tgz |
|
grafana |
https://binary.mirantis.com/stacklight/helm/grafana-3.3.10-mcp-254.tgz |
|
iam-proxy |
||
metric-collector |
https://binary.mirantis.com/stacklight/helm/metric-collector-0.3.0-mcp-17.tgz |
|
metricbeat |
https://binary.mirantis.com/stacklight/helm/metricbeat-1.7.1-mcp-25.tgz |
|
opensearch |
https://binary.mirantis.com/stacklight/helm/opensearch-0.1.0-mcp-63.tgz |
|
opensearch-dashboards |
https://binary.mirantis.com/stacklight/helm/opensearch-dashboards-0.1.0-mcp-49.tgz |
|
patroni |
https://binary.mirantis.com/stacklight/helm/patroni-0.15.1-mcp-57.tgz |
|
prometheus |
https://binary.mirantis.com/stacklight/helm/prometheus-8.11.4-mcp-257.tgz |
|
prometheus-blackbox-exporter |
https://binary.mirantis.com/stacklight/helm/prometheus-blackbox-exporter-0.3.0-mcp-19.tgz |
|
prometheus-es-exporter |
https://binary.mirantis.com/stacklight/helm/prometheus-es-exporter-1.0.0-mcp-18.tgz |
|
prometheus-msteams |
https://binary.mirantis.com/stacklight/helm/prometheus-msteams-0.1.0-mcp-12.tgz |
|
sf-notifier |
https://binary.mirantis.com/stacklight/helm/sf-notifier-0.2.0-mcp-10.tgz |
|
sf-reporter |
https://binary.mirantis.com/stacklight/helm/sf-reporter-0.2.0-mcp-10.tgz |
|
stacklight Updated |
https://binary.mirantis.com/stacklight/helm/stacklight-0.13.8.tgz |
|
telegraf-ds |
https://binary.mirantis.com/stacklight/helm/telegraf-ds-1.1.5-mcp-40.tgz |
|
telegraf-s |
https://binary.mirantis.com/stacklight/helm/telegraf-s-1.1.5-mcp-40.tgz |
|
telemeter-client |
https://binary.mirantis.com/stacklight/helm/telemeter-client-0.2.0-mcp-14.tgz |
|
telemeter-server |
https://binary.mirantis.com/stacklight/helm/telemeter-server-0.2.0-mcp-14.tgz |
|
Docker images |
alerta-web Updated |
mirantis.azurecr.io/stacklight/alerta-web:9-20231117023008 |
alertmanager Updated |
mirantis.azurecr.io/stacklight/alertmanager:v0-20231121101237 |
|
alertmanager-webhook-servicenow Updated |
mirantis.azurecr.io/stacklight/alertmanager-webhook-servicenow:v0.1-20231114075954 |
|
alpine-utils Updated |
mirantis.azurecr.io/stacklight/alpine-utils:1-20231117023019 |
|
blackbox-exporter |
mirantis.azurecr.io/stacklight/blackbox-exporter:v0.24.0 |
|
cadvisor Updated |
mirantis.azurecr.io/stacklight/cadvisor:v0.47-20231121100850 |
|
configmap-reload |
mirantis.azurecr.io/stacklight/configmap-reload:v0.8.0 |
|
curator |
mirantis.azurecr.io/stacklight/curator:5.7.6-20230404082402 |
|
curl-jq |
mirantis.azurecr.io/scale/curl-jq:alpine-20231019061751 |
|
elasticsearch-exporter |
mirantis.azurecr.io/stacklight/elasticsearch-exporter:v1.5.0 |
|
fluentd Updated |
mirantis.azurecr.io/stacklight/fluentd:1.15-20231117023010 |
|
grafana |
mirantis.azurecr.io/stacklight/grafana:9.5.13 |
|
grafana-image-renderer |
mirantis.azurecr.io/stacklight/grafana-image-renderer:3-20231030112043 |
|
k8s-sidecar Updated |
mirantis.azurecr.io/stacklight/k8s-sidecar:1-20231117023017 |
|
kube-state-metrics Updated |
mirantis.azurecr.io/stacklight/kube-state-metrics:v2.10.1 |
|
kubectl Updated |
mirantis.azurecr.io/stacklight/kubectl:1.22-20231117023017 |
|
metric-collector Updated |
mirantis.azurecr.io/stacklight/metric-collector:v0.1-20231117023011 |
|
metricbeat Updated |
mirantis.azurecr.io/stacklight/metricbeat:7.12.1-20231117023008 |
|
node-exporter Updated |
mirantis.azurecr.io/stacklight/node-exporter:v1.7.0 |
|
oauth2-proxy Updated |
mirantis.azurecr.io/iam/oauth2-proxy:v7.1.3-6 |
|
opensearch Updated |
mirantis.azurecr.io/stacklight/opensearch:2-20231121103248 |
|
opensearch-dashboards Updated |
mirantis.azurecr.io/stacklight/opensearch-dashboards:2-20231121104249 |
|
pgbouncer Updated |
mirantis.azurecr.io/stacklight/pgbouncer:1-20231117023020 |
|
prometheus |
mirantis.azurecr.io/stacklight/prometheus:v2.44.0 |
|
prometheus-es-exporter Updated |
mirantis.azurecr.io/stacklight/prometheus-es-exporter:v0.14.0-20231117023017 |
|
prometheus-msteams |
mirantis.azurecr.io/stacklight/prometheus-msteams:v1.5.2 |
|
prometheus-patroni-exporter Updated |
mirantis.azurecr.io/stacklight/prometheus-patroni-exporter:0.0.1-20231117023018 |
|
prometheus-postgres-exporter |
mirantis.azurecr.io/stacklight/prometheus-postgres-exporter:v0.12.0 |
|
prometheus-relay Updated |
mirantis.azurecr.io/stacklight/prometheus-relay:v0.4-20231117023012 |
|
psql-client Updated |
mirantis.azurecr.io/scale/psql-client:v13-20231116082249 |
|
sf-notifier Updated |
mirantis.azurecr.io/stacklight/sf-notifier:v0.4-20231117023016 |
|
sf-reporter Updated |
mirantis.azurecr.io/stacklight/sf-reporter:v0.1-20231110023016 |
|
spilo Updated |
mirantis.azurecr.io/stacklight/spilo:13-2.1p9-20231117023015 |
|
stacklight-toolkit Updated |
mirantis.azurecr.io/stacklight/stacklight-toolkit:20231117023017 |
|
telegraf |
mirantis.azurecr.io/stacklight/telegraf:v1.9.1-20231110023008 Updated |
|
mirantis.azurecr.io/stacklight/telegraf:1-20231030132045 |
||
telemeter Updated |
mirantis.azurecr.io/stacklight/telemeter:4.4-20231117023011 |
|
telemeter-token-auth Updated |
mirantis.azurecr.io/stacklight/telemeter-token-auth:v0.1-20231117023011 |
Unchanged as compared to 17.0.0
Artifact |
Component |
Path |
|---|---|---|
Debian repositories |
System packages |
|
http://mirror.mirantis.com/kaas/kubernetes-extra-rhel7-0.0.8/ |
||
https://mirror.mirantis.com/kaas/ubuntu-2023-10-11-015021.target.txt |
||
MCR repositories |
MCR |
https://repos.mirantis.com/ubuntu/dists/bionic/pool/stable-23.10/ |
Target ubuntu system |
Ubuntu |
https://binary.mirantis.com/bm/bin/efi/ubuntu/tgz-focal-20231011091340 |
This section includes release notes for the patch Cluster release 17.0.1 that is introduced in the Container Cloud patch release 2.25.1 and is based on the Cluster release 17.0.0.
This patch Cluster release introduces MOSK 23.3.1 that is based on Mirantis Kubernetes Engine 3.7.2 with Kubernetes 1.27 and Mirantis Container Runtime 23.0.7.
For details on MOSK 23.3.1, see Release notes 23.3.1
For the list of enhancements and CVE fixes delivered with this patch Cluster release, see 2.25.1
For details on patch release delivery, see Patch releases
This section lists the artifacts of components included in the Cluster release 17.0.1.
Note
The components that are newly added, updated, deprecated, or removed
as compared to the previous release version, are marked
with a corresponding superscript,
for example, lcm-ansible Updated.
Artifact |
Component |
Path |
|---|---|---|
Helm chart Updated |
ceph-controller |
https://binary.mirantis.com/ceph/helm/ceph-operator-1.0.0-mcc-2.25.1-9 |
Docker images Updated |
ceph |
mirantis.azurecr.io/mirantis/ceph:v17.2.6-2.cve |
ceph-controller |
mirantis.azurecr.io/ceph/mcp/ceph-controller:2.25.1-8 |
|
cephcsi |
mirantis.azurecr.io/mirantis/cephcsi:v3.8.1-4.cve |
|
cephcsi-registrar |
mirantis.azurecr.io/mirantis/cephcsi-registrar:v2.8.0-2.cve |
|
cephcsi-provisioner |
mirantis.azurecr.io/mirantis/cephcsi-provisioner:v3.5.0-2.cve |
|
cephcsi-snapshotter |
mirantis.azurecr.io/mirantis/cephcsi-snapshotter:v6.2.1-2.cve |
|
cephcsi-attacher |
mirantis.azurecr.io/mirantis/cephcsi-attacher:v4.3.0-2.cve |
|
cephcsi-resizer |
mirantis.azurecr.io/mirantis/cephcsi-resizer:v1.8.0-2.cve |
|
rook |
mirantis.azurecr.io/ceph/rook:v1.11.11-15 |
Artifact |
Component |
Path |
|---|---|---|
Binaries Updated |
lcm-ansible |
https://binary.mirantis.com/lcm/bin/lcm-ansible/v0.23.0-84-g8d74d7c/lcm-ansible.tar.gz |
lcm-agent |
||
Helm charts Updated |
helm-controller |
https://binary.mirantis.com/core/helm/helm-controller-1.38.22.tgz |
managed-lcm-api |
https://binary.mirantis.com/core/helm/managed-lcm-api-1.38.22.tgz |
|
Docker images Updated |
helm-controller |
mirantis.azurecr.io/core/lcm-controller:1.38.22 |
Artifact |
Component |
Path |
|---|---|---|
Helm charts Updated |
alerta |
https://binary.mirantis.com/stacklight/helm/alerta-0.1.0-mcp-33.tgz |
alertmanager-webhook-servicenow |
https://binary.mirantis.com/stacklight/helm/alertmanager-webhook-servicenow-0.2.0-mcp-8.tgz |
|
cadvisor |
https://binary.mirantis.com/stacklight/helm/cadvisor-0.1.0-mcp-6.tgz |
|
elasticsearch-curator |
https://binary.mirantis.com/stacklight/helm/elasticsearch-curator-1.5.0-mcp-15.tgz |
|
elasticsearch-exporter |
https://binary.mirantis.com/stacklight/helm/elasticsearch-exporter-1.2.0-mcp-10.tgz |
|
fluentd-logs |
https://binary.mirantis.com/stacklight/helm/fluentd-logs-0.1.0-mcp-196.tgz |
|
grafana |
https://binary.mirantis.com/stacklight/helm/grafana-3.3.10-mcp-254.tgz |
|
iam-proxy |
||
metric-collector |
https://binary.mirantis.com/stacklight/helm/metric-collector-0.3.0-mcp-17.tgz |
|
metricbeat |
https://binary.mirantis.com/stacklight/helm/metricbeat-1.7.1-mcp-25.tgz |
|
opensearch |
https://binary.mirantis.com/stacklight/helm/opensearch-0.1.0-mcp-63.tgz |
|
opensearch-dashboards |
https://binary.mirantis.com/stacklight/helm/opensearch-dashboards-0.1.0-mcp-49.tgz |
|
patroni |
https://binary.mirantis.com/stacklight/helm/patroni-0.15.1-mcp-57.tgz |
|
prometheus |
https://binary.mirantis.com/stacklight/helm/prometheus-8.11.4-mcp-257.tgz |
|
prometheus-blackbox-exporter |
https://binary.mirantis.com/stacklight/helm/prometheus-blackbox-exporter-0.3.0-mcp-19.tgz |
|
prometheus-es-exporter |
https://binary.mirantis.com/stacklight/helm/prometheus-es-exporter-1.0.0-mcp-18.tgz |
|
prometheus-msteams |
https://binary.mirantis.com/stacklight/helm/prometheus-msteams-0.1.0-mcp-12.tgz |
|
sf-notifier |
https://binary.mirantis.com/stacklight/helm/sf-notifier-0.2.0-mcp-10.tgz |
|
sf-reporter |
https://binary.mirantis.com/stacklight/helm/sf-reporter-0.2.0-mcp-10.tgz |
|
stacklight |
https://binary.mirantis.com/stacklight/helm/stacklight-0.13.7.tgz |
|
telegraf-ds |
https://binary.mirantis.com/stacklight/helm/telegraf-ds-1.1.5-mcp-40.tgz |
|
telegraf-s |
https://binary.mirantis.com/stacklight/helm/telegraf-s-1.1.5-mcp-40.tgz |
|
telemeter-client |
https://binary.mirantis.com/stacklight/helm/telemeter-client-0.2.0-mcp-14.tgz |
|
telemeter-server |
https://binary.mirantis.com/stacklight/helm/telemeter-server-0.2.0-mcp-14.tgz |
|
Docker images |
alerta-web Updated |
mirantis.azurecr.io/stacklight/alerta-web:9-20231103023010 |
alertmanager Updated |
mirantis.azurecr.io/stacklight/alertmanager:v0-20231103023014 |
|
alertmanager-webhook-servicenow Updated |
mirantis.azurecr.io/stacklight/alertmanager-webhook-servicenow:v0.1-20231027101957 |
|
alpine-utils Updated |
mirantis.azurecr.io/stacklight/alpine-utils:1-20231027023014 |
|
blackbox-exporter |
mirantis.azurecr.io/stacklight/blackbox-exporter:v0.24.0 |
|
cadvisor Updated |
mirantis.azurecr.io/stacklight/cadvisor:v0.47-20231027023014 |
|
configmap-reload |
mirantis.azurecr.io/stacklight/configmap-reload:v0.8.0 |
|
curator |
mirantis.azurecr.io/stacklight/curator:5.7.6-20230404082402 |
|
curl-jq Updated |
mirantis.azurecr.io/scale/curl-jq:alpine-20231019061751 |
|
elasticsearch-exporter |
mirantis.azurecr.io/stacklight/elasticsearch-exporter:v1.5.0 |
|
fluentd Updated |
mirantis.azurecr.io/stacklight/fluentd:1.15-20231027023015 |
|
grafana Updated |
mirantis.azurecr.io/stacklight/grafana:9.5.13 |
|
grafana-image-renderer Updated |
mirantis.azurecr.io/stacklight/grafana-image-renderer:3-20231030112043 |
|
k8s-sidecar Updated |
mirantis.azurecr.io/stacklight/k8s-sidecar:1-20231030141315 |
|
kube-state-metrics |
mirantis.azurecr.io/stacklight/kube-state-metrics:v2.8.2 |
|
kubectl Updated |
mirantis.azurecr.io/stacklight/kubectl:1.22-20231103023015 |
|
metric-collector Updated |
mirantis.azurecr.io/stacklight/metric-collector:v0.1-20231103023010 |
|
metricbeat Updated |
mirantis.azurecr.io/stacklight/metricbeat:7.12.1-20231027023009 |
|
node-exporter |
mirantis.azurecr.io/stacklight/node-exporter:v1.6.0 |
|
oauth2-proxy Updated |
mirantis.azurecr.io/iam/oauth2-proxy:v7.1.3-5 |
|
opensearch Updated |
mirantis.azurecr.io/stacklight/opensearch:2-20231103023014 |
|
opensearch-dashboards Updated |
mirantis.azurecr.io/stacklight/opensearch-dashboards:2-20231103023010 |
|
pgbouncer Updated |
mirantis.azurecr.io/stacklight/pgbouncer:1-20231103023015 |
|
prometheus |
mirantis.azurecr.io/stacklight/prometheus:v2.44.0 |
|
prometheus-es-exporter Updated |
mirantis.azurecr.io/stacklight/prometheus-es-exporter:v0.14.0-20231103023015 |
|
prometheus-msteams |
mirantis.azurecr.io/stacklight/prometheus-msteams:v1.5.2 |
|
prometheus-patroni-exporter Updated |
mirantis.azurecr.io/stacklight/prometheus-patroni-exporter:0.0.1-20231103023015 |
|
prometheus-postgres-exporter |
mirantis.azurecr.io/stacklight/prometheus-postgres-exporter:v0.12.0 |
|
prometheus-relay Updated |
mirantis.azurecr.io/stacklight/prometheus-relay:v0.4-20231103023010 |
|
psql-client |
mirantis.azurecr.io/scale/psql-client:v13-20230817113822 |
|
sf-notifier Updated |
mirantis.azurecr.io/stacklight/sf-notifier:v0.4-20231027023020 |
|
sf-reporter |
mirantis.azurecr.io/stacklight/sf-reporter:v0.1-20230911151029 |
|
spilo Updated |
mirantis.azurecr.io/stacklight/spilo:13-2.1p9-20231103023014 |
|
stacklight-toolkit Updated |
mirantis.azurecr.io/stacklight/stacklight-toolkit:20231103023015 |
|
telegraf |
mirantis.azurecr.io/stacklight/telegraf:v1.9.1-20231103023010 Updated |
|
mirantis.azurecr.io/stacklight/telegraf:1-20231030132045 Updated |
||
telemeter Updated |
mirantis.azurecr.io/stacklight/telemeter:4.4-20231027023011 |
|
telemeter-token-auth Updated |
mirantis.azurecr.io/stacklight/telemeter-token-auth:v0.1-20231103023014 |
Unchanged as compared to 17.0.0
Artifact |
Component |
Path |
|---|---|---|
Debian repositories |
System packages |
|
http://mirror.mirantis.com/kaas/kubernetes-extra-rhel7-0.0.8/ |
||
https://mirror.mirantis.com/kaas/ubuntu-2023-10-11-015021.target.txt |
||
MCR repositories |
MCR |
https://repos.mirantis.com/ubuntu/dists/bionic/pool/stable-23.10/ |
Target ubuntu system |
Ubuntu |
https://binary.mirantis.com/bm/bin/efi/ubuntu/tgz-focal-20231011091340 |
This section outlines release notes for the major Cluster release 17.0.0 that is introduced in the Container Cloud release 2.25.0. This Cluster release is based on the Cluster release 16.0.0. The Cluster release 17.0.0 supports:
Mirantis OpenStack for Kubernetes (MOSK) 23.3. For details, see Release notes 23.3.
Mirantis Kubernetes Engine (MKE) 3.7.1. For details, see MKE Release Notes.
Mirantis Container Runtime (MCR) 23.0.7. For details, see MCR Release Notes.
Kubernetes 1.27.
For the list of known and addressed issues, refer to the Container Cloud release 2.25.0 section.
This section outlines new features implemented in the Cluster release 17.0.0 that is introduced in the Container Cloud release 2.25.0.
Introduced support for Mirantis Container Runtime (MCR) 23.0.7 and Mirantis Kubernetes Engine (MKE) 3.7.1 that supports Kubernetes 1.27 for the Container Cloud management and managed clusters. On existing clusters, MKE and MCR are updated to the latest supported version when you update your managed cluster to the Cluster release 17.0.0.
Caution
Support for MKE 3.6.x is dropped. Therefore, new deployments on MKE 3.6.x are not supported.
Implemented the Ceph Cluster details page in the Container Cloud web UI containing the Machines and OSDs tabs with a detailed descriptions and statuses of Ceph machines and Ceph OSDs comprising a Ceph cluster deployment.
Implemented the capability to address Ceph storage devices using the by-id
identifiers.
The by-id identifier is the only persistent device identifier for a Ceph
cluster that remains stable after the cluster upgrade or any other maintenance.
Therefore, Mirantis recommends using device by-id symlinks rather than
device names or by-path symlinks.
Added the kaasCephState field in the KaaSCephCluster.status
specification to display the current state of KaasCephCluster and
any errors during object reconciliation, including specification
generation, object creation on a managed cluster, and status retrieval.
TechPreview
Added initial Technology Preview support for forwarding of Container Cloud services logs, which are sent to OpenSearch by default, to Splunk using the syslog external output configuration.
Implemented the following monitoring improvements for Ceph:
Optimized the following Ceph dashboards in Grafana: Ceph Cluster, Ceph Pools, Ceph OSDs.
Removed the redundant Ceph Nodes Grafana dashboard. You can view its content using the following dashboards:
Ceph stats through the Ceph Cluster dashboard.
Resource utilization through the System dashboard, which now includes filtering by Ceph node labels, such as
ceph_role_osd,ceph_role_mon, andceph_role_mgr.
Removed the
rook_clusteralert label.Removed the redundant
CephOSDDownalert.Renamed the
CephNodeDownalert toCephOSDNodeDown.
Optimized StackLight NodeDown alerts for a better notification handling
after cluster recovery from an accident:
Reworked the
NodeDown-related alert inhibition rulesReworked the logic of all
NodeDown-related alerts for all supported groups of nodes, which includes renaming of the<alertName>TargetsOutagealerts to<alertNameTargetDown>Added the
TungstenFabricOperatorTargetDownalert for Tungsten Fabric deployments of MOSK clustersRemoved redundant
KubeDNSTargetsOutageandKubePodsNotReadyalerts
Optimized OpenSearch configuration and StackLight datamodel to provide better resources utilization and faster query response. Added the following enhancements:
Limited the default namespaces for log collection with the ability to add custom namespaces to the monitoring list using the following parameters:
logging.namespaceFiltering.logs- limits the number of namespaces for Pods log collection. Enabled by default.logging.namespaceFiltering.events- limits the number of namespaces for Kubernetes events collection. Disabled by default.logging.namespaceFiltering.events/logs.extraNamespaces- adds extra namespaces, which are not in the default list, to collect specific Kubernetes Pod logs or Kubernetes events. Empty by default.
Added the
logging.enforceOopsCompressionparameter that enforces 32 GB of heap size, unless the defined memory limit allows using 50 GB of heap. Enabled by default.Added the
NO_SEVERITYseverity label that is automatically added to a log with no severity label in the message. This allows having more control over which logs are actually being processed by Fluentd and which are skipped by mistake.Added documentation on how to tune OpenSearch performance using hardware and software settings for baremetal-based Container Cloud clusters.
Learn more
Operations Guide: Tune OpenSearch performance for the bare metal provider
Operations Guide: StackLight configuration parameters - Log filtering for namespaces
Operations Guide: StackLight configuration parameters - Enforce OOPS compression
Operations Guide: StackLight configuration parameters - Log verbosity
On top of continuous improvements delivered to the existing Container Cloud guides, added the documentation on how to export data from the Table panels of Grafana dashboards to CSV.
The following table lists the components versions of the Cluster release 17.0.0.
Component |
Application/Service |
Version |
|---|---|---|
Cluster orchestration |
Mirantis Kubernetes Engine |
3.7.1 0 |
Container runtime |
Mirantis Container Runtime |
23.0.7 1 |
Distributed storage |
Ceph |
17.2.6 (Quincy) |
Rook |
1.11.11-13 |
|
LCM |
helm-controller |
1.38.17 |
lcm-ansible |
0.23.0-73-g01aa9b3 |
|
lcm-agent |
1.38.17 |
|
StackLight |
Alerta |
9.0.0 |
Alertmanager |
0.25.0 |
|
Alertmanager Webhook ServiceNow |
0.1 |
|
Blackbox Exporter |
0.24.0 |
|
cAdvisor |
0.47.2 |
|
Elasticsearch Curator |
5.7.6 |
|
Elasticsearch Exporter |
1.5.0 |
|
Fluentd |
1.15.3 |
|
Grafana |
9.5.7 |
|
Grafana Image Renderer |
3.7.1 |
|
kube-state-metrics |
2.8.2 |
|
Metric Collector |
0.1 |
|
Metricbeat |
7.12.1 |
|
Node Exporter |
1.6.0 |
|
OAuth2 Proxy |
7.1.3 |
|
OpenSearch |
2.8.0 |
|
OpenSearch Dashboards |
2.7.0 |
|
Prometheus |
2.44.0 |
|
Prometheus ES Exporter |
0.14.0 |
|
Prometheus MS Teams |
1.5.2 |
|
Prometheus Patroni Exporter |
0.0.1 |
|
Prometheus Postgres Exporter |
0.12.0 |
|
Prometheus Relay |
0.4 |
|
sf-notifier |
0.4 |
|
sf-reporter |
0.1 |
|
Spilo |
13-2.1p9 |
|
Telegraf |
1.9.1 |
|
1.27.3 |
||
Telemeter |
4.4 |
- 0
For the Mirantis Kubernetes Engine (MKE) release highlights and components versions, see MKE documentation: MKE release notes.
- 1
For the Mirantis Container Runtime (MCR) release highlights, see MCR documentation: MCR release notes.
This section lists the artifacts of components included in the Cluster release 17.0.0.
Artifact |
Component |
Path |
|---|---|---|
Helm chart |
ceph-controller |
https://binary.mirantis.com/ceph/helm/ceph-operator-1.0.0-mcc-2.25.0-1.tgz |
Docker images |
ceph |
mirantis.azurecr.io/mirantis/ceph:v17.2.6-rel-5 |
ceph-controller |
mirantis.azurecr.io/ceph/mcp/ceph-controller:2.25.0-0 |
|
cephcsi |
mirantis.azurecr.io/mirantis/cephcsi:v3.8.1-rel-1 |
|
cephcsi-registrar |
mirantis.azurecr.io/mirantis/cephcsi-registrar:v2.8.0-cve-1 |
|
cephcsi-provisioner |
mirantis.azurecr.io/mirantis/cephcsi-provisioner:v3.5.0-cve-1 |
|
cephcsi-snapshotter |
mirantis.azurecr.io/mirantis/cephcsi-snapshotter:v6.2.1-cve-1 |
|
cephcsi-attacher |
mirantis.azurecr.io/mirantis/cephcsi-attacher:v4.3.0-cve-1 |
|
cephcsi-resizer |
mirantis.azurecr.io/mirantis/cephcsi-resizer:v1.8.0-cve-1 |
|
rook |
mirantis.azurecr.io/ceph/rook:v1.11.11-13 |
Artifact |
Component |
Path |
|---|---|---|
Binaries |
lcm-ansible |
https://binary.mirantis.com/lcm/bin/lcm-ansible/v0.23.0-73-g01aa9b3/lcm-ansible.tar.gz |
lcm-agent |
||
Helm charts |
helm-controller |
https://binary.mirantis.com/core/helm/helm-controller-1.38.17.tgz |
managed-lcm-api |
https://binary.mirantis.com/core/helm/managed-lcm-api-1.38.17.tgz |
|
Docker images |
helm-controller |
mirantis.azurecr.io/core/lcm-controller:1.38.17 |
Artifact |
Component |
Path |
|---|---|---|
Helm charts |
alerta |
https://binary.mirantis.com/stacklight/helm/alerta-0.1.0-mcp-29.tgz |
alertmanager-webhook-servicenow |
https://binary.mirantis.com/stacklight/helm/alertmanager-webhook-servicenow-0.2.0-mcp-4.tgz |
|
cadvisor |
https://binary.mirantis.com/stacklight/helm/cadvisor-0.1.0-mcp-3.tgz |
|
elasticsearch-curator |
https://binary.mirantis.com/stacklight/helm/elasticsearch-curator-1.5.0-mcp-12.tgz |
|
elasticsearch-exporter |
https://binary.mirantis.com/stacklight/helm/elasticsearch-exporter-1.2.0-mcp-7.tgz |
|
fluentd-logs |
https://binary.mirantis.com/stacklight/helm/fluentd-logs-0.1.0-mcp-193.tgz |
|
grafana |
https://binary.mirantis.com/stacklight/helm/grafana-3.3.10-mcp-250.tgz |
|
iam-proxy |
||
metric-collector |
https://binary.mirantis.com/stacklight/helm/metric-collector-0.3.0-mcp-10.tgz |
|
metricbeat |
https://binary.mirantis.com/stacklight/helm/metricbeat-1.7.1-mcp-16.tgz |
|
opensearch |
https://binary.mirantis.com/stacklight/helm/opensearch-0.1.0-mcp-60.tgz |
|
opensearch-dashboards |
https://binary.mirantis.com/stacklight/helm/opensearch-dashboards-0.1.0-mcp-47.tgz |
|
patroni |
https://binary.mirantis.com/stacklight/helm/patroni-0.15.1-mcp-54.tgz |
|
prometheus |
https://binary.mirantis.com/stacklight/helm/prometheus-8.11.4-mcp-245.tgz |
|
prometheus-blackbox-exporter |
https://binary.mirantis.com/stacklight/helm/prometheus-blackbox-exporter-0.3.0-mcp-15.tgz |
|
prometheus-es-exporter |
https://binary.mirantis.com/stacklight/helm/prometheus-es-exporter-1.0.0-mcp-11.tgz |
|
prometheus-msteams |
https://binary.mirantis.com/stacklight/helm/prometheus-msteams-0.1.0-mcp-9.tgz |
|
sf-notifier |
https://binary.mirantis.com/stacklight/helm/sf-notifier-0.2.0-mcp-7.tgz |
|
sf-reporter |
https://binary.mirantis.com/stacklight/helm/sf-reporter-0.2.0-mcp-7.tgz |
|
stacklight |
https://binary.mirantis.com/stacklight/helm/stacklight-0.13.3.tgz |
|
telegraf-ds |
https://binary.mirantis.com/stacklight/helm/telegraf-ds-1.1.5-mcp-37.tgz |
|
telegraf-s |
https://binary.mirantis.com/stacklight/helm/telegraf-s-1.1.5-mcp-37.tgz |
|
telemeter-client |
https://binary.mirantis.com/stacklight/helm/telemeter-client-0.2.0-mcp-7.tgz |
|
telemeter-server |
https://binary.mirantis.com/stacklight/helm/telemeter-server-0.2.0-mcp-7.tgz |
|
Docker images |
alerta-web |
mirantis.azurecr.io/stacklight/alerta-web:9-20230929023008 |
alertmanager |
mirantis.azurecr.io/stacklight/alertmanager:v0-20230929023012 |
|
alertmanager-webhook-servicenow |
mirantis.azurecr.io/stacklight/alertmanager-webhook-servicenow:v0.1-20230912073324 |
|
alpine-utils |
mirantis.azurecr.io/stacklight/alpine-utils:1-20230929023018 |
|
blackbox-exporter |
mirantis.azurecr.io/stacklight/blackbox-exporter:v0.24.0 |
|
cadvisor |
mirantis.azurecr.io/stacklight/cadvisor:v0.47-20230929023009 |
|
configmap-reload |
mirantis.azurecr.io/stacklight/configmap-reload:v0.8.0 |
|
curator |
mirantis.azurecr.io/stacklight/curator:5.7.6-20230404082402 |
|
curl-jq |
mirantis.azurecr.io/scale/curl-jq:alpine-20230925094109 |
|
elasticsearch-exporter |
mirantis.azurecr.io/stacklight/elasticsearch-exporter:v1.5.0 |
|
fluentd |
mirantis.azurecr.io/stacklight/fluentd:1.15-20230929023011 |
|
grafana |
mirantis.azurecr.io/stacklight/grafana:9.5.7 |
|
grafana-image-renderer |
mirantis.azurecr.io/stacklight/grafana-image-renderer:3-20230929023011 |
|
k8s-sidecar |
mirantis.azurecr.io/stacklight/k8s-sidecar:1.22-20230929023017 |
|
kube-state-metrics |
mirantis.azurecr.io/stacklight/kube-state-metrics:v2.8.2 |
|
kubectl |
mirantis.azurecr.io/stacklight/kubectl:1.22-20230929023018 |
|
metric-collector |
mirantis.azurecr.io/stacklight/metric-collector:v0.1-20230929023015 |
|
metricbeat |
mirantis.azurecr.io/stacklight/metricbeat:7.12.1-20230929023009 |
|
node-exporter |
mirantis.azurecr.io/stacklight/node-exporter:v1.6.0 |
|
oauth2-proxy |
mirantis.azurecr.io/iam/oauth2-proxy:v7.1.3-4 |
|
opensearch |
mirantis.azurecr.io/stacklight/opensearch:2-20230929023012 |
|
opensearch-dashboards |
mirantis.azurecr.io/stacklight/opensearch-dashboards:2-20230929023008 |
|
pgbouncer |
mirantis.azurecr.io/stacklight/pgbouncer:1-20230929023018 |
|
prometheus |
mirantis.azurecr.io/stacklight/prometheus:v2.44.0 |
|
prometheus-es-exporter |
mirantis.azurecr.io/stacklight/prometheus-es-exporter:v0.14.0-20230929023017 |
|
prometheus-msteams |
mirantis.azurecr.io/stacklight/prometheus-msteams:v1.5.2 |
|
prometheus-patroni-exporter |
mirantis.azurecr.io/stacklight/prometheus-patroni-exporter:0.0.1-20230929023018 |
|
prometheus-postgres-exporter |
mirantis.azurecr.io/stacklight/prometheus-postgres-exporter:v0.12.0 |
|
prometheus-relay |
mirantis.azurecr.io/stacklight/prometheus-relay:v0.4-20230929023016 |
|
psql-client |
mirantis.azurecr.io/scale/psql-client:v13-20230817113822 |
|
sf-notifier |
mirantis.azurecr.io/stacklight/sf-notifier:v0.4-20230929023013 |
|
sf-reporter |
mirantis.azurecr.io/stacklight/sf-reporter:v0.1-20230911151029 |
|
spilo |
mirantis.azurecr.io/stacklight/spilo:13-2.1p9-20230929023012 |
|
stacklight-toolkit |
mirantis.azurecr.io/stacklight/stacklight-toolkit:20231004090138 |
|
telegraf |
mirantis.azurecr.io/stacklight/telegraf:v1.9.1-20230915023009 |
|
mirantis.azurecr.io/stacklight/telegraf:1.27-20230809094327 |
||
telemeter |
mirantis.azurecr.io/stacklight/telemeter:4.4-20230929023011 |
|
telemeter-token-auth |
mirantis.azurecr.io/stacklight/telemeter-token-auth:v0.1-20230929023012 |
Artifact |
Component |
Path |
|---|---|---|
Debian repositories |
System packages |
|
http://mirror.mirantis.com/kaas/kubernetes-extra-rhel7-0.0.8/ |
||
https://mirror.mirantis.com/kaas/ubuntu-2023-10-11-015021.target.txt |
||
MCR repositories |
MCR |
https://repos.mirantis.com/ubuntu/dists/bionic/pool/stable-23.10/ |
Target ubuntu system |
Ubuntu |
https://binary.mirantis.com/bm/bin/efi/ubuntu/tgz-focal-20231011091340 |
Major and patch versions update path
The primary distinction between major and patch product versions lies in the fact that major release versions introduce new functionalities, whereas patch release versions predominantly offer minor product enhancements, mostly CVE resolutions for your clusters.
Depending on your deployment needs, you can either update only between major Cluster releases or apply patch updates between major releases. Choosing the latter option ensures you receive security fixes as soon as they become available. Though, be prepared to update your cluster frequently, approximately once every three weeks. Otherwise, you can update only between major Cluster releases as each subsequent major Cluster release includes patch Cluster release updates of the previous major Cluster release.
This section outlines release notes for major and patch Cluster releases of the 16.3.x series.
This section includes release notes for the patch Cluster release 16.3.10 that is introduced in the Container Cloud patch release 2.29.5 and is based on the previous Cluster releases of the 16.3.x series series.
This Cluster release supports Mirantis Kubernetes Engine 3.7.23
with Kubernetes 1.27 and Mirantis Container Runtime 23.0.15 with
docker-ee-cli updated to 23.0.18.
For the list of CVE fixes delivered with this patch Cluster release, see 2.29.5
For details on patch release delivery, see Patch releases
This section lists the artifacts of components included in the Cluster release 16.3.10.
Note
The components that are newly added, updated, deprecated, or removed
as compared to the previous release version, are marked
with a corresponding superscript,
for example, lcm-ansible Updated.
Artifact |
Component |
Path |
|---|---|---|
Helm charts Updated |
local-volume-provisioner |
https://binary.mirantis.com/core/helm/local-volume-provisioner-1.41.35.tgz |
metallb |
||
Docker images Updated |
ironic |
mirantis.azurecr.io/openstack/ironic:antelope-jammy-20250704140945 |
metallb-controller |
mirantis.azurecr.io/bm/metallb/controller:v0.14.5-6716f869-amd64 |
|
metallb-speaker |
mirantis.azurecr.io/bm/metallb/speaker:v0.14.5-6716f869-amd64 |
Artifact |
Component |
Path |
|---|---|---|
Helm charts |
ceph-controller |
https://binary.mirantis.com/ceph/helm/ceph-operator-1.0.0-mcc-2.29.4-2.tgz |
Docker images |
ceph |
mirantis.azurecr.io/mirantis/ceph:v18.2.7-2.cve |
ceph-controller |
mirantis.azurecr.io/ceph/mcp/ceph-controller:2.29.4-1 |
|
cephcsi |
mirantis.azurecr.io/mirantis/cephcsi:v3.9.0-29.cve |
|
cephcsi-attacher |
mirantis.azurecr.io/mirantis/cephcsi-attacher:v4.4.2-7.cve |
|
cephcsi-provisioner |
mirantis.azurecr.io/mirantis/cephcsi-provisioner:v3.6.2-7.cve |
|
cephcsi-registrar |
mirantis.azurecr.io/mirantis/cephcsi-registrar:v2.9.2-7.cve |
|
cephcsi-resizer |
mirantis.azurecr.io/mirantis/cephcsi-resizer:v1.9.2-7.cve |
|
cephcsi-snapshotter |
mirantis.azurecr.io/mirantis/cephcsi-snapshotter:v6.3.2-7.cve |
|
rook |
mirantis.azurecr.io/ceph/rook:v1.13.5-31 |
|
snapshot-controller |
mirantis.azurecr.io/mirantis/snapshot-controller:v6.3.2-7.cve |
Artifact |
Component |
Path |
|---|---|---|
Helm charts |
cinder-csi-plugin Updated |
https://binary.mirantis.com/core/helm/cinder-csi-plugin-1.41.35.tgz |
client-certificate-controller Updated |
https://binary.mirantis.com/core/helm/client-certificate-controller-1.41.35.tgz |
|
metrics-server Updated |
https://binary.mirantis.com/core/helm/metrics-server-1.41.35.tgz |
|
openstack-cloud-controller-manager Deprecated |
https://binary.mirantis.com/core/helm/openstack-cloud-controller-manager-1.41.35.tgz |
|
policy-controller Updated |
https://binary.mirantis.com/core/helm/policy-controller-1.41.35.tgz |
|
Docker images |
cinder-csi-plugin |
mirantis.azurecr.io/lcm/kubernetes/cinder-csi-plugin:v1.27.2-28 |
client-certificate-controller Updated |
mirantis.azurecr.io/core/client-certificate-controller:1.41.35 |
|
csi-attacher Deprecated |
mirantis.azurecr.io/lcm/k8scsi/csi-attacher:v4.2.0-10 |
|
csi-node-driver-registrar Deprecated |
mirantis.azurecr.io/lcm/k8scsi/csi-node-driver-registrar:v2.7.0-9 |
|
csi-provisioner Deprecated |
mirantis.azurecr.io/lcm/k8scsi/csi-provisioner:v3.4.1-10 |
|
csi-resizer Deprecated |
mirantis.azurecr.io/lcm/k8scsi/csi-resizer:v1.7.0-10 |
|
csi-snapshotter Deprecated |
mirantis.azurecr.io/lcm/k8scsi/csi-snapshotter:v6.2.1-mcc-9 |
|
livenessprobe Deprecated |
mirantis.azurecr.io/lcm/k8scsi/livenessprobe:v2.9.0-9 |
|
metrics-server |
mirantis.azurecr.io/lcm/metrics-server-amd64:v0.6.3-13 |
|
openstack-cloud-controller-manager Deprecated |
mirantis.azurecr.io/lcm/kubernetes/openstack-cloud-controller-manager:v1.27.2-28 |
|
policy-controller Updated |
mirantis.azurecr.io/core/policy-controller:1.41.35 |
Artifact |
Component |
Path |
|---|---|---|
Binaries Updated |
lcm-agent |
mirantis.azurecr.io/core/bin/lcm-agent-1.41.35 |
lcm-ansible |
mirantis.azurecr.io/lcm/bin/lcm-ansible/v0.26.0-116-g388553f/lcm-ansible.tar.gz |
|
Helm charts Updated |
helm-controller |
https://binary.mirantis.com/core/helm/helm-controller-1.41.35.tgz |
managed-lcm-api |
https://binary.mirantis.com/core/helm/managed-lcm-api-1.41.35.tgz |
|
Docker images Updated |
helm-controller |
mirantis.azurecr.io/core/helm-controller:1.41.35 |
mcc-haproxy |
mirantis.azurecr.io/lcm/mcc-haproxy:v0.26.0-116-g388553f |
|
mcc-keepalived |
mirantis.azurecr.io/lcm/mcc-keepalived:v0.26.0-116-g388553f |
Artifact |
Component |
Path |
|---|---|---|
Helm charts |
alerta |
https://binary.mirantis.com/stacklight/helm/alerta-0.1.0-mcp-33.tgz |
alertmanager-webhook-servicenow |
https://binary.mirantis.com/stacklight/helm/alertmanager-webhook-servicenow-0.2.0-mcp-8.tgz |
|
cadvisor |
https://binary.mirantis.com/stacklight/helm/cadvisor-0.1.0-mcp-7.tgz |
|
elasticsearch-curator |
https://binary.mirantis.com/stacklight/helm/elasticsearch-curator-1.5.0-mcp-15.tgz |
|
elasticsearch-exporter |
https://binary.mirantis.com/stacklight/helm/elasticsearch-exporter-1.2.0-mcp-10.tgz |
|
fluentd-logs |
https://binary.mirantis.com/stacklight/helm/fluentd-logs-0.1.0-mcp-248.tgz |
|
grafana |
https://binary.mirantis.com/stacklight/helm/grafana-3.3.10-mcp-317.tgz |
|
iam-proxy |
||
metric-collector |
https://binary.mirantis.com/stacklight/helm/metric-collector-0.3.0-mcp-18.tgz |
|
metricbeat |
https://binary.mirantis.com/stacklight/helm/metricbeat-1.7.1-mcp-25.tgz |
|
opensearch |
https://binary.mirantis.com/stacklight/helm/opensearch-0.1.0-mcp-88.tgz |
|
opensearch-dashboards |
https://binary.mirantis.com/stacklight/helm/opensearch-dashboards-0.1.0-mcp-57.tgz |
|
patroni |
https://binary.mirantis.com/stacklight/helm/patroni-0.15.1-mcp-62.tgz |
|
prometheus |
https://binary.mirantis.com/stacklight/helm/prometheus-8.11.4-mcp-258.tgz |
|
prometheus-blackbox-exporter |
https://binary.mirantis.com/stacklight/helm/prometheus-blackbox-exporter-0.3.0-mcp-19.tgz |
|
prometheus-es-exporter |
https://binary.mirantis.com/stacklight/helm/prometheus-es-exporter-1.0.0-mcp-18.tgz |
|
prometheus-msteams |
https://binary.mirantis.com/stacklight/helm/prometheus-msteams-0.1.0-mcp-12.tgz |
|
sf-notifier |
https://binary.mirantis.com/stacklight/helm/sf-notifier-0.2.0-mcp-10.tgz |
|
sf-reporter |
https://binary.mirantis.com/stacklight/helm/sf-reporter-0.2.0-mcp-10.tgz |
|
stacklight Updated |
https://binary.mirantis.com/stacklight/helm/stacklight-0.16.18.tgz |
|
telegraf-ds |
https://binary.mirantis.com/stacklight/helm/telegraf-ds-1.1.5-mcp-42.tgz |
|
telegraf-s |
https://binary.mirantis.com/stacklight/helm/telegraf-s-1.1.5-mcp-42.tgz |
|
telemeter-client |
https://binary.mirantis.com/stacklight/helm/telemeter-client-0.2.0-mcp-14.tgz |
|
telemeter-server |
https://binary.mirantis.com/stacklight/helm/telemeter-server-0.2.0-mcp-14.tgz |
|
Docker images |
alerta-web Updated |
mirantis.azurecr.io/stacklight/alerta-web:9-20250707023011 |
alertmanager Updated |
mirantis.azurecr.io/stacklight/alertmanager:v0.25-20250707023018 |
|
alertmanager-webhook-servicenow |
mirantis.azurecr.io/stacklight/alertmanager-webhook-servicenow:v0.1-20250411082209 |
|
alpine-utils Updated |
mirantis.azurecr.io/stacklight/alpine-utils:1-20250707023018 |
|
blackbox-exporter |
mirantis.azurecr.io/stacklight/blackbox-exporter:0-20250305095821 |
|
cadvisor Updated |
mirantis.azurecr.io/stacklight/cadvisor:v0.49.1-20250707023011 |
|
configmap-reload |
mirantis.azurecr.io/stacklight/configmap-reload:v0.8.0 |
|
curator |
mirantis.azurecr.io/stacklight/curator:5.7.6-20230404082402 |
|
elasticsearch-exporter |
mirantis.azurecr.io/stacklight/elasticsearch-exporter:v1.5.0 |
|
fluentd Updated |
mirantis.azurecr.io/stacklight/fluentd:1.18-plugin-os-1.0-20250707023011 |
|
grafana |
mirantis.azurecr.io/stacklight/grafana:10.4.15 |
|
k8s-sidecar |
mirantis.azurecr.io/stacklight/k8s-sidecar:1-20250411124723 |
|
kube-state-metrics |
mirantis.azurecr.io/stacklight/kube-state-metrics:v2.10.1 |
|
metric-collector Updated |
mirantis.azurecr.io/stacklight/metric-collector:v0.1-20250707023018 |
|
metricbeat Updated |
mirantis.azurecr.io/stacklight/metricbeat:7.12.1-20250707023019 |
|
node-exporter |
mirantis.azurecr.io/stacklight/node-exporter:v1.8.2 |
|
oauth2-proxy |
mirantis.azurecr.io/iam/oauth2-proxy:v7.1.3-15 |
|
opensearch Updated |
mirantis.azurecr.io/stacklight/opensearch:2.19-20250707023019 |
|
opensearch-dashboards Updated |
mirantis.azurecr.io/stacklight/opensearch-dashboards:2.19-20250707023011 |
|
prometheus |
mirantis.azurecr.io/stacklight/prometheus:v2.48.0 |
|
prometheus-es-exporter Updated |
mirantis.azurecr.io/stacklight/prometheus-es-exporter:v0.14-20250707023018 |
|
prometheus-msteams Updated |
mirantis.azurecr.io/stacklight/prometheus-msteams:v1.5-20250707023011 |
|
prometheus-patroni-exporter Updated |
mirantis.azurecr.io/stacklight/prometheus-patroni-exporter:0.0.1-20250707023019 |
|
prometheus-postgres-exporter |
mirantis.azurecr.io/stacklight/prometheus-postgres-exporter:v0.15.0 |
|
prometheus-relay |
mirantis.azurecr.io/stacklight/prometheus-relay:v0.4-20250304085150 |
|
sf-notifier Updated |
mirantis.azurecr.io/stacklight/sf-notifier:v0.4-20250707023018 |
|
sf-reporter |
mirantis.azurecr.io/stacklight/sf-reporter:v0.1-20250411082229 |
|
spilo Updated |
mirantis.azurecr.io/stacklight/spilo:13-3.3-p2-20250707023018 |
|
telegraf |
mirantis.azurecr.io/stacklight/telegraf:v1.9.1-20241202023010 |
|
mirantis.azurecr.io/stacklight/telegraf:1-20250411114904 |
||
telemeter Updated |
mirantis.azurecr.io/stacklight/telemeter:4.4-20250707023019 |
|
telemeter-token-auth Updated |
mirantis.azurecr.io/stacklight/telemeter-token-auth:v0.1-20250707023019 |
Artifact |
Component |
Path |
|---|---|---|
Configuration management |
Ansible |
|
Debian repositories |
System packages |
|
https://mirror.mirantis.com/kaas/ubuntu-2025-06-23-003900/ Updated |
||
https://mirror.mirantis.com/kaas/ubuntu-2025-06-23-003900.target.txt Updated |
||
MCR repositories |
MCR |
https://repos.mirantis.com/ubuntu/dists/jammy/pool/stable-23.0/ |
Target ubuntu system |
Ubuntu |
https://binary.mirantis.com/bm/bin/efi/ubuntu/tgz-jammy-20250624161133 Updated |
This section includes release notes for the patch Cluster release 16.3.9 that is introduced in the Container Cloud patch release 2.29.4 and is based on the previous Cluster releases of the 16.3.x series series.
This Cluster release supports Mirantis Kubernetes Engine 3.7.23
with Kubernetes 1.27 and Mirantis Container Runtime 23.0.15 with
docker-ee-cli updated to 23.0.18.
For the list of CVE fixes delivered with this patch Cluster release, see 2.29.4
For details on patch release delivery, see Patch releases
This section lists the artifacts of components included in the Cluster release 16.3.9.
Note
The components that are newly added, updated, deprecated, or removed
as compared to the previous release version, are marked
with a corresponding superscript,
for example, lcm-ansible Updated.
Artifact |
Component |
Path |
|---|---|---|
Helm charts |
local-volume-provisioner |
https://binary.mirantis.com/core/helm/local-volume-provisioner-1.41.32.tgz |
metallb |
||
Docker images |
ironic |
mirantis.azurecr.io/openstack/ironic:antelope-jammy-20250307062615 |
metallb-controller |
mirantis.azurecr.io/bm/metallb/controller:v0.14.5-747c4ca9-amd64 |
|
metallb-speaker |
mirantis.azurecr.io/bm/metallb/speaker:v0.14.5-747c4ca9-amd64 |
Artifact |
Component |
Path |
|---|---|---|
Helm charts Updated |
ceph-controller |
https://binary.mirantis.com/ceph/helm/ceph-operator-1.0.0-mcc-2.29.4-2.tgz |
Docker images |
ceph Updated |
mirantis.azurecr.io/mirantis/ceph:v18.2.7-2.cve |
ceph-controller Updated |
mirantis.azurecr.io/ceph/mcp/ceph-controller:2.29.4-1 |
|
cephcsi Updated |
mirantis.azurecr.io/mirantis/cephcsi:v3.9.0-29.cve |
|
cephcsi-attacher |
mirantis.azurecr.io/mirantis/cephcsi-attacher:v4.4.2-7.cve |
|
cephcsi-provisioner |
mirantis.azurecr.io/mirantis/cephcsi-provisioner:v3.6.2-7.cve |
|
cephcsi-registrar |
mirantis.azurecr.io/mirantis/cephcsi-registrar:v2.9.2-7.cve |
|
cephcsi-resizer |
mirantis.azurecr.io/mirantis/cephcsi-resizer:v1.9.2-7.cve |
|
cephcsi-snapshotter |
mirantis.azurecr.io/mirantis/cephcsi-snapshotter:v6.3.2-7.cve |
|
rook Updated |
mirantis.azurecr.io/ceph/rook:v1.13.5-31 |
|
snapshot-controller |
mirantis.azurecr.io/mirantis/snapshot-controller:v6.3.2-7.cve |
Artifact |
Component |
Path |
|---|---|---|
Helm charts |
cinder-csi-plugin Deprecated |
https://binary.mirantis.com/core/helm/cinder-csi-plugin-1.41.32.tgz |
client-certificate-controller |
https://binary.mirantis.com/core/helm/client-certificate-controller-1.41.32.tgz |
|
metrics-server |
https://binary.mirantis.com/core/helm/metrics-server-1.41.32.tgz |
|
openstack-cloud-controller-manager Deprecated |
https://binary.mirantis.com/core/helm/openstack-cloud-controller-manager-1.41.32.tgz |
|
policy-controller |
https://binary.mirantis.com/core/helm/policy-controller-1.41.32.tgz |
|
Docker images |
cinder-csi-plugin Deprecated |
mirantis.azurecr.io/lcm/kubernetes/cinder-csi-plugin:v1.27.2-28 |
client-certificate-controller |
mirantis.azurecr.io/core/client-certificate-controller:1.41.32 |
|
csi-attacher Deprecated |
mirantis.azurecr.io/lcm/k8scsi/csi-attacher:v4.2.0-10 |
|
csi-node-driver-registrar Deprecated |
mirantis.azurecr.io/lcm/k8scsi/csi-node-driver-registrar:v2.7.0-9 |
|
csi-provisioner Deprecated |
mirantis.azurecr.io/lcm/k8scsi/csi-provisioner:v3.4.1-10 |
|
csi-resizer Deprecated |
mirantis.azurecr.io/lcm/k8scsi/csi-resizer:v1.7.0-10 |
|
csi-snapshotter Deprecated |
mirantis.azurecr.io/lcm/k8scsi/csi-snapshotter:v6.2.1-mcc-9 |
|
livenessprobe Deprecated |
mirantis.azurecr.io/lcm/k8scsi/livenessprobe:v2.9.0-9 |
|
metrics-server |
mirantis.azurecr.io/lcm/metrics-server-amd64:v0.6.3-13 |
|
openstack-cloud-controller-manager Deprecated |
mirantis.azurecr.io/lcm/kubernetes/openstack-cloud-controller-manager:v1.27.2-28 |
|
policy-controller |
mirantis.azurecr.io/core/policy-controller:1.41.32 |
Artifact |
Component |
Path |
|---|---|---|
Binaries |
lcm-agent |
mirantis.azurecr.io/core/bin/lcm-agent-1.41.32 |
lcm-ansible |
mirantis.azurecr.io/lcm/bin/lcm-ansible/v0.26.0-115-g2cedbea/lcm-ansible.tar.gz |
|
Helm charts |
helm-controller |
https://binary.mirantis.com/core/helm/helm-controller-1.41.32.tgz |
managed-lcm-api |
https://binary.mirantis.com/core/helm/managed-lcm-api-1.41.32.tgz |
|
Docker images |
helm-controller |
mirantis.azurecr.io/core/helm-controller:1.41.32 |
mcc-haproxy |
mirantis.azurecr.io/lcm/mcc-haproxy:v0.26.0-115-g2cedbea |
|
mcc-keepalived |
mirantis.azurecr.io/lcm/mcc-keepalived:v0.26.0-115-g2cedbea |
Artifact |
Component |
Path |
|---|---|---|
Helm charts |
alerta |
https://binary.mirantis.com/stacklight/helm/alerta-0.1.0-mcp-33.tgz |
alertmanager-webhook-servicenow |
https://binary.mirantis.com/stacklight/helm/alertmanager-webhook-servicenow-0.2.0-mcp-8.tgz |
|
cadvisor |
https://binary.mirantis.com/stacklight/helm/cadvisor-0.1.0-mcp-7.tgz |
|
elasticsearch-curator |
https://binary.mirantis.com/stacklight/helm/elasticsearch-curator-1.5.0-mcp-15.tgz |
|
elasticsearch-exporter |
https://binary.mirantis.com/stacklight/helm/elasticsearch-exporter-1.2.0-mcp-10.tgz |
|
fluentd-logs |
https://binary.mirantis.com/stacklight/helm/fluentd-logs-0.1.0-mcp-248.tgz |
|
grafana |
https://binary.mirantis.com/stacklight/helm/grafana-3.3.10-mcp-317.tgz |
|
iam-proxy |
||
metric-collector |
https://binary.mirantis.com/stacklight/helm/metric-collector-0.3.0-mcp-18.tgz |
|
metricbeat |
https://binary.mirantis.com/stacklight/helm/metricbeat-1.7.1-mcp-25.tgz |
|
opensearch |
https://binary.mirantis.com/stacklight/helm/opensearch-0.1.0-mcp-88.tgz |
|
opensearch-dashboards |
https://binary.mirantis.com/stacklight/helm/opensearch-dashboards-0.1.0-mcp-57.tgz |
|
patroni |
https://binary.mirantis.com/stacklight/helm/patroni-0.15.1-mcp-62.tgz |
|
prometheus |
https://binary.mirantis.com/stacklight/helm/prometheus-8.11.4-mcp-258.tgz |
|
prometheus-blackbox-exporter |
https://binary.mirantis.com/stacklight/helm/prometheus-blackbox-exporter-0.3.0-mcp-19.tgz |
|
prometheus-es-exporter |
https://binary.mirantis.com/stacklight/helm/prometheus-es-exporter-1.0.0-mcp-18.tgz |
|
prometheus-msteams |
https://binary.mirantis.com/stacklight/helm/prometheus-msteams-0.1.0-mcp-12.tgz |
|
sf-notifier |
https://binary.mirantis.com/stacklight/helm/sf-notifier-0.2.0-mcp-10.tgz |
|
sf-reporter |
https://binary.mirantis.com/stacklight/helm/sf-reporter-0.2.0-mcp-10.tgz |
|
stacklight Updated |
https://binary.mirantis.com/stacklight/helm/stacklight-0.16.16.tgz |
|
telegraf-ds |
https://binary.mirantis.com/stacklight/helm/telegraf-ds-1.1.5-mcp-42.tgz |
|
telegraf-s |
https://binary.mirantis.com/stacklight/helm/telegraf-s-1.1.5-mcp-42.tgz |
|
telemeter-client |
https://binary.mirantis.com/stacklight/helm/telemeter-client-0.2.0-mcp-14.tgz |
|
telemeter-server |
https://binary.mirantis.com/stacklight/helm/telemeter-server-0.2.0-mcp-14.tgz |
|
Docker images |
alerta-web Updated |
mirantis.azurecr.io/stacklight/alerta-web:9-20250526023008 |
alertmanager Updated |
mirantis.azurecr.io/stacklight/alertmanager:v0.25-20250526023014 |
|
alertmanager-webhook-servicenow |
mirantis.azurecr.io/stacklight/alertmanager-webhook-servicenow:v0.1-20250411082209 |
|
alpine-utils Updated |
mirantis.azurecr.io/stacklight/alpine-utils:1-20250526023015 |
|
blackbox-exporter |
mirantis.azurecr.io/stacklight/blackbox-exporter:0-20250305095821 |
|
cadvisor Updated |
mirantis.azurecr.io/stacklight/cadvisor:v0.49.1-20250526023013 |
|
configmap-reload |
mirantis.azurecr.io/stacklight/configmap-reload:v0.8.0 |
|
curator |
mirantis.azurecr.io/stacklight/curator:5.7.6-20230404082402 |
|
elasticsearch-exporter |
mirantis.azurecr.io/stacklight/elasticsearch-exporter:v1.5.0 |
|
fluentd Updated |
mirantis.azurecr.io/stacklight/fluentd:1.18-plugin-os-1.0-20250526023008 |
|
grafana |
mirantis.azurecr.io/stacklight/grafana:10.4.15 |
|
k8s-sidecar |
mirantis.azurecr.io/stacklight/k8s-sidecar:1-20250411124723 |
|
kube-state-metrics |
mirantis.azurecr.io/stacklight/kube-state-metrics:v2.10.1 |
|
metric-collector Updated |
mirantis.azurecr.io/stacklight/metric-collector:v0.1-20250526023013 |
|
metricbeat Updated |
mirantis.azurecr.io/stacklight/metricbeat:7.12.1-20250526023013 |
|
node-exporter |
mirantis.azurecr.io/stacklight/node-exporter:v1.8.2 |
|
oauth2-proxy |
mirantis.azurecr.io/iam/oauth2-proxy:v7.1.3-15 |
|
opensearch Updated |
mirantis.azurecr.io/stacklight/opensearch:2.17-20250526023013 |
|
opensearch-dashboards Updated |
mirantis.azurecr.io/stacklight/opensearch-dashboards:2.17-20250526023010 |
|
prometheus |
mirantis.azurecr.io/stacklight/prometheus:v2.48.0 |
|
prometheus-es-exporter Updated |
mirantis.azurecr.io/stacklight/prometheus-es-exporter:v0.14-20250526023015 |
|
prometheus-msteams Updated |
mirantis.azurecr.io/stacklight/prometheus-msteams:v1.5-20250526023013 |
|
prometheus-patroni-exporter Updated |
mirantis.azurecr.io/stacklight/prometheus-patroni-exporter:0.0.1-20250526023015 |
|
prometheus-postgres-exporter |
mirantis.azurecr.io/stacklight/prometheus-postgres-exporter:v0.15.0 |
|
prometheus-relay |
mirantis.azurecr.io/stacklight/prometheus-relay:v0.4-20250304085150 |
|
sf-notifier Updated |
mirantis.azurecr.io/stacklight/sf-notifier:v0.4-20250526023014 |
|
sf-reporter |
mirantis.azurecr.io/stacklight/sf-reporter:v0.1-20250411082229 |
|
spilo Updated |
mirantis.azurecr.io/stacklight/spilo:13-3.3-p2-20250526023013 |
|
telegraf |
mirantis.azurecr.io/stacklight/telegraf:v1.9.1-20241202023010 |
|
mirantis.azurecr.io/stacklight/telegraf:1-20250411114904 |
||
telemeter Updated |
mirantis.azurecr.io/stacklight/telemeter:4.4-20250526023014 |
|
telemeter-token-auth Updated |
mirantis.azurecr.io/stacklight/telemeter-token-auth:v0.1-20250526023014 |
Artifact |
Component |
Path |
|---|---|---|
Configuration management |
Ansible |
|
Debian repositories |
System packages |
|
https://mirror.mirantis.com/kaas/ubuntu-2025-05-26-003900/ Updated |
||
https://mirror.mirantis.com/kaas/ubuntu-2025-05-26-003900.target.txt Updated |
||
MCR repositories |
MCR |
https://repos.mirantis.com/ubuntu/dists/jammy/pool/stable-23.0/ |
Target ubuntu system |
Ubuntu |
https://binary.mirantis.com/bm/bin/efi/ubuntu/tgz-jammy-20250526092812 Updated |
This section includes release notes for the patch Cluster release 16.3.8 that is introduced in the Container Cloud patch release 2.29.3 and is based on the previous Cluster releases of the 16.3.x series series.
This Cluster release supports Mirantis Kubernetes Engine 3.7.22
with Kubernetes 1.27 and Mirantis Container Runtime 23.0.15 with
docker-ee-cli updated to 23.0.18.
For the list of CVE fixes delivered with this patch Cluster release, see 2.29.3
For details on patch release delivery, see Patch releases
This section lists the artifacts of components included in the Cluster release 16.3.8.
Note
The components that are newly added, updated, deprecated, or removed
as compared to the previous release version, are marked
with a corresponding superscript,
for example, lcm-ansible Updated.
Artifact |
Component |
Path |
|---|---|---|
Helm charts |
local-volume-provisioner |
https://binary.mirantis.com/core/helm/local-volume-provisioner-1.41.32.tgz |
metallb |
||
Docker images |
ironic |
mirantis.azurecr.io/openstack/ironic:antelope-jammy-20250307062615 |
metallb-controller |
mirantis.azurecr.io/bm/metallb/controller:v0.14.5-747c4ca9-amd64 |
|
metallb-speaker |
mirantis.azurecr.io/bm/metallb/speaker:v0.14.5-747c4ca9-amd64 |
Artifact |
Component |
Path |
|---|---|---|
Helm charts Updated |
ceph-controller |
https://binary.mirantis.com/ceph/helm/ceph-operator-1.0.0-mcc-2.29.3-6.tgz |
Docker images |
ceph Updated |
mirantis.azurecr.io/mirantis/ceph:v18.2.7-1.cve |
ceph-controller Updated |
mirantis.azurecr.io/ceph/mcp/ceph-controller:2.29.3-5 |
|
cephcsi Updated |
mirantis.azurecr.io/mirantis/cephcsi:v3.9.0-28.cve |
|
cephcsi-attacher |
mirantis.azurecr.io/mirantis/cephcsi-attacher:v4.4.2-7.cve |
|
cephcsi-provisioner |
mirantis.azurecr.io/mirantis/cephcsi-provisioner:v3.6.2-7.cve |
|
cephcsi-registrar |
mirantis.azurecr.io/mirantis/cephcsi-registrar:v2.9.2-7.cve |
|
cephcsi-resizer |
mirantis.azurecr.io/mirantis/cephcsi-resizer:v1.9.2-7.cve |
|
cephcsi-snapshotter |
mirantis.azurecr.io/mirantis/cephcsi-snapshotter:v6.3.2-7.cve |
|
rook Updated |
mirantis.azurecr.io/ceph/rook:v1.13.5-30 |
|
snapshot-controller |
mirantis.azurecr.io/mirantis/snapshot-controller:v6.3.2-7.cve |
Artifact |
Component |
Path |
|---|---|---|
Helm charts |
cinder-csi-plugin Deprecated |
https://binary.mirantis.com/core/helm/cinder-csi-plugin-1.41.32.tgz |
client-certificate-controller |
https://binary.mirantis.com/core/helm/client-certificate-controller-1.41.32.tgz |
|
metrics-server |
https://binary.mirantis.com/core/helm/metrics-server-1.41.32.tgz |
|
openstack-cloud-controller-manager Deprecated |
https://binary.mirantis.com/core/helm/openstack-cloud-controller-manager-1.41.32.tgz |
|
policy-controller |
https://binary.mirantis.com/core/helm/policy-controller-1.41.32.tgz |
|
Docker images |
cinder-csi-plugin Deprecated |
mirantis.azurecr.io/lcm/kubernetes/cinder-csi-plugin:v1.27.2-28 |
client-certificate-controller |
mirantis.azurecr.io/core/client-certificate-controller:1.41.32 |
|
csi-attacher Deprecated |
mirantis.azurecr.io/lcm/k8scsi/csi-attacher:v4.2.0-10 |
|
csi-node-driver-registrar Deprecated |
mirantis.azurecr.io/lcm/k8scsi/csi-node-driver-registrar:v2.7.0-9 |
|
csi-provisioner Deprecated |
mirantis.azurecr.io/lcm/k8scsi/csi-provisioner:v3.4.1-10 |
|
csi-resizer Deprecated |
mirantis.azurecr.io/lcm/k8scsi/csi-resizer:v1.7.0-10 |
|
csi-snapshotter Deprecated |
mirantis.azurecr.io/lcm/k8scsi/csi-snapshotter:v6.2.1-mcc-9 |
|
livenessprobe Deprecated |
mirantis.azurecr.io/lcm/k8scsi/livenessprobe:v2.9.0-9 |
|
metrics-server |
mirantis.azurecr.io/lcm/metrics-server-amd64:v0.6.3-13 |
|
openstack-cloud-controller-manager Deprecated |
mirantis.azurecr.io/lcm/kubernetes/openstack-cloud-controller-manager:v1.27.2-28 |
|
policy-controller |
mirantis.azurecr.io/core/policy-controller:1.41.32 |
Artifact |
Component |
Path |
|---|---|---|
Binaries |
lcm-agent |
mirantis.azurecr.io/core/bin/lcm-agent-1.41.32 |
lcm-ansible |
mirantis.azurecr.io/lcm/bin/lcm-ansible/v0.26.0-115-g2cedbea/lcm-ansible.tar.gz |
|
Helm charts |
helm-controller |
https://binary.mirantis.com/core/helm/helm-controller-1.41.32.tgz |
managed-lcm-api |
https://binary.mirantis.com/core/helm/managed-lcm-api-1.41.32.tgz |
|
Docker images |
helm-controller |
mirantis.azurecr.io/core/helm-controller:1.41.32 |
mcc-haproxy |
mirantis.azurecr.io/lcm/mcc-haproxy:v0.26.0-115-g2cedbea |
|
mcc-keepalived |
mirantis.azurecr.io/lcm/mcc-keepalived:v0.26.0-115-g2cedbea |
Artifact |
Component |
Path |
|---|---|---|
Helm charts |
alerta |
https://binary.mirantis.com/stacklight/helm/alerta-0.1.0-mcp-33.tgz |
alertmanager-webhook-servicenow |
https://binary.mirantis.com/stacklight/helm/alertmanager-webhook-servicenow-0.2.0-mcp-8.tgz |
|
cadvisor |
https://binary.mirantis.com/stacklight/helm/cadvisor-0.1.0-mcp-7.tgz |
|
elasticsearch-curator |
https://binary.mirantis.com/stacklight/helm/elasticsearch-curator-1.5.0-mcp-15.tgz |
|
elasticsearch-exporter |
https://binary.mirantis.com/stacklight/helm/elasticsearch-exporter-1.2.0-mcp-10.tgz |
|
fluentd-logs Updated |
https://binary.mirantis.com/stacklight/helm/fluentd-logs-0.1.0-mcp-248.tgz |
|
grafana |
https://binary.mirantis.com/stacklight/helm/grafana-3.3.10-mcp-317.tgz |
|
iam-proxy |
||
metric-collector |
https://binary.mirantis.com/stacklight/helm/metric-collector-0.3.0-mcp-18.tgz |
|
metricbeat |
https://binary.mirantis.com/stacklight/helm/metricbeat-1.7.1-mcp-25.tgz |
|
opensearch |
https://binary.mirantis.com/stacklight/helm/opensearch-0.1.0-mcp-88.tgz |
|
opensearch-dashboards |
https://binary.mirantis.com/stacklight/helm/opensearch-dashboards-0.1.0-mcp-57.tgz |
|
patroni |
https://binary.mirantis.com/stacklight/helm/patroni-0.15.1-mcp-62.tgz |
|
prometheus |
https://binary.mirantis.com/stacklight/helm/prometheus-8.11.4-mcp-258.tgz |
|
prometheus-blackbox-exporter |
https://binary.mirantis.com/stacklight/helm/prometheus-blackbox-exporter-0.3.0-mcp-19.tgz |
|
prometheus-es-exporter |
https://binary.mirantis.com/stacklight/helm/prometheus-es-exporter-1.0.0-mcp-18.tgz |
|
prometheus-msteams |
https://binary.mirantis.com/stacklight/helm/prometheus-msteams-0.1.0-mcp-12.tgz |
|
sf-notifier |
https://binary.mirantis.com/stacklight/helm/sf-notifier-0.2.0-mcp-10.tgz |
|
sf-reporter |
https://binary.mirantis.com/stacklight/helm/sf-reporter-0.2.0-mcp-10.tgz |
|
stacklight Updated |
https://binary.mirantis.com/stacklight/helm/stacklight-0.16.15.tgz |
|
telegraf-ds |
https://binary.mirantis.com/stacklight/helm/telegraf-ds-1.1.5-mcp-42.tgz |
|
telegraf-s |
https://binary.mirantis.com/stacklight/helm/telegraf-s-1.1.5-mcp-42.tgz |
|
telemeter-client |
https://binary.mirantis.com/stacklight/helm/telemeter-client-0.2.0-mcp-14.tgz |
|
telemeter-server |
https://binary.mirantis.com/stacklight/helm/telemeter-server-0.2.0-mcp-14.tgz |
|
Docker images |
alerta-web Updated |
mirantis.azurecr.io/stacklight/alerta-web:9-20250512023009 |
alertmanager Updated |
mirantis.azurecr.io/stacklight/alertmanager:v0.25-20250512023015 |
|
alertmanager-webhook-servicenow |
mirantis.azurecr.io/stacklight/alertmanager-webhook-servicenow:v0.1-20250411082209 |
|
alpine-utils Updated |
mirantis.azurecr.io/stacklight/alpine-utils:1-20250512023016 |
|
blackbox-exporter |
mirantis.azurecr.io/stacklight/blackbox-exporter:0-20250305095821 |
|
cadvisor Updated |
mirantis.azurecr.io/stacklight/cadvisor:v0.49.1-20250512023015 |
|
configmap-reload |
mirantis.azurecr.io/stacklight/configmap-reload:v0.8.0 |
|
curator |
mirantis.azurecr.io/stacklight/curator:5.7.6-20230404082402 |
|
elasticsearch-exporter |
mirantis.azurecr.io/stacklight/elasticsearch-exporter:v1.5.0 |
|
fluentd Updated |
mirantis.azurecr.io/stacklight/fluentd:1.18-20250512023009 |
|
grafana |
mirantis.azurecr.io/stacklight/grafana:10.4.15 |
|
k8s-sidecar |
mirantis.azurecr.io/stacklight/k8s-sidecar:1-20250411124723 |
|
kube-state-metrics |
mirantis.azurecr.io/stacklight/kube-state-metrics:v2.10.1 |
|
metric-collector Updated |
mirantis.azurecr.io/stacklight/metric-collector:v0.1-20250512023015 |
|
metricbeat Updated |
mirantis.azurecr.io/stacklight/metricbeat:7.12.1-20250512023015 |
|
node-exporter |
mirantis.azurecr.io/stacklight/node-exporter:v1.8.2 |
|
oauth2-proxy |
mirantis.azurecr.io/iam/oauth2-proxy:v7.1.3-15 |
|
opensearch Updated |
mirantis.azurecr.io/stacklight/opensearch:2.17-20250512023015 |
|
opensearch-dashboards Updated |
mirantis.azurecr.io/stacklight/opensearch-dashboards:2.17-20250512023015 |
|
prometheus |
mirantis.azurecr.io/stacklight/prometheus:v2.48.0 |
|
prometheus-es-exporter Updated |
mirantis.azurecr.io/stacklight/prometheus-es-exporter:v0.14-20250512023016 |
|
prometheus-msteams Updated |
mirantis.azurecr.io/stacklight/prometheus-msteams:v1.5-20250512023015 |
|
prometheus-patroni-exporter Updated |
mirantis.azurecr.io/stacklight/prometheus-patroni-exporter:0.0.1-20250512023015 |
|
prometheus-postgres-exporter |
mirantis.azurecr.io/stacklight/prometheus-postgres-exporter:v0.15.0 |
|
prometheus-relay |
mirantis.azurecr.io/stacklight/prometheus-relay:v0.4-20250304085150 |
|
sf-notifier Updated |
mirantis.azurecr.io/stacklight/sf-notifier:v0.4-20250512023015 |
|
sf-reporter |
mirantis.azurecr.io/stacklight/sf-reporter:v0.1-20250411082229 |
|
spilo Updated |
mirantis.azurecr.io/stacklight/spilo:13-3.3-p2-20250512023015 |
|
telegraf |
mirantis.azurecr.io/stacklight/telegraf:v1.9.1-20241202023010 |
|
mirantis.azurecr.io/stacklight/telegraf:1-20250411114904 |
||
telemeter Updated |
mirantis.azurecr.io/stacklight/telemeter:4.4-20250512023015 |
|
telemeter-token-auth Updated |
mirantis.azurecr.io/stacklight/telemeter-token-auth:v0.1-20250512023015 |
Artifact |
Component |
Path |
|---|---|---|
Configuration management |
Ansible |
|
Debian repositories |
System packages |
|
https://mirror.mirantis.com/kaas/ubuntu-2025-03-31-003900.target.txt |
||
MCR repositories |
MCR |
https://repos.mirantis.com/ubuntu/dists/jammy/pool/stable-23.0/ |
Target ubuntu system |
Ubuntu |
https://binary.mirantis.com/bm/bin/efi/ubuntu/tgz-jammy-20250331141854 |
This section includes release notes for the patch Cluster release 16.3.7 that is introduced in the Container Cloud patch release 2.29.2 and is based on the previous Cluster releases of the 16.3.x series series.
This Cluster release supports Mirantis Kubernetes Engine 3.7.20
with Kubernetes 1.27 and Mirantis Container Runtime 23.0.15 with
docker-ee-cli updated to 23.0.17.
For the list of CVE fixes delivered with this patch Cluster release, see 2.29.2
For details on patch release delivery, see Patch releases
This section lists the artifacts of components included in the Cluster release 16.3.7.
Note
The components that are newly added, updated, deprecated, or removed
as compared to the previous release version, are marked
with a corresponding superscript,
for example, lcm-ansible Updated.
Artifact |
Component |
Path |
|---|---|---|
Helm charts Updated |
local-volume-provisioner |
https://binary.mirantis.com/core/helm/local-volume-provisioner-1.41.32.tgz |
metallb |
||
Docker images |
ironic |
mirantis.azurecr.io/openstack/ironic:antelope-jammy-20250307062615 |
metallb-controller |
mirantis.azurecr.io/bm/metallb/controller:v0.14.5-747c4ca9-amd64 |
|
metallb-speaker |
mirantis.azurecr.io/bm/metallb/speaker:v0.14.5-747c4ca9-amd64 |
Artifact |
Component |
Path |
|---|---|---|
Helm chart Updated |
ceph-controller |
https://binary.mirantis.com/ceph/helm/ceph-operator-1.0.0-mcc-2.29.2-3.tgz |
Docker images |
ceph |
mirantis.azurecr.io/mirantis/ceph:v18.2.4-13.cve |
ceph-controller Updated |
mirantis.azurecr.io/ceph/mcp/ceph-controller:2.29.2-0 |
|
cephcsi |
mirantis.azurecr.io/mirantis/cephcsi:v3.9.0-27.cve |
|
cephcsi-attacher |
mirantis.azurecr.io/mirantis/cephcsi-attacher:v4.4.2-7.cve |
|
cephcsi-provisioner |
mirantis.azurecr.io/mirantis/cephcsi-provisioner:v3.6.2-7.cve |
|
cephcsi-registrar |
mirantis.azurecr.io/mirantis/cephcsi-registrar:v2.9.2-7.cve |
|
cephcsi-resizer |
mirantis.azurecr.io/mirantis/cephcsi-resizer:v1.9.2-7.cve |
|
cephcsi-snapshotter |
mirantis.azurecr.io/mirantis/cephcsi-snapshotter:v6.3.2-7.cve |
|
rook |
mirantis.azurecr.io/ceph/rook:v1.13.5-29 |
|
snapshot-controller |
mirantis.azurecr.io/mirantis/snapshot-controller:v6.3.2-7.cve |
Artifact |
Component |
Path |
|---|---|---|
Helm charts Updated |
cinder-csi-plugin Deprecated |
https://binary.mirantis.com/core/helm/cinder-csi-plugin-1.41.32.tgz |
client-certificate-controller |
https://binary.mirantis.com/core/helm/client-certificate-controller-1.41.32.tgz |
|
metrics-server |
https://binary.mirantis.com/core/helm/metrics-server-1.41.32.tgz |
|
openstack-cloud-controller-manager Deprecated |
https://binary.mirantis.com/core/helm/openstack-cloud-controller-manager-1.41.32.tgz |
|
policy-controller |
https://binary.mirantis.com/core/helm/policy-controller-1.41.32.tgz |
|
Docker images |
cinder-csi-plugin Deprecated |
mirantis.azurecr.io/lcm/kubernetes/cinder-csi-plugin:v1.27.2-28 |
client-certificate-controller Updated |
mirantis.azurecr.io/core/client-certificate-controller:1.41.32 |
|
csi-attacher Deprecated |
mirantis.azurecr.io/lcm/k8scsi/csi-attacher:v4.2.0-10 |
|
csi-node-driver-registrar Deprecated |
mirantis.azurecr.io/lcm/k8scsi/csi-node-driver-registrar:v2.7.0-9 |
|
csi-provisioner Deprecated |
mirantis.azurecr.io/lcm/k8scsi/csi-provisioner:v3.4.1-10 |
|
csi-resizer Deprecated |
mirantis.azurecr.io/lcm/k8scsi/csi-resizer:v1.7.0-10 |
|
csi-snapshotter Deprecated |
mirantis.azurecr.io/lcm/k8scsi/csi-snapshotter:v6.2.1-mcc-9 |
|
livenessprobe Deprecated |
mirantis.azurecr.io/lcm/k8scsi/livenessprobe:v2.9.0-9 |
|
metrics-server |
mirantis.azurecr.io/lcm/metrics-server-amd64:v0.6.3-13 |
|
openstack-cloud-controller-manager Deprecated |
mirantis.azurecr.io/lcm/kubernetes/openstack-cloud-controller-manager:v1.27.2-28 |
|
policy-controller Updated |
mirantis.azurecr.io/core/policy-controller:1.41.32 |
Artifact |
Component |
Path |
|---|---|---|
Binaries Updated |
lcm-agent |
mirantis.azurecr.io/core/bin/lcm-agent-1.41.32 |
lcm-ansible |
mirantis.azurecr.io/lcm/bin/lcm-ansible/v0.26.0-115-g2cedbea/lcm-ansible.tar.gz |
|
Helm charts Updated |
helm-controller |
https://binary.mirantis.com/core/helm/helm-controller-1.41.32.tgz |
managed-lcm-api |
https://binary.mirantis.com/core/helm/managed-lcm-api-1.41.32.tgz |
|
Docker images Updated |
helm-controller |
mirantis.azurecr.io/core/helm-controller:1.41.32 |
mcc-haproxy |
mirantis.azurecr.io/lcm/mcc-haproxy:v0.26.0-115-g2cedbea |
|
mcc-keepalived |
mirantis.azurecr.io/lcm/mcc-keepalived:v0.26.0-115-g2cedbea |
Artifact |
Component |
Path |
|---|---|---|
Helm charts |
alerta |
https://binary.mirantis.com/stacklight/helm/alerta-0.1.0-mcp-33.tgz |
alertmanager-webhook-servicenow |
https://binary.mirantis.com/stacklight/helm/alertmanager-webhook-servicenow-0.2.0-mcp-8.tgz |
|
cadvisor |
https://binary.mirantis.com/stacklight/helm/cadvisor-0.1.0-mcp-7.tgz |
|
elasticsearch-curator |
https://binary.mirantis.com/stacklight/helm/elasticsearch-curator-1.5.0-mcp-15.tgz |
|
elasticsearch-exporter |
https://binary.mirantis.com/stacklight/helm/elasticsearch-exporter-1.2.0-mcp-10.tgz |
|
fluentd-logs |
https://binary.mirantis.com/stacklight/helm/fluentd-logs-0.1.0-mcp-242.tgz |
|
grafana |
https://binary.mirantis.com/stacklight/helm/grafana-3.3.10-mcp-317.tgz |
|
iam-proxy |
||
metric-collector |
https://binary.mirantis.com/stacklight/helm/metric-collector-0.3.0-mcp-18.tgz |
|
metricbeat |
https://binary.mirantis.com/stacklight/helm/metricbeat-1.7.1-mcp-25.tgz |
|
opensearch |
https://binary.mirantis.com/stacklight/helm/opensearch-0.1.0-mcp-88.tgz |
|
opensearch-dashboards |
https://binary.mirantis.com/stacklight/helm/opensearch-dashboards-0.1.0-mcp-57.tgz |
|
patroni |
https://binary.mirantis.com/stacklight/helm/patroni-0.15.1-mcp-62.tgz |
|
prometheus |
https://binary.mirantis.com/stacklight/helm/prometheus-8.11.4-mcp-258.tgz |
|
prometheus-blackbox-exporter |
https://binary.mirantis.com/stacklight/helm/prometheus-blackbox-exporter-0.3.0-mcp-19.tgz |
|
prometheus-es-exporter |
https://binary.mirantis.com/stacklight/helm/prometheus-es-exporter-1.0.0-mcp-18.tgz |
|
prometheus-msteams |
https://binary.mirantis.com/stacklight/helm/prometheus-msteams-0.1.0-mcp-12.tgz |
|
sf-notifier |
https://binary.mirantis.com/stacklight/helm/sf-notifier-0.2.0-mcp-10.tgz |
|
sf-reporter |
https://binary.mirantis.com/stacklight/helm/sf-reporter-0.2.0-mcp-10.tgz |
|
stacklight Updated |
https://binary.mirantis.com/stacklight/helm/stacklight-0.16.13.tgz |
|
telegraf-ds |
https://binary.mirantis.com/stacklight/helm/telegraf-ds-1.1.5-mcp-42.tgz |
|
telegraf-s |
https://binary.mirantis.com/stacklight/helm/telegraf-s-1.1.5-mcp-42.tgz |
|
telemeter-client |
https://binary.mirantis.com/stacklight/helm/telemeter-client-0.2.0-mcp-14.tgz |
|
telemeter-server |
https://binary.mirantis.com/stacklight/helm/telemeter-server-0.2.0-mcp-14.tgz |
|
Docker images |
alerta-web Updated |
mirantis.azurecr.io/stacklight/alerta-web:9-20250414023017 |
alertmanager Updated |
mirantis.azurecr.io/stacklight/alertmanager:v0-20250414023017 |
|
alertmanager-webhook-servicenow Updated |
mirantis.azurecr.io/stacklight/alertmanager-webhook-servicenow:v0.1-20250411082209 |
|
alpine-utils Updated |
mirantis.azurecr.io/stacklight/alpine-utils:1-20250414023016 |
|
blackbox-exporter |
mirantis.azurecr.io/stacklight/blackbox-exporter:0-20250305095821 |
|
cadvisor Updated |
mirantis.azurecr.io/stacklight/cadvisor:v0.49.1-20250414023016 |
|
configmap-reload |
mirantis.azurecr.io/stacklight/configmap-reload:v0.8.0 |
|
curator |
mirantis.azurecr.io/stacklight/curator:5.7.6-20230404082402 |
|
elasticsearch-exporter |
mirantis.azurecr.io/stacklight/elasticsearch-exporter:v1.5.0 |
|
fluentd Updated |
mirantis.azurecr.io/stacklight/fluentd:1.18-20250414023016 |
|
grafana |
mirantis.azurecr.io/stacklight/grafana:10.4.15 |
|
k8s-sidecar Updated |
mirantis.azurecr.io/stacklight/k8s-sidecar:1-20250411124723 |
|
kube-state-metrics |
mirantis.azurecr.io/stacklight/kube-state-metrics:v2.10.1 |
|
metric-collector Updated |
mirantis.azurecr.io/stacklight/metric-collector:v0.1-20250414023016 |
|
metricbeat Updated |
mirantis.azurecr.io/stacklight/metricbeat:7.12.1-20250414023016 |
|
node-exporter |
mirantis.azurecr.io/stacklight/node-exporter:v1.8.2 |
|
oauth2-proxy |
mirantis.azurecr.io/iam/oauth2-proxy:v7.1.3-15 |
|
opensearch Updated |
mirantis.azurecr.io/stacklight/opensearch:2.17-20250414023016 |
|
opensearch-dashboards Updated |
mirantis.azurecr.io/stacklight/opensearch-dashboards:2.17-20250414023017 |
|
prometheus |
mirantis.azurecr.io/stacklight/prometheus:v2.48.0 |
|
prometheus-es-exporter Updated |
mirantis.azurecr.io/stacklight/prometheus-es-exporter:v0.14-20250414023016 |
|
prometheus-msteams Updated |
mirantis.azurecr.io/stacklight/prometheus-msteams:v1.5-20250414023016 |
|
prometheus-patroni-exporter Updated |
mirantis.azurecr.io/stacklight/prometheus-patroni-exporter:0.0.1-20250414023016 |
|
prometheus-postgres-exporter |
mirantis.azurecr.io/stacklight/prometheus-postgres-exporter:v0.15.0 |
|
prometheus-relay |
mirantis.azurecr.io/stacklight/prometheus-relay:v0.4-20250304085150 |
|
sf-notifier Updated |
mirantis.azurecr.io/stacklight/sf-notifier:v0.4-20250414023016 |
|
sf-reporter Updated |
mirantis.azurecr.io/stacklight/sf-reporter:v0.1-20250411082229 |
|
spilo Updated |
mirantis.azurecr.io/stacklight/spilo:13-3.3-p2-20250414023016 |
|
telegraf |
mirantis.azurecr.io/stacklight/telegraf:v1.9.1-20241202023010 |
|
mirantis.azurecr.io/stacklight/telegraf:1-20250411114904 Updated |
||
telemeter Updated |
mirantis.azurecr.io/stacklight/telemeter:4.4-20250414023016 |
|
telemeter-token-auth Updated |
mirantis.azurecr.io/stacklight/telemeter-token-auth:v0.1-20250414023016 |
Artifact |
Component |
Path |
|---|---|---|
Configuration management |
Ansible |
|
Debian repositories |
System packages |
|
https://mirror.mirantis.com/kaas/ubuntu-2025-03-31-003900/ Updated |
||
https://mirror.mirantis.com/kaas/ubuntu-2025-03-31-003900.target.txt Updated |
||
MCR repositories |
MCR |
https://repos.mirantis.com/ubuntu/dists/jammy/pool/stable-23.0/ |
Target ubuntu system |
Ubuntu |
https://binary.mirantis.com/bm/bin/efi/ubuntu/tgz-jammy-20250331141854 Updated |
This section includes release notes for the patch Cluster release 16.3.6 that is introduced in the Container Cloud patch release 2.29.1 and is based on the previous Cluster releases of the 16.3.x series series.
This Cluster release supports Mirantis Kubernetes Engine 3.7.20
with Kubernetes 1.27 and Mirantis Container Runtime 23.0.15 with
docker-ee-cli updated to 23.0.17.
For the list of CVE fixes delivered with this patch Cluster release, see 2.29.1
For details on patch release delivery, see Patch releases
This section lists the artifacts of components included in the Cluster release 16.3.6.
Note
The components that are newly added, updated, deprecated, or removed
as compared to the previous release version, are marked
with a corresponding superscript,
for example, lcm-ansible Updated.
Artifact |
Component |
Path |
|---|---|---|
Helm charts Updated |
local-volume-provisioner |
https://binary.mirantis.com/core/helm/local-volume-provisioner-1.41.31.tgz |
metallb |
||
Docker images Updated |
ironic |
mirantis.azurecr.io/openstack/ironic:antelope-jammy-20250307062615 |
metallb-controller |
mirantis.azurecr.io/bm/metallb/controller:v0.14.5-747c4ca9-amd64 |
|
metallb-speaker |
mirantis.azurecr.io/bm/metallb/speaker:v0.14.5-747c4ca9-amd64 |
Artifact |
Component |
Path |
|---|---|---|
Helm chart Updated |
ceph-controller |
https://binary.mirantis.com/ceph/helm/ceph-operator-1.0.0-mcc-2.29.1-1.tgz |
Docker images Updated |
ceph |
mirantis.azurecr.io/mirantis/ceph:v18.2.4-13.cve |
ceph-controller |
mirantis.azurecr.io/ceph/mcp/ceph-controller:2.29.1-0 |
|
cephcsi |
mirantis.azurecr.io/mirantis/cephcsi:v3.9.0-27.cve |
|
cephcsi-attacher |
mirantis.azurecr.io/mirantis/cephcsi-attacher:v4.4.2-7.cve |
|
cephcsi-provisioner |
mirantis.azurecr.io/mirantis/cephcsi-provisioner:v3.6.2-7.cve |
|
cephcsi-registrar |
mirantis.azurecr.io/mirantis/cephcsi-registrar:v2.9.2-7.cve |
|
cephcsi-resizer |
mirantis.azurecr.io/mirantis/cephcsi-resizer:v1.9.2-7.cve |
|
cephcsi-snapshotter |
mirantis.azurecr.io/mirantis/cephcsi-snapshotter:v6.3.2-7.cve |
|
rook |
mirantis.azurecr.io/ceph/rook:v1.13.5-29 |
|
snapshot-controller |
mirantis.azurecr.io/mirantis/snapshot-controller:v6.3.2-7.cve |
Artifact |
Component |
Path |
|---|---|---|
Helm charts Updated |
cinder-csi-plugin Deprecated |
https://binary.mirantis.com/core/helm/cinder-csi-plugin-1.41.31.tgz |
client-certificate-controller |
https://binary.mirantis.com/core/helm/client-certificate-controller-1.41.31.tgz |
|
metrics-server |
https://binary.mirantis.com/core/helm/metrics-server-1.41.31.tgz |
|
openstack-cloud-controller-manager Deprecated |
https://binary.mirantis.com/core/helm/openstack-cloud-controller-manager-1.41.31.tgz |
|
policy-controller |
https://binary.mirantis.com/core/helm/policy-controller-1.41.31.tgz |
|
Docker images |
cinder-csi-plugin Deprecated |
mirantis.azurecr.io/lcm/kubernetes/cinder-csi-plugin:v1.27.2-27 |
client-certificate-controller Updated |
mirantis.azurecr.io/core/client-certificate-controller:1.41.31 |
|
csi-attacher Deprecated |
mirantis.azurecr.io/lcm/k8scsi/csi-attacher:v4.2.0-10 |
|
csi-node-driver-registrar Deprecated |
mirantis.azurecr.io/lcm/k8scsi/csi-node-driver-registrar:v2.7.0-9 |
|
csi-provisioner Deprecated |
mirantis.azurecr.io/lcm/k8scsi/csi-provisioner:v3.4.1-10 |
|
csi-resizer Deprecated |
mirantis.azurecr.io/lcm/k8scsi/csi-resizer:v1.7.0-10 |
|
csi-snapshotter Deprecated |
mirantis.azurecr.io/lcm/k8scsi/csi-snapshotter:v6.2.1-mcc-9 |
|
livenessprobe Deprecated |
mirantis.azurecr.io/lcm/k8scsi/livenessprobe:v2.9.0-9 |
|
metrics-server Updated |
mirantis.azurecr.io/lcm/metrics-server-amd64:v0.6.3-13 |
|
openstack-cloud-controller-manager Deprecated |
mirantis.azurecr.io/lcm/kubernetes/openstack-cloud-controller-manager:v1.27.2-27 |
|
policy-controller Updated |
mirantis.azurecr.io/core/policy-controller:1.41.31 |
Artifact |
Component |
Path |
|---|---|---|
Binaries Updated |
lcm-agent |
mirantis.azurecr.io/core/bin/lcm-agent-1.41.31 |
lcm-ansible |
mirantis.azurecr.io/lcm/bin/lcm-ansible/v0.26.0-114-gf1e92be/lcm-ansible.tar.gz |
|
Helm charts Updated |
helm-controller |
https://binary.mirantis.com/core/helm/helm-controller-1.41.31.tgz |
managed-lcm-api |
https://binary.mirantis.com/core/helm/managed-lcm-api-1.41.31.tgz |
|
Docker images Updated |
helm-controller |
mirantis.azurecr.io/core/helm-controller:1.41.31 |
mcc-haproxy |
mirantis.azurecr.io/lcm/mcc-haproxy:v0.26.0-114-gf1e92be |
|
mcc-keepalived |
mirantis.azurecr.io/lcm/mcc-keepalived:v0.26.0-114-gf1e92be |
Artifact |
Component |
Path |
|---|---|---|
Helm charts |
alerta |
https://binary.mirantis.com/stacklight/helm/alerta-0.1.0-mcp-33.tgz |
alertmanager-webhook-servicenow |
https://binary.mirantis.com/stacklight/helm/alertmanager-webhook-servicenow-0.2.0-mcp-8.tgz |
|
cadvisor |
https://binary.mirantis.com/stacklight/helm/cadvisor-0.1.0-mcp-7.tgz |
|
elasticsearch-curator |
https://binary.mirantis.com/stacklight/helm/elasticsearch-curator-1.5.0-mcp-15.tgz |
|
elasticsearch-exporter |
https://binary.mirantis.com/stacklight/helm/elasticsearch-exporter-1.2.0-mcp-10.tgz |
|
fluentd-logs |
https://binary.mirantis.com/stacklight/helm/fluentd-logs-0.1.0-mcp-242.tgz |
|
grafana |
https://binary.mirantis.com/stacklight/helm/grafana-3.3.10-mcp-317.tgz |
|
iam-proxy |
||
metric-collector |
https://binary.mirantis.com/stacklight/helm/metric-collector-0.3.0-mcp-18.tgz |
|
metricbeat |
https://binary.mirantis.com/stacklight/helm/metricbeat-1.7.1-mcp-25.tgz |
|
opensearch |
https://binary.mirantis.com/stacklight/helm/opensearch-0.1.0-mcp-88.tgz |
|
opensearch-dashboards |
https://binary.mirantis.com/stacklight/helm/opensearch-dashboards-0.1.0-mcp-57.tgz |
|
patroni |
https://binary.mirantis.com/stacklight/helm/patroni-0.15.1-mcp-62.tgz |
|
prometheus |
https://binary.mirantis.com/stacklight/helm/prometheus-8.11.4-mcp-258.tgz |
|
prometheus-blackbox-exporter |
https://binary.mirantis.com/stacklight/helm/prometheus-blackbox-exporter-0.3.0-mcp-19.tgz |
|
prometheus-es-exporter |
https://binary.mirantis.com/stacklight/helm/prometheus-es-exporter-1.0.0-mcp-18.tgz |
|
prometheus-msteams |
https://binary.mirantis.com/stacklight/helm/prometheus-msteams-0.1.0-mcp-12.tgz |
|
sf-notifier |
https://binary.mirantis.com/stacklight/helm/sf-notifier-0.2.0-mcp-10.tgz |
|
sf-reporter |
https://binary.mirantis.com/stacklight/helm/sf-reporter-0.2.0-mcp-10.tgz |
|
stacklight Updated |
https://binary.mirantis.com/stacklight/helm/stacklight-0.16.11.tgz |
|
telegraf-ds |
https://binary.mirantis.com/stacklight/helm/telegraf-ds-1.1.5-mcp-42.tgz |
|
telegraf-s |
https://binary.mirantis.com/stacklight/helm/telegraf-s-1.1.5-mcp-42.tgz |
|
telemeter-client |
https://binary.mirantis.com/stacklight/helm/telemeter-client-0.2.0-mcp-14.tgz |
|
telemeter-server |
https://binary.mirantis.com/stacklight/helm/telemeter-server-0.2.0-mcp-14.tgz |
|
Docker images |
alerta-web Updated |
mirantis.azurecr.io/stacklight/alerta-web:9-20250317104943 |
alertmanager Updated |
mirantis.azurecr.io/stacklight/alertmanager:v0-20250317023015 |
|
alertmanager-webhook-servicenow Updated |
mirantis.azurecr.io/stacklight/alertmanager-webhook-servicenow:v0.1-20250317092402 |
|
alpine-utils Updated |
mirantis.azurecr.io/stacklight/alpine-utils:1-20250317023016 |
|
blackbox-exporter Updated |
mirantis.azurecr.io/stacklight/blackbox-exporter:0-20250305095821 |
|
cadvisor Updated |
mirantis.azurecr.io/stacklight/cadvisor:v0.49.1-20250317023016 |
|
configmap-reload |
mirantis.azurecr.io/stacklight/configmap-reload:v0.8.0 |
|
curator |
mirantis.azurecr.io/stacklight/curator:5.7.6-20230404082402 |
|
elasticsearch-exporter |
mirantis.azurecr.io/stacklight/elasticsearch-exporter:v1.5.0 |
|
fluentd Updated |
mirantis.azurecr.io/stacklight/fluentd:1.18-20250317023010 |
|
grafana Updated |
mirantis.azurecr.io/stacklight/grafana:10.4.15 |
|
k8s-sidecar Updated |
mirantis.azurecr.io/stacklight/k8s-sidecar:1-20250214112745 |
|
kube-state-metrics |
mirantis.azurecr.io/stacklight/kube-state-metrics:v2.10.1 |
|
metric-collector Updated |
mirantis.azurecr.io/stacklight/metric-collector:v0.1-20250317023016 |
|
metricbeat Updated |
mirantis.azurecr.io/stacklight/metricbeat:7.12.1-20250317023010 |
|
node-exporter |
mirantis.azurecr.io/stacklight/node-exporter:v1.8.2 |
|
oauth2-proxy Updated |
mirantis.azurecr.io/iam/oauth2-proxy:v7.1.3-15 |
|
opensearch Updated |
mirantis.azurecr.io/stacklight/opensearch:2.17-20250317023016 |
|
opensearch-dashboards Updated |
mirantis.azurecr.io/stacklight/opensearch-dashboards:2.17-20250317023010 |
|
prometheus |
mirantis.azurecr.io/stacklight/prometheus:v2.48.0 |
|
prometheus-es-exporter Updated |
mirantis.azurecr.io/stacklight/prometheus-es-exporter:v0.14-20250317023015 |
|
prometheus-msteams Updated |
mirantis.azurecr.io/stacklight/prometheus-msteams:v1.5-20250317023015 |
|
prometheus-patroni-exporter Updated |
mirantis.azurecr.io/stacklight/prometheus-patroni-exporter:0.0.1-20250317023016 |
|
prometheus-postgres-exporter |
mirantis.azurecr.io/stacklight/prometheus-postgres-exporter:v0.15.0 |
|
prometheus-relay Updated |
mirantis.azurecr.io/stacklight/prometheus-relay:v0.4-20250304085150 |
|
sf-notifier Updated |
mirantis.azurecr.io/stacklight/sf-notifier:v0.4-20250317092322 |
|
sf-reporter Updated |
mirantis.azurecr.io/stacklight/sf-reporter:v0.1-20250214110717 |
|
spilo Updated |
mirantis.azurecr.io/stacklight/spilo:13-3.3-p2-20250317023016 |
|
telegraf |
mirantis.azurecr.io/stacklight/telegraf:v1.9.1-20241202023010 |
|
mirantis.azurecr.io/stacklight/telegraf:1-20241115074302 |
||
telemeter Updated |
mirantis.azurecr.io/stacklight/telemeter:4.4-20250317023016 |
|
telemeter-token-auth Updated |
mirantis.azurecr.io/stacklight/telemeter-token-auth:v0.1-20250317023016 |
Artifact |
Component |
Path |
|---|---|---|
Configuration management |
Ansible |
|
Debian repositories |
System packages |
|
https://mirror.mirantis.com/kaas/ubuntu-2025-03-05-003900/ Updated |
||
https://mirror.mirantis.com/kaas/ubuntu-2025-03-05-003900.target.txt Updated |
||
MCR repositories |
MCR |
https://repos.mirantis.com/ubuntu/dists/jammy/pool/stable-23.0/ |
Target ubuntu system |
Ubuntu |
https://binary.mirantis.com/bm/bin/efi/ubuntu/tgz-jammy-20250305162411 Updated |
This section includes release notes for the patch Cluster release 16.3.5 that is introduced in the Container Cloud patch release 2.28.5 and is based on the previous Cluster releases of the 16.3.x series series.
This Cluster release supports Mirantis Kubernetes Engine 3.7.18 with Kubernetes 1.27 and Mirantis Container Runtime 23.0.15.
For the list of CVE fixes delivered with this patch Cluster release, see 2.28.5
For details on patch release delivery, see Patch releases
This section lists the artifacts of components included in the Cluster release 16.3.5.
Note
The components that are newly added, updated, deprecated, or removed
as compared to the previous release version, are marked
with a corresponding superscript,
for example, lcm-ansible Updated.
Artifact |
Component |
Path |
|---|---|---|
Helm charts Updated |
local-volume-provisioner |
https://binary.mirantis.com/core/helm/local-volume-provisioner-1.41.28.tgz |
metallb |
||
Docker images |
ironic |
mirantis.azurecr.io/openstack/ironic:antelope-jammy-20240716113922 |
metallb-controller |
mirantis.azurecr.io/bm/metallb/controller:v0.14.5-a68c7101-amd64 |
|
metallb-speaker |
mirantis.azurecr.io/bm/metallb/speaker:v0.14.5-a68c7101-amd64 |
Artifact |
Component |
Path |
|---|---|---|
Helm chart |
ceph-controller |
https://binary.mirantis.com/ceph/helm/ceph-operator-1.0.0-mcc-2.28.4-3.tgz |
Docker images |
ceph |
mirantis.azurecr.io/mirantis/ceph:v18.2.4-11.cve |
ceph-controller |
mirantis.azurecr.io/ceph/mcp/ceph-controller:2.28.4-2 |
|
cephcsi |
mirantis.azurecr.io/mirantis/cephcsi:v3.9.0-26.cve |
|
cephcsi-registrar |
mirantis.azurecr.io/mirantis/cephcsi-registrar:v2.9.2-6.cve |
|
cephcsi-provisioner |
mirantis.azurecr.io/mirantis/cephcsi-provisioner:v3.6.2-6.cve |
|
cephcsi-snapshotter |
mirantis.azurecr.io/mirantis/cephcsi-snapshotter:v6.3.2-6.cve |
|
cephcsi-attacher |
mirantis.azurecr.io/mirantis/cephcsi-attacher:v4.4.2-6.cve |
|
cephcsi-resizer |
mirantis.azurecr.io/mirantis/cephcsi-resizer:v1.9.2-6.cve |
|
rook |
mirantis.azurecr.io/ceph/rook:v1.13.5-28 |
|
snapshot-controller |
mirantis.azurecr.io/mirantis/snapshot-controller:v6.3.2-6.cve |
Artifact |
Component |
Path |
|---|---|---|
Helm charts Updated |
cinder-csi-plugin Deprecated |
https://binary.mirantis.com/core/helm/cinder-csi-plugin-1.41.28.tgz |
client-certificate-controller |
https://binary.mirantis.com/core/helm/client-certificate-controller-1.41.28.tgz |
|
metrics-server |
https://binary.mirantis.com/core/helm/metrics-server-1.41.28.tgz |
|
openstack-cloud-controller-manager Deprecated |
https://binary.mirantis.com/core/helm/openstack-cloud-controller-manager-1.41.28.tgz |
|
policy-controller |
https://binary.mirantis.com/core/helm/policy-controller-1.41.28.tgz |
|
Docker images |
cinder-csi-plugin Deprecated |
mirantis.azurecr.io/lcm/kubernetes/cinder-csi-plugin:v1.27.2-24 |
client-certificate-controller Updated |
mirantis.azurecr.io/core/client-certificate-controller:1.41.28 |
|
csi-attacher Deprecated |
mirantis.azurecr.io/lcm/k8scsi/csi-attacher:v4.2.0-7 |
|
csi-node-driver-registrar Deprecated |
mirantis.azurecr.io/lcm/k8scsi/csi-node-driver-registrar:v2.7.0-7 |
|
csi-provisioner Deprecated |
mirantis.azurecr.io/lcm/k8scsi/csi-provisioner:v3.4.1-7 |
|
csi-resizer Deprecated |
mirantis.azurecr.io/lcm/k8scsi/csi-resizer:v1.7.0-7 |
|
csi-snapshotter Deprecated |
mirantis.azurecr.io/lcm/k8scsi/csi-snapshotter:v6.2.1-mcc-6 |
|
livenessprobe Deprecated |
mirantis.azurecr.io/lcm/k8scsi/livenessprobe:v2.9.0-7 |
|
metrics-server |
mirantis.azurecr.io/lcm/metrics-server-amd64:v0.6.3-10 |
|
openstack-cloud-controller-manager Deprecated |
mirantis.azurecr.io/lcm/kubernetes/openstack-cloud-controller-manager:v1.27.2-24 |
|
policy-controller Updated |
mirantis.azurecr.io/core/policy-controller:1.41.28 |
Artifact |
Component |
Path |
|---|---|---|
Binaries Updated |
lcm-agent |
mirantis.azurecr.io/core/bin/lcm-agent-1.41.28 |
lcm-ansible |
mirantis.azurecr.io/lcm/bin/lcm-ansible/v0.26.0-112-g26f96e1/lcm-ansible.tar.gz |
|
Helm charts Updated |
helm-controller |
https://binary.mirantis.com/core/helm/helm-controller-1.41.28.tgz |
managed-lcm-api |
https://binary.mirantis.com/core/helm/managed-lcm-api-1.41.28.tgz |
|
Docker images Updated |
helm-controller |
mirantis.azurecr.io/core/helm-controller:1.41.28 |
mcc-haproxy |
mirantis.azurecr.io/lcm/mcc-haproxy:v0.26.0-112-g26f96e1 |
|
mcc-keepalived |
mirantis.azurecr.io/lcm/mcc-keepalived:v0.26.0-112-g26f96e1 |
Artifact |
Component |
Path |
|---|---|---|
Helm charts |
alerta |
https://binary.mirantis.com/stacklight/helm/alerta-0.1.0-mcp-33.tgz |
alertmanager-webhook-servicenow |
https://binary.mirantis.com/stacklight/helm/alertmanager-webhook-servicenow-0.2.0-mcp-8.tgz |
|
cadvisor |
https://binary.mirantis.com/stacklight/helm/cadvisor-0.1.0-mcp-7.tgz |
|
elasticsearch-curator |
https://binary.mirantis.com/stacklight/helm/elasticsearch-curator-1.5.0-mcp-15.tgz |
|
elasticsearch-exporter |
https://binary.mirantis.com/stacklight/helm/elasticsearch-exporter-1.2.0-mcp-10.tgz |
|
fluentd-logs |
https://binary.mirantis.com/stacklight/helm/fluentd-logs-0.1.0-mcp-242.tgz |
|
grafana |
https://binary.mirantis.com/stacklight/helm/grafana-3.3.10-mcp-317.tgz |
|
iam-proxy |
||
metric-collector |
https://binary.mirantis.com/stacklight/helm/metric-collector-0.3.0-mcp-18.tgz |
|
metricbeat |
https://binary.mirantis.com/stacklight/helm/metricbeat-1.7.1-mcp-25.tgz |
|
opensearch |
https://binary.mirantis.com/stacklight/helm/opensearch-0.1.0-mcp-88.tgz |
|
opensearch-dashboards |
https://binary.mirantis.com/stacklight/helm/opensearch-dashboards-0.1.0-mcp-57.tgz |
|
patroni |
https://binary.mirantis.com/stacklight/helm/patroni-0.15.1-mcp-62.tgz |
|
prometheus |
https://binary.mirantis.com/stacklight/helm/prometheus-8.11.4-mcp-258.tgz |
|
prometheus-blackbox-exporter |
https://binary.mirantis.com/stacklight/helm/prometheus-blackbox-exporter-0.3.0-mcp-19.tgz |
|
prometheus-es-exporter |
https://binary.mirantis.com/stacklight/helm/prometheus-es-exporter-1.0.0-mcp-18.tgz |
|
prometheus-msteams |
https://binary.mirantis.com/stacklight/helm/prometheus-msteams-0.1.0-mcp-12.tgz |
|
sf-notifier |
https://binary.mirantis.com/stacklight/helm/sf-notifier-0.2.0-mcp-10.tgz |
|
sf-reporter |
https://binary.mirantis.com/stacklight/helm/sf-reporter-0.2.0-mcp-10.tgz |
|
stacklight Updated |
https://binary.mirantis.com/stacklight/helm/stacklight-0.16.9.tgz |
|
telegraf-ds |
https://binary.mirantis.com/stacklight/helm/telegraf-ds-1.1.5-mcp-42.tgz |
|
telegraf-s |
https://binary.mirantis.com/stacklight/helm/telegraf-s-1.1.5-mcp-42.tgz |
|
telemeter-client |
https://binary.mirantis.com/stacklight/helm/telemeter-client-0.2.0-mcp-14.tgz |
|
telemeter-server |
https://binary.mirantis.com/stacklight/helm/telemeter-server-0.2.0-mcp-14.tgz |
|
Docker images |
alerta-web Updated |
mirantis.azurecr.io/stacklight/alerta-web:9-20250113023008 |
alertmanager Updated |
mirantis.azurecr.io/stacklight/alertmanager:v0-20250113023013 |
|
alertmanager-webhook-servicenow |
mirantis.azurecr.io/stacklight/alertmanager-webhook-servicenow:v0.1-20241022074315 |
|
alpine-utils Updated |
mirantis.azurecr.io/stacklight/alpine-utils:1-20250113023014 |
|
blackbox-exporter |
mirantis.azurecr.io/stacklight/blackbox-exporter:0-20241217061716 |
|
cadvisor Updated |
mirantis.azurecr.io/stacklight/cadvisor:v0.49.1-20250113023012 |
|
configmap-reload |
mirantis.azurecr.io/stacklight/configmap-reload:v0.8.0 |
|
curator |
mirantis.azurecr.io/stacklight/curator:5.7.6-20230404082402 |
|
elasticsearch-exporter |
mirantis.azurecr.io/stacklight/elasticsearch-exporter:v1.5.0 |
|
fluentd Updated |
mirantis.azurecr.io/stacklight/fluentd:1.18-20250114114547 |
|
grafana |
mirantis.azurecr.io/stacklight/grafana:10.4.3 |
|
k8s-sidecar |
mirantis.azurecr.io/stacklight/k8s-sidecar:1-20241115071117 |
|
kube-state-metrics |
mirantis.azurecr.io/stacklight/kube-state-metrics:v2.10.1 |
|
metric-collector Updated |
mirantis.azurecr.io/stacklight/metric-collector:v0.1-20250113023012 |
|
metricbeat Updated |
mirantis.azurecr.io/stacklight/metricbeat:7.12.1-20250113023013 |
|
node-exporter |
mirantis.azurecr.io/stacklight/node-exporter:v1.8.2 |
|
oauth2-proxy |
mirantis.azurecr.io/iam/oauth2-proxy:v7.1.3-13 |
|
opensearch Updated |
mirantis.azurecr.io/stacklight/opensearch:2.17-20250113023014 |
|
opensearch-dashboards Updated |
mirantis.azurecr.io/stacklight/opensearch-dashboards:2.17-20250113023013 |
|
prometheus |
mirantis.azurecr.io/stacklight/prometheus:v2.48.0 |
|
prometheus-es-exporter Updated |
mirantis.azurecr.io/stacklight/prometheus-es-exporter:v0.14-20250113023014 |
|
prometheus-msteams Updated |
mirantis.azurecr.io/stacklight/prometheus-msteams:v1.5-20250113023013 |
|
prometheus-patroni-exporter Updated |
mirantis.azurecr.io/stacklight/prometheus-patroni-exporter:0.0.1-20250113023014 |
|
prometheus-postgres-exporter |
mirantis.azurecr.io/stacklight/prometheus-postgres-exporter:v0.15.0 |
|
prometheus-relay |
mirantis.azurecr.io/stacklight/prometheus-relay:v0.4-20240925023019 |
|
sf-notifier Updated |
mirantis.azurecr.io/stacklight/sf-notifier:v0.4-20250113023013 |
|
sf-reporter |
mirantis.azurecr.io/stacklight/sf-reporter:v0.1-20241021111607 |
|
spilo Updated |
mirantis.azurecr.io/stacklight/spilo:13-3.3-p2-20250113023013 |
|
telegraf |
mirantis.azurecr.io/stacklight/telegraf:v1.9.1-20241202023010 |
|
mirantis.azurecr.io/stacklight/telegraf:1-20241115074302 |
||
telemeter Updated |
mirantis.azurecr.io/stacklight/telemeter:4.4-20250113023014 |
|
telemeter-token-auth Updated |
mirantis.azurecr.io/stacklight/telemeter-token-auth:v0.1-20250113023012 |
Artifact |
Component |
Path |
|---|---|---|
Configuration management |
Ansible |
|
Debian repositories |
System packages |
|
https://mirror.mirantis.com/kaas/ubuntu-2025-01-08-003900/ Updated |
||
https://mirror.mirantis.com/kaas/ubuntu-2025-01-08-003900.target.txt Updated |
||
MCR repositories |
MCR |
https://repos.mirantis.com/ubuntu/dists/jammy/pool/stable-23.0/ |
Target ubuntu system |
Ubuntu |
https://binary.mirantis.com/bm/bin/efi/ubuntu/tgz-jammy-20250108121533 Updated |
This section includes release notes for the patch Cluster release 16.3.4 that is introduced in the Container Cloud patch release 2.28.4 and is based on the previous Cluster releases of the 16.3.x series series.
This Cluster release supports Mirantis Kubernetes Engine 3.7.17 with Kubernetes 1.27 and Mirantis Container Runtime 23.0.15, which includes containerd 1.6.36.
For the list of CVE fixes delivered with this patch Cluster release, see 2.28.4
For details on patch release delivery, see Patch releases
This section lists the artifacts of components included in the Cluster release 16.3.4.
Note
The components that are newly added, updated, deprecated, or removed
as compared to the previous release version, are marked
with a corresponding superscript,
for example, lcm-ansible Updated.
Artifact |
Component |
Path |
|---|---|---|
Helm charts Updated |
local-volume-provisioner |
https://binary.mirantis.com/core/helm/local-volume-provisioner-1.41.26.tgz |
metallb |
||
Docker images |
ironic |
mirantis.azurecr.io/openstack/ironic:antelope-jammy-20240716113922 |
metallb-controller |
mirantis.azurecr.io/bm/metallb/controller:v0.14.5-a68c7101-amd64 |
|
metallb-speaker |
mirantis.azurecr.io/bm/metallb/speaker:v0.14.5-a68c7101-amd64 |
Artifact |
Component |
Path |
|---|---|---|
Helm chart Updated |
ceph-controller |
https://binary.mirantis.com/ceph/helm/ceph-operator-1.0.0-mcc-2.28.4-3.tgz |
Docker images |
ceph Updated |
mirantis.azurecr.io/mirantis/ceph:v18.2.4-11.cve |
ceph-controller Updated |
mirantis.azurecr.io/ceph/mcp/ceph-controller:2.28.4-2 |
|
cephcsi Updated |
mirantis.azurecr.io/mirantis/cephcsi:v3.9.0-26.cve |
|
cephcsi-registrar |
mirantis.azurecr.io/mirantis/cephcsi-registrar:v2.9.2-6.cve |
|
cephcsi-provisioner |
mirantis.azurecr.io/mirantis/cephcsi-provisioner:v3.6.2-6.cve |
|
cephcsi-snapshotter |
mirantis.azurecr.io/mirantis/cephcsi-snapshotter:v6.3.2-6.cve |
|
cephcsi-attacher |
mirantis.azurecr.io/mirantis/cephcsi-attacher:v4.4.2-6.cve |
|
cephcsi-resizer |
mirantis.azurecr.io/mirantis/cephcsi-resizer:v1.9.2-6.cve |
|
rook Updated |
mirantis.azurecr.io/ceph/rook:v1.13.5-28 |
|
snapshot-controller |
mirantis.azurecr.io/mirantis/snapshot-controller:v6.3.2-6.cve |
Artifact |
Component |
Path |
|---|---|---|
Helm charts Updated |
cinder-csi-plugin Deprecated |
https://binary.mirantis.com/core/helm/cinder-csi-plugin-1.41.26.tgz |
client-certificate-controller |
https://binary.mirantis.com/core/helm/client-certificate-controller-1.41.26.tgz |
|
metrics-server |
https://binary.mirantis.com/core/helm/metrics-server-1.41.26.tgz |
|
openstack-cloud-controller-manager Deprecated |
https://binary.mirantis.com/core/helm/openstack-cloud-controller-manager-1.41.26.tgz |
|
policy-controller |
https://binary.mirantis.com/core/helm/policy-controller-1.41.26.tgz |
|
Docker images |
cinder-csi-plugin Deprecated |
mirantis.azurecr.io/lcm/kubernetes/cinder-csi-plugin:v1.27.2-24 |
client-certificate-controller Updated |
mirantis.azurecr.io/core/client-certificate-controller:1.41.26 |
|
csi-attacher Deprecated |
mirantis.azurecr.io/lcm/k8scsi/csi-attacher:v4.2.0-7 |
|
csi-node-driver-registrar Deprecated |
mirantis.azurecr.io/lcm/k8scsi/csi-node-driver-registrar:v2.7.0-7 |
|
csi-provisioner Deprecated |
mirantis.azurecr.io/lcm/k8scsi/csi-provisioner:v3.4.1-7 |
|
csi-resizer Deprecated |
mirantis.azurecr.io/lcm/k8scsi/csi-resizer:v1.7.0-7 |
|
csi-snapshotter Deprecated |
mirantis.azurecr.io/lcm/k8scsi/csi-snapshotter:v6.2.1-mcc-6 |
|
livenessprobe Deprecated |
mirantis.azurecr.io/lcm/k8scsi/livenessprobe:v2.9.0-7 |
|
metrics-server Updated |
mirantis.azurecr.io/lcm/metrics-server-amd64:v0.6.3-10 |
|
openstack-cloud-controller-manager Deprecated |
mirantis.azurecr.io/lcm/kubernetes/openstack-cloud-controller-manager:v1.27.2-24 |
|
policy-controller Updated |
mirantis.azurecr.io/core/policy-controller:1.41.26 |
Artifact |
Component |
Path |
|---|---|---|
Binaries Updated |
lcm-ansible |
https://binary.mirantis.com/lcm/bin/lcm-ansible/v0.26.0-111-g8632985/lcm-ansible.tar.gz |
lcm-agent |
||
Helm charts Updated |
helm-controller |
https://binary.mirantis.com/core/helm/helm-controller-1.41.26.tgz |
managed-lcm-api |
https://binary.mirantis.com/core/helm/managed-lcm-api-1.41.26.tgz |
|
Docker images Updated |
helm-controller |
mirantis.azurecr.io/core/lcm-controller:1.41.26 |
mcc-haproxy |
mirantis.azurecr.io/lcm/mcc-haproxy:v0.26.0-111-g8632985 |
|
mcc-keepalived |
mirantis.azurecr.io/lcm/mcc-keepalived:v0.26.0-111-g8632985 |
Artifact |
Component |
Path |
|---|---|---|
Helm charts |
alerta |
https://binary.mirantis.com/stacklight/helm/alerta-0.1.0-mcp-33.tgz |
alertmanager-webhook-servicenow |
https://binary.mirantis.com/stacklight/helm/alertmanager-webhook-servicenow-0.2.0-mcp-8.tgz |
|
cadvisor |
https://binary.mirantis.com/stacklight/helm/cadvisor-0.1.0-mcp-7.tgz |
|
elasticsearch-curator |
https://binary.mirantis.com/stacklight/helm/elasticsearch-curator-1.5.0-mcp-15.tgz |
|
elasticsearch-exporter |
https://binary.mirantis.com/stacklight/helm/elasticsearch-exporter-1.2.0-mcp-10.tgz |
|
fluentd-logs Updated |
https://binary.mirantis.com/stacklight/helm/fluentd-logs-0.1.0-mcp-242.tgz |
|
grafana |
https://binary.mirantis.com/stacklight/helm/grafana-3.3.10-mcp-317.tgz |
|
iam-proxy |
||
metric-collector Updated |
https://binary.mirantis.com/stacklight/helm/metric-collector-0.3.0-mcp-18.tgz |
|
metricbeat |
https://binary.mirantis.com/stacklight/helm/metricbeat-1.7.1-mcp-25.tgz |
|
opensearch |
https://binary.mirantis.com/stacklight/helm/opensearch-0.1.0-mcp-88.tgz |
|
opensearch-dashboards |
https://binary.mirantis.com/stacklight/helm/opensearch-dashboards-0.1.0-mcp-57.tgz |
|
patroni Updated |
https://binary.mirantis.com/stacklight/helm/patroni-0.15.1-mcp-62.tgz |
|
prometheus |
https://binary.mirantis.com/stacklight/helm/prometheus-8.11.4-mcp-258.tgz |
|
prometheus-blackbox-exporter |
https://binary.mirantis.com/stacklight/helm/prometheus-blackbox-exporter-0.3.0-mcp-19.tgz |
|
prometheus-es-exporter |
https://binary.mirantis.com/stacklight/helm/prometheus-es-exporter-1.0.0-mcp-18.tgz |
|
prometheus-msteams |
https://binary.mirantis.com/stacklight/helm/prometheus-msteams-0.1.0-mcp-12.tgz |
|
sf-notifier |
https://binary.mirantis.com/stacklight/helm/sf-notifier-0.2.0-mcp-10.tgz |
|
sf-reporter |
https://binary.mirantis.com/stacklight/helm/sf-reporter-0.2.0-mcp-10.tgz |
|
stacklight Updated |
https://binary.mirantis.com/stacklight/helm/stacklight-0.16.8.tgz |
|
telegraf-ds |
https://binary.mirantis.com/stacklight/helm/telegraf-ds-1.1.5-mcp-42.tgz |
|
telegraf-s |
https://binary.mirantis.com/stacklight/helm/telegraf-s-1.1.5-mcp-42.tgz |
|
telemeter-client |
https://binary.mirantis.com/stacklight/helm/telemeter-client-0.2.0-mcp-14.tgz |
|
telemeter-server |
https://binary.mirantis.com/stacklight/helm/telemeter-server-0.2.0-mcp-14.tgz |
|
Docker images |
alerta-web Updated |
mirantis.azurecr.io/stacklight/alerta-web:9-20241216023012 |
alertmanager Updated |
mirantis.azurecr.io/stacklight/alertmanager:v0-20241216023016 |
|
alertmanager-webhook-servicenow |
mirantis.azurecr.io/stacklight/alertmanager-webhook-servicenow:v0.1-20241022074315 |
|
alpine-utils Updated |
mirantis.azurecr.io/stacklight/alpine-utils:1-20241216023016 |
|
blackbox-exporter Updated |
mirantis.azurecr.io/stacklight/blackbox-exporter:0-20241217061716 |
|
cadvisor Updated |
mirantis.azurecr.io/stacklight/cadvisor:v0.49.1-20241216023012 |
|
configmap-reload |
mirantis.azurecr.io/stacklight/configmap-reload:v0.8.0 |
|
curator |
mirantis.azurecr.io/stacklight/curator:5.7.6-20230404082402 |
|
elasticsearch-exporter |
mirantis.azurecr.io/stacklight/elasticsearch-exporter:v1.5.0 |
|
fluentd Updated |
mirantis.azurecr.io/stacklight/fluentd:1.17-20241216023012 |
|
grafana |
mirantis.azurecr.io/stacklight/grafana:10.4.3 |
|
k8s-sidecar |
mirantis.azurecr.io/stacklight/k8s-sidecar:1-20241115071117 |
|
kube-state-metrics |
mirantis.azurecr.io/stacklight/kube-state-metrics:v2.10.1 |
|
kubectl Removed |
n/a |
|
metric-collector Updated |
mirantis.azurecr.io/stacklight/metric-collector:v0.1-20241216023016 |
|
metricbeat Updated |
mirantis.azurecr.io/stacklight/metricbeat:7.12.1-20241217093320 |
|
node-exporter |
mirantis.azurecr.io/stacklight/node-exporter:v1.8.2 |
|
oauth2-proxy |
mirantis.azurecr.io/iam/oauth2-proxy:v7.1.3-13 |
|
opensearch Updated |
mirantis.azurecr.io/stacklight/opensearch:2.17-20241216023012 |
|
opensearch-dashboards Updated |
mirantis.azurecr.io/stacklight/opensearch-dashboards:2.17-20241216023012 |
|
pgbouncer Removed |
n/a |
|
prometheus |
mirantis.azurecr.io/stacklight/prometheus:v2.48.0 |
|
prometheus-es-exporter Updated |
mirantis.azurecr.io/stacklight/prometheus-es-exporter:v0.14-20241216023016 |
|
prometheus-msteams Updated |
mirantis.azurecr.io/stacklight/prometheus-msteams:v1.5-20241209023016 |
|
prometheus-patroni-exporter Updated |
mirantis.azurecr.io/stacklight/prometheus-patroni-exporter:0.0.1-20241216023016 |
|
prometheus-postgres-exporter |
mirantis.azurecr.io/stacklight/prometheus-postgres-exporter:v0.15.0 |
|
prometheus-relay |
mirantis.azurecr.io/stacklight/prometheus-relay:v0.4-20240925023019 |
|
sf-notifier Updated |
mirantis.azurecr.io/stacklight/sf-notifier:v0.4-20241216023012 |
|
sf-reporter |
mirantis.azurecr.io/stacklight/sf-reporter:v0.1-20241021111607 |
|
spilo Updated |
mirantis.azurecr.io/stacklight/spilo:13-3.3-p2-20241216023012 |
|
telegraf |
mirantis.azurecr.io/stacklight/telegraf:v1.9.1-20241202023010 Updated |
|
mirantis.azurecr.io/stacklight/telegraf:1-20241115074302 |
||
telemeter Updated |
mirantis.azurecr.io/stacklight/telemeter:4.4-20241216023016 |
|
telemeter-token-auth Updated |
mirantis.azurecr.io/stacklight/telemeter-token-auth:v0.1-20241216023012 |
Artifact |
Component |
Path |
|---|---|---|
Configuration management |
Ansible |
|
Debian repositories |
System packages |
|
https://mirror.mirantis.com/kaas/ubuntu-2024-12-05-003900/ Updated |
||
https://mirror.mirantis.com/kaas/ubuntu-2024-12-05-003900.target.txt Updated |
||
MCR repositories |
MCR |
https://repos.mirantis.com/ubuntu/dists/jammy/pool/stable-23.0/ |
Target ubuntu system |
Ubuntu |
https://binary.mirantis.com/bm/bin/efi/ubuntu/tgz-jammy-20241205163925 Updated |
This section outlines release notes for the major Cluster release 16.3.0 that is introduced in the Container Cloud release 2.28.0. The Cluster release 16.3.0 supports:
Mirantis Kubernetes Engine (MKE) 3.7.12. For details, see MKE Release Notes.
Mirantis Container Runtime (MCR) 23.0.14. For details, see MCR Release Notes.
Kubernetes 1.27.
For the list of known and addressed issues, refer to the Container Cloud release 2.28.0 section.
This section outlines new features implemented in the Cluster release 16.3.0 that is introduced in the Container Cloud release 2.28.0.
Introduced support for Mirantis Container Runtime (MCR) 23.0.14 and Mirantis Kubernetes Engine (MKE) 3.7.12 that includes Kubernetes 1.27.14 for the Container Cloud management and managed clusters.
On existing managed clusters, MKE and MCR are updated to the latest supported version when you update your managed cluster to the Cluster release 16.3.0.
Note
The 3.7.12 update applies to users who follow the update train using major releases. Users who install patch releases, have already obtained MKE 3.7.12 in Container Cloud 2.27.3 (Cluster release 16.1.4).
Analyzed and reached 80% of pass rate in the CIS Benchmark compliance checks (executed by the Nessus scanner) for Ubuntu Linux 22.04 LTS v2.0.0 L1 Server, revision 1.1.
Note
Compliance results can vary between clusters due to configuration-dependent tests, such as server disk partitioning.
If you require a detailed report of analyzed and fixed compliance checks, contact Mirantis support.
Implemented proactive monitoring that allows the operator to quickly detect
and resolve LCM health issues in a cluster. The implementation includes the
dedicated MCCClusterLCMUnhealthy alert along with the
kaas_cluster_lcm_healthy and kaas_cluster_ready metrics that are
collected on the kaas-exporter side.
Refactored all certificate and license expiration alerts in StackLight that now
display the exact number of remaining days before expiration using
{{ $value | humanizeTimestamp }}. This optimization replaces vague wording
such as less than 10 days, which indicated a range from 0 to 9 days before
expiration.
Learn more
The following table lists the components versions of the Cluster release
16.3.0. The components that are newly added, updated, deprecated, or removed as
compared to 16.2.0, are marked with a corresponding superscript, for example,
lcm-ansible Updated.
Component |
Application/Service |
Version |
|---|---|---|
Cluster orchestration Updated |
Mirantis Kubernetes Engine |
3.7.12 0 |
Container runtime Updated |
Mirantis Container Runtime |
23.0.14 1 |
Core Updated |
cinder-csi-plugin |
1.27.2-19 |
client-certificate-controller |
1.41.14 |
|
csi-attacher |
4.2.0-7 |
|
csi-node-driver-registrar |
2.7.0-7 |
|
csi-provisioner |
3.4.1-7 |
|
csi-resizer |
1.7.0-7 |
|
csi-snapshotter |
6.2.1-mcc-6 |
|
livenessprobe |
2.9.0-7 |
|
metrics-server |
0.6.3-9 |
|
policy-controller |
1.41.14 |
|
vsphere-cloud-controller-manager Removed |
n/a |
|
vsphere-csi-driver Removed |
n/a |
|
vsphere-csi-syncer Removed |
n/a |
|
Distributed storage Updated |
Ceph |
18.2.4-6.cve (Reef) |
Rook |
1.13.5-21 |
|
LCM Updated |
helm-controller |
1.41.14 |
lcm-ansible |
0.26.0-95-g95f0130 |
|
lcm-agent |
1.41.14 |
|
StackLight |
Alerta |
9.0.1 |
Alertmanager |
0.25.0 |
|
Alertmanager Webhook ServiceNow |
0.1 |
|
Blackbox Exporter |
0.24.0 |
|
cAdvisor |
0.47.2 |
|
Elasticsearch Curator |
5.7.6 |
|
Elasticsearch Exporter |
1.5.0 |
|
Fluentd |
1.15.3 |
|
Grafana Updated |
10.4.3 |
|
kube-state-metrics |
2.10.1 |
|
Metric Collector |
0.1 |
|
Metricbeat |
7.12.1 |
|
Node Exporter Updated |
1.8.2 |
|
OAuth2 Proxy |
7.1.3 |
|
OpenSearch |
2.12.0 |
|
OpenSearch Dashboards |
2.12.0 |
|
Prometheus |
2.48.0 |
|
Prometheus ES Exporter |
0.14.0 |
|
Prometheus MS Teams |
1.5.2 |
|
Prometheus Patroni Exporter |
0.0.1 |
|
Prometheus Postgres Exporter |
0.15.0 |
|
Prometheus Relay |
0.4 |
|
sf-notifier |
0.4 |
|
sf-reporter |
0.1 |
|
Spilo |
13-2.1p9 |
|
Telegraf |
1.9.1 |
|
1.30.2 |
||
Telemeter |
4.4 |
- 0
For the Mirantis Kubernetes Engine (MKE) release highlights and components versions, see MKE documentation: MKE release notes.
- 1
For the Mirantis Container Runtime (MCR) release highlights, see MCR documentation: MCR release notes.
This section lists the artifacts of components included in the Cluster release
16.3.0. The components that are newly added, updated, deprecated, or removed as
compared to 16.2.0, are marked with a corresponding superscript, for example,
lcm-ansible Updated.
Artifact |
Component |
Path |
|---|---|---|
Helm chart Updated |
ceph-controller |
https://binary.mirantis.com/ceph/helm/ceph-operator-1.0.0-mcc-2.28.0-15.tgz |
Docker images Updated |
ceph |
mirantis.azurecr.io/mirantis/ceph:v18.2.4-6.cve |
ceph-controller |
mirantis.azurecr.io/ceph/mcp/ceph-controller:2.28.0-14 |
|
cephcsi |
mirantis.azurecr.io/mirantis/cephcsi:v3.9.0-20.cve |
|
cephcsi-registrar |
mirantis.azurecr.io/mirantis/cephcsi-registrar:v2.9.2-6.cve |
|
cephcsi-provisioner |
mirantis.azurecr.io/mirantis/cephcsi-provisioner:v3.6.2-6.cve |
|
cephcsi-snapshotter |
mirantis.azurecr.io/mirantis/cephcsi-snapshotter:v6.3.2-6.cve |
|
cephcsi-attacher |
mirantis.azurecr.io/mirantis/cephcsi-attacher:v4.4.2-6.cve |
|
cephcsi-resizer |
mirantis.azurecr.io/mirantis/cephcsi-resizer:v1.9.2-6.cve |
|
rook |
mirantis.azurecr.io/ceph/rook:v1.13.5-21 |
|
snapshot-controller |
mirantis.azurecr.io/mirantis/snapshot-controller:v6.3.2-6.cve |
Artifact |
Component |
Path |
|---|---|---|
Helm charts Updated |
cinder-csi-plugin |
https://binary.mirantis.com/core/helm/cinder-csi-plugin-1.41.14.tgz |
client-certificate-controller |
https://binary.mirantis.com/core/helm/client-certificate-controller-1.41.14.tgz |
|
local-volume-provisioner |
https://binary.mirantis.com/core/helm/local-volume-provisioner-1.41.14.tgz |
|
metrics-server |
https://binary.mirantis.com/core/helm/metrics-server-1.41.14.tgz |
|
openstack-cloud-controller-manager |
https://binary.mirantis.com/core/helm/openstack-cloud-controller-manager-1.41.14.tgz |
|
policy-controller |
https://binary.mirantis.com/core/helm/policy-controller-1.41.14.tgz |
|
vsphere-cloud-controller-manager Removed |
n/a |
|
vsphere-csi-plugin Removed |
n/a |
|
Docker images Updated |
cinder-csi-plugin |
mirantis.azurecr.io/lcm/kubernetes/cinder-csi-plugin:v1.27.2-20 |
client-certificate-controller |
mirantis.azurecr.io/core/client-certificate-controller:1.41.14 |
|
csi-attacher |
mirantis.azurecr.io/lcm/k8scsi/csi-attacher:v4.2.0-7 |
|
csi-node-driver-registrar |
mirantis.azurecr.io/lcm/k8scsi/csi-node-driver-registrar:v2.7.0-7 |
|
csi-provisioner |
mirantis.azurecr.io/lcm/k8scsi/csi-provisioner:v3.4.1-7 |
|
csi-resizer |
mirantis.azurecr.io/lcm/k8scsi/csi-resizer:v1.7.0-7 |
|
csi-snapshotter |
mirantis.azurecr.io/lcm/k8scsi/csi-snapshotter:v6.2.1-mcc-6 |
|
livenessprobe |
mirantis.azurecr.io/lcm/k8scsi/livenessprobe:v2.9.0-7 |
|
metrics-server |
mirantis.azurecr.io/lcm/metrics-server-amd64:v0.6.3-9 |
|
openstack-cloud-controller-manager |
mirantis.azurecr.io/lcm/kubernetes/openstack-cloud-controller-manager:v1.27.2-20 |
|
policy-controller |
mirantis.azurecr.io/core/policy-controller:1.41.14 |
|
vsphere-cloud-controller-manager Removed |
n/a |
|
vsphere-csi-driver Removed |
n/a |
|
vsphere-csi-syncer Removed |
n/a |
Artifact |
Component |
Path |
|---|---|---|
Binaries Updated |
lcm-ansible |
https://binary.mirantis.com/lcm/bin/lcm-ansible/v0.26.0-95-g95f0130/lcm-ansible.tar.gz |
lcm-agent |
||
Helm charts Updated |
helm-controller |
https://binary.mirantis.com/core/helm/helm-controller-1.41.14.tgz |
managed-lcm-api |
https://binary.mirantis.com/core/helm/managed-lcm-api-1.41.14.tgz |
|
Docker images Updated |
helm-controller |
mirantis.azurecr.io/core/lcm-controller:1.41.14 |
Artifact |
Component |
Path |
|---|---|---|
Helm charts |
alerta |
https://binary.mirantis.com/stacklight/helm/alerta-0.1.0-mcp-33.tgz |
alertmanager-webhook-servicenow |
https://binary.mirantis.com/stacklight/helm/alertmanager-webhook-servicenow-0.2.0-mcp-8.tgz |
|
cadvisor |
https://binary.mirantis.com/stacklight/helm/cadvisor-0.1.0-mcp-7.tgz |
|
elasticsearch-curator |
https://binary.mirantis.com/stacklight/helm/elasticsearch-curator-1.5.0-mcp-15.tgz |
|
elasticsearch-exporter |
https://binary.mirantis.com/stacklight/helm/elasticsearch-exporter-1.2.0-mcp-10.tgz |
|
fluentd-logs Updated |
https://binary.mirantis.com/stacklight/helm/fluentd-logs-0.1.0-mcp-240.tgz |
|
grafana Updated |
https://binary.mirantis.com/stacklight/helm/grafana-3.3.10-mcp-305.tgz |
|
iam-proxy |
||
metric-collector |
https://binary.mirantis.com/stacklight/helm/metric-collector-0.3.0-mcp-17.tgz |
|
metricbeat |
https://binary.mirantis.com/stacklight/helm/metricbeat-1.7.1-mcp-25.tgz |
|
opensearch Updated |
https://binary.mirantis.com/stacklight/helm/opensearch-0.1.0-mcp-88.tgz |
|
opensearch-dashboards Updated |
https://binary.mirantis.com/stacklight/helm/opensearch-dashboards-0.1.0-mcp-56.tgz |
|
patroni |
https://binary.mirantis.com/stacklight/helm/patroni-0.15.1-mcp-59.tgz |
|
prometheus |
https://binary.mirantis.com/stacklight/helm/prometheus-8.11.4-mcp-258.tgz |
|
prometheus-blackbox-exporter |
https://binary.mirantis.com/stacklight/helm/prometheus-blackbox-exporter-0.3.0-mcp-19.tgz |
|
prometheus-es-exporter |
https://binary.mirantis.com/stacklight/helm/prometheus-es-exporter-1.0.0-mcp-18.tgz |
|
prometheus-msteams |
https://binary.mirantis.com/stacklight/helm/prometheus-msteams-0.1.0-mcp-12.tgz |
|
refapp |
https://binary.mirantis.com/scale/helm/refapp-0.2.1-mcp-16.tgz |
|
sf-notifier |
https://binary.mirantis.com/stacklight/helm/sf-notifier-0.2.0-mcp-10.tgz |
|
sf-reporter |
https://binary.mirantis.com/stacklight/helm/sf-reporter-0.2.0-mcp-10.tgz |
|
stacklight Updated |
https://binary.mirantis.com/stacklight/helm/stacklight-0.16.2.tgz |
|
telegraf-ds |
https://binary.mirantis.com/stacklight/helm/telegraf-ds-1.1.5-mcp-42.tgz |
|
telegraf-s |
https://binary.mirantis.com/stacklight/helm/telegraf-s-1.1.5-mcp-42.tgz |
|
telemeter-client |
https://binary.mirantis.com/stacklight/helm/telemeter-client-0.2.0-mcp-14.tgz |
|
telemeter-server |
https://binary.mirantis.com/stacklight/helm/telemeter-server-0.2.0-mcp-14.tgz |
|
Docker images |
alerta-web Updated |
mirantis.azurecr.io/stacklight/alerta-web:9-20240828023009 |
alertmanager Updated |
mirantis.azurecr.io/stacklight/alertmanager:v0-20240828023017 |
|
alertmanager-webhook-servicenow |
mirantis.azurecr.io/stacklight/alertmanager-webhook-servicenow:v0.1-20240318145925 |
|
alpine-utils Updated |
mirantis.azurecr.io/stacklight/alpine-utils:1-20240828023020 |
|
blackbox-exporter |
mirantis.azurecr.io/stacklight/blackbox-exporter:0-20240408080237 |
|
cadvisor Updated |
mirantis.azurecr.io/stacklight/cadvisor:v0.47-20240828023011 |
|
configmap-reload |
mirantis.azurecr.io/stacklight/configmap-reload:v0.8.0 |
|
curator |
mirantis.azurecr.io/stacklight/curator:5.7.6-20230404082402 |
|
elasticsearch-exporter |
mirantis.azurecr.io/stacklight/elasticsearch-exporter:v1.5.0 |
|
fluentd Updated |
mirantis.azurecr.io/stacklight/fluentd:1.15-20240828023010 |
|
grafana Updated |
mirantis.azurecr.io/stacklight/grafana:10.4.3 |
|
k8s-sidecar Updated |
mirantis.azurecr.io/stacklight/k8s-sidecar:1-20240828023017 |
|
kube-state-metrics |
mirantis.azurecr.io/stacklight/kube-state-metrics:v2.10.1 |
|
kubectl Updated |
mirantis.azurecr.io/stacklight/kubectl:1.27-20240828023016 |
|
metric-collector Updated |
mirantis.azurecr.io/stacklight/metric-collector:v0.1-20240828023014 |
|
metricbeat Updated |
mirantis.azurecr.io/stacklight/metricbeat:7.12.1-20240626023010 |
|
node-exporter Updated |
mirantis.azurecr.io/stacklight/node-exporter:v1.8.2 |
|
oauth2-proxy Updated |
mirantis.azurecr.io/iam/oauth2-proxy:v7.1.3-10 |
|
opensearch Updated |
mirantis.azurecr.io/stacklight/opensearch:2-20240828023015 |
|
opensearch-dashboards Updated |
mirantis.azurecr.io/stacklight/opensearch-dashboards:2-20240828023010 |
|
openstack-refapp Updated |
mirantis.azurecr.io/openstack/openstack-refapp:0.1.8 |
|
pgbouncer Updated |
mirantis.azurecr.io/stacklight/pgbouncer:1-20240828023016 |
|
prometheus |
mirantis.azurecr.io/stacklight/prometheus:v2.48.0 |
|
prometheus-es-exporter Updated |
mirantis.azurecr.io/stacklight/prometheus-es-exporter:v0.14.0-20240828023017 |
|
prometheus-msteams |
mirantis.azurecr.io/stacklight/prometheus-msteams:v1.5-20240408080322 |
|
prometheus-patroni-exporter Updated |
mirantis.azurecr.io/stacklight/prometheus-patroni-exporter:0.0.1-20240828023018 |
|
prometheus-postgres-exporter |
mirantis.azurecr.io/stacklight/prometheus-postgres-exporter:v0.15.0 |
|
prometheus-relay Updated |
mirantis.azurecr.io/stacklight/prometheus-relay:v0.4-20240828023016 |
|
psql-client Updated |
mirantis.azurecr.io/scale/psql-client:v13-20240701095027 |
|
sf-notifier Updated |
mirantis.azurecr.io/stacklight/sf-notifier:v0.4-20240828023015 |
|
sf-reporter |
mirantis.azurecr.io/stacklight/sf-reporter:v0.1-20240318145903 |
|
spilo Updated |
mirantis.azurecr.io/stacklight/spilo:13-2.1p9-20240828023010 |
|
stacklight-toolkit Removed |
n/a |
|
telegraf |
mirantis.azurecr.io/stacklight/telegraf:v1.9.1-20240828023009 Updated |
|
mirantis.azurecr.io/stacklight/telegraf:1-20240426131156 |
||
telemeter Updated |
mirantis.azurecr.io/stacklight/telemeter:4.4-20240828023013 |
|
telemeter-token-auth Updated |
mirantis.azurecr.io/stacklight/telemeter-token-auth:v0.1-20240828023017 |
Artifact |
Component |
Path |
|---|---|---|
Configuration management |
Ansible |
|
Debian repositories |
System packages |
|
https://mirror.mirantis.com/kaas/ubuntu-2024-09-11-014225/ Updated |
||
https://mirror.mirantis.com/kaas/ubuntu-2024-09-11-014225.target.txt Updated |
||
MCR repositories |
MCR |
https://repos.mirantis.com/ubuntu/dists/jammy/pool/stable-23.0/ |
Target ubuntu system |
Ubuntu |
https://binary.mirantis.com/bm/bin/efi/ubuntu/tgz-jammy-20240911103059 Updated |
Major and patch versions update path
The primary distinction between major and patch product versions lies in the fact that major release versions introduce new functionalities, whereas patch release versions predominantly offer minor product enhancements, mostly CVE resolutions for your clusters.
Depending on your deployment needs, you can either update only between major Cluster releases or apply patch updates between major releases. Choosing the latter option ensures you receive security fixes as soon as they become available. Though, be prepared to update your cluster frequently, approximately once every three weeks. Otherwise, you can update only between major Cluster releases as each subsequent major Cluster release includes patch Cluster release updates of the previous major Cluster release.
This section outlines release notes for major and patch Cluster releases of the 16.2.x series.
This section includes release notes for the patch Cluster release 16.2.7 that is introduced in the Container Cloud patch release 2.28.3 and is based on the previous Cluster releases of the 16.2.x series series.
This Cluster release supports Mirantis Kubernetes Engine 3.7.16 with Kubernetes 1.27 and Mirantis Container Runtime 23.0.11.
For the list of CVE fixes delivered with this patch Cluster release, see 2.28.3
For details on patch release delivery, see Patch releases
This section lists the artifacts of components included in the Cluster release 16.2.7.
Note
The components that are newly added, updated, deprecated, or removed
as compared to the previous release version, are marked
with a corresponding superscript,
for example, lcm-ansible Updated.
Artifact |
Component |
Path |
|---|---|---|
Helm charts Updated |
local-volume-provisioner |
https://binary.mirantis.com/core/helm/local-volume-provisioner-1.40.29.tgz |
metallb |
||
Docker images |
ironic |
mirantis.azurecr.io/openstack/ironic:antelope-jammy-20240716113922 |
metallb-controller |
mirantis.azurecr.io/bm/metallb/controller:v0.14.5-a68c7101-amd64 |
|
metallb-speaker |
mirantis.azurecr.io/bm/metallb/speaker:v0.14.5-a68c7101-amd64 |
Artifact |
Component |
Path |
|---|---|---|
Helm chart Updated |
ceph-controller |
https://binary.mirantis.com/ceph/helm/ceph-operator-1.0.0-mcc-2.28.3-2.tgz |
Docker images |
ceph Updated |
mirantis.azurecr.io/mirantis/ceph:v18.2.4-10.cve |
ceph-controller Updated |
mirantis.azurecr.io/ceph/mcp/ceph-controller:2.28.3-0 |
|
cephcsi Updated |
mirantis.azurecr.io/mirantis/cephcsi:v3.9.0-24.cve |
|
cephcsi-registrar |
mirantis.azurecr.io/mirantis/cephcsi-registrar:v2.9.2-6.cve |
|
cephcsi-provisioner |
mirantis.azurecr.io/mirantis/cephcsi-provisioner:v3.6.2-6.cve |
|
cephcsi-snapshotter |
mirantis.azurecr.io/mirantis/cephcsi-snapshotter:v6.3.2-6.cve |
|
cephcsi-attacher |
mirantis.azurecr.io/mirantis/cephcsi-attacher:v4.4.2-6.cve |
|
cephcsi-resizer |
mirantis.azurecr.io/mirantis/cephcsi-resizer:v1.9.2-6.cve |
|
rook Updated |
mirantis.azurecr.io/ceph/rook:v1.13.5-26 |
|
snapshot-controller |
mirantis.azurecr.io/mirantis/snapshot-controller:v6.3.2-6.cve |
Artifact |
Component |
Path |
|---|---|---|
Helm charts |
cinder-csi-plugin |
https://binary.mirantis.com/core/helm/cinder-csi-plugin-1.40.29.tgz |
client-certificate-controller |
https://binary.mirantis.com/core/helm/client-certificate-controller-1.40.29.tgz |
|
metrics-server |
https://binary.mirantis.com/core/helm/metrics-server-1.40.29.tgz |
|
openstack-cloud-controller-manager |
https://binary.mirantis.com/core/helm/openstack-cloud-controller-manager-1.40.29.tgz |
|
policy-controller |
https://binary.mirantis.com/core/helm/policy-controller-1.40.29.tgz |
|
Docker images |
cinder-csi-plugin |
mirantis.azurecr.io/lcm/kubernetes/cinder-csi-plugin:v1.27.2-22 |
client-certificate-controller |
mirantis.azurecr.io/core/client-certificate-controller:1.40.29 |
|
csi-attacher |
mirantis.azurecr.io/lcm/k8scsi/csi-attacher:v4.2.0-7 |
|
csi-node-driver-registrar |
mirantis.azurecr.io/lcm/k8scsi/csi-node-driver-registrar:v2.7.0-7 |
|
csi-provisioner |
mirantis.azurecr.io/lcm/k8scsi/csi-provisioner:v3.4.1-7 |
|
csi-resizer |
mirantis.azurecr.io/lcm/k8scsi/csi-resizer:v1.7.0-7 |
|
csi-snapshotter |
mirantis.azurecr.io/lcm/k8scsi/csi-snapshotter:v6.2.1-mcc-6 |
|
livenessprobe |
mirantis.azurecr.io/lcm/k8scsi/livenessprobe:v2.9.0-7 |
|
metrics-server |
mirantis.azurecr.io/lcm/metrics-server-amd64:v0.6.3-9 |
|
openstack-cloud-controller-manager |
mirantis.azurecr.io/lcm/kubernetes/openstack-cloud-controller-manager:v1.27.2-22 |
|
policy-controller |
mirantis.azurecr.io/core/policy-controller:1.40.29 |
Artifact |
Component |
Path |
|---|---|---|
Binaries |
lcm-agent |
mirantis.azurecr.io/core/bin/lcm-agent-1.40.29 |
lcm-ansible Updated |
mirantis.azurecr.io/lcm/bin/lcm-ansible/v0.25.0-45-g957de77/lcm-ansible.tar.gz |
|
Helm charts |
helm-controller |
https://binary.mirantis.com/core/helm/helm-controller-1.40.29.tgz |
managed-lcm-api |
https://binary.mirantis.com/core/helm/managed-lcm-api-1.40.29.tgz |
|
Docker images |
helm-controller |
mirantis.azurecr.io/core/helm-controller:1.40.29 |
mcc-haproxy Updated |
mirantis.azurecr.io/lcm/mcc-haproxy:v0.25.0-45-g957de77 |
|
mcc-keepalived Updated |
mirantis.azurecr.io/lcm/mcc-keepalived:v0.25.0-45-g957de77 |
Artifact |
Component |
Path |
|---|---|---|
Helm charts |
alerta |
https://binary.mirantis.com/stacklight/helm/alerta-0.1.0-mcp-33.tgz |
alertmanager-webhook-servicenow |
https://binary.mirantis.com/stacklight/helm/alertmanager-webhook-servicenow-0.2.0-mcp-8.tgz |
|
cadvisor |
https://binary.mirantis.com/stacklight/helm/cadvisor-0.1.0-mcp-7.tgz |
|
elasticsearch-curator |
https://binary.mirantis.com/stacklight/helm/elasticsearch-curator-1.5.0-mcp-15.tgz |
|
elasticsearch-exporter |
https://binary.mirantis.com/stacklight/helm/elasticsearch-exporter-1.2.0-mcp-10.tgz |
|
fluentd-logs |
https://binary.mirantis.com/stacklight/helm/fluentd-logs-0.1.0-mcp-238.tgz |
|
grafana Updated |
https://binary.mirantis.com/stacklight/helm/grafana-3.3.10-mcp-317.tgz |
|
iam-proxy |
||
metric-collector |
https://binary.mirantis.com/stacklight/helm/metric-collector-0.3.0-mcp-17.tgz |
|
metricbeat |
https://binary.mirantis.com/stacklight/helm/metricbeat-1.7.1-mcp-25.tgz |
|
opensearch |
https://binary.mirantis.com/stacklight/helm/opensearch-0.1.0-mcp-88.tgz |
|
opensearch-dashboards Updated |
https://binary.mirantis.com/stacklight/helm/opensearch-dashboards-0.1.0-mcp-57.tgz |
|
patroni |
https://binary.mirantis.com/stacklight/helm/patroni-0.15.1-mcp-61.tgz |
|
prometheus |
https://binary.mirantis.com/stacklight/helm/prometheus-8.11.4-mcp-258.tgz |
|
prometheus-blackbox-exporter |
https://binary.mirantis.com/stacklight/helm/prometheus-blackbox-exporter-0.3.0-mcp-19.tgz |
|
prometheus-es-exporter |
https://binary.mirantis.com/stacklight/helm/prometheus-es-exporter-1.0.0-mcp-18.tgz |
|
prometheus-msteams |
https://binary.mirantis.com/stacklight/helm/prometheus-msteams-0.1.0-mcp-12.tgz |
|
refapp Removed |
n/a |
|
sf-notifier |
https://binary.mirantis.com/stacklight/helm/sf-notifier-0.2.0-mcp-10.tgz |
|
sf-reporter |
https://binary.mirantis.com/stacklight/helm/sf-reporter-0.2.0-mcp-10.tgz |
|
stacklight Updated |
https://binary.mirantis.com/stacklight/helm/stacklight-0.15.14.tgz |
|
telegraf-ds |
https://binary.mirantis.com/stacklight/helm/telegraf-ds-1.1.5-mcp-42.tgz |
|
telegraf-s |
https://binary.mirantis.com/stacklight/helm/telegraf-s-1.1.5-mcp-42.tgz |
|
telemeter-client |
https://binary.mirantis.com/stacklight/helm/telemeter-client-0.2.0-mcp-14.tgz |
|
telemeter-server |
https://binary.mirantis.com/stacklight/helm/telemeter-server-0.2.0-mcp-14.tgz |
|
Docker images |
alerta-web Updated |
mirantis.azurecr.io/stacklight/alerta-web:9-20241118023015 |
alertmanager Updated |
mirantis.azurecr.io/stacklight/alertmanager:v0-20241118023015 |
|
alertmanager-webhook-servicenow |
mirantis.azurecr.io/stacklight/alertmanager-webhook-servicenow:v0.1-20241022074315 |
|
alpine-utils Updated |
mirantis.azurecr.io/stacklight/alpine-utils:1-20241119091011 |
|
blackbox-exporter |
mirantis.azurecr.io/stacklight/blackbox-exporter:0-20240408080237 |
|
cadvisor Updated |
mirantis.azurecr.io/stacklight/cadvisor:v0.47-20241118023015 |
|
configmap-reload |
mirantis.azurecr.io/stacklight/configmap-reload:v0.8.0 |
|
curator |
mirantis.azurecr.io/stacklight/curator:5.7.6-20230404082402 |
|
elasticsearch-exporter |
mirantis.azurecr.io/stacklight/elasticsearch-exporter:v1.5.0 |
|
fluentd Updated |
mirantis.azurecr.io/stacklight/fluentd:1.15-20241118023015 |
|
grafana |
mirantis.azurecr.io/stacklight/grafana:10.3.1 |
|
k8s-sidecar Updated |
mirantis.azurecr.io/stacklight/k8s-sidecar:1-20241115071117 |
|
kube-state-metrics |
mirantis.azurecr.io/stacklight/kube-state-metrics:v2.10.1 |
|
kubectl Updated |
mirantis.azurecr.io/stacklight/kubectl:1.27-20241118023017 |
|
metric-collector Updated |
mirantis.azurecr.io/stacklight/metric-collector:v0.1-20241118023015 |
|
metricbeat Updated |
mirantis.azurecr.io/stacklight/metricbeat:7.12.1-20241118023015 |
|
node-exporter |
mirantis.azurecr.io/stacklight/node-exporter:v1.7.0 |
|
oauth2-proxy |
mirantis.azurecr.io/iam/oauth2-proxy:v7.1.3-13 |
|
opensearch Updated |
mirantis.azurecr.io/stacklight/opensearch:2.17-20241118023016 |
|
opensearch-dashboards Updated |
mirantis.azurecr.io/stacklight/opensearch-dashboards:2.17-20241118023015 |
|
openstack-refapp Removed |
n/a |
|
pgbouncer |
mirantis.azurecr.io/stacklight/pgbouncer:1-20240925023021 |
|
prometheus |
mirantis.azurecr.io/stacklight/prometheus:v2.48.0 |
|
prometheus-es-exporter Updated |
mirantis.azurecr.io/stacklight/prometheus-es-exporter:v0.14-20241118023016 |
|
prometheus-msteams Updated |
mirantis.azurecr.io/stacklight/prometheus-msteams:v1.5-20241118023015 |
|
prometheus-patroni-exporter Updated |
mirantis.azurecr.io/stacklight/prometheus-patroni-exporter:0.0.1-20241118023015 |
|
prometheus-postgres-exporter |
mirantis.azurecr.io/stacklight/prometheus-postgres-exporter:v0.15.0 |
|
prometheus-relay |
mirantis.azurecr.io/stacklight/prometheus-relay:v0.4-20240925023019 |
|
psql-client Removed |
n/a |
|
sf-notifier Updated |
mirantis.azurecr.io/stacklight/sf-notifier:v0.4-20241118023015 |
|
sf-reporter |
mirantis.azurecr.io/stacklight/sf-reporter:v0.1-20241021111607 |
|
spilo Updated |
mirantis.azurecr.io/stacklight/spilo:13-2.1p9-20241118023015 |
|
telegraf |
mirantis.azurecr.io/stacklight/telegraf:v1.9.1-20241118023015 Updated |
|
mirantis.azurecr.io/stacklight/telegraf:1-20241115074302 Updated |
||
telemeter Updated |
mirantis.azurecr.io/stacklight/telemeter:4.4-20241118023015 |
|
telemeter-token-auth Updated |
mirantis.azurecr.io/stacklight/telemeter-token-auth:v0.1-20241118023015 |
Artifact |
Component |
Path |
|---|---|---|
Configuration management |
Ansible |
|
Debian repositories |
System packages |
|
https://mirror.mirantis.com/kaas/ubuntu-2024-11-18-003900/ Updated |
||
https://mirror.mirantis.com/kaas/ubuntu-2024-11-18-003900.target.txt Updated |
||
MCR repositories |
MCR |
https://repos.mirantis.com/ubuntu/dists/jammy/pool/stable-23.0/ |
Target ubuntu system |
Ubuntu |
https://binary.mirantis.com/bm/bin/efi/ubuntu/tgz-jammy-20241118151305 Updated |
This section includes release notes for the patch Cluster release 16.2.6 that is introduced in the Container Cloud patch release 2.28.2 and is based on the previous Cluster releases of the 16.2.x series series.
This Cluster release supports Mirantis Kubernetes Engine 3.7.16 with Kubernetes 1.27 and Mirantis Container Runtime 23.0.11.
For the list of CVE fixes delivered with this patch Cluster release, see 2.28.2
For details on patch release delivery, see Patch releases
This section lists the artifacts of components included in the Cluster release 16.2.6.
Note
The components that are newly added, updated, deprecated, or removed
as compared to the previous release version, are marked
with a corresponding superscript,
for example, lcm-ansible Updated.
Artifact |
Component |
Path |
|---|---|---|
Helm charts Updated |
local-volume-provisioner |
https://binary.mirantis.com/core/helm/local-volume-provisioner-1.40.29.tgz |
metallb |
||
Docker images |
ironic |
mirantis.azurecr.io/openstack/ironic:antelope-jammy-20240716113922 |
metallb-controller |
mirantis.azurecr.io/bm/metallb/controller:v0.14.5-a68c7101-amd64 |
|
metallb-speaker |
mirantis.azurecr.io/bm/metallb/speaker:v0.14.5-a68c7101-amd64 |
Artifact |
Component |
Path |
|---|---|---|
Helm chart Updated |
ceph-controller |
https://binary.mirantis.com/ceph/helm/ceph-operator-1.0.0-mcc-2.28.2-1.tgz |
Docker images |
ceph Updated |
mirantis.azurecr.io/mirantis/ceph:v18.2.4-8.cve |
ceph-controller Updated |
mirantis.azurecr.io/ceph/mcp/ceph-controller:2.28.2-0 |
|
cephcsi Updated |
mirantis.azurecr.io/mirantis/cephcsi:v3.9.0-22.cve |
|
cephcsi-registrar |
mirantis.azurecr.io/mirantis/cephcsi-registrar:v2.9.2-6.cve |
|
cephcsi-provisioner |
mirantis.azurecr.io/mirantis/cephcsi-provisioner:v3.6.2-6.cve |
|
cephcsi-snapshotter |
mirantis.azurecr.io/mirantis/cephcsi-snapshotter:v6.3.2-6.cve |
|
cephcsi-attacher |
mirantis.azurecr.io/mirantis/cephcsi-attacher:v4.4.2-6.cve |
|
cephcsi-resizer |
mirantis.azurecr.io/mirantis/cephcsi-resizer:v1.9.2-6.cve |
|
rook Updated |
mirantis.azurecr.io/ceph/rook:v1.13.5-23 |
|
snapshot-controller |
mirantis.azurecr.io/mirantis/snapshot-controller:v6.3.2-6.cve |
Artifact |
Component |
Path |
|---|---|---|
Helm charts Updated |
cinder-csi-plugin |
https://binary.mirantis.com/core/helm/cinder-csi-plugin-1.40.29.tgz |
client-certificate-controller |
https://binary.mirantis.com/core/helm/client-certificate-controller-1.40.29.tgz |
|
metrics-server |
https://binary.mirantis.com/core/helm/metrics-server-1.40.29.tgz |
|
openstack-cloud-controller-manager |
https://binary.mirantis.com/core/helm/openstack-cloud-controller-manager-1.40.29.tgz |
|
policy-controller |
https://binary.mirantis.com/core/helm/policy-controller-1.40.29.tgz |
|
Docker images |
cinder-csi-plugin |
mirantis.azurecr.io/lcm/kubernetes/cinder-csi-plugin:v1.27.2-22 |
client-certificate-controller Updated |
mirantis.azurecr.io/core/client-certificate-controller:1.40.29 |
|
csi-attacher |
mirantis.azurecr.io/lcm/k8scsi/csi-attacher:v4.2.0-7 |
|
csi-node-driver-registrar |
mirantis.azurecr.io/lcm/k8scsi/csi-node-driver-registrar:v2.7.0-7 |
|
csi-provisioner |
mirantis.azurecr.io/lcm/k8scsi/csi-provisioner:v3.4.1-7 |
|
csi-resizer |
mirantis.azurecr.io/lcm/k8scsi/csi-resizer:v1.7.0-7 |
|
csi-snapshotter |
mirantis.azurecr.io/lcm/k8scsi/csi-snapshotter:v6.2.1-mcc-6 |
|
livenessprobe |
mirantis.azurecr.io/lcm/k8scsi/livenessprobe:v2.9.0-7 |
|
metrics-server |
mirantis.azurecr.io/lcm/metrics-server-amd64:v0.6.3-9 |
|
openstack-cloud-controller-manager |
mirantis.azurecr.io/lcm/kubernetes/openstack-cloud-controller-manager:v1.27.2-22 |
|
policy-controller Updated |
mirantis.azurecr.io/core/policy-controller:1.40.29 |
Artifact |
Component |
Path |
|---|---|---|
Binaries |
lcm-ansible |
https://binary.mirantis.com/lcm/bin/lcm-ansible/v0.25.0-44-g561405b/lcm-ansible.tar.gz |
lcm-agent Updated |
||
Helm charts Updated |
helm-controller |
https://binary.mirantis.com/core/helm/helm-controller-1.40.29.tgz |
managed-lcm-api |
https://binary.mirantis.com/core/helm/managed-lcm-api-1.40.29.tgz |
|
Docker images Updated |
helm-controller |
mirantis.azurecr.io/core/lcm-controller:1.40.29 |
mcc-haproxy |
mirantis.azurecr.io/lcm/mcc-haproxy:v0.25.0-44-g561405b |
|
mcc-keepalived |
mirantis.azurecr.io/lcm/mcc-keepalived:v0.25.0-44-g561405b |
Artifact |
Component |
Path |
|---|---|---|
Helm charts |
alerta |
https://binary.mirantis.com/stacklight/helm/alerta-0.1.0-mcp-33.tgz |
alertmanager-webhook-servicenow |
https://binary.mirantis.com/stacklight/helm/alertmanager-webhook-servicenow-0.2.0-mcp-8.tgz |
|
cadvisor |
https://binary.mirantis.com/stacklight/helm/cadvisor-0.1.0-mcp-7.tgz |
|
elasticsearch-curator |
https://binary.mirantis.com/stacklight/helm/elasticsearch-curator-1.5.0-mcp-15.tgz |
|
elasticsearch-exporter |
https://binary.mirantis.com/stacklight/helm/elasticsearch-exporter-1.2.0-mcp-10.tgz |
|
fluentd-logs |
https://binary.mirantis.com/stacklight/helm/fluentd-logs-0.1.0-mcp-238.tgz |
|
grafana |
https://binary.mirantis.com/stacklight/helm/grafana-3.3.10-mcp-309.tgz |
|
iam-proxy |
||
metric-collector |
https://binary.mirantis.com/stacklight/helm/metric-collector-0.3.0-mcp-17.tgz |
|
metricbeat |
https://binary.mirantis.com/stacklight/helm/metricbeat-1.7.1-mcp-25.tgz |
|
opensearch |
https://binary.mirantis.com/stacklight/helm/opensearch-0.1.0-mcp-88.tgz |
|
opensearch-dashboards |
https://binary.mirantis.com/stacklight/helm/opensearch-dashboards-0.1.0-mcp-54.tgz |
|
patroni Updated |
https://binary.mirantis.com/stacklight/helm/patroni-0.15.1-mcp-61.tgz |
|
prometheus |
https://binary.mirantis.com/stacklight/helm/prometheus-8.11.4-mcp-258.tgz |
|
prometheus-blackbox-exporter |
https://binary.mirantis.com/stacklight/helm/prometheus-blackbox-exporter-0.3.0-mcp-19.tgz |
|
prometheus-es-exporter |
https://binary.mirantis.com/stacklight/helm/prometheus-es-exporter-1.0.0-mcp-18.tgz |
|
prometheus-msteams |
https://binary.mirantis.com/stacklight/helm/prometheus-msteams-0.1.0-mcp-12.tgz |
|
refapp Deprecated |
https://binary.mirantis.com/scale/helm/refapp-0.2.1-mcp-16.tgz |
|
sf-notifier |
https://binary.mirantis.com/stacklight/helm/sf-notifier-0.2.0-mcp-10.tgz |
|
sf-reporter |
https://binary.mirantis.com/stacklight/helm/sf-reporter-0.2.0-mcp-10.tgz |
|
stacklight Updated |
https://binary.mirantis.com/stacklight/helm/stacklight-0.15.13.tgz |
|
telegraf-ds |
https://binary.mirantis.com/stacklight/helm/telegraf-ds-1.1.5-mcp-42.tgz |
|
telegraf-s |
https://binary.mirantis.com/stacklight/helm/telegraf-s-1.1.5-mcp-42.tgz |
|
telemeter-client |
https://binary.mirantis.com/stacklight/helm/telemeter-client-0.2.0-mcp-14.tgz |
|
telemeter-server |
https://binary.mirantis.com/stacklight/helm/telemeter-server-0.2.0-mcp-14.tgz |
|
Docker images |
alerta-web Updated |
mirantis.azurecr.io/stacklight/alerta-web:9-20241028023014 |
alertmanager Updated |
mirantis.azurecr.io/stacklight/alertmanager:v0-20241028023014 |
|
alertmanager-webhook-servicenow |
mirantis.azurecr.io/stacklight/alertmanager-webhook-servicenow:v0.1-20241022074315 |
|
alpine-utils Updated |
mirantis.azurecr.io/stacklight/alpine-utils:1-20241028023016 |
|
blackbox-exporter |
mirantis.azurecr.io/stacklight/blackbox-exporter:0-20240408080237 |
|
cadvisor Updated |
mirantis.azurecr.io/stacklight/cadvisor:v0.47-20241028023014 |
|
configmap-reload |
mirantis.azurecr.io/stacklight/configmap-reload:v0.8.0 |
|
curator |
mirantis.azurecr.io/stacklight/curator:5.7.6-20230404082402 |
|
elasticsearch-exporter |
mirantis.azurecr.io/stacklight/elasticsearch-exporter:v1.5.0 |
|
fluentd Updated |
mirantis.azurecr.io/stacklight/fluentd:1.15-20241028023014 |
|
grafana |
mirantis.azurecr.io/stacklight/grafana:10.3.1 |
|
k8s-sidecar |
mirantis.azurecr.io/stacklight/k8s-sidecar:1-20241021111512 |
|
kube-state-metrics |
mirantis.azurecr.io/stacklight/kube-state-metrics:v2.10.1 |
|
kubectl |
mirantis.azurecr.io/stacklight/kubectl:1.27-20240925023021 |
|
metric-collector Updated |
mirantis.azurecr.io/stacklight/metric-collector:v0.1-20241028023016 |
|
metricbeat Updated |
mirantis.azurecr.io/stacklight/metricbeat:7.12.1-20241028023014 |
|
node-exporter |
mirantis.azurecr.io/stacklight/node-exporter:v1.7.0 |
|
oauth2-proxy Updated |
mirantis.azurecr.io/iam/oauth2-proxy:v7.1.3-13 |
|
opensearch Updated |
mirantis.azurecr.io/stacklight/opensearch:2-20241028023015 |
|
opensearch-dashboards Updated |
mirantis.azurecr.io/stacklight/opensearch-dashboards:2-20241028023015 |
|
openstack-refapp Deprecated |
mirantis.azurecr.io/openstack/openstack-refapp:0.1.11 |
|
pgbouncer |
mirantis.azurecr.io/stacklight/pgbouncer:1-20240925023021 |
|
prometheus |
mirantis.azurecr.io/stacklight/prometheus:v2.48.0 |
|
prometheus-es-exporter Updated |
mirantis.azurecr.io/stacklight/prometheus-es-exporter:v0.14-20241028023016 |
|
prometheus-msteams Updated |
mirantis.azurecr.io/stacklight/prometheus-msteams:v1.5-20241028023015 |
|
prometheus-patroni-exporter Updated |
mirantis.azurecr.io/stacklight/prometheus-patroni-exporter:0.0.1-20241028023016 |
|
prometheus-postgres-exporter |
mirantis.azurecr.io/stacklight/prometheus-postgres-exporter:v0.15.0 |
|
prometheus-relay |
mirantis.azurecr.io/stacklight/prometheus-relay:v0.4-20240925023019 |
|
psql-client Deprecated |
mirantis.azurecr.io/scale/psql-client:v13-20241029083652 |
|
sf-notifier Updated |
mirantis.azurecr.io/stacklight/sf-notifier:v0.4-20241028023015 |
|
sf-reporter |
mirantis.azurecr.io/stacklight/sf-reporter:v0.1-20241021111607 |
|
spilo Updated |
mirantis.azurecr.io/stacklight/spilo:13-2.1p9-20241028023014 |
|
telegraf |
mirantis.azurecr.io/stacklight/telegraf:v1.9.1-20241028023014 Updated |
|
mirantis.azurecr.io/stacklight/telegraf:1-20241018175310 |
||
telemeter Updated |
mirantis.azurecr.io/stacklight/telemeter:4.4-20241028023014 |
|
telemeter-token-auth Updated |
mirantis.azurecr.io/stacklight/telemeter-token-auth:v0.1-20241028023014 |
Artifact |
Component |
Path |
|---|---|---|
Configuration management |
Ansible |
|
Debian repositories |
System packages |
|
https://mirror.mirantis.com/kaas/ubuntu-2024-10-28-012906/ Updated |
||
https://mirror.mirantis.com/kaas/ubuntu-2024-10-28-012906.target.txt Updated |
||
MCR repositories |
MCR |
https://repos.mirantis.com/ubuntu/dists/jammy/pool/stable-23.0/ |
Target ubuntu system |
Ubuntu |
https://binary.mirantis.com/bm/bin/efi/ubuntu/tgz-jammy-20241028153545 Updated |
This section includes release notes for the patch Cluster release 16.2.5 that is introduced in the Container Cloud patch release 2.28.1 and is based on the previous Cluster releases of the 16.2.x series series.
This Cluster release supports Mirantis Kubernetes Engine 3.7.15 with Kubernetes 1.27 and Mirantis Container Runtime 23.0.11.
For the list of CVE fixes delivered with this patch Cluster release, see 2.28.1
For details on patch release delivery, see Patch releases
This section lists the artifacts of components included in the Cluster release 16.2.5.
Note
The components that are newly added, updated, deprecated, or removed
as compared to the previous release version, are marked
with a corresponding superscript,
for example, lcm-ansible Updated.
Artifact |
Component |
Path |
|---|---|---|
Helm charts Updated |
local-volume-provisioner |
https://binary.mirantis.com/core/helm/local-volume-provisioner-1.40.28.tgz |
metallb |
||
Docker images |
ironic |
mirantis.azurecr.io/openstack/ironic:antelope-jammy-20240716113922 |
metallb-controller Updated |
mirantis.azurecr.io/bm/metallb/controller:v0.14.5-a68c7101-amd64 |
|
metallb-speaker Updated |
mirantis.azurecr.io/bm/metallb/speaker:v0.14.5-a68c7101-amd64 |
Artifact |
Component |
Path |
|---|---|---|
Helm chart Updated |
ceph-controller |
https://binary.mirantis.com/ceph/helm/ceph-operator-1.0.0-mcc-2.28.1-5.tgz |
Docker images Updated |
ceph |
mirantis.azurecr.io/mirantis/ceph:v18.2.4-7.cve |
ceph-controller |
mirantis.azurecr.io/ceph/mcp/ceph-controller:2.28.1-4 |
|
cephcsi |
mirantis.azurecr.io/mirantis/cephcsi:v3.9.0-21.cve |
|
cephcsi-registrar |
mirantis.azurecr.io/mirantis/cephcsi-registrar:v2.9.2-6.cve |
|
cephcsi-provisioner |
mirantis.azurecr.io/mirantis/cephcsi-provisioner:v3.6.2-6.cve |
|
cephcsi-snapshotter |
mirantis.azurecr.io/mirantis/cephcsi-snapshotter:v6.3.2-6.cve |
|
cephcsi-attacher |
mirantis.azurecr.io/mirantis/cephcsi-attacher:v4.4.2-6.cve |
|
cephcsi-resizer |
mirantis.azurecr.io/mirantis/cephcsi-resizer:v1.9.2-6.cve |
|
rook |
mirantis.azurecr.io/ceph/rook:v1.13.5-22 |
|
snapshot-controller |
mirantis.azurecr.io/mirantis/snapshot-controller:v6.3.2-6.cve |
Artifact |
Component |
Path |
|---|---|---|
Helm charts Updated |
cinder-csi-plugin |
https://binary.mirantis.com/core/helm/cinder-csi-plugin-1.40.28.tgz |
client-certificate-controller |
https://binary.mirantis.com/core/helm/client-certificate-controller-1.40.28.tgz |
|
metrics-server |
https://binary.mirantis.com/core/helm/metrics-server-1.40.28.tgz |
|
openstack-cloud-controller-manager |
https://binary.mirantis.com/core/helm/openstack-cloud-controller-manager-1.40.28.tgz |
|
policy-controller |
https://binary.mirantis.com/core/helm/policy-controller-1.40.28.tgz |
|
Docker images Updated |
cinder-csi-plugin |
mirantis.azurecr.io/lcm/kubernetes/cinder-csi-plugin:v1.27.2-22 |
client-certificate-controller |
mirantis.azurecr.io/core/client-certificate-controller:1.40.28 |
|
csi-attacher |
mirantis.azurecr.io/lcm/k8scsi/csi-attacher:v4.2.0-7 |
|
csi-node-driver-registrar |
mirantis.azurecr.io/lcm/k8scsi/csi-node-driver-registrar:v2.7.0-7 |
|
csi-provisioner |
mirantis.azurecr.io/lcm/k8scsi/csi-provisioner:v3.4.1-7 |
|
csi-resizer |
mirantis.azurecr.io/lcm/k8scsi/csi-resizer:v1.7.0-7 |
|
csi-snapshotter |
mirantis.azurecr.io/lcm/k8scsi/csi-snapshotter:v6.2.1-mcc-6 |
|
livenessprobe |
mirantis.azurecr.io/lcm/k8scsi/livenessprobe:v2.9.0-7 |
|
metrics-server |
mirantis.azurecr.io/lcm/metrics-server-amd64:v0.6.3-9 |
|
openstack-cloud-controller-manager |
mirantis.azurecr.io/lcm/kubernetes/openstack-cloud-controller-manager:v1.27.2-22 |
|
policy-controller |
mirantis.azurecr.io/core/policy-controller:1.40.28 |
Artifact |
Component |
Path |
|---|---|---|
Binaries |
lcm-ansible |
https://binary.mirantis.com/lcm/bin/lcm-ansible/v0.25.0-44-g561405b/lcm-ansible.tar.gz |
lcm-agent Updated |
||
Helm charts Updated |
helm-controller |
https://binary.mirantis.com/core/helm/helm-controller-1.40.28.tgz |
managed-lcm-api |
https://binary.mirantis.com/core/helm/managed-lcm-api-1.40.28.tgz |
|
Docker images Updated |
helm-controller |
mirantis.azurecr.io/core/lcm-controller:1.40.28 |
mcc-haproxy |
mirantis.azurecr.io/lcm/mcc-haproxy:v0.25.0-44-g561405b |
|
mcc-keepalived |
mirantis.azurecr.io/lcm/mcc-keepalived:v0.25.0-44-g561405b |
Artifact |
Component |
Path |
|---|---|---|
Helm charts |
alerta |
https://binary.mirantis.com/stacklight/helm/alerta-0.1.0-mcp-33.tgz |
alertmanager-webhook-servicenow |
https://binary.mirantis.com/stacklight/helm/alertmanager-webhook-servicenow-0.2.0-mcp-8.tgz |
|
cadvisor |
https://binary.mirantis.com/stacklight/helm/cadvisor-0.1.0-mcp-7.tgz |
|
elasticsearch-curator |
https://binary.mirantis.com/stacklight/helm/elasticsearch-curator-1.5.0-mcp-15.tgz |
|
elasticsearch-exporter |
https://binary.mirantis.com/stacklight/helm/elasticsearch-exporter-1.2.0-mcp-10.tgz |
|
fluentd-logs |
https://binary.mirantis.com/stacklight/helm/fluentd-logs-0.1.0-mcp-238.tgz |
|
grafana Updated |
https://binary.mirantis.com/stacklight/helm/grafana-3.3.10-mcp-309.tgz |
|
iam-proxy |
||
metric-collector |
https://binary.mirantis.com/stacklight/helm/metric-collector-0.3.0-mcp-17.tgz |
|
metricbeat |
https://binary.mirantis.com/stacklight/helm/metricbeat-1.7.1-mcp-25.tgz |
|
opensearch |
https://binary.mirantis.com/stacklight/helm/opensearch-0.1.0-mcp-88.tgz |
|
opensearch-dashboards |
https://binary.mirantis.com/stacklight/helm/opensearch-dashboards-0.1.0-mcp-54.tgz |
|
patroni |
https://binary.mirantis.com/stacklight/helm/patroni-0.15.1-mcp-59.tgz |
|
prometheus |
https://binary.mirantis.com/stacklight/helm/prometheus-8.11.4-mcp-258.tgz |
|
prometheus-blackbox-exporter |
https://binary.mirantis.com/stacklight/helm/prometheus-blackbox-exporter-0.3.0-mcp-19.tgz |
|
prometheus-es-exporter |
https://binary.mirantis.com/stacklight/helm/prometheus-es-exporter-1.0.0-mcp-18.tgz |
|
prometheus-msteams |
https://binary.mirantis.com/stacklight/helm/prometheus-msteams-0.1.0-mcp-12.tgz |
|
refapp |
https://binary.mirantis.com/scale/helm/refapp-0.2.1-mcp-16.tgz |
|
sf-notifier |
https://binary.mirantis.com/stacklight/helm/sf-notifier-0.2.0-mcp-10.tgz |
|
sf-reporter |
https://binary.mirantis.com/stacklight/helm/sf-reporter-0.2.0-mcp-10.tgz |
|
stacklight Updated |
https://binary.mirantis.com/stacklight/helm/stacklight-0.15.12.tgz |
|
telegraf-ds |
https://binary.mirantis.com/stacklight/helm/telegraf-ds-1.1.5-mcp-42.tgz |
|
telegraf-s |
https://binary.mirantis.com/stacklight/helm/telegraf-s-1.1.5-mcp-42.tgz |
|
telemeter-client |
https://binary.mirantis.com/stacklight/helm/telemeter-client-0.2.0-mcp-14.tgz |
|
telemeter-server |
https://binary.mirantis.com/stacklight/helm/telemeter-server-0.2.0-mcp-14.tgz |
|
Docker images |
alerta-web Updated |
mirantis.azurecr.io/stacklight/alerta-web:9-20241021023014 |
alertmanager Updated |
mirantis.azurecr.io/stacklight/alertmanager:v0-20241021023014 |
|
alertmanager-webhook-servicenow Updated |
mirantis.azurecr.io/stacklight/alertmanager-webhook-servicenow:v0.1-20241022074315 |
|
alpine-utils Updated |
mirantis.azurecr.io/stacklight/alpine-utils:1-20241021023015 |
|
blackbox-exporter |
mirantis.azurecr.io/stacklight/blackbox-exporter:0-20240408080237 |
|
cadvisor Updated |
mirantis.azurecr.io/stacklight/cadvisor:v0.47-20241021023014 |
|
configmap-reload |
mirantis.azurecr.io/stacklight/configmap-reload:v0.8.0 |
|
curator |
mirantis.azurecr.io/stacklight/curator:5.7.6-20230404082402 |
|
elasticsearch-exporter |
mirantis.azurecr.io/stacklight/elasticsearch-exporter:v1.5.0 |
|
fluentd Updated |
mirantis.azurecr.io/stacklight/fluentd:1.15-20241022103051 |
|
grafana |
mirantis.azurecr.io/stacklight/grafana:10.3.1 |
|
k8s-sidecar Updated |
mirantis.azurecr.io/stacklight/k8s-sidecar:1-20241021111512 |
|
kube-state-metrics |
mirantis.azurecr.io/stacklight/kube-state-metrics:v2.10.1 |
|
kubectl Updated |
mirantis.azurecr.io/stacklight/kubectl:1.27-20240925023021 |
|
metric-collector Updated |
mirantis.azurecr.io/stacklight/metric-collector:v0.1-20241021023015 |
|
metricbeat Updated |
mirantis.azurecr.io/stacklight/metricbeat:7.12.1-20241021023014 |
|
node-exporter |
mirantis.azurecr.io/stacklight/node-exporter:v1.7.0 |
|
oauth2-proxy Updated |
mirantis.azurecr.io/iam/oauth2-proxy:v7.1.3-12 |
|
opensearch Updated |
mirantis.azurecr.io/stacklight/opensearch:2-20241021023014 |
|
opensearch-dashboards Updated |
mirantis.azurecr.io/stacklight/opensearch-dashboards:2-20241021023014 |
|
openstack-refapp Updated |
mirantis.azurecr.io/openstack/openstack-refapp:0.1.10 |
|
pgbouncer Updated |
mirantis.azurecr.io/stacklight/pgbouncer:1-20240925023021 |
|
prometheus |
mirantis.azurecr.io/stacklight/prometheus:v2.48.0 |
|
prometheus-es-exporter Updated |
mirantis.azurecr.io/stacklight/prometheus-es-exporter:v0.14-20241021023015 |
|
prometheus-msteams Updated |
mirantis.azurecr.io/stacklight/prometheus-msteams:v1.5-20241021023014 |
|
prometheus-patroni-exporter Updated |
mirantis.azurecr.io/stacklight/prometheus-patroni-exporter:0.0.1-20241021023015 |
|
prometheus-postgres-exporter |
mirantis.azurecr.io/stacklight/prometheus-postgres-exporter:v0.15.0 |
|
prometheus-relay Updated |
mirantis.azurecr.io/stacklight/prometheus-relay:v0.4-20240925023019 |
|
psql-client Updated |
mirantis.azurecr.io/scale/psql-client:v13-20240924065857 |
|
sf-notifier Updated |
mirantis.azurecr.io/stacklight/sf-notifier:v0.4-20241021023015 |
|
sf-reporter Updated |
mirantis.azurecr.io/stacklight/sf-reporter:v0.1-20241021111607 |
|
spilo Updated |
mirantis.azurecr.io/stacklight/spilo:13-2.1p9-20241021023014 |
|
telegraf |
mirantis.azurecr.io/stacklight/telegraf:v1.9.1-20241021023014 Updated |
|
mirantis.azurecr.io/stacklight/telegraf:1-20241018175310 Updated |
||
telemeter Updated |
mirantis.azurecr.io/stacklight/telemeter:4.4-20241021023014 |
|
telemeter-token-auth Updated |
mirantis.azurecr.io/stacklight/telemeter-token-auth:v0.1-20241021023014 |
Artifact |
Component |
Path |
|---|---|---|
Configuration management |
Ansible |
|
Debian repositories |
System packages |
|
https://mirror.mirantis.com/kaas/ubuntu-2024-10-14-013948/ Updated |
||
https://mirror.mirantis.com/kaas/ubuntu-2024-10-14-013948.target.txt Updated |
||
MCR repositories |
MCR |
https://repos.mirantis.com/ubuntu/dists/jammy/pool/stable-23.0/ |
Target ubuntu system |
Ubuntu |
https://binary.mirantis.com/bm/bin/efi/ubuntu/tgz-jammy-20241014154940 Updated |
This section includes release notes for the patch Cluster release 16.2.4 that is introduced in the Container Cloud patch release 2.27.4 and is based on the previous Cluster releases of the 16.2.x series series.
This Cluster release supports Mirantis Kubernetes Engine 3.7.12 with Kubernetes 1.27 and Mirantis Container Runtime 23.0.11.
For the list of CVE fixes delivered with this patch Cluster release, see 2.27.4
For details on patch release delivery, see Patch releases
This section lists the artifacts of components included in the Cluster release 16.2.4.
Note
The components that are newly added, updated, deprecated, or removed
as compared to the previous release version, are marked
with a corresponding superscript,
for example, lcm-ansible Updated.
Artifact |
Component |
Path |
|---|---|---|
Helm chart Updated |
ceph-controller |
https://binary.mirantis.com/ceph/helm/ceph-operator-1.0.0-mcc-2.27.3-10.tgz |
Docker images Updated |
ceph |
mirantis.azurecr.io/mirantis/ceph:v18.2.4-4.cve |
ceph-controller |
mirantis.azurecr.io/ceph/mcp/ceph-controller:2.27.3-9 |
|
cephcsi |
mirantis.azurecr.io/mirantis/cephcsi:v3.9.0-18.cve |
|
cephcsi-registrar |
mirantis.azurecr.io/mirantis/cephcsi-registrar:v2.9.2-5.cve |
|
cephcsi-provisioner |
mirantis.azurecr.io/mirantis/cephcsi-provisioner:v3.6.2-5.cve |
|
cephcsi-snapshotter |
mirantis.azurecr.io/mirantis/cephcsi-snapshotter:v6.3.2-5.cve |
|
cephcsi-attacher |
mirantis.azurecr.io/mirantis/cephcsi-attacher:v4.4.2-5.cve |
|
cephcsi-resizer |
mirantis.azurecr.io/mirantis/cephcsi-resizer:v1.9.2-5.cve |
|
rook |
mirantis.azurecr.io/ceph/rook:v1.13.5-19 |
|
snapshot-controller |
mirantis.azurecr.io/mirantis/snapshot-controller:v6.3.2-5.cve |
Artifact |
Component |
Path |
|---|---|---|
Helm charts Updated |
cinder-csi-plugin |
https://binary.mirantis.com/core/helm/cinder-csi-plugin-1.40.23.tgz |
client-certificate-controller |
https://binary.mirantis.com/core/helm/client-certificate-controller-1.40.23.tgz |
|
local-volume-provisioner |
https://binary.mirantis.com/core/helm/local-volume-provisioner-1.40.23.tgz |
|
metrics-server |
https://binary.mirantis.com/core/helm/metrics-server-1.40.23.tgz |
|
openstack-cloud-controller-manager |
https://binary.mirantis.com/core/helm/openstack-cloud-controller-manager-1.40.23.tgz |
|
policy-controller |
https://binary.mirantis.com/core/helm/policy-controller-1.40.23.tgz |
|
Docker images |
cinder-csi-plugin |
mirantis.azurecr.io/lcm/kubernetes/cinder-csi-plugin:v1.27.2-18 |
client-certificate-controller Updated |
mirantis.azurecr.io/core/client-certificate-controller:1.40.23 |
|
csi-attacher Updated |
mirantis.azurecr.io/lcm/k8scsi/csi-attacher:v4.2.0-6 |
|
csi-node-driver-registrar Updated |
mirantis.azurecr.io/lcm/k8scsi/csi-node-driver-registrar:v2.7.0-6 |
|
csi-provisioner Updated |
mirantis.azurecr.io/lcm/k8scsi/csi-provisioner:v3.4.1-6 |
|
csi-resizer Updated |
mirantis.azurecr.io/lcm/k8scsi/csi-resizer:v1.7.0-6 |
|
csi-snapshotter Updated |
mirantis.azurecr.io/lcm/k8scsi/csi-snapshotter:v6.2.1-mcc-5 |
|
livenessprobe Updated |
mirantis.azurecr.io/lcm/k8scsi/livenessprobe:v2.9.0-6 |
|
metrics-server Updated |
mirantis.azurecr.io/lcm/metrics-server-amd64:v0.6.3-8 |
|
openstack-cloud-controller-manager Updated |
mirantis.azurecr.io/lcm/kubernetes/openstack-cloud-controller-manager:v1.27.2-18 |
|
policy-controller Updated |
mirantis.azurecr.io/core/policy-controller:1.40.23 |
Artifact |
Component |
Path |
|---|---|---|
Binaries |
lcm-ansible |
https://binary.mirantis.com/lcm/bin/lcm-ansible/v0.25.0-42-g8710cbe/lcm-ansible.tar.gz |
lcm-agent Updated |
||
Helm charts Updated |
helm-controller |
https://binary.mirantis.com/core/helm/helm-controller-1.40.23.tgz |
managed-lcm-api |
https://binary.mirantis.com/core/helm/managed-lcm-api-1.40.23.tgz |
|
Docker images Updated |
helm-controller |
mirantis.azurecr.io/core/lcm-controller:1.40.23 |
Artifact |
Component |
Path |
|---|---|---|
Helm charts |
alerta |
https://binary.mirantis.com/stacklight/helm/alerta-0.1.0-mcp-33.tgz |
alertmanager-webhook-servicenow |
https://binary.mirantis.com/stacklight/helm/alertmanager-webhook-servicenow-0.2.0-mcp-8.tgz |
|
cadvisor |
https://binary.mirantis.com/stacklight/helm/cadvisor-0.1.0-mcp-7.tgz |
|
elasticsearch-curator |
https://binary.mirantis.com/stacklight/helm/elasticsearch-curator-1.5.0-mcp-15.tgz |
|
elasticsearch-exporter |
https://binary.mirantis.com/stacklight/helm/elasticsearch-exporter-1.2.0-mcp-10.tgz |
|
fluentd-logs |
https://binary.mirantis.com/stacklight/helm/fluentd-logs-0.1.0-mcp-238.tgz |
|
grafana |
https://binary.mirantis.com/stacklight/helm/grafana-3.3.10-mcp-300.tgz |
|
iam-proxy |
||
metric-collector |
https://binary.mirantis.com/stacklight/helm/metric-collector-0.3.0-mcp-17.tgz |
|
metricbeat |
https://binary.mirantis.com/stacklight/helm/metricbeat-1.7.1-mcp-25.tgz |
|
opensearch |
https://binary.mirantis.com/stacklight/helm/opensearch-0.1.0-mcp-88.tgz |
|
opensearch-dashboards |
https://binary.mirantis.com/stacklight/helm/opensearch-dashboards-0.1.0-mcp-54.tgz |
|
patroni |
https://binary.mirantis.com/stacklight/helm/patroni-0.15.1-mcp-59.tgz |
|
prometheus |
https://binary.mirantis.com/stacklight/helm/prometheus-8.11.4-mcp-258.tgz |
|
prometheus-blackbox-exporter |
https://binary.mirantis.com/stacklight/helm/prometheus-blackbox-exporter-0.3.0-mcp-19.tgz |
|
prometheus-es-exporter |
https://binary.mirantis.com/stacklight/helm/prometheus-es-exporter-1.0.0-mcp-18.tgz |
|
prometheus-msteams |
https://binary.mirantis.com/stacklight/helm/prometheus-msteams-0.1.0-mcp-12.tgz |
|
refapp |
https://binary.mirantis.com/scale/helm/refapp-0.2.1-mcp-16.tgz |
|
sf-notifier |
https://binary.mirantis.com/stacklight/helm/sf-notifier-0.2.0-mcp-10.tgz |
|
sf-reporter |
https://binary.mirantis.com/stacklight/helm/sf-reporter-0.2.0-mcp-10.tgz |
|
stacklight Updated |
https://binary.mirantis.com/stacklight/helm/stacklight-0.15.9.tgz |
|
telegraf-ds |
https://binary.mirantis.com/stacklight/helm/telegraf-ds-1.1.5-mcp-42.tgz |
|
telegraf-s |
https://binary.mirantis.com/stacklight/helm/telegraf-s-1.1.5-mcp-42.tgz |
|
telemeter-client |
https://binary.mirantis.com/stacklight/helm/telemeter-client-0.2.0-mcp-14.tgz |
|
telemeter-server |
https://binary.mirantis.com/stacklight/helm/telemeter-server-0.2.0-mcp-14.tgz |
|
Docker images |
alerta-web Updated |
mirantis.azurecr.io/stacklight/alerta-web:9-20240821023009 |
alertmanager Updated |
mirantis.azurecr.io/stacklight/alertmanager:v0-20240821023016 |
|
alertmanager-webhook-servicenow |
mirantis.azurecr.io/stacklight/alertmanager-webhook-servicenow:v0.1-20240318145925 |
|
alpine-utils Updated |
mirantis.azurecr.io/stacklight/alpine-utils:1-20240821023017 |
|
blackbox-exporter |
mirantis.azurecr.io/stacklight/blackbox-exporter:0-20240408080237 |
|
cadvisor Updated |
mirantis.azurecr.io/stacklight/cadvisor:v0.47-20240821023015 |
|
configmap-reload |
mirantis.azurecr.io/stacklight/configmap-reload:v0.8.0 |
|
curator |
mirantis.azurecr.io/stacklight/curator:5.7.6-20230404082402 |
|
elasticsearch-exporter |
mirantis.azurecr.io/stacklight/elasticsearch-exporter:v1.5.0 |
|
fluentd Updated |
mirantis.azurecr.io/stacklight/fluentd:1.15-20240821023009 |
|
grafana |
mirantis.azurecr.io/stacklight/grafana:10.3.1 |
|
k8s-sidecar Updated |
mirantis.azurecr.io/stacklight/k8s-sidecar:1-20240821023018 |
|
kube-state-metrics |
mirantis.azurecr.io/stacklight/kube-state-metrics:v2.10.1 |
|
kubectl Updated |
mirantis.azurecr.io/stacklight/kubectl:1.27-20240821023018 |
|
metric-collector Updated |
mirantis.azurecr.io/stacklight/metric-collector:v0.1-20240821023015 |
|
metricbeat |
mirantis.azurecr.io/stacklight/metricbeat:7.12.1-20240626023010 |
|
node-exporter |
mirantis.azurecr.io/stacklight/node-exporter:v1.7.0 |
|
oauth2-proxy Updated |
mirantis.azurecr.io/iam/oauth2-proxy:v7.1.3-10 |
|
opensearch Updated |
mirantis.azurecr.io/stacklight/opensearch:2-20240821023015 |
|
opensearch-dashboards Updated |
mirantis.azurecr.io/stacklight/opensearch-dashboards:2-20240821023010 |
|
openstack-refapp |
mirantis.azurecr.io/openstack/openstack-refapp:0.1.8 |
|
pgbouncer Updated |
mirantis.azurecr.io/stacklight/pgbouncer:1-20240821023018 |
|
prometheus |
mirantis.azurecr.io/stacklight/prometheus:v2.48.0 |
|
prometheus-es-exporter Updated |
mirantis.azurecr.io/stacklight/prometheus-es-exporter:v0.14.0-20240821023016 |
|
prometheus-msteams |
mirantis.azurecr.io/stacklight/prometheus-msteams:v1.5-20240408080322 |
|
prometheus-patroni-exporter Updated |
mirantis.azurecr.io/stacklight/prometheus-patroni-exporter:0.0.1-20240821023016 |
|
prometheus-postgres-exporter |
mirantis.azurecr.io/stacklight/prometheus-postgres-exporter:v0.15.0 |
|
prometheus-relay Updated |
mirantis.azurecr.io/stacklight/prometheus-relay:v0.4-20240821023015 |
|
psql-client |
mirantis.azurecr.io/scale/psql-client:v13-20240701095027 |
|
sf-notifier Updated |
mirantis.azurecr.io/stacklight/sf-notifier:v0.4-20240821023015 |
|
sf-reporter |
mirantis.azurecr.io/stacklight/sf-reporter:v0.1-20240318145903 |
|
spilo Updated |
mirantis.azurecr.io/stacklight/spilo:13-2.1p9-20240822083023 |
|
telegraf |
mirantis.azurecr.io/stacklight/telegraf:v1.9.1-20240821023009 Updated |
|
mirantis.azurecr.io/stacklight/telegraf:1-20240426131156 |
||
telemeter Updated |
mirantis.azurecr.io/stacklight/telemeter:4.4-20240821023015 |
|
telemeter-token-auth Updated |
mirantis.azurecr.io/stacklight/telemeter-token-auth:v0.1-20240821023021 |
Artifact |
Component |
Path |
|---|---|---|
Configuration management |
Ansible |
|
Debian repositories |
System packages |
|
https://mirror.mirantis.com/kaas/ubuntu-2024-08-21-014714/ Updated |
||
https://mirror.mirantis.com/kaas/ubuntu-2024-08-21-014714.target.txt Updated |
||
MCR repositories |
MCR |
https://repos.mirantis.com/ubuntu/dists/jammy/pool/stable-23.0/ |
Target ubuntu system |
Ubuntu |
https://binary.mirantis.com/bm/bin/efi/ubuntu/tgz-jammy-20240821124534 Updated |
This section includes release notes for the patch Cluster release 16.2.3 that is introduced in the Container Cloud patch release 2.27.3 and is based on the previous Cluster releases of the 16.2.x series series.
This Cluster release supports Mirantis Kubernetes Engine 3.7.12 with Kubernetes 1.27 and Mirantis Container Runtime 23.0.11.
For the list of CVE fixes delivered with this patch Cluster release, see 2.27.3
For details on patch release delivery, see Patch releases
This section lists the artifacts of components included in the Cluster release 16.2.3.
Note
The components that are newly added, updated, deprecated, or removed
as compared to the previous release version, are marked
with a corresponding superscript,
for example, lcm-ansible Updated.
Artifact |
Component |
Path |
|---|---|---|
Helm chart Updated |
ceph-controller |
https://binary.mirantis.com/ceph/helm/ceph-operator-1.0.0-mcc-2.27.3-8.tgz |
Docker images Updated |
ceph |
mirantis.azurecr.io/mirantis/ceph:v18.2.4-3.cve |
ceph-controller |
mirantis.azurecr.io/ceph/mcp/ceph-controller:2.27.3-7 |
|
cephcsi |
mirantis.azurecr.io/mirantis/cephcsi:v3.9.0-17.release |
|
cephcsi-registrar |
mirantis.azurecr.io/mirantis/cephcsi-registrar:v2.9.2-5.release |
|
cephcsi-provisioner |
mirantis.azurecr.io/mirantis/cephcsi-provisioner:v3.6.2-5.release |
|
cephcsi-snapshotter |
mirantis.azurecr.io/mirantis/cephcsi-snapshotter:v6.3.2-5.release |
|
cephcsi-attacher |
mirantis.azurecr.io/mirantis/cephcsi-attacher:v4.4.2-5.release |
|
cephcsi-resizer |
mirantis.azurecr.io/mirantis/cephcsi-resizer:v1.9.2-5.release |
|
rook |
mirantis.azurecr.io/ceph/rook:v1.13.5-18 |
|
snapshot-controller |
mirantis.azurecr.io/mirantis/snapshot-controller:v6.3.2-5.cve |
Artifact |
Component |
Path |
|---|---|---|
Helm charts Updated |
cinder-csi-plugin |
https://binary.mirantis.com/core/helm/cinder-csi-plugin-1.40.21.tgz |
client-certificate-controller |
https://binary.mirantis.com/core/helm/client-certificate-controller-1.40.21.tgz |
|
local-volume-provisioner |
https://binary.mirantis.com/core/helm/local-volume-provisioner-1.40.21.tgz |
|
metrics-server |
https://binary.mirantis.com/core/helm/metrics-server-1.40.21.tgz |
|
openstack-cloud-controller-manager |
https://binary.mirantis.com/core/helm/openstack-cloud-controller-manager-1.40.21.tgz |
|
policy-controller |
https://binary.mirantis.com/core/helm/policy-controller-1.40.21.tgz |
|
vsphere-cloud-controller-manager Removed |
n/a |
|
vsphere-csi-plugin Removed |
n/a |
|
Docker images |
cinder-csi-plugin Updated |
mirantis.azurecr.io/lcm/kubernetes/cinder-csi-plugin:v1.27.2-18 |
client-certificate-controller Updated |
mirantis.azurecr.io/core/client-certificate-controller:1.40.21 |
|
csi-attacher |
mirantis.azurecr.io/lcm/k8scsi/csi-attacher:v4.2.0-5 |
|
csi-node-driver-registrar |
mirantis.azurecr.io/lcm/k8scsi/csi-node-driver-registrar:v2.7.0-5 |
|
csi-provisioner |
mirantis.azurecr.io/lcm/k8scsi/csi-provisioner:v3.4.1-5 |
|
csi-resizer |
mirantis.azurecr.io/lcm/k8scsi/csi-resizer:v1.7.0-5 |
|
csi-snapshotter |
mirantis.azurecr.io/lcm/k8scsi/csi-snapshotter:v6.2.1-mcc-4 |
|
livenessprobe |
mirantis.azurecr.io/lcm/k8scsi/livenessprobe:v2.9.0-5 |
|
metrics-server |
mirantis.azurecr.io/lcm/metrics-server-amd64:v0.6.3-7 |
|
openstack-cloud-controller-manager Updated |
mirantis.azurecr.io/lcm/kubernetes/openstack-cloud-controller-manager:v1.27.2-18 |
|
policy-controller Updated |
mirantis.azurecr.io/core/policy-controller:1.40.21 |
|
vsphere-cloud-controller-manager Removed |
n/a |
|
vsphere-csi-driver Removed |
n/a |
|
vsphere-csi-syncer Removed |
n/a |
Artifact |
Component |
Path |
|---|---|---|
Binaries Updated |
lcm-ansible |
https://binary.mirantis.com/lcm/bin/lcm-ansible/v0.25.0-42-g8710cbe/lcm-ansible.tar.gz |
lcm-agent |
||
Helm charts Updated |
helm-controller |
https://binary.mirantis.com/core/helm/helm-controller-1.40.21.tgz |
managed-lcm-api |
https://binary.mirantis.com/core/helm/managed-lcm-api-1.40.21.tgz |
|
Docker images Updated |
helm-controller |
mirantis.azurecr.io/core/lcm-controller:1.40.21 |
Artifact |
Component |
Path |
|---|---|---|
Helm charts |
alerta |
https://binary.mirantis.com/stacklight/helm/alerta-0.1.0-mcp-33.tgz |
alertmanager-webhook-servicenow |
https://binary.mirantis.com/stacklight/helm/alertmanager-webhook-servicenow-0.2.0-mcp-8.tgz |
|
cadvisor |
https://binary.mirantis.com/stacklight/helm/cadvisor-0.1.0-mcp-7.tgz |
|
elasticsearch-curator |
https://binary.mirantis.com/stacklight/helm/elasticsearch-curator-1.5.0-mcp-15.tgz |
|
elasticsearch-exporter |
https://binary.mirantis.com/stacklight/helm/elasticsearch-exporter-1.2.0-mcp-10.tgz |
|
fluentd-logs |
https://binary.mirantis.com/stacklight/helm/fluentd-logs-0.1.0-mcp-238.tgz |
|
grafana |
https://binary.mirantis.com/stacklight/helm/grafana-3.3.10-mcp-300.tgz |
|
iam-proxy |
||
metric-collector |
https://binary.mirantis.com/stacklight/helm/metric-collector-0.3.0-mcp-17.tgz |
|
metricbeat |
https://binary.mirantis.com/stacklight/helm/metricbeat-1.7.1-mcp-25.tgz |
|
opensearch |
https://binary.mirantis.com/stacklight/helm/opensearch-0.1.0-mcp-88.tgz |
|
opensearch-dashboards |
https://binary.mirantis.com/stacklight/helm/opensearch-dashboards-0.1.0-mcp-54.tgz |
|
patroni |
https://binary.mirantis.com/stacklight/helm/patroni-0.15.1-mcp-59.tgz |
|
prometheus |
https://binary.mirantis.com/stacklight/helm/prometheus-8.11.4-mcp-258.tgz |
|
prometheus-blackbox-exporter |
https://binary.mirantis.com/stacklight/helm/prometheus-blackbox-exporter-0.3.0-mcp-19.tgz |
|
prometheus-es-exporter |
https://binary.mirantis.com/stacklight/helm/prometheus-es-exporter-1.0.0-mcp-18.tgz |
|
prometheus-msteams |
https://binary.mirantis.com/stacklight/helm/prometheus-msteams-0.1.0-mcp-12.tgz |
|
refapp |
https://binary.mirantis.com/scale/helm/refapp-0.2.1-mcp-16.tgz |
|
sf-notifier |
https://binary.mirantis.com/stacklight/helm/sf-notifier-0.2.0-mcp-10.tgz |
|
sf-reporter |
https://binary.mirantis.com/stacklight/helm/sf-reporter-0.2.0-mcp-10.tgz |
|
stacklight Updated |
https://binary.mirantis.com/stacklight/helm/stacklight-0.15.8.tgz |
|
telegraf-ds |
https://binary.mirantis.com/stacklight/helm/telegraf-ds-1.1.5-mcp-42.tgz |
|
telegraf-s |
https://binary.mirantis.com/stacklight/helm/telegraf-s-1.1.5-mcp-42.tgz |
|
telemeter-client |
https://binary.mirantis.com/stacklight/helm/telemeter-client-0.2.0-mcp-14.tgz |
|
telemeter-server |
https://binary.mirantis.com/stacklight/helm/telemeter-server-0.2.0-mcp-14.tgz |
|
Docker images |
alerta-web Updated |
mirantis.azurecr.io/stacklight/alerta-web:9-20240807023009 |
alertmanager Updated |
mirantis.azurecr.io/stacklight/alertmanager:v0-20240807023013 |
|
alertmanager-webhook-servicenow |
mirantis.azurecr.io/stacklight/alertmanager-webhook-servicenow:v0.1-20240318145925 |
|
alpine-utils Updated |
mirantis.azurecr.io/stacklight/alpine-utils:1-20240807023018 |
|
blackbox-exporter |
mirantis.azurecr.io/stacklight/blackbox-exporter:0-20240408080237 |
|
cadvisor Updated |
mirantis.azurecr.io/stacklight/cadvisor:v0.47-20240807023010 |
|
configmap-reload |
mirantis.azurecr.io/stacklight/configmap-reload:v0.8.0 |
|
curator |
mirantis.azurecr.io/stacklight/curator:5.7.6-20230404082402 |
|
elasticsearch-exporter |
mirantis.azurecr.io/stacklight/elasticsearch-exporter:v1.5.0 |
|
fluentd Updated |
mirantis.azurecr.io/stacklight/fluentd:1.15-20240807023010 |
|
grafana |
mirantis.azurecr.io/stacklight/grafana:10.3.1 |
|
k8s-sidecar Updated |
mirantis.azurecr.io/stacklight/k8s-sidecar:1-20240807023017 |
|
kube-state-metrics |
mirantis.azurecr.io/stacklight/kube-state-metrics:v2.10.1 |
|
kubectl Updated |
mirantis.azurecr.io/stacklight/kubectl:1.27-20240812134116 |
|
metric-collector Updated |
mirantis.azurecr.io/stacklight/metric-collector:v0.1-20240807023014 |
|
metricbeat |
mirantis.azurecr.io/stacklight/metricbeat:7.12.1-20240626023010 |
|
node-exporter |
mirantis.azurecr.io/stacklight/node-exporter:v1.7.0 |
|
oauth2-proxy |
mirantis.azurecr.io/iam/oauth2-proxy:v7.1.3-9 |
|
opensearch Updated |
mirantis.azurecr.io/stacklight/opensearch:2-20240807023012 |
|
opensearch-dashboards Updated |
mirantis.azurecr.io/stacklight/opensearch-dashboards:2-20240807023009 |
|
openstack-refapp |
mirantis.azurecr.io/openstack/openstack-refapp:0.1.8 |
|
pgbouncer Updated |
mirantis.azurecr.io/stacklight/pgbouncer:1-20240807023019 |
|
prometheus |
mirantis.azurecr.io/stacklight/prometheus:v2.48.0 |
|
prometheus-es-exporter Updated |
mirantis.azurecr.io/stacklight/prometheus-es-exporter:v0.14.0-20240807023016 |
|
prometheus-msteams |
mirantis.azurecr.io/stacklight/prometheus-msteams:v1.5-20240408080322 |
|
prometheus-patroni-exporter Updated |
mirantis.azurecr.io/stacklight/prometheus-patroni-exporter:0.0.1-20240807023017 |
|
prometheus-postgres-exporter |
mirantis.azurecr.io/stacklight/prometheus-postgres-exporter:v0.15.0 |
|
prometheus-relay Updated |
mirantis.azurecr.io/stacklight/prometheus-relay:v0.4-20240807023018 |
|
psql-client |
mirantis.azurecr.io/scale/psql-client:v13-20240701095027 |
|
sf-notifier Updated |
mirantis.azurecr.io/stacklight/sf-notifier:v0.4-20240807023014 |
|
sf-reporter |
mirantis.azurecr.io/stacklight/sf-reporter:v0.1-20240318145903 |
|
spilo Updated |
mirantis.azurecr.io/stacklight/spilo:13-2.1p9-20240807023011 |
|
stacklight-toolkit Removed |
n/a |
|
telegraf |
mirantis.azurecr.io/stacklight/telegraf:v1.9.1-20240605023010 |
|
mirantis.azurecr.io/stacklight/telegraf:1-20240426131156 |
||
telemeter Updated |
mirantis.azurecr.io/stacklight/telemeter:4.4-20240812121935 |
|
telemeter-token-auth Updated |
mirantis.azurecr.io/stacklight/telemeter-token-auth:v0.1-20240807023014 |
Artifact |
Component |
Path |
|---|---|---|
Configuration management |
Ansible |
|
Debian repositories |
System packages |
|
https://mirror.mirantis.com/kaas/ubuntu-2024-08-06-014502/ Updated |
||
https://mirror.mirantis.com/kaas/ubuntu-2024-08-06-014502.target.txt Updated |
||
MCR repositories |
MCR |
https://repos.mirantis.com/ubuntu/dists/jammy/pool/stable-23.0/ |
Target ubuntu system |
Ubuntu |
https://binary.mirantis.com/bm/bin/efi/ubuntu/tgz-jammy-20240806090151 Updated |
This section includes release notes for the patch Cluster release 16.2.2 that is introduced in the Container Cloud patch release 2.27.2 and is based on the previous Cluster releases of the 16.2.x series series.
This Cluster release supports Mirantis Kubernetes Engine 3.7.11 with Kubernetes 1.27 and Mirantis Container Runtime 23.0.11.
For the list of CVE fixes delivered with this patch Cluster release, see 2.27.2
For details on patch release delivery, see Patch releases
This section lists the artifacts of components included in the Cluster release 16.2.2.
Note
The components that are newly added, updated, deprecated, or removed
as compared to the previous release version, are marked
with a corresponding superscript,
for example, lcm-ansible Updated.
Artifact |
Component |
Path |
|---|---|---|
Helm chart |
ceph-controller |
https://binary.mirantis.com/ceph/helm/ceph-operator-1.0.0-mcc-2.27.0-13.tgz |
Docker images |
ceph |
mirantis.azurecr.io/mirantis/ceph:v18.2.3-2.cve |
ceph-controller |
mirantis.azurecr.io/ceph/mcp/ceph-controller:2.27.0-12 |
|
cephcsi |
mirantis.azurecr.io/mirantis/cephcsi:v3.9.0-14.cve |
|
cephcsi-registrar |
mirantis.azurecr.io/mirantis/cephcsi-registrar:v2.9.2-4.release |
|
cephcsi-provisioner |
mirantis.azurecr.io/mirantis/cephcsi-provisioner:v3.6.2-4.release |
|
cephcsi-snapshotter |
mirantis.azurecr.io/mirantis/cephcsi-snapshotter:v6.3.2-4.release |
|
cephcsi-attacher |
mirantis.azurecr.io/mirantis/cephcsi-attacher:v4.4.2-4.release |
|
cephcsi-resizer |
mirantis.azurecr.io/mirantis/cephcsi-resizer:v1.9.2-4.release |
|
rook |
mirantis.azurecr.io/ceph/rook:v1.13.5-16 |
|
snapshot-controller |
mirantis.azurecr.io/mirantis/snapshot-controller:v6.3.2-4.release |
Artifact |
Component |
Path |
|---|---|---|
Helm charts Updated |
cinder-csi-plugin |
https://binary.mirantis.com/core/helm/cinder-csi-plugin-1.40.18.tgz |
client-certificate-controller |
https://binary.mirantis.com/core/helm/client-certificate-controller-1.40.18.tgz |
|
local-volume-provisioner |
https://binary.mirantis.com/core/helm/local-volume-provisioner-1.40.18.tgz |
|
metrics-server |
https://binary.mirantis.com/core/helm/metrics-server-1.40.18.tgz |
|
openstack-cloud-controller-manager |
https://binary.mirantis.com/core/helm/openstack-cloud-controller-manager-1.40.18.tgz |
|
policy-controller |
https://binary.mirantis.com/core/helm/policy-controller-1.40.18.tgz |
|
vsphere-cloud-controller-manager |
https://binary.mirantis.com/core/helm/vsphere-cloud-controller-manager-1.40.18.tgz |
|
vsphere-csi-plugin |
https://binary.mirantis.com/core/helm/vsphere-csi-plugin-1.40.18.tgz |
|
Docker images |
cinder-csi-plugin Updated |
mirantis.azurecr.io/lcm/kubernetes/cinder-csi-plugin:v1.27.2-17 |
client-certificate-controller Updated |
mirantis.azurecr.io/core/client-certificate-controller:1.40.18 |
|
csi-attacher |
mirantis.azurecr.io/lcm/k8scsi/csi-attacher:v4.2.0-5 |
|
csi-node-driver-registrar |
mirantis.azurecr.io/lcm/k8scsi/csi-node-driver-registrar:v2.7.0-5 |
|
csi-provisioner |
mirantis.azurecr.io/lcm/k8scsi/csi-provisioner:v3.4.1-5 |
|
csi-resizer |
mirantis.azurecr.io/lcm/k8scsi/csi-resizer:v1.7.0-5 |
|
csi-snapshotter |
mirantis.azurecr.io/lcm/k8scsi/csi-snapshotter:v6.2.1-mcc-4 |
|
livenessprobe |
mirantis.azurecr.io/lcm/k8scsi/livenessprobe:v2.9.0-5 |
|
metrics-server |
mirantis.azurecr.io/lcm/metrics-server-amd64:v0.6.3-7 |
|
openstack-cloud-controller-manager Updated |
mirantis.azurecr.io/lcm/kubernetes/openstack-cloud-controller-manager:v1.27.2-17 |
|
policy-controller Updated |
mirantis.azurecr.io/core/policy-controller:1.40.18 |
|
vsphere-cloud-controller-manager |
mirantis.azurecr.io/lcm/kubernetes/vsphere-cloud-controller-manager:v1.27.0-6 |
|
vsphere-csi-driver |
mirantis.azurecr.io/lcm/kubernetes/vsphere-csi-driver:v3.0.2-1 |
|
vsphere-csi-syncer |
mirantis.azurecr.io/lcm/kubernetes/vsphere-csi-syncer:v3.0.2-1 |
Artifact |
Component |
Path |
|---|---|---|
Binaries Updated |
lcm-ansible |
https://binary.mirantis.com/lcm/bin/lcm-ansible/v0.25.0-40-g890ffca/lcm-ansible.tar.gz |
lcm-agent |
||
Helm charts Updated |
helm-controller |
https://binary.mirantis.com/core/helm/helm-controller-1.40.18.tgz |
managed-lcm-api |
https://binary.mirantis.com/core/helm/managed-lcm-api-1.40.18.tgz |
|
Docker images Updated |
helm-controller |
mirantis.azurecr.io/core/lcm-controller:1.40.18 |
Artifact |
Component |
Path |
|---|---|---|
Helm charts |
alerta |
https://binary.mirantis.com/stacklight/helm/alerta-0.1.0-mcp-33.tgz |
alertmanager-webhook-servicenow |
https://binary.mirantis.com/stacklight/helm/alertmanager-webhook-servicenow-0.2.0-mcp-8.tgz |
|
cadvisor |
https://binary.mirantis.com/stacklight/helm/cadvisor-0.1.0-mcp-7.tgz |
|
elasticsearch-curator |
https://binary.mirantis.com/stacklight/helm/elasticsearch-curator-1.5.0-mcp-15.tgz |
|
elasticsearch-exporter |
https://binary.mirantis.com/stacklight/helm/elasticsearch-exporter-1.2.0-mcp-10.tgz |
|
fluentd-logs |
https://binary.mirantis.com/stacklight/helm/fluentd-logs-0.1.0-mcp-238.tgz |
|
grafana |
https://binary.mirantis.com/stacklight/helm/grafana-3.3.10-mcp-300.tgz |
|
iam-proxy |
||
metric-collector |
https://binary.mirantis.com/stacklight/helm/metric-collector-0.3.0-mcp-17.tgz |
|
metricbeat |
https://binary.mirantis.com/stacklight/helm/metricbeat-1.7.1-mcp-25.tgz |
|
opensearch |
https://binary.mirantis.com/stacklight/helm/opensearch-0.1.0-mcp-88.tgz |
|
opensearch-dashboards |
https://binary.mirantis.com/stacklight/helm/opensearch-dashboards-0.1.0-mcp-54.tgz |
|
patroni |
https://binary.mirantis.com/stacklight/helm/patroni-0.15.1-mcp-59.tgz |
|
prometheus |
https://binary.mirantis.com/stacklight/helm/prometheus-8.11.4-mcp-258.tgz |
|
prometheus-blackbox-exporter |
https://binary.mirantis.com/stacklight/helm/prometheus-blackbox-exporter-0.3.0-mcp-19.tgz |
|
prometheus-es-exporter |
https://binary.mirantis.com/stacklight/helm/prometheus-es-exporter-1.0.0-mcp-18.tgz |
|
prometheus-msteams |
https://binary.mirantis.com/stacklight/helm/prometheus-msteams-0.1.0-mcp-12.tgz |
|
refapp |
https://binary.mirantis.com/scale/helm/refapp-0.2.1-mcp-16.tgz |
|
sf-notifier |
https://binary.mirantis.com/stacklight/helm/sf-notifier-0.2.0-mcp-10.tgz |
|
sf-reporter |
https://binary.mirantis.com/stacklight/helm/sf-reporter-0.2.0-mcp-10.tgz |
|
stacklight Updated |
https://binary.mirantis.com/stacklight/helm/stacklight-0.15.6.tgz |
|
telegraf-ds |
https://binary.mirantis.com/stacklight/helm/telegraf-ds-1.1.5-mcp-42.tgz |
|
telegraf-s |
https://binary.mirantis.com/stacklight/helm/telegraf-s-1.1.5-mcp-42.tgz |
|
telemeter-client |
https://binary.mirantis.com/stacklight/helm/telemeter-client-0.2.0-mcp-14.tgz |
|
telemeter-server |
https://binary.mirantis.com/stacklight/helm/telemeter-server-0.2.0-mcp-14.tgz |
|
Docker images |
alerta-web Updated |
mirantis.azurecr.io/stacklight/alerta-web:9-20240710023009 |
alertmanager Updated |
mirantis.azurecr.io/stacklight/alertmanager:v0-20240710023018 |
|
alertmanager-webhook-servicenow |
mirantis.azurecr.io/stacklight/alertmanager-webhook-servicenow:v0.1-20240318145925 |
|
alpine-utils Updated |
mirantis.azurecr.io/stacklight/alpine-utils:1-20240710023020 |
|
blackbox-exporter |
mirantis.azurecr.io/stacklight/blackbox-exporter:0-20240408080237 |
|
cadvisor Updated |
mirantis.azurecr.io/stacklight/cadvisor:v0.47-20240710023011 |
|
configmap-reload |
mirantis.azurecr.io/stacklight/configmap-reload:v0.8.0 |
|
curator |
mirantis.azurecr.io/stacklight/curator:5.7.6-20230404082402 |
|
elasticsearch-exporter |
mirantis.azurecr.io/stacklight/elasticsearch-exporter:v1.5.0 |
|
fluentd Updated |
mirantis.azurecr.io/stacklight/fluentd:1.15-20240710023010 |
|
grafana |
mirantis.azurecr.io/stacklight/grafana:10.3.1 |
|
k8s-sidecar Updated |
mirantis.azurecr.io/stacklight/k8s-sidecar:1-20240710023020 |
|
kube-state-metrics |
mirantis.azurecr.io/stacklight/kube-state-metrics:v2.10.1 |
|
kubectl Updated |
mirantis.azurecr.io/stacklight/kubectl:1.22-20240710023014 |
|
metric-collector Updated |
mirantis.azurecr.io/stacklight/metric-collector:v0.1-20240710023014 |
|
metricbeat |
mirantis.azurecr.io/stacklight/metricbeat:7.12.1-20240626023010 |
|
node-exporter |
mirantis.azurecr.io/stacklight/node-exporter:v1.7.0 |
|
oauth2-proxy Updated |
mirantis.azurecr.io/iam/oauth2-proxy:v7.1.3-9 |
|
opensearch Updated |
mirantis.azurecr.io/stacklight/opensearch:2-20240710023013 |
|
opensearch-dashboards Updated |
mirantis.azurecr.io/stacklight/opensearch-dashboards:2-20240710023010 |
|
openstack-refapp Updated |
mirantis.azurecr.io/openstack/openstack-refapp:0.1.8 |
|
pgbouncer Updated |
mirantis.azurecr.io/stacklight/pgbouncer:1-20240710023020 |
|
prometheus |
mirantis.azurecr.io/stacklight/prometheus:v2.48.0 |
|
prometheus-es-exporter Updated |
mirantis.azurecr.io/stacklight/prometheus-es-exporter:v0.14.0-20240710023017 |
|
prometheus-msteams |
mirantis.azurecr.io/stacklight/prometheus-msteams:v1.5-20240408080322 |
|
prometheus-patroni-exporter Updated |
mirantis.azurecr.io/stacklight/prometheus-patroni-exporter:0.0.1-20240710023019 |
|
prometheus-postgres-exporter |
mirantis.azurecr.io/stacklight/prometheus-postgres-exporter:v0.15.0 |
|
prometheus-relay Updated |
mirantis.azurecr.io/stacklight/prometheus-relay:v0.4-20240710023019 |
|
psql-client Updated |
mirantis.azurecr.io/scale/psql-client:v13-20240701095027 |
|
sf-notifier Updated |
mirantis.azurecr.io/stacklight/sf-notifier:v0.4-20240710023015 |
|
sf-reporter |
mirantis.azurecr.io/stacklight/sf-reporter:v0.1-20240318145903 |
|
spilo Updated |
mirantis.azurecr.io/stacklight/spilo:13-2.1p9-20240710023011 |
|
stacklight-toolkit Updated |
mirantis.azurecr.io/stacklight/stacklight-toolkit:20240710023015 |
|
telegraf |
mirantis.azurecr.io/stacklight/telegraf:v1.9.1-20240605023010 |
|
mirantis.azurecr.io/stacklight/telegraf:1-20240426131156 |
||
telemeter Updated |
mirantis.azurecr.io/stacklight/telemeter:4.4-20240710023015 |
|
telemeter-token-auth Updated |
mirantis.azurecr.io/stacklight/telemeter-token-auth:v0.1-20240710023019 |
Artifact |
Component |
Path |
|---|---|---|
Configuration management |
Ansible |
|
Debian repositories |
System packages |
|
http://mirror.mirantis.com/kaas/kubernetes-extra-rhel7-0.0.8/ |
||
https://mirror.mirantis.com/kaas/ubuntu-2024-07-16-014744/ Updated |
||
https://mirror.mirantis.com/kaas/ubuntu-2024-07-16-014744.target.txt Updated |
||
MCR repositories |
MCR |
https://repos.mirantis.com/ubuntu/dists/jammy/pool/stable-23.0/ |
Target ubuntu system |
Ubuntu |
https://binary.mirantis.com/bm/bin/efi/ubuntu/tgz-jammy-20240716073819 Updated |
This section includes release notes for the patch Cluster release 16.2.1 that is introduced in the Container Cloud patch release 2.27.1 and is based on the Cluster release 16.2.0.
This Cluster release supports Mirantis Kubernetes Engine 3.7.10
with Kubernetes 1.27 and Mirantis Container Runtime 23.0.11, in which
docker-ee-cli was updated to version 23.0.13 to fix several CVEs.
For the list of CVE fixes delivered with this patch Cluster release, see 2.27.1
For details on patch release delivery, see Patch releases
This section lists the artifacts of components included in the Cluster release 16.2.1.
Note
The components that are newly added, updated, deprecated, or removed
as compared to the previous release version, are marked
with a corresponding superscript,
for example, lcm-ansible Updated.
Artifact |
Component |
Path |
|---|---|---|
Helm chart Updated |
ceph-controller |
https://binary.mirantis.com/ceph/helm/ceph-operator-1.0.0-mcc-2.27.0-13.tgz |
Docker images |
ceph Updated |
mirantis.azurecr.io/mirantis/ceph:v18.2.3-2.cve |
ceph-controller Updated |
mirantis.azurecr.io/ceph/mcp/ceph-controller:2.27.0-12 |
|
cephcsi Updated |
mirantis.azurecr.io/mirantis/cephcsi:v3.9.0-14.cve |
|
cephcsi-registrar |
mirantis.azurecr.io/mirantis/cephcsi-registrar:v2.9.2-4.release |
|
cephcsi-provisioner |
mirantis.azurecr.io/mirantis/cephcsi-provisioner:v3.6.2-4.release |
|
cephcsi-snapshotter |
mirantis.azurecr.io/mirantis/cephcsi-snapshotter:v6.3.2-4.release |
|
cephcsi-attacher |
mirantis.azurecr.io/mirantis/cephcsi-attacher:v4.4.2-4.release |
|
cephcsi-resizer |
mirantis.azurecr.io/mirantis/cephcsi-resizer:v1.9.2-4.release |
|
rook Updated |
mirantis.azurecr.io/ceph/rook:v1.13.5-16 |
|
snapshot-controller |
mirantis.azurecr.io/mirantis/snapshot-controller:v6.3.2-4.release |
Artifact |
Component |
Path |
|---|---|---|
Helm charts Updated |
cinder-csi-plugin |
https://binary.mirantis.com/core/helm/cinder-csi-plugin-1.40.15.tgz |
client-certificate-controller |
https://binary.mirantis.com/core/helm/client-certificate-controller-1.40.15.tgz |
|
local-volume-provisioner |
https://binary.mirantis.com/core/helm/local-volume-provisioner-1.40.15.tgz |
|
metrics-server |
https://binary.mirantis.com/core/helm/metrics-server-1.40.15.tgz |
|
openstack-cloud-controller-manager |
https://binary.mirantis.com/core/helm/openstack-cloud-controller-manager-1.40.15.tgz |
|
policy-controller |
https://binary.mirantis.com/core/helm/policy-controller-1.40.15.tgz |
|
vsphere-cloud-controller-manager |
https://binary.mirantis.com/core/helm/vsphere-cloud-controller-manager-1.40.15.tgz |
|
vsphere-csi-plugin |
https://binary.mirantis.com/core/helm/vsphere-csi-plugin-1.40.15.tgz |
|
Docker images |
cinder-csi-plugin |
mirantis.azurecr.io/lcm/kubernetes/cinder-csi-plugin:v1.27.2-16 |
client-certificate-controller Updated |
mirantis.azurecr.io/core/client-certificate-controller:1.40.15 |
|
csi-attacher |
mirantis.azurecr.io/lcm/k8scsi/csi-attacher:v4.2.0-5 |
|
csi-node-driver-registrar |
mirantis.azurecr.io/lcm/k8scsi/csi-node-driver-registrar:v2.7.0-5 |
|
csi-provisioner |
mirantis.azurecr.io/lcm/k8scsi/csi-provisioner:v3.4.1-5 |
|
csi-resizer |
mirantis.azurecr.io/lcm/k8scsi/csi-resizer:v1.7.0-5 |
|
csi-snapshotter |
mirantis.azurecr.io/lcm/k8scsi/csi-snapshotter:v6.2.1-mcc-4 |
|
livenessprobe |
mirantis.azurecr.io/lcm/k8scsi/livenessprobe:v2.9.0-5 |
|
metrics-server |
mirantis.azurecr.io/lcm/metrics-server-amd64:v0.6.3-7 |
|
openstack-cloud-controller-manager |
mirantis.azurecr.io/lcm/kubernetes/openstack-cloud-controller-manager:v1.27.2-16 |
|
policy-controller Updated |
mirantis.azurecr.io/core/policy-controller:1.40.15 |
|
vsphere-cloud-controller-manager |
mirantis.azurecr.io/lcm/kubernetes/vsphere-cloud-controller-manager:v1.27.0-6 |
|
vsphere-csi-driver |
mirantis.azurecr.io/lcm/kubernetes/vsphere-csi-driver:v3.0.2-1 |
|
vsphere-csi-syncer |
mirantis.azurecr.io/lcm/kubernetes/vsphere-csi-syncer:v3.0.2-1 |
Artifact |
Component |
Path |
|---|---|---|
Binaries Updated |
lcm-ansible |
https://binary.mirantis.com/lcm/bin/lcm-ansible/v0.25.0-40-g890ffca/lcm-ansible.tar.gz |
lcm-agent |
||
Helm charts Updated |
helm-controller |
https://binary.mirantis.com/core/helm/helm-controller-1.40.15.tgz |
managed-lcm-api |
https://binary.mirantis.com/core/helm/managed-lcm-api-1.40.15.tgz |
|
Docker images Updated |
helm-controller |
mirantis.azurecr.io/core/lcm-controller:1.40.15 |
Artifact |
Component |
Path |
|---|---|---|
Helm charts |
alerta |
https://binary.mirantis.com/stacklight/helm/alerta-0.1.0-mcp-33.tgz |
alertmanager-webhook-servicenow |
https://binary.mirantis.com/stacklight/helm/alertmanager-webhook-servicenow-0.2.0-mcp-8.tgz |
|
cadvisor |
https://binary.mirantis.com/stacklight/helm/cadvisor-0.1.0-mcp-7.tgz |
|
elasticsearch-curator |
https://binary.mirantis.com/stacklight/helm/elasticsearch-curator-1.5.0-mcp-15.tgz |
|
elasticsearch-exporter |
https://binary.mirantis.com/stacklight/helm/elasticsearch-exporter-1.2.0-mcp-10.tgz |
|
fluentd-logs |
https://binary.mirantis.com/stacklight/helm/fluentd-logs-0.1.0-mcp-238.tgz |
|
grafana |
https://binary.mirantis.com/stacklight/helm/grafana-3.3.10-mcp-300.tgz |
|
iam-proxy |
||
metric-collector |
https://binary.mirantis.com/stacklight/helm/metric-collector-0.3.0-mcp-17.tgz |
|
metricbeat |
https://binary.mirantis.com/stacklight/helm/metricbeat-1.7.1-mcp-25.tgz |
|
opensearch Updated |
https://binary.mirantis.com/stacklight/helm/opensearch-0.1.0-mcp-88.tgz |
|
opensearch-dashboards |
https://binary.mirantis.com/stacklight/helm/opensearch-dashboards-0.1.0-mcp-54.tgz |
|
patroni |
https://binary.mirantis.com/stacklight/helm/patroni-0.15.1-mcp-59.tgz |
|
prometheus |
https://binary.mirantis.com/stacklight/helm/prometheus-8.11.4-mcp-258.tgz |
|
prometheus-blackbox-exporter |
https://binary.mirantis.com/stacklight/helm/prometheus-blackbox-exporter-0.3.0-mcp-19.tgz |
|
prometheus-es-exporter |
https://binary.mirantis.com/stacklight/helm/prometheus-es-exporter-1.0.0-mcp-18.tgz |
|
prometheus-msteams |
https://binary.mirantis.com/stacklight/helm/prometheus-msteams-0.1.0-mcp-12.tgz |
|
refapp |
https://binary.mirantis.com/scale/helm/refapp-0.2.1-mcp-16.tgz |
|
sf-notifier |
https://binary.mirantis.com/stacklight/helm/sf-notifier-0.2.0-mcp-10.tgz |
|
sf-reporter |
https://binary.mirantis.com/stacklight/helm/sf-reporter-0.2.0-mcp-10.tgz |
|
stacklight Updated |
https://binary.mirantis.com/stacklight/helm/stacklight-0.15.5.tgz |
|
telegraf-ds |
https://binary.mirantis.com/stacklight/helm/telegraf-ds-1.1.5-mcp-42.tgz |
|
telegraf-s |
https://binary.mirantis.com/stacklight/helm/telegraf-s-1.1.5-mcp-42.tgz |
|
telemeter-client |
https://binary.mirantis.com/stacklight/helm/telemeter-client-0.2.0-mcp-14.tgz |
|
telemeter-server |
https://binary.mirantis.com/stacklight/helm/telemeter-server-0.2.0-mcp-14.tgz |
|
Docker images |
alerta-web Updated |
mirantis.azurecr.io/stacklight/alerta-web:9-20240701140358 |
alertmanager Updated |
mirantis.azurecr.io/stacklight/alertmanager:v0-20240701140403 |
|
alertmanager-webhook-servicenow |
mirantis.azurecr.io/stacklight/alertmanager-webhook-servicenow:v0.1-20240318145925 |
|
alpine-utils Updated |
mirantis.azurecr.io/stacklight/alpine-utils:1-20240701140404 |
|
blackbox-exporter |
mirantis.azurecr.io/stacklight/blackbox-exporter:0-20240408080237 |
|
cadvisor Updated |
mirantis.azurecr.io/stacklight/cadvisor:v0.47-20240701140359 |
|
configmap-reload |
mirantis.azurecr.io/stacklight/configmap-reload:v0.8.0 |
|
curator |
mirantis.azurecr.io/stacklight/curator:5.7.6-20230404082402 |
|
elasticsearch-exporter |
mirantis.azurecr.io/stacklight/elasticsearch-exporter:v1.5.0 |
|
fluentd Updated |
mirantis.azurecr.io/stacklight/fluentd:1.15-20240701140357 |
|
grafana |
mirantis.azurecr.io/stacklight/grafana:10.3.1 |
|
k8s-sidecar Updated |
mirantis.azurecr.io/stacklight/k8s-sidecar:1-20240701140403 |
|
kube-state-metrics |
mirantis.azurecr.io/stacklight/kube-state-metrics:v2.10.1 |
|
kubectl Updated |
mirantis.azurecr.io/stacklight/kubectl:1.22-20240701140401 |
|
metric-collector Updated |
mirantis.azurecr.io/stacklight/metric-collector:v0.1-20240701140400 |
|
metricbeat Updated |
mirantis.azurecr.io/stacklight/metricbeat:7.12.1-20240626023010 |
|
node-exporter |
mirantis.azurecr.io/stacklight/node-exporter:v1.7.0 |
|
oauth2-proxy |
mirantis.azurecr.io/iam/oauth2-proxy:v7.1.3-8 |
|
opensearch Updated |
mirantis.azurecr.io/stacklight/opensearch:2-20240701140359 |
|
opensearch-dashboards Updated |
mirantis.azurecr.io/stacklight/opensearch-dashboards:2-20240701140352 |
|
openstack-refapp |
mirantis.azurecr.io/openstack/openstack-refapp:0.1.7 |
|
pgbouncer Updated |
mirantis.azurecr.io/stacklight/pgbouncer:1-20240701140404 |
|
prometheus |
mirantis.azurecr.io/stacklight/prometheus:v2.48.0 |
|
prometheus-es-exporter Updated |
mirantis.azurecr.io/stacklight/prometheus-es-exporter:v0.14.0-20240701140403 |
|
prometheus-msteams |
mirantis.azurecr.io/stacklight/prometheus-msteams:v1.5-20240408080322 |
|
prometheus-patroni-exporter Updated |
mirantis.azurecr.io/stacklight/prometheus-patroni-exporter:0.0.1-20240701140402 |
|
prometheus-postgres-exporter |
mirantis.azurecr.io/stacklight/prometheus-postgres-exporter:v0.15.0 |
|
prometheus-relay Updated |
mirantis.azurecr.io/stacklight/prometheus-relay:v0.4-20240701140404 |
|
psql-client |
mirantis.azurecr.io/scale/psql-client:v13-20240222083402 |
|
sf-notifier Updated |
mirantis.azurecr.io/stacklight/sf-notifier:v0.4-20240701140403 |
|
sf-reporter |
mirantis.azurecr.io/stacklight/sf-reporter:v0.1-20240318145903 |
|
spilo Updated |
mirantis.azurecr.io/stacklight/spilo:13-2.1p9-20240701140359 |
|
stacklight-toolkit Updated |
mirantis.azurecr.io/stacklight/stacklight-toolkit:20240701140402 |
|
telegraf |
mirantis.azurecr.io/stacklight/telegraf:v1.9.1-20240605023010 Updated |
|
mirantis.azurecr.io/stacklight/telegraf:1-20240426131156 |
||
telemeter Updated |
mirantis.azurecr.io/stacklight/telemeter:4.4-20240701140401 |
|
telemeter-token-auth Updated |
mirantis.azurecr.io/stacklight/telemeter-token-auth:v0.1-20240701140402 |
Artifact |
Component |
Path |
|---|---|---|
Configuration management |
Ansible |
|
Debian repositories |
System packages |
|
http://mirror.mirantis.com/kaas/kubernetes-extra-rhel7-0.0.8/ |
||
https://mirror.mirantis.com/kaas/ubuntu-2024-06-27-014654/ Updated |
||
https://mirror.mirantis.com/kaas/ubuntu-2024-06-27-014654.target.txt Updated |
||
MCR repositories |
MCR |
https://repos.mirantis.com/ubuntu/dists/jammy/pool/stable-23.0/ |
Target ubuntu system |
Ubuntu |
https://binary.mirantis.com/bm/bin/efi/ubuntu/tgz-jammy-20240627095125 Updated |
This section outlines release notes for the major Cluster release 16.2.0 that is introduced in the Container Cloud release 2.27.0. The Cluster release 16.2.0 supports:
Mirantis Kubernetes Engine (MKE) 3.7.8. For details, see MKE Release Notes.
Mirantis Container Runtime (MCR) 23.0.11. For details, see MCR Release Notes.
Kubernetes 1.27.
For the list of known and addressed issues, refer to the Container Cloud release 2.27.0 section.
This section outlines new features implemented in the Cluster release 16.2.0 that is introduced in the Container Cloud release 2.27.0.
Introduced support for Mirantis Kubernetes Engine (MKE) 3.7.8 that supports Kubernetes 1.27 for the Container Cloud management and managed clusters.
On existing managed clusters, MKE is updated to the latest supported version when you update your managed cluster to the Cluster release 16.2.0.
Note
This enhancement applies to users who follow the update train using major releases. Users who install patch releases, have already obtained MKE 3.7.8 in Container Cloud 2.26.4 (Cluster release 16.1.4).
Learn more
Analyzed and fixed the majority of failed compliance checks in the MKE benchmark compliance for Container Cloud core components and StackLight. The following controls were analyzed:
Control ID |
Component |
Control description |
Analyzed item |
|---|---|---|---|
5.1.2 |
client-certificate-controller
helm-controller
local-volume-provisioner
|
Minimize access to secrets |
|
5.1.4 |
local-volume-provisioner |
Minimize access to create pods |
|
5.2.5 |
client-certificate-controller
helm-controller
policy-controller
stacklight
|
Minimize the admission of containers with |
Containers with |
Upgraded Ceph major version from Quincy 17.2.7 (17.2.7-12.cve in the patch release train) to Reef 18.2.3 with an automatic upgrade of Ceph components on existing managed clusters during the Cluster version update.
Ceph Reef delivers new version of RocksDB which provides better IO performance. Also, this version supports RGW multisite re-sharding and contains overall security improvements.
Added support for Rook v1.13 that contains the Ceph CSI plugin 3.10.x as the default supported version. For a complete list of features and breaking changes, refer to official Rook documentation.
Learn more
Implemented the section option for the rookConfig parameter that
enables you to specify the section where a Rook parameter must be placed.
The use of this option enables restart of only specific daemons related to the
corresponding section instead of restarting all Ceph daemons except Ceph OSD.
Implemented monitoring of disk along with I/O errors in kernel logs to detect
hardware and software issues. The implementation includes the dedicated
KernelIOErrorsDetected alert, the kernel_io_errors_total metric that
is collected on the Fluentd side using the I/O error patterns, and general
refactoring of metrics created in Fluentd.
Added documentation describing usage examples of alert rules based on S.M.A.R.T. metrics to monitor disk information on bare metal clusters.
The StackLight telegraf-ds-smart exporter uses the
S.M.A.R.T. plugin to
obtain detailed disk information and export it as metrics. S.M.A.R.T. is a
commonly used system across vendors with performance data provided as
attributes.
Improved performance and UX visibility of the OpenSearch and OpenSearch Indices Grafana dashboards as well as added the capability to minimize the number of indices to be displayed on dashboards.
Learn more
As part of StackLight refactoring, removed grafana-image-renderer from the
Grafana installation in Container Cloud. StackLight uses this component only
for image generation in the Grafana web UI, which can be easily replaced with
standard screenshots.
The improvement optimizes resources usage and prevents potential CVEs that frequently affect this component.
The following table lists the components versions of the Cluster release 16.2.0.
Note
The components that are newly added, updated, deprecated, or removed
as compared to the previous release version, are marked
with a corresponding superscript,
for example, lcm-ansible Updated.
Component |
Application/Service |
Version |
|---|---|---|
Cluster orchestration |
Mirantis Kubernetes Engine |
3.7.8 0 |
Container runtime Updated |
Mirantis Container Runtime |
23.0.11 1 |
Distributed storage |
Ceph |
18.2.3-1.release (Reef) |
Rook |
1.13.5-15 |
|
LCM Updated |
helm-controller |
1.40.11 |
lcm-ansible |
0.25.0-37-gc15c97d |
|
lcm-agent |
1.40.11 |
|
StackLight |
Alerta |
9.0.1 |
Alertmanager |
0.25.0 |
|
Alertmanager Webhook ServiceNow |
0.1 |
|
Blackbox Exporter |
0.24.0 |
|
cAdvisor |
0.47.2 |
|
Elasticsearch Curator |
5.7.6 |
|
Elasticsearch Exporter |
1.5.0 |
|
Fluentd |
1.15.3 |
|
Grafana |
10.3.1 |
|
Grafana Image Renderer Removed |
n/a |
|
kube-state-metrics |
2.10.1 |
|
Metric Collector |
0.1 |
|
Metricbeat |
7.12.1 |
|
Node Exporter |
1.7.0 |
|
OAuth2 Proxy |
7.1.3 |
|
OpenSearch |
2.12.0 |
|
OpenSearch Dashboards |
2.12.0 |
|
Prometheus |
2.48.0 |
|
Prometheus ES Exporter |
0.14.0 |
|
Prometheus MS Teams |
1.5.2 |
|
Prometheus Patroni Exporter |
0.0.1 |
|
Prometheus Postgres Exporter |
0.15.0 |
|
Prometheus Relay |
0.4 |
|
sf-notifier |
0.4 |
|
sf-reporter |
0.1 |
|
Spilo |
13-2.1p9 |
|
Telegraf |
1.9.1 |
|
1.30.2 |
||
Telemeter |
4.4 |
- 0
For the Mirantis Kubernetes Engine (MKE) release highlights and components versions, see MKE documentation: MKE release notes.
- 1
For the Mirantis Container Runtime (MCR) release highlights, see MCR documentation: MCR release notes.
This section lists the artifacts of components included in the Cluster release 16.2.0.
Artifact |
Component |
Path |
|---|---|---|
Helm chart Updated |
ceph-controller |
https://binary.mirantis.com/ceph/helm/ceph-operator-1.0.0-mcc-2.27.0-7.tgz |
Docker images Updated |
ceph |
mirantis.azurecr.io/mirantis/ceph:v18.2.3-1.release |
ceph-controller |
mirantis.azurecr.io/ceph/mcp/ceph-controller:2.27.0-6 |
|
cephcsi |
mirantis.azurecr.io/mirantis/cephcsi:v3.9.0-12.release |
|
cephcsi-registrar |
mirantis.azurecr.io/mirantis/cephcsi-registrar:v2.9.2-4.release |
|
cephcsi-provisioner |
mirantis.azurecr.io/mirantis/cephcsi-provisioner:v3.6.2-4.release |
|
cephcsi-snapshotter |
mirantis.azurecr.io/mirantis/cephcsi-snapshotter:v6.3.2-4.release |
|
cephcsi-attacher |
mirantis.azurecr.io/mirantis/cephcsi-attacher:v4.4.2-4.release |
|
cephcsi-resizer |
mirantis.azurecr.io/mirantis/cephcsi-resizer:v1.9.2-4.release |
|
rook |
mirantis.azurecr.io/ceph/rook:v1.13.5-15 |
|
snapshot-controller New |
mirantis.azurecr.io/mirantis/snapshot-controller:v6.3.2-4.release |
Artifact |
Component |
Path |
|---|---|---|
Binaries Updated |
lcm-ansible |
https://binary.mirantis.com/lcm/bin/lcm-ansible/v0.25.0-37-gc15c97d/lcm-ansible.tar.gz |
lcm-agent |
||
Helm charts Updated |
helm-controller |
https://binary.mirantis.com/core/helm/helm-controller-1.40.11.tgz |
managed-lcm-api |
https://binary.mirantis.com/core/helm/managed-lcm-api-1.40.11.tgz |
|
Docker images Updated |
helm-controller |
mirantis.azurecr.io/core/lcm-controller:1.40.11 |
Artifact |
Component |
Path |
|---|---|---|
Helm charts |
alerta |
https://binary.mirantis.com/stacklight/helm/alerta-0.1.0-mcp-33.tgz |
alertmanager-webhook-servicenow |
https://binary.mirantis.com/stacklight/helm/alertmanager-webhook-servicenow-0.2.0-mcp-8.tgz |
|
cadvisor |
https://binary.mirantis.com/stacklight/helm/cadvisor-0.1.0-mcp-7.tgz |
|
elasticsearch-curator |
https://binary.mirantis.com/stacklight/helm/elasticsearch-curator-1.5.0-mcp-15.tgz |
|
elasticsearch-exporter |
https://binary.mirantis.com/stacklight/helm/elasticsearch-exporter-1.2.0-mcp-10.tgz |
|
fluentd-logs Updated |
https://binary.mirantis.com/stacklight/helm/fluentd-logs-0.1.0-mcp-238.tgz |
|
grafana Updated |
https://binary.mirantis.com/stacklight/helm/grafana-3.3.10-mcp-300.tgz |
|
iam-proxy |
||
metric-collector |
https://binary.mirantis.com/stacklight/helm/metric-collector-0.3.0-mcp-17.tgz |
|
metricbeat |
https://binary.mirantis.com/stacklight/helm/metricbeat-1.7.1-mcp-25.tgz |
|
opensearch Updated |
https://binary.mirantis.com/stacklight/helm/opensearch-0.1.0-mcp-87.tgz |
|
opensearch-dashboards |
https://binary.mirantis.com/stacklight/helm/opensearch-dashboards-0.1.0-mcp-54.tgz |
|
patroni |
https://binary.mirantis.com/stacklight/helm/patroni-0.15.1-mcp-59.tgz |
|
prometheus |
https://binary.mirantis.com/stacklight/helm/prometheus-8.11.4-mcp-258.tgz |
|
prometheus-blackbox-exporter |
https://binary.mirantis.com/stacklight/helm/prometheus-blackbox-exporter-0.3.0-mcp-19.tgz |
|
prometheus-es-exporter |
https://binary.mirantis.com/stacklight/helm/prometheus-es-exporter-1.0.0-mcp-18.tgz |
|
prometheus-msteams |
https://binary.mirantis.com/stacklight/helm/prometheus-msteams-0.1.0-mcp-12.tgz |
|
refapp |
https://binary.mirantis.com/scale/helm/refapp-0.2.1-mcp-16.tgz |
|
sf-notifier |
https://binary.mirantis.com/stacklight/helm/sf-notifier-0.2.0-mcp-10.tgz |
|
sf-reporter |
https://binary.mirantis.com/stacklight/helm/sf-reporter-0.2.0-mcp-10.tgz |
|
stacklight Updated |
https://binary.mirantis.com/stacklight/helm/stacklight-0.15.3.tgz |
|
telegraf-ds |
https://binary.mirantis.com/stacklight/helm/telegraf-ds-1.1.5-mcp-42.tgz |
|
telegraf-s |
https://binary.mirantis.com/stacklight/helm/telegraf-s-1.1.5-mcp-42.tgz |
|
telemeter-client |
https://binary.mirantis.com/stacklight/helm/telemeter-client-0.2.0-mcp-14.tgz |
|
telemeter-server |
https://binary.mirantis.com/stacklight/helm/telemeter-server-0.2.0-mcp-14.tgz |
|
Docker images |
alerta-web |
mirantis.azurecr.io/stacklight/alerta-web:9-20240515023009 |
alertmanager |
mirantis.azurecr.io/stacklight/alertmanager:v0-20240515023012 |
|
alertmanager-webhook-servicenow |
mirantis.azurecr.io/stacklight/alertmanager-webhook-servicenow:v0.1-20240318145925 |
|
alpine-utils |
mirantis.azurecr.io/stacklight/alpine-utils:1-20240515023017 |
|
blackbox-exporter |
mirantis.azurecr.io/stacklight/blackbox-exporter:0-20240408080237 |
|
cadvisor |
mirantis.azurecr.io/stacklight/cadvisor:v0.47-20240515023012 |
|
configmap-reload |
mirantis.azurecr.io/stacklight/configmap-reload:v0.8.0 |
|
curator |
mirantis.azurecr.io/stacklight/curator:5.7.6-20230404082402 |
|
elasticsearch-exporter |
mirantis.azurecr.io/stacklight/elasticsearch-exporter:v1.5.0 |
|
fluentd Updated |
mirantis.azurecr.io/stacklight/fluentd:1.15-20240611084259 |
|
grafana |
mirantis.azurecr.io/stacklight/grafana:10.3.1 |
|
grafana-image-renderer Removed |
n/a |
|
k8s-sidecar |
mirantis.azurecr.io/stacklight/k8s-sidecar:1-20240515023018 |
|
kube-state-metrics |
mirantis.azurecr.io/stacklight/kube-state-metrics:v2.10.1 |
|
kubectl |
mirantis.azurecr.io/stacklight/kubectl:1.22-20240515023015 |
|
metric-collector |
mirantis.azurecr.io/stacklight/metric-collector:v0.1-20240515023016 |
|
metricbeat |
mirantis.azurecr.io/stacklight/metricbeat:7.12.1-20240515023009 |
|
node-exporter |
mirantis.azurecr.io/stacklight/node-exporter:v1.7.0 |
|
oauth2-proxy |
mirantis.azurecr.io/iam/oauth2-proxy:v7.1.3-8 |
|
opensearch |
mirantis.azurecr.io/stacklight/opensearch:2-20240515023012 |
|
opensearch-dashboards |
mirantis.azurecr.io/stacklight/opensearch-dashboards:2-20240515023010 |
|
openstack-refapp |
mirantis.azurecr.io/openstack/openstack-refapp:0.1.7 |
|
pgbouncer |
mirantis.azurecr.io/stacklight/pgbouncer:1-20240515023018 |
|
prometheus |
mirantis.azurecr.io/stacklight/prometheus:v2.48.0 |
|
prometheus-es-exporter |
mirantis.azurecr.io/stacklight/prometheus-es-exporter:v0.14.0-20240515023016 |
|
prometheus-msteams |
mirantis.azurecr.io/stacklight/prometheus-msteams:v1.5-20240408080322 |
|
prometheus-patroni-exporter |
mirantis.azurecr.io/stacklight/prometheus-patroni-exporter:0.0.1-20240515023017 |
|
prometheus-postgres-exporter |
mirantis.azurecr.io/stacklight/prometheus-postgres-exporter:v0.15.0 |
|
prometheus-relay |
mirantis.azurecr.io/stacklight/prometheus-relay:v0.4-20240515023017 |
|
psql-client |
mirantis.azurecr.io/scale/psql-client:v13-20240222083402 |
|
sf-notifier |
mirantis.azurecr.io/stacklight/sf-notifier:v0.4-20240515023012 |
|
sf-reporter |
mirantis.azurecr.io/stacklight/sf-reporter:v0.1-20240318145903 |
|
spilo |
mirantis.azurecr.io/stacklight/spilo:13-2.1p9-20240515023010 |
|
stacklight-toolkit |
mirantis.azurecr.io/stacklight/stacklight-toolkit:20240515023016 |
|
telegraf |
mirantis.azurecr.io/stacklight/telegraf:v1.9.1-20240515023008 |
|
mirantis.azurecr.io/stacklight/telegraf:1-20240426131156 |
||
telemeter |
mirantis.azurecr.io/stacklight/telemeter:4.4-20240515023015 |
|
telemeter-token-auth |
mirantis.azurecr.io/stacklight/telemeter-token-auth:v0.1-20240515023012 |
Artifact |
Component |
Path |
|---|---|---|
Configuration management Updated |
Ansible |
|
Debian repositories |
System packages |
https://mirror.mirantis.com/kaas/kubernetes-extra-1.0.0/ Updated |
http://mirror.mirantis.com/kaas/kubernetes-extra-rhel7-0.0.8/ |
||
https://mirror.mirantis.com/kaas/ubuntu-2024-05-17-013445/ Updated |
||
https://mirror.mirantis.com/kaas/ubuntu-2024-05-17-013445.target.txt Updated |
||
MCR repositories |
MCR |
https://repos.mirantis.com/ubuntu/dists/jammy/pool/stable-23.0/ |
Target ubuntu system |
Ubuntu |
https://binary.mirantis.com/bm/bin/efi/ubuntu/tgz-jammy-20240517090139 Updated |
Major and patch versions update path
The primary distinction between major and patch product versions lies in the fact that major release versions introduce new functionalities, whereas patch release versions predominantly offer minor product enhancements, mostly CVE resolutions for your clusters.
Depending on your deployment needs, you can either update only between major Cluster releases or apply patch updates between major releases. Choosing the latter option ensures you receive security fixes as soon as they become available. Though, be prepared to update your cluster frequently, approximately once every three weeks. Otherwise, you can update only between major Cluster releases as each subsequent major Cluster release includes patch Cluster release updates of the previous major Cluster release.
This section outlines release notes for major and patch Cluster releases of the 16.1.x series.
This section includes release notes for the patch Cluster release 16.1.7 that is introduced in the Container Cloud patch release 2.27.2 and is based on the previous Cluster releases of the 16.1.x series series.
This Cluster release supports Mirantis Kubernetes Engine 3.7.11 with Kubernetes 1.27 and Mirantis Container Runtime 23.0.9.
For the list of CVE fixes delivered with this patch Cluster release, see 2.27.2
For details on patch release delivery, see Patch releases
This section lists the artifacts of components included in the Cluster release 16.1.7.
Note
The components that are newly added, updated, deprecated, or removed
as compared to the previous release version, are marked
with a corresponding superscript,
for example, lcm-ansible Updated.
Artifact |
Component |
Path |
|---|---|---|
Helm chart |
ceph-controller |
https://binary.mirantis.com/ceph/helm/ceph-operator-1.0.0-mcc-2.27.1-6.tgz |
Docker images |
ceph |
mirantis.azurecr.io/mirantis/ceph:v17.2.7-15.cve |
ceph-controller |
mirantis.azurecr.io/ceph/mcp/ceph-controller:2.27.1-5 |
|
cephcsi |
mirantis.azurecr.io/mirantis/cephcsi:v3.9.0-15.cve |
|
cephcsi-registrar |
mirantis.azurecr.io/mirantis/cephcsi-registrar:v2.9.2-3.cve |
|
cephcsi-provisioner |
mirantis.azurecr.io/mirantis/cephcsi-provisioner:v3.6.2-3.cve |
|
cephcsi-snapshotter |
mirantis.azurecr.io/mirantis/cephcsi-snapshotter:v6.3.2-3.cve |
|
cephcsi-attacher |
mirantis.azurecr.io/mirantis/cephcsi-attacher:v4.4.2-3.cve |
|
cephcsi-resizer |
mirantis.azurecr.io/mirantis/cephcsi-resizer:v1.9.2-3.cve |
|
rook |
mirantis.azurecr.io/ceph/rook:v1.12.10-21 |
Artifact |
Component |
Path |
|---|---|---|
Helm charts Updated |
cinder-csi-plugin |
https://binary.mirantis.com/core/helm/cinder-csi-plugin-1.39.31.tgz |
client-certificate-controller |
https://binary.mirantis.com/core/helm/client-certificate-controller-1.39.31.tgz |
|
local-volume-provisioner |
https://binary.mirantis.com/core/helm/local-volume-provisioner-1.39.31.tgz |
|
metrics-server |
https://binary.mirantis.com/core/helm/metrics-server-1.39.31.tgz |
|
openstack-cloud-controller-manager |
https://binary.mirantis.com/core/helm/openstack-cloud-controller-manager-1.39.31.tgz |
|
policy-controller |
https://binary.mirantis.com/core/helm/policy-controller-1.39.31.tgz |
|
vsphere-cloud-controller-manager |
https://binary.mirantis.com/core/helm/vsphere-cloud-controller-manager-1.39.31.tgz |
|
vsphere-csi-plugin |
https://binary.mirantis.com/core/helm/vsphere-csi-plugin-1.39.31.tgz |
|
Docker images |
cinder-csi-plugin Updated |
mirantis.azurecr.io/lcm/kubernetes/cinder-csi-plugin:v1.27.2-17 |
client-certificate-controller Updated |
mirantis.azurecr.io/core/client-certificate-controller:1.39.31 |
|
csi-attacher |
mirantis.azurecr.io/lcm/k8scsi/csi-attacher:v4.2.0-5 |
|
csi-node-driver-registrar |
mirantis.azurecr.io/lcm/k8scsi/csi-node-driver-registrar:v2.7.0-5 |
|
csi-provisioner |
mirantis.azurecr.io/lcm/k8scsi/csi-provisioner:v3.4.1-5 |
|
csi-resizer |
mirantis.azurecr.io/lcm/k8scsi/csi-resizer:v1.7.0-5 |
|
csi-snapshotter |
mirantis.azurecr.io/lcm/k8scsi/csi-snapshotter:v6.2.1-mcc-4 |
|
livenessprobe |
mirantis.azurecr.io/lcm/k8scsi/livenessprobe:v2.9.0-5 |
|
metrics-server |
mirantis.azurecr.io/lcm/metrics-server-amd64:v0.6.3-7 |
|
openstack-cloud-controller-manager Updated |
mirantis.azurecr.io/lcm/kubernetes/openstack-cloud-controller-manager:v1.27.2-17 |
|
policy-controller Updated |
mirantis.azurecr.io/core/policy-controller:1.39.31 |
|
vsphere-cloud-controller-manager |
mirantis.azurecr.io/lcm/kubernetes/vsphere-cloud-controller-manager:v1.27.0-6 |
|
vsphere-csi-driver |
mirantis.azurecr.io/lcm/kubernetes/vsphere-csi-driver:v3.0.2-1 |
|
vsphere-csi-syncer |
mirantis.azurecr.io/lcm/kubernetes/vsphere-csi-syncer:v3.0.2-1 |
Artifact |
Component |
Path |
|---|---|---|
Binaries |
lcm-ansible |
https://binary.mirantis.com/lcm/bin/lcm-ansible/v0.24.0-52-gd8adaba/lcm-ansible.tar.gz |
lcm-agent Updated |
||
Helm charts Updated |
helm-controller |
https://binary.mirantis.com/core/helm/helm-controller-1.39.31.tgz |
managed-lcm-api |
https://binary.mirantis.com/core/helm/managed-lcm-api-1.39.31.tgz |
|
Docker images Updated |
helm-controller |
mirantis.azurecr.io/core/lcm-controller:1.39.31 |
Artifact |
Component |
Path |
|---|---|---|
Helm charts |
alerta |
https://binary.mirantis.com/stacklight/helm/alerta-0.1.0-mcp-33.tgz |
alertmanager-webhook-servicenow |
https://binary.mirantis.com/stacklight/helm/alertmanager-webhook-servicenow-0.2.0-mcp-8.tgz |
|
cadvisor |
https://binary.mirantis.com/stacklight/helm/cadvisor-0.1.0-mcp-7.tgz |
|
elasticsearch-curator |
https://binary.mirantis.com/stacklight/helm/elasticsearch-curator-1.5.0-mcp-15.tgz |
|
elasticsearch-exporter |
https://binary.mirantis.com/stacklight/helm/elasticsearch-exporter-1.2.0-mcp-10.tgz |
|
fluentd-logs |
https://binary.mirantis.com/stacklight/helm/fluentd-logs-0.1.0-mcp-223.tgz |
|
grafana |
https://binary.mirantis.com/stacklight/helm/grafana-3.3.10-mcp-290.tgz |
|
iam-proxy |
||
metric-collector |
https://binary.mirantis.com/stacklight/helm/metric-collector-0.3.0-mcp-17.tgz |
|
metricbeat |
https://binary.mirantis.com/stacklight/helm/metricbeat-1.7.1-mcp-25.tgz |
|
opensearch |
https://binary.mirantis.com/stacklight/helm/opensearch-0.1.0-mcp-88.tgz |
|
opensearch-dashboards |
https://binary.mirantis.com/stacklight/helm/opensearch-dashboards-0.1.0-mcp-54.tgz |
|
patroni |
https://binary.mirantis.com/stacklight/helm/patroni-0.15.1-mcp-59.tgz |
|
prometheus |
https://binary.mirantis.com/stacklight/helm/prometheus-8.11.4-mcp-258.tgz |
|
prometheus-blackbox-exporter |
https://binary.mirantis.com/stacklight/helm/prometheus-blackbox-exporter-0.3.0-mcp-19.tgz |
|
prometheus-es-exporter |
https://binary.mirantis.com/stacklight/helm/prometheus-es-exporter-1.0.0-mcp-18.tgz |
|
prometheus-msteams |
https://binary.mirantis.com/stacklight/helm/prometheus-msteams-0.1.0-mcp-12.tgz |
|
refapp |
https://binary.mirantis.com/scale/helm/refapp-0.2.1-mcp-16.tgz |
|
sf-notifier |
https://binary.mirantis.com/stacklight/helm/sf-notifier-0.2.0-mcp-10.tgz |
|
sf-reporter |
https://binary.mirantis.com/stacklight/helm/sf-reporter-0.2.0-mcp-10.tgz |
|
stacklight Updated |
https://binary.mirantis.com/stacklight/helm/stacklight-0.14.15.tgz |
|
telegraf-ds |
https://binary.mirantis.com/stacklight/helm/telegraf-ds-1.1.5-mcp-42.tgz |
|
telegraf-s |
https://binary.mirantis.com/stacklight/helm/telegraf-s-1.1.5-mcp-42.tgz |
|
telemeter-client |
https://binary.mirantis.com/stacklight/helm/telemeter-client-0.2.0-mcp-14.tgz |
|
telemeter-server |
https://binary.mirantis.com/stacklight/helm/telemeter-server-0.2.0-mcp-14.tgz |
|
Docker images |
alerta-web Updated |
mirantis.azurecr.io/stacklight/alerta-web:9-20240710023009 |
alertmanager Updated |
mirantis.azurecr.io/stacklight/alertmanager:v0-20240710023018 |
|
alertmanager-webhook-servicenow |
mirantis.azurecr.io/stacklight/alertmanager-webhook-servicenow:v0.1-20240318145925 |
|
alpine-utils Updated |
mirantis.azurecr.io/stacklight/alpine-utils:1-20240710023020 |
|
blackbox-exporter |
mirantis.azurecr.io/stacklight/blackbox-exporter:0-20240408080237 |
|
cadvisor Updated |
mirantis.azurecr.io/stacklight/cadvisor:v0.47-20240710023011 |
|
configmap-reload |
mirantis.azurecr.io/stacklight/configmap-reload:v0.8.0 |
|
curator |
mirantis.azurecr.io/stacklight/curator:5.7.6-20230404082402 |
|
elasticsearch-exporter |
mirantis.azurecr.io/stacklight/elasticsearch-exporter:v1.5.0 |
|
fluentd Updated |
mirantis.azurecr.io/stacklight/fluentd:1.15-20240710023010 |
|
grafana |
mirantis.azurecr.io/stacklight/grafana:10.3.1 |
|
grafana-image-renderer |
mirantis.azurecr.io/stacklight/grafana-image-renderer:3-20240318142141 |
|
k8s-sidecar Updated |
mirantis.azurecr.io/stacklight/k8s-sidecar:1-20240710023020 |
|
kube-state-metrics |
mirantis.azurecr.io/stacklight/kube-state-metrics:v2.10.1 |
|
kubectl Updated |
mirantis.azurecr.io/stacklight/kubectl:1.22-20240710023014 |
|
metric-collector Updated |
mirantis.azurecr.io/stacklight/metric-collector:v0.1-20240710023014 |
|
metricbeat |
mirantis.azurecr.io/stacklight/metricbeat:7.12.1-20240626023010 |
|
node-exporter |
mirantis.azurecr.io/stacklight/node-exporter:v1.7.0 |
|
oauth2-proxy Updated |
mirantis.azurecr.io/iam/oauth2-proxy:v7.1.3-9 |
|
opensearch Updated |
mirantis.azurecr.io/stacklight/opensearch:2-20240710023013 |
|
opensearch-dashboards Updated |
mirantis.azurecr.io/stacklight/opensearch-dashboards:2-20240710023010 |
|
openstack-refapp Updated |
mirantis.azurecr.io/openstack/openstack-refapp:0.1.8 |
|
pgbouncer Updated |
mirantis.azurecr.io/stacklight/pgbouncer:1-20240710023020 |
|
prometheus |
mirantis.azurecr.io/stacklight/prometheus:v2.48.0 |
|
prometheus-es-exporter Updated |
mirantis.azurecr.io/stacklight/prometheus-es-exporter:v0.14.0-20240710023017 |
|
prometheus-msteams |
mirantis.azurecr.io/stacklight/prometheus-msteams:v1.5-20240408080322 |
|
prometheus-patroni-exporter Updated |
mirantis.azurecr.io/stacklight/prometheus-patroni-exporter:0.0.1-20240710023019 |
|
prometheus-postgres-exporter |
mirantis.azurecr.io/stacklight/prometheus-postgres-exporter:v0.15.0 |
|
prometheus-relay Updated |
mirantis.azurecr.io/stacklight/prometheus-relay:v0.4-20240710023019 |
|
psql-client Updated |
mirantis.azurecr.io/scale/psql-client:v13-20240701095027 |
|
sf-notifier Updated |
mirantis.azurecr.io/stacklight/sf-notifier:v0.4-20240710023015 |
|
sf-reporter |
mirantis.azurecr.io/stacklight/sf-reporter:v0.1-20240318145903 |
|
spilo Updated |
mirantis.azurecr.io/stacklight/spilo:13-2.1p9-20240710023011 |
|
stacklight-toolkit Updated |
mirantis.azurecr.io/stacklight/stacklight-toolkit:20240710023015 |
|
telegraf |
mirantis.azurecr.io/stacklight/telegraf:v1.9.1-20240605023010 |
|
mirantis.azurecr.io/stacklight/telegraf:1-20240426131156 |
||
telemeter Updated |
mirantis.azurecr.io/stacklight/telemeter:4.4-20240710023015 |
|
telemeter-token-auth Updated |
mirantis.azurecr.io/stacklight/telemeter-token-auth:v0.1-20240710023019 |
Artifact |
Component |
Path |
|---|---|---|
Debian repositories |
System packages |
|
http://mirror.mirantis.com/kaas/kubernetes-extra-rhel7-0.0.8/ |
||
https://mirror.mirantis.com/kaas/ubuntu-2024-07-16-014744/ Updated |
||
https://mirror.mirantis.com/kaas/ubuntu-2024-07-16-014744.target.txt Updated |
||
MCR repositories |
MCR |
https://repos.mirantis.com/ubuntu/dists/focal/pool/stable-23.0/ |
Target ubuntu system 1 |
Ubuntu |
https://binary.mirantis.com/bm/bin/efi/ubuntu/tgz-focal-20240716073842 Updated |
- 1
Only for bare metal clusters
This section includes release notes for the patch Cluster release 16.1.6 that is introduced in the Container Cloud patch release 2.27.1 and is based on the previous Cluster releases of the 16.1.x series series.
This Cluster release supports Mirantis Kubernetes Engine 3.7.10
with Kubernetes 1.27 and Mirantis Container Runtime 23.0.9, in which
docker-ee-cli was updated to version 23.0.13 to fix several CVEs.
For the list of CVE fixes delivered with this patch Cluster release, see 2.27.1
For details on patch release delivery, see Patch releases
This section lists the artifacts of components included in the Cluster release 16.1.6.
Note
The components that are newly added, updated, deprecated, or removed
as compared to the previous release version, are marked
with a corresponding superscript,
for example, lcm-ansible Updated.
Artifact |
Component |
Path |
|---|---|---|
Helm chart Updated |
ceph-controller |
https://binary.mirantis.com/ceph/helm/ceph-operator-1.0.0-mcc-2.27.1-6.tgz |
Docker images |
ceph Updated |
mirantis.azurecr.io/mirantis/ceph:v17.2.7-15.cve |
ceph-controller Updated |
mirantis.azurecr.io/ceph/mcp/ceph-controller:2.27.1-5 |
|
cephcsi Updated |
mirantis.azurecr.io/mirantis/cephcsi:v3.9.0-15.cve |
|
cephcsi-registrar |
mirantis.azurecr.io/mirantis/cephcsi-registrar:v2.9.2-3.cve |
|
cephcsi-provisioner |
mirantis.azurecr.io/mirantis/cephcsi-provisioner:v3.6.2-3.cve |
|
cephcsi-snapshotter |
mirantis.azurecr.io/mirantis/cephcsi-snapshotter:v6.3.2-3.cve |
|
cephcsi-attacher |
mirantis.azurecr.io/mirantis/cephcsi-attacher:v4.4.2-3.cve |
|
cephcsi-resizer |
mirantis.azurecr.io/mirantis/cephcsi-resizer:v1.9.2-3.cve |
|
rook Updated |
mirantis.azurecr.io/ceph/rook:v1.12.10-21 |
Artifact |
Component |
Path |
|---|---|---|
Helm charts Updated |
cinder-csi-plugin |
https://binary.mirantis.com/core/helm/cinder-csi-plugin-1.39.29.tgz |
client-certificate-controller |
https://binary.mirantis.com/core/helm/client-certificate-controller-1.39.29.tgz |
|
local-volume-provisioner |
https://binary.mirantis.com/core/helm/local-volume-provisioner-1.39.29.tgz |
|
metrics-server |
https://binary.mirantis.com/core/helm/metrics-server-1.39.29.tgz |
|
openstack-cloud-controller-manager |
https://binary.mirantis.com/core/helm/openstack-cloud-controller-manager-1.39.29.tgz |
|
policy-controller |
https://binary.mirantis.com/core/helm/policy-controller-1.39.29.tgz |
|
vsphere-cloud-controller-manager |
https://binary.mirantis.com/core/helm/vsphere-cloud-controller-manager-1.39.29.tgz |
|
vsphere-csi-plugin |
https://binary.mirantis.com/core/helm/vsphere-csi-plugin-1.39.29.tgz |
|
Docker images |
cinder-csi-plugin |
mirantis.azurecr.io/lcm/kubernetes/cinder-csi-plugin:v1.27.2-16 |
client-certificate-controller Updated |
mirantis.azurecr.io/core/client-certificate-controller:1.39.29 |
|
csi-attacher |
mirantis.azurecr.io/lcm/k8scsi/csi-attacher:v4.2.0-5 |
|
csi-node-driver-registrar |
mirantis.azurecr.io/lcm/k8scsi/csi-node-driver-registrar:v2.7.0-5 |
|
csi-provisioner |
mirantis.azurecr.io/lcm/k8scsi/csi-provisioner:v3.4.1-5 |
|
csi-resizer |
mirantis.azurecr.io/lcm/k8scsi/csi-resizer:v1.7.0-5 |
|
csi-snapshotter |
mirantis.azurecr.io/lcm/k8scsi/csi-snapshotter:v6.2.1-mcc-4 |
|
livenessprobe |
mirantis.azurecr.io/lcm/k8scsi/livenessprobe:v2.9.0-5 |
|
metrics-server |
mirantis.azurecr.io/lcm/metrics-server-amd64:v0.6.3-7 |
|
openstack-cloud-controller-manager |
mirantis.azurecr.io/lcm/kubernetes/openstack-cloud-controller-manager:v1.27.2-16 |
|
policy-controller Updated |
mirantis.azurecr.io/core/policy-controller:1.39.29 |
|
vsphere-cloud-controller-manager |
mirantis.azurecr.io/lcm/kubernetes/vsphere-cloud-controller-manager:v1.27.0-6 |
|
vsphere-csi-driver |
mirantis.azurecr.io/lcm/kubernetes/vsphere-csi-driver:v3.0.2-1 |
|
vsphere-csi-syncer |
mirantis.azurecr.io/lcm/kubernetes/vsphere-csi-syncer:v3.0.2-1 |
Artifact |
Component |
Path |
|---|---|---|
Binaries Updated |
lcm-ansible |
https://binary.mirantis.com/lcm/bin/lcm-ansible/v0.24.0-52-gd8adaba/lcm-ansible.tar.gz |
lcm-agent |
||
Helm charts Updated |
helm-controller |
https://binary.mirantis.com/core/helm/helm-controller-1.39.29.tgz |
managed-lcm-api |
https://binary.mirantis.com/core/helm/managed-lcm-api-1.39.29.tgz |
|
Docker images Updated |
helm-controller |
mirantis.azurecr.io/core/lcm-controller:1.39.29 |
Artifact |
Component |
Path |
|---|---|---|
Helm charts |
alerta |
https://binary.mirantis.com/stacklight/helm/alerta-0.1.0-mcp-33.tgz |
alertmanager-webhook-servicenow |
https://binary.mirantis.com/stacklight/helm/alertmanager-webhook-servicenow-0.2.0-mcp-8.tgz |
|
cadvisor |
https://binary.mirantis.com/stacklight/helm/cadvisor-0.1.0-mcp-7.tgz |
|
elasticsearch-curator |
https://binary.mirantis.com/stacklight/helm/elasticsearch-curator-1.5.0-mcp-15.tgz |
|
elasticsearch-exporter |
https://binary.mirantis.com/stacklight/helm/elasticsearch-exporter-1.2.0-mcp-10.tgz |
|
fluentd-logs |
https://binary.mirantis.com/stacklight/helm/fluentd-logs-0.1.0-mcp-223.tgz |
|
grafana |
https://binary.mirantis.com/stacklight/helm/grafana-3.3.10-mcp-290.tgz |
|
iam-proxy |
||
metric-collector |
https://binary.mirantis.com/stacklight/helm/metric-collector-0.3.0-mcp-17.tgz |
|
metricbeat |
https://binary.mirantis.com/stacklight/helm/metricbeat-1.7.1-mcp-25.tgz |
|
opensearch Updated |
https://binary.mirantis.com/stacklight/helm/opensearch-0.1.0-mcp-88.tgz |
|
opensearch-dashboards |
https://binary.mirantis.com/stacklight/helm/opensearch-dashboards-0.1.0-mcp-54.tgz |
|
patroni |
https://binary.mirantis.com/stacklight/helm/patroni-0.15.1-mcp-59.tgz |
|
prometheus |
https://binary.mirantis.com/stacklight/helm/prometheus-8.11.4-mcp-258.tgz |
|
prometheus-blackbox-exporter |
https://binary.mirantis.com/stacklight/helm/prometheus-blackbox-exporter-0.3.0-mcp-19.tgz |
|
prometheus-es-exporter |
https://binary.mirantis.com/stacklight/helm/prometheus-es-exporter-1.0.0-mcp-18.tgz |
|
prometheus-msteams |
https://binary.mirantis.com/stacklight/helm/prometheus-msteams-0.1.0-mcp-12.tgz |
|
refapp |
https://binary.mirantis.com/scale/helm/refapp-0.2.1-mcp-16.tgz |
|
sf-notifier |
https://binary.mirantis.com/stacklight/helm/sf-notifier-0.2.0-mcp-10.tgz |
|
sf-reporter |
https://binary.mirantis.com/stacklight/helm/sf-reporter-0.2.0-mcp-10.tgz |
|
stacklight Updated |
https://binary.mirantis.com/stacklight/helm/stacklight-0.14.14.tgz |
|
telegraf-ds |
https://binary.mirantis.com/stacklight/helm/telegraf-ds-1.1.5-mcp-42.tgz |
|
telegraf-s |
https://binary.mirantis.com/stacklight/helm/telegraf-s-1.1.5-mcp-42.tgz |
|
telemeter-client |
https://binary.mirantis.com/stacklight/helm/telemeter-client-0.2.0-mcp-14.tgz |
|
telemeter-server |
https://binary.mirantis.com/stacklight/helm/telemeter-server-0.2.0-mcp-14.tgz |
|
Docker images |
alerta-web Updated |
mirantis.azurecr.io/stacklight/alerta-web:9-20240701140358 |
alertmanager Updated |
mirantis.azurecr.io/stacklight/alertmanager:v0-20240701140403 |
|
alertmanager-webhook-servicenow |
mirantis.azurecr.io/stacklight/alertmanager-webhook-servicenow:v0.1-20240318145925 |
|
alpine-utils Updated |
mirantis.azurecr.io/stacklight/alpine-utils:1-20240701140404 |
|
blackbox-exporter |
mirantis.azurecr.io/stacklight/blackbox-exporter:0-20240408080237 |
|
cadvisor Updated |
mirantis.azurecr.io/stacklight/cadvisor:v0.47-20240701140359 |
|
configmap-reload |
mirantis.azurecr.io/stacklight/configmap-reload:v0.8.0 |
|
curator |
mirantis.azurecr.io/stacklight/curator:5.7.6-20230404082402 |
|
elasticsearch-exporter |
mirantis.azurecr.io/stacklight/elasticsearch-exporter:v1.5.0 |
|
fluentd Updated |
mirantis.azurecr.io/stacklight/fluentd:1.15-20240701140357 |
|
grafana |
mirantis.azurecr.io/stacklight/grafana:10.3.1 |
|
grafana-image-renderer |
mirantis.azurecr.io/stacklight/grafana-image-renderer:3-20240318142141 |
|
k8s-sidecar Updated |
mirantis.azurecr.io/stacklight/k8s-sidecar:1-20240701140403 |
|
kube-state-metrics |
mirantis.azurecr.io/stacklight/kube-state-metrics:v2.10.1 |
|
kubectl Updated |
mirantis.azurecr.io/stacklight/kubectl:1.22-20240701140401 |
|
metric-collector Updated |
mirantis.azurecr.io/stacklight/metric-collector:v0.1-20240701140400 |
|
metricbeat Updated |
mirantis.azurecr.io/stacklight/metricbeat:7.12.1-20240626023010 |
|
node-exporter |
mirantis.azurecr.io/stacklight/node-exporter:v1.7.0 |
|
oauth2-proxy |
mirantis.azurecr.io/iam/oauth2-proxy:v7.1.3-8 |
|
opensearch Updated |
mirantis.azurecr.io/stacklight/opensearch:2-20240701140359 |
|
opensearch-dashboards Updated |
mirantis.azurecr.io/stacklight/opensearch-dashboards:2-20240701140352 |
|
openstack-refapp |
mirantis.azurecr.io/openstack/openstack-refapp:0.1.7 |
|
pgbouncer Updated |
mirantis.azurecr.io/stacklight/pgbouncer:1-20240701140404 |
|
prometheus |
mirantis.azurecr.io/stacklight/prometheus:v2.48.0 |
|
prometheus-es-exporter Updated |
mirantis.azurecr.io/stacklight/prometheus-es-exporter:v0.14.0-20240701140403 |
|
prometheus-msteams |
mirantis.azurecr.io/stacklight/prometheus-msteams:v1.5-20240408080322 |
|
prometheus-patroni-exporter Updated |
mirantis.azurecr.io/stacklight/prometheus-patroni-exporter:0.0.1-20240701140402 |
|
prometheus-postgres-exporter |
mirantis.azurecr.io/stacklight/prometheus-postgres-exporter:v0.15.0 |
|
prometheus-relay Updated |
mirantis.azurecr.io/stacklight/prometheus-relay:v0.4-20240701140404 |
|
psql-client |
mirantis.azurecr.io/scale/psql-client:v13-20240222083402 |
|
sf-notifier Updated |
mirantis.azurecr.io/stacklight/sf-notifier:v0.4-20240701140403 |
|
sf-reporter |
mirantis.azurecr.io/stacklight/sf-reporter:v0.1-20240318145903 |
|
spilo Updated |
mirantis.azurecr.io/stacklight/spilo:13-2.1p9-20240701140359 |
|
stacklight-toolkit Updated |
mirantis.azurecr.io/stacklight/stacklight-toolkit:20240701140402 |
|
telegraf |
mirantis.azurecr.io/stacklight/telegraf:v1.9.1-20240605023010 Updated |
|
mirantis.azurecr.io/stacklight/telegraf:1-20240426131156 |
||
telemeter Updated |
mirantis.azurecr.io/stacklight/telemeter:4.4-20240701140401 |
|
telemeter-token-auth Updated |
mirantis.azurecr.io/stacklight/telemeter-token-auth:v0.1-20240701140402 |
Artifact |
Component |
Path |
|---|---|---|
Debian repositories |
System packages |
|
http://mirror.mirantis.com/kaas/kubernetes-extra-rhel7-0.0.8/ |
||
https://mirror.mirantis.com/kaas/ubuntu-2024-06-27-014654/ Updated |
||
https://mirror.mirantis.com/kaas/ubuntu-2024-06-27-014654.target.txt Updated |
||
MCR repositories |
MCR |
https://repos.mirantis.com/ubuntu/dists/focal/pool/stable-23.0/ |
Target ubuntu system 1 |
Ubuntu |
https://binary.mirantis.com/bm/bin/efi/ubuntu/tgz-focal-20240627095142 Updated |
- 1
Only for bare metal clusters
This section includes release notes for the patch Cluster release 16.1.5 that is introduced in the Container Cloud patch release 2.26.5 and is based on the previous Cluster releases of the 16.1.x series series.
This Cluster release supports Mirantis Kubernetes Engine 3.7.8 with Kubernetes 1.27 and Mirantis Container Runtime 23.0.9.
For the list of CVE fixes delivered with this patch Cluster release, see 2.26.5
For details on patch release delivery, see Patch releases
This section lists the artifacts of components included in the Cluster release 16.1.5.
Note
The components that are newly added, updated, deprecated, or removed
as compared to the previous release version, are marked
with a corresponding superscript,
for example, lcm-ansible Updated.
Artifact |
Component |
Path |
|---|---|---|
Helm chart Updated |
ceph-controller |
https://binary.mirantis.com/ceph/helm/ceph-operator-1.0.0-mcc-2.26.5-1.tgz |
Docker images |
ceph Updated |
mirantis.azurecr.io/mirantis/ceph:v17.2.7-13.cve |
ceph-controller Updated |
mirantis.azurecr.io/ceph/mcp/ceph-controller:2.26.5-0 |
|
cephcsi Updated |
mirantis.azurecr.io/mirantis/cephcsi:v3.9.0-10.cve |
|
cephcsi-registrar |
mirantis.azurecr.io/mirantis/cephcsi-registrar:v2.9.2-3.cve |
|
cephcsi-provisioner |
mirantis.azurecr.io/mirantis/cephcsi-provisioner:v3.6.2-3.cve |
|
cephcsi-snapshotter |
mirantis.azurecr.io/mirantis/cephcsi-snapshotter:v6.3.2-3.cve |
|
cephcsi-attacher |
mirantis.azurecr.io/mirantis/cephcsi-attacher:v4.4.2-3.cve |
|
cephcsi-resizer |
mirantis.azurecr.io/mirantis/cephcsi-resizer:v1.9.2-3.cve |
|
rook Updated |
mirantis.azurecr.io/ceph/rook:v1.12.10-19 |
Artifact |
Component |
Path |
|---|---|---|
Binaries |
lcm-ansible |
https://binary.mirantis.com/lcm/bin/lcm-ansible/v0.24.0-47-gf77368e/lcm-ansible.tar.gz |
lcm-agent Updated |
||
Helm charts Updated |
helm-controller |
https://binary.mirantis.com/core/helm/helm-controller-1.39.28.tgz |
managed-lcm-api |
https://binary.mirantis.com/core/helm/managed-lcm-api-1.39.28.tgz |
|
Docker images Updated |
helm-controller |
mirantis.azurecr.io/core/lcm-controller:1.39.28 |
Artifact |
Component |
Path |
|---|---|---|
Helm charts |
alerta |
https://binary.mirantis.com/stacklight/helm/alerta-0.1.0-mcp-33.tgz |
alertmanager-webhook-servicenow |
https://binary.mirantis.com/stacklight/helm/alertmanager-webhook-servicenow-0.2.0-mcp-8.tgz |
|
cadvisor |
https://binary.mirantis.com/stacklight/helm/cadvisor-0.1.0-mcp-7.tgz |
|
elasticsearch-curator |
https://binary.mirantis.com/stacklight/helm/elasticsearch-curator-1.5.0-mcp-15.tgz |
|
elasticsearch-exporter |
https://binary.mirantis.com/stacklight/helm/elasticsearch-exporter-1.2.0-mcp-10.tgz |
|
fluentd-logs |
https://binary.mirantis.com/stacklight/helm/fluentd-logs-0.1.0-mcp-223.tgz |
|
grafana |
https://binary.mirantis.com/stacklight/helm/grafana-3.3.10-mcp-290.tgz |
|
iam-proxy |
||
metric-collector |
https://binary.mirantis.com/stacklight/helm/metric-collector-0.3.0-mcp-17.tgz |
|
metricbeat |
https://binary.mirantis.com/stacklight/helm/metricbeat-1.7.1-mcp-25.tgz |
|
opensearch |
https://binary.mirantis.com/stacklight/helm/opensearch-0.1.0-mcp-86.tgz |
|
opensearch-dashboards |
https://binary.mirantis.com/stacklight/helm/opensearch-dashboards-0.1.0-mcp-54.tgz |
|
patroni |
https://binary.mirantis.com/stacklight/helm/patroni-0.15.1-mcp-59.tgz |
|
prometheus |
https://binary.mirantis.com/stacklight/helm/prometheus-8.11.4-mcp-258.tgz |
|
prometheus-blackbox-exporter |
https://binary.mirantis.com/stacklight/helm/prometheus-blackbox-exporter-0.3.0-mcp-19.tgz |
|
prometheus-es-exporter |
https://binary.mirantis.com/stacklight/helm/prometheus-es-exporter-1.0.0-mcp-18.tgz |
|
prometheus-msteams |
https://binary.mirantis.com/stacklight/helm/prometheus-msteams-0.1.0-mcp-12.tgz |
|
refapp |
https://binary.mirantis.com/scale/helm/refapp-0.2.1-mcp-16.tgz |
|
sf-notifier |
https://binary.mirantis.com/stacklight/helm/sf-notifier-0.2.0-mcp-10.tgz |
|
sf-reporter |
https://binary.mirantis.com/stacklight/helm/sf-reporter-0.2.0-mcp-10.tgz |
|
stacklight Updated |
https://binary.mirantis.com/stacklight/helm/stacklight-0.14.11.tgz |
|
telegraf-ds |
https://binary.mirantis.com/stacklight/helm/telegraf-ds-1.1.5-mcp-42.tgz |
|
telegraf-s |
https://binary.mirantis.com/stacklight/helm/telegraf-s-1.1.5-mcp-42.tgz |
|
telemeter-client |
https://binary.mirantis.com/stacklight/helm/telemeter-client-0.2.0-mcp-14.tgz |
|
telemeter-server |
https://binary.mirantis.com/stacklight/helm/telemeter-server-0.2.0-mcp-14.tgz |
|
Docker images |
alerta-web Updated |
mirantis.azurecr.io/stacklight/alerta-web:9-20240515023009 |
alertmanager Updated |
mirantis.azurecr.io/stacklight/alertmanager:v0-20240515023012 |
|
alertmanager-webhook-servicenow |
mirantis.azurecr.io/stacklight/alertmanager-webhook-servicenow:v0.1-20240318145925 |
|
alpine-utils Updated |
mirantis.azurecr.io/stacklight/alpine-utils:1-20240515023017 |
|
blackbox-exporter |
mirantis.azurecr.io/stacklight/blackbox-exporter:0-20240408080237 |
|
cadvisor Updated |
mirantis.azurecr.io/stacklight/cadvisor:v0.47-20240515023012 |
|
configmap-reload |
mirantis.azurecr.io/stacklight/configmap-reload:v0.8.0 |
|
curator |
mirantis.azurecr.io/stacklight/curator:5.7.6-20230404082402 |
|
elasticsearch-exporter |
mirantis.azurecr.io/stacklight/elasticsearch-exporter:v1.5.0 |
|
fluentd Updated |
mirantis.azurecr.io/stacklight/fluentd:1.15-20240515023009 |
|
grafana |
mirantis.azurecr.io/stacklight/grafana:10.3.1 |
|
grafana-image-renderer |
mirantis.azurecr.io/stacklight/grafana-image-renderer:3-20240318142141 |
|
k8s-sidecar Updated |
mirantis.azurecr.io/stacklight/k8s-sidecar:1-20240515023018 |
|
kube-state-metrics |
mirantis.azurecr.io/stacklight/kube-state-metrics:v2.10.1 |
|
kubectl Updated |
mirantis.azurecr.io/stacklight/kubectl:1.22-20240515023015 |
|
metric-collector Updated |
mirantis.azurecr.io/stacklight/metric-collector:v0.1-20240515023016 |
|
metricbeat Updated |
mirantis.azurecr.io/stacklight/metricbeat:7.12.1-20240515023009 |
|
node-exporter |
mirantis.azurecr.io/stacklight/node-exporter:v1.7.0 |
|
oauth2-proxy |
mirantis.azurecr.io/iam/oauth2-proxy:v7.1.3-8 |
|
opensearch Updated |
mirantis.azurecr.io/stacklight/opensearch:2-20240515023012 |
|
opensearch-dashboards Updated |
mirantis.azurecr.io/stacklight/opensearch-dashboards:2-20240515023010 |
|
openstack-refapp |
mirantis.azurecr.io/openstack/openstack-refapp:0.1.7 |
|
pgbouncer Updated |
mirantis.azurecr.io/stacklight/pgbouncer:1-20240515023018 |
|
prometheus |
mirantis.azurecr.io/stacklight/prometheus:v2.48.0 |
|
prometheus-es-exporter Updated |
mirantis.azurecr.io/stacklight/prometheus-es-exporter:v0.14.0-20240515023016 |
|
prometheus-msteams |
mirantis.azurecr.io/stacklight/prometheus-msteams:v1.5-20240408080322 |
|
prometheus-patroni-exporter Updated |
mirantis.azurecr.io/stacklight/prometheus-patroni-exporter:0.0.1-20240515023017 |
|
prometheus-postgres-exporter |
mirantis.azurecr.io/stacklight/prometheus-postgres-exporter:v0.15.0 |
|
prometheus-relay Updated |
mirantis.azurecr.io/stacklight/prometheus-relay:v0.4-20240515023017 |
|
psql-client |
mirantis.azurecr.io/scale/psql-client:v13-20240222083402 |
|
sf-notifier Updated |
mirantis.azurecr.io/stacklight/sf-notifier:v0.4-20240515023012 |
|
sf-reporter |
mirantis.azurecr.io/stacklight/sf-reporter:v0.1-20240318145903 |
|
spilo Updated |
mirantis.azurecr.io/stacklight/spilo:13-2.1p9-20240515023010 |
|
stacklight-toolkit Updated |
mirantis.azurecr.io/stacklight/stacklight-toolkit:20240515023016 |
|
telegraf |
mirantis.azurecr.io/stacklight/telegraf:v1.9.1-20240515023008 Updated |
|
mirantis.azurecr.io/stacklight/telegraf:1-20240426131156 |
||
telemeter Updated |
mirantis.azurecr.io/stacklight/telemeter:4.4-20240515023015 |
|
telemeter-token-auth Updated |
mirantis.azurecr.io/stacklight/telemeter-token-auth:v0.1-20240515023012 |
Artifact |
Component |
Path |
|---|---|---|
Debian repositories |
System packages |
|
http://mirror.mirantis.com/kaas/kubernetes-extra-rhel7-0.0.8/ |
||
https://mirror.mirantis.com/kaas/ubuntu-2024-05-17-013445/ Updated |
||
https://mirror.mirantis.com/kaas/ubuntu-2024-05-17-013445.target.txt Updated |
||
MCR repositories |
MCR |
https://repos.mirantis.com/ubuntu/dists/focal/pool/stable-23.0/ |
Target ubuntu system 1 |
Ubuntu |
https://binary.mirantis.com/bm/bin/efi/ubuntu/tgz-focal-20240517090228 Updated |
- 1
Only for bare metal clusters
This section includes release notes for the patch Cluster release 16.1.4 that is introduced in the Container Cloud patch release 2.26.4 and is based on the previous Cluster releases of the 16.1.x series series.
This Cluster release supports Mirantis Kubernetes Engine 3.7.8 with Kubernetes 1.27 and Mirantis Container Runtime 23.0.9.
For the list of enhancements and CVE fixes delivered with this patch Cluster release, see 2.26.4
For details on patch release delivery, see Patch releases
This section lists the artifacts of components included in the Cluster release 16.1.4.
Note
The components that are newly added, updated, deprecated, or removed
as compared to the previous release version, are marked
with a corresponding superscript,
for example, lcm-ansible Updated.
Artifact |
Component |
Path |
|---|---|---|
Helm chart Updated |
ceph-controller |
https://binary.mirantis.com/ceph/helm/ceph-operator-1.0.0-mcc-2.26.4-1.tgz |
Docker images |
ceph Updated |
mirantis.azurecr.io/mirantis/ceph:v17.2.7-12.cve |
ceph-controller Updated |
mirantis.azurecr.io/ceph/mcp/ceph-controller:2.26.4-0 |
|
cephcsi Updated |
mirantis.azurecr.io/mirantis/cephcsi:v3.9.0-9.cve |
|
cephcsi-registrar |
mirantis.azurecr.io/mirantis/cephcsi-registrar:v2.9.2-3.cve |
|
cephcsi-provisioner |
mirantis.azurecr.io/mirantis/cephcsi-provisioner:v3.6.2-3.cve |
|
cephcsi-snapshotter |
mirantis.azurecr.io/mirantis/cephcsi-snapshotter:v6.3.2-3.cve |
|
cephcsi-attacher |
mirantis.azurecr.io/mirantis/cephcsi-attacher:v4.4.2-3.cve |
|
cephcsi-resizer |
mirantis.azurecr.io/mirantis/cephcsi-resizer:v1.9.2-3.cve |
|
rook Updated |
mirantis.azurecr.io/ceph/rook:v1.12.10-18 |
Artifact |
Component |
Path |
|---|---|---|
Binaries |
lcm-ansible |
https://binary.mirantis.com/lcm/bin/lcm-ansible/v0.24.0-47-gf77368e/lcm-ansible.tar.gz |
lcm-agent Updated |
||
Helm charts Updated |
helm-controller |
https://binary.mirantis.com/core/helm/helm-controller-1.39.26.tgz |
managed-lcm-api |
https://binary.mirantis.com/core/helm/managed-lcm-api-1.39.26.tgz |
|
Docker images Updated |
helm-controller |
mirantis.azurecr.io/core/lcm-controller:1.39.26 |
Artifact |
Component |
Path |
|---|---|---|
Helm charts |
alerta |
https://binary.mirantis.com/stacklight/helm/alerta-0.1.0-mcp-33.tgz |
alertmanager-webhook-servicenow |
https://binary.mirantis.com/stacklight/helm/alertmanager-webhook-servicenow-0.2.0-mcp-8.tgz |
|
cadvisor |
https://binary.mirantis.com/stacklight/helm/cadvisor-0.1.0-mcp-7.tgz |
|
elasticsearch-curator |
https://binary.mirantis.com/stacklight/helm/elasticsearch-curator-1.5.0-mcp-15.tgz |
|
elasticsearch-exporter |
https://binary.mirantis.com/stacklight/helm/elasticsearch-exporter-1.2.0-mcp-10.tgz |
|
fluentd-logs |
https://binary.mirantis.com/stacklight/helm/fluentd-logs-0.1.0-mcp-223.tgz |
|
grafana |
https://binary.mirantis.com/stacklight/helm/grafana-3.3.10-mcp-290.tgz |
|
iam-proxy |
||
metric-collector |
https://binary.mirantis.com/stacklight/helm/metric-collector-0.3.0-mcp-17.tgz |
|
metricbeat |
https://binary.mirantis.com/stacklight/helm/metricbeat-1.7.1-mcp-25.tgz |
|
opensearch |
https://binary.mirantis.com/stacklight/helm/opensearch-0.1.0-mcp-86.tgz |
|
opensearch-dashboards |
https://binary.mirantis.com/stacklight/helm/opensearch-dashboards-0.1.0-mcp-54.tgz |
|
patroni |
https://binary.mirantis.com/stacklight/helm/patroni-0.15.1-mcp-59.tgz |
|
prometheus |
https://binary.mirantis.com/stacklight/helm/prometheus-8.11.4-mcp-258.tgz |
|
prometheus-blackbox-exporter |
https://binary.mirantis.com/stacklight/helm/prometheus-blackbox-exporter-0.3.0-mcp-19.tgz |
|
prometheus-es-exporter |
https://binary.mirantis.com/stacklight/helm/prometheus-es-exporter-1.0.0-mcp-18.tgz |
|
prometheus-msteams |
https://binary.mirantis.com/stacklight/helm/prometheus-msteams-0.1.0-mcp-12.tgz |
|
refapp |
https://binary.mirantis.com/scale/helm/refapp-0.2.1-mcp-16.tgz |
|
sf-notifier |
https://binary.mirantis.com/stacklight/helm/sf-notifier-0.2.0-mcp-10.tgz |
|
sf-reporter |
https://binary.mirantis.com/stacklight/helm/sf-reporter-0.2.0-mcp-10.tgz |
|
stacklight Updated |
https://binary.mirantis.com/stacklight/helm/stacklight-0.14.10.tgz |
|
telegraf-ds |
https://binary.mirantis.com/stacklight/helm/telegraf-ds-1.1.5-mcp-42.tgz |
|
telegraf-s |
https://binary.mirantis.com/stacklight/helm/telegraf-s-1.1.5-mcp-42.tgz |
|
telemeter-client |
https://binary.mirantis.com/stacklight/helm/telemeter-client-0.2.0-mcp-14.tgz |
|
telemeter-server |
https://binary.mirantis.com/stacklight/helm/telemeter-server-0.2.0-mcp-14.tgz |
|
Docker images |
alerta-web Updated |
mirantis.azurecr.io/stacklight/alerta-web:9-20240424023010 |
alertmanager Updated |
mirantis.azurecr.io/stacklight/alertmanager:v0-20240424023016 |
|
alertmanager-webhook-servicenow |
mirantis.azurecr.io/stacklight/alertmanager-webhook-servicenow:v0.1-20240318145925 |
|
alpine-utils Updated |
mirantis.azurecr.io/stacklight/alpine-utils:1-20240424023018 |
|
blackbox-exporter |
mirantis.azurecr.io/stacklight/blackbox-exporter:0-20240408080237 |
|
cadvisor Updated |
mirantis.azurecr.io/stacklight/cadvisor:v0.47-20240424023015 |
|
configmap-reload |
mirantis.azurecr.io/stacklight/configmap-reload:v0.8.0 |
|
curator |
mirantis.azurecr.io/stacklight/curator:5.7.6-20230404082402 |
|
elasticsearch-exporter |
mirantis.azurecr.io/stacklight/elasticsearch-exporter:v1.5.0 |
|
fluentd Updated |
mirantis.azurecr.io/stacklight/fluentd:1.15-20240424023010 |
|
grafana |
mirantis.azurecr.io/stacklight/grafana:10.3.1 |
|
grafana-image-renderer |
mirantis.azurecr.io/stacklight/grafana-image-renderer:3-20240318142141 |
|
k8s-sidecar Updated |
mirantis.azurecr.io/stacklight/k8s-sidecar:1-20240424023020 |
|
kube-state-metrics |
mirantis.azurecr.io/stacklight/kube-state-metrics:v2.10.1 |
|
kubectl Updated |
mirantis.azurecr.io/stacklight/kubectl:1.22-20240424023017 |
|
metric-collector Updated |
mirantis.azurecr.io/stacklight/metric-collector:v0.1-20240424023015 |
|
metricbeat Updated |
mirantis.azurecr.io/stacklight/metricbeat:7.12.1-20240424023010 |
|
node-exporter |
mirantis.azurecr.io/stacklight/node-exporter:v1.7.0 |
|
oauth2-proxy |
mirantis.azurecr.io/iam/oauth2-proxy:v7.1.3-8 |
|
opensearch Updated |
mirantis.azurecr.io/stacklight/opensearch:2-20240424023015 |
|
opensearch-dashboards Updated |
mirantis.azurecr.io/stacklight/opensearch-dashboards:2-20240424023010 |
|
openstack-refapp Updated |
mirantis.azurecr.io/openstack/openstack-refapp:0.1.7 |
|
pgbouncer Updated |
mirantis.azurecr.io/stacklight/pgbouncer:1-20240424023020 |
|
prometheus |
mirantis.azurecr.io/stacklight/prometheus:v2.48.0 |
|
prometheus-es-exporter Updated |
mirantis.azurecr.io/stacklight/prometheus-es-exporter:v0.14.0-20240424023018 |
|
prometheus-msteams |
mirantis.azurecr.io/stacklight/prometheus-msteams:v1.5-20240408080322 |
|
prometheus-patroni-exporter Updated |
mirantis.azurecr.io/stacklight/prometheus-patroni-exporter:0.0.1-20240424023018 |
|
prometheus-postgres-exporter |
mirantis.azurecr.io/stacklight/prometheus-postgres-exporter:v0.15.0 |
|
prometheus-relay Updated |
mirantis.azurecr.io/stacklight/prometheus-relay:v0.4-20240424023017 |
|
psql-client |
mirantis.azurecr.io/scale/psql-client:v13-20240222083402 |
|
sf-notifier Updated |
mirantis.azurecr.io/stacklight/sf-notifier:v0.4-20240424023015 |
|
sf-reporter |
mirantis.azurecr.io/stacklight/sf-reporter:v0.1-20240318145903 |
|
spilo Updated |
mirantis.azurecr.io/stacklight/spilo:13-2.1p9-20240424023015 |
|
stacklight-toolkit Updated |
mirantis.azurecr.io/stacklight/stacklight-toolkit:20240424023017 |
|
telegraf |
mirantis.azurecr.io/stacklight/telegraf:v1.9.1-20240424023009 Updated |
|
mirantis.azurecr.io/stacklight/telegraf:1-20240426131156 Updated |
||
telemeter Updated |
mirantis.azurecr.io/stacklight/telemeter:4.4-20240424023014 |
|
telemeter-token-auth Updated |
mirantis.azurecr.io/stacklight/telemeter-token-auth:v0.1-20240424023015 |
Artifact |
Component |
Path |
|---|---|---|
Debian repositories |
System packages |
|
http://mirror.mirantis.com/kaas/kubernetes-extra-rhel7-0.0.8/ |
||
https://mirror.mirantis.com/kaas/ubuntu-2024-05-02-014050/ Updated |
||
https://mirror.mirantis.com/kaas/ubuntu-2024-05-02-014050.target.txt Updated |
||
MCR repositories |
MCR |
https://repos.mirantis.com/ubuntu/dists/focal/pool/stable-23.0/ |
Target ubuntu system 1 |
Ubuntu |
https://binary.mirantis.com/bm/bin/efi/ubuntu/tgz-focal-20240502102020 Updated |
- 1
Only for bare metal clusters
This section includes release notes for the patch Cluster release 16.1.3 that is introduced in the Container Cloud patch release 2.26.3 and is based on the previous Cluster releases of the 16.1.x series series.
This Cluster release supports Mirantis Kubernetes Engine 3.7.7 with Kubernetes 1.27 and Mirantis Container Runtime 23.0.9.
For the list of enhancements and CVE fixes delivered with this patch Cluster release, see 2.26.3
For details on patch release delivery, see Patch releases
This section lists the artifacts of components included in the Cluster release 16.1.3.
Note
The components that are newly added, updated, deprecated, or removed
as compared to the previous release version, are marked
with a corresponding superscript,
for example, lcm-ansible Updated.
Artifact |
Component |
Path |
|---|---|---|
Helm chart Updated |
ceph-controller |
https://binary.mirantis.com/ceph/helm/ceph-operator-1.0.0-mcc-2.26.3-1.tgz |
Docker images Updated |
ceph |
mirantis.azurecr.io/mirantis/ceph:v17.2.7-11.cve |
ceph-controller |
mirantis.azurecr.io/ceph/mcp/ceph-controller:2.26.3-0 |
|
cephcsi |
mirantis.azurecr.io/mirantis/cephcsi:v3.9.0-8.cve |
|
cephcsi-registrar |
mirantis.azurecr.io/mirantis/cephcsi-registrar:v2.9.2-3.cve |
|
cephcsi-provisioner |
mirantis.azurecr.io/mirantis/cephcsi-provisioner:v3.6.2-3.cve |
|
cephcsi-snapshotter |
mirantis.azurecr.io/mirantis/cephcsi-snapshotter:v6.3.2-3.cve |
|
cephcsi-attacher |
mirantis.azurecr.io/mirantis/cephcsi-attacher:v4.4.2-3.cve |
|
cephcsi-resizer |
mirantis.azurecr.io/mirantis/cephcsi-resizer:v1.9.2-3.cve |
|
rook |
mirantis.azurecr.io/ceph/rook:v1.12.10-17 |
Artifact |
Component |
Path |
|---|---|---|
Binaries |
lcm-ansible |
https://binary.mirantis.com/lcm/bin/lcm-ansible/v0.24.0-47-gf77368e/lcm-ansible.tar.gz |
lcm-agent Updated |
||
Helm charts Updated |
helm-controller |
https://binary.mirantis.com/core/helm/helm-controller-1.39.23.tgz |
managed-lcm-api |
https://binary.mirantis.com/core/helm/managed-lcm-api-1.39.23.tgz |
|
Docker images Updated |
helm-controller |
mirantis.azurecr.io/core/lcm-controller:1.39.23 |
Artifact |
Component |
Path |
|---|---|---|
Helm charts |
alerta |
https://binary.mirantis.com/stacklight/helm/alerta-0.1.0-mcp-33.tgz |
alertmanager-webhook-servicenow |
https://binary.mirantis.com/stacklight/helm/alertmanager-webhook-servicenow-0.2.0-mcp-8.tgz |
|
cadvisor |
https://binary.mirantis.com/stacklight/helm/cadvisor-0.1.0-mcp-7.tgz |
|
elasticsearch-curator |
https://binary.mirantis.com/stacklight/helm/elasticsearch-curator-1.5.0-mcp-15.tgz |
|
elasticsearch-exporter |
https://binary.mirantis.com/stacklight/helm/elasticsearch-exporter-1.2.0-mcp-10.tgz |
|
fluentd-logs |
https://binary.mirantis.com/stacklight/helm/fluentd-logs-0.1.0-mcp-223.tgz |
|
grafana |
https://binary.mirantis.com/stacklight/helm/grafana-3.3.10-mcp-290.tgz |
|
iam-proxy |
||
metric-collector |
https://binary.mirantis.com/stacklight/helm/metric-collector-0.3.0-mcp-17.tgz |
|
metricbeat |
https://binary.mirantis.com/stacklight/helm/metricbeat-1.7.1-mcp-25.tgz |
|
opensearch |
https://binary.mirantis.com/stacklight/helm/opensearch-0.1.0-mcp-86.tgz |
|
opensearch-dashboards |
https://binary.mirantis.com/stacklight/helm/opensearch-dashboards-0.1.0-mcp-54.tgz |
|
patroni |
https://binary.mirantis.com/stacklight/helm/patroni-0.15.1-mcp-59.tgz |
|
prometheus |
https://binary.mirantis.com/stacklight/helm/prometheus-8.11.4-mcp-258.tgz |
|
prometheus-blackbox-exporter |
https://binary.mirantis.com/stacklight/helm/prometheus-blackbox-exporter-0.3.0-mcp-19.tgz |
|
prometheus-es-exporter |
https://binary.mirantis.com/stacklight/helm/prometheus-es-exporter-1.0.0-mcp-18.tgz |
|
prometheus-msteams |
https://binary.mirantis.com/stacklight/helm/prometheus-msteams-0.1.0-mcp-12.tgz |
|
refapp |
https://binary.mirantis.com/scale/helm/refapp-0.2.1-mcp-16.tgz |
|
sf-notifier |
https://binary.mirantis.com/stacklight/helm/sf-notifier-0.2.0-mcp-10.tgz |
|
sf-reporter |
https://binary.mirantis.com/stacklight/helm/sf-reporter-0.2.0-mcp-10.tgz |
|
stacklight Updated |
https://binary.mirantis.com/stacklight/helm/stacklight-0.14.9.tgz |
|
telegraf-ds |
https://binary.mirantis.com/stacklight/helm/telegraf-ds-1.1.5-mcp-42.tgz |
|
telegraf-s |
https://binary.mirantis.com/stacklight/helm/telegraf-s-1.1.5-mcp-42.tgz |
|
telemeter-client |
https://binary.mirantis.com/stacklight/helm/telemeter-client-0.2.0-mcp-14.tgz |
|
telemeter-server |
https://binary.mirantis.com/stacklight/helm/telemeter-server-0.2.0-mcp-14.tgz |
|
Docker images |
alerta-web Updated |
mirantis.azurecr.io/stacklight/alerta-web:9-20240403023008 |
alertmanager Updated |
mirantis.azurecr.io/stacklight/alertmanager:v0-20240408080051 |
|
alertmanager-webhook-servicenow |
mirantis.azurecr.io/stacklight/alertmanager-webhook-servicenow:v0.1-20240318145925 |
|
alpine-utils Updated |
mirantis.azurecr.io/stacklight/alpine-utils:1-20240403023017 |
|
blackbox-exporter Updated |
mirantis.azurecr.io/stacklight/blackbox-exporter:0-20240408080237 |
|
cadvisor Updated |
mirantis.azurecr.io/stacklight/cadvisor:v0.47-20240408140050 |
|
configmap-reload |
mirantis.azurecr.io/stacklight/configmap-reload:v0.8.0 |
|
curator |
mirantis.azurecr.io/stacklight/curator:5.7.6-20230404082402 |
|
elasticsearch-exporter |
mirantis.azurecr.io/stacklight/elasticsearch-exporter:v1.5.0 |
|
fluentd Updated |
mirantis.azurecr.io/stacklight/fluentd:1.15-20240403023009 |
|
grafana |
mirantis.azurecr.io/stacklight/grafana:10.3.1 |
|
grafana-image-renderer |
mirantis.azurecr.io/stacklight/grafana-image-renderer:3-20240318142141 |
|
k8s-sidecar Updated |
mirantis.azurecr.io/stacklight/k8s-sidecar:1-20240403023017 |
|
kube-state-metrics |
mirantis.azurecr.io/stacklight/kube-state-metrics:v2.10.1 |
|
kubectl Updated |
mirantis.azurecr.io/stacklight/kubectl:1.22-20240403023014 |
|
metric-collector Updated |
mirantis.azurecr.io/stacklight/metric-collector:v0.1-20240408155718 |
|
metricbeat Updated |
mirantis.azurecr.io/stacklight/metricbeat:7.12.1-20240408135717 |
|
node-exporter |
mirantis.azurecr.io/stacklight/node-exporter:v1.7.0 |
|
oauth2-proxy Updated |
mirantis.azurecr.io/iam/oauth2-proxy:v7.1.3-8 |
|
opensearch Updated |
mirantis.azurecr.io/stacklight/opensearch:2-20240403023014 |
|
opensearch-dashboards Updated |
mirantis.azurecr.io/stacklight/opensearch-dashboards:2-20240403023009 |
|
openstack-refapp |
mirantis.azurecr.io/openstack/openstack-refapp:0.1.6 |
|
pgbouncer Updated |
mirantis.azurecr.io/stacklight/pgbouncer:1-20240403023017 |
|
prometheus |
mirantis.azurecr.io/stacklight/prometheus:v2.48.0 |
|
prometheus-es-exporter Updated |
mirantis.azurecr.io/stacklight/prometheus-es-exporter:v0.14.0-20240403023016 |
|
prometheus-msteams Updated |
mirantis.azurecr.io/stacklight/prometheus-msteams:v1.5-20240408080322 |
|
prometheus-patroni-exporter Updated |
mirantis.azurecr.io/stacklight/prometheus-patroni-exporter:0.0.1-20240403023017 |
|
prometheus-postgres-exporter |
mirantis.azurecr.io/stacklight/prometheus-postgres-exporter:v0.15.0 |
|
prometheus-relay Updated |
mirantis.azurecr.io/stacklight/prometheus-relay:v0.4-20240408135804 |
|
psql-client |
mirantis.azurecr.io/scale/psql-client:v13-20240222083402 |
|
sf-notifier Updated |
mirantis.azurecr.io/stacklight/sf-notifier:v0.4-20240403023015 |
|
sf-reporter |
mirantis.azurecr.io/stacklight/sf-reporter:v0.1-20240318145903 |
|
spilo Updated |
mirantis.azurecr.io/stacklight/spilo:13-2.1p9-20240403023013 |
|
stacklight-toolkit Updated |
mirantis.azurecr.io/stacklight/stacklight-toolkit:20240403023016 |
|
telegraf |
mirantis.azurecr.io/stacklight/telegraf:v1.9.1-20240403023008 Updated |
|
mirantis.azurecr.io/stacklight/telegraf:1-20240306130859 |
||
telemeter Updated |
mirantis.azurecr.io/stacklight/telemeter:4.4-20240408155750 |
|
telemeter-token-auth Updated |
mirantis.azurecr.io/stacklight/telemeter-token-auth:v0.1-20240408155738 |
Artifact |
Component |
Path |
|---|---|---|
Debian repositories |
System packages |
|
http://mirror.mirantis.com/kaas/kubernetes-extra-rhel7-0.0.8/ |
||
https://mirror.mirantis.com/kaas/ubuntu-2024-04-11-013237/ Updated |
||
https://mirror.mirantis.com/kaas/ubuntu-2024-04-11-013237.target.txt Updated |
||
MCR repositories |
MCR |
https://repos.mirantis.com/ubuntu/dists/focal/pool/stable-23.0/ |
Target ubuntu system 1 |
Ubuntu |
https://binary.mirantis.com/bm/bin/efi/ubuntu/tgz-focal-20240411171541 Updated |
- 1
Only for bare metal clusters
This section includes release notes for the patch Cluster release 16.1.2 that is introduced in the Container Cloud patch release 2.26.2 and is based on the Cluster releases 16.1.1 and 16.1.0.
This Cluster release supports Mirantis Kubernetes Engine 3.7.6
with Kubernetes 1.27 and Mirantis Container Runtime 23.0.9, in which
docker-ee-cli was updated to version 23.0.10 to fix several CVEs.
For the list of enhancements and CVE fixes delivered with this patch Cluster release, see 2.26.2
For details on patch release delivery, see Patch releases
This section lists the artifacts of components included in the Cluster release 16.1.2.
Note
The components that are newly added, updated, deprecated, or removed
as compared to the previous release version, are marked
with a corresponding superscript,
for example, lcm-ansible Updated.
Artifact |
Component |
Path |
|---|---|---|
Helm chart Updated |
ceph-controller |
https://binary.mirantis.com/ceph/helm/ceph-operator-1.0.0-mcc-2.26.2-4.tgz |
Docker images Updated |
ceph |
mirantis.azurecr.io/mirantis/ceph:v17.2.7-10.release |
ceph-controller |
mirantis.azurecr.io/ceph/mcp/ceph-controller:2.26.2-3 |
|
cephcsi |
mirantis.azurecr.io/mirantis/cephcsi:v3.9.0-7.release |
|
cephcsi-registrar |
mirantis.azurecr.io/mirantis/cephcsi-registrar:v2.9.2-2.release |
|
cephcsi-provisioner |
mirantis.azurecr.io/mirantis/cephcsi-provisioner:v3.6.2-2.release |
|
cephcsi-snapshotter |
mirantis.azurecr.io/mirantis/cephcsi-snapshotter:v6.3.2-2.release |
|
cephcsi-attacher |
mirantis.azurecr.io/mirantis/cephcsi-attacher:v4.4.2-2.release |
|
cephcsi-resizer |
mirantis.azurecr.io/mirantis/cephcsi-resizer:v1.9.2-2.release |
|
rook |
mirantis.azurecr.io/ceph/rook:v1.12.10-16 |
Artifact |
Component |
Path |
|---|---|---|
Binaries |
lcm-ansible |
https://binary.mirantis.com/lcm/bin/lcm-ansible/v0.24.0-47-gf77368e/lcm-ansible.tar.gz |
lcm-agent Updated |
||
Helm charts Updated |
helm-controller |
https://binary.mirantis.com/core/helm/helm-controller-1.39.19.tgz |
managed-lcm-api |
https://binary.mirantis.com/core/helm/managed-lcm-api-1.39.19.tgz |
|
Docker images Updated |
helm-controller |
mirantis.azurecr.io/core/lcm-controller:1.39.19 |
Artifact |
Component |
Path |
|---|---|---|
Helm charts |
alerta |
https://binary.mirantis.com/stacklight/helm/alerta-0.1.0-mcp-33.tgz |
alertmanager-webhook-servicenow |
https://binary.mirantis.com/stacklight/helm/alertmanager-webhook-servicenow-0.2.0-mcp-8.tgz |
|
cadvisor |
https://binary.mirantis.com/stacklight/helm/cadvisor-0.1.0-mcp-7.tgz |
|
elasticsearch-curator |
https://binary.mirantis.com/stacklight/helm/elasticsearch-curator-1.5.0-mcp-15.tgz |
|
elasticsearch-exporter |
https://binary.mirantis.com/stacklight/helm/elasticsearch-exporter-1.2.0-mcp-10.tgz |
|
fluentd-logs |
https://binary.mirantis.com/stacklight/helm/fluentd-logs-0.1.0-mcp-223.tgz |
|
grafana Updated |
https://binary.mirantis.com/stacklight/helm/grafana-3.3.10-mcp-290.tgz |
|
iam-proxy |
||
metric-collector |
https://binary.mirantis.com/stacklight/helm/metric-collector-0.3.0-mcp-17.tgz |
|
metricbeat |
https://binary.mirantis.com/stacklight/helm/metricbeat-1.7.1-mcp-25.tgz |
|
opensearch |
https://binary.mirantis.com/stacklight/helm/opensearch-0.1.0-mcp-86.tgz |
|
opensearch-dashboards |
https://binary.mirantis.com/stacklight/helm/opensearch-dashboards-0.1.0-mcp-54.tgz |
|
patroni |
https://binary.mirantis.com/stacklight/helm/patroni-0.15.1-mcp-59.tgz |
|
prometheus |
https://binary.mirantis.com/stacklight/helm/prometheus-8.11.4-mcp-258.tgz |
|
prometheus-blackbox-exporter |
https://binary.mirantis.com/stacklight/helm/prometheus-blackbox-exporter-0.3.0-mcp-19.tgz |
|
prometheus-es-exporter |
https://binary.mirantis.com/stacklight/helm/prometheus-es-exporter-1.0.0-mcp-18.tgz |
|
prometheus-msteams |
https://binary.mirantis.com/stacklight/helm/prometheus-msteams-0.1.0-mcp-12.tgz |
|
refapp |
https://binary.mirantis.com/scale/helm/refapp-0.2.1-mcp-16.tgz |
|
sf-notifier |
https://binary.mirantis.com/stacklight/helm/sf-notifier-0.2.0-mcp-10.tgz |
|
sf-reporter |
https://binary.mirantis.com/stacklight/helm/sf-reporter-0.2.0-mcp-10.tgz |
|
stacklight Updated |
https://binary.mirantis.com/stacklight/helm/stacklight-0.14.8.tgz |
|
telegraf-ds Updated |
https://binary.mirantis.com/stacklight/helm/telegraf-ds-1.1.5-mcp-42.tgz |
|
telegraf-s Updated |
https://binary.mirantis.com/stacklight/helm/telegraf-s-1.1.5-mcp-42.tgz |
|
telemeter-client |
https://binary.mirantis.com/stacklight/helm/telemeter-client-0.2.0-mcp-14.tgz |
|
telemeter-server |
https://binary.mirantis.com/stacklight/helm/telemeter-server-0.2.0-mcp-14.tgz |
|
Docker images |
alerta-web Updated |
mirantis.azurecr.io/stacklight/alerta-web:9-20240318062240 |
alertmanager Updated |
mirantis.azurecr.io/stacklight/alertmanager:v0-20240318062244 |
|
alertmanager-webhook-servicenow Updated |
mirantis.azurecr.io/stacklight/alertmanager-webhook-servicenow:v0.1-20240318145925 |
|
alpine-utils Updated |
mirantis.azurecr.io/stacklight/alpine-utils:1-20240318062249 |
|
blackbox-exporter |
mirantis.azurecr.io/stacklight/blackbox-exporter:0-20231204053401 |
|
cadvisor Updated |
mirantis.azurecr.io/stacklight/cadvisor:v0.47-20240318062245 |
|
configmap-reload |
mirantis.azurecr.io/stacklight/configmap-reload:v0.8.0 |
|
curator |
mirantis.azurecr.io/stacklight/curator:5.7.6-20230404082402 |
|
elasticsearch-exporter |
mirantis.azurecr.io/stacklight/elasticsearch-exporter:v1.5.0 |
|
fluentd Updated |
mirantis.azurecr.io/stacklight/fluentd:1.15-20240318062244 |
|
grafana |
mirantis.azurecr.io/stacklight/grafana:10.3.1 |
|
grafana-image-renderer Updated |
mirantis.azurecr.io/stacklight/grafana-image-renderer:3-20240318142141 |
|
k8s-sidecar Updated |
mirantis.azurecr.io/stacklight/k8s-sidecar:1-20240318062249 |
|
kube-state-metrics |
mirantis.azurecr.io/stacklight/kube-state-metrics:v2.10.1 |
|
kubectl Updated |
mirantis.azurecr.io/stacklight/kubectl:1.22-20240318062246 |
|
metric-collector Updated |
mirantis.azurecr.io/stacklight/metric-collector:v0.1-20240318062249 |
|
metricbeat Updated |
mirantis.azurecr.io/stacklight/metricbeat:7.12.1-20240318062240 |
|
node-exporter |
mirantis.azurecr.io/stacklight/node-exporter:v1.7.0 |
|
oauth2-proxy |
mirantis.azurecr.io/iam/oauth2-proxy:v7.1.3-7 |
|
opensearch Updated |
mirantis.azurecr.io/stacklight/opensearch:2-20240318062244 |
|
opensearch-dashboards Updated |
mirantis.azurecr.io/stacklight/opensearch-dashboards:2-20240318062241 |
|
openstack-refapp |
mirantis.azurecr.io/openstack/openstack-refapp:0.1.6 |
|
pgbouncer Updated |
mirantis.azurecr.io/stacklight/pgbouncer:1-20240318062240 |
|
prometheus |
mirantis.azurecr.io/stacklight/prometheus:v2.48.0 |
|
prometheus-es-exporter Updated |
mirantis.azurecr.io/stacklight/prometheus-es-exporter:v0.14.0-20240318062248 |
|
prometheus-msteams |
mirantis.azurecr.io/stacklight/prometheus-msteams:v1.5-20231204064415 |
|
prometheus-patroni-exporter Updated |
mirantis.azurecr.io/stacklight/prometheus-patroni-exporter:0.0.1-20240318062250 |
|
prometheus-postgres-exporter |
mirantis.azurecr.io/stacklight/prometheus-postgres-exporter:v0.15.0 |
|
prometheus-relay Updated |
mirantis.azurecr.io/stacklight/prometheus-relay:v0.4-20240318062249 |
|
psql-client |
mirantis.azurecr.io/scale/psql-client:v13-20240222083402 |
|
sf-notifier Updated |
mirantis.azurecr.io/stacklight/sf-notifier:v0.4-20240318062246 |
|
sf-reporter Updated |
mirantis.azurecr.io/stacklight/sf-reporter:v0.1-20240318145903 |
|
spilo Updated |
mirantis.azurecr.io/stacklight/spilo:13-2.1p9-20240318062245 |
|
stacklight-toolkit Updated |
mirantis.azurecr.io/stacklight/stacklight-toolkit:20240318062247 |
|
telegraf |
mirantis.azurecr.io/stacklight/telegraf:v1.9.1-20240318062240 Updated |
|
mirantis.azurecr.io/stacklight/telegraf:1-20240306130859 Updated |
||
telemeter Updated |
mirantis.azurecr.io/stacklight/telemeter:4.4-20240318062245 |
|
telemeter-token-auth Updated |
mirantis.azurecr.io/stacklight/telemeter-token-auth:v0.1-20240318062247 |
Artifact |
Component |
Path |
|---|---|---|
Debian repositories |
System packages |
|
http://mirror.mirantis.com/kaas/kubernetes-extra-rhel7-0.0.8/ |
||
https://mirror.mirantis.com/kaas/ubuntu-2024-03-24-012650/ Updated |
||
https://mirror.mirantis.com/kaas/ubuntu-2024-03-24-012650.target.txt Updated |
||
MCR repositories |
MCR |
https://repos.mirantis.com/ubuntu/dists/focal/pool/stable-23.0/ |
Target ubuntu system 1 |
Ubuntu |
https://binary.mirantis.com/bm/bin/efi/ubuntu/tgz-focal-20240324172903 Updated |
- 1
Only for bare metal clusters
This section includes release notes for the patch Cluster release 16.1.1 that is introduced in the Container Cloud patch release 2.26.1 and is based on the Cluster release 16.1.0.
This Cluster release supports Mirantis Kubernetes Engine 3.7.5 with Kubernetes 1.27 and Mirantis Container Runtime 23.0.9.
For the list of enhancements and CVE fixes delivered with this patch Cluster release, see 2.26.1
For details on patch release delivery, see Patch releases
This section lists the artifacts of components included in the Cluster release 16.1.1.
Note
The components that are newly added, updated, deprecated, or removed
as compared to the previous release version, are marked
with a corresponding superscript,
for example, lcm-ansible Updated.
Artifact |
Component |
Path |
|---|---|---|
Helm chart Updated |
ceph-controller |
https://binary.mirantis.com/ceph/helm/ceph-operator-1.0.0-mcc-2.26.1-1.tgz |
Docker images |
ceph Updated |
mirantis.azurecr.io/mirantis/ceph:v17.2.7-9.release |
ceph-controller Updated |
mirantis.azurecr.io/ceph/mcp/ceph-controller:2.26.1-0 |
|
cephcsi Updated |
mirantis.azurecr.io/mirantis/cephcsi:v3.9.0-5.release |
|
cephcsi-registrar |
mirantis.azurecr.io/mirantis/cephcsi-registrar:v2.9.2-1.release |
|
cephcsi-provisioner |
mirantis.azurecr.io/mirantis/cephcsi-provisioner:v3.6.2-1.release |
|
cephcsi-snapshotter |
mirantis.azurecr.io/mirantis/cephcsi-snapshotter:v6.3.2-1.release |
|
cephcsi-attacher |
mirantis.azurecr.io/mirantis/cephcsi-attacher:v4.4.2-1.release |
|
cephcsi-resizer |
mirantis.azurecr.io/mirantis/cephcsi-resizer:v1.9.2-1.release |
|
rook Updated |
mirantis.azurecr.io/ceph/rook:v1.12.10-14 |
Artifact |
Component |
Path |
|---|---|---|
Binaries Updated |
lcm-ansible |
https://binary.mirantis.com/lcm/bin/lcm-ansible/v0.24.0-47-gf77368e/lcm-ansible.tar.gz |
lcm-agent |
||
Helm charts Updated |
helm-controller |
https://binary.mirantis.com/core/helm/helm-controller-1.39.15.tgz |
managed-lcm-api |
https://binary.mirantis.com/core/helm/managed-lcm-api-1.39.15.tgz |
|
Docker images Updated |
helm-controller |
mirantis.azurecr.io/core/lcm-controller:1.39.15 |
Artifact |
Component |
Path |
|---|---|---|
Helm charts |
alerta |
https://binary.mirantis.com/stacklight/helm/alerta-0.1.0-mcp-33.tgz |
alertmanager-webhook-servicenow |
https://binary.mirantis.com/stacklight/helm/alertmanager-webhook-servicenow-0.2.0-mcp-8.tgz |
|
cadvisor |
https://binary.mirantis.com/stacklight/helm/cadvisor-0.1.0-mcp-7.tgz |
|
elasticsearch-curator |
https://binary.mirantis.com/stacklight/helm/elasticsearch-curator-1.5.0-mcp-15.tgz |
|
elasticsearch-exporter |
https://binary.mirantis.com/stacklight/helm/elasticsearch-exporter-1.2.0-mcp-10.tgz |
|
fluentd-logs Updated |
https://binary.mirantis.com/stacklight/helm/fluentd-logs-0.1.0-mcp-223.tgz |
|
grafana Updated |
https://binary.mirantis.com/stacklight/helm/grafana-3.3.10-mcp-285.tgz |
|
iam-proxy |
||
metric-collector |
https://binary.mirantis.com/stacklight/helm/metric-collector-0.3.0-mcp-17.tgz |
|
metricbeat |
https://binary.mirantis.com/stacklight/helm/metricbeat-1.7.1-mcp-25.tgz |
|
opensearch Updated |
https://binary.mirantis.com/stacklight/helm/opensearch-0.1.0-mcp-86.tgz |
|
opensearch-dashboards Updated |
https://binary.mirantis.com/stacklight/helm/opensearch-dashboards-0.1.0-mcp-54.tgz |
|
patroni |
https://binary.mirantis.com/stacklight/helm/patroni-0.15.1-mcp-59.tgz |
|
prometheus |
https://binary.mirantis.com/stacklight/helm/prometheus-8.11.4-mcp-258.tgz |
|
prometheus-blackbox-exporter |
https://binary.mirantis.com/stacklight/helm/prometheus-blackbox-exporter-0.3.0-mcp-19.tgz |
|
prometheus-es-exporter |
https://binary.mirantis.com/stacklight/helm/prometheus-es-exporter-1.0.0-mcp-18.tgz |
|
prometheus-msteams |
https://binary.mirantis.com/stacklight/helm/prometheus-msteams-0.1.0-mcp-12.tgz |
|
refapp |
https://binary.mirantis.com/scale/helm/refapp-0.2.1-mcp-16.tgz |
|
sf-notifier |
https://binary.mirantis.com/stacklight/helm/sf-notifier-0.2.0-mcp-10.tgz |
|
sf-reporter |
https://binary.mirantis.com/stacklight/helm/sf-reporter-0.2.0-mcp-10.tgz |
|
stacklight Updated |
https://binary.mirantis.com/stacklight/helm/stacklight-0.14.7.tgz |
|
telegraf-ds |
https://binary.mirantis.com/stacklight/helm/telegraf-ds-1.1.5-mcp-40.tgz |
|
telegraf-s |
https://binary.mirantis.com/stacklight/helm/telegraf-s-1.1.5-mcp-41.tgz |
|
telemeter-client |
https://binary.mirantis.com/stacklight/helm/telemeter-client-0.2.0-mcp-14.tgz |
|
telemeter-server |
https://binary.mirantis.com/stacklight/helm/telemeter-server-0.2.0-mcp-14.tgz |
|
Docker images |
alerta-web Updated |
mirantis.azurecr.io/stacklight/alerta-web:9-20240228023009 |
alertmanager Updated |
mirantis.azurecr.io/stacklight/alertmanager:v0-20240228023011 |
|
alertmanager-webhook-servicenow Updated |
mirantis.azurecr.io/stacklight/alertmanager-webhook-servicenow:v0.1-20240226135626 |
|
alpine-utils Updated |
mirantis.azurecr.io/stacklight/alpine-utils:1-20240228023020 |
|
blackbox-exporter |
mirantis.azurecr.io/stacklight/blackbox-exporter:0-20231204053401 |
|
cadvisor Updated |
mirantis.azurecr.io/stacklight/cadvisor:v0.47-20240228023015 |
|
configmap-reload |
mirantis.azurecr.io/stacklight/configmap-reload:v0.8.0 |
|
curator |
mirantis.azurecr.io/stacklight/curator:5.7.6-20230404082402 |
|
elasticsearch-exporter |
mirantis.azurecr.io/stacklight/elasticsearch-exporter:v1.5.0 |
|
fluentd Updated |
mirantis.azurecr.io/stacklight/fluentd:1.15-20240228023011 |
|
grafana |
mirantis.azurecr.io/stacklight/grafana:10.3.1 |
|
grafana-image-renderer Updated |
mirantis.azurecr.io/stacklight/grafana-image-renderer:3-20240228060359 |
|
k8s-sidecar Updated |
mirantis.azurecr.io/stacklight/k8s-sidecar:1-20240228023018 |
|
kube-state-metrics |
mirantis.azurecr.io/stacklight/kube-state-metrics:v2.10.1 |
|
kubectl Updated |
mirantis.azurecr.io/stacklight/kubectl:1.22-20240228023017 |
|
metric-collector Updated |
mirantis.azurecr.io/stacklight/metric-collector:v0.1-20240228023015 |
|
metricbeat Updated |
mirantis.azurecr.io/stacklight/metricbeat:7.12.1-20240228023010 |
|
node-exporter |
mirantis.azurecr.io/stacklight/node-exporter:v1.7.0 |
|
oauth2-proxy |
mirantis.azurecr.io/iam/oauth2-proxy:v7.1.3-7 |
|
opensearch Updated |
mirantis.azurecr.io/stacklight/opensearch:2-20240228023015 |
|
opensearch-dashboards Updated |
mirantis.azurecr.io/stacklight/opensearch-dashboards:2-20240228023009 |
|
openstack-refapp Updated |
mirantis.azurecr.io/openstack/openstack-refapp:0.1.6 |
|
pgbouncer Updated |
mirantis.azurecr.io/stacklight/pgbouncer:1-20240228023020 |
|
prometheus |
mirantis.azurecr.io/stacklight/prometheus:v2.48.0 |
|
prometheus-es-exporter Updated |
mirantis.azurecr.io/stacklight/prometheus-es-exporter:v0.14.0-20240228023015 |
|
prometheus-msteams |
mirantis.azurecr.io/stacklight/prometheus-msteams:v1.5-20231204064415 |
|
prometheus-patroni-exporter Updated |
mirantis.azurecr.io/stacklight/prometheus-patroni-exporter:0.0.1-20240228023020 |
|
prometheus-postgres-exporter |
mirantis.azurecr.io/stacklight/prometheus-postgres-exporter:v0.15.0 |
|
prometheus-relay Updated |
mirantis.azurecr.io/stacklight/prometheus-relay:v0.4-20240228023015 |
|
psql-client Updated |
mirantis.azurecr.io/scale/psql-client:v13-20240222083402 |
|
sf-notifier Updated |
mirantis.azurecr.io/stacklight/sf-notifier:v0.4-20240228023016 |
|
sf-reporter Updated |
mirantis.azurecr.io/stacklight/sf-reporter:v0.1-20240226135743 |
|
spilo Updated |
mirantis.azurecr.io/stacklight/spilo:13-2.1p9-20240228023016 |
|
stacklight-toolkit Updated |
mirantis.azurecr.io/stacklight/stacklight-toolkit:20240228023017 |
|
telegraf |
mirantis.azurecr.io/stacklight/telegraf:v1.9.1-20240228023008 Updated |
|
mirantis.azurecr.io/stacklight/telegraf:1-20240219105842 Updated |
||
telemeter Updated |
mirantis.azurecr.io/stacklight/telemeter:4.4-20240228023013 |
|
telemeter-token-auth Updated |
mirantis.azurecr.io/stacklight/telemeter-token-auth:v0.1-20240228023014 |
Artifact |
Component |
Path |
|---|---|---|
Debian repositories |
System packages |
|
http://mirror.mirantis.com/kaas/kubernetes-extra-rhel7-0.0.8/ |
||
https://mirror.mirantis.com/kaas/ubuntu-2024-03-02-014158/ Updated |
||
https://mirror.mirantis.com/kaas/ubuntu-2024-03-02-014158.target.txt Updated |
||
MCR repositories |
MCR |
https://repos.mirantis.com/ubuntu/dists/focal/pool/stable-23.0/ |
Target ubuntu system 1 |
Ubuntu |
https://binary.mirantis.com/bm/bin/efi/ubuntu/tgz-focal-20240302175618 Updated |
- 1
Only for bare metal clusters
This section outlines release notes for the major Cluster release 16.1.0 that is introduced in the Container Cloud release 2.26.0. The Cluster release 16.1.0 supports:
Mirantis Kubernetes Engine (MKE) 3.7.5. For details, see MKE Release Notes.
Mirantis Container Runtime (MCR) 23.0.9. For details, see MCR Release Notes.
Kubernetes 1.27.
For the list of known and addressed issues, refer to the Container Cloud release 2.26.0 section.
This section outlines new features implemented in the Cluster release 16.1.0 that is introduced in the Container Cloud release 2.26.0.
Introduced support for Mirantis Container Runtime (MCR) 23.0.9 and Mirantis Kubernetes Engine (MKE) 3.7.5 that supports Kubernetes 1.27 for the Container Cloud management and managed clusters.
On existing managed clusters, MKE and MCR are updated to the latest supported version when you update your managed cluster to the Cluster release 16.1.0.
Added support for Rook v1.12 that contains the Ceph CSI plugin 3.9.x and introduces automated recovery of RBD (RWO) volumes from a failed node onto a new one, ensuring uninterrupted operations.
For a complete list of features introduced in the new Rook version, refer to official Rook documentation.
Learn more
TechPreview
Implemented the customDeviceClasses parameter that enables you to specify
the custom names different from the default ones, which include ssd,
hdd, and nvme, and use them in nodes and pools definitions.
Using this parameter, you can, for example, separate storage of large snapshots without touching the rest of Ceph cluster storage.
To enhance network security, added NetworkPolicy objects for all types of
Ceph daemons. These policies allow only specified ports to be used by the
corresponding Ceph daemon pods.
Completely reorganized and significantly improved the StackLight logging pipeline by implementing the following changes:
Switched to the storage-based log retention strategy that optimizes storage utilization and ensures effective data retention. This approach ensures that storage resources are efficiently allocated based on the importance and volume of different data types. The logging index management implies the following advantages:
Storage-based rollover mechanism
Consistent shard allocation
Minimal size of cluster state
Storage compression
No filter by logging level (filtering by tag is still available)
Control over disk space to be taken by indices types:
Logs
OpenStack notifications
Kubernetes events
Introduced new system and audit indices that are managed by OpenSearch data streams. It is a convenient way to manage insert-only pipelines such as log message collection.
Introduced the
OpenSearchStorageUsageCriticalandOpenSearchStorageUsageMajoralerts to monitor OpenSearch used and free space from the file system perspective.Introduced the following parameters:
persistentVolumeUsableStorageSizeGBto define exclusive OpenSearch node usageoutput_kindto define the type of logs to be forwarded to external outputs
Important
Changes in the StackLight logging pipeline require the following actions before and after the manged cluster update:
Added the alertsCommonLabels parameter for Prometheus server that defines
the list of custom labels to be injected to firing alerts while they are sent
to Alertmanager.
Caution
When new labels are injected, Prometheus sends alert updates with a new set of labels, which can potentially cause Alertmanager to have duplicated alerts for a short period of time if the cluster currently has firing alerts.
The following table lists the components versions of the Cluster release 16.1.0.
Component |
Application/Service |
Version |
|---|---|---|
Cluster orchestration Updated |
Mirantis Kubernetes Engine |
3.7.5 0 |
Container runtime Updated |
Mirantis Container Runtime |
23.0.9 1 |
Distributed storage Updated |
Ceph |
17.2.7 (Quincy) |
Rook |
1.12.10 |
|
StackLight |
Alerta Updated |
9.0.1 |
Alertmanager |
0.25.0 |
|
Alertmanager Webhook ServiceNow |
0.1 |
|
Blackbox Exporter |
0.24.0 |
|
cAdvisor |
0.47.2 |
|
Elasticsearch Curator |
5.7.6 |
|
Elasticsearch Exporter |
1.5.0 |
|
Fluentd |
1.15.3 |
|
Grafana Updated |
10.3.1 |
|
Grafana Image Renderer Updated |
3.8.4 |
|
kube-state-metrics Updated |
2.10.1 |
|
Metric Collector |
0.1 |
|
Metricbeat |
7.12.1 |
|
Node Exporter Updated |
1.7.0 |
|
OAuth2 Proxy |
7.1.3 |
|
OpenSearch Updated |
2.11.0 |
|
OpenSearch Dashboards Updated |
2.11.1 |
|
Prometheus Updated |
2.48.0 |
|
Prometheus ES Exporter |
0.14.0 |
|
Prometheus MS Teams |
1.5.2 |
|
Prometheus Patroni Exporter |
0.0.1 |
|
Prometheus Postgres Exporter Updated |
0.15.0 |
|
Prometheus Relay |
0.4 |
|
sf-notifier |
0.4 |
|
sf-reporter |
0.1 |
|
Spilo |
13-2.1p9 |
|
Telegraf |
1.9.1 |
|
1.28.5 Updated |
||
Telemeter |
4.4 |
- 0
For the Mirantis Kubernetes Engine (MKE) release highlights and components versions, see MKE documentation: MKE release notes.
- 1
For the Mirantis Container Runtime (MCR) release highlights, see MCR documentation: MCR release notes.
This section lists the artifacts of components included in the Cluster release 16.1.0.
Note
The components that are newly added, updated, deprecated, or removed
as compared to the previous release version, are marked
with a corresponding superscript,
for example, lcm-ansible Updated.
Artifact |
Component |
Path |
|---|---|---|
Helm chart Updated |
ceph-controller |
https://binary.mirantis.com/ceph/helm/ceph-operator-1.0.0-mcc-2.26.0-16.tgz |
Docker images Updated |
ceph |
mirantis.azurecr.io/mirantis/ceph:v17.2.7-8.release |
ceph-controller |
mirantis.azurecr.io/ceph/mcp/ceph-controller:2.26.0-15 |
|
cephcsi |
mirantis.azurecr.io/mirantis/cephcsi:v3.9.0-4.release |
|
cephcsi-registrar |
mirantis.azurecr.io/mirantis/cephcsi-registrar:v2.9.2-1.release |
|
cephcsi-provisioner |
mirantis.azurecr.io/mirantis/cephcsi-provisioner:v3.6.2-1.release |
|
cephcsi-snapshotter |
mirantis.azurecr.io/mirantis/cephcsi-snapshotter:v6.3.2-1.release |
|
cephcsi-attacher |
mirantis.azurecr.io/mirantis/cephcsi-attacher:v4.4.2-1.release |
|
cephcsi-resizer |
mirantis.azurecr.io/mirantis/cephcsi-resizer:v1.9.2-1.release |
|
rook |
mirantis.azurecr.io/ceph/rook:v1.12.10-13 |
Artifact |
Component |
Path |
|---|---|---|
Binaries Updated |
lcm-ansible |
https://binary.mirantis.com/lcm/bin/lcm-ansible/v0.24.0-46-gdaf7dbc/lcm-ansible.tar.gz |
lcm-agent |
||
Helm charts Updated |
helm-controller |
https://binary.mirantis.com/core/helm/helm-controller-1.39.13.tgz |
managed-lcm-api |
https://binary.mirantis.com/core/helm/managed-lcm-api-1.39.13.tgz |
|
Docker images Updated |
helm-controller |
mirantis.azurecr.io/core/lcm-controller:1.39.13 |
Artifact |
Component |
Path |
|---|---|---|
Helm charts |
alerta Updated |
https://binary.mirantis.com/stacklight/helm/alerta-0.1.0-mcp-33.tgz |
alertmanager-webhook-servicenow Updated |
https://binary.mirantis.com/stacklight/helm/alertmanager-webhook-servicenow-0.2.0-mcp-8.tgz |
|
cadvisor Updated |
https://binary.mirantis.com/stacklight/helm/cadvisor-0.1.0-mcp-7.tgz |
|
elasticsearch-curator Updated |
https://binary.mirantis.com/stacklight/helm/elasticsearch-curator-1.5.0-mcp-15.tgz |
|
elasticsearch-exporter Updated |
https://binary.mirantis.com/stacklight/helm/elasticsearch-exporter-1.2.0-mcp-10.tgz |
|
fluentd-logs Updated |
https://binary.mirantis.com/stacklight/helm/fluentd-logs-0.1.0-mcp-219.tgz |
|
grafana Updated |
https://binary.mirantis.com/stacklight/helm/grafana-3.3.10-mcp-278.tgz |
|
iam-proxy Updated |
||
metric-collector Updated |
https://binary.mirantis.com/stacklight/helm/metric-collector-0.3.0-mcp-17.tgz |
|
metricbeat Updated |
https://binary.mirantis.com/stacklight/helm/metricbeat-1.7.1-mcp-25.tgz |
|
opensearch Updated |
https://binary.mirantis.com/stacklight/helm/opensearch-0.1.0-mcp-80.tgz |
|
opensearch-dashboards Updated |
https://binary.mirantis.com/stacklight/helm/opensearch-dashboards-0.1.0-mcp-53.tgz |
|
patroni Updated |
https://binary.mirantis.com/stacklight/helm/patroni-0.15.1-mcp-59.tgz |
|
prometheus Updated |
https://binary.mirantis.com/stacklight/helm/prometheus-8.11.4-mcp-258.tgz |
|
prometheus-blackbox-exporter Updated |
https://binary.mirantis.com/stacklight/helm/prometheus-blackbox-exporter-0.3.0-mcp-19.tgz |
|
prometheus-es-exporter Updated |
https://binary.mirantis.com/stacklight/helm/prometheus-es-exporter-1.0.0-mcp-18.tgz |
|
prometheus-msteams Updated |
https://binary.mirantis.com/stacklight/helm/prometheus-msteams-0.1.0-mcp-12.tgz |
|
refapp Updated |
https://binary.mirantis.com/scale/helm/refapp-0.2.1-mcp-16.tgz |
|
sf-notifier Updated |
https://binary.mirantis.com/stacklight/helm/sf-notifier-0.2.0-mcp-10.tgz |
|
sf-reporter Updated |
https://binary.mirantis.com/stacklight/helm/sf-reporter-0.2.0-mcp-10.tgz |
|
stacklight Updated |
https://binary.mirantis.com/stacklight/helm/stacklight-0.14.2.tgz |
|
telegraf-ds Updated |
https://binary.mirantis.com/stacklight/helm/telegraf-ds-1.1.5-mcp-40.tgz |
|
telegraf-s Updated |
https://binary.mirantis.com/stacklight/helm/telegraf-s-1.1.5-mcp-41.tgz |
|
telemeter-client Updated |
https://binary.mirantis.com/stacklight/helm/telemeter-client-0.2.0-mcp-14.tgz |
|
telemeter-server Updated |
https://binary.mirantis.com/stacklight/helm/telemeter-server-0.2.0-mcp-14.tgz |
|
Docker images |
alerta-web Updated |
mirantis.azurecr.io/stacklight/alerta-web:9-20240201074016 |
alertmanager Updated |
mirantis.azurecr.io/stacklight/alertmanager:v0-20240201074016 |
|
alertmanager-webhook-servicenow Updated |
mirantis.azurecr.io/stacklight/alertmanager-webhook-servicenow:v0.1-20240119023014 |
|
alpine-utils Updated |
mirantis.azurecr.io/stacklight/alpine-utils:1-20240201074025 |
|
blackbox-exporter Updated |
mirantis.azurecr.io/stacklight/blackbox-exporter:0-20231204053401 |
|
cadvisor Updated |
mirantis.azurecr.io/stacklight/cadvisor:v0.47-20240201074020 |
|
configmap-reload |
mirantis.azurecr.io/stacklight/configmap-reload:v0.8.0 |
|
curator |
mirantis.azurecr.io/stacklight/curator:5.7.6-20230404082402 |
|
curl-jq Removed |
n/a |
|
elasticsearch-exporter |
mirantis.azurecr.io/stacklight/elasticsearch-exporter:v1.5.0 |
|
fluentd Updated |
mirantis.azurecr.io/stacklight/fluentd:1.15-20231215023011 |
|
grafana Updated |
mirantis.azurecr.io/stacklight/grafana:10.3.1 |
|
grafana-image-renderer Updated |
mirantis.azurecr.io/stacklight/grafana-image-renderer:3-20231124023009 |
|
k8s-sidecar Updated |
mirantis.azurecr.io/stacklight/k8s-sidecar:1-20240201074025 |
|
kube-state-metrics Updated |
mirantis.azurecr.io/stacklight/kube-state-metrics:v2.10.1 |
|
kubectl Updated |
mirantis.azurecr.io/stacklight/kubectl:1.22-20240201074022 |
|
metric-collector Updated |
mirantis.azurecr.io/stacklight/metric-collector:v0.1-20240201074019 |
|
metricbeat Updated |
mirantis.azurecr.io/stacklight/metricbeat:7.12.1-20240201074016 |
|
node-exporter Updated |
mirantis.azurecr.io/stacklight/node-exporter:v1.7.0 |
|
oauth2-proxy Updated |
mirantis.azurecr.io/iam/oauth2-proxy:v7.1.3-7 |
|
opensearch Updated |
mirantis.azurecr.io/stacklight/opensearch:2-20240201074019 |
|
opensearch-dashboards Updated |
mirantis.azurecr.io/stacklight/opensearch-dashboards:2-20240201074016 |
|
openstack-refapp Updated |
mirantis.azurecr.io/openstack/openstack-refapp:0.1.5 |
|
pgbouncer Updated |
mirantis.azurecr.io/stacklight/pgbouncer:1-20240201074024 |
|
prometheus Updated |
mirantis.azurecr.io/stacklight/prometheus:v2.48.0 |
|
prometheus-es-exporter Updated |
mirantis.azurecr.io/stacklight/prometheus-es-exporter:v0.14.0-20240201074023 |
|
prometheus-msteams Updated |
mirantis.azurecr.io/stacklight/prometheus-msteams:v1.5-20231204064415 |
|
prometheus-patroni-exporter Updated |
mirantis.azurecr.io/stacklight/prometheus-patroni-exporter:0.0.1-20240201074021 |
|
prometheus-postgres-exporter Updated |
mirantis.azurecr.io/stacklight/prometheus-postgres-exporter:v0.15.0 |
|
prometheus-relay Updated |
mirantis.azurecr.io/stacklight/prometheus-relay:v0.4-20240201074019 |
|
psql-client Updated |
mirantis.azurecr.io/scale/psql-client:v13-20240117093252 |
|
sf-notifier Updated |
mirantis.azurecr.io/stacklight/sf-notifier:v0.4-20240201074022 |
|
sf-reporter Updated |
mirantis.azurecr.io/stacklight/sf-reporter:v0.1-20240119124536 |
|
spilo Updated |
mirantis.azurecr.io/stacklight/spilo:13-2.1p9-20240201074020 |
|
stacklight-toolkit Updated |
mirantis.azurecr.io/stacklight/stacklight-toolkit:20240201074021 |
|
telegraf |
mirantis.azurecr.io/stacklight/telegraf:v1.9.1-20240201074016 Updated |
|
mirantis.azurecr.io/stacklight/telegraf:1-20240201074023 Updated |
||
telemeter Updated |
mirantis.azurecr.io/stacklight/telemeter:4.4-20240201074019 |
|
telemeter-token-auth Updated |
mirantis.azurecr.io/stacklight/telemeter-token-auth:v0.1-20240201074020 |
Artifact |
Component |
Path |
|---|---|---|
Debian repositories |
System packages |
https://mirror.mirantis.com/kaas/kubernetes-extra-0.0.9/ Updated |
http://mirror.mirantis.com/kaas/kubernetes-extra-rhel7-0.0.8/ |
||
https://mirror.mirantis.com/kaas/ubuntu-2024-02-01-020317/ Updated |
||
https://mirror.mirantis.com/kaas/ubuntu-2024-02-01-020317.target.txt Updated |
||
MCR repositories |
MCR Updated |
https://repos.mirantis.com/ubuntu/dists/focal/pool/stable-23.0/ |
Target ubuntu system 1 |
Ubuntu Updated |
https://binary.mirantis.com/bm/bin/efi/ubuntu/tgz-focal-20240201171126 |
- 1
Only for bare metal clusters
See also
Major and patch versions update path
The primary distinction between major and patch product versions lies in the fact that major release versions introduce new functionalities, whereas patch release versions predominantly offer minor product enhancements, mostly CVE resolutions for your clusters.
Depending on your deployment needs, you can either update only between major Cluster releases or apply patch updates between major releases. Choosing the latter option ensures you receive security fixes as soon as they become available. Though, be prepared to update your cluster frequently, approximately once every three weeks. Otherwise, you can update only between major Cluster releases as each subsequent major Cluster release includes patch Cluster release updates of the previous major Cluster release.
This section outlines release notes for unsupported major and patch Cluster releases of the 16.0.x series.
This section outlines release notes for the patch Cluster release 16.0.4 that is introduced in the Container Cloud release 2.25.4. and is based on Cluster releases 16.0.0, 16.0.1, 16.0.2, and 16.0.3.
This Cluster release supports Mirantis Kubernetes Engine 3.7.3 with Kubernetes 1.27 and Mirantis Container Runtime 23.0.7.
For the list of enhancements and CVE fixes delivered with this patch Cluster release, see 2.25.4
For details on patch release delivery, see Patch releases
This section lists the artifacts of components included in the Cluster release 16.0.4.
Note
The components that are newly added, updated, deprecated, or removed
as compared to the previous release version, are marked
with a corresponding superscript,
for example, lcm-ansible Updated.
Artifact |
Component |
Path |
|---|---|---|
Helm chart Updated |
ceph-controller |
https://binary.mirantis.com/ceph/helm/ceph-operator-1.0.0-mcc-2.25.4-1 |
Docker images |
ceph |
mirantis.azurecr.io/mirantis/ceph:v17.2.6-8.cve |
ceph-controller Updated |
mirantis.azurecr.io/ceph/mcp/ceph-controller:2.25.4-0 |
|
cephcsi Updated |
mirantis.azurecr.io/mirantis/cephcsi:v3.8.1-9.cve |
|
cephcsi-registrar |
mirantis.azurecr.io/mirantis/cephcsi-registrar:v2.8.0-2.cve |
|
cephcsi-provisioner |
mirantis.azurecr.io/mirantis/cephcsi-provisioner:v3.5.0-2.cve |
|
cephcsi-snapshotter |
mirantis.azurecr.io/mirantis/cephcsi-snapshotter:v6.2.1-2.cve |
|
cephcsi-attacher |
mirantis.azurecr.io/mirantis/cephcsi-attacher:v4.3.0-2.cve |
|
cephcsi-resizer |
mirantis.azurecr.io/mirantis/cephcsi-resizer:v1.8.0-2.cve |
|
rook Updated |
mirantis.azurecr.io/ceph/rook:v1.11.11-22 |
Artifact |
Component |
Path |
|---|---|---|
Binaries Updated |
lcm-ansible |
https://binary.mirantis.com/lcm/bin/lcm-ansible/v0.23.0-88-g35be0fc/lcm-ansible.tar.gz |
lcm-agent |
||
Helm charts Updated |
helm-controller |
https://binary.mirantis.com/core/helm/helm-controller-1.38.33.tgz |
managed-lcm-api |
https://binary.mirantis.com/core/helm/managed-lcm-api-1.38.33.tgz |
|
Docker images Updated |
helm-controller |
mirantis.azurecr.io/core/lcm-controller:1.38.33 |
Artifact |
Component |
Path |
|---|---|---|
Helm charts |
alerta |
https://binary.mirantis.com/stacklight/helm/alerta-0.1.0-mcp-33.tgz |
alertmanager-webhook-servicenow |
https://binary.mirantis.com/stacklight/helm/alertmanager-webhook-servicenow-0.2.0-mcp-8.tgz |
|
cadvisor |
https://binary.mirantis.com/stacklight/helm/cadvisor-0.1.0-mcp-6.tgz |
|
elasticsearch-curator |
https://binary.mirantis.com/stacklight/helm/elasticsearch-curator-1.5.0-mcp-15.tgz |
|
elasticsearch-exporter |
https://binary.mirantis.com/stacklight/helm/elasticsearch-exporter-1.2.0-mcp-10.tgz |
|
fluentd-logs |
https://binary.mirantis.com/stacklight/helm/fluentd-logs-0.1.0-mcp-196.tgz |
|
grafana |
https://binary.mirantis.com/stacklight/helm/grafana-3.3.10-mcp-254.tgz |
|
iam-proxy |
||
metric-collector |
https://binary.mirantis.com/stacklight/helm/metric-collector-0.3.0-mcp-17.tgz |
|
metricbeat |
https://binary.mirantis.com/stacklight/helm/metricbeat-1.7.1-mcp-25.tgz |
|
opensearch |
https://binary.mirantis.com/stacklight/helm/opensearch-0.1.0-mcp-63.tgz |
|
opensearch-dashboards |
https://binary.mirantis.com/stacklight/helm/opensearch-dashboards-0.1.0-mcp-49.tgz |
|
patroni |
https://binary.mirantis.com/stacklight/helm/patroni-0.15.1-mcp-59.tgz |
|
prometheus |
https://binary.mirantis.com/stacklight/helm/prometheus-8.11.4-mcp-257.tgz |
|
prometheus-blackbox-exporter |
https://binary.mirantis.com/stacklight/helm/prometheus-blackbox-exporter-0.3.0-mcp-19.tgz |
|
prometheus-es-exporter |
https://binary.mirantis.com/stacklight/helm/prometheus-es-exporter-1.0.0-mcp-18.tgz |
|
prometheus-msteams |
https://binary.mirantis.com/stacklight/helm/prometheus-msteams-0.1.0-mcp-12.tgz |
|
refapp |
https://binary.mirantis.com/scale/helm/refapp-0.2.1-mcp-13.tgz |
|
sf-notifier |
https://binary.mirantis.com/stacklight/helm/sf-notifier-0.2.0-mcp-10.tgz |
|
sf-reporter |
https://binary.mirantis.com/stacklight/helm/sf-reporter-0.2.0-mcp-10.tgz |
|
stacklight Updated |
https://binary.mirantis.com/stacklight/helm/stacklight-0.13.12.tgz |
|
telegraf-ds |
https://binary.mirantis.com/stacklight/helm/telegraf-ds-1.1.5-mcp-40.tgz |
|
telegraf-s |
https://binary.mirantis.com/stacklight/helm/telegraf-s-1.1.5-mcp-40.tgz |
|
telemeter-client |
https://binary.mirantis.com/stacklight/helm/telemeter-client-0.2.0-mcp-14.tgz |
|
telemeter-server |
https://binary.mirantis.com/stacklight/helm/telemeter-server-0.2.0-mcp-14.tgz |
|
Docker images |
alerta-web Updated |
mirantis.azurecr.io/stacklight/alerta-web:9-20231215023009 |
alertmanager Updated |
mirantis.azurecr.io/stacklight/alertmanager:v0-20231215023011 |
|
alertmanager-webhook-servicenow Updated |
mirantis.azurecr.io/stacklight/alertmanager-webhook-servicenow:v0.1-20231211141923 |
|
alpine-utils Updated |
mirantis.azurecr.io/stacklight/alpine-utils:1-20231215023021 |
|
blackbox-exporter |
mirantis.azurecr.io/stacklight/blackbox-exporter:0-20231204053401 |
|
cadvisor Updated |
mirantis.azurecr.io/stacklight/cadvisor:v0.47-20231215023012 |
|
configmap-reload |
mirantis.azurecr.io/stacklight/configmap-reload:v0.8.0 |
|
curator |
mirantis.azurecr.io/stacklight/curator:5.7.6-20230404082402 |
|
curl-jq |
mirantis.azurecr.io/scale/curl-jq:alpine-20231127081128 |
|
elasticsearch-exporter |
mirantis.azurecr.io/stacklight/elasticsearch-exporter:v1.5.0 |
|
fluentd Updated |
mirantis.azurecr.io/stacklight/fluentd:1.15-20231215023011 |
|
grafana |
mirantis.azurecr.io/stacklight/grafana:10.2.2 |
|
grafana-image-renderer |
mirantis.azurecr.io/stacklight/grafana-image-renderer:3-20231124023009 |
|
k8s-sidecar Updated |
mirantis.azurecr.io/stacklight/k8s-sidecar:1-20231215023018 |
|
kube-state-metrics |
mirantis.azurecr.io/stacklight/kube-state-metrics:v2.10.1 |
|
kubectl Updated |
mirantis.azurecr.io/stacklight/kubectl:1.22-20231226150248 |
|
metric-collector Updated |
mirantis.azurecr.io/stacklight/metric-collector:v0.1-20231215023013 |
|
metricbeat Updated |
mirantis.azurecr.io/stacklight/metricbeat:7.12.1-20231215023009 |
|
node-exporter |
mirantis.azurecr.io/stacklight/node-exporter:v1.7.0 |
|
oauth2-proxy |
mirantis.azurecr.io/iam/oauth2-proxy:v7.1.3-6 |
|
opensearch Updated |
mirantis.azurecr.io/stacklight/opensearch:2-20231215023014 |
|
opensearch-dashboards Updated |
mirantis.azurecr.io/stacklight/opensearch-dashboards:2-20231215023009 |
|
openstack-refapp |
mirantis.azurecr.io/openstack/openstack-refapp:0.1.4 |
|
pgbouncer Updated |
mirantis.azurecr.io/stacklight/pgbouncer:1-20231215023019 |
|
prometheus |
mirantis.azurecr.io/stacklight/prometheus:v2.48.0 |
|
prometheus-es-exporter Updated |
mirantis.azurecr.io/stacklight/prometheus-es-exporter:v0.14.0-20231215023018 |
|
prometheus-msteams |
mirantis.azurecr.io/stacklight/prometheus-msteams:v1.5-20231204064415 |
|
prometheus-patroni-exporter Updated |
mirantis.azurecr.io/stacklight/prometheus-patroni-exporter:0.0.1-20231215023018 |
|
prometheus-postgres-exporter |
mirantis.azurecr.io/stacklight/prometheus-postgres-exporter:v0.15.0 |
|
prometheus-relay Updated |
mirantis.azurecr.io/stacklight/prometheus-relay:v0.4-20231215023011 |
|
psql-client |
mirantis.azurecr.io/scale/psql-client:v13-20231116082249 |
|
sf-notifier Updated |
mirantis.azurecr.io/stacklight/sf-notifier:v0.4-20231215023014 |
|
sf-reporter Updated |
mirantis.azurecr.io/stacklight/sf-reporter:v0.1-20231211141939 |
|
spilo Updated |
mirantis.azurecr.io/stacklight/spilo:13-2.1p9-20231215023013 |
|
stacklight-toolkit Updated |
mirantis.azurecr.io/stacklight/stacklight-toolkit:20231215023015 |
|
telegraf |
mirantis.azurecr.io/stacklight/telegraf:v1.9.1-20231215023009 Updated |
|
mirantis.azurecr.io/stacklight/telegraf:1-20231204142011 |
||
telemeter Updated |
mirantis.azurecr.io/stacklight/telemeter:4.4-20231215023013 |
|
telemeter-token-auth Updated |
mirantis.azurecr.io/stacklight/telemeter-token-auth:v0.1-20231215023013 |
Unchanged as compared to 16.0.0
Artifact |
Component |
Path |
|---|---|---|
Debian repositories |
System packages |
|
http://mirror.mirantis.com/kaas/kubernetes-extra-rhel7-0.0.8/ |
||
https://mirror.mirantis.com/kaas/ubuntu-2023-10-11-015021.target.txt |
||
MCR repositories |
MCR |
https://repos.mirantis.com/ubuntu/dists/bionic/pool/stable-23.10/ |
Target ubuntu system 1 |
Ubuntu |
https://binary.mirantis.com/bm/bin/efi/ubuntu/tgz-focal-20231011091340 |
- 1
Only for bare metal clusters
This section outlines release notes for the patch Cluster release 16.0.3 that is introduced in the Container Cloud release 2.25.3. and is based on Cluster releases 16.0.0, 16.0.1, and 16.0.2.
This Cluster release supports Mirantis Kubernetes Engine 3.7.3 with Kubernetes 1.27 and Mirantis Container Runtime 23.0.7.
For the list of enhancements and CVE fixes delivered with this patch Cluster release, see 2.25.3
For details on patch release delivery, see Patch releases
This section lists the artifacts of components included in the Cluster release 16.0.3.
Note
The components that are newly added, updated, deprecated, or removed
as compared to the previous release version, are marked
with a corresponding superscript,
for example, lcm-ansible Updated.
Artifact |
Component |
Path |
|---|---|---|
Helm chart Updated |
ceph-controller |
https://binary.mirantis.com/ceph/helm/ceph-operator-1.0.0-mcc-2.25.3-3 |
Docker images |
ceph Updated |
mirantis.azurecr.io/mirantis/ceph:v17.2.6-8.cve |
ceph-controller Updated |
mirantis.azurecr.io/ceph/mcp/ceph-controller:2.25.3-0 |
|
cephcsi Updated |
mirantis.azurecr.io/mirantis/cephcsi:v3.8.1-8.cve |
|
cephcsi-registrar |
mirantis.azurecr.io/mirantis/cephcsi-registrar:v2.8.0-2.cve |
|
cephcsi-provisioner |
mirantis.azurecr.io/mirantis/cephcsi-provisioner:v3.5.0-2.cve |
|
cephcsi-snapshotter |
mirantis.azurecr.io/mirantis/cephcsi-snapshotter:v6.2.1-2.cve |
|
cephcsi-attacher |
mirantis.azurecr.io/mirantis/cephcsi-attacher:v4.3.0-2.cve |
|
cephcsi-resizer |
mirantis.azurecr.io/mirantis/cephcsi-resizer:v1.8.0-2.cve |
|
rook Updated |
mirantis.azurecr.io/ceph/rook:v1.11.11-21 |
Artifact |
Component |
Path |
|---|---|---|
Binaries Updated |
lcm-ansible |
https://binary.mirantis.com/lcm/bin/lcm-ansible/v0.23.0-87-gc9d7d3b/lcm-ansible.tar.gz |
lcm-agent |
||
Helm charts Updated |
helm-controller |
https://binary.mirantis.com/core/helm/helm-controller-1.38.31.tgz |
managed-lcm-api |
https://binary.mirantis.com/core/helm/managed-lcm-api-1.38.31.tgz |
|
Docker images Updated |
helm-controller |
mirantis.azurecr.io/core/lcm-controller:1.38.31 |
Artifact |
Component |
Path |
|---|---|---|
Helm charts |
alerta |
https://binary.mirantis.com/stacklight/helm/alerta-0.1.0-mcp-33.tgz |
alertmanager-webhook-servicenow |
https://binary.mirantis.com/stacklight/helm/alertmanager-webhook-servicenow-0.2.0-mcp-8.tgz |
|
cadvisor |
https://binary.mirantis.com/stacklight/helm/cadvisor-0.1.0-mcp-6.tgz |
|
elasticsearch-curator |
https://binary.mirantis.com/stacklight/helm/elasticsearch-curator-1.5.0-mcp-15.tgz |
|
elasticsearch-exporter |
https://binary.mirantis.com/stacklight/helm/elasticsearch-exporter-1.2.0-mcp-10.tgz |
|
fluentd-logs |
https://binary.mirantis.com/stacklight/helm/fluentd-logs-0.1.0-mcp-196.tgz |
|
grafana |
https://binary.mirantis.com/stacklight/helm/grafana-3.3.10-mcp-254.tgz |
|
iam-proxy |
||
metric-collector |
https://binary.mirantis.com/stacklight/helm/metric-collector-0.3.0-mcp-17.tgz |
|
metricbeat |
https://binary.mirantis.com/stacklight/helm/metricbeat-1.7.1-mcp-25.tgz |
|
opensearch |
https://binary.mirantis.com/stacklight/helm/opensearch-0.1.0-mcp-63.tgz |
|
opensearch-dashboards |
https://binary.mirantis.com/stacklight/helm/opensearch-dashboards-0.1.0-mcp-49.tgz |
|
patroni Updated |
https://binary.mirantis.com/stacklight/helm/patroni-0.15.1-mcp-59.tgz |
|
prometheus |
https://binary.mirantis.com/stacklight/helm/prometheus-8.11.4-mcp-257.tgz |
|
prometheus-blackbox-exporter |
https://binary.mirantis.com/stacklight/helm/prometheus-blackbox-exporter-0.3.0-mcp-19.tgz |
|
prometheus-es-exporter |
https://binary.mirantis.com/stacklight/helm/prometheus-es-exporter-1.0.0-mcp-18.tgz |
|
prometheus-msteams |
https://binary.mirantis.com/stacklight/helm/prometheus-msteams-0.1.0-mcp-12.tgz |
|
refapp |
https://binary.mirantis.com/scale/helm/refapp-0.2.1-mcp-13.tgz |
|
sf-notifier |
https://binary.mirantis.com/stacklight/helm/sf-notifier-0.2.0-mcp-10.tgz |
|
sf-reporter |
https://binary.mirantis.com/stacklight/helm/sf-reporter-0.2.0-mcp-10.tgz |
|
stacklight Updated |
https://binary.mirantis.com/stacklight/helm/stacklight-0.13.10.tgz |
|
telegraf-ds |
https://binary.mirantis.com/stacklight/helm/telegraf-ds-1.1.5-mcp-40.tgz |
|
telegraf-s |
https://binary.mirantis.com/stacklight/helm/telegraf-s-1.1.5-mcp-40.tgz |
|
telemeter-client |
https://binary.mirantis.com/stacklight/helm/telemeter-client-0.2.0-mcp-14.tgz |
|
telemeter-server |
https://binary.mirantis.com/stacklight/helm/telemeter-server-0.2.0-mcp-14.tgz |
|
Docker images |
alerta-web Updated |
mirantis.azurecr.io/stacklight/alerta-web:9-20231201023009 |
alertmanager Updated |
mirantis.azurecr.io/stacklight/alertmanager:v0-20231201023012 |
|
alertmanager-webhook-servicenow |
mirantis.azurecr.io/stacklight/alertmanager-webhook-servicenow:v0.1-20231114075954 |
|
alpine-utils Updated |
mirantis.azurecr.io/stacklight/alpine-utils:1-20231201023019 |
|
blackbox-exporter Updated |
mirantis.azurecr.io/stacklight/blackbox-exporter:0-20231204053401 |
|
cadvisor Updated |
mirantis.azurecr.io/stacklight/cadvisor:v0.47-20231201023011 |
|
configmap-reload |
mirantis.azurecr.io/stacklight/configmap-reload:v0.8.0 |
|
curator |
mirantis.azurecr.io/stacklight/curator:5.7.6-20230404082402 |
|
curl-jq Updated |
mirantis.azurecr.io/scale/curl-jq:alpine-20231127081128 |
|
elasticsearch-exporter |
mirantis.azurecr.io/stacklight/elasticsearch-exporter:v1.5.0 |
|
fluentd Updated |
mirantis.azurecr.io/stacklight/fluentd:1.15-20231204142422 |
|
grafana Updated |
mirantis.azurecr.io/stacklight/grafana:10.2.2 |
|
grafana-image-renderer Updated |
mirantis.azurecr.io/stacklight/grafana-image-renderer:3-20231124023009 |
|
k8s-sidecar Updated |
mirantis.azurecr.io/stacklight/k8s-sidecar:1-20231201023018 |
|
kube-state-metrics |
mirantis.azurecr.io/stacklight/kube-state-metrics:v2.10.1 |
|
kubectl Updated |
mirantis.azurecr.io/stacklight/kubectl:1.22-20231201023019 |
|
metric-collector Updated |
mirantis.azurecr.io/stacklight/metric-collector:v0.1-20231201023014 |
|
metricbeat Updated |
mirantis.azurecr.io/stacklight/metricbeat:7.12.1-20231201023010 |
|
node-exporter |
mirantis.azurecr.io/stacklight/node-exporter:v1.7.0 |
|
oauth2-proxy |
mirantis.azurecr.io/iam/oauth2-proxy:v7.1.3-6 |
|
opensearch Updated |
mirantis.azurecr.io/stacklight/opensearch:2-20231201023011 |
|
opensearch-dashboards Updated |
mirantis.azurecr.io/stacklight/opensearch-dashboards:2-20231201023009 |
|
openstack-refapp |
mirantis.azurecr.io/openstack/openstack-refapp:0.1.4 |
|
pgbouncer Updated |
mirantis.azurecr.io/stacklight/pgbouncer:1-20231201023014 |
|
prometheus Updated |
mirantis.azurecr.io/stacklight/prometheus:v2.48.0 |
|
prometheus-es-exporter Updated |
mirantis.azurecr.io/stacklight/prometheus-es-exporter:v0.14.0-20231201023015 |
|
prometheus-msteams Updated |
mirantis.azurecr.io/stacklight/prometheus-msteams:v1.5-20231204064415 |
|
prometheus-patroni-exporter Updated |
mirantis.azurecr.io/stacklight/prometheus-patroni-exporter:0.0.1-20231201023016 |
|
prometheus-postgres-exporter Updated |
mirantis.azurecr.io/stacklight/prometheus-postgres-exporter:v0.15.0 |
|
prometheus-relay Updated |
mirantis.azurecr.io/stacklight/prometheus-relay:v0.4-20231201023016 |
|
psql-client |
mirantis.azurecr.io/scale/psql-client:v13-20231116082249 |
|
sf-notifier Updated |
mirantis.azurecr.io/stacklight/sf-notifier:v0.4-20231201023011 |
|
sf-reporter |
mirantis.azurecr.io/stacklight/sf-reporter:v0.1-20231110023016 |
|
spilo Updated |
mirantis.azurecr.io/stacklight/spilo:13-2.1p9-20231207134103 |
|
stacklight-toolkit Updated |
mirantis.azurecr.io/stacklight/stacklight-toolkit:20231201023015 |
|
telegraf |
mirantis.azurecr.io/stacklight/telegraf:v1.9.1-20231207133615 Updated |
|
mirantis.azurecr.io/stacklight/telegraf:1-20231204142011 Updated |
||
telemeter Updated |
mirantis.azurecr.io/stacklight/telemeter:4.4-20231201023015 |
|
telemeter-token-auth Updated |
mirantis.azurecr.io/stacklight/telemeter-token-auth:v0.1-20231201023012 |
Unchanged as compared to 16.0.0
Artifact |
Component |
Path |
|---|---|---|
Debian repositories |
System packages |
|
http://mirror.mirantis.com/kaas/kubernetes-extra-rhel7-0.0.8/ |
||
https://mirror.mirantis.com/kaas/ubuntu-2023-10-11-015021.target.txt |
||
MCR repositories |
MCR |
https://repos.mirantis.com/ubuntu/dists/bionic/pool/stable-23.10/ |
Target ubuntu system 1 |
Ubuntu |
https://binary.mirantis.com/bm/bin/efi/ubuntu/tgz-focal-20231011091340 |
- 1
Only for bare metal clusters
This section outlines release notes for the patch Cluster release 16.0.2 that is introduced in the Container Cloud release 2.25.2. and is based on Cluster releases 16.0.0 and 16.0.1.
This Cluster release supports Mirantis Kubernetes Engine 3.7.2 with Kubernetes 1.27 and Mirantis Container Runtime 23.0.7.
For the list of enhancements and CVE fixes delivered with this patch Cluster release, see 2.25.2
For details on patch release delivery, see Patch releases
This section lists the artifacts of components included in the Cluster release 16.0.2.
Note
The components that are newly added, updated, deprecated, or removed
as compared to the previous release version, are marked
with a corresponding superscript,
for example, lcm-ansible Updated.
Artifact |
Component |
Path |
|---|---|---|
Helm chart Updated |
ceph-controller |
https://binary.mirantis.com/ceph/helm/ceph-operator-1.0.0-mcc-2.25.2-3 |
Docker images |
ceph Updated |
mirantis.azurecr.io/mirantis/ceph:v17.2.6-5.cve |
ceph-controller Updated |
mirantis.azurecr.io/ceph/mcp/ceph-controller:2.25.2-0 |
|
cephcsi Updated |
mirantis.azurecr.io/mirantis/cephcsi:v3.8.1-6.cve |
|
cephcsi-registrar |
mirantis.azurecr.io/mirantis/cephcsi-registrar:v2.8.0-2.cve |
|
cephcsi-provisioner |
mirantis.azurecr.io/mirantis/cephcsi-provisioner:v3.5.0-2.cve |
|
cephcsi-snapshotter |
mirantis.azurecr.io/mirantis/cephcsi-snapshotter:v6.2.1-2.cve |
|
cephcsi-attacher |
mirantis.azurecr.io/mirantis/cephcsi-attacher:v4.3.0-2.cve |
|
cephcsi-resizer |
mirantis.azurecr.io/mirantis/cephcsi-resizer:v1.8.0-2.cve |
|
rook Updated |
mirantis.azurecr.io/ceph/rook:v1.11.11-17 |
Artifact |
Component |
Path |
|---|---|---|
Binaries |
lcm-ansible |
https://binary.mirantis.com/lcm/bin/lcm-ansible/v0.23.0-84-g8d74d7c/lcm-ansible.tar.gz |
lcm-agent Updated |
||
Helm charts Updated |
helm-controller |
https://binary.mirantis.com/core/helm/helm-controller-1.38.29.tgz |
managed-lcm-api |
https://binary.mirantis.com/core/helm/managed-lcm-api-1.38.29.tgz |
|
Docker images Updated |
helm-controller |
mirantis.azurecr.io/core/lcm-controller:1.38.29 |
Artifact |
Component |
Path |
|---|---|---|
Helm charts |
alerta |
https://binary.mirantis.com/stacklight/helm/alerta-0.1.0-mcp-33.tgz |
alertmanager-webhook-servicenow |
https://binary.mirantis.com/stacklight/helm/alertmanager-webhook-servicenow-0.2.0-mcp-8.tgz |
|
cadvisor |
https://binary.mirantis.com/stacklight/helm/cadvisor-0.1.0-mcp-6.tgz |
|
elasticsearch-curator |
https://binary.mirantis.com/stacklight/helm/elasticsearch-curator-1.5.0-mcp-15.tgz |
|
elasticsearch-exporter |
https://binary.mirantis.com/stacklight/helm/elasticsearch-exporter-1.2.0-mcp-10.tgz |
|
fluentd-logs |
https://binary.mirantis.com/stacklight/helm/fluentd-logs-0.1.0-mcp-196.tgz |
|
grafana |
https://binary.mirantis.com/stacklight/helm/grafana-3.3.10-mcp-254.tgz |
|
iam-proxy |
||
metric-collector |
https://binary.mirantis.com/stacklight/helm/metric-collector-0.3.0-mcp-17.tgz |
|
metricbeat |
https://binary.mirantis.com/stacklight/helm/metricbeat-1.7.1-mcp-25.tgz |
|
opensearch |
https://binary.mirantis.com/stacklight/helm/opensearch-0.1.0-mcp-63.tgz |
|
opensearch-dashboards |
https://binary.mirantis.com/stacklight/helm/opensearch-dashboards-0.1.0-mcp-49.tgz |
|
patroni |
https://binary.mirantis.com/stacklight/helm/patroni-0.15.1-mcp-57.tgz |
|
prometheus |
https://binary.mirantis.com/stacklight/helm/prometheus-8.11.4-mcp-257.tgz |
|
prometheus-blackbox-exporter |
https://binary.mirantis.com/stacklight/helm/prometheus-blackbox-exporter-0.3.0-mcp-19.tgz |
|
prometheus-es-exporter |
https://binary.mirantis.com/stacklight/helm/prometheus-es-exporter-1.0.0-mcp-18.tgz |
|
prometheus-msteams |
https://binary.mirantis.com/stacklight/helm/prometheus-msteams-0.1.0-mcp-12.tgz |
|
refapp |
https://binary.mirantis.com/scale/helm/refapp-0.2.1-mcp-13.tgz |
|
sf-notifier |
https://binary.mirantis.com/stacklight/helm/sf-notifier-0.2.0-mcp-10.tgz |
|
sf-reporter |
https://binary.mirantis.com/stacklight/helm/sf-reporter-0.2.0-mcp-10.tgz |
|
stacklight Updated |
https://binary.mirantis.com/stacklight/helm/stacklight-0.13.8.tgz |
|
telegraf-ds |
https://binary.mirantis.com/stacklight/helm/telegraf-ds-1.1.5-mcp-40.tgz |
|
telegraf-s |
https://binary.mirantis.com/stacklight/helm/telegraf-s-1.1.5-mcp-40.tgz |
|
telemeter-client |
https://binary.mirantis.com/stacklight/helm/telemeter-client-0.2.0-mcp-14.tgz |
|
telemeter-server |
https://binary.mirantis.com/stacklight/helm/telemeter-server-0.2.0-mcp-14.tgz |
|
Docker images |
alerta-web Updated |
mirantis.azurecr.io/stacklight/alerta-web:9-20231117023008 |
alertmanager Updated |
mirantis.azurecr.io/stacklight/alertmanager:v0-20231121101237 |
|
alertmanager-webhook-servicenow Updated |
mirantis.azurecr.io/stacklight/alertmanager-webhook-servicenow:v0.1-20231114075954 |
|
alpine-utils Updated |
mirantis.azurecr.io/stacklight/alpine-utils:1-20231117023019 |
|
blackbox-exporter |
mirantis.azurecr.io/stacklight/blackbox-exporter:v0.24.0 |
|
cadvisor Updated |
mirantis.azurecr.io/stacklight/cadvisor:v0.47-20231121100850 |
|
configmap-reload |
mirantis.azurecr.io/stacklight/configmap-reload:v0.8.0 |
|
curator |
mirantis.azurecr.io/stacklight/curator:5.7.6-20230404082402 |
|
curl-jq |
mirantis.azurecr.io/scale/curl-jq:alpine-20231019061751 |
|
elasticsearch-exporter |
mirantis.azurecr.io/stacklight/elasticsearch-exporter:v1.5.0 |
|
fluentd Updated |
mirantis.azurecr.io/stacklight/fluentd:1.15-20231117023010 |
|
grafana |
mirantis.azurecr.io/stacklight/grafana:9.5.13 |
|
grafana-image-renderer |
mirantis.azurecr.io/stacklight/grafana-image-renderer:3-20231030112043 |
|
k8s-sidecar Updated |
mirantis.azurecr.io/stacklight/k8s-sidecar:1-20231117023017 |
|
kube-state-metrics Updated |
mirantis.azurecr.io/stacklight/kube-state-metrics:v2.10.1 |
|
kubectl Updated |
mirantis.azurecr.io/stacklight/kubectl:1.22-20231117023017 |
|
metric-collector Updated |
mirantis.azurecr.io/stacklight/metric-collector:v0.1-20231117023011 |
|
metricbeat Updated |
mirantis.azurecr.io/stacklight/metricbeat:7.12.1-20231117023008 |
|
node-exporter Updated |
mirantis.azurecr.io/stacklight/node-exporter:v1.7.0 |
|
oauth2-proxy Updated |
mirantis.azurecr.io/iam/oauth2-proxy:v7.1.3-6 |
|
opensearch Updated |
mirantis.azurecr.io/stacklight/opensearch:2-20231121103248 |
|
opensearch-dashboards Updated |
mirantis.azurecr.io/stacklight/opensearch-dashboards:2-20231121104249 |
|
openstack-refapp Updated |
mirantis.azurecr.io/openstack/openstack-refapp:0.1.4 |
|
pgbouncer Updated |
mirantis.azurecr.io/stacklight/pgbouncer:1-20231117023020 |
|
prometheus |
mirantis.azurecr.io/stacklight/prometheus:v2.44.0 |
|
prometheus-es-exporter Updated |
mirantis.azurecr.io/stacklight/prometheus-es-exporter:v0.14.0-20231117023017 |
|
prometheus-msteams |
mirantis.azurecr.io/stacklight/prometheus-msteams:v1.5.2 |
|
prometheus-patroni-exporter Updated |
mirantis.azurecr.io/stacklight/prometheus-patroni-exporter:0.0.1-20231117023018 |
|
prometheus-postgres-exporter |
mirantis.azurecr.io/stacklight/prometheus-postgres-exporter:v0.12.0 |
|
prometheus-relay Updated |
mirantis.azurecr.io/stacklight/prometheus-relay:v0.4-20231117023012 |
|
psql-client Updated |
mirantis.azurecr.io/scale/psql-client:v13-20231116082249 |
|
sf-notifier Updated |
mirantis.azurecr.io/stacklight/sf-notifier:v0.4-20231117023016 |
|
sf-reporter Updated |
mirantis.azurecr.io/stacklight/sf-reporter:v0.1-20231110023016 |
|
spilo Updated |
mirantis.azurecr.io/stacklight/spilo:13-2.1p9-20231117023015 |
|
stacklight-toolkit Updated |
mirantis.azurecr.io/stacklight/stacklight-toolkit:20231117023017 |
|
telegraf |
mirantis.azurecr.io/stacklight/telegraf:v1.9.1-20231110023008 Updated |
|
mirantis.azurecr.io/stacklight/telegraf:1-20231030132045 |
||
telemeter Updated |
mirantis.azurecr.io/stacklight/telemeter:4.4-20231117023011 |
|
telemeter-token-auth Updated |
mirantis.azurecr.io/stacklight/telemeter-token-auth:v0.1-20231117023011 |
Unchanged as compared to 16.0.0
Artifact |
Component |
Path |
|---|---|---|
Debian repositories |
System packages |
|
http://mirror.mirantis.com/kaas/kubernetes-extra-rhel7-0.0.8/ |
||
https://mirror.mirantis.com/kaas/ubuntu-2023-10-11-015021.target.txt |
||
MCR repositories |
MCR |
https://repos.mirantis.com/ubuntu/dists/bionic/pool/stable-23.10/ |
Target ubuntu system 1 |
Ubuntu |
https://binary.mirantis.com/bm/bin/efi/ubuntu/tgz-focal-20231011091340 |
- 1
Only for bare metal clusters
This section outlines release notes for the patch Cluster release 16.0.1 that is introduced in the Container Cloud release 2.25.1. and is based on the Cluster release 16.0.0.
This Cluster release supports Mirantis Kubernetes Engine 3.7.2 with Kubernetes 1.27 and Mirantis Container Runtime 23.0.7.
For the list of enhancements and CVE fixes delivered with this patch Cluster release, see 2.25.1
For details on patch release delivery, see Patch releases
This section lists the artifacts of components included in the Cluster release 16.0.1.
Note
The components that are newly added, updated, deprecated, or removed
as compared to the previous release version, are marked
with a corresponding superscript,
for example, lcm-ansible Updated.
Artifact |
Component |
Path |
|---|---|---|
Helm chart Updated |
ceph-controller |
https://binary.mirantis.com/ceph/helm/ceph-operator-1.0.0-mcc-2.25.1-9 |
Docker images Updated |
ceph |
mirantis.azurecr.io/mirantis/ceph:v17.2.6-2.cve |
ceph-controller |
mirantis.azurecr.io/ceph/mcp/ceph-controller:2.25.1-8 |
|
cephcsi |
mirantis.azurecr.io/mirantis/cephcsi:v3.8.1-4.cve |
|
cephcsi-registrar |
mirantis.azurecr.io/mirantis/cephcsi-registrar:v2.8.0-2.cve |
|
cephcsi-provisioner |
mirantis.azurecr.io/mirantis/cephcsi-provisioner:v3.5.0-2.cve |
|
cephcsi-snapshotter |
mirantis.azurecr.io/mirantis/cephcsi-snapshotter:v6.2.1-2.cve |
|
cephcsi-attacher |
mirantis.azurecr.io/mirantis/cephcsi-attacher:v4.3.0-2.cve |
|
cephcsi-resizer |
mirantis.azurecr.io/mirantis/cephcsi-resizer:v1.8.0-2.cve |
|
rook |
mirantis.azurecr.io/ceph/rook:v1.11.11-15 |
Artifact |
Component |
Path |
|---|---|---|
Binaries Updated |
lcm-ansible |
https://binary.mirantis.com/lcm/bin/lcm-ansible/v0.23.0-84-g8d74d7c/lcm-ansible.tar.gz |
lcm-agent |
||
Helm charts Updated |
helm-controller |
https://binary.mirantis.com/core/helm/helm-controller-1.38.22.tgz |
managed-lcm-api |
https://binary.mirantis.com/core/helm/managed-lcm-api-1.38.22.tgz |
|
Docker images Updated |
helm-controller |
mirantis.azurecr.io/core/lcm-controller:1.38.22 |
Artifact |
Component |
Path |
|---|---|---|
Helm charts |
alerta Updated |
https://binary.mirantis.com/stacklight/helm/alerta-0.1.0-mcp-33.tgz |
alertmanager-webhook-servicenow Updated |
https://binary.mirantis.com/stacklight/helm/alertmanager-webhook-servicenow-0.2.0-mcp-8.tgz |
|
cadvisor Updated |
https://binary.mirantis.com/stacklight/helm/cadvisor-0.1.0-mcp-6.tgz |
|
elasticsearch-curator Updated |
https://binary.mirantis.com/stacklight/helm/elasticsearch-curator-1.5.0-mcp-15.tgz |
|
elasticsearch-exporter Updated |
https://binary.mirantis.com/stacklight/helm/elasticsearch-exporter-1.2.0-mcp-10.tgz |
|
fluentd-logs Updated |
https://binary.mirantis.com/stacklight/helm/fluentd-logs-0.1.0-mcp-196.tgz |
|
grafana Updated |
https://binary.mirantis.com/stacklight/helm/grafana-3.3.10-mcp-254.tgz |
|
iam-proxy Updated |
||
metric-collector Updated |
https://binary.mirantis.com/stacklight/helm/metric-collector-0.3.0-mcp-17.tgz |
|
metricbeat Updated |
https://binary.mirantis.com/stacklight/helm/metricbeat-1.7.1-mcp-25.tgz |
|
opensearch Updated |
https://binary.mirantis.com/stacklight/helm/opensearch-0.1.0-mcp-63.tgz |
|
opensearch-dashboards Updated |
https://binary.mirantis.com/stacklight/helm/opensearch-dashboards-0.1.0-mcp-49.tgz |
|
patroni Updated |
https://binary.mirantis.com/stacklight/helm/patroni-0.15.1-mcp-57.tgz |
|
prometheus Updated |
https://binary.mirantis.com/stacklight/helm/prometheus-8.11.4-mcp-257.tgz |
|
prometheus-blackbox-exporter Updated |
https://binary.mirantis.com/stacklight/helm/prometheus-blackbox-exporter-0.3.0-mcp-19.tgz |
|
prometheus-es-exporter Updated |
https://binary.mirantis.com/stacklight/helm/prometheus-es-exporter-1.0.0-mcp-18.tgz |
|
prometheus-msteams Updated |
https://binary.mirantis.com/stacklight/helm/prometheus-msteams-0.1.0-mcp-12.tgz |
|
refapp |
https://binary.mirantis.com/scale/helm/refapp-0.2.1-mcp-13.tgz |
|
sf-notifier Updated |
https://binary.mirantis.com/stacklight/helm/sf-notifier-0.2.0-mcp-10.tgz |
|
sf-reporter Updated |
https://binary.mirantis.com/stacklight/helm/sf-reporter-0.2.0-mcp-10.tgz |
|
stacklight Updated |
https://binary.mirantis.com/stacklight/helm/stacklight-0.13.7.tgz |
|
telegraf-ds Updated |
https://binary.mirantis.com/stacklight/helm/telegraf-ds-1.1.5-mcp-40.tgz |
|
telegraf-s Updated |
https://binary.mirantis.com/stacklight/helm/telegraf-s-1.1.5-mcp-40.tgz |
|
telemeter-client Updated |
https://binary.mirantis.com/stacklight/helm/telemeter-client-0.2.0-mcp-14.tgz |
|
telemeter-server Updated |
https://binary.mirantis.com/stacklight/helm/telemeter-server-0.2.0-mcp-14.tgz |
|
Docker images |
alerta-web Updated |
mirantis.azurecr.io/stacklight/alerta-web:9-20231103023010 |
alertmanager Updated |
mirantis.azurecr.io/stacklight/alertmanager:v0-20231103023014 |
|
alertmanager-webhook-servicenow Updated |
mirantis.azurecr.io/stacklight/alertmanager-webhook-servicenow:v0.1-20231027101957 |
|
alpine-utils Updated |
mirantis.azurecr.io/stacklight/alpine-utils:1-20231027023014 |
|
blackbox-exporter |
mirantis.azurecr.io/stacklight/blackbox-exporter:v0.24.0 |
|
cadvisor Updated |
mirantis.azurecr.io/stacklight/cadvisor:v0.47-20231027023014 |
|
configmap-reload |
mirantis.azurecr.io/stacklight/configmap-reload:v0.8.0 |
|
curator |
mirantis.azurecr.io/stacklight/curator:5.7.6-20230404082402 |
|
curl-jq Updated |
mirantis.azurecr.io/scale/curl-jq:alpine-20231019061751 |
|
elasticsearch-exporter |
mirantis.azurecr.io/stacklight/elasticsearch-exporter:v1.5.0 |
|
fluentd Updated |
mirantis.azurecr.io/stacklight/fluentd:1.15-20231027023015 |
|
grafana Updated |
mirantis.azurecr.io/stacklight/grafana:9.5.13 |
|
grafana-image-renderer Updated |
mirantis.azurecr.io/stacklight/grafana-image-renderer:3-20231030112043 |
|
k8s-sidecar Updated |
mirantis.azurecr.io/stacklight/k8s-sidecar:1-20231030141315 |
|
kube-state-metrics |
mirantis.azurecr.io/stacklight/kube-state-metrics:v2.8.2 |
|
kubectl Updated |
mirantis.azurecr.io/stacklight/kubectl:1.22-20231103023015 |
|
metric-collector Updated |
mirantis.azurecr.io/stacklight/metric-collector:v0.1-20231103023010 |
|
metricbeat Updated |
mirantis.azurecr.io/stacklight/metricbeat:7.12.1-20231027023009 |
|
node-exporter |
mirantis.azurecr.io/stacklight/node-exporter:v1.6.0 |
|
oauth2-proxy Updated |
mirantis.azurecr.io/iam/oauth2-proxy:v7.1.3-5 |
|
opensearch Updated |
mirantis.azurecr.io/stacklight/opensearch:2-20231103023014 |
|
opensearch-dashboards Updated |
mirantis.azurecr.io/stacklight/opensearch-dashboards:2-20231103023010 |
|
openstack-refapp |
mirantis.azurecr.io/openstack/openstack-refapp:0.1.3 |
|
pgbouncer Updated |
mirantis.azurecr.io/stacklight/pgbouncer:1-20231103023015 |
|
prometheus |
mirantis.azurecr.io/stacklight/prometheus:v2.44.0 |
|
prometheus-es-exporter Updated |
mirantis.azurecr.io/stacklight/prometheus-es-exporter:v0.14.0-20231103023015 |
|
prometheus-msteams |
mirantis.azurecr.io/stacklight/prometheus-msteams:v1.5.2 |
|
prometheus-patroni-exporter Updated |
mirantis.azurecr.io/stacklight/prometheus-patroni-exporter:0.0.1-20231103023015 |
|
prometheus-postgres-exporter |
mirantis.azurecr.io/stacklight/prometheus-postgres-exporter:v0.12.0 |
|
prometheus-relay Updated |
mirantis.azurecr.io/stacklight/prometheus-relay:v0.4-20231103023010 |
|
psql-client |
mirantis.azurecr.io/scale/psql-client:v13-20230817113822 |
|
sf-notifier Updated |
mirantis.azurecr.io/stacklight/sf-notifier:v0.4-20231027023020 |
|
sf-reporter |
mirantis.azurecr.io/stacklight/sf-reporter:v0.1-20230911151029 |
|
spilo Updated |
mirantis.azurecr.io/stacklight/spilo:13-2.1p9-20231103023014 |
|
stacklight-toolkit Updated |
mirantis.azurecr.io/stacklight/stacklight-toolkit:20231103023015 |
|
telegraf |
mirantis.azurecr.io/stacklight/telegraf:v1.9.1-20231103023010 Updated |
|
mirantis.azurecr.io/stacklight/telegraf:1-20231030132045 Updated |
||
telemeter Updated |
mirantis.azurecr.io/stacklight/telemeter:4.4-20231027023011 |
|
telemeter-token-auth Updated |
mirantis.azurecr.io/stacklight/telemeter-token-auth:v0.1-20231103023014 |
Unchanged as compared to 16.0.0
Artifact |
Component |
Path |
|---|---|---|
Debian repositories |
System packages |
|
http://mirror.mirantis.com/kaas/kubernetes-extra-rhel7-0.0.8/ |
||
https://mirror.mirantis.com/kaas/ubuntu-2023-10-11-015021.target.txt |
||
MCR repositories |
MCR |
https://repos.mirantis.com/ubuntu/dists/bionic/pool/stable-23.10/ |
Target ubuntu system 1 |
Ubuntu |
https://binary.mirantis.com/bm/bin/efi/ubuntu/tgz-focal-20231011091340 |
- 1
Only for bare metal clusters
This section outlines release notes for the Cluster release 16.0.0 that is introduced in the Container Cloud release 2.25.0.
This Cluster release supports Mirantis Kubernetes Engine 3.7.1 with Kubernetes 1.27 and Mirantis Container Runtime 23.0.7.
For the list of known and addressed issues, refer to the Container Cloud release 2.25.0 section.
This section outlines new features implemented in the Cluster release 16.0.0 that is introduced in the Container Cloud release 2.25.0.
Introduced support for Mirantis Container Runtime (MCR) 23.0.7 and Mirantis Kubernetes Engine (MKE) 3.7.1 that supports Kubernetes 1.27 for the Container Cloud management and managed clusters. On existing clusters, MKE and MCR are updated to the latest supported version when you update your managed cluster to the Cluster release 16.0.0.
Caution
Support for MKE 3.6.x is dropped. Therefore, new deployments on MKE 3.6.x are not supported.
Implemented the Ceph Cluster details page in the Container Cloud web UI containing the Machines and OSDs tabs with a detailed descriptions and statuses of Ceph machines and Ceph OSDs comprising a Ceph cluster deployment.
Implemented the capability to address Ceph storage devices using the by-id
identifiers.
The by-id identifier is the only persistent device identifier for a Ceph
cluster that remains stable after the cluster upgrade or any other maintenance.
Therefore, Mirantis recommends using device by-id symlinks rather than
device names or by-path symlinks.
Added the kaasCephState field in the KaaSCephCluster.status
specification to display the current state of KaasCephCluster and
any errors during object reconciliation, including specification
generation, object creation on a managed cluster, and status retrieval.
TechPreview
Added initial Technology Preview support for forwarding of Container Cloud services logs, which are sent to OpenSearch by default, to Splunk using the syslog external output configuration.
Implemented the following monitoring improvements for Ceph:
Optimized the following Ceph dashboards in Grafana: Ceph Cluster, Ceph Pools, Ceph OSDs.
Removed the redundant Ceph Nodes Grafana dashboard. You can view its content using the following dashboards:
Ceph stats through the Ceph Cluster dashboard.
Resource utilization through the System dashboard, which now includes filtering by Ceph node labels, such as
ceph_role_osd,ceph_role_mon, andceph_role_mgr.
Removed the
rook_clusteralert label.Removed the redundant
CephOSDDownalert.Renamed the
CephNodeDownalert toCephOSDNodeDown.
Optimized StackLight NodeDown alerts for a better notification handling
after cluster recovery from an accident:
Reworked the
NodeDown-related alert inhibition rulesReworked the logic of all
NodeDown-related alerts for all supported groups of nodes, which includes renaming of the<alertName>TargetsOutagealerts to<alertNameTargetDown>Added the
TungstenFabricOperatorTargetDownalert for Tungsten Fabric deployments of MOSK clustersRemoved redundant
KubeDNSTargetsOutageandKubePodsNotReadyalerts
Optimized OpenSearch configuration and StackLight datamodel to provide better resources utilization and faster query response. Added the following enhancements:
Limited the default namespaces for log collection with the ability to add custom namespaces to the monitoring list using the following parameters:
logging.namespaceFiltering.logs- limits the number of namespaces for Pods log collection. Enabled by default.logging.namespaceFiltering.events- limits the number of namespaces for Kubernetes events collection. Disabled by default.logging.namespaceFiltering.events/logs.extraNamespaces- adds extra namespaces, which are not in the default list, to collect specific Kubernetes Pod logs or Kubernetes events. Empty by default.
Added the
logging.enforceOopsCompressionparameter that enforces 32 GB of heap size, unless the defined memory limit allows using 50 GB of heap. Enabled by default.Added the
NO_SEVERITYseverity label that is automatically added to a log with no severity label in the message. This allows having more control over which logs are actually being processed by Fluentd and which are skipped by mistake.Added documentation on how to tune OpenSearch performance using hardware and software settings for baremetal-based Container Cloud clusters.
Learn more
Operations Guide: Tune OpenSearch performance for the bare metal provider
MOSK Operations Guide: StackLight configuration parameters - Log filtering for namespaces
MOSK Operations Guide: StackLight configuration parameters - Enforce OOPS compression
MOSK Operations Guide: StackLight configuration parameters - Log verbosity
On top of continuous improvements delivered to the existing Container Cloud guides, added the documentation on how to export data from the Table panels of Grafana dashboards to CSV.
The following table lists the components versions of the Cluster release 16.0.0.
Component |
Application/Service |
Version |
|---|---|---|
Cluster orchestration |
Mirantis Kubernetes Engine |
3.7.1 0 |
Container runtime |
Mirantis Container Runtime |
23.0.7 1 |
Distributed storage |
Ceph |
17.2.6 (Quincy) |
Rook |
1.11.11-13 |
|
LCM |
helm-controller |
1.38.17 |
lcm-ansible |
0.23.0-73-g01aa9b3 |
|
lcm-agent |
1.38.17 |
|
StackLight |
Alerta |
9.0.0 |
Alertmanager |
0.25.0 |
|
Alertmanager Webhook ServiceNow |
0.1 |
|
Blackbox Exporter |
0.24.0 |
|
cAdvisor |
0.47.2 |
|
Elasticsearch Curator |
5.7.6 |
|
Elasticsearch Exporter |
1.5.0 |
|
Fluentd |
1.15.3 |
|
Grafana |
9.5.7 |
|
Grafana Image Renderer |
3.7.1 |
|
kube-state-metrics |
2.8.2 |
|
Metric Collector |
0.1 |
|
Metricbeat |
7.12.1 |
|
Node Exporter |
1.6.0 |
|
OAuth2 Proxy |
7.1.3 |
|
OpenSearch |
2.8.0 |
|
OpenSearch Dashboards |
2.7.0 |
|
Prometheus |
2.44.0 |
|
Prometheus ES Exporter |
0.14.0 |
|
Prometheus MS Teams |
1.5.2 |
|
Prometheus Patroni Exporter |
0.0.1 |
|
Prometheus Postgres Exporter |
0.12.0 |
|
Prometheus Relay |
0.4 |
|
sf-notifier |
0.4 |
|
sf-reporter |
0.1 |
|
Spilo |
13-2.1p9 |
|
Telegraf |
1.9.1 |
|
1.27.3 |
||
Telemeter |
4.4 |
- 0
For the Mirantis Kubernetes Engine (MKE) release highlights and components versions, see MKE documentation: MKE release notes.
- 1
For the Mirantis Container Runtime (MCR) release highlights, see MCR documentation: MCR release notes.
This section lists the artifacts of components included in the Cluster release 16.0.0.
Artifact |
Component |
Path |
|---|---|---|
Helm chart |
ceph-controller |
https://binary.mirantis.com/ceph/helm/ceph-operator-1.0.0-mcc-2.25.0-1.tgz |
Docker images |
ceph |
mirantis.azurecr.io/mirantis/ceph:v17.2.6-rel-5 |
ceph-controller |
mirantis.azurecr.io/ceph/mcp/ceph-controller:2.25.0-0 |
|
cephcsi |
mirantis.azurecr.io/mirantis/cephcsi:v3.8.1-rel-1 |
|
cephcsi-registrar |
mirantis.azurecr.io/mirantis/cephcsi-registrar:v2.8.0-cve-1 |
|
cephcsi-provisioner |
mirantis.azurecr.io/mirantis/cephcsi-provisioner:v3.5.0-cve-1 |
|
cephcsi-snapshotter |
mirantis.azurecr.io/mirantis/cephcsi-snapshotter:v6.2.1-cve-1 |
|
cephcsi-attacher |
mirantis.azurecr.io/mirantis/cephcsi-attacher:v4.3.0-cve-1 |
|
cephcsi-resizer |
mirantis.azurecr.io/mirantis/cephcsi-resizer:v1.8.0-cve-1 |
|
rook |
mirantis.azurecr.io/ceph/rook:v1.11.11-13 |
Artifact |
Component |
Path |
|---|---|---|
Binaries |
lcm-ansible |
https://binary.mirantis.com/lcm/bin/lcm-ansible/v0.23.0-73-g01aa9b3/lcm-ansible.tar.gz |
lcm-agent |
||
Helm charts |
helm-controller |
https://binary.mirantis.com/core/helm/helm-controller-1.38.17.tgz |
managed-lcm-api |
https://binary.mirantis.com/core/helm/managed-lcm-api-1.38.17.tgz |
|
Docker images |
helm-controller |
mirantis.azurecr.io/core/lcm-controller:1.38.17 |
Artifact |
Component |
Path |
|---|---|---|
Helm charts |
alerta |
https://binary.mirantis.com/stacklight/helm/alerta-0.1.0-mcp-29.tgz |
alertmanager-webhook-servicenow |
https://binary.mirantis.com/stacklight/helm/alertmanager-webhook-servicenow-0.2.0-mcp-4.tgz |
|
cadvisor |
https://binary.mirantis.com/stacklight/helm/cadvisor-0.1.0-mcp-3.tgz |
|
elasticsearch-curator |
https://binary.mirantis.com/stacklight/helm/elasticsearch-curator-1.5.0-mcp-12.tgz |
|
elasticsearch-exporter |
https://binary.mirantis.com/stacklight/helm/elasticsearch-exporter-1.2.0-mcp-7.tgz |
|
fluentd-logs |
https://binary.mirantis.com/stacklight/helm/fluentd-logs-0.1.0-mcp-193.tgz |
|
grafana |
https://binary.mirantis.com/stacklight/helm/grafana-3.3.10-mcp-250.tgz |
|
iam-proxy |
||
metric-collector |
https://binary.mirantis.com/stacklight/helm/metric-collector-0.3.0-mcp-10.tgz |
|
metricbeat |
https://binary.mirantis.com/stacklight/helm/metricbeat-1.7.1-mcp-16.tgz |
|
opensearch |
https://binary.mirantis.com/stacklight/helm/opensearch-0.1.0-mcp-60.tgz |
|
opensearch-dashboards |
https://binary.mirantis.com/stacklight/helm/opensearch-dashboards-0.1.0-mcp-47.tgz |
|
patroni |
https://binary.mirantis.com/stacklight/helm/patroni-0.15.1-mcp-54.tgz |
|
prometheus |
https://binary.mirantis.com/stacklight/helm/prometheus-8.11.4-mcp-245.tgz |
|
prometheus-blackbox-exporter |
https://binary.mirantis.com/stacklight/helm/prometheus-blackbox-exporter-0.3.0-mcp-15.tgz |
|
prometheus-es-exporter |
https://binary.mirantis.com/stacklight/helm/prometheus-es-exporter-1.0.0-mcp-11.tgz |
|
prometheus-msteams |
https://binary.mirantis.com/stacklight/helm/prometheus-msteams-0.1.0-mcp-9.tgz |
|
refapp |
https://binary.mirantis.com/scale/helm/refapp-0.2.1-mcp-13.tgz |
|
sf-notifier |
https://binary.mirantis.com/stacklight/helm/sf-notifier-0.2.0-mcp-7.tgz |
|
sf-reporter |
https://binary.mirantis.com/stacklight/helm/sf-reporter-0.2.0-mcp-7.tgz |
|
stacklight |
https://binary.mirantis.com/stacklight/helm/stacklight-0.13.3.tgz |
|
telegraf-ds |
https://binary.mirantis.com/stacklight/helm/telegraf-ds-1.1.5-mcp-37.tgz |
|
telegraf-s |
https://binary.mirantis.com/stacklight/helm/telegraf-s-1.1.5-mcp-37.tgz |
|
telemeter-client |
https://binary.mirantis.com/stacklight/helm/telemeter-client-0.2.0-mcp-7.tgz |
|
telemeter-server |
https://binary.mirantis.com/stacklight/helm/telemeter-server-0.2.0-mcp-7.tgz |
|
Docker images |
alerta-web |
mirantis.azurecr.io/stacklight/alerta-web:9-20230929023008 |
alertmanager |
mirantis.azurecr.io/stacklight/alertmanager:v0-20230929023012 |
|
alertmanager-webhook-servicenow |
mirantis.azurecr.io/stacklight/alertmanager-webhook-servicenow:v0.1-20230912073324 |
|
alpine-utils |
mirantis.azurecr.io/stacklight/alpine-utils:1-20230929023018 |
|
blackbox-exporter |
mirantis.azurecr.io/stacklight/blackbox-exporter:v0.24.0 |
|
cadvisor |
mirantis.azurecr.io/stacklight/cadvisor:v0.47-20230929023009 |
|
configmap-reload |
mirantis.azurecr.io/stacklight/configmap-reload:v0.8.0 |
|
curator |
mirantis.azurecr.io/stacklight/curator:5.7.6-20230404082402 |
|
curl-jq |
mirantis.azurecr.io/scale/curl-jq:alpine-20230925094109 |
|
elasticsearch-exporter |
mirantis.azurecr.io/stacklight/elasticsearch-exporter:v1.5.0 |
|
fluentd |
mirantis.azurecr.io/stacklight/fluentd:1.15-20230929023011 |
|
grafana |
mirantis.azurecr.io/stacklight/grafana:9.5.7 |
|
grafana-image-renderer |
mirantis.azurecr.io/stacklight/grafana-image-renderer:3-20230929023011 |
|
k8s-sidecar |
mirantis.azurecr.io/stacklight/k8s-sidecar:1.22-20230929023017 |
|
kube-state-metrics |
mirantis.azurecr.io/stacklight/kube-state-metrics:v2.8.2 |
|
kubectl |
mirantis.azurecr.io/stacklight/kubectl:1.22-20230929023018 |
|
metric-collector |
mirantis.azurecr.io/stacklight/metric-collector:v0.1-20230929023015 |
|
metricbeat |
mirantis.azurecr.io/stacklight/metricbeat:7.12.1-20230929023009 |
|
node-exporter |
mirantis.azurecr.io/stacklight/node-exporter:v1.6.0 |
|
oauth2-proxy |
mirantis.azurecr.io/iam/oauth2-proxy:v7.1.3-4 |
|
opensearch |
mirantis.azurecr.io/stacklight/opensearch:2-20230929023012 |
|
opensearch-dashboards |
mirantis.azurecr.io/stacklight/opensearch-dashboards:2-20230929023008 |
|
openstack-refapp |
mirantis.azurecr.io/openstack/openstack-refapp:0.1.3 |
|
pgbouncer |
mirantis.azurecr.io/stacklight/pgbouncer:1-20230929023018 |
|
prometheus |
mirantis.azurecr.io/stacklight/prometheus:v2.44.0 |
|
prometheus-es-exporter |
mirantis.azurecr.io/stacklight/prometheus-es-exporter:v0.14.0-20230929023017 |
|
prometheus-msteams |
mirantis.azurecr.io/stacklight/prometheus-msteams:v1.5.2 |
|
prometheus-patroni-exporter |
mirantis.azurecr.io/stacklight/prometheus-patroni-exporter:0.0.1-20230929023018 |
|
prometheus-postgres-exporter |
mirantis.azurecr.io/stacklight/prometheus-postgres-exporter:v0.12.0 |
|
prometheus-relay |
mirantis.azurecr.io/stacklight/prometheus-relay:v0.4-20230929023016 |
|
psql-client |
mirantis.azurecr.io/scale/psql-client:v13-20230817113822 |
|
sf-notifier |
mirantis.azurecr.io/stacklight/sf-notifier:v0.4-20230929023013 |
|
sf-reporter |
mirantis.azurecr.io/stacklight/sf-reporter:v0.1-20230911151029 |
|
spilo |
mirantis.azurecr.io/stacklight/spilo:13-2.1p9-20230929023012 |
|
stacklight-toolkit |
mirantis.azurecr.io/stacklight/stacklight-toolkit:20231004090138 |
|
telegraf |
mirantis.azurecr.io/stacklight/telegraf:v1.9.1-20230915023009 |
|
mirantis.azurecr.io/stacklight/telegraf:1.27-20230809094327 |
||
telemeter |
mirantis.azurecr.io/stacklight/telemeter:4.4-20230929023011 |
|
telemeter-token-auth |
mirantis.azurecr.io/stacklight/telemeter-token-auth:v0.1-20230929023012 |
Artifact |
Component |
Path |
|---|---|---|
Debian repositories |
System packages |
|
http://mirror.mirantis.com/kaas/kubernetes-extra-rhel7-0.0.8/ |
||
https://mirror.mirantis.com/kaas/ubuntu-2023-10-11-015021.target.txt |
||
MCR repositories |
MCR |
https://repos.mirantis.com/ubuntu/dists/bionic/pool/stable-23.10/ |
Target ubuntu system 1 |
Ubuntu |
https://binary.mirantis.com/bm/bin/efi/ubuntu/tgz-focal-20231011091340 |
- 1
Only for bare metal clusters
This section outlines release notes for unsupported Cluster releases of the 15.x series.
Major and patch versions update path
The primary distinction between major and patch product versions lies in the fact that major release versions introduce new functionalities, whereas patch release versions predominantly offer minor product enhancements, mostly CVE resolutions for your clusters.
Depending on your deployment needs, you can either update only between major Cluster releases or apply patch updates between major releases. Choosing the latter option ensures you receive security fixes as soon as they become available. Though, be prepared to update your cluster frequently, approximately once every three weeks. Otherwise, you can update only between major Cluster releases as each subsequent major Cluster release includes patch Cluster release updates of the previous major Cluster release.
This section includes release notes for the patch Cluster release 15.0.3 that is introduced in the Container Cloud patch release 2.24.5 and is based on Cluster releases 15.0.1, 15.0.2, and 15.0.3.
This patch Cluster release introduces MOSK 23.2.3 that is based on Mirantis Kubernetes Engine 3.6.6 with Kubernetes 1.24 and Mirantis Container Runtime 20.10.17.
For details on MOSK 23.2.3, see MOSK documentation: Release Notes
For the list of CVE fixes delivered with this patch Cluster release, see Container Cloud 2.24.5
For details on patch release delivery, see Patch releases
This section lists the components artifacts of the Cluster release 15.0.4.
Note
The components that are newly added, updated, deprecated, or removed
as compared to the previous release version, are marked
with a corresponding superscript,
for example, lcm-ansible Updated.
Artifact |
Component |
Path |
|---|---|---|
Helm chart |
ceph-controller |
https://binary.mirantis.com/ceph/helm/ceph-operator-1.0.0-mcc-2.24.4-8.tgz |
Docker images |
ceph |
mirantis.azurecr.io/mirantis/ceph:v17.2.6-cve-1 |
ceph-controller |
mirantis.azurecr.io/ceph/mcp/ceph-controller:2.24.4-7 |
|
cephcsi |
mirantis.azurecr.io/mirantis/cephcsi:v3.8.0-cve-2 |
|
cephcsi-registrar |
mirantis.azurecr.io/mirantis/cephcsi-registrar:v2.8.0-cve-1 |
|
cephcsi-provisioner |
mirantis.azurecr.io/mirantis/cephcsi-provisioner:v3.5.0-cve-1 |
|
cephcsi-snapshotter |
mirantis.azurecr.io/mirantis/cephcsi-snapshotter:v6.2.1-cve-1 |
|
cephcsi-attacher |
mirantis.azurecr.io/mirantis/cephcsi-attacher:v4.3.0-cve-1 |
|
cephcsi-resizer |
mirantis.azurecr.io/mirantis/cephcsi-resizer:v1.8.0-cve-1 |
|
rook |
mirantis.azurecr.io/ceph/rook:v1.11.4-12 |
Artifact |
Component |
Path |
|---|---|---|
Binaries Updated |
lcm-ansible |
https://binary.mirantis.com/lcm/bin/lcm-ansible/v0.22.0-75-g08569a8/lcm-ansible.tar.gz |
lcm-agent |
||
Helm charts Updated |
helm-controller |
https://binary.mirantis.com/core/helm/helm-controller-1.37.25.tgz |
managed-lcm-api |
https://binary.mirantis.com/core/helm/managed-lcm-api-1.37.25.tgz |
|
Docker images Updated |
helm-controller |
mirantis.azurecr.io/core/lcm-controller:1.37.25 |
Artifact |
Component |
Path |
|---|---|---|
Helm charts |
alerta |
https://binary.mirantis.com/stacklight/helm/alerta-0.1.0-mcp-29.tgz |
alertmanager-webhook-servicenow |
https://binary.mirantis.com/stacklight/helm/alertmanager-webhook-servicenow-0.2.0-mcp-4.tgz |
|
cadvisor |
https://binary.mirantis.com/stacklight/helm/cadvisor-0.1.0-mcp-2.tgz |
|
elasticsearch-curator |
https://binary.mirantis.com/stacklight/helm/elasticsearch-curator-1.5.0-mcp-10.tgz |
|
elasticsearch-exporter |
https://binary.mirantis.com/stacklight/helm/elasticsearch-exporter-1.2.0-mcp-7.tgz |
|
fluentd |
https://binary.mirantis.com/stacklight/helm/fluentd-2.0.3-mcp-49.tgz |
|
fluentd-logs |
https://binary.mirantis.com/stacklight/helm/fluentd-logs-0.1.0-mcp-176.tgz |
|
grafana |
https://binary.mirantis.com/stacklight/helm/grafana-3.3.10-mcp-231.tgz |
|
iam-proxy |
||
metric-collector |
https://binary.mirantis.com/stacklight/helm/metric-collector-0.3.0-mcp-10.tgz |
|
metricbeat |
https://binary.mirantis.com/stacklight/helm/metricbeat-1.7.1-mcp-16.tgz |
|
opensearch |
https://binary.mirantis.com/stacklight/helm/opensearch-0.1.0-mcp-58.tgz |
|
opensearch-dashboards |
https://binary.mirantis.com/stacklight/helm/opensearch-dashboards-0.1.0-mcp-47.tgz |
|
patroni |
https://binary.mirantis.com/stacklight/helm/patroni-0.15.1-mcp-52.tgz |
|
prometheus |
https://binary.mirantis.com/stacklight/helm/prometheus-8.11.4-mcp-240.tgz |
|
prometheus-blackbox-exporter |
https://binary.mirantis.com/stacklight/helm/prometheus-blackbox-exporter-0.3.0-mcp-11.tgz |
|
prometheus-es-exporter |
https://binary.mirantis.com/stacklight/helm/prometheus-es-exporter-1.0.0-mcp-11.tgz |
|
prometheus-msteams |
https://binary.mirantis.com/stacklight/helm/prometheus-msteams-0.1.0-mcp-9.tgz |
|
sf-notifier |
https://binary.mirantis.com/stacklight/helm/sf-notifier-0.2.0-mcp-7.tgz |
|
sf-reporter |
https://binary.mirantis.com/stacklight/helm/sf-reporter-0.2.0-mcp-6.tgz |
|
stacklight Updated |
https://binary.mirantis.com/stacklight/helm/stacklight-0.12.13.tgz |
|
telegraf-ds |
https://binary.mirantis.com/stacklight/helm/telegraf-ds-1.1.5-mcp-37.tgz |
|
telegraf-s |
https://binary.mirantis.com/stacklight/helm/telegraf-s-1.1.5-mcp-37.tgz |
|
telemeter-client |
https://binary.mirantis.com/stacklight/helm/telemeter-client-0.2.0-mcp-7.tgz |
|
telemeter-server |
https://binary.mirantis.com/stacklight/helm/telemeter-server-0.2.0-mcp-7.tgz |
|
Docker images |
alerta-web Updated |
mirantis.azurecr.io/stacklight/alerta-web:9-20230915023010 |
alertmanager Updated |
mirantis.azurecr.io/stacklight/alertmanager:v0-20230915023015 |
|
alertmanager-webhook-servicenow Updated |
mirantis.azurecr.io/stacklight/alertmanager-webhook-servicenow:v0.1-20230912073324 |
|
alpine-utils Updated |
mirantis.azurecr.io/stacklight/alpine-utils:1-20230915023025 |
|
blackbox-exporter |
mirantis.azurecr.io/stacklight/blackbox-exporter:v0.24.0 |
|
cadvisor Updated |
mirantis.azurecr.io/stacklight/cadvisor:v0.47-20230915023013 |
|
configmap-reload |
mirantis.azurecr.io/stacklight/configmap-reload:v0.8.0 |
|
curator |
mirantis.azurecr.io/stacklight/curator:5.7.6-20230404082402 |
|
curl-jq Updated |
mirantis.azurecr.io/scale/curl-jq:alpine-20230821070620 |
|
elasticsearch-exporter |
mirantis.azurecr.io/stacklight/elasticsearch-exporter:v1.5.0 |
|
fluentd Updated |
mirantis.azurecr.io/stacklight/fluentd:1.15-20230915023013 |
|
grafana |
mirantis.azurecr.io/stacklight/grafana:9.5.7 |
|
grafana-image-renderer Updated |
mirantis.azurecr.io/stacklight/grafana-image-renderer:3-20230915023013 |
|
k8s-sidecar Updated |
mirantis.azurecr.io/stacklight/k8s-sidecar:1.22-20230915023025 |
|
kube-state-metrics |
mirantis.azurecr.io/stacklight/kube-state-metrics:v2.8.2 |
|
kubectl Updated |
mirantis.azurecr.io/stacklight/kubectl:1.22-20230915023021 |
|
metric-collector Updated |
mirantis.azurecr.io/stacklight/metric-collector:v0.1-20230915023017 |
|
metricbeat Updated |
mirantis.azurecr.io/stacklight/metricbeat:7.12.1-20230915023011 |
|
node-exporter |
mirantis.azurecr.io/stacklight/node-exporter:v1.6.0 |
|
oauth2-proxy |
mirantis.azurecr.io/iam/oauth2-proxy:v7.1.3-4 |
|
opensearch Updated |
mirantis.azurecr.io/stacklight/opensearch:2-20230915023015 |
|
opensearch-dashboards Updated |
mirantis.azurecr.io/stacklight/opensearch-dashboards:2-20230915023009 |
|
openstack-refapp |
mirantis.azurecr.io/openstack/openstack-refapp:0.1.3 |
|
pgbouncer Updated |
mirantis.azurecr.io/stacklight/pgbouncer:1-20230915023025 |
|
prometheus |
mirantis.azurecr.io/stacklight/prometheus:v2.44.0 |
|
prometheus-es-exporter Updated |
mirantis.azurecr.io/stacklight/prometheus-es-exporter:v0.14.0-20230915023021 |
|
prometheus-msteams |
mirantis.azurecr.io/stacklight/prometheus-msteams:v1.5.2 |
|
prometheus-patroni-exporter Updated |
mirantis.azurecr.io/stacklight/prometheus-patroni-exporter:0.0.1-20230915023025 |
|
prometheus-postgres-exporter |
mirantis.azurecr.io/stacklight/prometheus-postgres-exporter:v0.12.0 |
|
prometheus-relay Updated |
mirantis.azurecr.io/stacklight/prometheus-relay:v0.4-20230915023021 |
|
psql-client |
mirantis.azurecr.io/scale/psql-client:v13-20230817113822 |
|
sf-notifier Updated |
mirantis.azurecr.io/stacklight/sf-notifier:v0.3-20230915023010 |
|
sf-reporter Updated |
mirantis.azurecr.io/stacklight/sf-reporter:v0.1-20230911151029 |
|
spilo Updated |
mirantis.azurecr.io/stacklight/spilo:13-2.1p9-20230915023014 |
|
stacklight-toolkit Updated |
mirantis.azurecr.io/stacklight/stacklight-toolkit:20230915023021 |
|
telegraf |
mirantis.azurecr.io/stacklight/telegraf:v1.9.1-20230915023009 Updated |
|
mirantis.azurecr.io/stacklight/telegraf:1.27-20230809094327 |
||
telemeter Updated |
mirantis.azurecr.io/stacklight/telemeter:4.4-20230915023020 |
|
telemeter-token-auth Updated |
mirantis.azurecr.io/stacklight/telemeter-token-auth:v0.1-20230915023020 |
Unchanged as compared to 15.0.1
Artifact |
Component |
Path |
|---|---|---|
Debian repositories |
System packages |
|
http://mirror.mirantis.com/kaas/kubernetes-extra-rhel7-0.0.8/ |
||
https://mirror.mirantis.com/kaas/ubuntu-2023-06-01-014502.target.txt |
||
MCR repositories |
MCR |
https://repos.mirantis.com/ubuntu/dists/bionic/pool/stable-20.10/ |
Target ubuntu system |
Ubuntu |
https://binary.mirantis.com/bm/bin/efi/ubuntu/tgz-focal-20230606111629 |
https://binary.mirantis.com/bm/bin/efi/ubuntu/tgz-bionic-5.4-20230606111551 1 |
- 1
Only for existing clusters
This section includes release notes for the patch Cluster release 15.0.3 that is introduced in the Container Cloud patch release 2.24.4 and is based on Cluster releases 15.0.1 and 15.0.2.
This patch Cluster release introduces MOSK 23.2.2 that is based on Mirantis Kubernetes Engine 3.6.6 with Kubernetes 1.24 and Mirantis Container Runtime 20.10.17.
For details on MOSK 23.2.2, see MOSK documentation: Release Notes
For the list of enhancements and CVE fixes delivered with this patch Cluster release, see 2.24.4
For details on patch release delivery, see Patch releases
This section lists the components artifacts of the Cluster release 15.0.3.
Note
The components that are newly added, updated, deprecated, or removed
as compared to the previous release version, are marked
with a corresponding superscript,
for example, lcm-ansible Updated.
Artifact |
Component |
Path |
|---|---|---|
Helm chart Updated |
ceph-controller |
https://binary.mirantis.com/ceph/helm/ceph-operator-1.0.0-mcc-2.24.4-8.tgz |
Docker images |
ceph |
mirantis.azurecr.io/mirantis/ceph:v17.2.6-cve-1 |
ceph-controller Updated |
mirantis.azurecr.io/ceph/mcp/ceph-controller:2.24.4-7 |
|
cephcsi Updated |
mirantis.azurecr.io/mirantis/cephcsi:v3.8.0-cve-2 |
|
cephcsi-registrar |
mirantis.azurecr.io/mirantis/cephcsi-registrar:v2.8.0-cve-1 |
|
cephcsi-provisioner |
mirantis.azurecr.io/mirantis/cephcsi-provisioner:v3.5.0-cve-1 |
|
cephcsi-snapshotter |
mirantis.azurecr.io/mirantis/cephcsi-snapshotter:v6.2.1-cve-1 |
|
cephcsi-attacher |
mirantis.azurecr.io/mirantis/cephcsi-attacher:v4.3.0-cve-1 |
|
cephcsi-resizer |
mirantis.azurecr.io/mirantis/cephcsi-resizer:v1.8.0-cve-1 |
|
rook Updated |
mirantis.azurecr.io/ceph/rook:v1.11.4-12 |
Artifact |
Component |
Path |
|---|---|---|
Binaries Updated |
lcm-ansible |
https://binary.mirantis.com/lcm/bin/lcm-ansible/v0.22.0-66-ga855169/lcm-ansible.tar.gz |
lcm-agent |
||
Helm charts Updated |
helm-controller |
https://binary.mirantis.com/core/helm/helm-controller-1.37.24.tgz |
managed-lcm-api |
https://binary.mirantis.com/core/helm/managed-lcm-api-1.37.24.tgz |
|
Docker images Updated |
helm-controller |
mirantis.azurecr.io/core/lcm-controller:1.37.24 |
Artifact |
Component |
Path |
|---|---|---|
Helm charts |
alerta |
https://binary.mirantis.com/stacklight/helm/alerta-0.1.0-mcp-29.tgz |
alertmanager-webhook-servicenow |
https://binary.mirantis.com/stacklight/helm/alertmanager-webhook-servicenow-0.2.0-mcp-4.tgz |
|
cadvisor |
https://binary.mirantis.com/stacklight/helm/cadvisor-0.1.0-mcp-2.tgz |
|
elasticsearch-curator |
https://binary.mirantis.com/stacklight/helm/elasticsearch-curator-1.5.0-mcp-10.tgz |
|
elasticsearch-exporter |
https://binary.mirantis.com/stacklight/helm/elasticsearch-exporter-1.2.0-mcp-7.tgz |
|
fluentd |
https://binary.mirantis.com/stacklight/helm/fluentd-2.0.3-mcp-49.tgz |
|
fluentd-logs |
https://binary.mirantis.com/stacklight/helm/fluentd-logs-0.1.0-mcp-176.tgz |
|
grafana |
https://binary.mirantis.com/stacklight/helm/grafana-3.3.10-mcp-231.tgz |
|
iam-proxy |
||
metric-collector |
https://binary.mirantis.com/stacklight/helm/metric-collector-0.3.0-mcp-10.tgz |
|
metricbeat |
https://binary.mirantis.com/stacklight/helm/metricbeat-1.7.1-mcp-16.tgz |
|
opensearch |
https://binary.mirantis.com/stacklight/helm/opensearch-0.1.0-mcp-58.tgz |
|
opensearch-dashboards |
https://binary.mirantis.com/stacklight/helm/opensearch-dashboards-0.1.0-mcp-47.tgz |
|
patroni |
https://binary.mirantis.com/stacklight/helm/patroni-0.15.1-mcp-52.tgz |
|
prometheus |
https://binary.mirantis.com/stacklight/helm/prometheus-8.11.4-mcp-240.tgz |
|
prometheus-blackbox-exporter |
https://binary.mirantis.com/stacklight/helm/prometheus-blackbox-exporter-0.3.0-mcp-11.tgz |
|
prometheus-es-exporter |
https://binary.mirantis.com/stacklight/helm/prometheus-es-exporter-1.0.0-mcp-11.tgz |
|
prometheus-msteams |
https://binary.mirantis.com/stacklight/helm/prometheus-msteams-0.1.0-mcp-9.tgz |
|
sf-notifier |
https://binary.mirantis.com/stacklight/helm/sf-notifier-0.2.0-mcp-7.tgz |
|
sf-reporter |
https://binary.mirantis.com/stacklight/helm/sf-reporter-0.2.0-mcp-6.tgz |
|
stacklight Updated |
https://binary.mirantis.com/stacklight/helm/stacklight-0.12.10.tgz |
|
telegraf-ds |
https://binary.mirantis.com/stacklight/helm/telegraf-ds-1.1.5-mcp-37.tgz |
|
telegraf-s |
https://binary.mirantis.com/stacklight/helm/telegraf-s-1.1.5-mcp-37.tgz |
|
telemeter-client |
https://binary.mirantis.com/stacklight/helm/telemeter-client-0.2.0-mcp-7.tgz |
|
telemeter-server |
https://binary.mirantis.com/stacklight/helm/telemeter-server-0.2.0-mcp-7.tgz |
|
Docker images |
alerta-web Updated |
mirantis.azurecr.io/stacklight/alerta-web:9-20230829061227 |
alertmanager Updated |
mirantis.azurecr.io/stacklight/alertmanager:v0-20230825023014 |
|
alertmanager-webhook-servicenow |
mirantis.azurecr.io/stacklight/alertmanager-webhook-servicenow:v0.1-20230601043943 |
|
alpine-utils Updated |
mirantis.azurecr.io/stacklight/alpine-utils:1-20230825023021 |
|
blackbox-exporter |
mirantis.azurecr.io/stacklight/blackbox-exporter:v0.24.0 |
|
cadvisor Updated |
mirantis.azurecr.io/stacklight/cadvisor:v0.47-20230825023011 |
|
configmap-reload |
mirantis.azurecr.io/stacklight/configmap-reload:v0.8.0 |
|
curator |
mirantis.azurecr.io/stacklight/curator:5.7.6-20230404082402 |
|
curl-jq |
mirantis.azurecr.io/scale/curl-jq:alpine-20230706142802 |
|
elasticsearch-exporter |
mirantis.azurecr.io/stacklight/elasticsearch-exporter:v1.5.0 |
|
fluentd Updated |
mirantis.azurecr.io/stacklight/fluentd:1.15-20230825023012 |
|
grafana |
mirantis.azurecr.io/stacklight/grafana:9.5.7 |
|
grafana-image-renderer |
mirantis.azurecr.io/stacklight/grafana-image-renderer:3-20230712154008 |
|
k8s-sidecar Updated |
mirantis.azurecr.io/stacklight/k8s-sidecar:1.22-20230825023020 |
|
keycloak-gatekeeper Removed |
n/a |
|
kube-state-metrics |
mirantis.azurecr.io/stacklight/kube-state-metrics:v2.8.2 |
|
kubectl Updated |
mirantis.azurecr.io/stacklight/kubectl:1.22-20230825023019 |
|
metric-collector Updated |
mirantis.azurecr.io/stacklight/metric-collector:v0.1-20230825023018 |
|
metricbeat Updated |
mirantis.azurecr.io/stacklight/metricbeat:7.12.1-20230825023010 |
|
node-exporter |
mirantis.azurecr.io/stacklight/node-exporter:v1.6.0 |
|
oauth2-proxy New |
mirantis.azurecr.io/iam/oauth2-proxy:v7.1.3-4 |
|
opensearch Updated |
mirantis.azurecr.io/stacklight/opensearch:2-20230825023013 |
|
opensearch-dashboards Updated |
mirantis.azurecr.io/stacklight/opensearch-dashboards:2-20230825023009 |
|
openstack-refapp |
mirantis.azurecr.io/openstack/openstack-refapp:0.1.3 |
|
pgbouncer Updated |
mirantis.azurecr.io/stacklight/pgbouncer:1-20230825023021 |
|
prometheus |
mirantis.azurecr.io/stacklight/prometheus:v2.44.0 |
|
prometheus-es-exporter Updated |
mirantis.azurecr.io/stacklight/prometheus-es-exporter:v0.14.0-20230825023020 |
|
prometheus-msteams |
mirantis.azurecr.io/stacklight/prometheus-msteams:v1.5.2 |
|
prometheus-patroni-exporter Updated |
mirantis.azurecr.io/stacklight/prometheus-patroni-exporter:0.0.1-20230825023021 |
|
prometheus-postgres-exporter |
mirantis.azurecr.io/stacklight/prometheus-postgres-exporter:v0.12.0 |
|
prometheus-relay Updated |
mirantis.azurecr.io/stacklight/prometheus-relay:v0.4-20230825023020 |
|
psql-client Updated |
mirantis.azurecr.io/scale/psql-client:v13-20230817113822 |
|
sf-notifier Updated |
mirantis.azurecr.io/stacklight/sf-notifier:v0.3-20230825023009 |
|
sf-reporter |
mirantis.azurecr.io/stacklight/sf-reporter:v0.1-20230601044047 |
|
spilo Updated |
mirantis.azurecr.io/stacklight/spilo:13-2.1p9-20230825023018 |
|
stacklight-toolkit Updated |
mirantis.azurecr.io/stacklight/stacklight-toolkit:20230825023019 |
|
telegraf |
mirantis.azurecr.io/stacklight/telegraf:v1.9.1-20230825023009 Updated |
|
mirantis.azurecr.io/stacklight/telegraf:1.27-20230809094327 |
||
telemeter Updated |
mirantis.azurecr.io/stacklight/telemeter:4.4-20230825023014 |
|
telemeter-token-auth Updated |
mirantis.azurecr.io/stacklight/telemeter-token-auth:v0.1-20230825023013 |
Unchanged as compared to 15.0.1
Artifact |
Component |
Path |
|---|---|---|
Debian repositories |
System packages |
|
http://mirror.mirantis.com/kaas/kubernetes-extra-rhel7-0.0.8/ |
||
https://mirror.mirantis.com/kaas/ubuntu-2023-06-01-014502.target.txt |
||
MCR repositories |
MCR |
https://repos.mirantis.com/ubuntu/dists/bionic/pool/stable-20.10/ |
Target ubuntu system |
Ubuntu |
https://binary.mirantis.com/bm/bin/efi/ubuntu/tgz-focal-20230606111629 |
https://binary.mirantis.com/bm/bin/efi/ubuntu/tgz-bionic-5.4-20230606111551 1 |
- 1
Only for existing clusters
This section includes release notes for the patch Cluster release 15.0.2 that is introduced in the Container Cloud patch release 2.24.3 and is based on the major Cluster release 15.0.1.
This patch Cluster release introduces MOSK 23.2.1 that
is based on Mirantis Kubernetes Engine 3.6.6 with Kubernetes 1.24 and Mirantis
Container Runtime 20.10.17, in which docker-ee-cli was updated to version
20.10.18 to fix the following CVEs:
CVE-2023-28840,
CVE-2023-28642,
CVE-2022-41723.
For details on MOSK 23.2.1, see MOSK documentation: Release Notes
For the list of enhancements and CVE fixes delivered with this patch Cluster release, see 2.24.3
For details on patch release delivery, see Patch releases
This section lists the components artifacts of the Cluster release 15.0.2.
Note
The components that are newly added, updated, deprecated, or removed
as compared to the previous release version, are marked
with a corresponding superscript,
for example, lcm-ansible Updated.
Artifact |
Component |
Path |
|---|---|---|
Helm chart Updated |
ceph-controller |
https://binary.mirantis.com/ceph/helm/ceph-operator-1.0.0-mcc-2.24.3-2.tgz |
Docker images Updated |
ceph |
mirantis.azurecr.io/mirantis/ceph:v17.2.6-cve-1 |
ceph-controller |
mirantis.azurecr.io/ceph/mcp/ceph-controller:2.24.3-0 |
|
cephcsi |
mirantis.azurecr.io/mirantis/cephcsi:v3.8.0-cve-1 |
|
cephcsi-registrar |
mirantis.azurecr.io/mirantis/cephcsi-registrar:v2.8.0-cve-1 |
|
cephcsi-provisioner |
mirantis.azurecr.io/mirantis/cephcsi-provisioner:v3.5.0-cve-1 |
|
cephcsi-snapshotter |
mirantis.azurecr.io/mirantis/cephcsi-snapshotter:v6.2.1-cve-1 |
|
cephcsi-attacher |
mirantis.azurecr.io/mirantis/cephcsi-attacher:v4.3.0-cve-1 |
|
cephcsi-resizer |
mirantis.azurecr.io/mirantis/cephcsi-resizer:v1.8.0-cve-1 |
|
rook |
mirantis.azurecr.io/ceph/rook:v1.11.4-11 |
Artifact |
Component |
Path |
|---|---|---|
Binaries Updated |
lcm-ansible |
https://binary.mirantis.com/lcm/bin/lcm-ansible/v0.22.0-63-g8f4f248/lcm-ansible.tar.gz |
lcm-agent |
||
Helm charts Updated |
helm-controller |
https://binary.mirantis.com/core/helm/helm-controller-1.37.23.tgz |
managed-lcm-api |
https://binary.mirantis.com/core/helm/managed-lcm-api-1.37.23.tgz |
|
Docker images Updated |
helm-controller |
mirantis.azurecr.io/core/lcm-controller:1.37.23 |
Artifact |
Component |
Path |
|---|---|---|
Helm charts |
alerta |
https://binary.mirantis.com/stacklight/helm/alerta-0.1.0-mcp-29.tgz |
alertmanager-webhook-servicenow |
https://binary.mirantis.com/stacklight/helm/alertmanager-webhook-servicenow-0.2.0-mcp-4.tgz |
|
cadvisor |
https://binary.mirantis.com/stacklight/helm/cadvisor-0.1.0-mcp-2.tgz |
|
elasticsearch-curator |
https://binary.mirantis.com/stacklight/helm/elasticsearch-curator-1.5.0-mcp-10.tgz |
|
elasticsearch-exporter |
https://binary.mirantis.com/stacklight/helm/elasticsearch-exporter-1.2.0-mcp-7.tgz |
|
fluentd |
https://binary.mirantis.com/stacklight/helm/fluentd-2.0.3-mcp-49.tgz |
|
fluentd-logs |
https://binary.mirantis.com/stacklight/helm/fluentd-logs-0.1.0-mcp-176.tgz |
|
grafana |
https://binary.mirantis.com/stacklight/helm/grafana-3.3.10-mcp-231.tgz |
|
iam-proxy |
||
metric-collector |
https://binary.mirantis.com/stacklight/helm/metric-collector-0.3.0-mcp-10.tgz |
|
metricbeat |
https://binary.mirantis.com/stacklight/helm/metricbeat-1.7.1-mcp-16.tgz |
|
opensearch |
https://binary.mirantis.com/stacklight/helm/opensearch-0.1.0-mcp-58.tgz |
|
opensearch-dashboards |
https://binary.mirantis.com/stacklight/helm/opensearch-dashboards-0.1.0-mcp-47.tgz |
|
patroni |
https://binary.mirantis.com/stacklight/helm/patroni-0.15.1-mcp-52.tgz |
|
prometheus |
https://binary.mirantis.com/stacklight/helm/prometheus-8.11.4-mcp-240.tgz |
|
prometheus-blackbox-exporter |
https://binary.mirantis.com/stacklight/helm/prometheus-blackbox-exporter-0.3.0-mcp-11.tgz |
|
prometheus-es-exporter |
https://binary.mirantis.com/stacklight/helm/prometheus-es-exporter-1.0.0-mcp-11.tgz |
|
prometheus-msteams |
https://binary.mirantis.com/stacklight/helm/prometheus-msteams-0.1.0-mcp-9.tgz |
|
sf-notifier |
https://binary.mirantis.com/stacklight/helm/sf-notifier-0.2.0-mcp-7.tgz |
|
sf-reporter |
https://binary.mirantis.com/stacklight/helm/sf-reporter-0.2.0-mcp-6.tgz |
|
stacklight Updated |
https://binary.mirantis.com/stacklight/helm/stacklight-0.12.9.tgz |
|
telegraf-ds |
https://binary.mirantis.com/stacklight/helm/telegraf-ds-1.1.5-mcp-37.tgz |
|
telegraf-s |
https://binary.mirantis.com/stacklight/helm/telegraf-s-1.1.5-mcp-37.tgz |
|
telemeter-client |
https://binary.mirantis.com/stacklight/helm/telemeter-client-0.2.0-mcp-7.tgz |
|
telemeter-server |
https://binary.mirantis.com/stacklight/helm/telemeter-server-0.2.0-mcp-7.tgz |
|
Docker images |
alerta-web |
mirantis.azurecr.io/stacklight/alerta-web:9-20230714023009 |
alertmanager Updated |
mirantis.azurecr.io/stacklight/alertmanager:v0-20230811023012 |
|
alertmanager-webhook-servicenow |
mirantis.azurecr.io/stacklight/alertmanager-webhook-servicenow:v0.1-20230601043943 |
|
alpine-utils Updated |
mirantis.azurecr.io/stacklight/alpine-utils:1-20230811023020 |
|
blackbox-exporter |
mirantis.azurecr.io/stacklight/blackbox-exporter:v0.24.0 |
|
cadvisor Updated |
mirantis.azurecr.io/stacklight/cadvisor:v0.47-20230811023011 |
|
configmap-reload |
mirantis.azurecr.io/stacklight/configmap-reload:v0.8.0 |
|
curator |
mirantis.azurecr.io/stacklight/curator:5.7.6-20230404082402 |
|
curl-jq |
mirantis.azurecr.io/scale/curl-jq:alpine-20230706142802 |
|
elasticsearch-exporter |
mirantis.azurecr.io/stacklight/elasticsearch-exporter:v1.5.0 |
|
fluentd Updated |
mirantis.azurecr.io/stacklight/fluentd:1.15-20230811023012 |
|
grafana Updated |
mirantis.azurecr.io/stacklight/grafana:9.5.7 |
|
grafana-image-renderer |
mirantis.azurecr.io/stacklight/grafana-image-renderer:3-20230712154008 |
|
k8s-sidecar Updated |
mirantis.azurecr.io/stacklight/k8s-sidecar:1.22-20230811023020 |
|
keycloak-gatekeeper |
mirantis.azurecr.io/iam/keycloak-gatekeeper:7.1.3-5 |
|
kube-state-metrics |
mirantis.azurecr.io/stacklight/kube-state-metrics:v2.8.2 |
|
kubectl Updated |
mirantis.azurecr.io/stacklight/kubectl:1.22-20230811023020 |
|
metric-collector Updated |
mirantis.azurecr.io/stacklight/metric-collector:v0.1-20230811023017 |
|
metricbeat Updated |
mirantis.azurecr.io/stacklight/metricbeat:7.12.1-20230811023011 |
|
node-exporter |
mirantis.azurecr.io/stacklight/node-exporter:v1.6.0 |
|
opensearch Updated |
mirantis.azurecr.io/stacklight/opensearch:2-20230811023016 |
|
opensearch-dashboards Updated |
mirantis.azurecr.io/stacklight/opensearch-dashboards:2-20230811023009 |
|
openstack-refapp |
mirantis.azurecr.io/openstack/openstack-refapp:0.1.3 |
|
pgbouncer Updated |
mirantis.azurecr.io/stacklight/pgbouncer:1-20230811023021 |
|
prometheus |
mirantis.azurecr.io/stacklight/prometheus:v2.44.0 |
|
prometheus-es-exporter Updated |
mirantis.azurecr.io/stacklight/prometheus-es-exporter:v0.14.0-20230811023019 |
|
prometheus-msteams |
mirantis.azurecr.io/stacklight/prometheus-msteams:v1.5.2 |
|
prometheus-patroni-exporter Updated |
mirantis.azurecr.io/stacklight/prometheus-patroni-exporter:0.0.1-20230811023020 |
|
prometheus-postgres-exporter |
mirantis.azurecr.io/stacklight/prometheus-postgres-exporter:v0.12.0 |
|
prometheus-relay Updated |
mirantis.azurecr.io/stacklight/prometheus-relay:v0.4-20230811023018 |
|
psql-client |
mirantis.azurecr.io/scale/psql-client:v13-20230706142757 |
|
sf-notifier Updated |
mirantis.azurecr.io/stacklight/sf-notifier:v0.3-20230811023011 |
|
sf-reporter |
mirantis.azurecr.io/stacklight/sf-reporter:v0.1-20230601044047 |
|
spilo Updated |
mirantis.azurecr.io/stacklight/spilo:13-2.1p9-20230811023016 |
|
stacklight-toolkit Updated |
mirantis.azurecr.io/stacklight/stacklight-toolkit:20230811023013 |
|
telegraf |
mirantis.azurecr.io/stacklight/telegraf:v1.9.1-20230811023008 Updated |
|
mirantis.azurecr.io/stacklight/telegraf:1.27-20230809094327 Updated |
||
telemeter Updated |
mirantis.azurecr.io/stacklight/telemeter:4.4-20230811023013 |
|
telemeter-token-auth Updated |
mirantis.azurecr.io/stacklight/telemeter-token-auth:v0.1-20230811023014 |
Unchanged as compared to 15.0.1
Artifact |
Component |
Path |
|---|---|---|
Debian repositories |
System packages |
|
http://mirror.mirantis.com/kaas/kubernetes-extra-rhel7-0.0.8/ |
||
https://mirror.mirantis.com/kaas/ubuntu-2023-06-01-014502.target.txt |
||
MCR repositories |
MCR |
https://repos.mirantis.com/ubuntu/dists/bionic/pool/stable-20.10/ |
Target ubuntu system |
Ubuntu |
https://binary.mirantis.com/bm/bin/efi/ubuntu/tgz-focal-20230606111629 |
https://binary.mirantis.com/bm/bin/efi/ubuntu/tgz-bionic-5.4-20230606111551 1 |
- 1
Only for existing clusters
This section outlines release notes for the major Cluster release 15.0.1 that is introduced in the Container Cloud release 2.24.2. This Cluster release is based on the Cluster release 14.0.1. The Cluster release 15.0.1 supports:
Mirantis OpenStack for Kubernetes (MOSK) 23.2. For details, see MOSK Release Notes.
Mirantis Kubernetes Engine (MKE) 3.6.5. For details, see MKE Release Notes.
Mirantis Container Runtime (MCR) 20.10.17. For details, see MCR Release Notes.
Kubernetes 1.24.
For the list of known and addressed issues, refer to the Container Cloud release 2.24.0 section.
This section outlines new features implemented in the Cluster release 15.0.1 that is introduced in the Container Cloud release 2.24.2.
Added support for Mirantis Container Runtime (MCR) 20.10.17 and Mirantis Kubernetes Engine (MKE) 3.6.5 that supports Kubernetes 1.24.
An update from the Cluster release 12.7.0 or 12.7.4 to 15.0.1 becomes available through the Container Cloud web UI menu once the related management or regional cluster automatically upgrades to Container Cloud 2.24.2.
Caution
Support for MKE 3.5.x is dropped. Therefore, new deployments on MKE 3.5.x are not supported.
Upgraded Ceph major version from Pacific 16.2.11 to Quincy 17.2.6 with an automatic upgrade of Ceph components on existing managed clusters during the Cluster version update.
On top of addressing the known issue 30635, introduced
a requirement for the deviceClass field in each Ceph pool specification to
prevent the issue recurrence. This rule includes all pools in
spec.cephClusterSpec.pools, spec.cephClusterSpec.objectStorage, and
spec.cephClusterSpec.sharedFilesystem of the pool specification.
Introduced healthcheck metrics and the following Ceph alerts to monitor network connectivity between Ceph nodes:
CephDaemonSlowOpsCephMonClockSkewCephOSDFlappingCephOSDSlowClusterNetworkCephOSDSlowPublicNetwork
Learn more
Updated OpenSearch and OpenSearch Dashboards from major version 1.3.7 to 2.7.0. The latest version includes a number of enhancements along with bug and security fixes.
Caution
The version update process can take up to 20 minutes, during
which both OpenSearch and OpenSearch Dashboards may become temporarily
unavailable. Additionally, the KubeStatefulsetUpdateNotRolledOut alert
for the opensearch-master StatefulSet may fire for a short period of time.
Note
The end-of-life support of the major version 1.x ends on December 31, 2023.
The following table lists the components versions of the Cluster release 15.0.1.
Component |
Application/Service |
Version |
|---|---|---|
Cluster orchestration |
Mirantis Kubernetes Engine |
3.6.5 0 |
Container runtime |
Mirantis Container Runtime |
20.10.17 1 |
Distributed storage |
Ceph |
17.2.6 (Quincy) |
Rook |
1.11.4-10 |
|
LCM |
helm-controller |
1.37.15 |
lcm-ansible |
0.22.0-52-g62235a5 |
|
lcm-agent |
1.37.15 |
|
StackLight |
Alerta |
9.0.0 |
Alertmanager |
0.25.0 |
|
Alertmanager Webhook ServiceNow |
0.1 |
|
Blackbox Exporter |
0.24.0 |
|
cAdvisor |
0.47.1 |
|
Elasticsearch Curator |
5.7.6 |
|
Elasticsearch Exporter |
1.5.0 |
|
Fluentd |
1.15.3 |
|
Grafana |
9.4.9 |
|
Grafana Image Renderer |
3.7.0 |
|
keycloak-gatekeeper |
7.1.3-5 |
|
kube-state-metrics |
2.8.2 |
|
Metric Collector |
0.1 |
|
Metricbeat |
7.12.1 |
|
Node Exporter |
1.6.0 |
|
OpenSearch |
2.7.0 |
|
OpenSearch Dashboards |
2.7.0 |
|
Prometheus |
2.44.0 |
|
Prometheus ES Exporter |
0.14.0 |
|
Prometheus MS Teams |
1.5.2 |
|
Prometheus Patroni Exporter |
0.0.1 |
|
Prometheus Postgres Exporter |
0.12.0 |
|
Prometheus Relay |
0.4 |
|
sf-notifier |
0.3 |
|
sf-reporter |
0.1 |
|
Spilo |
13-2.1p9 |
|
Telegraf |
1.9.1 |
|
1.26.2 |
||
Telemeter |
4.4 |
- 0
For the Mirantis Kubernetes Engine (MKE) release highlights and components versions, see MKE documentation: MKE release notes.
- 1
For the Mirantis Container Runtime (MCR) release highlights, see MCR documentation: MCR release notes.
This section lists the components artifacts of the Cluster release 15.0.1.
Artifact |
Component |
Path |
|---|---|---|
Helm chart |
ceph-controller |
https://binary.mirantis.com/ceph/helm/ceph-operator-1.0.0-mcc-2.24.0-10.tgz |
Docker images |
ceph |
mirantis.azurecr.io/mirantis/ceph:v17.2.6-rel-5 |
ceph-controller |
mirantis.azurecr.io/ceph/mcp/ceph-controller:2.24.0-9 |
|
cephcsi |
mirantis.azurecr.io/mirantis/cephcsi:v3.8.0-rel-3 |
|
cephcsi-registrar |
mirantis.azurecr.io/mirantis/cephcsi-registrar:v2.8.0-rel-1 |
|
cephcsi-provisioner |
mirantis.azurecr.io/mirantis/cephcsi-provisioner:v3.5.0-rel-1 |
|
cephcsi-snapshotter |
mirantis.azurecr.io/mirantis/cephcsi-snapshotter:v6.2.1-rel-1 |
|
cephcsi-attacher |
mirantis.azurecr.io/mirantis/cephcsi-attacher:v4.3.0-rel-1 |
|
cephcsi-resizer |
mirantis.azurecr.io/mirantis/cephcsi-resizer:v1.8.0-rel-1 |
|
rook |
mirantis.azurecr.io/ceph/rook:v1.11.4-10 |
Artifact |
Component |
Path |
|---|---|---|
Binaries |
lcm-ansible |
https://binary.mirantis.com/lcm/bin/lcm-ansible/v0.22.0-49-g9618f2a/lcm-ansible.tar.gz |
lcm-agent |
||
Helm charts |
helm-controller |
https://binary.mirantis.com/core/helm/helm-controller-1.37.15.tgz |
managed-lcm-api |
https://binary.mirantis.com/core/helm/managed-lcm-api-1.37.15.tgz |
|
Docker images |
helm-controller |
mirantis.azurecr.io/core/lcm-controller:1.37.15 |
Artifact |
Component |
Path |
|---|---|---|
Helm charts |
alerta |
https://binary.mirantis.com/stacklight/helm/alerta-0.1.0-mcp-29.tgz |
alertmanager-webhook-servicenow |
https://binary.mirantis.com/stacklight/helm/alertmanager-webhook-servicenow-0.2.0-mcp-4.tgz |
|
cadvisor |
https://binary.mirantis.com/stacklight/helm/cadvisor-0.1.0-mcp-2.tgz |
|
elasticsearch-curator |
https://binary.mirantis.com/stacklight/helm/elasticsearch-curator-1.5.0-mcp-10.tgz |
|
elasticsearch-exporter |
https://binary.mirantis.com/stacklight/helm/elasticsearch-exporter-1.2.0-mcp-7.tgz |
|
fluentd |
https://binary.mirantis.com/stacklight/helm/fluentd-2.0.3-mcp-49.tgz |
|
fluentd-logs |
https://binary.mirantis.com/stacklight/helm/fluentd-logs-0.1.0-mcp-175.tgz |
|
grafana |
https://binary.mirantis.com/stacklight/helm/grafana-3.3.10-mcp-225.tgz |
|
iam-proxy |
||
metric-collector |
https://binary.mirantis.com/stacklight/helm/metric-collector-0.3.0-mcp-10.tgz |
|
metricbeat |
https://binary.mirantis.com/stacklight/helm/metricbeat-1.7.1-mcp-16.tgz |
|
opensearch |
https://binary.mirantis.com/stacklight/helm/opensearch-0.1.0-mcp-58.tgz |
|
opensearch-dashboards |
https://binary.mirantis.com/stacklight/helm/opensearch-dashboards-0.1.0-mcp-47.tgz |
|
patroni |
https://binary.mirantis.com/stacklight/helm/patroni-0.15.1-mcp-52.tgz |
|
prometheus |
https://binary.mirantis.com/stacklight/helm/prometheus-8.11.4-mcp-240.tgz |
|
prometheus-blackbox-exporter |
https://binary.mirantis.com/stacklight/helm/prometheus-blackbox-exporter-0.3.0-mcp-11.tgz |
|
prometheus-es-exporter |
https://binary.mirantis.com/stacklight/helm/prometheus-es-exporter-1.0.0-mcp-11.tgz |
|
prometheus-msteams |
https://binary.mirantis.com/stacklight/helm/prometheus-msteams-0.1.0-mcp-9.tgz |
|
sf-notifier |
https://binary.mirantis.com/stacklight/helm/sf-notifier-0.2.0-mcp-4.tgz |
|
sf-reporter |
https://binary.mirantis.com/stacklight/helm/sf-reporter-0.2.0-mcp-6.tgz |
|
stacklight |
https://binary.mirantis.com/stacklight/helm/stacklight-0.12.8.tgz |
|
telegraf-ds |
https://binary.mirantis.com/stacklight/helm/telegraf-ds-1.1.5-mcp-37.tgz |
|
telegraf-s |
https://binary.mirantis.com/stacklight/helm/telegraf-s-1.1.5-mcp-37.tgz |
|
telemeter-client |
https://binary.mirantis.com/stacklight/helm/telemeter-client-0.2.0-mcp-7.tgz |
|
telemeter-server |
https://binary.mirantis.com/stacklight/helm/telemeter-server-0.2.0-mcp-7.tgz |
|
Docker images |
alerta-web |
mirantis.azurecr.io/stacklight/alerta-web:9-20230602023009 |
alertmanager |
mirantis.azurecr.io/stacklight/alertmanager:v0.25.0 |
|
alertmanager-webhook-servicenow |
mirantis.azurecr.io/stacklight/alertmanager-webhook-servicenow:v0.1-20230601043943 |
|
alpine-utils |
mirantis.azurecr.io/stacklight/alpine-utils:1-20230602023019 |
|
blackbox-exporter |
mirantis.azurecr.io/stacklight/blackbox-exporter:v0.24.0 |
|
cadvisor |
mirantis.azurecr.io/stacklight/cadvisor:v0.47-20230602023019 |
|
configmap-reload |
mirantis.azurecr.io/stacklight/configmap-reload:v0.8.0 |
|
curator |
mirantis.azurecr.io/stacklight/curator:5.7.6-20230404082402 |
|
curl-jq |
mirantis.azurecr.io/scale/curl-jq:alpine-20230120171102 |
|
elasticsearch-exporter |
mirantis.azurecr.io/stacklight/elasticsearch-exporter:v1.5.0 |
|
fluentd |
mirantis.azurecr.io/stacklight/fluentd:1.15-20230602023011 |
|
grafana |
mirantis.azurecr.io/stacklight/grafana:9.4.9 |
|
grafana-image-renderer |
mirantis.azurecr.io/stacklight/grafana-image-renderer:3-20230418140825 |
|
k8s-sidecar |
mirantis.azurecr.io/stacklight/k8s-sidecar:1.22-20230602023018 |
|
keycloak-gatekeeper |
mirantis.azurecr.io/iam/keycloak-gatekeeper:7.1.3-5 |
|
kube-state-metrics |
mirantis.azurecr.io/stacklight/kube-state-metrics:v2.8.2 |
|
kubectl |
mirantis.azurecr.io/stacklight/kubectl:1.22-20230602023016 |
|
metric-collector |
mirantis.azurecr.io/stacklight/metric-collector:v0.1-20230602111822 |
|
metricbeat |
mirantis.azurecr.io/stacklight/metricbeat:7.12.1-20230602023010 |
|
node-exporter |
mirantis.azurecr.io/stacklight/node-exporter:v1.6.0 |
|
opensearch |
mirantis.azurecr.io/stacklight/opensearch:2-20230602023014 |
|
opensearch-dashboards |
mirantis.azurecr.io/stacklight/opensearch-dashboards:2-20230602023014 |
|
openstack-refapp |
mirantis.azurecr.io/openstack/openstack-refapp:0.0.1.dev33 |
|
pgbouncer |
mirantis.azurecr.io/stacklight/pgbouncer:1-20230602023019 |
|
prometheus |
mirantis.azurecr.io/stacklight/prometheus:v2.44.0 |
|
prometheus-es-exporter |
mirantis.azurecr.io/stacklight/prometheus-es-exporter:v0.14.0-20230602023016 |
|
prometheus-msteams |
mirantis.azurecr.io/stacklight/prometheus-msteams:v1.5.2 |
|
prometheus-patroni-exporter |
mirantis.azurecr.io/stacklight/prometheus-patroni-exporter:0.0.1-20230602023018 |
|
prometheus-postgres-exporter |
mirantis.azurecr.io/stacklight/prometheus-postgres-exporter:v0.12.0 |
|
prometheus-relay |
mirantis.azurecr.io/stacklight/prometheus-relay:v0.4-20230602023016 |
|
psql-client |
mirantis.azurecr.io/scale/psql-client:v13-20230124173121 |
|
sf-notifier |
mirantis.azurecr.io/stacklight/sf-notifier:v0.3-20230602023012 |
|
sf-reporter |
mirantis.azurecr.io/stacklight/sf-reporter:v0.1-20230601044047 |
|
spilo |
mirantis.azurecr.io/stacklight/spilo:13-2.1p9-20230602023015 |
|
stacklight-toolkit |
mirantis.azurecr.io/stacklight/stacklight-toolkit:20230602123559 |
|
telegraf |
mirantis.azurecr.io/stacklight/telegraf:v1.9.1-20230602023009 |
|
mirantis.azurecr.io/stacklight/telegraf:1.26-20230602023017 |
||
telemeter |
mirantis.azurecr.io/stacklight/telemeter:4.4-20230602023011 |
|
telemeter-token-auth |
mirantis.azurecr.io/stacklight/telemeter-token-auth:v0.1-20230602023012 |
Artifact |
Component |
Path |
|---|---|---|
Debian repositories |
System packages |
|
http://mirror.mirantis.com/kaas/kubernetes-extra-rhel7-0.0.8/ |
||
https://mirror.mirantis.com/kaas/ubuntu-2023-06-01-014502.target.txt |
||
MCR repositories |
MCR |
https://repos.mirantis.com/ubuntu/dists/bionic/pool/stable-20.10/ |
Target ubuntu system |
Ubuntu |
https://binary.mirantis.com/bm/bin/efi/ubuntu/tgz-focal-20230606111629 |
https://binary.mirantis.com/bm/bin/efi/ubuntu/tgz-bionic-5.4-20230606111551 1 |
- 1
Only for existing bare metal clusters
See also
Major and patch versions update path
The primary distinction between major and patch product versions lies in the fact that major release versions introduce new functionalities, whereas patch release versions predominantly offer minor product enhancements, mostly CVE resolutions for your clusters.
Depending on your deployment needs, you can either update only between major Cluster releases or apply patch updates between major releases. Choosing the latter option ensures you receive security fixes as soon as they become available. Though, be prepared to update your cluster frequently, approximately once every three weeks. Otherwise, you can update only between major Cluster releases as each subsequent major Cluster release includes patch Cluster release updates of the previous major Cluster release.
This section outlines release notes for unsupported Cluster releases of the 14.x series.
This section outlines release notes for the Cluster release 14.1.0 that is introduced in the Container Cloud release 2.25.0. This Cluster release is dedicated for the vSphere provider only. This is the last Cluster release for the vSphere provider based on Mirantis Kubernetes Engine 3.6.6 with Kubernetes 1.24.
Important
The major Cluster release 14.1.0 is the last Cluster release for the vSphere provider based on MCR 20.10 and MKE 3.6.6 with Kubernetes 1.24. Therefore, Mirantis highly recommends updating your existing vSphere-based managed clusters to the Cluster release 16.0.1 that contains newer versions on MCR and MKE with Kubernetes. Otherwise, your management cluster upgrade to Container Cloud 2.25.2 will blocked.
For the update procedure, refer to Update to a patch version.
Since Container Cloud 2.25.1, the major Cluster release 14.1.0 is deprecated. Greenfield vSphere-based deployments on this Cluster release are not supported. Use the patch Cluster release 16.0.1 for new deployments instead.
For the list of known and addressed issues delivered in the Cluster release 14.1.0, refer to the Container Cloud release 2.25.0 section.
This section outlines new features implemented in the Cluster release 14.1.0 that is introduced in the Container Cloud release 2.25.0.
Introduced support for Mirantis Container Runtime (MCR) 23.0.7 for the Container Cloud management and managed clusters. On existing clusters, MCR is updated to the latest supported version when you update your managed cluster to the Cluster release 14.1.0.
Learn more
Implemented the capability to address Ceph storage devices using the by-id
identifiers.
The by-id identifier is the only persistent device identifier for a Ceph
cluster that remains stable after the cluster upgrade or any other maintenance.
Therefore, Mirantis recommends using device by-id symlinks rather than
device names or by-path symlinks.
Added the kaasCephState field in the KaaSCephCluster.status
specification to display the current state of KaasCephCluster and
any errors during object reconciliation, including specification
generation, object creation on a managed cluster, and status retrieval.
TechPreview
Added initial Technology Preview support for forwarding of Container Cloud services logs, which are sent to OpenSearch by default, to Splunk using the syslog external output configuration.
Implemented the following monitoring improvements for Ceph:
Optimized the following Ceph dashboards in Grafana: Ceph Cluster, Ceph Pools, Ceph OSDs.
Removed the redundant Ceph Nodes Grafana dashboard. You can view its content using the following dashboards:
Ceph stats through the Ceph Cluster dashboard.
Resource utilization through the System dashboard, which now includes filtering by Ceph node labels, such as
ceph_role_osd,ceph_role_mon, andceph_role_mgr.
Removed the
rook_clusteralert label.Removed the redundant
CephOSDDownalert.Renamed the
CephNodeDownalert toCephOSDNodeDown.
Optimized StackLight NodeDown alerts for a better notification handling
after cluster recovery from an accident:
Reworked the
NodeDown-related alert inhibition rulesReworked the logic of all
NodeDown-related alerts for all supported groups of nodes, which includes renaming of the<alertName>TargetsOutagealerts to<alertNameTargetDown>Added the
TungstenFabricOperatorTargetDownalert for Tungsten Fabric deployments of MOSK clustersRemoved redundant
KubeDNSTargetsOutageandKubePodsNotReadyalerts
Optimized OpenSearch configuration and StackLight datamodel to provide better resources utilization and faster query response. Added the following enhancements:
Limited the default namespaces for log collection with the ability to add custom namespaces to the monitoring list using the following parameters:
logging.namespaceFiltering.logs- limits the number of namespaces for Pods log collection. Enabled by default.logging.namespaceFiltering.events- limits the number of namespaces for Kubernetes events collection. Disabled by default.logging.namespaceFiltering.events/logs.extraNamespaces- adds extra namespaces, which are not in the default list, to collect specific Kubernetes Pod logs or Kubernetes events. Empty by default.
Added the
logging.enforceOopsCompressionparameter that enforces 32 GB of heap size, unless the defined memory limit allows using 50 GB of heap. Enabled by default.Added the
NO_SEVERITYseverity label that is automatically added to a log with no severity label in the message. This allows having more control over which logs are actually being processed by Fluentd and which are skipped by mistake.Added documentation on how to tune OpenSearch performance using hardware and software settings for baremetal-based Container Cloud clusters.
On top of continuous improvements delivered to the existing Container Cloud guides, added the documentation on how to export data from the Table panels of Grafana dashboards to CSV.
The following table lists the components versions of the Cluster release 14.1.0.
Note
The components that are newly added, updated, deprecated, or removed
as compared to the previous major Cluster release version, are marked with
a corresponding superscript, for example, lcm-ansible Updated.
Component |
Application/Service |
Version |
|---|---|---|
Cluster orchestration Updated |
Mirantis Kubernetes Engine |
3.6.6 0 |
Container runtime Updated |
Mirantis Container Runtime |
23.0.7 1 |
Distributed storage |
Ceph |
17.2.6 (Quincy) |
Rook Updated |
1.11.11-13 |
|
LCM |
helm-controller Updated |
1.38.17 |
lcm-ansible Updated |
0.23.0-73-g01aa9b3 |
|
StackLight |
Alerta |
9.0.0 |
Alertmanager |
0.25.0 |
|
Alertmanager Webhook ServiceNow |
0.1 |
|
Blackbox Exporter |
0.24.0 |
|
cAdvisor Updated |
0.47.2 |
|
Elasticsearch Curator |
5.7.6 |
|
Elasticsearch Exporter |
1.5.0 |
|
Fluentd |
1.15.3 |
|
Grafana Updated |
9.5.7 |
|
Grafana Image Renderer Updated |
3.7.1 |
|
keycloak-gatekeeper Removed |
n/a |
|
kube-state-metrics |
2.8.2 |
|
Metric Collector |
0.1 |
|
Metricbeat |
7.12.1 |
|
Node Exporter |
1.6.0 |
|
OAuth2 Proxy New |
7.1.3 |
|
OpenSearch Updated |
2.8.0 |
|
OpenSearch Dashboards |
2.7.0 |
|
Prometheus |
2.44.0 |
|
Prometheus ES Exporter |
0.14.0 |
|
Prometheus MS Teams |
1.5.2 |
|
Prometheus Patroni Exporter |
0.0.1 |
|
Prometheus Postgres Exporter |
0.12.0 |
|
Prometheus Relay |
0.4 |
|
sf-notifier Updated |
0.4 |
|
sf-reporter |
0.1 |
|
Spilo |
13-2.1p9 |
|
Telegraf |
1.9.1 |
|
1.27.3 Updated |
||
Telemeter |
4.4 |
- 0
For the Mirantis Kubernetes Engine (MKE) release highlights and components versions, see MKE documentation: MKE release notes.
- 1
For the Mirantis Container Runtime (MCR) release highlights, see MCR documentation: MCR release notes.
This section lists the components artifacts of the Cluster release 14.1.0.
Note
The components that are newly added, updated, deprecated, or removed
as compared to the previous major Cluster release version, are marked with
a corresponding superscript, for example, lcm-ansible Updated.
Artifact |
Component |
Path |
|---|---|---|
Helm chart Updated |
ceph-controller |
https://binary.mirantis.com/ceph/helm/ceph-operator-1.0.0-mcc-2.25.0-1.tgz |
Docker images |
ceph |
mirantis.azurecr.io/mirantis/ceph:v17.2.6-rel-5 |
ceph-controller Updated |
mirantis.azurecr.io/ceph/mcp/ceph-controller:2.25.0-0 |
|
cephcsi Updated |
mirantis.azurecr.io/mirantis/cephcsi:v3.8.1-rel-1 |
|
cephcsi-registrar Updated |
mirantis.azurecr.io/mirantis/cephcsi-registrar:v2.8.0-cve-1 |
|
cephcsi-provisioner Updated |
mirantis.azurecr.io/mirantis/cephcsi-provisioner:v3.5.0-cve-1 |
|
cephcsi-snapshotter Updated |
mirantis.azurecr.io/mirantis/cephcsi-snapshotter:v6.2.1-cve-1 |
|
cephcsi-attacher Updated |
mirantis.azurecr.io/mirantis/cephcsi-attacher:v4.3.0-cve-1 |
|
cephcsi-resizer Updated |
mirantis.azurecr.io/mirantis/cephcsi-resizer:v1.8.0-cve-1 |
|
rook Updated |
mirantis.azurecr.io/ceph/rook:v1.11.11-13 |
Artifact |
Component |
Path |
|---|---|---|
Binaries Updated |
lcm-ansible |
https://binary.mirantis.com/lcm/bin/lcm-ansible/v0.23.0-73-g01aa9b3/lcm-ansible.tar.gz |
lcm-agent |
||
Helm charts Updated |
helm-controller |
https://binary.mirantis.com/core/helm/helm-controller-1.38.17.tgz |
managed-lcm-api |
https://binary.mirantis.com/core/helm/managed-lcm-api-1.38.17.tgz |
|
Docker images Updated |
helm-controller |
mirantis.azurecr.io/core/lcm-controller:1.38.17 |
Artifact |
Component |
Path |
|---|---|---|
Helm charts |
alerta |
https://binary.mirantis.com/stacklight/helm/alerta-0.1.0-mcp-29.tgz |
alertmanager-webhook-servicenow |
https://binary.mirantis.com/stacklight/helm/alertmanager-webhook-servicenow-0.2.0-mcp-4.tgz |
|
cadvisor Updated |
https://binary.mirantis.com/stacklight/helm/cadvisor-0.1.0-mcp-3.tgz |
|
elasticsearch-curator Updated |
https://binary.mirantis.com/stacklight/helm/elasticsearch-curator-1.5.0-mcp-12.tgz |
|
elasticsearch-exporter |
https://binary.mirantis.com/stacklight/helm/elasticsearch-exporter-1.2.0-mcp-7.tgz |
|
fluentd-logs Updated |
https://binary.mirantis.com/stacklight/helm/fluentd-logs-0.1.0-mcp-193.tgz |
|
grafana Updated |
https://binary.mirantis.com/stacklight/helm/grafana-3.3.10-mcp-250.tgz |
|
iam-proxy |
||
metric-collector |
https://binary.mirantis.com/stacklight/helm/metric-collector-0.3.0-mcp-10.tgz |
|
metricbeat |
https://binary.mirantis.com/stacklight/helm/metricbeat-1.7.1-mcp-16.tgz |
|
opensearch Updated |
https://binary.mirantis.com/stacklight/helm/opensearch-0.1.0-mcp-60.tgz |
|
opensearch-dashboards |
https://binary.mirantis.com/stacklight/helm/opensearch-dashboards-0.1.0-mcp-47.tgz |
|
patroni Updated |
https://binary.mirantis.com/stacklight/helm/patroni-0.15.1-mcp-54.tgz |
|
prometheus Updated |
https://binary.mirantis.com/stacklight/helm/prometheus-8.11.4-mcp-245.tgz |
|
prometheus-blackbox-exporter Updated |
https://binary.mirantis.com/stacklight/helm/prometheus-blackbox-exporter-0.3.0-mcp-15.tgz |
|
prometheus-es-exporter |
https://binary.mirantis.com/stacklight/helm/prometheus-es-exporter-1.0.0-mcp-11.tgz |
|
prometheus-msteams |
https://binary.mirantis.com/stacklight/helm/prometheus-msteams-0.1.0-mcp-9.tgz |
|
refapp Updated |
https://binary.mirantis.com/scale/helm/refapp-0.2.1-mcp-13.tgz |
|
sf-notifier Updated |
https://binary.mirantis.com/stacklight/helm/sf-notifier-0.2.0-mcp-7.tgz |
|
sf-reporter Updated |
https://binary.mirantis.com/stacklight/helm/sf-reporter-0.2.0-mcp-7.tgz |
|
stacklight Updated |
https://binary.mirantis.com/stacklight/helm/stacklight-0.13.3.tgz |
|
telegraf-ds |
https://binary.mirantis.com/stacklight/helm/telegraf-ds-1.1.5-mcp-37.tgz |
|
telegraf-s |
https://binary.mirantis.com/stacklight/helm/telegraf-s-1.1.5-mcp-37.tgz |
|
telemeter-client |
https://binary.mirantis.com/stacklight/helm/telemeter-client-0.2.0-mcp-7.tgz |
|
telemeter-server |
https://binary.mirantis.com/stacklight/helm/telemeter-server-0.2.0-mcp-7.tgz |
|
Docker images |
alerta-web Updated |
mirantis.azurecr.io/stacklight/alerta-web:9-20230929023008 |
alertmanager Updated |
mirantis.azurecr.io/stacklight/alertmanager:v0-20230929023012 |
|
alertmanager-webhook-servicenow Updated |
mirantis.azurecr.io/stacklight/alertmanager-webhook-servicenow:v0.1-20230912073324 |
|
alpine-utils Updated |
mirantis.azurecr.io/stacklight/alpine-utils:1-20230929023018 |
|
blackbox-exporter |
mirantis.azurecr.io/stacklight/blackbox-exporter:v0.24.0 |
|
cadvisor Updated |
mirantis.azurecr.io/stacklight/cadvisor:v0.47-20230929023009 |
|
configmap-reload |
mirantis.azurecr.io/stacklight/configmap-reload:v0.8.0 |
|
curator |
mirantis.azurecr.io/stacklight/curator:5.7.6-20230404082402 |
|
curl-jq Updated |
mirantis.azurecr.io/scale/curl-jq:alpine-20230925094109 |
|
elasticsearch-exporter |
mirantis.azurecr.io/stacklight/elasticsearch-exporter:v1.5.0 |
|
fluentd Updated |
mirantis.azurecr.io/stacklight/fluentd:1.15-20230929023011 |
|
grafana Updated |
mirantis.azurecr.io/stacklight/grafana:9.5.7 |
|
grafana-image-renderer Updated |
mirantis.azurecr.io/stacklight/grafana-image-renderer:3-20230929023011 |
|
k8s-sidecar Updated |
mirantis.azurecr.io/stacklight/k8s-sidecar:1.22-20230929023017 |
|
keycloak-gatekeeper Removed |
n/a |
|
kube-state-metrics |
mirantis.azurecr.io/stacklight/kube-state-metrics:v2.8.2 |
|
kubectl Updated |
mirantis.azurecr.io/stacklight/kubectl:1.22-20230929023018 |
|
metric-collector Updated |
mirantis.azurecr.io/stacklight/metric-collector:v0.1-20230929023015 |
|
metricbeat Updated |
mirantis.azurecr.io/stacklight/metricbeat:7.12.1-20230929023009 |
|
node-exporter |
mirantis.azurecr.io/stacklight/node-exporter:v1.6.0 |
|
oauth2-proxy New |
mirantis.azurecr.io/iam/oauth2-proxy:v7.1.3-4 |
|
opensearch Updated |
mirantis.azurecr.io/stacklight/opensearch:2-20230929023012 |
|
opensearch-dashboards Updated |
mirantis.azurecr.io/stacklight/opensearch-dashboards:2-20230929023008 |
|
openstack-refapp |
mirantis.azurecr.io/openstack/openstack-refapp:0.1.3 |
|
pgbouncer Updated |
mirantis.azurecr.io/stacklight/pgbouncer:1-20230929023018 |
|
prometheus |
mirantis.azurecr.io/stacklight/prometheus:v2.44.0 |
|
prometheus-es-exporter Updated |
mirantis.azurecr.io/stacklight/prometheus-es-exporter:v0.14.0-20230929023017 |
|
prometheus-msteams |
mirantis.azurecr.io/stacklight/prometheus-msteams:v1.5.2 |
|
prometheus-patroni-exporter Updated |
mirantis.azurecr.io/stacklight/prometheus-patroni-exporter:0.0.1-20230929023018 |
|
prometheus-postgres-exporter |
mirantis.azurecr.io/stacklight/prometheus-postgres-exporter:v0.12.0 |
|
prometheus-relay Updated |
mirantis.azurecr.io/stacklight/prometheus-relay:v0.4-20230929023016 |
|
psql-client Updated |
mirantis.azurecr.io/scale/psql-client:v13-20230817113822 |
|
sf-notifier Updated |
mirantis.azurecr.io/stacklight/sf-notifier:v0.4-20230929023013 |
|
sf-reporter Updated |
mirantis.azurecr.io/stacklight/sf-reporter:v0.1-20230911151029 |
|
spilo Updated |
mirantis.azurecr.io/stacklight/spilo:13-2.1p9-20230929023012 |
|
stacklight-toolkit Updated |
mirantis.azurecr.io/stacklight/stacklight-toolkit:20231004090138 |
|
telegraf |
mirantis.azurecr.io/stacklight/telegraf:v1.9.1-20230915023009 Updated |
|
mirantis.azurecr.io/stacklight/telegraf:1.27-20230809094327 Updated |
||
telemeter Updated |
mirantis.azurecr.io/stacklight/telemeter:4.4-20230929023011 |
|
telemeter-token-auth Updated |
mirantis.azurecr.io/stacklight/telemeter-token-auth:v0.1-20230929023012 |
Artifact |
Component |
Path |
|---|---|---|
Debian repositories |
System packages |
|
http://mirror.mirantis.com/kaas/kubernetes-extra-rhel7-0.0.8/ |
||
https://mirror.mirantis.com/kaas/ubuntu-2023-10-11-015021/ Updated |
||
https://mirror.mirantis.com/kaas/ubuntu-2023-10-11-015021.target.txt Updated |
||
MCR repositories |
MCR |
https://repos.mirantis.com/ubuntu/dists/bionic/pool/stable-23.10/ Updated |
This section includes release notes for the patch Cluster release 14.0.4 that is introduced in the Container Cloud patch release 2.24.5 and is based on Cluster releases 14.0.1, 14.0.2, and 14.0.3.
This patch Cluster release is based on Mirantis Kubernetes Engine 3.6.6 with Kubernetes 1.24 and Mirantis Container Runtime 20.10.17.
For the list of CVE fixes delivered with this patch Cluster release, see Container Cloud 2.24.5
For details on patch release delivery, see Patch releases
This section lists the components artifacts of the Cluster release 14.0.4.
Note
The components that are newly added, updated, deprecated, or removed
as compared to the previous release version, are marked
with a corresponding superscript,
for example, lcm-ansible Updated.
Artifact |
Component |
Path |
|---|---|---|
Helm chart |
ceph-controller |
https://binary.mirantis.com/ceph/helm/ceph-operator-1.0.0-mcc-2.24.4-8.tgz |
Docker images |
ceph |
mirantis.azurecr.io/mirantis/ceph:v17.2.6-cve-1 |
ceph-controller |
mirantis.azurecr.io/ceph/mcp/ceph-controller:2.24.4-7 |
|
cephcsi |
mirantis.azurecr.io/mirantis/cephcsi:v3.8.0-cve-2 |
|
cephcsi-registrar |
mirantis.azurecr.io/mirantis/cephcsi-registrar:v2.8.0-cve-1 |
|
cephcsi-provisioner |
mirantis.azurecr.io/mirantis/cephcsi-provisioner:v3.5.0-cve-1 |
|
cephcsi-snapshotter |
mirantis.azurecr.io/mirantis/cephcsi-snapshotter:v6.2.1-cve-1 |
|
cephcsi-attacher |
mirantis.azurecr.io/mirantis/cephcsi-attacher:v4.3.0-cve-1 |
|
cephcsi-resizer |
mirantis.azurecr.io/mirantis/cephcsi-resizer:v1.8.0-cve-1 |
|
rook |
mirantis.azurecr.io/ceph/rook:v1.11.4-12 |
Artifact |
Component |
Path |
|---|---|---|
Binaries Updated |
lcm-ansible |
https://binary.mirantis.com/lcm/bin/lcm-ansible/v0.22.0-75-g08569a8/lcm-ansible.tar.gz |
lcm-agent |
||
Helm charts Updated |
helm-controller |
https://binary.mirantis.com/core/helm/helm-controller-1.37.25.tgz |
managed-lcm-api |
https://binary.mirantis.com/core/helm/managed-lcm-api-1.37.25.tgz |
|
Docker images Updated |
helm-controller |
mirantis.azurecr.io/core/lcm-controller:1.37.25 |
Artifact |
Component |
Path |
|---|---|---|
Helm charts |
alerta |
https://binary.mirantis.com/stacklight/helm/alerta-0.1.0-mcp-29.tgz |
alertmanager-webhook-servicenow |
https://binary.mirantis.com/stacklight/helm/alertmanager-webhook-servicenow-0.2.0-mcp-4.tgz |
|
cadvisor |
https://binary.mirantis.com/stacklight/helm/cadvisor-0.1.0-mcp-2.tgz |
|
elasticsearch-curator |
https://binary.mirantis.com/stacklight/helm/elasticsearch-curator-1.5.0-mcp-10.tgz |
|
elasticsearch-exporter |
https://binary.mirantis.com/stacklight/helm/elasticsearch-exporter-1.2.0-mcp-7.tgz |
|
fluentd |
https://binary.mirantis.com/stacklight/helm/fluentd-2.0.3-mcp-49.tgz |
|
fluentd-logs |
https://binary.mirantis.com/stacklight/helm/fluentd-logs-0.1.0-mcp-176.tgz |
|
grafana |
https://binary.mirantis.com/stacklight/helm/grafana-3.3.10-mcp-231.tgz |
|
iam-proxy |
||
metric-collector |
https://binary.mirantis.com/stacklight/helm/metric-collector-0.3.0-mcp-10.tgz |
|
metricbeat |
https://binary.mirantis.com/stacklight/helm/metricbeat-1.7.1-mcp-16.tgz |
|
opensearch |
https://binary.mirantis.com/stacklight/helm/opensearch-0.1.0-mcp-58.tgz |
|
opensearch-dashboards |
https://binary.mirantis.com/stacklight/helm/opensearch-dashboards-0.1.0-mcp-47.tgz |
|
patroni |
https://binary.mirantis.com/stacklight/helm/patroni-0.15.1-mcp-52.tgz |
|
prometheus |
https://binary.mirantis.com/stacklight/helm/prometheus-8.11.4-mcp-240.tgz |
|
prometheus-blackbox-exporter |
https://binary.mirantis.com/stacklight/helm/prometheus-blackbox-exporter-0.3.0-mcp-11.tgz |
|
prometheus-es-exporter |
https://binary.mirantis.com/stacklight/helm/prometheus-es-exporter-1.0.0-mcp-11.tgz |
|
prometheus-msteams |
https://binary.mirantis.com/stacklight/helm/prometheus-msteams-0.1.0-mcp-9.tgz |
|
refapp |
https://binary.mirantis.com/scale/helm/refapp-0.2.1-mcp-11.tgz |
|
sf-notifier |
https://binary.mirantis.com/stacklight/helm/sf-notifier-0.2.0-mcp-7.tgz |
|
sf-reporter |
https://binary.mirantis.com/stacklight/helm/sf-reporter-0.2.0-mcp-6.tgz |
|
stacklight Updated |
https://binary.mirantis.com/stacklight/helm/stacklight-0.12.13.tgz |
|
telegraf-ds |
https://binary.mirantis.com/stacklight/helm/telegraf-ds-1.1.5-mcp-37.tgz |
|
telegraf-s |
https://binary.mirantis.com/stacklight/helm/telegraf-s-1.1.5-mcp-37.tgz |
|
telemeter-client |
https://binary.mirantis.com/stacklight/helm/telemeter-client-0.2.0-mcp-7.tgz |
|
telemeter-server |
https://binary.mirantis.com/stacklight/helm/telemeter-server-0.2.0-mcp-7.tgz |
|
Docker images |
alerta-web Updated |
mirantis.azurecr.io/stacklight/alerta-web:9-20230915023010 |
alertmanager Updated |
mirantis.azurecr.io/stacklight/alertmanager:v0-20230915023015 |
|
alertmanager-webhook-servicenow Updated |
mirantis.azurecr.io/stacklight/alertmanager-webhook-servicenow:v0.1-20230912073324 |
|
alpine-utils Updated |
mirantis.azurecr.io/stacklight/alpine-utils:1-20230915023025 |
|
blackbox-exporter |
mirantis.azurecr.io/stacklight/blackbox-exporter:v0.24.0 |
|
cadvisor Updated |
mirantis.azurecr.io/stacklight/cadvisor:v0.47-20230915023013 |
|
configmap-reload |
mirantis.azurecr.io/stacklight/configmap-reload:v0.8.0 |
|
curator |
mirantis.azurecr.io/stacklight/curator:5.7.6-20230404082402 |
|
curl-jq Updated |
mirantis.azurecr.io/scale/curl-jq:alpine-20230821070620 |
|
elasticsearch-exporter |
mirantis.azurecr.io/stacklight/elasticsearch-exporter:v1.5.0 |
|
fluentd Updated |
mirantis.azurecr.io/stacklight/fluentd:1.15-20230915023013 |
|
grafana |
mirantis.azurecr.io/stacklight/grafana:9.5.7 |
|
grafana-image-renderer Updated |
mirantis.azurecr.io/stacklight/grafana-image-renderer:3-20230915023013 |
|
k8s-sidecar Updated |
mirantis.azurecr.io/stacklight/k8s-sidecar:1.22-20230915023025 |
|
kube-state-metrics |
mirantis.azurecr.io/stacklight/kube-state-metrics:v2.8.2 |
|
kubectl Updated |
mirantis.azurecr.io/stacklight/kubectl:1.22-20230915023021 |
|
metric-collector Updated |
mirantis.azurecr.io/stacklight/metric-collector:v0.1-20230915023017 |
|
metricbeat Updated |
mirantis.azurecr.io/stacklight/metricbeat:7.12.1-20230915023011 |
|
node-exporter |
mirantis.azurecr.io/stacklight/node-exporter:v1.6.0 |
|
oauth2-proxy |
mirantis.azurecr.io/iam/oauth2-proxy:v7.1.3-4 |
|
opensearch Updated |
mirantis.azurecr.io/stacklight/opensearch:2-20230915023015 |
|
opensearch-dashboards Updated |
mirantis.azurecr.io/stacklight/opensearch-dashboards:2-20230915023009 |
|
openstack-refapp |
mirantis.azurecr.io/openstack/openstack-refapp:0.1.3 |
|
pgbouncer Updated |
mirantis.azurecr.io/stacklight/pgbouncer:1-20230915023025 |
|
prometheus |
mirantis.azurecr.io/stacklight/prometheus:v2.44.0 |
|
prometheus-es-exporter Updated |
mirantis.azurecr.io/stacklight/prometheus-es-exporter:v0.14.0-20230915023021 |
|
prometheus-msteams |
mirantis.azurecr.io/stacklight/prometheus-msteams:v1.5.2 |
|
prometheus-patroni-exporter Updated |
mirantis.azurecr.io/stacklight/prometheus-patroni-exporter:0.0.1-20230915023025 |
|
prometheus-postgres-exporter |
mirantis.azurecr.io/stacklight/prometheus-postgres-exporter:v0.12.0 |
|
prometheus-relay Updated |
mirantis.azurecr.io/stacklight/prometheus-relay:v0.4-20230915023021 |
|
psql-client |
mirantis.azurecr.io/scale/psql-client:v13-20230817113822 |
|
sf-notifier Updated |
mirantis.azurecr.io/stacklight/sf-notifier:v0.3-20230915023010 |
|
sf-reporter Updated |
mirantis.azurecr.io/stacklight/sf-reporter:v0.1-20230911151029 |
|
spilo Updated |
mirantis.azurecr.io/stacklight/spilo:13-2.1p9-20230915023014 |
|
stacklight-toolkit Updated |
mirantis.azurecr.io/stacklight/stacklight-toolkit:20230915023021 |
|
telegraf |
mirantis.azurecr.io/stacklight/telegraf:v1.9.1-20230915023009 Updated |
|
mirantis.azurecr.io/stacklight/telegraf:1.27-20230809094327 |
||
telemeter Updated |
mirantis.azurecr.io/stacklight/telemeter:4.4-20230915023020 |
|
telemeter-token-auth Updated |
mirantis.azurecr.io/stacklight/telemeter-token-auth:v0.1-20230915023020 |
Unchanged as compared to 14.0.1
Artifact |
Component |
Path |
|---|---|---|
Debian repositories |
System packages |
|
http://mirror.mirantis.com/kaas/kubernetes-extra-rhel7-0.0.8/ |
||
https://mirror.mirantis.com/kaas/ubuntu-2023-06-01-014502.target.txt |
||
MCR repositories |
MCR |
https://repos.mirantis.com/ubuntu/dists/bionic/pool/stable-20.10/ |
Target ubuntu system 1 |
Ubuntu |
https://binary.mirantis.com/bm/bin/efi/ubuntu/tgz-focal-20230606111629 |
https://binary.mirantis.com/bm/bin/efi/ubuntu/tgz-bionic-5.4-20230606111551 2 |
This section includes release notes for the patch Cluster release 14.0.3 that is introduced in the Container Cloud patch release 2.24.4 and is based on Cluster releases 14.0.1 and 14.0.2.
This patch Cluster release is based on Mirantis Kubernetes Engine 3.6.6 with Kubernetes 1.24 and Mirantis Container Runtime 20.10.17.
For the list of enhancements and CVE fixes delivered with this patch Cluster release, see 2.24.4
For details on patch release delivery, see Patch releases
This section lists the components artifacts of the Cluster release 14.0.3.
Note
The components that are newly added, updated, deprecated, or removed
as compared to the previous release version, are marked
with a corresponding superscript,
for example, lcm-ansible Updated.
Artifact |
Component |
Path |
|---|---|---|
Helm chart Updated |
ceph-controller |
https://binary.mirantis.com/ceph/helm/ceph-operator-1.0.0-mcc-2.24.4-8.tgz |
Docker images |
ceph |
mirantis.azurecr.io/mirantis/ceph:v17.2.6-cve-1 |
ceph-controller Updated |
mirantis.azurecr.io/ceph/mcp/ceph-controller:2.24.4-7 |
|
cephcsi Updated |
mirantis.azurecr.io/mirantis/cephcsi:v3.8.0-cve-2 |
|
cephcsi-registrar |
mirantis.azurecr.io/mirantis/cephcsi-registrar:v2.8.0-cve-1 |
|
cephcsi-provisioner |
mirantis.azurecr.io/mirantis/cephcsi-provisioner:v3.5.0-cve-1 |
|
cephcsi-snapshotter |
mirantis.azurecr.io/mirantis/cephcsi-snapshotter:v6.2.1-cve-1 |
|
cephcsi-attacher |
mirantis.azurecr.io/mirantis/cephcsi-attacher:v4.3.0-cve-1 |
|
cephcsi-resizer |
mirantis.azurecr.io/mirantis/cephcsi-resizer:v1.8.0-cve-1 |
|
rook Updated |
mirantis.azurecr.io/ceph/rook:v1.11.4-12 |
Artifact |
Component |
Path |
|---|---|---|
Binaries Updated |
lcm-ansible |
https://binary.mirantis.com/lcm/bin/lcm-ansible/v0.22.0-66-ga855169/lcm-ansible.tar.gz |
lcm-agent |
||
Helm charts Updated |
helm-controller |
https://binary.mirantis.com/core/helm/helm-controller-1.37.24.tgz |
managed-lcm-api |
https://binary.mirantis.com/core/helm/managed-lcm-api-1.37.24.tgz |
|
Docker images Updated |
helm-controller |
mirantis.azurecr.io/core/lcm-controller:1.37.24 |
Artifact |
Component |
Path |
|---|---|---|
Helm charts |
alerta |
https://binary.mirantis.com/stacklight/helm/alerta-0.1.0-mcp-29.tgz |
alertmanager-webhook-servicenow |
https://binary.mirantis.com/stacklight/helm/alertmanager-webhook-servicenow-0.2.0-mcp-4.tgz |
|
cadvisor |
https://binary.mirantis.com/stacklight/helm/cadvisor-0.1.0-mcp-2.tgz |
|
elasticsearch-curator |
https://binary.mirantis.com/stacklight/helm/elasticsearch-curator-1.5.0-mcp-10.tgz |
|
elasticsearch-exporter |
https://binary.mirantis.com/stacklight/helm/elasticsearch-exporter-1.2.0-mcp-7.tgz |
|
fluentd |
https://binary.mirantis.com/stacklight/helm/fluentd-2.0.3-mcp-49.tgz |
|
fluentd-logs |
https://binary.mirantis.com/stacklight/helm/fluentd-logs-0.1.0-mcp-176.tgz |
|
grafana |
https://binary.mirantis.com/stacklight/helm/grafana-3.3.10-mcp-231.tgz |
|
iam-proxy |
||
metric-collector |
https://binary.mirantis.com/stacklight/helm/metric-collector-0.3.0-mcp-10.tgz |
|
metricbeat |
https://binary.mirantis.com/stacklight/helm/metricbeat-1.7.1-mcp-16.tgz |
|
opensearch |
https://binary.mirantis.com/stacklight/helm/opensearch-0.1.0-mcp-58.tgz |
|
opensearch-dashboards |
https://binary.mirantis.com/stacklight/helm/opensearch-dashboards-0.1.0-mcp-47.tgz |
|
patroni |
https://binary.mirantis.com/stacklight/helm/patroni-0.15.1-mcp-52.tgz |
|
prometheus |
https://binary.mirantis.com/stacklight/helm/prometheus-8.11.4-mcp-240.tgz |
|
prometheus-blackbox-exporter |
https://binary.mirantis.com/stacklight/helm/prometheus-blackbox-exporter-0.3.0-mcp-11.tgz |
|
prometheus-es-exporter |
https://binary.mirantis.com/stacklight/helm/prometheus-es-exporter-1.0.0-mcp-11.tgz |
|
prometheus-msteams |
https://binary.mirantis.com/stacklight/helm/prometheus-msteams-0.1.0-mcp-9.tgz |
|
refapp |
https://binary.mirantis.com/scale/helm/refapp-0.2.1-mcp-11.tgz |
|
sf-notifier |
https://binary.mirantis.com/stacklight/helm/sf-notifier-0.2.0-mcp-7.tgz |
|
sf-reporter |
https://binary.mirantis.com/stacklight/helm/sf-reporter-0.2.0-mcp-6.tgz |
|
stacklight Updated |
https://binary.mirantis.com/stacklight/helm/stacklight-0.12.10.tgz |
|
telegraf-ds |
https://binary.mirantis.com/stacklight/helm/telegraf-ds-1.1.5-mcp-37.tgz |
|
telegraf-s |
https://binary.mirantis.com/stacklight/helm/telegraf-s-1.1.5-mcp-37.tgz |
|
telemeter-client |
https://binary.mirantis.com/stacklight/helm/telemeter-client-0.2.0-mcp-7.tgz |
|
telemeter-server |
https://binary.mirantis.com/stacklight/helm/telemeter-server-0.2.0-mcp-7.tgz |
|
Docker images |
alerta-web Updated |
mirantis.azurecr.io/stacklight/alerta-web:9-20230829061227 |
alertmanager Updated |
mirantis.azurecr.io/stacklight/alertmanager:v0-20230825023014 |
|
alertmanager-webhook-servicenow |
mirantis.azurecr.io/stacklight/alertmanager-webhook-servicenow:v0.1-20230601043943 |
|
alpine-utils Updated |
mirantis.azurecr.io/stacklight/alpine-utils:1-20230825023021 |
|
blackbox-exporter |
mirantis.azurecr.io/stacklight/blackbox-exporter:v0.24.0 |
|
cadvisor Updated |
mirantis.azurecr.io/stacklight/cadvisor:v0.47-20230825023011 |
|
configmap-reload |
mirantis.azurecr.io/stacklight/configmap-reload:v0.8.0 |
|
curator |
mirantis.azurecr.io/stacklight/curator:5.7.6-20230404082402 |
|
curl-jq |
mirantis.azurecr.io/scale/curl-jq:alpine-20230706142802 |
|
elasticsearch-exporter |
mirantis.azurecr.io/stacklight/elasticsearch-exporter:v1.5.0 |
|
fluentd Updated |
mirantis.azurecr.io/stacklight/fluentd:1.15-20230825023012 |
|
grafana |
mirantis.azurecr.io/stacklight/grafana:9.5.7 |
|
grafana-image-renderer |
mirantis.azurecr.io/stacklight/grafana-image-renderer:3-20230712154008 |
|
k8s-sidecar Updated |
mirantis.azurecr.io/stacklight/k8s-sidecar:1.22-20230825023020 |
|
keycloak-gatekeeper Removed |
n/a |
|
kube-state-metrics |
mirantis.azurecr.io/stacklight/kube-state-metrics:v2.8.2 |
|
kubectl Updated |
mirantis.azurecr.io/stacklight/kubectl:1.22-20230825023019 |
|
metric-collector Updated |
mirantis.azurecr.io/stacklight/metric-collector:v0.1-20230825023018 |
|
metricbeat Updated |
mirantis.azurecr.io/stacklight/metricbeat:7.12.1-20230825023010 |
|
node-exporter |
mirantis.azurecr.io/stacklight/node-exporter:v1.6.0 |
|
oauth2-proxy New |
mirantis.azurecr.io/iam/oauth2-proxy:v7.1.3-4 |
|
opensearch Updated |
mirantis.azurecr.io/stacklight/opensearch:2-20230825023013 |
|
opensearch-dashboards Updated |
mirantis.azurecr.io/stacklight/opensearch-dashboards:2-20230825023009 |
|
openstack-refapp |
mirantis.azurecr.io/openstack/openstack-refapp:0.1.3 |
|
pgbouncer Updated |
mirantis.azurecr.io/stacklight/pgbouncer:1-20230825023021 |
|
prometheus |
mirantis.azurecr.io/stacklight/prometheus:v2.44.0 |
|
prometheus-es-exporter Updated |
mirantis.azurecr.io/stacklight/prometheus-es-exporter:v0.14.0-20230825023020 |
|
prometheus-msteams |
mirantis.azurecr.io/stacklight/prometheus-msteams:v1.5.2 |
|
prometheus-patroni-exporter Updated |
mirantis.azurecr.io/stacklight/prometheus-patroni-exporter:0.0.1-20230825023021 |
|
prometheus-postgres-exporter |
mirantis.azurecr.io/stacklight/prometheus-postgres-exporter:v0.12.0 |
|
prometheus-relay Updated |
mirantis.azurecr.io/stacklight/prometheus-relay:v0.4-20230825023020 |
|
psql-client Updated |
mirantis.azurecr.io/scale/psql-client:v13-20230817113822 |
|
sf-notifier Updated |
mirantis.azurecr.io/stacklight/sf-notifier:v0.3-20230825023009 |
|
sf-reporter |
mirantis.azurecr.io/stacklight/sf-reporter:v0.1-20230601044047 |
|
spilo Updated |
mirantis.azurecr.io/stacklight/spilo:13-2.1p9-20230825023018 |
|
stacklight-toolkit Updated |
mirantis.azurecr.io/stacklight/stacklight-toolkit:20230825023019 |
|
telegraf |
mirantis.azurecr.io/stacklight/telegraf:v1.9.1-20230825023009 Updated |
|
mirantis.azurecr.io/stacklight/telegraf:1.27-20230809094327 |
||
telemeter Updated |
mirantis.azurecr.io/stacklight/telemeter:4.4-20230825023014 |
|
telemeter-token-auth Updated |
mirantis.azurecr.io/stacklight/telemeter-token-auth:v0.1-20230825023013 |
Unchanged as compared to 14.0.1
Artifact |
Component |
Path |
|---|---|---|
Debian repositories |
System packages |
|
http://mirror.mirantis.com/kaas/kubernetes-extra-rhel7-0.0.8/ |
||
https://mirror.mirantis.com/kaas/ubuntu-2023-06-01-014502.target.txt |
||
MCR repositories |
MCR |
https://repos.mirantis.com/ubuntu/dists/bionic/pool/stable-20.10/ |
Target ubuntu system 1 |
Ubuntu |
https://binary.mirantis.com/bm/bin/efi/ubuntu/tgz-focal-20230606111629 |
https://binary.mirantis.com/bm/bin/efi/ubuntu/tgz-bionic-5.4-20230606111551 2 |
This section includes release notes for the patch Cluster release 14.0.2 that is introduced in the Container Cloud patch release 2.24.3 and is based on the Cluster release 14.0.1.
This patch Cluster release is based on Mirantis Kubernetes Engine 3.6.6
with Kubernetes 1.24 and Mirantis Container Runtime 20.10.17, in which
docker-ee-cli was updated to version 20.10.18 to fix the following CVEs:
CVE-2023-28840,
CVE-2023-28642,
CVE-2022-41723.
For the list of enhancements and CVE fixes delivered with this patch Cluster release, see 2.24.3
For details on patch release delivery, see Patch releases
This section lists the components artifacts of the Cluster release 14.0.2.
Note
The components that are newly added, updated, deprecated, or removed
as compared to the previous release version, are marked
with a corresponding superscript,
for example, lcm-ansible Updated.
Artifact |
Component |
Path |
|---|---|---|
Helm chart Updated |
ceph-controller |
https://binary.mirantis.com/ceph/helm/ceph-operator-1.0.0-mcc-2.24.3-2.tgz |
Docker images Updated |
ceph |
mirantis.azurecr.io/mirantis/ceph:v17.2.6-cve-1 |
ceph-controller |
mirantis.azurecr.io/ceph/mcp/ceph-controller:2.24.3-0 |
|
cephcsi |
mirantis.azurecr.io/mirantis/cephcsi:v3.8.0-cve-1 |
|
cephcsi-registrar |
mirantis.azurecr.io/mirantis/cephcsi-registrar:v2.8.0-cve-1 |
|
cephcsi-provisioner |
mirantis.azurecr.io/mirantis/cephcsi-provisioner:v3.5.0-cve-1 |
|
cephcsi-snapshotter |
mirantis.azurecr.io/mirantis/cephcsi-snapshotter:v6.2.1-cve-1 |
|
cephcsi-attacher |
mirantis.azurecr.io/mirantis/cephcsi-attacher:v4.3.0-cve-1 |
|
cephcsi-resizer |
mirantis.azurecr.io/mirantis/cephcsi-resizer:v1.8.0-cve-1 |
|
rook |
mirantis.azurecr.io/ceph/rook:v1.11.4-11 |
Artifact |
Component |
Path |
|---|---|---|
Binaries Updated |
lcm-ansible |
https://binary.mirantis.com/lcm/bin/lcm-ansible/v0.22.0-63-g8f4f248/lcm-ansible.tar.gz |
lcm-agent |
||
Helm charts Updated |
helm-controller |
https://binary.mirantis.com/core/helm/helm-controller-1.37.23.tgz |
managed-lcm-api |
https://binary.mirantis.com/core/helm/managed-lcm-api-1.37.23.tgz |
|
Docker images Updated |
helm-controller |
mirantis.azurecr.io/core/lcm-controller:1.37.23 |
Artifact |
Component |
Path |
|---|---|---|
Helm charts |
alerta |
https://binary.mirantis.com/stacklight/helm/alerta-0.1.0-mcp-29.tgz |
alertmanager-webhook-servicenow |
https://binary.mirantis.com/stacklight/helm/alertmanager-webhook-servicenow-0.2.0-mcp-4.tgz |
|
cadvisor |
https://binary.mirantis.com/stacklight/helm/cadvisor-0.1.0-mcp-2.tgz |
|
elasticsearch-curator |
https://binary.mirantis.com/stacklight/helm/elasticsearch-curator-1.5.0-mcp-10.tgz |
|
elasticsearch-exporter |
https://binary.mirantis.com/stacklight/helm/elasticsearch-exporter-1.2.0-mcp-7.tgz |
|
fluentd |
https://binary.mirantis.com/stacklight/helm/fluentd-2.0.3-mcp-49.tgz |
|
fluentd-logs |
https://binary.mirantis.com/stacklight/helm/fluentd-logs-0.1.0-mcp-176.tgz |
|
grafana |
https://binary.mirantis.com/stacklight/helm/grafana-3.3.10-mcp-231.tgz |
|
iam-proxy |
||
metric-collector |
https://binary.mirantis.com/stacklight/helm/metric-collector-0.3.0-mcp-10.tgz |
|
metricbeat |
https://binary.mirantis.com/stacklight/helm/metricbeat-1.7.1-mcp-16.tgz |
|
opensearch |
https://binary.mirantis.com/stacklight/helm/opensearch-0.1.0-mcp-58.tgz |
|
opensearch-dashboards |
https://binary.mirantis.com/stacklight/helm/opensearch-dashboards-0.1.0-mcp-47.tgz |
|
patroni |
https://binary.mirantis.com/stacklight/helm/patroni-0.15.1-mcp-52.tgz |
|
prometheus |
https://binary.mirantis.com/stacklight/helm/prometheus-8.11.4-mcp-240.tgz |
|
prometheus-blackbox-exporter |
https://binary.mirantis.com/stacklight/helm/prometheus-blackbox-exporter-0.3.0-mcp-11.tgz |
|
prometheus-es-exporter |
https://binary.mirantis.com/stacklight/helm/prometheus-es-exporter-1.0.0-mcp-11.tgz |
|
prometheus-msteams |
https://binary.mirantis.com/stacklight/helm/prometheus-msteams-0.1.0-mcp-9.tgz |
|
refapp |
https://binary.mirantis.com/scale/helm/refapp-0.2.1-mcp-11.tgz |
|
sf-notifier |
https://binary.mirantis.com/stacklight/helm/sf-notifier-0.2.0-mcp-7.tgz |
|
sf-reporter |
https://binary.mirantis.com/stacklight/helm/sf-reporter-0.2.0-mcp-6.tgz |
|
stacklight Updated |
https://binary.mirantis.com/stacklight/helm/stacklight-0.12.9.tgz |
|
telegraf-ds |
https://binary.mirantis.com/stacklight/helm/telegraf-ds-1.1.5-mcp-37.tgz |
|
telegraf-s |
https://binary.mirantis.com/stacklight/helm/telegraf-s-1.1.5-mcp-37.tgz |
|
telemeter-client |
https://binary.mirantis.com/stacklight/helm/telemeter-client-0.2.0-mcp-7.tgz |
|
telemeter-server |
https://binary.mirantis.com/stacklight/helm/telemeter-server-0.2.0-mcp-7.tgz |
|
Docker images |
alerta-web |
mirantis.azurecr.io/stacklight/alerta-web:9-20230714023009 |
alertmanager Updated |
mirantis.azurecr.io/stacklight/alertmanager:v0-20230811023012 |
|
alertmanager-webhook-servicenow |
mirantis.azurecr.io/stacklight/alertmanager-webhook-servicenow:v0.1-20230601043943 |
|
alpine-utils Updated |
mirantis.azurecr.io/stacklight/alpine-utils:1-20230811023020 |
|
blackbox-exporter |
mirantis.azurecr.io/stacklight/blackbox-exporter:v0.24.0 |
|
cadvisor Updated |
mirantis.azurecr.io/stacklight/cadvisor:v0.47-20230811023011 |
|
configmap-reload |
mirantis.azurecr.io/stacklight/configmap-reload:v0.8.0 |
|
curator |
mirantis.azurecr.io/stacklight/curator:5.7.6-20230404082402 |
|
curl-jq |
mirantis.azurecr.io/scale/curl-jq:alpine-20230706142802 |
|
elasticsearch-exporter |
mirantis.azurecr.io/stacklight/elasticsearch-exporter:v1.5.0 |
|
fluentd Updated |
mirantis.azurecr.io/stacklight/fluentd:1.15-20230811023012 |
|
grafana Updated |
mirantis.azurecr.io/stacklight/grafana:9.5.7 |
|
grafana-image-renderer |
mirantis.azurecr.io/stacklight/grafana-image-renderer:3-20230712154008 |
|
k8s-sidecar Updated |
mirantis.azurecr.io/stacklight/k8s-sidecar:1.22-20230811023020 |
|
keycloak-gatekeeper |
mirantis.azurecr.io/iam/keycloak-gatekeeper:7.1.3-5 |
|
kube-state-metrics |
mirantis.azurecr.io/stacklight/kube-state-metrics:v2.8.2 |
|
kubectl Updated |
mirantis.azurecr.io/stacklight/kubectl:1.22-20230811023020 |
|
metric-collector Updated |
mirantis.azurecr.io/stacklight/metric-collector:v0.1-20230811023017 |
|
metricbeat Updated |
mirantis.azurecr.io/stacklight/metricbeat:7.12.1-20230811023011 |
|
node-exporter |
mirantis.azurecr.io/stacklight/node-exporter:v1.6.0 |
|
opensearch Updated |
mirantis.azurecr.io/stacklight/opensearch:2-20230811023016 |
|
opensearch-dashboards Updated |
mirantis.azurecr.io/stacklight/opensearch-dashboards:2-20230811023009 |
|
openstack-refapp |
mirantis.azurecr.io/openstack/openstack-refapp:0.1.3 |
|
pgbouncer Updated |
mirantis.azurecr.io/stacklight/pgbouncer:1-20230811023021 |
|
prometheus |
mirantis.azurecr.io/stacklight/prometheus:v2.44.0 |
|
prometheus-es-exporter Updated |
mirantis.azurecr.io/stacklight/prometheus-es-exporter:v0.14.0-20230811023019 |
|
prometheus-msteams |
mirantis.azurecr.io/stacklight/prometheus-msteams:v1.5.2 |
|
prometheus-patroni-exporter Updated |
mirantis.azurecr.io/stacklight/prometheus-patroni-exporter:0.0.1-20230811023020 |
|
prometheus-postgres-exporter |
mirantis.azurecr.io/stacklight/prometheus-postgres-exporter:v0.12.0 |
|
prometheus-relay Updated |
mirantis.azurecr.io/stacklight/prometheus-relay:v0.4-20230811023018 |
|
psql-client |
mirantis.azurecr.io/scale/psql-client:v13-20230706142757 |
|
sf-notifier Updated |
mirantis.azurecr.io/stacklight/sf-notifier:v0.3-20230811023011 |
|
sf-reporter |
mirantis.azurecr.io/stacklight/sf-reporter:v0.1-20230601044047 |
|
spilo Updated |
mirantis.azurecr.io/stacklight/spilo:13-2.1p9-20230811023016 |
|
stacklight-toolkit Updated |
mirantis.azurecr.io/stacklight/stacklight-toolkit:20230811023013 |
|
telegraf |
mirantis.azurecr.io/stacklight/telegraf:v1.9.1-20230811023008 Updated |
|
mirantis.azurecr.io/stacklight/telegraf:1.27-20230809094327 Updated |
||
telemeter Updated |
mirantis.azurecr.io/stacklight/telemeter:4.4-20230811023013 |
|
telemeter-token-auth Updated |
mirantis.azurecr.io/stacklight/telemeter-token-auth:v0.1-20230811023014 |
Unchanged as compared to 14.0.1
Artifact |
Component |
Path |
|---|---|---|
Debian repositories |
System packages |
|
http://mirror.mirantis.com/kaas/kubernetes-extra-rhel7-0.0.8/ |
||
https://mirror.mirantis.com/kaas/ubuntu-2023-06-01-014502.target.txt |
||
MCR repositories |
MCR |
https://repos.mirantis.com/ubuntu/dists/bionic/pool/stable-20.10/ |
Target ubuntu system 1 |
Ubuntu |
https://binary.mirantis.com/bm/bin/efi/ubuntu/tgz-focal-20230606111629 |
https://binary.mirantis.com/bm/bin/efi/ubuntu/tgz-bionic-5.4-20230606111551 2 |
This section outlines release notes for the major Cluster release 14.0.1 that is introduced in the Container Cloud release 2.24.2.
This Cluster release supports Mirantis Kubernetes Engine 3.6.5 with Kubernetes 1.24 and Mirantis Container Runtime 20.10.17.
The Cluster release 14.0.1 is based on 14.0.0 introduced in Container Cloud 2.24.0. The only difference between these two 14.x releases is that 14.0.1 contains the following updated LCM and StackLight artifacts to address critical CVEs:
StackLight chart -
stacklight/helm/stacklight-0.12.8.tgzLCM Ansible image -
lcm-ansible-v0.22.0-52-g62235a5
For For the list of enhancements, refer to the Cluster release 14.0.0. For For the list of known and addressed issues, refer to the Container Cloud release 2.24.0 section.
The following table lists the components versions of the Cluster release 14.0.1.
Note
The components that are newly added, updated, deprecated, or removed
as compared to the previous release version, are marked
with a corresponding superscript,
for example, lcm-ansible Updated.
Component |
Application/Service |
Version |
|---|---|---|
Cluster orchestration |
Mirantis Kubernetes Engine |
3.6.5 0 |
Container runtime |
Mirantis Container Runtime |
20.10.17 1 |
Distributed storage |
Ceph |
17.2.6 (Quincy) |
Rook |
1.11.4-10 |
|
LCM |
helm-controller |
1.37.15 |
lcm-ansible Updated |
0.22.0-52-g62235a5 |
|
lcm-agent |
1.37.15 |
|
StackLight |
Alerta |
9.0.0 |
Alertmanager |
0.25.0 |
|
Alertmanager Webhook ServiceNow |
0.1 |
|
Blackbox Exporter |
0.24.0 |
|
cAdvisor |
0.47.1 |
|
Elasticsearch Curator |
5.7.6 |
|
Elasticsearch Exporter |
1.5.0 |
|
Fluentd |
1.15.3 |
|
Grafana Updated |
9.5.5 |
|
Grafana Image Renderer Updated |
3.7.1 |
|
keycloak-gatekeeper |
7.1.3-5 |
|
kube-state-metrics |
2.8.2 |
|
Metric Collector |
0.1 |
|
Metricbeat |
7.12.1 |
|
Prometheus Node Exporter |
1.6.0 |
|
OpenSearch Updated |
2.8.0 |
|
OpenSearch Dashboards |
2.7.0 |
|
Prometheus |
2.44.0 |
|
Prometheus ES Exporter |
0.14.0 |
|
Prometheus MS Teams |
1.5.2 |
|
Prometheus Patroni Exporter |
0.0.1 |
|
Prometheus Postgres Exporter |
0.12.0 |
|
Prometheus Relay |
0.4 |
|
sf-notifier |
0.3 |
|
sf-reporter |
0.1 |
|
Spilo |
13-2.1p9 |
|
Telegraf |
1.9.1 |
|
1.26.2 |
||
Telemeter |
4.4 |
- 0
For the Mirantis Kubernetes Engine (MKE) release highlights and components versions, see MKE documentation: MKE release notes.
- 1
For the Mirantis Container Runtime (MCR) release highlights, see MCR documentation: MCR release notes.
This section lists the components artifacts of the Cluster release 14.0.1.
Note
The components that are newly added, updated, deprecated, or removed
as compared to the previous release version, are marked
with a corresponding superscript,
for example, lcm-ansible Updated.
Artifact |
Component |
Path |
|---|---|---|
Helm chart |
ceph-controller |
https://binary.mirantis.com/ceph/helm/ceph-operator-1.0.0-mcc-2.24.0-10.tgz |
Docker images |
ceph |
mirantis.azurecr.io/mirantis/ceph:v17.2.6-rel-5 |
ceph-controller |
mirantis.azurecr.io/ceph/mcp/ceph-controller:2.24.0-9 |
|
cephcsi |
mirantis.azurecr.io/mirantis/cephcsi:v3.8.0-rel-3 |
|
cephcsi-registrar |
mirantis.azurecr.io/mirantis/cephcsi-registrar:v2.8.0-rel-1 |
|
cephcsi-provisioner |
mirantis.azurecr.io/mirantis/cephcsi-provisioner:v3.5.0-rel-1 |
|
cephcsi-snapshotter |
mirantis.azurecr.io/mirantis/cephcsi-snapshotter:v6.2.1-rel-1 |
|
cephcsi-attacher |
mirantis.azurecr.io/mirantis/cephcsi-attacher:v4.3.0-rel-1 |
|
cephcsi-resizer |
mirantis.azurecr.io/mirantis/cephcsi-resizer:v1.8.0-rel-1 |
|
rook |
mirantis.azurecr.io/ceph/rook:v1.11.4-10 |
Artifact |
Component |
Path |
|---|---|---|
Binaries |
lcm-ansible Updated |
https://binary.mirantis.com/lcm/bin/lcm-ansible/v0.22.0-52-g62235a5/lcm-ansible.tar.gz |
lcm-agent |
||
Helm charts |
helm-controller |
https://binary.mirantis.com/core/helm/helm-controller-1.37.15.tgz |
managed-lcm-api |
https://binary.mirantis.com/core/helm/managed-lcm-api-1.37.15.tgz |
|
Docker images |
helm-controller |
mirantis.azurecr.io/core/lcm-controller:1.37.15 |
Artifact |
Component |
Path |
|---|---|---|
Helm charts |
alerta |
https://binary.mirantis.com/stacklight/helm/alerta-0.1.0-mcp-29.tgz |
alertmanager-webhook-servicenow |
https://binary.mirantis.com/stacklight/helm/alertmanager-webhook-servicenow-0.2.0-mcp-4.tgz |
|
cadvisor |
https://binary.mirantis.com/stacklight/helm/cadvisor-0.1.0-mcp-2.tgz |
|
elasticsearch-curator |
https://binary.mirantis.com/stacklight/helm/elasticsearch-curator-1.5.0-mcp-10.tgz |
|
elasticsearch-exporter |
https://binary.mirantis.com/stacklight/helm/elasticsearch-exporter-1.2.0-mcp-7.tgz |
|
fluentd |
https://binary.mirantis.com/stacklight/helm/fluentd-2.0.3-mcp-49.tgz |
|
fluentd-logs Updated |
https://binary.mirantis.com/stacklight/helm/fluentd-logs-0.1.0-mcp-176.tgz |
|
grafana Updated |
https://binary.mirantis.com/stacklight/helm/grafana-3.3.10-mcp-231.tgz |
|
iam-proxy |
||
metric-collector |
https://binary.mirantis.com/stacklight/helm/metric-collector-0.3.0-mcp-10.tgz |
|
metricbeat |
https://binary.mirantis.com/stacklight/helm/metricbeat-1.7.1-mcp-16.tgz |
|
opensearch |
https://binary.mirantis.com/stacklight/helm/opensearch-0.1.0-mcp-58.tgz |
|
opensearch-dashboards |
https://binary.mirantis.com/stacklight/helm/opensearch-dashboards-0.1.0-mcp-47.tgz |
|
patroni |
https://binary.mirantis.com/stacklight/helm/patroni-0.15.1-mcp-52.tgz |
|
prometheus |
https://binary.mirantis.com/stacklight/helm/prometheus-8.11.4-mcp-240.tgz |
|
prometheus-blackbox-exporter |
https://binary.mirantis.com/stacklight/helm/prometheus-blackbox-exporter-0.3.0-mcp-11.tgz |
|
prometheus-es-exporter |
https://binary.mirantis.com/stacklight/helm/prometheus-es-exporter-1.0.0-mcp-11.tgz |
|
prometheus-msteams |
https://binary.mirantis.com/stacklight/helm/prometheus-msteams-0.1.0-mcp-9.tgz |
|
refapp |
https://binary.mirantis.com/scale/helm/refapp-0.2.1-mcp-11.tgz |
|
sf-notifier Updated |
https://binary.mirantis.com/stacklight/helm/sf-notifier-0.2.0-mcp-7.tgz |
|
sf-reporter |
https://binary.mirantis.com/stacklight/helm/sf-reporter-0.2.0-mcp-6.tgz |
|
stacklight Updated |
https://binary.mirantis.com/stacklight/helm/stacklight-0.12.8.tgz |
|
telegraf-ds |
https://binary.mirantis.com/stacklight/helm/telegraf-ds-1.1.5-mcp-37.tgz |
|
telegraf-s |
https://binary.mirantis.com/stacklight/helm/telegraf-s-1.1.5-mcp-37.tgz |
|
telemeter-client |
https://binary.mirantis.com/stacklight/helm/telemeter-client-0.2.0-mcp-7.tgz |
|
telemeter-server |
https://binary.mirantis.com/stacklight/helm/telemeter-server-0.2.0-mcp-7.tgz |
|
Docker images |
alerta-web Updated |
mirantis.azurecr.io/stacklight/alerta-web:9-20230714023009 |
alertmanager Updated |
mirantis.azurecr.io/stacklight/alertmanager:v0-20230717144436 |
|
alertmanager-webhook-servicenow |
mirantis.azurecr.io/stacklight/alertmanager-webhook-servicenow:v0.1-20230601043943 |
|
alpine-utils Updated |
mirantis.azurecr.io/stacklight/alpine-utils:1-20230714023021 |
|
blackbox-exporter |
mirantis.azurecr.io/stacklight/blackbox-exporter:v0.24.0 |
|
cadvisor Updated |
mirantis.azurecr.io/stacklight/cadvisor:v0.47-20230714023020 |
|
configmap-reload |
mirantis.azurecr.io/stacklight/configmap-reload:v0.8.0 |
|
curator |
mirantis.azurecr.io/stacklight/curator:5.7.6-20230404082402 |
|
curl-jq Updated |
mirantis.azurecr.io/scale/curl-jq:alpine-20230706142802 |
|
elasticsearch-exporter |
mirantis.azurecr.io/stacklight/elasticsearch-exporter:v1.5.0 |
|
fluentd Updated |
mirantis.azurecr.io/stacklight/fluentd:1.15-20230714023011 |
|
grafana Updated |
mirantis.azurecr.io/stacklight/grafana:9.5.5 |
|
grafana-image-renderer Updated |
mirantis.azurecr.io/stacklight/grafana-image-renderer:3-20230712154008 |
|
k8s-sidecar Updated |
mirantis.azurecr.io/stacklight/k8s-sidecar:1.22-20230714023021 |
|
keycloak-gatekeeper |
mirantis.azurecr.io/iam/keycloak-gatekeeper:7.1.3-5 |
|
kube-state-metrics |
mirantis.azurecr.io/stacklight/kube-state-metrics:v2.8.2 |
|
kubectl Updated |
mirantis.azurecr.io/stacklight/kubectl:1.22-20230714023020 |
|
metric-collector Updated |
mirantis.azurecr.io/stacklight/metric-collector:v0.1-20230714023015 |
|
metricbeat Updated |
mirantis.azurecr.io/stacklight/metricbeat:7.12.1-20230714023010 |
|
node-exporter |
mirantis.azurecr.io/stacklight/node-exporter:v1.6.0 |
|
opensearch Updated |
mirantis.azurecr.io/stacklight/opensearch:2-20230707023015 |
|
opensearch-dashboards Updated |
mirantis.azurecr.io/stacklight/opensearch-dashboards:2-20230719110228 |
|
openstack-refapp Updated |
mirantis.azurecr.io/openstack/openstack-refapp:0.1.3 |
|
pgbouncer Updated |
mirantis.azurecr.io/stacklight/pgbouncer:1-20230714023021 |
|
prometheus |
mirantis.azurecr.io/stacklight/prometheus:v2.44.0 |
|
prometheus-es-exporter Updated |
mirantis.azurecr.io/stacklight/prometheus-es-exporter:v0.14.0-20230714023018 |
|
prometheus-msteams |
mirantis.azurecr.io/stacklight/prometheus-msteams:v1.5.2 |
|
prometheus-patroni-exporter Updated |
mirantis.azurecr.io/stacklight/prometheus-patroni-exporter:0.0.1-20230714023020 |
|
prometheus-postgres-exporter |
mirantis.azurecr.io/stacklight/prometheus-postgres-exporter:v0.12.0 |
|
prometheus-relay Updated |
mirantis.azurecr.io/stacklight/prometheus-relay:v0.4-20230714023016 |
|
psql-client Updated |
mirantis.azurecr.io/scale/psql-client:v13-20230706142757 |
|
sf-notifier Updated |
mirantis.azurecr.io/stacklight/sf-notifier:v0.3-20230714113914 |
|
sf-reporter |
mirantis.azurecr.io/stacklight/sf-reporter:v0.1-20230601044047 |
|
spilo Updated |
mirantis.azurecr.io/stacklight/spilo:13-2.1p9-20230717125456 |
|
stacklight-toolkit Updated |
mirantis.azurecr.io/stacklight/stacklight-toolkit:20230714023018 |
|
telegraf |
mirantis.azurecr.io/stacklight/telegraf:v1.9.1-20230714023010 Updated |
|
mirantis.azurecr.io/stacklight/telegraf:1.26-20230602023017 |
||
telemeter Updated |
mirantis.azurecr.io/stacklight/telemeter:4.4-20230714023014 |
|
telemeter-token-auth Updated |
mirantis.azurecr.io/stacklight/telemeter-token-auth:v0.1-20230714023016 |
Artifact |
Component |
Path |
|---|---|---|
Debian repositories |
System packages |
|
http://mirror.mirantis.com/kaas/kubernetes-extra-rhel7-0.0.8/ |
||
https://mirror.mirantis.com/kaas/ubuntu-2023-06-01-014502.target.txt |
||
MCR repositories |
MCR |
https://repos.mirantis.com/ubuntu/dists/bionic/pool/stable-20.10/ |
Target ubuntu system 1 |
Ubuntu |
https://binary.mirantis.com/bm/bin/efi/ubuntu/tgz-focal-20230606111629 |
https://binary.mirantis.com/bm/bin/efi/ubuntu/tgz-bionic-5.4-20230606111551 2 |
This section outlines release notes for the Cluster release 14.0.0 that is introduced in the Container Cloud release 2.24.0.
This Cluster release supports Mirantis Kubernetes Engine 3.6.5 with Kubernetes 1.24 and Mirantis Container Runtime 20.10.17.
For the list of known and addressed issues, refer to the Container Cloud release 2.24.0 section.
This section outlines new features implemented in the Cluster release 14.0.0 that is introduced in the Container Cloud release 2.24.0.
Dropping of redundant Ceph components from management and regional clusters
Major version update of OpenSearch and OpenSearch Dashboards
Introduced support for Mirantis Container Runtime (MCR) 20.10.17 and Mirantis Kubernetes Engine (MKE) 3.6.5 that supports Kubernetes 1.24 for the Container Cloud management, regional, and managed clusters. On existing clusters, MKE and MCR are updated to the latest supported version when you update your managed cluster to the Cluster release 14.0.0.
Caution
Support for MKE 3.5.x is dropped. Therefore, new deployments on MKE 3.5.x are not supported.
Note
For MOSK-based deployments, the feature support is available since MOSK 23.2.
Upgraded Ceph major version from Pacific 16.2.11 to Quincy 17.2.6 with an automatic upgrade of Ceph components on existing managed clusters during the Cluster version update.
Note
For MOSK-based deployments, the feature support is available since MOSK 23.2.
As the final part of Ceph removal from Container Cloud management clusters, which reduces resource consumption, removed the following Ceph components that were present on clusters for backward compatibility:
Helm chart of the Ceph Controller (
ceph-operator)Ceph deployments
Ceph namespaces
ceph-lcm-mirantisandrook-ceph
Learn more
On top of addressing the known issue 30635, introduced
a requirement for the deviceClass field in each Ceph pool specification to
prevent the issue recurrence. This rule includes all pools in
spec.cephClusterSpec.pools, spec.cephClusterSpec.objectStorage, and
spec.cephClusterSpec.sharedFilesystem of the pool specification.
Introduced healthcheck metrics and the following Ceph alerts to monitor network connectivity between Ceph nodes:
CephDaemonSlowOpsCephMonClockSkewCephOSDFlappingCephOSDSlowClusterNetworkCephOSDSlowPublicNetwork
Note
For MOSK-based deployments, the feature support is available since MOSK 23.2.
Learn more
Implemented the following improvements to StackLight alerting:
Changed severity for multiple alerts to increase visibility of potentially workload-impacting alerts and decrease noise of non-workload-impacting alerts
Renamed
MCCLicenseExpirationCriticaltoMCCLicenseExpirationHigh,MCCLicenseExpirationMajortoMCCLicenseExpirationMediumFor Ironic:
Removed
IronicBmMetricsMissingin favor ofIronicBmApiOutageRemoved inhibition rules for
IronicBmTargetDownandIronicBmApiOutageImproved expression for
IronicBmApiOutage
For Kubernetes applications:
Reworked troubleshooting steps for
KubeStatefulSetUpdateNotRolledOut,KubeDeploymentOutage,KubeDeploymentReplicasMismatchUpdated descriptions for
KubeStatefulSetOutageandKubeDeploymentOutageChanged expressions for
KubeDeploymentOutage,KubeDeploymentReplicasMismatch,CephOSDDiskNotResponding, andCephOSDDown
Learn more
Updated OpenSearch and OpenSearch Dashboards from major version 1.3.7 to 2.7.0. The latest version includes a number of enhancements along with bug and security fixes.
Note
For MOSK-based deployments, the feature support is available since MOSK 23.2.
Caution
The version update process can take up to 20 minutes, during
which both OpenSearch and OpenSearch Dashboards may become temporarily
unavailable. Additionally, the KubeStatefulsetUpdateNotRolledOut alert
for the opensearch-master StatefulSet may fire for a short period of time.
Note
The end-of-life support of the major version 1.x ends on December 31, 2023.
Tuned the performance of Grafana dashboards for faster loading and a better UX by refactoring and optimizing different Grafana dashboards.
This enhancement includes extraction of the OpenSearch Indices dashboard out of the OpenSearch dashboard to provide detailed information about the state of indices, including their size, the size of document values and segments.
Learn more
To improve Prometheus performance and provide better resource utilization with faster query response, dropped metrics that are unused by StackLight. Also created the default white list of metrics that you can expand.
The feature is enabled by default using the
prometheusServer.metricsFiltering.enabled:true parameter. Thus, if you
have created custom alerts, recording rules, dashboards, or if you were
actively using some metrics for different purposes, some of those metrics can
be dropped. Therefore, verify the white list of Prometheus scrape jobs
to ensure that the required metrics are not dropped.
If a job name that relates to the required metric is not present in this list,
its target metrics are not dropped and are collected by Prometheus by default.
If the required metric is not present in this list, you can whitelist it
using the prometheusServer.metricsFiltering.extraMetricsInclude parameter.
Learn more
The following table lists the components versions of the Cluster release 14.0.0.
Component |
Application/Service |
Version |
|---|---|---|
Cluster orchestration |
Mirantis Kubernetes Engine |
3.6.5 0 |
Container runtime |
Mirantis Container Runtime |
20.10.17 1 |
Distributed storage |
Ceph |
17.2.6 (Quincy) |
Rook |
1.11.4-10 |
|
LCM |
helm-controller |
1.37.15 |
lcm-ansible |
0.22.0-49-g9618f2a |
|
lcm-agent |
1.37.15 |
|
StackLight |
Alerta |
9.0.0 |
Alertmanager |
0.25.0 |
|
Alertmanager Webhook ServiceNow |
0.1 |
|
Blackbox Exporter |
0.24.0 |
|
cAdvisor |
0.47.1 |
|
Elasticsearch Curator |
5.7.6 |
|
Elasticsearch Exporter |
1.5.0 |
|
Fluentd |
1.15.3 |
|
Grafana |
9.4.9 |
|
Grafana Image Renderer |
3.7.0 |
|
keycloak-gatekeeper |
7.1.3-5 |
|
kube-state-metrics |
2.8.2 |
|
Metric Collector |
0.1 |
|
Metricbeat |
7.12.1 |
|
Node Exporter |
1.6.0 |
|
OpenSearch |
2.7.0 |
|
OpenSearch Dashboards |
2.7.0 |
|
Prometheus |
2.44.0 |
|
Prometheus ES Exporter |
0.14.0 |
|
Prometheus MS Teams |
1.5.2 |
|
Prometheus Patroni Exporter |
0.0.1 |
|
Prometheus Postgres Exporter |
0.12.0 |
|
Prometheus Relay |
0.4 |
|
sf-notifier |
0.3 |
|
sf-reporter |
0.1 |
|
Spilo |
13-2.1p9 |
|
Telegraf |
1.9.1 |
|
1.26.2 |
||
Telemeter |
4.4 |
- 0
For the Mirantis Kubernetes Engine (MKE) release highlights and components versions, see MKE documentation: MKE release notes.
- 1
For the Mirantis Container Runtime (MCR) release highlights, see MCR documentation: MCR release notes.
This section lists the components artifacts of the Cluster release 14.0.0.
Artifact |
Component |
Path |
|---|---|---|
Helm chart |
ceph-controller |
https://binary.mirantis.com/ceph/helm/ceph-operator-1.0.0-mcc-2.24.0-10.tgz |
Docker images |
ceph |
mirantis.azurecr.io/mirantis/ceph:v17.2.6-rel-5 |
ceph-controller |
mirantis.azurecr.io/ceph/mcp/ceph-controller:2.24.0-9 |
|
cephcsi |
mirantis.azurecr.io/mirantis/cephcsi:v3.8.0-rel-3 |
|
cephcsi-registrar |
mirantis.azurecr.io/mirantis/cephcsi-registrar:v2.8.0-rel-1 |
|
cephcsi-provisioner |
mirantis.azurecr.io/mirantis/cephcsi-provisioner:v3.5.0-rel-1 |
|
cephcsi-snapshotter |
mirantis.azurecr.io/mirantis/cephcsi-snapshotter:v6.2.1-rel-1 |
|
cephcsi-attacher |
mirantis.azurecr.io/mirantis/cephcsi-attacher:v4.3.0-rel-1 |
|
cephcsi-resizer |
mirantis.azurecr.io/mirantis/cephcsi-resizer:v1.8.0-rel-1 |
|
rook |
mirantis.azurecr.io/ceph/rook:v1.11.4-10 |
Artifact |
Component |
Path |
|---|---|---|
Binaries |
lcm-ansible |
https://binary.mirantis.com/lcm/bin/lcm-ansible/v0.22.0-49-g9618f2a/lcm-ansible.tar.gz |
lcm-agent |
||
Helm charts |
helm-controller |
https://binary.mirantis.com/core/helm/helm-controller-1.37.15.tgz |
managed-lcm-api |
https://binary.mirantis.com/core/helm/managed-lcm-api-1.37.15.tgz |
|
Docker images |
helm-controller |
mirantis.azurecr.io/core/lcm-controller:1.37.15 |
Artifact |
Component |
Path |
|---|---|---|
Helm charts |
alerta |
https://binary.mirantis.com/stacklight/helm/alerta-0.1.0-mcp-29.tgz |
alertmanager-webhook-servicenow |
https://binary.mirantis.com/stacklight/helm/alertmanager-webhook-servicenow-0.2.0-mcp-4.tgz |
|
cadvisor |
https://binary.mirantis.com/stacklight/helm/cadvisor-0.1.0-mcp-2.tgz |
|
elasticsearch-curator |
https://binary.mirantis.com/stacklight/helm/elasticsearch-curator-1.5.0-mcp-10.tgz |
|
elasticsearch-exporter |
https://binary.mirantis.com/stacklight/helm/elasticsearch-exporter-1.2.0-mcp-7.tgz |
|
fluentd |
https://binary.mirantis.com/stacklight/helm/fluentd-2.0.3-mcp-49.tgz |
|
fluentd-logs |
https://binary.mirantis.com/stacklight/helm/fluentd-logs-0.1.0-mcp-175.tgz |
|
grafana |
https://binary.mirantis.com/stacklight/helm/grafana-3.3.10-mcp-225.tgz |
|
iam-proxy |
||
metric-collector |
https://binary.mirantis.com/stacklight/helm/metric-collector-0.3.0-mcp-10.tgz |
|
metricbeat |
https://binary.mirantis.com/stacklight/helm/metricbeat-1.7.1-mcp-16.tgz |
|
opensearch |
https://binary.mirantis.com/stacklight/helm/opensearch-0.1.0-mcp-58.tgz |
|
opensearch-dashboards |
https://binary.mirantis.com/stacklight/helm/opensearch-dashboards-0.1.0-mcp-47.tgz |
|
patroni |
https://binary.mirantis.com/stacklight/helm/patroni-0.15.1-mcp-52.tgz |
|
prometheus |
https://binary.mirantis.com/stacklight/helm/prometheus-8.11.4-mcp-240.tgz |
|
prometheus-blackbox-exporter |
https://binary.mirantis.com/stacklight/helm/prometheus-blackbox-exporter-0.3.0-mcp-11.tgz |
|
prometheus-es-exporter |
https://binary.mirantis.com/stacklight/helm/prometheus-es-exporter-1.0.0-mcp-11.tgz |
|
prometheus-msteams |
https://binary.mirantis.com/stacklight/helm/prometheus-msteams-0.1.0-mcp-9.tgz |
|
refapp |
https://binary.mirantis.com/scale/helm/refapp-0.2.1-mcp-11.tgz |
|
sf-notifier |
https://binary.mirantis.com/stacklight/helm/sf-notifier-0.2.0-mcp-4.tgz |
|
sf-reporter |
https://binary.mirantis.com/stacklight/helm/sf-reporter-0.2.0-mcp-6.tgz |
|
stacklight |
https://binary.mirantis.com/stacklight/helm/stacklight-0.12.6.tgz |
|
telegraf-ds |
https://binary.mirantis.com/stacklight/helm/telegraf-ds-1.1.5-mcp-37.tgz |
|
telegraf-s |
https://binary.mirantis.com/stacklight/helm/telegraf-s-1.1.5-mcp-37.tgz |
|
telemeter-client |
https://binary.mirantis.com/stacklight/helm/telemeter-client-0.2.0-mcp-7.tgz |
|
telemeter-server |
https://binary.mirantis.com/stacklight/helm/telemeter-server-0.2.0-mcp-7.tgz |
|
Docker images |
alerta-web |
mirantis.azurecr.io/stacklight/alerta-web:9-20230602023009 |
alertmanager |
mirantis.azurecr.io/stacklight/alertmanager:v0.25.0 |
|
alertmanager-webhook-servicenow |
mirantis.azurecr.io/stacklight/alertmanager-webhook-servicenow:v0.1-20230601043943 |
|
alpine-utils |
mirantis.azurecr.io/stacklight/alpine-utils:1-20230602023019 |
|
blackbox-exporter |
mirantis.azurecr.io/stacklight/blackbox-exporter:v0.24.0 |
|
cadvisor |
mirantis.azurecr.io/stacklight/cadvisor:v0.47-20230602023019 |
|
configmap-reload |
mirantis.azurecr.io/stacklight/configmap-reload:v0.8.0 |
|
curator |
mirantis.azurecr.io/stacklight/curator:5.7.6-20230404082402 |
|
curl-jq |
mirantis.azurecr.io/scale/curl-jq:alpine-20230120171102 |
|
elasticsearch-exporter |
mirantis.azurecr.io/stacklight/elasticsearch-exporter:v1.5.0 |
|
fluentd |
mirantis.azurecr.io/stacklight/fluentd:1.15-20230602023011 |
|
grafana |
mirantis.azurecr.io/stacklight/grafana:9.4.9 |
|
grafana-image-renderer |
mirantis.azurecr.io/stacklight/grafana-image-renderer:3-20230418140825 |
|
k8s-sidecar |
mirantis.azurecr.io/stacklight/k8s-sidecar:1.22-20230602023018 |
|
keycloak-gatekeeper |
mirantis.azurecr.io/iam/keycloak-gatekeeper:7.1.3-5 |
|
kube-state-metrics |
mirantis.azurecr.io/stacklight/kube-state-metrics:v2.8.2 |
|
kubectl |
mirantis.azurecr.io/stacklight/kubectl:1.22-20230602023016 |
|
metric-collector |
mirantis.azurecr.io/stacklight/metric-collector:v0.1-20230602111822 |
|
metricbeat |
mirantis.azurecr.io/stacklight/metricbeat:7.12.1-20230602023010 |
|
node-exporter |
mirantis.azurecr.io/stacklight/node-exporter:v1.6.0 |
|
opensearch |
mirantis.azurecr.io/stacklight/opensearch:2-20230602023014 |
|
opensearch-dashboards |
mirantis.azurecr.io/stacklight/opensearch-dashboards:2-20230602023014 |
|
openstack-refapp |
mirantis.azurecr.io/openstack/openstack-refapp:0.0.1.dev33 |
|
pgbouncer |
mirantis.azurecr.io/stacklight/pgbouncer:1-20230602023019 |
|
prometheus |
mirantis.azurecr.io/stacklight/prometheus:v2.44.0 |
|
prometheus-es-exporter |
mirantis.azurecr.io/stacklight/prometheus-es-exporter:v0.14.0-20230602023016 |
|
prometheus-msteams |
mirantis.azurecr.io/stacklight/prometheus-msteams:v1.5.2 |
|
prometheus-patroni-exporter |
mirantis.azurecr.io/stacklight/prometheus-patroni-exporter:0.0.1-20230602023018 |
|
prometheus-postgres-exporter |
mirantis.azurecr.io/stacklight/prometheus-postgres-exporter:v0.12.0 |
|
prometheus-relay |
mirantis.azurecr.io/stacklight/prometheus-relay:v0.4-20230602023016 |
|
psql-client |
mirantis.azurecr.io/scale/psql-client:v13-20230124173121 |
|
sf-notifier |
mirantis.azurecr.io/stacklight/sf-notifier:v0.3-20230602023012 |
|
sf-reporter |
mirantis.azurecr.io/stacklight/sf-reporter:v0.1-20230601044047 |
|
spilo |
mirantis.azurecr.io/stacklight/spilo:13-2.1p9-20230602023015 |
|
stacklight-toolkit |
mirantis.azurecr.io/stacklight/stacklight-toolkit:20230602123559 |
|
telegraf |
mirantis.azurecr.io/stacklight/telegraf:v1.9.1-20230602023009 |
|
mirantis.azurecr.io/stacklight/telegraf:1.26-20230602023017 |
||
telemeter |
mirantis.azurecr.io/stacklight/telemeter:4.4-20230602023011 |
|
telemeter-token-auth |
mirantis.azurecr.io/stacklight/telemeter-token-auth:v0.1-20230602023012 |
Artifact |
Component |
Path |
|---|---|---|
Debian repositories |
System packages |
|
http://mirror.mirantis.com/kaas/kubernetes-extra-rhel7-0.0.8/ |
||
https://mirror.mirantis.com/kaas/ubuntu-2023-06-01-014502.target.txt |
||
MCR repositories |
MCR |
https://repos.mirantis.com/ubuntu/dists/bionic/pool/stable-20.10/ |
Target ubuntu system 1 |
Ubuntu |
https://binary.mirantis.com/bm/bin/efi/ubuntu/tgz-focal-20230606111629 |
https://binary.mirantis.com/bm/bin/efi/ubuntu/tgz-bionic-5.4-20230606111551 2 |
See also
This section outlines release notes for the unsupported Cluster releases of the 12.x series. Cluster releases ending with a zero, for example, 12.x.0, are major releases. Cluster releases ending with with a non-zero, for example, 12.x.1, are patch releases of a major release 12.x.0.
This section outlines release notes for unsupported Cluster releases of the 12.7.x series.
This section includes release notes for the patch Cluster release 12.7.4 that is introduced in the Container Cloud patch release 2.23.5 and is based on the Cluster release 12.7.0. This patch Cluster release supports MOSK 23.1.4.
For details on MOSK 23.1.4, see Release notes 23.1.4
For CVE fixes delivered with this patch Cluster release, see security notes for 2.23.5
For CVE fixes delivered with the previous patch Cluster releases, see security notes for 2.23.4, 2.23.3, and 2.23.2
For details on patch release delivery, see Patch releases
This section lists the components artifacts of the Cluster release 12.7.4.
Note
The components that are newly added, updated, deprecated, or removed
as compared to the previous release version, are marked
with a corresponding superscript,
for example, lcm-ansible Updated.
Artifact |
Component |
Path |
|---|---|---|
Helm chart |
ceph-controller Updated |
https://binary.mirantis.com/ceph/helm/ceph-operator-1.0.0-mcc-2.23.5-1.tgz |
Docker images |
ceph |
mirantis.azurecr.io/ceph/ceph:v16.2.11-cve-4 |
ceph-controller Updated |
mirantis.azurecr.io/ceph/mcp/ceph-controller:2.23.5-0 |
|
cephcsi |
mirantis.azurecr.io/mirantis/cephcsi:v3.7.2-cve-4 |
|
cephcsi-attacher |
mirantis.azurecr.io/mirantis/cephcsi-attacher:v4.2.0-cve-2 |
|
cephcsi-provisioner |
mirantis.azurecr.io/mirantis/cephcsi-provisioner:v3.4.0-cve-2 |
|
cephcsi-registrar |
mirantis.azurecr.io/mirantis/cephcsi-registrar:v2.7.0-cve-2 |
|
cephcsi-resizer |
mirantis.azurecr.io/mirantis/cephcsi-resizer:v1.7.0-cve-2 |
|
cephcsi-snapshotter |
mirantis.azurecr.io/mirantis/cephcsi-snapshotter:v6.2.1-cve-2 |
|
rook |
mirantis.azurecr.io/ceph/rook:v1.10.10-10 |
Artifact |
Component |
Path |
|---|---|---|
Binaries |
lcm-ansible |
https://binary.mirantis.com/lcm/bin/lcm-ansible/v0.21.0-39-g5b167de/lcm-ansible.tar.gz |
lcm-agent Updated |
||
Helm charts Updated |
helm-controller |
https://binary.mirantis.com/core/helm/helm-controller-1.36.27.tgz |
managed-lcm-api |
https://binary.mirantis.com/core/helm/managed-lcm-api-1.36.27.tgz |
|
Docker images Updated |
helm-controller |
mirantis.azurecr.io/core/helm-controller:1.36.27 |
Artifact |
Component |
Path |
|---|---|---|
Helm charts |
alerta |
https://binary.mirantis.com/stacklight/helm/alerta-0.1.0-mcp-29.tgz |
alertmanager-webhook-servicenow |
https://binary.mirantis.com/stacklight/helm/alertmanager-webhook-servicenow-0.2.0-mcp-4.tgz |
|
cadvisor |
https://binary.mirantis.com/stacklight/helm/cadvisor-0.1.0-mcp-2.tgz |
|
cerebro |
https://binary.mirantis.com/stacklight/helm/cerebro-0.1.0-mcp-2.tgz |
|
elasticsearch-curator |
https://binary.mirantis.com/stacklight/helm/elasticsearch-curator-1.5.0-mcp-10.tgz |
|
elasticsearch-exporter |
https://binary.mirantis.com/stacklight/helm/elasticsearch-exporter-1.2.0-mcp-6.tgz |
|
fluentd |
https://binary.mirantis.com/stacklight/helm/fluentd-2.0.3-mcp-49.tgz |
|
fluentd-logs |
https://binary.mirantis.com/stacklight/helm/fluentd-logs-0.1.0-mcp-170.tgz |
|
grafana |
https://binary.mirantis.com/stacklight/helm/grafana-3.3.10-mcp-200.tgz |
|
iam-proxy |
||
metric-collector |
https://binary.mirantis.com/stacklight/helm/metric-collector-0.3.0-mcp-10.tgz |
|
metricbeat |
https://binary.mirantis.com/stacklight/helm/metricbeat-1.7.1-mcp-16.tgz |
|
opensearch |
https://binary.mirantis.com/stacklight/helm/opensearch-0.1.0-mcp-52.tgz |
|
opensearch-dashboards |
https://binary.mirantis.com/stacklight/helm/opensearch-dashboards-0.1.0-mcp-44.tgz |
|
patroni |
https://binary.mirantis.com/stacklight/helm/patroni-0.15.1-mcp-48.tgz |
|
prometheus |
https://binary.mirantis.com/stacklight/helm/prometheus-8.11.4-mcp-229.tgz |
|
prometheus-blackbox-exporter |
https://binary.mirantis.com/stacklight/helm/prometheus-blackbox-exporter-0.3.0-mcp-11.tgz |
|
prometheus-es-exporter |
https://binary.mirantis.com/stacklight/helm/prometheus-es-exporter-1.0.0-mcp-11.tgz |
|
prometheus-msteams |
https://binary.mirantis.com/stacklight/helm/prometheus-msteams-0.1.0-mcp-9.tgz |
|
sf-notifier |
https://binary.mirantis.com/stacklight/helm/sf-notifier-0.2.0-mcp-4.tgz |
|
sf-reporter |
https://binary.mirantis.com/stacklight/helm/sf-reporter-0.2.0-mcp-6.tgz |
|
stacklight Updated |
https://binary.mirantis.com/stacklight/helm/stacklight-0.11.9.tgz |
|
telegraf-ds |
https://binary.mirantis.com/stacklight/helm/telegraf-ds-1.1.5-mcp-29.tgz |
|
telegraf-s |
https://binary.mirantis.com/stacklight/helm/telegraf-s-1.1.5-mcp-30.tgz |
|
telemeter-client |
https://binary.mirantis.com/stacklight/helm/telemeter-client-0.2.0-mcp-7.tgz |
|
telemeter-server |
https://binary.mirantis.com/stacklight/helm/telemeter-server-0.2.0-mcp-7.tgz |
|
Docker images |
alerta-web Updated |
mirantis.azurecr.io/stacklight/alerta-web:9-20230523144245 |
alertmanager |
mirantis.azurecr.io/stacklight/alertmanager:v0.25.0 |
|
alertmanager-webhook-servicenow Updated |
mirantis.azurecr.io/stacklight/alertmanager-webhook-servicenow:v0.1-20230519023013 |
|
alpine-utils Updated |
mirantis.azurecr.io/stacklight/alpine-utils:1-20230519023021 |
|
blackbox-exporter |
mirantis.azurecr.io/stacklight/blackbox-exporter:v0.23.0 |
|
cadvisor Updated |
mirantis.azurecr.io/stacklight/cadvisor:v0.47-20230519023020 |
|
cerebro |
mirantis.azurecr.io/stacklight/cerebro:v0.9-20230505023015 |
|
configmap-reload |
mirantis.azurecr.io/stacklight/configmap-reload:v0.8.0 |
|
curator |
mirantis.azurecr.io/stacklight/curator:5.7.6-20230404082402 |
|
elasticsearch_exporter |
mirantis.azurecr.io/stacklight/elasticsearch_exporter:1.0.2 |
|
fluentd Updated |
mirantis.azurecr.io/stacklight/fluentd:1.15-20230519023011 |
|
grafana |
mirantis.azurecr.io/stacklight/grafana:9.4.9 |
|
grafana-image-renderer |
mirantis.azurecr.io/stacklight/grafana-image-renderer:3-20230418140825 |
|
k8s-sidecar Updated |
mirantis.azurecr.io/stacklight/k8s-sidecar:1.22-20230519023019 |
|
kube-state-metrics |
mirantis.azurecr.io/stacklight/kube-state-metrics:v2.8.2 |
|
kubectl Updated |
mirantis.azurecr.io/stacklight/kubectl:1.22-20230519023019 |
|
metric-collector |
mirantis.azurecr.io/stacklight/metric-collector:v0.1-20230330133800 |
|
metricbeat Updated |
mirantis.azurecr.io/stacklight/metricbeat:7.12.1-20230519023010 |
|
node-exporter |
mirantis.azurecr.io/stacklight/node-exporter:v1.5.0 |
|
opensearch Updated |
mirantis.azurecr.io/stacklight/opensearch:1-20230523124159 |
|
opensearch-dashboards Updated |
mirantis.azurecr.io/stacklight/opensearch-dashboards:1-20230519023015 |
|
pgbouncer Updated |
mirantis.azurecr.io/stacklight/pgbouncer:1-20230519023020 |
|
prometheus |
mirantis.azurecr.io/stacklight/prometheus:v2.40.7 |
|
prometheus-es-exporter Updated |
mirantis.azurecr.io/stacklight/prometheus-es-exporter:v0.14.0-20230519023018 |
|
prometheus-msteams |
mirantis.azurecr.io/stacklight/prometheus-msteams:v1.5.2 |
|
prometheus-patroni-exporter Updated |
mirantis.azurecr.io/stacklight/prometheus-patroni-exporter:0.0.1-20230519023019 |
|
prometheus-postgres-exporter |
mirantis.azurecr.io/stacklight/prometheus-postgres-exporter:v0.12.0 |
|
prometheus-relay Updated |
mirantis.azurecr.io/stacklight/prometheus-relay:v0.4-20230519023015 |
|
sf-notifier Updated |
mirantis.azurecr.io/stacklight/sf-notifier:v0.3-20230523144230 |
|
sf-reporter |
mirantis.azurecr.io/stacklight/sf-reporter:v0.1-20230403174259 |
|
spilo Updated |
mirantis.azurecr.io/stacklight/spilo:13-2.1p9-20230519023017 |
|
stacklight-toolkit Updated |
mirantis.azurecr.io/stacklight/stacklight-toolkit:20230519023016 |
|
telegraf |
mirantis.azurecr.io/stacklight/telegraf:v1.9.1-20230519023009 Updated |
|
mirantis.azurecr.io/stacklight/telegraf:1.26-20230523091335 Updated |
||
telemeter Updated |
mirantis.azurecr.io/stacklight/telemeter:4.4-20230519023012 |
|
telemeter-token-auth Updated |
mirantis.azurecr.io/stacklight/telemeter-token-auth:v0.1-20230519023015 |
|
yq |
mirantis.azurecr.io/stacklight/yq:4.33.2 |
Unchanged as compared to 12.7.0
Artifact |
Component |
Path |
|---|---|---|
Debian repositories |
System packages |
|
http://mirror.mirantis.com/kaas/kubernetes-extra-rhel7-0.0.7/ |
||
https://mirror.mirantis.com/kaas/ubuntu-2023-01-26-014412.target.txt |
||
MCR repositories |
MCR |
https://repos.mirantis.com/ubuntu/dists/bionic/pool/stable-20.10/ |
Target ubuntu system |
Ubuntu |
https://binary.mirantis.com/bm/bin/efi/ubuntu/tgz-focal-20230126185755 |
https://binary.mirantis.com/bm/bin/efi/ubuntu/tgz-bionic-5.4-20230126183021 |
This section includes release notes for the patch Cluster release 12.7.3 that is introduced in the Container Cloud patch release 2.23.4 and is based on the Cluster release 12.7.0. This patch Cluster release supports MOSK 23.1.3.
For details on MOSK 23.1.3, see Release notes 23.1.3
For CVE fixes delivered with this patch Cluster release, see security notes for 2.23.4
For CVE fixes delivered with the previous patch Cluster releases, see security notes for 2.23.3 and 2.23.2
For details on patch release delivery, see Patch releases
This section lists the components artifacts of the Cluster release 12.7.3.
Note
The components that are newly added, updated, deprecated, or removed
as compared to the previous release version, are marked
with a corresponding superscript,
for example, lcm-ansible Updated.
Artifact |
Component |
Path |
|---|---|---|
Helm chart |
ceph-controller Updated |
https://binary.mirantis.com/ceph/helm/ceph-operator-1.0.0-mcc-2.23.4-4.tgz |
Docker images |
ceph |
mirantis.azurecr.io/ceph/ceph:v16.2.11-cve-4 |
ceph-controller Updated |
mirantis.azurecr.io/ceph/mcp/ceph-controller:2.23.4-0 |
|
cephcsi Updated |
mirantis.azurecr.io/mirantis/cephcsi:v3.7.2-cve-4 |
|
cephcsi-attacher |
mirantis.azurecr.io/mirantis/cephcsi-attacher:v4.2.0-cve-2 |
|
cephcsi-provisioner |
mirantis.azurecr.io/mirantis/cephcsi-provisioner:v3.4.0-cve-2 |
|
cephcsi-registrar |
mirantis.azurecr.io/mirantis/cephcsi-registrar:v2.7.0-cve-2 |
|
cephcsi-resizer |
mirantis.azurecr.io/mirantis/cephcsi-resizer:v1.7.0-cve-2 |
|
cephcsi-snapshotter |
mirantis.azurecr.io/mirantis/cephcsi-snapshotter:v6.2.1-cve-2 |
|
rook |
mirantis.azurecr.io/ceph/rook:v1.10.10-10 |
Artifact |
Component |
Path |
|---|---|---|
Binaries |
lcm-ansible |
https://binary.mirantis.com/lcm/bin/lcm-ansible/v0.21.0-39-g5b167de/lcm-ansible.tar.gz |
lcm-agent Updated |
||
Helm charts Updated |
helm-controller |
https://binary.mirantis.com/core/helm/helm-controller-1.36.26.tgz |
managed-lcm-api |
https://binary.mirantis.com/core/helm/managed-lcm-api-1.36.26.tgz |
|
Docker images Updated |
helm-controller |
mirantis.azurecr.io/core/helm-controller:1.36.26 |
Artifact |
Component |
Path |
|---|---|---|
Helm charts |
alerta |
https://binary.mirantis.com/stacklight/helm/alerta-0.1.0-mcp-29.tgz |
alertmanager-webhook-servicenow |
https://binary.mirantis.com/stacklight/helm/alertmanager-webhook-servicenow-0.2.0-mcp-4.tgz |
|
cadvisor |
https://binary.mirantis.com/stacklight/helm/cadvisor-0.1.0-mcp-2.tgz |
|
cerebro |
https://binary.mirantis.com/stacklight/helm/cerebro-0.1.0-mcp-2.tgz |
|
elasticsearch-curator |
https://binary.mirantis.com/stacklight/helm/elasticsearch-curator-1.5.0-mcp-10.tgz |
|
elasticsearch-exporter |
https://binary.mirantis.com/stacklight/helm/elasticsearch-exporter-1.2.0-mcp-6.tgz |
|
fluentd |
https://binary.mirantis.com/stacklight/helm/fluentd-2.0.3-mcp-49.tgz |
|
fluentd-logs |
https://binary.mirantis.com/stacklight/helm/fluentd-logs-0.1.0-mcp-170.tgz |
|
grafana |
https://binary.mirantis.com/stacklight/helm/grafana-3.3.10-mcp-200.tgz |
|
iam-proxy |
||
metric-collector |
https://binary.mirantis.com/stacklight/helm/metric-collector-0.3.0-mcp-10.tgz |
|
metricbeat |
https://binary.mirantis.com/stacklight/helm/metricbeat-1.7.1-mcp-16.tgz |
|
opensearch |
https://binary.mirantis.com/stacklight/helm/opensearch-0.1.0-mcp-52.tgz |
|
opensearch-dashboards |
https://binary.mirantis.com/stacklight/helm/opensearch-dashboards-0.1.0-mcp-44.tgz |
|
patroni |
https://binary.mirantis.com/stacklight/helm/patroni-0.15.1-mcp-48.tgz |
|
prometheus |
https://binary.mirantis.com/stacklight/helm/prometheus-8.11.4-mcp-229.tgz |
|
prometheus-blackbox-exporter |
https://binary.mirantis.com/stacklight/helm/prometheus-blackbox-exporter-0.3.0-mcp-11.tgz |
|
prometheus-es-exporter |
https://binary.mirantis.com/stacklight/helm/prometheus-es-exporter-1.0.0-mcp-11.tgz |
|
prometheus-msteams |
https://binary.mirantis.com/stacklight/helm/prometheus-msteams-0.1.0-mcp-9.tgz |
|
sf-notifier |
https://binary.mirantis.com/stacklight/helm/sf-notifier-0.2.0-mcp-4.tgz |
|
sf-reporter |
https://binary.mirantis.com/stacklight/helm/sf-reporter-0.2.0-mcp-6.tgz |
|
stacklight Updated |
https://binary.mirantis.com/stacklight/helm/stacklight-0.11.7.tgz |
|
telegraf-ds |
https://binary.mirantis.com/stacklight/helm/telegraf-ds-1.1.5-mcp-29.tgz |
|
telegraf-s |
https://binary.mirantis.com/stacklight/helm/telegraf-s-1.1.5-mcp-30.tgz |
|
telemeter-client |
https://binary.mirantis.com/stacklight/helm/telemeter-client-0.2.0-mcp-7.tgz |
|
telemeter-server |
https://binary.mirantis.com/stacklight/helm/telemeter-server-0.2.0-mcp-7.tgz |
|
Docker images |
alerta-web Updated |
mirantis.azurecr.io/stacklight/alerta-web:9-20230505023008 |
alertmanager |
mirantis.azurecr.io/stacklight/alertmanager:v0.25.0 |
|
alertmanager-webhook-servicenow Updated |
mirantis.azurecr.io/stacklight/alertmanager-webhook-servicenow:v0.1-20230505023012 |
|
alpine-utils Updated |
mirantis.azurecr.io/stacklight/alpine-utils:1-20230505023019 |
|
blackbox-exporter |
mirantis.azurecr.io/stacklight/blackbox-exporter:v0.23.0 |
|
cadvisor Updated |
mirantis.azurecr.io/stacklight/cadvisor:v0.47-20230505023018 |
|
cerebro Updated |
mirantis.azurecr.io/stacklight/cerebro:v0.9-20230505023015 |
|
configmap-reload |
mirantis.azurecr.io/stacklight/configmap-reload:v0.8.0 |
|
curator |
mirantis.azurecr.io/stacklight/curator:5.7.6-20230404082402 |
|
elasticsearch_exporter |
mirantis.azurecr.io/stacklight/elasticsearch_exporter:1.0.2 |
|
fluentd Updated |
mirantis.azurecr.io/stacklight/fluentd:1.15-20230428063240 |
|
grafana Updated |
mirantis.azurecr.io/stacklight/grafana:9.4.9 |
|
grafana-image-renderer |
mirantis.azurecr.io/stacklight/grafana-image-renderer:3-20230418140825 |
|
k8s-sidecar Updated |
mirantis.azurecr.io/stacklight/k8s-sidecar:1.22-20230505023018 |
|
kube-state-metrics |
mirantis.azurecr.io/stacklight/kube-state-metrics:v2.8.2 |
|
kubectl Updated |
mirantis.azurecr.io/stacklight/kubectl:1.22-20230505023017 |
|
metric-collector |
mirantis.azurecr.io/stacklight/metric-collector:v0.1-20230330133800 |
|
metricbeat Updated |
mirantis.azurecr.io/stacklight/metricbeat:7.12.1-20230505023009 |
|
node-exporter |
mirantis.azurecr.io/stacklight/node-exporter:v1.5.0 |
|
opensearch Updated |
mirantis.azurecr.io/stacklight/opensearch:1-20230505023014 |
|
opensearch-dashboards Updated |
mirantis.azurecr.io/stacklight/opensearch-dashboards:1-20230505023013 |
|
pgbouncer Updated |
mirantis.azurecr.io/stacklight/pgbouncer:1-20230505023019 |
|
prometheus |
mirantis.azurecr.io/stacklight/prometheus:v2.40.7 |
|
prometheus-es-exporter Updated |
mirantis.azurecr.io/stacklight/prometheus-es-exporter:v0.14.0-20230505023016 |
|
prometheus-msteams |
mirantis.azurecr.io/stacklight/prometheus-msteams:v1.5.2 |
|
prometheus-patroni-exporter Updated |
mirantis.azurecr.io/stacklight/prometheus-patroni-exporter:0.0.1-20230505023017 |
|
prometheus-postgres-exporter |
mirantis.azurecr.io/stacklight/prometheus-postgres-exporter:v0.12.0 |
|
prometheus-relay Updated |
mirantis.azurecr.io/stacklight/prometheus-relay:v0.4-20230505023012 |
|
sf-notifier Updated |
mirantis.azurecr.io/stacklight/sf-notifier:v0.3-20230505023013 |
|
sf-reporter |
mirantis.azurecr.io/stacklight/sf-reporter:v0.1-20230403174259 |
|
spilo |
mirantis.azurecr.io/stacklight/spilo:13-2.1p9-20230404125347 |
|
stacklight-toolkit Updated |
mirantis.azurecr.io/stacklight/stacklight-toolkit:20230505023015 |
|
telegraf |
mirantis.azurecr.io/stacklight/telegraf:v1.9.1-20230505023009 Updated |
|
mirantis.azurecr.io/stacklight/telegraf:1.26.1-20230505023017 Updated |
||
telemeter Updated |
mirantis.azurecr.io/stacklight/telemeter:4.4-20230505023010 |
|
telemeter-token-auth Updated |
mirantis.azurecr.io/stacklight/telemeter-token-auth:v0.1-20230505023010 |
|
yq |
mirantis.azurecr.io/stacklight/yq:4.33.2 |
Unchanged as compared to 12.7.0
Artifact |
Component |
Path |
|---|---|---|
Debian repositories |
System packages |
|
http://mirror.mirantis.com/kaas/kubernetes-extra-rhel7-0.0.7/ |
||
https://mirror.mirantis.com/kaas/ubuntu-2023-01-26-014412.target.txt |
||
MCR repositories |
MCR |
https://repos.mirantis.com/ubuntu/dists/bionic/pool/stable-20.10/ |
Target ubuntu system |
Ubuntu |
https://binary.mirantis.com/bm/bin/efi/ubuntu/tgz-focal-20230126185755 |
https://binary.mirantis.com/bm/bin/efi/ubuntu/tgz-bionic-5.4-20230126183021 |
This section includes release notes for the patch Cluster release 12.7.2 that is introduced in the Container Cloud patch release 2.23.3 and is based on the Cluster release 12.7.0. This patch Cluster release supports MOSK 23.1.2.
For details on MOSK 23.1.2, see Release notes 23.1.2
For CVE fixes delivered with this patch Cluster release, see security notes for 2.23.3
For CVE fixes delivered with the previous patch Cluster release, see security notes for 2.23.2
For details on patch release delivery, see Patch releases
This section lists the components artifacts of the Cluster release 12.7.2.
Note
The components that are newly added, updated, deprecated, or removed
as compared to the previous release version, are marked
with a corresponding superscript,
for example, lcm-ansible Updated.
Artifact |
Component |
Path |
|---|---|---|
Helm chart |
ceph-controller Updated |
https://binary.mirantis.com/ceph/helm/ceph-operator-1.0.0-mcc-2.23.3-2.tgz |
Docker images Updated |
ceph |
mirantis.azurecr.io/ceph/ceph:v16.2.11-cve-4 |
ceph-controller |
mirantis.azurecr.io/ceph/mcp/ceph-controller:2.23.3-0 |
|
cephcsi |
mirantis.azurecr.io/mirantis/cephcsi:v3.7.2-cve-3 |
|
cephcsi-attacher |
mirantis.azurecr.io/mirantis/cephcsi-attacher:v4.2.0-cve-2 |
|
cephcsi-provisioner |
mirantis.azurecr.io/mirantis/cephcsi-provisioner:v3.4.0-cve-2 |
|
cephcsi-registrar |
mirantis.azurecr.io/mirantis/cephcsi-registrar:v2.7.0-cve-2 |
|
cephcsi-resizer |
mirantis.azurecr.io/mirantis/cephcsi-resizer:v1.7.0-cve-2 |
|
cephcsi-snapshotter |
mirantis.azurecr.io/mirantis/cephcsi-snapshotter:v6.2.1-cve-2 |
|
rook |
mirantis.azurecr.io/ceph/rook:v1.10.10-10 |
Artifact |
Component |
Path |
|---|---|---|
Binaries |
lcm-ansible |
https://binary.mirantis.com/lcm/bin/lcm-ansible/v0.21.0-39-g5b167de/lcm-ansible.tar.gz |
lcm-agent Updated |
||
Helm charts Updated |
helm-controller |
https://binary.mirantis.com/core/helm/helm-controller-1.36.23.tgz |
managed-lcm-api |
https://binary.mirantis.com/core/helm/managed-lcm-api-1.36.23.tgz |
|
Docker images |
helm-controller Updated |
mirantis.azurecr.io/core/helm-controller:1.36.23 |
Artifact |
Component |
Path |
|---|---|---|
Helm charts |
alerta |
https://binary.mirantis.com/stacklight/helm/alerta-0.1.0-mcp-29.tgz |
alertmanager-webhook-servicenow |
https://binary.mirantis.com/stacklight/helm/alertmanager-webhook-servicenow-0.2.0-mcp-4.tgz |
|
cadvisor |
https://binary.mirantis.com/stacklight/helm/cadvisor-0.1.0-mcp-2.tgz |
|
cerebro |
https://binary.mirantis.com/stacklight/helm/cerebro-0.1.0-mcp-2.tgz |
|
elasticsearch-curator |
https://binary.mirantis.com/stacklight/helm/elasticsearch-curator-1.5.0-mcp-10.tgz |
|
elasticsearch-exporter |
https://binary.mirantis.com/stacklight/helm/elasticsearch-exporter-1.2.0-mcp-6.tgz |
|
fluentd |
https://binary.mirantis.com/stacklight/helm/fluentd-2.0.3-mcp-49.tgz |
|
fluentd-logs |
https://binary.mirantis.com/stacklight/helm/fluentd-logs-0.1.0-mcp-170.tgz |
|
grafana Updated |
https://binary.mirantis.com/stacklight/helm/grafana-3.3.10-mcp-200.tgz |
|
iam-proxy |
||
metric-collector |
https://binary.mirantis.com/stacklight/helm/metric-collector-0.3.0-mcp-10.tgz |
|
metricbeat |
https://binary.mirantis.com/stacklight/helm/metricbeat-1.7.1-mcp-16.tgz |
|
opensearch |
https://binary.mirantis.com/stacklight/helm/opensearch-0.1.0-mcp-52.tgz |
|
opensearch-dashboards |
https://binary.mirantis.com/stacklight/helm/opensearch-dashboards-0.1.0-mcp-44.tgz |
|
patroni |
https://binary.mirantis.com/stacklight/helm/patroni-0.15.1-mcp-48.tgz |
|
prometheus |
https://binary.mirantis.com/stacklight/helm/prometheus-8.11.4-mcp-229.tgz |
|
prometheus-blackbox-exporter |
https://binary.mirantis.com/stacklight/helm/prometheus-blackbox-exporter-0.3.0-mcp-11.tgz |
|
prometheus-es-exporter |
https://binary.mirantis.com/stacklight/helm/prometheus-es-exporter-1.0.0-mcp-11.tgz |
|
prometheus-msteams |
https://binary.mirantis.com/stacklight/helm/prometheus-msteams-0.1.0-mcp-9.tgz |
|
sf-notifier |
https://binary.mirantis.com/stacklight/helm/sf-notifier-0.2.0-mcp-4.tgz |
|
sf-reporter |
https://binary.mirantis.com/stacklight/helm/sf-reporter-0.2.0-mcp-6.tgz |
|
stacklight Updated |
https://binary.mirantis.com/stacklight/helm/stacklight-0.11.6.tgz |
|
telegraf-ds |
https://binary.mirantis.com/stacklight/helm/telegraf-ds-1.1.5-mcp-29.tgz |
|
telegraf-s |
https://binary.mirantis.com/stacklight/helm/telegraf-s-1.1.5-mcp-30.tgz |
|
telemeter-client |
https://binary.mirantis.com/stacklight/helm/telemeter-client-0.2.0-mcp-7.tgz |
|
telemeter-server |
https://binary.mirantis.com/stacklight/helm/telemeter-server-0.2.0-mcp-7.tgz |
|
Docker images |
alerta-web Updated |
mirantis.azurecr.io/stacklight/alerta-web:9-20230414023009 |
alertmanager |
mirantis.azurecr.io/stacklight/alertmanager:v0.25.0 |
|
alertmanager-webhook-servicenow Updated |
mirantis.azurecr.io/stacklight/alertmanager-webhook-servicenow:v0.1-20230414023012 |
|
alpine-utils Updated |
mirantis.azurecr.io/stacklight/alpine-utils:1-20230414023019 |
|
blackbox-exporter |
mirantis.azurecr.io/stacklight/blackbox-exporter:v0.23.0 |
|
cadvisor Updated |
mirantis.azurecr.io/stacklight/cadvisor:v0.47-20230414023019 |
|
cerebro |
mirantis.azurecr.io/stacklight/cerebro:v0.9-20230316081755 |
|
configmap-reload |
mirantis.azurecr.io/stacklight/configmap-reload:v0.8.0 |
|
curator |
mirantis.azurecr.io/stacklight/curator:5.7.6-20230404082402 |
|
elasticsearch_exporter |
mirantis.azurecr.io/stacklight/elasticsearch_exporter:1.0.2 |
|
fluentd Updated |
mirantis.azurecr.io/stacklight/fluentd:1.15-20230414023011 |
|
grafana |
mirantis.azurecr.io/stacklight/grafana:9.4.7 |
|
grafana-image-renderer Updated |
mirantis.azurecr.io/stacklight/grafana-image-renderer:3-20230418140825 |
|
k8s-sidecar Updated |
mirantis.azurecr.io/stacklight/k8s-sidecar:1.22-20230414023019 |
|
kube-state-metrics Updated |
mirantis.azurecr.io/stacklight/kube-state-metrics:v2.8.2 |
|
kubectl Updated |
mirantis.azurecr.io/stacklight/kubectl:1.22-20230414023019 |
|
metric-collector |
mirantis.azurecr.io/stacklight/metric-collector:v0.1-20230330133800 |
|
metricbeat Updated |
mirantis.azurecr.io/stacklight/metricbeat:7.12.1-20230417102535 |
|
node-exporter |
mirantis.azurecr.io/stacklight/node-exporter:v1.5.0 |
|
opensearch Updated |
mirantis.azurecr.io/stacklight/opensearch:1-20230414023016 |
|
opensearch-dashboards Updated |
mirantis.azurecr.io/stacklight/opensearch-dashboards:1-20230414023010 |
|
pgbouncer Updated |
mirantis.azurecr.io/stacklight/pgbouncer:1-20230414023019 |
|
prometheus |
mirantis.azurecr.io/stacklight/prometheus:v2.40.7 |
|
prometheus-es-exporter Updated |
mirantis.azurecr.io/stacklight/prometheus-es-exporter:v0.14.0-20230414023017 |
|
prometheus-msteams Updated |
mirantis.azurecr.io/stacklight/prometheus-msteams:v1.5.2 |
|
prometheus-patroni-exporter Updated |
mirantis.azurecr.io/stacklight/prometheus-patroni-exporter:0.0.1-20230414023019 |
|
prometheus-postgres-exporter Updated |
mirantis.azurecr.io/stacklight/prometheus-postgres-exporter:v0.12.0 |
|
prometheus-relay Updated |
mirantis.azurecr.io/stacklight/prometheus-relay:v0.4-20230414023019 |
|
sf-notifier Updated |
mirantis.azurecr.io/stacklight/sf-notifier:v0.3-20230414023014 |
|
sf-reporter |
mirantis.azurecr.io/stacklight/sf-reporter:v0.1-20230403174259 |
|
spilo |
mirantis.azurecr.io/stacklight/spilo:13-2.1p9-20230404125347 |
|
stacklight-toolkit Updated |
mirantis.azurecr.io/stacklight/stacklight-toolkit:20230414023017 |
|
telegraf |
mirantis.azurecr.io/stacklight/telegraf:v1.9.1-20230414023010 Updated |
|
mirantis.azurecr.io/stacklight/telegraf:1.26.1-20230414023019 Updated |
||
telemeter Updated |
mirantis.azurecr.io/stacklight/telemeter:4.4-20230414023013 |
|
telemeter-token-auth Updated |
mirantis.azurecr.io/stacklight/telemeter-token-auth:v0.1-20230414023013 |
|
yq Updated |
mirantis.azurecr.io/stacklight/yq:4.33.2 |
Unchanged as compared to 12.7.0
Artifact |
Component |
Path |
|---|---|---|
Debian repositories |
System packages |
|
http://mirror.mirantis.com/kaas/kubernetes-extra-rhel7-0.0.7/ |
||
https://mirror.mirantis.com/kaas/ubuntu-2023-01-26-014412.target.txt |
||
MCR repositories |
MCR |
https://repos.mirantis.com/ubuntu/dists/bionic/pool/stable-20.10/ |
Target ubuntu system |
Ubuntu |
https://binary.mirantis.com/bm/bin/efi/ubuntu/tgz-focal-20230126185755 |
https://binary.mirantis.com/bm/bin/efi/ubuntu/tgz-bionic-5.4-20230126183021 |
This section outlines release notes for the patch Cluster release 12.7.1 that is introduced in the Container Cloud patch release 2.23.2 and is based on the Cluster release 12.7.0. This patch Cluster release supports MOSK 23.1.1.
For details on MOSK 23.1.1, see Release notes 23.1.1
For the list of CVE fixes, see 2.23.2
For details on patch release delivery, see Patch releases
This section lists the components artifacts of the Cluster release 12.7.1. For artifacts of the Container Cloud release, see Container Cloud release 2.23.2.
Note
The components that are newly added, updated, deprecated, or removed
as compared to the previous release version, are marked
with a corresponding superscript,
for example, lcm-ansible Updated.
Artifact |
Component |
Path |
|---|---|---|
Helm chart |
ceph-controller Updated |
https://binary.mirantis.com/ceph/helm/ceph-operator-1.0.0-mcc-2.23.2-7.tgz |
Docker images Updated |
ceph |
mirantis.azurecr.io/ceph/ceph:v16.2.11-cve-2 |
ceph-controller |
mirantis.azurecr.io/ceph/mcp/ceph-controller:2.23.2-6 |
|
cephcsi |
mirantis.azurecr.io/mirantis/cephcsi:v3.7.2-cve-1 |
|
cephcsi-attacher |
mirantis.azurecr.io/mirantis/cephcsi-attacher:v4.2.0-cve-1 |
|
cephcsi-provisioner |
mirantis.azurecr.io/mirantis/cephcsi-provisioner:v3.4.0-cve-1 |
|
cephcsi-registrar |
mirantis.azurecr.io/mirantis/cephcsi-registrar:v2.7.0-cve-1 |
|
cephcsi-resizer |
mirantis.azurecr.io/mirantis/cephcsi-resizer:v1.7.0-cve-1 |
|
cephcsi-snapshotter |
mirantis.azurecr.io/mirantis/cephcsi-snapshotter:v6.2.1-cve-1 |
|
rook |
mirantis.azurecr.io/ceph/rook:v1.10.10-9 |
Artifact |
Component |
Path |
|---|---|---|
Binaries |
lcm-ansible |
https://binary.mirantis.com/lcm/bin/lcm-ansible/v0.21.0-39-g5b167de/lcm-ansible.tar.gz |
lcm-agent Updated |
||
Helm charts Updated |
helm-controller |
https://binary.mirantis.com/core/helm/helm-controller-1.36.14.tgz |
managed-lcm-api |
https://binary.mirantis.com/core/helm/managed-lcm-api-1.36.14.tgz |
|
Docker images |
helm-controller Updated |
mirantis.azurecr.io/core/helm-controller:1.36.14 |
Artifact |
Component |
Path |
|---|---|---|
Helm charts |
alerta |
https://binary.mirantis.com/stacklight/helm/alerta-0.1.0-mcp-29.tgz |
alertmanager-webhook-servicenow |
https://binary.mirantis.com/stacklight/helm/alertmanager-webhook-servicenow-0.2.0-mcp-4.tgz |
|
cadvisor |
https://binary.mirantis.com/stacklight/helm/cadvisor-0.1.0-mcp-2.tgz |
|
cerebro |
https://binary.mirantis.com/stacklight/helm/cerebro-0.1.0-mcp-2.tgz |
|
elasticsearch-curator |
https://binary.mirantis.com/stacklight/helm/elasticsearch-curator-1.5.0-mcp-10.tgz |
|
elasticsearch-exporter |
https://binary.mirantis.com/stacklight/helm/elasticsearch-exporter-1.2.0-mcp-6.tgz |
|
fluentd |
https://binary.mirantis.com/stacklight/helm/fluentd-2.0.3-mcp-49.tgz |
|
fluentd-logs |
https://binary.mirantis.com/stacklight/helm/fluentd-logs-0.1.0-mcp-170.tgz |
|
grafana |
https://binary.mirantis.com/stacklight/helm/grafana-3.3.10-mcp-194.tgz |
|
iam-proxy Updated |
||
metric-collector |
https://binary.mirantis.com/stacklight/helm/metric-collector-0.3.0-mcp-10.tgz |
|
metricbeat |
https://binary.mirantis.com/stacklight/helm/metricbeat-1.7.1-mcp-16.tgz |
|
opensearch |
https://binary.mirantis.com/stacklight/helm/opensearch-0.1.0-mcp-52.tgz |
|
opensearch-dashboards |
https://binary.mirantis.com/stacklight/helm/opensearch-dashboards-0.1.0-mcp-44.tgz |
|
patroni |
https://binary.mirantis.com/stacklight/helm/patroni-0.15.1-mcp-48.tgz |
|
prometheus |
https://binary.mirantis.com/stacklight/helm/prometheus-8.11.4-mcp-229.tgz |
|
prometheus-blackbox-exporter |
https://binary.mirantis.com/stacklight/helm/prometheus-blackbox-exporter-0.3.0-mcp-11.tgz |
|
prometheus-es-exporter |
https://binary.mirantis.com/stacklight/helm/prometheus-es-exporter-1.0.0-mcp-11.tgz |
|
prometheus-msteams |
https://binary.mirantis.com/stacklight/helm/prometheus-msteams-0.1.0-mcp-9.tgz |
|
sf-notifier |
https://binary.mirantis.com/stacklight/helm/sf-notifier-0.2.0-mcp-4.tgz |
|
sf-reporter |
https://binary.mirantis.com/stacklight/helm/sf-reporter-0.2.0-mcp-6.tgz |
|
stacklight Updated |
https://binary.mirantis.com/stacklight/helm/stacklight-0.11.5.tgz |
|
telegraf-ds |
https://binary.mirantis.com/stacklight/helm/telegraf-ds-1.1.5-mcp-29.tgz |
|
telegraf-s |
https://binary.mirantis.com/stacklight/helm/telegraf-s-1.1.5-mcp-30.tgz |
|
telemeter-client |
https://binary.mirantis.com/stacklight/helm/telemeter-client-0.2.0-mcp-7.tgz |
|
telemeter-server |
https://binary.mirantis.com/stacklight/helm/telemeter-server-0.2.0-mcp-7.tgz |
|
Docker images |
alerta-web Updated |
mirantis.azurecr.io/stacklight/alerta-web:8-20230331023009 |
alertmanager |
mirantis.azurecr.io/stacklight/alertmanager:v0.25.0 |
|
alertmanager-webhook-servicenow Updated |
mirantis.azurecr.io/stacklight/alertmanager-webhook-servicenow:v0.1-20230331023013 |
|
alpine-utils Updated |
mirantis.azurecr.io/stacklight/alpine-utils:1-20230331023020 |
|
blackbox-exporter |
mirantis.azurecr.io/stacklight/blackbox-exporter:v0.23.0 |
|
cadvisor Updated |
mirantis.azurecr.io/stacklight/cadvisor:v0.47-20230331023021 |
|
cerebro Updated |
mirantis.azurecr.io/stacklight/cerebro:v0.9-20230316081755 |
|
configmap-reload |
mirantis.azurecr.io/stacklight/configmap-reload:v0.8.0 |
|
curator Updated |
mirantis.azurecr.io/stacklight/curator:5.7.6-20230404082402 |
|
elasticsearch_exporter |
mirantis.azurecr.io/stacklight/elasticsearch_exporter:1.0.2 |
|
fluentd Updated |
mirantis.azurecr.io/stacklight/fluentd:1.15-20230331023012 |
|
grafana Updated |
mirantis.azurecr.io/stacklight/grafana:9.4.7 |
|
grafana-image-renderer Updated |
mirantis.azurecr.io/stacklight/grafana-image-renderer:3-20230310145607 |
|
k8s-sidecar Updated |
mirantis.azurecr.io/stacklight/k8s-sidecar:1.22-20230331023020 |
|
kube-state-metrics |
mirantis.azurecr.io/stacklight/kube-state-metrics:v2.7.0 |
|
kubectl Updated |
mirantis.azurecr.io/stacklight/kubectl:1.22-20230331023019 |
|
metric-collector Updated |
mirantis.azurecr.io/stacklight/metric-collector:v0.1-20230330133800 |
|
metricbeat Updated |
mirantis.azurecr.io/stacklight/metricbeat:7.12.1-20230331123540 |
|
node-exporter |
mirantis.azurecr.io/stacklight/node-exporter:v1.5.0 |
|
opensearch Updated |
mirantis.azurecr.io/stacklight/opensearch:1-20230403060750 |
|
opensearch-dashboards Updated |
mirantis.azurecr.io/stacklight/opensearch-dashboards:1-20230403060759 |
|
pgbouncer Updated |
mirantis.azurecr.io/stacklight/pgbouncer:1-20230331023020 |
|
prometheus |
mirantis.azurecr.io/stacklight/prometheus:v2.40.7 |
|
prometheus-es-exporter Updated |
mirantis.azurecr.io/stacklight/prometheus-es-exporter:v0.14.0-20230331023015 |
|
prometheus-msteams Updated |
mirantis.azurecr.io/stacklight/prometheus-msteams:v1.5.1 |
|
prometheus-patroni-exporter Updated |
mirantis.azurecr.io/stacklight/prometheus-patroni-exporter:0.0.1-20230331023020 |
|
prometheus-postgres-exporter |
mirantis.azurecr.io/stacklight/prometheus-postgres-exporter:v0.9.0 |
|
prometheus-relay Updated |
mirantis.azurecr.io/stacklight/prometheus-relay:v0.4-20230331023018 |
|
sf-notifier Updated |
mirantis.azurecr.io/stacklight/sf-notifier:v0.3-20230331023014 |
|
sf-reporter Updated |
mirantis.azurecr.io/stacklight/sf-reporter:v0.1-20230403174259 |
|
spilo Updated |
mirantis.azurecr.io/stacklight/spilo:13-2.1p9-20230404125347 |
|
stacklight-toolkit Updated |
mirantis.azurecr.io/stacklight/stacklight-toolkit:20230331023016 |
|
telegraf |
mirantis.azurecr.io/stacklight/telegraf:v1.9.1-20230331023009 Updated |
|
mirantis.azurecr.io/stacklight/telegraf:1.23.4-20230317023017 Updated |
||
telemeter Updated |
mirantis.azurecr.io/stacklight/telemeter:4.4-20230331023013 |
|
telemeter-token-auth Updated |
mirantis.azurecr.io/stacklight/telemeter-token-auth:v0.1-20230331023015 |
|
yq Updated |
mirantis.azurecr.io/stacklight/yq:4.32.2 |
Unchanged as compared to 12.7.0
Artifact |
Component |
Path |
|---|---|---|
Debian repositories |
System packages |
|
http://mirror.mirantis.com/kaas/kubernetes-extra-rhel7-0.0.7/ |
||
https://mirror.mirantis.com/kaas/ubuntu-2023-01-26-014412.target.txt |
||
MCR repositories |
MCR |
https://repos.mirantis.com/ubuntu/dists/bionic/pool/stable-20.10/ |
Target ubuntu system |
Ubuntu |
https://binary.mirantis.com/bm/bin/efi/ubuntu/tgz-focal-20230126185755 |
https://binary.mirantis.com/bm/bin/efi/ubuntu/tgz-bionic-5.4-20230126183021 |
This section outlines release notes for the Cluster release 12.7.0 that is introduced in the Container Cloud release 2.23.1. This Cluster release is based on the Cluster release 11.7.0.
The Cluster release 12.7.0 supports:
Mirantis OpenStack for Kubernetes (MOSK) 23.1. For details, see Release notes 23.1.
Mirantis Kubernetes Engine (MKE) 3.5.7. For details, see MKE Release Notes.
Mirantis Container Runtime (MCR) 20.10.13. For details, see MCR Release Notes.
Kubernetes 1.21.
For the list of known and resolved issues, refer to the Container Cloud release 2.23.0 section.
This section outlines new features implemented in the Cluster release 12.7.0 that is introduced in the Container Cloud release 2.23.1.
Calculation of storage retention time using OpenSearch and Prometheus panels
‘MCC Applications Performance’ Grafana dashboard for StackLight
Updated the Mirantis Kubernetes Engine (MKE) patch release from 3.5.5 to 3.5.7. The MKE update occurs automatically when you update your managed cluster.
Upgraded Ceph major version from Octopus 15.2.17 to Pacific 16.2.11 with an automatic upgrade of Ceph components on existing managed clusters during the Cluster version update.
Caution
Since Ceph Pacific, while mounting an RBD or CephFS volume, CSI
drivers do not propagate the 777 permission on the mount path.
Increased the default number of Ceph Managers deployed on a Ceph cluster to two, active and stand-by, to improve fault tolerance and HA.
On existing clusters, the second Ceph Manager deploys automatically after a managed cluster update.
Note
Mirantis recommends labeling at least 3 Ceph nodes with the mgr
role that equals the default number of Ceph nodes for the mon role.
In such configuration, one back-up Ceph node will be available to redeploy
a failed Ceph Manager in case of a server outage.
Implemented monitoring of bond interfaces for clusters based on bare metal. The number of active and configured slaves per bond is now monitored with the following alerts raising in case of issues:
BondInterfaceDownBondInterfaceSlaveDownBondInterfaceOneSlaveLeftBondInterfaceOneSlaveConfigured
Learn more
Implemented the following panels in the Grafana dashboards for OpenSearch and Prometheus that provide details on the storage usage and allow calculating the possible retention time based on provisioned storage and average usage:
OpenSearch dashboard:
Cluster > Estimated Retention
Resources > Disk
Resources > File System Used Space by Percentage
Resources > Stored Indices Disk Usage
Resources > Age of Logs
Prometheus dashboard:
Cluster > Estimated Retention
Resources > Storage
Resources > Strage by Percentage
Implemented deployment of two iam-proxy instances for the StackLight HA
setup that ensures access to HA components if one iam-proxy instance
fails. The second iam-proxy instance is automatically deployed during
cluster update on existing StackLight HA deployments.
Added the capability to forward logs to external Elasticsearch and OpenSearch
servers as the fluentd-logs output. This enhancement also expands existing
configuration options for log forwarding to syslog.
Introduced logging.externalOutputs that deprecates logging.syslog and
enables you to configure any number of outputs with more configuration
flexibility.
Learn more
Implemented the MCC Applications Performance Grafana dashboard that provides information on the Container Cloud internals work based on Golang, controller runtime, and some custom metrics. You can use it to verify performance of applications and for troubleshooting purposes.
Learn more
The following table lists the components versions of the Cluster release 12.7.0. For major components and versions of the Container Cloud release, see Container Cloud release 2.23.0.
Note
The components that are newly added, updated, deprecated, or removed
as compared to the previous release version, are marked
with a corresponding superscript,
for example, lcm-ansible Updated.
Component |
Application/Service |
Version |
|---|---|---|
Cluster orchestration |
Mirantis Kubernetes Engine Updated |
3.5.7 0 |
Container runtime |
Mirantis Container Runtime |
20.10.13 1 |
Distributed storage Updated |
Ceph |
16.2.11 (Pacific) |
Rook |
1.0.0-20230120144247 |
|
LCM |
Helm |
2.16.11-40 |
helm-controller Updated |
1.36.3 |
|
lcm-ansible Updated |
0.21.0-39-g5b167de |
|
lcm-agent Updated |
1.36.3 |
|
StackLight |
Alerta Updated |
8.5.0 |
Alertmanager Updated |
0.25.0 |
|
Alertmanager Webhook ServiceNow Updated |
0.1 |
|
Blackbox Exporter Updated |
0.23.0 |
|
cAdvisor New |
0.46.0 |
|
Cerebro Updated |
0.9.4 |
|
Elasticsearch Curator |
5.7.6 |
|
Elasticsearch Exporter |
1.0.2 |
|
Fluentd Updated |
1.15.3 |
|
Grafana Updated |
9.1.8 |
|
Grafana Image Renderer Updated |
3.6.1 |
|
kube-state-metrics New |
2.7.0 |
|
IAM Proxy |
6.0.1 |
|
Metric Collector Updated |
0.1 |
|
Metricbeat Updated |
7.10.2 |
|
Node Exporter Updated |
1.5.0 |
|
OpenSearch Updated |
1.3.7 |
|
OpenSearch Dashboards Updated |
1.3.7 |
|
Prometheus Updated |
2.40.7 |
|
Prometheus ES Exporter Updated |
0.14.0 |
|
Prometheus MS Teams |
1.4.2 |
|
Prometheus Patroni Exporter Updated |
0.0.1 |
|
Prometheus Postgres Exporter |
0.9.0 |
|
Prometheus Relay Updated |
0.4 |
|
sf-notifier Updated |
0.3 |
|
sf-reporter Updated |
0.1 |
|
Spilo Updated |
13-2.1p9 |
|
Telegraf |
1.9.1 Updated |
|
1.23.4 Updated |
||
Telemeter Updated |
4.4 |
- 0
For the Mirantis Kubernetes Engine (MKE) release highlights and components versions, see MKE documentation: MKE release notes.
- 1
For the Mirantis Container Runtime (MCR) release highlights, see MCR documentation: MCR release notes.
This section lists the components artifacts of the Cluster release 12.7.0. For artifacts of the Container Cloud release, see Container Cloud release 2.23.0.
Note
The components that are newly added, updated, deprecated, or removed
as compared to the previous release version, are marked
with a corresponding superscript,
for example, lcm-ansible Updated.
Artifact |
Component |
Path |
|---|---|---|
Helm chart |
ceph-controller Updated |
https://binary.mirantis.com/ceph/helm/ceph-operator-1.0.0-mcc-2.23-12.tgz |
Docker images Updated |
ceph |
mirantis.azurecr.io/ceph/ceph:v16.2.11 |
ceph-controller |
mirantis.azurecr.io/ceph/mcp/ceph-controller:2.23-11 |
|
cephcsi |
mirantis.azurecr.io/ceph/cephcsi/cephcsi:v3.7.2 |
|
csi-node-driver-registrar |
mirantis.azurecr.io/ceph/k8scsi/csi-node-driver-registrar:v2.5.1 |
|
csi-provisioner |
mirantis.azurecr.io/ceph/k8scsi/csi-provisioner:v3.3.0 |
|
csi-snapshotter |
mirantis.azurecr.io/ceph/k8scsi/csi-snapshotter:v6.1.0 |
|
csi-attacher |
mirantis.azurecr.io/ceph/k8scsi/csi-attacher:v4.0.0 |
|
csi-resizer |
mirantis.azurecr.io/ceph/k8scsi/csi-resizer:v1.6.0 |
|
rook |
mirantis.azurecr.io/ceph/rook:v1.0.0-20230120144247 |
Artifact |
Component |
Path |
|---|---|---|
Binaries Updated |
lcm-ansible |
https://binary.mirantis.com/lcm/bin/lcm-ansible/v0.21.0-39-g5b167de/lcm-ansible.tar.gz |
lcm-agent |
||
Helm charts Updated |
helm-controller |
https://binary.mirantis.com/core/helm/helm-controller-1.36.3.tgz |
managed-lcm-api |
https://binary.mirantis.com/core/helm/managed-lcm-api-1.36.3.tgz |
|
Docker images |
helm-controller Updated |
mirantis.azurecr.io/core/lcm-controller:1.36.3 |
Artifact |
Component |
Path |
|---|---|---|
Helm charts |
alerta Updated |
https://binary.mirantis.com/stacklight/helm/alerta-0.1.0-mcp-29.tgz |
alertmanager-webhook-servicenow |
https://binary.mirantis.com/stacklight/helm/alertmanager-webhook-servicenow-0.2.0-mcp-4.tgz |
|
cadvisor New |
https://binary.mirantis.com/stacklight/helm/cadvisor-0.1.0-mcp-2.tgz |
|
cerebro |
https://binary.mirantis.com/stacklight/helm/cerebro-0.1.0-mcp-2.tgz |
|
elasticsearch-curator |
https://binary.mirantis.com/stacklight/helm/elasticsearch-curator-1.5.0-mcp-10.tgz |
|
elasticsearch-exporter |
https://binary.mirantis.com/stacklight/helm/elasticsearch-exporter-1.2.0-mcp-6.tgz |
|
fluentd Updated |
https://binary.mirantis.com/stacklight/helm/fluentd-2.0.3-mcp-49.tgz |
|
fluentd-logs Updated |
https://binary.mirantis.com/stacklight/helm/fluentd-logs-0.1.0-mcp-170.tgz |
|
grafana Updated |
https://binary.mirantis.com/stacklight/helm/grafana-3.3.10-mcp-194.tgz |
|
iam-proxy Updated |
||
metric-collector |
https://binary.mirantis.com/stacklight/helm/metric-collector-0.3.0-mcp-10.tgz |
|
metricbeat Updated |
https://binary.mirantis.com/stacklight/helm/metricbeat-1.7.1-mcp-16.tgz |
|
opensearch |
https://binary.mirantis.com/stacklight/helm/opensearch-0.1.0-mcp-52.tgz |
|
opensearch-dashboards Updated |
https://binary.mirantis.com/stacklight/helm/opensearch-dashboards-0.1.0-mcp-44.tgz |
|
patroni Updated |
https://binary.mirantis.com/stacklight/helm/patroni-0.15.1-mcp-48.tgz |
|
prometheus |
https://binary.mirantis.com/stacklight/helm/prometheus-8.11.4-mcp-229.tgz |
|
prometheus-blackbox-exporter |
https://binary.mirantis.com/stacklight/helm/prometheus-blackbox-exporter-0.3.0-mcp-11.tgz |
|
prometheus-es-exporter |
https://binary.mirantis.com/stacklight/helm/prometheus-es-exporter-1.0.0-mcp-11.tgz |
|
prometheus-msteams |
https://binary.mirantis.com/stacklight/helm/prometheus-msteams-0.1.0-mcp-9.tgz |
|
sf-notifier |
https://binary.mirantis.com/stacklight/helm/sf-notifier-0.2.0-mcp-4.tgz |
|
sf-reporter Updated |
https://binary.mirantis.com/stacklight/helm/sf-reporter-0.2.0-mcp-6.tgz |
|
stacklight Updated |
https://binary.mirantis.com/stacklight/helm/stacklight-0.11.3.tgz |
|
telegraf-ds |
https://binary.mirantis.com/stacklight/helm/telegraf-ds-1.1.5-mcp-29.tgz |
|
telegraf-s |
https://binary.mirantis.com/stacklight/helm/telegraf-s-1.1.5-mcp-30.tgz |
|
telemeter-client |
https://binary.mirantis.com/stacklight/helm/telemeter-client-0.2.0-mcp-7.tgz |
|
telemeter-server |
https://binary.mirantis.com/stacklight/helm/telemeter-server-0.2.0-mcp-7.tgz |
|
Docker images |
alerta-web Updated |
mirantis.azurecr.io/stacklight/alerta-web:8.5.0-20230206172055 |
alertmanager Updated |
mirantis.azurecr.io/stacklight/alertmanager:v0.25.0 |
|
alertmanager-webhook-servicenow Updated |
mirantis.azurecr.io/stacklight/alertmanager-webhook-servicenow:v0.1-20230206145038 |
|
alpine-utils Updated |
mirantis.azurecr.io/stacklight/alpine-utils:1-20230203125601 |
|
blackbox-exporter Updated |
mirantis.azurecr.io/stacklight/blackbox-exporter:v0.23.0 |
|
cadvisor New |
mirantis.azurecr.io/stacklight/cadvisor:v0.46.0 |
|
cerebro Updated |
mirantis.azurecr.io/stacklight/cerebro:v0.9-20230203125548 |
|
configmap-reload Updated |
mirantis.azurecr.io/stacklight/configmap-reload:v0.8.0 |
|
curator Updated |
mirantis.azurecr.io/stacklight/curator:5.7.6-20230206171950 |
|
elasticsearch_exporter |
mirantis.azurecr.io/stacklight/elasticsearch_exporter:1.0.2 |
|
fluentd Updated |
mirantis.azurecr.io/stacklight/fluentd:1.15-20230203125530 |
|
grafana |
mirantis.azurecr.io/stacklight/grafana:9.1.8 |
|
grafana-image-renderer Updated |
mirantis.azurecr.io/stacklight/grafana-image-renderer:3.6.1-20221103105602 |
|
k8s-sidecar Updated |
mirantis.azurecr.io/stacklight/k8s-sidecar:1.21.0-20230206130934 |
|
kube-state-metrics Updated |
mirantis.azurecr.io/stacklight/kube-state-metrics:v2.7.0 |
|
kubectl |
mirantis.azurecr.io/stacklight/kubectl:1.22.13 |
|
metric-collector Updated |
mirantis.azurecr.io/stacklight/metric-collector:v0.1-20221227141656 |
|
metricbeat Updated |
mirantis.azurecr.io/stacklight/metricbeat:7.10.2-20230203125534 |
|
node-exporter Updated |
mirantis.azurecr.io/stacklight/node-exporter:v1.5.0 |
|
opensearch Updated |
mirantis.azurecr.io/stacklight/opensearch:1-20230203125541 |
|
opensearch-dashboards Updated |
mirantis.azurecr.io/stacklight/opensearch-dashboards:1-20230203125528 |
|
pgbouncer Updated |
mirantis.azurecr.io/stacklight/pgbouncer:1-20230203125558 |
|
prometheus Updated |
mirantis.azurecr.io/stacklight/prometheus:v2.40.7 |
|
prometheus-es-exporter Updated |
mirantis.azurecr.io/stacklight/prometheus-es-exporter:v0.14.0-20230206130434 |
|
prometheus-msteams |
mirantis.azurecr.io/stacklight/prometheus-msteams:v1.4.2 |
|
prometheus-patroni-exporter Updated |
mirantis.azurecr.io/stacklight/prometheus-patroni-exporter:0.0.1-20230203125555 |
|
prometheus-postgres-exporter |
mirantis.azurecr.io/stacklight/prometheus-postgres-exporter:v0.9.0 |
|
prometheus-relay Updated |
mirantis.azurecr.io/stacklight/prometheus-relay:v0.4-20230203125553 |
|
sf-notifier Updated |
mirantis.azurecr.io/stacklight/sf-notifier:v0.3-20230206130301 |
|
sf-reporter Updated |
mirantis.azurecr.io/stacklight/sf-reporter:v0.1-20230206133637 |
|
spilo Updated |
mirantis.azurecr.io/stacklight/spilo:13-2.1p9-20230203124803 |
|
stacklight-toolkit Updated |
mirantis.azurecr.io/stacklight/stacklight-toolkit:20230203125546 |
|
telegraf |
mirantis.azurecr.io/stacklight/telegraf:v1.9.1-20230203125527 Updated |
|
mirantis.azurecr.io/stacklight/telegraf:1.23.4-20220915114529 |
||
telemeter Updated |
mirantis.azurecr.io/stacklight/telemeter:4.4-20230203125536 |
|
telemeter-token-auth Updated |
mirantis.azurecr.io/stacklight/telemeter-token-auth:v0.1-20230203125540 |
|
yq Updated |
mirantis.azurecr.io/stacklight/yq:4.30.6 |
Artifact |
Component |
Path |
|---|---|---|
Debian repositories |
System packages Updated |
|
http://mirror.mirantis.com/kaas/kubernetes-extra-rhel7-0.0.7/ |
||
https://mirror.mirantis.com/kaas/ubuntu-2023-01-26-014412.target.txt |
||
MCR repositories |
MCR |
https://repos.mirantis.com/ubuntu/dists/bionic/pool/stable-20.10/ |
Target ubuntu system |
Ubuntu Updated |
https://binary.mirantis.com/bm/bin/efi/ubuntu/tgz-focal-20230126185755 |
https://binary.mirantis.com/bm/bin/efi/ubuntu/tgz-bionic-5.4-20230126183021 |
See also
See also
This section outlines release notes for the Cluster release 12.5.0 that is introduced in the Container Cloud release 2.21.1. This Cluster release is based on the Cluster release 11.5.0.
The Cluster release 12.5.0 supports:
Mirantis OpenStack for Kubernetes (MOSK) 22.5. For details, see Release notes 22.5.
Mirantis Kubernetes Engine (MKE) 3.5.5. For details, see MKE Release Notes.
Mirantis Container Runtime (MCR) 20.10.13. For details, see MCR Release Notes.
Kubernetes 1.21.
For the list of known and resolved issues, refer to the Container Cloud release 2.21.0 section.
This section outlines new features implemented in the Cluster release 12.5.0 that is introduced in the Container Cloud release 2.21.1.
Added support for the Mirantis Kubernetes Engine (MKE) 3.5.5 with Kubernetes 2.21 and the Mirantis Container Runtime (MCR) version 20.10.13.
An update from the Cluster release 8.10.0 to 12.5.0 becomes available through the Container Cloud web UI menu once the related management or regional cluster automatically upgrades to Container Cloud 2.21.1.
Updated the MetalLB version from 0.12.1 to 0.13.4 to apply the latest
enhancements. The MetalLB configuration is now stored in dedicated MetalLB
objects instead of the ConfigMap object.
Improved etcd monitoring by implementing the Etcd dashboard and
etcdDbSizeCritical and etcdDbSizeMajor alerts that inform about the
size of the etcd database.
Learn more
The following table lists the components versions of the Cluster release 12.5.0. For major components and versions of the Container Cloud release, see Container Cloud release 2.21.0.
Component |
Application/Service |
Version |
|---|---|---|
Cluster orchestration |
Mirantis Kubernetes Engine |
3.5.5 0 |
Container runtime |
Mirantis Container Runtime |
20.10.13 1 |
Distributed storage |
Ceph |
15.2.17 (Octopus) |
Rook |
1.0.0-20220809220209 |
|
LCM |
Helm |
2.16.11-40 |
helm-controller |
0.3.0-327-gbc30b11b |
|
lcm-ansible |
0.19.0-12-g6cad672 |
|
lcm-agent |
0.3.0-327-gbc30b11b |
|
StackLight |
Alerta |
8.5.0-20220923121625 |
Alertmanager |
0.23.0 |
|
Alertmanager Webhook ServiceNow |
0.1-20220706035316 |
|
Cerebro |
0.9-20220923122026 |
|
Elasticsearch Curator |
5.7.6 |
|
Elasticsearch Exporter |
1.0.2 |
|
Fluentd |
1.14-20220922214003 |
|
Grafana |
9.0.2 |
|
Grafana Image Renderer |
3.5.0 |
|
IAM Proxy |
6.0.1 |
|
Metric Collector |
0.1-20220711134630 |
|
Metricbeat |
7.10.2-20220909091002 |
|
OpenSearch |
1-20220517112057 |
|
OpenSearch Dashboards |
1-20220517112107 |
|
Prometheus |
2.35.0 |
|
Prometheus Blackbox Exporter |
0.19.0 |
|
Prometheus ES Exporter |
0.14.0-20220517111946 |
|
Prometheus MS Teams |
1.4.2 |
|
Prometheus Node Exporter |
1.2.2 |
|
Prometheus NGINX Exporter |
0.6.0 |
|
Prometheus Patroni Exporter |
0.1-20220624102731 |
|
Prometheus Postgres Exporter |
0.9.0 |
|
Prometheus Relay |
0.3-20210317133316 |
|
sf-notifier |
0.3-20220706035002 |
|
sf-reporter |
0.1-20220916113234 |
|
Spilo |
13-2.1p1-20220921105803 |
|
Telegraf |
1.9.1-20221107155248 |
|
1.23.4-20220915114529 |
||
Telemeter |
4.4.0-20200424 |
- 0
For the Mirantis Kubernetes Engine (MKE) release highlights and components versions, see MKE documentation: MKE release notes.
- 1
For the Mirantis Container Runtime (MCR) release highlights, see MCR documentation: MCR release notes.
This section lists the components artifacts of the Cluster release 12.5.0. For artifacts of the Container Cloud release, see Container Cloud release 2.21.0.
Artifact |
Component |
Path |
|---|---|---|
Helm chart |
ceph-controller |
https://binary.mirantis.com/ceph/helm/ceph-operator-1.0.0-mcp-964.tgz |
Docker images |
ceph |
mirantis.azurecr.io/ceph/ceph:v15.2.17 |
ceph-controller |
mirantis.azurecr.io/ceph/mcp/ceph-controller:v1.0.0-20221024145202 |
|
cephcsi |
mirantis.azurecr.io/ceph/cephcsi/cephcsi:v3.4.0 |
|
csi-node-driver-registrar |
mirantis.azurecr.io/ceph/k8scsi/csi-node-driver-registrar:v2.1.0 |
|
csi-provisioner |
mirantis.azurecr.io/ceph/k8scsi/csi-provisioner:v2.1.2 |
|
csi-snapshotter |
mirantis.azurecr.io/ceph/k8scsi/csi-snapshotter:v4.0.0 |
|
csi-attacher |
mirantis.azurecr.io/ceph/k8scsi/csi-attacher:v3.1.0 |
|
csi-resizer |
mirantis.azurecr.io/ceph/k8scsi/csi-resizer:v1.1.0 |
|
rook |
mirantis.azurecr.io/ceph/rook:v1.0.0-20220809220209 |
Artifact |
Component |
Path |
|---|---|---|
Binaries |
lcm-ansible |
https://binary.mirantis.com/lcm/bin/lcm-ansible/v0.19.0-12-g6cad672/lcm-ansible.tar.gz |
lcm-agent |
https://binary.mirantis.com/lcm/bin/lcm-agent/v0.3.0-327-gbc30b11b/lcm-agent |
|
Helm charts |
helm-controller |
https://binary.mirantis.com/core/helm/helm-controller-1.34.16.tgz |
managed-lcm-api |
https://binary.mirantis.com/core/helm/managed-lcm-api-1.34.16.tgz |
|
Docker images |
helm-controller |
mirantis.azurecr.io/lcm/lcm-controller:v0.3.0-327-gbc30b11b |
Artifact |
Component |
Path |
|---|---|---|
Helm charts |
alerta |
https://binary.mirantis.com/stacklight/helm/alerta-0.1.0-mcp-25.tgz |
alertmanager-webhook-servicenow |
https://binary.mirantis.com/stacklight/helm/alertmanager-webhook-servicenow-0.2.0-mcp-4.tgz |
|
cerebro |
https://binary.mirantis.com/stacklight/helm/cerebro-0.1.0-mcp-2.tgz |
|
elasticsearch-curator |
https://binary.mirantis.com/stacklight/helm/elasticsearch-curator-1.5.0-mcp-10.tgz |
|
elasticsearch-exporter |
https://binary.mirantis.com/stacklight/helm/elasticsearch-exporter-1.2.0-mcp-6.tgz |
|
fluentd |
https://binary.mirantis.com/stacklight/helm/fluentd-2.0.3-mcp-37.tgz |
|
fluentd-logs |
https://binary.mirantis.com/stacklight/helm/fluentd-logs-0.1.0-mcp-142.tgz |
|
grafana |
https://binary.mirantis.com/stacklight/helm/grafana-3.3.10-mcp-173.tgz |
|
iam-proxy |
||
metric-collector |
https://binary.mirantis.com/stacklight/helm/metric-collector-0.3.0-mcp-10.tgz |
|
metricbeat |
https://binary.mirantis.com/stacklight/helm/metricbeat-1.7.1-mcp-16.tgz |
|
opensearch |
https://binary.mirantis.com/stacklight/helm/opensearch-0.1.0-mcp-52.tgz |
|
opensearch-dashboards |
https://binary.mirantis.com/stacklight/helm/opensearch-dashboards-0.1.0-mcp-40.tgz |
|
patroni |
https://binary.mirantis.com/stacklight/helm/patroni-0.15.1-mcp-42.tgz |
|
prometheus |
https://binary.mirantis.com/stacklight/helm/prometheus-8.11.4-mcp-229.tgz |
|
prometheus-blackbox-exporter |
https://binary.mirantis.com/stacklight/helm/prometheus-blackbox-exporter-0.3.0-mcp-11.tgz |
|
prometheus-es-exporter |
https://binary.mirantis.com/stacklight/helm/prometheus-es-exporter-1.0.0-mcp-11.tgz |
|
prometheus-msteams |
https://binary.mirantis.com/stacklight/helm/prometheus-msteams-0.1.0-mcp-9.tgz |
|
prometheus-nginx-exporter |
https://binary.mirantis.com/stacklight/helm/prometheus-nginx-exporter-0.2.0-mcp-1.tgz |
|
sf-notifier |
https://binary.mirantis.com/stacklight/helm/sf-notifier-0.2.0-mcp-4.tgz |
|
sf-reporter |
https://binary.mirantis.com/stacklight/helm/sf-reporter-0.2.0-mcp-5.tgz |
|
stacklight |
https://binary.mirantis.com/stacklight/helm/stacklight-0.9.3.tgz |
|
telegraf-ds |
https://binary.mirantis.com/stacklight/helm/telegraf-ds-1.1.5-mcp-29.tgz |
|
telegraf-s |
https://binary.mirantis.com/stacklight/helm/telegraf-s-1.1.5-mcp-30.tgz |
|
telemeter-client |
https://binary.mirantis.com/stacklight/helm/telemeter-client-0.2.0-mcp-7.tgz |
|
telemeter-server |
https://binary.mirantis.com/stacklight/helm/telemeter-server-0.2.0-mcp-7.tgz |
|
Docker images |
alerta-web |
mirantis.azurecr.io/stacklight/alerta-web:8.5.0-20220923121625 |
alertmanager |
mirantis.azurecr.io/stacklight/alertmanager:v0.23.0 |
|
alertmanager-webhook-servicenow |
mirantis.azurecr.io/stacklight/alertmanager-webhook-servicenow:v0.1-20220706035316 |
|
blackbox-exporter |
mirantis.azurecr.io/stacklight/blackbox-exporter:v0.19.0 |
|
busybox |
mirantis.azurecr.io/stacklight/busybox:1.30 |
|
cerebro |
mirantis.azurecr.io/stacklight/cerebro:v0.9-20220923122026 |
|
configmap-reload |
mirantis.azurecr.io/stacklight/configmap-reload:v0.3.0 |
|
curator |
mirantis.azurecr.io/stacklight/curator:5.7.6 |
|
curl |
mirantis.azurecr.io/stacklight/curl:7.69.0 |
|
curl-jq |
mirantis.azurecr.io/stacklight/curl-jq:1.5-1 |
|
elasticsearch_exporter |
mirantis.azurecr.io/stacklight/elasticsearch_exporter:1.0.2 |
|
fluentd |
mirantis.azurecr.io/stacklight/fluentd:1.14-20220922214003 |
|
grafana |
mirantis.azurecr.io/stacklight/grafana:9.0.2 |
|
grafana-image-renderer |
mirantis.azurecr.io/stacklight/grafana-image-renderer:3.5.0 |
|
k8s-sidecar |
mirantis.azurecr.io/stacklight/k8s-sidecar:1.15.9 |
|
kube-state-metrics |
mirantis.azurecr.io/stacklight/kube-state-metrics:v2.2.4 |
|
kubectl |
mirantis.azurecr.io/stacklight/kubectl:1.22.13 |
|
metric-collector |
mirantis.azurecr.io/stacklight/metric-collector:v0.1-20220711134630 |
|
metricbeat |
mirantis.azurecr.io/stacklight/metricbeat:7.10.2-20220909091002 |
|
nginx-prometheus-exporter |
mirantis.azurecr.io/stacklight/nginx-prometheus-exporter:0.6.0 |
|
node-exporter |
mirantis.azurecr.io/stacklight/node-exporter:v1.2.2 |
|
opensearch |
mirantis.azurecr.io/stacklight/opensearch:1-20220517112057 |
|
opensearch-dashboards |
mirantis.azurecr.io/stacklight/opensearch-dashboards:1-20220517112107 |
|
origin-telemeter |
mirantis.azurecr.io/stacklight/origin-telemeter:4.4.0-20200424 |
|
prometheus |
mirantis.azurecr.io/stacklight/prometheus:v2.35.0 |
|
prometheus-es-exporter |
mirantis.azurecr.io/stacklight/prometheus-es-exporter:v0.14.0-20220517111946 |
|
prometheus-msteams |
mirantis.azurecr.io/stacklight/prometheus-msteams:v1.4.2 |
|
prometheus-patroni-exporter |
mirantis.azurecr.io/stacklight/prometheus-patroni-exporter:v0.1-20220624102731 |
|
prometheus-postgres-exporter |
mirantis.azurecr.io/stacklight/prometheus-postgres-exporter:v0.9.0 |
|
prometheus-relay |
mirantis.azurecr.io/stacklight/prometheus-relay:v0.3-20210317133316 |
|
sf-notifier |
mirantis.azurecr.io/stacklight/sf-notifier:v0.3-20220706035002 |
|
sf-reporter |
mirantis.azurecr.io/stacklight/sf-reporter:v0.1-20220916113234 |
|
spilo |
mirantis.azurecr.io/stacklight/spilo:13-2.1p1-20220921105803 |
|
stacklight-toolkit |
mirantis.azurecr.io/stacklight/stacklight-toolkit:20220729121446 |
|
telegraf |
mirantis.azurecr.io/stacklight/telegraf:v1.9.1-20221107155248 |
|
mirantis.azurecr.io/stacklight/telegraf:1.23.4-20220915114529 |
||
telemeter-token-auth |
mirantis.azurecr.io/stacklight/telemeter-token-auth:v0.1-20200406175600 |
|
yq |
mirantis.azurecr.io/stacklight/yq:4.25.2 |
Artifact |
Component |
Path |
|---|---|---|
Debian repositories |
System packages |
|
http://mirror.mirantis.com/kaas/kubernetes-extra-rhel7-0.0.5/ |
||
https://mirror.mirantis.com/kaas/ubuntu-2022-07-13-020010.target.txt |
||
MCR repositories |
MCR |
https://repos.mirantis.com/ubuntu/dists/bionic/pool/stable-20.10/ |
Target ubuntu system |
Ubuntu |
https://binary.mirantis.com/bm/bin/efi/ubuntu/tgz-focal-20220915105522 |
https://binary.mirantis.com/bm/bin/efi/ubuntu/tgz-bionic-5.4-20220915105637 0 |
- 0
Only for existing bare metal clusters
This section outlines release notes for the unsupported Cluster releases of the 11.x series. Cluster releases ending with a zero, for example, 11.x.0, are major releases. Cluster releases ending with with a non-zero, for example, 11.x.1, are patch releases of a major release 11.x.0.
This section outlines release notes for unsupported Cluster releases of the 11.7.x series.
This section includes release notes for the patch Cluster release 11.7.4 that is introduced in the Container Cloud patch release 2.23.5 and is based on the Cluster release 11.7.0.
For CVE fixes delivered with this patch Cluster release, see security notes for 2.23.5
For CVE fixes delivered with the previous patch Cluster releases, see security notes for 2.23.4, 2.23.3, and 2.23.2
For details on patch release delivery, see Patch releases
This section lists the components artifacts of the Cluster release 11.7.4.
Note
The components that are newly added, updated, deprecated, or removed
as compared to the previous release version, are marked
with a corresponding superscript,
for example, lcm-ansible Updated.
Artifact |
Component |
Path |
|---|---|---|
Helm chart |
ceph-controller Updated |
https://binary.mirantis.com/ceph/helm/ceph-operator-1.0.0-mcc-2.23.5-1.tgz |
Docker images |
ceph |
mirantis.azurecr.io/ceph/ceph:v16.2.11-cve-4 |
ceph-controller Updated |
mirantis.azurecr.io/ceph/mcp/ceph-controller:2.23.5-0 |
|
cephcsi |
mirantis.azurecr.io/mirantis/cephcsi:v3.7.2-cve-4 |
|
cephcsi-attacher |
mirantis.azurecr.io/mirantis/cephcsi-attacher:v4.2.0-cve-2 |
|
cephcsi-provisioner |
mirantis.azurecr.io/mirantis/cephcsi-provisioner:v3.4.0-cve-2 |
|
cephcsi-registrar |
mirantis.azurecr.io/mirantis/cephcsi-registrar:v2.7.0-cve-2 |
|
cephcsi-resizer |
mirantis.azurecr.io/mirantis/cephcsi-resizer:v1.7.0-cve-2 |
|
cephcsi-snapshotter |
mirantis.azurecr.io/mirantis/cephcsi-snapshotter:v6.2.1-cve-2 |
|
rook |
mirantis.azurecr.io/ceph/rook:v1.10.10-10 |
Artifact |
Component |
Path |
|---|---|---|
Binaries |
lcm-ansible |
https://binary.mirantis.com/lcm/bin/lcm-ansible/v0.21.0-39-g5b167de/lcm-ansible.tar.gz |
lcm-agent Updated |
||
Helm charts Updated |
helm-controller |
https://binary.mirantis.com/core/helm/helm-controller-1.36.27.tgz |
managed-lcm-api |
https://binary.mirantis.com/core/helm/managed-lcm-api-1.36.27.tgz |
|
Docker images Updated |
helm-controller |
mirantis.azurecr.io/core/helm-controller:1.36.27 |
Artifact |
Component |
Path |
|---|---|---|
Helm charts |
alerta |
https://binary.mirantis.com/stacklight/helm/alerta-0.1.0-mcp-29.tgz |
alertmanager-webhook-servicenow |
https://binary.mirantis.com/stacklight/helm/alertmanager-webhook-servicenow-0.2.0-mcp-4.tgz |
|
cadvisor |
https://binary.mirantis.com/stacklight/helm/cadvisor-0.1.0-mcp-2.tgz |
|
cerebro |
https://binary.mirantis.com/stacklight/helm/cerebro-0.1.0-mcp-2.tgz |
|
elasticsearch-curator |
https://binary.mirantis.com/stacklight/helm/elasticsearch-curator-1.5.0-mcp-10.tgz |
|
elasticsearch-exporter |
https://binary.mirantis.com/stacklight/helm/elasticsearch-exporter-1.2.0-mcp-6.tgz |
|
fluentd |
https://binary.mirantis.com/stacklight/helm/fluentd-2.0.3-mcp-49.tgz |
|
fluentd-logs |
https://binary.mirantis.com/stacklight/helm/fluentd-logs-0.1.0-mcp-170.tgz |
|
grafana |
https://binary.mirantis.com/stacklight/helm/grafana-3.3.10-mcp-200.tgz |
|
iam-proxy |
||
metric-collector |
https://binary.mirantis.com/stacklight/helm/metric-collector-0.3.0-mcp-10.tgz |
|
metricbeat |
https://binary.mirantis.com/stacklight/helm/metricbeat-1.7.1-mcp-16.tgz |
|
opensearch |
https://binary.mirantis.com/stacklight/helm/opensearch-0.1.0-mcp-52.tgz |
|
opensearch-dashboards |
https://binary.mirantis.com/stacklight/helm/opensearch-dashboards-0.1.0-mcp-44.tgz |
|
patroni |
https://binary.mirantis.com/stacklight/helm/patroni-0.15.1-mcp-48.tgz |
|
prometheus |
https://binary.mirantis.com/stacklight/helm/prometheus-8.11.4-mcp-229.tgz |
|
prometheus-blackbox-exporter |
https://binary.mirantis.com/stacklight/helm/prometheus-blackbox-exporter-0.3.0-mcp-11.tgz |
|
prometheus-es-exporter |
https://binary.mirantis.com/stacklight/helm/prometheus-es-exporter-1.0.0-mcp-11.tgz |
|
prometheus-msteams |
https://binary.mirantis.com/stacklight/helm/prometheus-msteams-0.1.0-mcp-9.tgz |
|
refapp |
https://binary.mirantis.com/scale/helm/refapp-0.2.1-mcp-9.tgz |
|
sf-notifier |
https://binary.mirantis.com/stacklight/helm/sf-notifier-0.2.0-mcp-4.tgz |
|
sf-reporter |
https://binary.mirantis.com/stacklight/helm/sf-reporter-0.2.0-mcp-6.tgz |
|
stacklight Updated |
https://binary.mirantis.com/stacklight/helm/stacklight-0.11.9.tgz |
|
telegraf-ds |
https://binary.mirantis.com/stacklight/helm/telegraf-ds-1.1.5-mcp-29.tgz |
|
telegraf-s |
https://binary.mirantis.com/stacklight/helm/telegraf-s-1.1.5-mcp-30.tgz |
|
telemeter-client |
https://binary.mirantis.com/stacklight/helm/telemeter-client-0.2.0-mcp-7.tgz |
|
telemeter-server |
https://binary.mirantis.com/stacklight/helm/telemeter-server-0.2.0-mcp-7.tgz |
|
Docker images |
alerta-web Updated |
mirantis.azurecr.io/stacklight/alerta-web:9-20230523144245 |
alertmanager |
mirantis.azurecr.io/stacklight/alertmanager:v0.25.0 |
|
alertmanager-webhook-servicenow Updated |
mirantis.azurecr.io/stacklight/alertmanager-webhook-servicenow:v0.1-20230519023013 |
|
alpine-utils Updated |
mirantis.azurecr.io/stacklight/alpine-utils:1-20230519023021 |
|
blackbox-exporter |
mirantis.azurecr.io/stacklight/blackbox-exporter:v0.23.0 |
|
cadvisor Updated |
mirantis.azurecr.io/stacklight/cadvisor:v0.47-20230519023020 |
|
cerebro |
mirantis.azurecr.io/stacklight/cerebro:v0.9-20230505023015 |
|
configmap-reload |
mirantis.azurecr.io/stacklight/configmap-reload:v0.8.0 |
|
curator |
mirantis.azurecr.io/stacklight/curator:5.7.6-20230404082402 |
|
elasticsearch_exporter |
mirantis.azurecr.io/stacklight/elasticsearch_exporter:1.0.2 |
|
fluentd Updated |
mirantis.azurecr.io/stacklight/fluentd:1.15-20230519023011 |
|
grafana |
mirantis.azurecr.io/stacklight/grafana:9.4.9 |
|
grafana-image-renderer |
mirantis.azurecr.io/stacklight/grafana-image-renderer:3-20230418140825 |
|
k8s-sidecar Updated |
mirantis.azurecr.io/stacklight/k8s-sidecar:1.22-20230519023019 |
|
kube-state-metrics |
mirantis.azurecr.io/stacklight/kube-state-metrics:v2.8.2 |
|
kubectl Updated |
mirantis.azurecr.io/stacklight/kubectl:1.22-20230519023019 |
|
metric-collector |
mirantis.azurecr.io/stacklight/metric-collector:v0.1-20230330133800 |
|
metricbeat Updated |
mirantis.azurecr.io/stacklight/metricbeat:7.12.1-20230519023010 |
|
node-exporter |
mirantis.azurecr.io/stacklight/node-exporter:v1.5.0 |
|
opensearch Updated |
mirantis.azurecr.io/stacklight/opensearch:1-20230523124159 |
|
opensearch-dashboards Updated |
mirantis.azurecr.io/stacklight/opensearch-dashboards:1-20230519023015 |
|
pgbouncer Updated |
mirantis.azurecr.io/stacklight/pgbouncer:1-20230519023020 |
|
prometheus |
mirantis.azurecr.io/stacklight/prometheus:v2.40.7 |
|
prometheus-es-exporter Updated |
mirantis.azurecr.io/stacklight/prometheus-es-exporter:v0.14.0-20230519023018 |
|
prometheus-msteams |
mirantis.azurecr.io/stacklight/prometheus-msteams:v1.5.2 |
|
prometheus-patroni-exporter Updated |
mirantis.azurecr.io/stacklight/prometheus-patroni-exporter:0.0.1-20230519023019 |
|
prometheus-postgres-exporter |
mirantis.azurecr.io/stacklight/prometheus-postgres-exporter:v0.12.0 |
|
prometheus-relay Updated |
mirantis.azurecr.io/stacklight/prometheus-relay:v0.4-20230519023015 |
|
sf-notifier Updated |
mirantis.azurecr.io/stacklight/sf-notifier:v0.3-20230523144230 |
|
sf-reporter |
mirantis.azurecr.io/stacklight/sf-reporter:v0.1-20230403174259 |
|
spilo Updated |
mirantis.azurecr.io/stacklight/spilo:13-2.1p9-20230519023017 |
|
stacklight-toolkit Updated |
mirantis.azurecr.io/stacklight/stacklight-toolkit:20230519023016 |
|
telegraf |
mirantis.azurecr.io/stacklight/telegraf:v1.9.1-20230519023009 Updated |
|
mirantis.azurecr.io/stacklight/telegraf:1.26-20230523091335 Updated |
||
telemeter Updated |
mirantis.azurecr.io/stacklight/telemeter:4.4-20230519023012 |
|
telemeter-token-auth Updated |
mirantis.azurecr.io/stacklight/telemeter-token-auth:v0.1-20230519023015 |
|
yq |
mirantis.azurecr.io/stacklight/yq:4.33.2 |
Unchanged as compared to 11.7.0
Artifact |
Component |
Path |
|---|---|---|
Debian repositories |
System packages |
|
http://mirror.mirantis.com/kaas/kubernetes-extra-rhel7-0.0.7/ |
||
https://mirror.mirantis.com/kaas/ubuntu-2023-01-26-014412.target.txt |
||
MCR repositories |
MCR |
https://repos.mirantis.com/ubuntu/dists/bionic/pool/stable-20.10/ |
Target ubuntu system 1 |
Ubuntu |
https://binary.mirantis.com/bm/bin/efi/ubuntu/tgz-focal-20230126185755 |
https://binary.mirantis.com/bm/bin/efi/ubuntu/tgz-bionic-5.4-20230126183021 2 |
This section includes release notes for the patch Cluster release 11.7.3 that is introduced in the Container Cloud patch release 2.23.4 and is based on the Cluster release 11.7.0.
For CVE fixes delivered with this patch Cluster release, see security notes for 2.23.4
For CVE fixes delivered with the previous patch Cluster releases, see security notes for 2.23.3 and 2.23.2
For details on patch release delivery, see Patch releases
This section lists the components artifacts of the Cluster release 11.7.3.
Note
The components that are newly added, updated, deprecated, or removed
as compared to the previous release version, are marked
with a corresponding superscript,
for example, lcm-ansible Updated.
Artifact |
Component |
Path |
|---|---|---|
Helm chart |
ceph-controller Updated |
https://binary.mirantis.com/ceph/helm/ceph-operator-1.0.0-mcc-2.23.4-4.tgz |
Docker images |
ceph |
mirantis.azurecr.io/ceph/ceph:v16.2.11-cve-4 |
ceph-controller Updated |
mirantis.azurecr.io/ceph/mcp/ceph-controller:2.23.4-0 |
|
cephcsi Updated |
mirantis.azurecr.io/mirantis/cephcsi:v3.7.2-cve-4 |
|
cephcsi-attacher |
mirantis.azurecr.io/mirantis/cephcsi-attacher:v4.2.0-cve-2 |
|
cephcsi-provisioner |
mirantis.azurecr.io/mirantis/cephcsi-provisioner:v3.4.0-cve-2 |
|
cephcsi-registrar |
mirantis.azurecr.io/mirantis/cephcsi-registrar:v2.7.0-cve-2 |
|
cephcsi-resizer |
mirantis.azurecr.io/mirantis/cephcsi-resizer:v1.7.0-cve-2 |
|
cephcsi-snapshotter |
mirantis.azurecr.io/mirantis/cephcsi-snapshotter:v6.2.1-cve-2 |
|
rook |
mirantis.azurecr.io/ceph/rook:v1.10.10-10 |
Artifact |
Component |
Path |
|---|---|---|
Binaries |
lcm-ansible |
https://binary.mirantis.com/lcm/bin/lcm-ansible/v0.21.0-39-g5b167de/lcm-ansible.tar.gz |
lcm-agent Updated |
||
Helm charts Updated |
helm-controller |
https://binary.mirantis.com/core/helm/helm-controller-1.36.26.tgz |
managed-lcm-api |
https://binary.mirantis.com/core/helm/managed-lcm-api-1.36.26.tgz |
|
Docker images Updated |
helm-controller |
mirantis.azurecr.io/core/helm-controller:1.36.26 |
Artifact |
Component |
Path |
|---|---|---|
Helm charts |
alerta |
https://binary.mirantis.com/stacklight/helm/alerta-0.1.0-mcp-29.tgz |
alertmanager-webhook-servicenow |
https://binary.mirantis.com/stacklight/helm/alertmanager-webhook-servicenow-0.2.0-mcp-4.tgz |
|
cadvisor |
https://binary.mirantis.com/stacklight/helm/cadvisor-0.1.0-mcp-2.tgz |
|
cerebro |
https://binary.mirantis.com/stacklight/helm/cerebro-0.1.0-mcp-2.tgz |
|
elasticsearch-curator |
https://binary.mirantis.com/stacklight/helm/elasticsearch-curator-1.5.0-mcp-10.tgz |
|
elasticsearch-exporter |
https://binary.mirantis.com/stacklight/helm/elasticsearch-exporter-1.2.0-mcp-6.tgz |
|
fluentd |
https://binary.mirantis.com/stacklight/helm/fluentd-2.0.3-mcp-49.tgz |
|
fluentd-logs |
https://binary.mirantis.com/stacklight/helm/fluentd-logs-0.1.0-mcp-170.tgz |
|
grafana |
https://binary.mirantis.com/stacklight/helm/grafana-3.3.10-mcp-200.tgz |
|
iam-proxy |
||
metric-collector |
https://binary.mirantis.com/stacklight/helm/metric-collector-0.3.0-mcp-10.tgz |
|
metricbeat |
https://binary.mirantis.com/stacklight/helm/metricbeat-1.7.1-mcp-16.tgz |
|
opensearch |
https://binary.mirantis.com/stacklight/helm/opensearch-0.1.0-mcp-52.tgz |
|
opensearch-dashboards |
https://binary.mirantis.com/stacklight/helm/opensearch-dashboards-0.1.0-mcp-44.tgz |
|
patroni |
https://binary.mirantis.com/stacklight/helm/patroni-0.15.1-mcp-48.tgz |
|
prometheus |
https://binary.mirantis.com/stacklight/helm/prometheus-8.11.4-mcp-229.tgz |
|
prometheus-blackbox-exporter |
https://binary.mirantis.com/stacklight/helm/prometheus-blackbox-exporter-0.3.0-mcp-11.tgz |
|
prometheus-es-exporter |
https://binary.mirantis.com/stacklight/helm/prometheus-es-exporter-1.0.0-mcp-11.tgz |
|
prometheus-msteams |
https://binary.mirantis.com/stacklight/helm/prometheus-msteams-0.1.0-mcp-9.tgz |
|
refapp |
https://binary.mirantis.com/scale/helm/refapp-0.2.1-mcp-9.tgz |
|
sf-notifier |
https://binary.mirantis.com/stacklight/helm/sf-notifier-0.2.0-mcp-4.tgz |
|
sf-reporter |
https://binary.mirantis.com/stacklight/helm/sf-reporter-0.2.0-mcp-6.tgz |
|
stacklight Updated |
https://binary.mirantis.com/stacklight/helm/stacklight-0.11.7.tgz |
|
telegraf-ds |
https://binary.mirantis.com/stacklight/helm/telegraf-ds-1.1.5-mcp-29.tgz |
|
telegraf-s |
https://binary.mirantis.com/stacklight/helm/telegraf-s-1.1.5-mcp-30.tgz |
|
telemeter-client |
https://binary.mirantis.com/stacklight/helm/telemeter-client-0.2.0-mcp-7.tgz |
|
telemeter-server |
https://binary.mirantis.com/stacklight/helm/telemeter-server-0.2.0-mcp-7.tgz |
|
Docker images |
alerta-web Updated |
mirantis.azurecr.io/stacklight/alerta-web:9-20230505023008 |
alertmanager |
mirantis.azurecr.io/stacklight/alertmanager:v0.25.0 |
|
alertmanager-webhook-servicenow Updated |
mirantis.azurecr.io/stacklight/alertmanager-webhook-servicenow:v0.1-20230505023012 |
|
alpine-utils Updated |
mirantis.azurecr.io/stacklight/alpine-utils:1-20230505023019 |
|
blackbox-exporter |
mirantis.azurecr.io/stacklight/blackbox-exporter:v0.23.0 |
|
cadvisor Updated |
mirantis.azurecr.io/stacklight/cadvisor:v0.47-20230505023018 |
|
cerebro Updated |
mirantis.azurecr.io/stacklight/cerebro:v0.9-20230505023015 |
|
configmap-reload |
mirantis.azurecr.io/stacklight/configmap-reload:v0.8.0 |
|
curator |
mirantis.azurecr.io/stacklight/curator:5.7.6-20230404082402 |
|
elasticsearch_exporter |
mirantis.azurecr.io/stacklight/elasticsearch_exporter:1.0.2 |
|
fluentd Updated |
mirantis.azurecr.io/stacklight/fluentd:1.15-20230428063240 |
|
grafana Updated |
mirantis.azurecr.io/stacklight/grafana:9.4.9 |
|
grafana-image-renderer |
mirantis.azurecr.io/stacklight/grafana-image-renderer:3-20230418140825 |
|
k8s-sidecar Updated |
mirantis.azurecr.io/stacklight/k8s-sidecar:1.22-20230505023018 |
|
kube-state-metrics |
mirantis.azurecr.io/stacklight/kube-state-metrics:v2.8.2 |
|
kubectl Updated |
mirantis.azurecr.io/stacklight/kubectl:1.22-20230505023017 |
|
metric-collector |
mirantis.azurecr.io/stacklight/metric-collector:v0.1-20230330133800 |
|
metricbeat Updated |
mirantis.azurecr.io/stacklight/metricbeat:7.12.1-20230505023009 |
|
node-exporter |
mirantis.azurecr.io/stacklight/node-exporter:v1.5.0 |
|
opensearch Updated |
mirantis.azurecr.io/stacklight/opensearch:1-20230505023014 |
|
opensearch-dashboards Updated |
mirantis.azurecr.io/stacklight/opensearch-dashboards:1-20230505023013 |
|
pgbouncer Updated |
mirantis.azurecr.io/stacklight/pgbouncer:1-20230505023019 |
|
prometheus |
mirantis.azurecr.io/stacklight/prometheus:v2.40.7 |
|
prometheus-es-exporter Updated |
mirantis.azurecr.io/stacklight/prometheus-es-exporter:v0.14.0-20230505023016 |
|
prometheus-msteams |
mirantis.azurecr.io/stacklight/prometheus-msteams:v1.5.2 |
|
prometheus-patroni-exporter Updated |
mirantis.azurecr.io/stacklight/prometheus-patroni-exporter:0.0.1-20230505023017 |
|
prometheus-postgres-exporter |
mirantis.azurecr.io/stacklight/prometheus-postgres-exporter:v0.12.0 |
|
prometheus-relay Updated |
mirantis.azurecr.io/stacklight/prometheus-relay:v0.4-20230505023012 |
|
sf-notifier Updated |
mirantis.azurecr.io/stacklight/sf-notifier:v0.3-20230505023013 |
|
sf-reporter |
mirantis.azurecr.io/stacklight/sf-reporter:v0.1-20230403174259 |
|
spilo |
mirantis.azurecr.io/stacklight/spilo:13-2.1p9-20230404125347 |
|
stacklight-toolkit Updated |
mirantis.azurecr.io/stacklight/stacklight-toolkit:20230505023015 |
|
telegraf |
mirantis.azurecr.io/stacklight/telegraf:v1.9.1-20230505023009 Updated |
|
mirantis.azurecr.io/stacklight/telegraf:1.26.1-20230505023017 Updated |
||
telemeter Updated |
mirantis.azurecr.io/stacklight/telemeter:4.4-20230505023010 |
|
telemeter-token-auth Updated |
mirantis.azurecr.io/stacklight/telemeter-token-auth:v0.1-20230505023010 |
|
yq |
mirantis.azurecr.io/stacklight/yq:4.33.2 |
Unchanged as compared to 11.7.0
Artifact |
Component |
Path |
|---|---|---|
Debian repositories |
System packages |
|
http://mirror.mirantis.com/kaas/kubernetes-extra-rhel7-0.0.7/ |
||
https://mirror.mirantis.com/kaas/ubuntu-2023-01-26-014412.target.txt |
||
MCR repositories |
MCR |
https://repos.mirantis.com/ubuntu/dists/bionic/pool/stable-20.10/ |
Target ubuntu system 1 |
Ubuntu |
https://binary.mirantis.com/bm/bin/efi/ubuntu/tgz-focal-20230126185755 |
https://binary.mirantis.com/bm/bin/efi/ubuntu/tgz-bionic-5.4-20230126183021 2 |
This section includes release notes for the patch Cluster release 11.7.2 that is introduced in the Container Cloud patch release 2.23.3 and is based on the Cluster release 11.7.0.
For CVE fixes delivered with this patch Cluster release, see security notes for 2.23.3
For CVE fixes delivered with the previous patch Cluster release, see security notes for 2.23.2
For details on patch release delivery, see Patch releases
This section lists the components artifacts of the Cluster release 11.7.2.
Note
The components that are newly added, updated, deprecated, or removed
as compared to the previous release version, are marked
with a corresponding superscript,
for example, lcm-ansible Updated.
Artifact |
Component |
Path |
|---|---|---|
Helm chart |
ceph-controller Updated |
https://binary.mirantis.com/ceph/helm/ceph-operator-1.0.0-mcc-2.23.3-2.tgz |
Docker images Updated |
ceph |
mirantis.azurecr.io/ceph/ceph:v16.2.11-cve-4 |
ceph-controller |
mirantis.azurecr.io/ceph/mcp/ceph-controller:2.23.3-0 |
|
cephcsi |
mirantis.azurecr.io/mirantis/cephcsi:v3.7.2-cve-3 |
|
cephcsi-attacher |
mirantis.azurecr.io/mirantis/cephcsi-attacher:v4.2.0-cve-2 |
|
cephcsi-provisioner |
mirantis.azurecr.io/mirantis/cephcsi-provisioner:v3.4.0-cve-2 |
|
cephcsi-registrar |
mirantis.azurecr.io/mirantis/cephcsi-registrar:v2.7.0-cve-2 |
|
cephcsi-resizer |
mirantis.azurecr.io/mirantis/cephcsi-resizer:v1.7.0-cve-2 |
|
cephcsi-snapshotter |
mirantis.azurecr.io/mirantis/cephcsi-snapshotter:v6.2.1-cve-2 |
|
rook |
mirantis.azurecr.io/ceph/rook:v1.10.10-10 |
Artifact |
Component |
Path |
|---|---|---|
Binaries |
lcm-ansible |
https://binary.mirantis.com/lcm/bin/lcm-ansible/v0.21.0-39-g5b167de/lcm-ansible.tar.gz |
lcm-agent Updated |
||
Helm charts Updated |
helm-controller |
https://binary.mirantis.com/core/helm/helm-controller-1.36.14.tgz |
managed-lcm-api |
https://binary.mirantis.com/core/helm/managed-lcm-api-1.36.14.tgz |
|
Docker images |
helm-controller Updated |
mirantis.azurecr.io/core/helm-controller:1.36.23 |
Artifact |
Component |
Path |
|---|---|---|
Helm charts |
alerta |
https://binary.mirantis.com/stacklight/helm/alerta-0.1.0-mcp-29.tgz |
alertmanager-webhook-servicenow |
https://binary.mirantis.com/stacklight/helm/alertmanager-webhook-servicenow-0.2.0-mcp-4.tgz |
|
cadvisor |
https://binary.mirantis.com/stacklight/helm/cadvisor-0.1.0-mcp-2.tgz |
|
cerebro |
https://binary.mirantis.com/stacklight/helm/cerebro-0.1.0-mcp-2.tgz |
|
elasticsearch-curator |
https://binary.mirantis.com/stacklight/helm/elasticsearch-curator-1.5.0-mcp-10.tgz |
|
elasticsearch-exporter |
https://binary.mirantis.com/stacklight/helm/elasticsearch-exporter-1.2.0-mcp-6.tgz |
|
fluentd |
https://binary.mirantis.com/stacklight/helm/fluentd-2.0.3-mcp-49.tgz |
|
fluentd-logs |
https://binary.mirantis.com/stacklight/helm/fluentd-logs-0.1.0-mcp-170.tgz |
|
grafana Updated |
https://binary.mirantis.com/stacklight/helm/grafana-3.3.10-mcp-200.tgz |
|
iam-proxy |
||
metric-collector |
https://binary.mirantis.com/stacklight/helm/metric-collector-0.3.0-mcp-10.tgz |
|
metricbeat |
https://binary.mirantis.com/stacklight/helm/metricbeat-1.7.1-mcp-16.tgz |
|
opensearch |
https://binary.mirantis.com/stacklight/helm/opensearch-0.1.0-mcp-52.tgz |
|
opensearch-dashboards |
https://binary.mirantis.com/stacklight/helm/opensearch-dashboards-0.1.0-mcp-44.tgz |
|
patroni |
https://binary.mirantis.com/stacklight/helm/patroni-0.15.1-mcp-48.tgz |
|
prometheus |
https://binary.mirantis.com/stacklight/helm/prometheus-8.11.4-mcp-229.tgz |
|
prometheus-blackbox-exporter |
https://binary.mirantis.com/stacklight/helm/prometheus-blackbox-exporter-0.3.0-mcp-11.tgz |
|
prometheus-es-exporter |
https://binary.mirantis.com/stacklight/helm/prometheus-es-exporter-1.0.0-mcp-11.tgz |
|
prometheus-msteams |
https://binary.mirantis.com/stacklight/helm/prometheus-msteams-0.1.0-mcp-9.tgz |
|
refapp |
https://binary.mirantis.com/scale/helm/refapp-0.2.1-mcp-9.tgz |
|
sf-notifier |
https://binary.mirantis.com/stacklight/helm/sf-notifier-0.2.0-mcp-4.tgz |
|
sf-reporter |
https://binary.mirantis.com/stacklight/helm/sf-reporter-0.2.0-mcp-6.tgz |
|
stacklight Updated |
https://binary.mirantis.com/stacklight/helm/stacklight-0.11.6.tgz |
|
telegraf-ds |
https://binary.mirantis.com/stacklight/helm/telegraf-ds-1.1.5-mcp-29.tgz |
|
telegraf-s |
https://binary.mirantis.com/stacklight/helm/telegraf-s-1.1.5-mcp-30.tgz |
|
telemeter-client |
https://binary.mirantis.com/stacklight/helm/telemeter-client-0.2.0-mcp-7.tgz |
|
telemeter-server |
https://binary.mirantis.com/stacklight/helm/telemeter-server-0.2.0-mcp-7.tgz |
|
Docker images |
alerta-web Updated |
mirantis.azurecr.io/stacklight/alerta-web:9-20230414023009 |
alertmanager |
mirantis.azurecr.io/stacklight/alertmanager:v0.25.0 |
|
alertmanager-webhook-servicenow Updated |
mirantis.azurecr.io/stacklight/alertmanager-webhook-servicenow:v0.1-20230414023012 |
|
alpine-utils Updated |
mirantis.azurecr.io/stacklight/alpine-utils:1-20230414023019 |
|
blackbox-exporter |
mirantis.azurecr.io/stacklight/blackbox-exporter:v0.23.0 |
|
cadvisor Updated |
mirantis.azurecr.io/stacklight/cadvisor:v0.47-20230414023019 |
|
cerebro |
mirantis.azurecr.io/stacklight/cerebro:v0.9-20230316081755 |
|
configmap-reload |
mirantis.azurecr.io/stacklight/configmap-reload:v0.8.0 |
|
curator |
mirantis.azurecr.io/stacklight/curator:5.7.6-20230404082402 |
|
elasticsearch_exporter |
mirantis.azurecr.io/stacklight/elasticsearch_exporter:1.0.2 |
|
fluentd Updated |
mirantis.azurecr.io/stacklight/fluentd:1.15-20230414023011 |
|
grafana |
mirantis.azurecr.io/stacklight/grafana:9.4.7 |
|
grafana-image-renderer Updated |
mirantis.azurecr.io/stacklight/grafana-image-renderer:3-20230418140825 |
|
k8s-sidecar Updated |
mirantis.azurecr.io/stacklight/k8s-sidecar:1.22-20230414023019 |
|
kube-state-metrics Updated |
mirantis.azurecr.io/stacklight/kube-state-metrics:v2.8.2 |
|
kubectl Updated |
mirantis.azurecr.io/stacklight/kubectl:1.22-20230414023019 |
|
metric-collector |
mirantis.azurecr.io/stacklight/metric-collector:v0.1-20230330133800 |
|
metricbeat Updated |
mirantis.azurecr.io/stacklight/metricbeat:7.12.1-20230417102535 |
|
node-exporter |
mirantis.azurecr.io/stacklight/node-exporter:v1.5.0 |
|
opensearch Updated |
mirantis.azurecr.io/stacklight/opensearch:1-20230414023016 |
|
opensearch-dashboards Updated |
mirantis.azurecr.io/stacklight/opensearch-dashboards:1-20230414023010 |
|
pgbouncer Updated |
mirantis.azurecr.io/stacklight/pgbouncer:1-20230414023019 |
|
prometheus |
mirantis.azurecr.io/stacklight/prometheus:v2.40.7 |
|
prometheus-es-exporter Updated |
mirantis.azurecr.io/stacklight/prometheus-es-exporter:v0.14.0-20230414023017 |
|
prometheus-msteams Updated |
mirantis.azurecr.io/stacklight/prometheus-msteams:v1.5.2 |
|
prometheus-patroni-exporter Updated |
mirantis.azurecr.io/stacklight/prometheus-patroni-exporter:0.0.1-20230414023019 |
|
prometheus-postgres-exporter Updated |
mirantis.azurecr.io/stacklight/prometheus-postgres-exporter:v0.12.0 |
|
prometheus-relay Updated |
mirantis.azurecr.io/stacklight/prometheus-relay:v0.4-20230414023019 |
|
sf-notifier Updated |
mirantis.azurecr.io/stacklight/sf-notifier:v0.3-20230414023014 |
|
sf-reporter |
mirantis.azurecr.io/stacklight/sf-reporter:v0.1-20230403174259 |
|
spilo |
mirantis.azurecr.io/stacklight/spilo:13-2.1p9-20230404125347 |
|
stacklight-toolkit Updated |
mirantis.azurecr.io/stacklight/stacklight-toolkit:20230414023017 |
|
telegraf |
mirantis.azurecr.io/stacklight/telegraf:v1.9.1-20230414023010 Updated |
|
mirantis.azurecr.io/stacklight/telegraf:1.26.1-20230414023019 Updated |
||
telemeter Updated |
mirantis.azurecr.io/stacklight/telemeter:4.4-20230414023013 |
|
telemeter-token-auth Updated |
mirantis.azurecr.io/stacklight/telemeter-token-auth:v0.1-20230414023013 |
|
yq Updated |
mirantis.azurecr.io/stacklight/yq:4.33.2 |
Unchanged as compared to 11.7.0
Artifact |
Component |
Path |
|---|---|---|
Debian repositories |
System packages |
|
http://mirror.mirantis.com/kaas/kubernetes-extra-rhel7-0.0.7/ |
||
https://mirror.mirantis.com/kaas/ubuntu-2023-01-26-014412.target.txt |
||
MCR repositories |
MCR |
https://repos.mirantis.com/ubuntu/dists/bionic/pool/stable-20.10/ |
Target ubuntu system 1 |
Ubuntu |
https://binary.mirantis.com/bm/bin/efi/ubuntu/tgz-focal-20230126185755 |
https://binary.mirantis.com/bm/bin/efi/ubuntu/tgz-bionic-5.4-20230126183021 2 |
This section outlines release notes for the patch Cluster release 11.7.1 that is introduced in the Container Cloud patch release 2.23.2 and is based on the Cluster release 11.7.0. For the list of CVE fixes delivered with this patch Cluster release, see 2.23.2. For details on patch release delivery, see Patch releases.
This section lists the components artifacts of the Cluster release 11.7.1. For artifacts of the Container Cloud release, see Container Cloud release 2.23.2.
Note
The components that are newly added, updated, deprecated, or removed
as compared to the previous release version, are marked
with a corresponding superscript,
for example, lcm-ansible Updated.
Artifact |
Component |
Path |
|---|---|---|
Helm chart |
ceph-controller Updated |
https://binary.mirantis.com/ceph/helm/ceph-operator-1.0.0-mcc-2.23.2-7.tgz |
Docker images Updated |
ceph |
mirantis.azurecr.io/ceph/ceph:v16.2.11-cve-2 |
ceph-controller |
mirantis.azurecr.io/ceph/mcp/ceph-controller:2.23.2-6 |
|
cephcsi |
mirantis.azurecr.io/mirantis/cephcsi:v3.7.2-cve-1 |
|
cephcsi-attacher |
mirantis.azurecr.io/mirantis/cephcsi-attacher:v4.2.0-cve-1 |
|
cephcsi-provisioner |
mirantis.azurecr.io/mirantis/cephcsi-provisioner:v3.4.0-cve-1 |
|
cephcsi-registrar |
mirantis.azurecr.io/mirantis/cephcsi-registrar:v2.7.0-cve-1 |
|
cephcsi-resizer |
mirantis.azurecr.io/mirantis/cephcsi-resizer:v1.7.0-cve-1 |
|
cephcsi-snapshotter |
mirantis.azurecr.io/mirantis/cephcsi-snapshotter:v6.2.1-cve-1 |
|
rook |
mirantis.azurecr.io/ceph/rook:v1.10.10-9 |
Artifact |
Component |
Path |
|---|---|---|
Binaries |
lcm-ansible |
https://binary.mirantis.com/lcm/bin/lcm-ansible/v0.21.0-39-g5b167de/lcm-ansible.tar.gz |
lcm-agent Updated |
||
Helm charts Updated |
helm-controller |
https://binary.mirantis.com/core/helm/helm-controller-1.36.14.tgz |
managed-lcm-api |
https://binary.mirantis.com/core/helm/managed-lcm-api-1.36.14.tgz |
|
Docker images |
helm-controller Updated |
mirantis.azurecr.io/core/helm-controller:1.36.14 |
Artifact |
Component |
Path |
|---|---|---|
Helm charts |
alerta |
https://binary.mirantis.com/stacklight/helm/alerta-0.1.0-mcp-29.tgz |
alertmanager-webhook-servicenow |
https://binary.mirantis.com/stacklight/helm/alertmanager-webhook-servicenow-0.2.0-mcp-4.tgz |
|
cadvisor |
https://binary.mirantis.com/stacklight/helm/cadvisor-0.1.0-mcp-2.tgz |
|
cerebro |
https://binary.mirantis.com/stacklight/helm/cerebro-0.1.0-mcp-2.tgz |
|
elasticsearch-curator |
https://binary.mirantis.com/stacklight/helm/elasticsearch-curator-1.5.0-mcp-10.tgz |
|
elasticsearch-exporter |
https://binary.mirantis.com/stacklight/helm/elasticsearch-exporter-1.2.0-mcp-6.tgz |
|
fluentd |
https://binary.mirantis.com/stacklight/helm/fluentd-2.0.3-mcp-49.tgz |
|
fluentd-logs |
https://binary.mirantis.com/stacklight/helm/fluentd-logs-0.1.0-mcp-170.tgz |
|
grafana |
https://binary.mirantis.com/stacklight/helm/grafana-3.3.10-mcp-194.tgz |
|
iam-proxy Updated |
||
metric-collector |
https://binary.mirantis.com/stacklight/helm/metric-collector-0.3.0-mcp-10.tgz |
|
metricbeat |
https://binary.mirantis.com/stacklight/helm/metricbeat-1.7.1-mcp-16.tgz |
|
opensearch |
https://binary.mirantis.com/stacklight/helm/opensearch-0.1.0-mcp-52.tgz |
|
opensearch-dashboards |
https://binary.mirantis.com/stacklight/helm/opensearch-dashboards-0.1.0-mcp-44.tgz |
|
patroni |
https://binary.mirantis.com/stacklight/helm/patroni-0.15.1-mcp-48.tgz |
|
prometheus |
https://binary.mirantis.com/stacklight/helm/prometheus-8.11.4-mcp-229.tgz |
|
prometheus-blackbox-exporter |
https://binary.mirantis.com/stacklight/helm/prometheus-blackbox-exporter-0.3.0-mcp-11.tgz |
|
prometheus-es-exporter |
https://binary.mirantis.com/stacklight/helm/prometheus-es-exporter-1.0.0-mcp-11.tgz |
|
prometheus-msteams |
https://binary.mirantis.com/stacklight/helm/prometheus-msteams-0.1.0-mcp-9.tgz |
|
refapp |
https://binary.mirantis.com/scale/helm/refapp-0.2.1-mcp-9.tgz |
|
sf-notifier |
https://binary.mirantis.com/stacklight/helm/sf-notifier-0.2.0-mcp-4.tgz |
|
sf-reporter |
https://binary.mirantis.com/stacklight/helm/sf-reporter-0.2.0-mcp-6.tgz |
|
stacklight Updated |
https://binary.mirantis.com/stacklight/helm/stacklight-0.11.5.tgz |
|
telegraf-ds |
https://binary.mirantis.com/stacklight/helm/telegraf-ds-1.1.5-mcp-29.tgz |
|
telegraf-s |
https://binary.mirantis.com/stacklight/helm/telegraf-s-1.1.5-mcp-30.tgz |
|
telemeter-client |
https://binary.mirantis.com/stacklight/helm/telemeter-client-0.2.0-mcp-7.tgz |
|
telemeter-server |
https://binary.mirantis.com/stacklight/helm/telemeter-server-0.2.0-mcp-7.tgz |
|
Docker images |
alerta-web Updated |
mirantis.azurecr.io/stacklight/alerta-web:8-20230331023009 |
alertmanager |
mirantis.azurecr.io/stacklight/alertmanager:v0.25.0 |
|
alertmanager-webhook-servicenow Updated |
mirantis.azurecr.io/stacklight/alertmanager-webhook-servicenow:v0.1-20230331023013 |
|
alpine-utils Updated |
mirantis.azurecr.io/stacklight/alpine-utils:1-20230331023020 |
|
blackbox-exporter |
mirantis.azurecr.io/stacklight/blackbox-exporter:v0.23.0 |
|
cadvisor Updated |
mirantis.azurecr.io/stacklight/cadvisor:v0.47-20230331023021 |
|
cerebro Updated |
mirantis.azurecr.io/stacklight/cerebro:v0.9-20230316081755 |
|
configmap-reload |
mirantis.azurecr.io/stacklight/configmap-reload:v0.8.0 |
|
curator Updated |
mirantis.azurecr.io/stacklight/curator:5.7.6-20230404082402 |
|
elasticsearch_exporter |
mirantis.azurecr.io/stacklight/elasticsearch_exporter:1.0.2 |
|
fluentd Updated |
mirantis.azurecr.io/stacklight/fluentd:1.15-20230331023012 |
|
grafana Updated |
mirantis.azurecr.io/stacklight/grafana:9.4.7 |
|
grafana-image-renderer Updated |
mirantis.azurecr.io/stacklight/grafana-image-renderer:3-20230310145607 |
|
k8s-sidecar Updated |
mirantis.azurecr.io/stacklight/k8s-sidecar:1.22-20230331023020 |
|
kube-state-metrics |
mirantis.azurecr.io/stacklight/kube-state-metrics:v2.7.0 |
|
kubectl Updated |
mirantis.azurecr.io/stacklight/kubectl:1.22-20230331023019 |
|
metric-collector Updated |
mirantis.azurecr.io/stacklight/metric-collector:v0.1-20230330133800 |
|
metricbeat Updated |
mirantis.azurecr.io/stacklight/metricbeat:7.12.1-20230331123540 |
|
node-exporter |
mirantis.azurecr.io/stacklight/node-exporter:v1.5.0 |
|
opensearch Updated |
mirantis.azurecr.io/stacklight/opensearch:1-20230403060750 |
|
opensearch-dashboards Updated |
mirantis.azurecr.io/stacklight/opensearch-dashboards:1-20230403060759 |
|
pgbouncer Updated |
mirantis.azurecr.io/stacklight/pgbouncer:1-20230331023020 |
|
prometheus |
mirantis.azurecr.io/stacklight/prometheus:v2.40.7 |
|
prometheus-es-exporter Updated |
mirantis.azurecr.io/stacklight/prometheus-es-exporter:v0.14.0-20230331023015 |
|
prometheus-msteams Updated |
mirantis.azurecr.io/stacklight/prometheus-msteams:v1.5.1 |
|
prometheus-patroni-exporter Updated |
mirantis.azurecr.io/stacklight/prometheus-patroni-exporter:0.0.1-20230331023020 |
|
prometheus-postgres-exporter |
mirantis.azurecr.io/stacklight/prometheus-postgres-exporter:v0.9.0 |
|
prometheus-relay Updated |
mirantis.azurecr.io/stacklight/prometheus-relay:v0.4-20230331023018 |
|
sf-notifier Updated |
mirantis.azurecr.io/stacklight/sf-notifier:v0.3-20230331023014 |
|
sf-reporter Updated |
mirantis.azurecr.io/stacklight/sf-reporter:v0.1-20230403174259 |
|
spilo Updated |
mirantis.azurecr.io/stacklight/spilo:13-2.1p9-20230404125347 |
|
stacklight-toolkit Updated |
mirantis.azurecr.io/stacklight/stacklight-toolkit:20230331023016 |
|
telegraf |
mirantis.azurecr.io/stacklight/telegraf:v1.9.1-20230331023009 Updated |
|
mirantis.azurecr.io/stacklight/telegraf:1.23.4-20230317023017 Updated |
||
telemeter Updated |
mirantis.azurecr.io/stacklight/telemeter:4.4-20230331023013 |
|
telemeter-token-auth Updated |
mirantis.azurecr.io/stacklight/telemeter-token-auth:v0.1-20230331023015 |
|
yq Updated |
mirantis.azurecr.io/stacklight/yq:4.32.2 |
Unchanged as compared to 11.7.0
Artifact |
Component |
Path |
|---|---|---|
Debian repositories |
System packages |
|
http://mirror.mirantis.com/kaas/kubernetes-extra-rhel7-0.0.7/ |
||
https://mirror.mirantis.com/kaas/ubuntu-2023-01-26-014412.target.txt |
||
MCR repositories |
MCR |
https://repos.mirantis.com/ubuntu/dists/bionic/pool/stable-20.10/ |
Target ubuntu system 1 |
Ubuntu |
https://binary.mirantis.com/bm/bin/efi/ubuntu/tgz-focal-20230126185755 |
https://binary.mirantis.com/bm/bin/efi/ubuntu/tgz-bionic-5.4-20230126183021 2 |
This section outlines release notes for the Cluster release 11.7.0 that is introduced in the Mirantis Container Cloud release 2.23.0.
This Cluster release supports Mirantis Kubernetes Engine 3.5.7 with Kubernetes 1.21 and Mirantis Container Runtime 20.10.13.
This section outlines new features implemented in the Cluster release 11.7.0 that is introduced in the Container Cloud release 2.23.0.
Updated the Mirantis Kubernetes Engine (MKE) version from 3.5.5 to 3.5.7 for the Container Cloud management, regional, and managed clusters on all supported cloud providers, as well as for non Container Cloud based MKE cluster attachment.
Note
For MOSK-based deployments, the feature support is available since MOSK 23.1.
Learn more
Upgraded Ceph major version from Octopus 15.2.17 to Pacific 16.2.11 with an automatic upgrade of Ceph components on existing managed clusters during the Cluster version update.
Caution
Since Ceph Pacific, while mounting an RBD or CephFS volume, CSI
drivers do not propagate the 777 permission on the mount path.
Note
For MOSK-based deployments, the feature support is available since MOSK 23.1.
Implemented deployment of two iam-proxy instances for the StackLight HA
setup that ensures access to HA components if one iam-proxy instance
fails. The second iam-proxy instance is automatically deployed during
cluster update on existing StackLight HA deployments.
Note
For MOSK-based deployments, the feature support is available since MOSK 23.1.
Added the capability to forward logs to external Elasticsearch and OpenSearch
servers as the fluentd-logs output. This enhancement also expands existing
configuration options for log forwarding to syslog.
Introduced logging.externalOutputs that deprecates logging.syslog and
enables you to configure any number of outputs with more configuration
flexibility.
Note
For MOSK-based deployments, the feature support is available since MOSK 23.1.
Learn more
Implemented the MCC Applications Performance Grafana dashboard that provides information on the Container Cloud internals work based on Golang, controller runtime, and some custom metrics. You can use it to verify performance of applications and for troubleshooting purposes.
Note
For MOSK-based deployments, the feature support is available since MOSK 23.1.
Learn more
Implemented the following options that enable configuration of persistent volumes for Reference Application :
refapp.workload.persistentVolumeEnabledrefapp.workload.persistentVolumeSize
Note
The refapp.workload.persistentVolumeEnabled option is enabled by
default and is recommended for production clusters.
Caution
For MKE clusters that are part of MOSK infrastructure, the feature is not supported yet.
The following table lists the components versions of the Cluster release 11.7.0. For major components and versions of the Container Cloud release, see Container Cloud release 2.23.0.
Note
The components that are newly added, updated, deprecated, or removed
as compared to the previous release version, are marked
with a corresponding superscript,
for example, lcm-ansible Updated.
Component |
Application/Service |
Version |
|---|---|---|
Cluster orchestration |
Mirantis Kubernetes Engine Updated |
3.5.7 0 |
Container runtime |
Mirantis Container Runtime |
20.10.13 1 |
Distributed storage Updated |
Ceph |
16.2.11 (Pacific) |
Rook |
1.0.0-20230120144247 |
|
LCM |
Helm |
2.16.11-40 |
helm-controller Updated |
1.36.3 |
|
lcm-ansible Updated |
0.21.0-39-g5b167de |
|
lcm-agent Updated |
1.36.3 |
|
StackLight |
Alerta Updated |
8.5.0 |
Alertmanager Updated |
0.25.0 |
|
Alertmanager Webhook ServiceNow Updated |
0.1 |
|
Blackbox Exporter Updated |
0.23.0 |
|
cAdvisor |
0.46.0 |
|
Cerebro |
0.9.4 |
|
Elasticsearch Curator |
5.7.6 |
|
Elasticsearch Exporter |
1.0.2 |
|
Fluentd |
1.15.3 |
|
Grafana |
9.1.8 |
|
Grafana Image Renderer Updated |
3.6.1 |
|
kube-state-metrics Updated |
2.7.0 |
|
IAM Proxy |
6.0.1 |
|
Metric Collector Updated |
0.1 |
|
Metricbeat |
7.10.2 |
|
Node Exporter Updated |
1.5.0 |
|
OpenSearch Updated |
1.3.7 |
|
OpenSearch Dashboards Updated |
1.3.7 |
|
Prometheus Updated |
2.40.7 |
|
Prometheus ES Exporter Updated |
0.14.0 |
|
Prometheus MS Teams |
1.4.2 |
|
Prometheus Patroni Exporter |
0.0.1 |
|
Prometheus Postgres Exporter |
0.9.0 |
|
Prometheus Relay Updated |
0.4 |
|
sf-notifier Updated |
0.3 |
|
sf-reporter Updated |
0.1 |
|
Spilo Updated |
13-2.1p9 |
|
Telegraf |
1.9.1 Updated |
|
1.23.4 Updated |
||
Telemeter |
4.4 |
- 0
For the Mirantis Kubernetes Engine (MKE) release highlights and components versions, see MKE documentation: MKE release notes.
- 1
For the Mirantis Container Runtime (MCR) release highlights, see MCR documentation: MCR release notes.
This section lists the components artifacts of the Cluster release 11.7.0. For artifacts of the Container Cloud release, see Container Cloud release 2.23.0.
Note
The components that are newly added, updated, deprecated, or removed
as compared to the previous release version, are marked
with a corresponding superscript,
for example, lcm-ansible Updated.
Artifact |
Component |
Path |
|---|---|---|
Helm chart |
ceph-controller Updated |
https://binary.mirantis.com/ceph/helm/ceph-operator-1.0.0-mcc-2.23-12.tgz |
Docker images Updated |
ceph |
mirantis.azurecr.io/ceph/ceph:v16.2.11 |
ceph-controller |
mirantis.azurecr.io/ceph/mcp/ceph-controller:2.23-11 |
|
cephcsi |
mirantis.azurecr.io/ceph/cephcsi/cephcsi:v3.7.2 |
|
csi-node-driver-registrar |
mirantis.azurecr.io/ceph/k8scsi/csi-node-driver-registrar:v2.5.1 |
|
csi-provisioner |
mirantis.azurecr.io/ceph/k8scsi/csi-provisioner:v3.3.0 |
|
csi-snapshotter |
mirantis.azurecr.io/ceph/k8scsi/csi-snapshotter:v6.1.0 |
|
csi-attacher |
mirantis.azurecr.io/ceph/k8scsi/csi-attacher:v4.0.0 |
|
csi-resizer |
mirantis.azurecr.io/ceph/k8scsi/csi-resizer:v1.6.0 |
|
rook |
mirantis.azurecr.io/ceph/rook:v1.0.0-20230120144247 |
Artifact |
Component |
Path |
|---|---|---|
Binaries Updated |
lcm-ansible |
https://binary.mirantis.com/lcm/bin/lcm-ansible/v0.21.0-39-g5b167de/lcm-ansible.tar.gz |
lcm-agent |
||
Helm charts Updated |
helm-controller |
https://binary.mirantis.com/core/helm/helm-controller-1.36.3.tgz |
managed-lcm-api |
https://binary.mirantis.com/core/helm/managed-lcm-api-1.36.3.tgz |
|
Docker images |
helm-controller Updated |
mirantis.azurecr.io/core/lcm-controller:1.36.3 |
Artifact |
Component |
Path |
|---|---|---|
Helm charts |
alerta Updated |
https://binary.mirantis.com/stacklight/helm/alerta-0.1.0-mcp-29.tgz |
alertmanager-webhook-servicenow |
https://binary.mirantis.com/stacklight/helm/alertmanager-webhook-servicenow-0.2.0-mcp-4.tgz |
|
cadvisor |
https://binary.mirantis.com/stacklight/helm/cadvisor-0.1.0-mcp-2.tgz |
|
cerebro |
https://binary.mirantis.com/stacklight/helm/cerebro-0.1.0-mcp-2.tgz |
|
elasticsearch-curator |
https://binary.mirantis.com/stacklight/helm/elasticsearch-curator-1.5.0-mcp-10.tgz |
|
elasticsearch-exporter |
https://binary.mirantis.com/stacklight/helm/elasticsearch-exporter-1.2.0-mcp-6.tgz |
|
fluentd Updated |
https://binary.mirantis.com/stacklight/helm/fluentd-2.0.3-mcp-49.tgz |
|
fluentd-logs Updated |
https://binary.mirantis.com/stacklight/helm/fluentd-logs-0.1.0-mcp-170.tgz |
|
grafana Updated |
https://binary.mirantis.com/stacklight/helm/grafana-3.3.10-mcp-194.tgz |
|
iam-proxy Updated |
||
metric-collector |
https://binary.mirantis.com/stacklight/helm/metric-collector-0.3.0-mcp-10.tgz |
|
metricbeat |
https://binary.mirantis.com/stacklight/helm/metricbeat-1.7.1-mcp-16.tgz |
|
opensearch |
https://binary.mirantis.com/stacklight/helm/opensearch-0.1.0-mcp-52.tgz |
|
opensearch-dashboards Updated |
https://binary.mirantis.com/stacklight/helm/opensearch-dashboards-0.1.0-mcp-44.tgz |
|
patroni Updated |
https://binary.mirantis.com/stacklight/helm/patroni-0.15.1-mcp-48.tgz |
|
prometheus |
https://binary.mirantis.com/stacklight/helm/prometheus-8.11.4-mcp-229.tgz |
|
prometheus-blackbox-exporter |
https://binary.mirantis.com/stacklight/helm/prometheus-blackbox-exporter-0.3.0-mcp-11.tgz |
|
prometheus-es-exporter |
https://binary.mirantis.com/stacklight/helm/prometheus-es-exporter-1.0.0-mcp-11.tgz |
|
prometheus-msteams |
https://binary.mirantis.com/stacklight/helm/prometheus-msteams-0.1.0-mcp-9.tgz |
|
refapp Updated |
https://binary.mirantis.com/scale/helm/refapp-0.2.1-mcp-9.tgz |
|
sf-notifier |
https://binary.mirantis.com/stacklight/helm/sf-notifier-0.2.0-mcp-4.tgz |
|
sf-reporter |
https://binary.mirantis.com/stacklight/helm/sf-reporter-0.2.0-mcp-6.tgz |
|
stacklight Updated |
https://binary.mirantis.com/stacklight/helm/stacklight-0.11.3.tgz |
|
telegraf-ds |
https://binary.mirantis.com/stacklight/helm/telegraf-ds-1.1.5-mcp-29.tgz |
|
telegraf-s |
https://binary.mirantis.com/stacklight/helm/telegraf-s-1.1.5-mcp-30.tgz |
|
telemeter-client |
https://binary.mirantis.com/stacklight/helm/telemeter-client-0.2.0-mcp-7.tgz |
|
telemeter-server |
https://binary.mirantis.com/stacklight/helm/telemeter-server-0.2.0-mcp-7.tgz |
|
Docker images |
alerta-web Updated |
mirantis.azurecr.io/stacklight/alerta-web:8.5.0-20230206172055 |
alertmanager Updated |
mirantis.azurecr.io/stacklight/alertmanager:v0.25.0 |
|
alertmanager-webhook-servicenow Updated |
mirantis.azurecr.io/stacklight/alertmanager-webhook-servicenow:v0.1-20230206145038 |
|
alpine-utils Updated |
mirantis.azurecr.io/stacklight/alpine-utils:1-20230203125601 |
|
blackbox-exporter Updated |
mirantis.azurecr.io/stacklight/blackbox-exporter:v0.23.0 |
|
cadvisor |
mirantis.azurecr.io/stacklight/cadvisor:v0.46.0 |
|
cerebro Updated |
mirantis.azurecr.io/stacklight/cerebro:v0.9-20230203125548 |
|
configmap-reload Updated |
mirantis.azurecr.io/stacklight/configmap-reload:v0.8.0 |
|
curator Updated |
mirantis.azurecr.io/stacklight/curator:5.7.6-20230206171950 |
|
elasticsearch_exporter |
mirantis.azurecr.io/stacklight/elasticsearch_exporter:1.0.2 |
|
fluentd Updated |
mirantis.azurecr.io/stacklight/fluentd:1.15-20230203125530 |
|
grafana |
mirantis.azurecr.io/stacklight/grafana:9.1.8 |
|
grafana-image-renderer |
mirantis.azurecr.io/stacklight/grafana-image-renderer:3.6.1-20221103105602 |
|
k8s-sidecar Updated |
mirantis.azurecr.io/stacklight/k8s-sidecar:1.21.0-20230206130934 |
|
kube-state-metrics Updated |
mirantis.azurecr.io/stacklight/kube-state-metrics:v2.7.0 |
|
kubectl |
mirantis.azurecr.io/stacklight/kubectl:1.22.13 |
|
metric-collector Updated |
mirantis.azurecr.io/stacklight/metric-collector:v0.1-20221227141656 |
|
metricbeat Updated |
mirantis.azurecr.io/stacklight/metricbeat:7.10.2-20230203125534 |
|
node-exporter Updated |
mirantis.azurecr.io/stacklight/node-exporter:v1.5.0 |
|
opensearch Updated |
mirantis.azurecr.io/stacklight/opensearch:1-20230203125541 |
|
opensearch-dashboards Updated |
mirantis.azurecr.io/stacklight/opensearch-dashboards:1-20230203125528 |
|
pgbouncer Updated |
mirantis.azurecr.io/stacklight/pgbouncer:1-20230203125558 |
|
prometheus Updated |
mirantis.azurecr.io/stacklight/prometheus:v2.40.7 |
|
prometheus-es-exporter Updated |
mirantis.azurecr.io/stacklight/prometheus-es-exporter:v0.14.0-20230206130434 |
|
prometheus-msteams |
mirantis.azurecr.io/stacklight/prometheus-msteams:v1.4.2 |
|
prometheus-patroni-exporter Updated |
mirantis.azurecr.io/stacklight/prometheus-patroni-exporter:0.0.1-20230203125555 |
|
prometheus-postgres-exporter |
mirantis.azurecr.io/stacklight/prometheus-postgres-exporter:v0.9.0 |
|
prometheus-relay Updated |
mirantis.azurecr.io/stacklight/prometheus-relay:v0.4-20230203125553 |
|
refapp |
mirantis.azurecr.io/openstack/openstack-refapp:0.0.1.dev29 |
|
sf-notifier Updated |
mirantis.azurecr.io/stacklight/sf-notifier:v0.3-20230206130301 |
|
sf-reporter Updated |
mirantis.azurecr.io/stacklight/sf-reporter:v0.1-20230206133637 |
|
spilo Updated |
mirantis.azurecr.io/stacklight/spilo:13-2.1p9-20230203124803 |
|
stacklight-toolkit Updated |
mirantis.azurecr.io/stacklight/stacklight-toolkit:20230203125546 |
|
telegraf |
mirantis.azurecr.io/stacklight/telegraf:v1.9.1-20230203125527 Updated |
|
mirantis.azurecr.io/stacklight/telegraf:1.23.4-20220915114529 |
||
telemeter Updated |
mirantis.azurecr.io/stacklight/telemeter:4.4-20230203125536 |
|
telemeter-token-auth Updated |
mirantis.azurecr.io/stacklight/telemeter-token-auth:v0.1-20230203125540 |
|
yq Updated |
mirantis.azurecr.io/stacklight/yq:4.30.6 |
Artifact |
Component |
Path |
|---|---|---|
Debian repositories |
System packages |
|
http://mirror.mirantis.com/kaas/kubernetes-extra-rhel7-0.0.7/ |
||
https://mirror.mirantis.com/kaas/ubuntu-2023-01-26-014412.target.txt |
||
MCR repositories |
MCR |
https://repos.mirantis.com/ubuntu/dists/bionic/pool/stable-20.10/ |
Target ubuntu system 1 |
Ubuntu Updated |
https://binary.mirantis.com/bm/bin/efi/ubuntu/tgz-focal-20230126185755 |
https://binary.mirantis.com/bm/bin/efi/ubuntu/tgz-bionic-5.4-20230126183021 2 |
For the list of known and addressed issues, refer to the Container Cloud release 2.23.0 section.
See also
This section outlines release notes for the Cluster release 11.6.0 that is introduced in the Mirantis Container Cloud release 2.22.0.
This Cluster release supports Mirantis Kubernetes Engine 3.5.5 with Kubernetes 1.21 and Mirantis Container Runtime 20.10.13.
This section outlines new features implemented in the Cluster release 11.6.0 that is introduced in the Container Cloud release 2.22.0.
Implemented monitoring of bond interfaces for clusters based on bare metal and Equinix Metal with public or private networking. The number of active and configured slaves per bond is now monitored with the following alerts raising in case of issues:
BondInterfaceDownBondInterfaceSlaveDownBondInterfaceOneSlaveLeftBondInterfaceOneSlaveConfigured
Note
For MOSK-based deployments, the feature support is available since MOSK 23.1.
Learn more
Implemented the following panels in the Grafana dashboards for OpenSearch and Prometheus that provide details on the storage usage and allow calculating the possible retention time based on provisioned storage and average usage:
OpenSearch dashboard:
Cluster > Estimated Retention
Resources > Disk
Resources > File System Used Space by Percentage
Resources > Stored Indices Disk Usage
Resources > Age of Logs
Prometheus dashboard:
Cluster > Estimated Retention
Resources > Storage
Resources > Strage by Percentage
Note
For MOSK-based deployments, the feature support is available since MOSK 23.1.
Added cAdvisor to the StackLight deployment on any type of Container Cloud cluster that allows gathering metrics about usage of container resources.
Enhanced support for Reference Application that is designed for workload monitoring on managed clusters adding the Enable Reference Application check box to the StackLight tab of the Create new cluster wizard in the Container Cloud web UI.
You can also enable this option after deployment using the
Configure cluster menu of the Container Cloud web UI or using CLI
by editing the StackLight parameters in the Cluster object.
The Reference Application enhancement also comprises switching from MariaDB to PostgreSQL to improve the application stability and performance.
Note
Reference Application requires the following resources per cluster on top of the main product requirements:
Up to 1 GiB of RAM
Up to 3 GiB of storage
Increased the default number of Ceph Managers deployed on a Ceph cluster to two, active and stand-by, to improve fault tolerance and HA.
On existing clusters, the second Ceph Manager deploys automatically after a managed cluster update.
Note
Mirantis recommends labeling at least 3 Ceph nodes with the mgr
role that equals the default number of Ceph nodes for the mon role.
In such configuration, one back-up Ceph node will be available to redeploy
a failed Ceph Manager in case of a server outage.
Note
For MOSK-based deployments, the feature support is available since MOSK 23.1.
The following table lists the components versions of the Cluster release 11.6.0. For major components and versions of the Container Cloud release, see Container Cloud release 2.22.0.
Note
The components that are newly added, updated, deprecated, or removed
as compared to the previous release version, are marked
with a corresponding superscript,
for example, lcm-ansible Updated.
Component |
Application/Service |
Version |
|---|---|---|
Cluster orchestration |
Mirantis Kubernetes Engine |
3.5.5 0 |
Container runtime |
Mirantis Container Runtime |
20.10.13 1 |
Distributed storage |
Ceph |
15.2.17 (Octopus) |
Rook |
1.0.0-20220809220209 |
|
LCM |
Helm |
2.16.11-40 |
helm-controller Updated |
0.3.0-352-gf55d6378 |
|
lcm-ansible Updated |
0.20.1-2-g9148ac3 |
|
lcm-agent Updated |
0.3.0-352-gf55d6378 |
|
StackLight |
Alerta Updated |
8.5.0-20221122164956 |
Alertmanager |
0.23.0 |
|
Alertmanager Webhook ServiceNow Updated |
0.1-20221124153923 |
|
Blackbox Exporter |
0.19.0 |
|
cAdvisor New |
0.46.0 |
|
Cerebro Updated |
0.9.4 |
|
Elasticsearch Curator |
5.7.6 |
|
Elasticsearch Exporter |
1.0.2 |
|
Fluentd Updated |
1.15.3 |
|
Grafana Updated |
9.1.8 |
|
Grafana Image Renderer Updated |
3.6.1-20221103105602 |
|
kube-state-metrics |
2.2.4 |
|
IAM Proxy |
6.0.1 |
|
Metric Collector Updated |
0.1-20221115143126 |
|
Metricbeat Updated |
7.10.2 |
|
Node Exporter |
1.2.2 |
|
OpenSearch Updated |
1-20221129201140 |
|
OpenSearch Dashboards Updated |
1-20221213070555 |
|
Prometheus |
2.35.0 |
|
Prometheus ES Exporter Updated |
0.14.0-20221028070923 |
|
Prometheus MS Teams |
1.4.2 |
|
Prometheus NGINX Exporter Removed |
n/a |
|
Prometheus Node Exporter Renamed to Node Exporter |
n/a |
|
Prometheus Patroni Exporter Updated |
0.0.1 |
|
Prometheus Postgres Exporter |
0.9.0 |
|
Prometheus Relay |
0.3-20210317133316 |
|
sf-notifier Updated |
0.3-20221103105502 |
|
sf-reporter Updated |
0.1-20221128192801 |
|
Spilo |
13-2.1p1-20220921105803 |
|
Telegraf |
1.9.1-20221107155248 Updated |
|
1.23.4-20220915114529 |
||
Telemeter Updated |
4.4 |
- 0
For the Mirantis Kubernetes Engine (MKE) release highlights and components versions, see MKE documentation: MKE release notes.
- 1
For the Mirantis Container Runtime (MCR) release highlights, see MCR documentation: MCR release notes.
This section lists the components artifacts of the Cluster release 11.6.0. For artifacts of the Container Cloud release, see Container Cloud release 2.22.0.
Note
The components that are newly added, updated, deprecated, or removed
as compared to the previous release version, are marked
with a corresponding superscript,
for example, lcm-ansible Updated.
Artifact |
Component |
Path |
|---|---|---|
Helm chart |
ceph-controller Updated |
https://binary.mirantis.com/ceph/helm/ceph-operator-1.0.0-mcc-2.22-3.tgz |
Docker images |
ceph |
mirantis.azurecr.io/ceph/ceph:v15.2.17 |
ceph-controller Updated |
mirantis.azurecr.io/ceph/mcp/ceph-controller:v1.0.0-20221221183423 |
|
cephcsi |
mirantis.azurecr.io/ceph/cephcsi/cephcsi:v3.4.0 |
|
csi-node-driver-registrar |
mirantis.azurecr.io/ceph/k8scsi/csi-node-driver-registrar:v2.1.0 |
|
csi-provisioner |
mirantis.azurecr.io/ceph/k8scsi/csi-provisioner:v2.1.2 |
|
csi-snapshotter |
mirantis.azurecr.io/ceph/k8scsi/csi-snapshotter:v4.0.0 |
|
csi-attacher |
mirantis.azurecr.io/ceph/k8scsi/csi-attacher:v3.1.0 |
|
csi-resizer |
mirantis.azurecr.io/ceph/k8scsi/csi-resizer:v1.1.0 |
|
rook |
mirantis.azurecr.io/ceph/rook:v1.0.0-20220809220209 |
Artifact |
Component |
Path |
|---|---|---|
Binaries Updated |
lcm-ansible |
https://binary.mirantis.com/lcm/bin/lcm-ansible/v0.20.1-2-g9148ac3/lcm-ansible.tar.gz |
lcm-agent |
https://binary.mirantis.com/lcm/bin/lcm-agent/v0.3.0-352-gf55d6378/lcm-agent |
|
Helm charts Updated |
helm-controller |
https://binary.mirantis.com/core/helm/helm-controller-1.35.11.tgz |
managed-lcm-api |
https://binary.mirantis.com/core/helm/managed-lcm-api-1.35.11.tgz |
|
Docker images |
helm-controller Updated |
mirantis.azurecr.io/lcm/lcm-controller:v0.3.0-352-gf55d6378 |
Artifact |
Component |
Path |
|---|---|---|
Helm charts |
alerta Updated |
https://binary.mirantis.com/stacklight/helm/alerta-0.1.0-mcp-27.tgz |
alertmanager-webhook-servicenow |
https://binary.mirantis.com/stacklight/helm/alertmanager-webhook-servicenow-0.2.0-mcp-4.tgz |
|
cadvisor New |
https://binary.mirantis.com/stacklight/helm/cadvisor-0.1.0-mcp-2.tgz |
|
cerebro |
https://binary.mirantis.com/stacklight/helm/cerebro-0.1.0-mcp-2.tgz |
|
elasticsearch-curator |
https://binary.mirantis.com/stacklight/helm/elasticsearch-curator-1.5.0-mcp-10.tgz |
|
elasticsearch-exporter |
https://binary.mirantis.com/stacklight/helm/elasticsearch-exporter-1.2.0-mcp-6.tgz |
|
fluentd Updated |
https://binary.mirantis.com/stacklight/helm/fluentd-2.0.3-mcp-44.tgz |
|
fluentd-logs Updated |
https://binary.mirantis.com/stacklight/helm/fluentd-logs-0.1.0-mcp-156.tgz |
|
grafana Updated |
https://binary.mirantis.com/stacklight/helm/grafana-3.3.10-mcp-191.tgz |
|
iam-proxy |
||
metric-collector |
https://binary.mirantis.com/stacklight/helm/metric-collector-0.3.0-mcp-10.tgz |
|
metricbeat |
https://binary.mirantis.com/stacklight/helm/metricbeat-1.7.1-mcp-16.tgz |
|
opensearch |
https://binary.mirantis.com/stacklight/helm/opensearch-0.1.0-mcp-52.tgz |
|
opensearch-dashboards |
https://binary.mirantis.com/stacklight/helm/opensearch-dashboards-0.1.0-mcp-40.tgz |
|
patroni Updated |
https://binary.mirantis.com/stacklight/helm/patroni-0.15.1-mcp-45.tgz |
|
prometheus |
https://binary.mirantis.com/stacklight/helm/prometheus-8.11.4-mcp-229.tgz |
|
prometheus-blackbox-exporter |
https://binary.mirantis.com/stacklight/helm/prometheus-blackbox-exporter-0.3.0-mcp-11.tgz |
|
prometheus-es-exporter |
https://binary.mirantis.com/stacklight/helm/prometheus-es-exporter-1.0.0-mcp-11.tgz |
|
prometheus-msteams |
https://binary.mirantis.com/stacklight/helm/prometheus-msteams-0.1.0-mcp-9.tgz |
|
prometheus-nginx-exporter Removed |
n/a |
|
refapp Updated |
https://binary.mirantis.com/scale/helm/refapp-0.2.1-mcp-1.tgz |
|
sf-notifier |
https://binary.mirantis.com/stacklight/helm/sf-notifier-0.2.0-mcp-4.tgz |
|
sf-reporter Updated |
https://binary.mirantis.com/stacklight/helm/sf-reporter-0.2.0-mcp-6.tgz |
|
stacklight Updated |
https://binary.mirantis.com/stacklight/helm/stacklight-0.10.6.tgz |
|
telegraf-ds |
https://binary.mirantis.com/stacklight/helm/telegraf-ds-1.1.5-mcp-29.tgz |
|
telegraf-s |
https://binary.mirantis.com/stacklight/helm/telegraf-s-1.1.5-mcp-30.tgz |
|
telemeter-client |
https://binary.mirantis.com/stacklight/helm/telemeter-client-0.2.0-mcp-7.tgz |
|
telemeter-server |
https://binary.mirantis.com/stacklight/helm/telemeter-server-0.2.0-mcp-7.tgz |
|
Docker images |
alerta-web Updated |
mirantis.azurecr.io/stacklight/alerta-web:8.5.0-20221122164956 |
alertmanager |
mirantis.azurecr.io/stacklight/alertmanager:v0.23.0 |
|
alertmanager-webhook-servicenow Updated |
mirantis.azurecr.io/stacklight/alertmanager-webhook-servicenow:v0.1-20221124153923 |
|
alpine-utils New |
mirantis.azurecr.io/stacklight/alpine-utils:1-20221213101955 |
|
blackbox-exporter |
mirantis.azurecr.io/stacklight/blackbox-exporter:v0.19.0 |
|
busybox Removed |
n/a |
|
cadvisor New |
mirantis.azurecr.io/stacklight/cadvisor:v0.46.0 |
|
cerebro Updated |
mirantis.azurecr.io/stacklight/cerebro:v0.9-20221028114642 |
|
configmap-reload |
mirantis.azurecr.io/stacklight/configmap-reload:v0.3.0 |
|
curator Updated |
mirantis.azurecr.io/stacklight/curator:5.7.6-20221125180652 |
|
curl Removed |
n/a |
|
curl-jq Removed |
n/a |
|
elasticsearch_exporter |
mirantis.azurecr.io/stacklight/elasticsearch_exporter:1.0.2 |
|
fluentd Updated |
mirantis.azurecr.io/stacklight/fluentd:1.15-20221205103417 |
|
grafana Updated |
mirantis.azurecr.io/stacklight/grafana:9.1.8 |
|
grafana-image-renderer Updated |
mirantis.azurecr.io/stacklight/grafana-image-renderer:3.6.1-20221103105602 |
|
k8s-sidecar Updated |
mirantis.azurecr.io/stacklight/k8s-sidecar:1.21.0-20221122115008 |
|
kube-state-metrics |
mirantis.azurecr.io/stacklight/kube-state-metrics:v2.2.4 |
|
kubectl |
mirantis.azurecr.io/stacklight/kubectl:1.22.13 |
|
metric-collector Updated |
mirantis.azurecr.io/stacklight/metric-collector:v0.1-20221115143126 |
|
metricbeat Updated |
mirantis.azurecr.io/stacklight/metricbeat:7.10.2-20221208132713 |
|
nginx-prometheus-exporter Removed |
n/a |
|
node-exporter |
mirantis.azurecr.io/stacklight/node-exporter:v1.2.2 |
|
opensearch Updated |
mirantis.azurecr.io/stacklight/opensearch:1-20221129201140 |
|
opensearch-dashboards Updated |
mirantis.azurecr.io/stacklight/opensearch-dashboards:1-20221213070555 |
|
origin-telemeter Removed |
n/a |
|
pgbouncer Updated |
mirantis.azurecr.io/stacklight/pgbouncer:1-20221116202249 |
|
prometheus |
mirantis.azurecr.io/stacklight/prometheus:v2.35.0 |
|
prometheus-es-exporter Updated |
mirantis.azurecr.io/stacklight/prometheus-es-exporter:v0.14.0-20221028070923 |
|
prometheus-msteams |
mirantis.azurecr.io/stacklight/prometheus-msteams:v1.4.2 |
|
prometheus-patroni-exporter Updated |
mirantis.azurecr.io/stacklight/prometheus-patroni-exporter:0.0.1-2022111wont-fix/8112512 |
|
prometheus-postgres-exporter |
mirantis.azurecr.io/stacklight/prometheus-postgres-exporter:v0.9.0 |
|
prometheus-relay |
mirantis.azurecr.io/stacklight/prometheus-relay:v0.3-20210317133316 |
|
refapp |
mirantis.azurecr.io/openstack/openstack-refapp:0.0.1.dev29 |
|
sf-notifier Updated |
mirantis.azurecr.io/stacklight/sf-notifier:v0.3-20221103105502 |
|
sf-reporter Updated |
mirantis.azurecr.io/stacklight/sf-reporter:v0.1-20221128192801 |
|
spilo |
mirantis.azurecr.io/stacklight/spilo:13-2.1p1-20220921105803 |
|
stacklight-toolkit Updated |
mirantis.azurecr.io/stacklight/stacklight-toolkit:20221202065207 |
|
telegraf |
mirantis.azurecr.io/stacklight/telegraf:v1.9.1-20221107155248 Updated |
|
mirantis.azurecr.io/stacklight/telegraf:1.23.4-20220915114529 |
||
telemeter New |
mirantis.azurecr.io/stacklight/telemeter:4.4-20221129100512 |
|
telemeter-token-auth |
mirantis.azurecr.io/stacklight/telemeter-token-auth:v0.1-20200406175600 |
|
yq Updated |
mirantis.azurecr.io/stacklight/yq:4.30.5 |
Artifact |
Component |
Path |
|---|---|---|
Debian repositories |
System packages |
|
http://mirror.mirantis.com/kaas/kubernetes-extra-rhel7-0.0.6/ |
||
https://mirror.mirantis.com/kaas/ubuntu-2022-09-15-014207.target.txt |
||
MCR repositories |
MCR |
https://repos.mirantis.com/ubuntu/dists/bionic/pool/stable-20.10/ |
Target ubuntu system 1 |
Ubuntu |
https://binary.mirantis.com/bm/bin/efi/ubuntu/tgz-focal-20220915105522 |
https://binary.mirantis.com/bm/bin/efi/ubuntu/tgz-bionic-5.4-20220915105637 2 |
For the list of known and addressed issues, refer to the Container Cloud release 2.22.0 section.
See also
This section outlines release notes for the Cluster release 11.5.0 that is introduced in the Mirantis Container Cloud release 2.21.0.
This Cluster release supports Mirantis Kubernetes Engine 3.5.5 with Kubernetes 1.21 and Mirantis Container Runtime 20.10.13.
This section outlines new features implemented in the Cluster release 11.5.0 that is introduced in the Container Cloud release 2.21.0.
Updated the Mirantis Kubernetes Engine (MKE) version from 3.5.4 to 3.5.5 and the Mirantis Container Runtime (MCR) version from 20.10.12 to 20.10.13 for the Container Cloud management, regional, and managed clusters on all supported cloud providers, as well as for non Container Cloud based MKE cluster attachment.
Caution
For MKE clusters that are part of MOSK infrastructure, the feature support will become available in one of the following Container Cloud releases.
Updated the MetalLB version from 0.12.1 to 0.13.4 for the Container Cloud management, regional, and managed clusters of all cloud providers that use MetalLB: bare metal, Equinix Metal with public and private networking, vSphere.
The MetalLB configuration is now stored in dedicated MetalLB objects
instead of the ConfigMap object.
Caution
For MKE clusters that are part of MOSK infrastructure, the feature support will become available in one of the following Container Cloud releases.
Improved etcd monitoring by implementing the Etcd dashboard and
etcdDbSizeCritical and etcdDbSizeMajor alerts that inform about the
size of the etcd database.
Caution
For MKE clusters that are part of MOSK infrastructure, the feature support will become available in one of the following Container Cloud releases.
Learn more
Implemented Reference Application that is a small microservice application that enables workload monitoring on non-MOSK managed clusters. It mimics a classical microservice application and provides metrics that describe the likely behavior of user workloads.
Reference Application contains a set of alerts and a separate Grafana dashboard to provide check statuses of Reference Application and statistics such as response time and content length.
The feature is disabled by default and can be enabled using the StackLight configuration manifest.
Added the miraCephSecretsInfo specification to KaaSCephCluster.status.
This specification contains current state and details of secrets that are used
in the Ceph cluster, such as keyrings, Ceph clients, RADOS Gateway user
credentials, and so on.
Using miraCephSecretsInfo, you can create, access, and remove Ceph RADOS
Block Device (RBD) or Ceph File System (CephFS) clients and RADOS Gateway
(RGW) users.
Caution
For MKE clusters that are part of MOSK infrastructure, the feature is not supported yet.
Implemented the ability to create and configure Amazon S3 bucket policies between Ceph Object Storage users.
Caution
For MKE clusters that are part of MOSK infrastructure, the feature support will become available in one of the following Container Cloud releases.
The following table lists the components versions of the Cluster release 11.5.0.
Note
The components that are newly added, updated, deprecated, or removed
as compared to the previous release version, are marked
with a corresponding superscript,
for example, lcm-ansible Updated.
Component |
Application/Service |
Version |
|---|---|---|
Cluster orchestration Updated |
Mirantis Kubernetes Engine |
3.5.5 0 |
Container runtime Updated |
Mirantis Container Runtime |
20.10.13 1 |
Distributed storage Updated |
Ceph |
15.2.17 (Octopus) |
Rook |
1.0.0-20220809220209 |
|
LCM |
Helm |
2.16.11-40 |
helm-controller Updated |
0.3.0-327-gbc30b11b |
|
lcm-ansible Updated |
0.19.0-12-g6cad672 |
|
lcm-agent Updated |
0.3.0-327-gbc30b11b |
|
StackLight |
Alerta Updated |
8.5.0-20220923121625 |
Alertmanager |
0.23.0 |
|
Alertmanager Webhook ServiceNow |
0.1-20220706035316 |
|
Cerebro Updated |
0.9-20220923122026 |
|
Elasticsearch Curator |
5.7.6 |
|
Elasticsearch Exporter |
1.0.2 |
|
Fluentd Updated |
1.14-20220922214003 |
|
Grafana |
9.0.2 |
|
Grafana Image Renderer Updated |
3.5.0 |
|
IAM Proxy |
6.0.1 |
|
Metric Collector |
0.1-20220711134630 |
|
Metricbeat Updated |
7.10.2-20220909091002 |
|
OpenSearch |
1-20220517112057 |
|
OpenSearch Dashboards |
1-20220517112107 |
|
Prometheus |
2.35.0 |
|
Prometheus Blackbox Exporter |
0.19.0 |
|
Prometheus ES Exporter |
0.14.0-20220517111946 |
|
Prometheus MS Teams |
1.4.2 |
|
Prometheus Node Exporter |
1.2.2 |
|
Prometheus NGINX Exporter |
0.6.0 |
|
Prometheus Patroni Exporter |
0.1-20220624102731 |
|
Prometheus Postgres Exporter |
0.9.0 |
|
Prometheus Relay |
0.3-20210317133316 |
|
Reference Application New |
0.0.1 |
|
sf-notifier |
0.3-20220706035002 |
|
sf-reporter Updated |
0.1-20220916113234 |
|
Spilo Updated |
13-2.1p1-20220921105803 |
|
Telegraf |
1.9.1-20220714080809 |
|
1.23.4-20220915114529 Updated |
||
Telemeter |
4.4.0-20200424 |
- 0
For the Mirantis Kubernetes Engine (MKE) release highlights and components versions, see MKE documentation: MKE release notes.
- 1
For the Mirantis Container Runtime (MCR) release highlights, see MCR documentation: MCR release notes.
This section lists the components artifacts of the Cluster release 11.5.0.
Note
The components that are newly added, updated, deprecated, or removed
as compared to the previous release version, are marked
with a corresponding superscript,
for example, lcm-ansible Updated.
Artifact |
Component |
Path |
|---|---|---|
Helm chart |
ceph-controller Updated |
https://binary.mirantis.com/ceph/helm/ceph-operator-1.0.0-mcp-964.tgz |
Docker images |
ceph Updated |
mirantis.azurecr.io/ceph/ceph:v15.2.17 |
ceph-controller Updated |
mirantis.azurecr.io/ceph/mcp/ceph-controller:v1.0.0-20221024145202 |
|
cephcsi |
mirantis.azurecr.io/ceph/cephcsi/cephcsi:v3.4.0 |
|
csi-node-driver-registrar |
mirantis.azurecr.io/ceph/k8scsi/csi-node-driver-registrar:v2.1.0 |
|
csi-provisioner |
mirantis.azurecr.io/ceph/k8scsi/csi-provisioner:v2.1.2 |
|
csi-snapshotter |
mirantis.azurecr.io/ceph/k8scsi/csi-snapshotter:v4.0.0 |
|
csi-attacher |
mirantis.azurecr.io/ceph/k8scsi/csi-attacher:v3.1.0 |
|
csi-resizer |
mirantis.azurecr.io/ceph/k8scsi/csi-resizer:v1.1.0 |
|
rook Updated |
mirantis.azurecr.io/ceph/rook:v1.0.0-20220809220209 |
Artifact |
Component |
Path |
|---|---|---|
Binaries Updated |
lcm-ansible |
https://binary.mirantis.com/lcm/bin/lcm-ansible/v0.19.0-12-g6cad672/lcm-ansible.tar.gz |
lcm-agent |
https://binary.mirantis.com/lcm/bin/lcm-agent/v0.3.0-327-gbc30b11b/lcm-agent |
|
Helm charts Updated |
helm-controller |
https://binary.mirantis.com/core/helm/helm-controller-1.34.16.tgz |
managed-lcm-api |
https://binary.mirantis.com/core/helm/managed-lcm-api-1.34.16.tgz |
|
Docker images |
helm-controller Updated |
mirantis.azurecr.io/lcm/lcm-controller:v0.3.0-327-gbc30b11b |
Artifact |
Component |
Path |
|---|---|---|
Helm charts |
alerta |
https://binary.mirantis.com/stacklight/helm/alerta-0.1.0-mcp-25.tgz |
alertmanager-webhook-servicenow Updated |
https://binary.mirantis.com/stacklight/helm/alertmanager-webhook-servicenow-0.2.0-mcp-4.tgz |
|
cerebro |
https://binary.mirantis.com/stacklight/helm/cerebro-0.1.0-mcp-2.tgz |
|
elasticsearch-curator Updated |
https://binary.mirantis.com/stacklight/helm/elasticsearch-curator-1.5.0-mcp-10.tgz |
|
elasticsearch-exporter |
https://binary.mirantis.com/stacklight/helm/elasticsearch-exporter-1.2.0-mcp-6.tgz |
|
fluentd |
https://binary.mirantis.com/stacklight/helm/fluentd-2.0.3-mcp-37.tgz |
|
fluentd-logs Updated |
https://binary.mirantis.com/stacklight/helm/fluentd-logs-0.1.0-mcp-142.tgz |
|
grafana Updated |
https://binary.mirantis.com/stacklight/helm/grafana-3.3.10-mcp-173.tgz |
|
iam-proxy |
||
metric-collector Updated |
https://binary.mirantis.com/stacklight/helm/metric-collector-0.3.0-mcp-10.tgz |
|
metricbeat |
https://binary.mirantis.com/stacklight/helm/metricbeat-1.7.1-mcp-16.tgz |
|
opensearch |
https://binary.mirantis.com/stacklight/helm/opensearch-0.1.0-mcp-52.tgz |
|
opensearch-dashboards |
https://binary.mirantis.com/stacklight/helm/opensearch-dashboards-0.1.0-mcp-40.tgz |
|
patroni |
https://binary.mirantis.com/stacklight/helm/patroni-0.15.1-mcp-42.tgz |
|
prometheus Updated |
https://binary.mirantis.com/stacklight/helm/prometheus-8.11.4-mcp-229.tgz |
|
prometheus-blackbox-exporter |
https://binary.mirantis.com/stacklight/helm/prometheus-blackbox-exporter-0.3.0-mcp-11.tgz |
|
prometheus-es-exporter |
https://binary.mirantis.com/stacklight/helm/prometheus-es-exporter-1.0.0-mcp-11.tgz |
|
prometheus-msteams Updated |
https://binary.mirantis.com/stacklight/helm/prometheus-msteams-0.1.0-mcp-9.tgz |
|
prometheus-nginx-exporter |
https://binary.mirantis.com/stacklight/helm/prometheus-nginx-exporter-0.2.0-mcp-1.tgz |
|
refapp New |
https://binary.mirantis.com/scale/helm/refapp-0.1.1-mcp-1.tgz |
|
sf-notifier Updated |
https://binary.mirantis.com/stacklight/helm/sf-notifier-0.2.0-mcp-4.tgz |
|
sf-reporter Updated |
https://binary.mirantis.com/stacklight/helm/sf-reporter-0.2.0-mcp-5.tgz |
|
stacklight Updated |
https://binary.mirantis.com/stacklight/helm/stacklight-0.9.2.tgz |
|
telegraf-ds |
https://binary.mirantis.com/stacklight/helm/telegraf-ds-1.1.5-mcp-29.tgz |
|
telegraf-s |
https://binary.mirantis.com/stacklight/helm/telegraf-s-1.1.5-mcp-30.tgz |
|
telemeter-client Updated |
https://binary.mirantis.com/stacklight/helm/telemeter-client-0.2.0-mcp-7.tgz |
|
telemeter-server Updated |
https://binary.mirantis.com/stacklight/helm/telemeter-server-0.2.0-mcp-7.tgz |
|
Docker images |
alerta-web Updated |
mirantis.azurecr.io/stacklight/alerta-web:8.5.0-20220923121625 |
alertmanager |
mirantis.azurecr.io/stacklight/alertmanager:v0.23.0 |
|
alertmanager-webhook-servicenow |
mirantis.azurecr.io/stacklight/alertmanager-webhook-servicenow:v0.1-20220706035316 |
|
blackbox-exporter |
mirantis.azurecr.io/stacklight/blackbox-exporter:v0.19.0 |
|
busybox |
mirantis.azurecr.io/stacklight/busybox:1.30 |
|
cerebro Updated |
mirantis.azurecr.io/stacklight/cerebro:v0.9-20220923122026 |
|
configmap-reload |
mirantis.azurecr.io/stacklight/configmap-reload:v0.3.0 |
|
curator |
mirantis.azurecr.io/stacklight/curator:5.7.6 |
|
curl |
mirantis.azurecr.io/stacklight/curl:7.69.0 |
|
curl-jq |
mirantis.azurecr.io/stacklight/curl-jq:1.5-1 |
|
elasticsearch_exporter |
mirantis.azurecr.io/stacklight/elasticsearch_exporter:1.0.2 |
|
fluentd Updated |
mirantis.azurecr.io/stacklight/fluentd:1.14-20220922214003 |
|
grafana |
mirantis.azurecr.io/stacklight/grafana:9.0.2 |
|
grafana-image-renderer Updated |
mirantis.azurecr.io/stacklight/grafana-image-renderer:3.5.0 |
|
k8s-sidecar |
mirantis.azurecr.io/stacklight/k8s-sidecar:1.15.9 |
|
kube-state-metrics |
mirantis.azurecr.io/stacklight/kube-state-metrics:v2.2.4 |
|
kubectl Updated |
mirantis.azurecr.io/stacklight/kubectl:1.22.13 |
|
metric-collector |
mirantis.azurecr.io/stacklight/metric-collector:v0.1-20220711134630 |
|
metricbeat Updated |
mirantis.azurecr.io/stacklight/metricbeat:7.10.2-20220909091002 |
|
nginx-prometheus-exporter |
mirantis.azurecr.io/stacklight/nginx-prometheus-exporter:0.6.0 |
|
node-exporter |
mirantis.azurecr.io/stacklight/node-exporter:v1.2.2 |
|
opensearch |
mirantis.azurecr.io/stacklight/opensearch:1-20220517112057 |
|
opensearch-dashboards |
mirantis.azurecr.io/stacklight/opensearch-dashboards:1-20220517112107 |
|
origin-telemeter |
mirantis.azurecr.io/stacklight/origin-telemeter:4.4.0-20200424 |
|
pgbouncer |
mirantis.azurecr.io/stacklight/pgbouncer:1.12.0 |
|
prometheus |
mirantis.azurecr.io/stacklight/prometheus:v2.35.0 |
|
prometheus-es-exporter |
mirantis.azurecr.io/stacklight/prometheus-es-exporter:v0.14.0-20220517111946 |
|
prometheus-msteams |
mirantis.azurecr.io/stacklight/prometheus-msteams:v1.4.2 |
|
prometheus-patroni-exporter |
mirantis.azurecr.io/stacklight/prometheus-patroni-exporter:v0.1-20220624102731 |
|
prometheus-postgres-exporter |
mirantis.azurecr.io/stacklight/prometheus-postgres-exporter:v0.9.0 |
|
prometheus-relay |
mirantis.azurecr.io/stacklight/prometheus-relay:v0.3-20210317133316 |
|
refapp New |
mirantis.azurecr.io/openstack/openstack-refapp:0.0.1.dev29 |
|
sf-notifier |
mirantis.azurecr.io/stacklight/sf-notifier:v0.3-20220706035002 |
|
sf-reporter Updated |
mirantis.azurecr.io/stacklight/sf-reporter:v0.1-20220916113234 |
|
spilo Updated |
mirantis.azurecr.io/stacklight/spilo:13-2.1p1-20220921105803 |
|
stacklight-toolkit New |
mirantis.azurecr.io/stacklight/stacklight-toolkit:20220729121446 |
|
telegraf |
mirantis.azurecr.io/stacklight/telegraf:v1.9.1-20220714080809 |
|
mirantis.azurecr.io/stacklight/telegraf:1.23.4-20220915114529 Updated |
||
telemeter-token-auth |
mirantis.azurecr.io/stacklight/telemeter-token-auth:v0.1-20200406175600 |
|
yq |
mirantis.azurecr.io/stacklight/yq:4.25.2 |
Artifact |
Component |
Path |
|---|---|---|
Debian repositories |
System packages |
|
http://mirror.mirantis.com/kaas/kubernetes-extra-rhel7-0.0.5/ |
||
https://mirror.mirantis.com/kaas/ubuntu-2022-07-13-020010.target.txt |
||
MCR repositories |
MCR |
https://repos.mirantis.com/ubuntu/dists/bionic/pool/stable-20.10/ |
Target ubuntu system 1 |
Ubuntu |
https://binary.mirantis.com/bm/bin/efi/ubuntu/tgz-focal-20220915105522 |
https://binary.mirantis.com/bm/bin/efi/ubuntu/tgz-bionic-5.4-20220915105637 2 |
For the list of known and resolved issues, refer to the Container Cloud release 2.21.0 section.
This section outlines release notes for the Cluster release 11.4.0 that is introduced in the Mirantis Container Cloud release 2.20.0.
This Cluster release supports Mirantis Kubernetes Engine 3.5.4 with Kubernetes 1.21 and Mirantis Container Runtime 20.10.12.
This section outlines new features implemented in the Cluster release 11.4.0 that is introduced in the Container Cloud release 2.20.0.
Updated the Mirantis Kubernetes Engine (MKE) version from 3.5.3 to 3.5.4 and the Mirantis Container Runtime (MCR) version from 20.10.11 to 20.10.12 for the Container Cloud management, regional, and managed clusters on all supported cloud providers, as well as for non Container Cloud based MKE cluster attachment.
To reduce resource consumption, removed Ceph cluster deployment from management and regional clusters based on bare metal and Equinix Metal with private networking. Ceph is automatically removed during the Cluster release update to 11.4.0. Managed clusters continue using Ceph as a distributed storage system.
Implemented the objectUsers RADOS Gateway parameter in the
KaaSCephCluster CR. The new parameter allows for an easy creation of custom
Ceph RADOS Gateway users with permission rules. The users parameter is now
deprecated and, if specified, will be automatically transformed to
objectUsers.
Learn more
Implemented the rbdDeviceMapOptions field in the Ceph pool parameters of
the KaaSCephCluster CR. The new field allows specifying custom RADOS Block
Device (RBD) map options to use with StorageClass of a corresponding Ceph
pool.
Implemented the mgr.mgrModules parameter that includes the name and
enabled keys to provide the capability to disable a particular Ceph Manager
module. The mgr.modules parameter is now deprecated and, if specified, will
be automatically transformed to mgr.mgrModules.
Implemented the capability to configure health checks and liveness probe
settings for Ceph daemons through the KaaSCephCluster CR.
The following table lists the components versions of the Cluster release 11.4.0.
Note
The components that are newly added, updated, deprecated, or removed
as compared to the previous release version, are marked
with a corresponding superscript,
for example, lcm-ansible Updated.
Component |
Application/Service |
Version |
|---|---|---|
Cluster orchestration |
Mirantis Kubernetes Engine Updated |
3.5.4 0 |
Container runtime |
Mirantis Container Runtime Updated |
20.10.12 1 |
Distributed storage |
Ceph |
15.2.13 (Octopus) |
Rook |
1.0.0-20220504194120 |
|
LCM |
Helm |
2.16.11-40 |
helm-controller Updated |
0.3.0-285-g8498abe0 |
|
lcm-ansible Updated |
0.18.1 |
|
lcm-agent Updated |
0.3.0-288-g405179c2 |
|
metallb-controller Updated |
0.12.1 |
|
metrics-server |
0.5.2 |
|
StackLight |
Alerta |
8.5.0-20211108051042 |
Alertmanager |
0.23.0 |
|
Alertmanager Webhook ServiceNow Updated |
0.1-20220706035316 |
|
Cerebro |
0.9.3 |
|
Elasticsearch Curator |
5.7.6 |
|
Elasticsearch Exporter |
1.0.2 |
|
Fluentd |
1.14-20220111114545 |
|
Grafana Updated |
9.0.2 |
|
Grafana Image Renderer |
3.4.2 |
|
IAM Proxy |
6.0.1 |
|
Metric Collector Updated |
0.1-20220711134630 |
|
Metricbeat |
7.10.2-20220309185937 |
|
OpenSearch |
1-20220517112057 |
|
OpenSearch Dashboards |
1-20220517112107 |
|
Prometheus |
2.35.0 |
|
Prometheus Blackbox Exporter |
0.19.0 |
|
Prometheus ES Exporter |
0.14.0-20220517111946 |
|
Prometheus MS Teams |
1.4.2 |
|
Prometheus Node Exporter |
1.2.2 |
|
Prometheus NGINX Exporter |
0.6.0 |
|
Prometheus Patroni Exporter Updated |
0.1-20220624102731 |
|
Prometheus Postgres Exporter |
0.9.0 |
|
Prometheus Relay |
0.3-20210317133316 |
|
sf-notifier Updated |
0.3-20220706035002 |
|
sf-reporter Updated |
0.1-20220622101204 |
|
Spilo |
13-2.1p1-20220225091552 |
|
Telegraf Updated |
1.9.1-20220714080809 |
|
1.20.2-20220204122426 |
||
Telemeter |
4.4.0-20200424 |
- 0
For the Mirantis Kubernetes Engine (MKE) release highlights and components versions, see MKE documentation: MKE release notes.
- 1
For the Mirantis Container Runtime (MCR) release highlights, see MCR documentation: MCR release notes.
This section lists the components artifacts of the Cluster release 11.4.0.
Note
The components that are newly added, updated, deprecated, or removed
as compared to the previous release version, are marked
with a corresponding superscript,
for example, lcm-ansible Updated.
Artifact |
Component |
Path |
|---|---|---|
Helm chart |
ceph-controller Updated |
https://binary.mirantis.com/ceph/helm/ceph-operator-1.0.0-mcp-908.tgz |
Docker images |
ceph |
mirantis.azurecr.io/ceph/ceph:v15.2.13 |
ceph-controller Updated |
mirantis.azurecr.io/ceph/mcp/ceph-controller:v1.0.0-20220819101016 |
|
cephcsi |
mirantis.azurecr.io/ceph/cephcsi/cephcsi:v3.4.0 |
|
csi-node-driver-registrar |
mirantis.azurecr.io/ceph/k8scsi/csi-node-driver-registrar:v2.1.0 |
|
csi-provisioner |
mirantis.azurecr.io/ceph/k8scsi/csi-provisioner:v2.1.2 |
|
csi-snapshotter |
mirantis.azurecr.io/ceph/k8scsi/csi-snapshotter:v4.0.0 |
|
csi-attacher |
mirantis.azurecr.io/ceph/k8scsi/csi-attacher:v3.1.0 |
|
csi-resizer |
mirantis.azurecr.io/ceph/k8scsi/csi-resizer:v1.1.0 |
|
rook |
mirantis.azurecr.io/ceph/rook:v1.0.0-20220504194120 |
Artifact |
Component |
Path |
|---|---|---|
Binaries Updated |
lcm-ansible |
https://binary.mirantis.com/lcm/bin/lcm-ansible/v0.18.1/lcm-ansible.tar.gz |
lcm-agent |
https://binary.mirantis.com/lcm/bin/lcm-agent/v0.3.0-288-g405179c2/lcm-agent |
|
Helm charts Updated |
managed-lcm-api |
https://binary.mirantis.com/core/helm/managed-lcm-api-1.33.5.tgz |
metallb |
||
metrics-server |
https://binary.mirantis.com/core/helm/metrics-server-1.33.5.tgz |
|
Docker images |
helm-controller Updated |
mirantis.azurecr.io/lcm/lcm-controller:v0.3.0-285-g8498abe0 |
metallb-controller Updated |
mirantis.azurecr.io/bm/external/metallb/controller:v0.12.1 |
|
metallb-speaker Updated |
mirantis.azurecr.io/bm/external/metallb/speaker:v0.12.1 |
|
metrics-server |
mirantis.azurecr.io/core/external/metrics-server:v0.5.2 |
Artifact |
Component |
Path |
|---|---|---|
Helm charts |
alerta |
https://binary.mirantis.com/stacklight/helm/alerta-0.1.0-mcp-25.tgz |
alertmanager-webhook-servicenow |
https://binary.mirantis.com/stacklight/helm/alertmanager-webhook-servicenow-0.2.0-mcp-3.tgz |
|
cerebro |
https://binary.mirantis.com/stacklight/helm/cerebro-0.1.0-mcp-2.tgz |
|
elasticsearch-curator |
https://binary.mirantis.com/stacklight/helm/elasticsearch-curator-1.5.0-mcp-9.tgz |
|
elasticsearch-exporter |
https://binary.mirantis.com/stacklight/helm/elasticsearch-exporter-1.2.0-mcp-6.tgz |
|
fluentd |
https://binary.mirantis.com/stacklight/helm/fluentd-2.0.3-mcp-37.tgz |
|
fluentd-logs Updated |
https://binary.mirantis.com/stacklight/helm/fluentd-elasticsearch-3.0.0-mcp-131.tgz |
|
grafana Updated |
https://binary.mirantis.com/stacklight/helm/grafana-3.3.10-mcp-154.tgz |
|
iam-proxy Updated |
||
metric-collector |
https://binary.mirantis.com/stacklight/helm/metric-collector-0.3.0-mcp-6.tgz |
|
metricbeat |
https://binary.mirantis.com/stacklight/helm/metricbeat-1.7.1-mcp-16.tgz |
|
opensearch Updated |
https://binary.mirantis.com/stacklight/helm/opensearch-0.1.0-mcp-52.tgz |
|
opensearch-dashboards |
https://binary.mirantis.com/stacklight/helm/opensearch-dashboards-0.1.0-mcp-40.tgz |
|
patroni |
https://binary.mirantis.com/stacklight/helm/patroni-0.15.1-mcp-42.tgz |
|
prometheus |
https://binary.mirantis.com/stacklight/helm/prometheus-8.11.4-mcp-228.tgz |
|
prometheus-blackbox-exporter |
https://binary.mirantis.com/stacklight/helm/prometheus-blackbox-exporter-0.3.0-mcp-11.tgz |
|
prometheus-es-exporter |
https://binary.mirantis.com/stacklight/helm/prometheus-es-exporter-1.0.0-mcp-11.tgz |
|
prometheus-msteams |
https://binary.mirantis.com/stacklight/helm/prometheus-msteams-0.1.0-mcp-8.tgz |
|
prometheus-nginx-exporter |
https://binary.mirantis.com/stacklight/helm/prometheus-nginx-exporter-0.2.0-mcp-1.tgz |
|
sf-notifier |
https://binary.mirantis.com/stacklight/helm/sf-notifier-0.2.0-mcp-2.tgz |
|
sf-reporter |
https://binary.mirantis.com/stacklight/helm/sf-reporter-0.2.0-mcp-3.tgz |
|
stacklight Updated |
https://binary.mirantis.com/stacklight/helm/stacklight-0.8.1.tgz |
|
telegraf-ds |
https://binary.mirantis.com/stacklight/helm/telegraf-ds-1.1.5-mcp-29.tgz |
|
telegraf-s |
https://binary.mirantis.com/stacklight/helm/telegraf-s-1.1.5-mcp-30.tgz |
|
telemeter-server Updated |
https://binary.mirantis.com/stacklight/helm/telemeter-server-0.2.0-mcp-6.tgz |
|
telemeter-client Updated |
https://binary.mirantis.com/stacklight/helm/telemeter-client-0.2.0-mcp-6.tgz |
|
Docker images |
alerta |
mirantis.azurecr.io/stacklight/alerta-web:8.5.0-20211108051042 |
alertmanager |
mirantis.azurecr.io/stacklight/alertmanager:v0.23.0 |
|
alertmanager-webhook-servicenow Updated |
mirantis.azurecr.io/stacklight/alertmanager-webhook-servicenow:v0.1-20220706035316 |
|
busybox |
mirantis.azurecr.io/stacklight/busybox:1.30 |
|
cerebro |
mirantis.azurecr.io/stacklight/cerebro:0.9.3 |
|
configmap-reload |
mirantis.azurecr.io/stacklight/configmap-reload:v0.3.0 |
|
curl |
mirantis.azurecr.io/stacklight/curl:7.69.0 |
|
curl-jq |
mirantis.azurecr.io/stacklight/curl-jq:1.5-1 |
|
elasticsearch-curator |
mirantis.azurecr.io/stacklight/curator:5.7.6 |
|
elasticsearch-exporter |
mirantis.azurecr.io/stacklight/elasticsearch_exporter:1.0.2 |
|
fluentd |
mirantis.azurecr.io/stacklight/fluentd:1.14-20220111114545 |
|
grafana Updated |
mirantis.azurecr.io/stacklight/grafana:9.0.2 |
|
grafana-image-renderer |
mirantis.azurecr.io/stacklight/grafana-image-renderer:3.4.2 |
|
kubectl |
mirantis.azurecr.io/stacklight/kubectl:1.19.13 |
|
k8s-sidecar |
mirantis.azurecr.io/stacklight/k8s-sidecar:1.15.9 |
|
kube-state-metrics |
mirantis.azurecr.io/stacklight/kube-state-metrics:v2.2.4 |
|
metric-collector Updated |
mirantis.azurecr.io/stacklight/metric-collector:v0.1-20220711134630 |
|
metricbeat |
mirantis.azurecr.io/stacklight/metricbeat:7.10.2-20220309185937 |
|
node-exporter |
mirantis.azurecr.io/stacklight/node-exporter:v1.2.2 |
|
opensearch |
mirantis.azurecr.io/stacklight/opensearch:1-20220517112057 |
|
opensearch-dashboards |
mirantis.azurecr.io/stacklight/opensearch-dashboards:1-20220517112107 |
|
origin-telemeter |
mirantis.azurecr.io/stacklight/origin-telemeter:4.4.0-20200424 |
|
pgbouncer |
mirantis.azurecr.io/stacklight/pgbouncer:1.12.0 |
|
prometheus |
mirantis.azurecr.io/stacklight/prometheus:v2.35.0 |
|
prometheus-blackbox-exporter |
mirantis.azurecr.io/stacklight/blackbox-exporter:v0.19.0 |
|
prometheus-es-exporter |
mirantis.azurecr.io/stacklight/prometheus-es-exporter:v0.14.0-20220517111946 |
|
prometheus-msteams |
mirantis.azurecr.io/stacklight/prometheus-msteams:v1.4.2 |
|
prometheus-nginx-exporter |
mirantis.azurecr.io/stacklight/nginx-prometheus-exporter:0.6.0 |
|
prometheus-patroni-exporter Updated |
mirantis.azurecr.io/stacklight/prometheus-patroni-exporter:v0.1-20220624102731 |
|
prometheus-postgres-exporter |
mirantis.azurecr.io/stacklight/prometheus-postgres-exporter:v0.9.0 |
|
prometheus-relay |
mirantis.azurecr.io/stacklight/prometheus-relay:v0.3-20210317133316 |
|
sf-notifier Updated |
mirantis.azurecr.io/stacklight/sf-notifier:v0.3-20220706035002 |
|
sf-reporter Updated |
mirantis.azurecr.io/stacklight/sf-reporter:v0.1-20220622101204 |
|
spilo |
mirantis.azurecr.io/stacklight/spilo:13-2.1p1-20220225091552 |
|
telegraf Updated |
mirantis.azurecr.io/stacklight/telegraf:v1.9.1-20220714080809 |
|
mirantis.azurecr.io/stacklight/telegraf:1.20.2-20220204122426 |
||
telemeter-token-auth |
mirantis.azurecr.io/stacklight/telemeter-token-auth:v0.1-20200406175600 |
|
yq |
mirantis.azurecr.io/stacklight/yq:4.25.2 |
Artifact |
Component |
Path |
|---|---|---|
Debian repositories |
System packages |
|
http://mirror.mirantis.com/kaas/kubernetes-extra-rhel7-0.0.5/ |
||
https://mirror.mirantis.com/kaas/ubuntu-2022-07-13-020010.target.txt |
||
MCR repositories |
MCR |
https://repos.mirantis.com/ubuntu/dists/bionic/pool/stable-20.10/ |
For the list of known and resolved issues, refer to the Container Cloud release 2.20.0 section.
This section outlines release notes for the Cluster release 11.3.0 that is introduced in the Mirantis Container Cloud release 2.19.0.
This Cluster release supports Mirantis Kubernetes Engine 3.5.3 with Kubernetes 1.21 and Mirantis Container Runtime 20.10.11.
This section outlines new features implemented in the Cluster release 11.3.0 that is introduced in the Container Cloud release 2.19.0.
Implemented a new Kubernetes Containers Grafana dashboard that provides resources consumption metrics of containers running on Kubernetes nodes.
Learn more
Enhanced the documentation by adding troubleshooting guidelines for the Kubernetes system, Metric Collector, Helm Controller, Release Controller, and MKE alerts.
Learn more
As part of the Elasticsearch switching to OpenSearch, replaced the Elasticsearch parameters with OpenSearch in the Container Cloud web UI.
Implemented the capability to easily view the summary and health status of all Ceph clusters through the Container Cloud web UI.
Implemented the capability to remove or replace Ceph OSDs not only by the
device name or path but also by ID, using the by-id parameter in the
KaaSCephOperationRequest CR.
Learn more
TechPreview
Implemented the capability to create multiple Ceph data pools per a single
CephFS installation using the dataPools parameter in the CephFS
specification. The dataPool parameter is now deprecated.
Learn more
The following table lists the components versions of the Cluster release 11.3.0.
Note
The components that are newly added, updated, deprecated, or removed
as compared to the previous release version, are marked
with a corresponding superscript,
for example, lcm-ansible Updated.
Component |
Application/Service |
Version |
|---|---|---|
Cluster orchestration |
Mirantis Kubernetes Engine |
3.5.3 0 |
Container runtime |
Mirantis Container Runtime |
20.10.11 1 |
Distributed storage |
Ceph |
15.2.13 (Octopus) |
Rook |
1.0.0-20220504194120 |
|
LCM |
Helm |
2.16.11-40 |
helm-controller Updated |
0.3.0-257-ga93244da |
|
lcm-ansible Updated |
0.17.1-2-g1e337f8 |
|
lcm-agent Updated |
0.3.0-257-ga93244da |
|
metallb-controller |
0.9.3-1 |
|
metrics-server |
0.5.2 |
|
StackLight |
Alerta |
8.5.0-20211108051042 |
Alertmanager |
0.23.0 |
|
Alertmanager Webhook ServiceNow |
0.1-20220420161450 |
|
Cerebro |
0.9.3 |
|
Elasticsearch Curator |
5.7.6 |
|
Elasticsearch Exporter |
1.0.2 |
|
Fluentd |
1.14-20220111114545 |
|
Grafana |
8.5.0 |
|
Grafana Image Renderer Updated |
3.4.2 |
|
IAM Proxy |
6.0.1 |
|
Metric Collector Updated |
0.1-20220614110617 |
|
Metricbeat |
7.10.2-20220309185937 |
|
OpenSearch Updated |
1-20220517112057 |
|
OpenSearch Dashboards Updated |
1-20220517112107 |
|
Patroni |
13-2.1p1-20220225091552 |
|
Prometheus Updated |
2.35.0 |
|
Prometheus Blackbox Exporter |
0.19.0 |
|
Prometheus ES Exporter Updated |
0.14.0-20220517111946 |
|
Prometheus MS Teams |
1.4.2 |
|
Prometheus Node Exporter |
1.2.2 |
|
Prometheus NGINX Exporter |
0.6.0 |
|
Prometheus Patroni Exporter |
0.1-20210708141736 |
|
Prometheus Postgres Exporter |
0.9.0 |
|
Prometheus Relay |
0.3-20210317133316 |
|
sf-notifier Updated |
0.3-20220514051554 |
|
sf-reporter |
0.1-20220419092138 |
|
Telegraf |
1.9.1-20210225142050 |
|
1.20.2-20220204122426 |
||
Telemeter |
4.4.0-20200424 |
- 0
For the Mirantis Kubernetes Engine (MKE) release highlights and components versions, see MKE documentation: MKE release notes.
- 1
For the Mirantis Container Runtime (MCR) release highlights, see MCR documentation: MCR release notes.
This section lists the components artifacts of the Cluster release 11.3.0.
Note
The components that are newly added, updated, deprecated, or removed
as compared to the previous release version, are marked
with a corresponding superscript,
for example, lcm-ansible Updated.
Artifact |
Component |
Path |
|---|---|---|
Helm chart |
ceph-controller Updated |
https://binary.mirantis.com/ceph/helm/ceph-operator-1.0.0-mcp-831.tgz |
Docker images |
ceph |
mirantis.azurecr.io/ceph/ceph:v15.2.13 |
ceph-controller Updated |
mirantis.azurecr.io/ceph/mcp/ceph-controller:v1.0.0-20220715144333 |
|
cephcsi |
mirantis.azurecr.io/ceph/cephcsi/cephcsi:v3.4.0 |
|
csi-node-driver-registrar |
mirantis.azurecr.io/ceph/k8scsi/csi-node-driver-registrar:v2.1.0 |
|
csi-provisioner |
mirantis.azurecr.io/ceph/k8scsi/csi-provisioner:v2.1.2 |
|
csi-snapshotter |
mirantis.azurecr.io/ceph/k8scsi/csi-snapshotter:v4.0.0 |
|
csi-attacher |
mirantis.azurecr.io/ceph/k8scsi/csi-attacher:v3.1.0 |
|
csi-resizer |
mirantis.azurecr.io/ceph/k8scsi/csi-resizer:v1.1.0 |
|
rook |
mirantis.azurecr.io/ceph/rook:v1.0.0-20220504194120 |
Artifact |
Component |
Path |
|---|---|---|
Binaries Updated |
lcm-ansible |
https://binary.mirantis.com/lcm/bin/lcm-ansible/v0.17.1-2-g1e337f8/lcm-ansible.tar.gz |
lcm-agent |
https://binary.mirantis.com/lcm/bin/lcm-agent/v0.3.0-257-ga93244da/lcm-agent |
|
Helm charts Updated |
managed-lcm-api |
https://binary.mirantis.com/core/helm/managed-lcm-api-1.32.4.tgz |
metallb |
||
metrics-server |
https://binary.mirantis.com/core/helm/metrics-server-1.32.4.tgz |
|
Docker images |
helm-controller Updated |
mirantis.azurecr.io/lcm/lcm-controller:v0.3.0-257-ga93244da |
metallb-controller |
mirantis.azurecr.io/lcm/metallb/controller:v0.9.3-1 |
|
metallb-speaker |
mirantis.azurecr.io/lcm/metallb/speaker:v0.9.3-1 |
|
metrics-server |
mirantis.azurecr.io/core/external/metrics-server:v0.5.2 |
Artifact |
Component |
Path |
|---|---|---|
Helm charts |
alerta |
https://binary.mirantis.com/stacklight/helm/alerta-0.1.0-mcp-25.tgz |
alertmanager-webhook-servicenow |
https://binary.mirantis.com/stacklight/helm/alertmanager-webhook-servicenow-0.2.0-mcp-3.tgz |
|
cerebro |
https://binary.mirantis.com/stacklight/helm/cerebro-0.1.0-mcp-2.tgz |
|
elasticsearch-curator |
https://binary.mirantis.com/stacklight/helm/elasticsearch-curator-1.5.0-mcp-9.tgz |
|
elasticsearch-exporter |
https://binary.mirantis.com/stacklight/helm/elasticsearch-exporter-1.2.0-mcp-6.tgz |
|
fluentd |
https://binary.mirantis.com/stacklight/helm/fluentd-2.0.3-mcp-37.tgz |
|
fluentd-logs |
https://binary.mirantis.com/stacklight/helm/fluentd-elasticsearch-3.0.0-mcp-128.tgz |
|
grafana Updated |
https://binary.mirantis.com/stacklight/helm/grafana-3.3.10-mcp-150.tgz |
|
iam-proxy |
||
metric-collector |
https://binary.mirantis.com/stacklight/helm/metric-collector-0.3.0-mcp-6.tgz |
|
metricbeat |
https://binary.mirantis.com/stacklight/helm/metricbeat-1.7.1-mcp-16.tgz |
|
opensearch |
https://binary.mirantis.com/stacklight/helm/opensearch-0.1.0-mcp-50.tgz |
|
opensearch-dashboards |
https://binary.mirantis.com/stacklight/helm/opensearch-dashboards-0.1.0-mcp-40.tgz |
|
patroni |
https://binary.mirantis.com/stacklight/helm/patroni-0.15.1-mcp-42.tgz |
|
prometheus Updated |
https://binary.mirantis.com/stacklight/helm/prometheus-8.11.4-mcp-228.tgz |
|
prometheus-blackbox-exporter |
https://binary.mirantis.com/stacklight/helm/prometheus-blackbox-exporter-0.3.0-mcp-11.tgz |
|
prometheus-es-exporter |
https://binary.mirantis.com/stacklight/helm/prometheus-es-exporter-1.0.0-mcp-11.tgz |
|
prometheus-msteams |
https://binary.mirantis.com/stacklight/helm/prometheus-msteams-0.1.0-mcp-8.tgz |
|
prometheus-nginx-exporter |
https://binary.mirantis.com/stacklight/helm/prometheus-nginx-exporter-0.2.0-mcp-1.tgz |
|
sf-notifier |
https://binary.mirantis.com/stacklight/helm/sf-notifier-0.2.0-mcp-2.tgz |
|
sf-reporter |
https://binary.mirantis.com/stacklight/helm/sf-reporter-0.2.0-mcp-3.tgz |
|
stacklight Updated |
https://binary.mirantis.com/stacklight/helm/stacklight-0.7.2.tgz |
|
telegraf-ds |
https://binary.mirantis.com/stacklight/helm/telegraf-ds-1.1.5-mcp-29.tgz |
|
telegraf-s |
https://binary.mirantis.com/stacklight/helm/telegraf-s-1.1.5-mcp-30.tgz |
|
telemeter-server |
https://binary.mirantis.com/stacklight/helm/telemeter-server-0.2.0-mcp-5.tgz |
|
telemeter-client |
https://binary.mirantis.com/stacklight/helm/telemeter-client-0.2.0-mcp-5.tgz |
|
Docker images |
alerta |
mirantis.azurecr.io/stacklight/alerta-web:8.5.0-20211108051042 |
alertmanager |
mirantis.azurecr.io/stacklight/alertmanager:v0.23.0 |
|
alertmanager-webhook-servicenow |
mirantis.azurecr.io/stacklight/alertmanager-webhook-servicenow:v0.1-20220420161450 |
|
busybox |
mirantis.azurecr.io/stacklight/busybox:1.30 |
|
cerebro |
mirantis.azurecr.io/stacklight/cerebro:0.9.3 |
|
configmap-reload |
mirantis.azurecr.io/stacklight/configmap-reload:v0.3.0 |
|
curl |
mirantis.azurecr.io/stacklight/curl:7.69.0 |
|
curl-jq |
mirantis.azurecr.io/stacklight/curl-jq:1.5-1 |
|
elasticsearch-curator |
mirantis.azurecr.io/stacklight/curator:5.7.6 |
|
elasticsearch-exporter |
mirantis.azurecr.io/stacklight/elasticsearch_exporter:1.0.2 |
|
fluentd |
mirantis.azurecr.io/stacklight/fluentd:1.14-20220111114545 |
|
grafana |
mirantis.azurecr.io/stacklight/grafana:8.5.0 |
|
grafana-image-renderer Updated |
mirantis.azurecr.io/stacklight/grafana-image-renderer:3.4.2 |
|
kubectl |
mirantis.azurecr.io/stacklight/kubectl:1.19.13 |
|
k8s-sidecar |
mirantis.azurecr.io/stacklight/k8s-sidecar:1.15.9 |
|
kube-state-metrics |
mirantis.azurecr.io/stacklight/kube-state-metrics:v2.2.4 |
|
metric-collector Updated |
mirantis.azurecr.io/stacklight/metric-collector:v0.1-20220614110617 |
|
metricbeat |
mirantis.azurecr.io/stacklight/metricbeat:7.10.2-20220309185937 |
|
node-exporter |
mirantis.azurecr.io/stacklight/node-exporter:v1.2.2 |
|
opensearch Updated |
mirantis.azurecr.io/stacklight/opensearch:1-20220517112057 |
|
opensearch-dashboards Updated |
mirantis.azurecr.io/stacklight/opensearch-dashboards:1-20220517112107 |
|
origin-telemeter |
mirantis.azurecr.io/stacklight/origin-telemeter:4.4.0-20200424 |
|
prometheus Updated |
mirantis.azurecr.io/stacklight/prometheus:v2.35.0 |
|
prometheus-blackbox-exporter |
mirantis.azurecr.io/stacklight/blackbox-exporter:v0.19.0 |
|
prometheus-es-exporter Updated |
mirantis.azurecr.io/stacklight/prometheus-es-exporter:v0.14.0-20220517111946 |
|
prometheus-msteams |
mirantis.azurecr.io/stacklight/prometheus-msteams:v1.4.2 |
|
prometheus-nginx-exporter |
mirantis.azurecr.io/stacklight/nginx-prometheus-exporter:0.6.0 |
|
prometheus-patroni-exporter |
mirantis.azurecr.io/stacklight/prometheus-patroni-exporter:v0.1-20210708141736 |
|
prometheus-postgres-exporter |
mirantis.azurecr.io/stacklight/prometheus-postgres-exporter:v0.9.0 |
|
prometheus-relay |
mirantis.azurecr.io/stacklight/prometheus-relay:v0.3-20210317133316 |
|
sf-notifier Updated |
mirantis.azurecr.io/stacklight/sf-notifier:v0.3-20220514051554 |
|
sf-reporter |
mirantis.azurecr.io/stacklight/sf-reporter:v0.1-20220419092138 |
|
spilo |
mirantis.azurecr.io/stacklight/spilo:13-2.1p1-20220225091552 |
|
telegraf |
mirantis.azurecr.io/stacklight/telegraf:v1.9.1-20210225142050 |
|
mirantis.azurecr.io/stacklight/telegraf:1.20.2-20220204122426 |
||
telemeter-token-auth |
mirantis.azurecr.io/stacklight/telemeter-token-auth:v0.1-20200406175600 |
|
yq Updated |
mirantis.azurecr.io/stacklight/yq:4.25.2 |
Artifact |
Component |
Path |
|---|---|---|
Debian repositories |
System packages |
|
http://mirror.mirantis.com/kaas/kubernetes-extra-rhel7-0.0.5/ |
||
https://mirror.mirantis.com/kaas/ubuntu-2022-05-03-013543.target.txt |
||
MCR repositories |
MCR |
https://repos.mirantis.com/ubuntu/dists/bionic/pool/stable-20.10/ |
For the list of known and resolved issues, refer to the Container Cloud release 2.19.0 section.
This section outlines release notes for the Cluster release 11.2.0 that is introduced in the Mirantis Container Cloud release 2.18.0.
This Cluster release supports Mirantis Kubernetes Engine 3.5.3 with Kubernetes 1.21 and Mirantis Container Runtime 20.10.11.
This section outlines new features implemented in the Cluster release 11.2.0 that is introduced in the Container Cloud release 2.18.0.
Updated the Mirantis Kubernetes Engine (MKE) version from 3.5.1 to 3.5.3 and the Mirantis Container Runtime (MCR) version from 20.10.8 to 20.10.11 for the Container Cloud management, regional, and managed clusters on all supported cloud providers, as well as for non Container Cloud based MKE cluster attachment.
As part of the Elasticsearch switching to OpenSearch, removed the Elasticsearch and Kibana services, as well as introduced a set of new parameters that will replace the current ones in future releases. The old parameters are supported and take precedence over the new ones. For details, see Deprecation Notes and StackLight configuration parameters.
Note
In the Container Cloud web UI, the Elasticsearch and Kibana naming is still present. However, the services behind them have switched to OpenSearch and OpenSearch Dashboards.
Implemented the following improvements to StackLight alerting:
Added the
MCCClusterUpdatinginformational alert that raises when the Mirantis Container Cloud cluster starts updating.Enhanced StackLight alerting by clarifying alert severity levels. Switched all
Minoralerts toWarning. Now, only alerts of the following severities exist:informational,warning,major, andcritical.Enhanced the documentation by adding troubleshooting guidelines for the Kubernetes applications, resources, and storage alerts.
Learn more
Implemented the capability to allow sending of metrics from Prometheus, using the Prometheus remote write feature to a custom monitoring endpoint.
Learn more
Defined the following parameters in the StackLight configuration of the Cluster object for all types of clusters as mandatory. This applies to the clusters with StackLight enabled only. For existing clusters, Cluster object will be updated automatically.
Important
When creating a new cluster, specify these parameters through the Container Cloud web UI or as described in StackLight configuration parameters. Update all cluster templates created before Container Cloud 2.18.0 that do not have values for these parameters specified. Otherwise, the admission controller will reject cluster creation.
Web UI parameter |
API parameter |
|---|---|
Enable Logging |
|
HA Mode |
|
Prometheus Persistent Volume Claim Size |
|
Elasticsearch Persistent Volume Claim Size |
|
Implemented the capability to configure the placement of the
rook-ceph-operator, rook-discover, and csi-rbdplugin Ceph daemons.
Learn more
The following table lists the components versions of the Cluster release 11.2.0.
Note
The components that are newly added, updated, deprecated, or removed
as compared to the previous release version, are marked
with a corresponding superscript,
for example, lcm-ansible Updated.
Component |
Application/Service |
Version |
|---|---|---|
Cluster orchestration |
Mirantis Kubernetes Engine Updated |
3.5.3 0 |
Container runtime |
Mirantis Container Runtime Updated |
20.10.11 1 |
Distributed storage |
Ceph |
15.2.13 (Octopus) |
Rook |
1.0.0-20220504194120 |
|
LCM |
Helm |
2.16.11-40 |
helm-controller Updated |
0.3.0-239-gae7218ea |
|
lcm-ansible Updated |
0.16.0-13-gcac49ca |
|
lcm-agent Updated |
0.3.0-239-gae7218ea |
|
metallb-controller |
0.9.3-1 |
|
metrics-server |
0.5.2 |
|
StackLight |
Alerta |
8.5.0-20211108051042 |
Alertmanager |
0.23.0 |
|
Alertmanager Webhook ServiceNow Updated |
0.1-20220420161450 |
|
Cerebro |
0.9.3 |
|
Elasticsearch Curator |
5.7.6 |
|
Elasticsearch Exporter |
1.0.2 |
|
Fluentd |
1.14-20220111114545 |
|
Grafana Updated |
8.5.0 |
|
Grafana Image Renderer |
3.2.1 |
|
IAM Proxy |
6.0.1 |
|
Metric Collector |
0.1-20220209123106 |
|
Metricbeat |
7.10.2-20220309185937 |
|
OpenSearch |
1-20220316161927 |
|
OpenSearch Dashboards |
1-20220316161951 |
|
Patroni |
13-2.1p1-20220225091552 |
|
Prometheus |
2.31.1 |
|
Prometheus Blackbox Exporter |
0.19.0 |
|
Prometheus ES Exporter |
0.14.0-20220111114356 |
|
Prometheus MS Teams |
1.4.2 |
|
Prometheus Node Exporter |
1.2.2 |
|
Prometheus NGINX Exporter |
0.6.0 |
|
Prometheus Patroni Exporter |
0.1-20210708141736 |
|
Prometheus Postgres Exporter |
0.9.0 |
|
Prometheus Relay |
0.3-20210317133316 |
|
sf-notifier |
0.3-20210930112115 |
|
sf-reporter Updated |
0.1-20220419092138 |
|
Telegraf |
1.9.1-20210225142050 |
|
1.20.2-20220204122426 |
||
Telemeter |
4.4.0-20200424 |
- 0
For the Mirantis Kubernetes Engine (MKE) release highlights and components versions, see MKE documentation: MKE release notes.
- 1
For the Mirantis Container Runtime (MCR) release highlights, see MCR documentation: MCR release notes.
This section lists the components artifacts of the Cluster release 11.2.0.
Note
The components that are newly added, updated, deprecated, or removed
as compared to the previous release version, are marked
with a corresponding superscript,
for example, lcm-ansible Updated.
Artifact |
Component |
Path |
|---|---|---|
Helm chart |
ceph-controller Updated |
https://binary.mirantis.com/ceph/helm/ceph-operator-1.0.0-mcp-792.tgz |
Docker images |
ceph |
mirantis.azurecr.io/ceph/ceph:v15.2.13 |
ceph-controller Updated |
mirantis.azurecr.io/ceph/mcp/ceph-controller:v1.0.0-20220506180707 |
|
cephcsi |
mirantis.azurecr.io/ceph/cephcsi/cephcsi:v3.4.0 |
|
csi-node-driver-registrar |
mirantis.azurecr.io/ceph/k8scsi/csi-node-driver-registrar:v2.1.0 |
|
csi-provisioner |
mirantis.azurecr.io/ceph/k8scsi/csi-provisioner:v2.1.2 |
|
csi-snapshotter |
mirantis.azurecr.io/ceph/k8scsi/csi-snapshotter:v4.0.0 |
|
csi-attacher |
mirantis.azurecr.io/ceph/k8scsi/csi-attacher:v3.1.0 |
|
csi-resizer |
mirantis.azurecr.io/ceph/k8scsi/csi-resizer:v1.1.0 |
|
rook |
mirantis.azurecr.io/ceph/rook:v1.0.0-20220504194120 |
Artifact |
Component |
Path |
|---|---|---|
Binaries Updated |
lcm-ansible |
https://binary.mirantis.com/lcm/bin/lcm-ansible/v0.16.0-13-gcac49ca/lcm-ansible.tar.gz |
lcm-agent |
https://binary.mirantis.com/lcm/bin/lcm-agent/v0.3.0-239-gae7218ea/lcm-agent |
|
Helm charts Updated |
managed-lcm-api |
https://binary.mirantis.com/core/helm/managed-lcm-api-1.31.9.tgz |
metallb |
||
metrics-server |
https://binary.mirantis.com/core/helm/metrics-server-1.31.9.tgz |
|
Docker images |
helm |
mirantis.azurecr.io/lcm/helm/tiller:v2.16.11-40 |
helm-controller Updated |
mirantis.azurecr.io/lcm/lcm-controller:v0.3.0-239-gae7218ea |
|
metallb-controller |
mirantis.azurecr.io/lcm/metallb/controller:v0.9.3-1 |
|
metallb-speaker |
mirantis.azurecr.io/lcm/metallb/speaker:v0.9.3-1 |
|
metrics-server |
mirantis.azurecr.io/lcm/metrics-server-amd64:v0.5.2 |
Artifact |
Component |
Path |
|---|---|---|
Helm charts |
alerta |
https://binary.mirantis.com/stacklight/helm/alerta-0.1.0-mcp-25.tgz |
alertmanager-webhook-servicenow Updated |
https://binary.mirantis.com/stacklight/helm/alertmanager-webhook-servicenow-0.2.0-mcp-3.tgz |
|
cerebro |
https://binary.mirantis.com/stacklight/helm/cerebro-0.1.0-mcp-2.tgz |
|
elasticsearch Removed |
n/a |
|
elasticsearch-curator Updated |
https://binary.mirantis.com/stacklight/helm/elasticsearch-curator-1.5.0-mcp-9.tgz |
|
elasticsearch-exporter |
https://binary.mirantis.com/stacklight/helm/elasticsearch-exporter-1.2.0-mcp-6.tgz |
|
fluentd Updated |
https://binary.mirantis.com/stacklight/helm/fluentd-2.0.3-mcp-37.tgz |
|
fluentd-elasticsearch Removed |
n/a |
|
fluentd-logs New |
https://binary.mirantis.com/stacklight/helm/fluentd-elasticsearch-3.0.0-mcp-128.tgz |
|
grafana Updated |
https://binary.mirantis.com/stacklight/helm/grafana-3.3.10-mcp-145.tgz |
|
iam-proxy |
||
kibana Removed |
n/a |
|
metric-collector Updated |
https://binary.mirantis.com/stacklight/helm/metric-collector-0.3.0-mcp-6.tgz |
|
metricbeat |
https://binary.mirantis.com/stacklight/helm/metricbeat-1.7.1-mcp-16.tgz |
|
opensearch New |
https://binary.mirantis.com/stacklight/helm/opensearch-0.1.0-mcp-50.tgz |
|
opensearch-dashboards New |
https://binary.mirantis.com/stacklight/helm/opensearch-dashboards-0.1.0-mcp-40.tgz |
|
patroni |
https://binary.mirantis.com/stacklight/helm/patroni-0.15.1-mcp-42.tgz |
|
prometheus Updated |
https://binary.mirantis.com/stacklight/helm/prometheus-8.11.4-mcp-225.tgz |
|
prometheus-blackbox-exporter |
https://binary.mirantis.com/stacklight/helm/prometheus-blackbox-exporter-0.3.0-mcp-11.tgz |
|
prometheus-es-exporter |
https://binary.mirantis.com/stacklight/helm/prometheus-es-exporter-1.0.0-mcp-11.tgz |
|
prometheus-msteams Updated |
https://binary.mirantis.com/stacklight/helm/prometheus-msteams-0.1.0-mcp-8.tgz |
|
prometheus-nginx-exporter |
https://binary.mirantis.com/stacklight/helm/prometheus-nginx-exporter-0.2.0-mcp-1.tgz |
|
sf-notifier Updated |
https://binary.mirantis.com/stacklight/helm/sf-notifier-0.2.0-mcp-2.tgz |
|
sf-reporter Updated |
https://binary.mirantis.com/stacklight/helm/sf-reporter-0.2.0-mcp-3.tgz |
|
stacklight Updated |
https://binary.mirantis.com/stacklight/helm/stacklight-0.6.1.tgz |
|
telegraf-ds |
https://binary.mirantis.com/stacklight/helm/telegraf-ds-1.1.5-mcp-29.tgz |
|
telegraf-s |
https://binary.mirantis.com/stacklight/helm/telegraf-s-1.1.5-mcp-30.tgz |
|
telemeter-server Updated |
https://binary.mirantis.com/stacklight/helm/telemeter-server-0.2.0-mcp-5.tgz |
|
telemeter-client Updated |
https://binary.mirantis.com/stacklight/helm/telemeter-client-0.2.0-mcp-5.tgz |
|
Docker images |
alerta |
mirantis.azurecr.io/stacklight/alerta-web:8.5.0-20211108051042 |
alertmanager |
mirantis.azurecr.io/stacklight/alertmanager:v0.23.0 |
|
alertmanager-webhook-servicenow Updated |
mirantis.azurecr.io/stacklight/alertmanager-webhook-servicenow:v0.1-20220420161450 |
|
busybox |
mirantis.azurecr.io/stacklight/busybox:1.30 |
|
cerebro |
mirantis.azurecr.io/stacklight/cerebro:0.9.3 |
|
configmap-reload |
mirantis.azurecr.io/stacklight/configmap-reload:v0.3.0 |
|
curl |
mirantis.azurecr.io/stacklight/curl:7.69.0 |
|
curl-jq |
mirantis.azurecr.io/stacklight/curl-jq:1.5-1 |
|
elasticsearch-curator |
mirantis.azurecr.io/stacklight/curator:5.7.6 |
|
elasticsearch-exporter |
mirantis.azurecr.io/stacklight/elasticsearch_exporter:1.0.2 |
|
fluentd |
mirantis.azurecr.io/stacklight/fluentd:1.14-20220111114545 |
|
grafana Updated |
mirantis.azurecr.io/stacklight/grafana:8.5.0 |
|
grafana-image-renderer |
mirantis.azurecr.io/stacklight/grafana-image-renderer:3.2.1 |
|
kubectl |
mirantis.azurecr.io/stacklight/kubectl:1.19.13 |
|
k8s-sidecar Updated |
mirantis.azurecr.io/stacklight/k8s-sidecar:1.15.9 |
|
kube-state-metrics |
mirantis.azurecr.io/stacklight/kube-state-metrics:v2.2.4 |
|
metric-collector |
mirantis.azurecr.io/stacklight/metric-collector:v0.1-20220209123106 |
|
metricbeat |
mirantis.azurecr.io/stacklight/metricbeat:7.10.2-20220309185937 |
|
node-exporter |
mirantis.azurecr.io/stacklight/node-exporter:v1.2.2 |
|
opensearch |
mirantis.azurecr.io/stacklight/opensearch:1-20220316161927 |
|
opensearch-dashboards |
mirantis.azurecr.io/stacklight/opensearch-dashboards:1-20220316161951 |
|
origin-telemeter |
mirantis.azurecr.io/stacklight/origin-telemeter:4.4.0-20200424 |
|
prometheus |
mirantis.azurecr.io/stacklight/prometheus:v2.31.1 |
|
prometheus-blackbox-exporter |
mirantis.azurecr.io/stacklight/blackbox-exporter:v0.19.0 |
|
prometheus-es-exporter |
mirantis.azurecr.io/stacklight/prometheus-es-exporter:v0.14.0-20220111114356 |
|
prometheus-msteams |
mirantis.azurecr.io/stacklight/prometheus-msteams:v1.4.2 |
|
prometheus-nginx-exporter |
mirantis.azurecr.io/stacklight/nginx-prometheus-exporter:0.6.0 |
|
prometheus-patroni-exporter |
mirantis.azurecr.io/stacklight/prometheus-patroni-exporter:v0.1-20210708141736 |
|
prometheus-postgres-exporter |
mirantis.azurecr.io/stacklight/prometheus-postgres-exporter:v0.9.0 |
|
prometheus-relay |
mirantis.azurecr.io/stacklight/prometheus-relay:v0.3-20210317133316 |
|
sf-notifier |
mirantis.azurecr.io/stacklight/sf-notifier:v0.3-20210930112115 |
|
sf-reporter Updated |
mirantis.azurecr.io/stacklight/sf-reporter:v0.1-20220419092138 |
|
spilo |
mirantis.azurecr.io/stacklight/spilo:13-2.1p1-20220225091552 |
|
telegraf |
mirantis.azurecr.io/stacklight/telegraf:v1.9.1-20210225152050 |
|
mirantis.azurecr.io/stacklight/telegraf:1.20.2-20220204122426 |
||
telemeter-token-auth |
mirantis.azurecr.io/stacklight/telemeter-token-auth:v0.1-20200406175600 |
|
yq |
mirantis.azurecr.io/stacklight/yq:v4.2.0 |
Artifact |
Component |
Path |
|---|---|---|
Debian repositories |
System packages |
|
http://mirror.mirantis.com/kaas/kubernetes-extra-rhel7-0.0.5/ |
||
https://mirror.mirantis.com/kaas/ubuntu-2022-05-03-013543.target.txt |
||
MCR repositories |
MCR |
https://repos.mirantis.com/ubuntu/dists/bionic/pool/stable-20.10/ |
For the list of known and resolved issues, refer to the Container Cloud release 2.18.0 section.
This section outlines release notes for the Cluster release 11.1.0 that is introduced in the Mirantis Container Cloud release 2.17.0.
This Cluster release supports Mirantis Kubernetes Engine 3.5.1 with Kubernetes 1.21 and Mirantis Container Runtime 20.10.8.
This section outlines new features implemented in the Cluster release 11.1.0 that is introduced in the Container Cloud release 2.17.0.
Expanded support for the Mirantis Kubernetes Engine (MKE) 3.5.1 that includes Kubernetes 1.21 to be deployed on the Container Cloud management and regional clusters. The MKE 3.5.1 support for managed clusters was introduced in Container Cloud 2.16.0.
Learn more
Implemented the capability to configure the Elasticsearch retention time per logs, events, and notifications indices when creating a managed cluster through Container Cloud web UI.
The Retention Time parameter in the Container Cloud web UI is now replaced with the Logstash Retention Time, Events Retention Time, and Notifications Retention Time parameters.
Learn more
Implemented monitoring and added alerts for the Helm Controller
service and the HelmBundle custom resources.
Learn more
Implemented configurable timeouts for Ceph requests processing. The default is
set to 30 minutes. You can configure the timeout using the
pgRebalanceTimeoutMin parameter in the Ceph Helm chart.
Implemented the capability to configure the replicas count for
cephController, cephStatus, and cephRequest controllers using the
replicas parameter in the Ceph Helm chart. The default is set to 3
replicas.
Implemented a separate ceph-kcc-controller that runs on a management
cluster and manages the KaaSCephCluster custom resource (CR). Previously,
the KaaSCephCluster CR was managed by bm-provider.
Learn more
The following table lists the components versions of the Cluster release 11.1.0.
Note
The components that are newly added, updated, deprecated, or removed
as compared to the previous release version, are marked
with a corresponding superscript,
for example, lcm-ansible Updated.
Component |
Application/Service |
Version |
|---|---|---|
Cluster orchestration |
Mirantis Kubernetes Engine |
3.5.1 0 |
Container runtime |
Mirantis Container Runtime |
20.10.8 1 |
Distributed storage |
Ceph |
15.2.13 (Octopus) |
Rook Updated |
1.0.0-20220504194120 |
|
LCM |
Helm |
2.16.11-40 |
helm-controller Updated |
0.3.0-229-g4774bbbb |
|
lcm-ansible Updated |
0.15.0-24-gf023ea1 |
|
lcm-agent Updated |
0.3.0-229-g4774bbbb |
|
metallb-controller |
0.9.3-1 |
|
metrics-server |
0.5.2 |
|
StackLight |
Alerta |
8.5.0-20211108051042 |
Alertmanager |
0.23.0 |
|
Alertmanager Webhook ServiceNow |
0.1-20210601141858 |
|
Cerebro |
0.9.3 |
|
Elasticsearch Curator |
5.7.6 |
|
Elasticsearch Exporter |
1.0.2 |
|
Fluentd |
1.14-20220111114545 |
|
Grafana |
8.2.7 |
|
Grafana Image Renderer |
3.2.1 |
|
IAM Proxy |
6.0.1 |
|
Metric Collector |
0.1-20220209123106 |
|
Metricbeat Updated |
7.10.2-20220309185937 |
|
OpenSearch Updated |
1-20220316161927 |
|
OpenSearch Dashboards Updated |
1-20220316161951 |
|
Patroni Updated |
13-2.1p1-20220225091552 |
|
Prometheus |
2.31.1 |
|
Prometheus Blackbox Exporter |
0.19.0 |
|
Prometheus ES Exporter |
0.14.0-20220111114356 |
|
Prometheus MS Teams |
1.4.2 |
|
Prometheus Node Exporter |
1.2.2 |
|
Prometheus NGINX Exporter |
0.6.0 |
|
Prometheus Patroni Exporter |
0.1-20210708141736 |
|
Prometheus Postgres Exporter |
0.9.0 |
|
Prometheus Relay |
0.3-20210317133316 |
|
sf-notifier |
0.3-20210930112115 |
|
sf-reporter |
0.1-20210607111404 |
|
Telegraf |
1.9.1-20210225142050 |
|
Updated |
1.20.2-20220204122426 |
|
Telemeter |
4.4.0-20200424 |
- 0
For the Mirantis Kubernetes Engine (MKE) release highlights and components versions, see MKE documentation: MKE release notes.
- 1
For the Mirantis Container Runtime (MCR) release highlights, see MCR documentation: MCR release notes.
This section lists the components artifacts of the Cluster release 11.1.0.
Note
The components that are newly added, updated, deprecated, or removed
as compared to the previous release version, are marked
with a corresponding superscript,
for example, lcm-ansible Updated.
Artifact |
Component |
Path |
|---|---|---|
Helm chart |
ceph-controller Updated |
https://binary.mirantis.com/ceph/helm/ceph-operator-1.0.0-mcp-719.tgz |
Docker images |
ceph |
mirantis.azurecr.io/ceph/ceph:v15.2.13 |
ceph-controller Updated |
mirantis.azurecr.io/ceph/mcp/ceph-controller:v1.0.0-20220421152918 |
|
cephcsi |
mirantis.azurecr.io/ceph/cephcsi/cephcsi:v3.4.0 |
|
csi-node-driver-registrar |
mirantis.azurecr.io/ceph/k8scsi/csi-node-driver-registrar:v2.1.0 |
|
csi-provisioner |
mirantis.azurecr.io/ceph/k8scsi/csi-provisioner:v2.1.2 |
|
csi-snapshotter |
mirantis.azurecr.io/ceph/k8scsi/csi-snapshotter:v4.0.0 |
|
csi-attacher |
mirantis.azurecr.io/ceph/k8scsi/csi-attacher:v3.1.0 |
|
csi-resizer |
mirantis.azurecr.io/ceph/k8scsi/csi-resizer:v1.1.0 |
|
rook Updated |
mirantis.azurecr.io/ceph/rook:v1.0.0-20220504194120 |
Artifact |
Component |
Path |
|---|---|---|
Binaries Updated |
lcm-ansible |
https://binary.mirantis.com/lcm/bin/lcm-ansible/v0.15.0-24-gf023ea1/lcm-ansible.tar.gz |
lcm-agent |
https://binary.mirantis.com/lcm/bin/lcm-agent/v0.3.0-229-g4774bbbb/lcm-agent |
|
Helm charts Updated |
managed-lcm-api |
https://binary.mirantis.com/core/helm/managed-lcm-api-1.30.6.tgz |
metallb |
||
metrics-server |
https://binary.mirantis.com/core/helm/metrics-server-1.30.6.tgz |
|
Docker images |
helm |
mirantis.azurecr.io/lcm/helm/tiller:v2.16.11-40 |
helm-controller Updated |
mirantis.azurecr.io/lcm/lcm-controller:v0.3.0-229-g4774bbbb |
|
metallb-controller |
mirantis.azurecr.io/lcm/metallb/controller:v0.9.3-1 |
|
metallb-speaker |
mirantis.azurecr.io/lcm/metallb/speaker:v0.9.3-1 |
|
metrics-server |
mirantis.azurecr.io/lcm/metrics-server-amd64:v0.5.2 |
Artifact |
Component |
Path |
|---|---|---|
Helm charts |
alerta |
https://binary.mirantis.com/stacklight/helm/alerta-0.1.0-mcp-25.tgz |
alertmanager-webhook-servicenow |
https://binary.mirantis.com/stacklight/helm/alertmanager-webhook-servicenow-0.2.0-mcp-1.tgz |
|
cerebro |
https://binary.mirantis.com/stacklight/helm/cerebro-0.1.0-mcp-2.tgz |
|
elasticsearch Updated |
https://binary.mirantis.com/stacklight/helm/elasticsearch-7.1.1-mcp-45.tgz |
|
elasticsearch-curator Updated |
https://binary.mirantis.com/stacklight/helm/elasticsearch-curator-1.5.0-mcp-8.tgz |
|
elasticsearch-exporter Updated |
https://binary.mirantis.com/stacklight/helm/elasticsearch-exporter-1.2.0-mcp-6.tgz |
|
fluentd |
https://binary.mirantis.com/stacklight/helm/fluentd-2.0.3-mcp-36.tgz |
|
fluentd-elasticsearch Updated |
https://binary.mirantis.com/stacklight/helm/fluentd-elasticsearch-3.0.0-mcp-123.tgz |
|
grafana Updated |
https://binary.mirantis.com/stacklight/helm/grafana-3.3.10-mcp-130.tgz |
|
iam-proxy |
||
kibana |
https://binary.mirantis.com/stacklight/helm/kibana-3.2.1-mcp-36.tgz |
|
metric-collector |
https://binary.mirantis.com/stacklight/helm/metric-collector-0.3.0-mcp-4.tgz |
|
metricbeat |
https://binary.mirantis.com/stacklight/helm/metricbeat-1.7.1-mcp-16.tgz |
|
patroni Updated |
https://binary.mirantis.com/stacklight/helm/patroni-0.15.1-mcp-42.tgz |
|
prometheus |
https://binary.mirantis.com/stacklight/helm/prometheus-8.11.4-mcp-218.tgz |
|
prometheus-blackbox-exporter |
https://binary.mirantis.com/stacklight/helm/prometheus-blackbox-exporter-0.3.0-mcp-11.tgz |
|
prometheus-es-exporter |
https://binary.mirantis.com/stacklight/helm/prometheus-es-exporter-1.0.0-mcp-11.tgz |
|
prometheus-msteams |
https://binary.mirantis.com/stacklight/helm/prometheus-msteams-0.1.0-mcp-2.tgz |
|
prometheus-nginx-exporter |
https://binary.mirantis.com/stacklight/helm/prometheus-nginx-exporter-0.2.0-mcp-1.tgz |
|
sf-notifier |
https://binary.mirantis.com/stacklight/helm/sf-notifier-0.2.0-mcp-1.tgz |
|
sf-reporter |
https://binary.mirantis.com/stacklight/helm/sf-reporter-0.2.0-mcp-1.tgz |
|
stacklight Updated |
https://binary.mirantis.com/stacklight/helm/stacklight-0.5.3.tgz |
|
telegraf-ds |
https://binary.mirantis.com/stacklight/helm/telegraf-ds-1.1.5-mcp-29.tgz |
|
telegraf-s |
https://binary.mirantis.com/stacklight/helm/telegraf-s-1.1.5-mcp-30.tgz |
|
telemeter-server |
https://binary.mirantis.com/stacklight/helm/telemeter-server-0.2.0-mcp-4.tgz |
|
telemeter-client |
https://binary.mirantis.com/stacklight/helm/telemeter-client-0.2.0-mcp-4.tgz |
|
Docker images |
alerta |
mirantis.azurecr.io/stacklight/alerta-web:8.5.0-20211108051042 |
alertmanager |
mirantis.azurecr.io/stacklight/alertmanager:v0.23.0 |
|
alertmanager-webhook-servicenow |
mirantis.azurecr.io/stacklight/alertmanager-webhook-servicenow:v0.1-20210601141858 |
|
busybox |
mirantis.azurecr.io/stacklight/busybox:1.30 |
|
cerebro |
mirantis.azurecr.io/stacklight/cerebro:0.9.3 |
|
configmap-reload |
mirantis.azurecr.io/stacklight/configmap-reload:v0.3.0 |
|
curl |
mirantis.azurecr.io/stacklight/curl:7.69.0 |
|
curl-jq |
mirantis.azurecr.io/stacklight/curl-jq:1.5-1 |
|
elasticsearch-curator |
mirantis.azurecr.io/stacklight/curator:5.7.6 |
|
elasticsearch-exporter |
mirantis.azurecr.io/stacklight/elasticsearch_exporter:1.0.2 |
|
fluentd |
mirantis.azurecr.io/stacklight/fluentd:1.14-20220111114545 |
|
grafana |
mirantis.azurecr.io/stacklight/grafana:8.2.7 |
|
grafana-image-renderer |
mirantis.azurecr.io/stacklight/grafana-image-renderer:3.2.1 |
|
kubectl |
mirantis.azurecr.io/stacklight/kubectl:1.19.13 |
|
k8s-sidecar |
mirantis.azurecr.io/stacklight/k8s-sidecar:1.10.8 |
|
kube-state-metrics |
mirantis.azurecr.io/stacklight/kube-state-metrics:v2.2.4 |
|
metric-collector |
mirantis.azurecr.io/stacklight/metric-collector:v0.1-20220209123106 |
|
metricbeat Updated |
mirantis.azurecr.io/stacklight/metricbeat:7.10.2-20220309185937 |
|
node-exporter |
mirantis.azurecr.io/stacklight/node-exporter:v1.2.2 |
|
opensearch Updated |
mirantis.azurecr.io/stacklight/opensearch:1-20220316161927 |
|
opensearch-dashboards Updated |
mirantis.azurecr.io/stacklight/opensearch-dashboards:1-20220316161951 |
|
origin-telemeter |
mirantis.azurecr.io/stacklight/origin-telemeter:4.4.0-20200424 |
|
prometheus |
mirantis.azurecr.io/stacklight/prometheus:v2.31.1 |
|
prometheus-blackbox-exporter |
mirantis.azurecr.io/stacklight/blackbox-exporter:v0.19.0 |
|
prometheus-es-exporter |
mirantis.azurecr.io/stacklight/prometheus-es-exporter:v0.14.0-20220111114356 |
|
prometheus-msteams |
mirantis.azurecr.io/stacklight/prometheus-msteams:v1.4.2 |
|
prometheus-nginx-exporter |
mirantis.azurecr.io/stacklight/nginx-prometheus-exporter:0.6.0 |
|
prometheus-patroni-exporter |
mirantis.azurecr.io/stacklight/prometheus-patroni-exporter:v0.1-20210708141736 |
|
prometheus-postgres-exporter |
mirantis.azurecr.io/stacklight/prometheus-postgres-exporter:v0.9.0 |
|
prometheus-relay |
mirantis.azurecr.io/stacklight/prometheus-relay:v0.3-20210317133316 |
|
sf-notifier |
mirantis.azurecr.io/stacklight/sf-notifier:v0.3-20210930112115 |
|
sf-reporter |
mirantis.azurecr.io/stacklight/sf-reporter:v0.1-20210607111404 |
|
spilo Updated |
mirantis.azurecr.io/stacklight/spilo:13-2.1p1-20220225091552 |
|
telegraf |
mirantis.azurecr.io/stacklight/telegraf:v1.9.1-20210225152050 |
|
Updated |
mirantis.azurecr.io/stacklight/telegraf:1.20.2-20220204122426 |
|
telemeter-token-auth |
mirantis.azurecr.io/stacklight/telemeter-token-auth:v0.1-20200406175600 |
|
yq |
mirantis.azurecr.io/stacklight/yq:v4.2.0 |
Artifact |
Component |
Path |
|---|---|---|
Debian repositories |
System packages |
|
http://mirror.mirantis.com/kaas/kubernetes-extra-rhel7-0.0.5/ |
||
https://mirror.mirantis.com/kaas/ubuntu-2021-11-11-014639.target.txt |
||
MCR repositories |
MCR |
https://repos.mirantis.com/ubuntu/dists/bionic/pool/stable-20.10/ |
For the list of known and resolved issues, refer to the Container Cloud release 2.17.0 section.
This section outlines release notes for the Cluster release 11.0.0 that is introduced in the Mirantis Container Cloud release 2.16.0 and is designed for managed clusters.
This Cluster release supports Mirantis Kubernetes Engine 3.5.1 with Kubernetes 1.21 and Mirantis Container Runtime 20.10.8.
For the list of known and resolved issues, refer to the Container Cloud release 2.16.0 section.
This section outlines new features implemented in the Cluster release 11.0.0 that is introduced in the Container Cloud release 2.16.0.
Introduced support for the Mirantis Kubernetes Engine (MKE) 3.5.1 that includes Kubernetes 1.21 to be deployed on the Container Cloud managed clusters. Also, added support for attachment of existing MKE 3.5.1 clusters.
Learn more
Added the KubePodsRegularLongTermRestarts alert that raises in case of a
long-term periodic restart of containers.
Implemented the capability to configure the Elasticsearch retention time per
index using the elasticsearch.retentionTime parameter in the StackLight
Helm chart. Now, you can configure different retention periods for different
indices: logs, events, and notifications.
The elasticsearch.logstashRetentionTime parameter is now deprecated.
Implemented the capability to configure Prometheus Blackbox Exporter, including
customModules and timeoutOffset, through the StackLight Helm chart.
Implemented the capability to define custom Prometheus scrape configurations.
Due to licensing changes for Elasticsearch, Mirantis Container Cloud has switched from using Elasticsearch to OpenSearch and Kibana has switched to OpenSearch Dashboards. OpenSearch is a fork of Elasticsearch under the open-source Apache License with development led by Amazon Web Services.
For new deployments with the logging stack enabled, OpenSearch is now deployed by default. For existing deployments, migration to OpenSearch is performed automatically during clusters update. However, the entire Elasticsearch cluster may go down for up to 15 minutes.
Learn more
The following table lists the components versions of the Cluster release 11.0.0.
Component |
Application/Service |
Version |
|---|---|---|
Cluster orchestration |
Mirantis Kubernetes Engine |
3.5.1 0 |
Container runtime |
Mirantis Container Runtime |
20.10.8 1 |
Distributed storage |
Ceph |
15.2.13 (Octopus) |
Rook |
1.7.6 |
|
LCM |
Helm |
2.16.11-40 |
helm-controller |
0.3.0-187-gba894556 |
|
lcm-ansible |
0.14.0-14-geb6a51f |
|
lcm-agent |
0.3.0-187-gba894556 |
|
metallb-controller |
0.9.3-1 |
|
metrics-server |
0.5.2 |
|
StackLight |
Alerta |
8.5.0-20211108051042 |
Alertmanager |
0.23.0 |
|
Alertmanager Webhook ServiceNow |
0.1-20210601141858 |
|
Cerebro |
0.9.3 |
|
Elasticsearch Curator |
5.7.6 |
|
Elasticsearch Exporter |
1.0.2 |
|
Fluentd |
1.14-20220111114545 |
|
Grafana |
8.2.7 |
|
Grafana Image Renderer |
3.2.1 |
|
IAM Proxy |
6.0.1 |
|
Metric Collector |
0.1-20220209123106 |
|
Metricbeat |
7.10.2-20220111114624 |
|
OpenSearch |
1.2-20220114131142 |
|
OpenSearch Dashboards |
1.2-20220114131222 |
|
Patroni |
13-2.1p1-20220131130853 |
|
Prometheus |
2.31.1 |
|
Prometheus Blackbox Exporter |
0.19.0 |
|
Prometheus ES Exporter |
0.14.0-20220111114356 |
|
Prometheus MS Teams |
1.4.2 |
|
Prometheus Node Exporter |
1.2.2 |
|
Prometheus NGINX Exporter |
0.6.0 |
|
Prometheus Patroni Exporter |
0.1-20210708141736 |
|
Prometheus Postgres Exporter |
0.9.0 |
|
Prometheus Relay |
0.3-20210317133316 |
|
sf-notifier |
0.3-20210930112115 |
|
sf-reporter |
0.1-20210607111404 |
|
Telegraf |
1.9.1-20210225142050 |
|
1.20.0-20210927090119 |
||
Telemeter |
4.4.0-20200424 |
- 0
For the Mirantis Kubernetes Engine (MKE) release highlights and components versions, see MKE documentation: MKE release notes.
- 1
For the Mirantis Container Runtime (MCR) release highlights, see MCR documentation: MCR release notes.
This section lists the components artifacts of the Cluster release 11.0.0.
Artifact |
Component |
Path |
|---|---|---|
Helm chart |
ceph-controller |
https://binary.mirantis.com/ceph/helm/ceph-operator-1.0.0-mcp-661.tgz |
Docker images |
ceph |
mirantis.azurecr.io/ceph/ceph:v15.2.13 |
ceph-controller |
mirantis.azurecr.io/ceph/mcp/ceph-controller:v1.0.0-20220203124822 |
|
cephcsi |
mirantis.azurecr.io/ceph/cephcsi/cephcsi:v3.4.0 |
|
csi-node-driver-registrar |
mirantis.azurecr.io/ceph/k8scsi/csi-node-driver-registrar:v2.1.0 |
|
csi-provisioner |
mirantis.azurecr.io/ceph/k8scsi/csi-provisioner:v2.1.2 |
|
csi-snapshotter |
mirantis.azurecr.io/ceph/k8scsi/csi-snapshotter:v4.0.0 |
|
csi-attacher |
mirantis.azurecr.io/ceph/k8scsi/csi-attacher:v3.1.0 |
|
csi-resizer |
mirantis.azurecr.io/ceph/k8scsi/csi-resizer:v1.1.0 |
|
rook |
mirantis.azurecr.io/ceph/rook/ceph:v1.7.6 |
Artifact |
Component |
Path |
|---|---|---|
Binaries |
lcm-ansible |
https://binary.mirantis.com/lcm/bin/lcm-ansible/v0.14.0-14-geb6a51f/lcm-ansible.tar.gz |
lcm-agent |
https://binary.mirantis.com/lcm/bin/lcm-agent/v0.3.0-187-gba894556/lcm-agent |
|
Helm charts |
managed-lcm-api |
https://binary.mirantis.com/core/helm/managed-lcm-api-1.29.6.tgz |
metallb |
||
metrics-server |
https://binary.mirantis.com/core/helm/metrics-server-1.29.6.tgz |
|
Docker images |
helm |
mirantis.azurecr.io/lcm/helm/tiller:v2.16.11-40 |
helm-controller |
mirantis.azurecr.io/lcm/lcm-controller:v0.3.0-187-gba894556 |
|
metallb-controller |
mirantis.azurecr.io/lcm/metallb/controller:v0.9.3-1 |
|
metallb-speaker |
mirantis.azurecr.io/lcm/metallb/speaker:v0.9.3-1 |
|
metrics-server |
mirantis.azurecr.io/lcm/metrics-server-amd64:v0.5.2 |
Artifact |
Component |
Path |
|---|---|---|
Helm charts |
alerta |
https://binary.mirantis.com/stacklight/helm/alerta-0.1.0-mcp-25.tgz |
alertmanager-webhook-servicenow |
https://binary.mirantis.com/stacklight/helm/alertmanager-webhook-servicenow-0.2.0-mcp-1.tgz |
|
cerebro |
https://binary.mirantis.com/stacklight/helm/cerebro-0.1.0-mcp-2.tgz |
|
elasticsearch |
https://binary.mirantis.com/stacklight/helm/elasticsearch-7.1.1-mcp-44.tgz |
|
elasticsearch-curator |
https://binary.mirantis.com/stacklight/helm/elasticsearch-curator-1.5.0-mcp-6.tgz |
|
elasticsearch-exporter |
https://binary.mirantis.com/stacklight/helm/elasticsearch-exporter-1.2.0-mcp-2.tgz |
|
fluentd |
https://binary.mirantis.com/stacklight/helm/fluentd-2.0.3-mcp-36.tgz |
|
fluentd-elasticsearch |
https://binary.mirantis.com/stacklight/helm/fluentd-elasticsearch-3.0.0-mcp-120.tgz |
|
grafana |
https://binary.mirantis.com/stacklight/helm/grafana-3.3.10-mcp-125.tgz |
|
iam-proxy |
||
kibana |
https://binary.mirantis.com/stacklight/helm/kibana-3.2.1-mcp-36.tgz |
|
metric-collector |
https://binary.mirantis.com/stacklight/helm/metric-collector-0.3.0-mcp-4.tgz |
|
metricbeat |
https://binary.mirantis.com/stacklight/helm/metricbeat-1.7.1-mcp-16.tgz |
|
patroni |
https://binary.mirantis.com/stacklight/helm/patroni-0.15.1-mcp-38.tgz |
|
prometheus |
https://binary.mirantis.com/stacklight/helm/prometheus-8.11.4-mcp-218.tgz |
|
prometheus-blackbox-exporter |
https://binary.mirantis.com/stacklight/helm/prometheus-blackbox-exporter-0.3.0-mcp-11.tgz |
|
prometheus-es-exporter |
https://binary.mirantis.com/stacklight/helm/prometheus-es-exporter-1.0.0-mcp-11.tgz |
|
prometheus-msteams |
https://binary.mirantis.com/stacklight/helm/prometheus-msteams-0.1.0-mcp-2.tgz |
|
prometheus-nginx-exporter |
https://binary.mirantis.com/stacklight/helm/prometheus-nginx-exporter-0.2.0-mcp-1.tgz |
|
sf-notifier |
https://binary.mirantis.com/stacklight/helm/sf-notifier-0.2.0-mcp-1.tgz |
|
sf-reporter |
https://binary.mirantis.com/stacklight/helm/sf-reporter-0.2.0-mcp-1.tgz |
|
stacklight |
https://binary.mirantis.com/stacklight/helm/stacklight-0.4.3.tgz |
|
telegraf-ds |
https://binary.mirantis.com/stacklight/helm/telegraf-ds-1.1.5-mcp-29.tgz |
|
telegraf-s |
https://binary.mirantis.com/stacklight/helm/telegraf-s-1.1.5-mcp-30.tgz |
|
telemeter-server |
https://binary.mirantis.com/stacklight/helm/telemeter-server-0.2.0-mcp-4.tgz |
|
telemeter-client |
https://binary.mirantis.com/stacklight/helm/telemeter-client-0.2.0-mcp-4.tgz |
|
Docker images |
alerta |
mirantis.azurecr.io/stacklight/alerta-web:8.5.0-20211108051042 |
alertmanager |
mirantis.azurecr.io/stacklight/alertmanager:v0.23.0 |
|
alertmanager-webhook-servicenow |
mirantis.azurecr.io/stacklight/alertmanager-webhook-servicenow:v0.1-20210601141858 |
|
busybox |
mirantis.azurecr.io/stacklight/busybox:1.30 |
|
cerebro |
mirantis.azurecr.io/stacklight/cerebro:0.9.3 |
|
configmap-reload |
mirantis.azurecr.io/stacklight/configmap-reload:v0.3.0 |
|
curl |
mirantis.azurecr.io/stacklight/curl:7.69.0 |
|
curl-jq |
mirantis.azurecr.io/stacklight/curl-jq:1.5-1 |
|
elasticsearch-curator |
mirantis.azurecr.io/stacklight/curator:5.7.6 |
|
elasticsearch-exporter |
mirantis.azurecr.io/stacklight/elasticsearch_exporter:1.0.2 |
|
fluentd |
mirantis.azurecr.io/stacklight/fluentd:1.14-20220111114545 |
|
grafana |
mirantis.azurecr.io/stacklight/grafana:8.2.7 |
|
grafana-image-renderer |
mirantis.azurecr.io/stacklight/grafana-image-renderer:3.2.1 |
|
kubectl |
mirantis.azurecr.io/stacklight/kubectl:1.19.13 |
|
k8s-sidecar |
mirantis.azurecr.io/stacklight/k8s-sidecar:1.10.8 |
|
kube-state-metrics |
mirantis.azurecr.io/stacklight/kube-state-metrics:v2.2.4 |
|
metric-collector |
mirantis.azurecr.io/stacklight/metric-collector:v0.1-20220209123106 |
|
metricbeat |
mirantis.azurecr.io/stacklight/metricbeat:7.10.2-20220111114624 |
|
node-exporter |
mirantis.azurecr.io/stacklight/node-exporter:v1.2.2 |
|
opensearch |
mirantis.azurecr.io/stacklight/opensearch:1.2-20220114131142 |
|
opensearch-dashboards |
mirantis.azurecr.io/stacklight/opensearch-dashboards:1.2-20220114131222 |
|
origin-telemeter |
mirantis.azurecr.io/stacklight/origin-telemeter:4.4.0-20200424 |
|
prometheus |
mirantis.azurecr.io/stacklight/prometheus:v2.31.1 |
|
prometheus-blackbox-exporter |
mirantis.azurecr.io/stacklight/blackbox-exporter:v0.19.0 |
|
prometheus-es-exporter |
mirantis.azurecr.io/stacklight/prometheus-es-exporter:v0.14.0-20220111114356 |
|
prometheus-msteams |
mirantis.azurecr.io/stacklight/prometheus-msteams:v1.4.2 |
|
prometheus-nginx-exporter |
mirantis.azurecr.io/stacklight/nginx-prometheus-exporter:0.6.0 |
|
prometheus-patroni-exporter |
mirantis.azurecr.io/stacklight/prometheus-patroni-exporter:v0.1-20210708141736 |
|
prometheus-postgres-exporter |
mirantis.azurecr.io/stacklight/prometheus-postgres-exporter:v0.9.0 |
|
prometheus-relay |
mirantis.azurecr.io/stacklight/prometheus-relay:v0.3-20210317133316 |
|
sf-notifier |
mirantis.azurecr.io/stacklight/sf-notifier:v0.3-20210930112115 |
|
sf-reporter |
mirantis.azurecr.io/stacklight/sf-reporter:v0.1-20210607111404 |
|
spilo |
mirantis.azurecr.io/stacklight/spilo:13-2.1p1-20220131130853 |
|
telegraf |
mirantis.azurecr.io/stacklight/telegraf:v1.9.1-20210225152050 |
|
mirantis.azurecr.io/stacklight/telegraf:1.20.0-20210927090119 |
||
telemeter-token-auth |
mirantis.azurecr.io/stacklight/telemeter-token-auth:v0.1-20200406175600 |
|
yq |
mirantis.azurecr.io/stacklight/yq:v4.2.0 |
Artifact |
Component |
Path |
|---|---|---|
Debian repositories |
System packages |
|
http://mirror.mirantis.com/kaas/kubernetes-extra-rhel7-0.0.5/ |
||
https://mirror.mirantis.com/kaas/ubuntu-2021-11-11-014639.target.txt |
||
MCR repositories |
MCR |
https://repos.mirantis.com/ubuntu/dists/bionic/pool/stable-20.10/ |
This section outlines release notes for the unsupported Cluster releases of the 8.x series.
The Cluster release 8.10.0 is introduced in the Mirantis Container Cloud release 2.20.1. This Cluster release is based on the Cluster release 7.10.0.
The Cluster release 8.10.0 supports:
Mirantis OpenStack for Kubernetes (MOSK) 22.4. For details, see MOSK Release Notes.
Mirantis Kubernetes Engine (MKE) 3.4.10. For details, see MKE Release Notes.
Mirantis Container Runtime (MCR) 20.10.12. For details, see MCR Release Notes.
Kubernetes 1.20.
For the list of addressed and known issues, refer to the Container Cloud release 2.20.0 section.
This section outlines new features implemented in the Cluster release 8.10.0 that is introduced in the Container Cloud release 2.20.1.
Updated the Mirantis Kubernetes Engine (MKE) version from 3.4.8 to 3.4.10 and the Mirantis Container Runtime (MCR) version from 20.10.11 to 20.10.12.
Implemented the objectUsers RADOS Gateway parameter in the
KaaSCephCluster CR. The new parameter allows for an easy creation of custom
Ceph RADOS Gateway users with permission rules. The users parameter is now
deprecated and, if specified, will be automatically transformed to
objectUsers.
Learn more
Implemented the capability to easily view the summary and health status of all Ceph clusters through the Container Cloud web UI.
Implemented the capability to remove or replace Ceph OSDs not only by the
device name or path but also by ID, using the by-id parameter in the
KaaSCephOperationRequest CR.
Learn more
Implemented a new Kubernetes Containers Grafana dashboard that provides resources consumption metrics of containers running on Kubernetes nodes.
Learn more
The following table lists the components versions of the Cluster release 8.10.0.
Note
The components that are newly added, updated, deprecated, or removed
as compared to the previous release version, are marked
with a corresponding superscript,
for example, lcm-ansible Updated.
Component |
Application/Service |
Version |
|---|---|---|
Cluster orchestration |
Mirantis Kubernetes Engine Updated |
3.4.10 0 |
Container runtime |
Mirantis Container Runtime Updated |
20.10.12 1 |
Distributed storage |
Ceph |
15.2.13 (Octopus) |
Rook |
1.0.0-20220504194120 |
|
LCM |
Helm |
2.16.11-40 |
helm-controller Updated |
0.3.0-285-g8498abe0 |
|
lcm-ansible Updated |
0.18.1 |
|
lcm-agent Updated |
0.3.0-288-g405179c2 |
|
metallb-controller Updated |
0.12.1 |
|
metrics-server |
0.5.2 |
|
StackLight |
Alerta |
8.5.0-20211108051042 |
Alertmanager |
0.23.0 |
|
Alertmanager Webhook ServiceNow Updated |
0.1-20220706035316 |
|
Cerebro |
0.9.3 |
|
Elasticsearch Curator |
5.7.6 |
|
Elasticsearch Exporter |
1.0.2 |
|
Fluentd |
1.14-20220111114545 |
|
Grafana Updated |
9.0.2 |
|
Grafana Image Renderer Updated |
3.4.2 |
|
IAM Proxy |
6.0.1 |
|
Metric Collector Updated |
0.1-20220711134630 |
|
Metricbeat |
7.10.2-20220309185937 |
|
OpenSearch Updated |
1-20220517112057 |
|
OpenSearch Dashboards Updated |
1-20220517112107 |
|
Prometheus Updated |
2.35.0 |
|
Prometheus Blackbox Exporter |
0.19.0 |
|
Prometheus ES Exporter Updated |
0.14.0-20220517111946 |
|
Prometheus MS Teams |
1.4.2 |
|
Prometheus Node Exporter |
1.2.2 |
|
Prometheus NGINX Exporter |
0.6.0 |
|
Prometheus Patroni Exporter Updated |
0.1-20220624102731 |
|
Prometheus Postgres Exporter |
0.9.0 |
|
Prometheus Relay |
0.3-20210317133316 |
|
sf-notifier Updated |
0.3-20220706035002 |
|
sf-reporter Updated |
0.1-20220622101204 |
|
Spilo |
13-2.1p1-20220225091552 |
|
Telegraf Updated |
1.9.1-20220714080809 |
|
1.20.2-20220204122426 |
||
Telemeter |
4.4.0-20200424 |
- 0
For the Mirantis Kubernetes Engine (MKE) release highlights and components versions, see MKE documentation: MKE release notes.
- 1
For the Mirantis Container Runtime (MCR) release highlights, see MCR documentation: MCR release notes.
This section lists the components artifacts of the Cluster release 8.10.0.
Note
The components that are newly added, updated, deprecated, or removed
as compared to the previous release version, are marked
with a corresponding superscript,
for example, lcm-ansible Updated.
Artifact |
Component |
Path |
|---|---|---|
Helm chart |
ceph-controller Updated |
https://binary.mirantis.com/ceph/helm/ceph-operator-1.0.0-mcp-908.tgz |
Docker images |
ceph |
mirantis.azurecr.io/ceph/ceph:v15.2.13 |
ceph-controller Updated |
mirantis.azurecr.io/ceph/mcp/ceph-controller:v1.0.0-20220819101016 |
|
cephcsi |
mirantis.azurecr.io/ceph/cephcsi/cephcsi:v3.4.0 |
|
csi-node-driver-registrar |
mirantis.azurecr.io/ceph/k8scsi/csi-node-driver-registrar:v2.1.0 |
|
csi-provisioner |
mirantis.azurecr.io/ceph/k8scsi/csi-provisioner:v2.1.2 |
|
csi-snapshotter |
mirantis.azurecr.io/ceph/k8scsi/csi-snapshotter:v4.0.0 |
|
csi-attacher |
mirantis.azurecr.io/ceph/k8scsi/csi-attacher:v3.1.0 |
|
csi-resizer |
mirantis.azurecr.io/ceph/k8scsi/csi-resizer:v1.1.0 |
|
rook |
mirantis.azurecr.io/ceph/rook:v1.0.0-20220504194120 |
Artifact |
Component |
Path |
|---|---|---|
Binaries Updated |
lcm-ansible |
https://binary.mirantis.com/lcm/bin/lcm-ansible/v0.18.1/lcm-ansible.tar.gz |
lcm-agent |
https://binary.mirantis.com/lcm/bin/lcm-agent/v0.3.0-288-g405179c2/lcm-agent |
|
Helm charts Updated |
managed-lcm-api |
https://binary.mirantis.com/core/helm/managed-lcm-api-1.33.5.tgz |
metallb |
||
metrics-server |
https://binary.mirantis.com/core/helm/metrics-server-1.33.5.tgz |
|
Docker images |
helm-controller Updated |
mirantis.azurecr.io/lcm/lcm-controller:v0.3.0-285-g8498abe0 |
metallb-controller Updated |
mirantis.azurecr.io/bm/external/metallb/controller:v0.12.1 |
|
metallb-speaker Updated |
mirantis.azurecr.io/bm/external/metallb/speaker:v0.12.1 |
|
metrics-server |
mirantis.azurecr.io/core/external/metrics-server:v0.5.2 |
Artifact |
Component |
Path |
|---|---|---|
Helm charts |
alerta |
https://binary.mirantis.com/stacklight/helm/alerta-0.1.0-mcp-25.tgz |
alertmanager-webhook-servicenow |
https://binary.mirantis.com/stacklight/helm/alertmanager-webhook-servicenow-0.2.0-mcp-3.tgz |
|
cerebro |
https://binary.mirantis.com/stacklight/helm/cerebro-0.1.0-mcp-2.tgz |
|
elasticsearch-curator |
https://binary.mirantis.com/stacklight/helm/elasticsearch-curator-1.5.0-mcp-9.tgz |
|
elasticsearch-exporter |
https://binary.mirantis.com/stacklight/helm/elasticsearch-exporter-1.2.0-mcp-6.tgz |
|
fluentd |
https://binary.mirantis.com/stacklight/helm/fluentd-2.0.3-mcp-37.tgz |
|
fluentd-logs Updated |
https://binary.mirantis.com/stacklight/helm/fluentd-elasticsearch-3.0.0-mcp-131.tgz |
|
grafana Updated |
https://binary.mirantis.com/stacklight/helm/grafana-3.3.10-mcp-154.tgz |
|
iam-proxy Updated |
||
metric-collector |
https://binary.mirantis.com/stacklight/helm/metric-collector-0.3.0-mcp-6.tgz |
|
metricbeat |
https://binary.mirantis.com/stacklight/helm/metricbeat-1.7.1-mcp-16.tgz |
|
opensearch Updated |
https://binary.mirantis.com/stacklight/helm/opensearch-0.1.0-mcp-52.tgz |
|
opensearch-dashboards |
https://binary.mirantis.com/stacklight/helm/opensearch-dashboards-0.1.0-mcp-40.tgz |
|
patroni |
https://binary.mirantis.com/stacklight/helm/patroni-0.15.1-mcp-42.tgz |
|
prometheus Updated |
https://binary.mirantis.com/stacklight/helm/prometheus-8.11.4-mcp-228.tgz |
|
prometheus-blackbox-exporter |
https://binary.mirantis.com/stacklight/helm/prometheus-blackbox-exporter-0.3.0-mcp-11.tgz |
|
prometheus-es-exporter |
https://binary.mirantis.com/stacklight/helm/prometheus-es-exporter-1.0.0-mcp-11.tgz |
|
prometheus-msteams |
https://binary.mirantis.com/stacklight/helm/prometheus-msteams-0.1.0-mcp-8.tgz |
|
prometheus-nginx-exporter |
https://binary.mirantis.com/stacklight/helm/prometheus-nginx-exporter-0.2.0-mcp-1.tgz |
|
sf-notifier |
https://binary.mirantis.com/stacklight/helm/sf-notifier-0.2.0-mcp-2.tgz |
|
sf-reporter |
https://binary.mirantis.com/stacklight/helm/sf-reporter-0.2.0-mcp-3.tgz |
|
stacklight Updated |
https://binary.mirantis.com/stacklight/helm/stacklight-0.8.1.tgz |
|
telegraf-ds |
https://binary.mirantis.com/stacklight/helm/telegraf-ds-1.1.5-mcp-29.tgz |
|
telegraf-s |
https://binary.mirantis.com/stacklight/helm/telegraf-s-1.1.5-mcp-30.tgz |
|
telemeter-server Updated |
https://binary.mirantis.com/stacklight/helm/telemeter-server-0.2.0-mcp-6.tgz |
|
telemeter-client Updated |
https://binary.mirantis.com/stacklight/helm/telemeter-client-0.2.0-mcp-6.tgz |
|
Docker images |
alerta |
mirantis.azurecr.io/stacklight/alerta-web:8.5.0-20211108051042 |
alertmanager |
mirantis.azurecr.io/stacklight/alertmanager:v0.23.0 |
|
alertmanager-webhook-servicenow Updated |
mirantis.azurecr.io/stacklight/alertmanager-webhook-servicenow:v0.1-20220706035316 |
|
busybox |
mirantis.azurecr.io/stacklight/busybox:1.30 |
|
cerebro |
mirantis.azurecr.io/stacklight/cerebro:0.9.3 |
|
configmap-reload |
mirantis.azurecr.io/stacklight/configmap-reload:v0.3.0 |
|
curl |
mirantis.azurecr.io/stacklight/curl:7.69.0 |
|
curl-jq |
mirantis.azurecr.io/stacklight/curl-jq:1.5-1 |
|
elasticsearch-curator |
mirantis.azurecr.io/stacklight/curator:5.7.6 |
|
elasticsearch-exporter |
mirantis.azurecr.io/stacklight/elasticsearch_exporter:1.0.2 |
|
fluentd |
mirantis.azurecr.io/stacklight/fluentd:1.14-20220111114545 |
|
grafana Updated |
mirantis.azurecr.io/stacklight/grafana:9.0.2 |
|
grafana-image-renderer Updated |
mirantis.azurecr.io/stacklight/grafana-image-renderer:3.4.2 |
|
kubectl |
mirantis.azurecr.io/stacklight/kubectl:1.19.13 |
|
k8s-sidecar |
mirantis.azurecr.io/stacklight/k8s-sidecar:1.15.9 |
|
kube-state-metrics |
mirantis.azurecr.io/stacklight/kube-state-metrics:v2.2.4 |
|
metric-collector Updated |
mirantis.azurecr.io/stacklight/metric-collector:v0.1-20220711134630 |
|
metricbeat |
mirantis.azurecr.io/stacklight/metricbeat:7.10.2-20220309185937 |
|
node-exporter |
mirantis.azurecr.io/stacklight/node-exporter:v1.2.2 |
|
opensearch Updated |
mirantis.azurecr.io/stacklight/opensearch:1-20220517112057 |
|
opensearch-dashboards Updated |
mirantis.azurecr.io/stacklight/opensearch-dashboards:1-20220517112107 |
|
origin-telemeter |
mirantis.azurecr.io/stacklight/origin-telemeter:4.4.0-20200424 |
|
pgbouncer |
mirantis.azurecr.io/stacklight/pgbouncer:1.12.0 |
|
prometheus Updated |
mirantis.azurecr.io/stacklight/prometheus:v2.35.0 |
|
prometheus-blackbox-exporter |
mirantis.azurecr.io/stacklight/blackbox-exporter:v0.19.0 |
|
prometheus-es-exporter Updated |
mirantis.azurecr.io/stacklight/prometheus-es-exporter:v0.14.0-20220517111946 |
|
prometheus-msteams |
mirantis.azurecr.io/stacklight/prometheus-msteams:v1.4.2 |
|
prometheus-nginx-exporter |
mirantis.azurecr.io/stacklight/nginx-prometheus-exporter:0.6.0 |
|
prometheus-patroni-exporter Updated |
mirantis.azurecr.io/stacklight/prometheus-patroni-exporter:v0.1-20220624102731 |
|
prometheus-postgres-exporter |
mirantis.azurecr.io/stacklight/prometheus-postgres-exporter:v0.9.0 |
|
prometheus-relay |
mirantis.azurecr.io/stacklight/prometheus-relay:v0.3-20210317133316 |
|
sf-notifier Updated |
mirantis.azurecr.io/stacklight/sf-notifier:v0.3-20220706035002 |
|
sf-reporter Updated |
mirantis.azurecr.io/stacklight/sf-reporter:v0.1-20220622101204 |
|
spilo |
mirantis.azurecr.io/stacklight/spilo:13-2.1p1-20220225091552 |
|
telegraf Updated |
mirantis.azurecr.io/stacklight/telegraf:v1.9.1-20220714080809 |
|
mirantis.azurecr.io/stacklight/telegraf:1.20.2-20220204122426 |
||
telemeter-token-auth |
mirantis.azurecr.io/stacklight/telemeter-token-auth:v0.1-20200406175600 |
|
yq Updated |
mirantis.azurecr.io/stacklight/yq:4.25.2 |
Artifact |
Component |
Path |
|---|---|---|
Debian repositories |
System packages |
|
http://mirror.mirantis.com/kaas/kubernetes-extra-rhel7-0.0.5/ |
||
https://mirror.mirantis.com/kaas/ubuntu-2022-07-13-020010.target.txt |
||
MCR repositories |
MCR |
https://repos.mirantis.com/ubuntu/dists/bionic/pool/stable-20.10/ |
The Cluster release 8.8.0 is introduced in the Mirantis Container Cloud release 2.18.1. This Cluster release is based on the Cluster release 7.8.0.
The Cluster release 8.8.0 supports:
Mirantis OpenStack for Kubernetes (MOSK) 22.3. For details, see MOSK Release Notes.
Mirantis Kubernetes Engine (MKE) 3.4.8. For details, see MKE Release Notes.
Mirantis Container Runtime (MCR) 20.10.11. For details, see MCR Release Notes.
Kubernetes 1.20.
For the list of addressed and known issues, refer to the Container Cloud release 2.18.0 section.
This section outlines new features implemented in the Cluster release 8.8.0 that is introduced in the Container Cloud release 2.18.1.
Updated the Mirantis Kubernetes Engine (MKE) version from 3.4.7 to 3.4.8 and the Mirantis Container Runtime (MCR) version from 20.10.8 to 20.10.11.
As part of the Elasticsearch switching to OpenSearch, removed the Elasticsearch and Kibana services, as well as introduced a set of new parameters that will replace the current ones in future releases. The old parameters are supported and take precedence over the new ones. For details, see Deprecation Notes and StackLight configuration parameters.
Note
In the Container Cloud web UI, the Elasticsearch and Kibana naming is still present. However, the services behind them have switched to OpenSearch and OpenSearch Dashboards.
Implemented the following improvements to StackLight alerting:
Added the
MCCClusterUpdatinginformational alert that raises when the Mirantis Container Cloud cluster starts updating.Enhanced StackLight alerting by clarifying alert severity levels. Switched all
Minoralerts toWarning. Now, only alerts of the following severities exist:informational,warning,major, andcritical.Enhanced the documentation by adding troubleshooting guidelines for the Kubernetes applications, resources, and storage alerts.
Learn more
Implemented the capability to allow sending of metrics from Prometheus, using the Prometheus remote write feature to a custom monitoring endpoint.
Learn more
Defined the following parameters in the StackLight configuration of the Cluster object for all types of clusters as mandatory. This applies to the clusters with StackLight enabled only. For existing clusters, Cluster object will be updated automatically.
Important
When creating a new cluster, specify these parameters through the Container Cloud web UI or as described in StackLight configuration parameters. Update all cluster templates created before Container Cloud 2.18.0 that do not have values for these parameters specified. Otherwise, the Admission Controller will reject cluster creation.
Web UI parameter |
API parameter |
|---|---|
Enable Logging |
|
HA Mode |
|
Prometheus Persistent Volume Claim Size |
|
Elasticsearch Persistent Volume Claim Size |
|
Implemented the capability to configure the Elasticsearch retention time per logs, events, and notifications indices when creating a managed cluster through Container Cloud web UI.
The Retention Time parameter in the Container Cloud web UI is now replaced with the Logstash Retention Time, Events Retention Time, and Notifications Retention Time parameters.
Learn more
Implemented monitoring and added alerts for the Helm Controller
service and the HelmBundle custom resources.
Learn more
Implemented the capability to configure the placement of the
rook-ceph-operator, rook-discover, and csi-rbdplugin Ceph daemons.
Learn more
Implemented configurable timeouts for Ceph requests processing. The default is
set to 30 minutes. You can configure the timeout using the
pgRebalanceTimeoutMin parameter in the Ceph Helm chart.
Implemented the capability to configure the replicas count for
cephController, cephStatus, and cephRequest controllers using the
replicas parameter in the Ceph Helm chart. The default is set to 3
replicas.
Implemented a separate ceph-kcc-controller that runs on a management
cluster and manages the KaaSCephCluster custom resource (CR). Previously,
the KaaSCephCluster CR was managed by bm-provider.
Learn more
The following table lists the components versions of the Cluster release 8.8.0.
Note
The components that are newly added, updated, deprecated, or removed
as compared to the previous release version, are marked
with a corresponding superscript,
for example, lcm-ansible Updated.
Component |
Application/Service |
Version |
|---|---|---|
Cluster orchestration |
Mirantis Kubernetes Engine Updated |
3.4.8 0 |
Container runtime |
Mirantis Container Runtime Updated |
20.10.11 1 |
Distributed storage |
Ceph |
15.2.13 (Octopus) |
Rook Updated |
1.0.0-20220504194120 |
|
LCM |
Helm |
2.16.11-40 |
helm-controller Updated |
0.3.0-239-gae7218ea |
|
lcm-ansible Updated |
0.16.0-13-gcac49ca |
|
lcm-agent Updated |
0.3.0-239-gae7218ea |
|
metallb-controller |
0.9.3-1 |
|
metrics-server Updated |
0.5.2 |
|
StackLight |
Alerta |
8.5.0-20211108051042 |
Alertmanager |
0.23.0 |
|
Alertmanager Webhook ServiceNow Updated |
0.1-20220420161450 |
|
Cerebro |
0.9.3 |
|
Elasticsearch curator |
5.7.6 |
|
Elasticsearch exporter |
1.0.2 |
|
Fluentd |
1.14-20220111114545 |
|
Grafana Updated |
8.5.0 |
|
Grafana Image Renderer |
3.2.1 |
|
IAM Proxy |
6.0.1 |
|
Metric Collector |
0.1-20220209123106 |
|
Metricbeat Updated |
7.10.2-20220309185937 |
|
OpenSearch Updated |
1-20220316161927 |
|
OpenSearch Dashboards Updated |
1-20220316161951 |
|
Patroni Updated |
13-2.1p1-20220225091552 |
|
Prometheus |
2.31.1 |
|
Prometheus Blackbox Exporter |
0.19.0 |
|
Prometheus ES Exporter |
0.14.0-20220111114356 |
|
Prometheus MS Teams |
1.4.2 |
|
Prometheus Node Exporter |
1.2.2 |
|
Prometheus NGINX Exporter |
0.6.0 |
|
Prometheus Patroni Exporter |
0.1-20210708141736 |
|
Prometheus Postgres Exporter |
0.9.0 |
|
Prometheus Relay |
0.3-20210317133316 |
|
sf-notifier |
0.3-20210930112115 |
|
sf-reporter Updated |
0.1-20220419092138 |
|
Telegraf |
1.9.1-20210225142050 |
|
1.20.2-20220204122426 Updated |
||
Telemeter |
4.4.0-20200424 |
- 0
For the Mirantis Kubernetes Engine (MKE) release highlights and components versions, see MKE documentation: MKE release notes.
- 1
For the Mirantis Container Runtime (MCR) release highlights, see MCR documentation: MCR release notes.
This section lists the components artifacts of the Cluster release 8.8.0.
Note
The components that are newly added, updated, deprecated, or removed
as compared to the previous release version, are marked
with a corresponding superscript,
for example, lcm-ansible Updated.
Artifact |
Component |
Path |
|---|---|---|
Helm chart |
ceph-controller Updated |
https://binary.mirantis.com/ceph/helm/ceph-operator-1.0.0-mcp-792.tgz |
Docker images |
ceph |
mirantis.azurecr.io/ceph/ceph:v15.2.13 |
ceph-controller Updated |
mirantis.azurecr.io/ceph/mcp/ceph-controller:v1.0.0-20220506180707 |
|
cephcsi |
mirantis.azurecr.io/ceph/cephcsi/cephcsi:v3.4.0 |
|
csi-node-driver-registrar |
mirantis.azurecr.io/ceph/k8scsi/csi-node-driver-registrar:v2.1.0 |
|
csi-provisioner |
mirantis.azurecr.io/ceph/k8scsi/csi-provisioner:v2.1.2 |
|
csi-snapshotter |
mirantis.azurecr.io/ceph/k8scsi/csi-snapshotter:v4.0.0 |
|
csi-attacher |
mirantis.azurecr.io/ceph/k8scsi/csi-attacher:v3.1.0 |
|
csi-resizer |
mirantis.azurecr.io/ceph/k8scsi/csi-resizer:v1.1.0 |
|
rook Updated |
mirantis.azurecr.io/ceph/rook:v1.0.0-20220504194120 |
Artifact |
Component |
Path |
|---|---|---|
Binaries Updated |
lcm-ansible |
https://binary.mirantis.com/lcm/bin/lcm-ansible/v0.16.0-13-gcac49ca/lcm-ansible.tar.gz |
lcm-agent |
https://binary.mirantis.com/lcm/bin/lcm-agent/v0.3.0-239-gae7218ea/lcm-agent |
|
Helm charts Updated |
managed-lcm-api |
https://binary.mirantis.com/core/helm/managed-lcm-api-1.31.9.tgz |
metallb |
||
metrics-server |
https://binary.mirantis.com/core/helm/metrics-server-1.31.9.tgz |
|
Docker images |
helm |
mirantis.azurecr.io/lcm/helm/tiller:v2.16.11-40 |
helm-controller Updated |
mirantis.azurecr.io/lcm/lcm-controller:v0.3.0-239-gae7218ea |
|
metallb-controller |
mirantis.azurecr.io/lcm/metallb/controller:v0.9.3-1 |
|
metallb-speaker |
mirantis.azurecr.io/lcm/metallb/speaker:v0.9.3-1 |
|
metrics-server |
mirantis.azurecr.io/lcm/metrics-server-amd64:v0.5.2 |
Artifact |
Component |
Path |
|---|---|---|
Helm charts |
alerta |
https://binary.mirantis.com/stacklight/helm/alerta-0.1.0-mcp-25.tgz |
alertmanager-webhook-servicenow Updated |
https://binary.mirantis.com/stacklight/helm/alertmanager-webhook-servicenow-0.2.0-mcp-3.tgz |
|
cerebro |
https://binary.mirantis.com/stacklight/helm/cerebro-0.1.0-mcp-2.tgz |
|
elasticsearch Removed |
n/a |
|
elasticsearch-curator Updated |
https://binary.mirantis.com/stacklight/helm/elasticsearch-curator-1.5.0-mcp-9.tgz |
|
elasticsearch-exporter Updated |
https://binary.mirantis.com/stacklight/helm/elasticsearch-exporter-1.2.0-mcp-6.tgz |
|
fluentd Updated |
https://binary.mirantis.com/stacklight/helm/fluentd-2.0.3-mcp-37.tgz |
|
fluentd-elasticsearch Removed |
n/a |
|
fluentd-logs New |
https://binary.mirantis.com/stacklight/helm/fluentd-elasticsearch-3.0.0-mcp-128.tgz |
|
grafana Updated |
https://binary.mirantis.com/stacklight/helm/grafana-3.3.10-mcp-145.tgz |
|
iam-proxy |
||
kibana Removed |
n/a |
|
metric-collector Updated |
https://binary.mirantis.com/stacklight/helm/metric-collector-0.3.0-mcp-6.tgz |
|
metricbeat |
https://binary.mirantis.com/stacklight/helm/metricbeat-1.7.1-mcp-16.tgz |
|
opensearch New |
https://binary.mirantis.com/stacklight/helm/opensearch-0.1.0-mcp-50.tgz |
|
opensearch-dashboards New |
https://binary.mirantis.com/stacklight/helm/opensearch-dashboards-0.1.0-mcp-40.tgz |
|
patroni |
https://binary.mirantis.com/stacklight/helm/patroni-0.15.1-mcp-42.tgz |
|
prometheus Updated |
https://binary.mirantis.com/stacklight/helm/prometheus-8.11.4-mcp-225.tgz |
|
prometheus-blackbox-exporter |
https://binary.mirantis.com/stacklight/helm/prometheus-blackbox-exporter-0.3.0-mcp-11.tgz |
|
prometheus-es-exporter |
https://binary.mirantis.com/stacklight/helm/prometheus-es-exporter-1.0.0-mcp-11.tgz |
|
prometheus-msteams Updated |
https://binary.mirantis.com/stacklight/helm/prometheus-msteams-0.1.0-mcp-8.tgz |
|
prometheus-nginx-exporter |
https://binary.mirantis.com/stacklight/helm/prometheus-nginx-exporter-0.2.0-mcp-1.tgz |
|
sf-notifier Updated |
https://binary.mirantis.com/stacklight/helm/sf-notifier-0.2.0-mcp-2.tgz |
|
sf-reporter Updated |
https://binary.mirantis.com/stacklight/helm/sf-reporter-0.2.0-mcp-3.tgz |
|
stacklight Updated |
https://binary.mirantis.com/stacklight/helm/stacklight-0.6.1.tgz |
|
telegraf-ds |
https://binary.mirantis.com/stacklight/helm/telegraf-ds-1.1.5-mcp-29.tgz |
|
telegraf-s |
https://binary.mirantis.com/stacklight/helm/telegraf-s-1.1.5-mcp-30.tgz |
|
telemeter-server Updated |
https://binary.mirantis.com/stacklight/helm/telemeter-server-0.2.0-mcp-5.tgz |
|
telemeter-client Updated |
https://binary.mirantis.com/stacklight/helm/telemeter-client-0.2.0-mcp-5.tgz |
|
Docker images |
alerta |
mirantis.azurecr.io/stacklight/alerta-web:8.5.0-20211108051042 |
alertmanager |
mirantis.azurecr.io/stacklight/alertmanager:v0.23.0 |
|
alertmanager-webhook-servicenow Updated |
mirantis.azurecr.io/stacklight/alertmanager-webhook-servicenow:v0.1-20220420161450 |
|
busybox |
mirantis.azurecr.io/stacklight/busybox:1.30 |
|
cerebro |
mirantis.azurecr.io/stacklight/cerebro:0.9.3 |
|
configmap-reload |
mirantis.azurecr.io/stacklight/configmap-reload:v0.3.0 |
|
curl |
mirantis.azurecr.io/stacklight/curl:7.69.0 |
|
curl-jq |
mirantis.azurecr.io/stacklight/curl-jq:1.5-1 |
|
elasticsearch-curator |
mirantis.azurecr.io/stacklight/curator:5.7.6 |
|
elasticsearch-exporter |
mirantis.azurecr.io/stacklight/elasticsearch_exporter:1.0.2 |
|
fluentd |
mirantis.azurecr.io/stacklight/fluentd:1.14-20220111114545 |
|
grafana Updated |
mirantis.azurecr.io/stacklight/grafana:8.5.0 |
|
grafana-image-renderer |
mirantis.azurecr.io/stacklight/grafana-image-renderer:3.2.1 |
|
kubectl |
mirantis.azurecr.io/stacklight/kubectl:1.19.13 |
|
k8s-sidecar Updated |
mirantis.azurecr.io/stacklight/k8s-sidecar:1.15.9 |
|
kube-state-metrics |
mirantis.azurecr.io/stacklight/kube-state-metrics:v2.2.4 |
|
metric-collector |
mirantis.azurecr.io/stacklight/metric-collector:v0.1-20220209123106 |
|
metricbeat Updated |
mirantis.azurecr.io/stacklight/metricbeat:7.10.2-20220309185937 |
|
node-exporter |
mirantis.azurecr.io/stacklight/node-exporter:v1.2.2 |
|
opensearch Updated |
mirantis.azurecr.io/stacklight/opensearch:1-20220316161927 |
|
opensearch-dashboards Updated |
mirantis.azurecr.io/stacklight/opensearch-dashboards:1-20220316161951 |
|
origin-telemeter |
mirantis.azurecr.io/stacklight/origin-telemeter:4.4.0-20200424 |
|
pgbouncer |
mirantis.azurecr.io/stacklight/pgbouncer:1.12.0 |
|
prometheus |
mirantis.azurecr.io/stacklight/prometheus:v2.31.1 |
|
prometheus-blackbox-exporter |
mirantis.azurecr.io/stacklight/blackbox-exporter:v0.19.0 |
|
prometheus-es-exporter |
mirantis.azurecr.io/stacklight/prometheus-es-exporter:v0.14.0-20220111114356 |
|
prometheus-msteams |
mirantis.azurecr.io/stacklight/prometheus-msteams:v1.4.2 |
|
prometheus-nginx-exporter |
mirantis.azurecr.io/stacklight/nginx-prometheus-exporter:0.6.0 |
|
prometheus-patroni-exporter |
mirantis.azurecr.io/stacklight/prometheus-patroni-exporter:v0.1-20210708141736 |
|
prometheus-postgres-exporter |
mirantis.azurecr.io/stacklight/prometheus-postgres-exporter:v0.9.0 |
|
prometheus-relay |
mirantis.azurecr.io/stacklight/prometheus-relay:v0.3-20210317133316 |
|
sf-notifier |
mirantis.azurecr.io/stacklight/sf-notifier:v0.3-20210930112115 |
|
sf-reporter Updated |
mirantis.azurecr.io/stacklight/sf-reporter:v0.1-20220419092138 |
|
spilo Updated |
mirantis.azurecr.io/stacklight/spilo:13-2.1p1-20220225091552 |
|
telegraf |
mirantis.azurecr.io/stacklight/telegraf:v1.9.1-20210225152050 |
|
Updated |
mirantis.azurecr.io/stacklight/telegraf:1.20.2-20220204122426 |
|
telemeter-token-auth |
mirantis.azurecr.io/stacklight/telemeter-token-auth:v0.1-20200406175600 |
|
yq |
mirantis.azurecr.io/stacklight/yq:v4.2.0 |
Artifact |
Component |
Path |
|---|---|---|
Debian repositories |
System packages |
|
http://mirror.mirantis.com/kaas/kubernetes-extra-rhel7-0.0.5/ |
||
https://mirror.mirantis.com/kaas/ubuntu-2022-05-03-013543.target.txt |
||
MCR repositories |
MCR |
https://repos.mirantis.com/ubuntu/dists/bionic/pool/stable-20.10/ |
The Cluster release 8.6.0 is introduced in the Mirantis Container Cloud release 2.16.1. This Cluster release is based on the Cluster release 7.6.0.
The Cluster release 8.6.0 supports:
Mirantis OpenStack for Kubernetes (MOSK) 22.2. For details, see MOSK Release Notes.
Mirantis Kubernetes Engine (MKE) 3.4.7. For details, see MKE Release Notes.
Mirantis Container Runtime (MCR) 20.10.8. For details, see MCR Release Notes.
Kubernetes 1.20.
For the list of addressed and known issues, refer to the Container Cloud release 2.16.0 section.
This section outlines new features implemented in the Cluster release 8.6.0 that is introduced in the Container Cloud release 2.16.1.
Updated the Mirantis Kubernetes Engine (MKE) major version from 3.4.6 to 3.4.7 for the Container Cloud management, regional, and managed clusters. Also, added support for attachment of existing MKE 3.4.7 clusters.
Learn more
Added the KubePodsRegularLongTermRestarts alert that raises in case of a
long-term periodic restart of containers.
Implemented the capability to configure the Elasticsearch retention time per
index using the elasticsearch.retentionTime parameter in the StackLight
Helm chart. Now, you can configure different retention periods for different
indices: logs, events, and notifications.
The elasticsearch.logstashRetentionTime parameter is now deprecated.
Implemented the capability to configure Prometheus Blackbox Exporter, including
customModules and timeoutOffset, through the StackLight Helm chart.
Implemented the capability to define custom Prometheus scrape configurations.
Due to licensing changes for Elasticsearch, Mirantis Container Cloud has switched from using Elasticsearch to OpenSearch and Kibana has switched to OpenSearch Dashboards. OpenSearch is a fork of Elasticsearch under the open-source Apache License with development led by Amazon Web Services.
For new deployments with the logging stack enabled, OpenSearch is now deployed by default. For existing deployments, migration to OpenSearch is performed automatically during clusters update. However, the entire Elasticsearch cluster may go down for up to 15 minutes.
Learn more
The following table lists the components versions of the Cluster release 8.6.0.
Note
The components that are newly added, updated, deprecated, or removed
as compared to the previous release version, are marked
with a corresponding superscript,
for example, lcm-ansible Updated.
Component |
Application/Service |
Version |
|---|---|---|
Cluster orchestration |
Mirantis Kubernetes Engine Updated |
3.4.7 0 |
Container runtime |
Mirantis Container Runtime |
20.10.8 1 |
Distributed storage |
Ceph |
15.2.13 (Octopus) |
Rook |
1.7.6 |
|
LCM |
Helm |
2.16.11-40 |
helm-controller Updated |
0.3.0-187-gba894556 |
|
lcm-ansible Updated |
0.14.0-14-geb6a51f |
|
lcm-agent Updated |
0.3.0-187-gba894556 |
|
metallb-controller |
0.9.3-1 |
|
metrics-server Updated |
0.5.2 |
|
StackLight |
Alerta |
8.5.0-20211108051042 |
Alertmanager |
0.23.0 |
|
Alertmanager Webhook ServiceNow |
0.1-20210601141858 |
|
Cerebro |
0.9.3 |
|
Elasticsearch Removed |
n/a |
|
Elasticsearch curator |
5.7.6 |
|
Elasticsearch exporter |
1.0.2 |
|
Fluentd Updated |
1.14-20220111114545 |
|
Grafana |
8.2.7 |
|
Grafana Image Renderer |
3.2.1 |
|
IAM Proxy |
6.0.1 |
|
Kibana Removed |
n/a |
|
Metric Collector Updated |
0.1-20220209123106 |
|
Metricbeat Updated |
7.10.2-20220111114624 |
|
OpenSearch New |
1.2-20220114131142 |
|
OpenSearch Dashboards New |
1.2-20220114131222 |
|
Patroni Updated |
13-2.1p1-20220131130853 |
|
Prometheus |
2.31.1 |
|
Prometheus Blackbox Exporter Updated |
0.19.0 |
|
Prometheus ES Exporter Updated |
0.14.0-20220111114356 |
|
Prometheus MS Teams |
1.4.2 |
|
Prometheus Node Exporter |
1.2.2 |
|
Prometheus NGINX Exporter |
0.6.0 |
|
Prometheus Patroni Exporter |
0.1-20210708141736 |
|
Prometheus Postgres Exporter |
0.9.0 |
|
Prometheus Relay |
0.3-20210317133316 |
|
sf-notifier |
0.3-20210930112115 |
|
sf-reporter |
0.1-20210607111404 |
|
Telegraf |
1.9.1-20210225142050 |
|
1.20.0-20210927090119 |
||
Telemeter |
4.4.0-20200424 |
- 0
For the Mirantis Kubernetes Engine (MKE) release highlights and components versions, see MKE documentation: MKE release notes.
- 1
For the Mirantis Container Runtime (MCR) release highlights, see MCR documentation: MCR release notes.
This section lists the components artifacts of the Cluster release 8.6.0.
Note
The components that are newly added, updated, deprecated, or removed
as compared to the previous release version, are marked
with a corresponding superscript,
for example, lcm-ansible Updated.
Artifact |
Component |
Path |
|---|---|---|
Helm chart |
ceph-controller Updated |
https://binary.mirantis.com/ceph/helm/ceph-operator-1.0.0-mcp-661.tgz |
Docker images |
ceph |
mirantis.azurecr.io/ceph/ceph:v15.2.13 |
ceph-controller Updated |
mirantis.azurecr.io/ceph/mcp/ceph-controller:v1.0.0-20220303130346 |
|
cephcsi |
mirantis.azurecr.io/ceph/cephcsi/cephcsi:v3.4.0 |
|
csi-node-driver-registrar |
mirantis.azurecr.io/ceph/k8scsi/csi-node-driver-registrar:v2.1.0 |
|
csi-provisioner |
mirantis.azurecr.io/ceph/k8scsi/csi-provisioner:v2.1.2 |
|
csi-snapshotter |
mirantis.azurecr.io/ceph/k8scsi/csi-snapshotter:v4.0.0 |
|
csi-attacher |
mirantis.azurecr.io/ceph/k8scsi/csi-attacher:v3.1.0 |
|
csi-resizer |
mirantis.azurecr.io/ceph/k8scsi/csi-resizer:v1.1.0 |
|
rook |
mirantis.azurecr.io/ceph/rook/ceph:v1.7.6 |
Artifact |
Component |
Path |
|---|---|---|
Binaries Updated |
lcm-ansible |
https://binary.mirantis.com/lcm/bin/lcm-ansible/v0.14.0-14-geb6a51f/lcm-ansible.tar.gz |
lcm-agent |
https://binary.mirantis.com/lcm/bin/lcm-agent/v0.3.0-187-gba894556/lcm-agent |
|
Helm charts Updated |
managed-lcm-api |
https://binary.mirantis.com/core/helm/managed-lcm-api-1.29.6.tgz |
metallb |
||
metrics-server |
https://binary.mirantis.com/core/helm/metrics-server-1.29.6.tgz |
|
Docker images |
helm |
mirantis.azurecr.io/lcm/helm/tiller:v2.16.11-40 |
helm-controller Updated |
mirantis.azurecr.io/lcm/lcm-controller:v0.3.0-187-gba894556 |
|
metallb-controller |
mirantis.azurecr.io/lcm/metallb/controller:v0.9.3-1 |
|
metallb-speaker |
mirantis.azurecr.io/lcm/metallb/speaker:v0.9.3-1 |
|
metrics-server Updated |
mirantis.azurecr.io/lcm/metrics-server-amd64:v0.5.2 |
Artifact |
Component |
Path |
|---|---|---|
Helm charts |
alerta |
https://binary.mirantis.com/stacklight/helm/alerta-0.1.0-mcp-25.tgz |
alertmanager-webhook-servicenow |
https://binary.mirantis.com/stacklight/helm/alertmanager-webhook-servicenow-0.2.0-mcp-1.tgz |
|
cerebro |
https://binary.mirantis.com/stacklight/helm/cerebro-0.1.0-mcp-2.tgz |
|
elasticsearch Updated |
https://binary.mirantis.com/stacklight/helm/elasticsearch-7.1.1-mcp-44.tgz |
|
elasticsearch-curator |
https://binary.mirantis.com/stacklight/helm/elasticsearch-curator-1.5.0-mcp-6.tgz |
|
elasticsearch-exporter |
https://binary.mirantis.com/stacklight/helm/elasticsearch-exporter-1.2.0-mcp-2.tgz |
|
fluentd Updated |
https://binary.mirantis.com/stacklight/helm/fluentd-2.0.3-mcp-36.tgz |
|
fluentd-elasticsearch Updated |
https://binary.mirantis.com/stacklight/helm/fluentd-elasticsearch-3.0.0-mcp-120.tgz |
|
grafana Updated |
https://binary.mirantis.com/stacklight/helm/grafana-3.3.10-mcp-125.tgz |
|
iam-proxy Updated |
||
kibana Updated |
https://binary.mirantis.com/stacklight/helm/kibana-3.2.1-mcp-36.tgz |
|
metric-collector Updated |
https://binary.mirantis.com/stacklight/helm/metric-collector-0.3.0-mcp-4.tgz |
|
metricbeat Updated |
https://binary.mirantis.com/stacklight/helm/metricbeat-1.7.1-mcp-16.tgz |
|
patroni Updated |
https://binary.mirantis.com/stacklight/helm/patroni-0.15.1-mcp-38.tgz |
|
prometheus Updated |
https://binary.mirantis.com/stacklight/helm/prometheus-8.11.4-mcp-218.tgz |
|
prometheus-blackbox-exporter Updated |
https://binary.mirantis.com/stacklight/helm/prometheus-blackbox-exporter-0.3.0-mcp-11.tgz |
|
prometheus-es-exporter |
https://binary.mirantis.com/stacklight/helm/prometheus-es-exporter-1.0.0-mcp-11.tgz |
|
prometheus-msteams |
https://binary.mirantis.com/stacklight/helm/prometheus-msteams-0.1.0-mcp-2.tgz |
|
prometheus-nginx-exporter |
https://binary.mirantis.com/stacklight/helm/prometheus-nginx-exporter-0.2.0-mcp-1.tgz |
|
sf-notifier |
https://binary.mirantis.com/stacklight/helm/sf-notifier-0.2.0-mcp-1.tgz |
|
sf-reporter |
https://binary.mirantis.com/stacklight/helm/sf-reporter-0.2.0-mcp-1.tgz |
|
stacklight Updated |
https://binary.mirantis.com/stacklight/helm/stacklight-0.4.3.tgz |
|
telegraf-ds |
https://binary.mirantis.com/stacklight/helm/telegraf-ds-1.1.5-mcp-29.tgz |
|
telegraf-s |
https://binary.mirantis.com/stacklight/helm/telegraf-s-1.1.5-mcp-30.tgz |
|
telemeter-server Updated |
https://binary.mirantis.com/stacklight/helm/telemeter-server-0.2.0-mcp-4.tgz |
|
telemeter-client Updated |
https://binary.mirantis.com/stacklight/helm/telemeter-client-0.2.0-mcp-4.tgz |
|
Docker images |
alerta |
mirantis.azurecr.io/stacklight/alerta-web:8.5.0-20211108051042 |
alertmanager |
mirantis.azurecr.io/stacklight/alertmanager:v0.23.0 |
|
alertmanager-webhook-servicenow |
mirantis.azurecr.io/stacklight/alertmanager-webhook-servicenow:v0.1-20210601141858 |
|
busybox |
mirantis.azurecr.io/stacklight/busybox:1.30 |
|
cerebro |
mirantis.azurecr.io/stacklight/cerebro:0.9.3 |
|
configmap-reload |
mirantis.azurecr.io/stacklight/configmap-reload:v0.3.0 |
|
curl |
mirantis.azurecr.io/stacklight/curl:7.69.0 |
|
curl-jq |
mirantis.azurecr.io/stacklight/curl-jq:1.5-1 |
|
elasticsearch Removed |
n/a |
|
elasticsearch-curator |
mirantis.azurecr.io/stacklight/curator:5.7.6 |
|
elasticsearch-exporter |
mirantis.azurecr.io/stacklight/elasticsearch_exporter:1.0.2 |
|
fluentd Updated |
mirantis.azurecr.io/stacklight/fluentd:1.14-20220111114545 |
|
grafana |
mirantis.azurecr.io/stacklight/grafana:8.2.7 |
|
grafana-image-renderer |
mirantis.azurecr.io/stacklight/grafana-image-renderer:3.2.1 |
|
kubectl |
mirantis.azurecr.io/stacklight/kubectl:1.19.13 |
|
k8s-sidecar |
mirantis.azurecr.io/stacklight/k8s-sidecar:1.10.8 |
|
kibana Removed |
n/a |
|
kube-state-metrics |
mirantis.azurecr.io/stacklight/kube-state-metrics:v2.2.4 |
|
metric-collector Updated |
mirantis.azurecr.io/stacklight/metric-collector:v0.1-20220209123106 |
|
metricbeat Updated |
mirantis.azurecr.io/stacklight/metricbeat:7.10.2-20220111114624 |
|
node-exporter |
mirantis.azurecr.io/stacklight/node-exporter:v1.2.2 |
|
opensearch New |
mirantis.azurecr.io/stacklight/opensearch:1.2-20220114131142 |
|
opensearch-dashboards New |
mirantis.azurecr.io/stacklight/opensearch-dashboards:1.2-20220114131222 |
|
origin-telemeter |
mirantis.azurecr.io/stacklight/origin-telemeter:4.4.0-20200424 |
|
prometheus |
mirantis.azurecr.io/stacklight/prometheus:v2.31.1 |
|
prometheus-blackbox-exporter Updated |
mirantis.azurecr.io/stacklight/blackbox-exporter:v0.19.0 |
|
prometheus-es-exporter Updated |
mirantis.azurecr.io/stacklight/prometheus-es-exporter:v0.14.0-20220111114356 |
|
prometheus-msteams |
mirantis.azurecr.io/stacklight/prometheus-msteams:v1.4.2 |
|
prometheus-nginx-exporter |
mirantis.azurecr.io/stacklight/nginx-prometheus-exporter:0.6.0 |
|
prometheus-patroni-exporter |
mirantis.azurecr.io/stacklight/prometheus-patroni-exporter:v0.1-20210708141736 |
|
prometheus-postgres-exporter |
mirantis.azurecr.io/stacklight/prometheus-postgres-exporter:v0.9.0 |
|
prometheus-relay |
mirantis.azurecr.io/stacklight/prometheus-relay:v0.3-20210317133316 |
|
sf-notifier |
mirantis.azurecr.io/stacklight/sf-notifier:v0.3-20210930112115 |
|
sf-reporter |
mirantis.azurecr.io/stacklight/sf-reporter:v0.1-20210607111404 |
|
spilo Updated |
mirantis.azurecr.io/stacklight/spilo:13-2.1p1-20220131130853 |
|
telegraf |
mirantis.azurecr.io/stacklight/telegraf:v1.9.1-20210225152050 |
|
mirantis.azurecr.io/stacklight/telegraf:1.20.0-20210927090119 |
||
telemeter-token-auth |
mirantis.azurecr.io/stacklight/telemeter-token-auth:v0.1-20200406175600 |
|
yq |
mirantis.azurecr.io/stacklight/yq:v4.2.0 |
Artifact |
Component |
Path |
|---|---|---|
Debian repositories |
System packages |
|
http://mirror.mirantis.com/kaas/kubernetes-extra-rhel7-0.0.5/ |
||
https://mirror.mirantis.com/kaas/ubuntu-2021-11-11-014639.target.txt |
||
MCR repositories |
MCR |
https://repos.mirantis.com/ubuntu/dists/bionic/pool/stable-20.10/ |
The Cluster release 8.5.0 is introduced in the Mirantis Container Cloud release 2.15.1. This Cluster release is based on the Cluster release 7.5.0.
The Cluster release 8.5.0 supports:
Mirantis OpenStack for Kubernetes (MOSK) 22.1. For details, see MOSK Release Notes.
Mirantis Kubernetes Engine (MKE) 3.4.6. For details, see MKE Release Notes.
Mirantis Container Runtime (MCR) 20.10.8. For details, see MCR Release Notes.
Kubernetes 1.20.
For the list of addressed and known issues, refer to the Container Cloud release 2.15.0 section.
This section outlines new features implemented in the Cluster release 8.5.0 that is introduced in the Container Cloud release 2.15.1.
Available since 2.16.0 TechPreview
Implemented the initial Technology Preview support for MOSK (MOSK) deployment on local software-based Redundant Array of Independent Disks (RAID) devices to withstand failure of one device at a time. The feature becomes available once your Container Cloud cluster is automatically upgraded to 2.16.0.
Using a custom bare metal host profile, you can configure and create
an mdadm-based software RAID device of type raid10 if you have
an even number of devices available on your servers. At least four
storage devices are required for such RAID device.
Introduced support for the Mirantis Kubernetes Engine version 3.4.6 with Kubernetes 1.20 for the Container Cloud management, regional, and managed clusters. Also, added support for attachment of existing MKE 3.4.6 clusters.
Learn more
Updated the Mirantis Container Runtime (MCR) version from 20.10.6 to 20.10.8 for the Container Cloud management, regional, and managed clusters on all supported cloud providers.
Learn more
Limited the number of monitored network interfaces to prevent extended Prometheus RAM consumption in big clusters. By default, Prometheus Node Exporter now only collects information of a basic set of interfaces, both host and container. If required you can edit the list of excluded devices as needed.
Implemented the capability to define custom Prometheus recording rules through
the prometheusServer.customRecordingRules parameter in the StackLight Helm
chart. Overriding of existing recording rules is not supported.
Learn more
Implemented the capability to configure packet size for the syslog logging
output. If remote logging to syslog is enabled in StackLight, use the
logging.syslog.packetSize parameter in the StackLight Helm chart to
configure the packet size.
Implemented the capability to configure the Prometheus Relay client timeout and
response size limit through the prometheusRelay.clientTimeout and
prometheusRelay.responseLimitBytes parameters in the StackLight Helm chart.
Learn more
Implemented the MCCLicenseExpirationCritical and
MCCLicenseExpirationMajor alerts that notify about Mirantis Container Cloud
license expiration in less than 10 and 30 days.
Learn more
Implemented the following improvements to StackLight alerting:
Enhanced Kubernetes applications alerting:
Reworked the Kubernetes applications alerts to minimize flapping, avoid firing during pod rescheduling, and to detect crash looping for pods that restart less frequently.
Added the
KubeDeploymentOutage,KubeStatefulSetOutage, andKubeDaemonSetOutagealerts.Removed the redundant
KubeJobCompletionalert.Enhanced the alert inhibition rules to reduce alert flooding.
Improved alert descriptions.
Split
TelemeterClientFederationFailedintoTelemeterClientFailedandTelemeterClientHAFailedto separate alerts depending on the HA mode disabled or enabled.Updated the description for
DockerSwarmNodeFlapping.
Learn more
Disabled unused Node Exporter collectors and implemented the capability to
manually enable needed collectors using the
nodeExporter.extraCollectorsEnabled parameter. Only the following
collectors are now enabled by default in StackLight:
|
|
|
|
Learn more
To improve debugging and log reading, separated Ceph Controller, Ceph Status Controller, and Ceph Request Controller, which used to run in one pod, into three different deployments.
Learn more
Implemented additional validation of networks specified in
spec.cephClusterSpec.network.publicNet and
spec.cephClusterSpec.network.clusterNet and prohibited the use of the
0.0.0.0/0 CIDR. Now, the bare metal provider automatically translates
the 0.0.0.0/0 network range to the default LCM IPAM subnet if it exists.
You can now also add corresponding labels for the bare metal IPAM subnets when configuring the Ceph cluster during the management cluster deployment.
Learn more
Implemented full support for automated Ceph LCM operations using the
KaaSCephOperationRequest CR, such as addition or removal of Ceph OSDs and
nodes, as well as replacement of failed Ceph OSDs or nodes.
Learn more
Implemented the capability to specify Container Storage Interface (CSI)
provisioner tolerations and node affinity for different Rook resources.
Added support for the all and mds keys in toleration rules.
Extended the fullClusterInfo section of the KaaSCephCluster.status
resource with the following fields:
cephDetails- contains verbose details of a Ceph cluster statecephCSIPluginDaemonsStatus- contains details on all Ceph CSIs
Learn more
The following table lists the components versions of the Cluster release 8.5.0.
Note
The components that are newly added, updated, deprecated, or removed
as compared to the previous release version, are marked
with a corresponding superscript,
for example, lcm-ansible Updated.
Component |
Application/Service |
Version |
|---|---|---|
Cluster orchestration |
Mirantis Kubernetes Engine Updated |
3.4.6 0 |
Container runtime |
Mirantis Container Runtime Updated |
20.10.8 1 |
Distributed storage |
Ceph |
15.2.13 (Octopus) |
Rook Updated |
1.7.6 |
|
LCM |
Helm |
2.16.11-40 |
helm-controller Updated |
0.3.0-132-g83a348fa |
|
lcm-ansible Updated |
0.13.0-27-gcb6022b |
|
lcm-agent Updated |
0.3.0-132-g83a348fa |
|
metallb-controller |
0.9.3-1 |
|
metrics-server |
0.3.6-1 |
|
StackLight |
Alerta Updated |
8.5.0-20211108051042 |
Alertmanager Updated |
0.23.0 |
|
Alertmanager Webhook ServiceNow |
0.1-20210601141858 |
|
Cerebro |
0.9.3 |
|
Elasticsearch Updated |
7.10.2-2021110210112 |
|
Elasticsearch Curator |
5.7.6 |
|
Elasticsearch Exporter |
1.0.2 |
|
Fluentd |
1.10.2-20210915110132 |
|
Grafana Updated |
8.2.7 |
|
Grafana Image Renderer Updated |
3.2.1 |
|
IAM Proxy |
6.0.1 |
|
Kibana Updated |
7.10.2-20211101074638 |
|
Metric Collector Updated |
0.1-20211109121134 |
|
Metricbeat Updated |
7.10.2-20211103140113 |
|
Patroni |
13-2.0p6-20210525081943 |
|
Prometheus Updated |
2.31.1 |
|
Prometheus Blackbox Exporter |
0.14.0 |
|
Prometheus ES Exporter |
0.14.0-20210812120726 |
|
Prometheus MS Teams |
1.4.2 |
|
Prometheus Node Exporter Updated |
1.2.2 |
|
Prometheus NGINX Exporter |
0.6.0 |
|
Prometheus Patroni Exporter |
0.1-20210708141736 |
|
Prometheus Postgres Exporter |
0.9.0 |
|
Prometheus Relay |
0.3-20210317133316 |
|
sf-notifier |
0.3-20210930112115 |
|
sf-reporter |
0.1-20210607111404 |
|
Telegraf |
1.9.1-20210225142050 |
|
1.20.0-20210927090119 |
||
Telemeter |
4.4.0-20200424 |
- 0
For the Mirantis Kubernetes Engine (MKE) release highlights and components versions, see MKE documentation: MKE release notes.
- 1
For the Mirantis Container Runtime (MCR) release highlights, see MCR documentation: MCR release notes.
This section lists the components artifacts of the Cluster release 8.5.0.
Note
The components that are newly added, updated, deprecated, or removed
as compared to the previous release version, are marked
with a corresponding superscript,
for example, lcm-ansible Updated.
Artifact |
Component |
Path |
|---|---|---|
Helm chart |
ceph-controller Updated |
https://binary.mirantis.com/ceph/helm/ceph-operator-1.0.0-mcp-606.tgz |
Docker images |
ceph |
mirantis.azurecr.io/ceph/ceph:v15.2.13 |
ceph-controller Updated |
mirantis.azurecr.io/ceph/mcp/ceph-controller:v1.0.0-20220204145523 |
|
cephcsi Updated |
mirantis.azurecr.io/ceph/cephcsi/cephcsi:v3.4.0 |
|
csi-node-driver-registrar |
mirantis.azurecr.io/ceph/k8scsi/csi-node-driver-registrar:v2.1.0 |
|
csi-provisioner |
mirantis.azurecr.io/ceph/k8scsi/csi-provisioner:v2.1.2 |
|
csi-snapshotter |
mirantis.azurecr.io/ceph/k8scsi/csi-snapshotter:v4.0.0 |
|
csi-attacher |
mirantis.azurecr.io/ceph/k8scsi/csi-attacher:v3.1.0 |
|
csi-resizer |
mirantis.azurecr.io/ceph/k8scsi/csi-resizer:v1.1.0 |
|
rook Updated |
mirantis.azurecr.io/ceph/rook/ceph:v1.7.6 |
Artifact |
Component |
Path |
|---|---|---|
Binaries Updated |
lcm-ansible |
https://binary.mirantis.com/lcm/bin/lcm-ansible/v0.13.0-27-gcb6022b/lcm-ansible.tar.gz |
lcm-agent Updated |
https://binary.mirantis.com/lcm/bin/lcm-agent/v0.3.0-132-g83a348fa/lcm-agent |
|
Helm charts Updated |
managed-lcm-api |
https://binary.mirantis.com/core/helm/managed-lcm-api-1.28.7.tgz |
metallb |
||
metrics-server |
https://binary.mirantis.com/core/helm/metrics-server-1.28.7.tgz |
|
Docker images |
helm |
mirantis.azurecr.io/lcm/helm/tiller:v2.16.11-40 |
helm-controller Updated |
mirantis.azurecr.io/lcm/lcm-controller:v0.3.0-132-g83a348fa |
|
metallb-controller |
mirantis.azurecr.io/lcm/metallb/controller:v0.9.3-1 |
|
metallb-speaker |
mirantis.azurecr.io/lcm/metallb/speaker:v0.9.3-1 |
|
metrics-server |
mirantis.azurecr.io/lcm/metrics-server-amd64/v0.3.6-1 |
Artifact |
Component |
Path |
|---|---|---|
Helm charts |
alerta Updated |
https://binary.mirantis.com/stacklight/helm/alerta-0.1.0-mcp-25.tgz |
alertmanager-webhook-servicenow Updated |
https://binary.mirantis.com/stacklight/helm/alertmanager-webhook-servicenow-0.2.0-mcp-1.tgz |
|
cerebro |
https://binary.mirantis.com/stacklight/helm/cerebro-0.1.0-mcp-2.tgz |
|
elasticsearch |
https://binary.mirantis.com/stacklight/helm/elasticsearch-7.1.1-mcp-37.tgz |
|
elasticsearch-curator |
https://binary.mirantis.com/stacklight/helm/elasticsearch-curator-1.5.0-mcp-6.tgz |
|
elasticsearch-exporter |
https://binary.mirantis.com/stacklight/helm/elasticsearch-exporter-1.2.0-mcp-2.tgz |
|
fluentd |
https://binary.mirantis.com/stacklight/helm/fluentd-2.0.3-mcp-32.tgz |
|
fluentd-elasticsearch Updated |
https://binary.mirantis.com/stacklight/helm/fluentd-elasticsearch-3.0.0-mcp-115.tgz |
|
grafana Updated |
https://binary.mirantis.com/stacklight/helm/grafana-3.3.10-mcp-121.tgz |
|
iam-proxy Updated |
||
kibana |
https://binary.mirantis.com/stacklight/helm/kibana-3.2.1-mcp-30.tgz |
|
metric-collector Updated |
https://binary.mirantis.com/stacklight/helm/metric-collector-0.3.0-mcp-3.tgz |
|
metricbeat |
https://binary.mirantis.com/stacklight/helm/metricbeat-1.7.1-mcp-12.tgz |
|
patroni Updated |
https://binary.mirantis.com/stacklight/helm/patroni-0.15.1-mcp-36.tgz |
|
prometheus Updated |
https://binary.mirantis.com/stacklight/helm/prometheus-8.11.4-mcp-214.tgz |
|
prometheus-blackbox-exporter |
https://binary.mirantis.com/stacklight/helm/prometheus-blackbox-exporter-0.3.0-mcp-7.tgz |
|
prometheus-es-exporter |
https://binary.mirantis.com/stacklight/helm/prometheus-es-exporter-1.0.0-mcp-11.tgz |
|
prometheus-msteams |
https://binary.mirantis.com/stacklight/helm/prometheus-msteams-0.1.0-mcp-2.tgz |
|
prometheus-nginx-exporter Updated |
https://binary.mirantis.com/stacklight/helm/prometheus-nginx-exporter-0.2.0-mcp-1.tgz |
|
sf-notifier Updated |
https://binary.mirantis.com/stacklight/helm/sf-notifier-0.2.0-mcp-1.tgz |
|
sf-reporter Updated |
https://binary.mirantis.com/stacklight/helm/sf-reporter-0.2.0-mcp-1.tgz |
|
stacklight Updated |
https://binary.mirantis.com/stacklight/helm/stacklight-0.3.1.tgz |
|
telegraf-ds |
https://binary.mirantis.com/stacklight/helm/telegraf-ds-1.1.5-mcp-29.tgz |
|
telegraf-s |
https://binary.mirantis.com/stacklight/helm/telegraf-s-1.1.5-mcp-30.tgz |
|
telemeter-server Updated |
https://binary.mirantis.com/stacklight/helm/telemeter-server-0.2.0-mcp-1.tgz |
|
telemeter-client Updated |
https://binary.mirantis.com/stacklight/helm/telemeter-client-0.2.0-mcp-1.tgz |
|
Docker images |
alerta Updated |
mirantis.azurecr.io/stacklight/alerta-web:8.5.0-20211108051042 |
alertmanager Updated |
mirantis.azurecr.io/stacklight/alertmanager:v0.23.0 |
|
alertmanager-webhook-servicenow |
mirantis.azurecr.io/stacklight/alertmanager-webhook-servicenow:v0.1-20210601141858 |
|
busybox |
mirantis.azurecr.io/stacklight/busybox:1.30 |
|
cerebro |
mirantis.azurecr.io/stacklight/cerebro:0.9.3 |
|
configmap-reload |
mirantis.azurecr.io/stacklight/configmap-reload:v0.3.0 |
|
curl |
mirantis.azurecr.io/stacklight/curl:7.69.0 |
|
curl-jq |
mirantis.azurecr.io/stacklight/curl-jq:1.5-1 |
|
elasticsearch Updated |
mirantis.azurecr.io/stacklight/elasticsearch:7.10.2-20211102101126 |
|
elasticsearch-curator |
mirantis.azurecr.io/stacklight/curator:5.7.6 |
|
elasticsearch-exporter |
mirantis.azurecr.io/stacklight/elasticsearch_exporter:1.0.2 |
|
fluentd |
mirantis.azurecr.io/stacklight/fluentd:1.10.2-20210915110132 |
|
grafana Updated |
mirantis.azurecr.io/stacklight/grafana:8.2.7 |
|
grafana-image-renderer Updated |
mirantis.azurecr.io/stacklight/grafana-image-renderer:3.2.1 |
|
kubectl |
mirantis.azurecr.io/stacklight/kubectl:1.19.13 |
|
k8s-sidecar |
mirantis.azurecr.io/stacklight/k8s-sidecar:1.10.8 |
|
kibana Updated |
mirantis.azurecr.io/stacklight/kibana:7.10.2-20211101074638 |
|
kube-state-metrics Updated |
mirantis.azurecr.io/stacklight/kube-state-metrics:v2.2.4 |
|
metric-collector Updated |
mirantis.azurecr.io/stacklight/metric-collector:v0.1-20211109121134 |
|
metricbeat Updated |
mirantis.azurecr.io/stacklight/metricbeat:7.10.2-20211103140113 |
|
node-exporter Updated |
mirantis.azurecr.io/stacklight/node-exporter:v1.2.2 |
|
origin-telemeter |
mirantis.azurecr.io/stacklight/origin-telemeter:4.4.0-20200424 |
|
prometheus Updated |
mirantis.azurecr.io/stacklight/prometheus:v2.31.1 |
|
prometheus-blackbox-exporter |
mirantis.azurecr.io/stacklight/blackbox-exporter:v0.14.0 |
|
prometheus-es-exporter |
mirantis.azurecr.io/stacklight/prometheus-es-exporter:v0.14.0-20210812120726 |
|
prometheus-msteams |
mirantis.azurecr.io/stacklight/prometheus-msteams:v1.4.2 |
|
prometheus-nginx-exporter |
mirantis.azurecr.io/stacklight/nginx-prometheus-exporter:0.6.0 |
|
prometheus-patroni-exporter |
mirantis.azurecr.io/stacklight/prometheus-patroni-exporter:v0.1-20210708141736 |
|
prometheus-postgres-exporter |
mirantis.azurecr.io/stacklight/prometheus-postgres-exporter:v0.9.0 |
|
prometheus-relay |
mirantis.azurecr.io/stacklight/prometheus-relay:v0.3-20210317133316 |
|
sf-notifier |
mirantis.azurecr.io/stacklight/sf-notifier:v0.3-20210930112115 |
|
sf-reporter |
mirantis.azurecr.io/stacklight/sf-reporter:v0.1-20210607111404 |
|
spilo |
mirantis.azurecr.io/stacklight/spilo:13-2.0p6-20210525081943 |
|
telegraf |
mirantis.azurecr.io/stacklight/telegraf:v1.9.1-20210225152050 |
|
mirantis.azurecr.io/stacklight/telegraf:1.20.0-20210927090119 |
||
telemeter-token-auth |
mirantis.azurecr.io/stacklight/telemeter-token-auth:v0.1-20200406175600 |
|
yq |
mirantis.azurecr.io/stacklight/yq:v4.2.0 |
Artifact |
Component |
Path |
|---|---|---|
Debian repositories |
System packages |
|
http://mirror.mirantis.com/kaas/kubernetes-extra-rhel7-0.0.5/ |
||
https://mirror.mirantis.com/kaas/ubuntu-2021-11-11-014639/ Updated |
||
https://mirror.mirantis.com/kaas/ubuntu-2021-11-11-014639.target.txt Updated |
||
MCR repositories |
MCR |
https://repos.mirantis.com/ubuntu/dists/bionic/pool/stable-20.10/ Updated |
This section outlines release notes for the unsupported Cluster releases of the 7.x series.
This section outlines release notes for the Cluster release 7.11.0 that is introduced in the Mirantis Container Cloud release 2.21.0 and is the last release in the 7.x series.
This Cluster release supports Mirantis Kubernetes Engine 3.4.11 with Kubernetes 1.20 and Mirantis Container Runtime 20.10.13.
For the list of known and resolved issues, refer to the Container Cloud release 2.21.0 section.
This section outlines new features implemented in the Cluster release 7.11.0 that is introduced in the Container Cloud release 2.21.0.
Updated the Mirantis Kubernetes Engine (MKE) version from 3.4.10 to 3.4.11 and the Mirantis Container Runtime (MCR) version from 20.10.12 to 20.10.13 for the Container Cloud management, regional, and managed clusters on all supported cloud providers, as well as for non Container Cloud based MKE cluster attachment.
Updated the MetalLB version from 0.12.1 to 0.13.4 for the Container Cloud management, regional, and managed clusters of all cloud providers that use MetalLB: bare metal, Equinix Metal with public and private networking, vSphere.
The MetalLB configuration is now stored in dedicated MetalLB objects
instead of the ConfigMap object.
Improved etcd monitoring by implementing the Etcd dashboard and
etcdDbSizeCritical and etcdDbSizeMajor alerts that inform about the
size of the etcd database.
Learn more
Implemented Reference Application that is a small microservice application that enables workload monitoring on non-MOSK managed clusters. It mimics a classical microservice application and provides metrics that describe the likely behavior of user workloads.
Reference Application contains a set of alerts and a separate Grafana dashboard to provide check statuses of Reference Application and statistics such as response time and content length.
The feature is disabled by default and can be enabled using the StackLight configuration manifest.
Added the miraCephSecretsInfo specification to KaaSCephCluster.status.
This specification contains current state and details of secrets that are used
in the Ceph cluster, such as keyrings, Ceph clients, RADOS Gateway user
credentials, and so on.
Using miraCephSecretsInfo, you can create, access, and remove Ceph RADOS
Block Device (RBD) or Ceph File System (CephFS) clients and RADOS Gateway
(RGW) users.
Implemented the ability to create and configure Amazon S3 bucket policies between Ceph Object Storage users.
The following table lists the components versions of the Cluster release 7.11.0.
Note
The components that are newly added, updated, deprecated, or removed
as compared to the previous release version, are marked
with a corresponding superscript,
for example, lcm-ansible Updated.
Component |
Application/Service |
Version |
|---|---|---|
Cluster orchestration Updated 0 |
Mirantis Kubernetes Engine |
3.4.11 1 |
Container runtime Updated 0 |
Mirantis Container Runtime |
20.10.13 2 |
Distributed storage Updated |
Ceph |
15.2.17 (Octopus) |
Rook |
1.0.0-20220809220209 |
|
LCM |
Helm |
2.16.11-40 |
helm-controller Updated |
0.3.0-327-gbc30b11b |
|
lcm-ansible Updated |
0.19.0-12-g6cad672 |
|
lcm-agent Updated |
0.3.0-327-gbc30b11b |
|
metallb-controller Updated |
0.13.4 3 |
|
metrics-server |
0.5.2 |
|
StackLight |
Alerta Updated |
8.5.0-20220923121625 |
Alertmanager |
0.23.0 |
|
Alertmanager Webhook ServiceNow |
0.1-20220706035316 |
|
Cerebro Updated |
0.9-20220923122026 |
|
Elasticsearch Curator |
5.7.6 |
|
Elasticsearch Exporter |
1.0.2 |
|
Fluentd Updated |
1.14-20220922214003 |
|
Grafana |
9.0.2 |
|
Grafana Image Renderer Updated |
3.5.0 |
|
IAM Proxy |
6.0.1 |
|
Metric Collector |
0.1-20220711134630 |
|
Metricbeat Updated |
7.10.2-20220909091002 |
|
OpenSearch |
1-20220517112057 |
|
OpenSearch Dashboards |
1-20220517112107 |
|
Prometheus |
2.35.0 |
|
Prometheus Blackbox Exporter |
0.19.0 |
|
Prometheus ES Exporter |
0.14.0-20220517111946 |
|
Prometheus MS Teams |
1.4.2 |
|
Prometheus Node Exporter |
1.2.2 |
|
Prometheus NGINX Exporter |
0.6.0 |
|
Prometheus Patroni Exporter |
0.1-20220624102731 |
|
Prometheus Postgres Exporter |
0.9.0 |
|
Prometheus Relay |
0.3-20210317133316 |
|
Reference Application New |
0.0.1 |
|
sf-notifier |
0.3-20220706035002 |
|
sf-reporter Updated |
0.1-20220916113234 |
|
Spilo Updated |
13-2.1p1-20220921105803 |
|
Telegraf |
1.9.1-20220714080809 |
|
1.23.4-20220915114529 Updated |
||
Telemeter |
4.4.0-20200424 |
- 0(1,2)
For MOSK-based deployments, MKE will be updated from 3.4.10 to 3.4.11 and MCR will be updated from 20.10.12 to 20.10.13 in one of the following Container Cloud releases.
- 1
For the Mirantis Kubernetes Engine (MKE) release highlights and components versions, see MKE documentation: MKE release notes.
- 2
For the Mirantis Container Runtime (MCR) release highlights, see MCR documentation: MCR release notes.
- 3
For MOSK-based deployments, the
metallb-controllerversion is updated from 0.12.1 to 0.13.4 in MOSK 22.5.
This section lists the components artifacts of the Cluster release 7.11.0.
Note
The components that are newly added, updated, deprecated, or removed
as compared to the previous release version, are marked
with a corresponding superscript,
for example, lcm-ansible Updated.
Artifact |
Component |
Path |
|---|---|---|
Helm chart |
ceph-controller Updated |
https://binary.mirantis.com/ceph/helm/ceph-operator-1.0.0-mcp-964.tgz |
Docker images |
ceph Updated |
mirantis.azurecr.io/ceph/ceph:v15.2.17 |
ceph-controller Updated |
mirantis.azurecr.io/ceph/mcp/ceph-controller:v1.0.0-20221024145202 |
|
cephcsi |
mirantis.azurecr.io/ceph/cephcsi/cephcsi:v3.4.0 |
|
csi-node-driver-registrar |
mirantis.azurecr.io/ceph/k8scsi/csi-node-driver-registrar:v2.1.0 |
|
csi-provisioner |
mirantis.azurecr.io/ceph/k8scsi/csi-provisioner:v2.1.2 |
|
csi-snapshotter |
mirantis.azurecr.io/ceph/k8scsi/csi-snapshotter:v4.0.0 |
|
csi-attacher |
mirantis.azurecr.io/ceph/k8scsi/csi-attacher:v3.1.0 |
|
csi-resizer |
mirantis.azurecr.io/ceph/k8scsi/csi-resizer:v1.1.0 |
|
rook Updated |
mirantis.azurecr.io/ceph/rook:v1.0.0-20220809220209 |
Artifact |
Component |
Path |
|---|---|---|
Binaries Updated |
lcm-ansible |
https://binary.mirantis.com/lcm/bin/lcm-ansible/v0.19.0-12-g6cad672/lcm-ansible.tar.gz |
lcm-agent |
https://binary.mirantis.com/lcm/bin/lcm-agent/v0.3.0-327-gbc30b11b/lcm-agent |
|
Helm charts Updated |
managed-lcm-api |
https://binary.mirantis.com/core/helm/managed-lcm-api-1.34.16.tgz |
metallb 0 |
||
metrics-server |
https://binary.mirantis.com/core/helm/metrics-server-1.34.16.tgz |
|
Docker images |
helm-controller Updated |
mirantis.azurecr.io/lcm/lcm-controller:v0.3.0-327-gbc30b11b |
metallb-controller Updated 0 |
mirantis.azurecr.io/bm/external/metallb/controller:v0.13.4 |
|
metallb-speaker Updated 0 |
mirantis.azurecr.io/bm/external/metallb/speaker:v0.13.4 |
|
metrics-server |
mirantis.azurecr.io/core/external/metrics-server:v0.5.2 |
- 0(1,2,3)
For MOSK-based deployments, the
metallbversion is updated from 0.12.1 to 0.13.4 in MOSK 22.5.
Artifact |
Component |
Path |
|---|---|---|
Helm charts |
alerta |
https://binary.mirantis.com/stacklight/helm/alerta-0.1.0-mcp-25.tgz |
alertmanager-webhook-servicenow Updated |
https://binary.mirantis.com/stacklight/helm/alertmanager-webhook-servicenow-0.2.0-mcp-4.tgz |
|
cerebro |
https://binary.mirantis.com/stacklight/helm/cerebro-0.1.0-mcp-2.tgz |
|
elasticsearch-curator Updated |
https://binary.mirantis.com/stacklight/helm/elasticsearch-curator-1.5.0-mcp-10.tgz |
|
elasticsearch-exporter |
https://binary.mirantis.com/stacklight/helm/elasticsearch-exporter-1.2.0-mcp-6.tgz |
|
fluentd |
https://binary.mirantis.com/stacklight/helm/fluentd-2.0.3-mcp-37.tgz |
|
fluentd-logs Updated |
https://binary.mirantis.com/stacklight/helm/fluentd-logs-0.1.0-mcp-142.tgz |
|
grafana Updated |
https://binary.mirantis.com/stacklight/helm/grafana-3.3.10-mcp-173.tgz |
|
iam-proxy |
||
metric-collector Updated |
https://binary.mirantis.com/stacklight/helm/metric-collector-0.3.0-mcp-10.tgz |
|
metricbeat |
https://binary.mirantis.com/stacklight/helm/metricbeat-1.7.1-mcp-16.tgz |
|
opensearch |
https://binary.mirantis.com/stacklight/helm/opensearch-0.1.0-mcp-52.tgz |
|
opensearch-dashboards |
https://binary.mirantis.com/stacklight/helm/opensearch-dashboards-0.1.0-mcp-40.tgz |
|
patroni |
https://binary.mirantis.com/stacklight/helm/patroni-0.15.1-mcp-42.tgz |
|
prometheus Updated |
https://binary.mirantis.com/stacklight/helm/prometheus-8.11.4-mcp-229.tgz |
|
prometheus-blackbox-exporter |
https://binary.mirantis.com/stacklight/helm/prometheus-blackbox-exporter-0.3.0-mcp-11.tgz |
|
prometheus-es-exporter |
https://binary.mirantis.com/stacklight/helm/prometheus-es-exporter-1.0.0-mcp-11.tgz |
|
prometheus-msteams Updated |
https://binary.mirantis.com/stacklight/helm/prometheus-msteams-0.1.0-mcp-9.tgz |
|
prometheus-nginx-exporter |
https://binary.mirantis.com/stacklight/helm/prometheus-nginx-exporter-0.2.0-mcp-1.tgz |
|
refapp New |
https://binary.mirantis.com/scale/helm/refapp-0.1.1-mcp-1.tgz |
|
sf-notifier Updated |
https://binary.mirantis.com/stacklight/helm/sf-notifier-0.2.0-mcp-4.tgz |
|
sf-reporter Updated |
https://binary.mirantis.com/stacklight/helm/sf-reporter-0.2.0-mcp-5.tgz |
|
stacklight Updated |
https://binary.mirantis.com/stacklight/helm/stacklight-0.9.2.tgz |
|
telegraf-ds |
https://binary.mirantis.com/stacklight/helm/telegraf-ds-1.1.5-mcp-29.tgz |
|
telegraf-s |
https://binary.mirantis.com/stacklight/helm/telegraf-s-1.1.5-mcp-30.tgz |
|
telemeter-client Updated |
https://binary.mirantis.com/stacklight/helm/telemeter-client-0.2.0-mcp-7.tgz |
|
telemeter-server Updated |
https://binary.mirantis.com/stacklight/helm/telemeter-server-0.2.0-mcp-7.tgz |
|
Docker images |
alerta-web Updated |
mirantis.azurecr.io/stacklight/alerta-web:8.5.0-20220923121625 |
alertmanager |
mirantis.azurecr.io/stacklight/alertmanager:v0.23.0 |
|
alertmanager-webhook-servicenow |
mirantis.azurecr.io/stacklight/alertmanager-webhook-servicenow:v0.1-20220706035316 |
|
blackbox-exporter |
mirantis.azurecr.io/stacklight/blackbox-exporter:v0.19.0 |
|
busybox |
mirantis.azurecr.io/stacklight/busybox:1.30 |
|
cerebro Updated |
mirantis.azurecr.io/stacklight/cerebro:v0.9-20220923122026 |
|
configmap-reload |
mirantis.azurecr.io/stacklight/configmap-reload:v0.3.0 |
|
curator |
mirantis.azurecr.io/stacklight/curator:5.7.6 |
|
curl |
mirantis.azurecr.io/stacklight/curl:7.69.0 |
|
curl-jq |
mirantis.azurecr.io/stacklight/curl-jq:1.5-1 |
|
elasticsearch_exporter |
mirantis.azurecr.io/stacklight/elasticsearch_exporter:1.0.2 |
|
fluentd Updated |
mirantis.azurecr.io/stacklight/fluentd:1.14-20220922214003 |
|
grafana |
mirantis.azurecr.io/stacklight/grafana:9.0.2 |
|
grafana-image-renderer Updated |
mirantis.azurecr.io/stacklight/grafana-image-renderer:3.5.0 |
|
k8s-sidecar |
mirantis.azurecr.io/stacklight/k8s-sidecar:1.15.9 |
|
kube-state-metrics |
mirantis.azurecr.io/stacklight/kube-state-metrics:v2.2.4 |
|
kubectl Updated |
mirantis.azurecr.io/stacklight/kubectl:1.22.13 |
|
metric-collector |
mirantis.azurecr.io/stacklight/metric-collector:v0.1-20220711134630 |
|
metricbeat Updated |
mirantis.azurecr.io/stacklight/metricbeat:7.10.2-20220909091002 |
|
nginx-prometheus-exporter |
mirantis.azurecr.io/stacklight/nginx-prometheus-exporter:0.6.0 |
|
node-exporter |
mirantis.azurecr.io/stacklight/node-exporter:v1.2.2 |
|
opensearch |
mirantis.azurecr.io/stacklight/opensearch:1-20220517112057 |
|
opensearch-dashboards |
mirantis.azurecr.io/stacklight/opensearch-dashboards:1-20220517112107 |
|
origin-telemeter |
mirantis.azurecr.io/stacklight/origin-telemeter:4.4.0-20200424 |
|
pgbouncer |
mirantis.azurecr.io/stacklight/pgbouncer:1.12.0 |
|
prometheus |
mirantis.azurecr.io/stacklight/prometheus:v2.35.0 |
|
prometheus-es-exporter |
mirantis.azurecr.io/stacklight/prometheus-es-exporter:v0.14.0-20220517111946 |
|
prometheus-msteams |
mirantis.azurecr.io/stacklight/prometheus-msteams:v1.4.2 |
|
prometheus-patroni-exporter |
mirantis.azurecr.io/stacklight/prometheus-patroni-exporter:v0.1-20220624102731 |
|
prometheus-postgres-exporter |
mirantis.azurecr.io/stacklight/prometheus-postgres-exporter:v0.9.0 |
|
prometheus-relay |
mirantis.azurecr.io/stacklight/prometheus-relay:v0.3-20210317133316 |
|
refapp New |
mirantis.azurecr.io/openstack/openstack-refapp:0.0.1.dev29 |
|
sf-notifier |
mirantis.azurecr.io/stacklight/sf-notifier:v0.3-20220706035002 |
|
sf-reporter Updated |
mirantis.azurecr.io/stacklight/sf-reporter:v0.1-20220916113234 |
|
spilo Updated |
mirantis.azurecr.io/stacklight/spilo:13-2.1p1-20220921105803 |
|
stacklight-toolkit New |
mirantis.azurecr.io/stacklight/stacklight-toolkit:20220729121446 |
|
telegraf |
mirantis.azurecr.io/stacklight/telegraf:v1.9.1-20220714080809 |
|
mirantis.azurecr.io/stacklight/telegraf:1.23.4-20220915114529 Updated |
||
telemeter-token-auth |
mirantis.azurecr.io/stacklight/telemeter-token-auth:v0.1-20200406175600 |
|
yq |
mirantis.azurecr.io/stacklight/yq:4.25.2 |
Artifact |
Component |
Path |
|---|---|---|
Debian repositories |
System packages |
|
http://mirror.mirantis.com/kaas/kubernetes-extra-rhel7-0.0.5/ |
||
https://mirror.mirantis.com/kaas/ubuntu-2022-07-13-020010.target.txt |
||
MCR repositories |
MCR |
https://repos.mirantis.com/ubuntu/dists/bionic/pool/stable-20.10/ |
Target ubuntu system 1 |
Ubuntu |
https://binary.mirantis.com/bm/bin/efi/ubuntu/tgz-focal-20220915105522 |
https://binary.mirantis.com/bm/bin/efi/ubuntu/tgz-bionic-5.4-20220915105637 2 |
This section outlines release notes for the Cluster release 7.10.0 that is introduced in the Mirantis Container Cloud release 2.20.0.
This Cluster release supports Mirantis Kubernetes Engine 3.4.10 with Kubernetes 1.20 and Mirantis Container Runtime 20.10.12.
For the list of known and resolved issues, refer to the Container Cloud release 2.20.0 section.
This section outlines new features implemented in the Cluster release 7.10.0 that is introduced in the Container Cloud release 2.20.0.
Updated the Mirantis Kubernetes Engine (MKE) version from 3.4.9 to 3.4.10 and the Mirantis Container Runtime (MCR) version from 20.10.11 to 20.10.12 for the Container Cloud management, regional, and managed clusters on all supported cloud providers except MOSK-based deployments, as well as for non Container Cloud based MKE cluster attachment.
To reduce resource consumption, removed Ceph cluster deployment from management and regional clusters based on bare metal and Equinix Metal with private networking. Ceph is automatically removed during the Cluster release update to 7.10.0. Managed clusters continue using Ceph as a distributed storage system.
Implemented the objectUsers RADOS Gateway parameter in the
KaaSCephCluster CR. The new parameter allows for an easy creation of custom
Ceph RADOS Gateway users with permission rules. The users parameter is now
deprecated and, if specified, will be automatically transformed to
objectUsers.
Caution
For MKE clusters that are part of MOSK infrastructure, the feature support will become available in one of the following Container Cloud releases.
Learn more
Implemented the rbdDeviceMapOptions field in the Ceph pool parameters of
the KaaSCephCluster CR. The new field allows specifying custom RADOS Block
Device (RBD) map options to use with StorageClass of a corresponding Ceph
pool.
Caution
For MKE clusters that are part of MOSK infrastructure, the feature support will become available in one of the following Container Cloud releases.
Implemented the mgr.mgrModules parameter that includes the name and
enabled keys to provide the capability to disable a particular Ceph Manager
module. The mgr.modules parameter is now deprecated and, if specified, will
be automatically transformed to mgr.mgrModules.
Implemented the capability to configure health checks and liveness probe
settings for Ceph daemons through the KaaSCephCluster CR.
Caution
For MKE clusters that are part of MOSK infrastructure, the feature support will become available in one of the following Container Cloud releases.
The following table lists the components versions of the Cluster release 7.10.0.
Note
The components that are newly added, updated, deprecated, or removed
as compared to the previous release version, are marked
with a corresponding superscript,
for example, lcm-ansible Updated.
Component |
Application/Service |
Version |
|---|---|---|
Cluster orchestration |
Mirantis Kubernetes Engine Updated |
3.4.10 0 |
Container runtime |
Mirantis Container Runtime Updated |
20.10.12 1 |
Distributed storage |
Ceph |
15.2.13 (Octopus) |
Rook |
1.0.0-20220504194120 |
|
LCM |
Helm |
2.16.11-40 |
helm-controller Updated |
0.3.0-285-g8498abe0 |
|
lcm-ansible Updated |
0.18.1 |
|
lcm-agent Updated |
0.3.0-288-g405179c2 |
|
metallb-controller Updated |
0.12.1 |
|
metrics-server |
0.5.2 |
|
StackLight |
Alerta |
8.5.0-20211108051042 |
Alertmanager |
0.23.0 |
|
Alertmanager Webhook ServiceNow Updated |
0.1-20220706035316 |
|
Cerebro |
0.9.3 |
|
Elasticsearch Curator |
5.7.6 |
|
Elasticsearch Exporter |
1.0.2 |
|
Fluentd |
1.14-20220111114545 |
|
Grafana Updated |
9.0.2 |
|
Grafana Image Renderer |
3.4.2 |
|
IAM Proxy |
6.0.1 |
|
Metric Collector Updated |
0.1-20220711134630 |
|
Metricbeat |
7.10.2-20220309185937 |
|
OpenSearch |
1-20220517112057 |
|
OpenSearch Dashboards |
1-20220517112107 |
|
Prometheus |
2.35.0 |
|
Prometheus Blackbox Exporter |
0.19.0 |
|
Prometheus ES Exporter |
0.14.0-20220517111946 |
|
Prometheus MS Teams |
1.4.2 |
|
Prometheus Node Exporter |
1.2.2 |
|
Prometheus NGINX Exporter |
0.6.0 |
|
Prometheus Patroni Exporter Updated |
0.1-20220624102731 |
|
Prometheus Postgres Exporter |
0.9.0 |
|
Prometheus Relay |
0.3-20210317133316 |
|
sf-notifier Updated |
0.3-20220706035002 |
|
sf-reporter Updated |
0.1-20220622101204 |
|
Spilo |
13-2.1p1-20220225091552 |
|
Telegraf Updated |
1.9.1-20220714080809 |
|
1.20.2-20220204122426 |
||
Telemeter |
4.4.0-20200424 |
- 0
For the Mirantis Kubernetes Engine (MKE) release highlights and components versions, see MKE documentation: MKE release notes.
- 1
For the Mirantis Container Runtime (MCR) release highlights, see MCR documentation: MCR release notes.
This section lists the components artifacts of the Cluster release 7.10.0.
Note
The components that are newly added, updated, deprecated, or removed
as compared to the previous release version, are marked
with a corresponding superscript,
for example, lcm-ansible Updated.
Artifact |
Component |
Path |
|---|---|---|
Helm chart |
ceph-controller Updated |
https://binary.mirantis.com/ceph/helm/ceph-operator-1.0.0-mcp-908.tgz |
Docker images |
ceph |
mirantis.azurecr.io/ceph/ceph:v15.2.13 |
ceph-controller Updated |
mirantis.azurecr.io/ceph/mcp/ceph-controller:v1.0.0-20220819101016 |
|
cephcsi |
mirantis.azurecr.io/ceph/cephcsi/cephcsi:v3.4.0 |
|
csi-node-driver-registrar |
mirantis.azurecr.io/ceph/k8scsi/csi-node-driver-registrar:v2.1.0 |
|
csi-provisioner |
mirantis.azurecr.io/ceph/k8scsi/csi-provisioner:v2.1.2 |
|
csi-snapshotter |
mirantis.azurecr.io/ceph/k8scsi/csi-snapshotter:v4.0.0 |
|
csi-attacher |
mirantis.azurecr.io/ceph/k8scsi/csi-attacher:v3.1.0 |
|
csi-resizer |
mirantis.azurecr.io/ceph/k8scsi/csi-resizer:v1.1.0 |
|
rook |
mirantis.azurecr.io/ceph/rook:v1.0.0-20220504194120 |
Artifact |
Component |
Path |
|---|---|---|
Binaries Updated |
lcm-ansible |
https://binary.mirantis.com/lcm/bin/lcm-ansible/v0.18.1/lcm-ansible.tar.gz |
lcm-agent |
https://binary.mirantis.com/lcm/bin/lcm-agent/v0.3.0-288-g405179c2/lcm-agent |
|
Helm charts Updated |
managed-lcm-api |
https://binary.mirantis.com/core/helm/managed-lcm-api-1.33.5.tgz |
metallb |
||
metrics-server |
https://binary.mirantis.com/core/helm/metrics-server-1.33.5.tgz |
|
Docker images |
helm-controller Updated |
mirantis.azurecr.io/lcm/lcm-controller:v0.3.0-285-g8498abe0 |
metallb-controller Updated |
mirantis.azurecr.io/bm/external/metallb/controller:v0.12.1 |
|
metallb-speaker Updated |
mirantis.azurecr.io/bm/external/metallb/speaker:v0.12.1 |
|
metrics-server |
mirantis.azurecr.io/core/external/metrics-server:v0.5.2 |
Artifact |
Component |
Path |
|---|---|---|
Helm charts |
alerta |
https://binary.mirantis.com/stacklight/helm/alerta-0.1.0-mcp-25.tgz |
alertmanager-webhook-servicenow |
https://binary.mirantis.com/stacklight/helm/alertmanager-webhook-servicenow-0.2.0-mcp-3.tgz |
|
cerebro |
https://binary.mirantis.com/stacklight/helm/cerebro-0.1.0-mcp-2.tgz |
|
elasticsearch-curator |
https://binary.mirantis.com/stacklight/helm/elasticsearch-curator-1.5.0-mcp-9.tgz |
|
elasticsearch-exporter |
https://binary.mirantis.com/stacklight/helm/elasticsearch-exporter-1.2.0-mcp-6.tgz |
|
fluentd |
https://binary.mirantis.com/stacklight/helm/fluentd-2.0.3-mcp-37.tgz |
|
fluentd-logs Updated |
https://binary.mirantis.com/stacklight/helm/fluentd-elasticsearch-3.0.0-mcp-131.tgz |
|
grafana Updated |
https://binary.mirantis.com/stacklight/helm/grafana-3.3.10-mcp-154.tgz |
|
iam-proxy Updated |
||
metric-collector |
https://binary.mirantis.com/stacklight/helm/metric-collector-0.3.0-mcp-6.tgz |
|
metricbeat |
https://binary.mirantis.com/stacklight/helm/metricbeat-1.7.1-mcp-16.tgz |
|
opensearch Updated |
https://binary.mirantis.com/stacklight/helm/opensearch-0.1.0-mcp-52.tgz |
|
opensearch-dashboards |
https://binary.mirantis.com/stacklight/helm/opensearch-dashboards-0.1.0-mcp-40.tgz |
|
patroni |
https://binary.mirantis.com/stacklight/helm/patroni-0.15.1-mcp-42.tgz |
|
prometheus |
https://binary.mirantis.com/stacklight/helm/prometheus-8.11.4-mcp-228.tgz |
|
prometheus-blackbox-exporter |
https://binary.mirantis.com/stacklight/helm/prometheus-blackbox-exporter-0.3.0-mcp-11.tgz |
|
prometheus-es-exporter |
https://binary.mirantis.com/stacklight/helm/prometheus-es-exporter-1.0.0-mcp-11.tgz |
|
prometheus-msteams |
https://binary.mirantis.com/stacklight/helm/prometheus-msteams-0.1.0-mcp-8.tgz |
|
prometheus-nginx-exporter |
https://binary.mirantis.com/stacklight/helm/prometheus-nginx-exporter-0.2.0-mcp-1.tgz |
|
sf-notifier |
https://binary.mirantis.com/stacklight/helm/sf-notifier-0.2.0-mcp-2.tgz |
|
sf-reporter |
https://binary.mirantis.com/stacklight/helm/sf-reporter-0.2.0-mcp-3.tgz |
|
stacklight Updated |
https://binary.mirantis.com/stacklight/helm/stacklight-0.8.1.tgz |
|
telegraf-ds |
https://binary.mirantis.com/stacklight/helm/telegraf-ds-1.1.5-mcp-29.tgz |
|
telegraf-s |
https://binary.mirantis.com/stacklight/helm/telegraf-s-1.1.5-mcp-30.tgz |
|
telemeter-server Updated |
https://binary.mirantis.com/stacklight/helm/telemeter-server-0.2.0-mcp-6.tgz |
|
telemeter-client Updated |
https://binary.mirantis.com/stacklight/helm/telemeter-client-0.2.0-mcp-6.tgz |
|
Docker images |
alerta |
mirantis.azurecr.io/stacklight/alerta-web:8.5.0-20211108051042 |
alertmanager |
mirantis.azurecr.io/stacklight/alertmanager:v0.23.0 |
|
alertmanager-webhook-servicenow Updated |
mirantis.azurecr.io/stacklight/alertmanager-webhook-servicenow:v0.1-20220706035316 |
|
busybox |
mirantis.azurecr.io/stacklight/busybox:1.30 |
|
cerebro |
mirantis.azurecr.io/stacklight/cerebro:0.9.3 |
|
configmap-reload |
mirantis.azurecr.io/stacklight/configmap-reload:v0.3.0 |
|
curl |
mirantis.azurecr.io/stacklight/curl:7.69.0 |
|
curl-jq |
mirantis.azurecr.io/stacklight/curl-jq:1.5-1 |
|
elasticsearch-curator |
mirantis.azurecr.io/stacklight/curator:5.7.6 |
|
elasticsearch-exporter |
mirantis.azurecr.io/stacklight/elasticsearch_exporter:1.0.2 |
|
fluentd |
mirantis.azurecr.io/stacklight/fluentd:1.14-20220111114545 |
|
grafana Updated |
mirantis.azurecr.io/stacklight/grafana:9.0.2 |
|
grafana-image-renderer |
mirantis.azurecr.io/stacklight/grafana-image-renderer:3.4.2 |
|
kubectl |
mirantis.azurecr.io/stacklight/kubectl:1.19.13 |
|
k8s-sidecar |
mirantis.azurecr.io/stacklight/k8s-sidecar:1.15.9 |
|
kube-state-metrics |
mirantis.azurecr.io/stacklight/kube-state-metrics:v2.2.4 |
|
metric-collector Updated |
mirantis.azurecr.io/stacklight/metric-collector:v0.1-20220711134630 |
|
metricbeat |
mirantis.azurecr.io/stacklight/metricbeat:7.10.2-20220309185937 |
|
node-exporter |
mirantis.azurecr.io/stacklight/node-exporter:v1.2.2 |
|
opensearch |
mirantis.azurecr.io/stacklight/opensearch:1-20220517112057 |
|
opensearch-dashboards |
mirantis.azurecr.io/stacklight/opensearch-dashboards:1-20220517112107 |
|
origin-telemeter |
mirantis.azurecr.io/stacklight/origin-telemeter:4.4.0-20200424 |
|
pgbouncer |
mirantis.azurecr.io/stacklight/pgbouncer:1.12.0 |
|
prometheus |
mirantis.azurecr.io/stacklight/prometheus:v2.35.0 |
|
prometheus-blackbox-exporter |
mirantis.azurecr.io/stacklight/blackbox-exporter:v0.19.0 |
|
prometheus-es-exporter |
mirantis.azurecr.io/stacklight/prometheus-es-exporter:v0.14.0-20220517111946 |
|
prometheus-msteams |
mirantis.azurecr.io/stacklight/prometheus-msteams:v1.4.2 |
|
prometheus-nginx-exporter |
mirantis.azurecr.io/stacklight/nginx-prometheus-exporter:0.6.0 |
|
prometheus-patroni-exporter Updated |
mirantis.azurecr.io/stacklight/prometheus-patroni-exporter:v0.1-20220624102731 |
|
prometheus-postgres-exporter |
mirantis.azurecr.io/stacklight/prometheus-postgres-exporter:v0.9.0 |
|
prometheus-relay |
mirantis.azurecr.io/stacklight/prometheus-relay:v0.3-20210317133316 |
|
sf-notifier Updated |
mirantis.azurecr.io/stacklight/sf-notifier:v0.3-20220706035002 |
|
sf-reporter Updated |
mirantis.azurecr.io/stacklight/sf-reporter:v0.1-20220622101204 |
|
spilo |
mirantis.azurecr.io/stacklight/spilo:13-2.1p1-20220225091552 |
|
telegraf Updated |
mirantis.azurecr.io/stacklight/telegraf:v1.9.1-20220714080809 |
|
mirantis.azurecr.io/stacklight/telegraf:1.20.2-20220204122426 |
||
telemeter-token-auth |
mirantis.azurecr.io/stacklight/telemeter-token-auth:v0.1-20200406175600 |
|
yq |
mirantis.azurecr.io/stacklight/yq:4.25.2 |
Artifact |
Component |
Path |
|---|---|---|
Debian repositories |
System packages |
|
http://mirror.mirantis.com/kaas/kubernetes-extra-rhel7-0.0.5/ |
||
https://mirror.mirantis.com/kaas/ubuntu-2022-07-13-020010.target.txt |
||
MCR repositories |
MCR |
https://repos.mirantis.com/ubuntu/dists/bionic/pool/stable-20.10/ |
This section outlines release notes for the Cluster release 7.9.0 that is introduced in the Mirantis Container Cloud release 2.19.0.
This Cluster release supports Mirantis Kubernetes Engine 3.4.9 with Kubernetes 1.20 and Mirantis Container Runtime 20.10.11.
For the list of known and resolved issues, refer to the Container Cloud release 2.19.0 section.
This section outlines new features implemented in the Cluster release 7.9.0 that is introduced in the Container Cloud release 2.19.0.
Updated the Mirantis Kubernetes Engine (MKE) version from 3.4.8 to 3.4.9 for the Container Cloud management, regional, and managed clusters on all supported cloud providers except MOSK-based deployments, as well as for non Container Cloud based MKE cluster attachment.
Learn more
Implemented a new Kubernetes Containers Grafana dashboard that provides resources consumption metrics of containers running on Kubernetes nodes.
Caution
For MKE clusters that are part of MOSK infrastructure, the feature support will become available in one of the following Container Cloud releases.
Learn more
Enhanced the documentation by adding troubleshooting guidelines for the Kubernetes system, Metric Collector, Helm Controller, Release Controller, and MKE alerts.
Learn more
As part of the Elasticsearch switching to OpenSearch, replaced the Elasticsearch parameters with OpenSearch in the Container Cloud web UI.
Implemented the capability to easily view the summary and health status of all Ceph clusters through the Container Cloud web UI. The feature is supported for the bare metal provider only.
Caution
For MKE clusters that are part of MOSK infrastructure, the feature support will become available in one of the following Container Cloud releases.
Implemented the capability to remove or replace Ceph OSDs not only by the
device name or path but also by ID, using the by-id parameter in the
KaaSCephOperationRequest CR.
Caution
For MKE clusters that are part of MOSK infrastructure, the feature support will become available in one of the following Container Cloud releases.
Learn more
TechPreview
Implemented the capability to create multiple Ceph data pools per a single
CephFS installation using the dataPools parameter in the CephFS
specification. The dataPool parameter is now deprecated.
Caution
For MKE clusters that are part of MOSK infrastructure, the feature is not supported yet.
Learn more
The following table lists the components versions of the Cluster release 7.9.0.
Note
The components that are newly added, updated, deprecated, or removed
as compared to the previous release version, are marked
with a corresponding superscript,
for example, lcm-ansible Updated.
Component |
Application/Service |
Version |
|---|---|---|
Cluster orchestration |
Mirantis Kubernetes Engine Updated |
3.4.9 0 |
Container runtime |
Mirantis Container Runtime |
20.10.11 1 |
Distributed storage |
Ceph |
15.2.13 (Octopus) |
Rook |
1.0.0-20220504194120 |
|
LCM |
Helm |
2.16.11-40 |
helm-controller Updated |
0.3.0-257-ga93244da |
|
lcm-ansible Updated |
0.17.1-2-g1e337f8 |
|
lcm-agent Updated |
0.3.0-257-ga93244da |
|
metallb-controller |
0.9.3-1 |
|
metrics-server |
0.5.2 |
|
StackLight |
Alerta |
8.5.0-20211108051042 |
Alertmanager |
0.23.0 |
|
Alertmanager Webhook ServiceNow |
0.1-20220420161450 |
|
Cerebro |
0.9.3 |
|
Elasticsearch Curator |
5.7.6 |
|
Elasticsearch Exporter |
1.0.2 |
|
Fluentd |
1.14-20220111114545 |
|
Grafana |
8.5.0 |
|
Grafana Image Renderer Updated |
3.4.2 |
|
IAM Proxy |
6.0.1 |
|
Metric Collector Updated |
0.1-20220614110617 |
|
Metricbeat |
7.10.2-20220309185937 |
|
OpenSearch Updated |
1-20220517112057 |
|
OpenSearch Dashboards Updated |
1-20220517112107 |
|
Patroni |
13-2.1p1-20220225091552 |
|
Prometheus Updated |
2.35.0 |
|
Prometheus Blackbox Exporter |
0.19.0 |
|
Prometheus ES Exporter Updated |
0.14.0-20220517111946 |
|
Prometheus MS Teams |
1.4.2 |
|
Prometheus Node Exporter |
1.2.2 |
|
Prometheus NGINX Exporter |
0.6.0 |
|
Prometheus Patroni Exporter |
0.1-20210708141736 |
|
Prometheus Postgres Exporter |
0.9.0 |
|
Prometheus Relay |
0.3-20210317133316 |
|
sf-notifier Updated |
0.3-20220514051554 |
|
sf-reporter |
0.1-20220419092138 |
|
Telegraf |
1.9.1-20210225142050 |
|
1.20.2-20220204122426 |
||
Telemeter |
4.4.0-20200424 |
- 0
For the Mirantis Kubernetes Engine (MKE) release highlights and components versions, see MKE documentation: MKE release notes.
- 1
For the Mirantis Container Runtime (MCR) release highlights, see MCR documentation: MCR release notes.
This section lists the components artifacts of the Cluster release 7.9.0.
Note
The components that are newly added, updated, deprecated, or removed
as compared to the previous release version, are marked
with a corresponding superscript,
for example, lcm-ansible Updated.
Artifact |
Component |
Path |
|---|---|---|
Helm chart |
ceph-controller Updated |
https://binary.mirantis.com/ceph/helm/ceph-operator-1.0.0-mcp-831.tgz |
Docker images |
ceph |
mirantis.azurecr.io/ceph/ceph:v15.2.13 |
ceph-controller Updated |
mirantis.azurecr.io/ceph/mcp/ceph-controller:v1.0.0-20220715144333 |
|
cephcsi |
mirantis.azurecr.io/ceph/cephcsi/cephcsi:v3.4.0 |
|
csi-node-driver-registrar |
mirantis.azurecr.io/ceph/k8scsi/csi-node-driver-registrar:v2.1.0 |
|
csi-provisioner |
mirantis.azurecr.io/ceph/k8scsi/csi-provisioner:v2.1.2 |
|
csi-snapshotter |
mirantis.azurecr.io/ceph/k8scsi/csi-snapshotter:v4.0.0 |
|
csi-attacher |
mirantis.azurecr.io/ceph/k8scsi/csi-attacher:v3.1.0 |
|
csi-resizer |
mirantis.azurecr.io/ceph/k8scsi/csi-resizer:v1.1.0 |
|
rook |
mirantis.azurecr.io/ceph/rook:v1.0.0-20220504194120 |
Artifact |
Component |
Path |
|---|---|---|
Binaries Updated |
lcm-ansible |
https://binary.mirantis.com/lcm/bin/lcm-ansible/v0.17.1-2-g1e337f8/lcm-ansible.tar.gz |
lcm-agent |
https://binary.mirantis.com/lcm/bin/lcm-agent/v0.3.0-257-ga93244da/lcm-agent |
|
Helm charts Updated |
managed-lcm-api |
https://binary.mirantis.com/core/helm/managed-lcm-api-1.32.4.tgz |
metallb |
||
metrics-server |
https://binary.mirantis.com/core/helm/metrics-server-1.32.4.tgz |
|
Docker images |
helm-controller Updated |
mirantis.azurecr.io/lcm/lcm-controller:v0.3.0-257-ga93244da |
metallb-controller |
mirantis.azurecr.io/lcm/metallb/controller:v0.9.3-1 |
|
metallb-speaker |
mirantis.azurecr.io/lcm/metallb/speaker:v0.9.3-1 |
|
metrics-server |
mirantis.azurecr.io/core/external/metrics-server:v0.5.2 |
Artifact |
Component |
Path |
|---|---|---|
Helm charts |
alerta |
https://binary.mirantis.com/stacklight/helm/alerta-0.1.0-mcp-25.tgz |
alertmanager-webhook-servicenow |
https://binary.mirantis.com/stacklight/helm/alertmanager-webhook-servicenow-0.2.0-mcp-3.tgz |
|
cerebro |
https://binary.mirantis.com/stacklight/helm/cerebro-0.1.0-mcp-2.tgz |
|
elasticsearch-curator |
https://binary.mirantis.com/stacklight/helm/elasticsearch-curator-1.5.0-mcp-9.tgz |
|
elasticsearch-exporter |
https://binary.mirantis.com/stacklight/helm/elasticsearch-exporter-1.2.0-mcp-6.tgz |
|
fluentd |
https://binary.mirantis.com/stacklight/helm/fluentd-2.0.3-mcp-37.tgz |
|
fluentd-logs |
https://binary.mirantis.com/stacklight/helm/fluentd-elasticsearch-3.0.0-mcp-128.tgz |
|
grafana Updated |
https://binary.mirantis.com/stacklight/helm/grafana-3.3.10-mcp-150.tgz |
|
iam-proxy |
||
metric-collector |
https://binary.mirantis.com/stacklight/helm/metric-collector-0.3.0-mcp-6.tgz |
|
metricbeat |
https://binary.mirantis.com/stacklight/helm/metricbeat-1.7.1-mcp-16.tgz |
|
opensearch |
https://binary.mirantis.com/stacklight/helm/opensearch-0.1.0-mcp-50.tgz |
|
opensearch-dashboards |
https://binary.mirantis.com/stacklight/helm/opensearch-dashboards-0.1.0-mcp-40.tgz |
|
patroni |
https://binary.mirantis.com/stacklight/helm/patroni-0.15.1-mcp-42.tgz |
|
prometheus Updated |
https://binary.mirantis.com/stacklight/helm/prometheus-8.11.4-mcp-228.tgz |
|
prometheus-blackbox-exporter |
https://binary.mirantis.com/stacklight/helm/prometheus-blackbox-exporter-0.3.0-mcp-11.tgz |
|
prometheus-es-exporter |
https://binary.mirantis.com/stacklight/helm/prometheus-es-exporter-1.0.0-mcp-11.tgz |
|
prometheus-msteams |
https://binary.mirantis.com/stacklight/helm/prometheus-msteams-0.1.0-mcp-8.tgz |
|
prometheus-nginx-exporter |
https://binary.mirantis.com/stacklight/helm/prometheus-nginx-exporter-0.2.0-mcp-1.tgz |
|
sf-notifier |
https://binary.mirantis.com/stacklight/helm/sf-notifier-0.2.0-mcp-2.tgz |
|
sf-reporter |
https://binary.mirantis.com/stacklight/helm/sf-reporter-0.2.0-mcp-3.tgz |
|
stacklight Updated |
https://binary.mirantis.com/stacklight/helm/stacklight-0.7.2.tgz |
|
telegraf-ds |
https://binary.mirantis.com/stacklight/helm/telegraf-ds-1.1.5-mcp-29.tgz |
|
telegraf-s |
https://binary.mirantis.com/stacklight/helm/telegraf-s-1.1.5-mcp-30.tgz |
|
telemeter-server |
https://binary.mirantis.com/stacklight/helm/telemeter-server-0.2.0-mcp-5.tgz |
|
telemeter-client |
https://binary.mirantis.com/stacklight/helm/telemeter-client-0.2.0-mcp-5.tgz |
|
Docker images |
alerta |
mirantis.azurecr.io/stacklight/alerta-web:8.5.0-20211108051042 |
alertmanager |
mirantis.azurecr.io/stacklight/alertmanager:v0.23.0 |
|
alertmanager-webhook-servicenow |
mirantis.azurecr.io/stacklight/alertmanager-webhook-servicenow:v0.1-20220420161450 |
|
busybox |
mirantis.azurecr.io/stacklight/busybox:1.30 |
|
cerebro |
mirantis.azurecr.io/stacklight/cerebro:0.9.3 |
|
configmap-reload |
mirantis.azurecr.io/stacklight/configmap-reload:v0.3.0 |
|
curl |
mirantis.azurecr.io/stacklight/curl:7.69.0 |
|
curl-jq |
mirantis.azurecr.io/stacklight/curl-jq:1.5-1 |
|
elasticsearch-curator |
mirantis.azurecr.io/stacklight/curator:5.7.6 |
|
elasticsearch-exporter |
mirantis.azurecr.io/stacklight/elasticsearch_exporter:1.0.2 |
|
fluentd |
mirantis.azurecr.io/stacklight/fluentd:1.14-20220111114545 |
|
grafana |
mirantis.azurecr.io/stacklight/grafana:8.5.0 |
|
grafana-image-renderer Updated |
mirantis.azurecr.io/stacklight/grafana-image-renderer:3.4.2 |
|
kubectl |
mirantis.azurecr.io/stacklight/kubectl:1.19.13 |
|
k8s-sidecar |
mirantis.azurecr.io/stacklight/k8s-sidecar:1.15.9 |
|
kube-state-metrics |
mirantis.azurecr.io/stacklight/kube-state-metrics:v2.2.4 |
|
metric-collector Updated |
mirantis.azurecr.io/stacklight/metric-collector:v0.1-20220614110617 |
|
metricbeat |
mirantis.azurecr.io/stacklight/metricbeat:7.10.2-20220309185937 |
|
node-exporter |
mirantis.azurecr.io/stacklight/node-exporter:v1.2.2 |
|
opensearch Updated |
mirantis.azurecr.io/stacklight/opensearch:1-20220517112057 |
|
opensearch-dashboards Updated |
mirantis.azurecr.io/stacklight/opensearch-dashboards:1-20220517112107 |
|
origin-telemeter |
mirantis.azurecr.io/stacklight/origin-telemeter:4.4.0-20200424 |
|
prometheus Updated |
mirantis.azurecr.io/stacklight/prometheus:v2.35.0 |
|
prometheus-blackbox-exporter |
mirantis.azurecr.io/stacklight/blackbox-exporter:v0.19.0 |
|
prometheus-es-exporter Updated |
mirantis.azurecr.io/stacklight/prometheus-es-exporter:v0.14.0-20220517111946 |
|
prometheus-msteams |
mirantis.azurecr.io/stacklight/prometheus-msteams:v1.4.2 |
|
prometheus-nginx-exporter |
mirantis.azurecr.io/stacklight/nginx-prometheus-exporter:0.6.0 |
|
prometheus-patroni-exporter |
mirantis.azurecr.io/stacklight/prometheus-patroni-exporter:v0.1-20210708141736 |
|
prometheus-postgres-exporter |
mirantis.azurecr.io/stacklight/prometheus-postgres-exporter:v0.9.0 |
|
prometheus-relay |
mirantis.azurecr.io/stacklight/prometheus-relay:v0.3-20210317133316 |
|
sf-notifier Updated |
mirantis.azurecr.io/stacklight/sf-notifier:v0.3-20220514051554 |
|
sf-reporter |
mirantis.azurecr.io/stacklight/sf-reporter:v0.1-20220419092138 |
|
spilo |
mirantis.azurecr.io/stacklight/spilo:13-2.1p1-20220225091552 |
|
telegraf |
mirantis.azurecr.io/stacklight/telegraf:v1.9.1-20210225142050 |
|
mirantis.azurecr.io/stacklight/telegraf:1.20.2-20220204122426 |
||
telemeter-token-auth |
mirantis.azurecr.io/stacklight/telemeter-token-auth:v0.1-20200406175600 |
|
yq Updated |
mirantis.azurecr.io/stacklight/yq:4.25.2 |
Artifact |
Component |
Path |
|---|---|---|
Debian repositories |
System packages |
|
http://mirror.mirantis.com/kaas/kubernetes-extra-rhel7-0.0.5/ |
||
https://mirror.mirantis.com/kaas/ubuntu-2022-05-03-013543.target.txt |
||
MCR repositories |
MCR |
https://repos.mirantis.com/ubuntu/dists/bionic/pool/stable-20.10/ |
This section outlines release notes for the Cluster release 7.8.0 that is introduced in the Mirantis Container Cloud release 2.18.0.
This Cluster release supports Mirantis Kubernetes Engine 3.4.8 with Kubernetes 1.20 and Mirantis Container Runtime 20.10.11.
For the list of known and resolved issues, refer to the Container Cloud release 2.18.0 section.
This section outlines new features implemented in the Cluster release 7.8.0 that is introduced in the Container Cloud release 2.18.0.
Updated the Mirantis Kubernetes Engine (MKE) version from 3.4.7 to 3.4.8 and the Mirantis Container Runtime (MCR) version from 20.10.8 to 20.10.11 for the Container Cloud management, regional, and managed clusters on all supported cloud providers, as well as for non Container Cloud based MKE cluster attachment.
As part of the Elasticsearch switching to OpenSearch, removed the Elasticsearch and Kibana services, as well as introduced a set of new parameters that will replace the current ones in future releases. The old parameters are supported and take precedence over the new ones. For details, see Deprecation Notes and StackLight configuration parameters.
Note
In the Container Cloud web UI, the Elasticsearch and Kibana naming is still present. However, the services behind them have switched to OpenSearch and OpenSearch Dashboards.
Implemented the following improvements to StackLight alerting:
Added the
MCCClusterUpdatinginformational alert that raises when the Mirantis Container Cloud cluster starts updating.Enhanced StackLight alerting by clarifying alert severity levels. Switched all
Minoralerts toWarning. Now, only alerts of the following severities exist:informational,warning,major, andcritical.Enhanced the documentation by adding troubleshooting guidelines for the Kubernetes applications, resources, and storage alerts.
Learn more
Implemented the capability to allow sending of metrics from Prometheus, using the Prometheus remote write feature to a custom monitoring endpoint.
Learn more
Defined the following parameters in the StackLight configuration of the Cluster object for all types of clusters as mandatory. This applies to the clusters with StackLight enabled only. For existing clusters, Cluster object will be updated automatically.
Important
When creating a new cluster, specify these parameters through the Container Cloud web UI or as described in StackLight configuration parameters. Update all cluster templates created before Container Cloud 2.18.0 that do not have values for these parameters specified. Otherwise, the Admission Controller will reject cluster creation.
Web UI parameter |
API parameter |
|---|---|
Enable Logging |
|
HA Mode |
|
Prometheus Persistent Volume Claim Size |
|
Elasticsearch Persistent Volume Claim Size |
|
Implemented the capability to configure the placement of the
rook-ceph-operator, rook-discover, and csi-rbdplugin Ceph daemons.
Learn more
The following table lists the components versions of the Cluster release 7.8.0.
Note
The components that are newly added, updated, deprecated, or removed
as compared to the previous release version, are marked
with a corresponding superscript,
for example, lcm-ansible Updated.
Component |
Application/Service |
Version |
|---|---|---|
Cluster orchestration |
Mirantis Kubernetes Engine Updated |
3.4.8 0 |
Container runtime |
Mirantis Container Runtime Updated |
20.10.11 1 |
Distributed storage |
Ceph |
15.2.13 (Octopus) |
Rook |
1.0.0-20220504194120 |
|
LCM |
Helm |
2.16.11-40 |
helm-controller Updated |
0.3.0-239-gae7218ea |
|
lcm-ansible Updated |
0.16.0-13-gcac49ca |
|
lcm-agent Updated |
0.3.0-239-gae7218ea |
|
metallb-controller |
0.9.3-1 |
|
metrics-server |
0.5.2 |
|
StackLight |
Alerta |
8.5.0-20211108051042 |
Alertmanager |
0.23.0 |
|
Alertmanager Webhook ServiceNow Updated |
0.1-20220420161450 |
|
Cerebro |
0.9.3 |
|
Elasticsearch Curator |
5.7.6 |
|
Elasticsearch Exporter |
1.0.2 |
|
Fluentd |
1.14-20220111114545 |
|
Grafana Updated |
8.5.0 |
|
Grafana Image Renderer |
3.2.1 |
|
IAM Proxy |
6.0.1 |
|
Metric Collector |
0.1-20220209123106 |
|
Metricbeat |
7.10.2-20220309185937 |
|
OpenSearch |
1-20220316161927 |
|
OpenSearch Dashboards |
1-20220316161951 |
|
Patroni |
13-2.1p1-20220225091552 |
|
Prometheus |
2.31.1 |
|
Prometheus Blackbox Exporter |
0.19.0 |
|
Prometheus ES Exporter |
0.14.0-20220111114356 |
|
Prometheus MS Teams |
1.4.2 |
|
Prometheus Node Exporter |
1.2.2 |
|
Prometheus NGINX Exporter |
0.6.0 |
|
Prometheus Patroni Exporter |
0.1-20210708141736 |
|
Prometheus Postgres Exporter |
0.9.0 |
|
Prometheus Relay |
0.3-20210317133316 |
|
sf-notifier |
0.3-20210930112115 |
|
sf-reporter Updated |
0.1-20220419092138 |
|
Telegraf |
1.9.1-20210225142050 |
|
1.20.2-20220204122426 |
||
Telemeter |
4.4.0-20200424 |
- 0
For the Mirantis Kubernetes Engine (MKE) release highlights and components versions, see MKE documentation: MKE release notes.
- 1
For the Mirantis Container Runtime (MCR) release highlights, see MCR documentation: MCR release notes.
This section lists the components artifacts of the Cluster release 7.8.0.
Note
The components that are newly added, updated, deprecated, or removed
as compared to the previous release version, are marked
with a corresponding superscript,
for example, lcm-ansible Updated.
Artifact |
Component |
Path |
|---|---|---|
Helm chart |
ceph-controller Updated |
https://binary.mirantis.com/ceph/helm/ceph-operator-1.0.0-mcp-792.tgz |
Docker images |
ceph |
mirantis.azurecr.io/ceph/ceph:v15.2.13 |
ceph-controller Updated |
mirantis.azurecr.io/ceph/mcp/ceph-controller:v1.0.0-20220506180707 |
|
cephcsi |
mirantis.azurecr.io/ceph/cephcsi/cephcsi:v3.4.0 |
|
csi-node-driver-registrar |
mirantis.azurecr.io/ceph/k8scsi/csi-node-driver-registrar:v2.1.0 |
|
csi-provisioner |
mirantis.azurecr.io/ceph/k8scsi/csi-provisioner:v2.1.2 |
|
csi-snapshotter |
mirantis.azurecr.io/ceph/k8scsi/csi-snapshotter:v4.0.0 |
|
csi-attacher |
mirantis.azurecr.io/ceph/k8scsi/csi-attacher:v3.1.0 |
|
csi-resizer |
mirantis.azurecr.io/ceph/k8scsi/csi-resizer:v1.1.0 |
|
rook |
mirantis.azurecr.io/ceph/rook:v1.0.0-20220504194120 |
Artifact |
Component |
Path |
|---|---|---|
Binaries Updated |
lcm-ansible |
https://binary.mirantis.com/lcm/bin/lcm-ansible/v0.16.0-13-gcac49ca/lcm-ansible.tar.gz |
lcm-agent |
https://binary.mirantis.com/lcm/bin/lcm-agent/v0.3.0-239-gae7218ea/lcm-agent |
|
Helm charts Updated |
managed-lcm-api |
https://binary.mirantis.com/core/helm/managed-lcm-api-1.31.9.tgz |
metallb |
||
metrics-server |
https://binary.mirantis.com/core/helm/metrics-server-1.31.9.tgz |
|
Docker images |
helm |
mirantis.azurecr.io/lcm/helm/tiller:v2.16.11-40 |
helm-controller Updated |
mirantis.azurecr.io/lcm/lcm-controller:v0.3.0-239-gae7218ea |
|
metallb-controller |
mirantis.azurecr.io/lcm/metallb/controller:v0.9.3-1 |
|
metallb-speaker |
mirantis.azurecr.io/lcm/metallb/speaker:v0.9.3-1 |
|
metrics-server |
mirantis.azurecr.io/lcm/metrics-server-amd64:v0.5.2 |
Artifact |
Component |
Path |
|---|---|---|
Helm charts |
alerta |
https://binary.mirantis.com/stacklight/helm/alerta-0.1.0-mcp-25.tgz |
alertmanager-webhook-servicenow Updated |
https://binary.mirantis.com/stacklight/helm/alertmanager-webhook-servicenow-0.2.0-mcp-3.tgz |
|
cerebro |
https://binary.mirantis.com/stacklight/helm/cerebro-0.1.0-mcp-2.tgz |
|
elasticsearch Removed |
n/a |
|
elasticsearch-curator Updated |
https://binary.mirantis.com/stacklight/helm/elasticsearch-curator-1.5.0-mcp-9.tgz |
|
elasticsearch-exporter |
https://binary.mirantis.com/stacklight/helm/elasticsearch-exporter-1.2.0-mcp-6.tgz |
|
fluentd Updated |
https://binary.mirantis.com/stacklight/helm/fluentd-2.0.3-mcp-37.tgz |
|
fluentd-elasticsearch Removed |
n/a |
|
fluentd-logs New |
https://binary.mirantis.com/stacklight/helm/fluentd-elasticsearch-3.0.0-mcp-128.tgz |
|
grafana Updated |
https://binary.mirantis.com/stacklight/helm/grafana-3.3.10-mcp-145.tgz |
|
iam-proxy |
||
kibana Removed |
n/a |
|
metric-collector Updated |
https://binary.mirantis.com/stacklight/helm/metric-collector-0.3.0-mcp-6.tgz |
|
metricbeat |
https://binary.mirantis.com/stacklight/helm/metricbeat-1.7.1-mcp-16.tgz |
|
opensearch New |
https://binary.mirantis.com/stacklight/helm/opensearch-0.1.0-mcp-50.tgz |
|
opensearch-dashboards New |
https://binary.mirantis.com/stacklight/helm/opensearch-dashboards-0.1.0-mcp-40.tgz |
|
patroni |
https://binary.mirantis.com/stacklight/helm/patroni-0.15.1-mcp-42.tgz |
|
prometheus Updated |
https://binary.mirantis.com/stacklight/helm/prometheus-8.11.4-mcp-225.tgz |
|
prometheus-blackbox-exporter |
https://binary.mirantis.com/stacklight/helm/prometheus-blackbox-exporter-0.3.0-mcp-11.tgz |
|
prometheus-es-exporter |
https://binary.mirantis.com/stacklight/helm/prometheus-es-exporter-1.0.0-mcp-11.tgz |
|
prometheus-msteams Updated |
https://binary.mirantis.com/stacklight/helm/prometheus-msteams-0.1.0-mcp-8.tgz |
|
prometheus-nginx-exporter |
https://binary.mirantis.com/stacklight/helm/prometheus-nginx-exporter-0.2.0-mcp-1.tgz |
|
sf-notifier Updated |
https://binary.mirantis.com/stacklight/helm/sf-notifier-0.2.0-mcp-2.tgz |
|
sf-reporter Updated |
https://binary.mirantis.com/stacklight/helm/sf-reporter-0.2.0-mcp-3.tgz |
|
stacklight Updated |
https://binary.mirantis.com/stacklight/helm/stacklight-0.6.1.tgz |
|
telegraf-ds |
https://binary.mirantis.com/stacklight/helm/telegraf-ds-1.1.5-mcp-29.tgz |
|
telegraf-s |
https://binary.mirantis.com/stacklight/helm/telegraf-s-1.1.5-mcp-30.tgz |
|
telemeter-server Updated |
https://binary.mirantis.com/stacklight/helm/telemeter-server-0.2.0-mcp-5.tgz |
|
telemeter-client Updated |
https://binary.mirantis.com/stacklight/helm/telemeter-client-0.2.0-mcp-5.tgz |
|
Docker images |
alerta |
mirantis.azurecr.io/stacklight/alerta-web:8.5.0-20211108051042 |
alertmanager |
mirantis.azurecr.io/stacklight/alertmanager:v0.23.0 |
|
alertmanager-webhook-servicenow Updated |
mirantis.azurecr.io/stacklight/alertmanager-webhook-servicenow:v0.1-20220420161450 |
|
busybox |
mirantis.azurecr.io/stacklight/busybox:1.30 |
|
cerebro |
mirantis.azurecr.io/stacklight/cerebro:0.9.3 |
|
configmap-reload |
mirantis.azurecr.io/stacklight/configmap-reload:v0.3.0 |
|
curl |
mirantis.azurecr.io/stacklight/curl:7.69.0 |
|
curl-jq |
mirantis.azurecr.io/stacklight/curl-jq:1.5-1 |
|
elasticsearch-curator |
mirantis.azurecr.io/stacklight/curator:5.7.6 |
|
elasticsearch-exporter |
mirantis.azurecr.io/stacklight/elasticsearch_exporter:1.0.2 |
|
fluentd |
mirantis.azurecr.io/stacklight/fluentd:1.14-20220111114545 |
|
grafana Updated |
mirantis.azurecr.io/stacklight/grafana:8.5.0 |
|
grafana-image-renderer |
mirantis.azurecr.io/stacklight/grafana-image-renderer:3.2.1 |
|
kubectl |
mirantis.azurecr.io/stacklight/kubectl:1.19.13 |
|
k8s-sidecar Updated |
mirantis.azurecr.io/stacklight/k8s-sidecar:1.15.9 |
|
kube-state-metrics |
mirantis.azurecr.io/stacklight/kube-state-metrics:v2.2.4 |
|
metric-collector |
mirantis.azurecr.io/stacklight/metric-collector:v0.1-20220209123106 |
|
metricbeat |
mirantis.azurecr.io/stacklight/metricbeat:7.10.2-20220309185937 |
|
node-exporter |
mirantis.azurecr.io/stacklight/node-exporter:v1.2.2 |
|
opensearch |
mirantis.azurecr.io/stacklight/opensearch:1-20220316161927 |
|
opensearch-dashboards |
mirantis.azurecr.io/stacklight/opensearch-dashboards:1-20220316161951 |
|
origin-telemeter |
mirantis.azurecr.io/stacklight/origin-telemeter:4.4.0-20200424 |
|
prometheus |
mirantis.azurecr.io/stacklight/prometheus:v2.31.1 |
|
prometheus-blackbox-exporter |
mirantis.azurecr.io/stacklight/blackbox-exporter:v0.19.0 |
|
prometheus-es-exporter |
mirantis.azurecr.io/stacklight/prometheus-es-exporter:v0.14.0-20220111114356 |
|
prometheus-msteams |
mirantis.azurecr.io/stacklight/prometheus-msteams:v1.4.2 |
|
prometheus-nginx-exporter |
mirantis.azurecr.io/stacklight/nginx-prometheus-exporter:0.6.0 |
|
prometheus-patroni-exporter |
mirantis.azurecr.io/stacklight/prometheus-patroni-exporter:v0.1-20210708141736 |
|
prometheus-postgres-exporter |
mirantis.azurecr.io/stacklight/prometheus-postgres-exporter:v0.9.0 |
|
prometheus-relay |
mirantis.azurecr.io/stacklight/prometheus-relay:v0.3-20210317133316 |
|
sf-notifier |
mirantis.azurecr.io/stacklight/sf-notifier:v0.3-20210930112115 |
|
sf-reporter Updated |
mirantis.azurecr.io/stacklight/sf-reporter:v0.1-20220419092138 |
|
spilo |
mirantis.azurecr.io/stacklight/spilo:13-2.1p1-20220225091552 |
|
telegraf |
mirantis.azurecr.io/stacklight/telegraf:v1.9.1-20210225152050 |
|
mirantis.azurecr.io/stacklight/telegraf:1.20.2-20220204122426 |
||
telemeter-token-auth |
mirantis.azurecr.io/stacklight/telemeter-token-auth:v0.1-20200406175600 |
|
yq |
mirantis.azurecr.io/stacklight/yq:v4.2.0 |
Artifact |
Component |
Path |
|---|---|---|
Debian repositories |
System packages |
|
http://mirror.mirantis.com/kaas/kubernetes-extra-rhel7-0.0.5/ |
||
https://mirror.mirantis.com/kaas/ubuntu-2022-05-03-013543.target.txt |
||
MCR repositories |
MCR |
https://repos.mirantis.com/ubuntu/dists/bionic/pool/stable-20.10/ |
This section outlines release notes for the Cluster release 7.7.0 that is introduced in the Mirantis Container Cloud release 2.17.0.
This Cluster release supports Mirantis Kubernetes Engine 3.4.7 with Kubernetes 1.20 and Mirantis Container Runtime 20.10.8.
For the list of known and resolved issues, refer to the Container Cloud release 2.17.0 section.
This section outlines new features implemented in the Cluster release 7.7.0 that is introduced in the Container Cloud release 2.17.0.
Implemented the capability to configure the Elasticsearch retention time per logs, events, and notifications indices when creating a managed cluster through Container Cloud web UI.
The Retention Time parameter in the Container Cloud web UI is now replaced with the Logstash Retention Time, Events Retention Time, and Notifications Retention Time parameters.
Learn more
Implemented monitoring and added alerts for the Helm Controller
service and the HelmBundle custom resources.
Learn more
Implemented configurable timeouts for Ceph requests processing. The default is
set to 30 minutes. You can configure the timeout using the
pgRebalanceTimeoutMin parameter in the Ceph Helm chart.
Implemented the capability to configure the replicas count for
cephController, cephStatus, and cephRequest controllers using the
replicas parameter in the Ceph Helm chart. The default is set to 3
replicas.
Implemented a separate ceph-kcc-controller that runs on a management
cluster and manages the KaaSCephCluster custom resource (CR). Previously,
the KaaSCephCluster CR was managed by bm-provider.
Learn more
The following table lists the components versions of the Cluster release 7.7.0.
Note
The components that are newly added, updated, deprecated, or removed
as compared to the previous release version, are marked
with a corresponding superscript,
for example, lcm-ansible Updated.
Component |
Application/Service |
Version |
|---|---|---|
Cluster orchestration |
Mirantis Kubernetes Engine Updated |
3.4.7 0 |
Container runtime |
Mirantis Container Runtime Updated |
20.10.8 1 |
Distributed storage |
Ceph |
15.2.13 (Octopus) |
Rook Updated |
1.0.0-20220504194120 |
|
LCM |
Helm |
2.16.11-40 |
helm-controller Updated |
0.3.0-229-g4774bbbb |
|
lcm-ansible Updated |
0.15.0-24-gf023ea1 |
|
lcm-agent Updated |
0.3.0-229-g4774bbbb |
|
metallb-controller |
0.9.3-1 |
|
metrics-server |
0.5.2 |
|
StackLight |
Alerta |
8.5.0-20211108051042 |
Alertmanager |
0.23.0 |
|
Alertmanager Webhook ServiceNow |
0.1-20210601141858 |
|
Cerebro |
0.9.3 |
|
Elasticsearch Curator |
5.7.6 |
|
Elasticsearch Exporter |
1.0.2 |
|
Fluentd |
1.14-20220111114545 |
|
Grafana |
8.2.7 |
|
Grafana Image Renderer |
3.2.1 |
|
IAM Proxy |
6.0.1 |
|
Metric Collector |
0.1-20220209123106 |
|
Metricbeat Updated |
7.10.2-20220309185937 |
|
OpenSearch Updated |
1-20220316161927 |
|
OpenSearch Dashboards Updated |
1-20220316161951 |
|
Patroni Updated |
13-2.1p1-20220225091552 |
|
Prometheus |
2.31.1 |
|
Prometheus Blackbox Exporter |
0.19.0 |
|
Prometheus ES Exporter |
0.14.0-20220111114356 |
|
Prometheus MS Teams |
1.4.2 |
|
Prometheus Node Exporter |
1.2.2 |
|
Prometheus NGINX Exporter |
0.6.0 |
|
Prometheus Patroni Exporter |
0.1-20210708141736 |
|
Prometheus Postgres Exporter |
0.9.0 |
|
Prometheus Relay |
0.3-20210317133316 |
|
sf-notifier |
0.3-20210930112115 |
|
sf-reporter |
0.1-20210607111404 |
|
Telegraf |
1.9.1-20210225142050 |
|
Updated |
1.20.2-20220204122426 |
|
Telemeter |
4.4.0-20200424 |
- 0
For the Mirantis Kubernetes Engine (MKE) release highlights and components versions, see MKE documentation: MKE release notes.
- 1
For the Mirantis Container Runtime (MCR) release highlights, see MCR documentation: MCR release notes.
This section lists the components artifacts of the Cluster release 7.7.0.
Note
The components that are newly added, updated, deprecated, or removed
as compared to the previous release version, are marked
with a corresponding superscript,
for example, lcm-ansible Updated.
Artifact |
Component |
Path |
|---|---|---|
Helm chart |
ceph-controller Updated |
https://binary.mirantis.com/ceph/helm/ceph-operator-1.0.0-mcp-719.tgz |
Docker images |
ceph |
mirantis.azurecr.io/ceph/ceph:v15.2.13 |
ceph-controller Updated |
mirantis.azurecr.io/ceph/mcp/ceph-controller:v1.0.0-20220421152918 |
|
cephcsi |
mirantis.azurecr.io/ceph/cephcsi/cephcsi:v3.4.0 |
|
csi-node-driver-registrar |
mirantis.azurecr.io/ceph/k8scsi/csi-node-driver-registrar:v2.1.0 |
|
csi-provisioner |
mirantis.azurecr.io/ceph/k8scsi/csi-provisioner:v2.1.2 |
|
csi-snapshotter |
mirantis.azurecr.io/ceph/k8scsi/csi-snapshotter:v4.0.0 |
|
csi-attacher |
mirantis.azurecr.io/ceph/k8scsi/csi-attacher:v3.1.0 |
|
csi-resizer |
mirantis.azurecr.io/ceph/k8scsi/csi-resizer:v1.1.0 |
|
rook Updated |
mirantis.azurecr.io/ceph/rook:v1.0.0-20220504194120 |
Artifact |
Component |
Path |
|---|---|---|
Binaries Updated |
lcm-ansible |
https://binary.mirantis.com/lcm/bin/lcm-ansible/v0.15.0-24-gf023ea1/lcm-ansible.tar.gz |
lcm-agent |
https://binary.mirantis.com/lcm/bin/lcm-agent/v0.3.0-229-g4774bbbb/lcm-agent |
|
Helm charts Updated |
managed-lcm-api |
https://binary.mirantis.com/core/helm/managed-lcm-api-1.30.6.tgz |
metallb |
||
metrics-server |
https://binary.mirantis.com/core/helm/metrics-server-1.30.6.tgz |
|
Docker images |
helm |
mirantis.azurecr.io/lcm/helm/tiller:v2.16.11-40 |
helm-controller Updated |
mirantis.azurecr.io/lcm/lcm-controller:v0.3.0-229-g4774bbbb |
|
metallb-controller |
mirantis.azurecr.io/lcm/metallb/controller:v0.9.3-1 |
|
metallb-speaker |
mirantis.azurecr.io/lcm/metallb/speaker:v0.9.3-1 |
|
metrics-server |
mirantis.azurecr.io/lcm/metrics-server-amd64:v0.5.2 |
Artifact |
Component |
Path |
|---|---|---|
Helm charts |
alerta |
https://binary.mirantis.com/stacklight/helm/alerta-0.1.0-mcp-25.tgz |
alertmanager-webhook-servicenow |
https://binary.mirantis.com/stacklight/helm/alertmanager-webhook-servicenow-0.2.0-mcp-1.tgz |
|
cerebro |
https://binary.mirantis.com/stacklight/helm/cerebro-0.1.0-mcp-2.tgz |
|
elasticsearch Updated |
https://binary.mirantis.com/stacklight/helm/elasticsearch-7.1.1-mcp-45.tgz |
|
elasticsearch-curator Updated |
https://binary.mirantis.com/stacklight/helm/elasticsearch-curator-1.5.0-mcp-8.tgz |
|
elasticsearch-exporter Updated |
https://binary.mirantis.com/stacklight/helm/elasticsearch-exporter-1.2.0-mcp-6.tgz |
|
fluentd |
https://binary.mirantis.com/stacklight/helm/fluentd-2.0.3-mcp-36.tgz |
|
fluentd-elasticsearch Updated |
https://binary.mirantis.com/stacklight/helm/fluentd-elasticsearch-3.0.0-mcp-123.tgz |
|
grafana Updated |
https://binary.mirantis.com/stacklight/helm/grafana-3.3.10-mcp-130.tgz |
|
iam-proxy |
||
kibana |
https://binary.mirantis.com/stacklight/helm/kibana-3.2.1-mcp-36.tgz |
|
metric-collector |
https://binary.mirantis.com/stacklight/helm/metric-collector-0.3.0-mcp-4.tgz |
|
metricbeat |
https://binary.mirantis.com/stacklight/helm/metricbeat-1.7.1-mcp-16.tgz |
|
patroni Updated |
https://binary.mirantis.com/stacklight/helm/patroni-0.15.1-mcp-42.tgz |
|
prometheus |
https://binary.mirantis.com/stacklight/helm/prometheus-8.11.4-mcp-218.tgz |
|
prometheus-blackbox-exporter |
https://binary.mirantis.com/stacklight/helm/prometheus-blackbox-exporter-0.3.0-mcp-11.tgz |
|
prometheus-es-exporter |
https://binary.mirantis.com/stacklight/helm/prometheus-es-exporter-1.0.0-mcp-11.tgz |
|
prometheus-msteams |
https://binary.mirantis.com/stacklight/helm/prometheus-msteams-0.1.0-mcp-2.tgz |
|
prometheus-nginx-exporter |
https://binary.mirantis.com/stacklight/helm/prometheus-nginx-exporter-0.2.0-mcp-1.tgz |
|
sf-notifier |
https://binary.mirantis.com/stacklight/helm/sf-notifier-0.2.0-mcp-1.tgz |
|
sf-reporter |
https://binary.mirantis.com/stacklight/helm/sf-reporter-0.2.0-mcp-1.tgz |
|
stacklight Updated |
https://binary.mirantis.com/stacklight/helm/stacklight-0.5.3.tgz |
|
telegraf-ds |
https://binary.mirantis.com/stacklight/helm/telegraf-ds-1.1.5-mcp-29.tgz |
|
telegraf-s |
https://binary.mirantis.com/stacklight/helm/telegraf-s-1.1.5-mcp-30.tgz |
|
telemeter-server |
https://binary.mirantis.com/stacklight/helm/telemeter-server-0.2.0-mcp-4.tgz |
|
telemeter-client |
https://binary.mirantis.com/stacklight/helm/telemeter-client-0.2.0-mcp-4.tgz |
|
Docker images |
alerta |
mirantis.azurecr.io/stacklight/alerta-web:8.5.0-20211108051042 |
alertmanager |
mirantis.azurecr.io/stacklight/alertmanager:v0.23.0 |
|
alertmanager-webhook-servicenow |
mirantis.azurecr.io/stacklight/alertmanager-webhook-servicenow:v0.1-20210601141858 |
|
busybox |
mirantis.azurecr.io/stacklight/busybox:1.30 |
|
cerebro |
mirantis.azurecr.io/stacklight/cerebro:0.9.3 |
|
configmap-reload |
mirantis.azurecr.io/stacklight/configmap-reload:v0.3.0 |
|
curl |
mirantis.azurecr.io/stacklight/curl:7.69.0 |
|
curl-jq |
mirantis.azurecr.io/stacklight/curl-jq:1.5-1 |
|
elasticsearch-curator |
mirantis.azurecr.io/stacklight/curator:5.7.6 |
|
elasticsearch-exporter |
mirantis.azurecr.io/stacklight/elasticsearch_exporter:1.0.2 |
|
fluentd |
mirantis.azurecr.io/stacklight/fluentd:1.14-20220111114545 |
|
grafana |
mirantis.azurecr.io/stacklight/grafana:8.2.7 |
|
grafana-image-renderer |
mirantis.azurecr.io/stacklight/grafana-image-renderer:3.2.1 |
|
kubectl |
mirantis.azurecr.io/stacklight/kubectl:1.19.13 |
|
k8s-sidecar |
mirantis.azurecr.io/stacklight/k8s-sidecar:1.10.8 |
|
kube-state-metrics |
mirantis.azurecr.io/stacklight/kube-state-metrics:v2.2.4 |
|
metric-collector |
mirantis.azurecr.io/stacklight/metric-collector:v0.1-20220209123106 |
|
metricbeat Updated |
mirantis.azurecr.io/stacklight/metricbeat:7.10.2-20220309185937 |
|
node-exporter |
mirantis.azurecr.io/stacklight/node-exporter:v1.2.2 |
|
opensearch Updated |
mirantis.azurecr.io/stacklight/opensearch:1-20220316161927 |
|
opensearch-dashboards Updated |
mirantis.azurecr.io/stacklight/opensearch-dashboards:1-20220316161951 |
|
origin-telemeter |
mirantis.azurecr.io/stacklight/origin-telemeter:4.4.0-20200424 |
|
prometheus |
mirantis.azurecr.io/stacklight/prometheus:v2.31.1 |
|
prometheus-blackbox-exporter |
mirantis.azurecr.io/stacklight/blackbox-exporter:v0.19.0 |
|
prometheus-es-exporter |
mirantis.azurecr.io/stacklight/prometheus-es-exporter:v0.14.0-20220111114356 |
|
prometheus-msteams |
mirantis.azurecr.io/stacklight/prometheus-msteams:v1.4.2 |
|
prometheus-nginx-exporter |
mirantis.azurecr.io/stacklight/nginx-prometheus-exporter:0.6.0 |
|
prometheus-patroni-exporter |
mirantis.azurecr.io/stacklight/prometheus-patroni-exporter:v0.1-20210708141736 |
|
prometheus-postgres-exporter |
mirantis.azurecr.io/stacklight/prometheus-postgres-exporter:v0.9.0 |
|
prometheus-relay |
mirantis.azurecr.io/stacklight/prometheus-relay:v0.3-20210317133316 |
|
sf-notifier |
mirantis.azurecr.io/stacklight/sf-notifier:v0.3-20210930112115 |
|
sf-reporter |
mirantis.azurecr.io/stacklight/sf-reporter:v0.1-20210607111404 |
|
spilo Updated |
mirantis.azurecr.io/stacklight/spilo:13-2.1p1-20220225091552 |
|
telegraf |
mirantis.azurecr.io/stacklight/telegraf:v1.9.1-20210225152050 |
|
Updated |
mirantis.azurecr.io/stacklight/telegraf:1.20.2-20220204122426 |
|
telemeter-token-auth |
mirantis.azurecr.io/stacklight/telemeter-token-auth:v0.1-20200406175600 |
|
yq |
mirantis.azurecr.io/stacklight/yq:v4.2.0 |
Artifact |
Component |
Path |
|---|---|---|
Debian repositories |
System packages |
|
http://mirror.mirantis.com/kaas/kubernetes-extra-rhel7-0.0.5/ |
||
https://mirror.mirantis.com/kaas/ubuntu-2021-11-11-014639.target.txt |
||
MCR repositories |
MCR |
https://repos.mirantis.com/ubuntu/dists/bionic/pool/stable-20.10/ |
This section outlines release notes for the Cluster release 7.6.0 that is introduced in the Mirantis Container Cloud release 2.16.0.
This Cluster release supports Mirantis Kubernetes Engine 3.4.7 with Kubernetes 1.20 and Mirantis Container Runtime 20.10.8.
For the list of known and resolved issues, refer to the Container Cloud release 2.16.0 section.
This section outlines new features implemented in the Cluster release 7.6.0 that is introduced in the Container Cloud release 2.16.0.
Updated the Mirantis Kubernetes Engine (MKE) major version from 3.4.6 to 3.4.7 for the Container Cloud management, regional, and managed clusters. Also, added support for attachment of existing MKE 3.4.7 clusters.
Learn more
Added the KubePodsRegularLongTermRestarts alert that raises in case of a
long-term periodic restart of containers.
Implemented the capability to configure the Elasticsearch retention time per
index using the elasticsearch.retentionTime parameter in the StackLight
Helm chart. Now, you can configure different retention periods for different
indices: logs, events, and notifications.
The elasticsearch.logstashRetentionTime parameter is now deprecated.
Implemented the capability to configure Prometheus Blackbox Exporter, including
customModules and timeoutOffset, through the StackLight Helm chart.
Implemented the capability to define custom Prometheus scrape configurations.
Due to licensing changes for Elasticsearch, Mirantis Container Cloud has switched from using Elasticsearch to OpenSearch and Kibana has switched to OpenSearch Dashboards. OpenSearch is a fork of Elasticsearch under the open-source Apache License with development led by Amazon Web Services.
For new deployments with the logging stack enabled, OpenSearch is now deployed by default. For existing deployments, migration to OpenSearch is performed automatically during clusters update. However, the entire Elasticsearch cluster may go down for up to 15 minutes.
Learn more
The following table lists the components versions of the Cluster release 7.6.0.
Note
The components that are newly added, updated, deprecated, or removed
as compared to the previous release version, are marked
with a corresponding superscript,
for example, lcm-ansible Updated.
Component |
Application/Service |
Version |
|---|---|---|
Cluster orchestration |
Mirantis Kubernetes Engine Updated |
3.4.7 0 |
Container runtime |
Mirantis Container Runtime Updated |
20.10.8 1 |
Distributed storage |
Ceph |
15.2.13 (Octopus) |
Rook |
1.7.6 |
|
LCM |
Helm |
2.16.11-40 |
helm-controller Updated |
0.3.0-187-gba894556 |
|
lcm-ansible Updated |
0.14.0-14-geb6a51f |
|
lcm-agent Updated |
0.3.0-187-gba894556 |
|
metallb-controller |
0.9.3-1 |
|
metrics-server Updated |
0.5.2 |
|
StackLight |
Alerta |
8.5.0-20211108051042 |
Alertmanager |
0.23.0 |
|
Alertmanager Webhook ServiceNow |
0.1-20210601141858 |
|
Cerebro |
0.9.3 |
|
Elasticsearch Removed |
n/a |
|
Elasticsearch Curator |
5.7.6 |
|
Elasticsearch Exporter |
1.0.2 |
|
Fluentd Updated |
1.14-20220111114545 |
|
Grafana |
8.2.7 |
|
Grafana Image Renderer |
3.2.1 |
|
IAM Proxy |
6.0.1 |
|
Kibana Removed |
n/a |
|
Metric Collector Updated |
0.1-20220209123106 |
|
Metricbeat Updated |
7.10.2-20220111114624 |
|
OpenSearch New |
1.2-20220114131142 |
|
OpenSearch Dashboards New |
1.2-20220114131222 |
|
Patroni Updated |
13-2.1p1-20220131130853 |
|
Prometheus |
2.31.1 |
|
Prometheus Blackbox Exporter Updated |
0.19.0 |
|
Prometheus ES Exporter Updated |
0.14.0-20220111114356 |
|
Prometheus MS Teams |
1.4.2 |
|
Prometheus Node Exporter |
1.2.2 |
|
Prometheus NGINX Exporter |
0.6.0 |
|
Prometheus Patroni Exporter |
0.1-20210708141736 |
|
Prometheus Postgres Exporter |
0.9.0 |
|
Prometheus Relay |
0.3-20210317133316 |
|
sf-notifier |
0.3-20210930112115 |
|
sf-reporter |
0.1-20210607111404 |
|
Telegraf |
1.9.1-20210225142050 |
|
1.20.0-20210927090119 |
||
Telemeter |
4.4.0-20200424 |
- 0
For the Mirantis Kubernetes Engine (MKE) release highlights and components versions, see MKE documentation: MKE release notes.
- 1
For the Mirantis Container Runtime (MCR) release highlights, see MCR documentation: MCR release notes.
This section lists the components artifacts of the Cluster release 7.6.0.
Note
The components that are newly added, updated, deprecated, or removed
as compared to the previous release version, are marked
with a corresponding superscript,
for example, lcm-ansible Updated.
Artifact |
Component |
Path |
|---|---|---|
Helm chart |
ceph-controller Updated |
https://binary.mirantis.com/ceph/helm/ceph-operator-1.0.0-mcp-661.tgz |
Docker images |
ceph |
mirantis.azurecr.io/ceph/ceph:v15.2.13 |
ceph-controller Updated |
mirantis.azurecr.io/ceph/mcp/ceph-controller:v1.0.0-20220203124822 |
|
cephcsi |
mirantis.azurecr.io/ceph/cephcsi/cephcsi:v3.4.0 |
|
csi-node-driver-registrar |
mirantis.azurecr.io/ceph/k8scsi/csi-node-driver-registrar:v2.1.0 |
|
csi-provisioner |
mirantis.azurecr.io/ceph/k8scsi/csi-provisioner:v2.1.2 |
|
csi-snapshotter |
mirantis.azurecr.io/ceph/k8scsi/csi-snapshotter:v4.0.0 |
|
csi-attacher |
mirantis.azurecr.io/ceph/k8scsi/csi-attacher:v3.1.0 |
|
csi-resizer |
mirantis.azurecr.io/ceph/k8scsi/csi-resizer:v1.1.0 |
|
rook |
mirantis.azurecr.io/ceph/rook/ceph:v1.7.6 |
Artifact |
Component |
Path |
|---|---|---|
Binaries Updated |
lcm-ansible |
https://binary.mirantis.com/lcm/bin/lcm-ansible/v0.14.0-14-geb6a51f/lcm-ansible.tar.gz |
lcm-agent |
https://binary.mirantis.com/lcm/bin/lcm-agent/v0.3.0-187-gba894556/lcm-agent |
|
Helm charts Updated |
managed-lcm-api |
https://binary.mirantis.com/core/helm/managed-lcm-api-1.29.6.tgz |
metallb |
||
metrics-server |
https://binary.mirantis.com/core/helm/metrics-server-1.29.6.tgz |
|
Docker images |
helm |
mirantis.azurecr.io/lcm/helm/tiller:v2.16.11-40 |
helm-controller Updated |
mirantis.azurecr.io/lcm/lcm-controller:v0.3.0-187-gba894556 |
|
metallb-controller |
mirantis.azurecr.io/lcm/metallb/controller:v0.9.3-1 |
|
metallb-speaker |
mirantis.azurecr.io/lcm/metallb/speaker:v0.9.3-1 |
|
metrics-server Updated |
mirantis.azurecr.io/lcm/metrics-server-amd64:v0.5.2 |
Artifact |
Component |
Path |
|---|---|---|
Helm charts |
alerta |
https://binary.mirantis.com/stacklight/helm/alerta-0.1.0-mcp-25.tgz |
alertmanager-webhook-servicenow |
https://binary.mirantis.com/stacklight/helm/alertmanager-webhook-servicenow-0.2.0-mcp-1.tgz |
|
cerebro |
https://binary.mirantis.com/stacklight/helm/cerebro-0.1.0-mcp-2.tgz |
|
elasticsearch Updated |
https://binary.mirantis.com/stacklight/helm/elasticsearch-7.1.1-mcp-44.tgz |
|
elasticsearch-curator |
https://binary.mirantis.com/stacklight/helm/elasticsearch-curator-1.5.0-mcp-6.tgz |
|
elasticsearch-exporter |
https://binary.mirantis.com/stacklight/helm/elasticsearch-exporter-1.2.0-mcp-2.tgz |
|
fluentd Updated |
https://binary.mirantis.com/stacklight/helm/fluentd-2.0.3-mcp-36.tgz |
|
fluentd-elasticsearch Updated |
https://binary.mirantis.com/stacklight/helm/fluentd-elasticsearch-3.0.0-mcp-120.tgz |
|
grafana Updated |
https://binary.mirantis.com/stacklight/helm/grafana-3.3.10-mcp-125.tgz |
|
iam-proxy Updated |
||
kibana Updated |
https://binary.mirantis.com/stacklight/helm/kibana-3.2.1-mcp-36.tgz |
|
metric-collector Updated |
https://binary.mirantis.com/stacklight/helm/metric-collector-0.3.0-mcp-4.tgz |
|
metricbeat Updated |
https://binary.mirantis.com/stacklight/helm/metricbeat-1.7.1-mcp-16.tgz |
|
patroni Updated |
https://binary.mirantis.com/stacklight/helm/patroni-0.15.1-mcp-38.tgz |
|
prometheus Updated |
https://binary.mirantis.com/stacklight/helm/prometheus-8.11.4-mcp-218.tgz |
|
prometheus-blackbox-exporter Updated |
https://binary.mirantis.com/stacklight/helm/prometheus-blackbox-exporter-0.3.0-mcp-11.tgz |
|
prometheus-es-exporter |
https://binary.mirantis.com/stacklight/helm/prometheus-es-exporter-1.0.0-mcp-11.tgz |
|
prometheus-msteams |
https://binary.mirantis.com/stacklight/helm/prometheus-msteams-0.1.0-mcp-2.tgz |
|
prometheus-nginx-exporter |
https://binary.mirantis.com/stacklight/helm/prometheus-nginx-exporter-0.2.0-mcp-1.tgz |
|
sf-notifier |
https://binary.mirantis.com/stacklight/helm/sf-notifier-0.2.0-mcp-1.tgz |
|
sf-reporter |
https://binary.mirantis.com/stacklight/helm/sf-reporter-0.2.0-mcp-1.tgz |
|
stacklight Updated |
https://binary.mirantis.com/stacklight/helm/stacklight-0.4.3.tgz |
|
telegraf-ds |
https://binary.mirantis.com/stacklight/helm/telegraf-ds-1.1.5-mcp-29.tgz |
|
telegraf-s |
https://binary.mirantis.com/stacklight/helm/telegraf-s-1.1.5-mcp-30.tgz |
|
telemeter-server Updated |
https://binary.mirantis.com/stacklight/helm/telemeter-server-0.2.0-mcp-4.tgz |
|
telemeter-client Updated |
https://binary.mirantis.com/stacklight/helm/telemeter-client-0.2.0-mcp-4.tgz |
|
Docker images |
alerta |
mirantis.azurecr.io/stacklight/alerta-web:8.5.0-20211108051042 |
alertmanager |
mirantis.azurecr.io/stacklight/alertmanager:v0.23.0 |
|
alertmanager-webhook-servicenow |
mirantis.azurecr.io/stacklight/alertmanager-webhook-servicenow:v0.1-20210601141858 |
|
busybox |
mirantis.azurecr.io/stacklight/busybox:1.30 |
|
cerebro |
mirantis.azurecr.io/stacklight/cerebro:0.9.3 |
|
configmap-reload |
mirantis.azurecr.io/stacklight/configmap-reload:v0.3.0 |
|
curl |
mirantis.azurecr.io/stacklight/curl:7.69.0 |
|
curl-jq |
mirantis.azurecr.io/stacklight/curl-jq:1.5-1 |
|
elasticsearch Removed |
n/a |
|
elasticsearch-curator |
mirantis.azurecr.io/stacklight/curator:5.7.6 |
|
elasticsearch-exporter |
mirantis.azurecr.io/stacklight/elasticsearch_exporter:1.0.2 |
|
fluentd Updated |
mirantis.azurecr.io/stacklight/fluentd:1.14-20220111114545 |
|
grafana |
mirantis.azurecr.io/stacklight/grafana:8.2.7 |
|
grafana-image-renderer |
mirantis.azurecr.io/stacklight/grafana-image-renderer:3.2.1 |
|
kubectl |
mirantis.azurecr.io/stacklight/kubectl:1.19.13 |
|
k8s-sidecar |
mirantis.azurecr.io/stacklight/k8s-sidecar:1.10.8 |
|
kibana Removed |
n/a |
|
kube-state-metrics |
mirantis.azurecr.io/stacklight/kube-state-metrics:v2.2.4 |
|
metric-collector Updated |
mirantis.azurecr.io/stacklight/metric-collector:v0.1-20220209123106 |
|
metricbeat Updated |
mirantis.azurecr.io/stacklight/metricbeat:7.10.2-20220111114624 |
|
node-exporter |
mirantis.azurecr.io/stacklight/node-exporter:v1.2.2 |
|
opensearch New |
mirantis.azurecr.io/stacklight/opensearch:1.2-20220114131142 |
|
opensearch-dashboards New |
mirantis.azurecr.io/stacklight/opensearch-dashboards:1.2-20220114131222 |
|
origin-telemeter |
mirantis.azurecr.io/stacklight/origin-telemeter:4.4.0-20200424 |
|
prometheus |
mirantis.azurecr.io/stacklight/prometheus:v2.31.1 |
|
prometheus-blackbox-exporter Updated |
mirantis.azurecr.io/stacklight/blackbox-exporter:v0.19.0 |
|
prometheus-es-exporter Updated |
mirantis.azurecr.io/stacklight/prometheus-es-exporter:v0.14.0-20220111114356 |
|
prometheus-msteams |
mirantis.azurecr.io/stacklight/prometheus-msteams:v1.4.2 |
|
prometheus-nginx-exporter |
mirantis.azurecr.io/stacklight/nginx-prometheus-exporter:0.6.0 |
|
prometheus-patroni-exporter |
mirantis.azurecr.io/stacklight/prometheus-patroni-exporter:v0.1-20210708141736 |
|
prometheus-postgres-exporter |
mirantis.azurecr.io/stacklight/prometheus-postgres-exporter:v0.9.0 |
|
prometheus-relay |
mirantis.azurecr.io/stacklight/prometheus-relay:v0.3-20210317133316 |
|
sf-notifier |
mirantis.azurecr.io/stacklight/sf-notifier:v0.3-20210930112115 |
|
sf-reporter |
mirantis.azurecr.io/stacklight/sf-reporter:v0.1-20210607111404 |
|
spilo Updated |
mirantis.azurecr.io/stacklight/spilo:13-2.1p1-20220131130853 |
|
telegraf |
mirantis.azurecr.io/stacklight/telegraf:v1.9.1-20210225152050 |
|
mirantis.azurecr.io/stacklight/telegraf:1.20.0-20210927090119 |
||
telemeter-token-auth |
mirantis.azurecr.io/stacklight/telemeter-token-auth:v0.1-20200406175600 |
|
yq |
mirantis.azurecr.io/stacklight/yq:v4.2.0 |
Artifact |
Component |
Path |
|---|---|---|
Debian repositories |
System packages |
|
http://mirror.mirantis.com/kaas/kubernetes-extra-rhel7-0.0.5/ |
||
https://mirror.mirantis.com/kaas/ubuntu-2021-11-11-014639.target.txt |
||
MCR repositories |
MCR |
https://repos.mirantis.com/ubuntu/dists/bionic/pool/stable-20.10/ |
This section outlines release notes for the Cluster release 7.5.0 that is introduced in the Mirantis Container Cloud release 2.15.0.
This Cluster release supports Mirantis Kubernetes Engine 3.4.6 with Kubernetes 1.20 and Mirantis Container Runtime 20.10.8.
For the list of known and resolved issues, refer to the Container Cloud release 2.15.0 section.
This section outlines new features implemented in the Cluster release 7.5.0 that is introduced in the Container Cloud release 2.15.0.
Updated the Mirantis Container Runtime (MCR) version from 20.10.6 to 20.10.8 for the Container Cloud management, regional, and managed clusters on all supported cloud providers.
Learn more
Implemented the MCCLicenseExpirationCritical and
MCCLicenseExpirationMajor alerts that notify about Mirantis Container Cloud
license expiration in less than 10 and 30 days.
Learn more
Implemented the following improvements to StackLight alerting:
Enhanced Kubernetes applications alerting:
Reworked the Kubernetes applications alerts to minimize flapping, avoid firing during pod rescheduling, and to detect crash looping for pods that restart less frequently.
Added the
KubeDeploymentOutage,KubeStatefulSetOutage, andKubeDaemonSetOutagealerts.Removed the redundant
KubeJobCompletionalert.Enhanced the alert inhibition rules to reduce alert flooding.
Improved alert descriptions.
Split
TelemeterClientFederationFailedintoTelemeterClientFailedandTelemeterClientHAFailedto separate alerts depending on the HA mode disabled or enabled.Updated the description for
DockerSwarmNodeFlapping.
Learn more
Disabled unused Node Exporter collectors and implemented the capability to
manually enable needed collectors using the
nodeExporter.extraCollectorsEnabled parameter. Only the following
collectors are now enabled by default in StackLight:
|
|
|
|
Learn more
Implemented full support for automated Ceph LCM operations using the
KaaSCephOperationRequest CR, such as addition or removal of Ceph OSDs and
nodes, as well as replacement of failed Ceph OSDs or nodes.
Learn more
Implemented the capability to specify Container Storage Interface (CSI)
provisioner tolerations and node affinity for different Rook resources.
Added support for the all and mds keys in toleration rules.
Extended the fullClusterInfo section of the KaaSCephCluster.status
resource with the following fields:
cephDetails- contains verbose details of a Ceph cluster statecephCSIPluginDaemonsStatus- contains details on all Ceph CSIs
Learn more
The following table lists the components versions of the Cluster release 7.5.0.
Note
The components that are newly added, updated, deprecated, or removed
as compared to the previous release version, are marked
with a corresponding superscript,
for example, lcm-ansible Updated.
Component |
Application/Service |
Version |
|---|---|---|
Cluster orchestration |
Mirantis Kubernetes Engine |
3.4.6 0 |
Container runtime |
Mirantis Container Runtime Updated |
20.10.8 1 |
Distributed storage |
Ceph |
15.2.13 (Octopus) |
Rook |
1.7.6 |
|
LCM |
Helm |
2.16.11-40 |
helm-controller Updated |
0.3.0-132-g83a348fa |
|
lcm-ansible Updated |
0.13.0-26-gad73ff7 |
|
lcm-agent Updated |
0.3.0-132-g83a348fa |
|
metallb-controller |
0.9.3-1 |
|
metrics-server |
0.3.6-1 |
|
StackLight |
Alerta |
8.5.0-20211108051042 |
Alertmanager Updated |
0.23.0 |
|
Alertmanager Webhook ServiceNow |
0.1-20210601141858 |
|
Cerebro |
0.9.3 |
|
Elasticsearch |
7.10.2-2021110210112 |
|
Elasticsearch Curator |
5.7.6 |
|
Elasticsearch Exporter |
1.0.2 |
|
Fluentd |
1.10.2-20210915110132 |
|
Grafana Updated |
8.2.7 |
|
Grafana Image Renderer |
3.2.1 |
|
IAM Proxy |
6.0.1 |
|
Kibana |
7.10.2-20211101074638 |
|
Metric Collector |
0.1-20211109121134 |
|
Metricbeat |
7.10.2-20211103140113 |
|
Patroni |
13-2.0p6-20210525081943 |
|
Prometheus Updated |
2.31.1 |
|
Prometheus Blackbox Exporter |
0.14.0 |
|
Prometheus ES Exporter |
0.14.0-20210812120726 |
|
Prometheus MS Teams |
1.4.2 |
|
Prometheus Node Exporter Updated |
1.2.2 |
|
Prometheus NGINX Exporter |
0.6.0 |
|
Prometheus Patroni Exporter |
0.1-20210708141736 |
|
Prometheus Postgres Exporter |
0.9.0 |
|
Prometheus Relay |
0.3-20210317133316 |
|
Pushgateway Removed |
n/a |
|
sf-notifier |
0.3-20210930112115 |
|
sf-reporter |
0.1-20210607111404 |
|
Telegraf |
1.9.1-20210225142050 |
|
1.20.0-20210927090119 |
||
Telemeter |
4.4.0-20200424 |
- 0
For the Mirantis Kubernetes Engine (MKE) release highlights and components versions, see MKE documentation: MKE release notes.
- 1
For the Mirantis Container Runtime (MCR) release highlights, see MCR documentation: MCR release notes.
This section lists the components artifacts of the Cluster release 7.5.0.
Note
The components that are newly added, updated, deprecated, or removed
as compared to the previous release version, are marked
with a corresponding superscript,
for example, lcm-ansible Updated.
Artifact |
Component |
Path |
|---|---|---|
Helm chart |
ceph-controller Updated |
https://binary.mirantis.com/ceph/helm/ceph-operator-1.0.0-mcp-606.tgz |
Docker images |
ceph |
mirantis.azurecr.io/ceph/ceph:v15.2.13 |
ceph-controller Updated |
mirantis.azurecr.io/ceph/mcp/ceph-controller:v1.0.0-20220110132813 |
|
cephcsi |
mirantis.azurecr.io/ceph/cephcsi/cephcsi:v3.4.0 |
|
csi-node-driver-registrar |
mirantis.azurecr.io/ceph/k8scsi/csi-node-driver-registrar:v2.1.0 |
|
csi-provisioner |
mirantis.azurecr.io/ceph/k8scsi/csi-provisioner:v2.1.2 |
|
csi-snapshotter |
mirantis.azurecr.io/ceph/k8scsi/csi-snapshotter:v4.0.0 |
|
csi-attacher |
mirantis.azurecr.io/ceph/k8scsi/csi-attacher:v3.1.0 |
|
csi-resizer |
mirantis.azurecr.io/ceph/k8scsi/csi-resizer:v1.1.0 |
|
rook |
mirantis.azurecr.io/ceph/rook/ceph:v1.7.6 |
Artifact |
Component |
Path |
|---|---|---|
Binaries Updated |
lcm-ansible |
https://binary.mirantis.com/lcm/bin/lcm-ansible/v0.13.0-26-gad73ff7/lcm-ansible.tar.gz |
lcm-agent |
https://binary.mirantis.com/lcm/bin/lcm-agent/v0.3.0-132-g83a348fa/lcm-agent |
|
Helm charts Updated |
managed-lcm-api |
https://binary.mirantis.com/core/helm/managed-lcm-api-1.28.7.tgz |
metallb |
||
metrics-server |
https://binary.mirantis.com/core/helm/metrics-server-1.28.7.tgz |
|
Docker images |
helm |
mirantis.azurecr.io/lcm/helm/tiller:v2.16.11-40 |
helm-controller Updated |
mirantis.azurecr.io/lcm/lcm-controller:v0.3.0-132-g83a348fa |
|
metallb-controller |
mirantis.azurecr.io/lcm/metallb/controller:v0.9.3-1 |
|
metallb-speaker |
mirantis.azurecr.io/lcm/metallb/speaker:v0.9.3-1 |
|
metrics-server |
mirantis.azurecr.io/lcm/metrics-server-amd64/v0.3.6-1 |
Artifact |
Component |
Path |
|---|---|---|
Helm charts |
alerta Updated |
https://binary.mirantis.com/stacklight/helm/alerta-0.1.0-mcp-25.tgz |
alertmanager-webhook-servicenow |
https://binary.mirantis.com/stacklight/helm/alertmanager-webhook-servicenow-0.2.0-mcp-1.tgz |
|
cerebro |
https://binary.mirantis.com/stacklight/helm/cerebro-0.1.0-mcp-2.tgz |
|
elasticsearch |
https://binary.mirantis.com/stacklight/helm/elasticsearch-7.1.1-mcp-37.tgz |
|
elasticsearch-curator |
https://binary.mirantis.com/stacklight/helm/elasticsearch-curator-1.5.0-mcp-6.tgz |
|
elasticsearch-exporter |
https://binary.mirantis.com/stacklight/helm/elasticsearch-exporter-1.2.0-mcp-2.tgz |
|
fluentd |
https://binary.mirantis.com/stacklight/helm/fluentd-2.0.3-mcp-32.tgz |
|
fluentd-elasticsearch Updated |
https://binary.mirantis.com/stacklight/helm/fluentd-elasticsearch-3.0.0-mcp-115.tgz |
|
grafana Updated |
https://binary.mirantis.com/stacklight/helm/grafana-3.3.10-mcp-121.tgz |
|
iam-proxy Updated |
||
kibana |
https://binary.mirantis.com/stacklight/helm/kibana-3.2.1-mcp-30.tgz |
|
metric-collector Updated |
https://binary.mirantis.com/stacklight/helm/metric-collector-0.3.0-mcp-3.tgz |
|
metricbeat |
https://binary.mirantis.com/stacklight/helm/metricbeat-1.7.1-mcp-12.tgz |
|
patroni |
https://binary.mirantis.com/stacklight/helm/patroni-0.15.1-mcp-36.tgz |
|
prometheus Updated |
https://binary.mirantis.com/stacklight/helm/prometheus-8.11.4-mcp-214.tgz |
|
prometheus-blackbox-exporter |
https://binary.mirantis.com/stacklight/helm/prometheus-blackbox-exporter-0.3.0-mcp-7.tgz |
|
prometheus-es-exporter |
https://binary.mirantis.com/stacklight/helm/prometheus-es-exporter-1.0.0-mcp-11.tgz |
|
prometheus-msteams |
https://binary.mirantis.com/stacklight/helm/prometheus-msteams-0.1.0-mcp-2.tgz |
|
prometheus-nginx-exporter |
https://binary.mirantis.com/stacklight/helm/prometheus-nginx-exporter-0.2.0-mcp-1.tgz |
|
sf-notifier |
https://binary.mirantis.com/stacklight/helm/sf-notifier-0.2.0-mcp-1.tgz |
|
sf-reporter |
https://binary.mirantis.com/stacklight/helm/sf-reporter-0.2.0-mcp-1.tgz |
|
stacklight Updated |
https://binary.mirantis.com/stacklight/helm/stacklight-0.3.1.tgz |
|
telegraf-ds |
https://binary.mirantis.com/stacklight/helm/telegraf-ds-1.1.5-mcp-29.tgz |
|
telegraf-s |
https://binary.mirantis.com/stacklight/helm/telegraf-s-1.1.5-mcp-30.tgz |
|
telemeter-server |
https://binary.mirantis.com/stacklight/helm/telemeter-server-0.2.0-mcp-1.tgz |
|
telemeter-client |
https://binary.mirantis.com/stacklight/helm/telemeter-client-0.2.0-mcp-1.tgz |
|
Docker images |
alerta |
mirantis.azurecr.io/stacklight/alerta-web:8.5.0-20211108051042 |
alertmanager Updated |
mirantis.azurecr.io/stacklight/alertmanager:v0.23.0 |
|
alertmanager-webhook-servicenow |
mirantis.azurecr.io/stacklight/alertmanager-webhook-servicenow:v0.1-20210601141858 |
|
busybox |
mirantis.azurecr.io/stacklight/busybox:1.30 |
|
cerebro |
mirantis.azurecr.io/stacklight/cerebro:0.9.3 |
|
configmap-reload |
mirantis.azurecr.io/stacklight/configmap-reload:v0.3.0 |
|
curl |
mirantis.azurecr.io/stacklight/curl:7.69.0 |
|
curl-jq |
mirantis.azurecr.io/stacklight/curl-jq:1.5-1 |
|
elasticsearch |
mirantis.azurecr.io/stacklight/elasticsearch:7.10.2-20211102101126 |
|
elasticsearch-curator |
mirantis.azurecr.io/stacklight/curator:5.7.6 |
|
elasticsearch-exporter |
mirantis.azurecr.io/stacklight/elasticsearch_exporter:1.0.2 |
|
fluentd |
mirantis.azurecr.io/stacklight/fluentd:1.10.2-20210915110132 |
|
grafana Updated |
mirantis.azurecr.io/stacklight/grafana:8.2.7 |
|
grafana-image-renderer |
mirantis.azurecr.io/stacklight/grafana-image-renderer:3.2.1 |
|
kubectl |
mirantis.azurecr.io/stacklight/kubectl:1.19.13 |
|
k8s-sidecar |
mirantis.azurecr.io/stacklight/k8s-sidecar:1.10.8 |
|
kibana |
mirantis.azurecr.io/stacklight/kibana:7.10.2-20211101074638 |
|
kube-state-metrics Updated |
mirantis.azurecr.io/stacklight/kube-state-metrics:v2.2.4 |
|
metric-collector |
mirantis.azurecr.io/stacklight/metric-collector:v0.1-20211109121134 |
|
metricbeat |
mirantis.azurecr.io/stacklight/metricbeat:7.10.2-20211103140113 |
|
node-exporter Updated |
mirantis.azurecr.io/stacklight/node-exporter:v1.2.2 |
|
origin-telemeter |
mirantis.azurecr.io/stacklight/origin-telemeter:4.4.0-20200424 |
|
prometheus Updated |
mirantis.azurecr.io/stacklight/prometheus:v2.31.1 |
|
prometheus-blackbox-exporter |
mirantis.azurecr.io/stacklight/blackbox-exporter:v0.14.0 |
|
prometheus-es-exporter |
mirantis.azurecr.io/stacklight/prometheus-es-exporter:v0.14.0-20210812120726 |
|
prometheus-msteams |
mirantis.azurecr.io/stacklight/prometheus-msteams:v1.4.2 |
|
prometheus-nginx-exporter |
mirantis.azurecr.io/stacklight/nginx-prometheus-exporter:0.6.0 |
|
prometheus-patroni-exporter |
mirantis.azurecr.io/stacklight/prometheus-patroni-exporter:v0.1-20210708141736 |
|
prometheus-postgres-exporter |
mirantis.azurecr.io/stacklight/prometheus-postgres-exporter:v0.9.0 |
|
prometheus-relay |
mirantis.azurecr.io/stacklight/prometheus-relay:v0.3-20210317133316 |
|
pushgateway Removed |
n/a |
|
sf-notifier |
mirantis.azurecr.io/stacklight/sf-notifier:v0.3-20210930112115 |
|
sf-reporter |
mirantis.azurecr.io/stacklight/sf-reporter:v0.1-20210607111404 |
|
spilo |
mirantis.azurecr.io/stacklight/spilo:13-2.0p6-20210525081943 |
|
telegraf |
mirantis.azurecr.io/stacklight/telegraf:v1.9.1-20210225152050 |
|
mirantis.azurecr.io/stacklight/telegraf:1.20.0-20210927090119 |
||
telemeter-token-auth |
mirantis.azurecr.io/stacklight/telemeter-token-auth:v0.1-20200406175600 |
|
yq |
mirantis.azurecr.io/stacklight/yq:v4.2.0 |
Artifact |
Component |
Path |
|---|---|---|
Debian repositories |
System packages |
|
http://mirror.mirantis.com/kaas/kubernetes-extra-rhel7-0.0.5/ |
||
https://mirror.mirantis.com/kaas/ubuntu-2021-11-11-014639.target.txt |
||
MCR repositories |
MCR |
https://repos.mirantis.com/ubuntu/dists/bionic/pool/stable-20.10/ |
This section outlines release notes for the Cluster release 7.4.0 that is introduced in the Mirantis Container Cloud release 2.14.0.
This Cluster release supports Mirantis Kubernetes Engine 3.4.6 with Kubernetes 1.20 and Mirantis Container Runtime 20.10.6.
For the list of known and resolved issues, refer to the Container Cloud release 2.14.0 section.
This section outlines new features implemented in the Cluster release 7.4.0 that is introduced in the Container Cloud release 2.14.0.
Updated the Mirantis Kubernetes Engine version from 3.4.5 to 3.4.6 for the Container Cloud management, regional, and managed clusters. Also, added support for attachment of existing MKE 3.4.6 clusters.
Learn more
Limited the number of monitored network interfaces to prevent extended Prometheus RAM consumption in big clusters. By default, Prometheus Node Exporter now only collects information of a basic set of interfaces, both host and container. If required you can edit the list of excluded devices as needed.
Implemented the capability to define custom Prometheus recording rules through
the prometheusServer.customRecordingRules parameter in the StackLight Helm
chart. Overriding of existing recording rules is not supported.
Learn more
Implemented the capability to configure packet size for the syslog logging
output. If remote logging to syslog is enabled in StackLight, use the
logging.syslog.packetSize parameter in the StackLight Helm chart to
configure the packet size.
Implemented the capability to configure the Prometheus Relay client timeout and
response size limit through the prometheusRelay.clientTimeout and
prometheusRelay.responseLimitBytes parameters in the StackLight Helm chart.
Learn more
Implemented additional validation of networks specified in
spec.cephClusterSpec.network.publicNet and
spec.cephClusterSpec.network.clusterNet and prohibited the use of the
0.0.0.0/0 CIDR. Now, the bare metal provider automatically translates
the 0.0.0.0/0 network range to the default LCM IPAM subnet if it exists.
You can now also add corresponding labels for the bare metal IPAM subnets when configuring the Ceph cluster during the management cluster deployment.
Learn more
To improve debugging and log reading, separated Ceph Controller, Ceph Status Controller, and Ceph Request Controller, which used to run in one pod, into three different deployments.
Learn more
TechPreview
Implemented the KaaSCephOperationRequest CR that provides LCM operations
for Ceph OSDs and nodes by automatically creating separate
CephOsdRemoveRequest requests. It allows for automated removal of healthy
or non-healthy Ceph OSDs from a Ceph cluster.
Due to the Technology Preview status of the feature, Mirantis recommends following Remove Ceph OSD manually for Ceph OSDs removal.
The following table lists the components versions of the Cluster release 7.4.0.
Note
The components that are newly added, updated, deprecated, or removed
as compared to the previous release version, are marked
with a corresponding superscript,
for example, lcm-ansible Updated.
Component |
Application/Service |
Version |
|---|---|---|
Cluster orchestration |
Mirantis Kubernetes Engine Updated |
3.4.6 0 |
Container runtime |
Mirantis Container Runtime |
20.10.6 1 |
Distributed storage |
Ceph |
15.2.13 (Octopus) |
Rook Updated |
1.7.6 |
|
LCM |
Helm |
2.16.11-40 |
helm-controller Updated |
0.3.0-104-gb7f5e8d8 |
|
lcm-ansible Updated |
0.12.0-6-g5329efe |
|
lcm-agent Updated |
0.3.0-104-gb7f5e8d8 |
|
metallb-controller |
0.9.3-1 |
|
metrics-server |
0.3.6-1 |
|
StackLight |
Alerta Updated |
8.5.0-20211108051042 |
Alertmanager |
0.22.2 |
|
Alertmanager Webhook ServiceNow |
0.1-20210601141858 |
|
Cerebro |
0.9.3 |
|
Elasticsearch Updated |
7.10.2-2021110210112 |
|
Elasticsearch Curator |
5.7.6 |
|
Elasticsearch Exporter |
1.0.2 |
|
Fluentd |
1.10.2-20210915110132 |
|
Grafana Updated |
8.2.2 |
|
Grafana Image Renderer Updated |
3.2.1 |
|
IAM Proxy |
6.0.1 |
|
Kibana Updated |
7.10.2-20211101074638 |
|
Metric Collector Updated |
0.1-20211109121134 |
|
Metricbeat Updated |
7.10.2-20211103140113 |
|
Patroni |
13-2.0p6-20210525081943 |
|
Prometheus |
2.22.2 |
|
Prometheus Blackbox Exporter |
0.14.0 |
|
Prometheus ES Exporter |
0.14.0-20210812120726 |
|
Prometheus MS Teams |
1.4.2 |
|
Prometheus Node Exporter |
1.0.1 |
|
Prometheus NGINX Exporter |
0.6.0 |
|
Prometheus Patroni Exporter |
0.1-20210708141736 |
|
Prometheus Postgres Exporter |
0.9.0 |
|
Prometheus Relay |
0.3-20210317133316 |
|
Pushgateway |
1.2.0 |
|
sf-notifier |
0.3-20210930112115 |
|
sf-reporter |
0.1-20210607111404 |
|
Telegraf |
1.9.1-20210225142050 |
|
1.20.0-20210927090119 |
||
Telemeter |
4.4.0-20200424 |
- 0
For the Mirantis Kubernetes Engine (MKE) release highlights and components versions, see MKE documentation: MKE release notes.
- 1
For the Mirantis Container Runtime (MCR) release highlights, see MCR documentation: MCR release notes.
This section lists the components artifacts of the Cluster release 7.4.0.
Note
The components that are newly added, updated, deprecated, or removed
as compared to the previous release version, are marked
with a corresponding superscript,
for example, lcm-ansible Updated.
Artifact |
Component |
Path |
|---|---|---|
Helm chart |
ceph-controller Updated |
https://binary.mirantis.com/ceph/helm/ceph-operator-1.0.0-mcp-526.tgz |
Docker images |
ceph |
mirantis.azurecr.io/ceph/ceph:v15.2.13 |
ceph-controller Updated |
mirantis.azurecr.io/ceph/mcp/ceph-controller:v1.0.0-20211109132703 |
|
cephcsi Updated |
mirantis.azurecr.io/ceph/cephcsi/cephcsi:v3.4.0 |
|
csi-node-driver-registrar |
mirantis.azurecr.io/ceph/k8scsi/csi-node-driver-registrar:v2.1.0 |
|
csi-provisioner |
mirantis.azurecr.io/ceph/k8scsi/csi-provisioner:v2.1.2 |
|
csi-snapshotter |
mirantis.azurecr.io/ceph/k8scsi/csi-snapshotter:v4.0.0 |
|
csi-attacher |
mirantis.azurecr.io/ceph/k8scsi/csi-attacher:v3.1.0 |
|
csi-resizer |
mirantis.azurecr.io/ceph/k8scsi/csi-resizer:v1.1.0 |
|
rook Updated |
mirantis.azurecr.io/ceph/rook/ceph:v1.7.6 |
Artifact |
Component |
Path |
|---|---|---|
Binaries Updated |
lcm-ansible |
https://binary.mirantis.com/lcm/bin/lcm-ansible/v0.12.0-6-g5329efe/lcm-ansible.tar.gz |
lcm-agent Updated |
https://binary.mirantis.com/lcm/bin/lcm-agent/v0.3.0-104-gb7f5e8d8/lcm-agent |
|
Helm charts |
managed-lcm-api Updated |
https://binary.mirantis.com/core/helm/managed-lcm-api-1.27.6.tgz |
metallb Updated |
||
metrics-server |
https://binary.mirantis.com/core/helm/metrics-server-1.27.6.tgz |
|
Docker images |
helm |
mirantis.azurecr.io/lcm/helm/tiller:v2.16.11-40 |
helm-controller Updated |
mirantis.azurecr.io/lcm/lcm-controller:v0.3.0-104-gb7f5e8d8 |
|
metallb-controller |
mirantis.azurecr.io/lcm/metallb/controller:v0.9.3-1 |
|
metallb-speaker |
mirantis.azurecr.io/lcm/metallb/speaker:v0.9.3-1 |
|
metrics-server |
mirantis.azurecr.io/lcm/metrics-server-amd64/v0.3.6-1 |
Artifact |
Component |
Path |
|---|---|---|
Helm charts |
alerta |
https://binary.mirantis.com/stacklight/helm/alerta-0.1.0-mcp-22.tgz |
alertmanager-webhook-servicenow Updated |
https://binary.mirantis.com/stacklight/helm/alertmanager-webhook-servicenow-0.2.0-mcp-1.tgz |
|
cerebro |
https://binary.mirantis.com/stacklight/helm/cerebro-0.1.0-mcp-2.tgz |
|
elasticsearch |
https://binary.mirantis.com/stacklight/helm/elasticsearch-7.1.1-mcp-37.tgz |
|
elasticsearch-curator |
https://binary.mirantis.com/stacklight/helm/elasticsearch-curator-1.5.0-mcp-6.tgz |
|
elasticsearch-exporter |
https://binary.mirantis.com/stacklight/helm/elasticsearch-exporter-1.2.0-mcp-2.tgz |
|
fluentd |
https://binary.mirantis.com/stacklight/helm/fluentd-2.0.3-mcp-32.tgz |
|
fluentd-elasticsearch Updated |
https://binary.mirantis.com/stacklight/helm/fluentd-elasticsearch-3.0.0-mcp-112.tgz |
|
grafana Updated |
https://binary.mirantis.com/stacklight/helm/grafana-3.3.10-mcp-115.tgz |
|
iam-proxy |
||
kibana |
https://binary.mirantis.com/stacklight/helm/kibana-3.2.1-mcp-30.tgz |
|
metric-collector Updated |
https://binary.mirantis.com/stacklight/helm/metric-collector-0.3.0-mcp-1.tgz |
|
metricbeat |
https://binary.mirantis.com/stacklight/helm/metricbeat-1.7.1-mcp-12.tgz |
|
patroni Updated |
https://binary.mirantis.com/stacklight/helm/patroni-0.15.1-mcp-36.tgz |
|
prometheus Updated |
https://binary.mirantis.com/stacklight/helm/prometheus-8.11.4-mcp-208.tgz |
|
prometheus-blackbox-exporter |
https://binary.mirantis.com/stacklight/helm/prometheus-blackbox-exporter-0.3.0-mcp-7.tgz |
|
prometheus-es-exporter |
https://binary.mirantis.com/stacklight/helm/prometheus-es-exporter-1.0.0-mcp-11.tgz |
|
prometheus-msteams |
https://binary.mirantis.com/stacklight/helm/prometheus-msteams-0.1.0-mcp-2.tgz |
|
prometheus-nginx-exporter Updated |
https://binary.mirantis.com/stacklight/helm/prometheus-nginx-exporter-0.2.0-mcp-1.tgz |
|
sf-notifier Updated |
https://binary.mirantis.com/stacklight/helm/sf-notifier-0.2.0-mcp-1.tgz |
|
sf-reporter Updated |
https://binary.mirantis.com/stacklight/helm/sf-reporter-0.2.0-mcp-1.tgz |
|
stacklight Updated |
https://binary.mirantis.com/stacklight/helm/stacklight-0.2.5.tgz |
|
telegraf-ds |
https://binary.mirantis.com/stacklight/helm/telegraf-ds-1.1.5-mcp-29.tgz |
|
telegraf-s |
https://binary.mirantis.com/stacklight/helm/telegraf-s-1.1.5-mcp-30.tgz |
|
telemeter-server Updated |
https://binary.mirantis.com/stacklight/helm/telemeter-server-0.2.0-mcp-1.tgz |
|
telemeter-client Updated |
https://binary.mirantis.com/stacklight/helm/telemeter-client-0.2.0-mcp-1.tgz |
|
Docker images |
alerta Updated |
mirantis.azurecr.io/stacklight/alerta-web:8.5.0-20211108051042 |
alertmanager |
mirantis.azurecr.io/stacklight/alertmanager:v0.22.2 |
|
alertmanager-webhook-servicenow |
mirantis.azurecr.io/stacklight/alertmanager-webhook-servicenow:v0.1-20210601141858 |
|
busybox |
mirantis.azurecr.io/stacklight/busybox:1.30 |
|
cerebro |
mirantis.azurecr.io/stacklight/cerebro:0.9.3 |
|
configmap-reload |
mirantis.azurecr.io/stacklight/configmap-reload:v0.3.0 |
|
curl |
mirantis.azurecr.io/stacklight/curl:7.69.0 |
|
curl-jq |
mirantis.azurecr.io/stacklight/curl-jq:1.5-1 |
|
elasticsearch Updated |
mirantis.azurecr.io/stacklight/elasticsearch:7.10.2-20211102101126 |
|
elasticsearch-curator |
mirantis.azurecr.io/stacklight/curator:5.7.6 |
|
elasticsearch-exporter |
mirantis.azurecr.io/stacklight/elasticsearch_exporter:1.0.2 |
|
fluentd |
mirantis.azurecr.io/stacklight/fluentd:1.10.2-20210915110132 |
|
grafana Updated |
mirantis.azurecr.io/stacklight/grafana:8.2.2 |
|
grafana-image-renderer Updated |
mirantis.azurecr.io/stacklight/grafana-image-renderer:3.2.1 |
|
kubectl |
mirantis.azurecr.io/stacklight/kubectl:1.19.13 |
|
k8s-sidecar |
mirantis.azurecr.io/stacklight/k8s-sidecar:1.10.8 |
|
kibana Updated |
mirantis.azurecr.io/stacklight/kibana:7.10.2-20211101074638 |
|
kube-state-metrics |
mirantis.azurecr.io/stacklight/kube-state-metrics:v1.9.2 |
|
metric-collector Updated |
mirantis.azurecr.io/stacklight/metric-collector:v0.1-20211109121134 |
|
metricbeat Updated |
mirantis.azurecr.io/stacklight/metricbeat:7.10.2-20211103140113 |
|
node-exporter |
mirantis.azurecr.io/stacklight/node-exporter:v1.0.1 |
|
origin-telemeter |
mirantis.azurecr.io/stacklight/origin-telemeter:4.4.0-20200424 |
|
prometheus |
mirantis.azurecr.io/stacklight/prometheus:v2.22.2 |
|
prometheus-blackbox-exporter |
mirantis.azurecr.io/stacklight/blackbox-exporter:v0.14.0 |
|
prometheus-es-exporter |
mirantis.azurecr.io/stacklight/prometheus-es-exporter:v0.14.0-20210812120726 |
|
prometheus-msteams |
mirantis.azurecr.io/stacklight/prometheus-msteams:v1.4.2 |
|
prometheus-nginx-exporter |
mirantis.azurecr.io/stacklight/nginx-prometheus-exporter:0.6.0 |
|
prometheus-patroni-exporter |
mirantis.azurecr.io/stacklight/prometheus-patroni-exporter:v0.1-20210708141736 |
|
prometheus-postgres-exporter |
mirantis.azurecr.io/stacklight/prometheus-postgres-exporter:v0.9.0 |
|
prometheus-relay |
mirantis.azurecr.io/stacklight/prometheus-relay:v0.3-20210317133316 |
|
pushgateway |
mirantis.azurecr.io/stacklight/pushgateway:v1.2.0 |
|
sf-notifier |
mirantis.azurecr.io/stacklight/sf-notifier:v0.3-20210930112115 |
|
sf-reporter |
mirantis.azurecr.io/stacklight/sf-reporter:v0.1-20210607111404 |
|
spilo |
mirantis.azurecr.io/stacklight/spilo:13-2.0p6-20210525081943 |
|
telegraf |
mirantis.azurecr.io/stacklight/telegraf:v1.9.1-20210225152050 |
|
mirantis.azurecr.io/stacklight/telegraf:1.20.0-20210927090119 |
||
telemeter-token-auth |
mirantis.azurecr.io/stacklight/telemeter-token-auth:v0.1-20200406175600 |
|
yq |
mirantis.azurecr.io/stacklight/yq:v4.2.0 |
Artifact |
Component |
Path |
|---|---|---|
Debian repositories |
System packages |
|
http://mirror.mirantis.com/kaas/kubernetes-extra-rhel7-0.0.5/ New |
||
https://mirror.mirantis.com/kaas/ubuntu-2020-07-40-013349.target.txt |
||
MCR repositories |
MCR |
https://repos.mirantis.com/ubuntu/dists/bionic/pool/stable-20.10/ |
This section outlines release notes for the Cluster release 7.3.0 that is introduced in the Mirantis Container Cloud release 2.13.0.
This Cluster release supports Mirantis Kubernetes Engine 3.4.5 with Kubernetes 1.20 and Mirantis Container Runtime 20.10.6.
For the list of known and resolved issues, refer to the Container Cloud release 2.13.0 section.
This section outlines new features implemented in the Cluster release 7.3.0 that is introduced in the Container Cloud release 2.13.0.
Implemented the following improvements to StackLight alerting:
Implemented per-service
*TargetDownand*TargetsOutagealerts that raise if one or all Prometheus targets are down.Enhanced the alert inhibition rules to reduce alert flooding.
Removed the following inefficient alerts:
TargetDownTargetFlappingKubeletDownServiceNowWebhookReceiverDownSfNotifierDownPrometheusMsTeamsDown
Learn more
The following table lists the components versions of the Cluster release 7.3.0.
Note
The components that are newly added, updated, deprecated, or removed
as compared to the previous release version, are marked
with a corresponding superscript,
for example, lcm-ansible Updated.
Component |
Application/Service |
Version |
|---|---|---|
Cluster orchestration |
Mirantis Kubernetes Engine |
3.4.5 0 |
Container runtime |
Mirantis Container Runtime |
20.10.6 1 |
Distributed storage |
Ceph |
15.2.13 (Octopus) |
Rook |
1.6.8 |
|
LCM |
Helm |
2.16.11-40 |
helm-controller Updated |
0.3.0-67-g25ab9f1a |
|
lcm-ansible Updated |
0.11.0-6-gbfce76e |
|
lcm-agent Updated |
0.3.0-67-g25ab9f1a |
|
metallb-controller |
0.9.3-1 |
|
metrics-server |
0.3.6-1 |
|
StackLight |
Alerta |
8.4.1-20210707092546 |
Alertmanager |
0.22.2 |
|
Alertmanager Webhook ServiceNow |
0.1-20210601141858 |
|
Cerebro |
0.9.3 |
|
Elasticsearch |
7.10.2-20210601104922 |
|
Elasticsearch Curator |
5.7.6 |
|
Elasticsearch Exporter |
1.0.2 |
|
Fluentd Updated |
1.10.2-20210915110132 |
|
Grafana Updated |
8.1.2 |
|
Grafana Image Renderer |
2.0.1 |
|
IAM Proxy |
6.0.1 |
|
Kibana |
7.10.2-20210601104911 |
|
Metric Collector |
0.1-20210219112938 |
|
Metricbeat |
7.10.2 |
|
Patroni |
13-2.0p6-20210525081943 |
|
Prometheus |
2.22.2 |
|
Prometheus Blackbox Exporter |
0.14.0 |
|
Prometheus ES Exporter |
0.14.0-20210812120726 |
|
Prometheus MS Teams |
1.4.2 |
|
Prometheus Node Exporter |
1.0.1 |
|
Prometheus NGINX Exporter |
0.6.0 |
|
Prometheus Patroni Exporter |
0.1-20210708141736 |
|
Prometheus Postgres Exporter |
0.9.0 |
|
Prometheus Relay |
0.3-20210317133316 |
|
Pushgateway |
1.2.0 |
|
sf-notifier Updated |
0.3-20210930112115 |
|
sf-reporter New |
0.1-20210607111404 |
|
Telegraf |
1.9.1-20210225142050 |
|
New 1.20.0-20210927090119 |
||
Telemeter |
4.4.0-20200424 |
- 0
For the Mirantis Kubernetes Engine (MKE) release highlights and components versions, see MKE documentation: MKE release notes.
- 1
For the Mirantis Container Runtime (MCR) release highlights, see MCR documentation: MCR release notes.
This section lists the components artifacts of the Cluster release 7.3.0.
Note
The components that are newly added, updated, deprecated, or removed
as compared to the previous release version, are marked
with a corresponding superscript,
for example, lcm-ansible Updated.
Artifact |
Component |
Path |
|---|---|---|
Helm chart |
ceph-controller Updated |
https://binary.mirantis.com/ceph/helm/ceph-operator-1.0.0-mcp-427.tgz |
Docker images |
ceph |
mirantis.azurecr.io/ceph/ceph:v15.2.13 |
ceph-controller Updated |
mirantis.azurecr.io/ceph/mcp/ceph-controller:v1.0.0-20211013104642 |
|
cephcsi |
mirantis.azurecr.io/ceph/cephcsi/cephcsi:v3.3.1 |
|
csi-node-driver-registrar |
mirantis.azurecr.io/ceph/k8scsi/csi-node-driver-registrar:v2.1.0 |
|
csi-provisioner |
mirantis.azurecr.io/ceph/k8scsi/csi-provisioner:v2.1.2 |
|
csi-snapshotter |
mirantis.azurecr.io/ceph/k8scsi/csi-snapshotter:v4.0.0 |
|
csi-attacher |
mirantis.azurecr.io/ceph/k8scsi/csi-attacher:v3.1.0 |
|
csi-resizer |
mirantis.azurecr.io/ceph/k8scsi/csi-resizer:v1.1.0 |
|
rook |
mirantis.azurecr.io/ceph/rook/ceph:v1.6.8 |
Artifact |
Component |
Path |
|---|---|---|
Binaries Updated |
lcm-ansible |
https://binary.mirantis.com/lcm/bin/lcm-ansible/v0.11.0-6-gbfce76e/lcm-ansible.tar.gz |
lcm-agent |
https://binary.mirantis.com/lcm/bin/lcm-agent/v0.3.0-67-g25ab9f1a/lcm-agent |
|
Helm charts |
managed-lcm-api Updated |
https://binary.mirantis.com/core/helm/managed-lcm-api-1.26.6.tgz |
metallb Updated |
||
metrics-server |
https://binary.mirantis.com/core/helm/metrics-server-1.24.6.tgz |
|
Docker images |
helm |
mirantis.azurecr.io/lcm/helm/tiller:v2.16.11-40 |
helm-controller Updated |
mirantis.azurecr.io/lcm/lcm-controller:v0.3.0-67-g25ab9f1a |
|
metallb-controller |
mirantis.azurecr.io/lcm/metallb/controller:v0.9.3-1 |
|
metallb-speaker |
mirantis.azurecr.io/lcm/metallb/speaker:v0.9.3-1 |
|
metrics-server |
mirantis.azurecr.io/lcm/metrics-server-amd64/v0.3.6-1 |
Artifact |
Component |
Path |
|---|---|---|
Helm charts |
alerta |
https://binary.mirantis.com/stacklight/helm/alerta-0.1.0-mcp-22.tgz |
alertmanager-webhook-servicenow |
https://binary.mirantis.com/stacklight/helm/alertmanager-webhook-servicenow-0.1.0-mcp-3.tgz |
|
cerebro |
https://binary.mirantis.com/stacklight/helm/cerebro-0.1.0-mcp-2.tgz |
|
elasticsearch Updated |
https://binary.mirantis.com/stacklight/helm/elasticsearch-7.1.1-mcp-37.tgz |
|
elasticsearch-curator |
https://binary.mirantis.com/stacklight/helm/elasticsearch-curator-1.5.0-mcp-6.tgz |
|
elasticsearch-exporter |
https://binary.mirantis.com/stacklight/helm/elasticsearch-exporter-1.2.0-mcp-2.tgz |
|
fluentd |
https://binary.mirantis.com/stacklight/helm/fluentd-2.0.3-mcp-32.tgz |
|
fluentd-elasticsearch Updated |
https://binary.mirantis.com/stacklight/helm/fluentd-elasticsearch-3.0.0-mcp-105.tgz |
|
grafana |
https://binary.mirantis.com/stacklight/helm/grafana-3.3.10-mcp-110.tgz |
|
iam-proxy Updated |
||
kibana Updated |
https://binary.mirantis.com/stacklight/helm/kibana-3.2.1-mcp-30.tgz |
|
metric-collector |
https://binary.mirantis.com/stacklight/helm/metric-collector-0.2.0-mcp-12.tgz |
|
metricbeat |
https://binary.mirantis.com/stacklight/helm/metricbeat-1.7.1-mcp-12.tgz |
|
patroni |
https://binary.mirantis.com/stacklight/helm/patroni-0.15.1-mcp-34.tgz |
|
prometheus Updated |
https://binary.mirantis.com/stacklight/helm/prometheus-8.11.4-mcp-202.tgz |
|
prometheus-blackbox-exporter |
https://binary.mirantis.com/stacklight/helm/prometheus-blackbox-exporter-0.3.0-mcp-7.tgz |
|
prometheus-es-exporter |
https://binary.mirantis.com/stacklight/helm/prometheus-es-exporter-1.0.0-mcp-11.tgz |
|
prometheus-msteams |
https://binary.mirantis.com/stacklight/helm/prometheus-msteams-0.1.0-mcp-2.tgz |
|
prometheus-nginx-exporter |
https://binary.mirantis.com/stacklight/helm/prometheus-nginx-exporter-0.1.0-mcp-4.tgz |
|
sf-notifier |
https://binary.mirantis.com/stacklight/helm/sf-notifier-0.1.0-mcp-16.tgz |
|
sf-reporter New |
https://binary.mirantis.com/stacklight/helm/sf-reporter-0.1.0-mcp-13.tgz |
|
stacklight Updated |
https://binary.mirantis.com/stacklight/helm/stacklight-0.1.2-mcp-807.tgz |
|
telegraf-ds |
https://binary.mirantis.com/stacklight/helm/telegraf-ds-1.1.5-mcp-29.tgz |
|
telegraf-s |
https://binary.mirantis.com/stacklight/helm/telegraf-s-1.1.5-mcp-30.tgz |
|
telemeter-server |
https://binary.mirantis.com/stacklight/helm/telemeter-server-0.1.0-mcp-19.tgz |
|
telemeter-client |
https://binary.mirantis.com/stacklight/helm/telemeter-client-0.1.0-mcp-19.tgz |
|
Docker images |
alerta |
mirantis.azurecr.io/stacklight/alerta-web:8.4.1-20210707092546 |
alertmanager |
mirantis.azurecr.io/stacklight/alertmanager:v0.22.2 |
|
alertmanager-webhook-servicenow |
mirantis.azurecr.io/stacklight/alertmanager-webhook-servicenow:v0.1-20210601141858 |
|
busybox |
mirantis.azurecr.io/stacklight/busybox:1.30 |
|
cerebro |
mirantis.azurecr.io/stacklight/cerebro:0.9.3 |
|
configmap-reload |
mirantis.azurecr.io/stacklight/configmap-reload:v0.3.0 |
|
curl |
mirantis.azurecr.io/stacklight/curl:7.69.0 |
|
curl-jq |
mirantis.azurecr.io/stacklight/curl-jq:1.5-1 |
|
elasticsearch |
mirantis.azurecr.io/stacklight/elasticsearch:7.10.2-20210601104922 |
|
elasticsearch-curator |
mirantis.azurecr.io/stacklight/curator:5.7.6 |
|
elasticsearch-exporter |
mirantis.azurecr.io/stacklight/elasticsearch_exporter:1.0.2 |
|
fluentd Updated |
mirantis.azurecr.io/stacklight/fluentd:1.10.2-20210915110132 |
|
grafana Updated |
mirantis.azurecr.io/stacklight/grafana:8.1.2 |
|
grafana-image-renderer |
mirantis.azurecr.io/stacklight/grafana-image-renderer:2.0.1 |
|
kubectl |
mirantis.azurecr.io/stacklight/kubectl:1.19.13 |
|
k8s-sidecar |
mirantis.azurecr.io/stacklight/k8s-sidecar:1.10.8 |
|
kibana |
mirantis.azurecr.io/stacklight/kibana:7.10.2-20210601104911 |
|
kube-state-metrics |
mirantis.azurecr.io/stacklight/kube-state-metrics:v1.9.2 |
|
metric-collector |
mirantis.azurecr.io/stacklight/metric-collector:v0.1-20210219112938 |
|
metricbeat |
mirantis.azurecr.io/stacklight/metricbeat:7.10.2 |
|
node-exporter |
mirantis.azurecr.io/stacklight/node-exporter:v1.0.1 |
|
origin-telemeter |
mirantis.azurecr.io/stacklight/origin-telemeter:4.4.0-20200424 |
|
prometheus |
mirantis.azurecr.io/stacklight/prometheus:v2.22.2 |
|
prometheus-blackbox-exporter |
mirantis.azurecr.io/stacklight/blackbox-exporter:v0.14.0 |
|
prometheus-es-exporter |
mirantis.azurecr.io/stacklight/prometheus-es-exporter:v0.14.0-20210812120726 |
|
prometheus-msteams |
mirantis.azurecr.io/stacklight/prometheus-msteams:v1.4.2 |
|
prometheus-nginx-exporter |
mirantis.azurecr.io/stacklight/nginx-prometheus-exporter:0.6.0 |
|
prometheus-patroni-exporter |
mirantis.azurecr.io/stacklight/prometheus-patroni-exporter:v0.1-20210708141736 |
|
prometheus-postgres-exporter |
mirantis.azurecr.io/stacklight/prometheus-postgres-exporter:v0.9.0 |
|
prometheus-relay |
mirantis.azurecr.io/stacklight/prometheus-relay:v0.3-20210317133316 |
|
pushgateway |
mirantis.azurecr.io/stacklight/pushgateway:v1.2.0 |
|
sf-notifier Updated |
mirantis.azurecr.io/stacklight/sf-notifier:v0.3-20210930112115 |
|
sf-reporter New |
mirantis.azurecr.io/stacklight/sf-reporter:v0.1-20210607111404 |
|
spilo |
mirantis.azurecr.io/stacklight/spilo:13-2.0p6-20210525081943 |
|
telegraf |
mirantis.azurecr.io/stacklight/telegraf:v1.9.1-20210225152050 |
|
New mirantis.azurecr.io/stacklight/telegraf:1.20.0-20210927090119 |
||
telemeter-token-auth |
mirantis.azurecr.io/stacklight/telemeter-token-auth:v0.1-20200406175600 |
|
yq |
mirantis.azurecr.io/stacklight/yq:v4.2.0 |
Artifact |
Component |
Path |
|---|---|---|
Debian repositories |
System packages |
|
https://mirror.mirantis.com/kaas/ubuntu-2020-07-30-013349.target.txt |
||
MCR repositories |
MCR |
https://repos.mirantis.com/ubuntu/dists/bionic/pool/stable-20.10/ |
This section outlines release notes for the Cluster release 7.2.0 that is introduced in the Mirantis Container Cloud release 2.12.0.
This Cluster release supports Mirantis Kubernetes Engine 3.4.5 with Kubernetes 1.20 and Mirantis Container Runtime 20.10.6.
For the list of known and resolved issues, refer to the Container Cloud release 2.12.0 section.
This section outlines new features implemented in the Cluster release 7.2.0 that is introduced in the Container Cloud release 2.12.0.
Updated the Mirantis Container Runtime (MCR) version from 20.10.5 to 20.10.6 and Mirantis Kubernetes Engine (MKE) version from 3.4.0 to 3.4.5 for the Container Cloud management, regional, and managed clusters. Also, added support for attachment of existing MKE clusters 3.3.7-3.3.12 and 3.4.1-3.4.5.
For the MCR release highlights and components versions, see MCR documentation: MCR release notes and MKE documentation: MKE release notes.
Integrated the Ceph maintenance to the common upgrade procedure. Now, the
maintenance flag function is set up programmatically and the flag itself is
deprecated.
Technology Preview
Implemented the capability to specify RADOS Gateway tolerations through the
KaaSCephCluster spec using the native Rook way for setting resource
requirements for Ceph daemons.
Enhanced the Grafana dashboards to display user-friendly short names for
Kubernetes nodes, for example, master-0, instead of long name labels
such as kaas-node-f736fc1c-3baa-11eb-8262-0242ac110002.
This feature provides for consistency with Kubernetes nodes naming in the
Container Cloud web UI.
All Grafana dashboards that present node data now have an additional Node identifier drop-down menu. By default, it is set to machine to display short names for Kubernetes nodes. To display Kubernetes node name labels as previously, change this option to node.
Learn more
Implemented the following improvements to StackLight alerting:
Enhanced the alert inhibition rules.
Reworked a number of alerts to improve alerting efficiency and reduce alert flooding.
Removed the inefficient
DockerSwarmLeadElectionLoopandSystemDiskErrorsTooHighalerts.Added the
matcherskey to the routes configuration. Deprecated thematchandmatch_rekeys.
Learn more
Implemented the capability to create custom logs-based metrics that you can use to configure StackLight notifications.
Learn more
The following table lists the components versions of the Cluster release 7.2.0.
Note
The components that are newly added, updated, deprecated, or removed
as compared to the previous release version, are marked
with a corresponding superscript,
for example, lcm-ansible Updated.
Component |
Application/Service |
Version |
|---|---|---|
Cluster orchestration Updated |
Mirantis Kubernetes Engine |
3.4.5 0 |
Container runtime Updated |
Mirantis Container Runtime |
20.10.6 1 |
Distributed storage |
Ceph |
15.2.13 (Octopus) |
Rook |
1.6.8 |
|
LCM |
descheduler Removed |
n/a |
Helm |
2.16.11-40 |
|
helm-controller Updated |
0.3.0-32-gee08c2b8 |
|
lcm-ansible Updated |
0.10.0-12-g7cd13b6 |
|
lcm-agent Updated |
0.3.0-32-gee08c2b8 |
|
metallb-controller |
0.9.3-1 |
|
metrics-server |
0.3.6-1 |
|
StackLight |
Alerta |
8.4.1-20210707092546 |
Alertmanager |
0.22.2 |
|
Alertmanager Webhook ServiceNow |
0.1-20210601141858 |
|
Cerebro |
0.9.3 |
|
Elasticsearch |
7.10.2-20210601104922 |
|
Elasticsearch Curator |
5.7.6 |
|
Elasticsearch Exporter |
1.0.2 |
|
Fluentd |
1.10.2-20210602174807 |
|
Grafana |
7.5.4 |
|
Grafana Image Renderer |
2.0.1 |
|
IAM Proxy |
6.0.1 |
|
Kibana |
7.10.2-20210601104911 |
|
Metric Collector |
0.1-20210219112938 |
|
Metricbeat |
7.10.2 |
|
Patroni |
13-2.0p6-20210525081943 |
|
Prometheus |
2.22.2 |
|
Prometheus Blackbox Exporter |
0.14.0 |
|
Prometheus ES Exporter Updated |
0.14.0-20210812120726 |
|
Prometheus MS Teams |
1.4.2 |
|
Prometheus Node Exporter |
1.0.1 |
|
Prometheus NGINX Exporter |
0.6.0 |
|
Prometheus Patroni Exporter |
0.1-20210708141736 |
|
Prometheus Postgres Exporter |
0.9.0 |
|
Prometheus Relay |
0.3-20210317133316 |
|
Pushgateway |
1.2.0 |
|
sf-notifier |
0.3-20210702081359 |
|
Telegraf |
1.9.1-20210225142050 |
|
Telemeter |
4.4.0-20200424 |
- 0
For the Mirantis Kubernetes Engine (MKE) release highlights and components versions, see MKE documentation: MKE release notes.
- 1
For the Mirantis Container Runtime (MCR) release highlights, see MCR documentation: MCR release notes.
This section lists the components artifacts of the Cluster release 7.2.0.
Note
The components that are newly added, updated, deprecated, or removed
as compared to the previous release version, are marked
with a corresponding superscript,
for example, lcm-ansible Updated.
Artifact |
Component |
Path |
|---|---|---|
Helm chart |
ceph-controller Updated |
https://binary.mirantis.com/ceph/helm/ceph-operator-1.0.0-mcp-409.tgz |
Docker images |
ceph |
mirantis.azurecr.io/ceph/ceph:v15.2.13 |
ceph-controller Updated |
mirantis.azurecr.io/ceph/mcp/ceph-controller:v1.0.0-20210921155643 |
|
cephcsi |
mirantis.azurecr.io/ceph/cephcsi/cephcsi:v3.3.1 |
|
csi-node-driver-registrar |
mirantis.azurecr.io/ceph/k8scsi/csi-node-driver-registrar:v2.1.0 |
|
csi-provisioner Updated |
mirantis.azurecr.io/ceph/k8scsi/csi-provisioner:v2.1.2 |
|
csi-snapshotter |
mirantis.azurecr.io/ceph/k8scsi/csi-snapshotter:v4.0.0 |
|
csi-attacher |
mirantis.azurecr.io/ceph/k8scsi/csi-attacher:v3.1.0 |
|
csi-resizer |
mirantis.azurecr.io/ceph/k8scsi/csi-resizer:v1.1.0 |
|
rook |
mirantis.azurecr.io/ceph/rook/ceph:v1.6.8 |
Artifact |
Component |
Path |
|---|---|---|
Binaries Updated |
lcm-ansible |
https://binary.mirantis.com/lcm/bin/lcm-ansible/v0.10.0-12-g7cd13b6/lcm-ansible.tar.gz |
lcm-agent |
https://binary.mirantis.com/lcm/bin/lcm-agent/v0.3.0-32-gee08c2b8/lcm-agent |
|
Helm charts |
descheduler Removed |
n/a |
managed-lcm-api Updated |
https://binary.mirantis.com/core/helm/managed-lcm-api-1.25.6.tgz |
|
metallb Updated |
||
metrics-server |
https://binary.mirantis.com/core/helm/metrics-server-1.24.6.tgz |
|
Docker images |
descheduler Removed |
n/a |
helm |
mirantis.azurecr.io/lcm/helm/tiller:v2.16.11-40 |
|
helm-controller Updated |
mirantis.azurecr.io/lcm/lcm-controller:v0.3.0-32-gee08c2b8 |
|
metallb-controller |
mirantis.azurecr.io/lcm/metallb/controller:v0.9.3-1 |
|
metallb-speaker |
mirantis.azurecr.io/lcm/metallb/speaker:v0.9.3-1 |
|
metrics-server |
mirantis.azurecr.io/lcm/metrics-server-amd64/v0.3.6-1 |
Artifact |
Component |
Path |
|---|---|---|
Helm charts |
alerta |
https://binary.mirantis.com/stacklight/helm/alerta-0.1.0-mcp-22.tgz |
alertmanager-webhook-servicenow |
https://binary.mirantis.com/stacklight/helm/alertmanager-webhook-servicenow-0.1.0-mcp-3.tgz |
|
cerebro |
https://binary.mirantis.com/stacklight/helm/cerebro-0.1.0-mcp-2.tgz |
|
elasticsearch |
https://binary.mirantis.com/stacklight/helm/elasticsearch-7.1.1-mcp-36.tgz |
|
elasticsearch-curator |
https://binary.mirantis.com/stacklight/helm/elasticsearch-curator-1.5.0-mcp-6.tgz |
|
elasticsearch-exporter |
https://binary.mirantis.com/stacklight/helm/elasticsearch-exporter-1.2.0-mcp-2.tgz |
|
fluentd Updated |
https://binary.mirantis.com/stacklight/helm/fluentd-2.0.3-mcp-32.tgz |
|
fluentd-elasticsearch Updated |
https://binary.mirantis.com/stacklight/helm/fluentd-elasticsearch-3.0.0-mcp-97.tgz |
|
grafana Updated |
https://binary.mirantis.com/stacklight/helm/grafana-3.3.10-mcp-110.tgz |
|
iam-proxy Updated |
||
kibana |
https://binary.mirantis.com/stacklight/helm/kibana-3.2.1-mcp-29.tgz |
|
metric-collector |
https://binary.mirantis.com/stacklight/helm/metric-collector-0.2.0-mcp-12.tgz |
|
metricbeat |
https://binary.mirantis.com/stacklight/helm/metricbeat-1.7.1-mcp-12.tgz |
|
patroni Updated |
https://binary.mirantis.com/stacklight/helm/patroni-0.15.1-mcp-34.tgz |
|
prometheus Updated |
https://binary.mirantis.com/stacklight/helm/prometheus-8.11.4-mcp-201.tgz |
|
prometheus-blackbox-exporter |
https://binary.mirantis.com/stacklight/helm/prometheus-blackbox-exporter-0.3.0-mcp-7.tgz |
|
prometheus-es-exporter Updated |
https://binary.mirantis.com/stacklight/helm/prometheus-es-exporter-1.0.0-mcp-11.tgz |
|
prometheus-msteams |
https://binary.mirantis.com/stacklight/helm/prometheus-msteams-0.1.0-mcp-2.tgz |
|
prometheus-nginx-exporter |
https://binary.mirantis.com/stacklight/helm/prometheus-nginx-exporter-0.1.0-mcp-4.tgz |
|
sf-notifier |
https://binary.mirantis.com/stacklight/helm/sf-notifier-0.1.0-mcp-16.tgz |
|
stacklight Updated |
https://binary.mirantis.com/stacklight/helm/stacklight-0.1.2-mcp-595.tgz |
|
telegraf-ds |
https://binary.mirantis.com/stacklight/helm/telegraf-ds-1.1.5-mcp-29.tgz |
|
telegraf-s Updated |
https://binary.mirantis.com/stacklight/helm/telegraf-s-1.1.5-mcp-30.tgz |
|
telemeter-server Updated |
https://binary.mirantis.com/stacklight/helm/telemeter-server-0.1.0-mcp-19.tgz |
|
telemeter-client Updated |
https://binary.mirantis.com/stacklight/helm/telemeter-client-0.1.0-mcp-19.tgz |
|
Docker images |
alerta |
mirantis.azurecr.io/stacklight/alerta-web:8.4.1-20210707092546 |
alertmanager |
mirantis.azurecr.io/stacklight/alertmanager:v0.22.2 |
|
alertmanager-webhook-servicenow |
mirantis.azurecr.io/stacklight/alertmanager-webhook-servicenow:v0.1-20210601141858 |
|
busybox |
mirantis.azurecr.io/stacklight/busybox:1.30 |
|
cerebro |
mirantis.azurecr.io/stacklight/cerebro:0.9.3 |
|
configmap-reload |
mirantis.azurecr.io/stacklight/configmap-reload:v0.3.0 |
|
curl |
mirantis.azurecr.io/stacklight/curl:7.69.0 |
|
curl-jq |
mirantis.azurecr.io/stacklight/curl-jq:1.5-1 |
|
elasticsearch |
mirantis.azurecr.io/stacklight/elasticsearch:7.10.2-20210601104922 |
|
elasticsearch-curator |
mirantis.azurecr.io/stacklight/curator:5.7.6 |
|
elasticsearch-exporter |
mirantis.azurecr.io/stacklight/elasticsearch_exporter:1.0.2 |
|
fluentd |
mirantis.azurecr.io/stacklight/fluentd:1.10.2-20210602174807 |
|
grafana |
mirantis.azurecr.io/stacklight/grafana:7.5.4 |
|
grafana-image-renderer |
mirantis.azurecr.io/stacklight/grafana-image-renderer:2.0.1 |
|
kubectl |
mirantis.azurecr.io/stacklight/kubectl:1.19.13 |
|
k8s-sidecar |
mirantis.azurecr.io/stacklight/k8s-sidecar:1.10.8 |
|
kibana |
mirantis.azurecr.io/stacklight/kibana:7.10.2-20210601104911 |
|
kube-state-metrics |
mirantis.azurecr.io/stacklight/kube-state-metrics:v1.9.2 |
|
metric-collector |
mirantis.azurecr.io/stacklight/metric-collector:v0.1-20210219112938 |
|
metricbeat |
mirantis.azurecr.io/stacklight/metricbeat:7.10.2 |
|
node-exporter |
mirantis.azurecr.io/stacklight/node-exporter:v1.0.1 |
|
origin-telemeter |
mirantis.azurecr.io/stacklight/origin-telemeter:4.4.0-20200424 |
|
prometheus |
mirantis.azurecr.io/stacklight/prometheus:v2.22.2 |
|
prometheus-blackbox-exporter |
mirantis.azurecr.io/stacklight/blackbox-exporter:v0.14.0 |
|
prometheus-es-exporter Updated |
mirantis.azurecr.io/stacklight/prometheus-es-exporter:v0.14.0-20210812120726 |
|
prometheus-msteams |
mirantis.azurecr.io/stacklight/prometheus-msteams:v1.4.2 |
|
prometheus-nginx-exporter |
mirantis.azurecr.io/stacklight/nginx-prometheus-exporter:0.6.0 |
|
prometheus-patroni-exporter |
mirantis.azurecr.io/stacklight/prometheus-patroni-exporter:v0.1-20210708141736 |
|
prometheus-postgres-exporter |
mirantis.azurecr.io/stacklight/prometheus-postgres-exporter:v0.9.0 |
|
prometheus-relay |
mirantis.azurecr.io/stacklight/prometheus-relay:v0.3-20210317133316 |
|
pushgateway |
mirantis.azurecr.io/stacklight/pushgateway:v1.2.0 |
|
sf-notifier |
mirantis.azurecr.io/stacklight/sf-notifier:v0.3-20210702081359 |
|
spilo |
mirantis.azurecr.io/stacklight/spilo:13-2.0p6-20210525081943 |
|
telegraf |
mirantis.azurecr.io/stacklight/telegraf:v1.9.1-20210225152050 |
|
telemeter-token-auth |
mirantis.azurecr.io/stacklight/telemeter-token-auth:v0.1-20200406175600 |
|
yq |
mirantis.azurecr.io/stacklight/yq:v4.2.0 |
Artifact |
Component |
Path |
|---|---|---|
Debian repositories |
System packages |
|
https://mirror.mirantis.com/kaas/ubuntu-2020-07-30-013349.target.txt |
||
MCR repositories |
MCR |
https://repos.mirantis.com/ubuntu/dists/bionic/pool/stable-20.10/ |
This section outlines release notes for the Cluster release 7.1.0 that is introduced in the Mirantis Container Cloud release 2.11.0.
This Cluster release supports Mirantis Kubernetes Engine 3.4.0 with Kubernetes 1.20 and Mirantis Container Runtime 20.10.5.
For the list of known and resolved issues, refer to the Container Cloud release 2.11.0 section.
This section outlines new features implemented in the Cluster release 7.1.0 that is introduced in the Container Cloud release 2.11.0.
Upgraded Ceph from 14.2.19 (Nautilus) to 15.2.13 (Octopus) and Rook from 1.5.9 to 1.6.8.
Technology Preview
Implemented the capability to define Ceph tolerations and resources management
through the KaaSCephCluster spec using the native Rook way for setting
resource requirements for Ceph daemons.
Improved the MiraCephLog custom resource by adding more information about
all Ceph cluster entities and their statuses. The MiraCeph, MiraCephLog
statuses and MiraCephLog values are now integrated to
KaaSCephCluster.status and can be viewed using the miraCephInfo,
shortClusterInfo, and fullClusterInfo fields.
Implemented the capability to define a list of Ceph Manager modules to enable
on the Ceph cluster using the mgr.modules parameter in KaaSCephCluster.
Implemented the following improvements for the StackLight node labeling during a cluster creation or post-deployment configuration:
Added a verification that a cluster contains minimum 3 worker nodes with the StackLight label for clusters with StackLight deployed in HA mode. This verification applies to cluster deployment and update processes. For details on how to add the StackLight label before upgrade to the latest Cluster releases of Container Cloud 2.11.0, refer to Upgrade managed clusters with StackLight deployed in HA mode.
Added a notification about the minimum number of worker nodes with the StackLight label for HA StackLight deployments to the cluster live status description in the Container Cloud web UI.
Caution
Removal of the StackLight label from worker nodes along with removal of worker nodes with StackLight label can cause the StackLight components to become inaccessible. It is important to keep the worker nodes where the StackLight local volumes were provisioned.
Implemented the capability to set the default log level severity for all StackLight components as well as set a custom log level severity for specific StackLight components in the Container Cloud web UI. You can update this setting either during a managed cluster creation or during a post-deployment configuration.
Implemented the following improvements to StackLight alerting:
Added the following alerts:
KubeContainersCPUThrottlingHighthat raises in case of containers CPU throttling.KubeletDownthat raises if kubelet is down.
Reworked the alert inhibition rules.
Reworked a number of alerts to improve alerting efficiency and reduce alert flooding.
Removed the following inefficient alerts:
FileDescriptorUsageCriticalKubeCPUOvercommitNamespacesKubeMemOvercommitNamespacesKubeQuotaExceededContainerScrapeError
Implemented the capability to enable feed update in Salesforce using
the feed_enabled parameter. By default, this parameter is set to false
to save API calls.
On top of continuous improvements delivered to the existing Container Cloud guides, added a procedure on how to manually remove a Ceph OSD from a Ceph cluster.
Learn more
The following table lists the components versions of the Cluster release 7.1.0.
Note
The components that are newly added, updated, deprecated, or removed
as compared to the previous release version, are marked
with a corresponding superscript,
for example, lcm-ansible Updated.
Component |
Application/Service |
Version |
|---|---|---|
Cluster orchestration |
Mirantis Kubernetes Engine |
3.4.0 0 |
Container runtime |
Mirantis Container Runtime |
20.10.5 1 |
Distributed storage Updated |
Ceph |
15.2.13 (Octopus) |
Rook |
1.6.8 |
|
LCM |
descheduler |
0.8.0 |
Helm |
2.16.11-40 |
|
helm-controller Updated |
0.2.0-399-g85be100f |
|
lcm-ansible Updated |
0.9.0-17-g28bc9ce |
|
lcm-agent Updated |
0.2.0-399-g85be100f |
|
metallb-controller |
0.9.3-1 |
|
metrics-server |
0.3.6-1 |
|
StackLight |
Alerta Updated |
8.4.1-20210707092546 |
Alertmanager |
0.22.2 |
|
Alertmanager Webhook ServiceNow |
0.1-20210601141858 |
|
Cerebro |
0.9.3 |
|
Elasticsearch |
7.10.2-20210601104922 |
|
Elasticsearch Curator |
5.7.6 |
|
Elasticsearch Exporter |
1.0.2 |
|
Fluentd |
1.10.2-20210602174807 |
|
Grafana |
7.5.4 |
|
Grafana Image Renderer |
2.0.1 |
|
IAM Proxy |
6.0.1 |
|
Kibana |
7.10.2-20210601104911 |
|
Metric Collector |
0.1-20210219112938 |
|
Metricbeat |
7.10.2 |
|
Patroni |
13-2.0p6-20210525081943 |
|
Prometheus |
2.22.2 |
|
Prometheus Blackbox Exporter |
0.14.0 |
|
Prometheus ES Exporter |
0.5.1-20210323132924 |
|
Prometheus MS Teams |
1.4.2 |
|
Prometheus Node Exporter |
1.0.1 |
|
Prometheus NGINX Exporter |
0.6.0 |
|
Prometheus Patroni Exporter Updated |
0.1-20210708141736 |
|
Prometheus Postgres Exporter |
0.9.0 |
|
Prometheus Relay |
0.3-20210317133316 |
|
Pushgateway |
1.2.0 |
|
sf-notifier Updated |
0.3-20210702081359 |
|
Telegraf |
1.9.1-20210225142050 |
|
Telemeter |
4.4.0-20200424 |
- 0
For the Mirantis Kubernetes Engine (MKE) release highlights and components versions, see MKE documentation: MKE release notes.
- 1
For the Mirantis Container Runtime (MCR) release highlights, see MCR documentation: MCR release notes.
This section lists the components artifacts of the Cluster release 7.1.0.
Note
The components that are newly added, updated, deprecated, or removed
as compared to the previous release version, are marked
with a corresponding superscript,
for example, lcm-ansible Updated.
Artifact |
Component |
Path |
|---|---|---|
Helm chart |
ceph-controller Updated |
https://binary.mirantis.com/ceph/helm/ceph-operator-1.0.0-mcp-368.tgz |
Docker images |
ceph Updated |
mirantis.azurecr.io/ceph/ceph:v15.2.13 |
ceph-controller Updated |
mirantis.azurecr.io/ceph/mcp/ceph-controller:v1.0.0-20210807103257 |
|
cephcsi Updated |
mirantis.azurecr.io/ceph/cephcsi/cephcsi:v3.3.1 |
|
csi-node-driver-registrar |
mirantis.azurecr.io/ceph/k8scsi/csi-node-driver-registrar:v2.1.0 |
|
csi-provisioner Updated |
mirantis.azurecr.io/ceph/k8scsi/csi-provisioner:v2.1.2 |
|
csi-snapshotter |
mirantis.azurecr.io/ceph/k8scsi/csi-snapshotter:v4.0.0 |
|
csi-attacher |
mirantis.azurecr.io/ceph/k8scsi/csi-attacher:v3.1.0 |
|
csi-resizer |
mirantis.azurecr.io/ceph/k8scsi/csi-resizer:v1.1.0 |
|
rook Updated |
mirantis.azurecr.io/ceph/rook/ceph:v1.6.8 |
Artifact |
Component |
Path |
|---|---|---|
Binaries Updated |
lcm-ansible |
https://binary.mirantis.com/lcm/bin/lcm-ansible/v0.9.0-17-g28bc9ce/lcm-ansible.tar.gz |
lcm-agent Updated |
https://binary.mirantis.com/lcm/bin/lcm-agent/v0.2.0-399-g85be100f/lcm-agent |
|
Helm charts Updated |
descheduler |
https://binary.mirantis.com/core/helm/descheduler-1.24.6.tgz |
managed-lcm-api |
https://binary.mirantis.com/core/helm/managed-lcm-api-1.24.6.tgz |
|
metallb |
||
metrics-server |
https://binary.mirantis.com/core/helm/metrics-server-1.24.6.tgz |
|
Docker images |
descheduler |
mirantis.azurecr.io/lcm/descheduler/v0.8.0 |
helm |
mirantis.azurecr.io/lcm/helm/tiller:v2.16.11-40 |
|
helm-controller Updated |
mirantis.azurecr.io/lcm/lcm-controller:v0.2.0-399-g85be100f |
|
metallb-controller |
mirantis.azurecr.io/lcm/metallb/controller:v0.9.3-1 |
|
metallb-speaker |
mirantis.azurecr.io/lcm/metallb/speaker:v0.9.3-1 |
|
metrics-server |
mirantis.azurecr.io/lcm/metrics-server-amd64/v0.3.6-1 |
Artifact |
Component |
Path |
|---|---|---|
Helm charts |
alerta |
https://binary.mirantis.com/stacklight/helm/alerta-0.1.0-mcp-22.tgz |
alertmanager-webhook-servicenow |
https://binary.mirantis.com/stacklight/helm/alertmanager-webhook-servicenow-0.1.0-mcp-3.tgz |
|
cerebro |
https://binary.mirantis.com/stacklight/helm/cerebro-0.1.0-mcp-2.tgz |
|
elasticsearch Updated |
https://binary.mirantis.com/stacklight/helm/elasticsearch-7.1.1-mcp-36.tgz |
|
elasticsearch-curator |
https://binary.mirantis.com/stacklight/helm/elasticsearch-curator-1.5.0-mcp-6.tgz |
|
elasticsearch-exporter |
https://binary.mirantis.com/stacklight/helm/elasticsearch-exporter-1.2.0-mcp-2.tgz |
|
fluentd Updated |
https://binary.mirantis.com/stacklight/helm/fluentd-2.0.3-mcp-30.tgz |
|
fluentd-elasticsearch Updated |
https://binary.mirantis.com/stacklight/helm/fluentd-elasticsearch-3.0.0-mcp-96.tgz |
|
grafana Updated |
https://binary.mirantis.com/stacklight/helm/grafana-3.3.10-mcp-108.tgz |
|
iam-proxy Updated |
||
kibana Updated |
https://binary.mirantis.com/stacklight/helm/kibana-3.2.1-mcp-29.tgz |
|
metric-collector |
https://binary.mirantis.com/stacklight/helm/metric-collector-0.2.0-mcp-12.tgz |
|
metricbeat |
https://binary.mirantis.com/stacklight/helm/metricbeat-1.7.1-mcp-12.tgz |
|
patroni Updated |
https://binary.mirantis.com/stacklight/helm/patroni-0.15.1-mcp-33.tgz |
|
prometheus Updated |
https://binary.mirantis.com/stacklight/helm/prometheus-8.11.4-mcp-188.tgz |
|
prometheus-blackbox-exporter |
https://binary.mirantis.com/stacklight/helm/prometheus-blackbox-exporter-0.3.0-mcp-7.tgz |
|
prometheus-es-exporter |
https://binary.mirantis.com/stacklight/helm/prometheus-es-exporter-1.0.0-mcp-10.tgz |
|
prometheus-msteams |
https://binary.mirantis.com/stacklight/helm/prometheus-msteams-0.1.0-mcp-2.tgz |
|
prometheus-nginx-exporter |
https://binary.mirantis.com/stacklight/helm/prometheus-nginx-exporter-0.1.0-mcp-4.tgz |
|
sf-notifier |
https://binary.mirantis.com/stacklight/helm/sf-notifier-0.1.0-mcp-16.tgz |
|
stacklight Updated |
https://binary.mirantis.com/stacklight/helm/stacklight-0.1.2-mcp-574.tgz |
|
telegraf-ds Updated |
https://binary.mirantis.com/stacklight/helm/telegraf-ds-1.1.5-mcp-29.tgz |
|
telegraf-s Updated |
https://binary.mirantis.com/stacklight/helm/telegraf-s-1.1.5-mcp-29.tgz |
|
telemeter-server Updated |
https://binary.mirantis.com/stacklight/helm/telemeter-server-0.1.0-mcp-17.tgz |
|
telemeter-client Updated |
https://binary.mirantis.com/stacklight/helm/telemeter-client-0.1.0-mcp-17.tgz |
|
Docker images |
alerta Updated |
mirantis.azurecr.io/stacklight/alerta-web:8.4.1-20210707092546 |
alertmanager |
mirantis.azurecr.io/stacklight/alertmanager:v0.22.2 |
|
alertmanager-webhook-servicenow |
mirantis.azurecr.io/stacklight/alertmanager-webhook-servicenow:v0.1-20210601141858 |
|
busybox |
mirantis.azurecr.io/stacklight/busybox:1.30 |
|
cerebro |
mirantis.azurecr.io/stacklight/cerebro:0.9.3 |
|
configmap-reload |
mirantis.azurecr.io/stacklight/configmap-reload:v0.3.0 |
|
curl |
mirantis.azurecr.io/stacklight/curl:7.69.0 |
|
curl-jq |
mirantis.azurecr.io/stacklight/curl-jq:1.5-1 |
|
elasticsearch |
mirantis.azurecr.io/stacklight/elasticsearch:7.10.2-20210601104922 |
|
elasticsearch-curator |
mirantis.azurecr.io/stacklight/curator:5.7.6 |
|
elasticsearch-exporter |
mirantis.azurecr.io/stacklight/elasticsearch_exporter:1.0.2 |
|
fluentd |
mirantis.azurecr.io/stacklight/fluentd:1.10.2-20210602174807 |
|
grafana |
mirantis.azurecr.io/stacklight/grafana:7.5.4 |
|
grafana-image-renderer |
mirantis.azurecr.io/stacklight/grafana-image-renderer:2.0.1 |
|
kubectl Updated |
mirantis.azurecr.io/stacklight/kubectl:1.19.13 |
|
k8s-sidecar |
mirantis.azurecr.io/stacklight/k8s-sidecar:1.10.8 |
|
kibana |
mirantis.azurecr.io/stacklight/kibana:7.10.2-20210601104911 |
|
kube-state-metrics |
mirantis.azurecr.io/stacklight/kube-state-metrics:v1.9.2 |
|
metric-collector |
mirantis.azurecr.io/stacklight/metric-collector:v0.1-20210219112938 |
|
metricbeat |
mirantis.azurecr.io/stacklight/metricbeat:7.10.2 |
|
node-exporter |
mirantis.azurecr.io/stacklight/node-exporter:v1.0.1 |
|
origin-telemeter |
mirantis.azurecr.io/stacklight/origin-telemeter:4.4.0-20200424 |
|
prometheus |
mirantis.azurecr.io/stacklight/prometheus:v2.22.2 |
|
prometheus-blackbox-exporter |
mirantis.azurecr.io/stacklight/blackbox-exporter:v0.14.0 |
|
prometheus-es-exporter |
mirantis.azurecr.io/stacklight/prometheus-es-exporter:v0.5.1-20210323132924 |
|
prometheus-msteams |
mirantis.azurecr.io/stacklight/prometheus-msteams:v1.4.2 |
|
prometheus-nginx-exporter |
mirantis.azurecr.io/stacklight/nginx-prometheus-exporter:0.6.0 |
|
prometheus-patroni-exporter Updated |
mirantis.azurecr.io/stacklight/prometheus-patroni-exporter:v0.1-20210708141736 |
|
prometheus-postgres-exporter |
mirantis.azurecr.io/stacklight/prometheus-postgres-exporter:v0.9.0 |
|
prometheus-relay |
mirantis.azurecr.io/stacklight/prometheus-relay:v0.3-20210317133316 |
|
pushgateway |
mirantis.azurecr.io/stacklight/pushgateway:v1.2.0 |
|
sf-notifier Updated |
mirantis.azurecr.io/stacklight/sf-notifier:v0.3-20210702081359 |
|
spilo |
mirantis.azurecr.io/stacklight/spilo:13-2.0p6-20210525081943 |
|
telegraf |
mirantis.azurecr.io/stacklight/telegraf:v1.9.1-20210225152050 |
|
telemeter-token-auth |
mirantis.azurecr.io/stacklight/telemeter-token-auth:v0.1-20200406175600 |
|
yq |
mirantis.azurecr.io/stacklight/yq:v4.2.0 |
Artifact |
Component |
Path |
|---|---|---|
Debian repositories |
System packages |
|
https://mirror.mirantis.com/kaas/ubuntu-2020-07-30-013349.target.txt |
||
MCR repositories |
MCR |
https://repos.mirantis.com/ubuntu/dists/bionic/pool/stable-20.10/ |
This section outlines release notes for the Cluster release 7.0.0 that is introduced in the Mirantis Container Cloud release 2.10.0.
This Cluster release introduces support for the updated versions of Mirantis Kubernetes Engine 3.4.0 with Kubernetes 1.20 and Mirantis Container Runtime 20.10.5.
For the list of known and resolved issues, refer to the Container Cloud release 2.10.0 section.
This section outlines new features introduced in the Cluster release 7.0.0 that is the initial release of the 7.x Cluster release series.
The 7.0.0 Cluster release introduces support for the updated versions of:
Mirantis Container Runtime (MCR) 20.10.5
Mirantis Kubernetes Engine (MKE) 3.4.0
Kubernetes 1.20.1
All existing management and regional clusters with the Cluster release 5.16.0 are automatically updated to the Cluster release 7.0.0 with the updated versions of MCR, MKE, and Kubernetes.
Once you update your existing managed clusters from the Cluster release 5.16.0 to 5.17.0, an update to the Cluster release 7.0.0 becomes available through the Container Cloud web UI menu.
Implemented a graceful Mirantis Container Runtime (MCR) upgrade from 19.03.14 to 20.10.5 on existing Container Cloud clusters.
Improved the MKE logs gathering by replacing the default DEBUG logs level
with INFO. This change reduces the unnecessary load on the MKE cluster
caused by an excessive amount of logs generated with the DEBUG level
enabled.
Implemented the capability to configure the verbosity level of logs produced by all StackLight components or by each component separately.
Implemented the following improvements to StackLight alerting:
Added the following alerts:
PrometheusMsTeamsDownthat raises ifprometheus-msteamsis down.ServiceNowWebhookReceiverDownthat raises ifalertmanager-webhook-servicenowis down.SfNotifierDownthat raises if thesf-notifieris down.KubeAPICertExpirationMajor,KubeAPICertExpirationWarning,MKEAPICertExpirationMajor,MKEAPICertExpirationWarningthat inform on SSL certificates expiration.
Removed the inefficient
PostgresqlPrimaryDownalert.Reworked a number of alerts to improve alerting efficiency and reduce alert flooding.
Reworked the alert inhibition rules to match the receivers.
Updated Alertmanager to v0.22.2.
Changed the default behavior of the Salesforce alerts integration. Now, by default, only
Criticalalerts will be sent to the Salesforce.
Implemented the capability to add or configure proxy on existing Container Cloud managed clusters using the Container Cloud web UI.
On top of continuous improvements delivered to the existing Container Cloud guides, added a procedure on how to move a Ceph Monitor daemon to another node.
The following table lists the components versions of the Cluster release 7.0.0.
Component |
Application/Service |
Version |
|---|---|---|
Cluster orchestration |
Mirantis Kubernetes Engine |
3.4.0 0 |
Container runtime |
Mirantis Container Runtime |
20.10.5 1 |
Distributed storage |
Ceph |
14.2.19 (Nautilus) |
Rook |
1.5.9 |
|
LCM |
descheduler |
0.8.0 |
Helm |
2.16.11-40 |
|
helm-controller |
0.2.0-372-g7e042f4d |
|
lcm-ansible |
0.8.0-17-g63ec424 |
|
lcm-agent |
0.2.0-373-gae771bb4 |
|
metallb-controller |
0.9.3-1 |
|
metrics-server |
0.3.6-1 |
|
StackLight |
Alerta |
8.4.1-20210312131419 |
Alertmanager |
0.22.2 |
|
Alertmanager Webhook ServiceNow |
0.1-20210601141858 |
|
Cerebro |
0.9.3 |
|
Elasticsearch |
7.10.2-20210601104922 |
|
Elasticsearch Curator |
5.7.6 |
|
Elasticsearch Exporter |
1.0.2 |
|
Fluentd |
1.10.2-20210602174807 |
|
Grafana |
7.5.4 |
|
Grafana Image Renderer |
2.0.1 |
|
IAM Proxy |
6.0.1 |
|
Kibana |
7.10.2-20210601104911 |
|
Metric Collector |
0.1-20210219112938 |
|
Metricbeat |
7.10.2 |
|
Patroni |
13-2.0p6-20210525081943 |
|
Prometheus |
2.22.2 |
|
Prometheus Blackbox Exporter |
0.14.0 |
|
Prometheus ES Exporter |
0.5.1-20210323132924 |
|
Prometheus MS Teams |
1.4.2 |
|
Prometheus Node Exporter |
1.0.1 |
|
Prometheus NGINX Exporter |
0.6.0 |
|
Prometheus Patroni Exporter |
0.1-20200428121305 |
|
Prometheus Postgres Exporter |
0.9.0 |
|
Prometheus Relay |
0.3-20210317133316 |
|
Pushgateway |
1.2.0 |
|
sf-notifier |
0.3-20210617140951 |
|
sf-reporter |
0.1-20210607111404 |
|
Telegraf |
1.9.1-20210225142050 |
|
Telemeter |
4.4.0-20200424 |
- 0
For the Mirantis Kubernetes Engine (MKE) release highlights and components versions, see MKE documentation: MKE release notes.
- 1
For the Mirantis Container Runtime (MCR) release highlights, see MCR documentation: MCR release notes.
This section lists the components artifacts of the Cluster release 7.0.0.
Artifact |
Component |
Path |
|---|---|---|
Helm chart |
ceph-controller |
https://binary.mirantis.com/ceph/helm/ceph-operator-1.0.0-mcp-305.tgz |
Docker images |
ceph |
mirantis.azurecr.io/ceph/ceph:v14.2.19 |
ceph-controller |
mirantis.azurecr.io/ceph/mcp/ceph-controller:v1.0.0-20210716222903 |
|
cephcsi |
mirantis.azurecr.io/ceph/cephcsi/cephcsi:v3.2.1 |
|
csi-node-driver-registrar |
mirantis.azurecr.io/ceph/k8scsi/csi-node-driver-registrar:v2.1.0 |
|
csi-provisioner |
mirantis.azurecr.io/ceph/k8scsi/csi-provisioner:v2.1.1 |
|
csi-snapshotter |
mirantis.azurecr.io/ceph/k8scsi/csi-snapshotter:v4.0.0 |
|
csi-attacher |
mirantis.azurecr.io/ceph/k8scsi/csi-attacher:v3.1.0 |
|
csi-resizer |
mirantis.azurecr.io/ceph/k8scsi/csi-resizer:v1.1.0 |
|
rook |
mirantis.azurecr.io/ceph/rook/ceph:v1.5.9 |
Artifact |
Component |
Path |
|---|---|---|
Binaries |
lcm-ansible |
https://binary.mirantis.com/lcm/bin/lcm-ansible/v0.8.0-17-g63ec424/lcm-ansible.tar.gz |
lcm-agent |
https://binary.mirantis.com/lcm/bin/lcm-agent/v0.2.0-373-gae771bb4/lcm-agent |
|
Helm charts |
descheduler |
https://binary.mirantis.com/core/helm/descheduler-1.23.2.tgz |
managed-lcm-api |
https://binary.mirantis.com/core/helm/managed-lcm-api-1.23.2.tgz |
|
metallb |
||
metrics-server |
https://binary.mirantis.com/core/helm/metrics-server-1.23.2.tgz |
|
Docker images |
descheduler |
mirantis.azurecr.io/lcm/descheduler/v0.8.0 |
helm |
mirantis.azurecr.io/lcm/helm/tiller:v2.16.11-40 |
|
helm-controller |
mirantis.azurecr.io/lcm/lcm-controller:v0.2.0-372-g7e042f4d |
|
metallb-controller |
mirantis.azurecr.io/lcm/metallb/controller:v0.9.3-1 |
|
metallb-speaker |
mirantis.azurecr.io/lcm/metallb/speaker:v0.9.3-1 |
|
metrics-server |
mirantis.azurecr.io/lcm/metrics-server-amd64/v0.3.6-1 |
Artifact |
Component |
Path |
|---|---|---|
Helm charts |
alerta |
https://binary.mirantis.com/stacklight/helm/alerta-0.1.0-mcp-22.tgz |
alertmanager-webhook-servicenow |
https://binary.mirantis.com/stacklight/helm/alertmanager-webhook-servicenow-0.1.0-mcp-3.tgz |
|
cerebro |
https://binary.mirantis.com/stacklight/helm/cerebro-0.1.0-mcp-2.tgz |
|
elasticsearch |
https://binary.mirantis.com/stacklight/helm/elasticsearch-7.1.1-mcp-33.tgz |
|
elasticsearch-curator |
https://binary.mirantis.com/stacklight/helm/elasticsearch-curator-1.5.0-mcp-6.tgz |
|
elasticsearch-exporter |
https://binary.mirantis.com/stacklight/helm/elasticsearch-exporter-1.2.0-mcp-2.tgz |
|
fluentd |
https://binary.mirantis.com/stacklight/helm/fluentd-2.0.3-mcp-25.tgz |
|
fluentd-elasticsearch |
https://binary.mirantis.com/stacklight/helm/fluentd-elasticsearch-3.0.0-mcp-93.tgz |
|
grafana |
https://binary.mirantis.com/stacklight/helm/grafana-3.3.10-mcp-105.tgz |
|
iam-proxy |
||
kibana |
https://binary.mirantis.com/stacklight/helm/kibana-3.2.1-mcp-27.tgz |
|
metric-collector |
https://binary.mirantis.com/stacklight/helm/metric-collector-0.2.0-mcp-12.tgz |
|
metricbeat |
https://binary.mirantis.com/stacklight/helm/metricbeat-1.7.1-mcp-12.tgz |
|
patroni |
https://binary.mirantis.com/stacklight/helm/patroni-0.15.1-mcp-30.tgz |
|
prometheus |
https://binary.mirantis.com/stacklight/helm/prometheus-8.11.4-mcp-158.tgz |
|
prometheus-blackbox-exporter |
https://binary.mirantis.com/stacklight/helm/prometheus-blackbox-exporter-0.3.0-mcp-7.tgz |
|
prometheus-es-exporter |
https://binary.mirantis.com/stacklight/helm/prometheus-es-exporter-1.0.0-mcp-10.tgz |
|
prometheus-msteams |
https://binary.mirantis.com/stacklight/helm/prometheus-msteams-0.1.0-mcp-2.tgz |
|
prometheus-nginx-exporter |
https://binary.mirantis.com/stacklight/helm/prometheus-nginx-exporter-0.1.0-mcp-4.tgz |
|
sf-notifier |
https://binary.mirantis.com/stacklight/helm/sf-notifier-0.1.0-mcp-16.tgz |
|
sf-reporter |
https://binary.mirantis.com/stacklight/helm/sf-reporter-0.1.0-mcp-13.tgz |
|
stacklight |
https://binary.mirantis.com/stacklight/helm/stacklight-0.1.2-mcp-538.tgz |
|
telegraf-ds |
https://binary.mirantis.com/stacklight/helm/telegraf-ds-1.1.5-mcp-20.tgz |
|
telegraf-s |
https://binary.mirantis.com/stacklight/helm/telegraf-s-1.1.5-mcp-20.tgz |
|
telemeter-server |
https://binary.mirantis.com/stacklight/helm/telemeter-server-0.1.0-mcp-16.tgz |
|
telemeter-client |
https://binary.mirantis.com/stacklight/helm/telemeter-client-0.1.0-mcp-16.tgz |
|
Docker images |
alerta |
mirantis.azurecr.io/stacklight/alerta-web:8.4.1-20210312131419 |
alertmanager |
mirantis.azurecr.io/stacklight/alertmanager:v0.22.2 |
|
alertmanager-webhook-servicenow |
mirantis.azurecr.io/stacklight/alertmanager-webhook-servicenow:v0.1-20210601141858 |
|
busybox |
mirantis.azurecr.io/stacklight/busybox:1.30 |
|
cerebro |
mirantis.azurecr.io/stacklight/cerebro:0.9.3 |
|
configmap-reload |
mirantis.azurecr.io/stacklight/configmap-reload:v0.3.0 |
|
curl |
mirantis.azurecr.io/stacklight/curl:7.69.0 |
|
curl-jq |
mirantis.azurecr.io/stacklight/curl-jq:1.5-1 |
|
elasticsearch |
mirantis.azurecr.io/stacklight/elasticsearch:7.10.2-20210601104922 |
|
elasticsearch-curator |
mirantis.azurecr.io/stacklight/curator:5.7.6 |
|
elasticsearch-exporter |
mirantis.azurecr.io/stacklight/elasticsearch_exporter:1.0.2 |
|
fluentd |
mirantis.azurecr.io/stacklight/fluentd:1.10.2-20210602174807 |
|
grafana |
mirantis.azurecr.io/stacklight/grafana:7.5.4 |
|
grafana-image-renderer |
mirantis.azurecr.io/stacklight/grafana-image-renderer:2.0.1 |
|
kubectl |
mirantis.azurecr.io/stacklight/kubectl:1.19.2 |
|
k8s-sidecar |
mirantis.azurecr.io/stacklight/k8s-sidecar:1.10.8 |
|
kibana |
mirantis.azurecr.io/stacklight/kibana:7.10.2-20210601104911 |
|
kube-state-metrics |
mirantis.azurecr.io/stacklight/kube-state-metrics:v1.9.2 |
|
metric-collector |
mirantis.azurecr.io/stacklight/metric-collector:v0.1-20210219112938 |
|
metricbeat |
mirantis.azurecr.io/stacklight/metricbeat:7.10.2 |
|
node-exporter |
mirantis.azurecr.io/stacklight/node-exporter:v1.0.1 |
|
origin-telemeter |
mirantis.azurecr.io/stacklight/origin-telemeter:4.4.0-20200424 |
|
prometheus |
mirantis.azurecr.io/stacklight/prometheus:v2.22.2 |
|
prometheus-blackbox-exporter |
mirantis.azurecr.io/stacklight/blackbox-exporter:v0.14.0 |
|
prometheus-es-exporter |
mirantis.azurecr.io/stacklight/prometheus-es-exporter:v0.5.1-20210323132924 |
|
prometheus-msteams |
mirantis.azurecr.io/stacklight/prometheus-msteams:v1.4.2 |
|
prometheus-nginx-exporter |
mirantis.azurecr.io/stacklight/nginx-prometheus-exporter:0.6.0 |
|
prometheus-patroni-exporter |
mirantis.azurecr.io/stacklight/prometheus-patroni-exporter:v0.1-20200428121305 |
|
prometheus-postgres-exporter |
mirantis.azurecr.io/stacklight/prometheus-postgres-exporter:v0.9.0 |
|
prometheus-relay |
mirantis.azurecr.io/stacklight/prometheus-relay:v0.3-20210317133316 |
|
pushgateway |
mirantis.azurecr.io/stacklight/pushgateway:v1.2.0 |
|
sf-notifier |
mirantis.azurecr.io/stacklight/sf-notifier:v0.3-20210617140951 |
|
sf-reporter |
mirantis.azurecr.io/stacklight/sf-reporter:v0.1-20210607111404 |
|
spilo |
mirantis.azurecr.io/stacklight/spilo:13-2.0p6-20210525081943 |
|
telegraf |
mirantis.azurecr.io/stacklight/telegraf:v1.9.1-20210225152050 |
|
telemeter-token-auth |
mirantis.azurecr.io/stacklight/telemeter-token-auth:v0.1-20200406175600 |
|
yq |
mirantis.azurecr.io/stacklight/yq:v4.2.0 |
Artifact |
Component |
Path |
|---|---|---|
Debian repositories |
System packages |
|
https://mirror.mirantis.com/kaas/ubuntu-2020-07-30-013349.target.txt |
||
MCR repositories |
MCR |
https://repos.mirantis.com/ubuntu/dists/bionic/pool/stable-20.10/ |
This section outlines release notes for the unsupported Cluster releases of the 6.x series.
The Cluster release 6.20.0 is introduced in the Mirantis Container Cloud release 2.13.1. This Cluster release is based on the Cluster release 5.20.0.
The Cluster release 6.20.0 supports:
Mirantis OpenStack for Kubernetes (MOS) 21.6. For details, see MOS Release Notes.
Mirantis Kubernetes Engine (MKE) 3.3.12. For details, see MKE Release Notes.
Mirantis Container Runtime (MCR) 20.10.6. For details, see MCR Release Notes.
Kubernetes 1.18.
For the list of addressed and known issues, refer to the Container Cloud release 2.13.0 section.
This section outlines new features and enhancements introduced in the Cluster release 6.20.0.
Implemented the following improvements to StackLight alerting:
Implemented per-service
*TargetDownand*TargetsOutagealerts that raise if one or all Prometheus targets are down.Enhanced the alert inhibition rules to reduce alert flooding.
Removed the following inefficient alerts:
TargetDownTargetFlappingKubeletDownServiceNowWebhookReceiverDownSfNotifierDownPrometheusMsTeamsDown
Learn more
The following table lists the components versions of the Cluster release 6.20.0.
Note
The components that are newly added, updated, deprecated, or removed
as compared to the previous release version, are marked
with a corresponding superscript,
for example, lcm-ansible Updated.
Component |
Application/Service |
Version |
|---|---|---|
Cluster orchestration |
Mirantis Kubernetes Engine |
3.3.12 0 |
Container runtime |
Mirantis Container Runtime |
20.10.6 1 |
Distributed storage |
Ceph |
15.2.13 (Octopus) |
Rook |
1.6.8 |
|
LCM |
Helm |
2.16.11-40 |
helm-controller Updated |
0.3.0-67-g25ab9f1a |
|
lcm-ansible Updated |
0.11.0-6-gbfce76e |
|
lcm-agent Updated |
0.3.0-67-g25ab9f1a |
|
metallb-controller |
0.9.3-1 |
|
metrics-server |
0.3.6-1 |
|
StackLight |
Alerta |
8.4.1-20210707092546 |
Alertmanager |
0.22.2 |
|
Alertmanager Webhook ServiceNow |
0.1-20210601141858 |
|
Cerebro |
0.9.3 |
|
Elasticsearch |
7.10.2-20210601104922 |
|
Elasticsearch Curator |
5.7.6 |
|
Elasticsearch Exporter |
1.0.2 |
|
Fluentd Updated |
1.10.2-20210915110132 |
|
Grafana Updated |
8.1.2 |
|
Grafana Image Renderer |
2.0.1 |
|
IAM Proxy |
6.0.1 |
|
Kibana |
7.10.2-20210601104911 |
|
Metric Collector |
0.1-20210219112938 |
|
Metricbeat |
7.10.2 |
|
Patroni |
13-2.0p6-20210525081943 |
|
Prometheus |
2.22.2 |
|
Prometheus Blackbox Exporter |
0.14.0 |
|
Prometheus ES Exporter |
0.14.0-20210812120726 |
|
Prometheus MS Teams |
1.4.2 |
|
Prometheus Node Exporter |
1.0.1 |
|
Prometheus NGINX Exporter |
0.6.0 |
|
Prometheus Patroni Exporter |
0.1-20210708141736 |
|
Prometheus Postgres Exporter |
0.9.0 |
|
Prometheus Relay |
0.3-20210317133316 |
|
Pushgateway |
1.2.0 |
|
sf-notifier Updated |
0.3-20210930112115 |
|
sf-reporter New |
0.1-20210607111404 |
|
Telegraf |
1.9.1-20210225142050 |
|
New 1.20.0-20210927090119 |
||
Telemeter |
4.4.0-20200424 |
- 0
For the MKE release highlights and components versions, see MKE documentation: MKE release notes.
- 1
For the Mirantis Container Runtime (MCR) release highlights, see MCR documentation: MCR release notes.
This section lists the components artifacts of the Cluster release 6.20.0.
Note
The components that are newly added, updated, deprecated, or removed
as compared to the previous release version, are marked
with a corresponding superscript,
for example, lcm-ansible Updated.
Artifact |
Component |
Path |
|---|---|---|
Helm chart |
ceph-controller Updated |
https://binary.mirantis.com/ceph/helm/ceph-operator-1.0.0-mcp-427.tgz |
Docker images |
ceph |
mirantis.azurecr.io/ceph/ceph:v15.2.13 |
ceph-controller Updated |
mirantis.azurecr.io/ceph/mcp/ceph-controller:v1.0.0-20211013104642 |
|
cephcsi |
mirantis.azurecr.io/ceph/cephcsi/cephcsi:v3.3.1 |
|
csi-node-driver-registrar |
mirantis.azurecr.io/ceph/k8scsi/csi-node-driver-registrar:v2.1.0 |
|
csi-provisioner |
mirantis.azurecr.io/ceph/k8scsi/csi-provisioner:v2.1.2 |
|
csi-snapshotter |
mirantis.azurecr.io/ceph/k8scsi/csi-snapshotter:v4.0.0 |
|
csi-attacher |
mirantis.azurecr.io/ceph/k8scsi/csi-attacher:v3.1.0 |
|
csi-resizer |
mirantis.azurecr.io/ceph/k8scsi/csi-resizer:v1.1.0 |
|
rook |
mirantis.azurecr.io/ceph/rook/ceph:v1.6.8 |
Artifact |
Component |
Path |
|---|---|---|
Binaries Updated |
lcm-ansible |
https://binary.mirantis.com/lcm/bin/lcm-ansible/v0.11.0-6-gbfce76e/lcm-ansible.tar.gz |
lcm-agent |
https://binary.mirantis.com/lcm/bin/lcm-agent/v0.3.0-67-g25ab9f1a/lcm-agent |
|
Helm charts |
managed-lcm-api Updated |
https://binary.mirantis.com/core/helm/managed-lcm-api-1.26.6.tgz |
metallb Updated |
||
metrics-server |
https://binary.mirantis.com/core/helm/metrics-server-1.24.6.tgz |
|
Docker images |
helm |
mirantis.azurecr.io/lcm/helm/tiller:v2.16.11-40 |
helm-controller Updated |
mirantis.azurecr.io/lcm/lcm-controller:v0.3.0-67-g25ab9f1a |
|
metallb-controller |
mirantis.azurecr.io/lcm/metallb/controller:v0.9.3-1 |
|
metallb-speaker |
mirantis.azurecr.io/lcm/metallb/speaker:v0.9.3-1 |
|
metrics-server |
mirantis.azurecr.io/lcm/metrics-server-amd64/v0.3.6-1 |
Artifact |
Component |
Path |
|---|---|---|
Helm charts |
alerta |
https://binary.mirantis.com/stacklight/helm/alerta-0.1.0-mcp-22.tgz |
alertmanager-webhook-servicenow |
https://binary.mirantis.com/stacklight/helm/alertmanager-webhook-servicenow-0.1.0-mcp-3.tgz |
|
cerebro |
https://binary.mirantis.com/stacklight/helm/cerebro-0.1.0-mcp-2.tgz |
|
elasticsearch Updated |
https://binary.mirantis.com/stacklight/helm/elasticsearch-7.1.1-mcp-37.tgz |
|
elasticsearch-curator |
https://binary.mirantis.com/stacklight/helm/elasticsearch-curator-1.5.0-mcp-6.tgz |
|
elasticsearch-exporter |
https://binary.mirantis.com/stacklight/helm/elasticsearch-exporter-1.2.0-mcp-2.tgz |
|
fluentd |
https://binary.mirantis.com/stacklight/helm/fluentd-2.0.3-mcp-32.tgz |
|
fluentd-elasticsearch Updated |
https://binary.mirantis.com/stacklight/helm/fluentd-elasticsearch-3.0.0-mcp-105.tgz |
|
grafana |
https://binary.mirantis.com/stacklight/helm/grafana-3.3.10-mcp-110.tgz |
|
iam-proxy Updated |
||
kibana Updated |
https://binary.mirantis.com/stacklight/helm/kibana-3.2.1-mcp-30.tgz |
|
metric-collector |
https://binary.mirantis.com/stacklight/helm/metric-collector-0.2.0-mcp-12.tgz |
|
metricbeat |
https://binary.mirantis.com/stacklight/helm/metricbeat-1.7.1-mcp-12.tgz |
|
patroni |
https://binary.mirantis.com/stacklight/helm/patroni-0.15.1-mcp-34.tgz |
|
prometheus Updated |
https://binary.mirantis.com/stacklight/helm/prometheus-8.11.4-mcp-202.tgz |
|
prometheus-blackbox-exporter |
https://binary.mirantis.com/stacklight/helm/prometheus-blackbox-exporter-0.3.0-mcp-7.tgz |
|
prometheus-es-exporter |
https://binary.mirantis.com/stacklight/helm/prometheus-es-exporter-1.0.0-mcp-11.tgz |
|
prometheus-msteams |
https://binary.mirantis.com/stacklight/helm/prometheus-msteams-0.1.0-mcp-2.tgz |
|
prometheus-nginx-exporter |
https://binary.mirantis.com/stacklight/helm/prometheus-nginx-exporter-0.1.0-mcp-4.tgz |
|
sf-notifier |
https://binary.mirantis.com/stacklight/helm/sf-notifier-0.1.0-mcp-16.tgz |
|
sf-reporter New |
https://binary.mirantis.com/stacklight/helm/sf-reporter-0.1.0-mcp-13.tgz |
|
stacklight Updated |
https://binary.mirantis.com/stacklight/helm/stacklight-0.1.2-mcp-807.tgz |
|
telegraf-ds |
https://binary.mirantis.com/stacklight/helm/telegraf-ds-1.1.5-mcp-29.tgz |
|
telegraf-s |
https://binary.mirantis.com/stacklight/helm/telegraf-s-1.1.5-mcp-30.tgz |
|
telemeter-server |
https://binary.mirantis.com/stacklight/helm/telemeter-server-0.1.0-mcp-19.tgz |
|
telemeter-client |
https://binary.mirantis.com/stacklight/helm/telemeter-client-0.1.0-mcp-19.tgz |
|
Docker images |
alerta |
mirantis.azurecr.io/stacklight/alerta-web:8.4.1-20210707092546 |
alertmanager |
mirantis.azurecr.io/stacklight/alertmanager:v0.22.2 |
|
alertmanager-webhook-servicenow |
mirantis.azurecr.io/stacklight/alertmanager-webhook-servicenow:v0.1-20210601141858 |
|
busybox |
mirantis.azurecr.io/stacklight/busybox:1.30 |
|
cerebro |
mirantis.azurecr.io/stacklight/cerebro:0.9.3 |
|
configmap-reload |
mirantis.azurecr.io/stacklight/configmap-reload:v0.3.0 |
|
curl |
mirantis.azurecr.io/stacklight/curl:7.69.0 |
|
curl-jq |
mirantis.azurecr.io/stacklight/curl-jq:1.5-1 |
|
elasticsearch |
mirantis.azurecr.io/stacklight/elasticsearch:7.10.2-20210601104922 |
|
elasticsearch-curator |
mirantis.azurecr.io/stacklight/curator:5.7.6 |
|
elasticsearch-exporter |
mirantis.azurecr.io/stacklight/elasticsearch_exporter:1.0.2 |
|
fluentd Updated |
mirantis.azurecr.io/stacklight/fluentd:1.10.2-20210915110132 |
|
grafana Updated |
mirantis.azurecr.io/stacklight/grafana:8.1.2 |
|
grafana-image-renderer |
mirantis.azurecr.io/stacklight/grafana-image-renderer:2.0.1 |
|
kubectl |
mirantis.azurecr.io/stacklight/kubectl:1.19.13 |
|
k8s-sidecar |
mirantis.azurecr.io/stacklight/k8s-sidecar:1.10.8 |
|
kibana |
mirantis.azurecr.io/stacklight/kibana:7.10.2-20210601104911 |
|
kube-state-metrics |
mirantis.azurecr.io/stacklight/kube-state-metrics:v1.9.2 |
|
metric-collector |
mirantis.azurecr.io/stacklight/metric-collector:v0.1-20210219112938 |
|
metricbeat |
mirantis.azurecr.io/stacklight/metricbeat:7.10.2 |
|
node-exporter |
mirantis.azurecr.io/stacklight/node-exporter:v1.0.1 |
|
origin-telemeter |
mirantis.azurecr.io/stacklight/origin-telemeter:4.4.0-20200424 |
|
prometheus |
mirantis.azurecr.io/stacklight/prometheus:v2.22.2 |
|
prometheus-blackbox-exporter |
mirantis.azurecr.io/stacklight/blackbox-exporter:v0.14.0 |
|
prometheus-es-exporter |
mirantis.azurecr.io/stacklight/prometheus-es-exporter:v0.14.0-20210812120726 |
|
prometheus-msteams |
mirantis.azurecr.io/stacklight/prometheus-msteams:v1.4.2 |
|
prometheus-nginx-exporter |
mirantis.azurecr.io/stacklight/nginx-prometheus-exporter:0.6.0 |
|
prometheus-patroni-exporter |
mirantis.azurecr.io/stacklight/prometheus-patroni-exporter:v0.1-20210708141736 |
|
prometheus-postgres-exporter |
mirantis.azurecr.io/stacklight/prometheus-postgres-exporter:v0.9.0 |
|
prometheus-relay |
mirantis.azurecr.io/stacklight/prometheus-relay:v0.3-20210317133316 |
|
pushgateway |
mirantis.azurecr.io/stacklight/pushgateway:v1.2.0 |
|
sf-notifier Updated |
mirantis.azurecr.io/stacklight/sf-notifier:v0.3-20210930112115 |
|
sf-reporter New |
mirantis.azurecr.io/stacklight/sf-reporter:v0.1-20210607111404 |
|
spilo |
mirantis.azurecr.io/stacklight/spilo:13-2.0p6-20210525081943 |
|
telegraf |
mirantis.azurecr.io/stacklight/telegraf:v1.9.1-20210225152050 |
|
New mirantis.azurecr.io/stacklight/telegraf:1.20.0-20210927090119 |
||
telemeter-token-auth |
mirantis.azurecr.io/stacklight/telemeter-token-auth:v0.1-20200406175600 |
|
yq |
mirantis.azurecr.io/stacklight/yq:v4.2.0 |
Artifact |
Component |
Path |
|---|---|---|
Debian repositories |
System packages |
|
https://mirror.mirantis.com/kaas/ubuntu-2020-07-30-013349.target.txt |
||
MCR repositories |
MCR |
https://repos.mirantis.com/ubuntu/dists/bionic/pool/stable-20.10/ |
See also
The Cluster release 6.19.0 is introduced in the Mirantis Container Cloud release 2.12.0. This Cluster release is based on the Cluster release 5.19.0.
The Cluster release 6.19.0 supports:
Mirantis OpenStack for Kubernetes (MOS) 21.5. For details, see MOS Release Notes.
Mirantis Kubernetes Engine (MKE) 3.3.12. For details, see MKE Release Notes.
Mirantis Container Runtime (MCR) 20.10.6. For details, see MCR Release Notes.
Kubernetes 1.18.
For the list of addressed and known issues, refer to the Container Cloud release 2.12.0 section.
This section outlines new features and enhancements introduced in the Cluster release 6.19.0.
Updated the Mirantis Container Runtime (MCR) version from 20.10.5 to 20.10.6 and Mirantis Kubernetes Engine version from 3.3.6 to 3.3.12 for the Container Cloud management, regional, and managed clusters. Also, added support for attachment of existing MKE clusters 3.3.7-3.3.12 and 3.4.1-3.4.5.
For the MCR release highlights and components versions, see MCR documentation: MCR release notes and MKE documentation: MKE release notes.
Integrated the Ceph maintenance to the common upgrade procedure. Now, the
maintenance flag function is set up programmatically and the flag itself is
deprecated.
Technology Preview
Implemented the capability to specify RADOS Gateway tolerations through the
KaaSCephCluster spec using the native Rook way for setting resource
requirements for Ceph daemons.
Enhanced the Grafana dashboards to display user-friendly short names for
Kubernetes nodes, for example, master-0, instead of long name labels
such as kaas-node-f736fc1c-3baa-11eb-8262-0242ac110002.
This feature provides for consistency with Kubernetes nodes naming in the
Container Cloud web UI.
All Grafana dashboards that present node data now have an additional Node identifier drop-down menu. By default, it is set to machine to display short names for Kubernetes nodes. To display Kubernetes node name labels as previously, change this option to node.
Learn more
Implemented the following improvements to StackLight alerting:
Enhanced the alert inhibition rules.
Reworked a number of alerts to improve alerting efficiency and reduce alert flooding.
Removed the inefficient
DockerSwarmLeadElectionLoopandSystemDiskErrorsTooHighalerts.Added the
matcherskey to the routes configuration. Deprecated thematchandmatch_rekeys.
Learn more
Implemented the capability to create custom logs-based metrics that you can use to configure StackLight notifications.
Learn more
The following table lists the components versions of the Cluster release 6.19.0.
Note
The components that are newly added, updated, deprecated, or removed
as compared to the previous release version, are marked
with a corresponding superscript,
for example, lcm-ansible Updated.
Component |
Application/Service |
Version |
|---|---|---|
Cluster orchestration Updated |
Mirantis Kubernetes Engine |
3.3.12 0 |
Container runtime Updated |
Mirantis Container Runtime |
20.10.6 1 |
Distributed storage |
Ceph |
15.2.13 (Octopus) |
Rook |
1.6.8 |
|
LCM |
descheduler Removed |
n/a |
Helm |
2.16.11-40 |
|
helm-controller Updated |
0.3.0-32-gee08c2b8 |
|
lcm-ansible Updated |
0.10.0-12-g7cd13b6 |
|
lcm-agent Updated |
0.3.0-32-gee08c2b8 |
|
metallb-controller |
0.9.3-1 |
|
metrics-server |
0.3.6-1 |
|
StackLight |
Alerta |
8.4.1-20210707092546 |
Alertmanager |
0.22.2 |
|
Alertmanager Webhook ServiceNow |
0.1-20210601141858 |
|
Cerebro |
0.9.3 |
|
Elasticsearch |
7.10.2-20210601104922 |
|
Elasticsearch Curator |
5.7.6 |
|
Elasticsearch Exporter |
1.0.2 |
|
Fluentd |
1.10.2-20210602174807 |
|
Grafana |
7.5.4 |
|
Grafana Image Renderer |
2.0.1 |
|
IAM Proxy |
6.0.1 |
|
Kibana |
7.10.2-20210601104911 |
|
Metric Collector |
0.1-20210219112938 |
|
Metricbeat |
7.10.2 |
|
Patroni |
13-2.0p6-20210525081943 |
|
Prometheus |
2.22.2 |
|
Prometheus Blackbox Exporter |
0.14.0 |
|
Prometheus ES Exporter Updated |
0.14.0-20210812120726 |
|
Prometheus MS Teams |
1.4.2 |
|
Prometheus Node Exporter |
1.0.1 |
|
Prometheus NGINX Exporter |
0.6.0 |
|
Prometheus Patroni Exporter |
0.1-20210708141736 |
|
Prometheus Postgres Exporter |
0.9.0 |
|
Prometheus Relay |
0.3-20210317133316 |
|
Pushgateway |
1.2.0 |
|
sf-notifier |
0.3-20210702081359 |
|
Telegraf |
1.9.1-20210225142050 |
|
Telemeter |
4.4.0-20200424 |
- 0
For the MKE release highlights and components versions, see MKE documentation: MKE release notes.
- 1
For the Mirantis Container Runtime (MCR) release highlights, see MCR documentation: MCR release notes.
This section lists the components artifacts of the Cluster release 6.19.0.
Note
The components that are newly added, updated, deprecated, or removed
as compared to the previous release version, are marked
with a corresponding superscript,
for example, lcm-ansible Updated.
Artifact |
Component |
Path |
|---|---|---|
Helm chart |
ceph-controller Updated |
https://binary.mirantis.com/ceph/helm/ceph-operator-1.0.0-mcp-409.tgz |
Docker images |
ceph |
mirantis.azurecr.io/ceph/ceph:v15.2.13 |
ceph-controller Updated |
mirantis.azurecr.io/ceph/mcp/ceph-controller:v1.0.0-20210921155643 |
|
cephcsi |
mirantis.azurecr.io/ceph/cephcsi/cephcsi:v3.3.1 |
|
csi-node-driver-registrar |
mirantis.azurecr.io/ceph/k8scsi/csi-node-driver-registrar:v2.1.0 |
|
csi-provisioner Updated |
mirantis.azurecr.io/ceph/k8scsi/csi-provisioner:v2.1.2 |
|
csi-snapshotter |
mirantis.azurecr.io/ceph/k8scsi/csi-snapshotter:v4.0.0 |
|
csi-attacher |
mirantis.azurecr.io/ceph/k8scsi/csi-attacher:v3.1.0 |
|
csi-resizer |
mirantis.azurecr.io/ceph/k8scsi/csi-resizer:v1.1.0 |
|
rook |
mirantis.azurecr.io/ceph/rook/ceph:v1.6.8 |
Artifact |
Component |
Path |
|---|---|---|
Binaries Updated |
lcm-ansible |
https://binary.mirantis.com/lcm/bin/lcm-ansible/v0.10.0-12-g7cd13b6/lcm-ansible.tar.gz |
lcm-agent |
https://binary.mirantis.com/lcm/bin/lcm-agent/v0.3.0-32-gee08c2b8/lcm-agent |
|
Helm charts |
descheduler Removed |
n/a |
managed-lcm-api Updated |
https://binary.mirantis.com/core/helm/managed-lcm-api-1.25.6.tgz |
|
metallb Updated |
||
metrics-server |
https://binary.mirantis.com/core/helm/metrics-server-1.24.6.tgz |
|
Docker images |
descheduler Removed |
n/a |
helm |
mirantis.azurecr.io/lcm/helm/tiller:v2.16.11-40 |
|
helm-controller Updated |
mirantis.azurecr.io/lcm/lcm-controller:v0.3.0-32-gee08c2b8 |
|
metallb-controller |
mirantis.azurecr.io/lcm/metallb/controller:v0.9.3-1 |
|
metallb-speaker |
mirantis.azurecr.io/lcm/metallb/speaker:v0.9.3-1 |
|
metrics-server |
mirantis.azurecr.io/lcm/metrics-server-amd64/v0.3.6-1 |
Artifact |
Component |
Path |
|---|---|---|
Helm charts |
alerta |
https://binary.mirantis.com/stacklight/helm/alerta-0.1.0-mcp-22.tgz |
alertmanager-webhook-servicenow |
https://binary.mirantis.com/stacklight/helm/alertmanager-webhook-servicenow-0.1.0-mcp-3.tgz |
|
cerebro |
https://binary.mirantis.com/stacklight/helm/cerebro-0.1.0-mcp-2.tgz |
|
elasticsearch |
https://binary.mirantis.com/stacklight/helm/elasticsearch-7.1.1-mcp-36.tgz |
|
elasticsearch-curator |
https://binary.mirantis.com/stacklight/helm/elasticsearch-curator-1.5.0-mcp-6.tgz |
|
elasticsearch-exporter |
https://binary.mirantis.com/stacklight/helm/elasticsearch-exporter-1.2.0-mcp-2.tgz |
|
fluentd Updated |
https://binary.mirantis.com/stacklight/helm/fluentd-2.0.3-mcp-32.tgz |
|
fluentd-elasticsearch Updated |
https://binary.mirantis.com/stacklight/helm/fluentd-elasticsearch-3.0.0-mcp-97.tgz |
|
grafana Updated |
https://binary.mirantis.com/stacklight/helm/grafana-3.3.10-mcp-110.tgz |
|
iam-proxy Updated |
||
kibana |
https://binary.mirantis.com/stacklight/helm/kibana-3.2.1-mcp-29.tgz |
|
metric-collector |
https://binary.mirantis.com/stacklight/helm/metric-collector-0.2.0-mcp-12.tgz |
|
metricbeat |
https://binary.mirantis.com/stacklight/helm/metricbeat-1.7.1-mcp-12.tgz |
|
patroni Updated |
https://binary.mirantis.com/stacklight/helm/patroni-0.15.1-mcp-34.tgz |
|
prometheus Updated |
https://binary.mirantis.com/stacklight/helm/prometheus-8.11.4-mcp-201.tgz |
|
prometheus-blackbox-exporter |
https://binary.mirantis.com/stacklight/helm/prometheus-blackbox-exporter-0.3.0-mcp-7.tgz |
|
prometheus-es-exporter Updated |
https://binary.mirantis.com/stacklight/helm/prometheus-es-exporter-1.0.0-mcp-11.tgz |
|
prometheus-msteams |
https://binary.mirantis.com/stacklight/helm/prometheus-msteams-0.1.0-mcp-2.tgz |
|
prometheus-nginx-exporter |
https://binary.mirantis.com/stacklight/helm/prometheus-nginx-exporter-0.1.0-mcp-4.tgz |
|
sf-notifier |
https://binary.mirantis.com/stacklight/helm/sf-notifier-0.1.0-mcp-16.tgz |
|
stacklight Updated |
https://binary.mirantis.com/stacklight/helm/stacklight-0.1.2-mcp-595.tgz |
|
telegraf-ds |
https://binary.mirantis.com/stacklight/helm/telegraf-ds-1.1.5-mcp-29.tgz |
|
telegraf-s Updated |
https://binary.mirantis.com/stacklight/helm/telegraf-s-1.1.5-mcp-30.tgz |
|
telemeter-server Updated |
https://binary.mirantis.com/stacklight/helm/telemeter-server-0.1.0-mcp-19.tgz |
|
telemeter-client Updated |
https://binary.mirantis.com/stacklight/helm/telemeter-client-0.1.0-mcp-19.tgz |
|
Docker images |
alerta |
mirantis.azurecr.io/stacklight/alerta-web:8.4.1-20210707092546 |
alertmanager |
mirantis.azurecr.io/stacklight/alertmanager:v0.22.2 |
|
alertmanager-webhook-servicenow |
mirantis.azurecr.io/stacklight/alertmanager-webhook-servicenow:v0.1-20210601141858 |
|
busybox |
mirantis.azurecr.io/stacklight/busybox:1.30 |
|
cerebro |
mirantis.azurecr.io/stacklight/cerebro:0.9.3 |
|
configmap-reload |
mirantis.azurecr.io/stacklight/configmap-reload:v0.3.0 |
|
curl |
mirantis.azurecr.io/stacklight/curl:7.69.0 |
|
curl-jq |
mirantis.azurecr.io/stacklight/curl-jq:1.5-1 |
|
elasticsearch |
mirantis.azurecr.io/stacklight/elasticsearch:7.10.2-20210601104922 |
|
elasticsearch-curator |
mirantis.azurecr.io/stacklight/curator:5.7.6 |
|
elasticsearch-exporter |
mirantis.azurecr.io/stacklight/elasticsearch_exporter:1.0.2 |
|
fluentd |
mirantis.azurecr.io/stacklight/fluentd:1.10.2-20210602174807 |
|
grafana |
mirantis.azurecr.io/stacklight/grafana:7.5.4 |
|
grafana-image-renderer |
mirantis.azurecr.io/stacklight/grafana-image-renderer:2.0.1 |
|
kubectl |
mirantis.azurecr.io/stacklight/kubectl:1.19.13 |
|
k8s-sidecar |
mirantis.azurecr.io/stacklight/k8s-sidecar:1.10.8 |
|
kibana |
mirantis.azurecr.io/stacklight/kibana:7.10.2-20210601104911 |
|
kube-state-metrics |
mirantis.azurecr.io/stacklight/kube-state-metrics:v1.9.2 |
|
metric-collector |
mirantis.azurecr.io/stacklight/metric-collector:v0.1-20210219112938 |
|
metricbeat |
mirantis.azurecr.io/stacklight/metricbeat:7.10.2 |
|
node-exporter |
mirantis.azurecr.io/stacklight/node-exporter:v1.0.1 |
|
origin-telemeter |
mirantis.azurecr.io/stacklight/origin-telemeter:4.4.0-20200424 |
|
prometheus |
mirantis.azurecr.io/stacklight/prometheus:v2.22.2 |
|
prometheus-blackbox-exporter |
mirantis.azurecr.io/stacklight/blackbox-exporter:v0.14.0 |
|
prometheus-es-exporter Updated |
mirantis.azurecr.io/stacklight/prometheus-es-exporter:v0.14.0-20210812120726 |
|
prometheus-msteams |
mirantis.azurecr.io/stacklight/prometheus-msteams:v1.4.2 |
|
prometheus-nginx-exporter |
mirantis.azurecr.io/stacklight/nginx-prometheus-exporter:0.6.0 |
|
prometheus-patroni-exporter |
mirantis.azurecr.io/stacklight/prometheus-patroni-exporter:v0.1-20210708141736 |
|
prometheus-postgres-exporter |
mirantis.azurecr.io/stacklight/prometheus-postgres-exporter:v0.9.0 |
|
prometheus-relay |
mirantis.azurecr.io/stacklight/prometheus-relay:v0.3-20210317133316 |
|
pushgateway |
mirantis.azurecr.io/stacklight/pushgateway:v1.2.0 |
|
sf-notifier |
mirantis.azurecr.io/stacklight/sf-notifier:v0.3-20210702081359 |
|
spilo |
mirantis.azurecr.io/stacklight/spilo:13-2.0p6-20210525081943 |
|
telegraf |
mirantis.azurecr.io/stacklight/telegraf:v1.9.1-20210225152050 |
|
telemeter-token-auth |
mirantis.azurecr.io/stacklight/telemeter-token-auth:v0.1-20200406175600 |
|
yq |
mirantis.azurecr.io/stacklight/yq:v4.2.0 |
Artifact |
Component |
Path |
|---|---|---|
Debian repositories |
System packages |
|
https://mirror.mirantis.com/kaas/ubuntu-2020-07-30-013349.target.txt |
||
MCR repositories |
MCR |
https://repos.mirantis.com/ubuntu/dists/bionic/pool/stable-20.10/ Updated |
See also
The Cluster release 6.18.0 is introduced in the Mirantis Container Cloud release 2.11.0. This Cluster release is based on the Cluster release 5.18.0.
The Cluster release 6.18.0 supports:
Mirantis OpenStack for Kubernetes (MOS) 21.4. For details, see MOS Release Notes.
Mirantis Kubernetes Engine (MKE) 3.3.6 and the updated version of Mirantis Container Runtime (MCR) 20.10.5. For details, see MKE Release Notes and MCR Release Notes.
Kubernetes 1.18.
For the list of addressed issues, refer to the Container Cloud releases 2.10.0 and 2.11.0 sections. For the list of known issues, refer to the Container Cloud release 2.11.0.
This section outlines new features and enhancements introduced in the Cluster release 6.18.0.
Implemented a graceful Mirantis Container Runtime (MCR) upgrade from 19.03.14 to 20.10.5 on existing Container Cloud clusters.
Improved the MKE logs gathering by replacing the default DEBUG logs level
with INFO. This change reduces the unnecessary load on the MKE cluster
caused by an excessive amount of logs generated with the DEBUG level
enabled.
Implemented the capability to configure the verbosity level of logs produced by all StackLight components or by each component separately.
Implemented the capability to set the default log level severity for all StackLight components as well as set a custom log level severity for specific StackLight components in the Container Cloud web UI. You can update this setting either during a managed cluster creation or during a post-deployment configuration.
Implemented the following improvements to StackLight alerting:
Added the following alerts:
PrometheusMsTeamsDownthat raises ifprometheus-msteamsis down.ServiceNowWebhookReceiverDownthat raises ifalertmanager-webhook-servicenowis down.SfNotifierDownthat raises if thesf-notifieris down.KubeAPICertExpirationMajor,KubeAPICertExpirationWarning,MKEAPICertExpirationMajor,MKEAPICertExpirationWarningthat inform on SSL certificates expiration.KubeContainersCPUThrottlingHighthat raises in case of containers CPU throttling.KubeletDownthat raises if kubelet is down.
Removed the following inefficient alerts:
PostgresqlPrimaryDownFileDescriptorUsageCriticalKubeCPUOvercommitNamespacesKubeMemOvercommitNamespacesKubeQuotaExceededContainerScrapeError
Reworked a number of alerts to improve alerting efficiency and reduce alert flooding.
Reworked the alert inhibition rules to match the receivers.
Updated Alertmanager to v0.22.2.
Changed the default behavior of the Salesforce alerts integration. Now, by default, only
Criticalalerts will be sent to the Salesforce.
Implemented the following improvements for the StackLight node labeling during a cluster creation or post-deployment configuration:
Added a verification that a cluster contains minimum 3 worker nodes with the StackLight label for clusters with StackLight deployed in HA mode. This verification applies to cluster deployment and update processes. For details on how to add the StackLight label before upgrade to the latest Cluster releases of Container Cloud 2.11.0, refer to Upgrade managed clusters with StackLight deployed in HA mode.
Added a notification about the minimum number of worker nodes with the StackLight label for HA StackLight deployments to the cluster live status description in the Container Cloud web UI.
Caution
Removal of the StackLight label from worker nodes along with removal of worker nodes with StackLight label can cause the StackLight components to become inaccessible. It is important to keep the worker nodes where the StackLight local volumes were provisioned.
Implemented the capability to enable feed update in Salesforce using
the feed_enabled parameter. By default, this parameter is set to false
to save API calls.
Implemented the capability to add or configure proxy on existing Container Cloud managed clusters using the Container Cloud web UI.
Learn more
Upgraded Ceph from 14.2.19 (Nautilus) to 15.2.13 (Octopus) and Rook from 1.5.9 to 1.6.8.
On top of continuous improvements delivered to the existing Container Cloud guides, added the following procedures:
Technology Preview
Implemented the capability to define Ceph tolerations and resources management
through the KaaSCephCluster spec using the native Rook way for setting
resource requirements for Ceph daemons.
Improved the MiraCephLog custom resource by adding more information about
all Ceph cluster entities and their statuses. The MiraCeph, MiraCephLog
statuses and MiraCephLog values are now integrated to
KaaSCephCluster.status and can be viewed using the miraCephInfo,
shortClusterInfo, and fullClusterInfo fields.
Implemented the capability to define a list of Ceph Manager modules to enable
on the Ceph cluster using the mgr.modules parameter in KaaSCephCluster.
The following table lists the components versions of the Cluster release 6.18.0.
Note
The components that are newly added, updated, deprecated, or removed
as compared to the previous release version, are marked
with a corresponding superscript,
for example, lcm-ansible Updated.
Component |
Application/Service |
Version |
|---|---|---|
Cluster orchestration |
Mirantis Kubernetes Engine Updated |
3.3.6 0 |
Container runtime |
Mirantis Container Runtime Updated |
20.10.5 1 |
Distributed storage Updated |
Ceph |
15.2.13 (Octopus) |
Rook |
1.6.8 |
|
LCM |
descheduler |
0.8.0 |
Helm |
2.16.11-40 |
|
helm-controller Updated |
0.2.0-399-g85be100f |
|
lcm-ansible Updated |
0.9.0-17-g28bc9ce |
|
lcm-agent Updated |
0.2.0-399-g85be100f |
|
metallb-controller |
0.9.3-1 |
|
metrics-server |
0.3.6-1 |
|
StackLight |
Alerta Updated |
8.4.1-20210707092546 |
Alertmanager Updated |
0.22.2 |
|
Alertmanager Webhook ServiceNow Updated |
0.1-20210601141858 |
|
Cerebro |
0.9.3 |
|
Elasticsearch Updated |
7.10.2-20210601104922 |
|
Elasticsearch Curator |
5.7.6 |
|
Elasticsearch Exporter |
1.0.2 |
|
Fluentd Updated |
1.10.2-20210602174807 |
|
Grafana |
7.5.4 |
|
Grafana Image Renderer |
2.0.1 |
|
IAM Proxy |
6.0.1 |
|
Kibana Updated |
7.10.2-20210601104911 |
|
Metric Collector |
0.1-20210219112938 |
|
Metricbeat |
7.10.2 |
|
Patroni |
13-2.0p6-20210525081943 |
|
Prometheus |
2.22.2 |
|
Prometheus Blackbox Exporter |
0.14.0 |
|
Prometheus ES Exporter |
0.5.1-20210323132924 |
|
Prometheus MS Teams |
1.4.2 |
|
Prometheus Node Exporter |
1.0.1 |
|
Prometheus NGINX Exporter |
0.6.0 |
|
Prometheus Patroni Exporter Updated |
0.1-20210708141736 |
|
Prometheus Postgres Exporter |
0.9.0 |
|
Prometheus Relay |
0.3-20210317133316 |
|
Pushgateway |
1.2.0 |
|
sf-notifier Updated |
0.3-20210702081359 |
|
Telegraf |
1.9.1-20210225142050 |
|
Telemeter |
4.4.0-20200424 |
- 0
For the MKE release highlights and components versions, see MKE documentation: MKE release notes.
- 1
For the MCR release highlights, see MCR documentation: MCR release notes.
Due to the development limitations, the MCR upgrade to version 19.03.14 on existing Container Cloud clusters is not supported.
This section lists the components artifacts of the Cluster release 6.18.0.
Note
The components that are newly added, updated, deprecated, or removed
as compared to the previous release version, are marked
with a corresponding superscript,
for example, lcm-ansible Updated.
Artifact |
Component |
Path |
|---|---|---|
Helm chart |
ceph-controller Updated |
https://binary.mirantis.com/ceph/helm/ceph-operator-1.0.0-mcp-368.tgz |
Docker images |
ceph Updated |
mirantis.azurecr.io/ceph/ceph:v15.2.13 |
ceph-controller Updated |
mirantis.azurecr.io/ceph/mcp/ceph-controller:v1.0.0-20210807103257 |
|
cephcsi Updated |
mirantis.azurecr.io/ceph/cephcsi/cephcsi:v3.3.1 |
|
csi-node-driver-registrar |
mirantis.azurecr.io/ceph/k8scsi/csi-node-driver-registrar:v2.1.0 |
|
csi-provisioner Updated |
mirantis.azurecr.io/ceph/k8scsi/csi-provisioner:v2.1.2 |
|
csi-snapshotter |
mirantis.azurecr.io/ceph/k8scsi/csi-snapshotter:v4.0.0 |
|
csi-attacher |
mirantis.azurecr.io/ceph/k8scsi/csi-attacher:v3.1.0 |
|
csi-resizer |
mirantis.azurecr.io/ceph/k8scsi/csi-resizer:v1.1.0 |
|
rook Updated |
mirantis.azurecr.io/ceph/rook/ceph:v1.6.8 |
Artifact |
Component |
Path |
|---|---|---|
Binaries Updated |
lcm-ansible |
https://binary.mirantis.com/lcm/bin/lcm-ansible/v0.9.0-17-g28bc9ce/lcm-ansible.tar.gz |
lcm-agent Updated |
https://binary.mirantis.com/lcm/bin/lcm-agent/v0.2.0-399-g85be100f/lcm-agent |
|
Helm charts Updated |
descheduler |
https://binary.mirantis.com/core/helm/descheduler-1.24.6.tgz |
managed-lcm-api |
https://binary.mirantis.com/core/helm/managed-lcm-api-1.24.6.tgz |
|
metallb |
||
metrics-server |
https://binary.mirantis.com/core/helm/metrics-server-1.24.6.tgz |
|
Docker images |
descheduler |
mirantis.azurecr.io/lcm/descheduler/v0.8.0 |
helm |
mirantis.azurecr.io/lcm/helm/tiller:v2.16.11-40 |
|
helm-controller Updated |
mirantis.azurecr.io/lcm/lcm-controller:v0.2.0-399-g85be100f |
|
metallb-controller |
mirantis.azurecr.io/lcm/metallb/controller:v0.9.3-1 |
|
metallb-speaker |
mirantis.azurecr.io/lcm/metallb/speaker:v0.9.3-1 |
|
metrics-server |
mirantis.azurecr.io/lcm/metrics-server-amd64/v0.3.6-1 |
Artifact |
Component |
Path |
|---|---|---|
Helm charts |
alerta Updated |
https://binary.mirantis.com/stacklight/helm/alerta-0.1.0-mcp-22.tgz |
alertmanager-webhook-servicenow |
https://binary.mirantis.com/stacklight/helm/alertmanager-webhook-servicenow-0.1.0-mcp-3.tgz |
|
cerebro |
https://binary.mirantis.com/stacklight/helm/cerebro-0.1.0-mcp-2.tgz |
|
elasticsearch Updated |
https://binary.mirantis.com/stacklight/helm/elasticsearch-7.1.1-mcp-36.tgz |
|
elasticsearch-curator Updated |
https://binary.mirantis.com/stacklight/helm/elasticsearch-curator-1.5.0-mcp-6.tgz |
|
elasticsearch-exporter |
https://binary.mirantis.com/stacklight/helm/elasticsearch-exporter-1.2.0-mcp-2.tgz |
|
fluentd Updated |
https://binary.mirantis.com/stacklight/helm/fluentd-2.0.3-mcp-30.tgz |
|
fluentd-elasticsearch Updated |
https://binary.mirantis.com/stacklight/helm/fluentd-elasticsearch-3.0.0-mcp-96.tgz |
|
grafana Updated |
https://binary.mirantis.com/stacklight/helm/grafana-3.3.10-mcp-108.tgz |
|
iam-proxy Updated |
||
kibana Updated |
https://binary.mirantis.com/stacklight/helm/kibana-3.2.1-mcp-29.tgz |
|
metric-collector Updated |
https://binary.mirantis.com/stacklight/helm/metric-collector-0.2.0-mcp-12.tgz |
|
metricbeat Updated |
https://binary.mirantis.com/stacklight/helm/metricbeat-1.7.1-mcp-12.tgz |
|
patroni Updated |
https://binary.mirantis.com/stacklight/helm/patroni-0.15.1-mcp-33.tgz |
|
prometheus Updated |
https://binary.mirantis.com/stacklight/helm/prometheus-8.11.4-mcp-188.tgz |
|
prometheus-blackbox-exporter Updated |
https://binary.mirantis.com/stacklight/helm/prometheus-blackbox-exporter-0.3.0-mcp-7.tgz |
|
prometheus-es-exporter Updated |
https://binary.mirantis.com/stacklight/helm/prometheus-es-exporter-1.0.0-mcp-10.tgz |
|
prometheus-msteams |
https://binary.mirantis.com/stacklight/helm/prometheus-msteams-0.1.0-mcp-2.tgz |
|
prometheus-nginx-exporter |
https://binary.mirantis.com/stacklight/helm/prometheus-nginx-exporter-0.1.0-mcp-4.tgz |
|
sf-notifier Updated |
https://binary.mirantis.com/stacklight/helm/sf-notifier-0.1.0-mcp-16.tgz |
|
stacklight Updated |
https://binary.mirantis.com/stacklight/helm/stacklight-0.1.2-mcp-574.tgz |
|
telegraf-ds Updated |
https://binary.mirantis.com/stacklight/helm/telegraf-ds-1.1.5-mcp-29.tgz |
|
telegraf-s Updated |
https://binary.mirantis.com/stacklight/helm/telegraf-s-1.1.5-mcp-29.tgz |
|
telemeter-server Updated |
https://binary.mirantis.com/stacklight/helm/telemeter-server-0.1.0-mcp-17.tgz |
|
telemeter-client Updated |
https://binary.mirantis.com/stacklight/helm/telemeter-client-0.1.0-mcp-17.tgz |
|
Docker images |
alerta Updated |
mirantis.azurecr.io/stacklight/alerta-web:8.4.1-20210707092546 |
alertmanager Updated |
mirantis.azurecr.io/stacklight/alertmanager:v0.22.2 |
|
alertmanager-webhook-servicenow Updated |
mirantis.azurecr.io/stacklight/alertmanager-webhook-servicenow:v0.1-20210601141858 |
|
busybox |
mirantis.azurecr.io/stacklight/busybox:1.30 |
|
cerebro |
mirantis.azurecr.io/stacklight/cerebro:0.9.3 |
|
configmap-reload |
mirantis.azurecr.io/stacklight/configmap-reload:v0.3.0 |
|
curl |
mirantis.azurecr.io/stacklight/curl:7.69.0 |
|
curl-jq |
mirantis.azurecr.io/stacklight/curl-jq:1.5-1 |
|
elasticsearch Updated |
mirantis.azurecr.io/stacklight/elasticsearch:7.10.2-20210601104922 |
|
elasticsearch-curator |
mirantis.azurecr.io/stacklight/curator:5.7.6 |
|
elasticsearch-exporter |
mirantis.azurecr.io/stacklight/elasticsearch_exporter:1.0.2 |
|
fluentd Updated |
mirantis.azurecr.io/stacklight/fluentd:1.10.2-20210602174807 |
|
grafana |
mirantis.azurecr.io/stacklight/grafana:7.5.4 |
|
grafana-image-renderer |
mirantis.azurecr.io/stacklight/grafana-image-renderer:2.0.1 |
|
kubectl Updated |
mirantis.azurecr.io/stacklight/kubectl:1.19.13 |
|
k8s-sidecar |
mirantis.azurecr.io/stacklight/k8s-sidecar:1.10.8 |
|
kibana Updated |
mirantis.azurecr.io/stacklight/kibana:7.10.2-20210601104911 |
|
kube-state-metrics |
mirantis.azurecr.io/stacklight/kube-state-metrics:v1.9.2 |
|
metric-collector |
mirantis.azurecr.io/stacklight/metric-collector:v0.1-20210219112938 |
|
metricbeat |
mirantis.azurecr.io/stacklight/metricbeat:7.10.2 |
|
node-exporter |
mirantis.azurecr.io/stacklight/node-exporter:v1.0.1 |
|
origin-telemeter |
mirantis.azurecr.io/stacklight/origin-telemeter:4.4.0-20200424 |
|
prometheus |
mirantis.azurecr.io/stacklight/prometheus:v2.22.2 |
|
prometheus-blackbox-exporter |
mirantis.azurecr.io/stacklight/blackbox-exporter:v0.14.0 |
|
prometheus-es-exporter |
mirantis.azurecr.io/stacklight/prometheus-es-exporter:v0.5.1-20210323132924 |
|
prometheus-msteams |
mirantis.azurecr.io/stacklight/prometheus-msteams:v1.4.2 |
|
prometheus-nginx-exporter |
mirantis.azurecr.io/stacklight/nginx-prometheus-exporter:0.6.0 |
|
prometheus-patroni-exporter Updated |
mirantis.azurecr.io/stacklight/prometheus-patroni-exporter:v0.1-20210708141736 |
|
prometheus-postgres-exporter |
mirantis.azurecr.io/stacklight/prometheus-postgres-exporter:v0.9.0 |
|
prometheus-relay |
mirantis.azurecr.io/stacklight/prometheus-relay:v0.3-20210317133316 |
|
pushgateway |
mirantis.azurecr.io/stacklight/pushgateway:v1.2.0 |
|
sf-notifier Updated |
mirantis.azurecr.io/stacklight/sf-notifier:v0.3-20210702081359 |
|
spilo |
mirantis.azurecr.io/stacklight/spilo:13-2.0p6-20210525081943 |
|
telegraf |
mirantis.azurecr.io/stacklight/telegraf:v1.9.1-20210225152050 |
|
telemeter-token-auth |
mirantis.azurecr.io/stacklight/telemeter-token-auth:v0.1-20200406175600 |
|
yq |
mirantis.azurecr.io/stacklight/yq:v4.2.0 |
Artifact |
Component |
Path |
|---|---|---|
Debian repositories |
System packages |
|
https://mirror.mirantis.com/kaas/ubuntu-2020-07-30-013349.target.txt |
||
MCR repositories Updated |
MCR |
https://repos.mirantis.com/ubuntu/dists/bionic/pool/stable-20.10/ |
See also
The Cluster release 6.16.0 is introduced in the Mirantis Container Cloud release 2.9.0. This Cluster release is based on the Cluster release 5.16.0.
The Cluster release 6.16.0 supports:
Mirantis OpenStack for Kubernetes (MOS) 21.3. For details, see MOS Release Notes.
Mirantis Kubernetes Engine (MKE) 3.3.6 and Mirantis Container Runtime (MCR) 19.03.14. For details, see MKE Release Notes and MCR Release Notes.
Kubernetes 1.18.
For the list of addressed issues, refer to the Container Cloud releases 2.8.0 and 2.9.0 sections. For the list of known issues, refer to the Container Cloud release 2.9.0.
This section outlines new features and enhancements introduced in the Cluster release 6.16.0.
Upgraded PostgreSQL from version 12 to 13
Updated Elasticsearch, Kibana, and Metricbeat from version 7.6.1 to 7.10.2
Implemented the capability to enable Alertmanager to send notifications to a Microsoft Teams channel.
Learn more
Implemented the capability to enable Alertmanager to send notifications to
ServiceNow. Also added the ServiceNowAuthFailure alert that will raise in
case of failure to authenticate to ServiceNow.
Learn more
Improved the log collection mechanism by optimizing the existing and adding new log parsers for multiple Container Cloud components.
Learn more
Enhanced Ceph Controller to automatically specify default configuration options for each Ceph cluster during the Ceph deployment.
Implemented the following Ceph enhancements in the KaaSCephCluster CR:
Added the capability to specify the
rgwrole using therolesparameterAdded the following parameters:
rookConfigto override the Ceph configuration optionsuseAsFullNameto enable the Ceph block pool to use only thenamevalue as a nametargetSizeRatioto specify the expected consumption of the Ceph cluster total capacitySSLCertto use a custom TLS certificate to access the Ceph RGW endpointnodeGroupsto easily define specifications for multiple Ceph nodes using lists, grouped by node lists or node labelsclientsto specify the Ceph clients and their capabilities
Implemented the capability to configure multiple networks for a Ceph cluster.
Learn more
Implemented the capability to configure TLS for a Ceph cluster using a custom ingress rule for Ceph public endpoints.
Implemented the capability to enable RADOS Block Device (RBD) mirroring for Ceph pools.
Learn more
The following table lists the components versions of the Cluster release 6.16.0.
Note
The components that are newly added, updated, deprecated, or removed
as compared to the previous release version, are marked
with a corresponding superscript,
for example, lcm-ansible Updated.
Component |
Application/Service |
Version |
|---|---|---|
Distributed storage Updated |
Ceph |
14.2.19 (Nautilus) |
Rook |
1.5.9 |
|
Container runtime |
Mirantis Container Runtime |
19.03.14 1 |
Cluster orchestration |
Mirantis Kubernetes Engine Updated |
3.3.6 0 |
LCM |
descheduler |
0.8.0 |
Helm |
2.16.11-40 |
|
helm-controller Updated |
0.2.0-349-g4870b7f5 |
|
lcm-ansible Updated |
0.7.0-9-g30acaae |
|
lcm-agent Updated |
0.2.0-349-g4870b7f5 |
|
metallb-controller |
0.9.3-1 |
|
metrics-server |
0.3.6-1 |
|
StackLight |
Alerta |
8.4.1-20210312131419 |
Alertmanager |
0.21.0 |
|
Alertmanager Webhook ServiceNow New |
0.1-20210426114325 |
|
Cerebro |
0.9.3 |
|
Elasticsearch Updated |
7.10.2-20210513065347 |
|
Elasticsearch Curator |
5.7.6 |
|
Elasticsearch Exporter |
1.0.2 |
|
Fluentd Updated |
1.10.2-20210518100631 |
|
Grafana Updated |
7.5.4 |
|
Grafana Image Renderer |
2.0.1 |
|
IAM Proxy |
6.0.1 |
|
Kibana Updated |
7.10.2-20210513065546 |
|
Metric Collector |
0.1-20210219112938 |
|
Metricbeat Updated |
7.10.2 |
|
Netchecker Deprecated |
1.4.1 |
|
Patroni Updated |
13-2.0p6-20210525081943 |
|
Prometheus |
2.22.2 |
|
Prometheus Blackbox Exporter |
0.14.0 |
|
Prometheus ES Exporter |
0.5.1-20210323132924 |
|
Prometheus MS Teams New |
1.4.2 |
|
Prometheus Node Exporter |
1.0.1 |
|
Prometheus NGINX Exporter |
0.6.0 |
|
Prometheus Patroni Exporter |
0.1-20200428121305 |
|
Prometheus Postgres Exporter Updated |
0.9.0 |
|
Prometheus Relay |
0.3-20210317133316 |
|
Pushgateway |
1.2.0 |
|
sf-notifier |
0.3-20210323132354 |
|
sf-reporter |
0.1-20201216142628 |
|
Telegraf |
1.9.1-20210225142050 |
|
Telemeter |
4.4.0-20200424 |
- 0
For the MKE release highlights and components versions, see MKE documentation: MKE release notes.
- 1
For the MCR release highlights, see MCR documentation: MCR release notes.
Due to the development limitations, the MCR upgrade to version 19.03.14 on existing Container Cloud clusters is not supported.
This section lists the components artifacts of the Cluster release 6.16.0.
Note
The components that are newly added, updated, deprecated, or removed
as compared to the previous release version, are marked
with a corresponding superscript,
for example, lcm-ansible Updated.
Artifact |
Component |
Path |
|---|---|---|
Helm chart |
ceph-controller Updated |
https://binary.mirantis.com/ceph/helm/ceph-operator-1.0.0-mcp-271.tgz |
Docker images |
ceph Updated |
mirantis.azurecr.io/ceph/ceph:v14.2.19 |
ceph-controller Updated |
mirantis.azurecr.io/ceph/mcp/ceph-controller:v1.0.0-20210521190241 |
|
cephcsi |
mirantis.azurecr.io/ceph/cephcsi/cephcsi:v3.2.1 |
|
csi-node-driver-registrar |
mirantis.azurecr.io/ceph/k8scsi/csi-node-driver-registrar:v2.1.0 |
|
csi-provisioner Updated |
mirantis.azurecr.io/ceph/k8scsi/csi-provisioner:v2.1.1 |
|
csi-snapshotter |
mirantis.azurecr.io/ceph/k8scsi/csi-snapshotter:v4.0.0 |
|
csi-attacher |
mirantis.azurecr.io/ceph/k8scsi/csi-attacher:v3.1.0 |
|
csi-resizer |
mirantis.azurecr.io/ceph/k8scsi/csi-resizer:v1.1.0 |
|
rook Updated |
mirantis.azurecr.io/ceph/rook/ceph:v1.5.9 |
Artifact |
Component |
Path |
|---|---|---|
Binaries |
lcm-ansible Updated |
https://binary.mirantis.com/lcm/bin/lcm-ansible/v0.7.0-9-g30acaae/lcm-ansible.tar.gz |
lcm-agent Updated |
https://binary.mirantis.com/lcm/bin/lcm-agent/v0.2.0-349-g4870b7f5/lcm-agent |
|
Helm charts Updated |
descheduler |
https://binary.mirantis.com/core/helm/descheduler-1.22.4.tgz |
managed-lcm-api |
https://binary.mirantis.com/core/helm/managed-lcm-api-1.22.4.tgz |
|
metallb |
||
metrics-server |
https://binary.mirantis.com/core/helm/metrics-server-1.22.4.tgz |
|
Docker images |
descheduler |
mirantis.azurecr.io/lcm/descheduler/v0.8.0 |
helm |
mirantis.azurecr.io/lcm/helm/tiller:v2.16.11-40 |
|
helm-controller Updated |
mirantis.azurecr.io/lcm/lcm-controller:v0.2.0-349-g4870b7f5 |
|
metallb-controller |
mirantis.azurecr.io/lcm/metallb/controller:v0.9.3-1 |
|
metallb-speaker |
mirantis.azurecr.io/lcm/metallb/speaker:v0.9.3-1 |
|
metrics-server |
mirantis.azurecr.io/lcm/metrics-server-amd64/v0.3.6-1 |
Artifact |
Component |
Path |
|---|---|---|
Helm charts |
alerta Updated |
https://binary.mirantis.com/stacklight/helm/alerta-0.1.0-mcp-20.tgz |
alertmanager-webhook-servicenow New |
https://binary.mirantis.com/stacklight/helm/alertmanager-webhook-servicenow-0.1.0-mcp-3.tgz |
|
cerebro |
https://binary.mirantis.com/stacklight/helm/cerebro-0.1.0-mcp-2.tgz |
|
elasticsearch Updated |
https://binary.mirantis.com/stacklight/helm/elasticsearch-7.1.1-mcp-31.tgz |
|
elasticsearch-curator |
https://binary.mirantis.com/stacklight/helm/elasticsearch-curator-1.5.0-mcp-2.tgz |
|
elasticsearch-exporter |
https://binary.mirantis.com/stacklight/helm/elasticsearch-exporter-1.2.0-mcp-2.tgz |
|
fluentd Updated |
https://binary.mirantis.com/stacklight/helm/fluentd-2.0.3-mcp-20.tgz |
|
fluentd-elasticsearch Updated |
https://binary.mirantis.com/stacklight/helm/fluentd-elasticsearch-3.0.0-mcp-83.tgz |
|
grafana Updated |
https://binary.mirantis.com/stacklight/helm/grafana-3.3.10-mcp-102.tgz |
|
iam-proxy |
||
kibana Updated |
https://binary.mirantis.com/stacklight/helm/kibana-3.2.1-mcp-25.tgz |
|
metric-collector |
https://binary.mirantis.com/stacklight/helm/metric-collector-0.2.0-mcp-8.tgz |
|
metricbeat |
https://binary.mirantis.com/stacklight/helm/metricbeat-1.7.1-mcp-8.tgz |
|
netchecker Deprecated |
||
patroni Updated |
https://binary.mirantis.com/stacklight/helm/patroni-0.15.1-mcp-24.tgz |
|
prometheus Updated |
https://binary.mirantis.com/stacklight/helm/prometheus-8.11.4-mcp-139.tgz |
|
prometheus-blackbox-exporter |
https://binary.mirantis.com/stacklight/helm/prometheus-blackbox-exporter-0.3.0-mcp-4.tgz |
|
prometheus-es-exporter |
https://binary.mirantis.com/stacklight/helm/prometheus-es-exporter-1.0.0-mcp-3.tgz |
|
prometheus-msteams New |
https://binary.mirantis.com/stacklight/helm/prometheus-msteams-0.1.0-mcp-2.tgz |
|
prometheus-nginx-exporter |
https://binary.mirantis.com/stacklight/helm/prometheus-nginx-exporter-0.1.0-mcp-4.tgz |
|
sf-notifier |
https://binary.mirantis.com/stacklight/helm/sf-notifier-0.1.0-mcp-11.tgz |
|
sf-reporter |
https://binary.mirantis.com/stacklight/helm/sf-reporter-0.1.0-mcp-10.tgz |
|
stacklight Updated |
https://binary.mirantis.com/stacklight/helm/stacklight-0.1.2-mcp-492.tgz |
|
telegraf-ds |
https://binary.mirantis.com/stacklight/helm/telegraf-ds-1.1.5-mcp-20.tgz |
|
telegraf-s |
https://binary.mirantis.com/stacklight/helm/telegraf-s-1.1.5-mcp-20.tgz |
|
telemeter-server |
https://binary.mirantis.com/stacklight/helm/telemeter-server-0.1.0-mcp-12.tgz |
|
telemeter-client |
https://binary.mirantis.com/stacklight/helm/telemeter-client-0.1.0-mcp-12.tgz |
|
Docker images |
alerta |
mirantis.azurecr.io/stacklight/alerta-web:8.4.1-20210312131419 |
alertmanager |
mirantis.azurecr.io/stacklight/alertmanager:v0.21.0 |
|
alertmanager-webhook-servicenow New |
mirantis.azurecr.io/stacklight/alertmanager-webhook-servicenow:v0.1-20210426114325 |
|
busybox |
mirantis.azurecr.io/stacklight/busybox:1.30 |
|
cerebro |
mirantis.azurecr.io/stacklight/cerebro:0.9.3 |
|
configmap-reload |
mirantis.azurecr.io/stacklight/configmap-reload:v0.3.0 |
|
curl |
mirantis.azurecr.io/stacklight/curl:7.69.0 |
|
curl-jq |
mirantis.azurecr.io/stacklight/curl-jq:1.5-1 |
|
elasticsearch Updated |
mirantis.azurecr.io/stacklight/elasticsearch:7.10.2-20210513065347 |
|
elasticsearch-curator |
mirantis.azurecr.io/stacklight/curator:5.7.6 |
|
elasticsearch-exporter |
mirantis.azurecr.io/stacklight/elasticsearch_exporter:1.0.2 |
|
fluentd Updated |
mirantis.azurecr.io/stacklight/fluentd:1.10.2-20210518100631 |
|
gce-proxy |
mirantis.azurecr.io/stacklight/gce-proxy:1.11 |
|
grafana Updated |
mirantis.azurecr.io/stacklight/grafana:7.5.4 |
|
grafana-image-renderer |
mirantis.azurecr.io/stacklight/grafana-image-renderer:2.0.1 |
|
kubectl |
mirantis.azurecr.io/stacklight/kubectl:1.19.2 |
|
k8s-netchecker-agent Deprecated |
mirantis.azurecr.io/lcm/kubernetes/k8s-netchecker-agent:2019.1 |
|
k8s-netchecker-server Deprecated |
mirantis.azurecr.io/lcm/kubernetes/k8s-netchecker-server:2019.1 |
|
k8s-sidecar |
mirantis.azurecr.io/stacklight/k8s-sidecar:1.10.8 |
|
kibana Updated |
mirantis.azurecr.io/stacklight/kibana:7.10.2-20210513065546 |
|
kube-state-metrics |
mirantis.azurecr.io/stacklight/kube-state-metrics:v1.9.2 |
|
metric-collector |
mirantis.azurecr.io/stacklight/metric-collector:v0.1-20210219112938 |
|
metricbeat Updated |
mirantis.azurecr.io/stacklight/metricbeat:7.10.2 |
|
node-exporter |
mirantis.azurecr.io/stacklight/node-exporter:v1.0.1 |
|
origin-telemeter |
mirantis.azurecr.io/stacklight/origin-telemeter:4.4.0-20200424 |
|
prometheus |
mirantis.azurecr.io/stacklight/prometheus:v2.22.2 |
|
prometheus-blackbox-exporter |
mirantis.azurecr.io/stacklight/blackbox-exporter:v0.14.0 |
|
prometheus-es-exporter |
mirantis.azurecr.io/stacklight/prometheus-es-exporter:v0.5.1-20210323132924 |
|
prometheus-msteams New |
mirantis.azurecr.io/stacklight/prometheus-msteams:v1.4.2 |
|
prometheus-nginx-exporter |
mirantis.azurecr.io/stacklight/nginx-prometheus-exporter:0.6.0 |
|
prometheus-patroni-exporter |
mirantis.azurecr.io/stacklight/prometheus-patroni-exporter:v0.1-20200428121305 |
|
prometheus-postgres-exporter Updated |
mirantis.azurecr.io/stacklight/prometheus-postgres-exporter:v0.9.0 |
|
prometheus-relay |
mirantis.azurecr.io/stacklight/prometheus-relay:v0.3-20210317133316 |
|
pushgateway |
mirantis.azurecr.io/stacklight/pushgateway:v1.2.0 |
|
sf-notifier |
mirantis.azurecr.io/stacklight/sf-notifier:v0.3-20210323132354 |
|
sf-reporter |
mirantis.azurecr.io/stacklight/sf-reporter:v0.1-20201216152628 |
|
spilo Updated |
mirantis.azurecr.io/stacklight/spilo:13-2.0p6-20210525081943 |
|
telegraf |
mirantis.azurecr.io/stacklight/telegraf:v1.9.1-20210225152050 |
|
telemeter-token-auth |
mirantis.azurecr.io/stacklight/telemeter-token-auth:v0.1-20200406175600 |
|
yq |
mirantis.azurecr.io/stacklight/yq:v4.2.0 |
Artifact |
Component |
Path |
|---|---|---|
Debian repositories |
System packages |
|
https://mirror.mirantis.com/kaas/ubuntu-2020-07-30-013349.target.txt |
||
MCR repositories |
MCR |
https://repos.mirantis.com/ubuntu/dists/bionic/pool/stable-19.03/ |
See also
The Cluster release 6.14.0 is introduced in the Mirantis Container Cloud release 2.7.0. This Cluster release is based on the Cluster release 5.14.0.
The Cluster release 6.14.0 supports:
Mirantis OpenStack for Kubernetes (MOS) 21.2. For details, see MOS Release Notes.
Mirantis Kubernetes Engine (MKE) 3.3.6 and Mirantis Container Runtime (MCR) 19.03.14. For details, see MKE Release Notes and MCR Release Notes.
Kubernetes 1.18.
For the list of resolved issues, refer to the Container Cloud releases 2.6.0 and 2.7.0 sections. For the list of known issues, refer to the Container Cloud releases 2.7.0.
This section outlines new features and enhancements introduced in the Cluster release 6.14.0.
Significantly enhanced the StackLight log collection mechanism to avoid
collecting and keeping an excessive amount of log messages when it is not
essential. Now, during or after deployment of StackLight, you can select one of
the 9 available logging levels depending on the required severity. The default
logging level is INFO.
Learn more
Implemented the capability to configure StackLight to forward all logs to an external syslog server. In this case, StackLight will send logs both to the syslog server and to Elasticsearch, which is the default target.
Learn more
Improved the log collection mechanism by optimizing the existing and adding new log parsers for multiple Container Cloud components.
Learn more
Technology Preview
Implemented the capability to configure Ceph Controller to start pods on the taint nodes and manage the resources of Ceph nodes. Now, when bootstrapping a new management or managed cluster, you can specify requests, limits, or tolerations for Ceph resources. You can also configure resource management for an existing Ceph cluster. However, such approach may cause downtime.
Improved user experience by moving the rgw section of the
KaasCephCluster CR to a common objectStorage section that now includes
all RADOS Gateway configurations of a Ceph cluster. The spec.rgw section is
deprecated. However, if you continue using spec.rgw, it will be
automatically translated into the new objectStorage.rgw section during the
Container Cloud update to 2.6.0.
Learn more
Implemented the capability to enable Ceph maintenance mode using the
maintenance flag not only during a managed cluster update but also when
required. However, Mirantis does not recommend enabling maintenance on
production deployments other than during update.
Learn more
TECHNOLOGY PREVIEW
Added the possibility to configure dedicated networks for the Ceph cluster access and replication traffic using dedicated subnets. Container Cloud automatically configures Ceph to use the addresses from the dedicated subnets after you assign the corresponding addresses to the storage nodes.
Technology Preview
Implemented the capability to enable the Ceph Multisite configuration that allows object storage to replicate its data over multiple Ceph clusters. Using Multisite, such object storage is independent and isolated from another object storage in the cluster.
On top of continuous improvements delivered to the existing Container Cloud guides, added the Troubleshoot Ceph section to the Operations Guide. This section now contains a detailed procedure on a failed or accidentally removed Ceph cluster recovery.
Learn more
The following table lists the components versions of the Cluster release 6.14.0.
Note
The components that are newly added, updated, deprecated, or removed
as compared to the previous release version, are marked
with a corresponding superscript,
for example, lcm-ansible Updated.
Component |
Application/Service |
Version |
|---|---|---|
Distributed storage |
Ceph |
14.2.12 (Nautilus) |
Rook |
1.5.5 |
|
Container runtime |
Mirantis Container Runtime |
19.03.14 1 |
Cluster orchestration |
Mirantis Kubernetes Engine Updated |
3.3.6 0 |
LCM |
descheduler |
0.8.0 |
Helm |
2.16.11-40 |
|
helm-controller Updated |
0.2.0-297-g8c87ad67 |
|
lcm-ansible Updated |
0.5.0-10-gdd307e6 |
|
lcm-agent Updated |
0.2.0-300-ga874e0df |
|
metallb-controller |
0.9.3-1 |
|
metrics-server |
0.3.6-1 |
|
StackLight |
Alerta Updated |
8.4.1-20210312131419 |
Alertmanager |
0.21.0 |
|
Cerebro |
0.9.3 |
|
Elasticsearch |
7.6.1 |
|
Elasticsearch Curator |
5.7.6 |
|
Elasticsearch Exporter |
1.0.2 |
|
Fluentd Updated |
1.10.2-20210301155825 |
|
Grafana Updated |
7.3.7 |
|
Grafana Image Renderer Updated |
2.0.1 |
|
IAM Proxy |
6.0.1 |
|
Kibana |
7.6.1 |
|
Metric Collector Updated |
0.1-20210219112938 |
|
Metricbeat |
7.6.1 |
|
Netchecker |
1.4.1 |
|
Patroni |
12-1.6p3 |
|
Prometheus |
2.22.2 |
|
Prometheus Blackbox Exporter |
0.14.0 |
|
Prometheus ES Exporter Updated |
0.5.1-20210323132924 |
|
Prometheus Node Exporter |
1.0.1 |
|
Prometheus NGINX Exporter |
0.6.0 |
|
Prometheus Patroni Exporter |
0.1-20200428121305 |
|
Prometheus Postgres Exporter |
0.8.0-20201006113956 |
|
Prometheus Relay Updated |
0.3-20210317133316 |
|
Pushgateway |
1.2.0 |
|
sf-notifier Updated |
0.3-20210323132354 |
|
sf-reporter |
0.1-20201216142628 |
|
Telegraf Updated |
1.9.1-20210225142050 |
|
Telemeter |
4.4.0-20200424 |
- 0
For the MKE release highlights and components versions, see MKE documentation: MKE release notes.
- 1
For the MCR release highlights, see MCR documentation: MCR release notes.
Due to the development limitations, the MCR upgrade to version 19.03.14 on existing Container Cloud clusters is not supported.
This section lists the components artifacts of the Cluster release 6.14.0.
Note
The components that are newly added, updated, deprecated, or removed
as compared to the previous release version, are marked
with a corresponding superscript,
for example, lcm-ansible Updated.
Artifact |
Component |
Path |
|---|---|---|
Helm chart |
ceph-controller Updated |
https://binary.mirantis.com/ceph/helm/ceph-operator-1.0.0-mcp-177.tgz |
Docker images |
ceph |
mirantis.azurecr.io/ceph/ceph:v14.2.12 |
ceph-controller Updated |
mirantis.azurecr.io/ceph/mcp/ceph-controller:v1.0.0-20210322210534 |
|
cephcsi |
mirantis.azurecr.io/ceph/cephcsi/cephcsi:v3.2.1 |
|
csi-node-driver-registrar |
mirantis.azurecr.io/ceph/k8scsi/csi-node-driver-registrar:v2.1.0 |
|
csi-provisioner |
mirantis.azurecr.io/ceph/k8scsi/csi-provisioner:v2.1.0 |
|
csi-snapshotter |
mirantis.azurecr.io/ceph/k8scsi/csi-snapshotter:v4.0.0 |
|
csi-attacher |
mirantis.azurecr.io/ceph/k8scsi/csi-attacher:v3.1.0 |
|
csi-resizer |
mirantis.azurecr.io/ceph/k8scsi/csi-resizer:v1.1.0 |
|
rook |
mirantis.azurecr.io/ceph/rook/ceph:v1.5.5 |
Artifact |
Component |
Path |
|---|---|---|
Binaries |
lcm-ansible Updated |
https://binary.mirantis.com/lcm/bin/lcm-ansible/v0.5.0-10-gdd307e6/lcm-ansible.tar.gz |
lcm-agent Updated |
https://binary.mirantis.com/lcm/bin/lcm-agent/v0.2.0-300-ga874e0df/lcm-agent |
|
Helm charts |
descheduler Updated |
https://binary.mirantis.com/core/helm/descheduler-1.19.1.tgz |
managed-lcm-api Updated |
https://binary.mirantis.com/core/helm/managed-lcm-api-1.19.1.tgz |
|
metallb Updated |
||
metrics-server Updated |
https://binary.mirantis.com/core/helm/metrics-server-1.19.1.tgz |
|
Docker images |
descheduler |
mirantis.azurecr.io/lcm/descheduler/v0.8.0 |
helm |
mirantis.azurecr.io/lcm/helm/tiller:v2.16.11-40 |
|
helm-controller Updated |
mirantis.azurecr.io/lcm/lcm-controller:v0.2.0-297-g8c87ad67 |
|
metallb-controller |
mirantis.azurecr.io/lcm/metallb/controller:v0.9.3-1 |
|
metallb-speaker |
mirantis.azurecr.io/lcm/metallb/speaker:v0.9.3-1 |
|
metrics-server |
mirantis.azurecr.io/lcm/metrics-server-amd64/v0.3.6-1 |
Artifact |
Component |
Path |
|---|---|---|
Helm charts |
alerta Updated |
https://binary.mirantis.com/stacklight/helm/alerta-0.1.0-mcp-15.tgz |
cerebro |
https://binary.mirantis.com/stacklight/helm/cerebro-0.1.0-mcp-2.tgz |
|
elasticsearch |
https://binary.mirantis.com/stacklight/helm/elasticsearch-7.1.1-mcp-22.tgz |
|
elasticsearch-curator |
https://binary.mirantis.com/stacklight/helm/elasticsearch-curator-1.5.0-mcp-2.tgz |
|
elasticsearch-exporter |
https://binary.mirantis.com/stacklight/helm/elasticsearch-exporter-1.2.0-mcp-2.tgz |
|
fluentd Updated |
https://binary.mirantis.com/stacklight/helm/fluentd-2.0.3-mcp-17.tgz |
|
fluentd-elasticsearch Updated |
https://binary.mirantis.com/stacklight/helm/fluentd-elasticsearch-3.0.0-mcp-61.tgz |
|
grafana Updated |
https://binary.mirantis.com/stacklight/helm/grafana-3.3.10-mcp-93.tgz |
|
iam-proxy |
||
kibana |
https://binary.mirantis.com/stacklight/helm/kibana-3.2.1-mcp-20.tgz |
|
metric-collector |
https://binary.mirantis.com/stacklight/helm/metric-collector-0.2.0-mcp-8.tgz |
|
metricbeat |
https://binary.mirantis.com/stacklight/helm/metricbeat-1.7.1-mcp-8.tgz |
|
netchecker |
||
patroni Updated |
https://binary.mirantis.com/stacklight/helm/patroni-0.15.1-mcp-20.tgz |
|
prometheus Updated |
https://binary.mirantis.com/stacklight/helm/prometheus-8.11.4-mcp-124.tgz |
|
prometheus-blackbox-exporter |
https://binary.mirantis.com/stacklight/helm/prometheus-blackbox-exporter-0.3.0-mcp-4.tgz |
|
prometheus-es-exporter |
https://binary.mirantis.com/stacklight/helm/prometheus-es-exporter-1.0.0-mcp-3.tgz |
|
prometheus-nginx-exporter |
https://binary.mirantis.com/stacklight/helm/prometheus-nginx-exporter-0.1.0-mcp-4.tgz |
|
sf-notifier |
https://binary.mirantis.com/stacklight/helm/sf-notifier-0.1.0-mcp-11.tgz |
|
sf-reporter |
https://binary.mirantis.com/stacklight/helm/sf-reporter-0.1.0-mcp-10.tgz |
|
stacklight Updated |
https://binary.mirantis.com/stacklight/helm/stacklight-0.1.2-mcp-438.tgz |
|
telegraf-ds |
https://binary.mirantis.com/stacklight/helm/telegraf-ds-1.1.5-mcp-20.tgz |
|
telegraf-s |
https://binary.mirantis.com/stacklight/helm/telegraf-s-1.1.5-mcp-20.tgz |
|
telemeter-server |
https://binary.mirantis.com/stacklight/helm/telemeter-server-0.1.0-mcp-12.tgz |
|
telemeter-client |
https://binary.mirantis.com/stacklight/helm/telemeter-client-0.1.0-mcp-12.tgz |
|
Docker images |
alerta Updated |
mirantis.azurecr.io/stacklight/alerta-web:8.4.1-20210312131419 |
alertmanager |
mirantis.azurecr.io/stacklight/alertmanager:v0.21.0 |
|
alpine-python3-requests |
mirantis.azurecr.io/stacklight/alpine-python3-requests:latest-20200618 |
|
busybox |
mirantis.azurecr.io/stacklight/busybox:1.30 |
|
cerebro |
mirantis.azurecr.io/stacklight/cerebro:0.9.3 |
|
configmap-reload |
mirantis.azurecr.io/stacklight/configmap-reload:v0.3.0 |
|
curl |
mirantis.azurecr.io/stacklight/curl:7.69.0 |
|
curl-jq |
mirantis.azurecr.io/stacklight/curl-jq:1.5-1 |
|
elasticsearch |
mirantis.azurecr.io/stacklight/elasticsearch:7.6.1 |
|
elasticsearch-curator |
mirantis.azurecr.io/stacklight/curator:5.7.6 |
|
elasticsearch-exporter |
mirantis.azurecr.io/stacklight/elasticsearch_exporter:1.0.2 |
|
fluentd Updated |
mirantis.azurecr.io/stacklight/fluentd:1.10.2-20210301155825 |
|
gce-proxy |
mirantis.azurecr.io/stacklight/gce-proxy:1.11 |
|
grafana Updated |
mirantis.azurecr.io/stacklight/grafana:7.3.7 |
|
grafana-image-renderer Updated |
mirantis.azurecr.io/stacklight/grafana-image-renderer:2.0.1 |
|
kubectl |
mirantis.azurecr.io/stacklight/kubectl:1.19.2 |
|
k8s-netchecker-agent |
mirantis.azurecr.io/lcm/kubernetes/k8s-netchecker-agent:2019.1 |
|
k8s-netchecker-server |
mirantis.azurecr.io/lcm/kubernetes/k8s-netchecker-server:2019.1 |
|
k8s-sidecar Updated |
mirantis.azurecr.io/stacklight/k8s-sidecar:1.10.8 |
|
kibana |
mirantis.azurecr.io/stacklight/kibana:7.6.1 |
|
kube-state-metrics |
mirantis.azurecr.io/stacklight/kube-state-metrics:v1.9.2 |
|
metric-collector Updated |
mirantis.azurecr.io/stacklight/metric-collector:v0.1-20210219112938 |
|
metricbeat |
mirantis.azurecr.io/stacklight/metricbeat:7.6.1 |
|
node-exporter |
mirantis.azurecr.io/stacklight/node-exporter:v1.0.1 |
|
origin-telemeter |
mirantis.azurecr.io/stacklight/origin-telemeter:4.4.0-20200424 |
|
prometheus |
mirantis.azurecr.io/stacklight/prometheus:v2.22.2 |
|
prometheus-blackbox-exporter |
mirantis.azurecr.io/stacklight/blackbox-exporter:v0.14.0 |
|
prometheus-es-exporter Updated |
mirantis.azurecr.io/stacklight/prometheus-es-exporter:v0.5.1-20210323132924 |
|
prometheus-nginx-exporter |
mirantis.azurecr.io/stacklight/nginx-prometheus-exporter:0.6.0 |
|
prometheus-patroni-exporter |
mirantis.azurecr.io/stacklight/prometheus-patroni-exporter:v0.1-20200428121305 |
|
prometheus-postgres-exporter |
mirantis.azurecr.io/stacklight/prometheus-postgres-exporter:v0.8.0-20201006113956 |
|
prometheus-relay Updated |
mirantis.azurecr.io/stacklight/prometheus-relay:v0.3-20210317133316 |
|
pushgateway |
mirantis.azurecr.io/stacklight/pushgateway:v1.2.0 |
|
sf-notifier Updated |
mirantis.azurecr.io/stacklight/sf-notifier:v0.3-20210323132354 |
|
sf-reporter |
mirantis.azurecr.io/stacklight/sf-reporter:v0.1-20201216142628 |
|
spilo |
mirantis.azurecr.io/stacklight/spilo:12-1.6p3 |
|
telegraf Updated |
mirantis.azurecr.io/stacklight/telegraf:v1.9.1-20210225142050 |
|
telemeter-token-auth |
mirantis.azurecr.io/stacklight/telemeter-token-auth:v0.1-20200406175600 |
|
yq |
mirantis.azurecr.io/stacklight/yq:v4.2.0 |
Artifact |
Component |
Path |
|---|---|---|
Debian repositories |
System packages |
|
https://mirror.mirantis.com/kaas/ubuntu-2020-07-30-013349.target.txt |
||
MCR repositories |
MCR |
https://repos.mirantis.com/ubuntu/dists/bionic/pool/stable-19.03/ |
See also
The Cluster release 6.12.0 is introduced in the Mirantis Container Cloud release 2.5.0 and is supported by 2.6.0. This Cluster release is based on the Cluster release 5.12.0.
The Cluster release 6.12.0 supports:
Mirantis OpenStack for Kubernetes (MOS) 21.1. For details, see MOS Release Notes.
Updated versions of Mirantis Kubernetes Engine (MKE) 3.3.6 and Mirantis Container Runtime (MCR) 19.03.14. For details, see MKE Release Notes and MCR Release Notes.
Kubernetes 1.18.
For the list of resolved issues, refer to the Container Cloud releases 2.4.0 and 2.5.0 sections. For the list of known issues, refer to the Container Cloud release 2.5.0 section.
This section outlines new features and enhancements introduced in the Cluster release 6.12.0.
Implemented alert inhibition rules to provide a clearer view on the cloud status and simplify troubleshooting. Using alert inhibition rules, Alertmanager decreases alert noise by suppressing dependent alerts notifications. The feature is enabled by default. For details, see Alert dependencies.
Implemented integration between Grafana and Kibana by adding a View logs in Kibana link to the majority of Grafana dashboards, which allows you to immediately view contextually relevant logs through the Kibana web UI.
Learn more
Implemented the TelegrafGatherErrors alert that raises if Telegraf fails to
gather metrics.
Learn more
Added the ironic.insecure parameter for enabling or disabling the host and
chain verification for bare metal Ironic monitoring.
Learn more
Enhanced StackLight to automatically set clusterId that defines an ID of
a Container Cloud cluster. Now, you do not need to set or modify this parameter
manually when configuring the sf-notifier and sf-reporter services.
Learn more
Enhanced StackLight by adding support for Cerebro, a web UI that visualizes health of Elasticsearch clusters and allows for convenient debugging. Cerebro is disabled by default.
Implemented the maintenance label to set for Ceph during a managed
cluster update. This prevents Ceph rebalance leading to data loss
during a managed cluster update.
Learn more
Implemented the Enable Object Storage checkbox in the Container Cloud web UI to allow enabling a single-instance RGW Object Storage when creating a Ceph cluster as described in Add a Ceph cluster since MOSK 25.2.
Enhanced Ceph to support RADOS Gateway (RGW) high availability. Now, you can run multiple instances of Ceph RGW in active/active mode.
Learn more
Added proxy support for Alertmanager, Metric collector, Salesforce notifier and reporter, and Telemeter client. Now, these StackLight components automatically use the same proxy that is configured for Container Cloud clusters.
Note
Proxy handles only the HTTP and HTTPS traffic. Therefore, for clusters with limited or no Internet access, it is not possible to set up Alertmanager email notifications, which use SMTP, when proxy is used.
Note
Due to a limitation, StackLight fails to integrate with an external
proxy with authentication handled by a proxy server. In such cases, the
proxy server ignores the HTTP Authorization header for basic
authentication passed by Prometheus Alertmanager. Therefore, use proxies
without authentication or with authentication handled by a reverse proxy.
The following table lists the components versions of the Cluster release 6.12.0.
Note
The components that are newly added, updated, deprecated, or removed
as compared to the previous release version, are marked
with a corresponding superscript,
for example, lcm-ansible Updated.
Component |
Application/Service |
Version |
|---|---|---|
Distributed storage |
Ceph |
14.2.12 (Nautilus) |
Rook |
1.5.5 |
|
Container runtime |
Mirantis Container Runtime |
19.03.14 1 |
Cluster orchestration |
Mirantis Kubernetes Engine Updated |
3.3.6 0 |
LCM |
descheduler |
0.8.0 |
Helm |
2.16.11-40 |
|
helm-controller Updated |
0.2.0-258-ga2d72294 |
|
lcm-ansible Updated |
0.3.0-10-g7c2a87e |
|
lcm-agent Updated |
0.2.0-258-ga2d72294 |
|
metallb-controller |
0.9.3-1 |
|
metrics-server |
0.3.6-1 |
|
StackLight |
Alerta |
8.0.2-20201014133832 |
Alertmanager |
0.21.0 |
|
Cerebro New |
0.9.3 |
|
Elasticsearch |
7.6.1 |
|
Elasticsearch Curator |
5.7.6 |
|
Elasticsearch Exporter |
1.0.2 |
|
Fluentd |
1.10.2-20200609085335 |
|
Grafana |
7.1.5 |
|
Grafana Image Renderer |
2.0.0 |
|
IAM Proxy |
6.0.1 |
|
Kibana |
7.6.1 |
|
Metric Collector |
0.1-20201222100033 |
|
Metricbeat |
7.6.1 |
|
Netchecker |
1.4.1 |
|
Patroni |
12-1.6p3 |
|
Prometheus |
2.22.2 |
|
Prometheus Blackbox Exporter |
0.14.0 |
|
Prometheus ES Exporter |
0.5.1-20201002144823 |
|
Prometheus Node Exporter |
1.0.1 |
|
Prometheus NGINX Exporter |
0.6.0 |
|
Prometheus Patroni Exporter |
0.1-20200428121305 |
|
Prometheus Postgres Exporter |
0.8.0-20201006113956 |
|
Prometheus Relay |
0.3-20200519054052 |
|
Pushgateway |
1.2.0 |
|
sf-notifier |
0.3-20201216142028 |
|
sf-reporter |
0.1-20201216142628 |
|
Telegraf |
1.9.1-20201222194740 |
|
Telemeter |
4.4.0-20200424 |
- 0
For the MKE release highlights and components versions, see MKE documentation: MKE release notes.
- 1
For the MCR release highlights, see MCR documentation: MCR release notes.
Due to the development limitations, the MCR upgrade to version 19.03.14 on existing Container Cloud clusters is not supported.
This section lists the components artifacts of the Cluster release 6.12.0.
Note
The components that are newly added, updated, deprecated, or removed
as compared to the previous release version, are marked
with a corresponding superscript,
for example, lcm-ansible Updated.
Artifact |
Component |
Path |
|---|---|---|
Helm chart |
ceph-controller Updated |
https://binary.mirantis.com/ceph/helm/ceph-operator-1.0.0-mcp-127.tgz |
Docker images |
ceph |
mirantis.azurecr.io/ceph/ceph:v14.2.12 |
ceph-controller Updated |
mirantis.azurecr.io/ceph/mcp/ceph-controller:v1.0.0-20210201202754 |
|
cephcsi |
mirantis.azurecr.io/ceph/cephcsi/cephcsi:v3.2.1 |
|
csi-node-driver-registrar |
mirantis.azurecr.io/ceph/k8scsi/csi-node-driver-registrar:v2.1.0 |
|
csi-provisioner |
mirantis.azurecr.io/ceph/k8scsi/csi-provisioner:v2.1.0 |
|
csi-snapshotter |
mirantis.azurecr.io/ceph/k8scsi/csi-snapshotter:v4.0.0 |
|
csi-attacher |
mirantis.azurecr.io/ceph/k8scsi/csi-attacher:v3.1.0 |
|
csi-resizer |
mirantis.azurecr.io/ceph/k8scsi/csi-resizer:v1.1.0 |
|
rook |
mirantis.azurecr.io/ceph/rook/ceph:v1.5.5 |
Artifact |
Component |
Path |
|---|---|---|
Binaries |
lcm-ansible Updated |
https://binary.mirantis.com/lcm/bin/lcm-ansible/v0.3.0-10-g7c2a87e/lcm-ansible.tar.gz |
lcm-agent Updated |
https://binary.mirantis.com/lcm/bin/lcm-agent/v0.2.0-258-ga2d72294/lcm-agent |
|
Helm charts |
descheduler Updated |
https://binary.mirantis.com/core/helm/descheduler-1.17.4.tgz |
managed-lcm-api Updated |
https://binary.mirantis.com/core/helm/managed-lcm-api-1.17.4.tgz |
|
metallb Updated |
||
metrics-server Updated |
https://binary.mirantis.com/core/helm/metrics-server-1.17.4.tgz |
|
Docker images |
descheduler |
mirantis.azurecr.io/lcm/descheduler/v0.8.0 |
helm |
mirantis.azurecr.io/lcm/helm/tiller:v2.16.11-40 |
|
helm-controller Updated |
mirantis.azurecr.io/lcm/lcm-controller:v0.2.0-258-ga2d72294 |
|
metallb-controller |
mirantis.azurecr.io/lcm/metallb/controller:v0.9.3-1 |
|
metallb-speaker |
mirantis.azurecr.io/lcm/metallb/speaker:v0.9.3-1 |
|
metrics-server |
mirantis.azurecr.io/lcm/metrics-server-amd64/v0.3.6-1 |
Artifact |
Component |
Path |
|---|---|---|
Helm charts |
alerta |
https://binary.mirantis.com/stacklight/helm/alerta-0.1.0-mcp-13.tgz |
cerebro New |
https://binary.mirantis.com/stacklight/helm/cerebro-0.1.0-mcp-2.tgz |
|
elasticsearch |
https://binary.mirantis.com/stacklight/helm/elasticsearch-7.1.1-mcp-22.tgz |
|
elasticsearch-curator |
https://binary.mirantis.com/stacklight/helm/elasticsearch-curator-1.5.0-mcp-2.tgz |
|
elasticsearch-exporter |
https://binary.mirantis.com/stacklight/helm/elasticsearch-exporter-1.2.0-mcp-2.tgz |
|
fluentd |
https://binary.mirantis.com/stacklight/helm/fluentd-2.0.3-mcp-15.tgz |
|
fluentd-elasticsearch |
https://binary.mirantis.com/stacklight/helm/fluentd-elasticsearch-3.0.0-mcp-33.tgz |
|
grafana Updated |
https://binary.mirantis.com/stacklight/helm/grafana-3.3.10-mcp-89.tgz |
|
iam-proxy |
||
kibana |
https://binary.mirantis.com/stacklight/helm/kibana-3.2.1-mcp-20.tgz |
|
metric-collector |
https://binary.mirantis.com/stacklight/helm/metric-collector-0.2.0-mcp-8.tgz |
|
metricbeat |
https://binary.mirantis.com/stacklight/helm/metricbeat-1.7.1-mcp-8.tgz |
|
netchecker |
||
patroni |
https://binary.mirantis.com/stacklight/helm/patroni-0.15.1-mcp-19.tgz |
|
prometheus |
https://binary.mirantis.com/stacklight/helm/prometheus-8.11.4-mcp-114.tgz |
|
prometheus-blackbox-exporter |
https://binary.mirantis.com/stacklight/helm/prometheus-blackbox-exporter-0.3.0-mcp-4.tgz |
|
prometheus-es-exporter |
https://binary.mirantis.com/stacklight/helm/prometheus-es-exporter-1.0.0-mcp-3.tgz |
|
prometheus-nginx-exporter |
https://binary.mirantis.com/stacklight/helm/prometheus-nginx-exporter-0.1.0-mcp-4.tgz |
|
sf-notifier |
https://binary.mirantis.com/stacklight/helm/sf-notifier-0.1.0-mcp-11.tgz |
|
sf-reporter |
https://binary.mirantis.com/stacklight/helm/sf-reporter-0.1.0-mcp-10.tgz |
|
stacklight Updated |
https://binary.mirantis.com/stacklight/helm/stacklight-0.1.2-mcp-401.tgz |
|
telegraf-ds |
https://binary.mirantis.com/stacklight/helm/telegraf-ds-1.1.5-mcp-20.tgz |
|
telegraf-s |
https://binary.mirantis.com/stacklight/helm/telegraf-s-1.1.5-mcp-20.tgz |
|
telemeter-server |
https://binary.mirantis.com/stacklight/helm/telemeter-server-0.1.0-mcp-12.tgz |
|
telemeter-client |
https://binary.mirantis.com/stacklight/helm/telemeter-client-0.1.0-mcp-12.tgz |
|
Docker images |
alerta |
mirantis.azurecr.io/stacklight/alerta-web:8.0.2-20201014133832 |
alertmanager |
mirantis.azurecr.io/stacklight/alertmanager:v0.21.0 |
|
alpine-python3-requests |
mirantis.azurecr.io/stacklight/alpine-python3-requests:latest-20200618 |
|
busybox |
mirantis.azurecr.io/stacklight/busybox:1.30 |
|
cerebro New |
mirantis.azurecr.io/stacklight/cerebro:0.9.3 |
|
configmap-reload |
mirantis.azurecr.io/stacklight/configmap-reload:v0.3.0 |
|
curl |
mirantis.azurecr.io/stacklight/curl:7.69.0 |
|
curl-jq |
mirantis.azurecr.io/stacklight/curl-jq:1.5-1 |
|
elasticsearch |
mirantis.azurecr.io/stacklight/elasticsearch:7.6.1 |
|
elasticsearch-curator |
mirantis.azurecr.io/stacklight/curator:5.7.6 |
|
elasticsearch-exporter |
mirantis.azurecr.io/stacklight/elasticsearch_exporter:1.0.2 |
|
fluentd |
mirantis.azurecr.io/stacklight/fluentd:1.10.2-20200609085335 |
|
gce-proxy |
mirantis.azurecr.io/stacklight/gce-proxy:1.11 |
|
grafana |
mirantis.azurecr.io/stacklight/grafana:7.1.5 |
|
grafana-image-renderer |
mirantis.azurecr.io/stacklight/grafana-image-renderer:2.0.0 |
|
kubectl |
mirantis.azurecr.io/stacklight/kubectl:1.19.2 |
|
k8s-netchecker-agent |
mirantis.azurecr.io/lcm/kubernetes/k8s-netchecker-agent:2019.1 |
|
k8s-netchecker-server |
mirantis.azurecr.io/lcm/kubernetes/k8s-netchecker-server:2019.1 |
|
k8s-sidecar |
mirantis.azurecr.io/stacklight/k8s-sidecar:0.1.178 |
|
kibana |
mirantis.azurecr.io/stacklight/kibana:7.6.1 |
|
kube-state-metrics |
mirantis.azurecr.io/stacklight/kube-state-metrics:v1.9.2 |
|
metric-collector |
mirantis.azurecr.io/stacklight/metric-collector:v0.1-20201222100033 |
|
metricbeat |
mirantis.azurecr.io/stacklight/metricbeat:7.6.1 |
|
node-exporter |
mirantis.azurecr.io/stacklight/node-exporter:v1.0.1 |
|
origin-telemeter |
mirantis.azurecr.io/stacklight/origin-telemeter:4.4.0-20200424 |
|
prometheus |
mirantis.azurecr.io/stacklight/prometheus:v2.22.2 |
|
prometheus-blackbox-exporter |
mirantis.azurecr.io/stacklight/blackbox-exporter:v0.14.0 |
|
prometheus-es-exporter |
mirantis.azurecr.io/stacklight/prometheus-es-exporter:v0.5.1-20201002144823 |
|
prometheus-nginx-exporter |
mirantis.azurecr.io/stacklight/nginx-prometheus-exporter:0.6.0 |
|
prometheus-patroni-exporter |
mirantis.azurecr.io/stacklight/prometheus-patroni-exporter:v0.1-20200428121305 |
|
prometheus-postgres-exporter |
mirantis.azurecr.io/stacklight/prometheus-postgres-exporter:v0.8.0-20201006113956 |
|
prometheus-relay |
mirantis.azurecr.io/stacklight/prometheus-relay:v0.3-20200519054052 |
|
pushgateway |
mirantis.azurecr.io/stacklight/pushgateway:v1.2.0 |
|
sf-notifier |
mirantis.azurecr.io/stacklight/sf-notifier:v0.3-20201216142028 |
|
sf-reporter |
mirantis.azurecr.io/stacklight/sf-reporter:v0.1-20201216142628 |
|
spilo |
mirantis.azurecr.io/stacklight/spilo:12-1.6p3 |
|
telegraf |
mirantis.azurecr.io/stacklight/telegraf:v1.9.1-20201222194740 |
|
telemeter-token-auth |
mirantis.azurecr.io/stacklight/telemeter-token-auth:v0.1-20200406175600 |
|
yq New |
mirantis.azurecr.io/stacklight/yq:v4.2.0 |
See also
The Cluster release 6.10.0 is introduced in the Mirantis Container Cloud release 2.3.0 and supports:
Mirantis OpenStack for Kubernetes (MOS) Ussuri Update. For details, see MOS Release Notes.
Updated versions of Mirantis Kubernetes Engine 3.3.4 and Mirantis Container Runtime 19.03.13. For details, see MKE Release Notes and MCR Release Notes.
Kubernetes 1.18.
For the list of known and resolved issues, refer to the Container Cloud release 2.3.0 section.
This section outlines new features and enhancements introduced in the Cluster release 6.10.0.
Enhanced Ceph to support RADOS Gateway (RGW) Object Storage.
Learn more
Implemented the capability to obtain detailed information on the Ceph cluster state, including Ceph logs, Ceph OSDs state, and a list of Ceph pools.
Learn more
The following table lists the components versions of the Cluster release 6.10.0.
Note
The components that are newly added, updated, deprecated, or removed
as compared to the previous release version, are marked
with a corresponding superscript,
for example, lcm-ansible Updated.
Component |
Application/Service |
Version |
|---|---|---|
Distributed storage |
Ceph |
14.2.11 (Nautilus) |
Rook |
1.4.4 |
|
Container runtime |
Mirantis Container Runtime Updated |
19.03.13 1 |
Cluster orchestration |
Mirantis Kubernetes Engine Updated |
3.3.4 0 |
LCM |
descheduler |
0.8.0 |
Helm Updated |
2.16.11-40 |
|
helm-controller Updated |
0.2.0-221-g32bd5f56 |
|
lcm-ansible Updated |
0.2.0-381-g720ec96 |
|
lcm-agent Updated |
0.2.0-221-g32bd5f56 |
|
metallb-controller |
0.9.3-1 |
|
metrics-server |
0.3.6-1 |
|
StackLight |
Alerta |
8.0.2-20201014133832 |
Alertmanager |
0.21.0 |
|
Elasticsearch |
7.6.1 |
|
Elasticsearch Curator |
5.7.6 |
|
Elasticsearch Exporter |
1.0.2 |
|
Fluentd |
1.10.2-20200609085335 |
|
Grafana |
7.1.5 |
|
Grafana Image Renderer |
2.0.0 |
|
IAM Proxy |
6.0.1 |
|
Kibana |
7.6.1 |
|
Metric Collector Updated |
0.1-20201120155524 |
|
Metricbeat |
7.6.1 |
|
Netchecker |
1.4.1 |
|
Patroni |
12-1.6p3 |
|
Prometheus Updated |
2.22.2 |
|
Prometheus Blackbox Exporter |
0.14.0 |
|
Prometheus ES Exporter |
0.5.1-20201002144823 |
|
Prometheus libvirt Exporter |
0.1-20200610164751 |
|
Prometheus Memcached Exporter |
0.5.0 |
|
Prometheus MySQL Exporter |
0.11.0 |
|
Prometheus Node Exporter |
1.0.1 |
|
Prometheus NGINX Exporter |
0.6.0 |
|
Prometheus Patroni Exporter |
0.1-20200428121305 |
|
Prometheus Postgres Exporter |
0.8.0-20201006113956 |
|
Prometheus RabbitMQ Exporter Updated |
v1.0.0-RC7.1 |
|
Prometheus Relay |
0.3-20200519054052 |
|
Pushgateway |
1.2.0 |
|
sf-notifier |
0.3-20201001081256 |
|
sf-reporter |
0.1-20200219140217 |
|
Telegraf Updated |
1.9.1-20201120081248 |
|
Telemeter |
4.4.0-20200424 |
- 0
For the MKE release highlights and components versions, see MKE documentation: MKE release notes.
- 1
For the MCR release highlights, see MCR documentation: MCR release notes.
Due to the development limitations, the MCR upgrade to version 19.03.14 on existing Container Cloud clusters is not supported.
This section lists the components artifacts of the Cluster release 6.10.0.
Note
The components that are newly added, updated, deprecated, or removed
as compared to the previous release version, are marked
with a corresponding superscript,
for example, lcm-ansible Updated.
Artifact |
Component |
Path |
|---|---|---|
Helm chart |
ceph-controller Updated |
https://binary.mirantis.com/ceph/helm/ceph-operator-1.0.0-mcp-95.tgz |
Docker images |
ceph |
mirantis.azurecr.io/ceph/ceph:v14.2.11 |
ceph-controller Updated |
mirantis.azurecr.io/ceph/mcp/ceph-controller:v1.0.0-20201215142221 |
|
cephcsi |
mirantis.azurecr.io/ceph/cephcsi/cephcsi:v3.1.0 |
|
csi-node-driver-registrar |
mirantis.azurecr.io/ceph/k8scsi/csi-node-driver-registrar:v1.2.0 |
|
csi-provisioner |
mirantis.azurecr.io/ceph/k8scsi/csi-provisioner:v1.6.0 |
|
csi-snapshotter |
mirantis.azurecr.io/ceph/k8scsi/csi-snapshotter:v2.1.1 |
|
csi-attacher |
mirantis.azurecr.io/ceph/k8scsi/csi-attacher:v2.1.0 |
|
rook |
mirantis.azurecr.io/ceph/rook/ceph:v1.4.4 |
Artifact |
Component |
Path |
|---|---|---|
Binaries |
lcm-ansible Updated |
https://binary.mirantis.com/lcm/bin/lcm-ansible/v0.2.0-381-g720ec96/lcm-ansible.tar.gz |
lcm-agent Updated |
https://binary.mirantis.com/lcm/bin/lcm-agent/v0.2.0-221-g32bd5f56/lcm-agent |
|
Helm charts |
descheduler Updated |
https://binary.mirantis.com/core/helm/descheduler-1.15.1.tgz |
managed-lcm-api New |
https://binary.mirantis.com/core/helm/managed-lcm-api-1.15.1.tgz |
|
metallb Updated |
||
metrics-server Updated |
https://binary.mirantis.com/core/helm/metrics-server-1.15.1.tgz |
|
Docker images |
descheduler |
mirantis.azurecr.io/lcm/descheduler/v0.8.0 |
helm Updated |
mirantis.azurecr.io/lcm/helm/tiller:v2.16.11-40 |
|
helm-controller Updated |
mirantis.azurecr.io/lcm/lcm-controller:v0.2.0-221-g32bd5f56 |
|
metallb-controller |
mirantis.azurecr.io/lcm/metallb/controller:v0.9.3-1 |
|
metallb-speaker |
mirantis.azurecr.io/lcm/metallb/speaker:v0.9.3-1 |
|
metrics-server |
mirantis.azurecr.io/lcm/metrics-server-amd64/v0.3.6-1 |
Artifact |
Component |
Path |
|---|---|---|
Helm charts |
alerta |
https://binary.mirantis.com/stacklight/helm/alerta-0.1.0-mcp-13.tgz |
elasticsearch Updated |
https://binary.mirantis.com/stacklight/helm/elasticsearch-7.1.1-mcp-22.tgz |
|
elasticsearch-curator |
https://binary.mirantis.com/stacklight/helm/elasticsearch-curator-1.5.0-mcp-2.tgz |
|
elasticsearch-exporter |
https://binary.mirantis.com/stacklight/helm/elasticsearch-exporter-1.2.0-mcp-2.tgz |
|
fluentd |
https://binary.mirantis.com/stacklight/helm/fluentd-2.0.3-mcp-15.tgz |
|
fluentd-elasticsearch Updated |
https://binary.mirantis.com/stacklight/helm/fluentd-elasticsearch-3.0.0-mcp-33.tgz |
|
grafana Updated |
https://binary.mirantis.com/stacklight/helm/grafana-3.3.10-mcp-74.tgz |
|
kibana |
https://binary.mirantis.com/stacklight/helm/kibana-3.2.1-mcp-20.tgz |
|
metric-collector Updated |
https://binary.mirantis.com/stacklight/helm/metric-collector-0.2.0-mcp-5.tgz |
|
metricbeat |
https://binary.mirantis.com/stacklight/helm/metricbeat-1.7.1-mcp-8.tgz |
|
netchecker |
||
patroni |
https://binary.mirantis.com/stacklight/helm/patroni-0.15.1-mcp-17.tgz |
|
prometheus Updated |
https://binary.mirantis.com/stacklight/helm/prometheus-8.11.4-mcp-102.tgz |
|
prometheus-blackbox-exporter |
https://binary.mirantis.com/stacklight/helm/prometheus-blackbox-exporter-0.3.0-mcp-3.tgz |
|
prometheus-es-exporter |
https://binary.mirantis.com/stacklight/helm/prometheus-es-exporter-1.0.0-mcp-3.tgz |
|
prometheus-libvirt-exporter |
https://binary.mirantis.com/stacklight/heprometheus-libvirt-exporter-0.1.0-mcp-2.tgz |
|
prometheus-memcached-exporter |
https://binary.mirantis.com/stacklight/helm/prometheus-memcached-exporter-0.1.0-mcp-1.tgz |
|
prometheus-mysql-exporter |
https://binary.mirantis.com/stacklight/helm/prometheus-mysql-exporter-0.3.2-mcp-1.tgz |
|
prometheus-nginx-exporter |
https://binary.mirantis.com/stacklight/helm/prometheus-nginx-exporter-0.1.0-mcp-4.tgz |
|
prometheus-rabbitmq-exporter |
https://binary.mirantis.com/stacklight/helm/prometheus-rabbitmq-exporter-0.4.1-mcp-1.tgz |
|
sf-notifier Updated |
https://binary.mirantis.com/stacklight/helm/sf-notifier-0.1.0-mcp-9.tgz |
|
sf-reporter Updated |
https://binary.mirantis.com/stacklight/helm/sf-reporter-0.1.0-mcp-8.tgz |
|
stacklight Updated |
https://binary.mirantis.com/stacklight/helm/stacklight-0.1.2-mcp-354.tgz |
|
telegraf-ds Updated |
https://binary.mirantis.com/stacklight/helm/telegraf-ds-1.1.5-mcp-19.tgz |
|
telegraf-s Updated |
https://binary.mirantis.com/stacklight/helm/telegraf-s-1.1.5-mcp-19.tgz |
|
telemeter-server |
https://binary.mirantis.com/stacklight/helm/telemeter-server-0.1.0-mcp-11.tgz |
|
telemeter-client |
https://binary.mirantis.com/stacklight/helm/telemeter-client-0.1.0-mcp-11.tgz |
|
Docker images |
alerta |
mirantis.azurecr.io/stacklight/alerta-web:8.0.2-20201014133832 |
alertmanager |
mirantis.azurecr.io/stacklight/alertmanager:v0.21.0 |
|
alpine-python3-requests |
mirantis.azurecr.io/stacklight/alpine-python3-requests:latest-20200618 |
|
busybox |
mirantis.azurecr.io/stacklight/busybox:1.30 |
|
configmap-reload |
mirantis.azurecr.io/stacklight/configmap-reload:v0.3.0 |
|
curl |
mirantis.azurecr.io/stacklight/curl:7.69.0 |
|
curl-jq |
mirantis.azurecr.io/stacklight/curl-jq:1.5-1 |
|
elasticsearch |
mirantis.azurecr.io/stacklight/elasticsearch:7.6.1 |
|
elasticsearch-curator |
mirantis.azurecr.io/stacklight/curator:5.7.6 |
|
elasticsearch-exporter |
mirantis.azurecr.io/stacklight/elasticsearch_exporter:1.0.2 |
|
fluentd |
mirantis.azurecr.io/stacklight/fluentd:1.10.2-20200609085335 |
|
gce-proxy |
mirantis.azurecr.io/stacklight/gce-proxy:1.11 |
|
grafana |
mirantis.azurecr.io/stacklight/grafana:7.1.5 |
|
grafana-image-renderer |
mirantis.azurecr.io/stacklight/grafana-image-renderer:2.0.0 |
|
kubectl |
mirantis.azurecr.io/stacklight/kubectl:1.19.2 |
|
k8s-netchecker-agent |
mirantis.azurecr.io/lcm/kubernetes/k8s-netchecker-agent:2019.1 |
|
k8s-netchecker-server |
mirantis.azurecr.io/lcm/kubernetes/k8s-netchecker-server:2019.1 |
|
k8s-sidecar |
mirantis.azurecr.io/stacklight/k8s-sidecar:0.1.178 |
|
kibana |
mirantis.azurecr.io/stacklight/kibana:7.6.1 |
|
kube-state-metrics |
mirantis.azurecr.io/stacklight/kube-state-metrics:v1.9.2 |
|
metric-collector Updated |
mirantis.azurecr.io/stacklight/metric-collector:v0.1-20201120155524 |
|
metricbeat |
mirantis.azurecr.io/stacklight/metricbeat:7.6.1 |
|
node-exporter |
mirantis.azurecr.io/stacklight/node-exporter:v1.0.1 |
|
origin-telemeter |
mirantis.azurecr.io/stacklight/origin-telemeter:4.4.0-20200424 |
|
prometheus Updated |
mirantis.azurecr.io/stacklight/prometheus:v2.22.2 |
|
prometheus-blackbox-exporter |
mirantis.azurecr.io/stacklight/blackbox-exporter:v0.14.0 |
|
prometheus-es-exporter |
mirantis.azurecr.io/stacklight/prometheus-es-exporter:v0.5.1-20201002144823 |
|
prometheus-libvirt-exporter |
mirantis.azurecr.io/stacklight/libvirt-exporter:v0.1-20200610164751 |
|
prometheus-memcached-exporter |
mirantis.azurecr.io/stacklight/memcached-exporter:v0.5.0 |
|
prometheus-mysql-exporter |
mirantis.azurecr.io/stacklight/mysqld-exporter:v0.11.0 |
|
prometheus-nginx-exporter |
mirantis.azurecr.io/stacklight/nginx-prometheus-exporter:0.6.0 |
|
prometheus-patroni-exporter |
mirantis.azurecr.io/stacklight/prometheus-patroni-exporter:v0.1-20200428121305 |
|
prometheus-postgres-exporter |
mirantis.azurecr.io/stacklight/prometheus-postgres-exporter:v0.8.0-20201006113956 |
|
prometheus-rabbitmq-exporter Updated |
mirantis.azurecr.io/stacklight/rabbitmq-exporter:v1.0.0-RC7.1 |
|
prometheus-relay |
mirantis.azurecr.io/stacklight/prometheus-relay:v0.3-20200519054052 |
|
pushgateway |
mirantis.azurecr.io/stacklight/pushgateway:v1.2.0 |
|
sf-notifier |
mirantis.azurecr.io/stacklight/sf-notifier:v0.3-20201001081256 |
|
sf-reporter |
mirantis.azurecr.io/stacklight/sf-reporter:v0.1-20200219140217 |
|
spilo |
mirantis.azurecr.io/stacklight/spilo:12-1.6p3 |
|
telegraf Updated |
mirantis.azurecr.io/stacklight/telegraf:v1.9.1-20201120081248 |
|
telemeter-token-auth |
mirantis.azurecr.io/stacklight/telemeter-token-auth:v0.1-20200406175600 |
See also
The Cluster release 6.8.1 is introduced in the Mirantis Container Cloud release 2.2.0. This Cluster release is based on the Cluster release 5.8.0 and the main difference is support of the Mirantis OpenStack for Kubernetes (MOS) product.
For details about MOS, see MOS Release Notes.
For details about the Cluster release 5.8.0, refer to the 5.8.0 section.
This section outlines release notes for the unsupported Cluster releases of the 5.x series.
This section outlines release notes for the Cluster release 5.22.0 that is introduced in the Mirantis Container Cloud release 2.15.0. This Cluster release supports Mirantis Container Runtime 20.10.8 and Mirantis Kubernetes Engine 3.3.13 with Kubernetes 1.18.
For the list of known and resolved issues, refer to the Container Cloud release 2.15.0 section.
This section outlines new features and enhancements introduced in the Cluster release 5.22.0.
Updated the Mirantis Container Runtime (MCR) version from 20.10.6 to 20.10.8 for the Container Cloud management, regional, and managed clusters on all supported cloud providers.
Learn more
Implemented the MCCLicenseExpirationCritical and
MCCLicenseExpirationMajor alerts that notify about Mirantis Container Cloud
license expiration in less than 10 and 30 days.
Learn more
Implemented the following improvements to StackLight alerting:
Enhanced Kubernetes applications alerting:
Reworked the Kubernetes applications alerts to minimize flapping, avoid firing during pod rescheduling, and to detect crash looping for pods that restart less frequently.
Added the
KubeDeploymentOutage,KubeStatefulSetOutage, andKubeDaemonSetOutagealerts.Removed the redundant
KubeJobCompletionalert.Enhanced the alert inhibition rules to reduce alert flooding.
Improved alert descriptions.
Split
TelemeterClientFederationFailedintoTelemeterClientFailedandTelemeterClientHAFailedto separate alerts depending on the HA mode disabled or enabled.Updated the description for
DockerSwarmNodeFlapping.
Learn more
Disabled unused Node Exporter collectors and implemented the capability to
manually enable needed collectors using the
nodeExporter.extraCollectorsEnabled parameter. Only the following
collectors are now enabled by default in StackLight:
|
|
|
|
Learn more
Implemented full support for automated Ceph LCM operations using the
KaaSCephOperationRequest CR, such as addition or removal of Ceph OSDs and
nodes, as well as replacement of failed Ceph OSDs or nodes.
Learn more
Implemented the capability to specify Container Storage Interface (CSI)
provisioner tolerations and node affinity for different Rook resources.
Added support for the all and mds keys in toleration rules.
Extended the fullClusterInfo section of the KaaSCephCluster.status
resource with the following fields:
cephDetails- contains verbose details of a Ceph cluster statecephCSIPluginDaemonsStatus- contains details on all Ceph CSIs
Learn more
The following table lists the components versions of the Cluster release 5.22.0.
Note
The components that are newly added, updated, deprecated, or removed
as compared to the previous release version, are marked
with a corresponding superscript,
for example, lcm-ansible Updated.
Component |
Application/Service |
Version |
|---|---|---|
Cluster orchestration |
Mirantis Kubernetes Engine |
3.3.13 0 |
Container runtime |
Mirantis Container Runtime Updated |
20.10.8 1 |
Distributed storage |
Ceph |
15.2.13 (Octopus) |
Rook |
1.7.6 |
|
LCM |
Helm |
2.16.11-40 |
helm-controller Updated |
0.3.0-132-g83a348fa |
|
lcm-ansible Updated |
0.13.0-26-gad73ff7 |
|
lcm-agent Updated |
0.3.0-132-g83a348fa |
|
metallb-controller |
0.9.3-1 |
|
metrics-server |
0.3.6-1 |
|
StackLight |
Alerta |
8.5.0-20211108051042 |
Alertmanager Updated |
0.23.0 |
|
Alertmanager Webhook ServiceNow |
0.1-20210601141858 |
|
Cerebro |
0.9.3 |
|
Elasticsearch |
7.10.2-2021110210112 |
|
Elasticsearch Curator |
5.7.6 |
|
Elasticsearch Exporter |
1.0.2 |
|
Fluentd |
1.10.2-20210915110132 |
|
Grafana Updated |
8.2.7 |
|
Grafana Image Renderer |
3.2.1 |
|
IAM Proxy |
6.0.1 |
|
Kibana |
7.10.2-20211101074638 |
|
Metric Collector |
0.1-20211109121134 |
|
Metricbeat |
7.10.2-20211103140113 |
|
Patroni |
13-2.0p6-20210525081943 |
|
Prometheus Updated |
2.31.1 |
|
Prometheus Blackbox Exporter |
0.14.0 |
|
Prometheus ES Exporter |
0.14.0-20210812120726 |
|
Prometheus MS Teams |
1.4.2 |
|
Prometheus Node Exporter Updated |
1.2.2 |
|
Prometheus NGINX Exporter |
0.6.0 |
|
Prometheus Patroni Exporter |
0.1-20210708141736 |
|
Prometheus Postgres Exporter |
0.9.0 |
|
Prometheus Relay |
0.3-20210317133316 |
|
Pushgateway Removed |
n/a |
|
sf-notifier |
0.3-20210930112115 |
|
sf-reporter |
0.1-20210607111404 |
|
Telegraf |
1.9.1-20210225142050 |
|
1.20.0-20210927090119 |
||
Telemeter |
4.4.0-20200424 |
- 0
For the Mirantis Kubernetes Engine (MKE) release highlights and components versions, see MKE documentation: MKE release notes.
- 1
For the Mirantis Container Runtime (MCR) release highlights, see MCR documentation: MCR release notes.
This section lists the components artifacts of the Cluster release 5.22.0.
Note
The components that are newly added, updated, deprecated, or removed
as compared to the previous release version, are marked
with a corresponding superscript,
for example, lcm-ansible Updated.
Artifact |
Component |
Path |
|---|---|---|
Helm chart |
ceph-controller Updated |
https://binary.mirantis.com/ceph/helm/ceph-operator-1.0.0-mcp-606.tgz |
Docker images |
ceph |
mirantis.azurecr.io/ceph/ceph:v15.2.13 |
ceph-controller Updated |
mirantis.azurecr.io/ceph/mcp/ceph-controller:v1.0.0-20220110132813 |
|
cephcsi |
mirantis.azurecr.io/ceph/cephcsi/cephcsi:v3.4.0 |
|
csi-node-driver-registrar |
mirantis.azurecr.io/ceph/k8scsi/csi-node-driver-registrar:v2.1.0 |
|
csi-provisioner |
mirantis.azurecr.io/ceph/k8scsi/csi-provisioner:v2.1.2 |
|
csi-snapshotter |
mirantis.azurecr.io/ceph/k8scsi/csi-snapshotter:v4.0.0 |
|
csi-attacher |
mirantis.azurecr.io/ceph/k8scsi/csi-attacher:v3.1.0 |
|
csi-resizer |
mirantis.azurecr.io/ceph/k8scsi/csi-resizer:v1.1.0 |
|
rook |
mirantis.azurecr.io/ceph/rook/ceph:v1.7.6 |
Artifact |
Component |
Path |
|---|---|---|
Binaries Updated |
lcm-ansible |
https://binary.mirantis.com/lcm/bin/lcm-ansible/v0.13.0-26-gad73ff7/lcm-ansible.tar.gz |
lcm-agent |
https://binary.mirantis.com/lcm/bin/lcm-agent/v0.3.0-132-g83a348fa/lcm-agent |
|
Helm charts Updated |
managed-lcm-api |
https://binary.mirantis.com/core/helm/managed-lcm-api-1.28.7.tgz |
metallb |
||
metrics-server |
https://binary.mirantis.com/core/helm/metrics-server-1.28.7.tgz |
|
Docker images |
helm |
mirantis.azurecr.io/lcm/helm/tiller:v2.16.11-40 |
helm-controller Updated |
mirantis.azurecr.io/lcm/lcm-controller:v0.3.0-132-g83a348fa |
|
metallb-controller |
mirantis.azurecr.io/lcm/metallb/controller:v0.9.3-1 |
|
metallb-speaker |
mirantis.azurecr.io/lcm/metallb/speaker:v0.9.3-1 |
|
metrics-server |
mirantis.azurecr.io/lcm/metrics-server-amd64/v0.3.6-1 |
Artifact |
Component |
Path |
|---|---|---|
Helm charts |
alerta Updated |
https://binary.mirantis.com/stacklight/helm/alerta-0.1.0-mcp-25.tgz |
alertmanager-webhook-servicenow |
https://binary.mirantis.com/stacklight/helm/alertmanager-webhook-servicenow-0.2.0-mcp-1.tgz |
|
cerebro |
https://binary.mirantis.com/stacklight/helm/cerebro-0.1.0-mcp-2.tgz |
|
elasticsearch |
https://binary.mirantis.com/stacklight/helm/elasticsearch-7.1.1-mcp-37.tgz |
|
elasticsearch-curator |
https://binary.mirantis.com/stacklight/helm/elasticsearch-curator-1.5.0-mcp-6.tgz |
|
elasticsearch-exporter |
https://binary.mirantis.com/stacklight/helm/elasticsearch-exporter-1.2.0-mcp-2.tgz |
|
fluentd |
https://binary.mirantis.com/stacklight/helm/fluentd-2.0.3-mcp-32.tgz |
|
fluentd-elasticsearch Updated |
https://binary.mirantis.com/stacklight/helm/fluentd-elasticsearch-3.0.0-mcp-115.tgz |
|
grafana Updated |
https://binary.mirantis.com/stacklight/helm/grafana-3.3.10-mcp-121.tgz |
|
iam-proxy Updated |
||
kibana |
https://binary.mirantis.com/stacklight/helm/kibana-3.2.1-mcp-30.tgz |
|
metric-collector Updated |
https://binary.mirantis.com/stacklight/helm/metric-collector-0.3.0-mcp-3.tgz |
|
metricbeat |
https://binary.mirantis.com/stacklight/helm/metricbeat-1.7.1-mcp-12.tgz |
|
patroni |
https://binary.mirantis.com/stacklight/helm/patroni-0.15.1-mcp-36.tgz |
|
prometheus Updated |
https://binary.mirantis.com/stacklight/helm/prometheus-8.11.4-mcp-214.tgz |
|
prometheus-blackbox-exporter |
https://binary.mirantis.com/stacklight/helm/prometheus-blackbox-exporter-0.3.0-mcp-7.tgz |
|
prometheus-es-exporter |
https://binary.mirantis.com/stacklight/helm/prometheus-es-exporter-1.0.0-mcp-11.tgz |
|
prometheus-msteams |
https://binary.mirantis.com/stacklight/helm/prometheus-msteams-0.1.0-mcp-2.tgz |
|
prometheus-nginx-exporter |
https://binary.mirantis.com/stacklight/helm/prometheus-nginx-exporter-0.2.0-mcp-1.tgz |
|
sf-notifier |
https://binary.mirantis.com/stacklight/helm/sf-notifier-0.2.0-mcp-1.tgz |
|
sf-reporter |
https://binary.mirantis.com/stacklight/helm/sf-reporter-0.2.0-mcp-1.tgz |
|
stacklight Updated |
https://binary.mirantis.com/stacklight/helm/stacklight-0.3.1.tgz |
|
telegraf-ds |
https://binary.mirantis.com/stacklight/helm/telegraf-ds-1.1.5-mcp-29.tgz |
|
telegraf-s |
https://binary.mirantis.com/stacklight/helm/telegraf-s-1.1.5-mcp-30.tgz |
|
telemeter-server |
https://binary.mirantis.com/stacklight/helm/telemeter-server-0.2.0-mcp-1.tgz |
|
telemeter-client |
https://binary.mirantis.com/stacklight/helm/telemeter-client-0.2.0-mcp-1.tgz |
|
Docker images |
alerta |
mirantis.azurecr.io/stacklight/alerta-web:8.5.0-20211108051042 |
alertmanager Updated |
mirantis.azurecr.io/stacklight/alertmanager:v0.23.0 |
|
alertmanager-webhook-servicenow |
mirantis.azurecr.io/stacklight/alertmanager-webhook-servicenow:v0.1-20210601141858 |
|
busybox |
mirantis.azurecr.io/stacklight/busybox:1.30 |
|
cerebro |
mirantis.azurecr.io/stacklight/cerebro:0.9.3 |
|
configmap-reload |
mirantis.azurecr.io/stacklight/configmap-reload:v0.3.0 |
|
curl |
mirantis.azurecr.io/stacklight/curl:7.69.0 |
|
curl-jq |
mirantis.azurecr.io/stacklight/curl-jq:1.5-1 |
|
elasticsearch |
mirantis.azurecr.io/stacklight/elasticsearch:7.10.2-20211102101126 |
|
elasticsearch-curator |
mirantis.azurecr.io/stacklight/curator:5.7.6 |
|
elasticsearch-exporter |
mirantis.azurecr.io/stacklight/elasticsearch_exporter:1.0.2 |
|
fluentd |
mirantis.azurecr.io/stacklight/fluentd:1.10.2-20210915110132 |
|
grafana Updated |
mirantis.azurecr.io/stacklight/grafana:8.2.7 |
|
grafana-image-renderer |
mirantis.azurecr.io/stacklight/grafana-image-renderer:3.2.1 |
|
kubectl |
mirantis.azurecr.io/stacklight/kubectl:1.19.13 |
|
k8s-sidecar |
mirantis.azurecr.io/stacklight/k8s-sidecar:1.10.8 |
|
kibana |
mirantis.azurecr.io/stacklight/kibana:7.10.2-20211101074638 |
|
kube-state-metrics Updated |
mirantis.azurecr.io/stacklight/kube-state-metrics:v2.2.4 |
|
metric-collector |
mirantis.azurecr.io/stacklight/metric-collector:v0.1-20211109121134 |
|
metricbeat |
mirantis.azurecr.io/stacklight/metricbeat:7.10.2-20211103140113 |
|
node-exporter Updated |
mirantis.azurecr.io/stacklight/node-exporter:v1.2.2 |
|
origin-telemeter |
mirantis.azurecr.io/stacklight/origin-telemeter:4.4.0-20200424 |
|
prometheus Updated |
mirantis.azurecr.io/stacklight/prometheus:v2.31.1 |
|
prometheus-blackbox-exporter |
mirantis.azurecr.io/stacklight/blackbox-exporter:v0.14.0 |
|
prometheus-es-exporter |
mirantis.azurecr.io/stacklight/prometheus-es-exporter:v0.14.0-20210812120726 |
|
prometheus-msteams |
mirantis.azurecr.io/stacklight/prometheus-msteams:v1.4.2 |
|
prometheus-nginx-exporter |
mirantis.azurecr.io/stacklight/nginx-prometheus-exporter:0.6.0 |
|
prometheus-patroni-exporter |
mirantis.azurecr.io/stacklight/prometheus-patroni-exporter:v0.1-20210708141736 |
|
prometheus-postgres-exporter |
mirantis.azurecr.io/stacklight/prometheus-postgres-exporter:v0.9.0 |
|
prometheus-relay |
mirantis.azurecr.io/stacklight/prometheus-relay:v0.3-20210317133316 |
|
pushgateway Removed |
n/a |
|
sf-notifier |
mirantis.azurecr.io/stacklight/sf-notifier:v0.3-20210930112115 |
|
sf-reporter |
mirantis.azurecr.io/stacklight/sf-reporter:v0.1-20210607111404 |
|
spilo |
mirantis.azurecr.io/stacklight/spilo:13-2.0p6-20210525081943 |
|
telegraf |
mirantis.azurecr.io/stacklight/telegraf:v1.9.1-20210225152050 |
|
mirantis.azurecr.io/stacklight/telegraf:1.20.0-20210927090119 |
||
telemeter-token-auth |
mirantis.azurecr.io/stacklight/telemeter-token-auth:v0.1-20200406175600 |
|
yq |
mirantis.azurecr.io/stacklight/yq:v4.2.0 |
Artifact |
Component |
Path |
|---|---|---|
Debian repositories |
System packages |
|
http://mirror.mirantis.com/kaas/kubernetes-extra-rhel7-0.0.5/ |
||
https://mirror.mirantis.com/kaas/ubuntu-2021-11-11-014639.target.txt |
||
MCR repositories |
MCR |
https://repos.mirantis.com/ubuntu/dists/bionic/pool/stable-20.10/ |
This section outlines release notes for the Cluster release 5.21.0 that is introduced in the Mirantis Container Cloud release 2.14.0. This Cluster release supports Mirantis Container Runtime 20.10.6 and Mirantis Kubernetes Engine 3.3.12 with Kubernetes 1.18.
For the list of known and resolved issues, refer to the Container Cloud release 2.14.0 section.
This section outlines new features and enhancements introduced in the Cluster release 5.21.0.
Updated the Mirantis Kubernetes Engine version from 3.3.12 to 3.3.13 for the Container Cloud management, regional, and managed clusters. Also, added support for attachment of existing MKE 3.3.13 clusters.
Learn more
Limited the number of monitored network interfaces to prevent extended Prometheus RAM consumption in big clusters. By default, Prometheus Node Exporter now only collects information of a basic set of interfaces, both host and container. If required you can edit the list of excluded devices as needed.
Implemented the capability to define custom Prometheus recording rules through
the prometheusServer.customRecordingRules parameter in the StackLight Helm
chart. Overriding of existing recording rules is not supported.
Learn more
Implemented the capability to configure packet size for the syslog logging
output. If remote logging to syslog is enabled in StackLight, use the
logging.syslog.packetSize parameter in the StackLight Helm chart to
configure the packet size.
Implemented the capability to configure the Prometheus Relay client timeout and
response size limit through the prometheusRelay.clientTimeout and
prometheusRelay.responseLimitBytes parameters in the StackLight Helm chart.
Learn more
Implemented additional validation of networks specified in
spec.cephClusterSpec.network.publicNet and
spec.cephClusterSpec.network.clusterNet and prohibited the use of the
0.0.0.0/0 CIDR. Now, the bare metal provider automatically translates
the 0.0.0.0/0 network range to the default LCM IPAM subnet if it exists.
You can now also add corresponding labels for the bare metal IPAM subnets when configuring the Ceph cluster during the management cluster deployment.
Learn more
To improve debugging and log reading, separated Ceph Controller, Ceph Status Controller, and Ceph Request Controller, which used to run in one pod, into three different deployments.
Learn more
TechPreview
Implemented the KaaSCephOperationRequest CR that provides LCM operations
for Ceph OSDs and nodes by automatically creating separate
CephOsdRemoveRequest requests. It allows for automated removal of healthy
or non-healthy Ceph OSDs from a Ceph cluster.
Due to the Technology Preview status of the feature, Mirantis recommends following Remove Ceph OSD manually for Ceph OSDs removal.
The following table lists the components versions of the Cluster release 5.21.0.
Note
The components that are newly added, updated, deprecated, or removed
as compared to the previous release version, are marked
with a corresponding superscript,
for example, lcm-ansible Updated.
Component |
Application/Service |
Version |
|---|---|---|
Cluster orchestration |
Mirantis Kubernetes Engine Updated |
3.3.13 0 |
Container runtime |
Mirantis Container Runtime |
20.10.6 1 |
Distributed storage |
Ceph |
15.2.13 (Octopus) |
Rook Updated |
1.7.6 |
|
LCM |
Helm |
2.16.11-40 |
helm-controller Updated |
0.3.0-104-gb7f5e8d8 |
|
lcm-ansible Updated |
0.12.0-6-g5329efe |
|
lcm-agent Updated |
0.3.0-104-gb7f5e8d8 |
|
metallb-controller |
0.9.3-1 |
|
metrics-server |
0.3.6-1 |
|
StackLight |
Alerta Updated |
8.5.0-20211108051042 |
Alertmanager |
0.22.2 |
|
Alertmanager Webhook ServiceNow |
0.1-20210601141858 |
|
Cerebro |
0.9.3 |
|
Elasticsearch Updated |
7.10.2-2021110210112 |
|
Elasticsearch Curator |
5.7.6 |
|
Elasticsearch Exporter |
1.0.2 |
|
Fluentd |
1.10.2-20210915110132 |
|
Grafana Updated |
8.2.2 |
|
Grafana Image Renderer Updated |
3.2.1 |
|
IAM Proxy |
6.0.1 |
|
Kibana Updated |
7.10.2-20211101074638 |
|
Metric Collector Updated |
0.1-20211109121134 |
|
Metricbeat Updated |
7.10.2-20211103140113 |
|
Patroni |
13-2.0p6-20210525081943 |
|
Prometheus |
2.22.2 |
|
Prometheus Blackbox Exporter |
0.14.0 |
|
Prometheus ES Exporter |
0.14.0-20210812120726 |
|
Prometheus MS Teams |
1.4.2 |
|
Prometheus Node Exporter |
1.0.1 |
|
Prometheus NGINX Exporter |
0.6.0 |
|
Prometheus Patroni Exporter |
0.1-20210708141736 |
|
Prometheus Postgres Exporter |
0.9.0 |
|
Prometheus Relay |
0.3-20210317133316 |
|
Pushgateway |
1.2.0 |
|
sf-notifier |
0.3-20210930112115 |
|
sf-reporter |
0.1-20210607111404 |
|
Telegraf |
1.9.1-20210225142050 |
|
1.20.0-20210927090119 |
||
Telemeter |
4.4.0-20200424 |
- 0
For the Mirantis Kubernetes Engine (MKE) release highlights and components versions, see MKE documentation: MKE release notes.
- 1
For the Mirantis Container Runtime (MCR) release highlights, see MCR documentation: MCR release notes.
This section lists the components artifacts of the Cluster release 5.21.0.
Note
The components that are newly added, updated, deprecated, or removed
as compared to the previous release version, are marked
with a corresponding superscript,
for example, lcm-ansible Updated.
Artifact |
Component |
Path |
|---|---|---|
Helm chart |
ceph-controller Updated |
https://binary.mirantis.com/ceph/helm/ceph-operator-1.0.0-mcp-526.tgz |
Docker images |
ceph |
mirantis.azurecr.io/ceph/ceph:v15.2.13 |
ceph-controller Updated |
mirantis.azurecr.io/ceph/mcp/ceph-controller:v1.0.0-20211109132703 |
|
cephcsi Updated |
mirantis.azurecr.io/ceph/cephcsi/cephcsi:v3.4.0 |
|
csi-node-driver-registrar |
mirantis.azurecr.io/ceph/k8scsi/csi-node-driver-registrar:v2.1.0 |
|
csi-provisioner |
mirantis.azurecr.io/ceph/k8scsi/csi-provisioner:v2.1.2 |
|
csi-snapshotter |
mirantis.azurecr.io/ceph/k8scsi/csi-snapshotter:v4.0.0 |
|
csi-attacher |
mirantis.azurecr.io/ceph/k8scsi/csi-attacher:v3.1.0 |
|
csi-resizer |
mirantis.azurecr.io/ceph/k8scsi/csi-resizer:v1.1.0 |
|
rook Updated |
mirantis.azurecr.io/ceph/rook/ceph:v1.7.6 |
Artifact |
Component |
Path |
|---|---|---|
Binaries Updated |
lcm-ansible |
https://binary.mirantis.com/lcm/bin/lcm-ansible/v0.12.0-6-g5329efe/lcm-ansible.tar.gz |
lcm-agent Updated |
https://binary.mirantis.com/lcm/bin/lcm-agent/v0.3.0-104-gb7f5e8d8/lcm-agent |
|
Helm charts |
managed-lcm-api Updated |
https://binary.mirantis.com/core/helm/managed-lcm-api-1.27.6.tgz |
metallb Updated |
||
metrics-server |
https://binary.mirantis.com/core/helm/metrics-server-1.27.6.tgz |
|
Docker images |
helm |
mirantis.azurecr.io/lcm/helm/tiller:v2.16.11-40 |
helm-controller Updated |
mirantis.azurecr.io/lcm/lcm-controller:v0.3.0-104-gb7f5e8d8 |
|
metallb-controller |
mirantis.azurecr.io/lcm/metallb/controller:v0.9.3-1 |
|
metallb-speaker |
mirantis.azurecr.io/lcm/metallb/speaker:v0.9.3-1 |
|
metrics-server |
mirantis.azurecr.io/lcm/metrics-server-amd64/v0.3.6-1 |
Artifact |
Component |
Path |
|---|---|---|
Helm charts |
alerta |
https://binary.mirantis.com/stacklight/helm/alerta-0.1.0-mcp-22.tgz |
alertmanager-webhook-servicenow Updated |
https://binary.mirantis.com/stacklight/helm/alertmanager-webhook-servicenow-0.2.0-mcp-1.tgz |
|
cerebro |
https://binary.mirantis.com/stacklight/helm/cerebro-0.1.0-mcp-2.tgz |
|
elasticsearch |
https://binary.mirantis.com/stacklight/helm/elasticsearch-7.1.1-mcp-37.tgz |
|
elasticsearch-curator |
https://binary.mirantis.com/stacklight/helm/elasticsearch-curator-1.5.0-mcp-6.tgz |
|
elasticsearch-exporter |
https://binary.mirantis.com/stacklight/helm/elasticsearch-exporter-1.2.0-mcp-2.tgz |
|
fluentd |
https://binary.mirantis.com/stacklight/helm/fluentd-2.0.3-mcp-32.tgz |
|
fluentd-elasticsearch Updated |
https://binary.mirantis.com/stacklight/helm/fluentd-elasticsearch-3.0.0-mcp-112.tgz |
|
grafana Updated |
https://binary.mirantis.com/stacklight/helm/grafana-3.3.10-mcp-115.tgz |
|
iam-proxy |
||
kibana |
https://binary.mirantis.com/stacklight/helm/kibana-3.2.1-mcp-30.tgz |
|
metric-collector Updated |
https://binary.mirantis.com/stacklight/helm/metric-collector-0.3.0-mcp-1.tgz |
|
metricbeat |
https://binary.mirantis.com/stacklight/helm/metricbeat-1.7.1-mcp-12.tgz |
|
patroni Updated |
https://binary.mirantis.com/stacklight/helm/patroni-0.15.1-mcp-36.tgz |
|
prometheus Updated |
https://binary.mirantis.com/stacklight/helm/prometheus-8.11.4-mcp-208.tgz |
|
prometheus-blackbox-exporter |
https://binary.mirantis.com/stacklight/helm/prometheus-blackbox-exporter-0.3.0-mcp-7.tgz |
|
prometheus-es-exporter |
https://binary.mirantis.com/stacklight/helm/prometheus-es-exporter-1.0.0-mcp-11.tgz |
|
prometheus-msteams |
https://binary.mirantis.com/stacklight/helm/prometheus-msteams-0.1.0-mcp-2.tgz |
|
prometheus-nginx-exporter Updated |
https://binary.mirantis.com/stacklight/helm/prometheus-nginx-exporter-0.2.0-mcp-1.tgz |
|
sf-notifier Updated |
https://binary.mirantis.com/stacklight/helm/sf-notifier-0.2.0-mcp-1.tgz |
|
sf-reporter Updated |
https://binary.mirantis.com/stacklight/helm/sf-reporter-0.2.0-mcp-1.tgz |
|
stacklight Updated |
https://binary.mirantis.com/stacklight/helm/stacklight-0.2.5.tgz |
|
telegraf-ds |
https://binary.mirantis.com/stacklight/helm/telegraf-ds-1.1.5-mcp-29.tgz |
|
telegraf-s |
https://binary.mirantis.com/stacklight/helm/telegraf-s-1.1.5-mcp-30.tgz |
|
telemeter-server Updated |
https://binary.mirantis.com/stacklight/helm/telemeter-server-0.2.0-mcp-1.tgz |
|
telemeter-client Updated |
https://binary.mirantis.com/stacklight/helm/telemeter-client-0.2.0-mcp-1.tgz |
|
Docker images |
alerta Updated |
mirantis.azurecr.io/stacklight/alerta-web:8.5.0-20211108051042 |
alertmanager |
mirantis.azurecr.io/stacklight/alertmanager:v0.22.2 |
|
alertmanager-webhook-servicenow |
mirantis.azurecr.io/stacklight/alertmanager-webhook-servicenow:v0.1-20210601141858 |
|
busybox |
mirantis.azurecr.io/stacklight/busybox:1.30 |
|
cerebro |
mirantis.azurecr.io/stacklight/cerebro:0.9.3 |
|
configmap-reload |
mirantis.azurecr.io/stacklight/configmap-reload:v0.3.0 |
|
curl |
mirantis.azurecr.io/stacklight/curl:7.69.0 |
|
curl-jq |
mirantis.azurecr.io/stacklight/curl-jq:1.5-1 |
|
elasticsearch Updated |
mirantis.azurecr.io/stacklight/elasticsearch:7.10.2-20211102101126 |
|
elasticsearch-curator |
mirantis.azurecr.io/stacklight/curator:5.7.6 |
|
elasticsearch-exporter |
mirantis.azurecr.io/stacklight/elasticsearch_exporter:1.0.2 |
|
fluentd |
mirantis.azurecr.io/stacklight/fluentd:1.10.2-20210915110132 |
|
grafana Updated |
mirantis.azurecr.io/stacklight/grafana:8.2.2 |
|
grafana-image-renderer Updated |
mirantis.azurecr.io/stacklight/grafana-image-renderer:3.2.1 |
|
kubectl |
mirantis.azurecr.io/stacklight/kubectl:1.19.13 |
|
k8s-sidecar |
mirantis.azurecr.io/stacklight/k8s-sidecar:1.10.8 |
|
kibana Updated |
mirantis.azurecr.io/stacklight/kibana:7.10.2-20211101074638 |
|
kube-state-metrics |
mirantis.azurecr.io/stacklight/kube-state-metrics:v1.9.2 |
|
metric-collector Updated |
mirantis.azurecr.io/stacklight/metric-collector:v0.1-20211109121134 |
|
metricbeat Updated |
mirantis.azurecr.io/stacklight/metricbeat:7.10.2-20211103140113 |
|
node-exporter |
mirantis.azurecr.io/stacklight/node-exporter:v1.0.1 |
|
origin-telemeter |
mirantis.azurecr.io/stacklight/origin-telemeter:4.4.0-20200424 |
|
prometheus |
mirantis.azurecr.io/stacklight/prometheus:v2.22.2 |
|
prometheus-blackbox-exporter |
mirantis.azurecr.io/stacklight/blackbox-exporter:v0.14.0 |
|
prometheus-es-exporter |
mirantis.azurecr.io/stacklight/prometheus-es-exporter:v0.14.0-20210812120726 |
|
prometheus-msteams |
mirantis.azurecr.io/stacklight/prometheus-msteams:v1.4.2 |
|
prometheus-nginx-exporter |
mirantis.azurecr.io/stacklight/nginx-prometheus-exporter:0.6.0 |
|
prometheus-patroni-exporter |
mirantis.azurecr.io/stacklight/prometheus-patroni-exporter:v0.1-20210708141736 |
|
prometheus-postgres-exporter |
mirantis.azurecr.io/stacklight/prometheus-postgres-exporter:v0.9.0 |
|
prometheus-relay |
mirantis.azurecr.io/stacklight/prometheus-relay:v0.3-20210317133316 |
|
pushgateway |
mirantis.azurecr.io/stacklight/pushgateway:v1.2.0 |
|
sf-notifier |
mirantis.azurecr.io/stacklight/sf-notifier:v0.3-20210930112115 |
|
sf-reporter |
mirantis.azurecr.io/stacklight/sf-reporter:v0.1-20210607111404 |
|
spilo |
mirantis.azurecr.io/stacklight/spilo:13-2.0p6-20210525081943 |
|
telegraf |
mirantis.azurecr.io/stacklight/telegraf:v1.9.1-20210225152050 |
|
mirantis.azurecr.io/stacklight/telegraf:1.20.0-20210927090119 |
||
telemeter-token-auth |
mirantis.azurecr.io/stacklight/telemeter-token-auth:v0.1-20200406175600 |
|
yq |
mirantis.azurecr.io/stacklight/yq:v4.2.0 |
Artifact |
Component |
Path |
|---|---|---|
Debian repositories |
System packages |
|
http://mirror.mirantis.com/kaas/kubernetes-extra-rhel7-0.0.5/ |
||
https://mirror.mirantis.com/kaas/ubuntu-2020-07-30-013349.target.txt |
||
MCR repositories |
MCR |
https://repos.mirantis.com/ubuntu/dists/bionic/pool/stable-20.10/ |
This section outlines release notes for the Cluster release 5.20.0 that is introduced in the Mirantis Container Cloud release 2.13.0. This Cluster release supports Mirantis Container Runtime 20.10.6 and Mirantis Kubernetes Engine 3.3.12 with Kubernetes 1.18.
For the list of known and resolved issues, refer to the Container Cloud release 2.13.0 section.
This section outlines new features and enhancements introduced in the Cluster release 5.20.0.
Implemented the following improvements to StackLight alerting:
Implemented per-service
*TargetDownand*TargetsOutagealerts that raise if one or all Prometheus targets are down.Enhanced the alert inhibition rules to reduce alert flooding.
Removed the following inefficient alerts:
TargetDownTargetFlappingKubeletDownServiceNowWebhookReceiverDownSfNotifierDownPrometheusMsTeamsDown
Learn more
The following table lists the components versions of the Cluster release 5.20.0.
Note
The components that are newly added, updated, deprecated, or removed
as compared to the previous release version, are marked
with a corresponding superscript,
for example, lcm-ansible Updated.
Component |
Application/Service |
Version |
|---|---|---|
Cluster orchestration |
Mirantis Kubernetes Engine |
3.3.12 0 |
Container runtime |
Mirantis Container Runtime |
20.10.6 1 |
Distributed storage |
Ceph |
15.2.13 (Octopus) |
Rook |
1.6.8 |
|
LCM |
Helm |
2.16.11-40 |
helm-controller Updated |
0.3.0-67-g25ab9f1a |
|
lcm-ansible Updated |
0.11.0-6-gbfce76e |
|
lcm-agent Updated |
0.3.0-67-g25ab9f1a |
|
metallb-controller |
0.9.3-1 |
|
metrics-server |
0.3.6-1 |
|
StackLight |
Alerta |
8.4.1-20210707092546 |
Alertmanager |
0.22.2 |
|
Alertmanager Webhook ServiceNow |
0.1-20210601141858 |
|
Cerebro |
0.9.3 |
|
Elasticsearch |
7.10.2-20210601104922 |
|
Elasticsearch Curator |
5.7.6 |
|
Elasticsearch Exporter |
1.0.2 |
|
Fluentd Updated |
1.10.2-20210915110132 |
|
Grafana Updated |
8.1.2 |
|
Grafana Image Renderer |
2.0.1 |
|
IAM Proxy |
6.0.1 |
|
Kibana |
7.10.2-20210601104911 |
|
Metric Collector |
0.1-20210219112938 |
|
Metricbeat |
7.10.2 |
|
Patroni |
13-2.0p6-20210525081943 |
|
Prometheus |
2.22.2 |
|
Prometheus Blackbox Exporter |
0.14.0 |
|
Prometheus ES Exporter |
0.14.0-20210812120726 |
|
Prometheus MS Teams |
1.4.2 |
|
Prometheus Node Exporter |
1.0.1 |
|
Prometheus NGINX Exporter |
0.6.0 |
|
Prometheus Patroni Exporter |
0.1-20210708141736 |
|
Prometheus Postgres Exporter |
0.9.0 |
|
Prometheus Relay |
0.3-20210317133316 |
|
Pushgateway |
1.2.0 |
|
sf-notifier Updated |
0.3-20210930112115 |
|
sf-reporter New |
0.1-20210607111404 |
|
Telegraf |
1.9.1-20210225142050 |
|
New 1.20.0-20210927090119 |
||
Telemeter |
4.4.0-20200424 |
- 0
For the Mirantis Kubernetes Engine (MKE) release highlights and components versions, see MKE documentation: MKE release notes.
- 1
For the Mirantis Container Runtime (MCR) release highlights, see MCR documentation: MCR release notes.
This section lists the components artifacts of the Cluster release 5.20.0.
Note
The components that are newly added, updated, deprecated, or removed
as compared to the previous release version, are marked
with a corresponding superscript,
for example, lcm-ansible Updated.
Artifact |
Component |
Path |
|---|---|---|
Helm chart |
ceph-controller Updated |
https://binary.mirantis.com/ceph/helm/ceph-operator-1.0.0-mcp-427.tgz |
Docker images |
ceph |
mirantis.azurecr.io/ceph/ceph:v15.2.13 |
ceph-controller Updated |
mirantis.azurecr.io/ceph/mcp/ceph-controller:v1.0.0-20211013104642 |
|
cephcsi |
mirantis.azurecr.io/ceph/cephcsi/cephcsi:v3.3.1 |
|
csi-node-driver-registrar |
mirantis.azurecr.io/ceph/k8scsi/csi-node-driver-registrar:v2.1.0 |
|
csi-provisioner |
mirantis.azurecr.io/ceph/k8scsi/csi-provisioner:v2.1.2 |
|
csi-snapshotter |
mirantis.azurecr.io/ceph/k8scsi/csi-snapshotter:v4.0.0 |
|
csi-attacher |
mirantis.azurecr.io/ceph/k8scsi/csi-attacher:v3.1.0 |
|
csi-resizer |
mirantis.azurecr.io/ceph/k8scsi/csi-resizer:v1.1.0 |
|
rook |
mirantis.azurecr.io/ceph/rook/ceph:v1.6.8 |
Artifact |
Component |
Path |
|---|---|---|
Binaries Updated |
lcm-ansible |
https://binary.mirantis.com/lcm/bin/lcm-ansible/v0.11.0-6-gbfce76e/lcm-ansible.tar.gz |
lcm-agent |
https://binary.mirantis.com/lcm/bin/lcm-agent/v0.3.0-67-g25ab9f1a/lcm-agent |
|
Helm charts |
managed-lcm-api Updated |
https://binary.mirantis.com/core/helm/managed-lcm-api-1.26.6.tgz |
metallb Updated |
||
metrics-server |
https://binary.mirantis.com/core/helm/metrics-server-1.24.6.tgz |
|
Docker images |
helm |
mirantis.azurecr.io/lcm/helm/tiller:v2.16.11-40 |
helm-controller Updated |
mirantis.azurecr.io/lcm/lcm-controller:v0.3.0-67-g25ab9f1a |
|
metallb-controller |
mirantis.azurecr.io/lcm/metallb/controller:v0.9.3-1 |
|
metallb-speaker |
mirantis.azurecr.io/lcm/metallb/speaker:v0.9.3-1 |
|
metrics-server |
mirantis.azurecr.io/lcm/metrics-server-amd64/v0.3.6-1 |
Artifact |
Component |
Path |
|---|---|---|
Helm charts |
alerta |
https://binary.mirantis.com/stacklight/helm/alerta-0.1.0-mcp-22.tgz |
alertmanager-webhook-servicenow |
https://binary.mirantis.com/stacklight/helm/alertmanager-webhook-servicenow-0.1.0-mcp-3.tgz |
|
cerebro |
https://binary.mirantis.com/stacklight/helm/cerebro-0.1.0-mcp-2.tgz |
|
elasticsearch Updated |
https://binary.mirantis.com/stacklight/helm/elasticsearch-7.1.1-mcp-37.tgz |
|
elasticsearch-curator |
https://binary.mirantis.com/stacklight/helm/elasticsearch-curator-1.5.0-mcp-6.tgz |
|
elasticsearch-exporter |
https://binary.mirantis.com/stacklight/helm/elasticsearch-exporter-1.2.0-mcp-2.tgz |
|
fluentd |
https://binary.mirantis.com/stacklight/helm/fluentd-2.0.3-mcp-32.tgz |
|
fluentd-elasticsearch Updated |
https://binary.mirantis.com/stacklight/helm/fluentd-elasticsearch-3.0.0-mcp-105.tgz |
|
grafana |
https://binary.mirantis.com/stacklight/helm/grafana-3.3.10-mcp-110.tgz |
|
iam-proxy Updated |
||
kibana Updated |
https://binary.mirantis.com/stacklight/helm/kibana-3.2.1-mcp-30.tgz |
|
metric-collector |
https://binary.mirantis.com/stacklight/helm/metric-collector-0.2.0-mcp-12.tgz |
|
metricbeat |
https://binary.mirantis.com/stacklight/helm/metricbeat-1.7.1-mcp-12.tgz |
|
patroni |
https://binary.mirantis.com/stacklight/helm/patroni-0.15.1-mcp-34.tgz |
|
prometheus Updated |
https://binary.mirantis.com/stacklight/helm/prometheus-8.11.4-mcp-202.tgz |
|
prometheus-blackbox-exporter |
https://binary.mirantis.com/stacklight/helm/prometheus-blackbox-exporter-0.3.0-mcp-7.tgz |
|
prometheus-es-exporter |
https://binary.mirantis.com/stacklight/helm/prometheus-es-exporter-1.0.0-mcp-11.tgz |
|
prometheus-msteams |
https://binary.mirantis.com/stacklight/helm/prometheus-msteams-0.1.0-mcp-2.tgz |
|
prometheus-nginx-exporter |
https://binary.mirantis.com/stacklight/helm/prometheus-nginx-exporter-0.1.0-mcp-4.tgz |
|
sf-notifier |
https://binary.mirantis.com/stacklight/helm/sf-notifier-0.1.0-mcp-16.tgz |
|
sf-reporter New |
https://binary.mirantis.com/stacklight/helm/sf-reporter-0.1.0-mcp-13.tgz |
|
stacklight Updated |
https://binary.mirantis.com/stacklight/helm/stacklight-0.1.2-mcp-807.tgz |
|
telegraf-ds |
https://binary.mirantis.com/stacklight/helm/telegraf-ds-1.1.5-mcp-29.tgz |
|
telegraf-s |
https://binary.mirantis.com/stacklight/helm/telegraf-s-1.1.5-mcp-30.tgz |
|
telemeter-server |
https://binary.mirantis.com/stacklight/helm/telemeter-server-0.1.0-mcp-19.tgz |
|
telemeter-client |
https://binary.mirantis.com/stacklight/helm/telemeter-client-0.1.0-mcp-19.tgz |
|
Docker images |
alerta |
mirantis.azurecr.io/stacklight/alerta-web:8.4.1-20210707092546 |
alertmanager |
mirantis.azurecr.io/stacklight/alertmanager:v0.22.2 |
|
alertmanager-webhook-servicenow |
mirantis.azurecr.io/stacklight/alertmanager-webhook-servicenow:v0.1-20210601141858 |
|
busybox |
mirantis.azurecr.io/stacklight/busybox:1.30 |
|
cerebro |
mirantis.azurecr.io/stacklight/cerebro:0.9.3 |
|
configmap-reload |
mirantis.azurecr.io/stacklight/configmap-reload:v0.3.0 |
|
curl |
mirantis.azurecr.io/stacklight/curl:7.69.0 |
|
curl-jq |
mirantis.azurecr.io/stacklight/curl-jq:1.5-1 |
|
elasticsearch |
mirantis.azurecr.io/stacklight/elasticsearch:7.10.2-20210601104922 |
|
elasticsearch-curator |
mirantis.azurecr.io/stacklight/curator:5.7.6 |
|
elasticsearch-exporter |
mirantis.azurecr.io/stacklight/elasticsearch_exporter:1.0.2 |
|
fluentd Updated |
mirantis.azurecr.io/stacklight/fluentd:1.10.2-20210915110132 |
|
grafana Updated |
mirantis.azurecr.io/stacklight/grafana:8.1.2 |
|
grafana-image-renderer |
mirantis.azurecr.io/stacklight/grafana-image-renderer:2.0.1 |
|
kubectl |
mirantis.azurecr.io/stacklight/kubectl:1.19.13 |
|
k8s-sidecar |
mirantis.azurecr.io/stacklight/k8s-sidecar:1.10.8 |
|
kibana |
mirantis.azurecr.io/stacklight/kibana:7.10.2-20210601104911 |
|
kube-state-metrics |
mirantis.azurecr.io/stacklight/kube-state-metrics:v1.9.2 |
|
metric-collector |
mirantis.azurecr.io/stacklight/metric-collector:v0.1-20210219112938 |
|
metricbeat |
mirantis.azurecr.io/stacklight/metricbeat:7.10.2 |
|
node-exporter |
mirantis.azurecr.io/stacklight/node-exporter:v1.0.1 |
|
origin-telemeter |
mirantis.azurecr.io/stacklight/origin-telemeter:4.4.0-20200424 |
|
prometheus |
mirantis.azurecr.io/stacklight/prometheus:v2.22.2 |
|
prometheus-blackbox-exporter |
mirantis.azurecr.io/stacklight/blackbox-exporter:v0.14.0 |
|
prometheus-es-exporter |
mirantis.azurecr.io/stacklight/prometheus-es-exporter:v0.14.0-20210812120726 |
|
prometheus-msteams |
mirantis.azurecr.io/stacklight/prometheus-msteams:v1.4.2 |
|
prometheus-nginx-exporter |
mirantis.azurecr.io/stacklight/nginx-prometheus-exporter:0.6.0 |
|
prometheus-patroni-exporter |
mirantis.azurecr.io/stacklight/prometheus-patroni-exporter:v0.1-20210708141736 |
|
prometheus-postgres-exporter |
mirantis.azurecr.io/stacklight/prometheus-postgres-exporter:v0.9.0 |
|
prometheus-relay |
mirantis.azurecr.io/stacklight/prometheus-relay:v0.3-20210317133316 |
|
pushgateway |
mirantis.azurecr.io/stacklight/pushgateway:v1.2.0 |
|
sf-notifier Updated |
mirantis.azurecr.io/stacklight/sf-notifier:v0.3-20210930112115 |
|
sf-reporter New |
mirantis.azurecr.io/stacklight/sf-reporter:v0.1-20210607111404 |
|
spilo |
mirantis.azurecr.io/stacklight/spilo:13-2.0p6-20210525081943 |
|
telegraf |
mirantis.azurecr.io/stacklight/telegraf:v1.9.1-20210225152050 |
|
New mirantis.azurecr.io/stacklight/telegraf:1.20.0-20210927090119 |
||
telemeter-token-auth |
mirantis.azurecr.io/stacklight/telemeter-token-auth:v0.1-20200406175600 |
|
yq |
mirantis.azurecr.io/stacklight/yq:v4.2.0 |
Artifact |
Component |
Path |
|---|---|---|
Debian repositories |
System packages |
|
https://mirror.mirantis.com/kaas/ubuntu-2020-07-30-013349.target.txt |
||
MCR repositories |
MCR |
https://repos.mirantis.com/ubuntu/dists/bionic/pool/stable-20.10/ |
This section outlines release notes for the Cluster release 5.19.0 that is introduced in the Mirantis Container Cloud release 2.12.0. This Cluster release supports Mirantis Container Runtime 20.10.6 and Mirantis Kubernetes Engine 3.3.12 with Kubernetes 1.18.
For the list of known and resolved issues, refer to the Container Cloud release 2.12.0 section.
This section outlines new features and enhancements introduced in the Cluster release 5.19.0.
Updated the Mirantis Container Runtime (MCR) version from 20.10.5 to 20.10.6 and Mirantis Kubernetes Engine version from 3.3.6 to 3.3.12 for the Container Cloud management, regional, and managed clusters. Also, added support for attachment of existing MKE clusters 3.3.7-3.3.12 and 3.4.1-3.4.5.
For the MCR release highlights and components versions, see MCR documentation: MCR release notes and MKE documentation: MKE release notes.
Integrated the Ceph maintenance to the common upgrade procedure. Now, the
maintenance flag function is set up programmatically and the flag itself is
deprecated.
Technology Preview
Implemented the capability to specify RADOS Gateway tolerations through the
KaaSCephCluster spec using the native Rook way for setting resource
requirements for Ceph daemons.
Enhanced the Grafana dashboards to display user-friendly short names for
Kubernetes nodes, for example, master-0, instead of long name labels
such as kaas-node-f736fc1c-3baa-11eb-8262-0242ac110002.
This feature provides for consistency with Kubernetes nodes naming in the
Container Cloud web UI.
All Grafana dashboards that present node data now have an additional Node identifier drop-down menu. By default, it is set to machine to display short names for Kubernetes nodes. To display Kubernetes node name labels as previously, change this option to node.
Learn more
Implemented the following improvements to StackLight alerting:
Enhanced the alert inhibition rules.
Reworked a number of alerts to improve alerting efficiency and reduce alert flooding.
Removed the inefficient
DockerSwarmLeadElectionLoopandSystemDiskErrorsTooHighalerts.Added the
matcherskey to the routes configuration. Deprecated thematchandmatch_rekeys.
Learn more
Implemented the capability to create custom logs-based metrics that you can use to configure StackLight notifications.
Learn more
The following table lists the components versions of the Cluster release 5.19.0.
Note
The components that are newly added, updated, deprecated, or removed
as compared to the previous release version, are marked
with a corresponding superscript,
for example, lcm-ansible Updated.
Component |
Application/Service |
Version |
|---|---|---|
Cluster orchestration Updated |
Mirantis Kubernetes Engine |
3.3.12 0 |
Container runtime Updated |
Mirantis Container Runtime |
20.10.6 1 |
Distributed storage |
Ceph |
15.2.13 (Octopus) |
Rook |
1.6.8 |
|
LCM |
descheduler Removed |
n/a |
Helm |
2.16.11-40 |
|
helm-controller Updated |
0.3.0-32-gee08c2b8 |
|
lcm-ansible Updated |
0.10.0-12-g7cd13b6 |
|
lcm-agent Updated |
0.3.0-32-gee08c2b8 |
|
metallb-controller |
0.9.3-1 |
|
metrics-server |
0.3.6-1 |
|
StackLight |
Alerta |
8.4.1-20210707092546 |
Alertmanager |
0.22.2 |
|
Alertmanager Webhook ServiceNow |
0.1-20210601141858 |
|
Cerebro |
0.9.3 |
|
Elasticsearch |
7.10.2-20210601104922 |
|
Elasticsearch Curator |
5.7.6 |
|
Elasticsearch Exporter |
1.0.2 |
|
Fluentd |
1.10.2-20210602174807 |
|
Grafana |
7.5.4 |
|
Grafana Image Renderer |
2.0.1 |
|
IAM Proxy |
6.0.1 |
|
Kibana |
7.10.2-20210601104911 |
|
Metric Collector |
0.1-20210219112938 |
|
Metricbeat |
7.10.2 |
|
Patroni |
13-2.0p6-20210525081943 |
|
Prometheus |
2.22.2 |
|
Prometheus Blackbox Exporter |
0.14.0 |
|
Prometheus ES Exporter Updated |
0.14.0-20210812120726 |
|
Prometheus MS Teams |
1.4.2 |
|
Prometheus Node Exporter |
1.0.1 |
|
Prometheus NGINX Exporter |
0.6.0 |
|
Prometheus Patroni Exporter |
0.1-20210708141736 |
|
Prometheus Postgres Exporter |
0.9.0 |
|
Prometheus Relay |
0.3-20210317133316 |
|
Pushgateway |
1.2.0 |
|
sf-notifier |
0.3-20210702081359 |
|
Telegraf |
1.9.1-20210225142050 |
|
Telemeter |
4.4.0-20200424 |
- 0
For the Mirantis Kubernetes Engine (MKE) release highlights and components versions, see MKE documentation: MKE release notes.
- 1
For the Mirantis Container Runtime (MCR) release highlights, see MCR documentation: MCR release notes.
This section lists the components artifacts of the Cluster release 5.19.0.
Note
The components that are newly added, updated, deprecated, or removed
as compared to the previous release version, are marked
with a corresponding superscript,
for example, lcm-ansible Updated.
Artifact |
Component |
Path |
|---|---|---|
Helm chart |
ceph-controller Updated |
https://binary.mirantis.com/ceph/helm/ceph-operator-1.0.0-mcp-409.tgz |
Docker images |
ceph |
mirantis.azurecr.io/ceph/ceph:v15.2.13 |
ceph-controller Updated |
mirantis.azurecr.io/ceph/mcp/ceph-controller:v1.0.0-20210921155643 |
|
cephcsi |
mirantis.azurecr.io/ceph/cephcsi/cephcsi:v3.3.1 |
|
csi-node-driver-registrar |
mirantis.azurecr.io/ceph/k8scsi/csi-node-driver-registrar:v2.1.0 |
|
csi-provisioner Updated |
mirantis.azurecr.io/ceph/k8scsi/csi-provisioner:v2.1.2 |
|
csi-snapshotter |
mirantis.azurecr.io/ceph/k8scsi/csi-snapshotter:v4.0.0 |
|
csi-attacher |
mirantis.azurecr.io/ceph/k8scsi/csi-attacher:v3.1.0 |
|
csi-resizer |
mirantis.azurecr.io/ceph/k8scsi/csi-resizer:v1.1.0 |
|
rook |
mirantis.azurecr.io/ceph/rook/ceph:v1.6.8 |
Artifact |
Component |
Path |
|---|---|---|
Binaries Updated |
lcm-ansible |
https://binary.mirantis.com/lcm/bin/lcm-ansible/v0.10.0-12-g7cd13b6/lcm-ansible.tar.gz |
lcm-agent |
https://binary.mirantis.com/lcm/bin/lcm-agent/v0.3.0-32-gee08c2b8/lcm-agent |
|
Helm charts |
descheduler Removed |
n/a |
managed-lcm-api Updated |
https://binary.mirantis.com/core/helm/managed-lcm-api-1.25.6.tgz |
|
metallb Updated |
||
metrics-server |
https://binary.mirantis.com/core/helm/metrics-server-1.24.6.tgz |
|
Docker images |
descheduler Removed |
n/a |
helm |
mirantis.azurecr.io/lcm/helm/tiller:v2.16.11-40 |
|
helm-controller Updated |
mirantis.azurecr.io/lcm/lcm-controller:v0.3.0-32-gee08c2b8 |
|
metallb-controller |
mirantis.azurecr.io/lcm/metallb/controller:v0.9.3-1 |
|
metallb-speaker |
mirantis.azurecr.io/lcm/metallb/speaker:v0.9.3-1 |
|
metrics-server |
mirantis.azurecr.io/lcm/metrics-server-amd64/v0.3.6-1 |
Artifact |
Component |
Path |
|---|---|---|
Helm charts |
alerta |
https://binary.mirantis.com/stacklight/helm/alerta-0.1.0-mcp-22.tgz |
alertmanager-webhook-servicenow |
https://binary.mirantis.com/stacklight/helm/alertmanager-webhook-servicenow-0.1.0-mcp-3.tgz |
|
cerebro |
https://binary.mirantis.com/stacklight/helm/cerebro-0.1.0-mcp-2.tgz |
|
elasticsearch |
https://binary.mirantis.com/stacklight/helm/elasticsearch-7.1.1-mcp-36.tgz |
|
elasticsearch-curator |
https://binary.mirantis.com/stacklight/helm/elasticsearch-curator-1.5.0-mcp-6.tgz |
|
elasticsearch-exporter |
https://binary.mirantis.com/stacklight/helm/elasticsearch-exporter-1.2.0-mcp-2.tgz |
|
fluentd Updated |
https://binary.mirantis.com/stacklight/helm/fluentd-2.0.3-mcp-32.tgz |
|
fluentd-elasticsearch Updated |
https://binary.mirantis.com/stacklight/helm/fluentd-elasticsearch-3.0.0-mcp-97.tgz |
|
grafana Updated |
https://binary.mirantis.com/stacklight/helm/grafana-3.3.10-mcp-110.tgz |
|
iam-proxy Updated |
||
kibana |
https://binary.mirantis.com/stacklight/helm/kibana-3.2.1-mcp-29.tgz |
|
metric-collector |
https://binary.mirantis.com/stacklight/helm/metric-collector-0.2.0-mcp-12.tgz |
|
metricbeat |
https://binary.mirantis.com/stacklight/helm/metricbeat-1.7.1-mcp-12.tgz |
|
patroni Updated |
https://binary.mirantis.com/stacklight/helm/patroni-0.15.1-mcp-34.tgz |
|
prometheus Updated |
https://binary.mirantis.com/stacklight/helm/prometheus-8.11.4-mcp-201.tgz |
|
prometheus-blackbox-exporter |
https://binary.mirantis.com/stacklight/helm/prometheus-blackbox-exporter-0.3.0-mcp-7.tgz |
|
prometheus-es-exporter Updated |
https://binary.mirantis.com/stacklight/helm/prometheus-es-exporter-1.0.0-mcp-11.tgz |
|
prometheus-msteams |
https://binary.mirantis.com/stacklight/helm/prometheus-msteams-0.1.0-mcp-2.tgz |
|
prometheus-nginx-exporter |
https://binary.mirantis.com/stacklight/helm/prometheus-nginx-exporter-0.1.0-mcp-4.tgz |
|
sf-notifier |
https://binary.mirantis.com/stacklight/helm/sf-notifier-0.1.0-mcp-16.tgz |
|
stacklight Updated |
https://binary.mirantis.com/stacklight/helm/stacklight-0.1.2-mcp-595.tgz |
|
telegraf-ds |
https://binary.mirantis.com/stacklight/helm/telegraf-ds-1.1.5-mcp-29.tgz |
|
telegraf-s Updated |
https://binary.mirantis.com/stacklight/helm/telegraf-s-1.1.5-mcp-30.tgz |
|
telemeter-server Updated |
https://binary.mirantis.com/stacklight/helm/telemeter-server-0.1.0-mcp-19.tgz |
|
telemeter-client Updated |
https://binary.mirantis.com/stacklight/helm/telemeter-client-0.1.0-mcp-19.tgz |
|
Docker images |
alerta |
mirantis.azurecr.io/stacklight/alerta-web:8.4.1-20210707092546 |
alertmanager |
mirantis.azurecr.io/stacklight/alertmanager:v0.22.2 |
|
alertmanager-webhook-servicenow |
mirantis.azurecr.io/stacklight/alertmanager-webhook-servicenow:v0.1-20210601141858 |
|
busybox |
mirantis.azurecr.io/stacklight/busybox:1.30 |
|
cerebro |
mirantis.azurecr.io/stacklight/cerebro:0.9.3 |
|
configmap-reload |
mirantis.azurecr.io/stacklight/configmap-reload:v0.3.0 |
|
curl |
mirantis.azurecr.io/stacklight/curl:7.69.0 |
|
curl-jq |
mirantis.azurecr.io/stacklight/curl-jq:1.5-1 |
|
elasticsearch |
mirantis.azurecr.io/stacklight/elasticsearch:7.10.2-20210601104922 |
|
elasticsearch-curator |
mirantis.azurecr.io/stacklight/curator:5.7.6 |
|
elasticsearch-exporter |
mirantis.azurecr.io/stacklight/elasticsearch_exporter:1.0.2 |
|
fluentd |
mirantis.azurecr.io/stacklight/fluentd:1.10.2-20210602174807 |
|
grafana |
mirantis.azurecr.io/stacklight/grafana:7.5.4 |
|
grafana-image-renderer |
mirantis.azurecr.io/stacklight/grafana-image-renderer:2.0.1 |
|
kubectl |
mirantis.azurecr.io/stacklight/kubectl:1.19.13 |
|
k8s-sidecar |
mirantis.azurecr.io/stacklight/k8s-sidecar:1.10.8 |
|
kibana |
mirantis.azurecr.io/stacklight/kibana:7.10.2-20210601104911 |
|
kube-state-metrics |
mirantis.azurecr.io/stacklight/kube-state-metrics:v1.9.2 |
|
metric-collector |
mirantis.azurecr.io/stacklight/metric-collector:v0.1-20210219112938 |
|
metricbeat |
mirantis.azurecr.io/stacklight/metricbeat:7.10.2 |
|
node-exporter |
mirantis.azurecr.io/stacklight/node-exporter:v1.0.1 |
|
origin-telemeter |
mirantis.azurecr.io/stacklight/origin-telemeter:4.4.0-20200424 |
|
prometheus |
mirantis.azurecr.io/stacklight/prometheus:v2.22.2 |
|
prometheus-blackbox-exporter |
mirantis.azurecr.io/stacklight/blackbox-exporter:v0.14.0 |
|
prometheus-es-exporter Updated |
mirantis.azurecr.io/stacklight/prometheus-es-exporter:v0.14.0-20210812120726 |
|
prometheus-msteams |
mirantis.azurecr.io/stacklight/prometheus-msteams:v1.4.2 |
|
prometheus-nginx-exporter |
mirantis.azurecr.io/stacklight/nginx-prometheus-exporter:0.6.0 |
|
prometheus-patroni-exporter |
mirantis.azurecr.io/stacklight/prometheus-patroni-exporter:v0.1-20210708141736 |
|
prometheus-postgres-exporter |
mirantis.azurecr.io/stacklight/prometheus-postgres-exporter:v0.9.0 |
|
prometheus-relay |
mirantis.azurecr.io/stacklight/prometheus-relay:v0.3-20210317133316 |
|
pushgateway |
mirantis.azurecr.io/stacklight/pushgateway:v1.2.0 |
|
sf-notifier |
mirantis.azurecr.io/stacklight/sf-notifier:v0.3-20210702081359 |
|
spilo |
mirantis.azurecr.io/stacklight/spilo:13-2.0p6-20210525081943 |
|
telegraf |
mirantis.azurecr.io/stacklight/telegraf:v1.9.1-20210225152050 |
|
telemeter-token-auth |
mirantis.azurecr.io/stacklight/telemeter-token-auth:v0.1-20200406175600 |
|
yq |
mirantis.azurecr.io/stacklight/yq:v4.2.0 |
Artifact |
Component |
Path |
|---|---|---|
Debian repositories |
System packages |
|
https://mirror.mirantis.com/kaas/ubuntu-2020-07-30-013349.target.txt |
||
MCR repositories Updated |
MCR |
https://repos.mirantis.com/ubuntu/dists/bionic/pool/stable-20.10/ |
This section outlines release notes for the Cluster release 5.18.0 that is introduced in the Mirantis Container Cloud release 2.11.0. This Cluster release supports Mirantis Container Runtime 20.10.5 and Mirantis Kubernetes Engine 3.3.6 with Kubernetes 1.18.
For the list of known and resolved issues, refer to the Container Cloud release 2.11.0 section.
This section outlines new features and enhancements introduced in the Cluster release 5.18.0.
Upgraded Ceph from 14.2.19 (Nautilus) to 15.2.13 (Octopus) and Rook from 1.5.9 to 1.6.8.
Technology Preview
Implemented the capability to define Ceph tolerations and resources management
through the KaaSCephCluster spec using the native Rook way for setting
resource requirements for Ceph daemons.
Improved the MiraCephLog custom resource by adding more information about
all Ceph cluster entities and their statuses. The MiraCeph, MiraCephLog
statuses and MiraCephLog values are now integrated to
KaaSCephCluster.status and can be viewed using the miraCephInfo,
shortClusterInfo, and fullClusterInfo fields.
Implemented the capability to define a list of Ceph Manager modules to enable
on the Ceph cluster using the mgr.modules parameter in KaaSCephCluster.
Implemented the following improvements for the StackLight node labeling during a cluster creation or post-deployment configuration:
Added a verification that a cluster contains minimum 3 worker nodes with the StackLight label for clusters with StackLight deployed in HA mode. This verification applies to cluster deployment and update processes. For details on how to add the StackLight label before upgrade to the latest Cluster releases of Container Cloud 2.11.0, refer to Upgrade managed clusters with StackLight deployed in HA mode.
Added a notification about the minimum number of worker nodes with the StackLight label for HA StackLight deployments to the cluster live status description in the Container Cloud web UI.
Caution
Removal of the StackLight label from worker nodes along with removal of worker nodes with StackLight label can cause the StackLight components to become inaccessible. It is important to keep the worker nodes where the StackLight local volumes were provisioned.
Implemented the capability to set the default log level severity for all StackLight components as well as set a custom log level severity for specific StackLight components in the Container Cloud web UI. You can update this setting either during a managed cluster creation or during a post-deployment configuration.
Implemented the following improvements to StackLight alerting:
Added the following alerts:
KubeContainersCPUThrottlingHighthat raises in case of containers CPU throttling.KubeletDownthat raises if kubelet is down.
Reworked a number of alerts to improve alerting efficiency and reduce alert flooding.
Reworked the alert inhibition rules.
Removed the following inefficient alerts:
FileDescriptorUsageCriticalKubeCPUOvercommitNamespacesKubeMemOvercommitNamespacesKubeQuotaExceededContainerScrapeError
Implemented the capability to enable feed update in Salesforce using
the feed_enabled parameter. By default, this parameter is set to false
to save API calls.
On top of continuous improvements delivered to the existing Container Cloud guides, added a procedure on how to manually remove a Ceph OSD from a Ceph cluster.
Learn more
The following table lists the components versions of the Cluster release 5.18.0.
Note
The components that are newly added, updated, deprecated, or removed
as compared to the previous release version, are marked
with a corresponding superscript,
for example, lcm-ansible Updated.
Component |
Application/Service |
Version |
|---|---|---|
Cluster orchestration |
Mirantis Kubernetes Engine |
3.3.6 0 |
Container runtime |
Mirantis Container Runtime |
20.10.5 1 |
Distributed storage Updated |
Ceph |
15.2.13 (Octopus) |
Rook |
1.6.8 |
|
LCM |
descheduler |
0.8.0 |
Helm |
2.16.11-40 |
|
helm-controller Updated |
0.2.0-399-g85be100f |
|
lcm-ansible Updated |
0.9.0-17-g28bc9ce |
|
lcm-agent Updated |
0.2.0-399-g85be100f |
|
metallb-controller |
0.9.3-1 |
|
metrics-server |
0.3.6-1 |
|
StackLight |
Alerta Updated |
8.4.1-20210707092546 |
Alertmanager |
0.22.2 |
|
Alertmanager Webhook ServiceNow |
0.1-20210601141858 |
|
Cerebro |
0.9.3 |
|
Elasticsearch |
7.10.2-20210601104922 |
|
Elasticsearch Curator |
5.7.6 |
|
Elasticsearch Exporter |
1.0.2 |
|
Fluentd |
1.10.2-20210602174807 |
|
Grafana |
7.5.4 |
|
Grafana Image Renderer |
2.0.1 |
|
IAM Proxy |
6.0.1 |
|
Kibana |
7.10.2-20210601104911 |
|
Metric Collector |
0.1-20210219112938 |
|
Metricbeat |
7.10.2 |
|
Patroni |
13-2.0p6-20210525081943 |
|
Prometheus |
2.22.2 |
|
Prometheus Blackbox Exporter |
0.14.0 |
|
Prometheus ES Exporter |
0.5.1-20210323132924 |
|
Prometheus MS Teams |
1.4.2 |
|
Prometheus Node Exporter |
1.0.1 |
|
Prometheus NGINX Exporter |
0.6.0 |
|
Prometheus Patroni Exporter Updated |
0.1-20210708141736 |
|
Prometheus Postgres Exporter |
0.9.0 |
|
Prometheus Relay |
0.3-20210317133316 |
|
Pushgateway |
1.2.0 |
|
sf-notifier Updated |
0.3-20210702081359 |
|
Telegraf |
1.9.1-20210225142050 |
|
Telemeter |
4.4.0-20200424 |
- 0
For the Mirantis Kubernetes Engine (MKE) release highlights and components versions, see MKE documentation: MKE release notes.
- 1
For the Mirantis Container Runtime (MCR) release highlights, see MCR documentation: MCR release notes.
This section lists the components artifacts of the Cluster release 5.18.0.
Note
The components that are newly added, updated, deprecated, or removed
as compared to the previous release version, are marked
with a corresponding superscript,
for example, lcm-ansible Updated.
Artifact |
Component |
Path |
|---|---|---|
Helm chart |
ceph-controller Updated |
https://binary.mirantis.com/ceph/helm/ceph-operator-1.0.0-mcp-368.tgz |
Docker images |
ceph Updated |
mirantis.azurecr.io/ceph/ceph:v15.2.13 |
ceph-controller Updated |
mirantis.azurecr.io/ceph/mcp/ceph-controller:v1.0.0-20210807103257 |
|
cephcsi Updated |
mirantis.azurecr.io/ceph/cephcsi/cephcsi:v3.3.1 |
|
csi-node-driver-registrar |
mirantis.azurecr.io/ceph/k8scsi/csi-node-driver-registrar:v2.1.0 |
|
csi-provisioner Updated |
mirantis.azurecr.io/ceph/k8scsi/csi-provisioner:v2.1.2 |
|
csi-snapshotter |
mirantis.azurecr.io/ceph/k8scsi/csi-snapshotter:v4.0.0 |
|
csi-attacher |
mirantis.azurecr.io/ceph/k8scsi/csi-attacher:v3.1.0 |
|
csi-resizer |
mirantis.azurecr.io/ceph/k8scsi/csi-resizer:v1.1.0 |
|
rook Updated |
mirantis.azurecr.io/ceph/rook/ceph:v1.6.8 |
Artifact |
Component |
Path |
|---|---|---|
Binaries Updated |
lcm-ansible |
https://binary.mirantis.com/lcm/bin/lcm-ansible/v0.9.0-17-g28bc9ce/lcm-ansible.tar.gz |
lcm-agent Updated |
https://binary.mirantis.com/lcm/bin/lcm-agent/v0.2.0-399-g85be100f/lcm-agent |
|
Helm charts Updated |
descheduler |
https://binary.mirantis.com/core/helm/descheduler-1.24.6.tgz |
managed-lcm-api |
https://binary.mirantis.com/core/helm/managed-lcm-api-1.24.6.tgz |
|
metallb |
||
metrics-server |
https://binary.mirantis.com/core/helm/metrics-server-1.24.6.tgz |
|
Docker images |
descheduler |
mirantis.azurecr.io/lcm/descheduler/v0.8.0 |
helm |
mirantis.azurecr.io/lcm/helm/tiller:v2.16.11-40 |
|
helm-controller Updated |
mirantis.azurecr.io/lcm/lcm-controller:v0.2.0-399-g85be100f |
|
metallb-controller |
mirantis.azurecr.io/lcm/metallb/controller:v0.9.3-1 |
|
metallb-speaker |
mirantis.azurecr.io/lcm/metallb/speaker:v0.9.3-1 |
|
metrics-server |
mirantis.azurecr.io/lcm/metrics-server-amd64/v0.3.6-1 |
Artifact |
Component |
Path |
|---|---|---|
Helm charts |
alerta |
https://binary.mirantis.com/stacklight/helm/alerta-0.1.0-mcp-22.tgz |
alertmanager-webhook-servicenow |
https://binary.mirantis.com/stacklight/helm/alertmanager-webhook-servicenow-0.1.0-mcp-3.tgz |
|
cerebro |
https://binary.mirantis.com/stacklight/helm/cerebro-0.1.0-mcp-2.tgz |
|
elasticsearch Updated |
https://binary.mirantis.com/stacklight/helm/elasticsearch-7.1.1-mcp-36.tgz |
|
elasticsearch-curator |
https://binary.mirantis.com/stacklight/helm/elasticsearch-curator-1.5.0-mcp-6.tgz |
|
elasticsearch-exporter |
https://binary.mirantis.com/stacklight/helm/elasticsearch-exporter-1.2.0-mcp-2.tgz |
|
fluentd Updated |
https://binary.mirantis.com/stacklight/helm/fluentd-2.0.3-mcp-30.tgz |
|
fluentd-elasticsearch Updated |
https://binary.mirantis.com/stacklight/helm/fluentd-elasticsearch-3.0.0-mcp-96.tgz |
|
grafana Updated |
https://binary.mirantis.com/stacklight/helm/grafana-3.3.10-mcp-108.tgz |
|
iam-proxy Updated |
||
kibana Updated |
https://binary.mirantis.com/stacklight/helm/kibana-3.2.1-mcp-29.tgz |
|
metric-collector |
https://binary.mirantis.com/stacklight/helm/metric-collector-0.2.0-mcp-12.tgz |
|
metricbeat |
https://binary.mirantis.com/stacklight/helm/metricbeat-1.7.1-mcp-12.tgz |
|
patroni Updated |
https://binary.mirantis.com/stacklight/helm/patroni-0.15.1-mcp-33.tgz |
|
prometheus Updated |
https://binary.mirantis.com/stacklight/helm/prometheus-8.11.4-mcp-188.tgz |
|
prometheus-blackbox-exporter |
https://binary.mirantis.com/stacklight/helm/prometheus-blackbox-exporter-0.3.0-mcp-7.tgz |
|
prometheus-es-exporter |
https://binary.mirantis.com/stacklight/helm/prometheus-es-exporter-1.0.0-mcp-10.tgz |
|
prometheus-msteams |
https://binary.mirantis.com/stacklight/helm/prometheus-msteams-0.1.0-mcp-2.tgz |
|
prometheus-nginx-exporter |
https://binary.mirantis.com/stacklight/helm/prometheus-nginx-exporter-0.1.0-mcp-4.tgz |
|
sf-notifier |
https://binary.mirantis.com/stacklight/helm/sf-notifier-0.1.0-mcp-16.tgz |
|
stacklight Updated |
https://binary.mirantis.com/stacklight/helm/stacklight-0.1.2-mcp-574.tgz |
|
telegraf-ds Updated |
https://binary.mirantis.com/stacklight/helm/telegraf-ds-1.1.5-mcp-29.tgz |
|
telegraf-s Updated |
https://binary.mirantis.com/stacklight/helm/telegraf-s-1.1.5-mcp-29.tgz |
|
telemeter-server Updated |
https://binary.mirantis.com/stacklight/helm/telemeter-server-0.1.0-mcp-17.tgz |
|
telemeter-client Updated |
https://binary.mirantis.com/stacklight/helm/telemeter-client-0.1.0-mcp-17.tgz |
|
Docker images |
alerta Updated |
mirantis.azurecr.io/stacklight/alerta-web:8.4.1-20210707092546 |
alertmanager |
mirantis.azurecr.io/stacklight/alertmanager:v0.22.2 |
|
alertmanager-webhook-servicenow |
mirantis.azurecr.io/stacklight/alertmanager-webhook-servicenow:v0.1-20210601141858 |
|
busybox |
mirantis.azurecr.io/stacklight/busybox:1.30 |
|
cerebro |
mirantis.azurecr.io/stacklight/cerebro:0.9.3 |
|
configmap-reload |
mirantis.azurecr.io/stacklight/configmap-reload:v0.3.0 |
|
curl |
mirantis.azurecr.io/stacklight/curl:7.69.0 |
|
curl-jq |
mirantis.azurecr.io/stacklight/curl-jq:1.5-1 |
|
elasticsearch |
mirantis.azurecr.io/stacklight/elasticsearch:7.10.2-20210601104922 |
|
elasticsearch-curator |
mirantis.azurecr.io/stacklight/curator:5.7.6 |
|
elasticsearch-exporter |
mirantis.azurecr.io/stacklight/elasticsearch_exporter:1.0.2 |
|
fluentd |
mirantis.azurecr.io/stacklight/fluentd:1.10.2-20210602174807 |
|
grafana |
mirantis.azurecr.io/stacklight/grafana:7.5.4 |
|
grafana-image-renderer |
mirantis.azurecr.io/stacklight/grafana-image-renderer:2.0.1 |
|
kubectl Updated |
mirantis.azurecr.io/stacklight/kubectl:1.19.13 |
|
k8s-sidecar |
mirantis.azurecr.io/stacklight/k8s-sidecar:1.10.8 |
|
kibana |
mirantis.azurecr.io/stacklight/kibana:7.10.2-20210601104911 |
|
kube-state-metrics |
mirantis.azurecr.io/stacklight/kube-state-metrics:v1.9.2 |
|
metric-collector |
mirantis.azurecr.io/stacklight/metric-collector:v0.1-20210219112938 |
|
metricbeat |
mirantis.azurecr.io/stacklight/metricbeat:7.10.2 |
|
node-exporter |
mirantis.azurecr.io/stacklight/node-exporter:v1.0.1 |
|
origin-telemeter |
mirantis.azurecr.io/stacklight/origin-telemeter:4.4.0-20200424 |
|
prometheus |
mirantis.azurecr.io/stacklight/prometheus:v2.22.2 |
|
prometheus-blackbox-exporter |
mirantis.azurecr.io/stacklight/blackbox-exporter:v0.14.0 |
|
prometheus-es-exporter |
mirantis.azurecr.io/stacklight/prometheus-es-exporter:v0.5.1-20210323132924 |
|
prometheus-msteams |
mirantis.azurecr.io/stacklight/prometheus-msteams:v1.4.2 |
|
prometheus-nginx-exporter |
mirantis.azurecr.io/stacklight/nginx-prometheus-exporter:0.6.0 |
|
prometheus-patroni-exporter Updated |
mirantis.azurecr.io/stacklight/prometheus-patroni-exporter:v0.1-20210708141736 |
|
prometheus-postgres-exporter |
mirantis.azurecr.io/stacklight/prometheus-postgres-exporter:v0.9.0 |
|
prometheus-relay |
mirantis.azurecr.io/stacklight/prometheus-relay:v0.3-20210317133316 |
|
pushgateway |
mirantis.azurecr.io/stacklight/pushgateway:v1.2.0 |
|
sf-notifier Updated |
mirantis.azurecr.io/stacklight/sf-notifier:v0.3-20210702081359 |
|
spilo |
mirantis.azurecr.io/stacklight/spilo:13-2.0p6-20210525081943 |
|
telegraf |
mirantis.azurecr.io/stacklight/telegraf:v1.9.1-20210225152050 |
|
telemeter-token-auth |
mirantis.azurecr.io/stacklight/telemeter-token-auth:v0.1-20200406175600 |
|
yq |
mirantis.azurecr.io/stacklight/yq:v4.2.0 |
Artifact |
Component |
Path |
|---|---|---|
Debian repositories |
System packages |
|
https://mirror.mirantis.com/kaas/ubuntu-2020-07-30-013349.target.txt |
||
MCR repositories Updated |
MCR |
https://repos.mirantis.com/ubuntu/dists/bionic/pool/stable-20.10/ |
This section outlines release notes for the Cluster release 5.17.0 that is introduced in the Mirantis Container Cloud release 2.10.0. This Cluster release introduces support for the updated version of Mirantis Container Runtime 20.10.5 and supports Mirantis Kubernetes Engine 3.3.6 with Kubernetes 1.18.
For the list of known and resolved issues, refer to the Container Cloud release 2.10.0 section.
This section outlines new features and enhancements introduced in the Cluster release 5.17.0.
Implemented a graceful Mirantis Container Runtime (MCR) upgrade from 19.03.14 to 20.10.5 on existing Container Cloud clusters.
Improved the MKE logs gathering by replacing the default DEBUG logs level
with INFO. This change reduces the unnecessary load on the MKE cluster
caused by an excessive amount of logs generated with the DEBUG level
enabled.
Implemented the capability to configure the verbosity level of logs produced by all StackLight components or by each component separately.
Implemented the following improvements to StackLight alerting:
Added the following alerts:
PrometheusMsTeamsDownthat raises ifprometheus-msteamsis down.ServiceNowWebhookReceiverDownthat raises ifalertmanager-webhook-servicenowis down.SfNotifierDownthat raises if thesf-notifieris down.KubeAPICertExpirationMajor,KubeAPICertExpirationWarning,MKEAPICertExpirationMajor,MKEAPICertExpirationWarningthat inform on SSL certificates expiration.
Removed the inefficient
PostgresqlPrimaryDownalert.Reworked a number of alerts to improve alerting efficiency and reduce alert flooding.
Reworked the alert inhibition rules to match the receivers.
Updated Alertmanager to v0.22.2.
Changed the default behavior of the Salesforce alerts integration. Now, by default, only
Criticalalerts will be sent to the Salesforce.
Implemented the capability to add or configure proxy on existing Container Cloud managed clusters using the Container Cloud web UI.
Learn more
On top of continuous improvements delivered to the existing Container Cloud guides, added a procedure on how to move a Ceph Monitor daemon to another node.
Learn more
The following table lists the components versions of the Cluster release 5.17.0.
Note
The components that are newly added, updated, deprecated, or removed
as compared to the previous release version, are marked
with a corresponding superscript,
for example, lcm-ansible Updated.
Component |
Application/Service |
Version |
|---|---|---|
Cluster orchestration |
Mirantis Kubernetes Engine |
3.3.6 0 |
Container runtime |
Mirantis Container Runtime Updated |
20.10.5 1 |
Distributed storage |
Ceph |
14.2.19 (Nautilus) |
Rook |
1.5.9 |
|
LCM |
descheduler |
0.8.0 |
Helm |
2.16.11-40 |
|
helm-controller Updated |
0.2.0-372-g7e042f4d |
|
lcm-ansible Updated |
0.8.0-17-g63ec424 |
|
lcm-agent Updated |
0.2.0-373-gae771bb4 |
|
metallb-controller |
0.9.3-1 |
|
metrics-server |
0.3.6-1 |
|
StackLight |
Alerta |
8.4.1-20210312131419 |
Alertmanager Updated |
0.22.2 |
|
Alertmanager Webhook ServiceNow Updated |
0.1-20210601141858 |
|
Cerebro |
0.9.3 |
|
Elasticsearch Updated |
7.10.2-20210601104922 |
|
Elasticsearch Curator |
5.7.6 |
|
Elasticsearch Exporter |
1.0.2 |
|
Fluentd Updated |
1.10.2-20210602174807 |
|
Grafana |
7.5.4 |
|
Grafana Image Renderer |
2.0.1 |
|
IAM Proxy |
6.0.1 |
|
Kibana Updated |
7.10.2-20210601104911 |
|
Metric Collector |
0.1-20210219112938 |
|
Metricbeat |
7.10.2 |
|
Patroni |
13-2.0p6-20210525081943 |
|
Prometheus |
2.22.2 |
|
Prometheus Blackbox Exporter |
0.14.0 |
|
Prometheus ES Exporter |
0.5.1-20210323132924 |
|
Prometheus MS Teams |
1.4.2 |
|
Prometheus Node Exporter |
1.0.1 |
|
Prometheus NGINX Exporter |
0.6.0 |
|
Prometheus Patroni Exporter |
0.1-20200428121305 |
|
Prometheus Postgres Exporter |
0.9.0 |
|
Prometheus Relay |
0.3-20210317133316 |
|
Pushgateway |
1.2.0 |
|
sf-notifier Updated |
0.3-20210617140951 |
|
sf-reporter Updated |
0.1-20210607111404 |
|
Telegraf |
1.9.1-20210225142050 |
|
Telemeter |
4.4.0-20200424 |
- 0
For the Mirantis Kubernetes Engine (MKE) release highlights and components versions, see MKE documentation: MKE release notes.
- 1
For the Mirantis Container Runtime (MCR) release highlights, see MCR documentation: MCR release notes.
This section lists the components artifacts of the Cluster release 5.17.0.
Note
The components that are newly added, updated, deprecated, or removed
as compared to the previous release version, are marked
with a corresponding superscript,
for example, lcm-ansible Updated.
Artifact |
Component |
Path |
|---|---|---|
Helm chart |
ceph-controller Updated |
https://binary.mirantis.com/ceph/helm/ceph-operator-1.0.0-mcp-305.tgz |
Docker images |
ceph |
mirantis.azurecr.io/ceph/ceph:v14.2.19 |
ceph-controller Updated |
mirantis.azurecr.io/ceph/mcp/ceph-controller:v1.0.0-20210716222903 |
|
cephcsi |
mirantis.azurecr.io/ceph/cephcsi/cephcsi:v3.2.1 |
|
csi-node-driver-registrar |
mirantis.azurecr.io/ceph/k8scsi/csi-node-driver-registrar:v2.1.0 |
|
csi-provisioner |
mirantis.azurecr.io/ceph/k8scsi/csi-provisioner:v2.1.1 |
|
csi-snapshotter |
mirantis.azurecr.io/ceph/k8scsi/csi-snapshotter:v4.0.0 |
|
csi-attacher |
mirantis.azurecr.io/ceph/k8scsi/csi-attacher:v3.1.0 |
|
csi-resizer |
mirantis.azurecr.io/ceph/k8scsi/csi-resizer:v1.1.0 |
|
rook |
mirantis.azurecr.io/ceph/rook/ceph:v1.5.9 |
Artifact |
Component |
Path |
|---|---|---|
Binaries Updated |
lcm-ansible |
https://binary.mirantis.com/lcm/bin/lcm-ansible/v0.8.0-17-g63ec424/lcm-ansible.tar.gz |
lcm-agent Updated |
https://binary.mirantis.com/lcm/bin/lcm-agent/v0.2.0-373-gae771bb4/lcm-agent |
|
Helm charts Updated |
descheduler |
https://binary.mirantis.com/core/helm/descheduler-1.23.2.tgz |
managed-lcm-api |
https://binary.mirantis.com/core/helm/managed-lcm-api-1.23.2.tgz |
|
metallb |
||
metrics-server |
https://binary.mirantis.com/core/helm/metrics-server-1.23.2.tgz |
|
Docker images |
descheduler |
mirantis.azurecr.io/lcm/descheduler/v0.8.0 |
helm |
mirantis.azurecr.io/lcm/helm/tiller:v2.16.11-40 |
|
helm-controller Updated |
mirantis.azurecr.io/lcm/lcm-controller:v0.2.0-372-g7e042f4d |
|
metallb-controller |
mirantis.azurecr.io/lcm/metallb/controller:v0.9.3-1 |
|
metallb-speaker |
mirantis.azurecr.io/lcm/metallb/speaker:v0.9.3-1 |
|
metrics-server |
mirantis.azurecr.io/lcm/metrics-server-amd64/v0.3.6-1 |
Artifact |
Component |
Path |
|---|---|---|
Helm charts |
alerta Updated |
https://binary.mirantis.com/stacklight/helm/alerta-0.1.0-mcp-22.tgz |
alertmanager-webhook-servicenow |
https://binary.mirantis.com/stacklight/helm/alertmanager-webhook-servicenow-0.1.0-mcp-3.tgz |
|
cerebro |
https://binary.mirantis.com/stacklight/helm/cerebro-0.1.0-mcp-2.tgz |
|
elasticsearch Updated |
https://binary.mirantis.com/stacklight/helm/elasticsearch-7.1.1-mcp-33.tgz |
|
elasticsearch-curator Updated |
https://binary.mirantis.com/stacklight/helm/elasticsearch-curator-1.5.0-mcp-6.tgz |
|
elasticsearch-exporter |
https://binary.mirantis.com/stacklight/helm/elasticsearch-exporter-1.2.0-mcp-2.tgz |
|
fluentd Updated |
https://binary.mirantis.com/stacklight/helm/fluentd-2.0.3-mcp-25.tgz |
|
fluentd-elasticsearch Updated |
https://binary.mirantis.com/stacklight/helm/fluentd-elasticsearch-3.0.0-mcp-93.tgz |
|
grafana Updated |
https://binary.mirantis.com/stacklight/helm/grafana-3.3.10-mcp-105.tgz |
|
iam-proxy |
||
kibana Updated |
https://binary.mirantis.com/stacklight/helm/kibana-3.2.1-mcp-27.tgz |
|
metric-collector Updated |
https://binary.mirantis.com/stacklight/helm/metric-collector-0.2.0-mcp-12.tgz |
|
metricbeat Updated |
https://binary.mirantis.com/stacklight/helm/metricbeat-1.7.1-mcp-12.tgz |
|
patroni Updated |
https://binary.mirantis.com/stacklight/helm/patroni-0.15.1-mcp-30.tgz |
|
prometheus Updated |
https://binary.mirantis.com/stacklight/helm/prometheus-8.11.4-mcp-158.tgz |
|
prometheus-blackbox-exporter Updated |
https://binary.mirantis.com/stacklight/helm/prometheus-blackbox-exporter-0.3.0-mcp-7.tgz |
|
prometheus-es-exporter Updated |
https://binary.mirantis.com/stacklight/helm/prometheus-es-exporter-1.0.0-mcp-10.tgz |
|
prometheus-msteams |
https://binary.mirantis.com/stacklight/helm/prometheus-msteams-0.1.0-mcp-2.tgz |
|
prometheus-nginx-exporter |
https://binary.mirantis.com/stacklight/helm/prometheus-nginx-exporter-0.1.0-mcp-4.tgz |
|
sf-notifier Updated |
https://binary.mirantis.com/stacklight/helm/sf-notifier-0.1.0-mcp-16.tgz |
|
sf-reporter Updated |
https://binary.mirantis.com/stacklight/helm/sf-reporter-0.1.0-mcp-13.tgz |
|
stacklight Updated |
https://binary.mirantis.com/stacklight/helm/stacklight-0.1.2-mcp-538.tgz |
|
telegraf-ds |
https://binary.mirantis.com/stacklight/helm/telegraf-ds-1.1.5-mcp-20.tgz |
|
telegraf-s |
https://binary.mirantis.com/stacklight/helm/telegraf-s-1.1.5-mcp-20.tgz |
|
telemeter-server Updated |
https://binary.mirantis.com/stacklight/helm/telemeter-server-0.1.0-mcp-16.tgz |
|
telemeter-client Updated |
https://binary.mirantis.com/stacklight/helm/telemeter-client-0.1.0-mcp-16.tgz |
|
Docker images |
alerta |
mirantis.azurecr.io/stacklight/alerta-web:8.4.1-20210312131419 |
alertmanager Updated |
mirantis.azurecr.io/stacklight/alertmanager:v0.22.2 |
|
alertmanager-webhook-servicenow Updated |
mirantis.azurecr.io/stacklight/alertmanager-webhook-servicenow:v0.1-20210601141858 |
|
busybox |
mirantis.azurecr.io/stacklight/busybox:1.30 |
|
cerebro |
mirantis.azurecr.io/stacklight/cerebro:0.9.3 |
|
configmap-reload |
mirantis.azurecr.io/stacklight/configmap-reload:v0.3.0 |
|
curl |
mirantis.azurecr.io/stacklight/curl:7.69.0 |
|
curl-jq |
mirantis.azurecr.io/stacklight/curl-jq:1.5-1 |
|
elasticsearch Updated |
mirantis.azurecr.io/stacklight/elasticsearch:7.10.2-20210601104922 |
|
elasticsearch-curator |
mirantis.azurecr.io/stacklight/curator:5.7.6 |
|
elasticsearch-exporter |
mirantis.azurecr.io/stacklight/elasticsearch_exporter:1.0.2 |
|
fluentd Updated |
mirantis.azurecr.io/stacklight/fluentd:1.10.2-20210602174807 |
|
grafana |
mirantis.azurecr.io/stacklight/grafana:7.5.4 |
|
grafana-image-renderer |
mirantis.azurecr.io/stacklight/grafana-image-renderer:2.0.1 |
|
kubectl |
mirantis.azurecr.io/stacklight/kubectl:1.19.2 |
|
k8s-sidecar |
mirantis.azurecr.io/stacklight/k8s-sidecar:1.10.8 |
|
kibana Updated |
mirantis.azurecr.io/stacklight/kibana:7.10.2-20210601104911 |
|
kube-state-metrics |
mirantis.azurecr.io/stacklight/kube-state-metrics:v1.9.2 |
|
metric-collector |
mirantis.azurecr.io/stacklight/metric-collector:v0.1-20210219112938 |
|
metricbeat |
mirantis.azurecr.io/stacklight/metricbeat:7.10.2 |
|
node-exporter |
mirantis.azurecr.io/stacklight/node-exporter:v1.0.1 |
|
origin-telemeter |
mirantis.azurecr.io/stacklight/origin-telemeter:4.4.0-20200424 |
|
prometheus |
mirantis.azurecr.io/stacklight/prometheus:v2.22.2 |
|
prometheus-blackbox-exporter |
mirantis.azurecr.io/stacklight/blackbox-exporter:v0.14.0 |
|
prometheus-es-exporter |
mirantis.azurecr.io/stacklight/prometheus-es-exporter:v0.5.1-20210323132924 |
|
prometheus-msteams |
mirantis.azurecr.io/stacklight/prometheus-msteams:v1.4.2 |
|
prometheus-nginx-exporter |
mirantis.azurecr.io/stacklight/nginx-prometheus-exporter:0.6.0 |
|
prometheus-patroni-exporter |
mirantis.azurecr.io/stacklight/prometheus-patroni-exporter:v0.1-20200428121305 |
|
prometheus-postgres-exporter |
mirantis.azurecr.io/stacklight/prometheus-postgres-exporter:v0.9.0 |
|
prometheus-relay |
mirantis.azurecr.io/stacklight/prometheus-relay:v0.3-20210317133316 |
|
pushgateway |
mirantis.azurecr.io/stacklight/pushgateway:v1.2.0 |
|
sf-notifier Updated |
mirantis.azurecr.io/stacklight/sf-notifier:v0.3-20210617140951 |
|
sf-reporter Updated |
mirantis.azurecr.io/stacklight/sf-reporter:v0.1-20210607111404 |
|
spilo |
mirantis.azurecr.io/stacklight/spilo:13-2.0p6-20210525081943 |
|
telegraf |
mirantis.azurecr.io/stacklight/telegraf:v1.9.1-20210225152050 |
|
telemeter-token-auth |
mirantis.azurecr.io/stacklight/telemeter-token-auth:v0.1-20200406175600 |
|
yq |
mirantis.azurecr.io/stacklight/yq:v4.2.0 |
Artifact |
Component |
Path |
|---|---|---|
Debian repositories |
System packages |
|
https://mirror.mirantis.com/kaas/ubuntu-2020-07-30-013349.target.txt |
||
MCR repositories Updated |
MCR |
https://repos.mirantis.com/ubuntu/dists/bionic/pool/stable-20.10/ |
This section outlines release notes for the Cluster release 5.16.0 that is introduced in the Mirantis Container Cloud release 2.9.0. This Cluster release supports Mirantis Kubernetes Engine 3.3.6, Mirantis Container Runtime 19.03.14, and Kubernetes 1.18.
For the list of known and resolved issues, refer to the Container Cloud release 2.9.0 section.
This section outlines new features and enhancements introduced in the Cluster release 5.16.0.
Upgraded PostgreSQL from version 12 to 13
Updated Elasticsearch, Kibana, and Metricbeat from version 7.6.1 to 7.10.2
Implemented the capability to configure multiple networks for a Ceph cluster.
Learn more
Implemented the capability to configure TLS for a Ceph cluster using a custom ingress rule for Ceph public endpoints.
Implemented the capability to enable RADOS Block Device (RBD) mirroring for Ceph pools.
Learn more
The following table lists the components versions of the Cluster release 5.16.0.
Note
The components that are newly added, updated, deprecated, or removed
as compared to the previous release version, are marked
with a corresponding superscript,
for example, lcm-ansible Updated.
Component |
Application/Service |
Version |
|---|---|---|
Cluster orchestration |
Mirantis Kubernetes Engine |
3.3.6 0 |
Container runtime |
Mirantis Container Runtime |
19.03.14 1 |
Distributed storage |
Ceph |
14.2.19 (Nautilus) |
Rook |
1.5.9 |
|
LCM |
descheduler |
0.8.0 |
Helm |
2.16.11-40 |
|
helm-controller Updated |
0.2.0-349-g4870b7f5 |
|
lcm-ansible Updated |
0.7.0-9-g30acaae |
|
lcm-agent Updated |
0.2.0-349-g4870b7f5 |
|
metallb-controller |
0.9.3-1 |
|
metrics-server |
0.3.6-1 |
|
StackLight |
Alerta |
8.4.1-20210312131419 |
Alertmanager |
0.21.0 |
|
Alertmanager Webhook ServiceNow |
0.1-20210426114325 |
|
Cerebro |
0.9.3 |
|
Elasticsearch Updated |
7.10.2-20210513065347 |
|
Elasticsearch Curator |
5.7.6 |
|
Elasticsearch Exporter |
1.0.2 |
|
Fluentd Updated |
1.10.2-20210518100631 |
|
Grafana |
7.5.4 |
|
Grafana Image Renderer |
2.0.1 |
|
IAM Proxy |
6.0.1 |
|
Kibana Updated |
7.10.2-20210513065546 |
|
Metric Collector |
0.1-20210219112938 |
|
Metricbeat Updated |
7.10.2 |
|
Netchecker Deprecated |
1.4.1 |
|
Patroni Updated |
13-2.0p6-20210525081943 |
|
Prometheus |
2.22.2 |
|
Prometheus Blackbox Exporter |
0.14.0 |
|
Prometheus ES Exporter |
0.5.1-20210323132924 |
|
Prometheus MS Teams |
1.4.2 |
|
Prometheus Node Exporter |
1.0.1 |
|
Prometheus NGINX Exporter |
0.6.0 |
|
Prometheus Patroni Exporter |
0.1-20200428121305 |
|
Prometheus Postgres Exporter Updated |
0.9.0 |
|
Prometheus Relay |
0.3-20210317133316 |
|
Pushgateway |
1.2.0 |
|
sf-notifier |
0.3-20210323132354 |
|
sf-reporter |
0.1-20201216142628 |
|
Telegraf |
1.9.1-20210225142050 |
|
Telemeter |
4.4.0-20200424 |
- 0
For the MKE release highlights and components versions, see MKE documentation: MKE release notes.
- 1
For the MCR release highlights, see MCR documentation: MCR release notes.
Due to the development limitations, the MCR upgrade to version 19.03.14 on existing Container Cloud clusters is not supported.
This section lists the components artifacts of the Cluster release 5.16.0.
Note
The components that are newly added, updated, deprecated, or removed
as compared to the previous release version, are marked
with a corresponding superscript,
for example, lcm-ansible Updated.
Artifact |
Component |
Path |
|---|---|---|
Helm chart |
ceph-controller Updated |
https://binary.mirantis.com/ceph/helm/ceph-operator-1.0.0-mcp-271.tgz |
Docker images |
ceph |
mirantis.azurecr.io/ceph/ceph:v14.2.19 |
ceph-controller Updated |
mirantis.azurecr.io/ceph/mcp/ceph-controller:v1.0.0-20210521190241 |
|
cephcsi |
mirantis.azurecr.io/ceph/cephcsi/cephcsi:v3.2.1 |
|
csi-node-driver-registrar |
mirantis.azurecr.io/ceph/k8scsi/csi-node-driver-registrar:v2.1.0 |
|
csi-provisioner |
mirantis.azurecr.io/ceph/k8scsi/csi-provisioner:v2.1.1 |
|
csi-snapshotter |
mirantis.azurecr.io/ceph/k8scsi/csi-snapshotter:v4.0.0 |
|
csi-attacher |
mirantis.azurecr.io/ceph/k8scsi/csi-attacher:v3.1.0 |
|
csi-resizer |
mirantis.azurecr.io/ceph/k8scsi/csi-resizer:v1.1.0 |
|
rook |
mirantis.azurecr.io/ceph/rook/ceph:v1.5.9 |
Artifact |
Component |
Path |
|---|---|---|
Binaries Updated |
lcm-ansible |
https://binary.mirantis.com/lcm/bin/lcm-ansible/v0.7.0-9-g30acaae/lcm-ansible.tar.gz |
lcm-agent Updated |
https://binary.mirantis.com/lcm/bin/lcm-agent/v0.2.0-349-g4870b7f5/lcm-agent |
|
Helm charts Updated |
descheduler |
https://binary.mirantis.com/core/helm/descheduler-1.22.4.tgz |
managed-lcm-api |
https://binary.mirantis.com/core/helm/managed-lcm-api-1.22.4.tgz |
|
metallb |
||
metrics-server |
https://binary.mirantis.com/core/helm/metrics-server-1.22.4.tgz |
|
Docker images |
descheduler |
mirantis.azurecr.io/lcm/descheduler/v0.8.0 |
helm |
mirantis.azurecr.io/lcm/helm/tiller:v2.16.11-40 |
|
helm-controller Updated |
mirantis.azurecr.io/lcm/lcm-controller:v0.2.0-349-g4870b7f5 |
|
metallb-controller |
mirantis.azurecr.io/lcm/metallb/controller:v0.9.3-1 |
|
metallb-speaker |
mirantis.azurecr.io/lcm/metallb/speaker:v0.9.3-1 |
|
metrics-server |
mirantis.azurecr.io/lcm/metrics-server-amd64/v0.3.6-1 |
Artifact |
Component |
Path |
|---|---|---|
Helm charts |
alerta |
https://binary.mirantis.com/stacklight/helm/alerta-0.1.0-mcp-20.tgz |
alertmanager-webhook-servicenow |
https://binary.mirantis.com/stacklight/helm/alertmanager-webhook-servicenow-0.1.0-mcp-3.tgz |
|
cerebro |
https://binary.mirantis.com/stacklight/helm/cerebro-0.1.0-mcp-2.tgz |
|
elasticsearch Updated |
https://binary.mirantis.com/stacklight/helm/elasticsearch-7.1.1-mcp-31.tgz |
|
elasticsearch-curator |
https://binary.mirantis.com/stacklight/helm/elasticsearch-curator-1.5.0-mcp-2.tgz |
|
elasticsearch-exporter |
https://binary.mirantis.com/stacklight/helm/elasticsearch-exporter-1.2.0-mcp-2.tgz |
|
fluentd |
https://binary.mirantis.com/stacklight/helm/fluentd-2.0.3-mcp-20.tgz |
|
fluentd-elasticsearch Updated |
https://binary.mirantis.com/stacklight/helm/fluentd-elasticsearch-3.0.0-mcp-83.tgz |
|
grafana Updated |
https://binary.mirantis.com/stacklight/helm/grafana-3.3.10-mcp-102.tgz |
|
iam-proxy |
||
kibana Updated |
https://binary.mirantis.com/stacklight/helm/kibana-3.2.1-mcp-25.tgz |
|
metric-collector |
https://binary.mirantis.com/stacklight/helm/metric-collector-0.2.0-mcp-8.tgz |
|
metricbeat |
https://binary.mirantis.com/stacklight/helm/metricbeat-1.7.1-mcp-8.tgz |
|
netchecker Deprecated |
||
patroni Updated |
https://binary.mirantis.com/stacklight/helm/patroni-0.15.1-mcp-24.tgz |
|
prometheus Updated |
https://binary.mirantis.com/stacklight/helm/prometheus-8.11.4-mcp-139.tgz |
|
prometheus-blackbox-exporter |
https://binary.mirantis.com/stacklight/helm/prometheus-blackbox-exporter-0.3.0-mcp-4.tgz |
|
prometheus-es-exporter |
https://binary.mirantis.com/stacklight/helm/prometheus-es-exporter-1.0.0-mcp-3.tgz |
|
prometheus-msteams |
https://binary.mirantis.com/stacklight/helm/prometheus-msteams-0.1.0-mcp-2.tgz |
|
prometheus-nginx-exporter |
https://binary.mirantis.com/stacklight/helm/prometheus-nginx-exporter-0.1.0-mcp-4.tgz |
|
sf-notifier |
https://binary.mirantis.com/stacklight/helm/sf-notifier-0.1.0-mcp-11.tgz |
|
sf-reporter |
https://binary.mirantis.com/stacklight/helm/sf-reporter-0.1.0-mcp-10.tgz |
|
stacklight Updated |
https://binary.mirantis.com/stacklight/helm/stacklight-0.1.2-mcp-492.tgz |
|
telegraf-ds |
https://binary.mirantis.com/stacklight/helm/telegraf-ds-1.1.5-mcp-20.tgz |
|
telegraf-s |
https://binary.mirantis.com/stacklight/helm/telegraf-s-1.1.5-mcp-20.tgz |
|
telemeter-server |
https://binary.mirantis.com/stacklight/helm/telemeter-server-0.1.0-mcp-12.tgz |
|
telemeter-client |
https://binary.mirantis.com/stacklight/helm/telemeter-client-0.1.0-mcp-12.tgz |
|
Docker images |
alerta |
mirantis.azurecr.io/stacklight/alerta-web:8.4.1-20210312131419 |
alertmanager |
mirantis.azurecr.io/stacklight/alertmanager:v0.21.0 |
|
alertmanager-webhook-servicenow |
mirantis.azurecr.io/stacklight/alertmanager-webhook-servicenow:v0.1-20210426114325 |
|
busybox |
mirantis.azurecr.io/stacklight/busybox:1.30 |
|
cerebro |
mirantis.azurecr.io/stacklight/cerebro:0.9.3 |
|
configmap-reload |
mirantis.azurecr.io/stacklight/configmap-reload:v0.3.0 |
|
curl |
mirantis.azurecr.io/stacklight/curl:7.69.0 |
|
curl-jq |
mirantis.azurecr.io/stacklight/curl-jq:1.5-1 |
|
elasticsearch Updated |
mirantis.azurecr.io/stacklight/elasticsearch:7.10.2-20210513065347 |
|
elasticsearch-curator |
mirantis.azurecr.io/stacklight/curator:5.7.6 |
|
elasticsearch-exporter |
mirantis.azurecr.io/stacklight/elasticsearch_exporter:1.0.2 |
|
fluentd Updated |
mirantis.azurecr.io/stacklight/fluentd:1.10.2-20210518100631 |
|
gce-proxy |
mirantis.azurecr.io/stacklight/gce-proxy:1.11 |
|
grafana |
mirantis.azurecr.io/stacklight/grafana:7.5.4 |
|
grafana-image-renderer |
mirantis.azurecr.io/stacklight/grafana-image-renderer:2.0.1 |
|
kubectl |
mirantis.azurecr.io/stacklight/kubectl:1.19.2 |
|
k8s-netchecker-agent Deprecated |
mirantis.azurecr.io/lcm/kubernetes/k8s-netchecker-agent:2019.1 |
|
k8s-netchecker-server Deprecated |
mirantis.azurecr.io/lcm/kubernetes/k8s-netchecker-server:2019.1 |
|
k8s-sidecar |
mirantis.azurecr.io/stacklight/k8s-sidecar:1.10.8 |
|
kibana Updated |
mirantis.azurecr.io/stacklight/kibana:7.10.2-20210513065546 |
|
kube-state-metrics |
mirantis.azurecr.io/stacklight/kube-state-metrics:v1.9.2 |
|
metric-collector |
mirantis.azurecr.io/stacklight/metric-collector:v0.1-20210219112938 |
|
metricbeat Updated |
mirantis.azurecr.io/stacklight/metricbeat:7.10.2 |
|
node-exporter |
mirantis.azurecr.io/stacklight/node-exporter:v1.0.1 |
|
origin-telemeter |
mirantis.azurecr.io/stacklight/origin-telemeter:4.4.0-20200424 |
|
prometheus |
mirantis.azurecr.io/stacklight/prometheus:v2.22.2 |
|
prometheus-blackbox-exporter |
mirantis.azurecr.io/stacklight/blackbox-exporter:v0.14.0 |
|
prometheus-es-exporter |
mirantis.azurecr.io/stacklight/prometheus-es-exporter:v0.5.1-20210323132924 |
|
prometheus-msteams |
mirantis.azurecr.io/stacklight/prometheus-msteams:v1.4.2 |
|
prometheus-nginx-exporter |
mirantis.azurecr.io/stacklight/nginx-prometheus-exporter:0.6.0 |
|
prometheus-patroni-exporter |
mirantis.azurecr.io/stacklight/prometheus-patroni-exporter:v0.1-20200428121305 |
|
prometheus-postgres-exporter Updated |
mirantis.azurecr.io/stacklight/prometheus-postgres-exporter:v0.9.0 |
|
prometheus-relay |
mirantis.azurecr.io/stacklight/prometheus-relay:v0.3-20210317133316 |
|
pushgateway |
mirantis.azurecr.io/stacklight/pushgateway:v1.2.0 |
|
sf-notifier |
mirantis.azurecr.io/stacklight/sf-notifier:v0.3-20210323132354 |
|
sf-reporter |
mirantis.azurecr.io/stacklight/sf-reporter:v0.1-20201216152628 |
|
spilo Updated |
mirantis.azurecr.io/stacklight/spilo:13-2.0p6-20210525081943 |
|
telegraf |
mirantis.azurecr.io/stacklight/telegraf:v1.9.1-20210225152050 |
|
telemeter-token-auth |
mirantis.azurecr.io/stacklight/telemeter-token-auth:v0.1-20200406175600 |
|
yq |
mirantis.azurecr.io/stacklight/yq:v4.2.0 |
Artifact |
Component |
Path |
|---|---|---|
Debian repositories |
System packages |
|
https://mirror.mirantis.com/kaas/ubuntu-2020-07-30-013349.target.txt |
||
MCR repositories |
MCR |
https://repos.mirantis.com/ubuntu/dists/bionic/pool/stable-19.03/ |
This section outlines release notes for the Cluster release 5.15.0 that is introduced in the Mirantis Container Cloud release 2.8.0. This Cluster release supports Mirantis Kubernetes Engine 3.3.6, Mirantis Container Runtime 19.03.14, and Kubernetes 1.18.
For the list of known and resolved issues, refer to the Container Cloud release 2.8.0 section.
This section outlines new features and enhancements introduced in the Cluster release 5.15.0.
Implemented the capability to enable Alertmanager to send notifications to a Microsoft Teams channel.
Learn more
Implemented the capability to enable Alertmanager to send notifications to
ServiceNow. Also added the ServiceNowAuthFailure alert that will raise in
case of failure to authenticate to ServiceNow.
Learn more
Improved the log collection mechanism by optimizing the existing and adding new log parsers for multiple Container Cloud components.
Learn more
Enhanced Ceph Controller to automatically specify default configuration options for each Ceph cluster during the Ceph deployment.
Implemented the following Ceph enhancements in the KaaSCephCluster CR:
Added the capability to specify the
rgwrole using therolesparameterAdded the following parameters:
rookConfigto override the Ceph configuration optionsuseAsFullNameto enable the Ceph block pool to use only thenamevalue as a nametargetSizeRatioto specify the expected consumption of the Ceph cluster total capacitySSLCertto use a custom TLS certificate to access the Ceph RGW endpointnodeGroupsto easily define specifications for multiple Ceph nodes using lists, grouped by node lists or node labelsclientsto specify the Ceph clients and their capabilities
Learn more
On top of continuous improvements delivered to the existing Container Cloud guides, added the following detailed procedures:
Recovery of failed Ceph Monitors of a Ceph cluster.
Silencing of StackLight alerts, for example, for maintenance or before performing an update.
Learn more
The following table lists the components versions of the Cluster release 5.15.0.
Note
The components that are newly added, updated, deprecated, or removed
as compared to the previous release version, are marked
with a corresponding superscript,
for example, lcm-ansible Updated.
Component |
Application/Service |
Version |
|---|---|---|
Cluster orchestration |
Mirantis Kubernetes Engine |
3.3.6 0 |
Container runtime |
Mirantis Container Runtime |
19.03.14 1 |
Distributed storage Updated |
Ceph |
14.2.19 (Nautilus) |
Rook |
1.5.9 |
|
LCM |
descheduler |
0.8.0 |
Helm |
2.16.11-40 |
|
helm-controller Updated |
0.2.0-327-g5676f4e3 |
|
lcm-ansible Updated |
0.6.0-19-g0004de6 |
|
lcm-agent Updated |
0.2.0-327-g5676f4e3 |
|
metallb-controller |
0.9.3-1 |
|
metrics-server |
0.3.6-1 |
|
StackLight |
Alerta |
8.4.1-20210312131419 |
Alertmanager |
0.21.0 |
|
Alertmanager Webhook ServiceNow New |
0.1-20210426114325 |
|
Cerebro |
0.9.3 |
|
Elasticsearch |
7.6.1 |
|
Elasticsearch Curator |
5.7.6 |
|
Elasticsearch Exporter |
1.0.2 |
|
Fluentd |
1.10.2-20210301155825 |
|
Grafana Updated |
7.5.4 |
|
Grafana Image Renderer |
2.0.1 |
|
IAM Proxy |
6.0.1 |
|
Kibana |
7.6.1 |
|
Metric Collector |
0.1-20210219112938 |
|
Metricbeat |
7.6.1 |
|
Netchecker |
1.4.1 |
|
Patroni |
12-1.6p3 |
|
Prometheus |
2.22.2 |
|
Prometheus Blackbox Exporter |
0.14.0 |
|
Prometheus ES Exporter |
0.5.1-20210323132924 |
|
Prometheus MS Teams New |
1.4.2 |
|
Prometheus Node Exporter |
1.0.1 |
|
Prometheus NGINX Exporter |
0.6.0 |
|
Prometheus Patroni Exporter |
0.1-20200428121305 |
|
Prometheus Postgres Exporter |
0.8.0-20201006113956 |
|
Prometheus Relay |
0.3-20210317133316 |
|
Pushgateway |
1.2.0 |
|
sf-notifier |
0.3-20210323132354 |
|
sf-reporter |
0.1-20201216142628 |
|
Telegraf |
1.9.1-20210225142050 |
|
Telemeter |
4.4.0-20200424 |
- 0
For the MKE release highlights and components versions, see MKE documentation: MKE release notes.
- 1
For the MCR release highlights, see MCR documentation: MCR release notes.
Due to the development limitations, the MCR upgrade to version 19.03.14 on existing Container Cloud clusters is not supported.
This section lists the components artifacts of the Cluster release 5.15.0.
Note
The components that are newly added, updated, deprecated, or removed
as compared to the previous release version, are marked
with a corresponding superscript,
for example, lcm-ansible Updated.
Artifact |
Component |
Path |
|---|---|---|
Helm chart |
ceph-controller Updated |
https://binary.mirantis.com/ceph/helm/ceph-operator-1.0.0-mcp-242.tgz |
Docker images |
ceph Updated |
mirantis.azurecr.io/ceph/ceph:v14.2.19 |
ceph-controller Updated |
mirantis.azurecr.io/ceph/mcp/ceph-controller:v1.0.0-20210425091701 |
|
cephcsi |
mirantis.azurecr.io/ceph/cephcsi/cephcsi:v3.2.1 |
|
csi-node-driver-registrar |
mirantis.azurecr.io/ceph/k8scsi/csi-node-driver-registrar:v2.1.0 |
|
csi-provisioner Updated |
mirantis.azurecr.io/ceph/k8scsi/csi-provisioner:v2.1.1 |
|
csi-snapshotter |
mirantis.azurecr.io/ceph/k8scsi/csi-snapshotter:v4.0.0 |
|
csi-attacher |
mirantis.azurecr.io/ceph/k8scsi/csi-attacher:v3.1.0 |
|
csi-resizer |
mirantis.azurecr.io/ceph/k8scsi/csi-resizer:v1.1.0 |
|
rook Updated |
mirantis.azurecr.io/ceph/rook/ceph:v1.5.9 |
Artifact |
Component |
Path |
|---|---|---|
Binaries Updated |
lcm-ansible |
https://binary.mirantis.com/lcm/bin/lcm-ansible/v0.6.0-19-g0004de6/lcm-ansible.tar.gz |
lcm-agent |
https://binary.mirantis.com/lcm/bin/lcm-agent/v0.2.0-327-g5676f4e3/lcm-agent |
|
Helm charts Updated |
descheduler |
https://binary.mirantis.com/core/helm/descheduler-1.20.2.tgz |
managed-lcm-api |
https://binary.mirantis.com/core/helm/managed-lcm-api-1.20.2.tgz |
|
metallb |
||
metrics-server |
https://binary.mirantis.com/core/helm/metrics-server-1.20.2.tgz |
|
Docker images |
descheduler |
mirantis.azurecr.io/lcm/descheduler/v0.8.0 |
helm |
mirantis.azurecr.io/lcm/helm/tiller:v2.16.11-40 |
|
helm-controller Updated |
mirantis.azurecr.io/lcm/lcm-controller:v0.2.0-327-g5676f4e3 |
|
metallb-controller |
mirantis.azurecr.io/lcm/metallb/controller:v0.9.3-1 |
|
metallb-speaker |
mirantis.azurecr.io/lcm/metallb/speaker:v0.9.3-1 |
|
metrics-server |
mirantis.azurecr.io/lcm/metrics-server-amd64/v0.3.6-1 |
Artifact |
Component |
Path |
|---|---|---|
Helm charts |
alerta Updated |
https://binary.mirantis.com/stacklight/helm/alerta-0.1.0-mcp-20.tgz |
alertmanager-webhook-servicenow New |
https://binary.mirantis.com/stacklight/helm/alertmanager-webhook-servicenow-0.1.0-mcp-3.tgz |
|
cerebro |
https://binary.mirantis.com/stacklight/helm/cerebro-0.1.0-mcp-2.tgz |
|
elasticsearch Updated |
https://binary.mirantis.com/stacklight/helm/elasticsearch-7.1.1-mcp-29.tgz |
|
elasticsearch-curator |
https://binary.mirantis.com/stacklight/helm/elasticsearch-curator-1.5.0-mcp-2.tgz |
|
elasticsearch-exporter |
https://binary.mirantis.com/stacklight/helm/elasticsearch-exporter-1.2.0-mcp-2.tgz |
|
fluentd Updated |
https://binary.mirantis.com/stacklight/helm/fluentd-2.0.3-mcp-20.tgz |
|
fluentd-elasticsearch Updated |
https://binary.mirantis.com/stacklight/helm/fluentd-elasticsearch-3.0.0-mcp-79.tgz |
|
grafana Updated |
https://binary.mirantis.com/stacklight/helm/grafana-3.3.10-mcp-98.tgz |
|
iam-proxy |
||
kibana |
https://binary.mirantis.com/stacklight/helm/kibana-3.2.1-mcp-20.tgz |
|
metric-collector |
https://binary.mirantis.com/stacklight/helm/metric-collector-0.2.0-mcp-8.tgz |
|
metricbeat |
https://binary.mirantis.com/stacklight/helm/metricbeat-1.7.1-mcp-8.tgz |
|
netchecker |
||
patroni Updated |
https://binary.mirantis.com/stacklight/helm/patroni-0.15.1-mcp-21.tgz |
|
prometheus Updated |
https://binary.mirantis.com/stacklight/helm/prometheus-8.11.4-mcp-130.tgz |
|
prometheus-blackbox-exporter |
https://binary.mirantis.com/stacklight/helm/prometheus-blackbox-exporter-0.3.0-mcp-4.tgz |
|
prometheus-es-exporter |
https://binary.mirantis.com/stacklight/helm/prometheus-es-exporter-1.0.0-mcp-3.tgz |
|
prometheus-msteams New |
https://binary.mirantis.com/stacklight/helm/prometheus-msteams-0.1.0-mcp-2.tgz |
|
prometheus-nginx-exporter |
https://binary.mirantis.com/stacklight/helm/prometheus-nginx-exporter-0.1.0-mcp-4.tgz |
|
sf-notifier |
https://binary.mirantis.com/stacklight/helm/sf-notifier-0.1.0-mcp-11.tgz |
|
sf-reporter |
https://binary.mirantis.com/stacklight/helm/sf-reporter-0.1.0-mcp-10.tgz |
|
stacklight Updated |
https://binary.mirantis.com/stacklight/helm/stacklight-0.1.2-mcp-464.tgz |
|
telegraf-ds |
https://binary.mirantis.com/stacklight/helm/telegraf-ds-1.1.5-mcp-20.tgz |
|
telegraf-s |
https://binary.mirantis.com/stacklight/helm/telegraf-s-1.1.5-mcp-20.tgz |
|
telemeter-server |
https://binary.mirantis.com/stacklight/helm/telemeter-server-0.1.0-mcp-12.tgz |
|
telemeter-client |
https://binary.mirantis.com/stacklight/helm/telemeter-client-0.1.0-mcp-12.tgz |
|
Docker images |
alerta |
mirantis.azurecr.io/stacklight/alerta-web:8.4.1-20210312131419 |
alertmanager |
mirantis.azurecr.io/stacklight/alertmanager:v0.21.0 |
|
alertmanager-webhook-servicenow New |
mirantis.azurecr.io/stacklight/alertmanager-webhook-servicenow:v0.1-20210426114325 |
|
alpine-python3-requests |
mirantis.azurecr.io/stacklight/alpine-python3-requests:latest-20200618 |
|
busybox |
mirantis.azurecr.io/stacklight/busybox:1.30 |
|
cerebro |
mirantis.azurecr.io/stacklight/cerebro:0.9.3 |
|
configmap-reload |
mirantis.azurecr.io/stacklight/configmap-reload:v0.3.0 |
|
curl |
mirantis.azurecr.io/stacklight/curl:7.69.0 |
|
curl-jq |
mirantis.azurecr.io/stacklight/curl-jq:1.5-1 |
|
elasticsearch |
mirantis.azurecr.io/stacklight/elasticsearch:7.6.1 |
|
elasticsearch-curator |
mirantis.azurecr.io/stacklight/curator:5.7.6 |
|
elasticsearch-exporter |
mirantis.azurecr.io/stacklight/elasticsearch_exporter:1.0.2 |
|
fluentd |
mirantis.azurecr.io/stacklight/fluentd:1.10.2-20210301155825 |
|
gce-proxy |
mirantis.azurecr.io/stacklight/gce-proxy:1.11 |
|
grafana Updated |
mirantis.azurecr.io/stacklight/grafana:7.5.4 |
|
grafana-image-renderer |
mirantis.azurecr.io/stacklight/grafana-image-renderer:2.0.1 |
|
kubectl |
mirantis.azurecr.io/stacklight/kubectl:1.19.2 |
|
k8s-netchecker-agent |
mirantis.azurecr.io/lcm/kubernetes/k8s-netchecker-agent:2019.1 |
|
k8s-netchecker-server |
mirantis.azurecr.io/lcm/kubernetes/k8s-netchecker-server:2019.1 |
|
k8s-sidecar |
mirantis.azurecr.io/stacklight/k8s-sidecar:1.10.8 |
|
kibana |
mirantis.azurecr.io/stacklight/kibana:7.6.1 |
|
kube-state-metrics |
mirantis.azurecr.io/stacklight/kube-state-metrics:v1.9.2 |
|
metric-collector |
mirantis.azurecr.io/stacklight/metric-collector:v0.1-20210219112938 |
|
metricbeat |
mirantis.azurecr.io/stacklight/metricbeat:7.6.1 |
|
node-exporter |
mirantis.azurecr.io/stacklight/node-exporter:v1.0.1 |
|
origin-telemeter |
mirantis.azurecr.io/stacklight/origin-telemeter:4.4.0-20200424 |
|
prometheus |
mirantis.azurecr.io/stacklight/prometheus:v2.22.2 |
|
prometheus-blackbox-exporter |
mirantis.azurecr.io/stacklight/blackbox-exporter:v0.14.0 |
|
prometheus-es-exporter |
mirantis.azurecr.io/stacklight/prometheus-es-exporter:v0.5.1-20210323132924 |
|
prometheus-msteams New |
mirantis.azurecr.io/stacklight/prometheus-msteams:v1.4.2 |
|
prometheus-nginx-exporter |
mirantis.azurecr.io/stacklight/nginx-prometheus-exporter:0.6.0 |
|
prometheus-patroni-exporter |
mirantis.azurecr.io/stacklight/prometheus-patroni-exporter:v0.1-20200428121305 |
|
prometheus-postgres-exporter |
mirantis.azurecr.io/stacklight/prometheus-postgres-exporter:v0.8.0-20201006113956 |
|
prometheus-relay |
mirantis.azurecr.io/stacklight/prometheus-relay:v0.3-20210317133316 |
|
pushgateway |
mirantis.azurecr.io/stacklight/pushgateway:v1.2.0 |
|
sf-notifier |
mirantis.azurecr.io/stacklight/sf-notifier:v0.3-20210323132354 |
|
sf-reporter |
mirantis.azurecr.io/stacklight/sf-reporter:v0.1-20201216152628 |
|
spilo |
mirantis.azurecr.io/stacklight/spilo:12-1.6p3 |
|
telegraf |
mirantis.azurecr.io/stacklight/telegraf:v1.9.1-20210225152050 |
|
telemeter-token-auth |
mirantis.azurecr.io/stacklight/telemeter-token-auth:v0.1-20200406175600 |
|
yq |
mirantis.azurecr.io/stacklight/yq:v4.2.0 |
Artifact |
Component |
Path |
|---|---|---|
Debian repositories |
System packages |
|
https://mirror.mirantis.com/kaas/ubuntu-2020-07-30-013349.target.txt |
||
MCR repositories |
MCR |
https://repos.mirantis.com/ubuntu/dists/bionic/pool/stable-19.03/ |
This section outlines release notes for the Cluster release 5.14.0 that is introduced in the Mirantis Container Cloud release 2.7.0. This Cluster release supports Mirantis Kubernetes Engine 3.3.6, Mirantis Container Runtime 19.03.14, and Kubernetes 1.18.
For the list of known and resolved issues, refer to the Container Cloud release 2.7.0 section.
This section outlines new features and enhancements introduced in the Cluster release 5.14.0.
Improved the log collection mechanism by optimizing the existing and adding new log parsers for multiple Container Cloud components.
Learn more
TECHNOLOGY PREVIEW
Added the possibility to configure dedicated networks for the Ceph cluster access and replication traffic using dedicated subnets. Container Cloud automatically configures Ceph to use the addresses from the dedicated subnets after you assign the corresponding addresses to the storage nodes.
Learn more
TECHNOLOGY PREVIEW
Implemented the capability to enable the Ceph Multisite configuration that allows object storage to replicate its data over multiple Ceph clusters. Using Multisite, such object storage is independent and isolated from another object storage in the cluster.
On top of continuous improvements delivered to the existing Container Cloud guides, added the Troubleshoot Ceph section to the Operations Guide. This section now contains a detailed procedure to recover a failed or accidentally removed Ceph cluster.
Learn more
The following table lists the components versions of the Cluster release 5.14.0.
Note
The components that are newly added, updated, deprecated, or removed
as compared to the previous release version, are marked
with a corresponding superscript,
for example, lcm-ansible Updated.
Component |
Application/Service |
Version |
|---|---|---|
Cluster orchestration |
Mirantis Kubernetes Engine |
3.3.6 0 |
Container runtime |
Mirantis Container Runtime |
19.03.14 1 |
Distributed storage |
Ceph |
14.2.12 (Nautilus) |
Rook |
1.5.5 |
|
LCM |
descheduler |
0.8.0 |
Helm |
2.16.11-40 |
|
helm-controller Updated |
0.2.0-297-g8c87ad67 |
|
lcm-ansible Updated |
0.5.0-10-gdd307e6 |
|
lcm-agent Updated |
0.2.0-300-ga874e0df |
|
metallb-controller |
0.9.3-1 |
|
metrics-server |
0.3.6-1 |
|
StackLight |
Alerta Updated |
8.4.1-20210312131419 |
Alertmanager |
0.21.0 |
|
Cerebro |
0.9.3 |
|
Elasticsearch |
7.6.1 |
|
Elasticsearch Curator |
5.7.6 |
|
Elasticsearch Exporter |
1.0.2 |
|
Fluentd |
1.10.2-20210301155825 |
|
Grafana |
7.3.7 |
|
Grafana Image Renderer |
2.0.1 |
|
IAM Proxy |
6.0.1 |
|
Kibana |
7.6.1 |
|
Metric Collector |
0.1-20210219112938 |
|
Metricbeat |
7.6.1 |
|
Netchecker |
1.4.1 |
|
Patroni |
12-1.6p3 |
|
Prometheus |
2.22.2 |
|
Prometheus Blackbox Exporter |
0.14.0 |
|
Prometheus ES Exporter Updated |
0.5.1-20210323132924 |
|
Prometheus Node Exporter |
1.0.1 |
|
Prometheus NGINX Exporter |
0.6.0 |
|
Prometheus Patroni Exporter |
0.1-20200428121305 |
|
Prometheus Postgres Exporter |
0.8.0-20201006113956 |
|
Prometheus Relay Updated |
0.3-20210317133316 |
|
Pushgateway |
1.2.0 |
|
sf-notifier Updated |
0.3-20210323132354 |
|
sf-reporter |
0.1-20201216142628 |
|
Telegraf |
1.9.1-20210225142050 |
|
Telemeter |
4.4.0-20200424 |
- 0
For the MKE release highlights and components versions, see MKE documentation: MKE release notes.
- 1
For the MCR release highlights, see MCR documentation: MCR release notes.
Due to the development limitations, the MCR upgrade to version 19.03.14 on existing Container Cloud clusters is not supported.
This section lists the components artifacts of the Cluster release 5.14.0.
Note
The components that are newly added, updated, deprecated, or removed
as compared to the previous release version, are marked
with a corresponding superscript,
for example, lcm-ansible Updated.
Artifact |
Component |
Path |
|---|---|---|
Helm chart |
ceph-controller Updated |
https://binary.mirantis.com/ceph/helm/ceph-operator-1.0.0-mcp-177.tgz |
Docker images |
ceph |
mirantis.azurecr.io/ceph/ceph:v14.2.12 |
ceph-controller Updated |
mirantis.azurecr.io/ceph/mcp/ceph-controller:v1.0.0-20210322210534 |
|
cephcsi |
mirantis.azurecr.io/ceph/cephcsi/cephcsi:v3.2.1 |
|
csi-node-driver-registrar |
mirantis.azurecr.io/ceph/k8scsi/csi-node-driver-registrar:v2.1.0 |
|
csi-provisioner |
mirantis.azurecr.io/ceph/k8scsi/csi-provisioner:v2.1.0 |
|
csi-snapshotter |
mirantis.azurecr.io/ceph/k8scsi/csi-snapshotter:v4.0.0 |
|
csi-attacher |
mirantis.azurecr.io/ceph/k8scsi/csi-attacher:v3.1.0 |
|
csi-resizer |
mirantis.azurecr.io/ceph/k8scsi/csi-resizer:v1.1.0 |
|
rook |
mirantis.azurecr.io/ceph/rook/ceph:v1.5.5 |
Artifact |
Component |
Path |
|---|---|---|
Binaries |
lcm-ansible Updated |
https://binary.mirantis.com/lcm/bin/lcm-ansible/v0.5.0-10-gdd307e6/lcm-ansible.tar.gz |
lcm-agent Updated |
https://binary.mirantis.com/lcm/bin/lcm-agent/v0.2.0-300-ga874e0df/lcm-agent |
|
Helm charts |
descheduler Updated |
https://binary.mirantis.com/core/helm/descheduler-1.19.1.tgz |
managed-lcm-api Updated |
https://binary.mirantis.com/core/helm/managed-lcm-api-1.19.1.tgz |
|
metallb Updated |
||
metrics-server Updated |
https://binary.mirantis.com/core/helm/metrics-server-1.19.1.tgz |
|
Docker images |
descheduler |
mirantis.azurecr.io/lcm/descheduler/v0.8.0 |
helm |
mirantis.azurecr.io/lcm/helm/tiller:v2.16.11-40 |
|
helm-controller Updated |
mirantis.azurecr.io/lcm/lcm-controller:v0.2.0-297-g8c87ad67 |
|
metallb-controller |
mirantis.azurecr.io/lcm/metallb/controller:v0.9.3-1 |
|
metallb-speaker |
mirantis.azurecr.io/lcm/metallb/speaker:v0.9.3-1 |
|
metrics-server |
mirantis.azurecr.io/lcm/metrics-server-amd64/v0.3.6-1 |
Artifact |
Component |
Path |
|---|---|---|
Helm charts |
alerta |
https://binary.mirantis.com/stacklight/helm/alerta-0.1.0-mcp-15.tgz |
cerebro |
https://binary.mirantis.com/stacklight/helm/cerebro-0.1.0-mcp-2.tgz |
|
elasticsearch |
https://binary.mirantis.com/stacklight/helm/elasticsearch-7.1.1-mcp-22.tgz |
|
elasticsearch-curator |
https://binary.mirantis.com/stacklight/helm/elasticsearch-curator-1.5.0-mcp-2.tgz |
|
elasticsearch-exporter |
https://binary.mirantis.com/stacklight/helm/elasticsearch-exporter-1.2.0-mcp-2.tgz |
|
fluentd Updated |
https://binary.mirantis.com/stacklight/helm/fluentd-2.0.3-mcp-17.tgz |
|
fluentd-elasticsearch Updated |
https://binary.mirantis.com/stacklight/helm/fluentd-elasticsearch-3.0.0-mcp-61.tgz |
|
grafana |
https://binary.mirantis.com/stacklight/helm/grafana-3.3.10-mcp-93.tgz |
|
iam-proxy |
||
kibana |
https://binary.mirantis.com/stacklight/helm/kibana-3.2.1-mcp-20.tgz |
|
metric-collector |
https://binary.mirantis.com/stacklight/helm/metric-collector-0.2.0-mcp-8.tgz |
|
metricbeat |
https://binary.mirantis.com/stacklight/helm/metricbeat-1.7.1-mcp-8.tgz |
|
netchecker |
||
patroni |
https://binary.mirantis.com/stacklight/helm/patroni-0.15.1-mcp-20.tgz |
|
prometheus Updated |
https://binary.mirantis.com/stacklight/helm/prometheus-8.11.4-mcp-124.tgz |
|
prometheus-blackbox-exporter |
https://binary.mirantis.com/stacklight/helm/prometheus-blackbox-exporter-0.3.0-mcp-4.tgz |
|
prometheus-es-exporter |
https://binary.mirantis.com/stacklight/helm/prometheus-es-exporter-1.0.0-mcp-3.tgz |
|
prometheus-nginx-exporter |
https://binary.mirantis.com/stacklight/helm/prometheus-nginx-exporter-0.1.0-mcp-4.tgz |
|
sf-notifier |
https://binary.mirantis.com/stacklight/helm/sf-notifier-0.1.0-mcp-11.tgz |
|
sf-reporter |
https://binary.mirantis.com/stacklight/helm/sf-reporter-0.1.0-mcp-10.tgz |
|
stacklight Updated |
https://binary.mirantis.com/stacklight/helm/stacklight-0.1.2-mcp-438.tgz |
|
telegraf-ds |
https://binary.mirantis.com/stacklight/helm/telegraf-ds-1.1.5-mcp-20.tgz |
|
telegraf-s |
https://binary.mirantis.com/stacklight/helm/telegraf-s-1.1.5-mcp-20.tgz |
|
telemeter-server |
https://binary.mirantis.com/stacklight/helm/telemeter-server-0.1.0-mcp-12.tgz |
|
telemeter-client |
https://binary.mirantis.com/stacklight/helm/telemeter-client-0.1.0-mcp-12.tgz |
|
Docker images |
alerta Updated |
mirantis.azurecr.io/stacklight/alerta-web:8.4.1-20210312131419 |
alertmanager |
mirantis.azurecr.io/stacklight/alertmanager:v0.21.0 |
|
alpine-python3-requests |
mirantis.azurecr.io/stacklight/alpine-python3-requests:latest-20200618 |
|
busybox |
mirantis.azurecr.io/stacklight/busybox:1.30 |
|
cerebro |
mirantis.azurecr.io/stacklight/cerebro:0.9.3 |
|
configmap-reload |
mirantis.azurecr.io/stacklight/configmap-reload:v0.3.0 |
|
curl |
mirantis.azurecr.io/stacklight/curl:7.69.0 |
|
curl-jq |
mirantis.azurecr.io/stacklight/curl-jq:1.5-1 |
|
elasticsearch |
mirantis.azurecr.io/stacklight/elasticsearch:7.6.1 |
|
elasticsearch-curator |
mirantis.azurecr.io/stacklight/curator:5.7.6 |
|
elasticsearch-exporter |
mirantis.azurecr.io/stacklight/elasticsearch_exporter:1.0.2 |
|
fluentd |
mirantis.azurecr.io/stacklight/fluentd:1.10.2-20210301155825 |
|
gce-proxy |
mirantis.azurecr.io/stacklight/gce-proxy:1.11 |
|
grafana |
mirantis.azurecr.io/stacklight/grafana:7.3.7 |
|
grafana-image-renderer |
mirantis.azurecr.io/stacklight/grafana-image-renderer:2.0.1 |
|
kubectl |
mirantis.azurecr.io/stacklight/kubectl:1.19.2 |
|
k8s-netchecker-agent |
mirantis.azurecr.io/lcm/kubernetes/k8s-netchecker-agent:2019.1 |
|
k8s-netchecker-server |
mirantis.azurecr.io/lcm/kubernetes/k8s-netchecker-server:2019.1 |
|
k8s-sidecar Updated |
mirantis.azurecr.io/stacklight/k8s-sidecar:1.10.8 |
|
kibana |
mirantis.azurecr.io/stacklight/kibana:7.6.1 |
|
kube-state-metrics |
mirantis.azurecr.io/stacklight/kube-state-metrics:v1.9.2 |
|
metric-collector |
mirantis.azurecr.io/stacklight/metric-collector:v0.1-20210219112938 |
|
metricbeat |
mirantis.azurecr.io/stacklight/metricbeat:7.6.1 |
|
node-exporter |
mirantis.azurecr.io/stacklight/node-exporter:v1.0.1 |
|
origin-telemeter |
mirantis.azurecr.io/stacklight/origin-telemeter:4.4.0-20200424 |
|
prometheus |
mirantis.azurecr.io/stacklight/prometheus:v2.22.2 |
|
prometheus-blackbox-exporter |
mirantis.azurecr.io/stacklight/blackbox-exporter:v0.14.0 |
|
prometheus-es-exporter Updated |
mirantis.azurecr.io/stacklight/prometheus-es-exporter:v0.5.1-20210323132924 |
|
prometheus-nginx-exporter |
mirantis.azurecr.io/stacklight/nginx-prometheus-exporter:0.6.0 |
|
prometheus-patroni-exporter |
mirantis.azurecr.io/stacklight/prometheus-patroni-exporter:v0.1-20200428121305 |
|
prometheus-postgres-exporter |
mirantis.azurecr.io/stacklight/prometheus-postgres-exporter:v0.8.0-20201006113956 |
|
prometheus-relay Updated |
mirantis.azurecr.io/stacklight/prometheus-relay:v0.3-20210317133316 |
|
pushgateway |
mirantis.azurecr.io/stacklight/pushgateway:v1.2.0 |
|
sf-notifier Updated |
mirantis.azurecr.io/stacklight/sf-notifier:v0.3-20210323132354 |
|
sf-reporter |
mirantis.azurecr.io/stacklight/sf-reporter:v0.1-20201216142628 |
|
spilo |
mirantis.azurecr.io/stacklight/spilo:12-1.6p3 |
|
telegraf |
mirantis.azurecr.io/stacklight/telegraf:v1.9.1-20210225142050 |
|
telemeter-token-auth |
mirantis.azurecr.io/stacklight/telemeter-token-auth:v0.1-20200406175600 |
|
yq |
mirantis.azurecr.io/stacklight/yq:v4.2.0 |
Artifact |
Component |
Path |
|---|---|---|
Debian repositories |
System packages |
|
https://mirror.mirantis.com/kaas/ubuntu-2020-07-30-013349.target.txt |
||
MCR repositories |
MCR |
https://repos.mirantis.com/ubuntu/dists/bionic/pool/stable-19.03/ |
This section outlines release notes for the Cluster release 5.13.0 that is introduced in the Mirantis Container Cloud release 2.6.0. This Cluster release supports Mirantis Kubernetes Engine 3.3.6, Mirantis Container Runtime 19.03.14, and Kubernetes 1.18.
For the list of known and resolved issues, refer to the Container Cloud release 2.6.0 section.
This section outlines new features and enhancements introduced in the Cluster release 5.13.0.
Significantly enhanced the StackLight log collection mechanism to avoid
collecting and keeping an excessive amount of log messages when it is not
essential. Now, during or after deployment of StackLight, you can select one of
the 9 available logging levels depending on the required severity. The default
logging level is INFO.
Learn more
Implemented the capability to configure StackLight to forward all logs to an external syslog server. In this case, StackLight will send logs both to the syslog server and to Elasticsearch, which is the default target.
Learn more
Technology Preview
Implemented the capability to configure Ceph Controller to start pods on the taint nodes and manage the resources of Ceph nodes. Now, when bootstrapping a new management or managed cluster, you can specify requests, limits, or tolerations for Ceph resources. You can also configure resource management for an existing Ceph cluster. However, such approach may cause downtime.
Improved user experience by moving the rgw section of the
KaasCephCluster CR to a common objectStorage section that now includes
all RADOS Gateway configurations of a Ceph cluster. The spec.rgw section is
deprecated. However, if you continue using spec.rgw, it will be
automatically translated into the new objectStorage.rgw section during the
Container Cloud update to 2.6.0.
Learn more
Implemented the capability to enable Ceph maintenance mode using the
maintenance flag not only during a managed cluster update but also when
required. However, Mirantis does not recommend enabling maintenance on
production deployments other than during update.
Learn more
The following table lists the components versions of the Cluster release 5.13.0.
Note
The components that are newly added, updated, deprecated, or removed
as compared to the previous release version, are marked
with a corresponding superscript,
for example, lcm-ansible Updated.
Component |
Application/Service |
Version |
|---|---|---|
Cluster orchestration |
Mirantis Kubernetes Engine |
3.3.6 0 |
Container runtime |
Mirantis Container Runtime |
19.03.14 1 |
Distributed storage |
Ceph |
14.2.12 (Nautilus) |
Rook |
1.5.5 |
|
LCM |
descheduler |
0.8.0 |
Helm |
2.16.11-40 |
|
helm-controller Updated |
0.2.0-289-gd7e9fa9c |
|
lcm-ansible Updated |
0.4.0-4-ga2bb104 |
|
lcm-agent Updated |
0.2.0-289-gd7e9fa9c |
|
metallb-controller |
0.9.3-1 |
|
metrics-server |
0.3.6-1 |
|
StackLight |
Alerta |
8.0.2-20201014133832 |
Alertmanager |
0.21.0 |
|
Cerebro |
0.9.3 |
|
Elasticsearch |
7.6.1 |
|
Elasticsearch Curator |
5.7.6 |
|
Elasticsearch Exporter |
1.0.2 |
|
Fluentd Updated |
1.10.2-20210301155825 |
|
Grafana Updated |
7.3.7 |
|
Grafana Image Renderer Updated |
2.0.1 |
|
IAM Proxy |
6.0.1 |
|
Kibana |
7.6.1 |
|
Metric Collector Updated |
0.1-20210219112938 |
|
Metricbeat |
7.6.1 |
|
Netchecker |
1.4.1 |
|
Patroni |
12-1.6p3 |
|
Prometheus |
2.22.2 |
|
Prometheus Blackbox Exporter |
0.14.0 |
|
Prometheus ES Exporter |
0.5.1-20201002144823 |
|
Prometheus Node Exporter |
1.0.1 |
|
Prometheus NGINX Exporter |
0.6.0 |
|
Prometheus Patroni Exporter |
0.1-20200428121305 |
|
Prometheus Postgres Exporter |
0.8.0-20201006113956 |
|
Prometheus Relay |
0.3-20200519054052 |
|
Pushgateway |
1.2.0 |
|
sf-notifier |
0.3-20201216142028 |
|
sf-reporter |
0.1-20201216142628 |
|
Telegraf Updated |
1.9.1-20210225142050 |
|
Telemeter |
4.4.0-20200424 |
- 0
For the MKE release highlights and components versions, see MKE documentation: MKE release notes.
- 1
For the MCR release highlights, see MCR documentation: MCR release notes.
Due to the development limitations, the MCR upgrade to version 19.03.14 on existing Container Cloud clusters is not supported.
This section lists the components artifacts of the Cluster release 5.13.0.
Note
The components that are newly added, updated, deprecated, or removed
as compared to the previous release version, are marked
with a corresponding superscript,
for example, lcm-ansible Updated.
Artifact |
Component |
Path |
|---|---|---|
Helm chart |
ceph-controller Updated |
https://binary.mirantis.com/ceph/helm/ceph-operator-1.0.0-mcp-165.tgz |
Docker images |
ceph |
mirantis.azurecr.io/ceph/ceph:v14.2.12 |
ceph-controller Updated |
mirantis.azurecr.io/ceph/mcp/ceph-controller:v1.0.0-20210309160354 |
|
cephcsi |
mirantis.azurecr.io/ceph/cephcsi/cephcsi:v3.2.1 |
|
csi-node-driver-registrar |
mirantis.azurecr.io/ceph/k8scsi/csi-node-driver-registrar:v2.1.0 |
|
csi-provisioner |
mirantis.azurecr.io/ceph/k8scsi/csi-provisioner:v2.1.0 |
|
csi-snapshotter |
mirantis.azurecr.io/ceph/k8scsi/csi-snapshotter:v4.0.0 |
|
csi-attacher |
mirantis.azurecr.io/ceph/k8scsi/csi-attacher:v3.1.0 |
|
csi-resizer |
mirantis.azurecr.io/ceph/k8scsi/csi-resizer:v1.1.0 |
|
rook |
mirantis.azurecr.io/ceph/rook/ceph:v1.5.5 |
Artifact |
Component |
Path |
|---|---|---|
Binaries |
lcm-ansible Updated |
https://binary.mirantis.com/lcm/bin/lcm-ansible/v0.4.0-4-ga2bb104/lcm-ansible.tar.gz |
lcm-agent Updated |
https://binary.mirantis.com/lcm/bin/lcm-agent/v0.2.0-289-gd7e9fa9c/lcm-agent |
|
Helm charts |
descheduler Updated |
https://binary.mirantis.com/core/helm/descheduler-1.18.1.tgz |
managed-lcm-api Updated |
https://binary.mirantis.com/core/helm/managed-lcm-api-1.18.1.tgz |
|
metallb Updated |
||
metrics-server Updated |
https://binary.mirantis.com/core/helm/metrics-server-1.18.1.tgz |
|
Docker images |
descheduler |
mirantis.azurecr.io/lcm/descheduler/v0.8.0 |
helm |
mirantis.azurecr.io/lcm/helm/tiller:v2.16.11-40 |
|
helm-controller Updated |
mirantis.azurecr.io/lcm/lcm-controller:v0.2.0-289-gd7e9fa9c |
|
metallb-controller |
mirantis.azurecr.io/lcm/metallb/controller:v0.9.3-1 |
|
metallb-speaker |
mirantis.azurecr.io/lcm/metallb/speaker:v0.9.3-1 |
|
metrics-server |
mirantis.azurecr.io/lcm/metrics-server-amd64/v0.3.6-1 |
Artifact |
Component |
Path |
|---|---|---|
Helm charts |
alerta Updated |
https://binary.mirantis.com/stacklight/helm/alerta-0.1.0-mcp-15.tgz |
cerebro |
https://binary.mirantis.com/stacklight/helm/cerebro-0.1.0-mcp-2.tgz |
|
elasticsearch |
https://binary.mirantis.com/stacklight/helm/elasticsearch-7.1.1-mcp-22.tgz |
|
elasticsearch-curator |
https://binary.mirantis.com/stacklight/helm/elasticsearch-curator-1.5.0-mcp-2.tgz |
|
elasticsearch-exporter |
https://binary.mirantis.com/stacklight/helm/elasticsearch-exporter-1.2.0-mcp-2.tgz |
|
fluentd Updated |
https://binary.mirantis.com/stacklight/helm/fluentd-2.0.3-mcp-16.tgz |
|
fluentd-elasticsearch Updated |
https://binary.mirantis.com/stacklight/helm/fluentd-elasticsearch-3.0.0-mcp-44.tgz |
|
grafana Updated |
https://binary.mirantis.com/stacklight/helm/grafana-3.3.10-mcp-93.tgz |
|
iam-proxy |
||
kibana |
https://binary.mirantis.com/stacklight/helm/kibana-3.2.1-mcp-20.tgz |
|
metric-collector |
https://binary.mirantis.com/stacklight/helm/metric-collector-0.2.0-mcp-8.tgz |
|
metricbeat |
https://binary.mirantis.com/stacklight/helm/metricbeat-1.7.1-mcp-8.tgz |
|
netchecker |
||
patroni Updated |
https://binary.mirantis.com/stacklight/helm/patroni-0.15.1-mcp-20.tgz |
|
prometheus Updated |
https://binary.mirantis.com/stacklight/helm/prometheus-8.11.4-mcp-121.tgz |
|
prometheus-blackbox-exporter |
https://binary.mirantis.com/stacklight/helm/prometheus-blackbox-exporter-0.3.0-mcp-4.tgz |
|
prometheus-es-exporter |
https://binary.mirantis.com/stacklight/helm/prometheus-es-exporter-1.0.0-mcp-3.tgz |
|
prometheus-nginx-exporter |
https://binary.mirantis.com/stacklight/helm/prometheus-nginx-exporter-0.1.0-mcp-4.tgz |
|
sf-notifier |
https://binary.mirantis.com/stacklight/helm/sf-notifier-0.1.0-mcp-11.tgz |
|
sf-reporter |
https://binary.mirantis.com/stacklight/helm/sf-reporter-0.1.0-mcp-10.tgz |
|
stacklight Updated |
https://binary.mirantis.com/stacklight/helm/stacklight-0.1.2-mcp-426.tgz |
|
telegraf-ds |
https://binary.mirantis.com/stacklight/helm/telegraf-ds-1.1.5-mcp-20.tgz |
|
telegraf-s |
https://binary.mirantis.com/stacklight/helm/telegraf-s-1.1.5-mcp-20.tgz |
|
telemeter-server |
https://binary.mirantis.com/stacklight/helm/telemeter-server-0.1.0-mcp-12.tgz |
|
telemeter-client |
https://binary.mirantis.com/stacklight/helm/telemeter-client-0.1.0-mcp-12.tgz |
|
Docker images |
alerta |
mirantis.azurecr.io/stacklight/alerta-web:8.0.2-20201014133832 |
alertmanager |
mirantis.azurecr.io/stacklight/alertmanager:v0.21.0 |
|
alpine-python3-requests |
mirantis.azurecr.io/stacklight/alpine-python3-requests:latest-20200618 |
|
busybox |
mirantis.azurecr.io/stacklight/busybox:1.30 |
|
cerebro |
mirantis.azurecr.io/stacklight/cerebro:0.9.3 |
|
configmap-reload |
mirantis.azurecr.io/stacklight/configmap-reload:v0.3.0 |
|
curl |
mirantis.azurecr.io/stacklight/curl:7.69.0 |
|
curl-jq |
mirantis.azurecr.io/stacklight/curl-jq:1.5-1 |
|
elasticsearch |
mirantis.azurecr.io/stacklight/elasticsearch:7.6.1 |
|
elasticsearch-curator |
mirantis.azurecr.io/stacklight/curator:5.7.6 |
|
elasticsearch-exporter |
mirantis.azurecr.io/stacklight/elasticsearch_exporter:1.0.2 |
|
fluentd Updated |
mirantis.azurecr.io/stacklight/fluentd:1.10.2-20210301155825 |
|
gce-proxy |
mirantis.azurecr.io/stacklight/gce-proxy:1.11 |
|
grafana Updated |
mirantis.azurecr.io/stacklight/grafana:7.3.7 |
|
grafana-image-renderer Updated |
mirantis.azurecr.io/stacklight/grafana-image-renderer:2.0.1 |
|
kubectl |
mirantis.azurecr.io/stacklight/kubectl:1.19.2 |
|
k8s-netchecker-agent |
mirantis.azurecr.io/lcm/kubernetes/k8s-netchecker-agent:2019.1 |
|
k8s-netchecker-server |
mirantis.azurecr.io/lcm/kubernetes/k8s-netchecker-server:2019.1 |
|
k8s-sidecar |
mirantis.azurecr.io/stacklight/k8s-sidecar:0.1.178 |
|
kibana |
mirantis.azurecr.io/stacklight/kibana:7.6.1 |
|
kube-state-metrics |
mirantis.azurecr.io/stacklight/kube-state-metrics:v1.9.2 |
|
metric-collector Updated |
mirantis.azurecr.io/stacklight/metric-collector:v0.1-20210219112938 |
|
metricbeat |
mirantis.azurecr.io/stacklight/metricbeat:7.6.1 |
|
node-exporter |
mirantis.azurecr.io/stacklight/node-exporter:v1.0.1 |
|
origin-telemeter |
mirantis.azurecr.io/stacklight/origin-telemeter:4.4.0-20200424 |
|
prometheus |
mirantis.azurecr.io/stacklight/prometheus:v2.22.2 |
|
prometheus-blackbox-exporter |
mirantis.azurecr.io/stacklight/blackbox-exporter:v0.14.0 |
|
prometheus-es-exporter |
mirantis.azurecr.io/stacklight/prometheus-es-exporter:v0.5.1-20201002144823 |
|
prometheus-nginx-exporter |
mirantis.azurecr.io/stacklight/nginx-prometheus-exporter:0.6.0 |
|
prometheus-patroni-exporter |
mirantis.azurecr.io/stacklight/prometheus-patroni-exporter:v0.1-20200428121305 |
|
prometheus-postgres-exporter |
mirantis.azurecr.io/stacklight/prometheus-postgres-exporter:v0.8.0-20201006113956 |
|
prometheus-relay |
mirantis.azurecr.io/stacklight/prometheus-relay:v0.3-20200519054052 |
|
pushgateway |
mirantis.azurecr.io/stacklight/pushgateway:v1.2.0 |
|
sf-notifier |
mirantis.azurecr.io/stacklight/sf-notifier:v0.3-20201216142028 |
|
sf-reporter |
mirantis.azurecr.io/stacklight/sf-reporter:v0.1-20201216142628 |
|
spilo |
mirantis.azurecr.io/stacklight/spilo:12-1.6p3 |
|
telegraf Updated |
mirantis.azurecr.io/stacklight/telegraf:v1.9.1-20210225142050 |
|
telemeter-token-auth |
mirantis.azurecr.io/stacklight/telemeter-token-auth:v0.1-20200406175600 |
|
yq |
mirantis.azurecr.io/stacklight/yq:v4.2.0 |
This section outlines release notes for the Cluster release 5.12.0 that is introduced in the Mirantis Container Cloud release 2.5.0. This Cluster release supports Kubernetes 1.18 and Mirantis Container Runtime 19.03.14 as well as introduces support for the updated version of Mirantis Kubernetes Engine 3.3.6.
For the list of known and resolved issues, refer to the Container Cloud release 2.5.0 section.
This section outlines new features and enhancements introduced in the Cluster release 5.12.0.
Implemented the maintenance label to set for Ceph during a managed
cluster update. This prevents Ceph rebalance leading to data loss
during a managed cluster update.
Learn more
Implemented the Enable Object Storage checkbox in the Container Cloud web UI to allow enabling a single-instance RGW Object Storage when creating a Ceph cluster as described in Add a Ceph cluster since MOSK 25.2.
Enhanced Ceph to support RADOS Gateway (RGW) high availability. Now, you can run multiple instances of Ceph RGW in active/active mode.
Learn more
Enhanced StackLight by adding support for Cerebro, a web UI that visualizes health of Elasticsearch clusters and allows for convenient debugging. Cerebro is disabled by default.
Added proxy support for Alertmanager, Metric collector, Salesforce notifier and reporter, and Telemeter client. Now, these StackLight components automatically use the same proxy that is configured for Container Cloud clusters.
Note
Proxy handles only the HTTP and HTTPS traffic. Therefore, for clusters with limited or no Internet access, it is not possible to set up Alertmanager email notifications, which use SMTP, when proxy is used.
Note
Due to a limitation, StackLight fails to integrate with an external
proxy with authentication handled by a proxy server. In such cases, the
proxy server ignores the HTTP Authorization header for basic
authentication passed by Prometheus Alertmanager. Therefore, use proxies
without authentication or with authentication handled by a reverse proxy.
Learn more
The following table lists the components versions of the Cluster release 5.12.0.
Note
The components that are newly added, updated, deprecated, or removed
as compared to the previous release version, are marked
with a corresponding superscript,
for example, lcm-ansible Updated.
Component |
Application/Service |
Version |
|---|---|---|
Cluster orchestration |
Mirantis Kubernetes Engine Updated |
3.3.6 0 |
Container runtime |
Mirantis Container Runtime |
19.03.14 1 |
Distributed storage |
Ceph |
14.2.12 (Nautilus) |
Rook |
1.5.5 |
|
LCM |
descheduler |
0.8.0 |
Helm |
2.16.11-40 |
|
helm-controller Updated |
0.2.0-258-ga2d72294 |
|
lcm-ansible Updated |
0.3.0-10-g7c2a87e |
|
lcm-agent Updated |
0.2.0-258-ga2d72294 |
|
metallb-controller |
0.9.3-1 |
|
metrics-server |
0.3.6-1 |
|
StackLight |
Alerta |
8.0.2-20201014133832 |
Alertmanager |
0.21.0 |
|
Cerebro New |
0.9.3 |
|
Elasticsearch |
7.6.1 |
|
Elasticsearch Curator |
5.7.6 |
|
Elasticsearch Exporter |
1.0.2 |
|
Fluentd |
1.10.2-20200609085335 |
|
Grafana |
7.1.5 |
|
Grafana Image Renderer |
2.0.0 |
|
IAM Proxy |
6.0.1 |
|
Kibana |
7.6.1 |
|
Metric Collector |
0.1-20201222100033 |
|
Metricbeat |
7.6.1 |
|
Netchecker |
1.4.1 |
|
Patroni |
12-1.6p3 |
|
Prometheus |
2.22.2 |
|
Prometheus Blackbox Exporter |
0.14.0 |
|
Prometheus ES Exporter |
0.5.1-20201002144823 |
|
Prometheus Node Exporter |
1.0.1 |
|
Prometheus NGINX Exporter |
0.6.0 |
|
Prometheus Patroni Exporter |
0.1-20200428121305 |
|
Prometheus Postgres Exporter |
0.8.0-20201006113956 |
|
Prometheus Relay |
0.3-20200519054052 |
|
Pushgateway |
1.2.0 |
|
sf-notifier |
0.3-20201216142028 |
|
sf-reporter |
0.1-20201216142628 |
|
Telegraf |
1.9.1-20201222194740 |
|
Telemeter |
4.4.0-20200424 |
- 0
For the MKE release highlights and components versions, see MKE documentation: MKE release notes.
- 1
For the MCR release highlights, see MCR documentation: MCR release notes.
Due to the development limitations, the MCR upgrade to version 19.03.14 on existing Container Cloud clusters is not supported.
This section lists the components artifacts of the Cluster release 5.12.0.
Note
The components that are newly added, updated, deprecated, or removed
as compared to the previous release version, are marked
with a corresponding superscript,
for example, lcm-ansible Updated.
Artifact |
Component |
Path |
|---|---|---|
Helm chart |
ceph-controller Updated |
https://binary.mirantis.com/ceph/helm/ceph-operator-1.0.0-mcp-127.tgz |
Docker images |
ceph |
mirantis.azurecr.io/ceph/ceph:v14.2.12 |
ceph-controller Updated |
mirantis.azurecr.io/ceph/mcp/ceph-controller:v1.0.0-20210201202754 |
|
cephcsi |
mirantis.azurecr.io/ceph/cephcsi/cephcsi:v3.2.1 |
|
csi-node-driver-registrar |
mirantis.azurecr.io/ceph/k8scsi/csi-node-driver-registrar:v2.1.0 |
|
csi-provisioner |
mirantis.azurecr.io/ceph/k8scsi/csi-provisioner:v2.1.0 |
|
csi-snapshotter |
mirantis.azurecr.io/ceph/k8scsi/csi-snapshotter:v4.0.0 |
|
csi-attacher |
mirantis.azurecr.io/ceph/k8scsi/csi-attacher:v3.1.0 |
|
csi-resizer |
mirantis.azurecr.io/ceph/k8scsi/csi-resizer:v1.1.0 |
|
rook |
mirantis.azurecr.io/ceph/rook/ceph:v1.5.5 |
Artifact |
Component |
Path |
|---|---|---|
Binaries |
lcm-ansible Updated |
https://binary.mirantis.com/lcm/bin/lcm-ansible/v0.3.0-10-g7c2a87e/lcm-ansible.tar.gz |
lcm-agent Updated |
https://binary.mirantis.com/lcm/bin/lcm-agent/v0.2.0-258-ga2d72294/lcm-agent |
|
Helm charts |
descheduler Updated |
https://binary.mirantis.com/core/helm/descheduler-1.17.4.tgz |
managed-lcm-api Updated |
https://binary.mirantis.com/core/helm/managed-lcm-api-1.17.4.tgz |
|
metallb Updated |
||
metrics-server Updated |
https://binary.mirantis.com/core/helm/metrics-server-1.17.4.tgz |
|
Docker images |
descheduler |
mirantis.azurecr.io/lcm/descheduler/v0.8.0 |
helm |
mirantis.azurecr.io/lcm/helm/tiller:v2.16.11-40 |
|
helm-controller Updated |
mirantis.azurecr.io/lcm/lcm-controller:v0.2.0-258-ga2d72294 |
|
metallb-controller |
mirantis.azurecr.io/lcm/metallb/controller:v0.9.3-1 |
|
metallb-speaker |
mirantis.azurecr.io/lcm/metallb/speaker:v0.9.3-1 |
|
metrics-server |
mirantis.azurecr.io/lcm/metrics-server-amd64/v0.3.6-1 |
Artifact |
Component |
Path |
|---|---|---|
Helm charts |
alerta |
https://binary.mirantis.com/stacklight/helm/alerta-0.1.0-mcp-13.tgz |
cerebro New |
https://binary.mirantis.com/stacklight/helm/cerebro-0.1.0-mcp-2.tgz |
|
elasticsearch |
https://binary.mirantis.com/stacklight/helm/elasticsearch-7.1.1-mcp-22.tgz |
|
elasticsearch-curator |
https://binary.mirantis.com/stacklight/helm/elasticsearch-curator-1.5.0-mcp-2.tgz |
|
elasticsearch-exporter |
https://binary.mirantis.com/stacklight/helm/elasticsearch-exporter-1.2.0-mcp-2.tgz |
|
fluentd |
https://binary.mirantis.com/stacklight/helm/fluentd-2.0.3-mcp-15.tgz |
|
fluentd-elasticsearch |
https://binary.mirantis.com/stacklight/helm/fluentd-elasticsearch-3.0.0-mcp-33.tgz |
|
grafana Updated |
https://binary.mirantis.com/stacklight/helm/grafana-3.3.10-mcp-89.tgz |
|
iam-proxy |
||
kibana |
https://binary.mirantis.com/stacklight/helm/kibana-3.2.1-mcp-20.tgz |
|
metric-collector |
https://binary.mirantis.com/stacklight/helm/metric-collector-0.2.0-mcp-8.tgz |
|
metricbeat |
https://binary.mirantis.com/stacklight/helm/metricbeat-1.7.1-mcp-8.tgz |
|
netchecker |
||
patroni |
https://binary.mirantis.com/stacklight/helm/patroni-0.15.1-mcp-19.tgz |
|
prometheus Updated |
https://binary.mirantis.com/stacklight/helm/prometheus-8.11.4-mcp-119.tgz |
|
prometheus-blackbox-exporter |
https://binary.mirantis.com/stacklight/helm/prometheus-blackbox-exporter-0.3.0-mcp-4.tgz |
|
prometheus-es-exporter |
https://binary.mirantis.com/stacklight/helm/prometheus-es-exporter-1.0.0-mcp-3.tgz |
|
prometheus-nginx-exporter |
https://binary.mirantis.com/stacklight/helm/prometheus-nginx-exporter-0.1.0-mcp-4.tgz |
|
sf-notifier |
https://binary.mirantis.com/stacklight/helm/sf-notifier-0.1.0-mcp-11.tgz |
|
sf-reporter |
https://binary.mirantis.com/stacklight/helm/sf-reporter-0.1.0-mcp-10.tgz |
|
stacklight Updated |
https://binary.mirantis.com/stacklight/helm/stacklight-0.1.2-mcp-413.tgz |
|
telegraf-ds |
https://binary.mirantis.com/stacklight/helm/telegraf-ds-1.1.5-mcp-20.tgz |
|
telegraf-s |
https://binary.mirantis.com/stacklight/helm/telegraf-s-1.1.5-mcp-20.tgz |
|
telemeter-server |
https://binary.mirantis.com/stacklight/helm/telemeter-server-0.1.0-mcp-12.tgz |
|
telemeter-client |
https://binary.mirantis.com/stacklight/helm/telemeter-client-0.1.0-mcp-12.tgz |
|
Docker images |
alerta |
mirantis.azurecr.io/stacklight/alerta-web:8.0.2-20201014133832 |
alertmanager |
mirantis.azurecr.io/stacklight/alertmanager:v0.21.0 |
|
alpine-python3-requests |
mirantis.azurecr.io/stacklight/alpine-python3-requests:latest-20200618 |
|
busybox |
mirantis.azurecr.io/stacklight/busybox:1.30 |
|
cerebro New |
mirantis.azurecr.io/stacklight/cerebro:0.9.3 |
|
configmap-reload |
mirantis.azurecr.io/stacklight/configmap-reload:v0.3.0 |
|
curl |
mirantis.azurecr.io/stacklight/curl:7.69.0 |
|
curl-jq |
mirantis.azurecr.io/stacklight/curl-jq:1.5-1 |
|
elasticsearch |
mirantis.azurecr.io/stacklight/elasticsearch:7.6.1 |
|
elasticsearch-curator |
mirantis.azurecr.io/stacklight/curator:5.7.6 |
|
elasticsearch-exporter |
mirantis.azurecr.io/stacklight/elasticsearch_exporter:1.0.2 |
|
fluentd |
mirantis.azurecr.io/stacklight/fluentd:1.10.2-20200609085335 |
|
gce-proxy |
mirantis.azurecr.io/stacklight/gce-proxy:1.11 |
|
grafana |
mirantis.azurecr.io/stacklight/grafana:7.1.5 |
|
grafana-image-renderer |
mirantis.azurecr.io/stacklight/grafana-image-renderer:2.0.0 |
|
kubectl |
mirantis.azurecr.io/stacklight/kubectl:1.19.2 |
|
k8s-netchecker-agent |
mirantis.azurecr.io/lcm/kubernetes/k8s-netchecker-agent:2019.1 |
|
k8s-netchecker-server |
mirantis.azurecr.io/lcm/kubernetes/k8s-netchecker-server:2019.1 |
|
k8s-sidecar |
mirantis.azurecr.io/stacklight/k8s-sidecar:0.1.178 |
|
kibana |
mirantis.azurecr.io/stacklight/kibana:7.6.1 |
|
kube-state-metrics |
mirantis.azurecr.io/stacklight/kube-state-metrics:v1.9.2 |
|
metric-collector |
mirantis.azurecr.io/stacklight/metric-collector:v0.1-20201222100033 |
|
metricbeat |
mirantis.azurecr.io/stacklight/metricbeat:7.6.1 |
|
node-exporter |
mirantis.azurecr.io/stacklight/node-exporter:v1.0.1 |
|
origin-telemeter |
mirantis.azurecr.io/stacklight/origin-telemeter:4.4.0-20200424 |
|
prometheus |
mirantis.azurecr.io/stacklight/prometheus:v2.22.2 |
|
prometheus-blackbox-exporter |
mirantis.azurecr.io/stacklight/blackbox-exporter:v0.14.0 |
|
prometheus-es-exporter |
mirantis.azurecr.io/stacklight/prometheus-es-exporter:v0.5.1-20201002144823 |
|
prometheus-nginx-exporter |
mirantis.azurecr.io/stacklight/nginx-prometheus-exporter:0.6.0 |
|
prometheus-patroni-exporter |
mirantis.azurecr.io/stacklight/prometheus-patroni-exporter:v0.1-20200428121305 |
|
prometheus-postgres-exporter |
mirantis.azurecr.io/stacklight/prometheus-postgres-exporter:v0.8.0-20201006113956 |
|
prometheus-relay |
mirantis.azurecr.io/stacklight/prometheus-relay:v0.3-20200519054052 |
|
pushgateway |
mirantis.azurecr.io/stacklight/pushgateway:v1.2.0 |
|
sf-notifier |
mirantis.azurecr.io/stacklight/sf-notifier:v0.3-20201216142028 |
|
sf-reporter |
mirantis.azurecr.io/stacklight/sf-reporter:v0.1-20201216142628 |
|
spilo |
mirantis.azurecr.io/stacklight/spilo:12-1.6p3 |
|
telegraf |
mirantis.azurecr.io/stacklight/telegraf:v1.9.1-20201222194740 |
|
telemeter-token-auth |
mirantis.azurecr.io/stacklight/telemeter-token-auth:v0.1-20200406175600 |
|
yq |
mirantis.azurecr.io/stacklight/yq:v4.2.0 |
This section outlines release notes for the Cluster release 5.11.0 that is introduced in the Mirantis Container Cloud release 2.4.0. This Cluster release supports Kubernetes 1.18 and Mirantis Kubernetes Engine 3.3.4 as well as introduces support for the updated version of Mirantis Container Runtime 19.03.14.
Note
The Cluster release 5.11.0 supports only attachment of existing MKE 3.3.4 clusters.
For the deployment of new or attachment of existing clusters based on other supported MKE versions, the latest available Cluster releases are used.
For the list of known and resolved issues, refer to the Container Cloud release 2.4.0 section.
This section outlines new features and enhancements introduced in the Cluster release 5.11.0.
Implemented alert inhibition rules to provide a clearer view on the cloud status and simplify troubleshooting. Using alert inhibition rules, Alertmanager decreases alert noise by suppressing dependent alerts notifications. The feature is enabled by default. For details, see Alert dependencies.
Implemented integration between Grafana and Kibana by adding a View logs in Kibana link to the majority of Grafana dashboards, which allows you to immediately view contextually relevant logs through the Kibana web UI.
Learn more
Implemented the TelegrafGatherErrors alert that raises if Telegraf fails to
gather metrics.
Learn more
Added the ironic.insecure parameter for enabling or disabling the host and
chain verification for bare metal Ironic monitoring.
Learn more
Enhanced StackLight to automatically set clusterId that defines an ID of
a Container Cloud cluster. Now, you do not need to set or modify this parameter
manually when configuring the sf-notifier and sf-reporter services.
Learn more
The following table lists the components versions of the Cluster release 5.11.0.
Note
The components that are newly added, updated, deprecated, or removed
as compared to the previous release version, are marked
with a corresponding superscript,
for example, lcm-ansible Updated.
Component |
Application/Service |
Version |
|---|---|---|
Cluster orchestration |
Mirantis Kubernetes Engine |
3.3.4 0 |
Container runtime |
Mirantis Container Runtime Updated |
19.03.14 1 |
Distributed storage Updated |
Ceph |
14.2.12 (Nautilus) |
Rook |
1.5.5 |
|
LCM |
descheduler |
0.8.0 |
Helm |
2.16.11-40 |
|
helm-controller |
0.2.0-221-g32bd5f56 |
|
lcm-ansible Updated |
0.2.0-394-g599b2a1 |
|
lcm-agent |
0.2.0-221-g32bd5f56 |
|
metallb-controller |
0.9.3-1 |
|
metrics-server |
0.3.6-1 |
|
StackLight |
Alerta |
8.0.2-20201014133832 |
Alertmanager |
0.21.0 |
|
Elasticsearch |
7.6.1 |
|
Elasticsearch Curator |
5.7.6 |
|
Elasticsearch Exporter |
1.0.2 |
|
Fluentd |
1.10.2-20200609085335 |
|
Grafana |
7.1.5 |
|
Grafana Image Renderer |
2.0.0 |
|
IAM Proxy |
6.0.1 |
|
Kibana |
7.6.1 |
|
Metric Collector Updated |
0.1-20201222100033 |
|
Metricbeat |
7.6.1 |
|
Netchecker |
1.4.1 |
|
Patroni |
12-1.6p3 |
|
Prometheus |
2.22.2 |
|
Prometheus Blackbox Exporter |
0.14.0 |
|
Prometheus ES Exporter |
0.5.1-20201002144823 |
|
Prometheus libvirt Exporter |
0.1-20200610164751 |
|
Prometheus Memcached Exporter |
0.5.0 |
|
Prometheus MySQL Exporter |
0.11.0 |
|
Prometheus Node Exporter |
1.0.1 |
|
Prometheus NGINX Exporter |
0.6.0 |
|
Prometheus Patroni Exporter |
0.1-20200428121305 |
|
Prometheus Postgres Exporter |
0.8.0-20201006113956 |
|
Prometheus RabbitMQ Exporter |
1.0.0-RC7.1 |
|
Prometheus Relay |
0.3-20200519054052 |
|
Pushgateway |
1.2.0 |
|
sf-notifier Updated |
0.3-20201216142028 |
|
sf-reporter Updated |
0.1-20201216142628 |
|
Telegraf Updated |
1.9.1-20201222194740 |
|
Telemeter |
4.4.0-20200424 |
- 0
For the MKE release highlights and components versions, see MKE documentation: MKE release notes.
- 1
For the MCR release highlights, see MCR documentation: MCR release notes.
Due to the development limitations, the MCR upgrade to version 19.03.14 on existing Container Cloud clusters is not supported.
This section lists the components artifacts of the Cluster release 5.11.0.
Note
The components that are newly added, updated, deprecated, or removed
as compared to the previous release version, are marked
with a corresponding superscript,
for example, lcm-ansible Updated.
Artifact |
Component |
Path |
|---|---|---|
Helm chart |
ceph-controller Updated |
https://binary.mirantis.com/ceph/helm/ceph-operator-1.0.0-mcp-111.tgz |
Docker images Updated |
ceph |
mirantis.azurecr.io/ceph/ceph:v14.2.12 |
ceph-controller |
mirantis.azurecr.io/ceph/mcp/ceph-controller:v1.0.0-20210120004212 |
|
cephcsi |
mirantis.azurecr.io/ceph/cephcsi/cephcsi:v3.2.1 |
|
csi-node-driver-registrar |
mirantis.azurecr.io/ceph/k8scsi/csi-node-driver-registrar:v2.1.0 |
|
csi-provisioner |
mirantis.azurecr.io/ceph/k8scsi/csi-provisioner:v2.1.0 |
|
csi-snapshotter |
mirantis.azurecr.io/ceph/k8scsi/csi-snapshotter:v4.0.0 |
|
csi-attacher |
mirantis.azurecr.io/ceph/k8scsi/csi-attacher:v3.1.0 |
|
csi-resizer New |
mirantis.azurecr.io/ceph/k8scsi/csi-resizer:v1.1.0 |
|
rook |
mirantis.azurecr.io/ceph/rook/ceph:v1.5.5 |
Artifact |
Component |
Path |
|---|---|---|
Binaries |
lcm-ansible Updated |
https://binary.mirantis.com/lcm/bin/lcm-ansible/v0.2.0-394-g599b2a1/lcm-ansible.tar.gz |
lcm-agent |
https://binary.mirantis.com/lcm/bin/lcm-agent/v0.2.0-221-g32bd5f56/lcm-agent |
|
Helm charts |
descheduler Updated |
https://binary.mirantis.com/core/helm/descheduler-1.16.0.tgz |
managed-lcm-api Updated |
https://binary.mirantis.com/core/helm/managed-lcm-api-1.16.0.tgz |
|
metallb Updated |
||
metrics-server Updated |
https://binary.mirantis.com/core/helm/metrics-server-1.16.0.tgz |
|
Docker images |
descheduler |
mirantis.azurecr.io/lcm/descheduler/v0.8.0 |
helm |
mirantis.azurecr.io/lcm/helm/tiller:v2.16.11-40 |
|
helm-controller |
mirantis.azurecr.io/lcm/lcm-controller:v0.2.0-221-g32bd5f56 |
|
metallb-controller |
mirantis.azurecr.io/lcm/metallb/controller:v0.9.3-1 |
|
metallb-speaker |
mirantis.azurecr.io/lcm/metallb/speaker:v0.9.3-1 |
|
metrics-server |
mirantis.azurecr.io/lcm/metrics-server-amd64/v0.3.6-1 |
Artifact |
Component |
Path |
|---|---|---|
Helm charts |
alerta |
https://binary.mirantis.com/stacklight/helm/alerta-0.1.0-mcp-13.tgz |
elasticsearch |
https://binary.mirantis.com/stacklight/helm/elasticsearch-7.1.1-mcp-22.tgz |
|
elasticsearch-curator |
https://binary.mirantis.com/stacklight/helm/elasticsearch-curator-1.5.0-mcp-2.tgz |
|
elasticsearch-exporter |
https://binary.mirantis.com/stacklight/helm/elasticsearch-exporter-1.2.0-mcp-2.tgz |
|
fluentd |
https://binary.mirantis.com/stacklight/helm/fluentd-2.0.3-mcp-15.tgz |
|
fluentd-elasticsearch |
https://binary.mirantis.com/stacklight/helm/fluentd-elasticsearch-3.0.0-mcp-33.tgz |
|
grafana Updated |
https://binary.mirantis.com/stacklight/helm/grafana-3.3.10-mcp-81.tgz |
|
iam-proxy |
||
kibana |
https://binary.mirantis.com/stacklight/helm/kibana-3.2.1-mcp-20.tgz |
|
metric-collector Updated |
https://binary.mirantis.com/stacklight/helm/metric-collector-0.2.0-mcp-8.tgz |
|
metricbeat |
https://binary.mirantis.com/stacklight/helm/metricbeat-1.7.1-mcp-8.tgz |
|
netchecker |
||
patroni Updated |
https://binary.mirantis.com/stacklight/helm/patroni-0.15.1-mcp-19.tgz |
|
prometheus Updated |
https://binary.mirantis.com/stacklight/helm/prometheus-8.11.4-mcp-114.tgz |
|
prometheus-blackbox-exporter Updated |
https://binary.mirantis.com/stacklight/helm/prometheus-blackbox-exporter-0.3.0-mcp-4.tgz |
|
prometheus-es-exporter |
https://binary.mirantis.com/stacklight/helm/prometheus-es-exporter-1.0.0-mcp-3.tgz |
|
prometheus-libvirt-exporter |
https://binary.mirantis.com/stacklight/heprometheus-libvirt-exporter-0.1.0-mcp-2.tgz |
|
prometheus-memcached-exporter |
https://binary.mirantis.com/stacklight/helm/prometheus-memcached-exporter-0.1.0-mcp-1.tgz |
|
prometheus-mysql-exporter |
https://binary.mirantis.com/stacklight/helm/prometheus-mysql-exporter-0.3.2-mcp-1.tgz |
|
prometheus-nginx-exporter |
https://binary.mirantis.com/stacklight/helm/prometheus-nginx-exporter-0.1.0-mcp-4.tgz |
|
prometheus-rabbitmq-exporter |
https://binary.mirantis.com/stacklight/helm/prometheus-rabbitmq-exporter-0.4.1-mcp-1.tgz |
|
sf-notifier Updated |
https://binary.mirantis.com/stacklight/helm/sf-notifier-0.1.0-mcp-11.tgz |
|
sf-reporter Updated |
https://binary.mirantis.com/stacklight/helm/sf-reporter-0.1.0-mcp-10.tgz |
|
stacklight Updated |
https://binary.mirantis.com/stacklight/helm/stacklight-0.1.2-mcp-398.tgz |
|
telegraf-ds Updated |
https://binary.mirantis.com/stacklight/helm/telegraf-ds-1.1.5-mcp-20.tgz |
|
telegraf-s Updated |
https://binary.mirantis.com/stacklight/helm/telegraf-s-1.1.5-mcp-20.tgz |
|
telemeter-server Updated |
https://binary.mirantis.com/stacklight/helm/telemeter-server-0.1.0-mcp-12.tgz |
|
telemeter-client Updated |
https://binary.mirantis.com/stacklight/helm/telemeter-client-0.1.0-mcp-12.tgz |
|
Docker images |
alerta |
mirantis.azurecr.io/stacklight/alerta-web:8.0.2-20201014133832 |
alertmanager |
mirantis.azurecr.io/stacklight/alertmanager:v0.21.0 |
|
alpine-python3-requests |
mirantis.azurecr.io/stacklight/alpine-python3-requests:latest-20200618 |
|
busybox |
mirantis.azurecr.io/stacklight/busybox:1.30 |
|
configmap-reload |
mirantis.azurecr.io/stacklight/configmap-reload:v0.3.0 |
|
curl |
mirantis.azurecr.io/stacklight/curl:7.69.0 |
|
curl-jq |
mirantis.azurecr.io/stacklight/curl-jq:1.5-1 |
|
elasticsearch |
mirantis.azurecr.io/stacklight/elasticsearch:7.6.1 |
|
elasticsearch-curator |
mirantis.azurecr.io/stacklight/curator:5.7.6 |
|
elasticsearch-exporter |
mirantis.azurecr.io/stacklight/elasticsearch_exporter:1.0.2 |
|
fluentd |
mirantis.azurecr.io/stacklight/fluentd:1.10.2-20200609085335 |
|
gce-proxy |
mirantis.azurecr.io/stacklight/gce-proxy:1.11 |
|
grafana |
mirantis.azurecr.io/stacklight/grafana:7.1.5 |
|
grafana-image-renderer |
mirantis.azurecr.io/stacklight/grafana-image-renderer:2.0.0 |
|
kubectl |
mirantis.azurecr.io/stacklight/kubectl:1.19.2 |
|
k8s-netchecker-agent |
mirantis.azurecr.io/lcm/kubernetes/k8s-netchecker-agent:2019.1 |
|
k8s-netchecker-server |
mirantis.azurecr.io/lcm/kubernetes/k8s-netchecker-server:2019.1 |
|
k8s-sidecar |
mirantis.azurecr.io/stacklight/k8s-sidecar:0.1.178 |
|
kibana |
mirantis.azurecr.io/stacklight/kibana:7.6.1 |
|
kube-state-metrics |
mirantis.azurecr.io/stacklight/kube-state-metrics:v1.9.2 |
|
metric-collector Updated |
mirantis.azurecr.io/stacklight/metric-collector:v0.1-20201222100033 |
|
metricbeat |
mirantis.azurecr.io/stacklight/metricbeat:7.6.1 |
|
node-exporter |
mirantis.azurecr.io/stacklight/node-exporter:v1.0.1 |
|
origin-telemeter |
mirantis.azurecr.io/stacklight/origin-telemeter:4.4.0-20200424 |
|
prometheus |
mirantis.azurecr.io/stacklight/prometheus:v2.22.2 |
|
prometheus-blackbox-exporter |
mirantis.azurecr.io/stacklight/blackbox-exporter:v0.14.0 |
|
prometheus-es-exporter |
mirantis.azurecr.io/stacklight/prometheus-es-exporter:v0.5.1-20201002144823 |
|
prometheus-libvirt-exporter |
mirantis.azurecr.io/stacklight/libvirt-exporter:v0.1-20200610164751 |
|
prometheus-memcached-exporter |
mirantis.azurecr.io/stacklight/memcached-exporter:v0.5.0 |
|
prometheus-mysql-exporter |
mirantis.azurecr.io/stacklight/mysqld-exporter:v0.11.0 |
|
prometheus-nginx-exporter |
mirantis.azurecr.io/stacklight/nginx-prometheus-exporter:0.6.0 |
|
prometheus-patroni-exporter |
mirantis.azurecr.io/stacklight/prometheus-patroni-exporter:v0.1-20200428121305 |
|
prometheus-postgres-exporter |
mirantis.azurecr.io/stacklight/prometheus-postgres-exporter:v0.8.0-20201006113956 |
|
prometheus-rabbitmq-exporter |
mirantis.azurecr.io/stacklight/rabbitmq-exporter:v1.0.0-RC7.1 |
|
prometheus-relay |
mirantis.azurecr.io/stacklight/prometheus-relay:v0.3-20200519054052 |
|
pushgateway |
mirantis.azurecr.io/stacklight/pushgateway:v1.2.0 |
|
sf-notifier Updated |
mirantis.azurecr.io/stacklight/sf-notifier:v0.3-20201216142028 |
|
sf-reporter Updated |
mirantis.azurecr.io/stacklight/sf-reporter:v0.1-20201216142628 |
|
spilo |
mirantis.azurecr.io/stacklight/spilo:12-1.6p3 |
|
telegraf Updated |
mirantis.azurecr.io/stacklight/telegraf:v1.9.1-20201222194740 |
|
telemeter-token-auth |
mirantis.azurecr.io/stacklight/telemeter-token-auth:v0.1-20200406175600 |
|
yq New |
mirantis.azurecr.io/stacklight/yq:v4.2.0 |
Artifact |
Component |
Path |
|---|---|---|
Debian repositories |
System packages |
|
https://mirror.mirantis.com/kaas/ubuntu-2020-07-30-013349.target.txt |
||
MCR repositories |
MCR |
https://repos.mirantis.com/ubuntu/dists/bionic/pool/stable-19.03/ |
This section outlines release notes for the Cluster release 5.10.0 that is introduced in the Mirantis Container Cloud release 2.3.0. This Cluster release supports Kubernetes 1.18 and introduces support for the latest versions of Mirantis Kubernetes Engine 3.3.4 and Mirantis Container Runtime 19.03.13.
For the list of known and resolved issues, refer to the Container Cloud release 2.3.0 section.
This section outlines new features and enhancements introduced in the Cluster release 5.10.0.
Enhanced Ceph to support RADOS Gateway (RGW) Object Storage.
Learn more
Implemented the capability to obtain detailed information on the Ceph cluster state, including Ceph logs, Ceph OSDs state, and a list of Ceph pools.
Learn more
The following table lists the components versions of the Cluster release 5.10.0.
Note
The components that are newly added, updated, deprecated, or removed
as compared to the previous release version, are marked
with a corresponding superscript,
for example, lcm-ansible Updated.
Component |
Application/Service |
Version |
|---|---|---|
Cluster orchestration |
Mirantis Kubernetes Engine Updated |
3.3.4 0 |
Container runtime |
Mirantis Container Runtime Updated |
19.03.13 1 |
Distributed storage |
Ceph |
14.2.11 (Nautilus) |
Rook |
1.4.4 |
|
LCM |
descheduler |
0.8.0 |
Helm Updated |
2.16.11-40 |
|
helm-controller Updated |
0.2.0-221-g32bd5f56 |
|
lcm-ansible Updated |
0.2.0-381-g720ec96 |
|
lcm-agent Updated |
0.2.0-221-g32bd5f56 |
|
metallb-controller |
0.9.3-1 |
|
metrics-server |
0.3.6-1 |
|
StackLight |
Alerta |
8.0.2-20201014133832 |
Alertmanager |
0.21.0 |
|
Elasticsearch |
7.6.1 |
|
Elasticsearch Curator |
5.7.6 |
|
Elasticsearch Exporter |
1.0.2 |
|
Fluentd |
1.10.2-20200609085335 |
|
Grafana |
7.1.5 |
|
Grafana Image Renderer |
2.0.0 |
|
IAM Proxy |
6.0.1 |
|
Kibana |
7.6.1 |
|
Metric Collector Updated |
0.1-20201120155524 |
|
Metricbeat |
7.6.1 |
|
Netchecker |
1.4.1 |
|
Patroni |
12-1.6p3 |
|
Prometheus Updated |
2.22.2 |
|
Prometheus Blackbox Exporter |
0.14.0 |
|
Prometheus ES Exporter |
0.5.1-20201002144823 |
|
Prometheus libvirt Exporter |
0.1-20200610164751 |
|
Prometheus Memcached Exporter |
0.5.0 |
|
Prometheus MySQL Exporter |
0.11.0 |
|
Prometheus Node Exporter |
1.0.1 |
|
Prometheus NGINX Exporter |
0.6.0 |
|
Prometheus Patroni Exporter |
0.1-20200428121305 |
|
Prometheus Postgres Exporter |
0.8.0-20201006113956 |
|
Prometheus RabbitMQ Exporter Updated |
v1.0.0-RC7.1 |
|
Prometheus Relay |
0.3-20200519054052 |
|
Pushgateway |
1.2.0 |
|
sf-notifier |
0.3-20201001081256 |
|
sf-reporter |
0.1-20200219140217 |
|
Telegraf Updated |
1.9.1-20201120081248 |
|
Telemeter |
4.4.0-20200424 |
- 0
For the MKE release highlights and components versions, see MKE documentation: MKE release notes.
- 1
For the MCR release highlights, see MCR documentation: MCR release notes.
Due to the development limitations, the MCR upgrade to version 19.03.14 on existing Container Cloud clusters is not supported.
This section lists the components artifacts of the Cluster release 5.10.0.
Note
The components that are newly added, updated, deprecated, or removed
as compared to the previous release version, are marked
with a corresponding superscript,
for example, lcm-ansible Updated.
Artifact |
Component |
Path |
|---|---|---|
Helm chart |
ceph-controller Updated |
https://binary.mirantis.com/ceph/helm/ceph-operator-1.0.0-mcp-95.tgz |
Docker images |
ceph |
mirantis.azurecr.io/ceph/ceph:v14.2.11 |
ceph-controller Updated |
mirantis.azurecr.io/ceph/mcp/ceph-controller:v1.0.0-20201215142221 |
|
cephcsi |
mirantis.azurecr.io/ceph/cephcsi/cephcsi:v3.1.0 |
|
csi-node-driver-registrar |
mirantis.azurecr.io/ceph/k8scsi/csi-node-driver-registrar:v1.2.0 |
|
csi-provisioner |
mirantis.azurecr.io/ceph/k8scsi/csi-provisioner:v1.6.0 |
|
csi-snapshotter |
mirantis.azurecr.io/ceph/k8scsi/csi-snapshotter:v2.1.1 |
|
csi-attacher |
mirantis.azurecr.io/ceph/k8scsi/csi-attacher:v2.1.0 |
|
rook |
mirantis.azurecr.io/ceph/rook/ceph:v1.4.4 |
Artifact |
Component |
Path |
|---|---|---|
Binaries |
lcm-ansible Updated |
https://binary.mirantis.com/lcm/bin/lcm-ansible/v0.2.0-381-g720ec96/lcm-ansible.tar.gz |
lcm-agent Updated |
https://binary.mirantis.com/lcm/bin/lcm-agent/v0.2.0-221-g32bd5f56/lcm-agent |
|
Helm charts |
descheduler Updated |
https://binary.mirantis.com/core/helm/descheduler-1.15.1.tgz |
managed-lcm-api New |
https://binary.mirantis.com/core/helm/managed-lcm-api-1.15.1.tgz |
|
metallb Updated |
||
metrics-server Updated |
https://binary.mirantis.com/core/helm/metrics-server-1.15.1.tgz |
|
Docker images |
descheduler |
mirantis.azurecr.io/lcm/descheduler/v0.8.0 |
helm Updated |
mirantis.azurecr.io/lcm/helm/tiller:v2.16.11-40 |
|
helm-controller Updated |
mirantis.azurecr.io/lcm/lcm-controller:v0.2.0-221-g32bd5f56 |
|
metallb-controller |
mirantis.azurecr.io/lcm/metallb/controller:v0.9.3-1 |
|
metallb-speaker |
mirantis.azurecr.io/lcm/metallb/speaker:v0.9.3-1 |
|
metrics-server |
mirantis.azurecr.io/lcm/metrics-server-amd64/v0.3.6-1 |
Artifact |
Component |
Path |
|---|---|---|
Helm charts |
alerta |
https://binary.mirantis.com/stacklight/helm/alerta-0.1.0-mcp-13.tgz |
elasticsearch Updated |
https://binary.mirantis.com/stacklight/helm/elasticsearch-7.1.1-mcp-22.tgz |
|
elasticsearch-curator |
https://binary.mirantis.com/stacklight/helm/elasticsearch-curator-1.5.0-mcp-2.tgz |
|
elasticsearch-exporter |
https://binary.mirantis.com/stacklight/helm/elasticsearch-exporter-1.2.0-mcp-2.tgz |
|
fluentd |
https://binary.mirantis.com/stacklight/helm/fluentd-2.0.3-mcp-15.tgz |
|
fluentd-elasticsearch Updated |
https://binary.mirantis.com/stacklight/helm/fluentd-elasticsearch-3.0.0-mcp-33.tgz |
|
grafana Updated |
https://binary.mirantis.com/stacklight/helm/grafana-3.3.10-mcp-74.tgz |
|
iam-proxy |
||
kibana |
https://binary.mirantis.com/stacklight/helm/kibana-3.2.1-mcp-20.tgz |
|
metric-collector Updated |
https://binary.mirantis.com/stacklight/helm/metric-collector-0.2.0-mcp-5.tgz |
|
metricbeat |
https://binary.mirantis.com/stacklight/helm/metricbeat-1.7.1-mcp-8.tgz |
|
netchecker |
||
patroni |
https://binary.mirantis.com/stacklight/helm/patroni-0.15.1-mcp-17.tgz |
|
prometheus Updated |
https://binary.mirantis.com/stacklight/helm/prometheus-8.11.4-mcp-102.tgz |
|
prometheus-blackbox-exporter |
https://binary.mirantis.com/stacklight/helm/prometheus-blackbox-exporter-0.3.0-mcp-3.tgz |
|
prometheus-es-exporter |
https://binary.mirantis.com/stacklight/helm/prometheus-es-exporter-1.0.0-mcp-3.tgz |
|
prometheus-libvirt-exporter |
https://binary.mirantis.com/stacklight/heprometheus-libvirt-exporter-0.1.0-mcp-2.tgz |
|
prometheus-memcached-exporter |
https://binary.mirantis.com/stacklight/helm/prometheus-memcached-exporter-0.1.0-mcp-1.tgz |
|
prometheus-mysql-exporter |
https://binary.mirantis.com/stacklight/helm/prometheus-mysql-exporter-0.3.2-mcp-1.tgz |
|
prometheus-nginx-exporter |
https://binary.mirantis.com/stacklight/helm/prometheus-nginx-exporter-0.1.0-mcp-4.tgz |
|
prometheus-rabbitmq-exporter |
https://binary.mirantis.com/stacklight/helm/prometheus-rabbitmq-exporter-0.4.1-mcp-1.tgz |
|
sf-notifier Updated |
https://binary.mirantis.com/stacklight/helm/sf-notifier-0.1.0-mcp-9.tgz |
|
sf-reporter Updated |
https://binary.mirantis.com/stacklight/helm/sf-reporter-0.1.0-mcp-8.tgz |
|
stacklight Updated |
https://binary.mirantis.com/stacklight/helm/stacklight-0.1.2-mcp-354.tgz |
|
telegraf-ds Updated |
https://binary.mirantis.com/stacklight/helm/telegraf-ds-1.1.5-mcp-19.tgz |
|
telegraf-s Updated |
https://binary.mirantis.com/stacklight/helm/telegraf-s-1.1.5-mcp-19.tgz |
|
telemeter-server |
https://binary.mirantis.com/stacklight/helm/telemeter-server-0.1.0-mcp-11.tgz |
|
telemeter-client |
https://binary.mirantis.com/stacklight/helm/telemeter-client-0.1.0-mcp-11.tgz |
|
Docker images |
alerta |
mirantis.azurecr.io/stacklight/alerta-web:8.0.2-20201014133832 |
alertmanager |
mirantis.azurecr.io/stacklight/alertmanager:v0.21.0 |
|
alpine-python3-requests |
mirantis.azurecr.io/stacklight/alpine-python3-requests:latest-20200618 |
|
busybox |
mirantis.azurecr.io/stacklight/busybox:1.30 |
|
configmap-reload |
mirantis.azurecr.io/stacklight/configmap-reload:v0.3.0 |
|
curl |
mirantis.azurecr.io/stacklight/curl:7.69.0 |
|
curl-jq |
mirantis.azurecr.io/stacklight/curl-jq:1.5-1 |
|
elasticsearch |
mirantis.azurecr.io/stacklight/elasticsearch:7.6.1 |
|
elasticsearch-curator |
mirantis.azurecr.io/stacklight/curator:5.7.6 |
|
elasticsearch-exporter |
mirantis.azurecr.io/stacklight/elasticsearch_exporter:1.0.2 |
|
fluentd |
mirantis.azurecr.io/stacklight/fluentd:1.10.2-20200609085335 |
|
gce-proxy |
mirantis.azurecr.io/stacklight/gce-proxy:1.11 |
|
grafana |
mirantis.azurecr.io/stacklight/grafana:7.1.5 |
|
grafana-image-renderer |
mirantis.azurecr.io/stacklight/grafana-image-renderer:2.0.0 |
|
kubectl |
mirantis.azurecr.io/stacklight/kubectl:1.19.2 |
|
k8s-netchecker-agent |
mirantis.azurecr.io/lcm/kubernetes/k8s-netchecker-agent:2019.1 |
|
k8s-netchecker-server |
mirantis.azurecr.io/lcm/kubernetes/k8s-netchecker-server:2019.1 |
|
k8s-sidecar |
mirantis.azurecr.io/stacklight/k8s-sidecar:0.1.178 |
|
kibana |
mirantis.azurecr.io/stacklight/kibana:7.6.1 |
|
kube-state-metrics |
mirantis.azurecr.io/stacklight/kube-state-metrics:v1.9.2 |
|
metric-collector Updated |
mirantis.azurecr.io/stacklight/metric-collector:v0.1-20201120155524 |
|
metricbeat |
mirantis.azurecr.io/stacklight/metricbeat:7.6.1 |
|
node-exporter |
mirantis.azurecr.io/stacklight/node-exporter:v1.0.1 |
|
origin-telemeter |
mirantis.azurecr.io/stacklight/origin-telemeter:4.4.0-20200424 |
|
prometheus Updated |
mirantis.azurecr.io/stacklight/prometheus:v2.22.2 |
|
prometheus-blackbox-exporter |
mirantis.azurecr.io/stacklight/blackbox-exporter:v0.14.0 |
|
prometheus-es-exporter |
mirantis.azurecr.io/stacklight/prometheus-es-exporter:v0.5.1-20201002144823 |
|
prometheus-libvirt-exporter |
mirantis.azurecr.io/stacklight/libvirt-exporter:v0.1-20200610164751 |
|
prometheus-memcached-exporter |
mirantis.azurecr.io/stacklight/memcached-exporter:v0.5.0 |
|
prometheus-mysql-exporter |
mirantis.azurecr.io/stacklight/mysqld-exporter:v0.11.0 |
|
prometheus-nginx-exporter |
mirantis.azurecr.io/stacklight/nginx-prometheus-exporter:0.6.0 |
|
prometheus-patroni-exporter |
mirantis.azurecr.io/stacklight/prometheus-patroni-exporter:v0.1-20200428121305 |
|
prometheus-postgres-exporter |
mirantis.azurecr.io/stacklight/prometheus-postgres-exporter:v0.8.0-20201006113956 |
|
prometheus-rabbitmq-exporter Updated |
mirantis.azurecr.io/stacklight/rabbitmq-exporter:v1.0.0-RC7.1 |
|
prometheus-relay |
mirantis.azurecr.io/stacklight/prometheus-relay:v0.3-20200519054052 |
|
pushgateway |
mirantis.azurecr.io/stacklight/pushgateway:v1.2.0 |
|
sf-notifier |
mirantis.azurecr.io/stacklight/sf-notifier:v0.3-20201001081256 |
|
sf-reporter |
mirantis.azurecr.io/stacklight/sf-reporter:v0.1-20200219140217 |
|
spilo |
mirantis.azurecr.io/stacklight/spilo:12-1.6p3 |
|
telegraf Updated |
mirantis.azurecr.io/stacklight/telegraf:v1.9.1-20201120081248 |
|
telemeter-token-auth |
mirantis.azurecr.io/stacklight/telemeter-token-auth:v0.1-20200406175600 |
This section outlines release notes for the Cluster release 5.9.0 that is introduced in the Mirantis Container Cloud release 2.2.0 and supports Mirantis Kubernetes Engine 3.3.3, Mirantis Container Runtime 19.03.12, and Kubernetes 1.18.
For the list of known and resolved issues, refer to the Container Cloud release 2.2.0 section.
This section outlines new features and enhancements introduced in the Cluster release 5.9.0.
Upgraded Alerta from version 7.4.4 to 8.0.2.
Enhanced StackLight to monitor the number of file descriptors on nodes and
raise FileDescriptorUsage* alerts when a node uses 80%, 90%, or 95% of
file descriptors.
Learn more
Added the
SSLProbesFailingalert that raises in case of an SSL certificate probes failure.Improved alerts descriptions and raise conditions.
Learn more
The following table lists the components versions of the Cluster release 5.9.0.
Note
The components that are newly added, updated, deprecated, or removed
as compared to the previous release version, are marked
with a corresponding superscript,
for example, lcm-ansible Updated.
Component |
Application/Service |
Version |
|---|---|---|
Cluster orchestration |
Mirantis Kubernetes Engine |
3.3.3 0 |
Container runtime |
Mirantis Container Runtime |
19.03.12 1 |
Distributed storage |
Ceph Updated |
14.2.11 (Nautilus) |
Rook Updated |
1.4.4 |
|
LCM |
ansible-docker Updated |
0.3.5-147-g18f3b44 |
descheduler |
0.8.0 |
|
Helm |
2.16.9-39 |
|
helm-controller Updated |
0.2.0-178-g8cc488f8 |
|
lcm-ansible Updated |
0.2.0-132-g49f7591 |
|
lcm-agent Updated |
0.2.0-178-g8cc488f8 |
|
metallb-controller |
0.9.3-1 |
|
metrics-server |
0.3.6-1 |
|
StackLight |
Alerta Updated |
8.0.2-20201014133832 |
Alertmanager |
0.21.0 |
|
Elasticsearch |
7.6.1 |
|
Elasticsearch Curator |
5.7.6 |
|
Elasticsearch Exporter |
1.0.2 |
|
Fluentd |
1.10.2-20200609085335 |
|
Grafana |
7.1.5 |
|
Grafana Image Renderer |
2.0.0 |
|
IAM Proxy |
6.0.1 |
|
Kibana |
7.6.1 |
|
MCC Metric Collector |
0.1-20201005141816 |
|
Metricbeat |
7.6.1 |
|
Netchecker |
1.4.1 |
|
Patroni |
12-1.6p3 |
|
Prometheus Updated |
2.19.3 |
|
Prometheus Blackbox Exporter |
0.14.0 |
|
Prometheus ES Exporter |
0.5.1-20201002144823 |
|
Prometheus libvirt Exporter |
0.1-20200610164751 |
|
Prometheus Memcached Exporter |
0.5.0 |
|
Prometheus MySQL Exporter |
0.11.0 |
|
Prometheus Node Exporter |
1.0.1 |
|
Prometheus NGINX Exporter |
0.6.0 |
|
Prometheus Patroni Exporter |
0.1-20200428121305 |
|
Prometheus Postgres Exporter |
0.8.0-20201006113956 |
|
Prometheus RabbitMQ Exporter |
0.29.0 |
|
Prometheus Relay |
0.3-20200519054052 |
|
Pushgateway |
1.2.0 |
|
sf-notifier Updated |
0.3-20201001081256 |
|
sf-reporter |
0.1-20200219140217 |
|
telegraf-ds |
1.9.1-20200901112858 |
|
telegraf-s |
1.9.1-20200901112858 |
|
Telemeter |
4.4.0-20200424 |
- 0
For the MKE release highlights and components versions, see MKE documentation: MKE release notes.
- 1
For the MCR release highlights, see MCR documentation: MCR release notes.
This section lists the components artifacts of the Cluster release 5.9.0.
Note
The components that are newly added, updated, deprecated, or removed
as compared to the previous release version, are marked
with a corresponding superscript,
for example, lcm-ansible Updated.
Artifact |
Component |
Path |
|---|---|---|
Helm chart |
ceph-controller Updated |
https://binary.mirantis.com/ceph/helm/ceph-operator-1.0.0-mcp-33.tgz |
Docker images |
ceph Updated |
mirantis.azurecr.io/ceph/ceph:v14.2.11 |
ceph-controller Updated |
mirantis.azurecr.io/ceph/mcp/ceph-controller:v1.0.0-20201022081323 |
|
cephcsi Updated |
mirantis.azurecr.io/ceph/cephcsi/cephcsi:v3.1.0 |
|
csi-node-driver-registrar |
mirantis.azurecr.io/ceph/k8scsi/csi-node-driver-registrar:v1.2.0 |
|
csi-provisioner Updated |
mirantis.azurecr.io/ceph/k8scsi/csi-provisioner:v1.6.0 |
|
csi-snapshotter Updated |
mirantis.azurecr.io/ceph/k8scsi/csi-snapshotter:v2.1.1 |
|
csi-attacher |
mirantis.azurecr.io/ceph/k8scsi/csi-attacher:v2.1.0 |
|
rook Updated |
mirantis.azurecr.io/ceph/rook/ceph:v1.4.4 |
Artifact |
Component |
Path |
|---|---|---|
Binaries |
ansible-docker Updated |
https://binary.mirantis.com/lcm/bin/ansible-docker/v0.3.5-147-g18f3b44/ansible-docker.tar.gz |
lcm-ansible Updated |
https://binary.mirantis.com/lcm/bin/lcm-ansible/v0.2.0-132-g49f7591-1/lcm-ansible.tar.gz |
|
lcm-agent Updated |
https://binary.mirantis.com/lcm/bin/lcm-agent/v0.2.0-178-g8cc488f8/lcm-agent |
|
Helm charts |
descheduler Updated |
https://binary.mirantis.com/core/helm/descheduler-1.14.0.tgz |
metallb Updated |
||
metrics-server Updated |
https://binary.mirantis.com/core/helm/metrics-server-1.14.0.tgz |
|
Docker images |
descheduler |
mirantis.azurecr.io/lcm/descheduler/v0.8.0 |
helm |
mirantis.azurecr.io/lcm/helm/tiller:v2.16.9-39 |
|
helm-controller Updated |
mirantis.azurecr.io/lcm/lcm-controller:v0.2.0-178-g8cc488f8 |
|
metallb-controller |
mirantis.azurecr.io/lcm/metallb/controller:v0.9.3-1 |
|
metallb-speaker |
mirantis.azurecr.io/lcm/metallb/speaker:v0.9.3-1 |
|
metrics-server |
mirantis.azurecr.io/lcm/metrics-server-amd64/v0.3.6-1 |
Artifact |
Component |
Path |
|---|---|---|
Helm charts |
alerta Updated |
https://binary.mirantis.com/stacklight/helm/alerta-0.1.0-mcp-13.tgz |
elasticsearch |
https://binary.mirantis.com/stacklight/helm/elasticsearch-7.1.1-mcp-20.tgz |
|
elasticsearch-curator |
https://binary.mirantis.com/stacklight/helm/elasticsearch-curator-1.5.0-mcp-2.tgz |
|
elasticsearch-exporter |
https://binary.mirantis.com/stacklight/helm/elasticsearch-exporter-1.2.0-mcp-2.tgz |
|
fluentd |
https://binary.mirantis.com/stacklight/helm/fluentd-2.0.3-mcp-15.tgz |
|
fluentd-elasticsearch Updated |
https://binary.mirantis.com/stacklight/helm/fluentd-elasticsearch-3.0.0-mcp-28.tgz |
|
grafana Updated |
https://binary.mirantis.com/stacklight/helm/grafana-3.3.10-mcp-66.tgz |
|
iam-proxy |
||
kibana |
https://binary.mirantis.com/stacklight/helm/kibana-3.2.1-mcp-20.tgz |
|
mcc-metric-collector |
https://binary.mirantis.com/stacklight/helm/mcc-metric-collector-0.1.0-mcp-22.tgz |
|
metricbeat |
https://binary.mirantis.com/stacklight/helm/metricbeat-1.7.1-mcp-8.tgz |
|
netchecker |
||
patroni |
https://binary.mirantis.com/stacklight/helm/patroni-0.15.1-mcp-17.tgz |
|
prometheus Updated |
https://binary.mirantis.com/stacklight/helm/prometheus-8.11.4-mcp-83.tgz |
|
prometheus-blackbox-exporter |
https://binary.mirantis.com/stacklight/helm/prometheus-blackbox-exporter-0.3.0-mcp-3.tgz |
|
prometheus-es-exporter |
https://binary.mirantis.com/stacklight/helm/prometheus-es-exporter-1.0.0-mcp-3.tgz |
|
prometheus-libvirt-exporter |
https://binary.mirantis.com/stacklight/heprometheus-libvirt-exporter-0.1.0-mcp-2.tgz |
|
prometheus-memcached-exporter |
https://binary.mirantis.com/stacklight/helm/prometheus-memcached-exporter-0.1.0-mcp-1.tgz |
|
prometheus-mysql-exporter |
https://binary.mirantis.com/stacklight/helm/prometheus-mysql-exporter-0.3.2-mcp-1.tgz |
|
prometheus-nginx-exporter |
https://binary.mirantis.com/stacklight/helm/prometheus-nginx-exporter-0.1.0-mcp-4.tgz |
|
prometheus-rabbitmq-exporter |
https://binary.mirantis.com/stacklight/helm/prometheus-rabbitmq-exporter-0.4.1-mcp-1.tgz |
|
sf-notifier |
https://binary.mirantis.com/stacklight/helm/sf-notifier-0.1.0-mcp-5.tgz |
|
sf-reporter |
https://binary.mirantis.com/stacklight/helm/sf-reporter-0.1.0-mcp-6.tgz |
|
stacklight Updated |
https://binary.mirantis.com/stacklight/helm/stacklight-0.1.2-mcp-325.tgz |
|
telegraf-ds |
https://binary.mirantis.com/stacklight/helm/telegraf-ds-1.1.5-mcp-16.tgz |
|
telegraf-s |
https://binary.mirantis.com/stacklight/helm/telegraf-s-1.1.5-mcp-16.tgz |
|
telemeter-server |
https://binary.mirantis.com/stacklight/helm/telemeter-server-0.1.0-mcp-11.tgz |
|
telemeter-client |
https://binary.mirantis.com/stacklight/helm/telemeter-client-0.1.0-mcp-11.tgz |
|
Docker images |
alerta Updated |
mirantis.azurecr.io/stacklight/alerta-web:8.0.2-20201014133832 |
alertmanager |
mirantis.azurecr.io/stacklight/alertmanager:v0.21.0 |
|
alpine-python3-requests Updated |
mirantis.azurecr.io/stacklight/alpine-python3-requests:latest-20200618 |
|
busybox |
mirantis.azurecr.io/stacklight/busybox:1.30 |
|
configmap-reload |
mirantis.azurecr.io/stacklight/configmap-reload:v0.3.0 |
|
curl |
mirantis.azurecr.io/stacklight/curl:7.69.0 |
|
curl-jq |
mirantis.azurecr.io/stacklight/curl-jq:1.5-1 |
|
elasticsearch |
mirantis.azurecr.io/stacklight/elasticsearch:7.6.1 |
|
elasticsearch-curator |
mirantis.azurecr.io/stacklight/curator:5.7.6 |
|
elasticsearch-exporter |
mirantis.azurecr.io/stacklight/elasticsearch_exporter:1.0.2 |
|
fluentd |
mirantis.azurecr.io/stacklight/fluentd:1.10.2-20200609085335 |
|
gce-proxy |
mirantis.azurecr.io/stacklight/gce-proxy:1.11 |
|
grafana |
mirantis.azurecr.io/stacklight/grafana:7.1.5 |
|
grafana-image-renderer |
mirantis.azurecr.io/stacklight/grafana-image-renderer:2.0.0 |
|
kubectl Updated |
mirantis.azurecr.io/stacklight/kubectl:1.19.2 |
|
k8s-netchecker-agent |
mirantis.azurecr.io/lcm/kubernetes/k8s-netchecker-agent:2019.1 |
|
k8s-netchecker-server |
mirantis.azurecr.io/lcm/kubernetes/k8s-netchecker-server:2019.1 |
|
k8s-sidecar |
mirantis.azurecr.io/stacklight/k8s-sidecar:0.1.178 |
|
kibana |
mirantis.azurecr.io/stacklight/kibana:7.6.1 |
|
kube-state-metrics |
mirantis.azurecr.io/stacklight/kube-state-metrics:v1.9.2 |
|
mcc-metric-collector |
mirantis.azurecr.io/stacklight/mcc-metric-collector:v0.1-20201005141816 |
|
metricbeat |
mirantis.azurecr.io/stacklight/metricbeat:7.6.1 |
|
node-exporter |
mirantis.azurecr.io/stacklight/node-exporter:v1.0.1 |
|
origin-telemeter |
mirantis.azurecr.io/stacklight/origin-telemeter:4.4.0-20200424 |
|
prometheus Updated |
mirantis.azurecr.io/stacklight/prometheus:v2.19.3 |
|
prometheus-blackbox-exporter |
mirantis.azurecr.io/stacklight/blackbox-exporter:v0.14.0 |
|
prometheus-es-exporter |
mirantis.azurecr.io/stacklight/prometheus-es-exporter:v0.5.1-20201002144823 |
|
prometheus-libvirt-exporter |
mirantis.azurecr.io/stacklight/libvirt-exporter:v0.1-20200610164751 |
|
prometheus-memcached-exporter |
mirantis.azurecr.io/stacklight/memcached-exporter:v0.5.0 |
|
prometheus-mysql-exporter |
mirantis.azurecr.io/stacklight/mysqld-exporter:v0.11.0 |
|
prometheus-nginx-exporter |
mirantis.azurecr.io/stacklight/nginx-prometheus-exporter:0.6.0 |
|
prometheus-patroni-exporter |
mirantis.azurecr.io/stacklight/prometheus-patroni-exporter:v0.1-20200428121305 |
|
prometheus-postgres-exporter |
mirantis.azurecr.io/stacklight/prometheus-postgres-exporter:v0.8.0-20201006113956 |
|
prometheus-rabbitmq-exporter |
mirantis.azurecr.io/stacklight/rabbitmq-exporter:v0.29.0 |
|
prometheus-relay |
mirantis.azurecr.io/stacklight/prometheus-relay:v0.3-20200519054052 |
|
pushgateway |
mirantis.azurecr.io/stacklight/pushgateway:v1.2.0 |
|
sf-notifier Updated |
mirantis.azurecr.io/stacklight/sf-notifier:v0.3-20201001081256 |
|
sf-reporter |
mirantis.azurecr.io/stacklight/sf-reporter:v0.1-20200219140217 |
|
spilo |
mirantis.azurecr.io/stacklight/spilo:12-1.6p3 |
|
telegraf |
mirantis.azurecr.io/stacklight/telegraf:v1.9.1-20200901112858 |
|
telemeter-token-auth |
mirantis.azurecr.io/stacklight/telemeter-token-auth:v0.1-20200406175600 |
This section outlines release notes for the Cluster release 5.8.0 that is introduced in the Mirantis Container Cloud release 2.1.0 and supports Mirantis Kubernetes Engine 3.3.3, Mirantis Container Runtime 19.03.12, and Kubernetes 1.18.
For the list of known issues, refer to the Container Cloud release 2.1.0 Known issues.
This section outlines new features and enhancements introduced in the Cluster release 5.8.0.
Upgraded Grafana from version 6.6.2 to 7.1.5.
Introduced Grafana Image Renderer, a separate Grafana container in a pod to offload rendering of images from charts. Grafana Image Renderer is enabled by default.
Configured a home dashboard to replace the Installation/configuration panel that opens when you access Grafana. By default, Kubernetes Cluster is set as a home dashboard. However, you can set any of the available Grafana dashboards.
Split the regional and management cluster function in StackLight telemetry. Now, the metrics from managed clusters are aggregated on regional clusters, then both regional and managed clusters metrics are sent from regional clusters to the management cluster.
Added the capability to filter panels by regions in the Clusters Overview and Telemeter Server Grafana dashboards.
Learn more
Improved alerts descriptions and raise conditions.
Changed severity in some alerts to improve operability.
Improved raise conditions of some alerts by adding the
forclause and unifying the existingforclauses.
Learn more
The following table lists the components versions of the Cluster release 5.8.0.
Note
The components that are newly added, updated, deprecated, or removed
as compared to the previous release version, are marked
with a corresponding superscript,
for example, lcm-ansible Updated.
Component |
Application/Service |
Version |
|---|---|---|
Cluster orchestration |
Mirantis Kubernetes Engine |
3.3.3 0 |
Container runtime |
Mirantis Container Runtime |
19.03.12 1 |
Distributed storage |
Ceph |
14.2.9 (Nautilus) |
Rook |
1.3.8 |
|
LCM |
ansible-docker Updated |
0.3.5-141-g1007cc9 |
descheduler |
0.8.0 |
|
Helm Updated |
2.16.9-39 |
|
helm-controller Updated |
0.2.0-169-g5668304d |
|
lcm-ansible Updated |
0.2.0-119-g8f05f58-1 |
|
lcm-agent |
0.2.0-149-g412c5a05 |
|
metallb-controller |
0.9.3-1 |
|
metrics-server |
0.3.6-1 |
|
StackLight |
Alerta |
7.4.4-20200615123606 |
Alertmanager |
0.21.0 |
|
Elasticsearch |
7.6.1 |
|
Elasticsearch Curator |
5.7.6 |
|
Elasticsearch Exporter |
1.0.2 |
|
Fluentd |
1.10.2-20200609085335 |
|
Grafana Updated |
7.1.5 |
|
Grafana Image Renderer New |
2.0.0 |
|
IAM Proxy |
6.0.1 |
|
Kibana |
7.6.1 |
|
MCC Metric Collector Updated |
0.1-20201005141816 |
|
Metricbeat |
7.6.1 |
|
Netchecker |
1.4.1 |
|
Patroni |
12-1.6p3 |
|
Prometheus |
2.19.2 |
|
Prometheus Blackbox Exporter |
0.14.0 |
|
Prometheus ES Exporter Updated |
0.5.1-20201002144823 |
|
Prometheus libvirt Exporter |
0.1-20200610164751 |
|
Prometheus Memcached Exporter |
0.5.0 |
|
Prometheus MySQL Exporter |
0.11.0 |
|
Prometheus Node Exporter |
1.0.1 |
|
Prometheus NGINX Exporter |
0.6.0 |
|
Prometheus Patroni Exporter |
0.1-20200428121305 |
|
Prometheus Postgres Exporter Updated |
0.8.0-20201006113956 |
|
Prometheus RabbitMQ Exporter |
0.29.0 |
|
Prometheus Relay |
0.3-20200519054052 |
|
Pushgateway |
1.2.0 |
|
sf-notifier Updated |
0.3-20200813125431 |
|
sf-reporter |
0.1-20200219140217 |
|
telegraf-ds Updated |
1.9.1-20200901112858 |
|
telegraf-s Updated |
1.9.1-20200901112858 |
|
Telemeter |
4.4.0-20200424 |
- 0
For the MKE release highlights and components versions, see MKE documentation: MKE release notes.
- 1
For the MCR release highlights, see MCR documentation: MCR release notes.
This section lists the components artifacts of the Cluster release 5.8.0.
Note
The components that are newly added, updated, deprecated, or removed
as compared to the previous release version, are marked
with a corresponding superscript,
for example, lcm-ansible Updated.
Artifact |
Component |
Path |
|---|---|---|
Helm chart |
ceph-controller Updated |
https://binary.mirantis.com/ceph/helm/ceph-operator-1.0.0-mcp-18.tgz |
Docker images |
ceph |
mirantis.azurecr.io/ceph/ceph:v14.2.9 |
ceph-controller Updated |
mirantis.azurecr.io/ceph/mcp/ceph-controller:v1.0.0-20200903151423 |
|
cephcsi |
mirantis.azurecr.io/ceph/cephcsi/cephcsi:v2.1.2 |
|
csi-node-driver-registrar |
mirantis.azurecr.io/ceph/k8scsi/csi-node-driver-registrar:v1.2.0 |
|
csi-provisioner |
mirantis.azurecr.io/ceph/k8scsi/csi-provisioner:v1.4.0 |
|
csi-snapshotter |
mirantis.azurecr.io/ceph/k8scsi/csi-snapshotter:v1.2.2 |
|
csi-attacher |
mirantis.azurecr.io/ceph/k8scsi/csi-attacher:v2.1.0 |
|
rook |
mirantis.azurecr.io/ceph/rook/ceph:v1.3.8 |
Artifact |
Component |
Path |
|---|---|---|
Binaries |
ansible-docker Updated |
https://binary.mirantis.com/lcm/bin/ansible-docker/v0.3.5-141-g1007cc9/ansible-docker.tar.gz |
lcm-ansible Updated |
https://binary.mirantis.com/lcm/bin/lcm-ansible/v0.2.0-119-g8f05f58-1/lcm-ansible.tar.gz |
|
lcm-agent Updated |
https://binary.mirantis.com/lcm/bin/lcm-agent/v0.2.0-169-g5668304d/lcm-agent |
|
Helm charts |
descheduler Updated |
https://binary.mirantis.com/core/helm/descheduler-1.12.2.tgz |
metallb Updated |
||
metrics-server Updated |
https://binary.mirantis.com/core/helm/metrics-server-1.12.2.tgz |
|
Docker images |
descheduler |
mirantis.azurecr.io/lcm/descheduler/v0.8.0 |
helm Updated |
mirantis.azurecr.io/lcm/helm/tiller:v2.16.9-39 |
|
helm-controller Updated |
mirantis.azurecr.io/lcm/lcm-controller:v0.2.0-169-g5668304d |
|
metallb-controller |
mirantis.azurecr.io/lcm/metallb/controller:v0.9.3-1 |
|
metallb-speaker |
mirantis.azurecr.io/lcm/metallb/speaker:v0.9.3-1 |
|
metrics-server |
mirantis.azurecr.io/lcm/metrics-server-amd64/v0.3.6-1 |
Artifact |
Component |
Path |
|---|---|---|
Helm charts |
alerta |
https://binary.mirantis.com/stacklight/helm/alerta-0.1.0-mcp-12.tgz |
elasticsearch |
https://binary.mirantis.com/stacklight/helm/elasticsearch-7.1.1-mcp-20.tgz |
|
elasticsearch-curator |
https://binary.mirantis.com/stacklight/helm/elasticsearch-curator-1.5.0-mcp-2.tgz |
|
elasticsearch-exporter |
https://binary.mirantis.com/stacklight/helm/elasticsearch-exporter-1.2.0-mcp-2.tgz |
|
fluentd Updated |
https://binary.mirantis.com/stacklight/helm/fluentd-2.0.3-mcp-15.tgz |
|
fluentd-elasticsearch |
https://binary.mirantis.com/stacklight/helm/fluentd-elasticsearch-3.0.0-mcp-25.tgz |
|
grafana Updated |
https://binary.mirantis.com/stacklight/helm/grafana-3.3.10-mcp-64.tgz |
|
iam-proxy |
||
kibana Updated |
https://binary.mirantis.com/stacklight/helm/kibana-3.2.1-mcp-20.tgz |
|
mcc-metric-collector |
https://binary.mirantis.com/stacklight/helm/mcc-metric-collector-0.1.0-mcp-22.tgz |
|
metricbeat |
https://binary.mirantis.com/stacklight/helm/metricbeat-1.7.1-mcp-8.tgz |
|
netchecker |
||
patroni |
https://binary.mirantis.com/stacklight/helm/patroni-0.15.1-mcp-17.tgz |
|
prometheus Updated |
https://binary.mirantis.com/stacklight/helm/prometheus-8.11.4-mcp-80.tgz |
|
prometheus-blackbox-exporter |
https://binary.mirantis.com/stacklight/helm/prometheus-blackbox-exporter-0.3.0-mcp-3.tgz |
|
prometheus-es-exporter |
https://binary.mirantis.com/stacklight/helm/prometheus-es-exporter-1.0.0-mcp-3.tgz |
|
prometheus-libvirt-exporter |
https://binary.mirantis.com/stacklight/heprometheus-libvirt-exporter-0.1.0-mcp-2.tgz |
|
prometheus-memcached-exporter |
https://binary.mirantis.com/stacklight/helm/prometheus-memcached-exporter-0.1.0-mcp-1.tgz |
|
prometheus-mysql-exporter |
https://binary.mirantis.com/stacklight/helm/prometheus-mysql-exporter-0.3.2-mcp-1.tgz |
|
prometheus-nginx-exporter Updated |
https://binary.mirantis.com/stacklight/helm/prometheus-nginx-exporter-0.1.0-mcp-4.tgz |
|
prometheus-rabbitmq-exporter |
https://binary.mirantis.com/stacklight/helm/prometheus-rabbitmq-exporter-0.4.1-mcp-1.tgz |
|
sf-notifier |
https://binary.mirantis.com/stacklight/helm/sf-notifier-0.1.0-mcp-5.tgz |
|
sf-reporter |
https://binary.mirantis.com/stacklight/helm/sf-reporter-0.1.0-mcp-6.tgz |
|
stacklight Updated |
https://binary.mirantis.com/stacklight/helm/stacklight-0.1.2-mcp-312.tgz |
|
telegraf-ds Updated |
https://binary.mirantis.com/stacklight/helm/telegraf-ds-1.1.5-mcp-16.tgz |
|
telegraf-s Updated |
https://binary.mirantis.com/stacklight/helm/telegraf-s-1.1.5-mcp-16.tgz |
|
telemeter-server |
https://binary.mirantis.com/stacklight/helm/telemeter-server-0.1.0-mcp-11.tgz |
|
telemeter-client |
https://binary.mirantis.com/stacklight/helm/telemeter-client-0.1.0-mcp-11.tgz |
|
Docker images |
alerta |
mirantis.azurecr.io/stacklight/alerta-web:7.4.4-20200615123606 |
alertmanager |
mirantis.azurecr.io/stacklight/alertmanager:v0.21.0 |
|
alpine-python3-requests |
mirantis.azurecr.io/stacklight/alpine-python3-requests:latest-20200320 |
|
busybox |
mirantis.azurecr.io/stacklight/busybox:1.30 |
|
configmap-reload |
mirantis.azurecr.io/stacklight/configmap-reload:v0.3.0 |
|
curl |
mirantis.azurecr.io/stacklight/curl:7.69.0 |
|
curl-jq |
mirantis.azurecr.io/stacklight/curl-jq:1.5-1 |
|
elasticsearch |
mirantis.azurecr.io/stacklight/elasticsearch:7.6.1 |
|
elasticsearch-curator |
mirantis.azurecr.io/stacklight/curator:5.7.6 |
|
elasticsearch-exporter |
mirantis.azurecr.io/stacklight/elasticsearch_exporter:1.0.2 |
|
fluentd |
mirantis.azurecr.io/stacklight/fluentd:1.10.2-20200609085335 |
|
gce-proxy |
mirantis.azurecr.io/stacklight/gce-proxy:1.11 |
|
grafana Updated |
mirantis.azurecr.io/stacklight/grafana:7.1.5 |
|
grafana-image-renderer New |
mirantis.azurecr.io/stacklight/grafana-image-renderer:2.0.0 |
|
kubectl New |
mirantis.azurecr.io/stacklight/kubectl:1.15.3 |
|
k8s-netchecker-agent |
mirantis.azurecr.io/lcm/kubernetes/k8s-netchecker-agent:2019.1 |
|
k8s-netchecker-server |
mirantis.azurecr.io/lcm/kubernetes/k8s-netchecker-server:2019.1 |
|
k8s-sidecar |
mirantis.azurecr.io/stacklight/k8s-sidecar:0.1.178 |
|
kibana |
mirantis.azurecr.io/stacklight/kibana:7.6.1 |
|
kube-state-metrics |
mirantis.azurecr.io/stacklight/kube-state-metrics:v1.9.2 |
|
mcc-metric-collector Updated |
mirantis.azurecr.io/stacklight/mcc-metric-collector:v0.1-20201005141816 |
|
metricbeat |
mirantis.azurecr.io/stacklight/metricbeat:7.6.1 |
|
node-exporter |
mirantis.azurecr.io/stacklight/node-exporter:v1.0.1 |
|
origin-telemeter |
mirantis.azurecr.io/stacklight/origin-telemeter:4.4.0-20200424 |
|
prometheus |
mirantis.azurecr.io/stacklight/prometheus:v2.19.2 |
|
prometheus-blackbox-exporter |
mirantis.azurecr.io/stacklight/blackbox-exporter:v0.14.0 |
|
prometheus-es-exporter Updated |
mirantis.azurecr.io/stacklight/prometheus-es-exporter:v0.5.1-20201002144823 |
|
prometheus-libvirt-exporter |
mirantis.azurecr.io/stacklight/libvirt-exporter:v0.1-20200610164751 |
|
prometheus-memcached-exporter |
mirantis.azurecr.io/stacklight/memcached-exporter:v0.5.0 |
|
prometheus-mysql-exporter |
mirantis.azurecr.io/stacklight/mysqld-exporter:v0.11.0 |
|
prometheus-nginx-exporter |
mirantis.azurecr.io/stacklight/nginx-prometheus-exporter:0.6.0 |
|
prometheus-patroni-exporter |
mirantis.azurecr.io/stacklight/prometheus-patroni-exporter:v0.1-20200428121305 |
|
prometheus-postgres-exporter Updated |
mirantis.azurecr.io/stacklight/prometheus-postgres-exporter:v0.8.0-20201006113956 |
|
prometheus-rabbitmq-exporter |
mirantis.azurecr.io/stacklight/rabbitmq-exporter:v0.29.0 |
|
prometheus-relay |
mirantis.azurecr.io/stacklight/prometheus-relay:v0.3-20200519054052 |
|
pushgateway |
mirantis.azurecr.io/stacklight/pushgateway:v1.2.0 |
|
sf-notifier Updated |
mirantis.azurecr.io/stacklight/sf-notifier:v0.3-20200813125431 |
|
sf-reporter |
mirantis.azurecr.io/stacklight/sf-reporter:v0.1-20200219140217 |
|
spilo |
mirantis.azurecr.io/stacklight/spilo:12-1.6p3 |
|
telegraf Updated |
mirantis.azurecr.io/stacklight/telegraf:v1.9.1-20200901112858 |
|
telemeter-token-auth |
mirantis.azurecr.io/stacklight/telemeter-token-auth:v0.1-20200406175600 |
See also
This section outlines release notes for the Cluster release 5.7.0 that is introduced in the Mirantis Container Cloud release 2.0.0 and supports Mirantis Kubernetes Engine 3.3.3, Mirantis Container Runtime 19.03.12, and Kubernetes 1.18.
For the list of known issues, refer to the Container Cloud release 2.0.0 Known issues.
The following table lists the components versions of the Cluster release 5.7.0.
Component |
Application/Service |
Version |
|---|---|---|
Cluster orchestration |
Mirantis Kubernetes Engine |
3.3.3 0 |
Container runtime |
Mirantis Container Runtime |
19.03.12 1 |
Distributed storage |
Ceph |
14.2.9 (Nautilus) |
Rook |
1.3.8 |
|
LCM |
ansible-docker |
0.3.5-136-g38653c7 |
descheduler |
0.8.0 |
|
Helm |
2.16.7-38 |
|
helm-controller |
0.2.0-149-g412c5a05 |
|
lcm-ansible |
0.2.0-110-g63cf88b |
|
lcm-agent |
0.2.0-149-g412c5a05 |
|
metallb-controller |
0.9.3-1 |
|
metrics-server |
0.3.6-1 |
|
StackLight |
Alerta |
7.4.4-20200615123606 |
Alertmanager |
0.21.0 |
|
Elasticsearch |
7.6.1 |
|
Elasticsearch Curator |
5.7.6 |
|
Elasticsearch Exporter |
1.0.2 |
|
Fluentd |
1.10.2-20200609085335 |
|
Grafana |
6.6.2 |
|
IAM Proxy |
6.0.1 |
|
Kibana |
7.6.1 |
|
MCC Metric Collector |
0.1-20200806113043 |
|
Metricbeat |
7.6.1 |
|
Netchecker |
1.4.1 |
|
Patroni |
12-1.6p3 |
|
Prometheus |
2.19.2 |
|
Prometheus Blackbox Exporter |
0.14.0 |
|
Prometheus ES Exporter |
0.5.1-20200313132957 |
|
Prometheus libvirt Exporter |
0.1-20200610164751 |
|
Prometheus Memcached Exporter |
0.5.0 |
|
Prometheus MySQL Exporter |
0.11.0 |
|
Prometheus Node Exporter |
1.0.1 |
|
Prometheus NGINX Exporter |
0.6.0 |
|
Prometheus Patroni Exporter |
0.1-20200428121305 |
|
Prometheus Postgres Exporter |
0.8.0-20200715102834 |
|
Prometheus RabbitMQ Exporter |
0.29.0 |
|
Prometheus Relay |
0.3-20200519054052 |
|
Pushgateway |
1.2.0 |
|
sf-notifier |
0.3-20200430122138 |
|
sf-reporter |
0.1-20200219140217 |
|
telegraf-ds |
1.9.1-20200806073506 |
|
telegraf-s |
1.9.1-20200806073506 |
|
Telemeter |
4.4.0-20200424 |
- 0
For the MKE release highlights and components versions, see MKE documentation: MKE release notes.
- 1
For the MCR release highlights, see MCR documentation: MCR release notes.
Due to the development limitations, the MCR upgrade to version 19.03.14 on existing Container Cloud clusters is not supported.
This section lists the components artifacts of the Cluster release 5.7.0.
Artifact |
Component |
Path |
|---|---|---|
Helm chart |
ceph-controller |
https://binary.mirantis.com/ceph/helm/ceph-operator-1.0.0-mcp-16.tgz |
Docker images |
ceph |
mirantis.azurecr.io/ceph/ceph:v14.2.9 |
ceph-controller |
mirantis.azurecr.io/ceph/mcp/ceph-controller:v1.0.0-20200805103414 |
|
cephcsi |
mirantis.azurecr.io/ceph/cephcsi/cephcsi:v2.1.2 |
|
csi-node-driver-registrar |
mirantis.azurecr.io/ceph/k8scsi/csi-node-driver-registrar:v1.2.0 |
|
csi-provisioner |
mirantis.azurecr.io/ceph/k8scsi/csi-provisioner:v1.4.0 |
|
csi-snapshotter |
mirantis.azurecr.io/ceph/k8scsi/csi-snapshotter:v1.2.2 |
|
csi-attacher |
mirantis.azurecr.io/ceph/k8scsi/csi-attacher:v2.1.0 |
|
rook |
mirantis.azurecr.io/ceph/rook/ceph:v1.3.8 |
Artifact |
Component |
Path |
|---|---|---|
Binaries |
ansible-docker |
https://binary.mirantis.com/lcm/bin/ansible-docker/v0.3.5-136-g38653c7/ansible-docker.tar.gz |
lcm-ansible |
https://binary.mirantis.com/lcm/bin/lcm-ansible/v0.2.0-110-g63cf88b/lcm-ansible.tar.gz |
|
lcm-agent |
https://binary.mirantis.com/lcm/bin/lcm-agent/v0.2.0-149-g412c5a05/lcm-agent |
|
Helm charts |
descheduler |
https://binary.mirantis.com/core/helm/descheduler-1.10.12.tgz |
metallb |
||
metrics-server |
https://binary.mirantis.com/core/helm/metrics-server-1.10.12.tgz |
|
Docker images |
descheduler |
mirantis.azurecr.io/lcm/descheduler/v0.8.0 |
helm |
mirantis.azurecr.io/lcm/helm/tiller:v2.16.9-39 |
|
helm-controller |
mirantis.azurecr.io/lcm/lcm-controller:v0.2.0-149-g412c5a05 |
|
metallb-controller |
mirantis.azurecr.io/lcm/metallb/controller:v0.9.3-1 |
|
metallb-speaker |
mirantis.azurecr.io/lcm/metallb/speaker:v0.9.3-1 |
|
metrics-server |
mirantis.azurecr.io/lcm/metrics-server-amd64/v0.3.6-1 |
Artifact |
Component |
Path |
|---|---|---|
Helm charts |
alerta |
https://binary.mirantis.com/stacklight/helm/alerta-0.1.0-mcp-12.tgz |
elasticsearch |
https://binary.mirantis.com/stacklight/helm/elasticsearch-7.1.1-mcp-20.tgz |
|
elasticsearch-curator |
https://binary.mirantis.com/stacklight/helm/elasticsearch-curator-1.5.0-mcp-2.tgz |
|
elasticsearch-exporter |
https://binary.mirantis.com/stacklight/helm/elasticsearch-exporter-1.2.0-mcp-2.tgz |
|
fluentd |
https://binary.mirantis.com/stacklight/helm/fluentd-2.0.3-mcp-15.tgz |
|
fluentd-elasticsearch |
https://binary.mirantis.com/stacklight/helm/fluentd-elasticsearch-3.0.0-mcp-24.tgz |
|
grafana |
https://binary.mirantis.com/stacklight/helm/grafana-3.3.10-mcp-59.tgz |
|
kibana |
https://binary.mirantis.com/stacklight/helm/kibana-3.2.1-mcp-19.tgz |
|
mcc-metric-collector |
https://binary.mirantis.com/stacklight/helm/mcc-metric-collector-0.1.0-mcp-22.tgz |
|
metricbeat |
https://binary.mirantis.com/stacklight/helm/metricbeat-1.7.1-mcp-8.tgz |
|
netchecker |
||
patroni |
https://binary.mirantis.com/stacklight/helm/patroni-0.15.1-mcp-17.tgz |
|
prometheus |
https://binary.mirantis.com/stacklight/helm/prometheus-8.11.4-mcp-73.tgz |
|
prometheus-blackbox-exporter |
https://binary.mirantis.com/stacklight/helm/prometheus-blackbox-exporter-0.3.0-mcp-3.tgz |
|
prometheus-es-exporter |
https://binary.mirantis.com/stacklight/helm/prometheus-es-exporter-1.0.0-mcp-3.tgz |
|
prometheus-libvirt-exporter |
https://binary.mirantis.com/stacklight/heprometheus-libvirt-exporter-0.1.0-mcp-2.tgz |
|
prometheus-memcached-exporter |
https://binary.mirantis.com/stacklight/helm/prometheus-memcached-exporter-0.1.0-mcp-1.tgz |
|
prometheus-mysql-exporter |
https://binary.mirantis.com/stacklight/helm/prometheus-mysql-exporter-0.3.2-mcp-1.tgz |
|
prometheus-nginx-exporter |
https://binary.mirantis.com/stacklight/helm/prometheus-nginx-exporter-0.1.0-mcp-2.tgz |
|
prometheus-rabbitmq-exporter |
https://binary.mirantis.com/stacklight/helm/prometheus-rabbitmq-exporter-0.4.1-mcp-1.tgz |
|
sf-notifier |
https://binary.mirantis.com/stacklight/helm/sf-notifier-0.1.0-mcp-5.tgz |
|
sf-reporter |
https://binary.mirantis.com/stacklight/helm/sf-reporter-0.1.0-mcp-6.tgz |
|
stacklight |
https://binary.mirantis.com/stacklight/helm/stacklight-0.1.2-mcp-285.tgz |
|
telegraf-ds |
https://binary.mirantis.com/stacklight/helm/telegraf-ds-1.1.5-mcp-14.tgz |
|
telegraf-s |
https://binary.mirantis.com/stacklight/helm/telegraf-s-1.1.5-mcp-14.tgz |
|
telemeter-server |
https://binary.mirantis.com/stacklight/helm/telemeter-server-0.1.0-mcp-11.tgz |
|
telemeter-client |
https://binary.mirantis.com/stacklight/helm/telemeter-client-0.1.0-mcp-11.tgz |
|
Docker images |
alerta |
mirantis.azurecr.io/stacklight/alerta-web:7.4.4-20200615123606 |
alertmanager |
mirantis.azurecr.io/stacklight/alertmanager:v0.21.0 |
|
alpine-python3-requests |
mirantis.azurecr.io/stacklight/alpine-python3-requests:latest-20200320 |
|
busybox |
mirantis.azurecr.io/stacklight/busybox:1.30 |
|
configmap-reload |
mirantis.azurecr.io/stacklight/configmap-reload:v0.3.0 |
|
curl |
mirantis.azurecr.io/stacklight/curl:7.69.0 |
|
curl-jq |
mirantis.azurecr.io/stacklight/curl-jq:1.5-1 |
|
elasticsearch |
mirantis.azurecr.io/stacklight/elasticsearch:7.6.1 |
|
elasticsearch-curator |
mirantis.azurecr.io/stacklight/curator:5.7.6 |
|
elasticsearch-exporter |
mirantis.azurecr.io/stacklight/elasticsearch_exporter:1.0.2 |
|
fluentd |
mirantis.azurecr.io/stacklight/fluentd:1.10.2-20200609085335 |
|
gce-proxy |
mirantis.azurecr.io/stacklight/gce-proxy:1.11 |
|
grafana |
mirantis.azurecr.io/stacklight/grafana:6.6.2 |
|
k8s-netchecker-agent |
mirantis.azurecr.io/lcm/kubernetes/k8s-netchecker-agent:2019.1 |
|
k8s-netchecker-server |
mirantis.azurecr.io/lcm/kubernetes/k8s-netchecker-server:2019.1 |
|
k8s-sidecar |
mirantis.azurecr.io/stacklight/k8s-sidecar:0.1.178 |
|
kibana |
mirantis.azurecr.io/stacklight/kibana:7.6.1 |
|
kube-state-metrics |
mirantis.azurecr.io/stacklight/kube-state-metrics:v1.9.2 |
|
mcc-metric-collector |
mirantis.azurecr.io/stacklight/mcc-metric-collector:v0.1-20200806113043 |
|
metricbeat |
mirantis.azurecr.io/stacklight/metricbeat:7.6.1 |
|
node-exporter |
mirantis.azurecr.io/stacklight/node-exporter:v1.0.1 |
|
origin-telemeter |
mirantis.azurecr.io/stacklight/origin-telemeter:4.4.0-20200424 |
|
prometheus |
mirantis.azurecr.io/stacklight/prometheus:v2.19.2 |
|
prometheus-blackbox-exporter |
mirantis.azurecr.io/stacklight/blackbox-exporter:v0.14.0 |
|
prometheus-es-exporter |
mirantis.azurecr.io/stacklight/prometheus-es-exporter:v0.5.1-20200313132957 |
|
prometheus-libvirt-exporter |
mirantis.azurecr.io/stacklight/libvirt-exporter:v0.1-20200610164751 |
|
prometheus-memcached-exporter |
mirantis.azurecr.io/stacklight/memcached-exporter:v0.5.0 |
|
prometheus-mysql-exporter |
mirantis.azurecr.io/stacklight/mysqld-exporter:v0.11.0 |
|
prometheus-nginx-exporter |
mirantis.azurecr.io/stacklight/nginx-prometheus-exporter:0.6.0 |
|
prometheus-patroni-exporter |
mirantis.azurecr.io/stacklight/prometheus-patroni-exporter:v0.1-20200428121305 |
|
prometheus-postgres-exporter |
mirantis.azurecr.io/stacklight/prometheus-postgres-exporter:v0.8.0-20200715102834 |
|
prometheus-rabbitmq-exporter |
mirantis.azurecr.io/stacklight/rabbitmq-exporter:v0.29.0 |
|
prometheus-relay |
mirantis.azurecr.io/stacklight/prometheus-relay:v0.3-20200519054052 |
|
pushgateway |
mirantis.azurecr.io/stacklight/pushgateway:v1.2.0 |
|
sf-notifier |
mirantis.azurecr.io/stacklight/sf-notifier:v0.3-20200430122138 |
|
sf-reporter |
mirantis.azurecr.io/stacklight/sf-reporter:v0.1-20200219140217 |
|
spilo |
mirantis.azurecr.io/stacklight/spilo:12-1.6p3 |
|
telegraf |
mirantis.azurecr.io/stacklight/telegraf:v1.9.1-20200806073506 |
|
telemeter-token-auth |
mirantis.azurecr.io/stacklight/telemeter-token-auth:v0.1-20200406175600 |
See also
See also
Patch releases
Since Container Cloud 2.23.2, the release train comprises several patch releases that Mirantis delivers on top of a major release mainly to incorporate security updates as soon as they become available without waiting for the next major release. By significantly reducing the time to provide fixes for Common Vulnerabilities and Exposures (CVE), patch releases protect your clusters from cyber threats and potential data breaches.
Major and patch versions update path
The primary distinction between major and patch product versions lies in the fact that major release versions introduce new functionalities, whereas patch release versions predominantly offer minor product enhancements, mostly CVE resolutions for your clusters.
Depending on your deployment needs, you can either update only between major Cluster releases or apply patch updates between major releases. Choosing the latter option ensures you receive security fixes as soon as they become available. Though, be prepared to update your cluster frequently, approximately once every three weeks. Otherwise, you can update only between major Cluster releases as each subsequent major Cluster release includes patch Cluster release updates of the previous major Cluster release.
Content delivery in major and patch releases
As compared to a major Cluster release update, a patch release update does not involve any public API or LCM changes, major version bumps of MKE or other major components, workloads evacuation. A patch cluster update only may require restart of containers running the Container Cloud controllers, MKE, Ceph, and StackLight services to update base images with related libraries and apply CVE fixes to images. The data plane is not affected.
The following table lists differences between content delivery in major releases as compared to patch releases:
Content |
Major release |
Patch release |
|---|---|---|
Major version upgrade of the major product components including but not limited to Ceph and StackLight 0 |
||
Patch version bumps of MKE and Kubernetes 1 |
||
Container runtime changes including Mirantis Container Runtime and containerd updates |
||
Changes in public API |
||
Changes in the Container Cloud lifecycle management |
||
Host machine changes including host operating system updates and upgrades, kernel updates, and so on |
||
CVE fixes for images |
||
Fixes for known product issues |
Update paths for major vs patch releases
Management clusters obtain patch releases automatically the same way as major releases. Managed clusters use the same update delivery method as for the major Cluster release updates. New patch Cluster releases become available through the Container Cloud web UI after automatic upgrade of a management cluster to the latest patch Cluster release.
You may decide to use only major Cluster releases without updating to patch Cluster releases. In this case, you will perform updates from an N to N+1 major release.
Major Cluster releases include all patch updates of the previous major Cluster release. However, Mirantis recommends applying security fixes using patch releases as soon as they become available to avoid security threats and potentially achieve legal compliance.
If you delay the Container Cloud upgrade and schedule it at a later time as described in Schedule Mirantis Container Cloud updates, make sure to schedule a longer maintenance window as the upgrade queue can include several patch releases along with the major release upgrade.
For the update procedure, refer to Update to a patch version.
Patch update schemes before and since 2.26.5
Starting from Container Cloud 2.26.5 (Cluster releases 16.1.5 and 17.1.5), Mirantis introduces a new update scheme for managed clusters allowing for the update path flexibility.
Since Container Cloud 2.26.5 |
Before Container Cloud 2.26.5 |
|---|---|
The user can update a managed cluster to any patch version in the series even if a newer patch version has been released already. Note In Container Cloud patch releases 2.27.1 and 2.27.2, only the 16.2.x patch Cluster releases will be delivered with an automatic update of management clusters and the possibility to update non-MOSK managed clusters. In parallel, 2.27.1 and 2.27.2 will include new 16.1.x and 17.1.x patches for MOSK 24.1.x. And the first 17.2.x patch Cluster release for MOSK 24.2.x will be delivered in 2.27.3. For details, see Update path for 24.1 and 24.2 series. |
The user cannot update a managed cluster to the intermediate patch version in the series if a newer patch version has been released. For example, when the patch Cluster release 17.0.4 becomes available, you can update from 17.0.1 to 17.0.4 at once, but not from 17.0.1 to 17.0.2. |
The user can always update to the newer major version from the latest patch version of the previous series. Additionally, there will be another possibility of major update during the course of the patch series from the patch version released immediately before the target major version. |
If the cluster starts receiving patch releases, the user must apply the latest patch version in the series to be able to update to the following major release. For example, to obtain the major Cluster release 17.1.0 while using the patch Cluster release 17.0.2, you must update your cluster to the latest patch Cluster release 17.0.4 first. |
Latest supported patch releases
For the cluster versions compatibility, refer to MOSK cluster components compatibility.
- 0
For status descriptions, refer to Cluster support statuses.
Compatibility Matrix
The Release Compatibility Matrix describes the cluster configurations that have been supported by the product over the course of its lifetime and the path a MOSK cluster can take to move from an older configuration to a newer one.
For each MOSK release, the document outlines the versions of the product major components, the valid combinations of these versions, and the way every component is updated or upgraded.
For a more comprehensive list of the product subcomponents and their respective versions included in each MOSK version, refer to Release Notes, or use the Releases section in the management console or API.
MOSK cluster components compatibility
The tables below provides the insight into the versions of the components running on a MOSK cluster.
MOSK cluster |
25.2 (21.0.0) |
|---|---|
Release date |
2025-09-23 |
Mirantis Kubernetes Engine |
3.7.24-mosk-1 3 |
Kubernetes |
1.30 |
Mirantis Container Runtime |
25.0.12 |
Ubuntu |
22.04 |
Linux Kernel 0 |
5.15.0-153-generic |
Mirantis StackLight 1 |
0.18.5 |
OpenStack 2 |
Epoxy,
Caracal
|
OpenSDN |
24.1 |
Ceph |
Squid 19.2.3-4.cve |
- 0
The kernel version of the host operating system validated by Mirantis and confirmed to be working for the supported use cases. Usage of custom kernel versions or third-party vendor-provided kernels, such as FIPS-enabled, assume full responsibility for validating the compatibility of components in such environments.
- 1
The StackLight version is represented by the tag of the
stacklightHelm chart, which includes information about all StackLight components.- 2
The LTS duration of an OpenStack version is two years. For support timeline for different OpenStack versions, refer to OpenStack support cycle.
- 3
This MKE release is available exclusively for MOSK. For further details, contact Mirantis support.
Management cluster components compatibility
The following table outlines the compatibility matrix of the components included in the management cluster.
Management cluster |
2.30.0 (current) |
|---|---|
Release date |
2025-09-23 |
Mirantis Kubernetes Engine |
3.7.24-mosk-1 0 |
Kubernetes |
1.30 |
Mirantis Container Runtime |
25.0.12 |
Ubuntu |
24.04 |
Linux Kernel 1 |
6.8.0-79-generic |
Mirantis StackLight 2 |
0.18.5 |
- 0
This MKE release is available exclusively for MOSK. For further details, contact Mirantis support.
- 1
The kernel version of the host operating system is validated by Mirantis and confirmed to be working for the supported use cases. Usage of custom kernel versions or third-party vendor-provided kernels, such as FIPS-enabled, assume full responsibility for validating the compatibility of components in such environments.
- 2
The StackLight version is represented by the tag of the
stacklightHelm chart, which includes information about all StackLight components.
Cluster versions compatibility
The following table provides the full support matrix for MOSK management and Cluster release versions.
Legend
Symbol |
Definition |
|---|---|
Latest supported cluster version to use for cluster deployment or update |
|
Deprecated cluster version that you must update to the latest supported cluster version |
|
Cluster version is not included in the product release yet. |
If the version you are looking for is not included in the table, it means that the version has become usupported, which prevents the automatic update of a management cluster. To resume receiving management cluster updates, you must update your MOSK cluster first.
For the detailed status description, refer to Cluster support statuses.
Release |
MOSK management version |
2.30.0 (current) |
|---|---|---|
Release history |
Release date |
2025-09-23 |
MOSK cluster major |
25.2 (21.0.0) |
|
25.1 (17.4.0) |
||
MOSK management cluster major |
20.0.0 |
|
MOSK cluster patch |
25.1.x (17.4.x) |
17.4.6 |
MOSK management cluster patch |
16.4.x |
16.4.6 |
The following drop-down table provides the support matrix for MOSK management and Cluster releases of 2.29.x series.
MOSK management 2.29 series
Release |
MOSK management version |
2.29.6 (current) |
2.29.5 |
2.29.4 |
2.29.3 |
2.29.2 |
2.29.1 |
2.29.0 |
|---|---|---|---|---|---|---|---|---|
Release history |
Release date |
2025-08-11 |
2025-07-14 |
2025-06-16 |
2025-05-20 |
2025-04-22 |
2025-03-26 |
2025-03-11 |
MOSK cluster major |
25.1 (17.4.0) |
|||||||
24.3 (17.3.0) |
||||||||
MOSK management cluster major |
16.4.0 |
|||||||
MOSK cluster patch |
25.1.x (17.4.x) |
17.4.6 |
||||||
24.3.x (17.3.x) |
17.3.10
17.3.9
17.3.8
17.3.7
17.3.6
17.3.5
17.3.4
|
17.3.10
17.3.9
17.3.8
17.3.7
17.3.6
17.3.5
17.3.4
|
17.3.9
17.3.8
17.3.7
17.3.6
17.3.5
17.3.4
|
17.3.8
17.3.7
17.3.6
17.3.5
17.3.4
|
17.3.7
17.3.6
17.3.5
17.3.4
|
17.3.6
17.3.5
17.3.4
|
17.3.5
17.3.4
|
|
MOSK management cluster patch |
16.4.x |
16.4.6
16.4.5
16.4.4
16.4.3
16.4.2
16.4.1
|
16.4.5
16.4.4
16.4.3
16.4.2
16.4.1
|
16.4.4
16.4.3
16.4.2
16.4.1
|
16.4.3
16.4.2
16.4.1
|
16.4.2
16.4.1
|
16.4.1
|
|
16.3.x |
16.3.10
16.3.9
16.3.8
16.3.7
16.3.6
16.3.5
16.3.4
|
16.3.10
16.3.9
16.3.8
16.3.7
16.3.6
16.3.5
16.3.4
|
16.3.9
16.3.8
16.3.7
16.3.6
16.3.5
16.3.4
|
16.3.8
16.3.7
16.3.6
16.3.5
16.3.4
|
16.3.7
16.3.6
16.3.5
16.3.4
|
16.3.6
16.3.5
16.3.4
|
16.3.5
16.3.4
|
MOSK cluster update schema
The table below provides the paths for the MOSK cluster update between series. To interpret the data correctly, read the table horizontally. For example, if your current cluster version is 24.3, you can update directly to 25.1. If you have already received the 24.3.2 patch, an update to 25.1 is also possible. However, updating to the 25.1 series is not supported if you current version is between 24.3.3 and 24.3.6. In that case, the next available update window is from 24.3.7 to 25.1.1.
MOSK 24.1 series |
MOSK 24.2 series |
MOSK 24.3 series |
MOSK 25.1 series |
MOSK 25.2 series |
|---|---|---|---|---|
24.1.4 |
||||
24.1.5 |
||||
24.1.5 |
24.2 |
24.3 |
25.1 |
25.2 |
24.1.6 |
||||
24.1.7 |
||||
24.1.7 |
24.2.1 |
|||
24.2.2 |
24.3 |
25.1 |
25.2 |
|
24.2.3 |
||||
24.2.4 |
||||
24.2.5 |
24.3.1 |
|||
24.3.2 |
25.1 |
25.2 |
||
24.3.3 |
||||
24.3.4 |
||||
24.3.5 |
||||
24.3.6 |
||||
24.3.7 |
25.1.1 |
25.2 |
Compatibility matrix for older releases
This section includes compatibility matrices for MOSK management clusters and MOSK clusters for the older product versions and in the deprecated format.
MOSK cluster components compatibility for older releases
The following drop-down tables include compatibility matrices for MOSK clusters 25.1 and older series.
25.1 series compatibility matrix
MOSK cluster |
25.1 (17.4.0) |
25.1.1 (17.4.6) |
|---|---|---|
Release date |
2025-03-11 |
2025-08-11 |
Mirantis Kubernetes Engine |
3.7.19 |
3.7.24 |
Kubernetes |
1.27 |
1.27 |
Mirantis Container Runtime |
25.0.8 |
25.0.8 |
Ubuntu |
22.04 |
22.04 |
Linux Kernel 3 |
5.15.0-131-generic |
5.15.0-143-generic |
Mirantis StackLight 4 |
0.17.2 |
0.17.15 |
OpenStack 2 |
Caracal,
Antelope Deprecated
|
Caracal,
Antelope Deprecated
|
Tungsten Fabric |
21.4,
OpenSDN 24.1 TechPreview
|
21.4,
OpenSDN 24.1 TechPreview
|
Ceph |
Reef 18.2.4-12.cve |
Reef 18.2.7-3.cve |
24.3 series compatibility matrix
MOSK |
24.3.7 |
24.3.6 |
24.3.5 |
24.3.4 |
24.3.3 |
24.3.2 |
24.3.1 |
24.3 |
|---|---|---|---|---|---|---|---|---|
Release date |
July 14, 2025 |
June 16, 2025 |
May 20, 2025 |
April 22, 2025 |
March 26, 2025 |
February 03, 2025 |
January 06, 2025 |
October 16, 2024 |
Container Cloud |
2.29.5 |
2.29.4 |
2.29.3 |
2.29.2 |
2.29.1 |
2.28.5 |
2.28.4 |
2.28 |
Release support status 0 |
Supported |
Deprecated |
Deprecated |
Deprecated |
Deprecated |
Deprecated |
Deprecated |
Deprecated |
Deprecated major MOSK 1 |
24.2 |
24.2 |
24.2 |
24.2 |
24.2 |
24.2 |
24.2 |
24.2 |
MOSK cluster |
17.3.10 |
17.3.9 |
17.3.8 |
17.3.7 |
17.3.6 |
17.3.5 |
17.3.4 |
17.3.0 |
MKE |
3.7.23 with k8s 1.27 |
3.7.23 with k8s 1.27 |
3.7.22 with K8s 1.27 |
3.7.20 with K8s 1.27 |
3.7.20 with K8s 1.27 |
3.7.18 with K8s 1.27 |
3.7.17 with K8s 1.27 |
3.7.12 with K8s 1.27 |
OpenStack 2 |
Caracal,
Antelope
|
Caracal,
Antelope
|
Caracal,
Antelope
|
Caracal,
Antelope
|
Caracal,
Antelope
|
Caracal,
Antelope
|
Caracal,
Antelope
|
Caracal,
Antelope
|
Tungsten Fabric |
21.4 |
21.4 |
21.4 |
21.4 |
21.4 |
21.4 |
21.4 |
21.4 |
Ceph |
Reef 18.2.7-2.cve |
Reef 18.2.7-2.cve |
Reef 18.2.7-1.cve |
Reef 18.2.4-13.cve |
Reef 18.2.4-13.cve |
Reef 18.2.4-11.cve |
Reef 18.2.4-11.cve |
Reef 18.2.4-6.cve |
Operating system |
Ubuntu 22.04 |
Ubuntu 22.04 |
Ubuntu 22.04 |
Ubuntu 22.04 |
Ubuntu 22.04 |
Ubuntu 22.04,
Ubuntu 20.04 Deprecated
|
Ubuntu 22.04,
Ubuntu 20.04 Deprecated
|
Ubuntu 22.04,
Ubuntu 20.04 Deprecated
|
Linux kernel 3 |
5.15.0-142-generic |
5.15.0-140-generic |
5.15.0-135-generic |
5.15.0-135-generic |
5.15.0-134-generic |
5.15.0-130-generic |
5.15.0-126-generic |
5.15.0-119-generic |
24.2 series compatibility matrix
MOSK |
24.2.5 |
24.2.4 |
24.2.3 |
24.2.2 |
24.2.1 |
24.2 |
|---|---|---|---|---|---|---|
Release date |
December 09, 2024 |
November 18, 2024 |
October 30, 2024 |
September 16, 2024 |
August 27, 2024 |
July 02, 2024 |
Container Cloud |
2.28.3 |
2.28.2 |
2.28.1 |
2.27.4 |
2.27.3 |
2.27.0 |
Release support status 0 |
Unsupported |
Unsupported |
Unsupported |
Unsupported |
Unsupported |
Unsupported |
Deprecated major MOSK 1 |
24.1 |
24.1 |
24.1 |
24.1 |
24.1 |
24.1 |
MOSK cluster |
17.2.7 |
17.2.6 |
17.2.5 |
17.2.4 |
17.2.3 |
17.2.0 |
MKE |
3.7.16 with K8s 1.27 |
3.7.16 with K8s 1.27 |
3.7.15 with K8s 1.27 |
3.7.12 with K8s 1.27 |
3.7.12 with K8s 1.27 |
3.7.8 with K8s 1.27 |
OpenStack 2 |
Caracal TechPreview,
Antelope,
Yoga Deprecated
|
Caracal TechPreview,
Antelope,
Yoga Deprecated
|
Caracal TechPreview,
Antelope,
Yoga Deprecated
|
Caracal TechPreview,
Antelope,
Yoga Deprecated
|
Caracal TechPreview,
Antelope,
Yoga Deprecated
|
Caracal TechPreview,
Antelope,
Yoga Deprecated
|
Tungsten Fabric |
21.4 |
21.4 |
21.4 |
21.4 |
21.4 |
21.4 |
Ceph |
Reef 18.2.4-10.cve |
Reef 18.2.4-8.cve |
Reef 18.2.4-7.cve |
Reef 18.2.4-4.cve |
Reef 18.2.4-3.cve |
Reef 18.2.3-1.release |
Operating system |
Ubuntu 20.04 |
Ubuntu 20.04 |
Ubuntu 20.04 |
Ubuntu 20.04 |
Ubuntu 20.04 |
Ubuntu 20.04 |
Linux kernel 3 |
5.15.0-125-generic |
5.15.0-124-generic |
5.15.0-122-generic |
5.15.0-118-generic |
5.15.0-117-generic |
5.15.0-107-generic |
24.1 series compatibility matrix
MOSK |
24.1.7 |
24.1.6 |
24.1.5 |
24.1.4 |
24.1.3 |
24.1.2 |
24.1.1 |
24.1 |
|---|---|---|---|---|---|---|---|---|
Release date |
Aug 05, 2024 |
July 16, 2024 |
June 18, 2024 |
May 20, 2024 |
Apr 29, 2024 |
Apr 08, 2024 |
Mar 20, 2024 |
Mar 04, 2024 |
Container Cloud |
2.27.2 |
2.27.1 |
2.26.5 |
2.26.4 |
2.26.3 |
2.26.2 |
2.26.1 |
2.26.0 |
Release support status 0 |
Unsupported |
Unsupported |
Unsupported |
Unsupported |
Unsupported |
Unsupported |
Unsupported |
Unsupported |
Deprecated major MOSK 1 |
24.1 |
24.1 |
23.3 |
23.3 |
23.3 |
23.3 |
23.3 |
23.3 |
MOSK cluster |
17.1.7 |
17.1.6 |
17.1.5 |
17.1.4 |
17.1.3 |
17.1.2 |
17.1.1 |
17.1.0 |
MKE |
3.7.11 with K8s 1.27 |
3.7.10 with K8s 1.27 |
3.7.8 with K8s 1.27 |
3.7.8 with K8s 1.27 |
3.7.7 with K8s 1.27 |
3.7.6 with K8s 1.27 |
3.7.5 with K8s 1.27 |
3.7.5 with K8s 1.27 |
OpenStack 2 |
Antelope, Yoga |
Antelope, Yoga |
Antelope, Yoga |
Antelope, Yoga |
Antelope, Yoga |
Antelope, Yoga |
Antelope, Yoga |
Antelope, Yoga |
Tungsten Fabric |
21.4 |
21.4 |
21.4 |
21.4 |
21.4 |
21.4 |
21.4 |
21.4 |
Ceph |
Quincy v17.2.7-15.cve |
Quincy v17.2.7-15.cve |
Quincy 17.2.7-13.cve |
Quincy 17.2.7-12.cve |
Quincy 17.2.7-11.cve |
Quincy 17.2.7-10.release |
Quincy 17.2.7-9.release |
Quincy 17.2.7-8.release |
Operating system |
Ubuntu 20.04 |
Ubuntu 20.04 |
Ubuntu 20.04 |
Ubuntu 20.04 |
Ubuntu 20.04 |
Ubuntu 20.04 |
Ubuntu 20.04 |
Ubuntu 20.04 |
Linux kernel 3 |
5.15.0-113-generic |
5.15.0-113-generic |
5.15.0-107-generic |
5.15.0-105-generic |
5.15.0-102-generic |
5.15.0-101-generic |
5.15.0-97-generic |
5.15.0-92-generic |
23.3 series compatibility matrix
MOSK |
23.3.4 patch |
23.3.3 patch |
23.3.2 patch |
23.3.1 patch |
23.3 |
|---|---|---|---|---|---|
Release date |
Jan 10, 2024 |
Dec 18, 2023 |
Dec 05, 2023 |
Nov 27, 2023 |
Nov 06, 2023 |
Container Cloud |
2.25.4 - Jan 10, 2024 |
2.25.3 - Dec 18, 2023 |
2.25.2 - Dec 05, 2023 |
2.25.1 - Nov 27, 2023 |
2.25 - Nov 06, 2023 |
Release support status 0 |
Deprecated |
Unsupported |
Unsupported |
Unsupported |
Deprecated |
Deprecated major MOSK 1 |
23.2 |
23.2 |
23.2 |
23.2 |
23.2 |
MOSK cluster |
17.0.4 |
17.0.3 |
17.0.2 |
17.0.1 |
17.0.0 |
MKE |
3.7.3 with K8s 1.27 |
3.7.3 with K8s 1.27 |
3.7.2 with K8s 1.27 |
3.7.2 with K8s 1.27 |
3.7.1 with K8s 1.27 |
OpenStack 2 |
Yoga,
Antelope TechPreview
|
Yoga,
Antelope TechPreview
|
Yoga,
Antelope TechPreview
|
Yoga,
Antelope TechPreview
|
Yoga,
Antelope TechPreview
|
Tungsten Fabric |
21.4 |
21.4 |
21.4 |
21.4 |
21.4 |
Ceph |
Quincy 17.2.6-8.cve |
Quincy 17.2.6-8.cve |
Quincy 17.2.6-5.cve |
Quincy 17.2.6-2.cve |
Quincy 17.2.6-cve-1 |
Operating system |
Ubuntu 20.04 |
Ubuntu 20.04 |
Ubuntu 20.04 |
Ubuntu 20.04 |
Ubuntu 20.04 |
Linux kernel 3 |
5.15.0-86-generic |
5.15.0-86-generic |
5.15.0-86-generic |
5.15.0-86-generic |
5.15.0-86-generic |
23.2 series compatibility matrix
MOSK |
23.2.3 patch |
23.2.2 patch |
23.2.1 patch |
23.2 |
|---|---|---|---|---|
Release date |
Sept 26, 2023 |
Sept 14, 2023 |
Aug 29, 2023 |
Aug 21, 2023 |
Container Cloud |
2.24.5 - Sept 26, 2023 |
2.24.4 - Sept 14, 2023 |
2.24.3 - Aug 28, 2023 |
2.24.2 - Aug 21, 2023
2.24.3 - Aug 28, 2023
|
Release support status 0 |
Unsupported |
Unsupported |
Unsupported |
Unsupported |
Deprecated major MOSK 1 |
23.1 |
23.1 |
23.1 |
23.1 |
MOSK cluster |
15.0.4 |
15.0.3 |
15.0.2 |
15.0.1 |
MKE |
3.6.6 with K8s 1.24 |
3.6.6 with K8s 1.24 |
3.6.6 with K8s 1.24 |
3.6.5 with K8s 1.24 |
OpenStack 2 |
Yoga,
Victoria Deprecated
|
Yoga,
Victoria Deprecated
|
Yoga,
Victoria Deprecated
|
Yoga,
Victoria Deprecated
|
Tungsten Fabric |
21.4 |
21.4 |
21.4 |
21.4 |
Ceph |
Quincy 17.2.6-cve-1 |
Quincy 17.2.6-cve-1 |
Quincy 17.2.6-cve-1 |
Quincy 17.2.6-rel-5 |
Operating system |
Ubuntu 20.04,
Ubuntu 18.04 Deprecated
|
Ubuntu 20.04,
Ubuntu 18.04 Deprecated
|
Ubuntu 20.04,
Ubuntu 18.04 Deprecated
|
Ubuntu 20.04,
Ubuntu 18.04 Deprecated
|
Linux kernel 3 |
5.4.0-150-generic |
5.4.0-150-generic |
5.4.0-150-generic |
5.4.0-150-generic |
23.1 series compatibility matrix
MOSK version |
23.1.4 patch |
23.1.3 patch |
23.1.2 patch |
23.1.1 patch |
23.1 |
|---|---|---|---|---|---|
Release date |
Jun 05, 2023 |
May 22, 2023 |
May 04, 2023 |
Apr 20, 2023 |
Apr 04, 2023 |
Container Cloud |
2.24.1 - Jul 27, 2023
2.24.0 - Jul 20, 2023
2.23.5 - Jun 05, 2023
|
2.23.4 - May 22, 2023 |
2.23.3 - May 04, 2023 |
2.23.2 - Apr 20, 2023 |
2.23.3 - May 04, 2023
2.23.2 - Apr 20, 2023
2.23.1 - Apr 04, 2023
|
Release support status 0 |
Unsupported |
Unsupported |
Unsupported |
Unsupported |
Unsupported |
Deprecated major MOSK 1 |
22.5 |
22.5 |
22.5 |
22.5 |
22.5 |
MOSK cluster |
12.7.4 |
12.7.3 |
12.7.2 |
12.7.1 |
12.7.0 |
MKE |
3.5.7 with K8s 1.21 |
3.5.7 with K8s 1.21 |
3.5.7 with K8s 1.21 |
3.5.7 with K8s 1.21 |
3.5.7 with K8s 1.21 |
OpenStack 2 |
Yoga,
Victoria
|
Yoga,
Victoria
|
Yoga,
Victoria
|
Yoga,
Victoria
|
Yoga,
Victoria
|
Tungsten Fabric |
21.4 |
21.4 |
21.4 |
21.4 |
21.4 |
Ceph |
Pacific 16.2.11-cve-4 |
Pacific 16.2.11-cve-4 |
Pacific 16.2.11-cve-4 |
Pacific 16.2.11-cve-2 |
Pacific 16.2.11 |
Operating system |
Ubuntu 20.04 Greenfield,
Ubuntu 18.04
|
Ubuntu 20.04 Greenfield,
Ubuntu 18.04
|
Ubuntu 20.04 Greenfield,
Ubuntu 18.04
|
Ubuntu 20.04 Greenfield,
Ubuntu 18.04
|
Ubuntu 20.04 Greenfield,
Ubuntu 18.04
|
Linux kernel 3 |
5.4.0-137-generic |
5.4.0-137-generic |
5.4.0-137-generic |
5.4.0-137-generic |
5.4.0-137-generic |
22.5 compatibility matrix
MOSK |
22.5 |
|---|---|
Release date |
Dec 19, 2022 |
Container Cloud |
2.23.0 - Mar 7, 2023,
2.22.0 - Jan 31, 2023,
2.21.1 - Dec 19, 2022
|
Release support status 0 |
Unupported |
Deprecated major MOSK 1 |
22.4 |
MOSK cluster |
12.5.0 |
MKE |
3.5.5 with K8s 1.21 |
OpenStack 2 |
Yoga, Victoria |
Tungsten Fabric |
2011,
21.4 TechPreview
|
Ceph |
Octopus 15.2.17 |
Operating system |
Ubuntu 20.04 Greenfield,
Ubuntu 18.04
|
Linux kernel 3 |
5.4.0-125-generic |
Footnotes
- 0(1,2,3,4,5,6,7)
For the cluster support statuses description, refer to Cluster support statuses.
- 1(1,2,3,4,5,6,7)
Mirantis Container Cloud will update itself automatically as long as the release of each managed cluster has either supported or deprecated status in the new version of Container Cloud.
A deprecated cluster release becomes unsupported in one of the following Container Cloud releases. Therefore, we strongly recommend that you update your deprecated MOSK clusters to the latest supported version.
- 2(1,2,3,4,5,6,7,8)
The LTS duration of an OpenStack version is two years. For support timeline for different OpenStack versions, refer to OpenStack support cycle.
- 3(1,2,3,4,5,6,7,8)
The kernel version of the host operating system validated by Mirantis and confirmed to be working for the supported use cases. Usage of custom kernel versions or third-party vendor-provided kernels, such as FIPS-enabled, assume full responsibility for validating the compatibility of components in such environments.
- 4
The StackLight version is represented by the tag of the
stacklightHelm chart, which includes information about all StackLight components.
Management cluster components compatibility for older releases
The following drop-down tables include compatibility matrices for MOSK management cluster old release series. For the latest supported management cluster releases, see Management cluster components compatibility.
MOSK management 2.29.x series
Management cluster |
2.29.6 |
2.29.5 |
2.29.4 |
2.29.3 |
2.29.2 |
2.29.1 |
2.29.0 |
|---|---|---|---|---|---|---|---|
Release date |
2025-08-11 |
2025-07-14 |
2025-06-16 |
2025-05-20 |
2025-04-22 |
2025-03-26 |
2025-03-11 |
Mirantis Kubernetes Engine |
3.7.24 |
3.7.23 |
3.7.23 |
3.7.22 |
3.7.20 |
3.7.20 |
3.7.19 |
Kubernetes |
1.27 |
1.27 |
1.27 |
1.27 |
1.27 |
1.27 |
1.27 |
Mirantis Container Runtime |
25.0.8 |
25.0.8 |
25.0.8 12 |
25.0.8 12 |
25.0.8 11 |
25.0.8 11 |
25.0.8 |
Ubuntu |
24.04 |
22.04 |
22.04 |
22.04 |
22.04 |
22.04 |
22.04 |
Linux Kernel 8 |
5.15.0-143-generic |
5.15.0-142-generic |
5.15.0-140-generic |
5.15.0-135-generic |
5.15.0-135-generic |
5.15.0-134-generic |
5.15.0-131-generic |
Mirantis StackLight 13 |
0.17.15 |
0.17.12 |
0.17.10 |
0.17.9 |
0.17.7 |
0.17.4 |
0.17.2 |
Container Cloud compatibility matrix 2.28.x
Release |
Container Cloud |
2.28.5 |
2.28.4 |
2.28.3 |
2.28.2 |
2.28.1 |
2.28.0 |
|---|---|---|---|---|---|---|---|
Release history |
Release date |
Feb 03, 2025 |
Jan 06, 2025 |
Dec 09, 2024 |
Nov 18, 2024 |
Oct 30, 2024 |
Oct 16, 2024 |
Major Cluster releases (managed) |
17.3.0 +
MOSK 24.3
MKE 3.7.12
|
||||||
17.2.0 +
MOSK 24.2
MKE 3.7.8
|
|||||||
17.1.0 +
MOSK 24.1
MKE 3.7.5
|
|||||||
16.3.0
MKE 3.7.12
|
|||||||
16.2.0
MKE 3.7.8
|
|||||||
16.1.0
MKE 3.7.5
|
|||||||
Patch Cluster releases (managed) |
17.3.x + MOSK 24.3.x |
17.3.5
17.3.4
|
17.3.4
|
||||
17.2.x + MOSK 24.2.x |
17.2.7
17.2.6
17.2.5
17.2.4
17.2.3
|
17.2.7
17.2.6
17.2.5
17.2.4
17.2.3
|
17.2.6
17.2.5
17.2.4
17.2.3
|
17.2.5
17.2.4
17.2.3
|
17.2.4
17.2.3
|
||
17.1.x + MOSK 24.1.x |
|||||||
16.3.x |
16.3.5
16.3.4
16.3.3
16.3.2
16.3.1
|
16.3.4
16.3.3
16.3.2
16.3.1
|
16.3.3
16.3.2
16.3.1
|
16.3.2
16.3.1
|
16.3.1
|
||
16.2.x |
16.2.7
16.2.6
16.2.5
16.2.4
16.2.3
|
16.2.7
16.2.6
16.2.5
16.2.4
16.2.3
|
16.2.6
16.2.5
16.2.4
16.2.3
|
16.2.5
16.2.4
16.2.3
|
16.2.4
16.2.3
16.2.2
16.2.1
|
||
16.1.x |
|||||||
Fully managed cluster |
Mirantis Kubernetes Engine (MKE) |
3.7.18
17.3.5, 16.3.5
|
3.7.17
17.3.4, 16.3.4
|
3.7.16
17.2.7, 16.3.3, 16.2.7
|
3.7.16
17.2.6, 16.3.2, 16.2.6
|
3.7.15
17.2.5, 16.3.1, 16.2.5
|
3.7.12
17.3.0, 16.3.0
|
Container orchestration |
Kubernetes |
1.27 17.x, 16.x |
1.27 17.x, 16.x |
1.27 17.x, 16.x |
1.27 17.x, 16.x |
1.27 17.x, 16.x |
1.27 17.x, 16.x |
Container runtime |
Mirantis Container Runtime (MCR) |
23.0.15
17.3.5, 16.3.5
23.0.14
17.3.0, 16.3.0
|
23.0.15
17.3.4, 16.3.4
23.0.14
17.3.0, 16.3.0
|
23.0.14
17.3.0, 16.3.x
23.0.11
17.2.7, 16.2.7
|
23.0.14
17.3.0, 16.3.x
23.0.11
17.2.6, 16.2.6
|
23.0.14
17.3.0, 16.3.x
23.0.11
17.2.5, 16.2.5
|
23.0.14
17.3.0, 16.3.0
23.0.11
17.2.4, 16.2.4
|
OS distributions |
Ubuntu |
22.04 9 |
22.04 9 |
22.04 9 |
22.04 9 |
22.04 9 |
22.04 9 |
Infrastructure platform |
Bare metal 8 |
kernel 5.15.0-130-generic Jammy, Focal
|
kernel 5.15.0-126-generic Jammy, Focal
|
kernel 5.15.0-125-generic Jammy, Focal
|
kernel 5.15.0-124-generic Jammy, Focal
|
kernel 5.15.0-122-generic Jammy, Focal
|
kernel 5.15.0-119-generic Jammy, Focal
|
MOSK Yoga or Antelope with OVS 3 |
|||||||
Queens
Yoga
Antelope
|
Queens
Yoga
Antelope
|
Queens
Yoga
Antelope
|
Queens
Yoga
Antelope
|
Queens
Yoga
Antelope
|
Queens
Yoga
Antelope
|
||
Software defined storage |
Ceph |
18.2.4-11.cve
17.3.5, 16.3.5
|
18.2.4-11.cve
17.3.4, 16.3.4
|
18.2.4-10.cve
17.2.7, 16.3.3, 16.2.7
|
18.2.4-8.cve
17.2.6, 16.3.2, 16.2.6
|
18.2.4-6.cve
16.3.1
18.2.4-7.cve
17.2.5, 16.2.5
|
18.2.4-6.cve
17.3.0, 16.3.0
|
Rook |
1.13.5-28
17.3.5, 16.3.5
|
1.13.5-28
17.3.4, 16.3.4
|
1.13.5-26
17.2.7, 16.3.3, 16.2.7
|
1.13.5-23
17.2.6, 16.3.2, 16.2.6
|
1.13.5-21
16.3.1
1.13.5-22
17.2.5, 16.2.5
|
1.13.5-21
17.3.0, 16.3.0
|
|
Logging, monitoring, and alerting |
StackLight |
Container Cloud compatibility matrix 2.27.x
Release |
Container Cloud |
2.27.4 |
2.27.3 |
2.27.2 |
2.27.1 |
2.27.0 |
|---|---|---|---|---|---|---|
Release history |
Release date |
Sep 16, 2024 |
Aug 27, 2024 |
Aug 05, 2024 |
July 16, 2024 |
July 02, 2024 |
Major Cluster releases (managed) |
17.2.0 +
MOSK 24.2
MKE 3.7.8
|
|||||
17.1.0 +
MOSK 24.1
MKE 3.7.5
|
||||||
16.2.0
MKE 3.7.8
|
||||||
16.1.0
MKE 3.7.5
|
||||||
Patch Cluster releases (managed) |
17.2.x + MOSK 24.2.x |
17.2.4
17.2.3
|
17.2.3
|
|||
17.1.x + MOSK 24.1.x |
17.1.7+24.1.7
17.1.6+24.1.6
17.1.5+24.1.5
|
17.1.7+24.1.7
17.1.6+24.1.6
17.1.5+24.1.5
|
17.1.7+24.1.7
17.1.6+24.1.6
17.1.5+24.1.5
|
17.1.6+24.1.6
17.1.5+24.1.5
|
17.1.5+24.1.5
|
|
16.2.x |
16.2.4
16.2.3
16.2.2
16.2.1
|
16.2.3
16.2.2
16.2.1
|
16.2.2
16.2.1
|
16.2.1
|
||
16.1.x |
16.1.7
16.1.6
16.1.5
|
16.1.7
16.1.6
16.1.5
|
16.1.7
16.1.6
16.1.5
|
16.1.6
16.1.5
|
16.1.5
|
|
Fully managed cluster |
Mirantis Kubernetes Engine (MKE) |
3.7.12
17.2.4, 16.2.4
|
3.7.12
17.2.3, 16.2.3
|
3.7.11
17.1.7, 16.2.2, 16.1.7
|
3.7.10
17.1.6, 16.2.1, 16.1.6
|
3.7.8
17.2.0, 16.2.0
|
Attached managed cluster |
MKE 7 |
3.6.8
19.1.0
3.6.1
19.0.0
3.5.5
18.1.0
3.5.3
18.0.0
|
3.6.8
19.1.0
3.6.1
19.0.0
3.5.5
18.1.0
3.5.3
18.0.0
|
3.6.8
19.1.0
3.6.1
19.0.0
3.5.5
18.1.0
3.5.3
18.0.0
|
||
Container orchestration |
Kubernetes |
1.27 17.x, 16.x |
1.27 17.x, 16.x |
1.27 17.x, 16.x |
1.27 17.x, 16.x |
1.27 17.x, 16.x |
Container runtime |
Mirantis Container Runtime (MCR) |
23.0.11 17.2.x, 16.2.x |
||||
OS distributions |
Ubuntu |
22.04 9
20.04
|
22.04 9
20.04
|
22.04 9
20.04
|
22.04 9
20.04
|
22.04 9
20.04
|
Infrastructure platform |
Bare metal 8 |
kernel 5.15.0-119-generic Jammy
kernel 5.15.0-118-generic Focal
|
kernel 5.15.0-117-generic Jammy, Focal
|
kernel 5.15.0-116-generic Jammy
kernel 5.15.0-113-generic Focal
|
kernel 5.15.0-113-generic
|
kernel 5.15.0-107-generic
|
MOSK Yoga or Antelope with OVS 3 |
||||||
Queens
Yoga
Antelope
|
Queens
Yoga
Antelope
|
Queens
Yoga
Antelope
|
Queens
Yoga
Antelope
|
Queens
Yoga
Antelope
|
||
VMware vSphere 5 |
7.0, 6.7 |
7.0, 6.7 |
7.0, 6.7 |
|||
Software defined storage |
Ceph |
18.2.4-4.cve
17.2.4, 16.2.4
|
18.2.4-3.cve
17.2.3, 16.2.3
|
18.2.3-2.cve
16.2.2
17.2.7-15.cve
17.1.7, 16.1.7
|
18.2.3-2.cve
16.2.1
17.2.7-15.cve
17.1.6, 16.1.6
|
18.2.3-1.release
17.2.0, 16.2.0
|
Rook |
1.13.5-19
17.2.4, 16.2.4
|
1.13.5-18
17.2.3, 16.2.3
|
1.13.5-16
16.2.2
1.12.10-21
17.1.7, 16.1.7
|
1.13.5-16
16.2.1
1.12.10-21
17.1.6, 16.1.6
|
1.13.5-15
17.2.0, 16.2.0
|
|
Logging, monitoring, and alerting |
StackLight |
Container Cloud compatibility matrix 2.26.x
Release |
Container Cloud |
2.26.5 |
2.26.4 |
2.26.3 |
2.26.2 |
2.26.1 |
2.26.0 |
|---|---|---|---|---|---|---|---|
Release history |
Release date |
June 18, 2024 |
May 20, 2024 |
Apr 29, 2024 |
Apr 08, 2024 |
Mar 20, 2024 |
Mar 04, 2024 |
Major Cluster releases (managed) |
17.1.0 +
MOSK 24.1
MKE 3.7.5
|
||||||
17.0.0 +
MOSK 23.3
MKE 3.7.1
|
|||||||
16.1.0
MKE 3.7.5
|
|||||||
16.0.0
MKE 3.7.1
|
|||||||
Patch Cluster releases (managed) |
17.1.x + MOSK 24.1.x |
17.1.5+24.1.5
17.1.4+24.1.4
17.1.3+24.1.3
17.1.2+24.1.2
17.1.1+24.1.1
|
17.1.4+24.1.4
17.1.3+24.1.3
17.1.2+24.1.2
17.1.1+24.1.1
|
17.1.3+24.1.3
17.1.2+24.1.2
17.1.1+24.1.1
|
17.1.2+24.1.2
17.1.1+24.1.1
|
17.1.1+24.1.1
|
|
17.0.x + MOSK 23.3.x |
17.0.4+23.3.4
|
17.0.4+23.3.4
|
17.0.4+23.3.4
|
17.0.4+23.3.4
|
17.0.4+23.3.4
|
17.0.4+23.3.4
17.0.3+23.3.3
17.0.2+23.3.2
17.0.1+23.3.1
|
|
16.1.x |
16.1.5
16.1.4
16.1.3
16.1.2
16.1.1
|
16.1.4
16.1.3
16.1.2
16.1.1
|
16.1.3
16.1.2
16.1.1
|
16.1.2
16.1.1
|
16.1.1
|
||
16.0.x |
16.0.4
|
16.0.4
|
16.0.4
|
16.0.4
|
16.0.4
|
16.0.4
16.0.3
16.0.2
16.0.1
|
|
Fully managed cluster |
Mirantis Kubernetes Engine (MKE) |
3.7.8
17.1.5, 16.1.5
|
3.7.8
17.1.4, 16.1.4
|
3.7.7
17.1.3, 16.1.3
|
3.7.6
17.1.2, 16.1.2
|
3.7.5
17.1.1, 16.1.1
|
3.7.5
17.1.0, 16.1.0
|
Attached managed cluster |
MKE 7 |
3.6.8
19.1.0
3.6.1
19.0.0
3.5.5
18.1.0
3.5.3
18.0.0
|
3.6.8
19.1.0
3.6.1
19.0.0
3.5.5
18.1.0
3.5.3
18.0.0
|
3.6.8
19.1.0
3.6.1
19.0.0
3.5.5
18.1.0
3.5.3
18.0.0
|
3.6.8
19.1.0
3.6.1
19.0.0
3.5.5
18.1.0
3.5.3
18.0.0
|
3.6.8
19.1.0
3.6.1
19.0.0
3.5.5
18.1.0
3.5.3
18.0.0
|
3.6.8
19.1.0
3.6.1
19.0.0
3.5.5
18.1.0
3.5.3
18.0.0
|
Container orchestration |
Kubernetes |
1.27 17.1.x, 16.1.x |
1.27 17.1.x, 16.1.x |
1.27 17.1.x, 16.1.x |
1.27 17.1.x, 16.1.x |
1.27 17.1.x, 16.1.x |
1.27 17.1.x, 16.1.x |
Container runtime |
Mirantis Container Runtime (MCR) |
23.0.9 17.1.x, 16.1.x 2 |
23.0.9 17.1.x, 16.1.x 2 |
23.0.9 17.1.x, 16.1.x 2 |
23.0.9 17.1.x, 16.1.x 2 |
23.0.9 17.1.x, 16.1.x |
23.0.9 17.1.x, 16.1.x |
OS distributions |
Ubuntu |
20.04 |
20.04 |
20.04 |
20.04 |
20.04 |
20.04 |
Infrastructure platform |
Bare metal 8 |
kernel 5.15.0-107-generic
|
kernel 5.15.0-105-generic
|
kernel 5.15.0-102-generic
|
kernel 5.15.0-101-generic
|
kernel 5.15.0-97-generic
|
kernel 5.15.0-92-generic
|
MOSK Yoga or Antelope with OVS 3 |
|||||||
Queens
Yoga
Antelope
|
Queens
Yoga
Antelope
|
Queens
Yoga
Antelope
|
Queens
Yoga
Antelope
|
Queens
Yoga
Antelope
|
Queens
Yoga
Antelope
|
||
VMware vSphere 5 |
7.0, 6.7 |
7.0, 6.7 |
7.0, 6.7 |
7.0, 6.7 |
7.0, 6.7 |
7.0, 6.7 |
|
Software defined storage |
Ceph |
17.2.7-13.cve
17.1.5, 16.1.5
|
17.2.7-12.cve
17.1.4, 16.1.4
|
17.2.7-11.cve
17.1.3, 16.1.3
|
17.2.7-10.release
17.1.2, 16.1.2
|
17.2.7-9.release
17.1.1, 16.1.1
|
17.2.7-8.release
17.1.0, 16.1.0
|
Rook |
1.12.10-19
17.1.5, 16.1.5
|
1.12.10-18
17.1.4, 16.1.4
|
1.12.10-17
17.1.3, 16.1.3
|
1.12.10-16
17.1.2, 16.1.2
|
1.12.10-14
17.1.1, 16.1.1
|
1.12.10-13
17.1.0, 16.1.0
|
|
Logging, monitoring, and alerting |
StackLight |
Container Cloud compatibility matrix 2.25.x
Release |
Container Cloud |
2.25.4 |
2.25.3 |
2.25.2 |
2.25.1 |
2.25.0 |
|---|---|---|---|---|---|---|
Release history |
Release date |
Jan 10, 2024 |
Dec 18, 2023 |
Dec 05, 2023 |
Nov 27, 2023 |
Nov 06, 2023 |
17.0.0 +
MOSK 23.3
MKE 3.7.1
|
||||||
16.0.0
MKE 3.7.1
|
||||||
15.0.1 +
MOSK 23.2
MKE 3.6.5
|
||||||
14.1.0 1
MKE 3.6.6
|
||||||
14.0.1
MKE 3.6.5
|
||||||
12.7.0 +
MOSK 23.1
MKE 3.5.7
|
||||||
11.7.0
MKE 3.5.7
|
||||||
Patch Cluster releases (managed) |
17.0.x + MOSK 23.3.x |
17.0.4+23.3.4
17.0.3+23.3.3
17.0.2+23.3.2
17.0.1+23.3.1
|
17.0.3+23.3.3
17.0.2+23.3.2
17.0.1+23.3.1
|
17.0.2+23.3.2
17.0.1+23.3.1
|
17.0.1+23.3.1
|
|
16.0.x |
16.0.4
16.0.3
16.0.2
16.0.1
|
16.0.3
16.0.2
16.0.1
|
16.0.2
16.0.1
|
16.0.1
|
||
15.0.x + MOSK 23.2.x |
15.0.4+23.2.3 |
15.0.4+23.2.3 |
15.0.4+23.2.3 |
15.0.4+23.2.3 |
15.0.4+23.2.3 |
|
14.0.x |
14.0.4 |
14.0.4 |
14.0.4 |
14.0.4 |
14.0.4 |
|
Fully managed cluster |
Mirantis Kubernetes Engine (MKE) |
3.7.3
Since 17.0.3, 16.0.3
3.7.2
Since 17.0.1, 16.0.1
3.7.1
17.0.0, 16.0.0
|
3.7.3
Since 17.0.3, 16.0.3
3.7.2
Since 17.0.1, 16.0.1
3.7.1
17.0.0, 16.0.0
|
3.7.2
Since 17.0.1, 16.0.1
3.7.1
17.0.0, 16.0.0
|
3.7.2
Since 17.0.1, 16.0.1
3.7.1
17.0.0, 16.0.0
|
3.7.1
17.0.0, 16.0.0
|
Attached managed cluster |
MKE 7 |
3.6.8
19.1.0
3.6.1
19.0.0
3.5.5
18.1.0
3.5.3
18.0.0
|
3.6.8
19.1.0
3.6.1
19.0.0
3.5.5
18.1.0
3.5.3
18.0.0
|
3.6.8
19.1.0
3.6.1
19.0.0
3.5.5
18.1.0
3.5.3
18.0.0
|
||
Container orchestration |
Kubernetes |
1.27 17.0.x, 16.0.x |
1.27 17.0.x, 16.0.x |
1.27 17.0.x, 16.0.x |
1.27 17.0.x, 16.0.x |
1.27 17.0.0, 16.0.0 |
Container runtime |
Mirantis Container Runtime (MCR) |
23.0.7 17.0.x, 16.0.x |
23.0.7 17.0.x, 16.0.x |
23.0.7 17.0.x, 16.0.x |
23.0.7 17.0.x, 16.0.x |
23.0.7 17.0.0, 16.0.0 |
OS distributions |
Ubuntu |
20.04 |
20.04 |
20.04 |
20.04 |
20.04 |
Infrastructure platform |
Bare metal 8 |
kernel 5.15.0-86-generic |
kernel 5.15.0-86-generic |
kernel 5.15.0-86-generic |
kernel 5.15.0-86-generic |
kernel 5.15.0-86-generic |
MOSK Yoga or Antelope with Tungsten Fabric 3 |
||||||
MOSK Yoga or Antelope with OVS 3 |
||||||
Queens
Yoga
Antelope
|
Queens
Yoga
Antelope
|
Queens
Yoga
Antelope
|
Queens
Yoga
Antelope
|
Queens
Yoga
Antelope
|
||
VMware vSphere 5 |
7.0, 6.7 |
7.0, 6.7 |
7.0, 6.7 |
7.0, 6.7 |
7.0, 6.7 |
|
Software defined storage |
Ceph |
17.2.6-8.cve
Since 17.0.3, 16.0.3
17.2.6-5.cve
17.0.2, 16.0.2
17.2.6-2.cve
17.0.1, 16.0.1
17.2.6-cve-1
17.0.0, 16.0.0, 14.1.0
|
17.2.6-8.cve
17.0.3, 16.0.3
17.2.6-5.cve
17.0.2, 16.0.2
17.2.6-2.cve
17.0.1, 16.0.1
17.2.6-cve-1
17.0.0, 16.0.0, 14.1.0
|
17.2.6-5.cve
17.0.2, 16.0.2
17.2.6-2.cve
17.0.1, 16.0.1
17.2.6-cve-1
17.0.0, 16.0.0, 14.1.0
|
17.2.6-2.cve
17.0.1, 16.0.1
17.2.6-cve-1
17.0.0, 16.0.0, 14.1.0
|
17.2.6-cve-1
17.0.0, 16.0.0, 14.1.0
|
Rook |
1.11.11-22
17.0.4, 16.0.4
1.11.11-21
17.0.3, 16.0.3
1.11.11-17
17.0.2, 16.0.2
1.11.11-15
17.0.1, 16.0.1
1.11.11-13
17.0.0, 16.0.0, 14.1.0
|
1.11.11-21
17.0.3, 16.0.3
1.11.11-17
17.0.2, 16.0.2
1.11.11-15
17.0.1, 16.0.1
1.11.11-13
17.0.0, 16.0.0, 14.1.0
|
1.11.11-17
17.0.2, 16.0.2
1.11.11-15
S17.0.1, 16.0.1
1.11.11-13
17.0.0, 16.0.0, 14.1.0
|
1.11.11-15
17.0.1, 16.0.1
1.11.11-13
17.0.0, 16.0.0, 14.1.0
|
1.11.11-13
17.0.0, 16.0.0, 14.1.0
|
|
Logging, monitoring, and alerting |
StackLight |
Container Cloud compatibility matrix 2.24.x
Release |
Container Cloud |
2.24.5 |
2.24.4 |
2.24.3 |
2.24.2 |
2.24.0
2.24.1 0
|
|---|---|---|---|---|---|---|
Release history |
Release date |
Sep 26, 2023 |
Sep 14, 2023 |
Aug 29, 2023 |
Aug 21, 2023 |
Jul 20, 2023
Jul 27, 2023
|
Major Cluster releases (managed) |
15.0.1 +
MOSK 23.2
MKE 3.6.5
|
|||||
14.0.1
MKE 3.6.5
|
||||||
14.0.0
MKE 3.6.5
|
||||||
12.7.0 +
MOSK 23.1
MKE 3.5.7
|
||||||
11.7.0
MKE 3.5.7
|
||||||
Patch Cluster releases (managed) |
15.0.x + MOSK 23.2.x |
15.0.4+23.2.3
15.0.3+23.2.2
15.0.2+23.2.1
|
15.0.3+23.2.2
15.0.2+23.2.1
|
15.0.2+23.2.1
|
||
14.0.x |
14.0.4
14.0.3
14.0.2
|
14.0.3
14.0.2
|
14.0.2
|
|||
Managed cluster |
Mirantis Kubernetes Engine (MKE) |
3.6.6
Since 15.0.2, 14.0.2
3.6.5
15.0.1, 14.0.1
|
3.6.6
Since 15.0.2, 14.0.2
3.6.5
15.0.1, 14.0.1
|
3.6.6
15.0.2, 14.0.2
3.6.5
15.0.1, 14.0.1
|
3.6.5
15.0.1, 14.0.1
|
3.6.5
14.0.0
|
Container orchestration |
Kubernetes |
1.24
15.0.x, 14.0.x
|
1.24
15.0.x, 14.0.x
|
1.24
15.0.x, 14.0.x
|
1.24
15.0.1, 14.0.1
|
1.24
14.0.0
|
Container runtime |
Mirantis Container Runtime (MCR) |
20.10.17
15.0.x, 14.0.x
|
20.10.17
15.0.x, 14.0.x
|
20.10.17 2
15.0.x, 14.0.x
|
20.10.17
15.0.1, 14.0.1
|
20.10.17
14.0.0
|
OS distributions |
Ubuntu |
20.04 |
20.04 |
20.04 |
20.04 |
20.04 |
Infrastructure platform |
Bare metal |
kernel 5.4.0-150-generic |
kernel 5.4.0-150-generic |
kernel 5.4.0-150-generic |
kernel 5.4.0-150-generic |
kernel 5.4.0-150-generic |
MOSK Yoga or Antelope with Tungsten Fabric 3 |
||||||
MOSK Yoga or Antelope with OVS 3 |
||||||
Queens
Yoga
|
Queens
Yoga
|
Queens
Yoga
|
Queens
Yoga
|
Queens
Yoga
|
||
VMware vSphere 5 |
7.0, 6.7 |
7.0, 6.7 |
7.0, 6.7 |
7.0, 6.7 |
7.0, 6.7 |
|
Software defined storage |
Ceph 6 |
17.2.6-cve-1 Since 15.0.2, 14.0.2
17.2.6-rel-5 15.0.1, 14.0.1
|
17.2.6-cve-1
Since 15.0.2, 14.0.2
17.2.6-rel-5
15.0.1, 14.0.1
|
17.2.6-cve-1
15.0.2, 14.0.2
17.2.6-rel-5
15.0.1, 14.0.1
|
17.2.6-rel-5
|
17.2.6-rel-5
16.2.11-cve-4
16.2.11
|
Rook 6 |
1.11.4-12
Since 15.0.3, 14.0.3
1.11.4-11
15.0.2, 14.0.2
1.11.4-10
15.0.1, 14.0.1
|
1.11.4-12
15.0.3, 14.0.3
1.11.4-11
15.0.2, 14.0.2
1.11.4-10
15.0.1, 14.0.1
|
1.11.4-11
15.0.2, 14.0.2
1.11.4-10
15.0.1, 14.0.1
|
1.11.4-10
|
1.11.4-10
1.10.10-10
1.0.0-20230120144247
|
|
Logging, monitoring, and alerting |
StackLight |
Container Cloud compatibility matrix 2.23.x
Release |
Container Cloud |
2.23.5 |
2.23.4 |
2.23.3 |
2.23.2 |
2.23.1 |
2.23.0 |
|---|---|---|---|---|---|---|---|
Release history |
Release date |
Jun 05, 2023 |
May 22, 2023 |
May 04, 2023 |
Apr 20, 2023 |
Apr 04, 2023 |
Mar 07, 2023 |
Major Cluster releases (managed) |
12.7.0 +
MOSK 23.1 MKE 3.5.7
|
||||||
12.5.0 +
MOSK 22.5 MKE 3.5.5
|
|||||||
11.7.0
MKE 3.5.7
|
|||||||
11.6.0
MKE 3.5.5
|
|||||||
Patch Cluster releases (managed) |
12.7.x + MOSK 23.1.x |
12.7.4 + 23.1.4
12.7.3 + 23.1.3
12.7.2 + 23.1.2
12.7.1 + 23.1.1
|
12.7.3 + 23.1.3
12.7.2 + 23.1.2
12.7.1 + 23.1.1
|
12.7.2 + 23.1.2
12.7.1 + 23.1.1
|
12.7.1 + 23.1.1
|
||
11.7.x |
11.7.4
11.7.3
11.7.2
11.7.1
|
11.7.3
11.7.2
11.7.1
|
11.7.2
11.7.1
|
11.7.1
|
|||
Managed cluster |
Mirantis Kubernetes Engine (MKE) |
3.5.7 12.7.x, 11.7.x |
3.5.7 12.7.x, 11.7.x |
3.5.7 12.7.x, 11.7.x |
3.5.7 12.7.x, 11.7.x |
3.5.7 12.7.0, 11.7.0 |
3.5.7 11.7.0 |
Container orchestration |
Kubernetes |
1.21 12.7.x, 11.7.x |
1.21 12.7.x, 11.7.x |
1.21 12.7.x, 11.7.x |
1.21 12.7.x, 11.7.x |
1.21 12.7.0, 11.7.0 |
1.21 12.5.0, 11.7.0 |
Container runtime |
Mirantis Container Runtime (MCR) 2 |
20.10.13 |
20.10.13 |
20.10.13 |
20.10.13 |
20.10.13 |
20.10.13 |
OS distributions |
Ubuntu |
20.04 |
20.04 |
20.04 |
20.04 |
20.04 |
20.04 |
Infrastructure platform |
Bare metal |
kernel 5.4.0-137-generic |
kernel 5.4.0-137-generic |
kernel 5.4.0-137-generic |
kernel 5.4.0-137-generic |
kernel 5.4.0-137-generic |
kernel 5.4.0-137-generic |
MOSK Victoria or Yoga with Tungsten Fabric 3 |
|||||||
MOSK Victoria or Yoga with OVS 3 |
|||||||
Queens
Victoria
Yoga
|
Queens
Victoria
Yoga
|
Queens
Victoria
Yoga
|
Queens
Victoria
Yoga
|
Queens
Victoria
Yoga
|
Queens
Victoria
Yoga
|
||
VMware vSphere 5 |
7.0, 6.7 |
7.0, 6.7 |
7.0, 6.7 |
7.0, 6.7 |
7.0, 6.7 |
7.0, 6.7 |
|
Software defined storage |
Ceph 6 |
16.2.11-cve-4
16.2.11-cve-2
16.2.11
|
16.2.11-cve-4
16.2.11-cve-2
16.2.11
|
16.2.11-cve-4
16.2.11-cve-2
16.2.11
|
16.2.11-cve-2
16.2.11
|
16.2.11
|
16.2.11
|
Rook 6 |
1.10.10-10
1.10.10-9
1.0.0-20230120144247
|
1.10.10-10
1.10.10-9
1.0.0-20230120144247
|
1.10.10-10
1.10.10-9
1.0.0-20230120144247
|
1.10.10-9
1.0.0-20230120144247
|
1.0.0-20230120144247
|
1.0.0-20230120144247
|
|
Logging, monitoring, and alerting |
StackLight |
Footnotes
- 0
Container Cloud 2.23.5 or 2.24.0 automatically upgrades to the 2.24.1 patch release containing several hot fixes.
- 1
The major Cluster release 14.1.0 is dedicated for the vSphere provider only. This is the last Cluster release for the vSphere provider based on MCR 20.10 and MKE 3.6.6 with Kubernetes 1.24.
Container Cloud 2.25.1 introduces the patch Cluster release 16.0.1 that supports the vSphere provider on MCR 23.0.7 and MKE 3.7.2 with Kubernetes 1.27.
- 2(1,2,3,4,5,6)
In Container Cloud 2.26.2,
docker-ee-cliis updated to 23.0.10 for MCR 23.0.9 to fix several CVEs.In Container Cloud 2.24.3,
docker-ee-cliis updated to 20.10.18 for MCR 20.10.17 to fix the following CVEs: CVE-2023-28840, CVE-2023-28642, CVE-2022-41723.
- 3(1,2,3,4,5,6,7,8,9,10,11,12,13,14,15)
OpenStack Antelope is supported as TechPreview since MOSK 23.3.
A Container Cloud cluster based on MOSK Yoga or Antelope with Tungsten Fabric is supported as TechPreview since Container Cloud 2.25.1. Since Container Cloud 2.26.0, support for this configuration is suspended. If you still require this configuration, contact Mirantis support for further information.
OpenStack Victoria is supported until September, 2023. MOSK 23.2 is the last release version where OpenStack Victoria packages are updated.
If you have not already upgraded your OpenStack version to Yoga, Mirantis highly recommends doing this during the course of the MOSK 23.2 series. For details, see Upgrade OpenStack.
- 4(1,2,3,4,5,6)
Only Cinder API V3 is supported.
- 5(1,2,3,4,5)
Since Container Cloud 2.27.3 (Cluster release 16.2.3), the VMware vSphere configuration is unsupported. For details, see Deprecation Notes.
VMware vSphere is supported on RHEL 8.7 or Ubuntu 20.04.
RHEL 8.7 is generally available since Cluster releases 16.0.0 and 14.1.0. Before these Cluster releases, it is supported within the Technology Preview features scope.
For Ubuntu deployments, Packer builds a vSphere virtual machine template that is based on Ubuntu 20.04 with kernel 5.15.0-116-generic. If you build a VM template manually, we recommend installing the same kernel version 5.15.0-116-generic.
- 6(1,2,3,4)
Ceph Pacific supported in 2.23.0 is automatically updated to Quincy during cluster update to 2.24.0.
Ceph Pacific 16.2.11 and Rook 1.0.0-20230120144247 apply to major Cluster releases 12.7.0 and 11.7.0 only.
- 7(1,2,3)
Attachment of non Container Cloud based MKE clusters is supported only for vSphere-based management clusters on Ubuntu 20.04. Since Container Cloud 2.27.3 (Cluster release 16.2.3), the vSphere-based configuration is unsupported. For details, see Deprecation Notes.
- 8(1,2,3,4,5)
The kernel version of the host operating system is validated by Mirantis and confirmed to be working for the supported use cases. Usage of custom kernel versions or third-party vendor-provided kernels, such as FIPS-enabled, assume full responsibility for validating the compatibility of components in such environments.
- 9(1,2,3,4,5,6,7,8,9,10,11)
On non-MOSK clusters, Ubuntu 22.04 is installed by default on management and managed clusters. Ubuntu 20.04 is not supported.
On MOSK clusters:
Since Container Cloud 2.28.0 (Cluster releases 17.3.0), Ubuntu 22.04 is generally available for managed clusters. All existing deployments based on Ubuntu 20.04 must be upgraded to 22.04 within the course of 2.28.x. Otherwise, update of managed clusters to 2.29.0 will become impossible and management cluster update to 2.29.1 will be blocked.
Before Container Cloud 2.28.0 (Cluster releases 17.2.0, 16.2.0, or earlier), Ubuntu 22.04 is installed by default on management clusters only. And Ubuntu 20.04 is the only supported distribution for managed clusters.
- 10(1,2,3,4,5,6,7,8)
In Container Cloud 2.27.1,
docker-ee-cliis updated to 23.0.13 for MCR 23.0.11 and 23.0.9 to fix several CVEs.- 11(1,2)
In 2.29.1,
docker-ee-cliis updated to 25.0.9m1 (MCR 25.0.8) to fix several CVEs.- 12(1,2)
In 2.29.3,
docker-ee-cliis updated to 25.0.10 (MCR 25.0.8) to fix several CVEs.- 13
The StackLight version is represented by the tag of the
stacklightHelm chart, which includes information about all StackLight components.
Deprecation Notes
Considering continuous reorganization and enhancement of Mirantis OpenStack for Kubernetes (MOSK), certain components are deprecated and eventually removed from the product. This section provides details about the deprecated and removed functionality that may potentially impact existing MOSK deployments.
OpenStack
This section provides information about deprecated and removed functionality in Mirantis OpenStack services.
Instance image signature verification upon boot and upload
Deprecated |
MOSK 25.2 |
|---|---|
Unsupported |
MOSK 26.1 |
Details |
Deprecated support for verifying image signature when an instance is booted from an image and an image is uploaded to the Image service. For more information, contact Mirantis support. |
BGP VPN as a Service
Deprecated |
MOSK 25.1 |
|---|---|
Unsupported |
MOSK 25.2 |
Details |
Deprecated support for the BGP VPN as a service. For more information, contact Mirantis support. |
Logical Volume Manager with iSCSI for the Block Storage service
Deprecated |
MOSK 25.1 |
|---|---|
Unsupported |
MOSK 25.2 |
Details |
Deprecated support for the Logical Volume Manager (LVM) with iSCSI backend for the Block Storage service. For more information, contact Mirantis support. |
Multitenant OVS networking for the Bare Metal service
Deprecated |
MOSK 25.1 |
|---|---|
Unsupported |
MOSK 25.2 |
Details |
Deprecated support for the multitenant networking in the Bare Metal service (Ironic) using Open vSwitch (OVS). For more information, contact Mirantis support. |
DPDK
Deprecated |
MOSK 25.1 |
|---|---|
Unsupported |
MOSK 25.2 |
Details |
Deprecated the DPDK feature. For more information, contact Mirantis support. |
Telemetry services
Deprecated |
MOSK 24.2.2 |
|---|---|
Unsupported |
MOSK 24.2.4 |
Details |
Deprecated the MOSK Telemetry services (Gnocchi, Ceilometer, and Aodh) that used to monitor OpenStack components. Also, the OpenStack Panko service has been removed from the product as long as it is no longer maintained in the upstream OpenStack after Victoria. For details, see panko repository. |
The allow-unsafe-backup parameter for MariaDB
Deprecated |
MOSK 22.3 |
|---|---|
Removed |
MOSK 22.4 |
Details |
Removed the unsafe |
CPU isolation using isolcpus
Deprecated |
MOSK 22.2 |
|---|---|
Removed |
To be decided |
Details |
Configuring CPU isolation through the |
Tungsten Fabric
This section provides information about deprecated and removed functionality in Mirantis Tungsten Fabric.
Tungsten Fabric API v1alpha1
Deprecated |
MOSK 24.2 |
|---|---|
Unsupported |
MOSK 24.3 |
Removed |
MOSK 25.1 |
Details |
Instead of v1alpha1, MOSK introduces support for the API v2 for the Tungsten Fabric Operator. The new version of the Tungsten Fabric Operator API aligns with the OpenStack Controller API and provides better interface for advanced configurations. In MOSK 24.1, the API v2 is available only for the new product deployments with Tungsten Fabric. Since 24.2, MOSK API v2 becomes default for new product
deployments and includes the ability to convert existing v1alpha1
During the update to the 24.3 series, the old Tungsten Fabric cluster configuration API v1alpha1 is automatically converted and replaced with the v2 version. |
Tungsten Fabric analytics services
Deprecated |
MOSK 24.1 |
|---|---|
Unsupported |
MOSK 24.2 |
Removed |
MOSK 25.2 |
Details |
Tungsten Fabric analytics services, primarily designed for collecting various metrics from the Tungsten Fabric services, have been deprecated. All greenfield deployments starting from MOSK 24.1 do not include Tungsten Fabric analytics services. The existing deployments updated to 24.1 and newer until 25.2 include Tungsten Fabric analytics services as well as the ability to disable them as described in Disable Tungsten Fabric analytics services. During MOSK cluster update to 25.2, all Tungsten Fabric
analytics services are automatically removed and the
|
Bare metal
This section provides information about deprecated and removed functionality in bare metal services.
loadBalancerHost for IPAM object configuration
Deprecated |
MOSK 25.2 and Container Cloud 2.30.0 |
|---|---|
Removed |
To be decided |
Details |
Deprecated the Configuration example for apiVersion: ipam.mirantis.com/v1alpha1
kind: Subnet
metadata:
labels:
cluster.sigs.k8s.io/cluster-name: test-cluster
kaas.mirantis.com/provider: baremetal
ipam/SVC-LBhost: "1"
name: api-lb
namespace: test-ns
spec:
cidr: 172.16.168.0/24
includeRanges:
- 172.16.168.3
On existing clusters, the |
WireGuard
Deprecated |
MOSK 25.1 and Container Cloud 2.29.0 |
|---|---|
Unsupported |
To be decided |
Details |
Deprecated support for WireGuard. If you still require the feature, contact Mirantis support for further information. |
MetalLBConfigTemplate resource management
Deprecated |
MOSK 24.2 and Container Cloud 2.27.0 |
|---|---|
Unsupported |
MOSK 24.3 and Container Cloud 2.28.0 |
Details |
Deprecated the Existing Since MOSK 25.1, Admission Controller blocks creation
of new |
SubnetPool resource management
Deprecated |
MOSK 24.2 and Container Cloud 2.27.0 |
|---|---|
Unsupported |
MOSK 24.3 and Container Cloud 2.28.0 |
Details |
Deprecated the Existing configurations that use Since MOSK 25.1 and Container Cloud 2.29.0, Admission
Controller blocks creation of new If you still require this feature, contact Mirantis support for further information. |
Default L2Template for a namespace
Deprecated |
MOSK 23.2 and Container Cloud 2.24.0 |
|---|---|
Unsupported |
MOSK 23.3 and Container Cloud 2.25.0 |
Details |
Disabled creation of the default L2 template for a namespace. On existing clusters, |
The clusterRef parameter in L2Template
Deprecated |
MOSK 23.3 and Container Cloud 2.25.0 |
|---|---|
Unsupported |
To be decided |
Details |
Deprecated the On existing clusters, this parameter is automatically migrated to the
|
Ubuntu Focal
Deprecated |
MOSK 24.3 and Container Cloud 2.28.0 |
|---|---|
Unsupported |
MOSK 25.1 and Container Cloud 2.29.0 |
Details |
Deprecated support for the Focal Fossa Ubuntu distribution in favor of Jammy Jellyfish. Warning During the course of the Container Cloud 2.28.x series, Mirantis highly recommends upgrading an operating system on any nodes of all your MOSK cluster machines to Ubuntu 22.04 before the next major Cluster release becomes available. It is not mandatory to upgrade all machines at once. You can upgrade them one by one or in small batches, for example, if the maintenance window is limited in time. Otherwise, the Cluster release update of the Ubuntu 20.04-based MOSK clusters will become impossible as of Container Cloud 2.29.0 with Ubuntu 22.04 as the only supported version. Management cluster update to Container Cloud 2.29.1 will be blocked if at least one node of any related MOSK cluster is running Ubuntu 20.04. |
byName in BareMetalHostProfile
Deprecated |
MOSK 24.1 and Container Cloud 2.26.0 |
|---|---|
Unsupported |
MOSK 25.2 and Container Cloud 2.27.0 |
Details |
Deprecated the |
minSizeGiB, maxSizeGiB, and sizeGiB in BareMetalHostProfile
Deprecated |
MOSK 24.1 and Container Cloud 2.26.0 |
|---|---|
Removed |
MOSK 25.2 and Container Cloud 2.30.0 |
Details |
Deprecated the Now, to specify the device size, use devices:
- device:
minSize: 60Gi
partitions:
- name: bios_grub
size: 4Mi
partflags: ['bios_grub']
- name: uefi
partflags: ['esp']
size: 200Mi
- name: config-2
size: 64Mi
- name: lvm_root_part
size: 0
Warning In the existing profiles, you must migrate the syntax
manually before your management cluster is updated to
MOSK management 2.30.0. Otherwise, the values
will be lost and |
The wipe field in spec of BareMetalHostProfile
Deprecated |
MOSK 24.1 and Container Cloud 2.26.0 |
|---|---|
Unsupported |
To be decided |
Details |
Deprecated the For backward compatibility, any existing wipeDevice:
eraseMetadata:
enabled: True
For new machines, use the |
L2Template without the l3Layout parameters section
Deprecated |
MOS 21.3 and Container Cloud 2.9.0 |
|---|---|
Unsupported |
MOSK 23.2 and Container Cloud 2.24.0 |
Details |
Deprecated the use of the On existing clusters, the
Example L2 template with the |
The dnsmasq.dhcp_range parameter
Deprecated |
MOSK 22.5 and Container Cloud 2.21.0 |
|---|---|
Unsupported |
MOSK 23.2 and Container Cloud 2.24.0 |
Details |
Deprecated the Since Container Cloud 2.24.0, |
The MetalLB configInline parameter
Deprecated |
MOSK 23.2 and Container Cloud 2.24.0 |
|---|---|
Unsupported |
MOSK 23.3 and Container Cloud 2.25.0 |
Details |
Deprecated the |
The L2Template and IPaddr parameter status fields
Deprecated |
MOSK 23.1 and Container Cloud 2.23.0 |
|---|---|
Unsupported |
MOSK 23.3 and Container Cloud 2.25.0 |
Details |
Deprecated the following status fields for the
|
Subnet and SubnetPool status fields
Deprecated |
MOSK 23.1 and Container Cloud 2.23.0 |
|---|---|
Unsupported |
MOSK 23.3 and Container Cloud 2.25.0 |
Details |
Deprecated the following
|
IpamHost status fields renaming
Deprecated |
MOSK 22.5 and Container Cloud 2.21.0 |
|---|---|
Renamed |
MOSK 23.1 and Container Cloud 2.22.0 |
Details |
Renamed the following fields of the
The format of
|
The status.l2RenderResult field of the IpamHost object
Deprecated |
MOSK 22.4 and Container Cloud 2.19.0 |
|---|---|
Unsupported |
To be decided |
Details |
Deprecated the |
The status.nicMACmap field of the IpamHost object
Deprecated |
MOSK 21.6 and Container Cloud 2.14.0 |
|---|---|
Unsupported |
MOSK 22.1 and Container Cloud 2.15.0 |
Details |
Removed |
The ipam/DefaultSubnet label of the Subnet object
Deprecated |
MOSK 21.6 and Container Cloud 2.14.0 |
|---|---|
Unsupported |
To be decided |
Details |
Deprecated the |
The IpamHost status fields
Deprecated |
MOSK 21.5 and Container Cloud 2.12.0 |
|---|---|
Renamed |
MOSK 22.5 and Container Cloud 2.22.0 |
Details |
Replaced the following
|
IPAM API resources
Deprecated |
MOSK 21.4 and Container Cloud 2.11.0 |
|---|---|
Renamed |
MOSK 21.5 and Container Cloud 2.12.0 |
Details |
Deprecated the following IPAM API resources: |
Netchecker
Deprecated |
MOSK 21.3 and Container Cloud 2.9.0 |
|---|---|
Unsupported |
MOSK 21.4 and Container Cloud 2.11.0 |
Details |
Deprecated the Netchecker service. |
bootUEFI
Deprecated |
MOSK 21.2 and Container Cloud 2.8.0 |
|---|---|
Unsupported |
MOSK 21.3 and Container Cloud 2.9.0 |
Details |
Replaced the
|
Container Cloud
This section provides information about deprecated and removed functionality in Mirantis Container Cloud services.
OpenStack cloud provider
Deprecated |
Container Cloud 2.28.4 (Cluster release 16.3.4) |
|---|---|
Unsupported |
Container Cloud 2.29.0 (Cluster release 16.4.0) |
Details |
Suspended support for OpenStack-based deployments for the sake of the MOSK product. Simultaneously, ceased performing functional integration testing of the OpenStack provider and removed the possibility to update an OpenStack-based cluster to Container Cloud 2.29.0 (Cluster release 16.4.0). Therefore, the final supported version for this cloud provider is Container Cloud 2.28.5 (Cluster release 16.3.5). If you still require the feature, contact Mirantis support for further information. |
Reference Application for workload monitoring
Deprecated |
Container Cloud 2.28.0 (Cluster release 16.3.0) |
|---|---|
Unsupported |
Container Cloud 2.28.3 (Cluster release 16.3.3) |
Details |
Deprecated support for Reference Application on non-MOSK
clusters. Due to this deprecation, if the Note For the feature support on MOSK deployments, refer to Deploy your first cloud application using automation. |
The maxWorkerUpgradeCount parameter
Deprecated |
Container Cloud 2.27.0 (Cluster releases 17.2.0 and 16.2.0) |
|---|---|
Unsupported |
To be decided |
Details |
Deprecated the |
VMware vSphere-based clusters
Deprecated |
Container Cloud 2.27.2 (Cluster release 16.2.2) |
|---|---|
Unsupported |
Container Cloud 2.27.3 (Cluster release 16.2.3) |
Details |
Suspended support for VMware vSphere-based deployments, including attachment of existing Mirantis Kubernetes Engine (MKE) clusters that were originally not deployed by Container Cloud. Simultaneously, ceased performing functional integration testing of the vSphere provider and removed the possibility to update a vSphere-based cluster to Container Cloud 2.27.3 (Cluster release 16.2.3). Therefore, the final supported version for this cloud provider is Container Cloud 2.27.2 (Cluster release 16.2.2). If you still require the feature, contact Mirantis support for further information. |
Regional clusters
Deprecated |
Container Cloud 2.25.0 (Cluster releases 17.0.0 and 16.0.0) |
|---|---|
Unsupported |
Container Cloud 2.26.0 (Cluster releases 17.1.0 and 16.1.0) |
Details |
Suspended support for regional clusters and several regions on a single management cluster. Simultaneously, ceased performing functional integration testing of the feature and removed the related code in Container Cloud 2.26.0. If you still require this feature, contact Mirantis support for further information. |
Bootstrap v1
Deprecated |
Container Cloud 2.25.0 (Cluster releases 17.0.0 and 16.0.0) |
|---|---|
Unsupported |
Container Cloud 2.26.0 (Cluster releases 17.1.0 and 16.1.0) |
Details |
Deprecated the bootstrap procedure using Bootstrap v1 in favor of Bootstrap v2. For new bootstrap procedure, see Deploy a management cluster. |
Attachment of MKE clusters
Deprecated |
Container Cloud 2.24.0 (Cluster release 14.0.0) |
|---|---|
Unsupported |
Container Cloud 2.24.0 (Cluster release 14.0.0) |
Details |
Suspended support for attachment of existing Mirantis Kubernetes Engine (MKE) clusters that were originally not deployed by Container Cloud. Also suspended support for all related features, such as sharing a Ceph cluster with an attached MKE cluster. |
IAM API and IAM CLI
Deprecated |
Container Cloud 2.15.0 (Cluster releases 7.5.0 and 5.22.0) |
|---|---|
Unsupported |
Container Cloud 2.18.0 (Cluster releases 11.2.0 and 7.8.0) |
Details |
Deprecated the |
SSH-enabled user names
Deprecated |
Container Cloud 2.7.0 (Cluster release 5.14.0) |
|---|---|
Unsupported |
Container Cloud 2.9.0 (Cluster releases 6.16.0 and 5.16.0) |
Details |
Replaced all existing SSH user names, such as |
DISABLE_OIDC flag for TLS
Deprecated |
Container Cloud 2.13.0 (Cluster releases 7.3.0 and 5.20.0) |
|---|---|
Unsupported |
Container Cloud 2.14.0 (Cluster releases 7.4.0 and 5.21.0) |
Details |
Removed the |
Ceph
This section provides information about deprecated and removed functionality in Mirantis Ceph.
KaaSCephCluster API on management clusters
Deprecated |
MOSK 25.2 |
|---|---|
Unsupported |
MOSK 26.1 |
Details |
Deprecated the Also, the In MOSK 25.2, migration of custom resources from management to MOSK clusters is optional and recommended to prepare for future migration, but irreversible. For migration details, see Migrate KaaSCephCluster from a management to MOSK cluster. Since MOSK 26.1, this migration will occur automatically.
On existing clusters, after Ceph resources migration, any interaction
with the Ceph cluster will be processed inside |
The ingress section in the Ceph spec
Deprecated |
MOSK 24.3 |
|---|---|
Unsupported |
MOSK 25.1 |
Details |
Deprecated the On existing clusters, the |
Ceph metrics
Deprecated |
MOSK 24.2 |
|---|---|
Unsupported |
MOSK 24.3 |
Details |
Deprecated the performance metric exporter that is integrated into the Ceph Manager daemon for the sake of the dedicated Ceph Exporter daemon. Names of metrics will not be changed, no metrics will be removed. All Ceph metrics to be collected by the Ceph Exporter daemon will change
their labels
Therefore, if Ceph metrics to be collected by the Ceph Exporter daemon are used in any customizations, for example, custom alerts, Grafana dashboards, or queries in custom tools, update your customizations to use new labels since Container Cloud 2.28.0 (Cluster releases 16.3.0 and 17.3.0).
List of affected Ceph RGW metrics
List of all metrics to be collected by Ceph Exporter instead of
Ceph Manager
|
The cephDeviceMapping status fields
Deprecated |
MOSK 23.1 |
|---|---|
Unsupported |
MOSK 23.2 |
Details |
Removed |
The mgr.modules parameter
Deprecated |
MOSK 22.4 |
|---|---|
Unsupported |
To be decided |
Details |
Deprecated the |
Ceph RADOS Gateway users parameter
Deprecated |
MOSK 22.4 |
|---|---|
Unsupported |
To be decided |
Details |
Deprecated the Ceph RADOS Gateway |
Ceph on management and regional clusters
Deprecated |
Container Cloud 2.19.0 (Cluster releases 11.3.0 and 7.9.0) |
|---|---|
Unsupported |
Container Cloud 2.20.0 (Cluster releases 11.4.0 and 7.10.0) |
Details |
Removed Ceph cluster deployment from the management and regional clusters to reduce resource consumption. Ceph is automatically removed during the Cluster release update to 11.4.0 or 7.10.0. |
The dataPool field in CephFS specification
Deprecated |
MOSK 22.4 and Container Cloud 2.19.0 |
|---|---|
Unsupported |
To be decided |
Details |
Deprecated the |
The manageOsds parameter in KaaSCephCluster
Deprecated |
MOSK 22.1 and Container Cloud 2.14.0 |
|---|---|
Unsupported |
MOSK 22.3 and Container Cloud 2.17.0 |
Details |
Deprecated |
The maintenance flag
Deprecated |
MOSK 21.5 and Container Cloud 2.12.0 |
|---|---|
Unsupported |
MOSK 22.1 and Container Cloud 2.14.0 |
Details |
Deprecated the Ceph |
StackLight
This section provides information about deprecated and removed functionality in Mirantis StackLight.
Node Exporter netDeviceExclude and extraCollectorsEnabled parameters
Deprecated |
MOSK 25.2 and Container Cloud 2.30.0 |
|---|---|
Unsupported |
To be decided |
Details |
Deprecated redundant |
Alertmanager API v1
Deprecated |
MOSK 25.1 and Container Cloud 2.29.0 |
|---|---|
Unsupported |
MOSK 25.2 and Container Cloud 2.30.0 |
Details |
Deprecated the Alertmanager API v1 in favor of v2. The current Alertmanager version supports both API versions. However, in MOSK 25.2 and Container Cloud 2.30.0, Alertmanager is upgraded to the version 0.28.1 that supports only the API v2. Therefore, if you use API v1, update your integrations and configurations to use the API v2 to ensure compatibility with the upgraded Alertmanager. |
RabbitMQ Prometheus Exporter
Deprecated |
MOSK 25.1 and Container Cloud 2.29.0 |
|---|---|
Unsupported |
MOSK 25.2 and Container Cloud 2.30.0 |
Details |
Following the upstream deprecation in Prometheus, deprecated the
As a result, deprecated and renamed the RabbitMQ Grafana dashboard to the RabbitMQ [Deprecated] one. As a replacement, use the RabbitMQ Overview and RabbitMQ Erlang Grafana dashboards. Warning If you use deprecated RabbitMQ metrics in customizations such as alerts and dashboards, switch to the new metrics and dashboards within the course of the MOSK 25.1 series to prevent issues once the deprecated metrics and dashboard will be removed. |
Angular plugins in Grafana dashboards
Deprecated |
MOSK 24.3 and Container Cloud 2.28.0 |
|---|---|
Unsupported |
MOSK 25.1 and Container Cloud 2.29.0 |
Details |
Following the upstream deprecation in Grafana, deprecated the Angular-based plugins in favor of the React-based ones. In Container Cloud 2.29.0 and MOSK 25.1, where Grafana is updated from version 10 to 11, the following Angular plugins are automatically migrated to the React ones:
All Grafana dashboards provided by StackLight are also migrated to React automatically. For the list of default dashboards, see View Grafana dashboards. Warning This migration may corrupt custom Grafana dashboards that have Angular-based panels. Therefore, if you have such dashboards, back them up and manually upgrade Angular-based panels during the course of Container Cloud 2.28.x and MOSK 24.3.x to prevent custom appearance issues after plugin migration. |
The telegraf-openstack plugin
Deprecated |
MOSK 23.3 |
|---|---|
Final release |
MOSK 23.3.4 |
Removed |
MOSK 24.1 |
Details |
The StackLight Therefore, if you use any To obtain the list of metrics that are removed and replaced with new ones, contact Mirantis support. |
The resourcesPerClusterSize parameter
Deprecated |
MOSK 24.3 and Container Cloud 2.28.0 |
|---|---|
Removed |
To be decided |
Details |
Deprecated the |
Logging parameters
Deprecated |
MOSK 23.3 and Container Cloud 2.25.0 |
|---|---|
Removed |
MOSK 24.1 and Container Cloud 2.26.0 |
Details |
Removed the following logging-related StackLight parameters in the light of the logging pipeline refactoring described in Upgraded logging pipeline in StackLight:
No replacement exists for these redundant parameters. You can safely remove them on existing clusters. |
The logging.syslog parameter
Deprecated |
MOSK 23.1 and Container Cloud 2.23.0 |
|---|---|
Removed |
To be decided |
Details |
Deprecated |
Elasticsearch and Kibana
Deprecated |
MOSK 22.2 and Container Cloud 2.16.0 |
|---|---|
Removed |
To be decided |
Details |
Replaced Elasticsearch with OpenSearch, and Kibana with OpenSearch Dashboards due to licensing changes for Elasticsearch. OpenSearch is a fork of Elasticsearch under the open-source Apache License with development led by Amazon Web Services. For new deployments with the logging stack enabled, OpenSearch is now deployed by default. For existing deployments, migration to OpenSearch is performed automatically during clusters update. However, the entire Elasticsearch cluster may go down for up to 15 minutes. |
Retention Time parameter in the Container Cloud web UI
Deprecated |
MOSK 22.2 and Container Cloud 2.16.0 |
|---|---|
Removed |
MOSK 22.3 and Container Cloud 2.17.0 |
Details |
Replaced the Retention Time parameter with the Logstash Retention Time, Events Retention Time, and Notifications Retention Time parameters. |
logstashRetentionTime parameter for Elasticsearch
Deprecated |
MOSK 22.2 and Container Cloud 2.16.0 |
|---|---|
Removed |
MOSK 24.1 and Container Cloud 2.26.0 |
Details |
Deprecated the |
match and match_re keys for notifications routes
Deprecated |
MOSK 21.5 and Container Cloud 2.12.0 |
|---|---|
Removed |
MOSK 21.6 and Container Cloud 2.14.0 |
Details |
Replaced |
Release cadence and support cycle
Mirantis aims to release Mirantis OpenStack for Kubernetes (MOSK) software regularly and often.
MOSK software includes OpenStack, Tungsten Fabric, life-cycle management tooling, other supporting software, and dependencies. Mirantis’s goal is to ensure that such updates are easy to install in zero-touch and zero-downtime fashion.
MOSK major and patch releases
MOSK release cadence consists of major, for example, MOSK 24.1, and patch, for example, MOSK 24.1.1 or 24.1.2, releases. The major release with the patch releases based on it are called a release series, for example, MOSK 24.1 series.
Both major and patch release versions incorporate solutions for security vulnerabilities and known product issues. The primary distinction between these two release types lies in the fact that major release versions introduce new functionalities, whereas patch release versions predominantly offer minor product enhancements.
Patch releases strive to considerably reduce the timeframe for delivering CVE resolutions in images to your deployments, aiding in the mitigation of cyber threats and data breaches.
Content |
Major release |
Patch release |
|---|---|---|
Version update and upgrade of the major product components including but not limited to OpenStack, Tungsten Fabric, Kubernetes, Ceph, and Stacklight 0 |
||
Container runtime changes including Mirantis Container Runtime and containerd updates |
||
Changes in public API |
||
Changes in the Container Cloud and MOSK lifecycle management including but not limited to machines, clusters, Ceph OSDs |
||
Host machine changes including host operating system and kernel updates |
||
Patch version bumps of MKE and Kubernetes |
||
Fixes for Common Vulnerabilities and Exposures (CVE) in images |
||
Fixes for known product issues |
- 0
StackLight subcomponents may be updated during patch releases
Most patch release versions involve minor changes that only require restarting containers on the cluster during updates. However, the product can also deliver CVE fixes on Ubuntu, which includes updating the minor version of the Ubuntu kernel. This kernel update is not mandatory, but if you prioritize getting the latest CVE fixes for Ubuntu, you can manually reboot machines during a convenient maintenance window to update the kernel.
Each subsequent major release includes patch release updates of the previous major release.
You may decide to update between only major releases without updating to patch releases. In this case, you will perform updates from an N to N+1 major release. However, Mirantis recommends applying security fixes using patch releases as soon as they become available.
Starting from MOSK 24.1.5, Mirantis introduces a new update scheme allowing for the update path flexibility.
Before MOSK 24.1.5 |
Since MOSK 24.1.5 |
|---|---|
The user cannot update to the intermediate patch version in the series if a newer patch version has been released. |
The user can update to any patch version in the series even if a newer patch version has been released already. |
If the cluster starts receiving patch releases, the user must apply the latest patch version in the series to be able to update to the following major release. |
The user can always update to the newer major version from the latest patch version of the previous series. Additionally, there will be another possibility of major update during the course of the patch series from the patch version released immediately before the target major version. Refer to MOSK cluster update schema for the update possibility illustration. |
See also
Cluster support statuses
The product support status reflects the freshness of your deployment and should be considered when planning the cluster update path.
Support status |
Description |
|---|---|
Supported |
Latest supported product release version to use for a greenfield cluster deployment and to update to. |
Deprecated |
Product release version that you should update to the latest supported product release. You cannot update between two deprecated release versions. The deprecated product version becomes unsupported when newer product versions are released. Therefore, when planning the update path for the cluster, consider the dates of the upcoming product releases. Greenfield deployments based on a deprecated product release are not supported. Use the latest supported release version for initial deployments instead. |
Unsupported |
Product release that blocks automatic update of a management cluster and must be updated immediately to resume receiving newest product features and enhancements. |
OpenStack support cycle
Mirantis provides Long Term Support (LTS) for specific versions of OpenStack. LTS includes scheduled updates with new functionality, bug and security fixes. Mirantis intends to introduce support for new OpenStack version once a year. The LTS duration of an OpenStack version is two years.
The diagram below illustrates the current LTS support cycle for OpenStack. The upstream versions not mentioned in the diagram are not supported in the product as well as the upgrade paths from or to such versions unless such upgrade is part of an upgrade path to a supported version. For the OpenStack upgrade procedure, refer to Upgrade OpenStack.
Versions of Tungsten Fabric, underlying Kubernetes, Ceph, StackLight, and other supporting software and dependencies may change at Mirantis discretion. Follow Compatibility Matrix and product Release Notes for any changes in product component versions.
Technology Preview features
A Technology Preview feature provides early access to upcoming product innovations, allowing customers to experiment with the functionality and provide feedback.
Technology Preview features may be privately or publicly available but neither are intended for production use. While Mirantis will provide assistance with such features through official channels, normal Service Level Agreements do not apply.
As Mirantis considers making future iterations of Technology Preview features generally available, we will do our best to resolve any issues that customers experience when using these features.
During the development of a Technology Preview feature, additional components may become available to the public for evaluation. Mirantis cannot guarantee the stability of such features. As a result, if you are using Technology Preview features, you may not be able to seamlessly update to subsequent product releases, as well as upgrade or migrate to the functionality that has not been announced as full support yet.
Mirantis makes no guarantees that Technology Preview features will graduate to generally available features.